NASA TECHNICAL / ' > / $y Js MEMORANDUM i - X SE NASA W X-. • /-*•: • • iffite ,A READOUT SYSTEMS FOR PHOTOELECTRIC INTEGRATING SPECTROMETERS by Michael L. Franklin and William A. Gordon Lewis Research Center Cleveland, Ohio 44135 NATIONAL AERONAUTICS AND SPACE ADMINISTRATION • WASHINGTON, D. C. • DECEMBER 1971 https://ntrs.nasa.gov/search.jsp?R=19720004421 2018-06-08T00:00:25+00:00Z

Welcome message from author
This document is posted to help you gain knowledge. Please leave a comment to let me know what you think about it! Share it to your friends and learn new things together.
Transcript
NASA TECHNICAL/ ' > / $y Js
MEMORANDUM
i -X
SE
NASA W X-.• /-*•: • • iffite
,A
READOUT SYSTEMS FOR PHOTOELECTRIC
INTEGRATING SPECTROMETERS
by Michael L. Franklin and William A. Gordon
Lewis Research Center
Cleveland, Ohio 44135
NATIONAL AERONAUTICS AND SPACE ADMINISTRATION • WASHINGTON, D. C. • DECEMBER 1971
https://ntrs.nasa.gov/search.jsp?R=19720004421 2018-06-08T00:00:25+00:00Z

1. Report No.
NASA TM X-2443
2. Government Accession No. 3. Recipient's Catalog No.
4. Title and Subtitle EVALUATION OF SOME WIDE-DYNAMIC-
RANGE READOUT SYSTEMS FOR PHOTOELECTRIC
INTEGRATING SPECTROMETERS
5. Report Date
December 19716. Performing Organization Code
7. Author(s)
Michael L. Franklin and William A. Gordon8. Performing Organization Report No.
E-6525
9. Performing Organization Name and Address
Lewis Research CenterNational Aeronautics and Space AdministrationCleveland, Ohio 44135
10. Work Unit No.
134-03
11. Contract or Grant No.
12. Sponsoring Agency Name and Address
National Aeronautics and Space AdministrationWashington, D.C. 20546
13. Type of Report and Period Covered
Technical Memorandum
14. Sponsoring Agency Code
15. Supplementary Notes
16. Abstract
Five types of electronic circuits commonly used for readout of currents from photomultipliertubes were evaluated. This evaluation was conducted to define the experimental limits ofachieving the widest possible dynamic range of light detection and concentration measurementsin spectrochemical analysis. The circuits evaluated included the photon-counting techniqueand four dc circuits. These circuits displayed a dynamic range from 3 to about 4.5 decadeswithin a repeatability criterion of 1 percent, or better. The maximum dynamic range allowedby the photomultiplier tube in this application was estimated to be about 6 decades.
17. Key Words (Suggested by Author(s))
Chemical analysisSpectroscopyEmission spectroscopySpectrochemical analysis
18. Distribution Statement
Unclassified - unlimited
19. Security Dassif. (of this report)
Unclassified20. Security Classif. (of this page)
Unclassified21. No. of Pages
21
22. Price*
$3.00
* For sale by the National Technical Information Service, Springfield, Virginia 22151
EVALUATION OF SOME WIDE-DYNAMIC-RANGE READOUT SYSTEMS FOR
PHOTOELECTRIC INTEGRATING SPECTROMETERS
by Michael L. Franklin and William A. Gordon
Lewis Research Center
SUMMARY«
Five types of electronic circuits- commonly used for readout of photomultiplier cur-«rents in photometric instruments were evaluated to define the experimental limits inachieving the widest possible dynamic range of light detection for wide-range concentra-tion measurements in emission spectrochemical analysis. In keeping with the precisionrequirements for this application, dynamic range was defined as the range of photocur-rents giving repeatabilities of 1 percent, or better. By this definition, strict linearityof the readout was not required.
The circuits examined included the photon-counting technique and four dc circuits.All the dc circuits, in varying configurations, used a capacitor to integrate the photo-currents and a high-input-impedance operational amplifier as an interface between thephotomultiplier tubes and the final readout display.
The dynamic range of the photon-counting circuit was about 4. 5 decades with opera-tional conditions typical in emission spectroscopy. This circuit was limited on the lowend by shot noise and detector noise, and on the high end by the frequency response ofthe amplifier-discriminator. The dynamic range of the analog circuits was from 3 to4. 5 decades and was limited on the low end by ambient electrical noise and on the highend by the maximum voltage rating of currently available operational amplifiers. Themaximum dynamic range allowed by the photomultipliers typically used in this applica-tion was about 6 decades, as estimated from manufacturers' specifications.
A discussion is also given of some other considerations, in addition to dynamicrange, when these circuits are used in multichannel photoelectric spectrometers.
INTRODUCTION
In the determination of chemical composition by optical emission spectroscopy, it\is desirable to analyze the widest range of concentrations in a single sample and with a

single spectral line. The maximum dynamic concentration range determinate with asingle spectral line is inherently limited by the emission characteristics of the plasmaused to excite atomic spectra. At the low-concentration end the range is limited by thebackground intensity fluctuations, or noise,,inherent in every plasma. The high-intensity-range limit is imposed by either or both of two factors: (1) self-absorption ofradiation in the emission plasma, and (2) line broadening in excess of the exit slit widthof the spectrometer. The development of excitation sources allowing determinationsover a wide concentration range is a fundamental problem in emission spectroscopy.However, with the development of sources with wide dynamic range, the development ofreadout systems with commensurate dynamic range is also necessary.
Recent refinements of the direct-current arc excitation source at the Lewis Re-search Center (ref. 1) have resulted in useful ranges of analysis of more than 3 decades
'•
(1000). This dynamic range exceeds the capabilities of readout systems on commer-cially available photoelectric spectrometers, which are limited to about 2 decades with
*achievable precisions of at least 1 percent. An example of the limitation imposed by thereadout system at the Lewis Research Center is shown in figure 1. This plot shows theresponse of the readout system as a function of the amount of titanium in the samplesand also as a function of increasing exposures to a constant light intensity. The concen-tration curve for titanium is typical of some 20 other elements also programmed foranalysis in the spectrometer. The curve showing response to an increasing exposure to
20x10
.1.01 .02 .04.06 .1 .2 .4 .6 1 2 4 6 10 20 40 100
White light intensity, arbitrary units; amount of titanium, ug
Figure 1. - Example of limitation imposed by readout system on dynamicrange of spectrochemical analysis.
a constant light intensity represents the maximum useful range of the readout system.Comparison of these response curves shows that most, but not all, of the nonlinearityat higher titanium concentrations is attributable to the readout system. Therefore, itis apparent from figure 1 that increasing the dynamic range of the readout system isnecessary to extend the higher range of concentrations determinable by this method.
This report contains the results of evaluation of five circuits applicable to integrat-ing photoelectric spectrometers, with special consideration given to the requirement ofwide dynamic range. The evaluation was conducted to define the limits in achieving widedynamic range with these circuits and generally to assess the suitability of these cir-cuits for readout of photocurrents in spectrochemical analysis. A discussion is givenof some basic considerations of each readout circuit when it is used in this application.
DEFINITIONS OF DYNAMIC RANGET
The definition of dynamic range is often stated in terms of the resolution element ofthe system. For example, a device with a resolution of 1 part in 10 000 is said to havea dynamic range of 10 000, or 4 decades. However, in the context of this work, theterm dynamic range is intended to apply to a practical analysis system and is definedin terms of the concentration resolution. Therefore, the definition of dynamic range inthis work is the span over which precisions of 1 percent (relative standard deviation),or better, are achieved without range changing. This precision represents a maximumallowable error due to the readout system alone and is acceptable for even the moststringent analytical requirements. By this definition, a resolution of 1 part in 10 000is said to have a dynamic range of 2 decades within the 1 percent limit because readoutof at least 100 parts is required to ensure a precision of 1 percent. Definitions of dy-namic range, of course, can be made in terms of any arbitrary precision limit. Itshould also be recognized that the precision limit can logically be defined as a functionof concentration to reflect the wider limits of acceptable precision in the trace concen-tration range compared with the major constituent ranges. However, the results andconclusions of this work are not dependent on the precision criterion selected, exceptin the case of the photon-counting circuit as discussed in the section Photon Counting -Circuit V.
In defining dynamic range, the absolute linearity was not of primary importance.Good linearity of a readout device is a primary consideration when the readout data arereduced manually and experimenter bias may produce errors in reading concentrationsfrom scales or graphs. With modern digital data processing the linearity requirementis secondary due to computer interpolation accuracy. All that is required when com-puter processing of data is used is that the resolution elements in terms of concentration
be within specified limits. Therefore, special efforts to make the readout preciselylinear are not justified if the concentration resolution can be achieved.
APPARATUS AND PROCEDURE
The five circuits that were investigated for application to readout of photocurrentsfrom a photoelectric spectrometer are shown schematically in figure 2. The compo-nents in these circuits which are critical in this application include the integrating capa-citors, the fie Id-effect-transistor operational amplifier (FET-OA), and the digital volt-meter. These components are common to all the circuits except circuit V, the photon-counting circuit. The specifications of these components which are important in thisapplication are summarized in table I.
Circuit I
In circuit I (fig. 2 (a)) the capacitor was connected between the anode and the groundof the photomultiplier (PM) tube. After integration, the voltage on the capacitor wasmeasured directly by switching the charged capacitor to the FET-OA connected as avoltage follower. This system presents an impedance of about 10 ohms to the chargeon the capacitor and therefore permits voltage readings without significant discharge ofthe capacitor. The voltage at the output of the OA was measured with a 4s-digit volt-meter.
To test this circuit, a 0.1-microfarad capacitor was used for integration of theknown input currents. The capacitor was charged to an accurately known voltage andthen connected to the readout bus, which in multichannel operation would sequentiallyconnect each channel capacitor to the input of the OA. The mercury-wetted reed relaywas used to provide bounceless switching in connecting the input to the OA to ground.Five milliseconds after the charged capacitor was switched to the OA input, the auto-ranging digital voltmeter was given a digitizing command. The relative standard devia-tions were calculated for at least 10 repeat readings in the voltage range between 1 mil-livolt and 100 volts, and these data were used to determine the dynamic range of thesystem.

A Integrating capacitor, 0.1 \ifB Operational amplifierC Photomultiplier tubeD Digital voltmeterE Digital counter
F OscillatorG Monostable multivibratorH Pulse height discriminatorI Decade counting unit
(a) Direct capacitor voltage - circuit I. (b) Integrating amplifier - circuit II.
100 n
Circuit IIKa) Circuit IIKb)
(c) Time of capacitor discharge - circuits IIKa) and IIKb).
0.001 uF
40-mV-leveldetector
(d) Voltage-to-frequency converter - circuit IV. (e) Photon-counting - circuit V.
Figure 2. - Schematic circuits of readout systems evaluated.

TABLE I. - COMPONENT SPECIFICATIONS
Component
Capacitors
Operationalamplifiers
Digitalvoltmeter
Photomultipliertubes
Amplifierdiscriminator
Specifications
Type, polystyrene (hermetically sealed)Resistance, 1014 n/F
Type, field- effect transistorLimit voltage, 100 VPower supply, 115 V; 0. 1 percent reg-ulation for 10- percent change in loadInput bias current, 50 pA (max); tem-perature coefficient, doubles for 10° CriseInput voltage offset, 1 . 0 mV adjustableto zero; temperature coefficient, 30 fiVper C°
Direct- current ranges: 10 mV, 100 mV,IV, 10 V, 100 V, and 750 V (auto-ranging)Sensitivity, 1 (nV on 10-mV rangeDigitization time, 0.5 sec
Type, Radio Corporation of America1P28 and 1P21Supply voltage (typical), 800 VMaximum anode current, 500 mAAnode dark current, (typical ) 2x10 ACurrent amplification, 6x10 electronsper photon
Voltage gain, 2500 VBandwidth, 10 kHz to 250 MHzMaximum counting rate, 25 MHz; dis-criminator level, 50 mV; pulse- pairresolution, lOnsec
Used in-
Circuits I, III (a), III(b),and IV
Circuits I, II, IH(a),m(b), IV, and V
Circuits I and H
All circuits
Circuit V
Circuit II
This circuit provides true integration of photocurrents because the capacitor is in
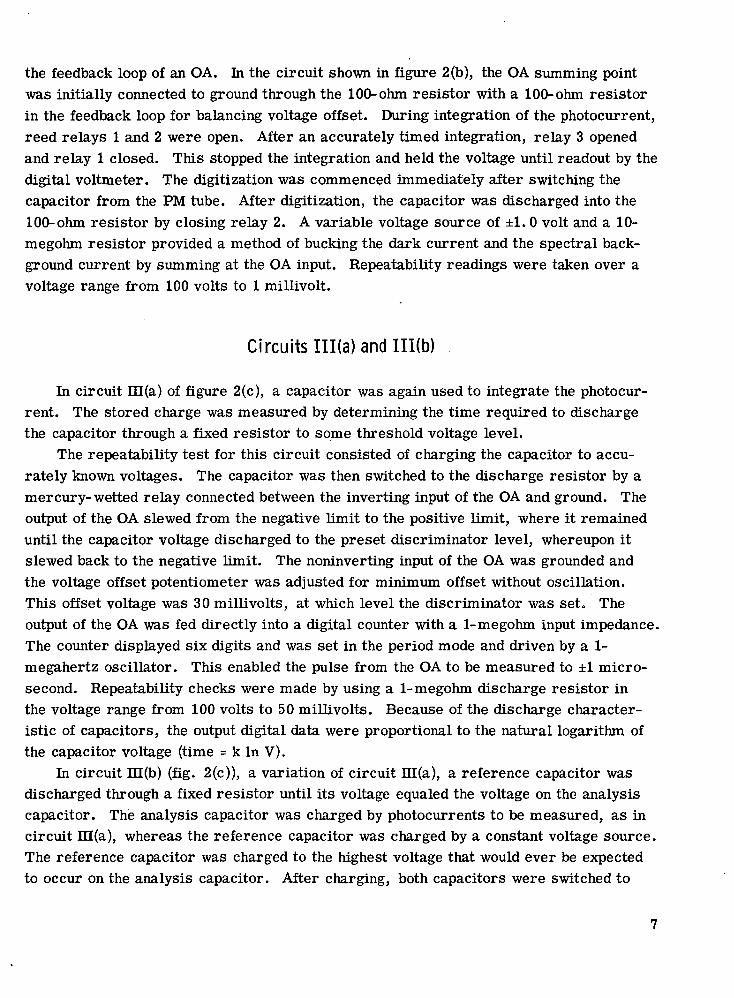
the feedback loop of an OA. In the circuit shown in figure 2(b), the OA summing pointwas initially connected to ground through the 100-ohm resistor with a 100-ohm resistorin the feedback loop for balancing voltage offset. During integration of the photocurrent,reed relays 1 and 2 were open. After an accurately timed integration, relay 3 openedand relay 1 closed. This stopped the integration and held the voltage until readout by thedigital voltmeter. The digitization was commenced immediately after switching thecapacitor from the PM tube. After digitization, the capacitor was discharged into the100-ohm resistor by closing relay 2. A variable voltage source of ±1.0 volt and a 10-megohm resistor provided a method of bucking the dark current and the spectral back-ground current by summing at the OA input. Repeatability readings were taken over avoltage range from 100 volts to 1 millivolt.
Circuits IIKa) and IIKb)
In circuit in(a) of figure 2(c), a capacitor was again used to integrate the photocur-rent. The stored charge was measured by determining the time required to dischargethe capacitor through a fixed resistor to some threshold voltage level.
The repeatability test for this circuit consisted of charging the capacitor to accu-rately known voltages. The capacitor was then switched to the discharge resistor by amercury-wetted relay connected between the inverting input of the OA and ground. Theoutput of the OA slewed from the negative limit to the positive limit, where it remaineduntil the capacitor voltage discharged to the preset discriminator level, whereupon itslewed back to the negative limit. The noninverting input of the OA was grounded andthe voltage offset potentiometer was adjusted for minimum offset without oscillation.This offset voltage was 30 millivolts, at which level the discriminator was set. Theoutput of the OA was fed directly into a digital counter with a 1-megohm input impedance.The counter displayed six digits and was set in the period mode and driven by a 1-megahertz oscillator. This enabled the pulse from the OA to be measured to ±1 micro-second. Repeatability checks were made by using a 1-megohm discharge resistor inthe voltage range from 100 volts to 50 millivolts. Because of the discharge character-istic of capacitors, the output digital data were proportional to the natural logarithm ofthe capacitor voltage (time - k In V).
In circuit in(b) (fig. 2(c)), a variation of circuit HI (a), a reference capacitor wasdischarged through a fixed resistor until its voltage equaled the voltage on the analysiscapacitor. The analysis capacitor was charged by photocurrents to be measured, as incircuit ni(a), whereas the reference capacitor was charged by a constant voltage source.The reference capacitor was charged to the highest voltage that would ever be expectedto occur on the analysis capacitor. After charging, both capacitors were switched to
the OA inputs. The time required to reach an equilibrium voltage on the dischargeresistor was inversely proportional to the natural logarithm of the voltage on the anal-ysis capacitor (time = K(l/ln V)).
This circuit was checked for repeatability by switching the positive high-impedanceinput from ground to the integrating capacitor. This kept the OA output at the negativevoltage limit. Next, the charged reference capacitor was switched by a bouncelessmercury-wetted reed relay to the 1-megohm discharge resistor connected to the invert-ing input. The OA output then slewed to the positive limit, where it remained until thetwo capacitor voltages were equal. At that time the OA output went to the negativelimit. The duration of the output pulse from the OA was measured within 1 microsecondby the digital counter used in circuit m(a).
Circuit IV
Circuit IV (fig. 2(d)) digitized the total charge on the integrating capacitor in smallcharge increments. The integrating capacitor, initially charged with photocurrent, wasswitched to the OA input through a 4-megohm resistor. The OA integrated the currentfrom the integrating capacitor until the OA reached 40 millivolts, the voltage detectorlevel. This caused voltage of opposite polarity to be applied for a fixed time pulsethrough a 10-kilohm resistor to the OA summing point by a monostable multivibrator.This, in turn, caused the output of the OA to integrate negatively, which discharged thecapacitor in the feedback loop. The output pulses, resulting from periodic reset opera-tions, were accumulated for 2 seconds on the counter.
Repeatability tests were made by applying accurately known voltages, between100 millivolts and about 100 volts, to the integrating capacitors.
Circuit V
The photon-counting circuit shown schematically in figure 2 was evaluated fromexperiments conducted with less than state-of-the-art electronic components and byextrapolating these results using specifications of the best components currently avail-able.
In the circuit of figure 2 the amplifier-discriminator specification, in particular,is crucial for achieving the maximum dynamic range. Typical specifications for astate-of-the-art amplifier-discriminator are as follows: voltage gain, 2500 volts;bandwidth, 10 kilohertz to 250 megahertz; maximum counting rate, 25 megahertz; dis-criminator level, 50 millivolts; and pulse-air resolution, 10 nanoseconds.
8

In multichannel operation, a seven-decimal-digit high-speed counter is requiredfor each channel to record the 25-megahertz signal for 10 seconds. Alternatively, thecounts can be stored on decade counting units (DCU) as illustrated in figure 2(e), andsequentially displayed on the counter. It is not necessary to decode the first two decadecounting units since they are not significant within the 1-percent precision criterion.By decoding only the highest seven digits and injecting 10-megahertz readout pulses atthe third DCU, the decoding time was only 1.0 second, whereas it would be 100 secondsper channel for nine decimal digits.
The dynamic range of this circuit was estimated by using the relations betweenprecision and number of photon events expressed by
=-±- / i dt (1)eG J0
where
N number of photon events
e electron charge, 1.6x10" C/electron
G gain of photomultiplier tube, electron per photon
i dt current integral, A-sec
and
- (Rs+B + 2RB)1/2 tl/2 (2)
where
s standard deviationRs+B count rate of signal plus background
RB count rate of background
t integration time
as given in reference 2.

RESULTS AND DISCUSSION
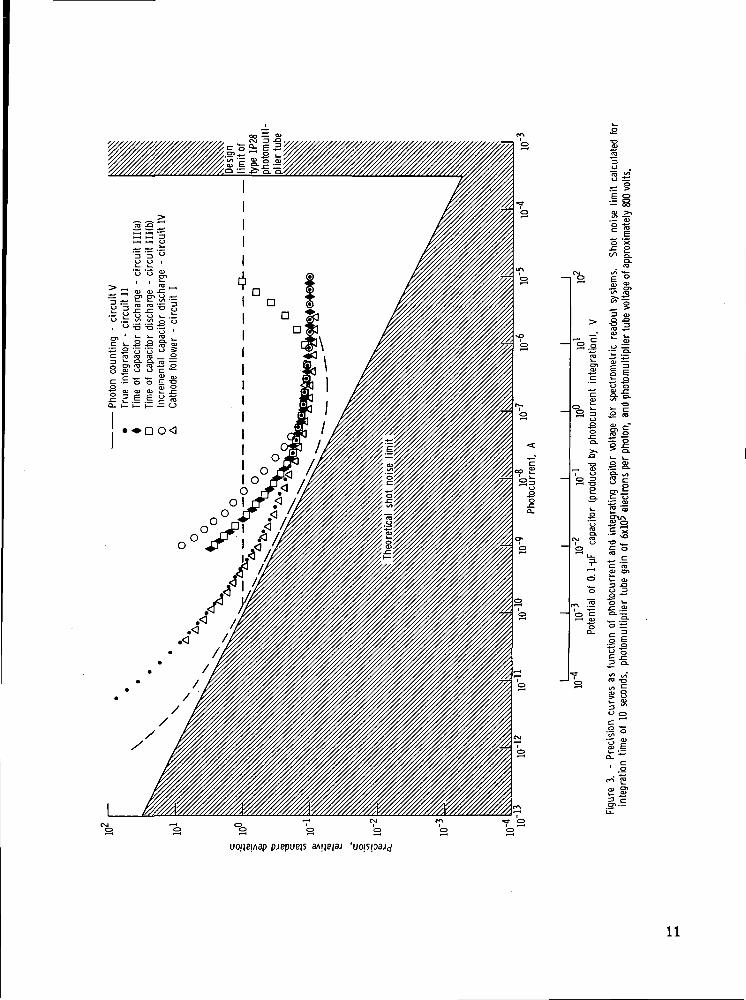
The dynamic range of the various circuits evaluated is summarized in figure 3 inthe form of error curves as a function of photocurrent. These curves were either cal-culated or experimental as indicated in the figure. The dynamic range for each circuitat the level of 1-percent precision is indicated by the intercept of the dashed horizontalline with the respective error curves.
The current scale of figure 3 is approximately proportional to analytical concentra-tions. In practical analysis, the concentration range of interest can be made to corre-spond to any arbitrary current range within the limits of the spectral line intensitiesand the photodetectors. This is done, for example, by selection of spectral lines, bysample size, and by adjusting the gains of the photomultiplier tubes. In this discussion,the limitations of the spectral line emissions are not considered, and only the dynamicrange of the readout system is evaluated in terms of output current of the PM (photo-multiplier )tubes.
Several fundamental limits are presented in figure 3. The maximum photocurrent_4
was taken to be about 5X10 ampere. This is a typical design limit for a side-window,nine-stage PM tube such as the RCA (Radio Corporation of America) type 1P28. Alsoshown in figure 3 is an absolute lower limit of attainable precision as a function ofphotocurrent. This limit was calculated from photon event statistics by using equa-tion (1) and the noise-free precision limit expressed by a = N ' , where a is thestandard deviation and N is the number of photon events. Since this equation is appli-cable to a noise-free system, it expresses the absolute lower limit of precision attain-able in any real system, given the current, the PM tube amplification, and the integrat-ing time. For the calculations of figure 3, G was taken as 6X10 electrons per photon,typical of the RCA 1P28 tube with 800 volts applied. All calculations were made for anintegrating time of 10 seconds, which is about the minimum integration time in spectro-chemical analysis, but which may extend to about 100 seconds in some applications.
From the standpoint of dynamic range alone, each of the circuits would be satis-factory for the great majority of spectrochemical analyses. However, there are signi-ficant differences among the circuits for applications where the maximum dynamicrange is r.equired. These applications often involve so-called universal procedureswhich are designed to analyze wide concentration ranges. Some of the important char-acteristics of the circuits, in addition to dynamic range, are discussed in the followingsections.
10
•g
-= ge aOJ >•*
O X.c o</> 0.
sr p =>-S I E.E i: o
O Or s -i
-° w i_
rt "S .€ S.To a- ^S-g S £
e
I
, 31 u_
O
•£3"O ^_S °^^ cc 'ro^ en
s.
£ o
~3-"o ±r
IIg
.2 '
£ S".§,.=
11
Principle of Operation of Photomultiplier Tubes
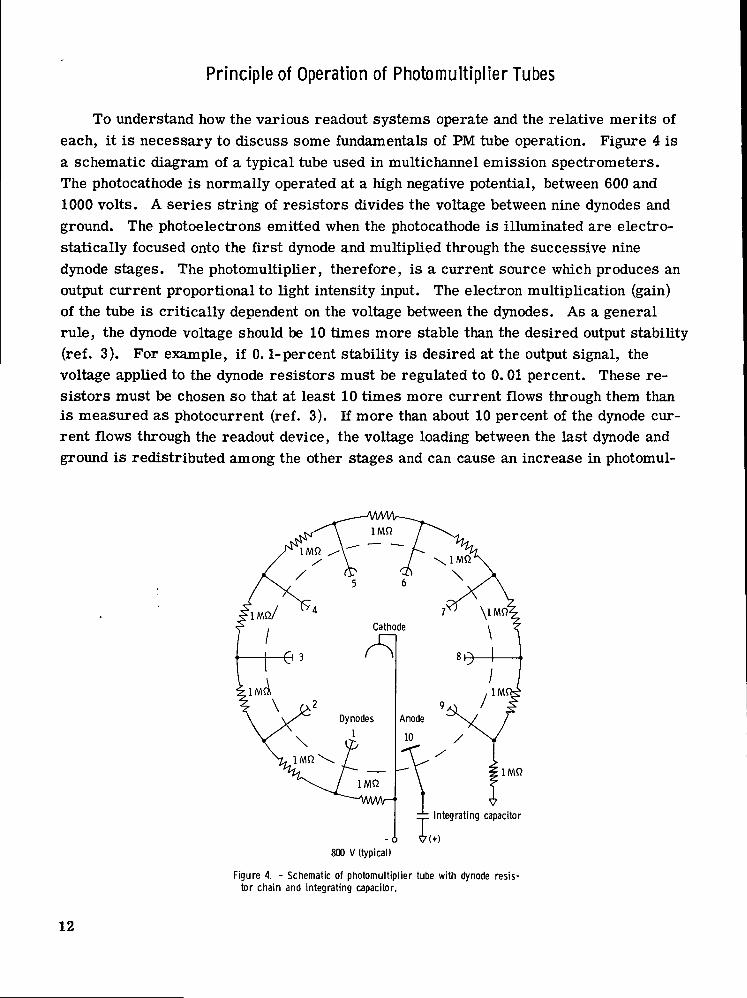
To understand how the various readout systems operate and the relative merits ofeach, it is necessary to discuss some fundamentals of PM tube operation. Figure 4 isa schematic diagram of a typical tube used in multichannel emission spectrometers.The photocathode is normally operated at a high negative potential, between 600 and1000 volts. A series string of resistors divides the voltage between nine dynodes andground. The photoelectrons emitted when the photocathode is illuminated are electro-statically focused onto the first dynode and multiplied through the successive ninedynode stages. The photomultiplier, therefore, is a current source which produces anoutput current proportional to light intensity input. The electron multiplication (gain)of the tube is critically dependent on the voltage between the dynodes. As a generalrule, the dynode voltage should be 10 times more stable than the desired output stability(ref. 3). For example, if 0.1-percent stability is desired at the output signal, thevoltage applied to the dynode resistors must be regulated to 0.01 percent. These re-sistors must be chosen so that at least 10 times more current flows through them thanis measured as photocurrent (ref. 3). If more than about 10 percent of the dynode cur-rent flows through the readout device, the voltage loading between the last dynode andground is redistributed among the other stages and can cause an increase in photomul-
Integrating capacitor
-A V(+)800 V (typical)
Figure 4. - Schematic of photomultiplier tube with dynode resis-tor chain and integrating capacitor.
12

tiplier gain (refs. 3 and 4). For a 10-percent loading of the last dynode there is anapproximate 1-per cent increase in the voltages between the various stages with an ap-proximate increase of 10 percent in photocurrent. Furthermore, the gain of the firststage has a greater effect on the shot noise than succeeding stages; and this voltage is,therefore, somewhat more critical. Voltage regulator tubes and Zener diodes can beused to fix the dynode voltages, but this approach was not investigated in this work.
When operating voltage is applied to a PM tube, an ohmic leakage current flowseven when the tube is in the dark. In addition to this dark current, thermionic noiseand pulses due to radioactive background are also present (ref. 2). This dark currentis relatively constant and can be subtracted when measuring light intensities.
Storage of Photocurrents on a Capacitor
In all the circuits except circuit V, a capacitor with low leakage specification isused as the charge storage device. In circuit n, the capacitor is effectively bufferedfrom the PM tube anode by the high-impedance OA and can, therefore, integrate currentlinearly up to the voltage rating of the OA. However, in circuits I, ni(a), and m(b) thecharging characteristic of the capacitor is dependent on the applied tube voltage, spec-ifically on the last dynode-to-ground potential. Figure 5 shows the charging curve as a
1201—
20 40 60 80 100Light exposure, arbitrary units
120 140
Figure 5. - Potential on integrating capacitor as function of light exposure.Integrating capacitor connected directly to anode of photomultiplier tubewhich was at potential of -94 volts.
13
function of time with constant light flux input. The departure from linearity at the highcapacitor voltages is the result of decreased anode photocurrent collection. This de-crease is caused by the reduction in anode-to-last-dynode voltage as the voltage of thecharging capacitor increases. As this difference in potential approaches zero the charg-ing rate is decreased until the capacitor voltage equals the voltage on the last dynode,at which point the capacitor stops charging. Therefore, the maximum voltage to whichthe capacitor can charge is a function of the applied tube voltage. This places a definitelimit of about 60 to 90 volts on the upper voltage range. This is the limiting character-istic of these circuits wherein the capacitor is connected directly to the anode.
Direct Capacitor Voltage - Circuit I
The voltage on the charged capacitor can be measured by using an operational am-plifier with an input impedance of 10 ohms, or greater. This circuit yielded a dynam-ic range of nearly 4 decades with a relative standard deviation of 1 percent, or better.The linearity obtained was as shown in figure 5, because the capacitor was connecteddirectly to the PM tube anode. The nonlinearity is an inherent characteristic of thiscircuit, as described in the previous section, but is not necessarily a disadvantage withmodern curve-fitting techniques and computer processing.
Integrating Operational Amplifier - Circuit II
This circuit gave the widest dynamic range of the analog circuits - about 4. 5 dec-ades at 1 percent precision and an additional decade within about 10 percent precision.The dynamic range was limited by environmental noise at a voltage resolution of about0.1 millivolt, as with circuit I, and by the maximum output voltage of the OA of 115volts. The capacitor was charged very linearly up to this 115-volt limit and was inde-pendent of the voltage on the last dynode. This circuit also has the advantage that buck-ing currents can be easily applied at the summing point of the OA to compensate fordark currents and spectral background currents.
A disadvantage of this circuit is that a small bias current is required to operatethe OA, and this current will either add to or subtract from the photocurrent stored onthe capacitor. When the PM tube is disconnected from the measuring circuit prior toreadout, this bias current will slowly change the voltage on the capacitor at a rate ofabout 0.1 millivolt per second for the components specified for this circuit. This cor-responds to a bias current of about 10 picoamperes. The manufacturer's specificationon the OA's used was 50 picoamperes.
14

The bias current of the OA is very constant and does not significantly affect therepeatability of measurements if the timing sequences of the readout are also highlyrepeatable. In a multichannel spectrometer, the time between disconnect from the PMtube and readout can be up to about 10 seconds for the last channels recorded. In thistime the capacitor voltage can change about 1 millivolt, typically. Furthermore, thistime was variable in the system tested because of variable delays due to range changingof the autoranging digital voltmeter. When this variable timing sequence can be shownto be a significant source of error, the timing sequence must be slowed to allow for themaximum range-changing delay for each channel recorded. No further definition ofthis source of error was made in this investigation. Another disadvantage of this cir-cuit is that the cost per channel is somewhat greater than the other analog circuitsbecause a separate high-voltage OA is required for each channel.
Timing of Capacitor Discharge - Circuits IIKa) and IIKb)
The integrated photocurrents stored on capacitors can be measured by dischargingthe capacitor through a fixed resistor and determining the time of discharge (ref. 5).The dynamic range of this system was about 3 decades, as shown in figure 3.
The maximum voltage that was measured with this circuit was limited by the maxi-mum voltage appearing at the last dynode of the PM tube, as explained previously, typ-ically between 70 and 90 volts. The discharge of the voltage on the capacitor was timedwith a 1-megahertz counter, which allowed sufficient resolution for 4 decades of dy-namic range within the precision limit of 1 percent. The time of discharge is propor-tional to the natural log of the charge on the capacitor
T = RCln-J: (3)V2
where
T time of discharge, sec
R circuit resistance, ohm
C analysis capacitor, F
Vj potential on analysis capacitor, V
Y£ terminal potential on analysis capacitor, V
15
The lowest voltage that could be detected with this circuit was about 50 millivolts.Below this terminal potential the system was susceptible to ambient noise spikes whichcaused uncertainties in terminating the timing of the discharge and also tended to startoscillations in the high-gain wide-bandwidth FET-OA. Thus, voltages between about70 volts and 50 millivolts could be digitized with repeatabilities of 1 percent, or better.
Circuit in(b) was a variation of the time-of-discharge method described previously.In this circuit, the voltage of the analysis capacitor was made relative to the dischargeof a reference capacitor voltage. The reference capacitor was charged to some fixedvoltage greater than the maximum voltage expected on the analysis capacitor, which wascharged with photocurrent. The reference capacitor was discharged through a fixedresistance until the OA input voltages were equal. The time required for voltage equili-brium was inversely proportional to the natural log of the voltage in the analysis capaci-tor
V2T = RC9 In —£ (4)
Vl
where
T time of voltage equilibrium (Vj = V2), sec
R circuit resistance, ohm
C analysis capacitance, F
Vj potential on analysis capacitor, V
Vg potential on reference capacitor, V
Therefore, the larger photocurrents produced the smaller count values. This affordedan approximately constant relative error over the photocurrent dynamic range.
The addition of the reference capacitor in circuit m(b) does not extend the dynamicrange, however. Its primary value is in measuring ratios of photocurrents, which isconvenient when using internal standards in spectrochemical analysis.
A disadvantage of circuits m(a) and in(b) was that the maximum discharge time wasof the order of 1 second per channel. Therefore, these circuits are not compatible withhigh-speed digital data logging when the maximum dynamic range is required. Further-more, with circuit m(b) the maximum readout time was required for channels withlittle or no charge on their respective capacitors. In most applications of multichannelspectrometers, only a few channels contain most of the information. However, withdata logging systems with speeds of about 10 to 30 characters per second, these circuitsmay not be time limiting.
16

Voltage-to-Frequency Converter - Circuit IV
The dynamic range of a voltage-to-frequency converter circuit, shown in figure 2(d)(circuit IV), was estimated to be about 3.25 decades, allowing a 2-second readout timein the spectrometric application. The dynamic range of this circuit was limited by thespeed of the voltage-to-frequency converter. A state-of-the-art converter can operateat a rate of 250 kilohertz with a 0.1-percent nonlinearity, and the voltage-to-frequencyconverter of figure 2(d) was designed to be compatible with a converter with this fre-quency response.
In this circuit, the total charge stored on the integrating capacitor was measuredby connecting to an integrating-type voltage-to-frequency converter. The counting rateof the converter was proportional to the voltage on the analysis capacitor, which wascharged by photocurrent. As the analysis capacitor is discharged through the converterinput resistor, its voltage drops exponentially with time until the capacitor is completelydischarged, or until the measurement is otherwise terminated. Likewise, the initialcount rate of the converter is somewhat higher than the average count rate and falls tozero with complete discharge of the capacitor. With the circuit of figure 2, the initialcount rate was about 625 kilohertz, thus exceeding the linear frequency response of theconverter. However, the average count rate was 125 kilohertz, and the deviation fromlinearity resulting from the high initial count rate was acceptable in the interests ofmaximum dynamic range. The operational amplifier used with this circuit should havea full output capability from -10 volts to +10 volts, at a frequency of 10 megahertz, andlow offset current of 50 picoamperes or less.
If the 0.1-microfarad capacitor in circuit IV is charged to a maximum of 100 volts,and with an allowable conversion time of 2 seconds, the voltage-to-frequency converterwill produce about 250 000 counts for complete charge transfer (i.e., C^VA/CfVQa =250 000, where C* and Cf are the analysis and feedback capacitors, respectively;and VA and V are the voltages on CA and the OA output, respectively). In the2-second allowable conversion time, CA will discharge to about 0.7 percent of theinitial value of VA- This represents about five time constants of the discharge circuit(4 MS2 x 0.1 fit). Therefore, the dynamic range of this system, within the 1-percentrepeatability criterion, was between 100 and 250 000 counts, or about 3.25 decades.
A disadvantage of this circuit is that it is not compatible with high- speed data acqui-sition because of the relatively long readout time required for wide dynamic range.However, it would be suitable for typewriter recording speeds of 10 to 30 charactersper second.
17

Photon Counting - Circuit V
The dynamic range of a state-of-the-art photon-counting system was estimatedto be about 4. 5 decades, within the 1-percent precision criterion. In figure 3,the dashed portion of the error curve for photon counting was estimated, whereas thesolid portion was experimentally verified. The lower limit of the curve was calculatedfrom the shot noise limit for a 10-second integration, a PM tube gain of 6x10 electronsper photon, and a PM background of 100 hertz. Each of these values represents typicalconditions encountered in spectrochemical analysis. The rate of photon events per am-pere of photocurrent was calculated from these conditions by using equation (1). The
/*
highest current was estimated to be about 3x10~ ampere as limited by the maximumcount rate of the amplifier-discriminator. As this maximum count rate is approached,the amplifier response becomes nonlinear; and as a result the error increases, as in-dicated in figure 3, but does not exceed 1 percent up to the 25-megahertz cutoff.
The photon-counting technique has some characteristics which make it potentiallyadvantageous as a wide-dynamic-range readout system in emission spectroscopy. Ref-erence 6 presents some of the considerations when using this circuit for spectrochemi-cal analysis. It provides a digital readout for discrete events without an intermediateanalog conversion. In addition, the ultimate performance of the system follows well-defined counting statistics according to equations (1) and (2).
However, in addition to the relatively high cost per channel, there are some notabledisadvantages of this technique when it is used as a wide-dynamic-range readout systemin emission spectrochemical analysis. First, the photocurrents measured are usuallyin a range where dc circuits perform equally as well or better than photon- countingcircuits. As pointed out in references 7 and 8 and other sources, the photon-countingcircuit outperforms dc circuits at low light levels which produce photocurrents of theorder of dark current (i.e., 10" A and lower). However, the spectrochemical appli-cation is usually not light limited and photocurrents up to 10 to 100 microamperes canbe supplied, if necessary.
Second, the photon-counting circuit is susceptible to high-frequency noise fromhigh-voltage sparks used to excite atomic spectra. To achieve the lower current limitshown in figure 3 in the presence of such noise will require careful shielding of elec-tronic components.
Third, the photon emission rates in spectrochemical analysis are not constant withtime, as was assumed in setting the upper current limit in the analysis of this circuit,but are variable with both arc and spark excitation. Therefore, the upper limit of thephoton-counting circuit, as shown in figure 3, is somewhat overestimated because ofthis approximation.
18

CONCLUDING REMARKS
Of the circuits evaluated, the photon-counting circuit and the operational-amplifierintegrator circuit gave the widest dynamic range within a 1-per cent repeatability cri-terion. Both circuits responded over about 4. 5 decades of input photocurrents withoutrange switching. This dynamic range corresponded to photocurrents between about10" and 10" ampere and to voltages of between 1 millivolt and 100 volts on the inte-grator capacitor.
The low current limit of the photon-counting circuit was defined by the combinedeffects of theoretical shot noise limit and detector noise, whereas the upper currentwas limited by the maximum frequency response of the amplifier-discriminator. Withthe dc operational-amplifier integrator circuit, the lower voltage limit was defined byenvironmental electrical noise, whereas the upper voltage limit was defined by the max-imum operating voltage of the operational amplifiers. The photon-counting circuit wasprohibitively expensive for applications requiring more than a few channels, but furtheradvances in technology could make this circuit the method of choice.
Several other dc circuits can also be used to read out photocurrents, but with somecompromise of maximum dynamic range as compared with the other circuits mentionedherein. In particular, the circuit configuration in which capacitors were connected tointegrate directly and to store the photocurrents, followed by voltage readout with avoltage-follower circuit, gave a dynamic range response of about 4 decades. Thiscircuit was more economical in multichannel operation because only a single voltage-follower circuit was required for all channels.
The other dc circuits, including time of capacitor discharge and incremental capac-itor discharge, were limited in dynamic range to about 3. 5 decades but were relativelysimple and reliable in operation.
Lewis Research Center,National Aeronautics and Space Administration,
Cleveland, Ohio, September 22, 1971,134-03.
REFERENCES
1. Gordon, William A.; and Chapman, Gilberts.: Quantitative Direct-Cur rent ArcAnalysis of Random Compositions of Microgram Residues in Silver Chloride Com-mon Matrix. Spectrochim. Acta., vol. 25B, 1970, pp. 123-137.
19

2. Eberhardt, E. H.: Noise In Photomultiplier Tubes. IEEE Trans, on Nucl. Sci.,vol. NS-14, no. 2, Apr. 1967, pp. 7-14.
3. Sharpe, J.; Stanley, V. A.; and Keene, J. P.: Introduction to the Photomultiplier.Publ. 2M/6-67/1554E1, The EMI Co., London, 1967.
4. Santini, R. E.; and Pardue, H. L.: Design and Evaluation of a Stabilized, DualDetector Chemiluminescence Spectrophotometer. Anal. Chem., vol. 42, no. 7,June 1970, pp. 706-712.
5. Saunderson, Jason L.; Caldecourt, Victor J.; and Peterson, Eugene W.: Photo-electric Instrument for Direct Spectrochemical Analysis by the Internal StandardMethod. Patent No. 2,577,815, United States, Dec. 11, 1951.
6. Franklin, M. L.; Horlick, Gary; and Malmstadt, H. V.: Basic and Practical Con-siderations in Utilizing Photon Counting for Quantitative Spectrochemical Methods.Anal. Chem., vol. 41, no. 1, Jan. 1969, pp. 2-10.
7. Alfano, R. R.; and Ockman, N.: Methods for Detecting Weak Light Signals. J.Opt, Soc. Am., vol. 58, no. 1, Jan. 1968, pp. 90-95.
8. Nakamura, J. K.; and Schwartz, S. E.: Synchronous Detection vs Pulse Countingfor Sensitive Photomultiplier Detection Systems. Appl. Opt., vol. 7, no. 6, June1968, pp. 1073-1078.
20 NASA-Langley, 1971 6 E~6525

NATrOHAL AERONAUTICS AND SPACE ADMJSTRATtONWASHINGTON. D.C 20546
OFFICIAl^BUSINESS
PENAt-TY FOR^RHJATE USg t300 I /7FIRST CLASS MAIL
' POSTAGE AND fgES PAID
^/NATIONAL AERONAUTICS ANO
fe SPACG AOMINfSTRATION
POSTMASTER: If UndclivcrabJc (Section 1)8Postal Manual) Do Not Return
/ ' ,* ' ' *, ' '--:;» % T/f-, '^"The'aeronautical and space activities of: We United, States shall be
condmted so as to contribute . ,',/to the expansion of 'hitman knowl-edge 'of phenomena in the atmosphere and, space. The Administrationshall, provide for the widest practicable and appropriate disseminationof infoftuation concerning its activities and the results thereof."
—NATIONAL AERONAUTICS AND SPACE ACT OF 1958
SCIENTIFIC AND TECHNICAL B0BIJKATI©NS
TECHNICAL REPORTS: Scientific andtechnical informatioa considered important,complete, and a' lasting contribution to existingknowkdge.
TECHNICAL NOTES: Information less broadin scope but nevertheless of importance as acontribution to existing knowledge.
TECHNICAL MEMORANDUMS:Information receiving limited distributionbecause of preliminary data, security classifica-tion, or other reasons.
CONTRACTOR REPORTS: Scientific andtechnical information generated under a NASAcontract or grant and considered an importantcontribution to existing knowledge.
TECHNICAL TRANSLATIONS: Informationpublished in a foreign language consideredto merit NASA distribution in English.
SPECIAL PUBLICATIONS: Informationderived from or of value to NASA activities.Publications include conference proceedings,monographs, data compilations, handbooks,sourcefeooks, and special bibliographies.
TECHNOLOGY UTILIZATIONPUBLICATIONS: Information on technologyused by NASA that may be of particularinterest in commercial and other non-aerospaceapplications. Publications include Tech Briefs,Technology Utilization Reports and
Technology Surveys.
Details on the availability of these publications may be obtained from:
SCIENTIFIC AND TECHNICAL INFORMATION OFFICE
NATIONAL AERONAUTICS AND SPACE ADMINISTRATIONWashington, O.C. 20546
Related Documents