NASA TECHNICAL NASA TM X-72664 MEMORANDUM COPY NO. C.j N"- I c- TECHNIQUE AND COMPUTER PROGRAM FOR CALCULATING PHOTOGRAPHIC FILM DENSITY VARIATIONS BY Craig W. Ohlhorst (NASA-TM-X-72 66 4) TECHNIQUE AND COMPUTER N75-17635 PROGRAM FOR CALCULATING PHOTOGRAPHIC FILM DENSITY VARIATIONS (NASA) 32 p HC $3.75 CSCL 14E Unclas .. G_3/35 11i 08 , This informal documentation medium is used to provide accelerated or special release of technical information to selected users. The contents may not meet NASA formal editing and publication standards, may be re- vised, or may be incorporated in another publication. NATIONAL AERONAUTICS AND SPACE ADMINISTRATION LANGLEY RESEARCH CENTER, HAMPTON, VIRGINIA 23665 https://ntrs.nasa.gov/search.jsp?R=19750009563 2018-07-12T06:35:52+00:00Z

Welcome message from author
This document is posted to help you gain knowledge. Please leave a comment to let me know what you think about it! Share it to your friends and learn new things together.
Transcript
NASA TECHNICAL NASA TM X-72664
MEMORANDUM COPY NO.
C.jN"-
Ic- TECHNIQUE AND COMPUTER PROGRAM FOR CALCULATING
PHOTOGRAPHIC FILM DENSITY VARIATIONS
BY Craig W. Ohlhorst
(NASA-TM-X-726 6 4) TECHNIQUE AND COMPUTER N75-17635
PROGRAM FOR CALCULATING PHOTOGRAPHIC FILM
DENSITY VARIATIONS (NASA) 32 p HC $3.75CSCL 14E Unclas.. G_3/35 11i0 8 ,
This informal documentation medium is used to provide accelerated or
special release of technical information to selected users. The contentsmay not meet NASA formal editing and publication standards, may be re-
vised, or may be incorporated in another publication.
NATIONAL AERONAUTICS AND SPACE ADMINISTRATION
LANGLEY RESEARCH CENTER, HAMPTON, VIRGINIA 23665
https://ntrs.nasa.gov/search.jsp?R=19750009563 2018-07-12T06:35:52+00:00Z
1. Report No. 2. Government Accession No. 3. Recipient's Catalog No.
TMX- 726644. Title and Subtitle 5. Report Date
February 7, 1975Technique and Computer Program for Calculating 6. Performing OrgPhotographic Film Density Variations 67.710
7. Author(s) 8. Performing Organization Report No.
Craig W. Ohlhorst10. Work Unit No.
9. Performing Organization Name and Address
NASA-Langley Research Center, Hampton, VA 23665 11. Contract or Grant No.
13. Type of Report and Period Covered12. Sponsoring Agency Name and Address
14. Sponsoring Agency CodeNASA-Langley Research Center, Hampton, VA 23665
15. Supplementary Notes
Interim technical information release subject to possible revision and/or later
formal publication.
16. Abmtailm density data that have been digitalized and recorded in Binary Coded
Decimal (BCD) format are converted into a number representing the film density
difference between the unexposed film border and any point on a photograph by
program CONVERT. The difference between AVERAGE, the BCD number representing
the unexposed film area and the BCD number of a specific data point is calculated
and then multiplied by three constants to produce the desired film density
difference. The angle off the principal axis of the lens is computed for each
data point in order that a correction factor be applied to compensate for
atmospheric backscattering differences and light intensity fall-off, inherent in
the camera lens system in use. The program is capable of plotting the calculated
density differences. The percentage of pointsin specific density ranges can
1n h nmpnt a17. Key Words (Suggested by Author(s)) (STAR category underlined) 18. Distribution Statement
Photographic Film Density Calculations, Unclassified - UnlimitedComputer Program, computer picture plot
mi crodens itometer
19. Security Oassif. (of this report) 20. Security Classif. (of this page) 21. No. of Pages 22. Price'
Unclassified Unclassified2 $375The National Technical Information Service, Springfield, Virginia 22151
Available fromSTIF/NASA Scientific and Technical Information Facility, P.O. Box 33, College Park, MD 20740
TECHNIQUE AND COMPUTER PROGRAM
FOR CALCULATING PHOTOGRAPHIC FILM DENSITY VARIATIONS
by Craig W. Ohlhorst
Langley Research Center
SUMMARY
A technique and computer program have been developed to calculate the
film density difference between the unexposed film border and any point on a.
photograph. The program calculates the angle off the principal axis of thecamera lens so that a correction can be made for vignetting and atmosphericbackscattering. The program also plots the computed values as a function' ofposition on the photograph so that a three-dimensional.picture is produced.Ranges of density difference can be predetermined, and the program will placeeach data point into its corresponding range so that the percentage of pointsin each rangE can be calculated.
SYMBOLS
AA proportionality constant, mm/BCD
AVERAGE number in BCD format representing the density of the unexposedfilm area
BB proportionality constant representing the gradient of the-lineardensity wedge, density/mm
BCD microdensitometer recorded film density
CT represents the number of data points recorded from the borderline trace
Sum represents the summation of BCD numbers for the data points recordedfrom the border line trace
XMM: calculated film density difference, density
ZZ correction factor for vignetting and atmospheric backscattering
ABCD difference in BCD numbers between any two.points
angle off the principal axis of the camera lens, degrees
Aj vertical component of , degrees
cpi horizontal component of , degrees
6 camera horizontal half angle, degrees
INTRODUCTION
It takes considerable time and money to collect and analyze water samplesto determine the health state of a body of water. Development of an instru-ment that could remotely determine the water quality of a body of waterwould be of great benefit to the effort of monitoring the water quality ofthis nation's rivers and lakes.
The NASA Langley Research Center, in conjunction with other federalagencies, has been working on a program to develop and evaluate instrumentsthat will have the capacity to remotely determine various water qualityparameters. One of the instruments being evaluated is a wide-angle lens,aerial photography system with appropriate lens filter combinations. Thewide-angle lens is used to get both high spatial resolution and a synopticview at the same time. Film density of the photographs are then analyzed tosee if there is a correlation between radiance intensity and certain waterquality parameters. It has been shown in reference 1, for example, that thefilm density difference between the unexposed film border and a point on aphotograph can be correlated to chlorophyll a concentrations.
Data obtained using the wide-angle lens require a mathematical correctionto the film densities to compensate for atmospheric backscattering and lensvignetting. The correction needed is a function of location on the photograph(angle off the principal axis of the lens). The principal axis is assumed hereto be the same as the perpendicular vertical intersecting the center point ofthe photograph. Each data point will have 'a unique angle, so a method tocalculate this angle is needed. A microdensitometer, an isodensitracer, anda magnetic tape encoder were combined to digitalize the film densities. Thispaper presents a technique and computer program to convert digitalized filmdensities into a number representing the film density difference between theunexposed film border and a point on the photograph.
PROBLEM TASK DESCRIPTION
A National Instruments Laboratories' Isodensitracer and Magnetic TapeDigital Encoder System are used to digitalize film densities obtainedfrom a Joyce, Label and Company Microdensitometer. These are recorded inBinary Coded Decimal (BCD) format. The problem considered in this paper isthat of calculating the film density difference between the unexposed filmborder and any recorded data point.
2
TECHNIQUE FOR COMPUTING FILM DENSITY DIFFERENCES
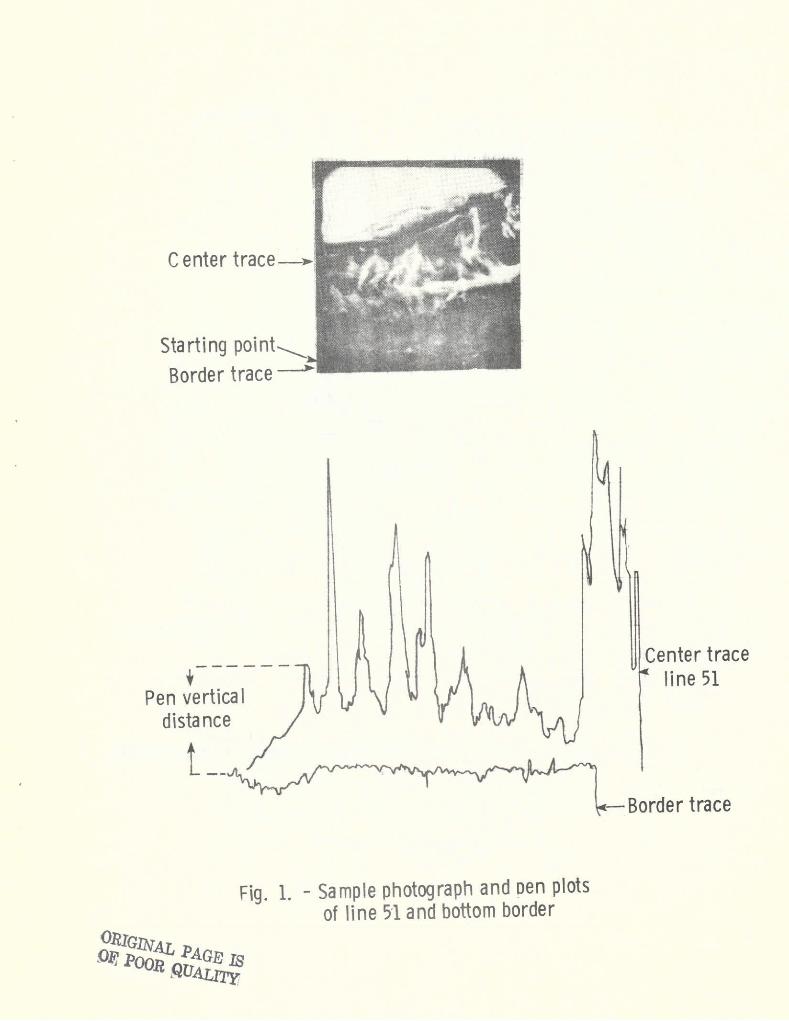
The Joyce, Lobel and Company Microdensitometer, Model Mark III C, hasbeen modified electronically to utilize the automatic interval stepper of theisodensitracer so that the microdensitometer can automatically scan a fullphotograph. The microdensitometer uses a double-beam system in which twolight beams from a single source are alternately impinged on a photomultipliertube. 2 The photomultiplier alternately sees the beam going through the speci-men and through a reference linear density wedge, thus providing an electricalsignal which causes movements of a servomotor to bring the linear wedge intooptical balance with the specimen beam. A pen attached to the linear wedgecarriage plots the position of the wedge resulting in a plot of the density.The vertical distance that the tracing pen moves, (see figure 1), equals thedistance that the linear wedge is shifted to optically balance the referenceand specimen beam. Multiplication of this vertical pen distance by theslope (BB, density/mm) of the linear density wedge will give a film densitydifference value.
The Magnetic Tape Encoder System is mounted on the rear of themi'crodensitometer and attached to one of the pulleys driving the lineardensity wedge. A multicommutator is mounted on the x-axis of the flat bedrecorder. This c6mmutator provides 5, 10, 20, 50, or 100 contacts per revolu-tion and is so mounted to provide approximately 10 revolutions for one traverseof the recording table on the X-axis. At each point of contact, density datum is-recorded. The encoder provides a BCD output corresponding to one of 175 posi-tions evenly spread out along the length of the linear wedge; thus, there is adirect proportionality between the magnitude of the difference in BCD nubersbetween any two points and the vertical pen distance between those points.
Vertical Pen Distance = (AA)(ABCD)
The proportionality constant (AA) has been hand calculated and storedin the program. (See Appendix A for the calculation of AA.) A mathematicalcomputation subtracting the recorded BCD number for a specific data pointfrom the BCD number representing the unexposed film border (AVERAGE) willgive the ABCD number for that data point. AVERAGE is calculated by summingup the BCD numbers of the border trace and dividing by the total number ofpoints in that trace.
AVERAGE = Sum/CT
As previously stated, multiplication of the vertical pen distance byconstant BB would give the film density difference for a specific data point.Use of a wide-angle lens requires that a correction for vignetting andatmospheric backscattering be made. The correction must be applied to thevertical pen distance before multiplication by BB. The correction factor (ZZ),can be calculated and applies to each data point, provided the angle 1 foreach point is known (see fig. 2). For the photograph shown in this paper,ZZ was set equal to cos2o. The angle 0 can.be broken up into its horizontaland vertical components with
3
tan2 = tan2 i + tan2 (Aj
The angles pi and .Aj can be calculated since the number of points
recorded per scan and the number of scan lines are known.
Camera horizontal half anglepi = 1/2(number of points per scan) X Pi
= Camera horizontal half angle XA1/2(total number of scan lines) X Aj
where p. = ith point from the center of the film
A. = jth line from the centerline
2These angles are calculated by the user, converted to tan2 values by
the user, an stored by Data Statements in the program. The program calls2 2
the appropriate" tan pi and tan A values for each data point, adds them
together, and calculates $. Thus, the steps for calculating the filmdensity difference are:
1. Calculation of AVERAGE2. AVERAGE - BCD = ABCD3. (ABCD) X (AA) = Vertical Pen Distance4. Calculation of 05. Calculation of ZZ6. (Vertical Pen Distance)/(ZZ) = Corrected Vertical Pen Distance7. (Corrected Vertical Pen Distance) X (BB) = XMM
PROGRAM DESCRIPTION
Program CONVERT is written in Fortran IV for the Control Data 6000 seriescomputers. It uses Langley Research Center Library subroutines PSEUDO,CALPLT, AXIS, LINPLT, NFRAME; and Library functions SQRT, ATAN, and COS.The program also uses Subroutine ENCOD, which is not in the Langley ComputerLibrary but was developed by Langley personnel for use with the MagneticTape Encoder.
Program CONVERT
Program CONVERT is used for the input and output of data. It initializesthe variables. Subroutine ENCOD takes the information off the tape, and theprogram calculates the corrected film density difference values. Each valueis placed in a range of density differences by the program so that the
4
percentage of points in each range can be calculated. The user specifies
the desired density difference ranges. Program CONVERT also plots the
computed values as a function of position on the photograph so that a three-
dimensional picture is produced with the third dimension being the density
difference.
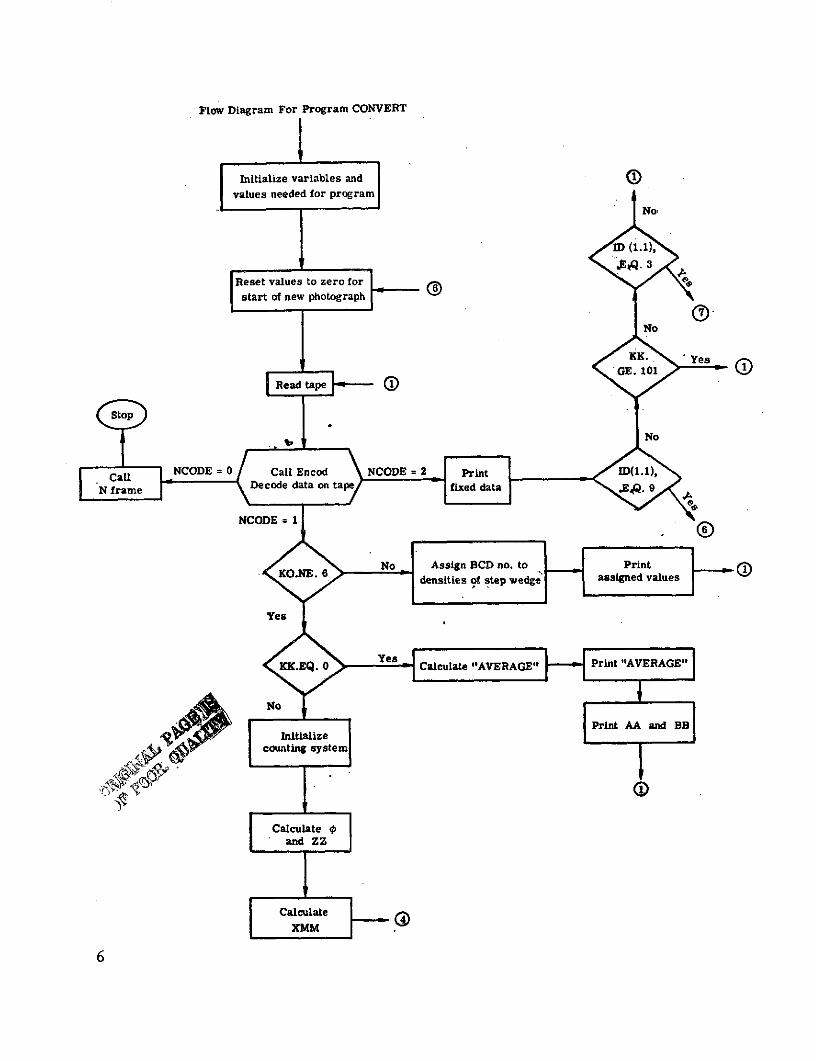
A specific order of data input onto the recording tape must be followed
for the program to work properly. The specific order needed is explained in
Appendix B, and a program listing is given in Appendix C. The flow diagram
of program CONVERT is shown on pages 6 and 7.
PROGRAM USAGE
The program is run on the Control Data 6000 series computer under the
Scope 3.0 operating system and requires a field length of 60,0008 storage
locations. The Central Processing Unit (CPU) time will depend on the number
of data points recorded. A CPU time of 150 seconds will usually be enough
to analyze one 70 mm size photograph with 50,000 data points recorded.
Input Description
Most of the input data comes from the user submitted tape. Other input
data terms are as follows:
PPP array of Kodak step wedge densities corresponding to the wedge
steps that were traced over by the microdensitometer, inputed by
a Data Statement
CFX array of the tan pi values for each data point in a line,
inputed by a Data Statement
CFY array of the tan QAj values for each line, inputed by a Data
Statement
AA constant, mm/BCD
BB constant, density/mm
Desired density difference ranges--entered by IF Statements.
Output Description
The output for program CONVERT consists of these elements:
1. Five lines of machine setting and other non-density data. See Table I
for sample listing. The settings are recorded by the Fixed Data Switches on
the Magnetic Tape Encoder (see Appendix D).
5
Flow Diagram For Program CONVERT
Initialize variables and0
values needed for program
No,
ID (1.1),
Reset values to zero for
start of new photograph
No
KK. YesSGE. 101
Read tape 9
StopNo
S Call NCODE= 0 Call Encod NCODE = 2 Print (.1)
N frame Decode data on tape fixed data s . 9
NCODE = 1
No Assign BCD no. to PrintKOXE. 6 densities of step wedge assigned values
Yes
KK.EQ. O Yes Calculate "AVERAGE" Print "AVERAGE"
No Print AAInitialize
and BB
counting syste
Calculateand ZZ
CalculateXMMM
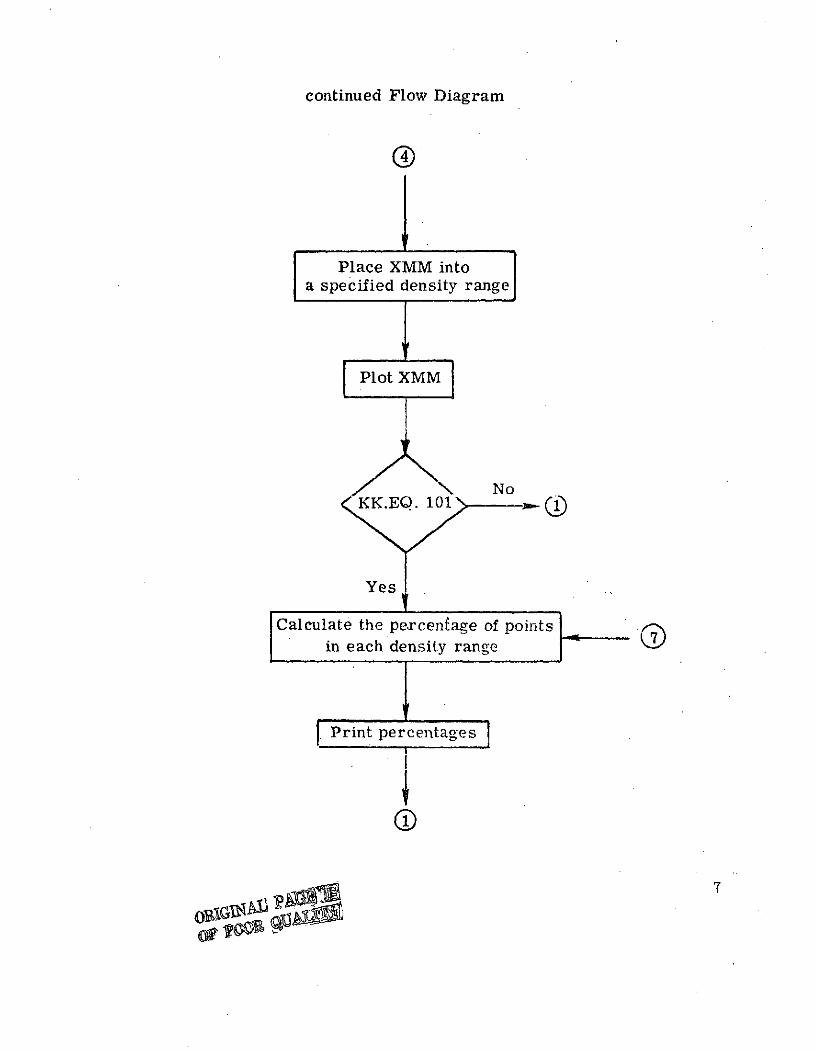
continued Flow Diagram
Place XMM intoa specified density range
Plot XMM
\ NoKK.. 101
Y es
Calculate the percenfage of pointsin each density range
Print percentages
7
~B~ n~~L: I
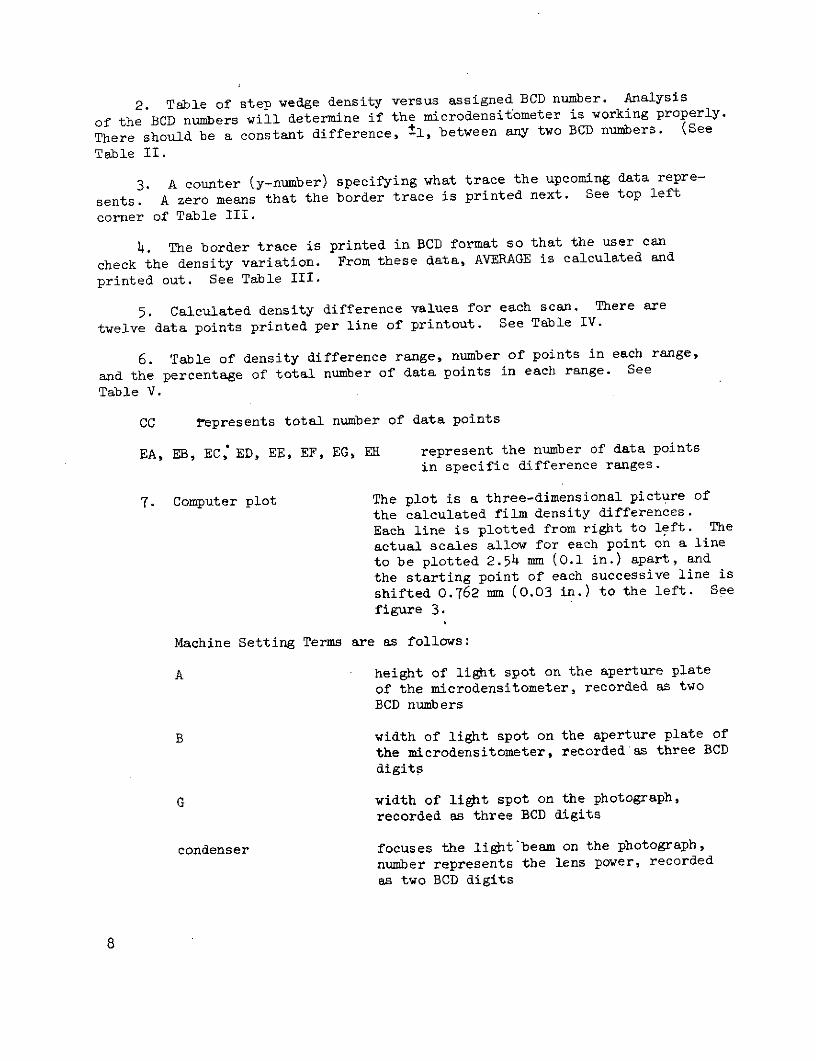
2. Table of step wedge density versus assigned BCD number. Analysis
of the BCD numbers will determine if the microdensitometer is working properly.
There should be a constant difference, +1, between any two BCD numbers. (See
Table II.
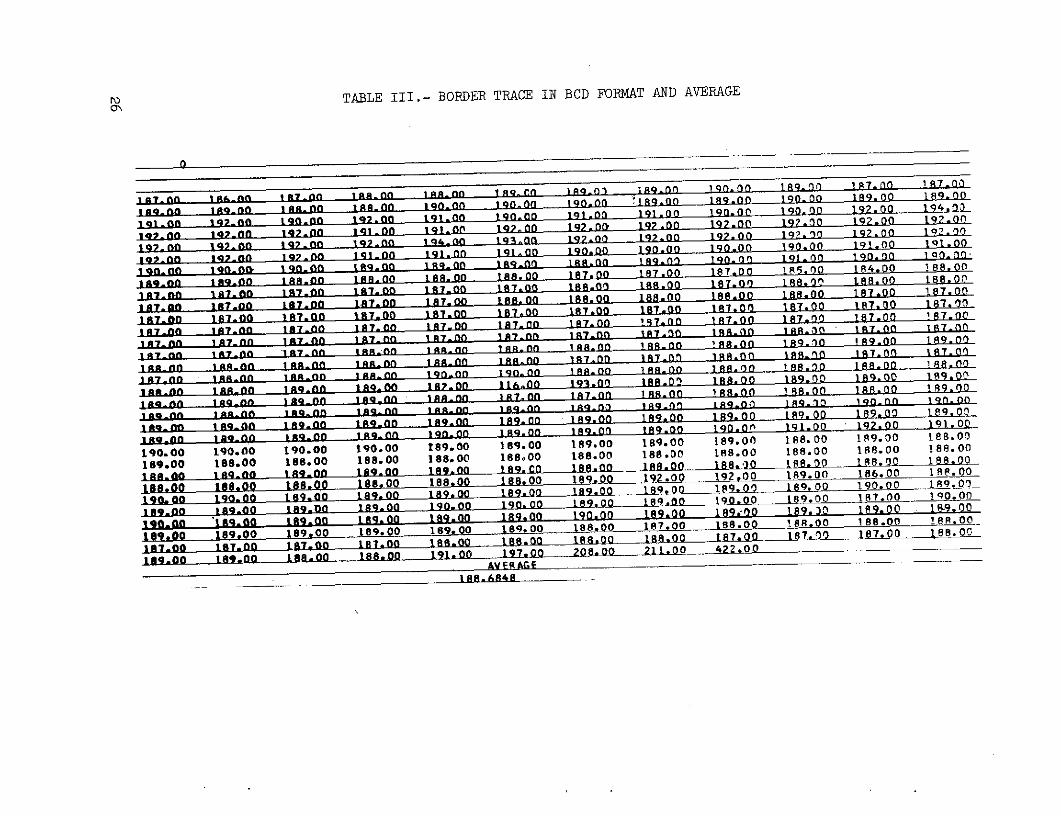
3. A counter (y-number) specifying what trace the upcoming data repre-
sents. A zero means that the border trace is printed next. See top left
corner of Table III.
4. The border trace is printed in BCD format so that the user can
check the density variation. From these data, AVERAGE is calculated and
printed out. See Table III.
5. Calculated density difference values for each scan. There are
twelve data points printed per line of printout. See Table IV.
6. Table of density difference range, number of points in each range,
and the percentage of total number of data points in each range. See
Table V.
CC represents total number of data points
EA, EB, EC, ED, EE, EF, EG, EH represent the number of data points
in specific difference ranges.
7. Computer plot The plot is a three-dimensional picture of
the calculated film density differences.
Each line is plotted from right to left. The
actual scales allow for each point on a line
to be plotted 2.54 mm (0.1 in.) apart, and
the starting point of each successive line is
shifted 0.762 mm (0.03 in.) to the left. See
figure 3.
Machine Setting Terms are as follows:
A height of light spot on the aperture plate
of the microdensitometer, recorded as two
BCD numbers
B width of light spot on the aperture plate of
the microdensitometer, recorded as three BCD
digits
G width of light spot on the photograph,recorded as three BCD digits
condenser focuses the light'beam on the photograph,number represents the lens power, recorded
as two BCD digits
8
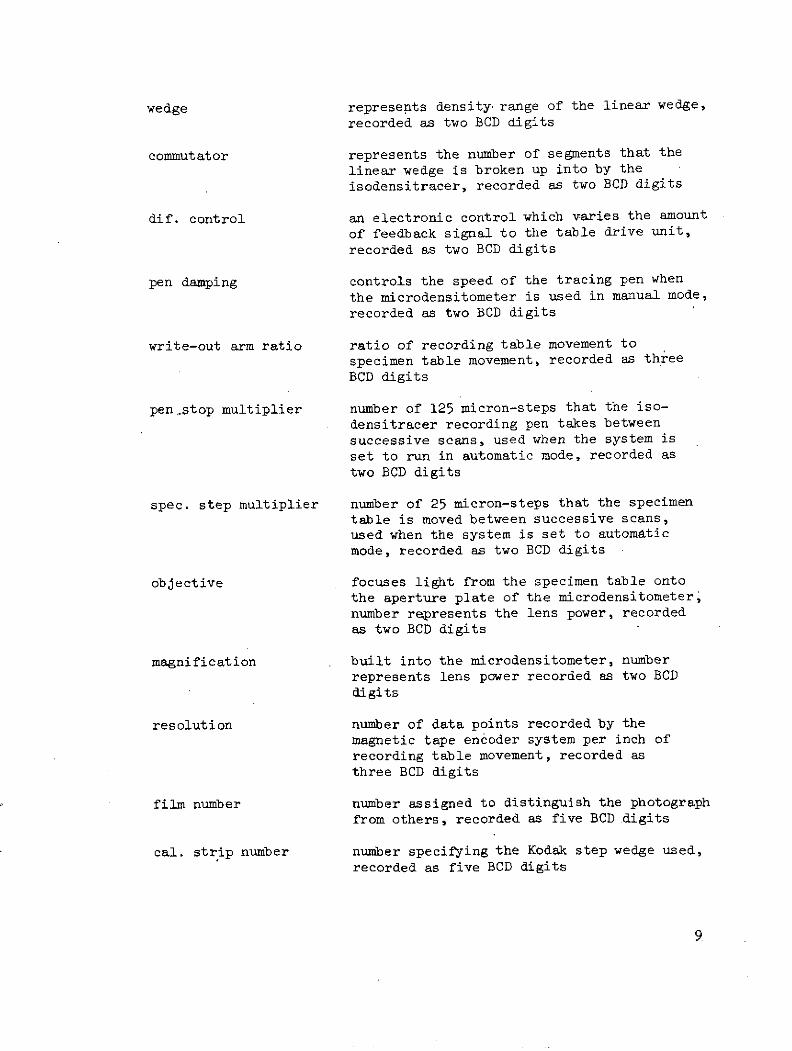
wedge represents density range of the linear wedge,recorded as two BCD digits
commutator represents the number of segments that the
linear wedge is broken up into by theisodensitracer, recorded as two BCD digits
dif. control an electronic control which varies the amount
of feedback signal to the table drive unit,recorded as two BCD digits
pen damping controls the speed of the tracing pen when
the microdensitometer is used in manual mode,recorded as two BCD digits
write-out arm ratio ratio of recording table movement to
specimen table movement, recorded as three
BCD digits
pen.-stop multiplier number of 125 micron-steps that the iso-
densitracer recording pen takes between
successive scans, used when the system isset to run in automatic mode, recorded as
two BCD digits
spec. step multiplier number of 25 micron-steps that the specimentable is moved between successive scans,used when the system is set to automaticmode, recorded as two BCD digits
objective focuses light from the specimen table ontothe aperture plate of the microdensitometer,number represents the lens power, recordedas two BCD digits
magnification built into the microdensitometer, numberrepresents lens power recorded as two BCDdigits
resolution number of data points recorded by themagnetic tape encoder system per inch ofrecording table movement, recorded asthree BCD digits
film number number assigned to distinguish the photographfrom others, recorded as five BCD digits
cal. strip number number specifying the Kodak step wedge used,recorded as five BCD digits
9
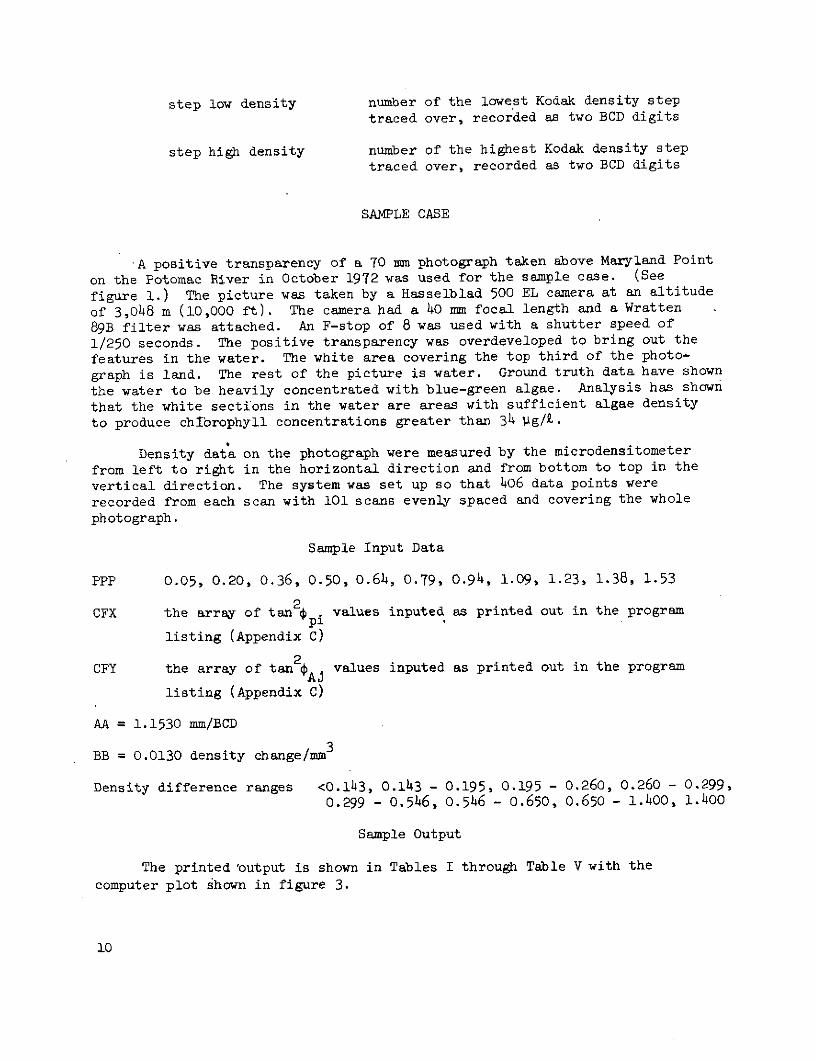
step low density number of the lowest Kodak density steptraced over, recorded as two BCD digits
step high density number of the highest Kodak density steptraced over, recorded as two BCD digits
SAMPLE CASE
A positive transparency of a 70 mm photograph taken above Maryland Point
on the Potomac River in October 1972 was used for the sample case. (See
figure 1.) The picture was taken by a Hasselblad 500 EL camera at an altitude
of 3,048 m (10,000 ft). The camera had a 40 mm focal length and a Wratten
89B filter was attached. An F-stop of 8 was used with a shutter speed of
1/250 seconds. The positive transparency was overdeveloped to bring out the
features in the water. The white area covering the top third of the photo-
graph is land. The rest of the picture is water. Ground truth data have shown
the water to be heavily concentrated with blue-green algae. Analysis has shown
that the white sections in the water are areas with sufficient algae density
to produce chlbrophyll concentrations greater than 34 Pg/i.
Density data on the photograph were measured by the microdensitometer
from left to right in the horizontal direction and from bottom to top in the
vertical direction. The system was set up so that 406 data points were
recorded from each scan with 101 scans evenly spaced and covering the whole
photograph.
Sample Input Data
PPP 0.05, 0.20, 0.36, 0.50, 0.64, 0.79, 0.94, 1.09, 1.23, 1.38, 1.53
2CFX the array of tan p .i values inputed as printed out in the program
listing (Appendix C)
CFY the array of tan 2 Aj values inputed as printed out in the program
listing (Appendix C)
AA = 1.1530 mm/BCD
BB = 0.0130 density change/mm3
Density difference ranges <0.143, 0.143 - 0.195, 0.195 - 0.260, 0.260 - 0.299,
0.299 - 0.546, 0.546 - 0.650, 0.650 - 1.400, 1.400
Sample Output
The printed 'output is shown in Tables I through Table V with the
computer plot shown in figure 3.
10
CONCLUDING REMARKS
A technique and computer program have been developed to calculate the
film density difference between the unexposed film border and any point on a
photograph. The program calculates the angle off the principal axis of the
camera lens so that a correction can be made for vignetting and atmospheric
backscattering. The program also plots the computed values as a function of
position on the photograph so that a three-dimensional picture is produced.
Ranges of density difference can be predetermined, and the program will place
each data point into its corresponding range so that the percentage of points
in each range can be calculated.
11
APPENDIX A
CALCULATION OF CONSTANT AA
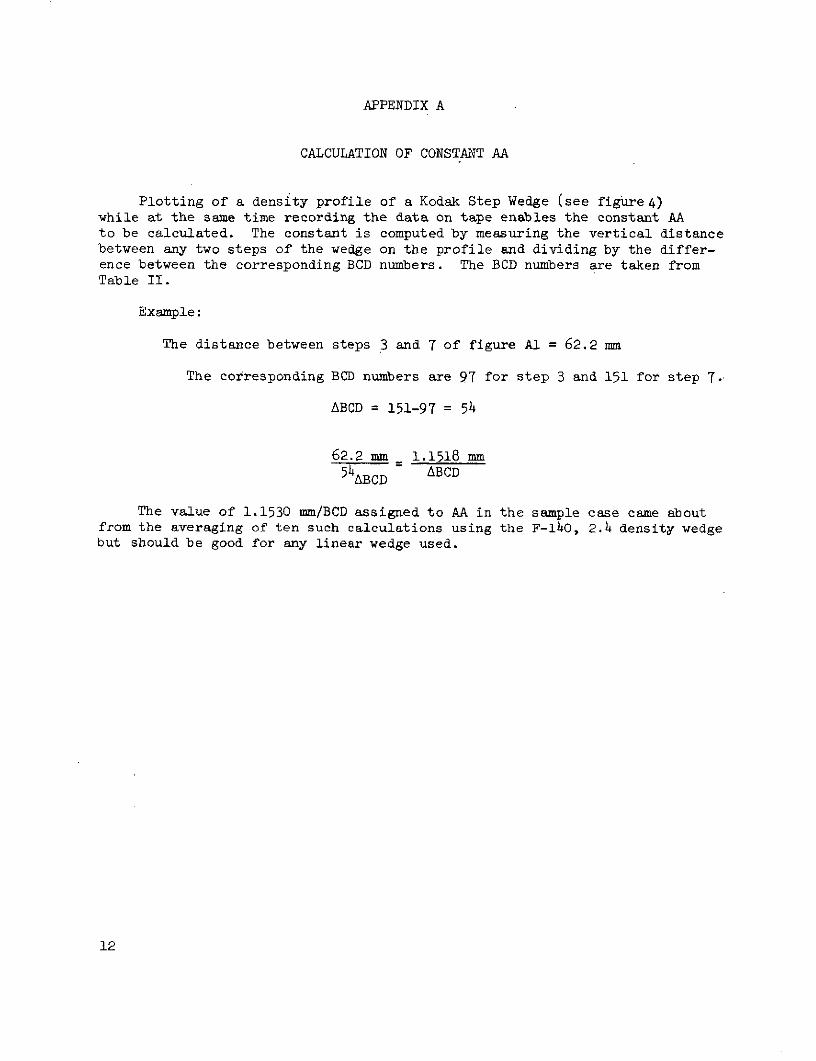
Plotting of a density profile of a Kodak Step Wedge (see figure 4)while at the same time recording the data on tape enables the constant AAto be calculated. The constant is computed by measuring the vertical distancebetween any two steps of the wedge on the profile and dividing by the differ-ence between the corresponding BCD numbers. The BCD numbers are taken fromTable II.
Example:
The distance between steps 3 and 7 of figure Al = 62.2 mm
The corresponding BCD numbers are 97 for step 3 and 151 for step 7.
ABCD = 151-97 = 54
62.2 mm 1.1518 mm54BCD ABCD
The value of 1.1530 mm/BCD assigned to AA in the sample case came aboutfrom the averaging of ten such calculations using the F-140, 2.4 density wedgebut should be good for any linear wedge used.
12
APPENDIX B
ORDER OF DATA INPUT NEEDED FOR PROGRAM CONVERT
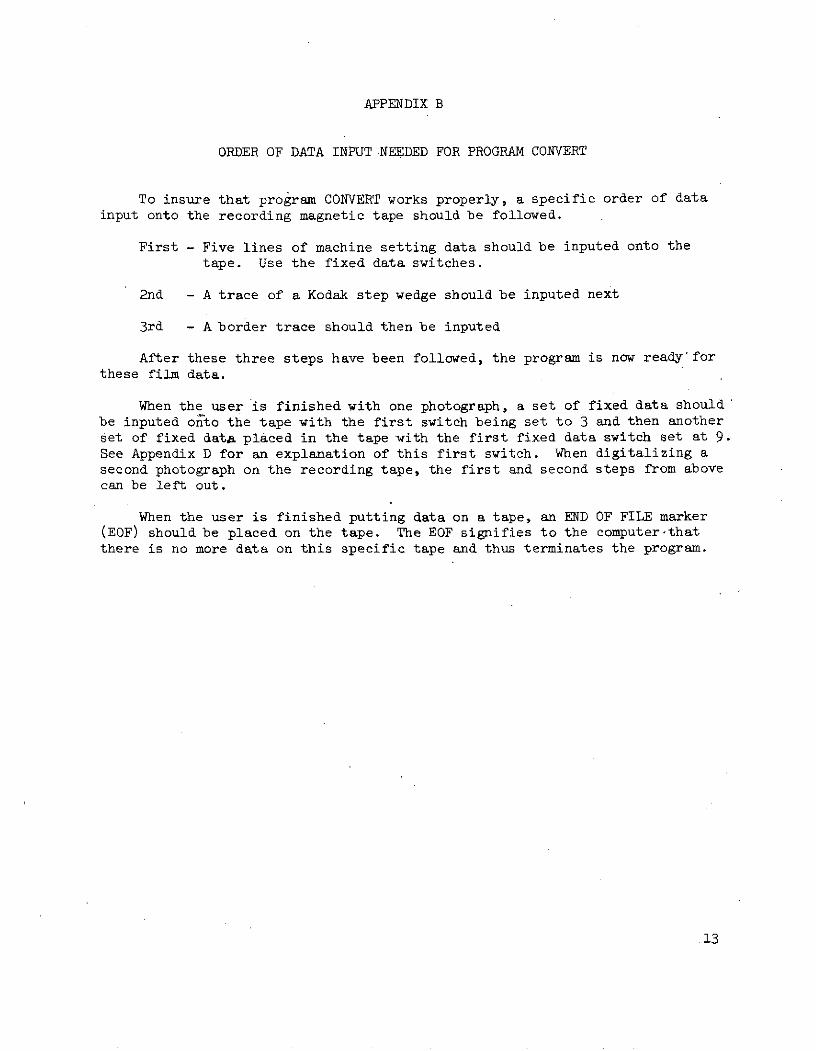
To insure that program CONVERT works properly, a specific order of datainput onto the recording magnetic tape should be followed.
First - Five lines of machine setting data should be inputed onto the
tape. Use the fixed data switches.
2nd - A trace of a Kodak step wedge should be inputed next
3rd - A border trace should then be inputed
After these three steps have been followed, the program is now ready'forthese film data.
When the user is finished with one photograph, a set of fixed data should'be inputed onito the tape with the first switch being set to 3 and then anotherset of fixed data placed in the tape with the first fixed data switch set at 9.See Appendix D for an explanation of this first switch. When digitalizing asecond photograph on the recording tape, the first and second steps from abovecan be left out.
When the user is finished putting data on a tape, an END OF FILE marker(EOF) should be placed on the tape. The EOF signifies to the computer-thatthere is no more data on this specific tape and thus terminates the program.
13
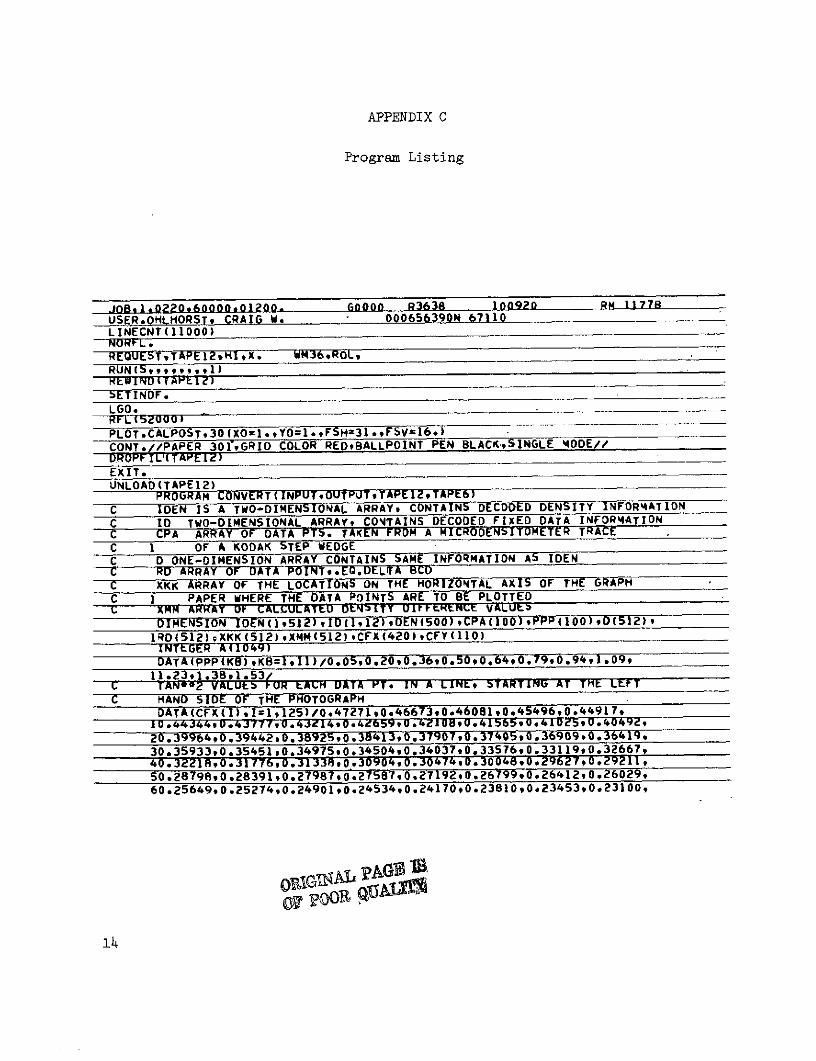
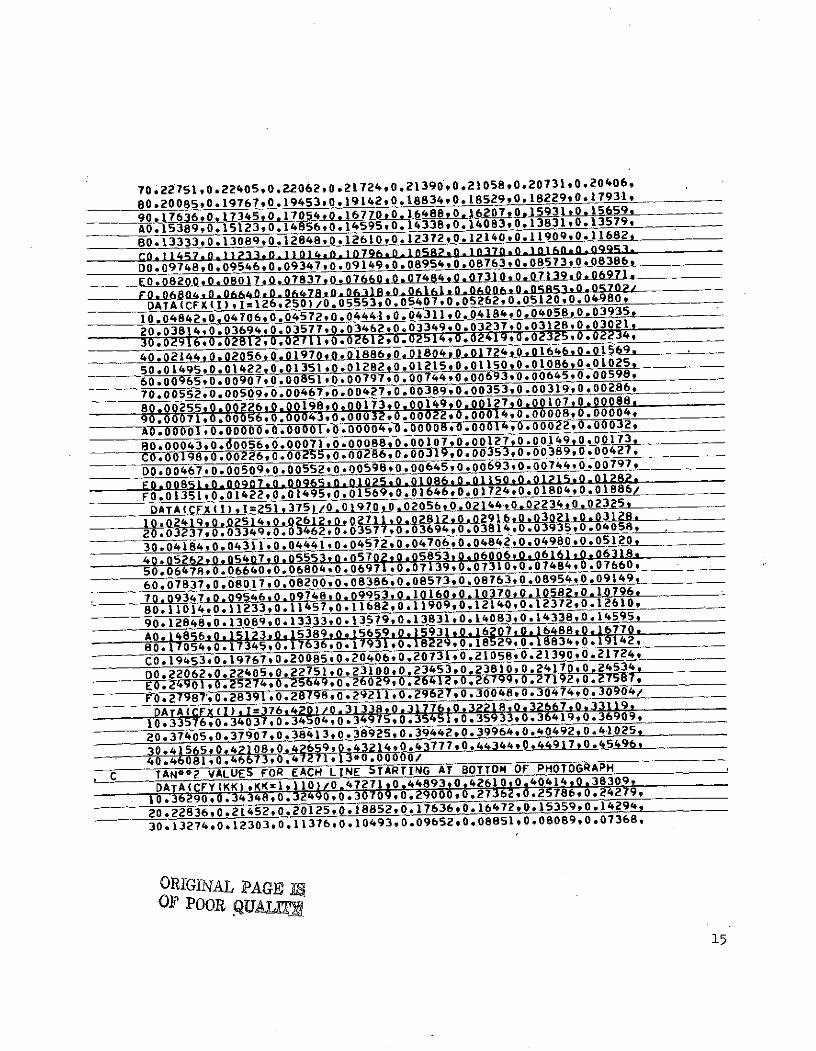
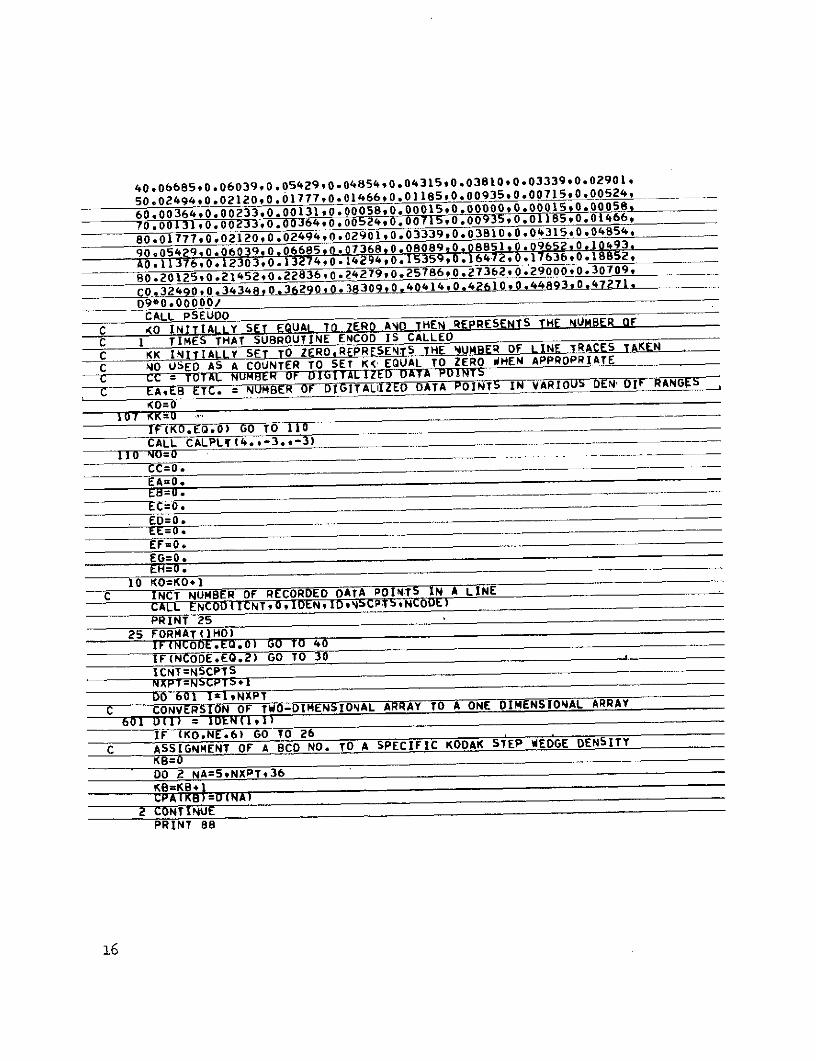
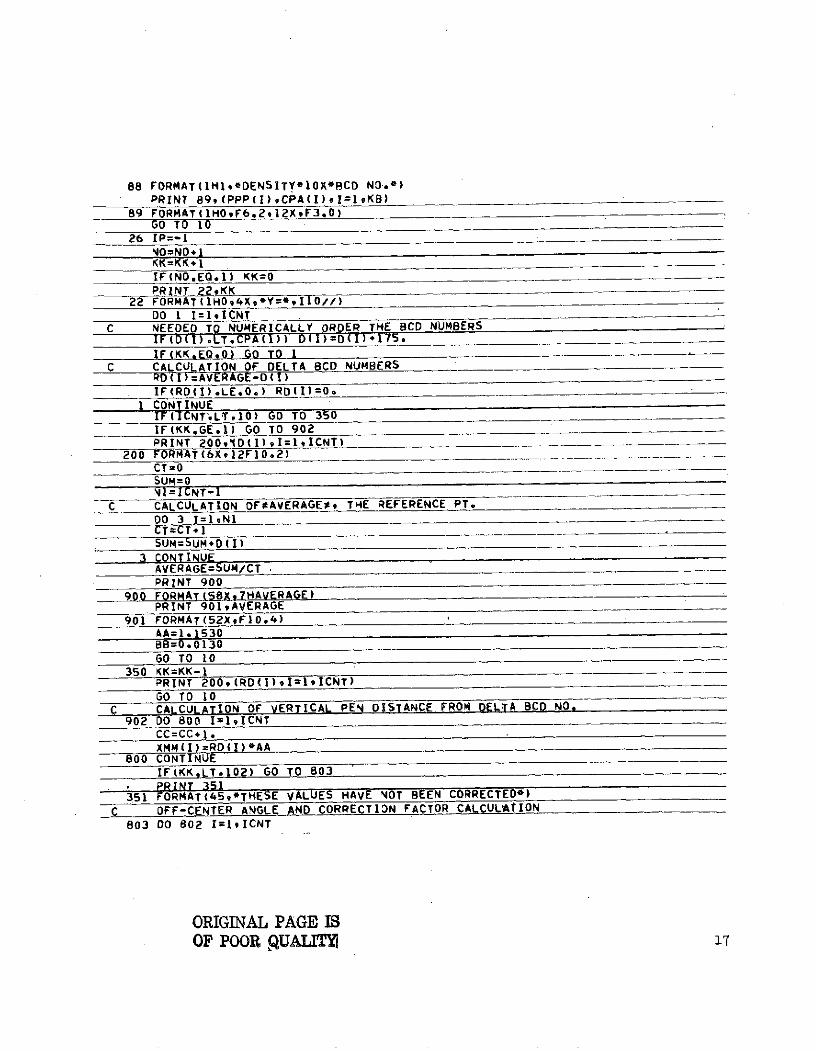
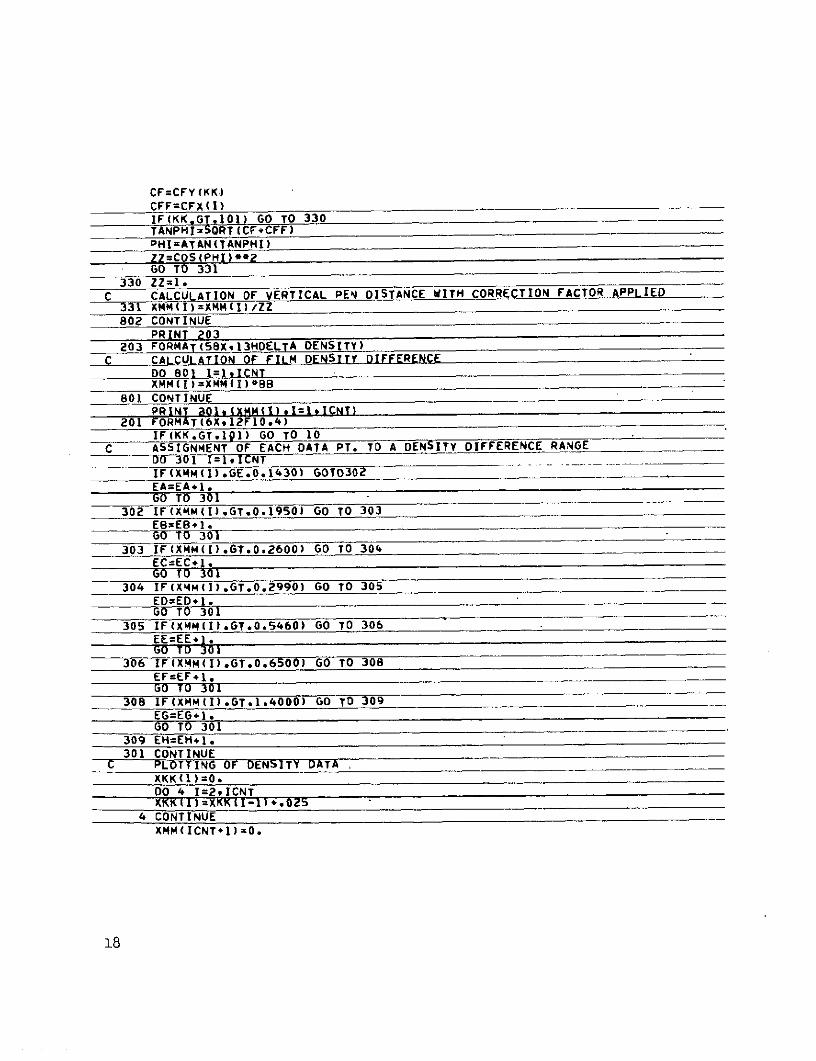
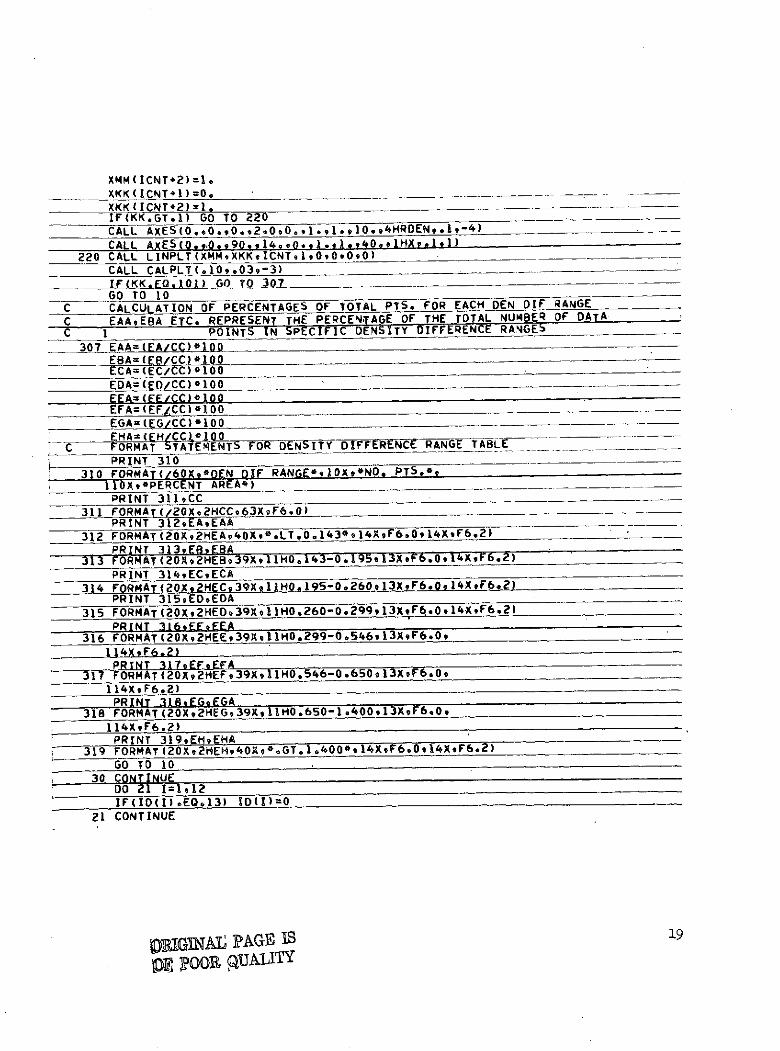
APPENDIX C
Program Listing
JOB.1.0220.60000.01200. GO000n R3638 100920 RM 11778
USER.OHLHORST, CRAIG W. 000656390N 67110LINECNT(11000)NOHFL.REQUESTTAPE12,HI,X. WM36,ROL,RUN(S,,,,,,,1)RLWIN(TAPtle)
5ETINDF.
LGO.RFL(b2000U I
PLOT.CALPOST,30(XO=1*,YO=1-,FSH=31.*FSV=16*)CONT.//PAPER 301,GRID COLOR REDBALLPOINT PEN BLACK,SINGLE 4ODE//DRWPFIL'ITAPE )
EXIT.UNLOAD(TAPE12)
PROGRAM CONVERT(INPUTOUTPUTTAPEI2,TAPE6)C IDEN IS A TWO-DIMENSIONAL ARRAY, CONTAINS DECODED DENSITY INFOR4ATION
C ID TWO-DIMENSIONAL ARRAY, CONTAINS DECODED FIXED DATA INFOR4ATIONC CPA ARRAY OF DATA PT1. TAKEN FROM A MICRODENSITOMETER TRACE
C 1 OF A KODAK STEP WEDGEC D ONE-DIMENSION ARRAY CONTAINS SAME INFORMATION AS IDENC RD ARRAY OF DATA POINT,.EQ.DELfTA BCDC XKK ARRAY OF THE LOCATIONS ON THE HORIZONTAL AXIS OF THE GRAPH
C 1 PAPER WHERE THE DATA POINTS ARE TO BE PLOTTEDL XMM ARHAY UF CALULATtUD DNITY UDIF'ILtNCt VALUt.
DIMENSION IDEN(1I512)0,ID(112),DENI(500)CPA(100)*PPP(100),D(512)9IRD(512) XKK(512) XMM(512) CFX(420),CFY(110)INTtGER A(1049)
DATA(PPP(KB),KB=lIll)/O.05,O.20,0.36,0.50,0.6 49 0 .79 ,0.94 l.09,
11.23,1.38,1.53;c TAN*2 VALULE FUR LATH DATA PT. IN A LINE, STARTING AT THE LEFTC HAND SIDE OF THE PHOTOGRAPH
DATA(CFXK(1)I=1 25))/0.47271,0.466730.46081,0.4 54 9 6,0. 4 4 917.
10.44344,U.4377790.4Jel4O.4659O.421089U.4156590.410O25s.40499
20.39964,0.39442,0.38925,0.38413,0.37907,0.37405O0.36909,0.364 1930.35933,0.35451,0.34975,0.34504,0.34037,0.3357690.3311990.32667,40.32218,O.31776,O.31338,0.30904,0.30474,0.30048,O.29627,O.29211,50.28798,O.28391,0.27987,0.21587,0.27192,0.26799,0.26412,0.26029,60.25649,0.25274,0.24901,0.24534,0.24170,0.23810,0e23453,0.23100,
14
70.22751 ,O.22405,0.22062,O.2172490.21390,0.2105890.20731 ,O.20406,
80.20085,0. 19767,0. 19453,0. 191429,1883490, 1852990. 1822990. 179319
900 17636,0.,173459,.17054.1670168, 0 6090 1593190. 15659.
AD. 15389,0.15123,0. 14856,0. 14595,0.1433890. 140 8390. 1383190.13579,
80. 13333,0. 13089,0, 12848,0. 1261090. 1237290. 12140 90,119099 09 11682g
DO.09748,0.0954690.09347,0.0914990.08954,0.0876390.0857390908386sEO.0820090.08017.0.078379 *076602Q2O7484tO2Q73lO9Oo071.39o00
6 27 1 4
DATA(CFX(I),112bg250)/0.05553,o.0540790#0 26290.0512090*0 49 8 09,
10,0484290.0470690.04572,0.0444-1,0.0431190.0418490.0405890.03935920oO38149090369490.0357790*0346290.0334990.03i?3790*0312890*03041-30.0 -J'*-Z16,0. 02812,0 * 02111,0. 02612,*02514, 0. 241990 .02290
02234,
400*02144,0. 020569, 0 01970,00 1889. 0 180490. 01724.0 .0 64690.0 15699
50.0 1495,0 .0142290 .01351,10'l .011 12 8, i 0 .01215,0 .011509,0.0108690 1,1010259400065*0*009079Co0085jq0*.00I qI gilI 744,o.00Ill 93,.064590*005989
70.00552,0.00509,0.00467,0.0042790.0038990.00353,0.00319,O0028~69
80.00255.0.002?6,0.00198,0,00173,0.00O149,000127,0.0010-Q790.000889-900071,0.U006,0.000439000032,08.00022* .00014900000890*00004,
AO0fllb, F.000.00001,0.0_ I4I0.0000Ill:00149.00229 .0 0 0 2 ,
80.0004390. 005i6,0.0007l,0.0008890.00107,0012790.001 4990 .0017 3 ,
D0.00467,0.00509,0.005S2,0.00598,0.0064590.0069390.0074490O0079 7,
FO.00851.0.00907.O.0096.on.01025001086.001150o.001 P15 .n0 lR
M00135190.9142,00495,0.01569,0.0164b,0.0172490.018 0 4 90 .018 8 6/
DATA (CFX 1) 1=2519375)z /0 01970 90 .02056,02144-90,02234,023251
12o 419!R:0251,.0261290.0~toOi7 1.002812 ,0.02916,90.03021.0.031258.200271030.030 46003 57 ,0394031,0.*03935,0.0408
30.041849,0431190.04441,0.045729,04706,0,0484290.0498090.051209
4 0 02 20.540790,0555390*0570?90.,0539p060069061 19lO.618
50.06478,0.06640,0.06804,0.06971,0.07139,0.07319.78906060.07837,08017.0.08200.08386,0.0857390.0876390,0895490.09149t.702093479 02.095t46,0 . ~ 99,Q53 -- 1 l6 09,1037090. 10582p..107962.80.11014,0.11233f,11457,0. 11682,0.11909,12140, 137290. 126109
90. 12848,0. 13089,0 13333,0. 1357990 1383190 4408390. 1433890. 14595915,9:9 I6D7 .0.16488*,16770.
80.17054,0.1735,. CE 936goeiy18220I182jgp,0.18834,0.19142,
C0.194539091976790.2008590 2040690.2073190.2105890.2 13 9090OZl?2
4 9
DO. 22062, 0. 2205,0. 2275 1,0.23100,0 .23453,0 .2381D0: 2417'09 0.*245349
EO.2401,0.5274,.'504Y 0*2602,02.641290.26799 0 2T19 2 #0 .?
8 7
KF;;2;;-7?,0;D839 I .eU(9k,-O.242--1,-O.2962rvO30048.0.3 O4(49UojUVU4 /
D~rACFXI.3 :6 4 2 ,03 3382, *31 769 093221890*3266790.331190
10.33!576,0.30034 0490.3497590,35451,0.35933,0.36419,0.36909,
20*3745,. 790.3841390.3892590.3944290.3996490.4049290.41025230*4j565#0.4? 08v0*42659:?5t3214,0 4377790.443449094491790.45496L
C TAN**2 VALUES OR EACH LINE SRING AT BOTTOM4 OF PHOTOGRAPH
Aj Y(K) KK=16110)/0.4727190.44 8 9 3 9O 44261090.404t14,38309,-
lIOA 63 2gioO.34348,0.32490,0.o3-99,290000.27Jbe2,0.2578690.24279,20*2283690.2920.201259 18201660.679.559.4294,
30. 13274,0. 123039,11376,0. 10493, 0.*09652,0 * 885190 90808990 *073689
ORIGINAL PAGE M~OF~ POOR QUAL9V'
9T
88 INI~Id
(WN10=184l1d
9t'1idXN'IS=VN Z 00
A1iS0 3903M d3IS )IVO)N1 3.1I3dS V 01 *ON 038 V JO IN3frNgISSV 39e 01 00 (903N).A l
(I11N-u0I = MQ) 109
Avbb~v 1VNOiISN3Wl0 3N0 V 01 AnmV IVNIISN 3NI-00.i ..JO NOIS~d3AN03) 3idXN61=1 109 00
T*SIA~ISNidkSld3sN=IN31
0C 01 00 (2*03*303N)JI0'l? 01 09 (QL! 0OJT~i
S2_ I.N 16
3NI1 V NJ sU'I0~ ViVO 03~0W33di .J0 838WCN 13N1 31.0)1=0> 01
* 0=11
D0oN OTT(~-~4,)hd~V3TIV3
0!! 01 00 (Q*330)4f
SIONVUi jIG N39 c, 0I8VA N! SiNIOd VIVO ONII1ViI9IO JO MSJ8NdAN =01 16 ~V3.'q1NTOe4 WVO9 tl7y1V1IOQ0 16 IlR~fN IV101 = 11
31V18d0bddV N3HA 083Z 01 IVnO3 >')l 135 01 83INfl03 V SW u3sfl ON
14'W 53V 1 1 jib 6138PRIN iili 5 S d3 l 10, 3Z4! 01n 13S ATIV I II NI AN103-1VO SI 003N3 3NIino0enslS IWNIs3wil I
-J"39Wn4N 341 siN3S38d3b N3HI CINV 08A3Z 01. 1VflO'J 13S AilVIIINI 0)'oafl3Sd IIVO/ 00 0 0 0 *0 6
.C6tpOlO2q60pO.ISggpO066§8O81OO8 9toools9906066 90of2+SD0
94seooosoooBEo'SO0O0 o000'10o00'8S 0006''e'000'Ct$OZIOo06LTO~O9
OV~S00e0SL'C00"S9 0 00
is 1 0 'i0 0 i, 10 0 0 0
88 FORMAT(IHI,DENSITYOIOXeBCD NOD**)PRINT 89,(PPP(I)9CPA(I)loI=IKB)
89 FORMAT(IHOF6.212XF3.0)GO TO 10
26 IP=-INO=NO+}KK=KKI1IF(NO.EQ.1) KK=OPRINT 22#KK
22 FORMAT(1HO4e,*Y=*,II0//)00D 1 I=1,ICNT
C NEEDED TO NUMERICALLY ORDER THE BCD NUMBERSIF(D(t).LT.CPA(1)) D(I)=(I) 175*
IF(KK.EQ°O) GO TO 1C CALCULATION OF DELTA BCD NUMBERS
RD( )=AVERAGE-D(I)IF(RD(I).LEO0.) RD(I)=0.
1 CONTINUEIF(ICNT.LT.10) GO TO 350IF(KK.GE.1) GO TO 902PRINT 200,ID(1)l=1ICNT)
200 FORMAT(6X,12F10.2)CT=OSUM=0*4IICNT-l
C CALCULATION OF*AVERAGE$, THE REFERENCE PT,DO 3 I=1,N1CT=CT.ISUM=SUMD(I)
3 CONTINUEAVERAGE=SUM/CTPRINT 900
900 FORMAT(SBX.7HAVERAGE)PRINT 901AVERAGE
901 FORMAT(52XF10.4)AA=1 *1530BB=U 0130GO TO 10
350 KK=KK-1PRINT 2009(RD(I)1=,1ICNT)GO TO 10
C CALCULATION OF VERTICAL PEN DISTANCE FROM DELTA BCD NO,902 DO 800 I=,ICNT
CC=CC+1.XMMI)=RD(I)*AA
800 CONTINUEIF(KKLT102) GO TO 803
PRINT 351351 FORMAT(45,*THESE VALUES HAVE NOT BEEN CORRECTED*)
C OFF-CENTER ANGLE AND CORRECTION FACTOR CALCULATION803 DO 802 I=1lCNT
ORIGINAL PAGE ISOF POOR OUALIYI 17
CF=CFY(KK)CFF=CFX(I)IF(KK.GT.101) GO TO 330TANPHI=SORT(CFCFF)PHI=ATAN(TANPHI)
ZZ=COS(PHI)**2GO TO 331
330 ZZ=l.C CALCULATION OF VERTICAL PEN DISTANCE WITH CORRECTION FACTOR APPLIED
331 XMM(I)=XMM(I)/ZZ802 CONTINUE
PRINT 203203 FORMAT(58Xl3HDELTA DENSITY)
C CALCULATION OF FILM DENSITY DIFFERENCEDO 801 I=)I*CNTXMM(I)=XMM(I)BB8
801 CONTINUEPRINT 301 (XMM(1),I=19ICNT)
201 FORMAT(6X,12FI0.4)IF(KK.GT.191) GO TO 10
C ASSIGNMENT OF EACH DATA PT. TO A DENSITY DIFFERENCE RANGEDO 301 I=1ICNTIF(XMM(I).GE.0.1430) GOT0302
EA=EA*+1GO TO 301
302 IF(XMM(I).GT.0.1950) GO TO 303
EB=EB*1.GO TO 301
303 IF(XMM(I).GT.O.2600) GO TO 304EC=EC+1.GO TO 301
304 IF(XMm(I).GT.0.2990) GO TO 305
ED=ED1.GO TO 301
305 IF(XMM(I).GT.0.5460) GO TO 306
EE=EE+1.GO TO 301
306 IF(XMM(I).GT.0.6500) GO TO 308
EF=EF+1.GO TO 301
308 IF(XMM(I).GT.1.4000) GO TO 309
EG=EG*1.GO TO 301
309 EH=EH.I.301 CONTINUE
C PLOTTING OF DENSITY DATA ,
XKK(1)=O.DO 4 I=2,ICNTXKK(I)=XKKiI-1)*.025
4 CONTINUE
XMM(ICNT*1)=0.
18
XMM(ICNT*2)=1.XKK(ICNT*I)=O.XKK(ICNT*2)=IIF(KK.GT.1) GO TO 220CALL AXES(0.O.O,0.,o0,0 ,.,I IO.,4HRDEN,.1-4)CALL AXES(0t.9O90.* l4.O-.i.l.9,40.IHXP.1L)l
220 CALL LINPLT(XMM*XKKlICNT,199,0090O)CALL CALPLT(°10.039-3)
IF(KK.EQ*IOI) GO TO 307GO TO 10
C CALCULATION OF PERCENTAGES OF TOTAL PTS. FOR EACH DEN DIF RANGE
C EAAvEBA ETC. REPRESENT THE PERCENTAGE OF THE TOTAL NUMBER OF DATAC I POINTS IN SPECIFIC DENSITY DIFFERENCE RANGES
307 EAA=(EA/CC)o100EBA=(ES/CC)*100ECA=(EC/CC)*100EDA=(ED/CC)*100EEA=(EE/CC)l100EFA=(EF/CC)*100EGA=(EG/CC)*100EHA=(EHCCc 100
C FORMAT 5TA EMENT FOR DENSITY DIFFRENCE RANGE TABLEPRINT 310
310 FORMAT(/60XO*DEN DIF RANGE,1OX*NO. PTSN.11OX90PERCENT AREA*)PRINT 311CC
311 FORMAT(/20X.2HCC963XF6.0)PRINT 312.EAEAA
312 FORMAT(20X,2HEAO40Xe.LT.0.143* 14XF6.0914X F6 .2 )PRINT 3139EBEBA
313 FORMAT(20X2HEB939X11HO.143-0.19513oF6.0,1l4 X9F 6 .2 )
PRINT 314,ECoECA314 FORMAT(20X,2HEC,39X9lHO,1950.260913X9F
6 0914X F6*2)PRINT 3159EDoEDA
315 FORMAT(2XHED39XalIHO.60-0.299913X9F6O 4x,9F 6 .2 )
316 FORMAT(20X92HEE139X1MHO.299-0.546913 X9F6.0O
114X9F6.2)PRINT 317.REFA -
317 FORMAT(20X 92HEFe39X,1HO.546-0.6 50S9 3 X9F 6.oO
114XF6.2)PRINT 3189EG.EGA
318 FORMAT(20Xt2HEG39XllHO.6SO-o1.400l3X9F6 .0,
__ 114XF6.2)PRINT 3199EHEHA
319 FORMAT(20X,2HEH,40XtoGT.1o400*914XF6.0 14XF6.2 )
GO TO 10
DO 21 1=1,12
IF(ID(I),EQ.13) IO(I)=
21 CONTINUE
RIGINA PAGE I 19
POOR QJAL
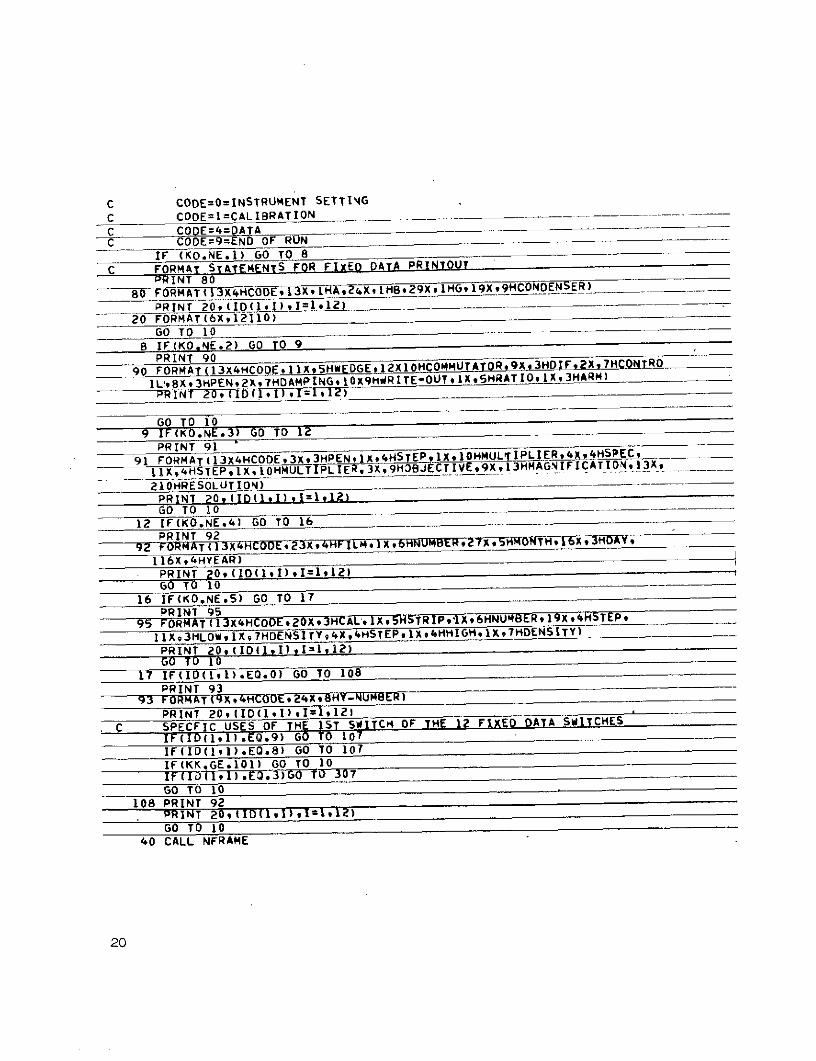
C CODE=O=INSTRUMENT SETTING
C CODE=1=CALIBRATION
C CODE DATAC CODE=9=END OF RUN
IF (KO.NE.1) GO TO 8
C FORMAT STATEMENS FOR FI E ATA PRINTOUTPRINT 80
80 FORMAT(3X 4HCODE,13X,1HA,2 4X1BIH ,2P 9xlHGv19X9N ER)
PRINT 20,(ID(1,,1)Il,12)__20 FORMAT(bX,12110)
GO TO 10
8 IF(KO.NE.2) GO TO 9PRINT 90
90 FORMAT( 3X 4HCOOE,IX5HWEDGEt12XIOHCOMMUTATOR,9X3HDIF2XtTHCONTRO
1L!8BX 3 HPEN 2 KX,7HDAMPINGI109XHRITE-OUTlXSHRATIOX93HARM)
PRINT 20 ((1,1 )1 .1,IZ)
GO TO 109 IF(KO.NE.3) GO TO 12
PRINT 91
91 FORMA ( 3 X4 HCOOE, 3X93HPEN91Xg4HSTEP9IXlOHMULTIPLIER,94X4HSPEC -
210HRESOLUT ION) __-_----
PRINT 20,(l(tI),l=1,_2)GO TO 10
12 IF(KO.NE.4) GO TO 16
PRINT 9292 FORMAT(13X4HCOE,23XKW4HFILM,1X,6HNUMER,27XSHuNT--'
6 xI 3HDAY
116X,4HYEAR)PRINT 20,(I(11))1=1l12)GO TO 10
16 IF(KO.NE.5) GO TO 17
PRINT 9595 FORMAT(KI3 ';4HCODEo2101 HY1L , tSTRI3kLIINBER I9 '511TEP9
llX,3HLOWIX,7HDENSITY,4X94HSTEPo1X4HHIGH.XltHDENSITY)
PRINT 20 (ID(l,)tl =l1l2)GO TO 10
17 IF(IO(1,1).EQ.0) GO TO 108
PRINT 9393 FORMAT(9XXKHCODE,2BHYV-NU.IBER)
PRINT 20,(ID(191),I1=112)
C SPECFIC USES OF THE IST SWITC4 OF THE 12 FIXED DATA SWITCHES
IF(ID(I,1).EQ.9) GO TO 107
IF(IO(II).EQ.8) GO TO 107
IF(KKGE.101) GO TO 10
GO TO 10108 PRINT 92
PRINT 20,I(1,I),1=1,12)GO TO 10
40 CALL NFRAME
20
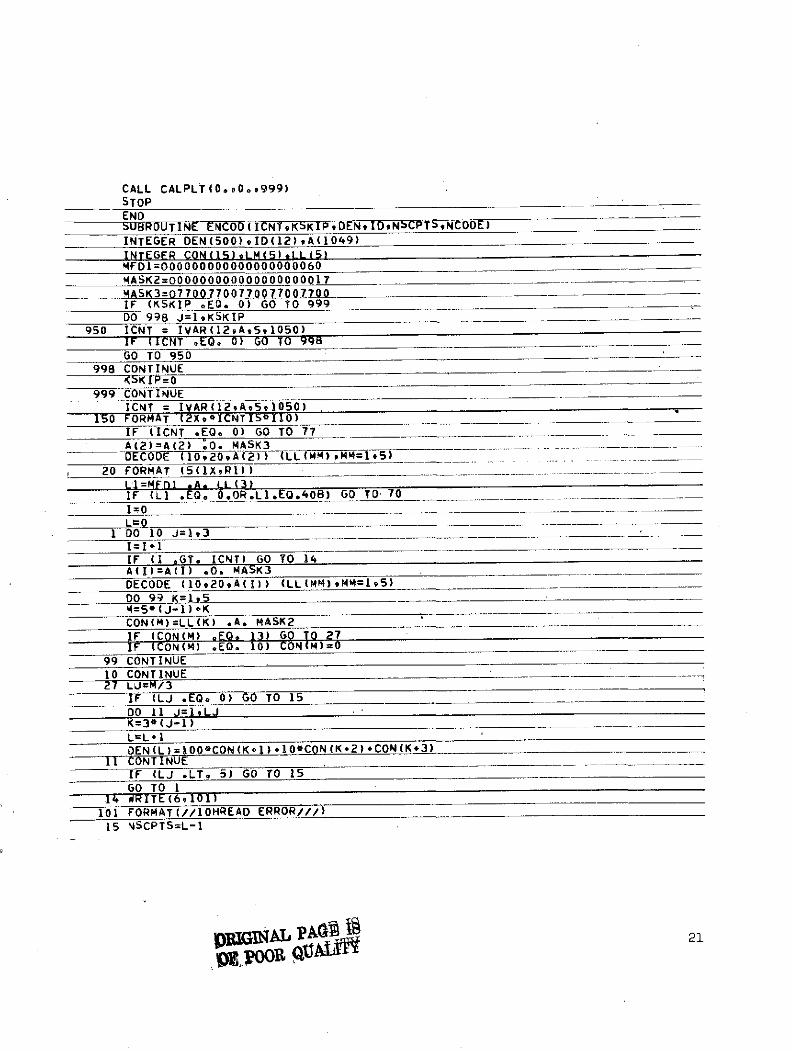
CALL CALPLT(0QO.,999)STOPENDSUBROUTINE ENCOD(ICNTKSKIPDENgIDtNbCPTS.NCODE)INTEGER DEN(500)9ID(12),A(1049)INTEGER CON(15)9LM(5),LL(5)MFD1=000000000000000000604ASK2=0000000000000000017MASK3=077007700770077007700 - -- - ---- --IF (KSKIP oEOo 0) GO TO 999DO 998 J=1lKSKIP
950 ICNT = IVAR(12,A591050)IF (ICNT .EQ. 0) GO TO 998GO TO 950
998 CONTINUEKSKIP=0
999 CONTINUEICNT = IVAR(12Av95 0 050)
150 FORMAT (2X9eICNTISI10)IF (ICNT .EQ. 0) GO TO 77A((2)=A2) 0O. MASK3DECODE (109209A(2)) (LL(MM)NM=1I5)
20 FORMAT (5(1XgRl))L1=MFDLI *Ao LL(3)IF (L1 .EOo 0.OR.L1.EQ.40B) GO TO 70
1=0Lo __ __ __ _____ ___ _______
L=O1 DO 10 J=193
I=I*1lIF (1 .GT. ICNT) GO TO 14A(I)=(I) .0. MASK3DECODE (1020A(I)) (LL(MM)9M4=1o5)DO 99 K=l54=5o(J-l)*KCON(M)=LL(K) *A. MASK2IF (CON(M) :EQ. 13) GO TO 27IF CON(M) .EQ 10) CO (M)=0
99 CONTINUE10 CONTINUE27 L=M/3
IF (LJ .EQ. O) GO TO 15 __
DO 11 J=19LJK=3*(J-1)L=L*1DEN(L) =100CON(Kol) 10*CON(K+2) CON(K*3)
i CONTINUEIF (LJ .LT. 5) GO TO 15GO TO 1
14 WRITE(69101)101 FORMAT(//1OHREAD ERROR///)15 NSCPTS=L-1
PgINpO a 21oou qMp1l
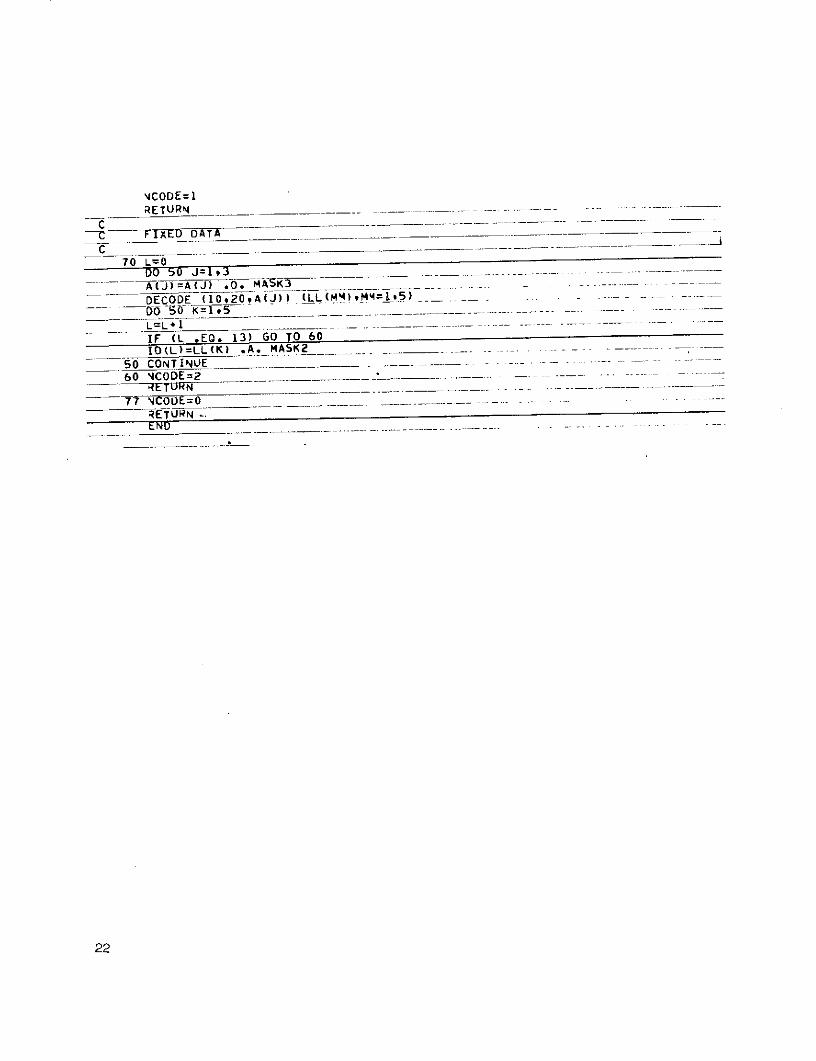
4CODE=1RETURN
- -----
C --
70 L 0DO 50 J=13A(J)=A(J) .0. MAK3i ..
DECODE (10,209A(J)) (LL (M4)tM4=15) -
IF (L .EO. 13) GO TO 60IO(L)=LL(K) .A. MASK2
5 0 C O N T I N U E .... .. . .. . . . .. .
60 CODE=2
RETURN
22
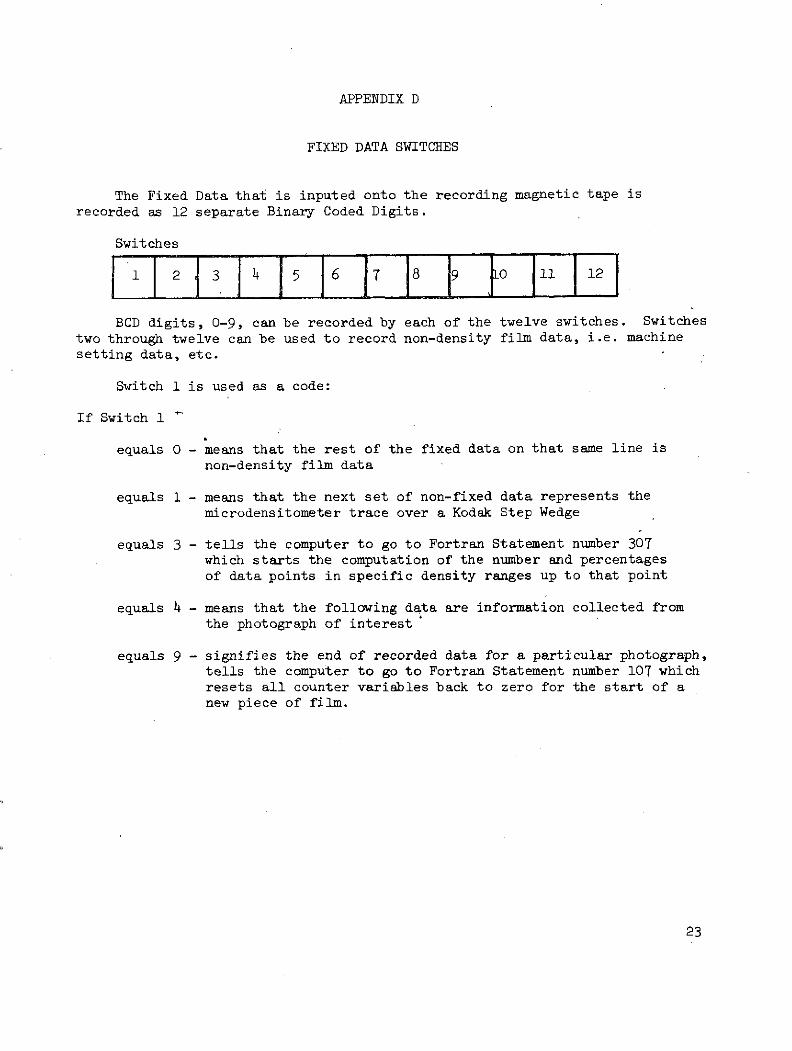
APPENDIX D
FIXED DATA SWITCHES
The Fixed Data that is inputed onto the recording magnetic tape is
recorded as 12 separate Binary Coded Digits.
Switches
1 2 3 4 5 6 7 8 9 LO 11 12
BCD digits, 0-9, can be recorded by each of the twelve switches. Switches
two through twelve can be used to record non-density film data, i.e. machine
setting data, etc.
Switch 1 is used as a code:
If Switch 1
equals 0 - means that the rest of the fixed data on that same line isnon-density film data
equals 1 - means that the next set of non-fixed data represents themicrodensitometer trace over a Kodak Step Wedge
equals 3 - tells the computer to go to Fortran Statement number 307which starts the computation of the number and percentagesof data points in specific density ranges up to that point
equals 4 - means that the following data are information collected fromthe photograph of interest
equals 9 - signifies the end of recorded data for a particular photograph,tells the computer to go to Fortran Statement number 107 whichresets all counter variables back to zero for the start of anew piece of film.
23
REFERENCES
1. Bressette, W. E.; and Lear, D. E., Jr.: The Use of Near-Infrared
Reflected Sunlight for Biodegradable Pollution Monitoring, Presented at
the Second Conference on Environmental Quality Sensors, National
Environmental Research Center, Las Vegas, Nevada, October 10-11, 1973.
2. Instruction Manual For Automatic Recording Microdensitometer Model MK IIIC.,Joyce, Loebl and Co. Limited , August 1963.
3. Grolier, Maurice; and Woolbridge, James J.: Specification and
Acceptability Tests of the Joyce-Loebl Isodensitracer, Model MK III CS,
Series 571, Density Range: 5.6. April 1966.
24
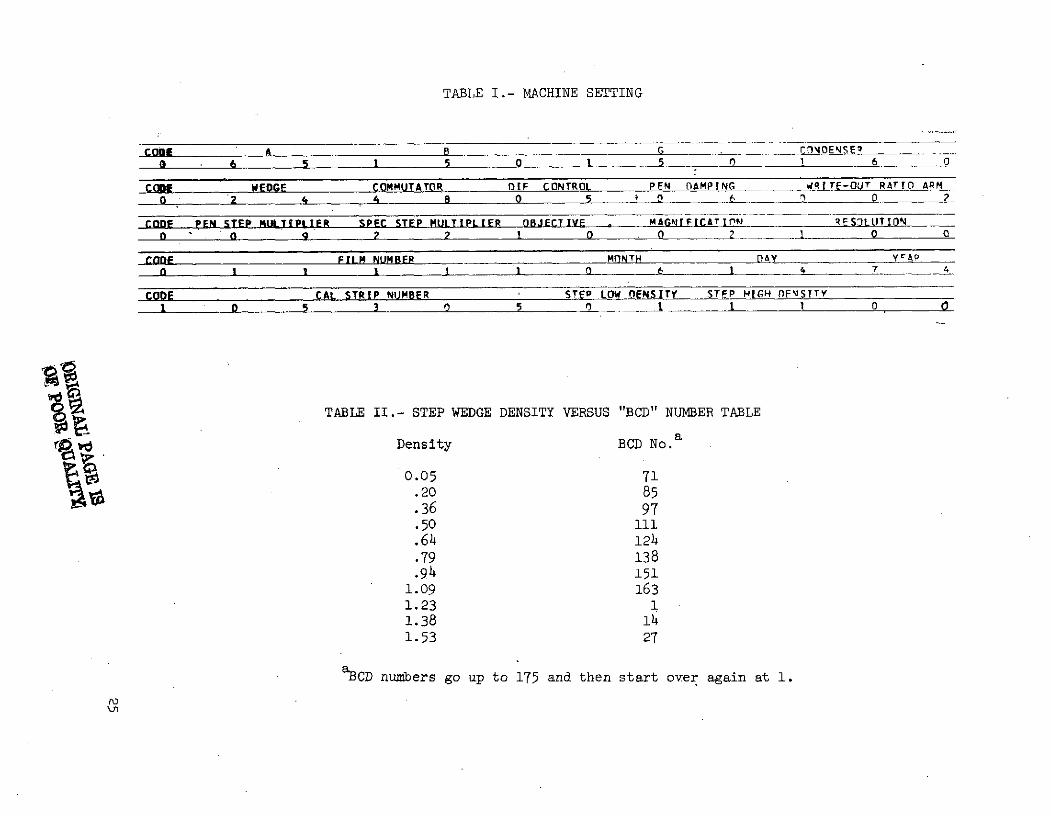
TABLE I.- MACHINE SETTING
CODE A B G ~f VOENSEQ0 6 5 1 5 0 1 5 0 6 0
CODE WEDGE COMMUTATOR DIF CONTROL PEN DAMPING WRITE-OUT RATIO ARM
0 2 4 4 8 0 5 0 6 0 2
CODE PEN STEP MULTIPLIER SPEC STEP MULTIPLIER OBJECTIVE . MAGNIFICATION RES3LUTION0 o 9 2 1 0 1 0
CODE FILM NUMBER _NT DpaY YCAp0 1 1 1 1 1 6 4 7 4
CODE CAL STRIP NUMBER STEP tOW OnNSITY STFP HIGH nFSITY
1 0 5 3 5 o 1 1 1 0
TABLE II.- STEP WEDGE DENSITY VERSUS "BCD" NUMBER TABLE
aDensity BCD No.
0.05 71.20 85.36 97.50 111.64 124.79 138.94 151
1.09 1631.23 11.38 141.53 27
aBCD numbers go up to 175 and then start over again at 1.
'Ji
ro TABLE III.- BORDER TRACE IN BCD FORMAT AND AVERAGE
0O
I 00t 11 1A 7lf18 1.00 8800
1ao00 9l0ann 1800n 1801.00 I 18o 18.00 1900 18.00 18
189.00 108.00 107.00 191.00 189.00 192.00 18.00 189.00 198.00 189.00 189.00 188.00
ig?.-no 20 1 92B.0 19.00 t.02 13.00n 192.00 190 00 190 199.00 19.00 1;2.00
102an lg2 no 102-no 1p 11 191.n0 10go 10.n 190.00 190.00 191.00 191.00
i .nn 190a.n infl.nn igt.on 189. 189. 0 18 00 18.00 18.0 189.00 189.00 .,..0
189.00 189.00 188.00 188.00 800 188.00 187,00 189.00 197.00 18. 00 184.00 188.007.. I_ 7- 7 197o00 1970 n00 . o.00 188.0.00 1800 188.00 188.00
1.00 1.00 1.00 1.00 18.00 8 88.00 18800 188.00 188.00 18A.00 18.001800 800 189.00 18.00 189 00 1800 18 1.00 .o 18.00 187.00
187.00 1870 1 0 117-0 i7.00 1*7.n 1.0 l A8..~.-70 7 .0, 187-.o
, ,187.0 1 n. 0 1
0 0 -
8.00 188.008" 0 188.00 8 0
1I1PJ[L~a~u~L~Ln~U~-IYY"AYFRAGF~'
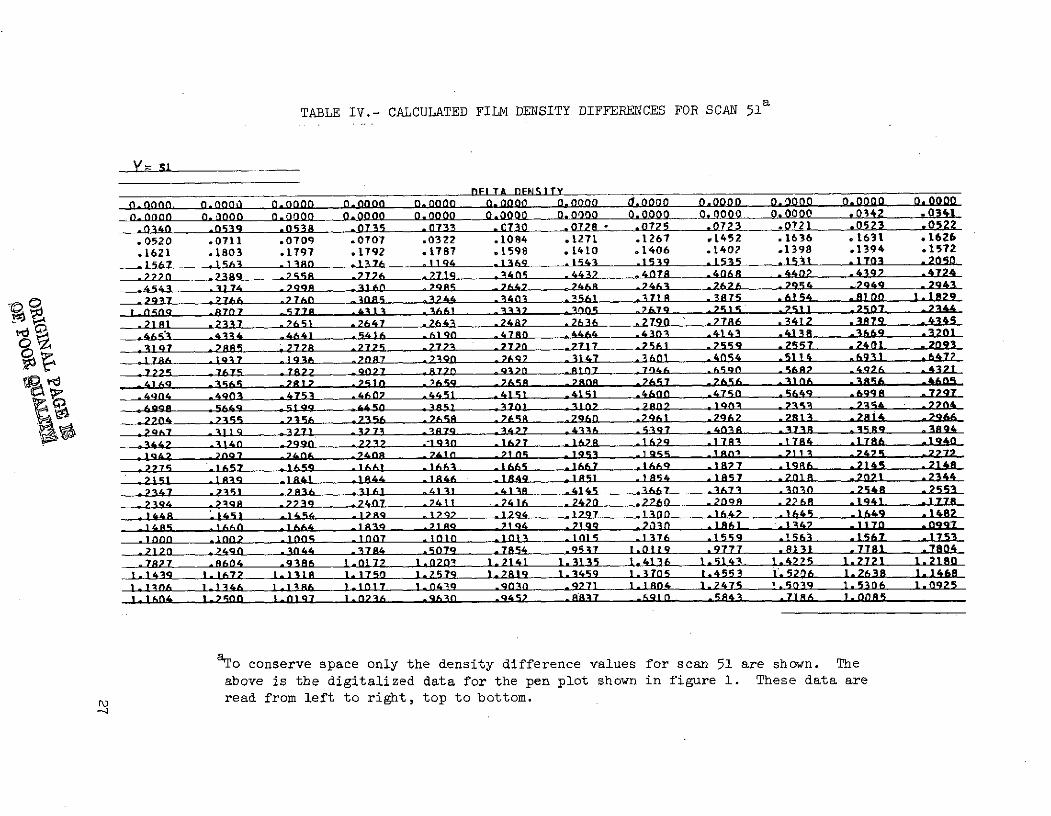
TABLE IV.- CALCULATED FILM DENSITY DIFFERENCES FOR SCAN 51"
Y= 51
nFITA OFNSITYn.nnn, n.nno) 0.0000 0.00 0. 0.0000 00000 0.0000 0.000 0.0000 0.00000. o000 0.0000 00.0000 0.0000 0.0000 0.000000 0.0000 0.0000 0.0000 .0342 .0341
.0140 .0539 .0538 .0735 .0733 .C730 .0728 .0725 .0723 .0721 .0523 .0522
.0520 .0711 .0709 .0707 .0322 .1084 .1271 .1267 .1452 .1636 .1631 .1626
.1621 .1803 .1797 .1792 .1787 .1598 .1410 .1406 .1402 .1398 .1394 .1572
.1567 .1I63 .13A8 .1376 .1194 .1369 .1543 .1539 .1535 .1531 .1703 .2050
.7770 .7389 .7f558 .7776 .7719 .1405 .4437 .4078 .40AR .4402 .4392 .4724
.4541 .3174 ,2998 .316A .7985 .647 4AR .746 .6?A7A .7954 .,2949 .27943
.2937 .7716 .77n .An08 .376 3403 .561 .3718 .3875 .6154 .8100 1.1829
I0509 _8707 .95778 .4111 .1661 .3337 .Ans .679 .72515 .A7511 .77 24
.21RI .2331 .7651 .2647 .2643 .2487 .636 .2790 .27786 .3412 .379 .4345
.4653 .4334 .4641 .5416 .6190 .4780 .4464 .4303 .4143 .4138 .3669 .3201
-3197 .7885 27712 . 775 .777A ,7720 .7717 .7561 .7559 .25157 .2401 .209
.1TRA .197 .136 .087 .390n .7697 .3147 .i601 .4054 .5114 .6931 .6477
7775 .7175 .7-8A7 .077 0 720 9370 .R07 .7046 .6590 568A? .496A .4371
V. 4169 . 4 67&817 C% P1 .72;159 .75A .70RR .7A657 .7656 .IA .A3856A .4AS
.4q04 .49n0 .4753 .46A0 .4451 .4151 .4151 .4600 .4750 .5649 .6998 .7297
699 -5649 .519 .445d .6 -3.30 -, R3107 7An 193 .733 .2354 .21
_2204 .7355 -7356 71356 .7658 .2658 .7960 .7961 .2962 .2813 .2814 .2966
.7967 3119 .3171 .377 .3879 .3477 .436 .53197 .4038 .373R .3589 .3894
,447 -14n -79qn .-7,4 .-1130 .1627 .1678 .1679 .178 .178.1 71786 .1940
-]Q& n7 .2406 -2408 _741n .1 9i 911935 180' 7111 _74IK -77.2775 "16A7 lArq .AAI .1hA .1 .16A67 .1&q69 .1877 .19R6 .2145 .2148
151 JlARq .1A41 .1844 .1AR4 .1R4Q .181 .1854 .1857 .1018 .2071 .2344
.2194 .729q8 .279 .7407 .2411 ._741 .7420 .2760 .209A .2?R .1941 .1778
.1448 .141 .1454 .12W .12<7 -1794 .1297 .100 .1642 .1645 .1649 .1482
-16A5 IAn -IAIL .tA3A .21AQ _71Q4 .2199 .20n0 .1-61 .1 4I 1170 .997
.1000 .1n02 .nn5 .107 .Inin .1013 .- 105 .1376 .1559 .1563 .1567 .1753
.2120 .249A .3044 .784 .5079 .7854 .95347 1.0119 .9777 .8131 .7781 .7804
.7827 .8604 .9386 1.0172 1.020A 1.2141 1.3135 1.4136 1.5143. 1.4725 1.2721 1.2180
1.1439 1.1672 1.1318 1.1750 1.2579 1.7819 1.3459 1.3705 1.4553 1.5206 1.2638 1.1468
13110A 1.134A 1.1RAA 1.1017 1.0439 .9030 .9271 1.1804 1.2475 1.5039 1.5306 1.0925
1.104 70f 1.019ni7 1.AA0736 .9A .9457 8837 -6910 .5843 .71R6 1.0085
aTo conserve space only the density difference values for scan 51 are shown. The
above is the digitalized data for the pen plot shown in figure 1. These data are
read from left to right, top to bottom.
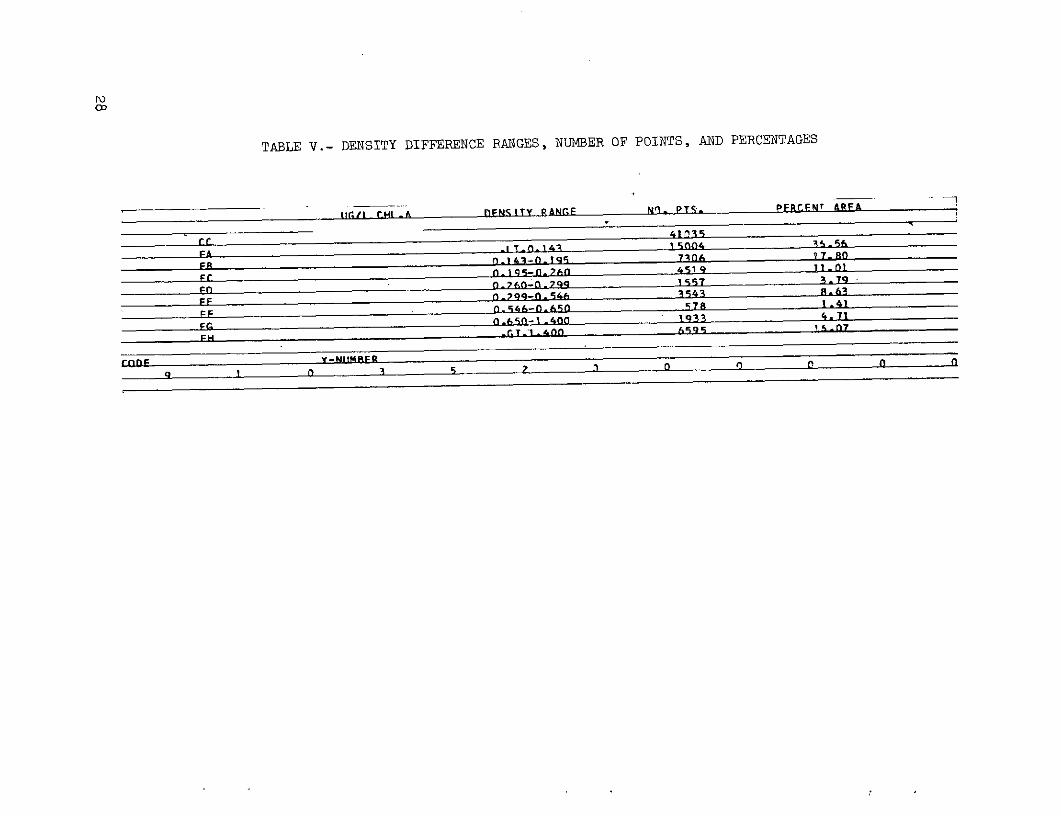
TABLE V.- DENSITY DIFFERENCE RANGES, NUMBER OF POINTS, AND PERCENTAGES
t/D Ct . FNSITY PANGF Nl. PTS. PFRFNT APFA
FR 41
0pT.f4144 1 900
F0.54-0.A50 'A 1.41
FC 0 140 ___19n 3 4.71_
_ _5 T.3 4 0
Center trace--- ..
Starting pointBorder trace
Center traceSline 51
Pen verticaldistance
Border trace
Fig. 1. - Sample photograph and Den plotsof line 51 and bottom border
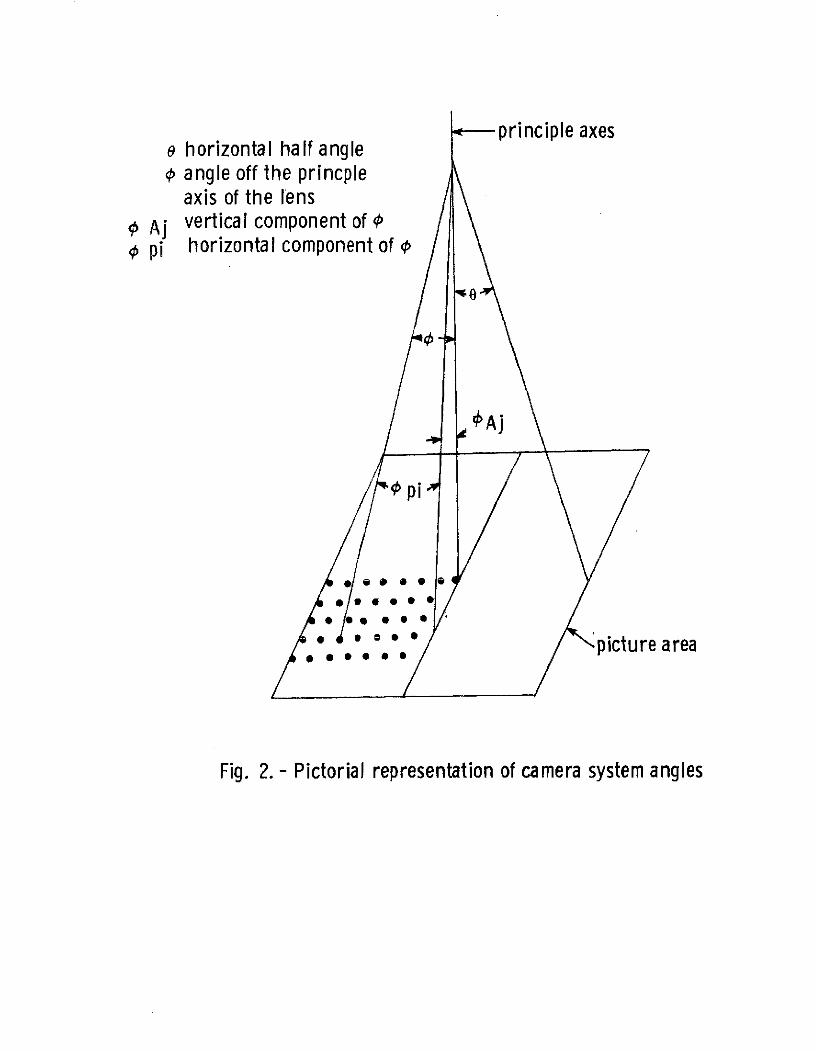
principle axese horizontal half angle
angle off the princpleaxis of the lens
, Aj vertical component of 4
0 pi horizontal component of o
'Aj
Spi
picture area
Fig. 2. - Pictorial representation of camera system angles
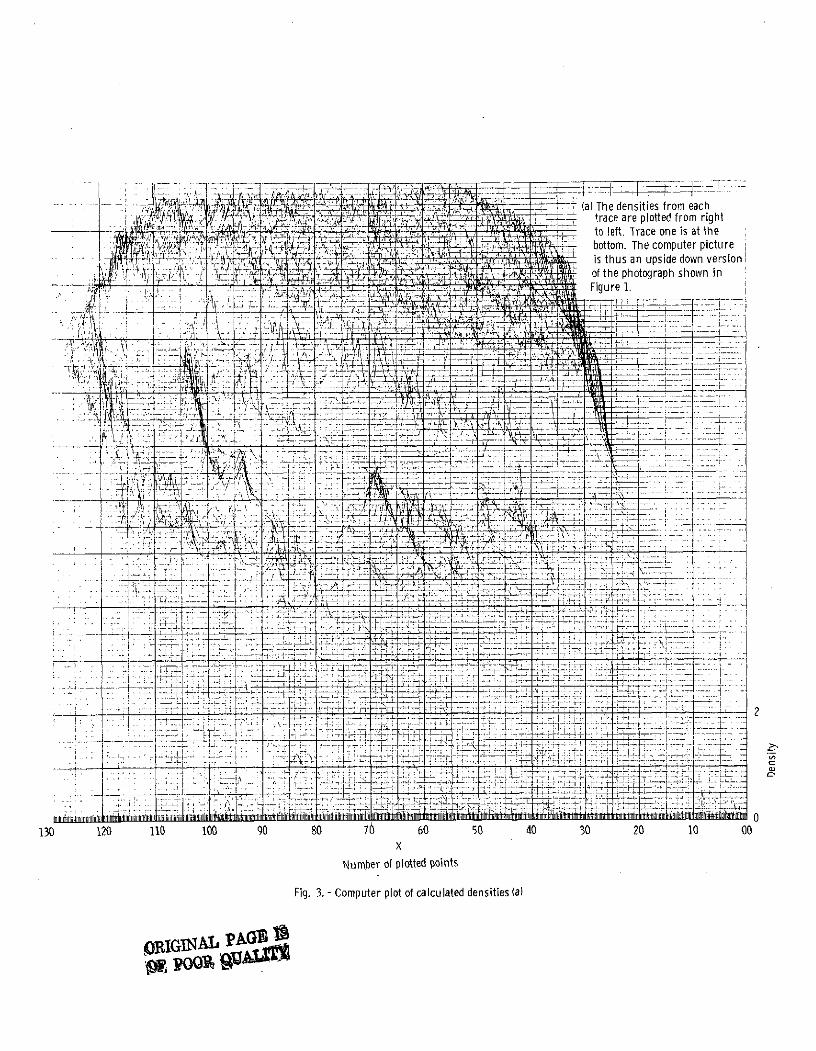
t - (a) The densities from each:i• -4Y trace are plotted from right: rto left. Trace one is at the
. t: . bottom. The computer picture
. . _- is thus an upside down versionS ,--of the photograph shown in
--- T- V r Figure 1.
r T. t.ii,'+L .. ... ....
-i.i. "::L
- lx --
': :._:z - J -L :. " i
• i l i+............i- !: .
__ :L[t
Fig 3.T . - Com ute plot of -cac lae eniie a
4:-7(
-- - I_ _ T Z L;_ -i -1
Number of potted poi nt
Fig. 3 -Com uter lot o calcuated ensites (a
. -~1GS ItORIGVAL P, PW.% -~
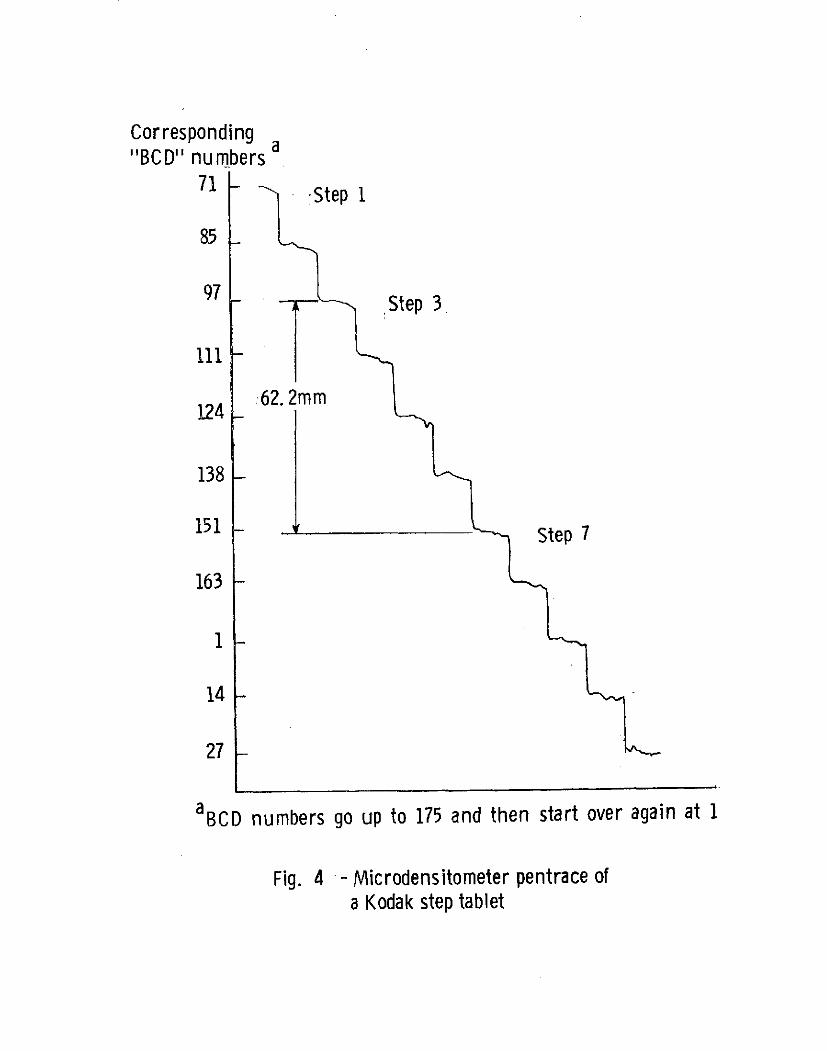
Corresponding"BC D" numbers
Step 1
85
Step 3
124 62. 2mm
138
151 - Step 7
163
14
27
aBCD numbers go up to 175 and then start over again at 1
Fig. 4 - Microdensitometer pentrace ofa Kodak step tablet
Related Documents