NASA Human Error Analysis September 17, 2010 National Aeronautics and Space Administration NASA Human Error Analysis Authors Principal Investigators: Faith Chandler – NASA, I. Addison Heard – ARES Corporation, Mary Presley – ARES Corporation; Other Authors: Alexander Burg – ARES Corporation, Ed Midden – ARES Corporation, Phil Mongan – ARES Corporation Abstract For aerospace operations, NASA risk analysts have very little actual‐relevant human error data to integrate into their risk assessments and corresponding calculations. Consequently, NASA relies on Human Reliability Analysis (HRA) methods that use expert opinion from other industries, data and analysis to determine human error probabilities. To provide accurate and relevant data for NASA risk assessment, this project focused on identifying previously recorded NASA human error data, evaluating that data, and calculating human error rates for manual and cognitive tasks. Once compiled and analyzed, the error rates would be available for use in NASA risk assessments and design trade studies. These data would serve as bases or anchors to help analysts decide how much to modify generic human error probabilities for tasks that lack data collected from real human errors. Additionally, the data provided NASA a mechanism to assess existing HRA methods to ascertain which method(s) provide human error probabilities that most closely resemble data‐based error rates. This informal validation provides an indication of those HRA methods that are most suitable for given activities and contexts when actual human error data is not available. During the project, we identified eight data sets and after initial screening, determined that three data sets would produce the most valuable information. The study focused on these three data sets: (1) the Kennedy Space Center (KSC) Shuttle Switch Throw Database (manual tasks), (2) the Johnson Space Center (JSC) International Space Station (ISS) Command Error Database (CED) (cognitive tasks), and (3) the Jet Propulsion Laboratory (JPL) Mars Exploration Rover (MER) CED (cognitive and analytical tasks). For each data set, we identified the number of actions and errors, and calculated the human error rate. The corresponding point value human error rates were 1.90x10‐3 for the switch throw data; 5.30x10‐4 for the ISS’s command error data; and 1.05x10‐4 for MER command error data. We also compared these error rates with human error probabilities (HEPs) generated by three HRA methods: (1) Technique for Human Error Rate Prediction (THERP), (2) Cognitive Reliability and Error Analysis Method (CREAM), and (3) Nuclear Action Reliability Assessment (NARA) to determine which method would produce a quantitative estimate that most closely represents the actual data. We found that when uncertainties were roughly estimated for the methods, all three methods produced HEPs that were comparable (qualitatively and quantitatively) to the human error rate for manual tasks recorded in the switch throw data set. CREAM and NARA provided the closer approximation of HEPs for the cognitive tasks in the ISS’s Command error data set, with CREAM providing the closest approximation. Of the three methods evaluated, none of the methods had human error categories that corresponded to the data‐based error categories and performance shaping

Welcome message from author
This document is posted to help you gain knowledge. Please leave a comment to let me know what you think about it! Share it to your friends and learn new things together.
Transcript
NASA Human Error Analysis September 17, 2010
National Aeronautics and Space Administration
NASA Human Error Analysis
Authors Principal Investigators: Faith Chandler – NASA, I. Addison Heard – ARES Corporation, Mary Presley – ARES Corporation; Other Authors: Alexander Burg – ARES Corporation, Ed Midden – ARES Corporation, Phil Mongan – ARES Corporation
Abstract For aerospace operations, NASA risk analysts have very little actual‐relevant human error data to integrate into their risk assessments and corresponding calculations. Consequently, NASA relies on Human Reliability Analysis (HRA) methods that use expert opinion from other industries, data and analysis to determine human error probabilities. To provide accurate and relevant data for NASA risk assessment, this project focused on identifying previously recorded NASA human error data, evaluating that data, and calculating human error rates for manual and cognitive tasks. Once compiled and analyzed, the error rates would be available for use in NASA risk assessments and design trade studies. These data would serve as bases or anchors to help analysts decide how much to modify generic human error probabilities for tasks that lack data collected from real human errors. Additionally, the data provided NASA a mechanism to assess existing HRA methods to ascertain which method(s) provide human error probabilities that most closely resemble data‐based error rates. This informal validation provides an indication of those HRA methods that are most suitable for given activities and contexts when actual human error data is not available. During the project, we identified eight data sets and after initial screening, determined that three data sets would produce the most valuable information. The study focused on these three data sets: (1) the Kennedy Space Center (KSC) Shuttle Switch Throw Database (manual tasks), (2) the Johnson Space Center (JSC) International Space Station (ISS) Command Error Database (CED) (cognitive tasks), and (3) the Jet Propulsion Laboratory (JPL) Mars Exploration Rover (MER) CED (cognitive and analytical tasks). For each data set, we identified the number of actions and errors, and calculated the human error rate. The corresponding point value human error rates were 1.90x10‐3 for the switch throw data; 5.30x10‐4 for the ISS’s command error data; and 1.05x10‐4 for MER command error data. We also compared these error rates with human error probabilities (HEPs) generated by three HRA methods: (1) Technique for Human Error Rate Prediction (THERP), (2) Cognitive Reliability and Error Analysis Method (CREAM), and (3) Nuclear Action Reliability Assessment (NARA) to determine which method would produce a quantitative estimate that most closely represents the actual data. We found that when uncertainties were roughly estimated for the methods, all three methods produced HEPs that were comparable (qualitatively and quantitatively) to the human error rate for manual tasks recorded in the switch throw data set. CREAM and NARA provided the closer approximation of HEPs for the cognitive tasks in the ISS’s Command error data set, with CREAM providing the closest approximation. Of the three methods evaluated, none of the methods had human error categories that corresponded to the data‐based error categories and performance shaping
NASA Human Error Analysis September 17, 2010
2
National Aeronautics and Space Administration
factors used in the MER CED. Consequently, the MER CED was very useful in providing an extension to the cases handled by the methods.
Acronym List CED Command Error DatabaseCMD Command CREAM Cognitive Reliability and Error
Analysis Method CRM Continuous Risk Management CTV Crew Transfer Vehicle DTO Detailed Test Objective EPC Error Producing Condition EVA Extra‐Vehicular Activity GUI Graphical User Interface HEP Human Error Probability HRA Human Reliability Analysis IPR Interim Problem Report ISS International Space Station JPL Jet Propulsion Laboratory JSC Johnson Space Center KSC Kennedy Space Center MCC Mission Control Center MD Moderate Dependence MER Mars Exploration Rover MMI Man‐Machine Interface MOD Mission Operations Directorate
NARA Nuclear Action Reliability Assessment
Ops Operations OTC Orbiter Test Conductor PILOT Portable In‐Flight Operations
Training PRA Probabilistic Risk Assessment PSF Performance Shaping Factor RIDM Risk‐Informed Decision‐Making RMS Remote Manipulator System SCO Space Craft Operator SOWG Science Operations Working
Group SPAR‐H Standard Plant Analysis Risk HRA SPN Software Program Note STA Shuttle Training Aircraft STS Space Transportation System THERP Technique for Human Error Rate
Prediction TPE Test Project Engineer VMS Vertical Motion Simulator
Introduction and Background NASA programs are required to conduct system safety analysis and qualitative and quantitative risk assessments as part of their adherence to Continuous Risk Management (CRM) and Risk‐Informed Decision‐Making (RIDM)1. Additionally spaceflight programs are required to perform Probabilistic Risk Assessment (PRA) as part of standard risk management activities2. Within these risk management activities, one of the major areas of risk that must be considered and incorporated is the potential for human error. In a previous study by Chandler, Chang, Mosleh, et al, titled Human Reliability Analysis Methods: Selection Guidance for NASA3, the authors were able to identify several critical NASA spaceflight mission phases that can be significantly impacted by human error; namely: (1) Pre‐Launch and Launch; (2) Emergency Egress; (3) Remote Manipulator System (RMS) operation; (4) Guidance, Rendezvous, and Docking; (5) Emergency Response and Recovery; (6) Extra‐Vehicular Activity (EVA); and (7) Entry/Landing. Following the recommendations of that study, our team’s goal was to locate and evaluate actual NASA human error data that were collected from those mission phases or that could be appropriately generalized to tasks that occur during those mission phases − allowing risk analysts to incorporate data‐based error rates, rather than error probabilities, in their analysis and risk assessments. Upon identifying human error data sources (and selecting from the most promising of those), we planned to calculate human error rates
NASA Human Error Analysis September 17, 2010
3
National Aeronautics and Space Administration
and provide guidance on the use of those rates for other NASA program risk assessments. In particular, our guidance would focus on whether the data‐based error rates should be applied to risk assessments of cognitive or manual human activities, and the context and special circumstances that would limit how the actual error data should be generalized. Additionally, we set out to evaluate three of the four methods that Chandler, Chang, Mosleh, et al, determined were most useful and applicable to NASA spaceflight applications to further assess their applicability and determine if and when those methods would produce human error probabilities that closely represented actual NASA error rates. Consequently, this paper should be considered the follow‐on study to the paper by Chandler, Chang, Mosleh, et al. To summarize the goals of this study, our team intended to:
1. Collect actual human error data from NASA programs and projects to determine data‐based human error rates for use as benchmarks in HRA applications in NASA risk assessments;
2. Provide guidance for analysts indicating the task type, context, and specific mission phases where the error rate can be appropriately generalized for use in risk assessments;
3. Compare the data‐based error rates to the human error probability predictions produced by Technique for Human Error Rate Prediction (THERP)4, Cognitive Reliability and Error Analysis Method (CREAM)5, and Nuclear Action Reliability Assessment (NARA)6 to assess if the methods produce comparable predictions of human error rate for the activities evaluated.
Methodology and Analysis
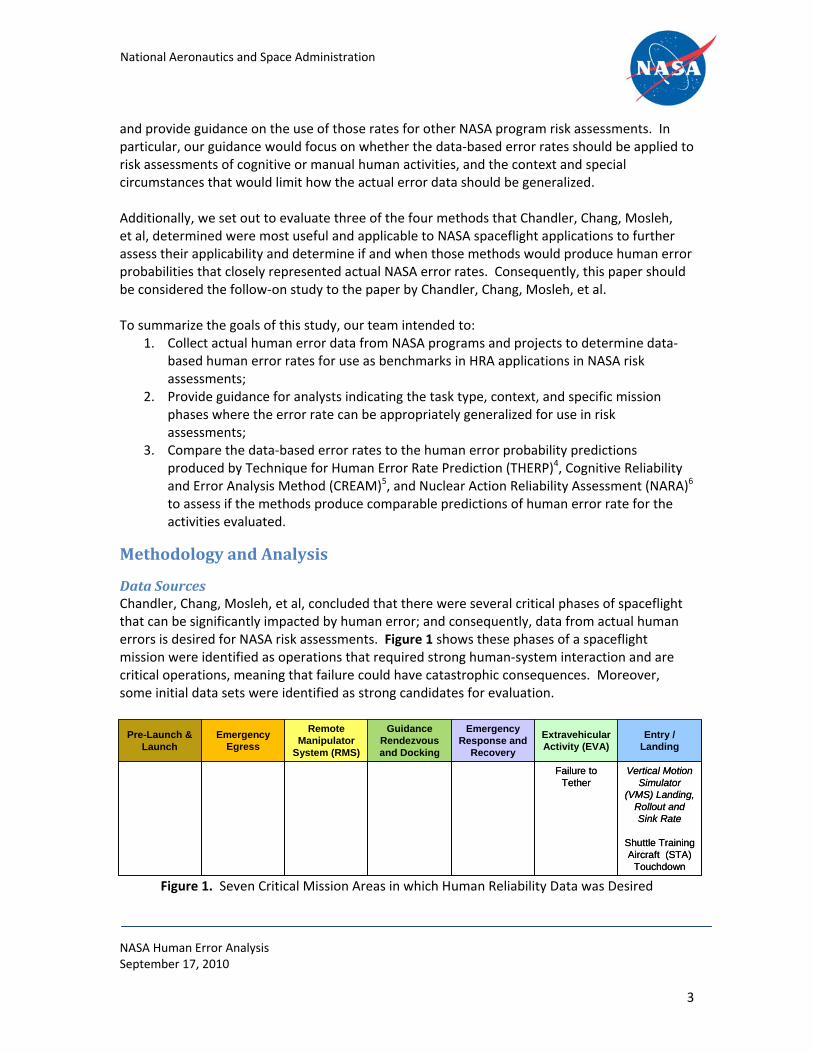
Data Sources Chandler, Chang, Mosleh, et al, concluded that there were several critical phases of spaceflight that can be significantly impacted by human error; and consequently, data from actual human errors is desired for NASA risk assessments. Figure 1 shows these phases of a spaceflight mission were identified as operations that required strong human‐system interaction and are critical operations, meaning that failure could have catastrophic consequences. Moreover, some initial data sets were identified as strong candidates for evaluation.
Figure 1. Seven Critical Mission Areas in which Human Reliability Data was Desired
Pre-Launch & Launch
Emergency Egress
Remote Manipulator
System (RMS)
Guidance Rendezvous and Docking
Emergency Response and
Recovery
Extravehicular Activity (EVA)
Entry / Landing
Failure to Tether
Vertical Motion Simulator
(VMS) Landing, Rollout and Sink Rate
Shuttle Training Aircraft (STA)
Touchdown
NASA Human Error Analysis September 17, 2010
4
National Aeronautics and Space Administration
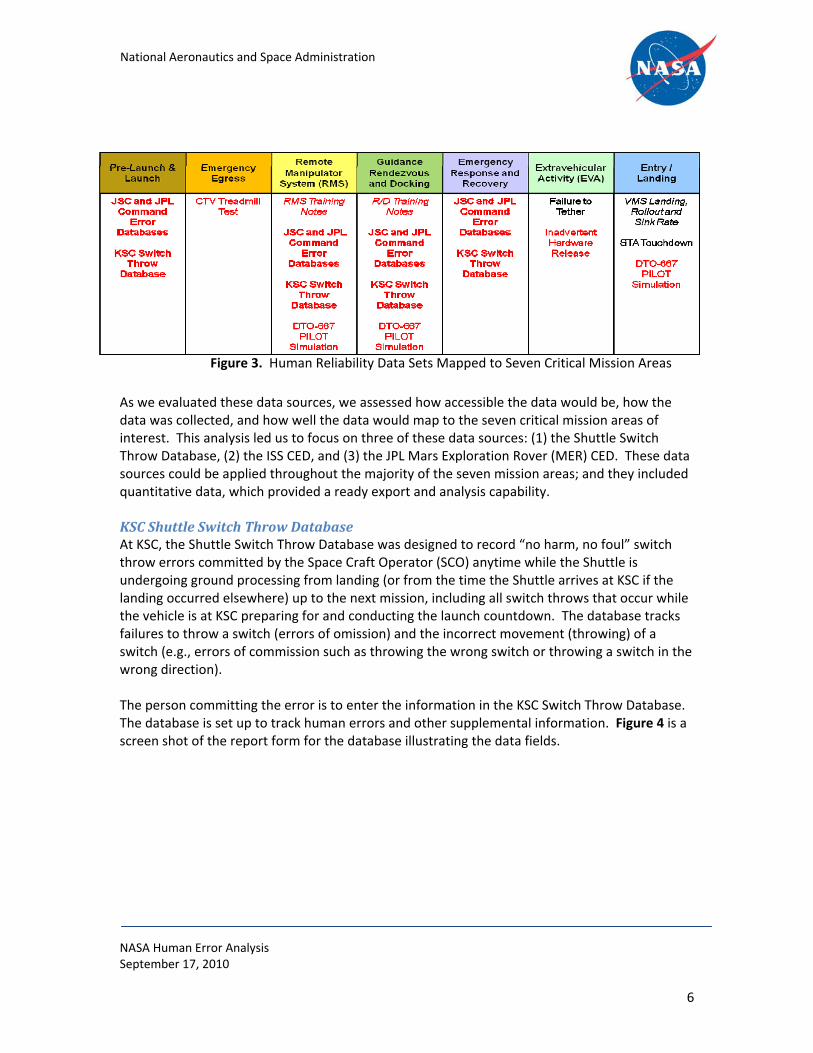
These seven critical areas guided our data investigation. Our goal was to identify and collect information about human errors that actually occurred during these phases by looking at training performance logs and/or operational data. Because the critical human tasks that occur during spaceflight operations are conducted by the flight crew and mission control and these personnel are predominately based at Johnson Space Center (JSC), we began our search for relevant human performance data bases at this location and then through leads‐identified data sources in other locations as well. We spoke with professionals in the following offices: Mission Operations Directorate (MOD), which is responsible for flight crew training and Mission Control Center (MCC) operations during spaceflight; Space and Life Sciences Directorate that studies human factors and human research; Flight Operations at Ellington Field; Astronaut office; and Shuttle and International Space Station (ISS) Program offices. We conducted 73 interviews, identified 33 potential data sources, and quickly found how difficult it was to identify personnel that were currently collecting or had already collected information about human tasks, human performance, and specific human errors that had occurred during spaceflight training or actual operations. One data source evaluated, training and simulations, may seem an ideal opportunity area to collect data on human reliability; however, the ability to obtain actual human error rates is dependent upon how consistently and completely information on human errors are recorded. At NASA, the training philosophy emphasizes operator proficiency through repeated drilling of nominal and off‐nominal scenarios, rather than the evaluation and recordkeeping of individual performance on each training simulation. Data collection is focused on identifying changes needed for improving operations, and not on personal readiness or modeling error rates. The data are often collected in a free‐hand note format that often does not include standard human error or Performance Shaping Factor (PSF) counts, categories, or terminology. Consequently, although notes are taken, substantial time and effort would be required to decipher and code the notes into a usable format. And even then, the notes would have inconsistent types and levels of detail, which would affect human error analysis conducted for the purpose of understanding human reliability. Additionally, human errors that occur during training have limitations in their applicability to real operations, given that the PSFs (e.g., stress, fatigue, and level of proficiency) would be different. NASA’s medical and human factors engineering community conducts research on human performance in the space environment to ensure that systems are designed to safely and effectively accommodate the human’s abilities and limitations while assisting them in completion of their mission. The focus of much research is to understand the physiological and psychological effects of working in the space environment and to develop associated countermeasures. Because the focus has not been to understand or predict human error during space operations, specific task and error data needed for risk assessment has not been collected. Finally, there are strong sensitivities to human errors being recorded during actual spaceflight operations. Spaceflight is a challenging and complex business that requires extensive preparation to operate in very difficult environments. Similar to work in other complex
NASA Human Error Analysis September 17, 2010
5
National Aeronautics and Space Administration
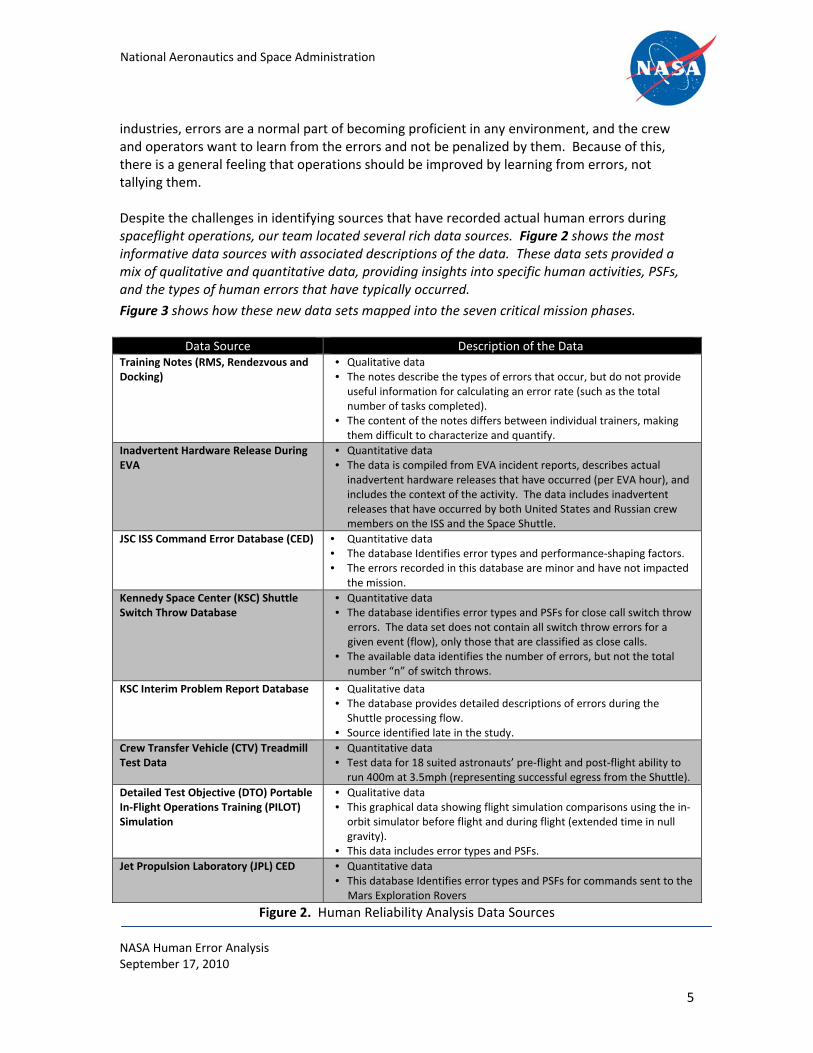
industries, errors are a normal part of becoming proficient in any environment, and the crew and operators want to learn from the errors and not be penalized by them. Because of this, there is a general feeling that operations should be improved by learning from errors, not tallying them. Despite the challenges in identifying sources that have recorded actual human errors during spaceflight operations, our team located several rich data sources. Figure 2 shows the most informative data sources with associated descriptions of the data. These data sets provided a mix of qualitative and quantitative data, providing insights into specific human activities, PSFs, and the types of human errors that have typically occurred. Figure 3 shows how these new data sets mapped into the seven critical mission phases.
Data Source Description of the Data Training Notes (RMS, Rendezvous and Docking)
• Qualitative data • The notes describe the types of errors that occur, but do not provide useful information for calculating an error rate (such as the total number of tasks completed).
• The content of the notes differs between individual trainers, making them difficult to characterize and quantify.
Inadvertent Hardware Release During EVA
• Quantitative data • The data is compiled from EVA incident reports, describes actual inadvertent hardware releases that have occurred (per EVA hour), and includes the context of the activity. The data includes inadvertent releases that have occurred by both United States and Russian crew members on the ISS and the Space Shuttle.
JSC ISS Command Error Database (CED)
• Quantitative data • The database Identifies error types and performance‐shaping factors. • The errors recorded in this database are minor and have not impacted
the mission.
Kennedy Space Center (KSC) Shuttle Switch Throw Database
• Quantitative data • The database identifies error types and PSFs for close call switch throw
errors. The data set does not contain all switch throw errors for a given event (flow), only those that are classified as close calls.
• The available data identifies the number of errors, but not the total number “n” of switch throws.
KSC Interim Problem Report Database • Qualitative data • The database provides detailed descriptions of errors during the Shuttle processing flow.
• Source identified late in the study. Crew Transfer Vehicle (CTV) Treadmill Test Data
• Quantitative data • Test data for 18 suited astronauts’ pre‐flight and post‐flight ability to run 400m at 3.5mph (representing successful egress from the Shuttle).
Detailed Test Objective (DTO) Portable In‐Flight Operations Training (PILOT) Simulation
• Qualitative data • This graphical data showing flight simulation comparisons using the in‐orbit simulator before flight and during flight (extended time in null gravity).
• This data includes error types and PSFs. Jet Propulsion Laboratory (JPL) CED • Quantitative data
• This database Identifies error types and PSFs for commands sent to the Mars Exploration Rovers
Figure 2. Human Reliability Analysis Data Sources
NASA Human Error Analysis September 17, 2010
6
National Aeronautics and Space Administration
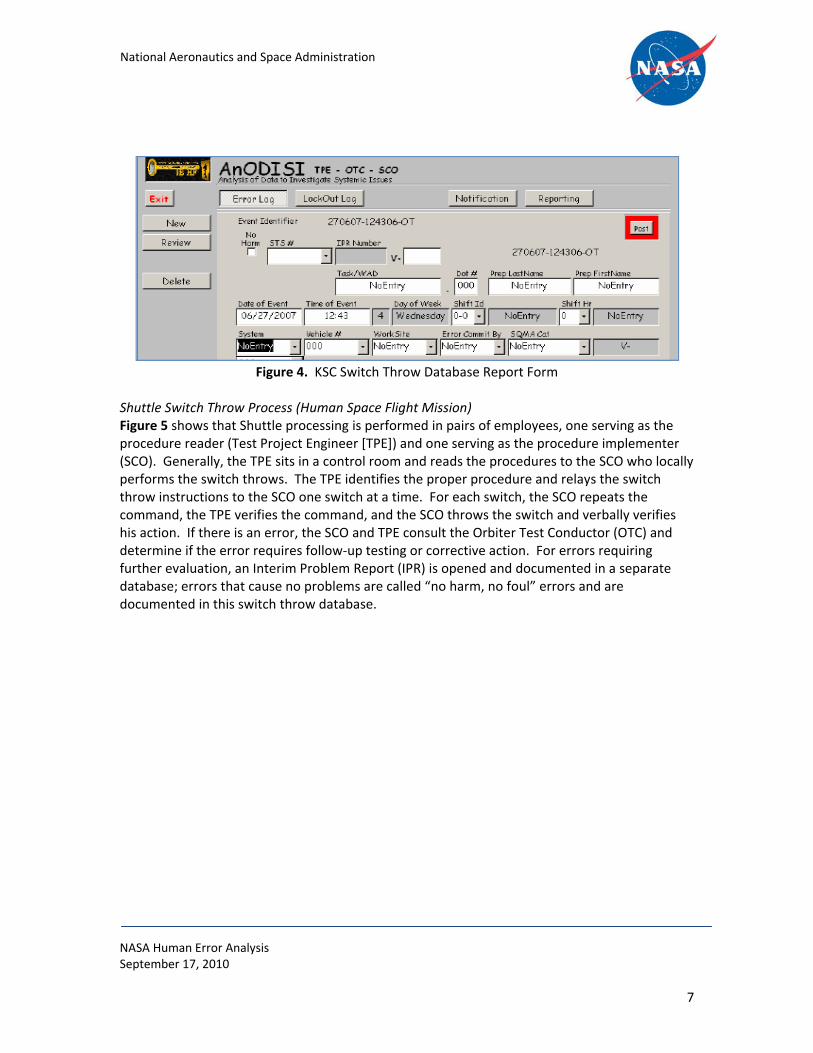
As we evaluated these data sources, we assessed how accessible the data would be, how the data was collected, and how well the data would map to the seven critical mission areas of interest. This analysis led us to focus on three of these data sources: (1) the Shuttle Switch Throw Database, (2) the ISS CED, and (3) the JPL Mars Exploration Rover (MER) CED. These data sources could be applied throughout the majority of the seven mission areas; and they included quantitative data, which provided a ready export and analysis capability. KSC Shuttle Switch Throw Database At KSC, the Shuttle Switch Throw Database was designed to record “no harm, no foul” switch throw errors committed by the Space Craft Operator (SCO) anytime while the Shuttle is undergoing ground processing from landing (or from the time the Shuttle arrives at KSC if the landing occurred elsewhere) up to the next mission, including all switch throws that occur while the vehicle is at KSC preparing for and conducting the launch countdown. The database tracks failures to throw a switch (errors of omission) and the incorrect movement (throwing) of a switch (e.g., errors of commission such as throwing the wrong switch or throwing a switch in the wrong direction). The person committing the error is to enter the information in the KSC Switch Throw Database. The database is set up to track human errors and other supplemental information. Figure 4 is a screen shot of the report form for the database illustrating the data fields.
Figure 3. Human Reliability Data Sets Mapped to Seven Critical Mission Areas
NASA Human Error Analysis September 17, 2010
7
National Aeronautics and Space Administration
Figure 4. KSC Switch Throw Database Report Form
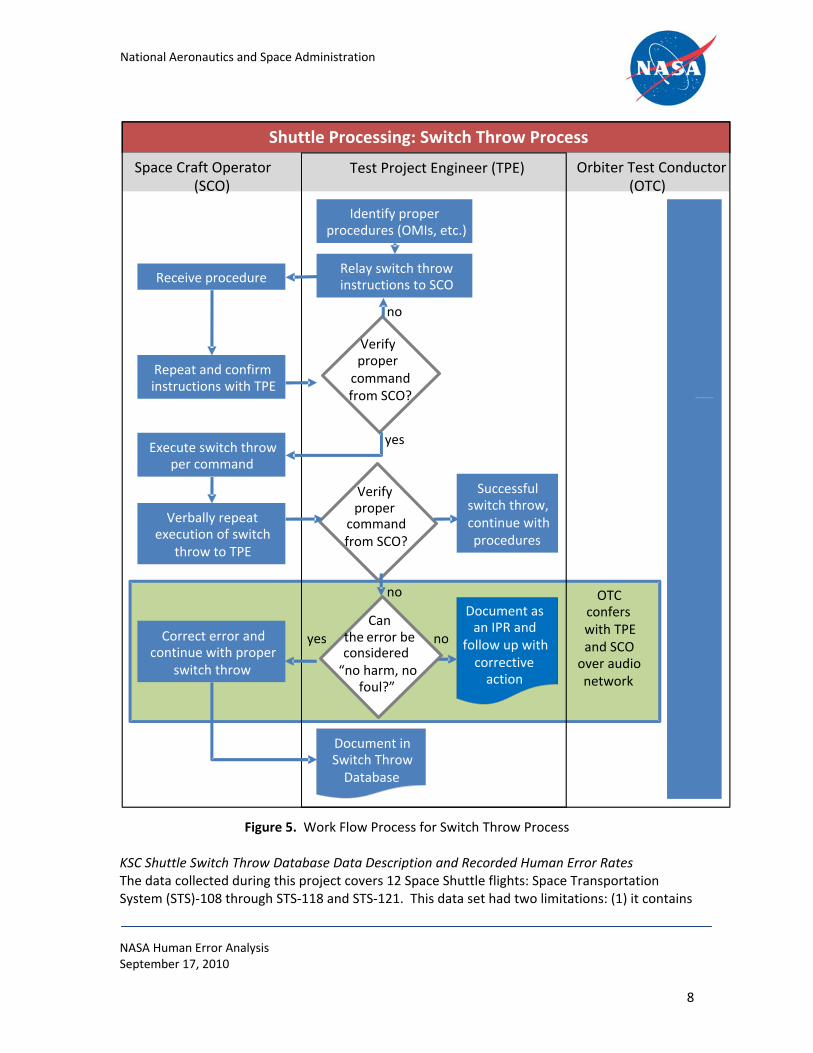
Shuttle Switch Throw Process (Human Space Flight Mission) Figure 5 shows that Shuttle processing is performed in pairs of employees, one serving as the procedure reader (Test Project Engineer [TPE]) and one serving as the procedure implementer (SCO). Generally, the TPE sits in a control room and reads the procedures to the SCO who locally performs the switch throws. The TPE identifies the proper procedure and relays the switch throw instructions to the SCO one switch at a time. For each switch, the SCO repeats the command, the TPE verifies the command, and the SCO throws the switch and verbally verifies his action. If there is an error, the SCO and TPE consult the Orbiter Test Conductor (OTC) and determine if the error requires follow‐up testing or corrective action. For errors requiring further evaluation, an Interim Problem Report (IPR) is opened and documented in a separate database; errors that cause no problems are called “no harm, no foul” errors and are documented in this switch throw database.
NASA Human Error Analysis September 17, 2010
8
National Aeronautics and Space Administration
Figure 5. Work Flow Process for Switch Throw Process KSC Shuttle Switch Throw Database Data Description and Recorded Human Error Rates The data collected during this project covers 12 Space Shuttle flights: Space Transportation System (STS)‐108 through STS‐118 and STS‐121. This data set had two limitations: (1) it contains
Shuttle Processing: Switch Throw Process
Space Craft Operator(SCO)
Test Project Engineer (TPE) Orbiter Test Conductor (OTC)
Identify proper procedures (OMIs, etc.)
Relay switch throw instructions to SCO
Verify proper command from SCO?
Receive procedure
Repeat and confirm instructions with TPE
Execute switch throwper command
Verbally repeatexecution of switch
throw to TPE
Verify proper
command from SCO?
Successful switch throw, continue with procedures
Correct error and continue with proper
switch throw
Document as an IPR and
follow up with corrective action
Document in Switch Throw Database
Oversee all Orbiter test activities
Can the error be considered “no harm, no
foul?”
OTC confers with TPE and SCO over audio network
yes
no
no
yes
no
NASA Human Error Analysis September 17, 2010
9
National Aeronautics and Space Administration
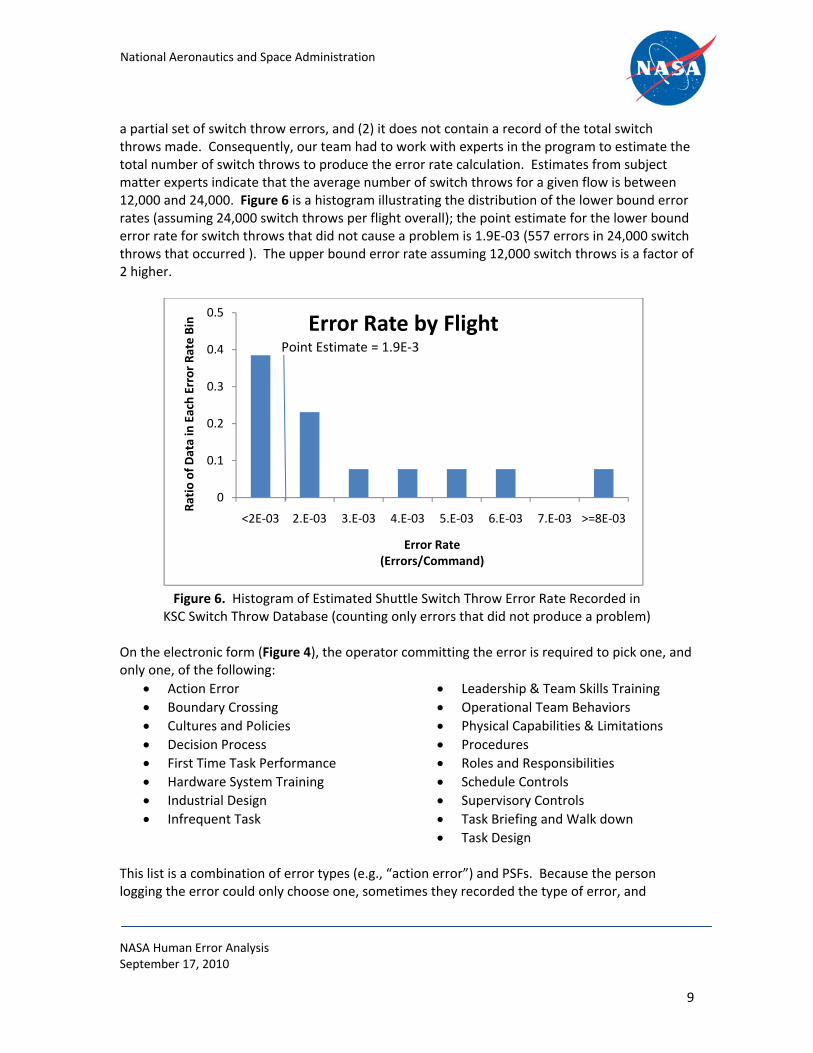
a partial set of switch throw errors, and (2) it does not contain a record of the total switch throws made. Consequently, our team had to work with experts in the program to estimate the total number of switch throws to produce the error rate calculation. Estimates from subject matter experts indicate that the average number of switch throws for a given flow is between 12,000 and 24,000. Figure 6 is a histogram illustrating the distribution of the lower bound error rates (assuming 24,000 switch throws per flight overall); the point estimate for the lower bound error rate for switch throws that did not cause a problem is 1.9E‐03 (557 errors in 24,000 switch throws that occurred ). The upper bound error rate assuming 12,000 switch throws is a factor of 2 higher.
a Figure 6. Histogram of Estimated Shuttle Switch Throw Error Rate Recorded in
KSC Switch Throw Database (counting only errors that did not produce a problem) On the electronic form (Figure 4), the operator committing the error is required to pick one, and only one, of the following:
Action Error
Boundary Crossing
Cultures and Policies
Decision Process
First Time Task Performance
Hardware System Training
Industrial Design
Infrequent Task
Leadership & Team Skills Training
Operational Team Behaviors
Physical Capabilities & Limitations
Procedures
Roles and Responsibilities
Schedule Controls
Supervisory Controls
Task Briefing and Walk down
Task Design This list is a combination of error types (e.g., “action error”) and PSFs. Because the person logging the error could only choose one, sometimes they recorded the type of error, and
0
0.1
0.2
0.3
0.4
0.5
<2E‐03 2.E‐03 3.E‐03 4.E‐03 5.E‐03 6.E‐03 7.E‐03 >=8E‐03
Ratio of Data in Each Error Rate Bin
Error Rate(Errors/Command)
Error Rate by FlightPoint Estimate = 1.9E‐3
NASA Human Error Analysis September 17, 2010
10
National Aeronautics and Space Administration
sometimes they recorded the PSF. Figure 7 shows how we combined the listed PSFs into categories. KSC Switch Throw Data List Item Included In PSF Category in Figure 8 & 16
Boundary Crossing Team Collaboration
Cultures and Policies Organizational Factors
Decision Process Not Specified
First Time Task Performance Training/Experience
Hardware System Training Training/Experience
Industrial Design System Design/Man‐Machine Interface (MMI)
Infrequent Task Training/Experience
Leadership and Team Skills Training Team Coordination
Operational Team Behaviors Team Coordination
Physical Capabilities and Limitations Team Coordination
Procedures Procedures
Roles and Responsibilities Team Coordination
Schedule Controls Available Time
Supervisory Controls Organizational Factors
Task Briefing and Walk Down Team Coordination
Task Design Task Design
Figure 7. Table Illustrating How Database Items were Combined into Categories for PSFs in Figure 8 and Figure 16
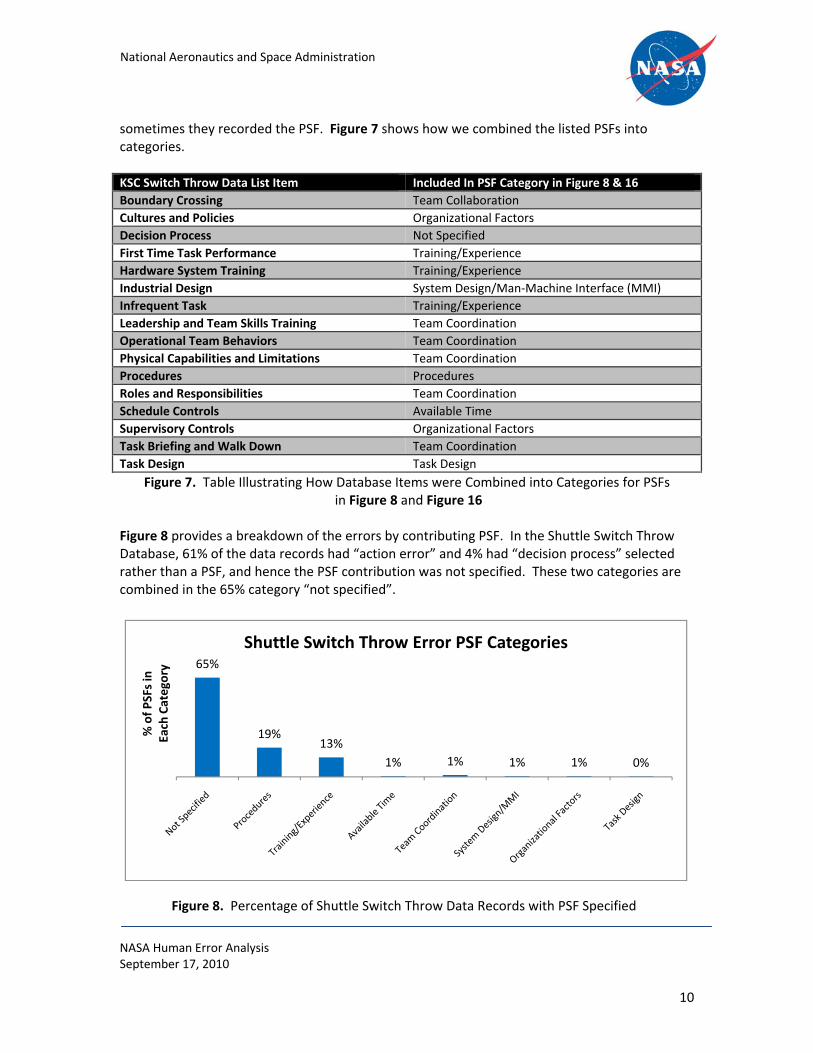
Figure 8 provides a breakdown of the errors by contributing PSF. In the Shuttle Switch Throw Database, 61% of the data records had “action error” and 4% had “decision process” selected rather than a PSF, and hence the PSF contribution was not specified. These two categories are combined in the 65% category “not specified”.
Figure 8. Percentage of Shuttle Switch Throw Data Records with PSF Specified
65%
19%13%
1% 1% 1% 1% 0%
% of PSFs in
Each Category
Shuttle Switch Throw Error PSF Categories
NASA Human Error Analysis September 17, 2010
11
National Aeronautics and Space Administration
Shuttle Switch Throw Error Data Compared to HEPs Calculated by HRA Methods To determine which Human Reliability Analysis (HRA) method (THERP, CREAM, or NARA) would produce a Human Error Probability (HEP) that most closely resembled the actual Shuttle switch throw error rate, we used the command process in Figure 5 in conjunction with subject matter expert interviews and identified the following possible errors: For CREAM, the dominant error types were determined to be “Execution Error: Action of Wrong Type” and “Execution Error: Action on Wrong Object.” For NARA, the dominant error type chosen was “Ensuring Correct Plant Status B3: Set system status as part of routine operations using strict administratively controlled procedures,” and the Error Producing Condition (EPC) “no obvious means of reversing unintended action” was partially applied (a total factor of 2.7). The dominant error type for THERP was “Errors of Commission in operating manual controls [Table 20‐12 (3)]: Select wrong control on a panel from an array of similar‐appearing controls that are arranged in well‐delineated functional groups.” As previously noted, a two‐man team performs the switch throw process. In the CREAM and NARA calculations, second person verification was not credited because complete dependency between the reader and operator was determined to be most appropriate and most conservative, in absence of specific input from subject matter experts or direct observation of the process. THERP, however, had a specific entry for second‐person verification “checking by reader/checker of a 2‐man team [Table 20‐22 (8)] ” and that factor of 0.5 was applied to the THERP HEP calculation. Figure 9 summarizes these error types and PSFs.
Method Error Types Mapped PSFs or Other Adjustments
THERP Errors of Commission in operating manual controls [Table 20‐12 (3)]; Select wrong control on a panel from an array of similar‐appearing controls that are arranged in well‐delineated functional groups
Checking by reader/checker of a 2‐man team [Table 20‐22 (8)] (adj. factor = 0.5)
CREAM Execution Error: Action of Wrong Type
Execution Error: Action on Wrong Object
N/A
NARA Ensuring Correct Plant Status B3: Set system status as part of routine operations using strict administratively controlled procedures
No obvious means of reversing unintended action (EPC = 2.7)
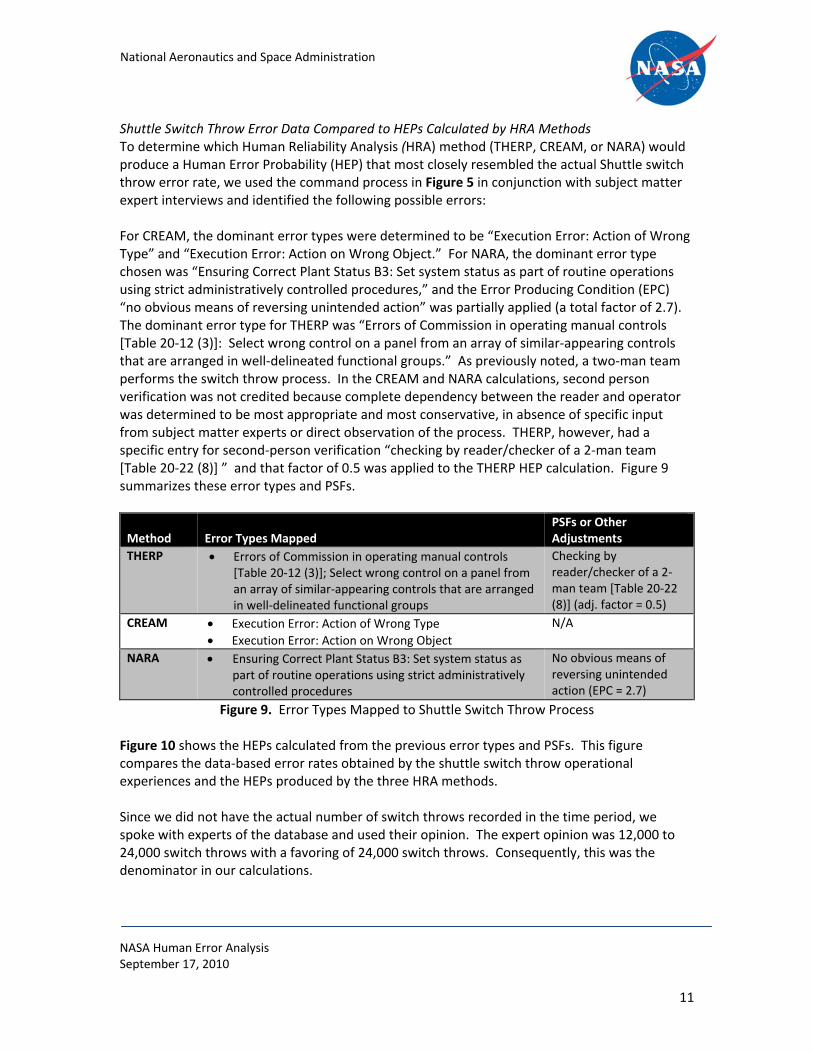
Figure 9. Error Types Mapped to Shuttle Switch Throw Process Figure 10 shows the HEPs calculated from the previous error types and PSFs. This figure compares the data‐based error rates obtained by the shuttle switch throw operational experiences and the HEPs produced by the three HRA methods. Since we did not have the actual number of switch throws recorded in the time period, we spoke with experts of the database and used their opinion. The expert opinion was 12,000 to 24,000 switch throws with a favoring of 24,000 switch throws. Consequently, this was the denominator in our calculations.
NASA Human Error Analysis September 17, 2010
12
National Aeronautics and Space Administration
Figure 10. Comparison of Shuttle Switch Throw Error Rate to HEPs Calculated Using Three HRA Methods
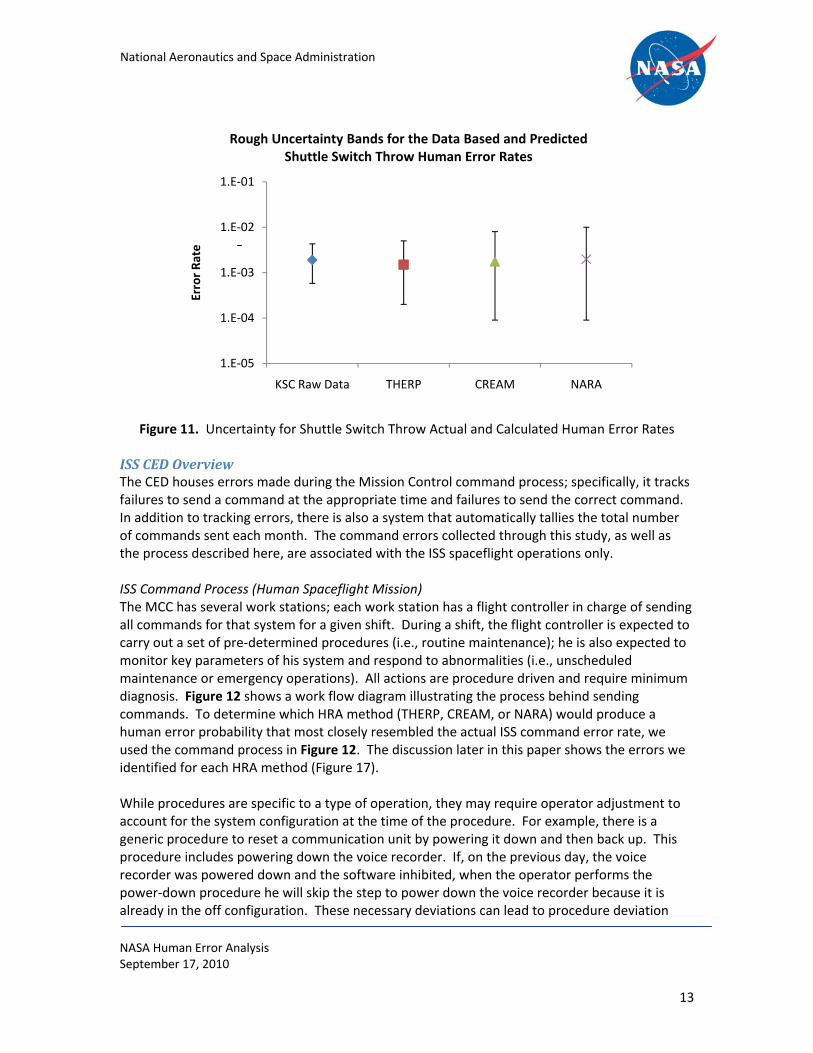
The KSC Shuttle Switch Throw Database only captures a portion of the total switch throws and does not include switch throw errors that produce harm and require a corrective action. However, based‐on discussions with subject matter experts, it is expected that the percent of errors not captured by this database is small. The Shuttle switch throw process is similar to what is seen in other highly specialized industries; and, as expected, there is close agreement between the data‐based value and the predicted values from all three methods in this preliminary comparison. Rough Uncertainty in HEP Estimates There are several sources of uncertainty in the data‐based and HRA method derived error rates. With respect to the data‐based error rates, there was some variation in the Shuttle flight error rates (as seen in Figure 6). Our team did not apply many PSFs to the HEP estimates because we were unable to identify subject matter experts that had direct observation of the process that could provide specific input on PSFs. Consequently, our team applied alternate interpretations of the PSFs to each HRA method in order to determine what effect that would have on the HEPs. Figure 11 shows the resulting data rough estimated uncertainty and rough modeling estimated uncertainties.
1.90E‐03 1.50E‐03 1.75E‐03 1.98E‐03
KSC Raw Data THERP CREAM NARA
Error Probab
ility per Comman
d
Data Source or HRA Method
Comparison of Shuttle Switch Throw Error Rate to HEPs Calculated Using 3 HRA Methods
NASA Human Error Analysis September 17, 2010
13
National Aeronautics and Space Administration
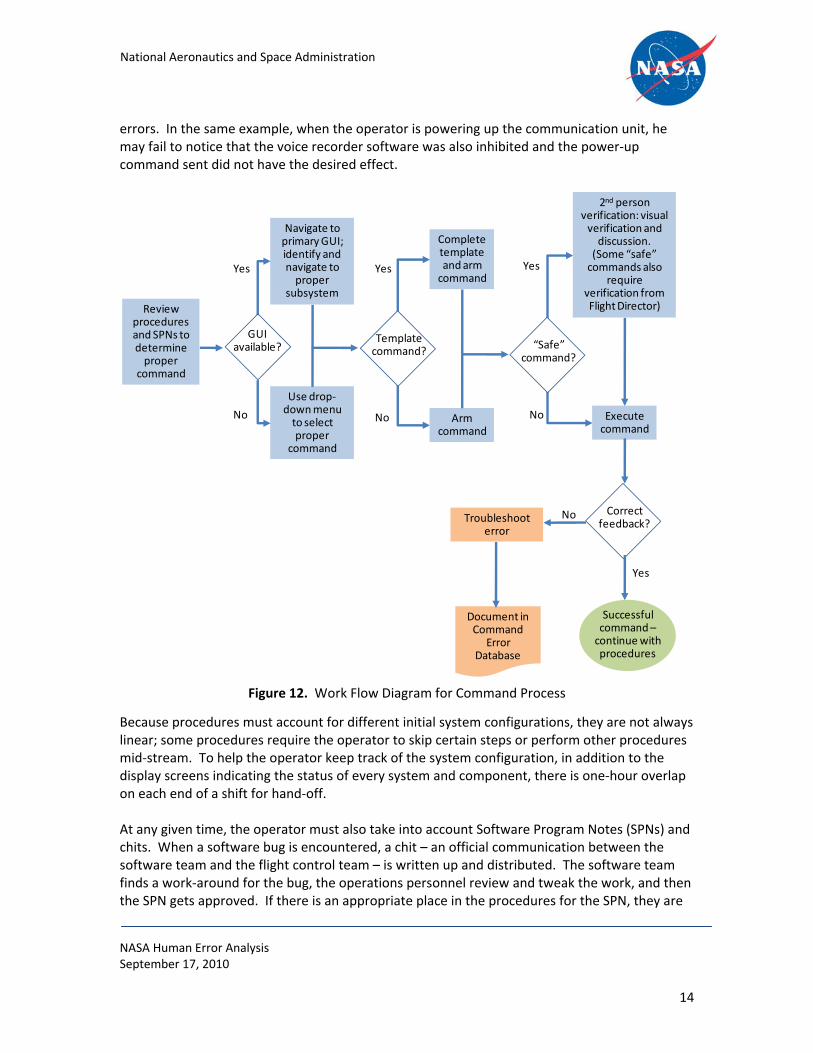
Figure 11. Uncertainty for Shuttle Switch Throw Actual and Calculated Human Error Rates ISS CED Overview The CED houses errors made during the Mission Control command process; specifically, it tracks failures to send a command at the appropriate time and failures to send the correct command. In addition to tracking errors, there is also a system that automatically tallies the total number of commands sent each month. The command errors collected through this study, as well as the process described here, are associated with the ISS spaceflight operations only. ISS Command Process (Human Spaceflight Mission) The MCC has several work stations; each work station has a flight controller in charge of sending all commands for that system for a given shift. During a shift, the flight controller is expected to carry out a set of pre‐determined procedures (i.e., routine maintenance); he is also expected to monitor key parameters of his system and respond to abnormalities (i.e., unscheduled maintenance or emergency operations). All actions are procedure driven and require minimum diagnosis. Figure 12 shows a work flow diagram illustrating the process behind sending commands. To determine which HRA method (THERP, CREAM, or NARA) would produce a human error probability that most closely resembled the actual ISS command error rate, we used the command process in Figure 12. The discussion later in this paper shows the errors we identified for each HRA method (Figure 17).
While procedures are specific to a type of operation, they may require operator adjustment to account for the system configuration at the time of the procedure. For example, there is a generic procedure to reset a communication unit by powering it down and then back up. This procedure includes powering down the voice recorder. If, on the previous day, the voice recorder was powered down and the software inhibited, when the operator performs the power‐down procedure he will skip the step to power down the voice recorder because it is already in the off configuration. These necessary deviations can lead to procedure deviation
1.E‐05
1.E‐04
1.E‐03
1.E‐02
1.E‐01
KSC Raw Data THERP CREAM NARA
Error Rate
Rough Uncertainty Bands for the Data Based and Predicted Shuttle Switch Throw Human Error Rates
NASA Human Error Analysis September 17, 2010
14
National Aeronautics and Space Administration
errors. In the same example, when the operator is powering up the communication unit, he may fail to notice that the voice recorder software was also inhibited and the power‐up command sent did not have the desired effect.
Because procedures must account for different initial system configurations, they are not always linear; some procedures require the operator to skip certain steps or perform other procedures mid‐stream. To help the operator keep track of the system configuration, in addition to the display screens indicating the status of every system and component, there is one‐hour overlap on each end of a shift for hand‐off. At any given time, the operator must also take into account Software Program Notes (SPNs) and chits. When a software bug is encountered, a chit – an official communication between the software team and the flight control team – is written up and distributed. The software team finds a work‐around for the bug, the operations personnel review and tweak the work, and then the SPN gets approved. If there is an appropriate place in the procedures for the SPN, they are
Document in Command
Error Database
Troubleshoot error
GUI available?
Use drop‐down menu to select proper
command
Navigate to primary GUI; identify and navigate to proper
subsystem
Review procedures and SPNs to determine proper
command
Template command?
Arm command
Complete template and arm command
“Safe” command?
Execute command
2nd person verification: visual verification and discussion.(Some “safe” commands also
require verification from Flight Director)
Correctfeedback?
Successful command –continue with procedures
Yes
No No No
No
Yes
Yes
Yes
Figure 12. Work Flow Diagram for Command Process
NASA Human Error Analysis September 17, 2010
15
National Aeronautics and Space Administration
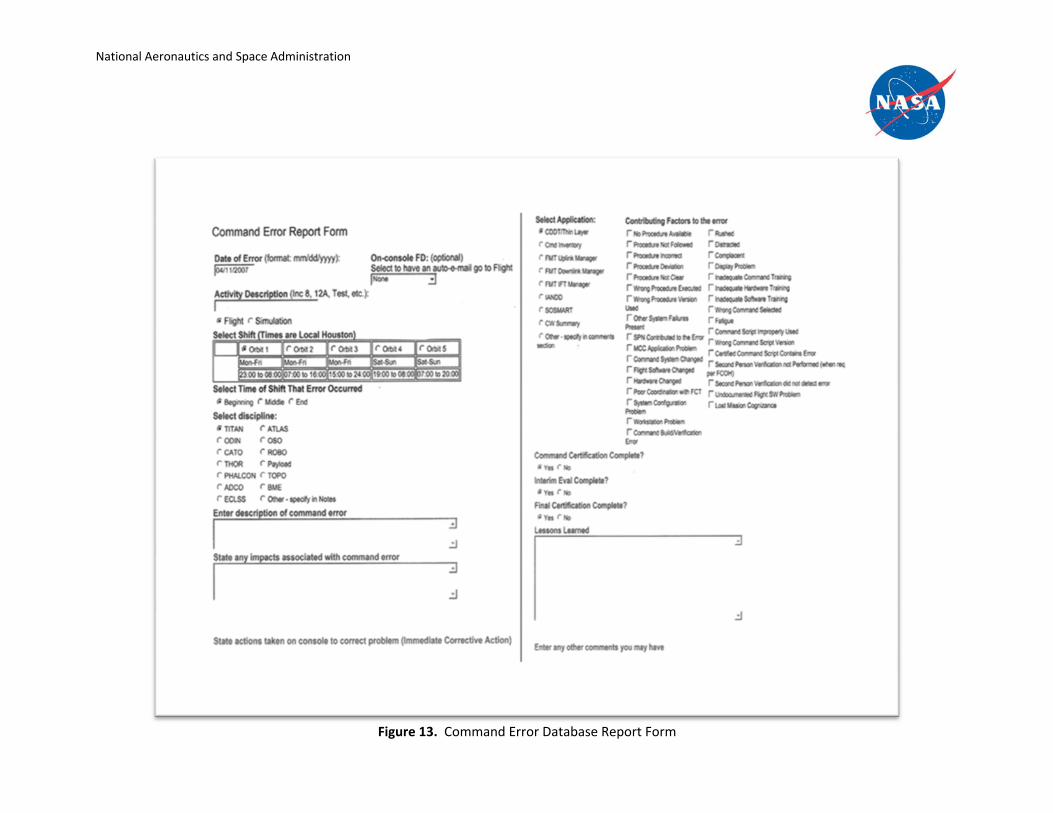
inserted as notes; however, many SPNs are not incorporated into the procedures. SPNs are distributed to all operators so they are aware of the known bugs even if a flag is not in the procedure. There are about 300‐700 SPNs open at any given time. Once the operator decides a command needs to be sent, the command process begins. There are two ways an operator can send a command – by either using the Graphical User Interface (GUI)* or using a drop down list. To use the GUI, the operator picks the system to send a command to and then navigates to the subsystem and specific command. The drop‐down list is a list of all the commands in the system. While the list can be searched, there are often many commands with very similar titles and identification numbers. The GUI is the preferred method of sending a command; however, the GUI is not available for all commands. If the procedure indicates that it is a “safe” command, the operator will obtain second‐person verification. The second person will both visually review the command from his own work station and verbally confirm the command with the operator. Some safe commands require additional verification by the Flight Director. Finally, the operator executes the command and checks for end‐item feedback, as indicated by the procedure. Feedback usually has a 3−8 second delay. In addition to checking that the system performed as expected, the operator also checks the history log of commands, which is displayed on the work station screen, to ensure the command he executed was correct and effectively delivered. ISS CED Data Description and Recorded Human Error Rates When a command error occurs, it is the operator’s responsibility to document the error in the database. The database was developed to help the program evaluate areas of interest and was not developed for the specific purpose of informing this study. However, the data collected provides useful insight into the actual human error rates of this cognitive task. For the purposes of this study, our team collected data that covered 115 months from December 1998 to June 2008; there are a total of 647 errors out of 1,223,496 commands over that time period. No command errors have significantly impacted the mission or resulted in a mishap; they were all “close‐calls.” The ISS CED tracks more information than simple occurrence of a human error. Figure 13 is the input form for the database and illustrates the additional information captured. Because the system is self‐reporting, there was a great sensitivity in releasing data that could potentially be traced back to a specific operator (i.e., detailed narratives of the error). For this reason, we only collected sanitized data (that omitted specific operator identifiers), which includes the following fields for each error: date of error, flight or simulation, shift, discipline, contributing factor, and operator certification level.
* A Graphical User Interface (GUI) is a software interface designed to standardize and simplify the use of computer programs, as by using a mouse to manipulate text and images on a display screen featuring icons, windows, and menus (source: www.dictionary.com).
National Aeronautics and Space Administration
Figure 13. Command Error Database Report Form
National Aeronautics and Space Administration
NASA Human Error Analysis September 17, 2010
17
.00
.02
.04
.06
.08
.10
.12
.14
<1E‐4
2.0E‐04
3.0E‐04
4.0E‐04
5.0E‐04
6.0E‐04
7.0E‐04
8.0E‐04
9.0E‐04
1.0E‐03
1.1E‐03
1.2E‐03
1.3E‐03
1.4E‐03
1.5E‐03
1.6E‐03
1.7E‐03
1.8E‐03
1.9E‐03
2.0E‐03
>2.1E‐3
Error Rate by Flight
Ratio of Data in
Each Error Rate Bin
Point Estimate = 1.9E‐3
Error Rate (Errors/Command)
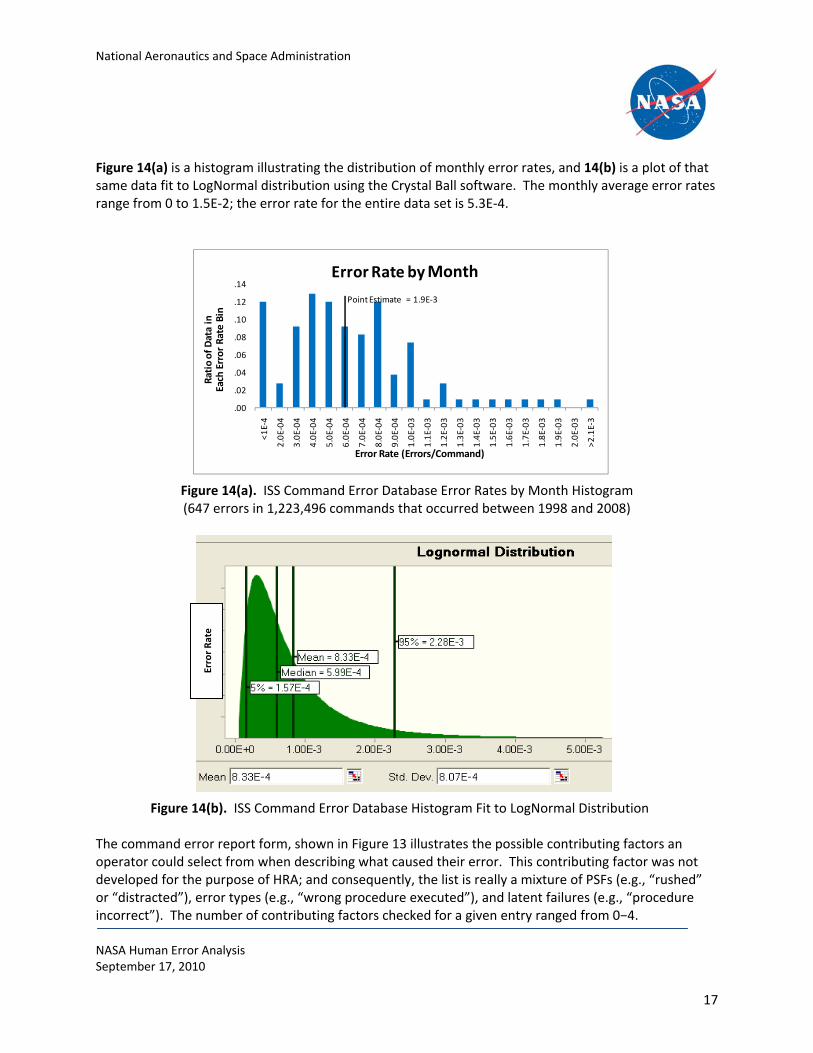
Figure 14(a) is a histogram illustrating the distribution of monthly error rates, and 14(b) is a plot of that same data fit to LogNormal distribution using the Crystal Ball software. The monthly average error rates range from 0 to 1.5E‐2; the error rate for the entire data set is 5.3E‐4.
The command error report form, shown in Figure 13 illustrates the possible contributing factors an operator could select from when describing what caused their error. This contributing factor was not developed for the purpose of HRA; and consequently, the list is really a mixture of PSFs (e.g., “rushed” or “distracted”), error types (e.g., “wrong procedure executed”), and latent failures (e.g., “procedure incorrect”). The number of contributing factors checked for a given entry ranged from 0−4.
Figure 14(a). ISS Command Error Database Error Rates by Month Histogram (647 errors in 1,223,496 commands that occurred between 1998 and 2008)
Figure 14(b). ISS Command Error Database Histogram Fit to LogNormal Distribution
Month
Error Rate
National Aeronautics and Space Administration
NASA Human Error Analysis September 17, 2010
18
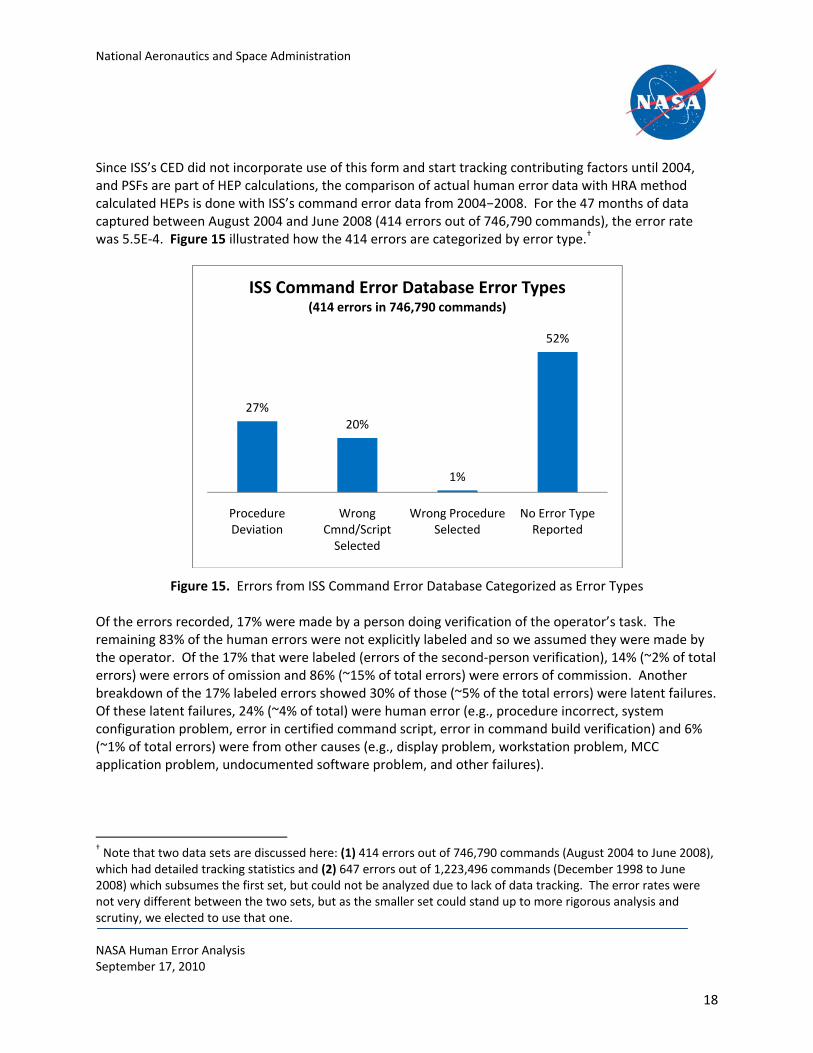
Since ISS’s CED did not incorporate use of this form and start tracking contributing factors until 2004, and PSFs are part of HEP calculations, the comparison of actual human error data with HRA method calculated HEPs is done with ISS’s command error data from 2004−2008. For the 47 months of data captured between August 2004 and June 2008 (414 errors out of 746,790 commands), the error rate was 5.5E‐4. Figure 15 illustrated how the 414 errors are categorized by error type.†
Figure 15. Errors from ISS Command Error Database Categorized as Error Types Of the errors recorded, 17% were made by a person doing verification of the operator’s task. The remaining 83% of the human errors were not explicitly labeled and so we assumed they were made by the operator. Of the 17% that were labeled (errors of the second‐person verification), 14% (~2% of total errors) were errors of omission and 86% (~15% of total errors) were errors of commission. Another breakdown of the 17% labeled errors showed 30% of those (~5% of the total errors) were latent failures. Of these latent failures, 24% (~4% of total) were human error (e.g., procedure incorrect, system configuration problem, error in certified command script, error in command build verification) and 6% (~1% of total errors) were from other causes (e.g., display problem, workstation problem, MCC application problem, undocumented software problem, and other failures).
† Note that two data sets are discussed here: (1) 414 errors out of 746,790 commands (August 2004 to June 2008), which had detailed tracking statistics and (2) 647 errors out of 1,223,496 commands (December 1998 to June 2008) which subsumes the first set, but could not be analyzed due to lack of data tracking. The error rates were not very different between the two sets, but as the smaller set could stand up to more rigorous analysis and scrutiny, we elected to use that one.
27%
20%
1%
52%
Procedure Deviation
Wrong Cmnd/Script Selected
Wrong Procedure Selected
No Error Type Reported
ISS Command Error Database Error Types(414 errors in 746,790 commands)
National Aeronautics and Space Administration
NASA Human Error Analysis September 17, 2010
19
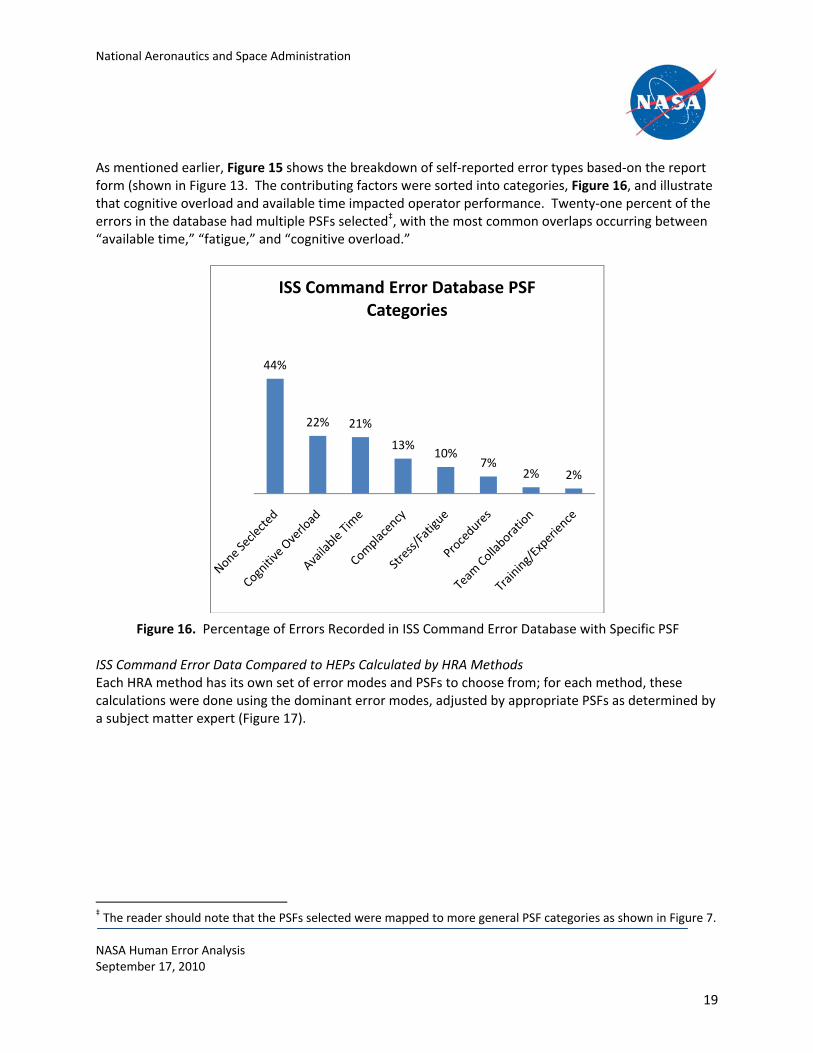
As mentioned earlier, Figure 15 shows the breakdown of self‐reported error types based‐on the report form (shown in Figure 13. The contributing factors were sorted into categories, Figure 16, and illustrate that cognitive overload and available time impacted operator performance. Twenty‐one percent of the errors in the database had multiple PSFs selected‡, with the most common overlaps occurring between “available time,” “fatigue,” and “cognitive overload.”
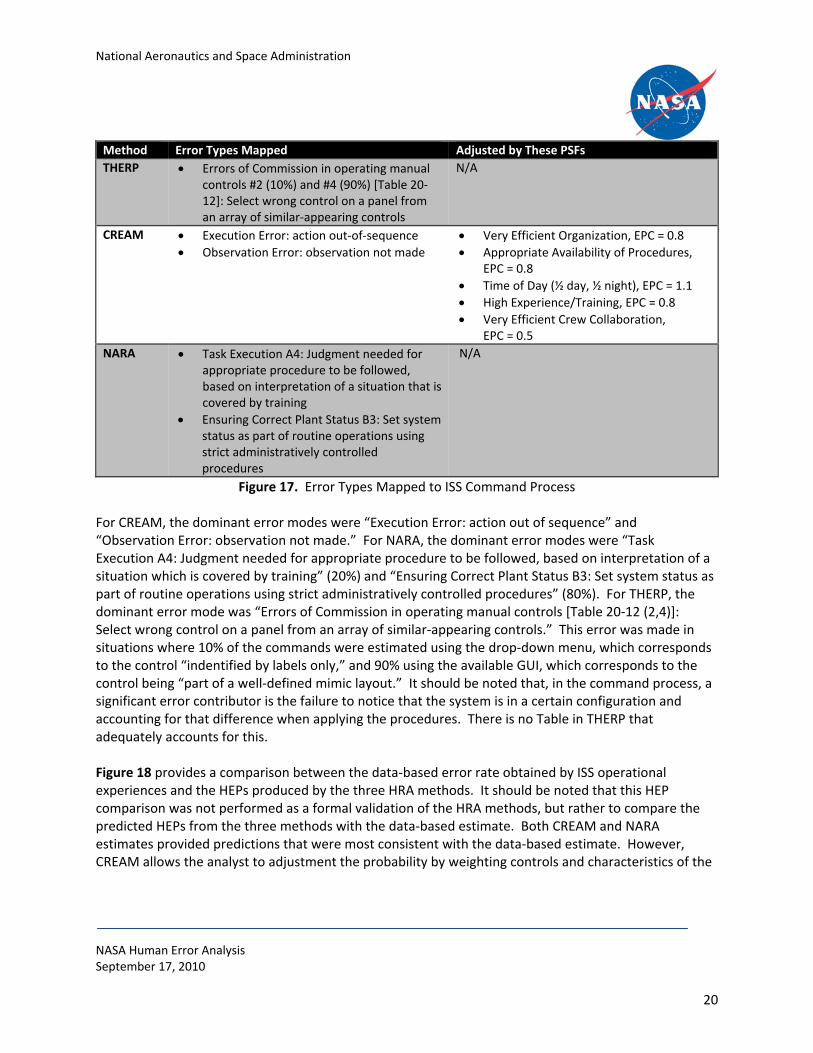
ISS Command Error Data Compared to HEPs Calculated by HRA Methods Each HRA method has its own set of error modes and PSFs to choose from; for each method, these calculations were done using the dominant error modes, adjusted by appropriate PSFs as determined by a subject matter expert (Figure 17).
‡ The reader should note that the PSFs selected were mapped to more general PSF categories as shown in Figure 7.
44%
22% 21%
13%10%
7%2% 2%
ISS Command Error Database PSF Categories
Figure 16. Percentage of Errors Recorded in ISS Command Error Database with Specific PSF
National Aeronautics and Space Administration
NASA Human Error Analysis September 17, 2010
20
Method Error Types Mapped Adjusted by These PSFs
THERP Errors of Commission in operating manual controls #2 (10%) and #4 (90%) [Table 20‐12]: Select wrong control on a panel from an array of similar‐appearing controls
N/A
CREAM Execution Error: action out‐of‐sequence
Observation Error: observation not made
Very Efficient Organization, EPC = 0.8
Appropriate Availability of Procedures, EPC = 0.8
Time of Day (½ day, ½ night), EPC = 1.1
High Experience/Training, EPC = 0.8
Very Efficient Crew Collaboration, EPC = 0.5
NARA Task Execution A4: Judgment needed for appropriate procedure to be followed, based on interpretation of a situation that is covered by training
Ensuring Correct Plant Status B3: Set system status as part of routine operations using strict administratively controlled procedures
N/A
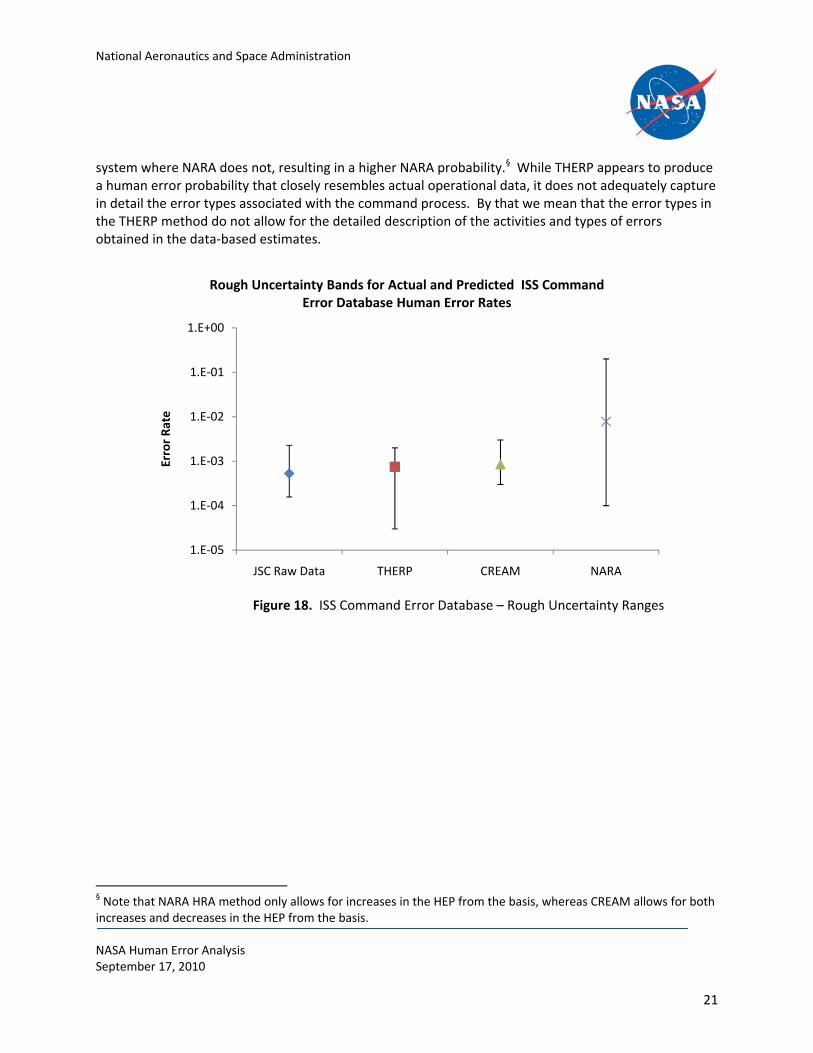
Figure 17. Error Types Mapped to ISS Command Process For CREAM, the dominant error modes were “Execution Error: action out of sequence” and “Observation Error: observation not made.” For NARA, the dominant error modes were “Task Execution A4: Judgment needed for appropriate procedure to be followed, based on interpretation of a situation which is covered by training” (20%) and “Ensuring Correct Plant Status B3: Set system status as part of routine operations using strict administratively controlled procedures” (80%). For THERP, the dominant error mode was “Errors of Commission in operating manual controls [Table 20‐12 (2,4)]: Select wrong control on a panel from an array of similar‐appearing controls.” This error was made in situations where 10% of the commands were estimated using the drop‐down menu, which corresponds to the control “indentified by labels only,” and 90% using the available GUI, which corresponds to the control being “part of a well‐defined mimic layout.” It should be noted that, in the command process, a significant error contributor is the failure to notice that the system is in a certain configuration and accounting for that difference when applying the procedures. There is no Table in THERP that adequately accounts for this. Figure 18 provides a comparison between the data‐based error rate obtained by ISS operational experiences and the HEPs produced by the three HRA methods. It should be noted that this HEP comparison was not performed as a formal validation of the HRA methods, but rather to compare the predicted HEPs from the three methods with the data‐based estimate. Both CREAM and NARA estimates provided predictions that were most consistent with the data‐based estimate. However, CREAM allows the analyst to adjustment the probability by weighting controls and characteristics of the
National Aeronautics and Space Administration
NASA Human Error Analysis September 17, 2010
21
system where NARA does not, resulting in a higher NARA probability.§ While THERP appears to produce a human error probability that closely resembles actual operational data, it does not adequately capture in detail the error types associated with the command process. By that we mean that the error types in the THERP method do not allow for the detailed description of the activities and types of errors obtained in the data‐based estimates.
§ Note that NARA HRA method only allows for increases in the HEP from the basis, whereas CREAM allows for both increases and decreases in the HEP from the basis.
1.E‐05
1.E‐04
1.E‐03
1.E‐02
1.E‐01
1.E+00
JSC Raw Data THERP CREAM NARA
Error Rate
Rough Uncertainty Bands for Actual and Predicted ISS Command Error Database Human Error Rates
Figure 18. ISS Command Error Database – Rough Uncertainty Ranges
National Aeronautics and Space Administration
NASA Human Error Analysis September 17, 2010
22
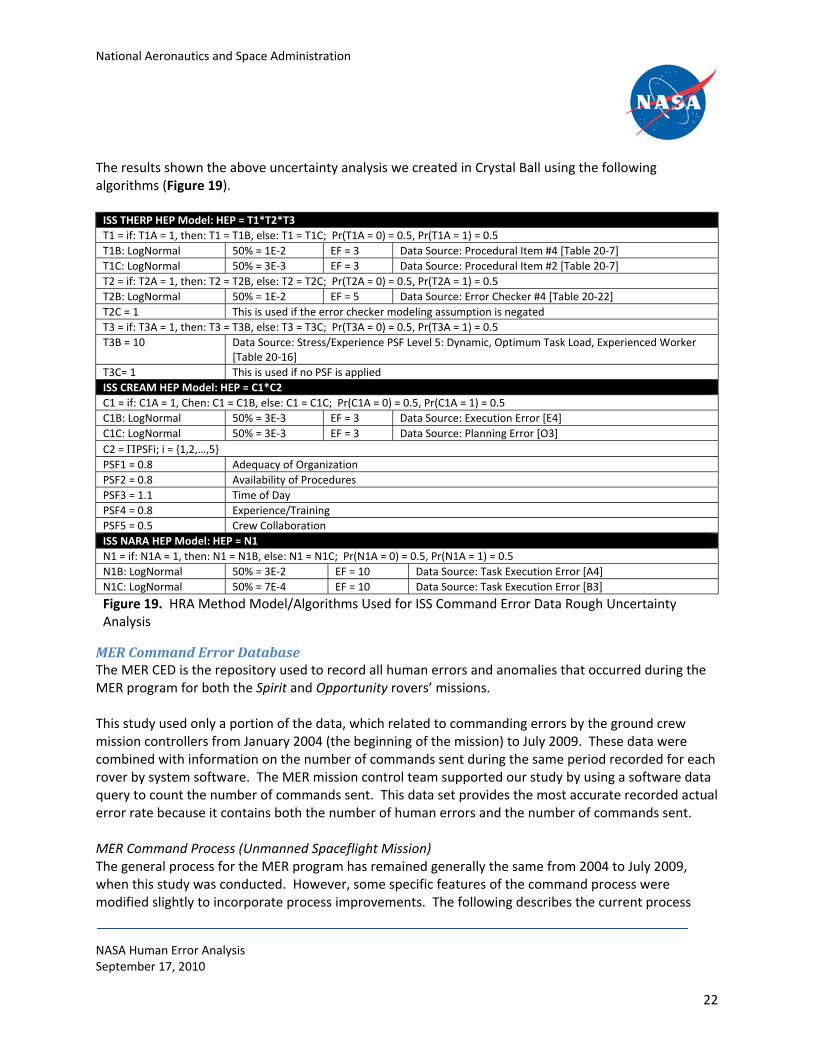
The results shown the above uncertainty analysis we created in Crystal Ball using the following algorithms (Figure 19). ISS THERP HEP Model: HEP = T1*T2*T3
T1 = if: T1A = 1, then: T1 = T1B, else: T1 = T1C; Pr(T1A = 0) = 0.5, Pr(T1A = 1) = 0.5
T1B: LogNormal 50% = 1E‐2 EF = 3 Data Source: Procedural Item #4 [Table 20‐7]
T1C: LogNormal 50% = 3E‐3 EF = 3 Data Source: Procedural Item #2 [Table 20‐7]
T2 = if: T2A = 1, then: T2 = T2B, else: T2 = T2C; Pr(T2A = 0) = 0.5, Pr(T2A = 1) = 0.5
T2B: LogNormal 50% = 1E‐2 EF = 5 Data Source: Error Checker #4 [Table 20‐22]
T2C = 1 This is used if the error checker modeling assumption is negated
T3 = if: T3A = 1, then: T3 = T3B, else: T3 = T3C; Pr(T3A = 0) = 0.5, Pr(T3A = 1) = 0.5
T3B = 10 Data Source: Stress/Experience PSF Level 5: Dynamic, Optimum Task Load, Experienced Worker [Table 20‐16]
T3C= 1 This is used if no PSF is applied
ISS CREAM HEP Model: HEP = C1*C2
C1 = if: C1A = 1, Chen: C1 = C1B, else: C1 = C1C; Pr(C1A = 0) = 0.5, Pr(C1A = 1) = 0.5
C1B: LogNormal 50% = 3E‐3 EF = 3 Data Source: Execution Error [E4]
C1C: LogNormal 50% = 3E‐3 EF = 3 Data Source: Planning Error [O3]
C2 = PSFi; i = {1,2,…,5}
PSF1 = 0.8 Adequacy of Organization
PSF2 = 0.8 Availability of Procedures
PSF3 = 1.1 Time of Day
PSF4 = 0.8 Experience/Training
PSF5 = 0.5 Crew Collaboration
ISS NARA HEP Model: HEP = N1
N1 = if: N1A = 1, then: N1 = N1B, else: N1 = N1C; Pr(N1A = 0) = 0.5, Pr(N1A = 1) = 0.5
N1B: LogNormal 50% = 3E‐2 EF = 10 Data Source: Task Execution Error [A4]
N1C: LogNormal 50% = 7E‐4 EF = 10 Data Source: Task Execution Error [B3]
Figure 19. HRA Method Model/Algorithms Used for ISS Command Error Data Rough Uncertainty Analysis
MER Command Error Database The MER CED is the repository used to record all human errors and anomalies that occurred during the MER program for both the Spirit and Opportunity rovers’ missions. This study used only a portion of the data, which related to commanding errors by the ground crew mission controllers from January 2004 (the beginning of the mission) to July 2009. These data were combined with information on the number of commands sent during the same period recorded for each rover by system software. The MER mission control team supported our study by using a software data query to count the number of commands sent. This data set provides the most accurate recorded actual error rate because it contains both the number of human errors and the number of commands sent. MER Command Process (Unmanned Spaceflight Mission) The general process for the MER program has remained generally the same from 2004 to July 2009, when this study was conducted. However, some specific features of the command process were modified slightly to incorporate process improvements. The following describes the current process
National Aeronautics and Space Administration
NASA Human Error Analysis September 17, 2010
23
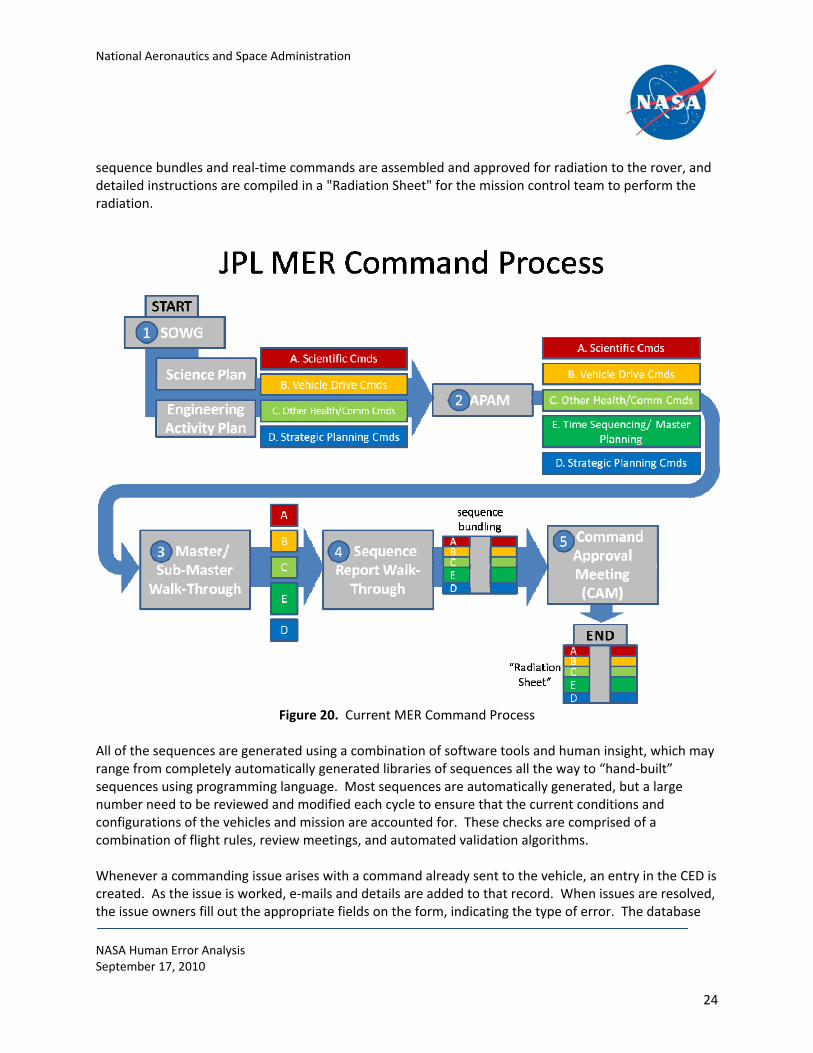
(see Figure 20). Commands are developed in an integrated iterative process by multiple teams working in parallel. The teams are fluid, but can generally be defined as science commands, vehicle drive commands, health and communication commands, master sequence planning, and strategic commands. The process also has five “gateway” meetings at which critical decisions and changes about the command sequences are discussed. First, after the downlink from the previous Sol**, the teams begin interpreting the data and convene at the daily tactical planning meeting called the SOWG or the Science Operations Working Group (indicated by the number 1 in the diagram below). The SOWG is the first gateway meeting, at which the team develops the detailed science and engineering activity plan. This is where science makes their science activity requests (e.g., driving, using the robotic arm, imaging, etc.). Team members required for command sequence creation are physically present at the meeting and many begin working during the meeting on their command sequences. In April 2004, the MER program transitioned to distributed (remote) operations where scientific members of the team began to dial‐in via telecom, rather than be physically present for the meetings. After the meeting, the teams begin building their activity plans using libraries of previously generated commands and software tool kits created by the program. The next gateway is the Activity Plan Approval Meeting (APAM – number 2 in the diagram) where the integrated (science and engineering) activities are time‐ordered, de‐conflicted and resource analyzed (power, data, duration, etc.). An animation of the rover (mechanical) activities (driving, arm movement) is reviewed at this meeting. Activities that do not fit are removed at this point. Beyond this point, only changes that are necessary to "make play" (e.g., rover health and safety), not "make better,” are allowed.†† After the activity plan is reviewed, any changes are incorporated into the sequences and all of the sequences are integrated into a Master Sequence. Next is the "Master/Sub‐master (sequence) Walk‐through" (number 3 in the diagram). Here all spacecraft sequences are reviewed, with most sequences being reviewed line‐by‐line (reused sequences typically do not get reviewed again). A line‐by‐line animation of the rover's mechanical actions is shown concurrently during the review. Small changes to timing or command ordering can be made at this point. The next gateway is the "Sequence Report Walk‐through" (number 4 in the diagram). At this point, all sequences have been run through various tools for modeling, limit checking, and flight rule checking, and detailed timing for each command has been established. Any errors or warnings are reviewed and investigated as necessary, and one more line‐by‐line review is performed. If all sequences pass this step, they are ready to be bundled together in a sequence load for the rover. The teams modify and complete their sequences and then have a final review of the planned sequences. In this final review, called the "Command Approval Meeting" (CAM – number 5 in the diagram), all
** Sols are the Martian equivalent of days, but due to the differences in duration between Earth and Mars days, the “daily” cycle is offset by 40 minutes each day; 1 Mars day = 1.0275 Earth days. †† The animations are not meant to be detailed verifications of the sequences, but rather general high‐level checks of integrated activities among many sequence teams; whereas the later checks are reviews of detailed sequences.
National Aeronautics and Space Administration
NASA Human Error Analysis September 17, 2010
24
sequence bundles and real‐time commands are assembled and approved for radiation to the rover, and detailed instructions are compiled in a "Radiation Sheet" for the mission control team to perform the radiation.
Figure 20. Current MER Command Process
All of the sequences are generated using a combination of software tools and human insight, which may range from completely automatically generated libraries of sequences all the way to “hand‐built” sequences using programming language. Most sequences are automatically generated, but a large number need to be reviewed and modified each cycle to ensure that the current conditions and configurations of the vehicles and mission are accounted for. These checks are comprised of a combination of flight rules, review meetings, and automated validation algorithms. Whenever a commanding issue arises with a command already sent to the vehicle, an entry in the CED is created. As the issue is worked, e‐mails and details are added to that record. When issues are resolved, the issue owners fill out the appropriate fields on the form, indicating the type of error. The database
National Aeronautics and Space Administration
NASA Human Error Analysis September 17, 2010
25
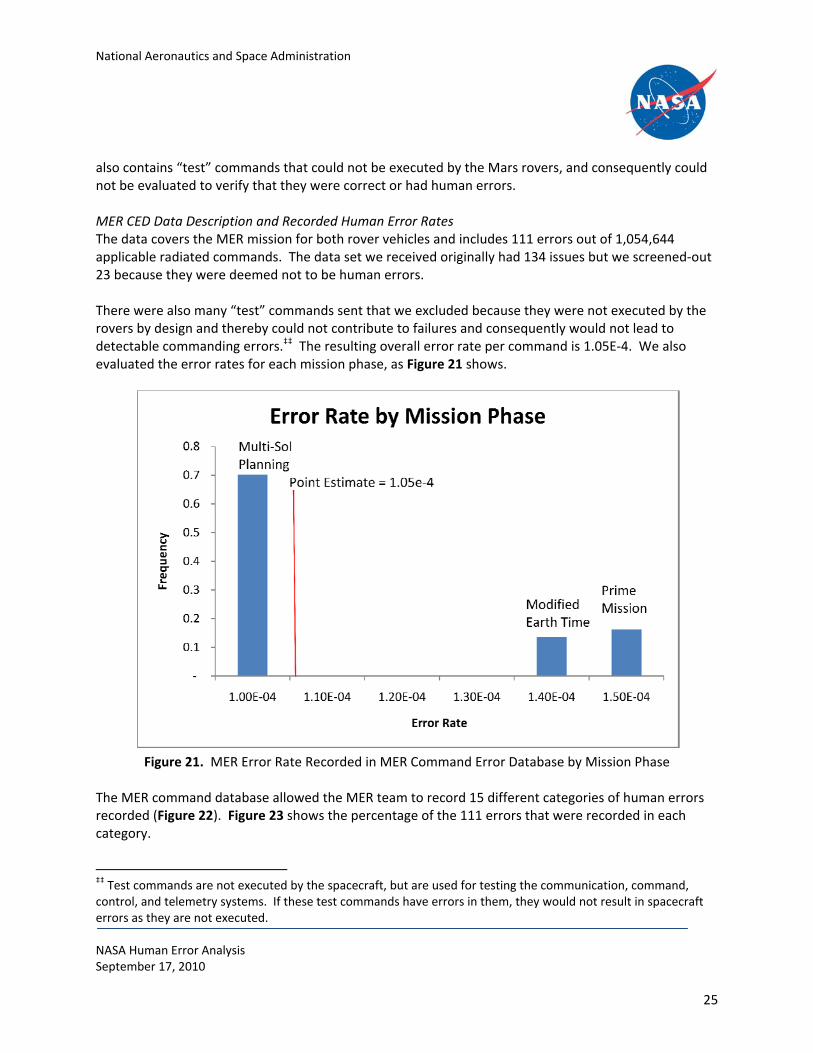
also contains “test” commands that could not be executed by the Mars rovers, and consequently could not be evaluated to verify that they were correct or had human errors. MER CED Data Description and Recorded Human Error Rates The data covers the MER mission for both rover vehicles and includes 111 errors out of 1,054,644 applicable radiated commands. The data set we received originally had 134 issues but we screened‐out 23 because they were deemed not to be human errors. There were also many “test” commands sent that we excluded because they were not executed by the rovers by design and thereby could not contribute to failures and consequently would not lead to detectable commanding errors.‡‡ The resulting overall error rate per command is 1.05E‐4. We also evaluated the error rates for each mission phase, as Figure 21 shows.
Figure 21. MER Error Rate Recorded in MER Command Error Database by Mission Phase
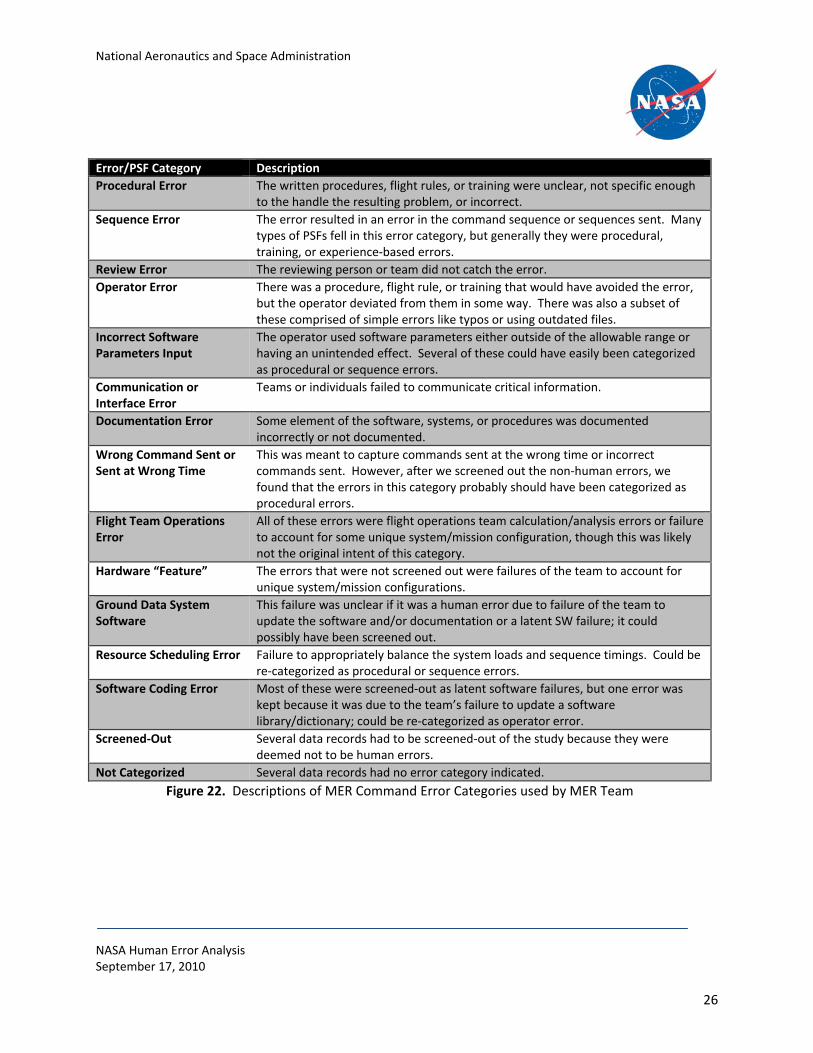
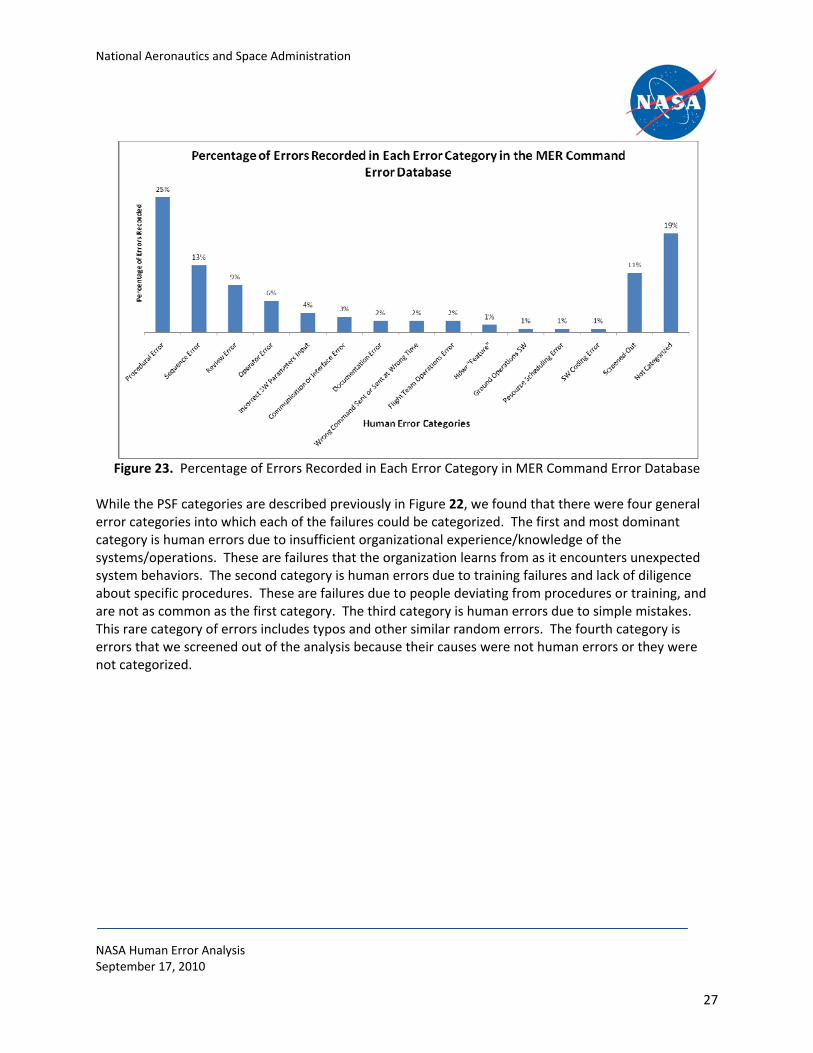
The MER command database allowed the MER team to record 15 different categories of human errors recorded (Figure 22). Figure 23 shows the percentage of the 111 errors that were recorded in each category.
‡‡ Test commands are not executed by the spacecraft, but are used for testing the communication, command, control, and telemetry systems. If these test commands have errors in them, they would not result in spacecraft errors as they are not executed.
National Aeronautics and Space Administration
NASA Human Error Analysis September 17, 2010
26
Error/PSF Category Description
Procedural Error The written procedures, flight rules, or training were unclear, not specific enough to the handle the resulting problem, or incorrect.
Sequence Error The error resulted in an error in the command sequence or sequences sent. Many types of PSFs fell in this error category, but generally they were procedural, training, or experience‐based errors.
Review Error The reviewing person or team did not catch the error.
Operator Error There was a procedure, flight rule, or training that would have avoided the error, but the operator deviated from them in some way. There was also a subset of these comprised of simple errors like typos or using outdated files.
Incorrect Software Parameters Input
The operator used software parameters either outside of the allowable range or having an unintended effect. Several of these could have easily been categorized as procedural or sequence errors.
Communication or Interface Error
Teams or individuals failed to communicate critical information.
Documentation Error Some element of the software, systems, or procedures was documented incorrectly or not documented.
Wrong Command Sent or Sent at Wrong Time
This was meant to capture commands sent at the wrong time or incorrect commands sent. However, after we screened out the non‐human errors, we found that the errors in this category probably should have been categorized as procedural errors.
Flight Team Operations Error
All of these errors were flight operations team calculation/analysis errors or failure to account for some unique system/mission configuration, though this was likely not the original intent of this category.
Hardware “Feature” The errors that were not screened out were failures of the team to account for unique system/mission configurations.
Ground Data System Software
This failure was unclear if it was a human error due to failure of the team to update the software and/or documentation or a latent SW failure; it could possibly have been screened out.
Resource Scheduling Error Failure to appropriately balance the system loads and sequence timings. Could be re‐categorized as procedural or sequence errors.
Software Coding Error Most of these were screened‐out as latent software failures, but one error was kept because it was due to the team’s failure to update a software library/dictionary; could be re‐categorized as operator error.
Screened‐Out Several data records had to be screened‐out of the study because they were deemed not to be human errors.
Not Categorized Several data records had no error category indicated.
Figure 22. Descriptions of MER Command Error Categories used by MER Team
National Aeronautics and Space Administration
NASA Human Error Analysis September 17, 2010
27
Figure 23. Percentage of Errors Recorded in Each Error Category in MER Command Error Database
While the PSF categories are described previously in Figure 22, we found that there were four general error categories into which each of the failures could be categorized. The first and most dominant category is human errors due to insufficient organizational experience/knowledge of the systems/operations. These are failures that the organization learns from as it encounters unexpected system behaviors. The second category is human errors due to training failures and lack of diligence about specific procedures. These are failures due to people deviating from procedures or training, and are not as common as the first category. The third category is human errors due to simple mistakes. This rare category of errors includes typos and other similar random errors. The fourth category is errors that we screened out of the analysis because their causes were not human errors or they were not categorized.
National Aeronautics and Space Administration
NASA Human Error Analysis September 17, 2010
28
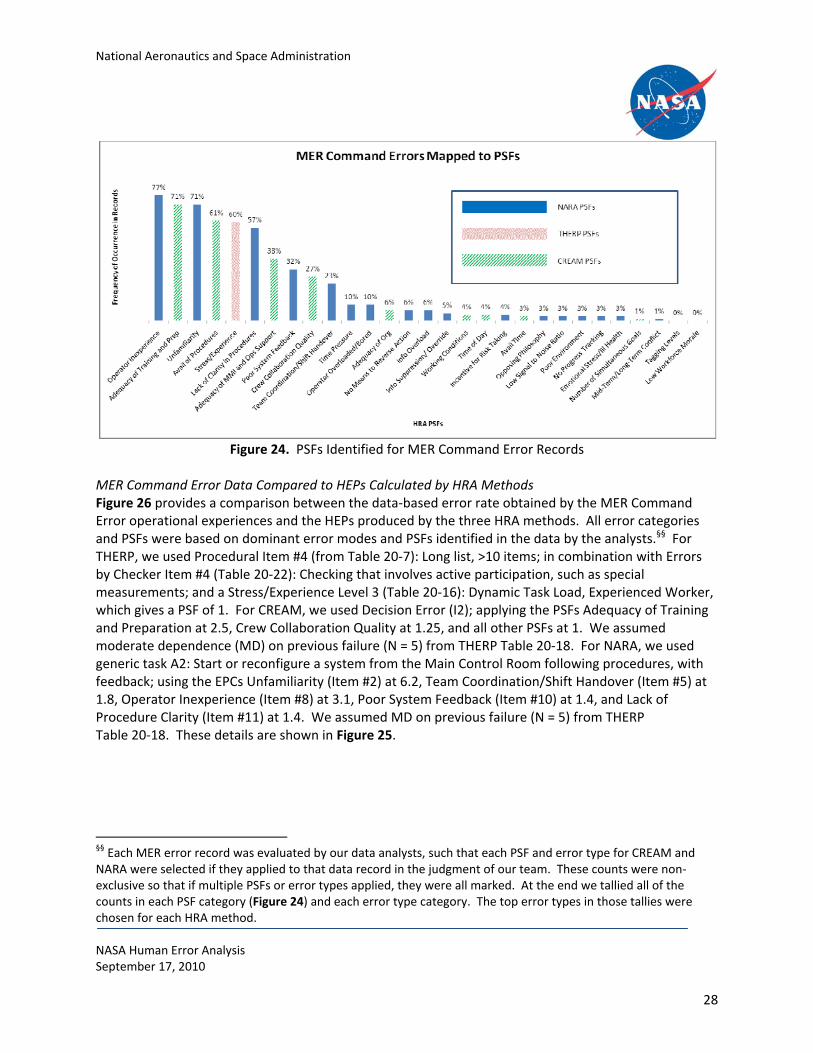
Figure 24. PSFs Identified for MER Command Error Records
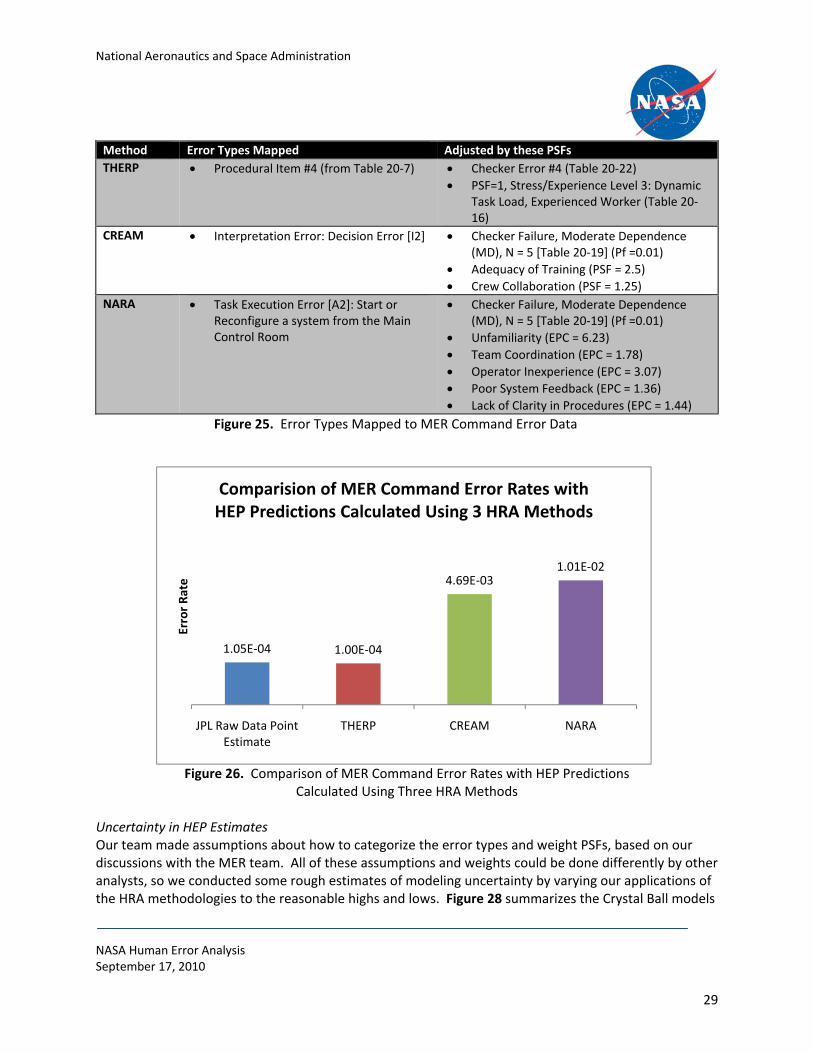
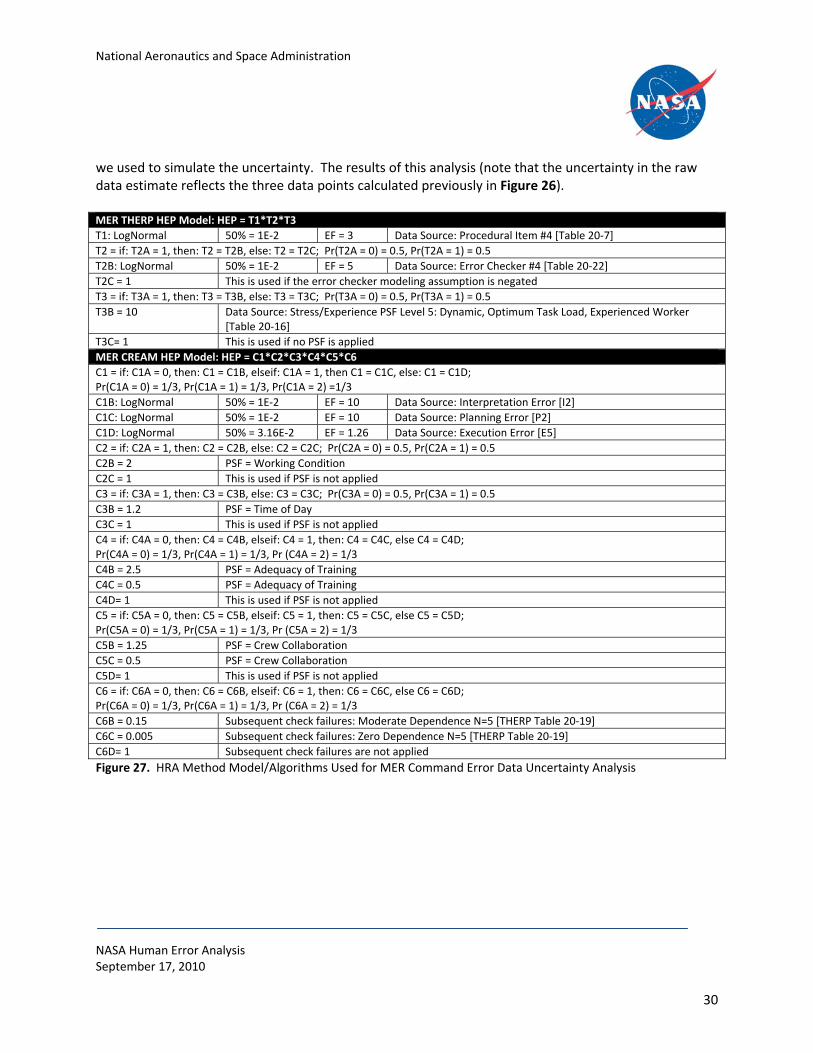
MER Command Error Data Compared to HEPs Calculated by HRA Methods Figure 26 provides a comparison between the data‐based error rate obtained by the MER Command Error operational experiences and the HEPs produced by the three HRA methods. All error categories and PSFs were based on dominant error modes and PSFs identified in the data by the analysts.§§ For THERP, we used Procedural Item #4 (from Table 20‐7): Long list, >10 items; in combination with Errors by Checker Item #4 (Table 20‐22): Checking that involves active participation, such as special measurements; and a Stress/Experience Level 3 (Table 20‐16): Dynamic Task Load, Experienced Worker, which gives a PSF of 1. For CREAM, we used Decision Error (I2); applying the PSFs Adequacy of Training and Preparation at 2.5, Crew Collaboration Quality at 1.25, and all other PSFs at 1. We assumed moderate dependence (MD) on previous failure (N = 5) from THERP Table 20‐18. For NARA, we used generic task A2: Start or reconfigure a system from the Main Control Room following procedures, with feedback; using the EPCs Unfamiliarity (Item #2) at 6.2, Team Coordination/Shift Handover (Item #5) at 1.8, Operator Inexperience (Item #8) at 3.1, Poor System Feedback (Item #10) at 1.4, and Lack of Procedure Clarity (Item #11) at 1.4. We assumed MD on previous failure (N = 5) from THERP Table 20‐18. These details are shown in Figure 25.
§§ Each MER error record was evaluated by our data analysts, such that each PSF and error type for CREAM and NARA were selected if they applied to that data record in the judgment of our team. These counts were non‐exclusive so that if multiple PSFs or error types applied, they were all marked. At the end we tallied all of the counts in each PSF category (Figure 24) and each error type category. The top error types in those tallies were chosen for each HRA method.
National Aeronautics and Space Administration
NASA Human Error Analysis September 17, 2010
29
Method Error Types Mapped Adjusted by these PSFs
THERP Procedural Item #4 (from Table 20‐7) Checker Error #4 (Table 20‐22)
PSF=1, Stress/Experience Level 3: Dynamic Task Load, Experienced Worker (Table 20‐16)
CREAM Interpretation Error: Decision Error [I2] Checker Failure, Moderate Dependence (MD), N = 5 [Table 20‐19] (Pf =0.01)
Adequacy of Training (PSF = 2.5)
Crew Collaboration (PSF = 1.25)
NARA Task Execution Error [A2]: Start or Reconfigure a system from the Main Control Room
Checker Failure, Moderate Dependence (MD), N = 5 [Table 20‐19] (Pf =0.01)
Unfamiliarity (EPC = 6.23)
Team Coordination (EPC = 1.78)
Operator Inexperience (EPC = 3.07)
Poor System Feedback (EPC = 1.36)
Lack of Clarity in Procedures (EPC = 1.44)
Figure 25. Error Types Mapped to MER Command Error Data
Figure 26. Comparison of MER Command Error Rates with HEP Predictions Calculated Using Three HRA Methods
Uncertainty in HEP Estimates Our team made assumptions about how to categorize the error types and weight PSFs, based on our discussions with the MER team. All of these assumptions and weights could be done differently by other analysts, so we conducted some rough estimates of modeling uncertainty by varying our applications of the HRA methodologies to the reasonable highs and lows. Figure 28 summarizes the Crystal Ball models
1.05E‐04 1.00E‐04
4.69E‐031.01E‐02
JPL Raw Data Point Estimate
THERP CREAM NARA
Error Rate
Comparision of MER Command Error Rates with HEP Predictions Calculated Using 3 HRA Methods
National Aeronautics and Space Administration
NASA Human Error Analysis September 17, 2010
30
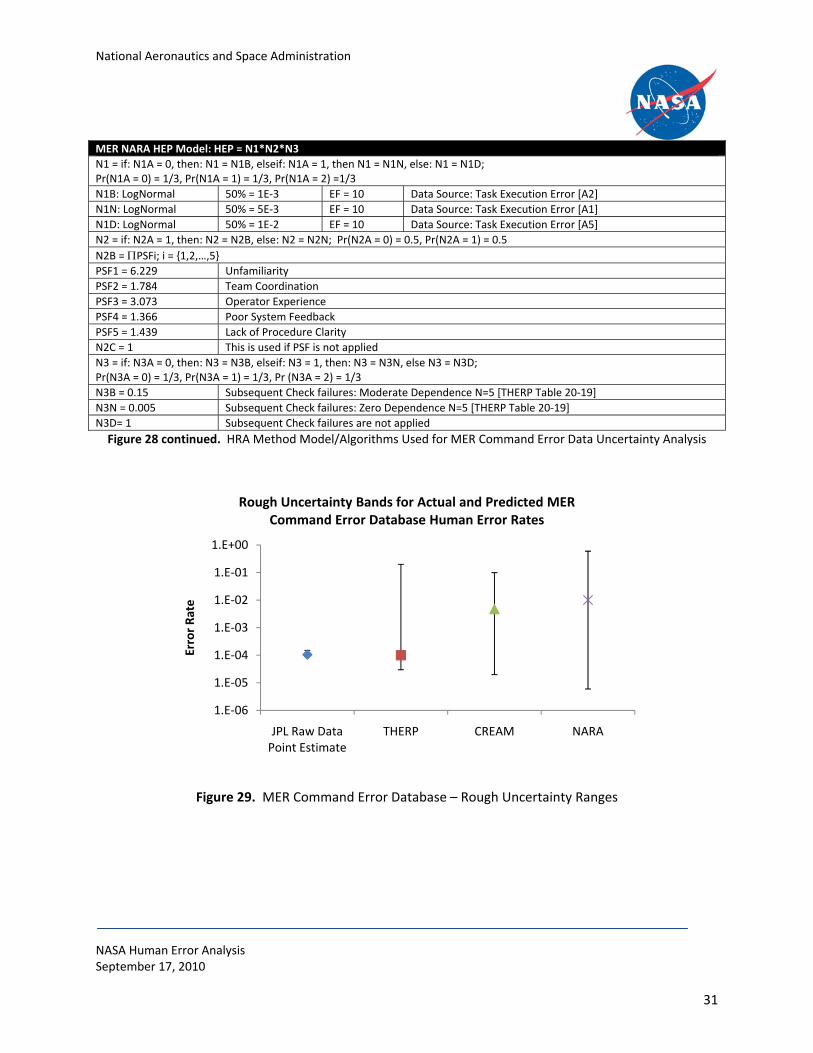
we used to simulate the uncertainty. The results of this analysis (note that the uncertainty in the raw data estimate reflects the three data points calculated previously in Figure 26). MER THERP HEP Model: HEP = T1*T2*T3
T1: LogNormal 50% = 1E‐2 EF = 3 Data Source: Procedural Item #4 [Table 20‐7]
T2 = if: T2A = 1, then: T2 = T2B, else: T2 = T2C; Pr(T2A = 0) = 0.5, Pr(T2A = 1) = 0.5
T2B: LogNormal 50% = 1E‐2 EF = 5 Data Source: Error Checker #4 [Table 20‐22]
T2C = 1 This is used if the error checker modeling assumption is negated
T3 = if: T3A = 1, then: T3 = T3B, else: T3 = T3C; Pr(T3A = 0) = 0.5, Pr(T3A = 1) = 0.5
T3B = 10 Data Source: Stress/Experience PSF Level 5: Dynamic, Optimum Task Load, Experienced Worker [Table 20‐16]
T3C= 1 This is used if no PSF is applied
MER CREAM HEP Model: HEP = C1*C2*C3*C4*C5*C6
C1 = if: C1A = 0, then: C1 = C1B, elseif: C1A = 1, then C1 = C1C, else: C1 = C1D; Pr(C1A = 0) = 1/3, Pr(C1A = 1) = 1/3, Pr(C1A = 2) =1/3
C1B: LogNormal 50% = 1E‐2 EF = 10 Data Source: Interpretation Error [I2]
C1C: LogNormal 50% = 1E‐2 EF = 10 Data Source: Planning Error [P2]
C1D: LogNormal 50% = 3.16E‐2 EF = 1.26 Data Source: Execution Error [E5]
C2 = if: C2A = 1, then: C2 = C2B, else: C2 = C2C; Pr(C2A = 0) = 0.5, Pr(C2A = 1) = 0.5
C2B = 2 PSF = Working Condition
C2C = 1 This is used if PSF is not applied
C3 = if: C3A = 1, then: C3 = C3B, else: C3 = C3C; Pr(C3A = 0) = 0.5, Pr(C3A = 1) = 0.5
C3B = 1.2 PSF = Time of Day
C3C = 1 This is used if PSF is not applied
C4 = if: C4A = 0, then: C4 = C4B, elseif: C4 = 1, then: C4 = C4C, else C4 = C4D; Pr(C4A = 0) = 1/3, Pr(C4A = 1) = 1/3, Pr (C4A = 2) = 1/3
C4B = 2.5 PSF = Adequacy of Training
C4C = 0.5 PSF = Adequacy of Training
C4D= 1 This is used if PSF is not applied
C5 = if: C5A = 0, then: C5 = C5B, elseif: C5 = 1, then: C5 = C5C, else C5 = C5D; Pr(C5A = 0) = 1/3, Pr(C5A = 1) = 1/3, Pr (C5A = 2) = 1/3
C5B = 1.25 PSF = Crew Collaboration
C5C = 0.5 PSF = Crew Collaboration
C5D= 1 This is used if PSF is not applied
C6 = if: C6A = 0, then: C6 = C6B, elseif: C6 = 1, then: C6 = C6C, else C6 = C6D; Pr(C6A = 0) = 1/3, Pr(C6A = 1) = 1/3, Pr (C6A = 2) = 1/3
C6B = 0.15 Subsequent check failures: Moderate Dependence N=5 [THERP Table 20‐19]
C6C = 0.005 Subsequent check failures: Zero Dependence N=5 [THERP Table 20‐19]
C6D= 1 Subsequent check failures are not applied
Figure 27. HRA Method Model/Algorithms Used for MER Command Error Data Uncertainty Analysis
National Aeronautics and Space Administration
NASA Human Error Analysis September 17, 2010
31
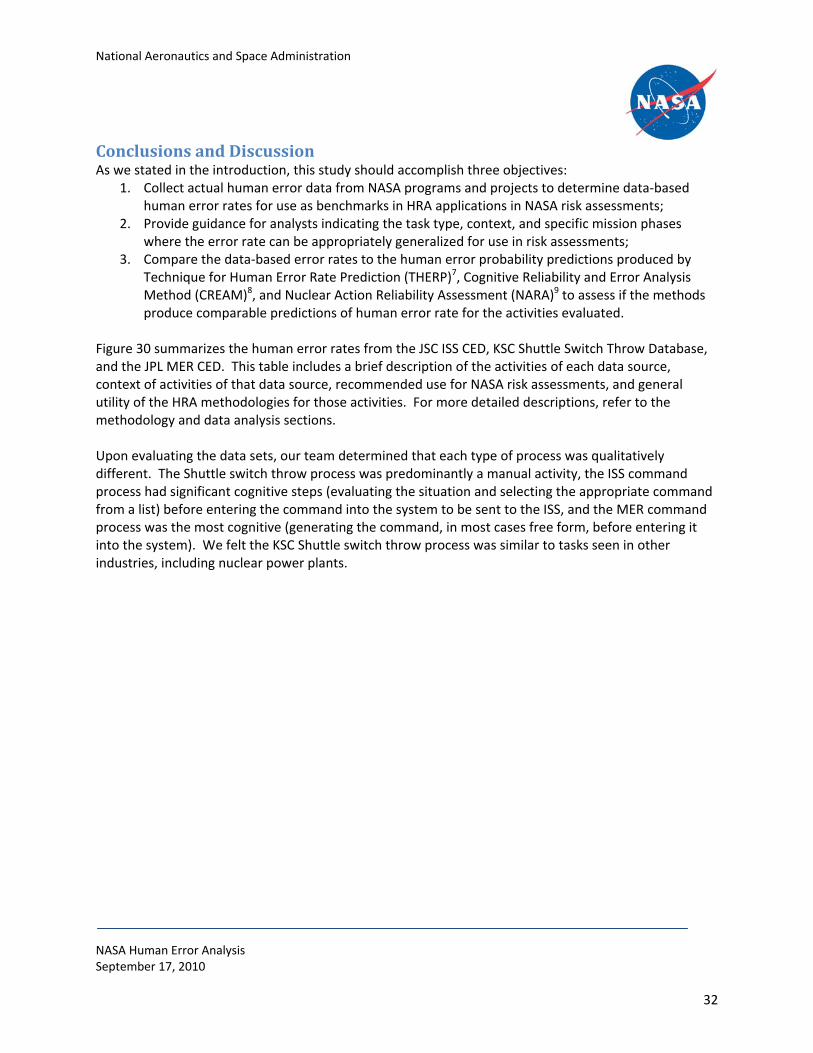
MER NARA HEP Model: HEP = N1*N2*N3
N1 = if: N1A = 0, then: N1 = N1B, elseif: N1A = 1, then N1 = N1N, else: N1 = N1D; Pr(N1A = 0) = 1/3, Pr(N1A = 1) = 1/3, Pr(N1A = 2) =1/3
N1B: LogNormal 50% = 1E‐3 EF = 10 Data Source: Task Execution Error [A2]
N1N: LogNormal 50% = 5E‐3 EF = 10 Data Source: Task Execution Error [A1]
N1D: LogNormal 50% = 1E‐2 EF = 10 Data Source: Task Execution Error [A5]
N2 = if: N2A = 1, then: N2 = N2B, else: N2 = N2N; Pr(N2A = 0) = 0.5, Pr(N2A = 1) = 0.5
N2B = PSFi; i = {1,2,…,5}
PSF1 = 6.229 Unfamiliarity
PSF2 = 1.784 Team Coordination
PSF3 = 3.073 Operator Experience
PSF4 = 1.366 Poor System Feedback
PSF5 = 1.439 Lack of Procedure Clarity
N2C = 1 This is used if PSF is not applied
N3 = if: N3A = 0, then: N3 = N3B, elseif: N3 = 1, then: N3 = N3N, else N3 = N3D; Pr(N3A = 0) = 1/3, Pr(N3A = 1) = 1/3, Pr (N3A = 2) = 1/3
N3B = 0.15 Subsequent Check failures: Moderate Dependence N=5 [THERP Table 20‐19]
N3N = 0.005 Subsequent Check failures: Zero Dependence N=5 [THERP Table 20‐19]
N3D= 1 Subsequent Check failures are not applied
Figure 28 continued. HRA Method Model/Algorithms Used for MER Command Error Data Uncertainty Analysis
Figure 29. MER Command Error Database – Rough Uncertainty Ranges
1.E‐06
1.E‐05
1.E‐04
1.E‐03
1.E‐02
1.E‐01
1.E+00
JPL Raw Data Point Estimate
THERP CREAM NARA
Error Rate
Rough Uncertainty Bands for Actual and Predicted MER Command Error Database Human Error Rates
National Aeronautics and Space Administration
NASA Human Error Analysis September 17, 2010
32
Conclusions and Discussion As we stated in the introduction, this study should accomplish three objectives:
1. Collect actual human error data from NASA programs and projects to determine data‐based human error rates for use as benchmarks in HRA applications in NASA risk assessments;
2. Provide guidance for analysts indicating the task type, context, and specific mission phases where the error rate can be appropriately generalized for use in risk assessments;
3. Compare the data‐based error rates to the human error probability predictions produced by Technique for Human Error Rate Prediction (THERP)7, Cognitive Reliability and Error Analysis Method (CREAM)8, and Nuclear Action Reliability Assessment (NARA)9 to assess if the methods produce comparable predictions of human error rate for the activities evaluated.
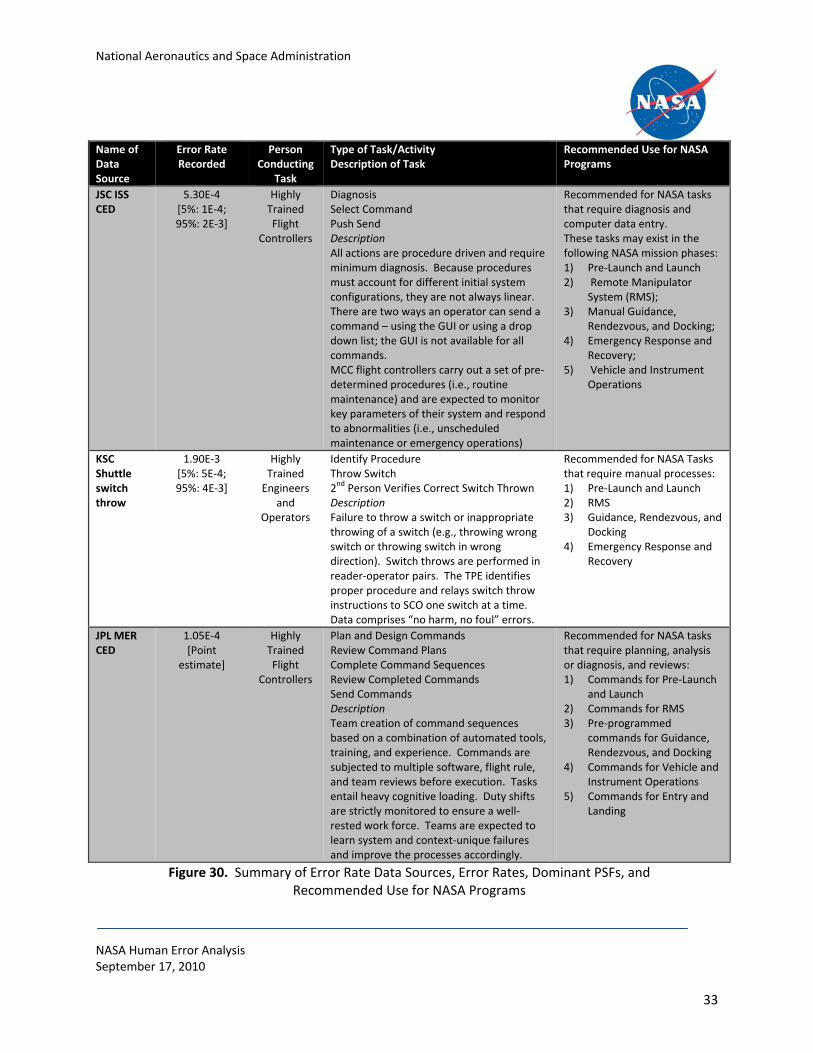
Figure 30 summarizes the human error rates from the JSC ISS CED, KSC Shuttle Switch Throw Database, and the JPL MER CED. This table includes a brief description of the activities of each data source, context of activities of that data source, recommended use for NASA risk assessments, and general utility of the HRA methodologies for those activities. For more detailed descriptions, refer to the methodology and data analysis sections. Upon evaluating the data sets, our team determined that each type of process was qualitatively different. The Shuttle switch throw process was predominantly a manual activity, the ISS command process had significant cognitive steps (evaluating the situation and selecting the appropriate command from a list) before entering the command into the system to be sent to the ISS, and the MER command process was the most cognitive (generating the command, in most cases free form, before entering it into the system). We felt the KSC Shuttle switch throw process was similar to tasks seen in other industries, including nuclear power plants.
National Aeronautics and Space Administration
NASA Human Error Analysis September 17, 2010
33
Name of Data Source
Error Rate Recorded
Person Conducting
Task
Type of Task/Activity Description of Task
Recommended Use for NASA Programs
JSC ISS CED
5.30E‐4 [5%: 1E‐4; 95%: 2E‐3]
Highly Trained Flight
Controllers
Diagnosis Select Command Push Send Description All actions are procedure driven and require minimum diagnosis. Because procedures must account for different initial system configurations, they are not always linear. There are two ways an operator can send a command – using the GUI or using a drop down list; the GUI is not available for all commands. MCC flight controllers carry out a set of pre‐determined procedures (i.e., routine maintenance) and are expected to monitor key parameters of their system and respond to abnormalities (i.e., unscheduled maintenance or emergency operations)
Recommended for NASA tasks that require diagnosis and computer data entry. These tasks may exist in the following NASA mission phases: 1) Pre‐Launch and Launch 2) Remote Manipulator
System (RMS); 3) Manual Guidance,
Rendezvous, and Docking; 4) Emergency Response and
Recovery; 5) Vehicle and Instrument
Operations
KSC Shuttle switch throw
1.90E‐3 [5%: 5E‐4; 95%: 4E‐3]
Highly Trained Engineers
and Operators
Identify Procedure Throw Switch 2nd Person Verifies Correct Switch Thrown Description Failure to throw a switch or inappropriate throwing of a switch (e.g., throwing wrong switch or throwing switch in wrong direction). Switch throws are performed in reader‐operator pairs. The TPE identifies proper procedure and relays switch throw instructions to SCO one switch at a time. Data comprises “no harm, no foul” errors.
Recommended for NASA Tasks that require manual processes: 1) Pre‐Launch and Launch 2) RMS 3) Guidance, Rendezvous, and
Docking 4) Emergency Response and
Recovery
JPL MER CED
1.05E‐4 [Point
estimate]
Highly Trained Flight
Controllers
Plan and Design Commands Review Command Plans Complete Command Sequences Review Completed Commands Send Commands Description Team creation of command sequences based on a combination of automated tools, training, and experience. Commands are subjected to multiple software, flight rule, and team reviews before execution. Tasks entail heavy cognitive loading. Duty shifts are strictly monitored to ensure a well‐rested work force. Teams are expected to learn system and context‐unique failures and improve the processes accordingly.
Recommended for NASA tasks that require planning, analysis or diagnosis, and reviews: 1) Commands for Pre‐Launch
and Launch 2) Commands for RMS 3) Pre‐programmed
commands for Guidance, Rendezvous, and Docking
4) Commands for Vehicle and Instrument Operations
5) Commands for Entry and Landing
Figure 30. Summary of Error Rate Data Sources, Error Rates, Dominant PSFs, and Recommended Use for NASA Programs
National Aeronautics and Space Administration
NASA Human Error Analysis September 17, 2010
34
How Well the Three Methods Allowed Analysis of Actual Data Set We found that the three HRA methods (THERP, CREAM, and NARA) included types of activities, error modes, and PSFs that were similar to the actual types of activities, error modes, and PSFs found in the Shuttle switch throw process, making these methods more likely to produce applicable HEP estimates for this process. The ISS process had both cognitive and manual elements to the task. Our team found that both CREAM and NARA provided qualitative descriptions (types of activities, error modes, and PSFs) and quantitative estimates that were reasonable descriptions of the process and data. However, CREAM allows an adjustment for the exceptional controls and characteristics of the system (such as very efficient organizations and advantageous working conditions) that NARA does not, resulting in a higher NARA human error rate. While THERP appears consistent quantitatively, it does not adequately capture in detail the error modes. The MER process was highly analytical, with more cognitive activities in the task than the other two processes. Because the task had multiple cognitive steps, our team found it difficult to correctly model the task activity using the three HRA activities described. There were two primary reasons for this difficulty. First, the descriptions of the errors in all three HRA methods never seemed to adequately describe the types of activities or error modes. Second, the iterative command sequence development and multiple layers of automated and human reviews had to be explicitly accounted for by adding events (such as moderately dependent subsequent failures from THERP table 20‐18). This type of explicit modeling was not necessary in the other data sets and in a sense is a sort of mini PRA model. Given that the application of special probabilities or models is highly subjective and that it is typically unnecessary to apply them in HRA methods, the team did not feel comfortable with this approach. The subjective modeling impact on the error rate is evident in the large uncertainty ranges in the HRA methods in Figure 29.*** Therefore, it is the opinion of this team that highly cognitive and analytical procedures such as the MER Command sequence development process are inadequately modeled by current HRA techniques. Other techniques such as software reliability methodologies may provide better analogs to similar activities. Our team found that each HRA method was appropriate for specific types of tasks, and all provided HEP estimates that closely resemble data‐based error rates in manual tasks such as the ISS switch throw task. However, our team found no method was the clear “best method” for all tasks. THERP and NARA do not have error modes that represent the detailed aerospace cognitive tasks and activities, whereas CREAM has more detailed descriptions of these activities. CREAM and NARA required modification to account for team reviews after the initial errors, but the predictions were still somewhat high. More detailed modeling than we did could result in more accurate predictions.
*** While THERP did provide some quantitative estimates in reasonable agreement with the data, our team did not feel that the THERP error modes were well matched to the MER process. We also found that CREAM and NARA had more applicable PSFs than THERP. CREAM provided the best qualitative descriptions (activity types, PSFs, and error modes) of the MER process.
National Aeronautics and Space Administration
NASA Human Error Analysis September 17, 2010
35
For a slightly different view of the HRA method comparison, we created Figure 31, which describes the applicability of the HRA methodologies THERP, CREAM, and NARA††† to the data sets evaluated in this study. For each methodology we have included a short discussion of: (1) the use of PSFs; (2) application of error types; (3) quantitative accuracy and uncertainty; and (4) a recommended use for each. The italic section of each is the best use of that methodology in the estimation of this team. The table surmises that THERP is the best quantitative estimator, CREAM was the most descriptive of the activity qualitative elements, and all three methods describe the KSC Shuttle switch throw data well, both qualitatively and quantitatively.
††† We remind the reader that we did not include SPAR‐H in this study due to resource limitations.
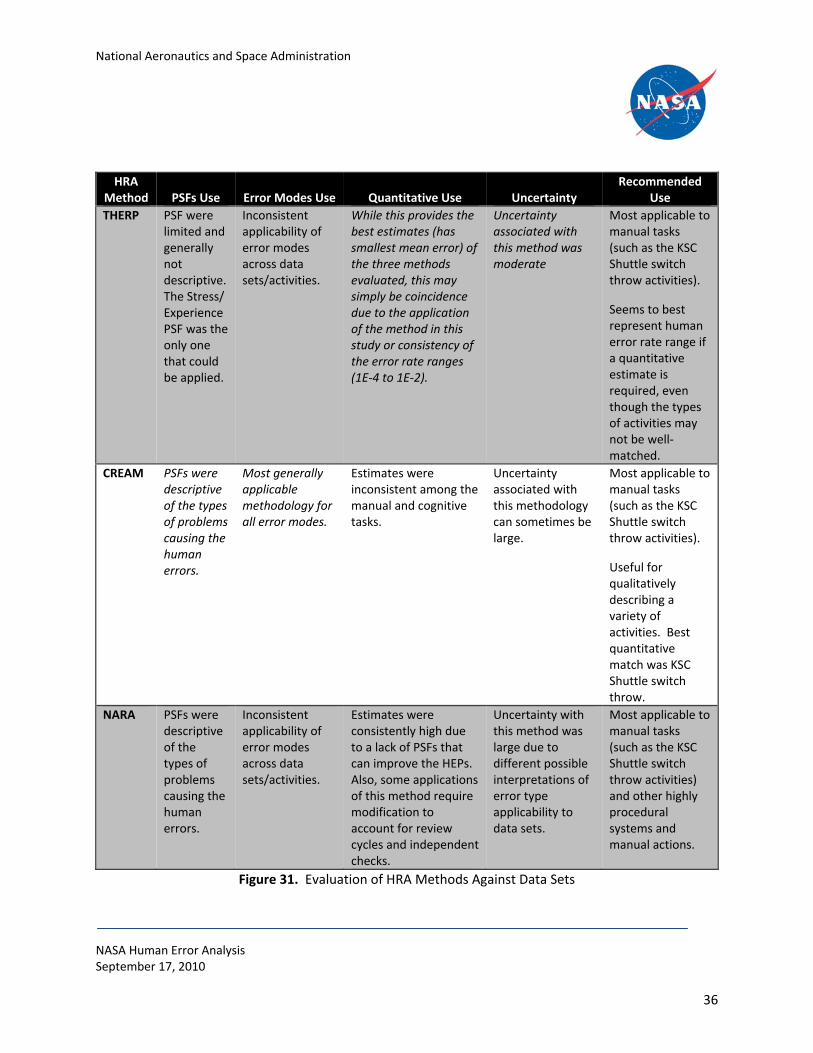
National Aeronautics and Space Administration
NASA Human Error Analysis September 17, 2010
36
Figure 31. Evaluation of HRA Methods Against Data Sets
HRA Method PSFs Use Error Modes Use Quantitative Use Uncertainty
Recommended Use
THERP PSF were limited and generally not descriptive. The Stress/ Experience PSF was the only one that could be applied.
Inconsistent applicability of error modes across data sets/activities.
While this provides the best estimates (has smallest mean error) of the three methods evaluated, this may simply be coincidence due to the application of the method in this study or consistency of the error rate ranges (1E‐4 to 1E‐2).
Uncertainty associated with this method was moderate
Most applicable to manual tasks (such as the KSC Shuttle switch throw activities).
Seems to best represent human error rate range if a quantitative estimate is required, even though the types of activities may not be well‐matched.
CREAM PSFs were descriptive of the types of problems causing the human errors.
Most generally applicable methodology for all error modes.
Estimates were inconsistent among the manual and cognitive tasks.
Uncertainty associated with this methodology can sometimes be large.
Most applicable to manual tasks (such as the KSC Shuttle switch throw activities).
Useful for qualitatively describing a variety of activities. Best quantitative match was KSC Shuttle switch throw.
NARA PSFs were descriptive of the types of problems causing the human errors.
Inconsistent applicability of error modes across data sets/activities.
Estimates were consistently high due to a lack of PSFs that can improve the HEPs. Also, some applications of this method require modification to account for review cycles and independent checks.
Uncertainty with this method was large due to different possible interpretations of error type applicability to data sets.
Most applicable to manual tasks (such as the KSC Shuttle switch throw activities) and other highly procedural systems and manual actions.
National Aeronautics and Space Administration
NASA Human Error Analysis September 17, 2010
37
In summary, our team successfully identified, selected, and collected actual NASA human error data for use in NASA risk assessments. The data collected was from the KSC Shuttle switch throw database, the ISS CED, and JPL MER CED. The human error rates were 1.9x10‐3 for the Shuttle switch throw tasks, 5.3x10‐4 for ISS command error tasks, and 1.05x10‐4 for MER command error tasks. When we compared these data sets and processes against the HRA methods THERP, CREAM, and NARA, we found that the three methods all provided predicted human error probability estimates that were consistent with the data‐based estimates. Both CREAM and NARA allowed the MER command error process to be described in more detail but none of the methods produced an accurate estimate for this cognitive task. Some areas of useful and recommended future research would be: (1) to collect a broader set of data to provide additional data in risk assessment and to help validate the HRA methods, and (2) to expand the analysis to see how well Standard Plant Analysis Risk HRA (SPAR‐H)10 can describe the processes and estimate human error rates.
References 1 NASA. (2008). Agency Risk Management Procedural Requirements. NPR 8000.4. Washington, DC. 2 NASA. (2004). Probabilistic Risk Assessment (PRA): Procedures for NASA Programs and Projects. NPR 8705.5. Washington, DC. 3 Chandler, F. T., Chang, Y. H., Mosleh, A., Marble, J. L., Boring, R. L., & Gertman, D. I. (2006). Human Reliability Analysis Methods: Selection Guidance for NASA. (NASA/OSMA). Washington, DC. 4 Swain, A. D., Guttmann, H. E. (1983). Handbook of Human Reliability Analysis with Emphasis on Nuclear Power Plant Applications. NUREG/CR‐1278. Washington, DC. 5 JSC Safety and Mission Assurance. (2005). Human Reliability Analysis (HRA) Data Report. Space Shuttle Probabilistic Risk Assessment, III(2). Washington, DC. 6 Kirwan, B., Gibson, H., Kennedy, R., Edmunds, J., Cooksley, G., & Umbers, I. (2005). Nuclear Action Reliability Assessment (NARA): A Data‐Based HRA Tool. Safety & Reliability Journal. 25(2). 7 Swain, A. D., Guttmann, H. E. (1983). Handbook of Human Reliability Analysis with Emphasis on Nuclear Power Plant Applications. NUREG/CR‐1278. Washington, DC. 8 JSC Safety and Mission Assurance. (2005). Human Reliability Analysis (HRA) Data Report. Space Shuttle Probabilistic Risk Assessment, III(2). Washington, DC. 9 Kirwan, B., Gibson, H., Kennedy, R., Edmunds, J., Cooksley, G., & Umbers, I. (2005). Nuclear Action Reliability Assessment (NARA): A Data‐Based HRA Tool. Safety & Reliability Journal. 25(2). 10 Gertman, D., Blackman, H., Marble, J., Byers, J., & Smith, C. (2005). The SPAR‐H Human Reliability Analysis Method. NUREG/CR‐6883. Idaho Falls, ID.
Related Documents