NARUC Natural Gas Committee New York City July 17, 2007 David Sweet – Executive Director World Alliance for Decentralized Energy (WADE) Edinburgh, Washington, Edmonton, Beijing

NARUC Natural Gas Committee New York City July 17, 2007 David Sweet – Executive Director World Alliance for Decentralized Energy (WADE) Edinburgh, Washington,
Jan 02, 2016
Welcome message from author
This document is posted to help you gain knowledge. Please leave a comment to let me know what you think about it! Share it to your friends and learn new things together.
Transcript

NARUC Natural Gas Committee
New York CityJuly 17, 2007
David Sweet – Executive DirectorWorld Alliance for Decentralized Energy (WADE)
Edinburgh, Washington, Edmonton, Beijing

2
LNG supply - who knows what the future will bring?

3
Doomsday Scenario
“The world will soon start to run out of conventionally produced oil. If we manage somehow to overcome that shock by shifting the burden to coal and natural gas, the two other primary fossil fuels, life may go on more or less as it has been – until we start to run out of all fossil fuels by the end of this century… Even if human life does go on, civilization as we know it will not survive, unless we can find a way to live without fossil fuels.”
Out of Gas, by David Goodstein

4
A Contrarian Voice “The raw fuels are not running out. The
faster we extract and burn them, the faster we find still more.”
“The cost of energy as we use it has less and less to do with the cost of fuel.”
“The more efficient our technology, the more energy we consume.”
“The competitive advantage in manufacturing is now swinging decisively back toward the United States.”
The Bottomless Well, by Peter Huber and Mark Mills

5
The Oracle on LNG
“If North American natural gas markets are to function with the flexibility exhibited by oil, unlimited access to the vast world reserves of gas is required.”
Alan Greenspan, June 2003

6
Source: BG, ALNG, CMS, University o f Houston (IELE)
LNG Value Chain

7
LNG
Source: WADE based on BP Statistical Review of World Energy2007
2007 Proven World Natural Gas Reserves by Region (181 Trillion Cubic Meters)
8%
8%
41%
35%
4%
4% North America
South America
Europe & Eurasia
Middle East
Africa
Asia Pacific

8

9
LNGU.S. Natural Gas Production, Consumption, and Net Imports, 1960-2030
0
5
10
15
20
25
30
1960 1970 1980 1990 2000 2010 2020 2030
(Tri
llio
n c
ub
ic f
eet)
Consumption
Production
16%
21%
Source: WADE based on EIA World Energy Outlook 2007

10
LNG
Source: WADE based on 2004 Cedigaz data
Global and Projected Natural Gas Liquefaction Capacity
0
20
40
60
80
100
120
140
160
1960 1970 1980 1990 2000 2010
num
ber
of
pla
nts
0
50
100
150
200
250
300
350
400
450
tota
l capacity (
mill
ion t
/year)
cumulative # plants
cumulative # plants (projected)
cumulative capacity
cumulative capacity (projected)
11
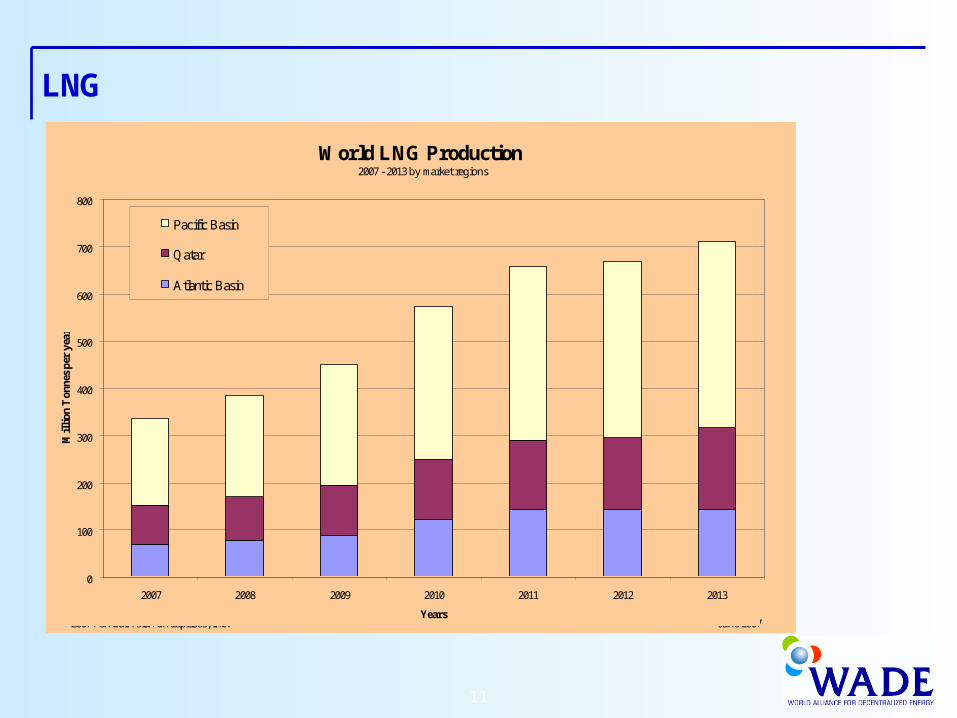
LNG
World LNG Production
0
100
200
300
400
500
600
700
800
2007 2008 2009 2010 2011 2012 2013
Years
Mil
lion
Ton
nes
per
year
Pacific Basin
Qatar
Atlantic Basin
2007 - 2013 by market regions
©2007 Pan EurAsian Enterprises, Inc. June 2007

12
LNG
Source: WADE based on 2004 Cedigaz data
Gas Liquefaction Capacity by Region (2004)
51%
19%
22%
1%
7%
Asia- Oceania
Middle East
Africa
North America
Latin America

13
LNG
Source: WADE based on 2004 Cedigaz data
Projected Gas Liquefaction Capacity by Region (2015)
29%
32%
26%
4%
8%1%
Asia- Oceania
Middle East
Africa
North America
Latin America
Europe

14
LNG
US LNG Imports by Country, 1992-2006 (Billion cubic feet)
0
100
200
300
400
500
600
700
1992 1993 1994 1995 1996 1997 1998 1999 2000 2001 2002 2003 2004 2005 2006
Egypt
Nigeria
Trinidad and Tobago
Others
Algeria
15
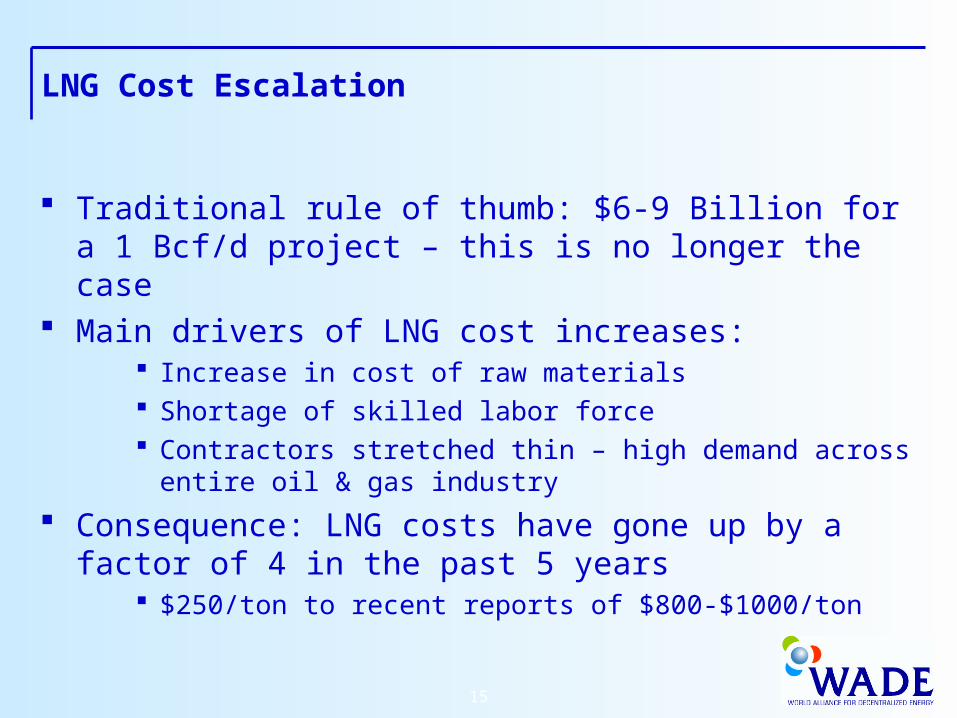
LNG Cost Escalation
Traditional rule of thumb: $6-9 Billion for a 1 Bcf/d project – this is no longer the case
Main drivers of LNG cost increases: Increase in cost of raw materials Shortage of skilled labor force Contractors stretched thin – high demand across entire
oil & gas industry
Consequence: LNG costs have gone up by a factor of 4 in the past 5 years
$250/ton to recent reports of $800-$1000/ton

16
LNG Cost Escalation
1.00
1.25
1.50
1.75
2.00
2.25
2.50
J an-03 J ul-03 J an-04 J ul-04 J an-05 J ul-05 J an-06
Carbon Steel
Stainless Steel
Nickel
Aluminum
Copper
Nickel
Aluminium
Carbon Steel hot-rolled plate
Copper
Raw materials price increases 2003-06(1-Jan-2003 = 1.0)
Sources: MEPS, LME
304 Stainless hot-rolled plate
Source: Poten & Partners

17
LNG Drivers – Energy Price Escalation
Source: WADE based on EIA World Energy Outlook 2007
World Oil Price, 1980-2030 (2005 $US/barrel)
$0
$20
$40
$60
$80
$100
$120
1980 1990 2000 2010 2020 2030
History Projections
High Price
Reference Scenario
Low Price

18
LNG Drivers - NIMBY, BANANA and NOPE

19
LNG Drivers - Climate Change

20
LNG is a Long Term Play
LNG infrastructure will not be built on short-term contracts – long term is the anchor but spot is growing
LNG value chain is a capital intensive investment that requires a sharing of project risks over the asset life
LNG will continue to be a growing component of the supply portfolio

21
NARUC/IOGCC Report on Long Term Contracts (10/85)
State regulators should take a more active role encouraging long-term gas supply, transportation, storage plans
State regulators should minimize second guessing and taking a short-term perspective when evaluating long-term contracts
State regulators should recognize the special features of certain infrastructure projects, specifically … LNG projects, will require substantial revenue guarantees

22
Conclusions
The future can change quickly Global LNG supply is expanding rapidly – for now Costs will continue to escalate Energy price increases and climate change will
drive supply additions Spot trade will grow but long term contracts will
remain the foundation of LNG market Long term investments need long term contracts

Related Documents