Narrative Report Prepared by: Prepared for: Target Market Analysis Newaygo County, MI Strategy Report July 18, 2014

Welcome message from author
This document is posted to help you gain knowledge. Please leave a comment to let me know what you think about it! Share it to your friends and learn new things together.
Transcript
NarrativeReport
Prepared by:
Prepared for:
Target Market Analysis
Newaygo County, MI
Strategy Report
July 18, 2014
Newaygo County, Michigan Market Strategy Report – July 18, 2014
Table of Contents Page
Introduction 1
Executive Summary 2
Market Overview 4
Challenges and Impediments 7
TMA Terminology 8
Market Potential by Study Area 10
Affordability and HUD Income Limits 10
The Target Markets 12
Optimal Values and Prices 15
Detached and Attached Products 16
Unit Sizes in Square Feet 18
Product Labeling 21
TMA Approach and Assumptions 21
Next-Steps 24
Newaygo County, Michigan Market Strategy Report – July 18, 2014
Introduction
This Target Market Analysis (TMA) and report focuses on the strategy and recommendations forNewaygo County, Michigan. It focuses the market potential for attached (renter and owner)housing products in each of five partner communities, including the Village of Hesperia, and theCities of Grant, Newaygo, Fremont, and White Cloud. It also addresses the market potential fordetached, owner-occupied units in the surrounding townships and rural settings throughoutthe balance of Newaygo County.
This Market Strategy Report can serve as a freestanding document for most stakeholders.Readers interested in understanding the more detailed analytic approach can also review twoWorkbooks on the Target Market Analysis and Supply-Demand Analysis. The two workbooksalso include additional narratives on the work methodology, approach, and marketobservations.
Table 1Target Market Analysis – Work Products
Newaygo County, Michigan
Sections # ofDocument Title Type (Exhibits) Pages
Market Strategy Report Main Report A – C 70Supply-Demand Analysis Workbook D – T 160Target Market Analysis Workbook AA – BB 40Stakeholder Engagement Addendum - - - - 40
An addendum is also available that details the results of the stakeholder engagement process(facilitated by Beckett & Raeder, in collaboration with LandUse|USA). A summary of theengagement process is also provided in this Market Strategy Report.
Newaygo County, Michigan Market Strategy Report – 07/18/2014
Page 2
Executive Summary
Based on the household attributes of 10 target markets moving within and into NewaygoCounty each year, there is a maximum market potential of 1,732 units annually among bothrenter-occupied and owner-occupied units (see Exhibit A.1). This figure includes a broad rangeof prices for renter-occupied and owner occupied units, and both detached and attachedproducts.
Attached Units – There is also clear market opportunity for attached housing products,including both renter- and owner-occupied units. The vast majority of need is among theEnduring Hardships target market, with is one of the lowest income groups, and comprisedalmost entirely of renters. Other target markets with smaller market potentials include Dare toDream, Bohemian Groove, Senior Discounts, and Digital Dependents. These target markets areexplained in detail in the following sections of this report.
The magnitude of market potential in attached products is most relevant to the 5 partnercommunities and their downtown districts, and less relevant to the surrounding townships. Themajority of new attached housing products should be targeted at low-to-moderate households.The demand for attached housing products in the upper-income brackets is marginal, and mostwill continue choosing detached houses.
Owner-Occupied, Detached – There is also market support among households with highpropensity for choosing detached houses, and a much higher propensity for owning their home.This market includes two groups:
Low-to-moderate income households – Many of these households will struggle to qualifyfor home loans – particularly for new houses that carry higher premiums. In NewaygoCounty, construction costs per detached house are relatively low, but still high enoughto make the profitability margins too tight for the affordable market (see Exhibit A.10).These market conditions motivate the developers to focus on the moderate-to-bettermarkets. The lower income households are left with few choices other than shufflingamong dated houses; renting houses; and relocating to other markets.
Moderate-to-better income households – These include some dual-income households,empty nesters, early retirees, snowbirds, and some active seniors. They are attracted byNewaygo County’s rural setting and natural resources, and will seek detached houses ongolf courses and inland lakes; that offering scenic and vista views; and that are close tohealth care and community services.

Newaygo County, Michigan Market Strategy Report – 07/18/2014
Page 3
Renter-Occupied, Detached Houses – Among the target markets, about one-third of the low-income households have a high propensity to live in detached houses, and they have a lowpropensity for home ownership (see Exhibits A.11 and A.16). In other words, they prefer to renthouses. This market potential is being partially met by private parties converting houses intorental and investment properties. Most of the for-rent houses are being converted in a qualitymanner so are being generally accepted by stakeholders.
Additional summaries are provided below, with exhibit numbers that link to the attachedSection A. Sections B and C are also attached and explained later in this report.
Exhibit Executive Summary
A.1 The maximum annual market potential for Newaygo County is 1,732 residentialunits, of which 1,328 units (75%) should be renter-occupied, and 404 units (25%)should be owner-occupied.
A.1 The maximum annual market potential for the City of White Cloud is 76 units, ofwhich 64 should be renter-occupied, and 12 should be owner occupied. Similarly,the maximum market potential is 106 units for the City of Fremont; 55 units forthe City of Newaygo; 48 units for the City of Grant; and 43 units for the Village ofHesperia.
A.1 There are 10 target markets that developers should focus on for rehabs,conversions, and new housing products. The largest group is Enduring Hardshipswith a market potential of 1,041 units throughout Newaygo County, including 38units in White Cloud; 47 units in Fremont; 32 units in the City of Newaygo; 28units in Grant; and 27 units in Hesperia. The vast majority of these units shouldbe planned for renter occupancy among low-income households.
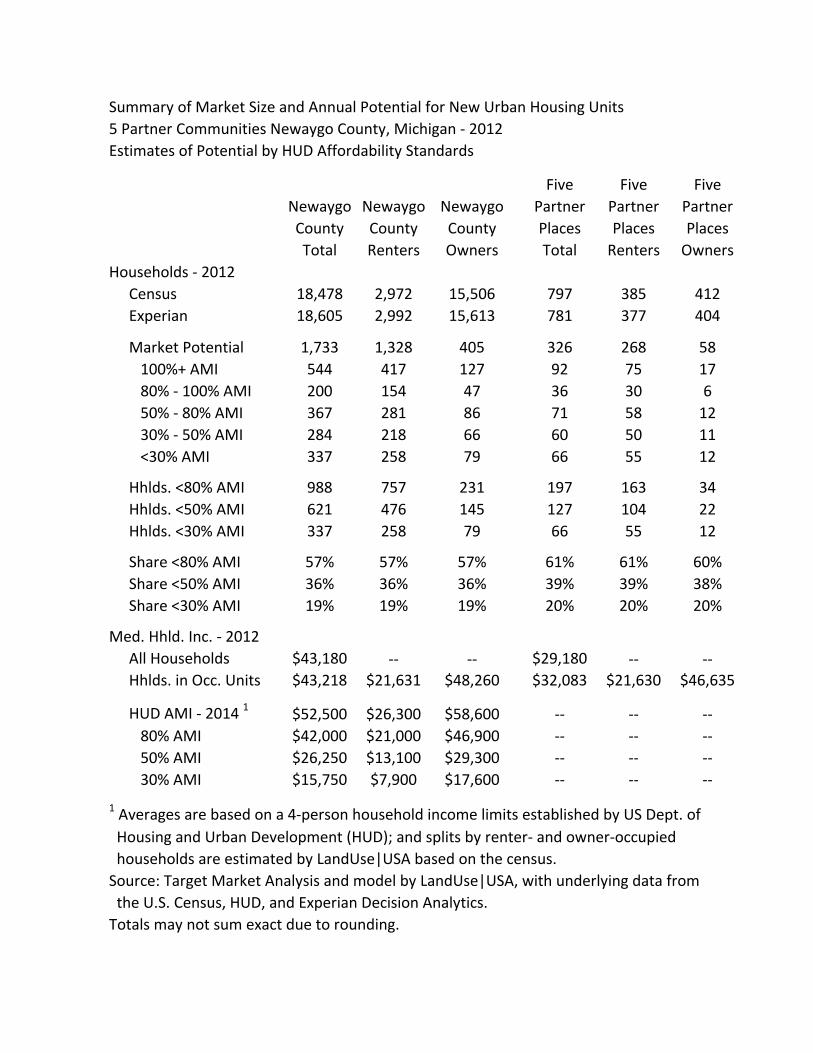
A.2 – A.7 For Newaygo County overall, 57% of the target households have incomes belowHUD’s 80% of AMI income limit of $52,500 (for a 4-person household). Withinthe 5 partner communities, 61% of the target households have incomes belowthe 80% AMI. Details are also provided for each of the 5 partner communities.
A.8 Low household incomes among the target markets and their corresponding lowcapacity for home values will make it difficult for developers to realize themarket’s full potential while also being profitable. Only 10% of the owner-occupied market potential is for new units priced at $100,000 or more; and 90%of the owner-occupied market potential is for units priced below that threshold.
Newaygo County, Michigan Market Strategy Report – 07/18/2014
Page 4
A.10 Based on a history of building permits approved in Newaygo County, the averageconstruction cost for a single-family detached house exceeds $100,000. To fulfillthe market potential while being profitable, developers should consider newattached formats for owner-occupied units, rather than detached houses. Thisapproach must also match the preferences of the target markets.
A.9 The market potential for renter-occupied units is over three times larger thanthe owner-occupied market. Low household income levels among the targetmarkets, and their corresponding low capacity for rents, will make it essential fordevelopers to focus on affordable housing solutions, and not just on market rateproducts. The vast majority (over 80%) of the market potential will be in unitswith rents of $600 or less.
A.10 The average cost of construction for a multi-family attached unit is about$65,000 (with significant increases over the past 2 years). It is assumed that mostof these permits were for renter-occupied units like apartments, rather thanowner-occupied units like condominiums or row houses. The development ofattached owner-occupied units should be expected to cost at least $90,000,which is more economical than detached houses.
Market Overview
The study area for this project includes Newaygo County plus its five partner communities,including the Cities of Grant, Newaygo, Fremont, and White Cloud, and the Village of Hesperia.The study area boundaries align with the respective municipal boundaries (see also the exhibitsin the attached Section B of this report). The regional draw area for new households inNewaygo County includes Newaygo, Kent, Muskegon, and Oceana Counties.
At the early stages of this project, we also conducted a closer study of households living in thecore downtown districts of each community (as delineated by block group), and found thattheir lifestyle attributes were generally consistent with community-wide averages. Therefore,the study areas align with municipal boundaries, and the market potential can be qualified forthe downtown districts based on the lifestyle attributes of the target markets.
Newaygo County, Michigan Market Strategy Report – 07/18/2014
Page 5
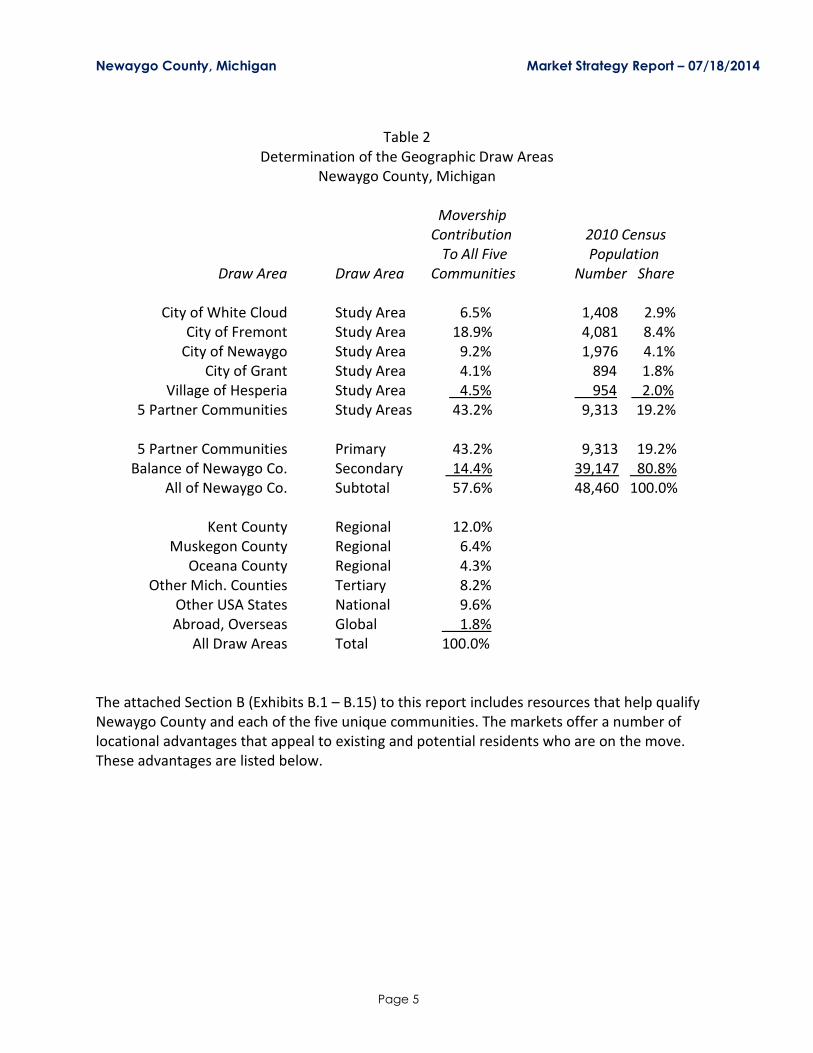
Table 2Determination of the Geographic Draw Areas
Newaygo County, Michigan
MovershipContribution 2010 Census
To All Five PopulationDraw Area Draw Area Communities Number Share
City of White Cloud Study Area 6.5% 1,408 2.9%City of Fremont Study Area 18.9% 4,081 8.4%
City of Newaygo Study Area 9.2% 1,976 4.1%City of Grant Study Area 4.1% 894 1.8%
Village of Hesperia Study Area 4.5% 954 2.0%5 Partner Communities Study Areas 43.2% 9,313 19.2%
5 Partner Communities Primary 43.2% 9,313 19.2%Balance of Newaygo Co. Secondary 14.4% 39,147 80.8%
All of Newaygo Co. Subtotal 57.6% 48,460 100.0%
Kent County Regional 12.0%Muskegon County Regional 6.4%
Oceana County Regional 4.3%Other Mich. Counties Tertiary 8.2%
Other USA States National 9.6%Abroad, Overseas Global 1.8%
All Draw Areas Total 100.0%
The attached Section B (Exhibits B.1 – B.15) to this report includes resources that help qualifyNewaygo County and each of the five unique communities. The markets offer a number oflocational advantages that appeal to existing and potential residents who are on the move.These advantages are listed below.
Newaygo County, Michigan Market Strategy Report – 07/18/2014
Page 6
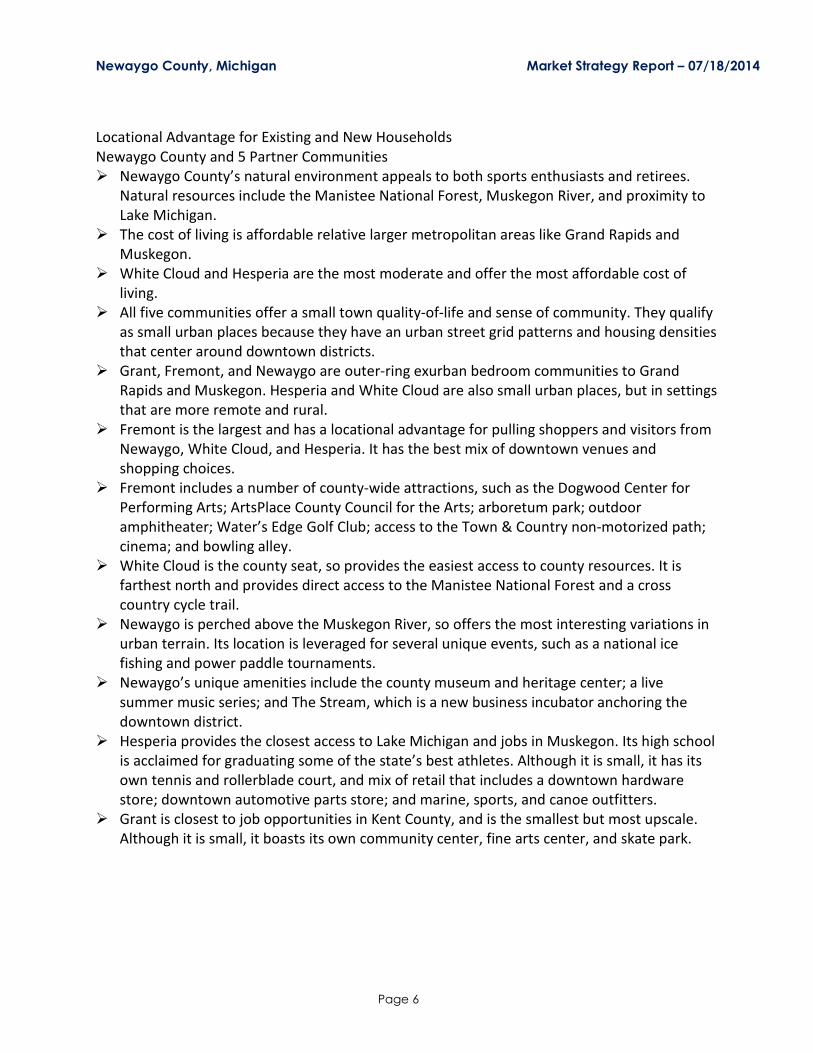
Locational Advantage for Existing and New HouseholdsNewaygo County and 5 Partner Communities Newaygo County’s natural environment appeals to both sports enthusiasts and retirees.
Natural resources include the Manistee National Forest, Muskegon River, and proximity toLake Michigan.
The cost of living is affordable relative larger metropolitan areas like Grand Rapids andMuskegon.
White Cloud and Hesperia are the most moderate and offer the most affordable cost ofliving.
All five communities offer a small town quality-of-life and sense of community. They qualifyas small urban places because they have an urban street grid patterns and housing densitiesthat center around downtown districts.
Grant, Fremont, and Newaygo are outer-ring exurban bedroom communities to GrandRapids and Muskegon. Hesperia and White Cloud are also small urban places, but in settingsthat are more remote and rural.
Fremont is the largest and has a locational advantage for pulling shoppers and visitors fromNewaygo, White Cloud, and Hesperia. It has the best mix of downtown venues andshopping choices.
Fremont includes a number of county-wide attractions, such as the Dogwood Center forPerforming Arts; ArtsPlace County Council for the Arts; arboretum park; outdooramphitheater; Water’s Edge Golf Club; access to the Town & Country non-motorized path;cinema; and bowling alley.
White Cloud is the county seat, so provides the easiest access to county resources. It isfarthest north and provides direct access to the Manistee National Forest and a crosscountry cycle trail.
Newaygo is perched above the Muskegon River, so offers the most interesting variations inurban terrain. Its location is leveraged for several unique events, such as a national icefishing and power paddle tournaments.
Newaygo’s unique amenities include the county museum and heritage center; a livesummer music series; and The Stream, which is a new business incubator anchoring thedowntown district.
Hesperia provides the closest access to Lake Michigan and jobs in Muskegon. Its high schoolis acclaimed for graduating some of the state’s best athletes. Although it is small, it has itsown tennis and rollerblade court, and mix of retail that includes a downtown hardwarestore; downtown automotive parts store; and marine, sports, and canoe outfitters.
Grant is closest to job opportunities in Kent County, and is the smallest but most upscale.Although it is small, it boasts its own community center, fine arts center, and skate park.
Newaygo County, Michigan Market Strategy Report – 07/18/2014
Page 7
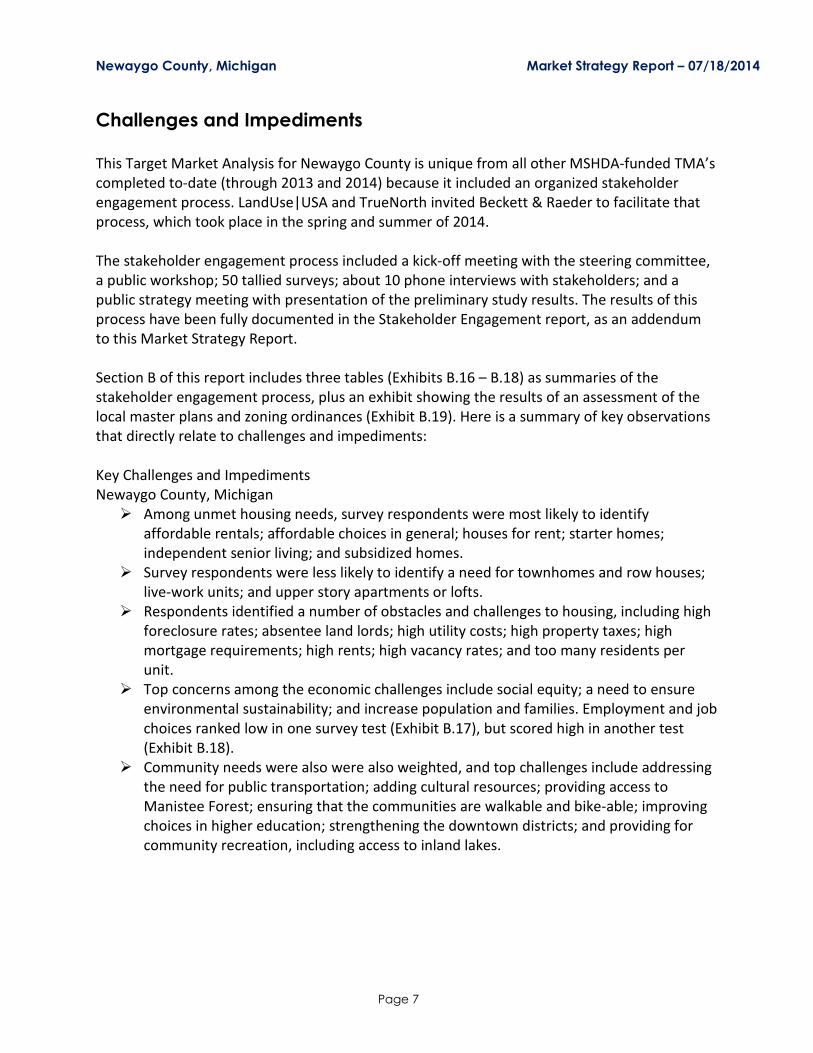
Challenges and Impediments
This Target Market Analysis for Newaygo County is unique from all other MSHDA-funded TMA’scompleted to-date (through 2013 and 2014) because it included an organized stakeholderengagement process. LandUse|USA and TrueNorth invited Beckett & Raeder to facilitate thatprocess, which took place in the spring and summer of 2014.
The stakeholder engagement process included a kick-off meeting with the steering committee,a public workshop; 50 tallied surveys; about 10 phone interviews with stakeholders; and apublic strategy meeting with presentation of the preliminary study results. The results of thisprocess have been fully documented in the Stakeholder Engagement report, as an addendumto this Market Strategy Report.
Section B of this report includes three tables (Exhibits B.16 – B.18) as summaries of thestakeholder engagement process, plus an exhibit showing the results of an assessment of thelocal master plans and zoning ordinances (Exhibit B.19). Here is a summary of key observationsthat directly relate to challenges and impediments:
Key Challenges and ImpedimentsNewaygo County, Michigan Among unmet housing needs, survey respondents were most likely to identify
affordable rentals; affordable choices in general; houses for rent; starter homes;independent senior living; and subsidized homes.
Survey respondents were less likely to identify a need for townhomes and row houses;live-work units; and upper story apartments or lofts.
Respondents identified a number of obstacles and challenges to housing, including highforeclosure rates; absentee land lords; high utility costs; high property taxes; highmortgage requirements; high rents; high vacancy rates; and too many residents perunit.
Top concerns among the economic challenges include social equity; a need to ensureenvironmental sustainability; and increase population and families. Employment and jobchoices ranked low in one survey test (Exhibit B.17), but scored high in another test(Exhibit B.18).
Community needs were also were also weighted, and top challenges include addressingthe need for public transportation; adding cultural resources; providing access toManistee Forest; ensuring that the communities are walkable and bike-able; improvingchoices in higher education; strengthening the downtown districts; and providing forcommunity recreation, including access to inland lakes.
Newaygo County, Michigan Market Strategy Report – 07/18/2014
Page 8
TMA Terminology
This section of the report defines some key terminology for Market Demand and MarketPotential; and Lifestyle Clusters and Target Markets.
Market Demand and Supply – Traditional approaches to housing studies involve directcomparisons of supply and demand within the existing market. Demand is traditionally basedon the attributes of households currently living in the market. Studies should also makeadjustments for movership rates that can vary considerably by income bracket, head ofhouseholder’s age, and tenure (owner v. renter.)
It is also traditional to assume that the form and style of current supply is a good indicator ofwhat new buyers and renters will want. In other words, it is assumed that developers haveaccurately gauged market preferences and that what is built (and sold or rented) is an accuratereflection of what households want. This approach is advocated by lending institutions, whichwill often require evidence of market “comparables” as evidence of a proposed project’sappropriateness for the market.
Market Gap – A direct comparison of demand with supply is made to gauge market gaps, whereGap = (Demand) – (Supply). Market gap is usually measured by a) the number of units bytenure; b) by size range (square feet); and c) and price range (value or rent). The results mightbe qualified for building styles or form, but almost always based on the attributes of currentsupply, and seldom based on household preferences for products that might be missing fromthe market.
Market Potential – Supply and demand approach to housing studies is flawed because it fails toconsider the buying and renting capacity of households who are moving into a market (as wellas within); and also fails to consider that the style and form of the housing that they would buyor rent if given a choice. The Market Potential approach does a better job by focusing on a) thenumber of households moving into the market (as well as within); b) their buying and rentingcapacity; c) their lifestyle attributes; and d) their preferences for various housing types andform. If the preferred housing types and form are absent from the market, then they represent“Missing Middle” housing products. Adding unique styles and forms of housing can significantlyimprove a market’s ability to compete and intercept households who are on the move.
Lifestyle Clusters and Target Markets – Based on definitions provided by Experian DecisionAnalytics (the vendor of demographic data used in this study), there are 71 possible lifestyleclusters located across the United States, which Experian also calls Mosaics.
Newaygo County, Michigan Market Strategy Report – 07/18/2014
Page 9
Profiles for the target markets include photos of “typical” households and can be used todeduce some socio-economic attributes like: a) head of householder’s age; b) familycomposition (such as the presence of children, and singles); c) lifestyle (based on attire, tools,and other objects in the photos); and d) prevailing ethnicity.
Some of the photos may imply that ethnicity is a leading factor in how the clusters are defined– but this is not the case. Experian’s definitions of the lifestyle clusters are based primarily on a)geographic region in the United States; b) household density; c) household income; d) tenure(owner and renter-occupancy); d) consumer behavior (credit and debt); and e) a wide variety ofsocio-economic variables, of which ethnicity is just one factor.
Many of these variables also have direct correlations. For example, it is a proven fact thatrenter-occupancy rates are higher among lower-income households. Complete profiles on thetarget markets are included in Exhibits A.12 – A.16 (see Section A) of this Target MarketAnalysis. The data in these tables take precedence over any subjective deductions thatstakeholders might make from the photographs and images.
Of the 71 possible lifestyle clusters, about half can be found to reside in the State of Michigan.Among these, we have identified ten as the primary target markets for Newaygo County.Detailed descriptions are provided later in this Market Strategy Report.
Additional explanations of the analytic approach and market assumptions are provided onpages 21 – 23 of this Market Strategy Report. These explanations are particularly important foraccurately interpreting the maximum market potential figures and other analytic results.

Newaygo County, Michigan Market Strategy Report – 07/18/2014
Page 10
Market Potential by Study Area
The results of this target market analysis indicate that the 5 partner communities cancollectively support a maximum of 326 dwelling units annually through 2020 (assuming thatconstruction begins in 2015 and that 2016 is the first full year). Regardless of how many unitsare actually developed, at least 80% should be designed for renters, and no more than 20%should be designed for owners.
In addition, a maximum of 1,407 could be supported in the relatively rural townships. However,the recommended strategy involves addressing the needs of the small urban cities first.
Table 3Allocation of Market Potential by Study Area
Newaygo County, Michigan
Max. Annual Max. 5-Yr. Share ofStudy Area Potential Potential1 Total
City of White Cloud 74 370 4.3%City of Fremont 107 535 6.2%
City of Newaygo 54 270 3.1%City of Grant 49 245 2.8%
Village of Hesperia 42 210 2.4%Subtotal 326 1,630 18.8%
Townships, Balance 1,407 7,035 81.1%Newaygo County 1,733 8,665 100.0%
1Assumes that construction commences in 2015 (a partial year) for a first full year of 2016, and
fifth full year of 2020. Any unmet market potential in any given year will dissipate and will notaccumulate or roll-over to subsequent years.
Affordability and HUD Income Limits
We have compared the analytic results with the U.S. Housing and Urban Development’s (HUD)income limits. HUD has established that the current Area Median Income (AMI) for a 4-personhousehold in Newaygo County is $52,500; and 80% of the AMI is $42,000 for the upperthreshold of low-income households. Based on these guidelines, about 60% of the targetmarket households and market potential is in the low-income limit of 80% of the AMI. Nearly40% are in the very low income limits or lower; and 20% are in the extremely low income limits.
Newaygo County, Michigan Market Strategy Report – 07/18/2014
Page 11
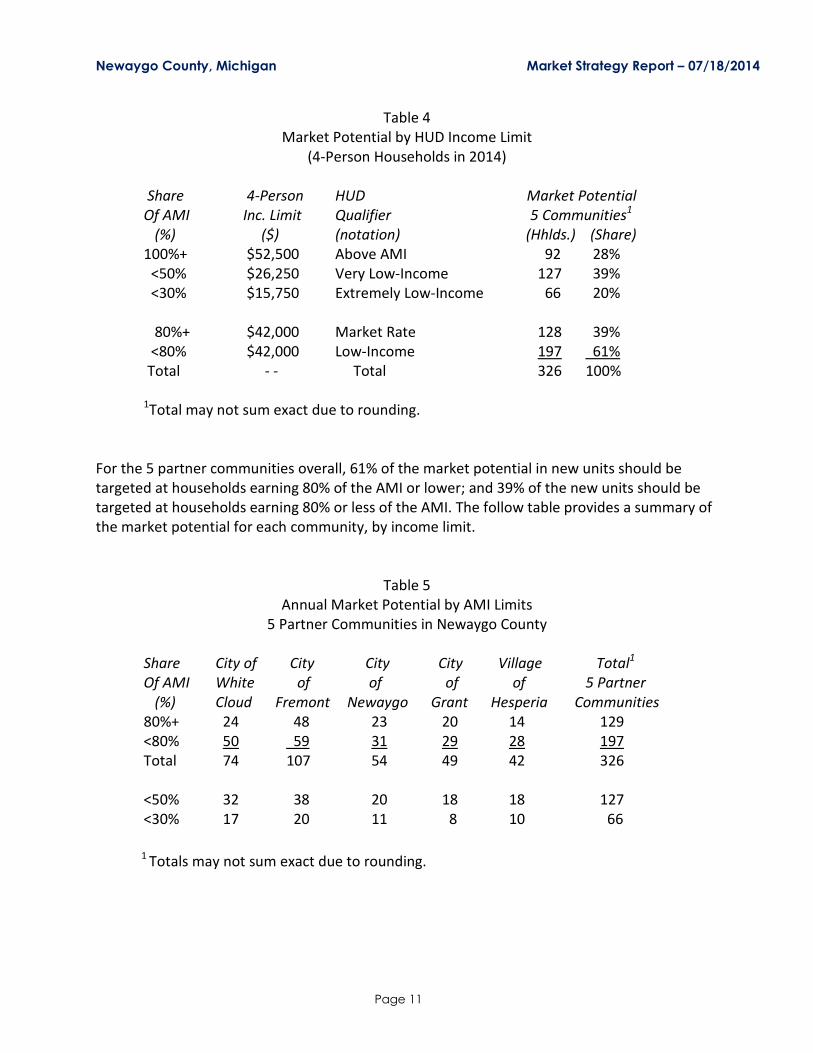
Table 4Market Potential by HUD Income Limit
(4-Person Households in 2014)
Share 4-Person HUD Market PotentialOf AMI Inc. Limit Qualifier 5 Communities1
(%) ($) (notation) (Hhlds.) (Share)100%+ $52,500 Above AMI 92 28%
<50% $26,250 Very Low-Income 127 39%<30% $15,750 Extremely Low-Income 66 20%
80%+ $42,000 Market Rate 128 39%<80% $42,000 Low-Income 197 61%
Total - - Total 326 100%
1Total may not sum exact due to rounding.
For the 5 partner communities overall, 61% of the market potential in new units should betargeted at households earning 80% of the AMI or lower; and 39% of the new units should betargeted at households earning 80% or less of the AMI. The follow table provides a summary ofthe market potential for each community, by income limit.
Table 5Annual Market Potential by AMI Limits
5 Partner Communities in Newaygo County
Share City of City City City Village Total1
Of AMI White of of of of 5 Partner(%) Cloud Fremont Newaygo Grant Hesperia Communities
80%+ 24 48 23 20 14 129<80% 50 59 31 29 28 197Total 74 107 54 49 42 326
<50% 32 38 20 18 18 127<30% 17 20 11 8 10 66
1 Totals may not sum exact due to rounding.
Newaygo County, Michigan Market Strategy Report – 07/18/2014
Page 12
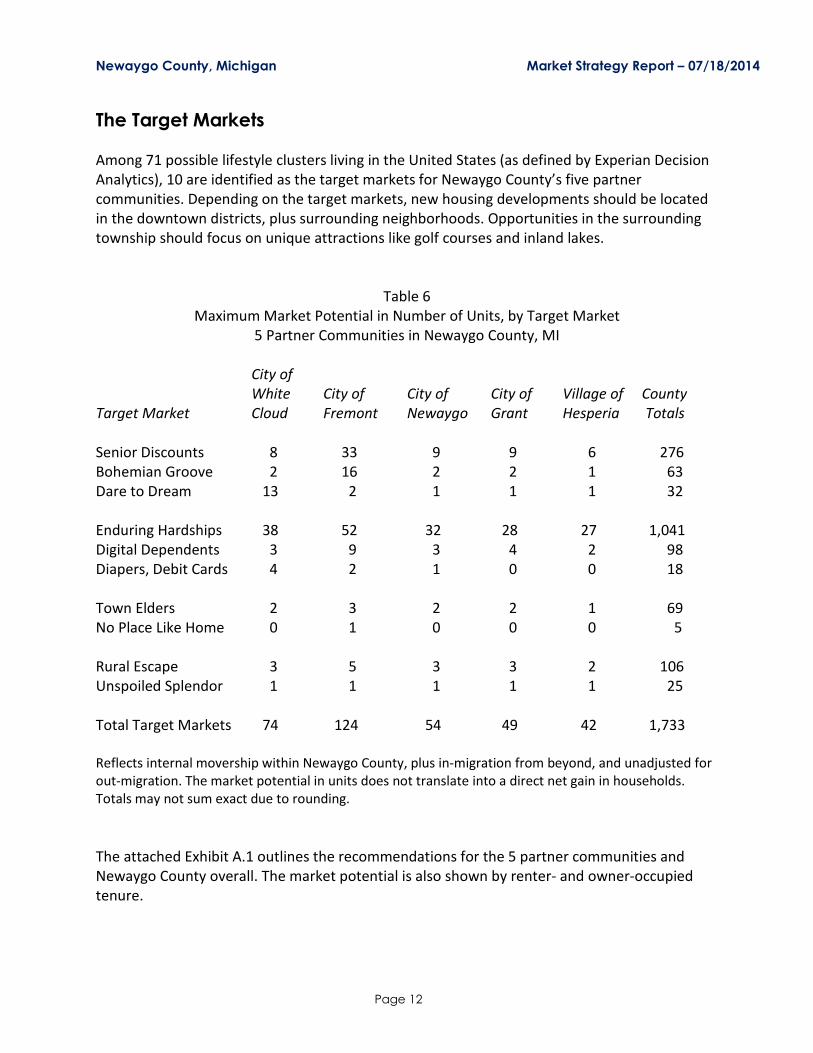
The Target Markets
Among 71 possible lifestyle clusters living in the United States (as defined by Experian DecisionAnalytics), 10 are identified as the target markets for Newaygo County’s five partnercommunities. Depending on the target markets, new housing developments should be locatedin the downtown districts, plus surrounding neighborhoods. Opportunities in the surroundingtownship should focus on unique attractions like golf courses and inland lakes.
Table 6Maximum Market Potential in Number of Units, by Target Market
5 Partner Communities in Newaygo County, MI
City ofWhite City of City of City of Village of County
Target Market Cloud Fremont Newaygo Grant Hesperia Totals
Senior Discounts 8 33 9 9 6 276Bohemian Groove 2 16 2 2 1 63Dare to Dream 13 2 1 1 1 32
Enduring Hardships 38 52 32 28 27 1,041Digital Dependents 3 9 3 4 2 98Diapers, Debit Cards 4 2 1 0 0 18
Town Elders 2 3 2 2 1 69No Place Like Home 0 1 0 0 0 5
Rural Escape 3 5 3 3 2 106Unspoiled Splendor 1 1 1 1 1 25
Total Target Markets 74 124 54 49 42 1,733
Reflects internal movership within Newaygo County, plus in-migration from beyond, and unadjusted forout-migration. The market potential in units does not translate into a direct net gain in households.Totals may not sum exact due to rounding.
The attached Exhibit A.1 outlines the recommendations for the 5 partner communities andNewaygo County overall. The market potential is also shown by renter- and owner-occupiedtenure.
Newaygo County, Michigan Market Strategy Report – 07/18/2014
Page 13
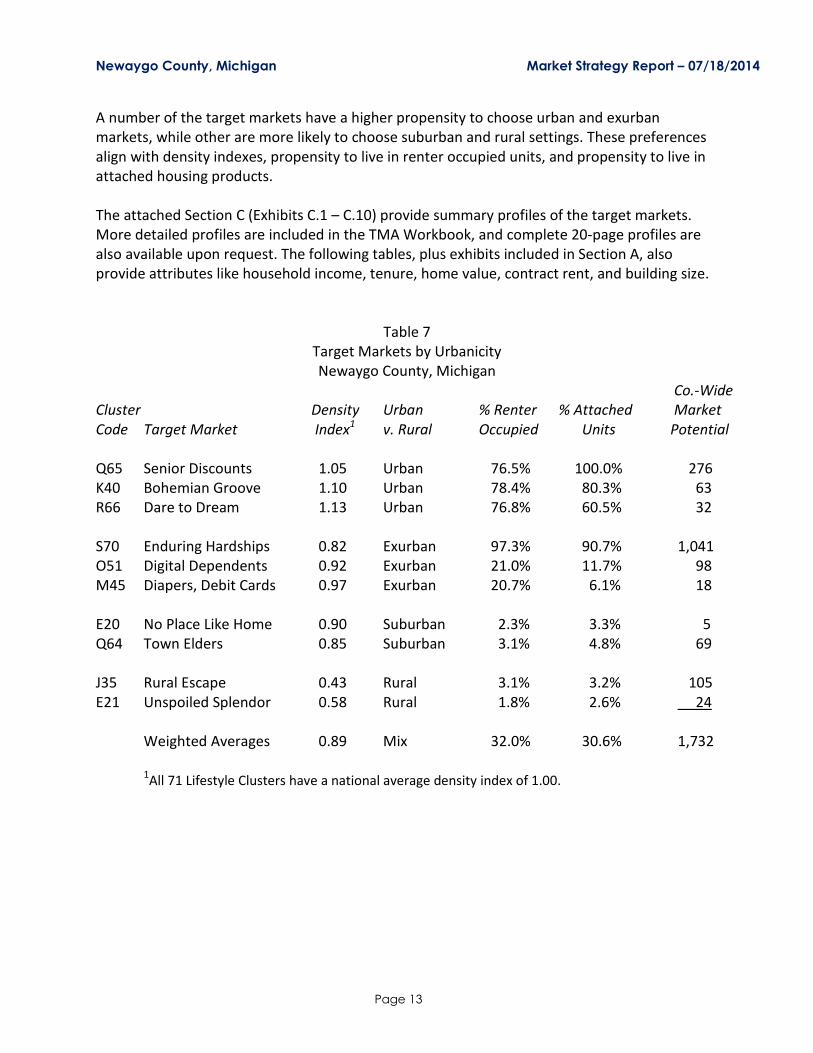
A number of the target markets have a higher propensity to choose urban and exurbanmarkets, while other are more likely to choose suburban and rural settings. These preferencesalign with density indexes, propensity to live in renter occupied units, and propensity to live inattached housing products.
The attached Section C (Exhibits C.1 – C.10) provide summary profiles of the target markets.More detailed profiles are included in the TMA Workbook, and complete 20-page profiles arealso available upon request. The following tables, plus exhibits included in Section A, alsoprovide attributes like household income, tenure, home value, contract rent, and building size.
Table 7Target Markets by UrbanicityNewaygo County, Michigan
Co.-WideCluster Density Urban % Renter % Attached MarketCode Target Market Index1 v. Rural Occupied Units Potential
Q65 Senior Discounts 1.05 Urban 76.5% 100.0% 276K40 Bohemian Groove 1.10 Urban 78.4% 80.3% 63R66 Dare to Dream 1.13 Urban 76.8% 60.5% 32
S70 Enduring Hardships 0.82 Exurban 97.3% 90.7% 1,041O51 Digital Dependents 0.92 Exurban 21.0% 11.7% 98M45 Diapers, Debit Cards 0.97 Exurban 20.7% 6.1% 18
E20 No Place Like Home 0.90 Suburban 2.3% 3.3% 5Q64 Town Elders 0.85 Suburban 3.1% 4.8% 69
J35 Rural Escape 0.43 Rural 3.1% 3.2% 105E21 Unspoiled Splendor 0.58 Rural 1.8% 2.6% 24
Weighted Averages 0.89 Mix 32.0% 30.6% 1,732
1All 71 Lifestyle Clusters have a national average density index of 1.00.
Newaygo County, Michigan Market Strategy Report – 07/18/2014
Page 14
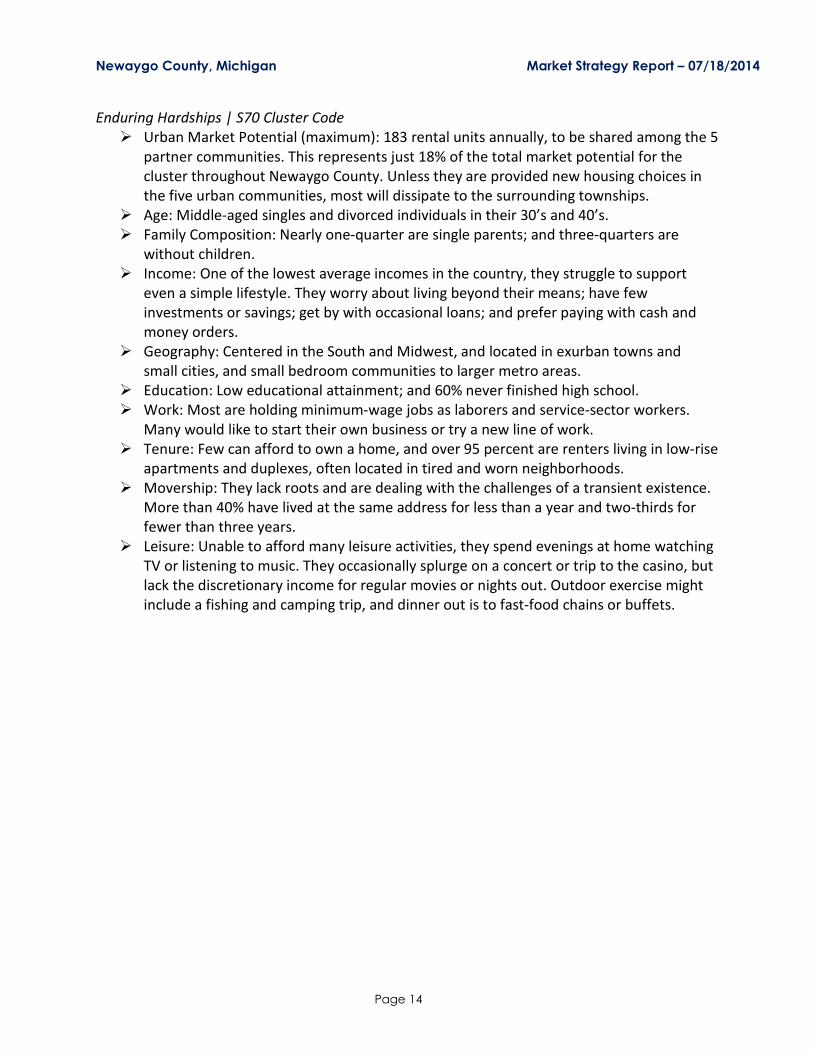
Enduring Hardships | S70 Cluster Code Urban Market Potential (maximum): 183 rental units annually, to be shared among the 5
partner communities. This represents just 18% of the total market potential for thecluster throughout Newaygo County. Unless they are provided new housing choices inthe five urban communities, most will dissipate to the surrounding townships.
Age: Middle-aged singles and divorced individuals in their 30’s and 40’s. Family Composition: Nearly one-quarter are single parents; and three-quarters are
without children. Income: One of the lowest average incomes in the country, they struggle to support
even a simple lifestyle. They worry about living beyond their means; have fewinvestments or savings; get by with occasional loans; and prefer paying with cash andmoney orders.
Geography: Centered in the South and Midwest, and located in exurban towns andsmall cities, and small bedroom communities to larger metro areas.
Education: Low educational attainment; and 60% never finished high school. Work: Most are holding minimum-wage jobs as laborers and service-sector workers.
Many would like to start their own business or try a new line of work. Tenure: Few can afford to own a home, and over 95 percent are renters living in low-rise
apartments and duplexes, often located in tired and worn neighborhoods. Movership: They lack roots and are dealing with the challenges of a transient existence.
More than 40% have lived at the same address for less than a year and two-thirds forfewer than three years.
Leisure: Unable to afford many leisure activities, they spend evenings at home watchingTV or listening to music. They occasionally splurge on a concert or trip to the casino, butlack the discretionary income for regular movies or nights out. Outdoor exercise mightinclude a fishing and camping trip, and dinner out is to fast-food chains or buffets.

Newaygo County, Michigan Market Strategy Report – 07/18/2014
Page 15
Senior Discounts | Q65 Cluster Code Urban Market Potential (maximum): 47 renter-occupied units and 11 owner-occupied
units each year, to be shared among the 5 partner communities. Up to 38 of these couldbe absorbed by The Gateway senior housing project being developed at the eastern endof downtown Fremont (a conversion of the former Fremont High School, withcompletion expected in late 2014).
Age: Mostly elderly and retired residents; mostly over the age of 75 years. Family: Three-quarters are widowed grandparents with grown children who are located
too far away or otherwise incapable of sharing their home. The group cherishes theirfamilies and friends and they like to meet new people and entertain in their apartments.
Income: Fixed and modest incomes, some taking advantage of rent-controlled rates andsenior discounts to stretch their budgets. Most do not qualify as sophisticated investors;few have income-producing assets; and almost none have stocks and bonds. They get byon small pensions that supplement their Social Security checks, and are slow to pay offmonthly credit card balances. They prefer to pay their bills with cash and money orders.
Geography: Located throughout the country, typically in metro communities that permitlarge, multi-unit apartment buildings.
Tenure: Renting in city and urban apartment buildings geared for seniors, rather thancope with the maintenance of a home. They prefer the security of an apartmentbuilding, preferably with a door attendant, to being on their own.
Leisure: Many have active leisure lives, regularly attend plays, classical music concerts,and casinos.
Optimal Values and Prices
The optimal home values among owner-occupied units, and contract rents among renter-occupied units are based on national averages for the target markets (as reported by ExperianDecision Analytics), with adjustments for local market conditions at the county level.
It will be most challenging to develop owner-occupied detached houses that are valued at lessthan $100,000, because the average cost per unit among permitted single-family units forNewaygo County has exceeded that level in recent years. The best strategy for adding unitsvalued at $120,000 or less is to build attached units.

Newaygo County, Michigan Market Strategy Report – 07/18/2014
Page 16
Table 8Allocation of Market Potential by Home Values and Contract Rents
Totals for Newaygo County, Michigan
TotalUnits R66 K40 Q65 M45 O51 E20 Q64 S70 E21 J35
Home Values< $100,000 364 7 12 60 14 71 4 63 27 18 87$100,000+ 40 0 2 5 0 7 1 4 1 6 15
Subtotal 405 7 14 65 14 78 5 67 28 24 102
Contract Rents< $600/month 1,103 19 33 186 2 10 0 2 849 0 2
$600/month 225 6 16 25 2 10 0 1 164 0 1Subtotal 1,328 25 49 211 4 21 0 2 1,013 0 3
Grand Total 1 1,733 32 63 276 18 98 5 69 1,041 25 106
1 Totals may not sum exact due to rounding.Source: Underlying home values and contract rents by target market are provided by Experian DecisionAnalytics, and adjusted by LandUse|USA for local (county-level) conditions.
Detached and Attached Products
The 10 target markets generate a market-wide potential for 423 detached houses annuallythroughout Newaygo County, including exurban and suburban neighborhoods in the partnercommunities. Some of the market potential can be filled by rehabbing and modernizing existinghousing stock (rather than building more detached houses).
One-third (110 units annually) of the market potential for detached products is being sought bylow-income renters. Much of this market is expected to dissipate to existing detached housesthat are being converted into rental units.
Among the target markets with moderate incomes, at least half will dissipate into the marketdue to two key economic challenges. First, the low income profiles of the target markets (andparticularly the Enduring Hardships category) make it difficult for them to qualify for homeloans. Second, because the value of the affordable products may be lower than constructioncosts, it will be difficult for developers to make a profit without significant and tangible (i.e.,cash and rebate) incentives.

Newaygo County, Michigan Market Strategy Report – 07/18/2014
Page 17
Table 9Market Potential for Detached Housing Products
Newaygo County, Michigan
1-Unit ShareDetached Owners
S70 Enduring Hardships 97 1.0%R66 Dare to Dream 13 3.0%
Low Income, Renters 110 1.5%
Q64 Town Elders 65 95.6%O51 Digital Dependents 87 61.9%M45 Diapers, Debit Cards 17 61.4%K40 Bohemian Groove 12 11.4%
Low-to-Mod. Inc., Owners 181 70.0%
J35 Rural Escape 102 95.2%E21 Unspoiled Splendor 24 97.6%E20 No Place Like Home 5 96.5%
Better Income, Owners 131 96.0%
Half of the target markets also have propensities to choose some attached housing products, assummarized below. Assuming that the target markets could all qualify for prices that could bedeveloped under profitable scenarios, there is a county-wide market potential for a maximumof 50 duplexes, or about 100 duplex units annually. There is also a county-wide marketpotential for a maximum of 50 triplex buildings (150 units); and 15 quad buildings (60 units)annually.
Table 10Market Potential for Attached Housing Products (in Units)
Newaygo County, Michigan5-9 10-19 20+ Share
Duplex Triplex Quad Units Units Units Renters
S70 Enduring Hardships 87 132 57 264 117 286 97.3%Q65 Senior Discounts 2 4 2 6 31 232 76.5%R66 Dare to Dream 4 7 2 7 0 0 76.8%
Low Income 93 143 61 277 148 518 90.0%
K40 Bohemian Groove 5 9 5 16 5 11 78.4%O51 Digital Dependents 1 3 1 5 0 0 21.0%
Moderate Income 7 12 6 21 5 11 75.0%

Newaygo County, Michigan Market Strategy Report – 07/18/2014
Page 18
Among the attached products, the more lucrative markets also represent significantly smallernumbers for the market potential. Prices (and rents) can all be higher for the Bohemian Groove,Digital Dependents target markets, but the annual magnitude of opportunity is considerablyless – and the risk of overbuilding will be higher.
The following table allocates the market potential among the 5 partner communities bybuilding type, with practical adjustments for the building size. For example, if the model impliesa market potential for 3 units in duplexes, we adjusted the figure to be 4 units in duplexes, or 2units in each double. The extra unit was then trimmed from the larger buildings. Similarly, if themodel implies a market potential for 7 units in quads, we adjusted the figure to be 8 units inquads, or 4 units in each building.
Table 11Market Potential for Attached Housing Products (in Units)
5 Partner Communities in Newaygo County, Michigan
5-9 10-19 20+ TotalDuplex Triplex Quad Units Units Units Units
City of White Cloud 10 15 8 8 16 0 57City of Fremont 14 18 16 18 16 0 82City of Newaygo 8 12 4 6 15 0 45City of Grant 8 6 4 6 14 0 38Village of Hesperia 6 6 4 6 13 0 35
Unit Sizes in Square Feet
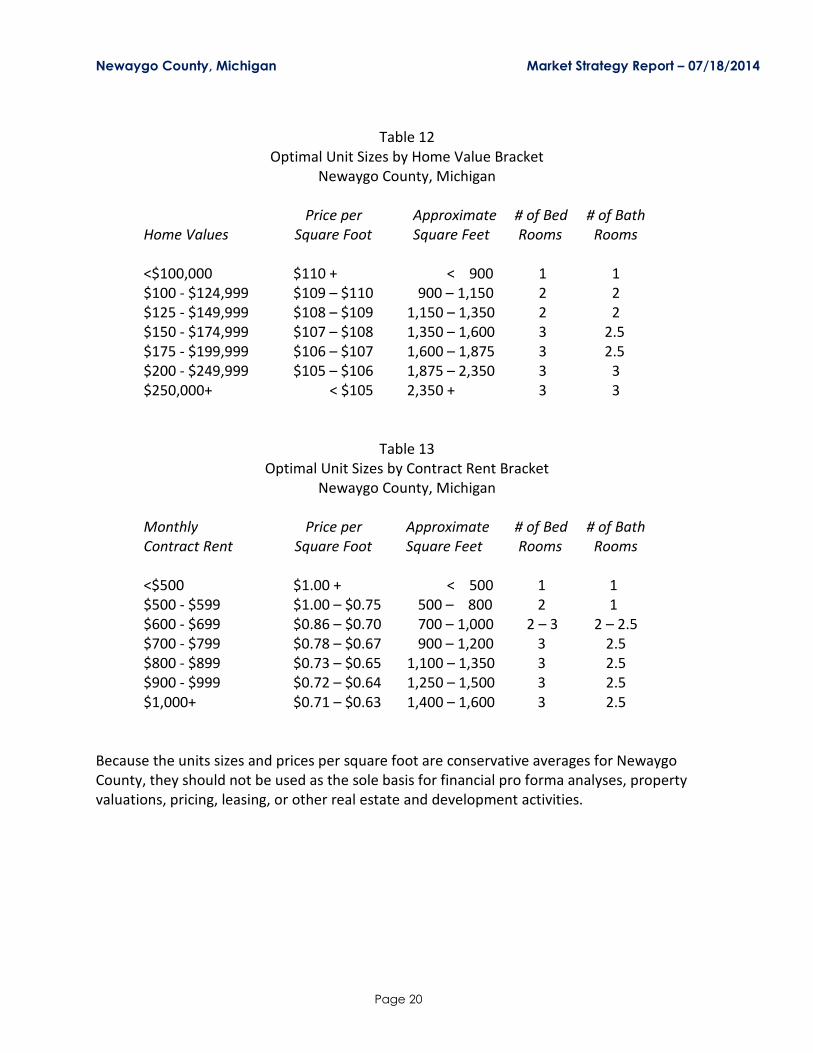
Most of the strategy recommendations provided in this report reflect the lifestyle attributesand preferences of target markets that are living throughout the upper Midwest and Michigan,and migrating both into and within Newaygo County. In comparison, the development ofrecommendations on unit sizes is based on based on local and current real estate marketconditions, based on known owner-occupied values per square foot, and rent-occupiedcontract rents per square foot (see Sections S and T in the Supply-Demand Workbook).
Unit sizes relative to value and rents are provided below, and are intended to providedevelopers only with typical and conservative ranges for Newaygo County. Variations should beexpected between the five partner communities; and high values or outliers should beexpected for projects that are truly unique to the market. For example, lakefront homes, orunits that offer exemplary vista views of lakes, golf courses, natural terrain, and downtowndistricts may have premiums on price per square foot.

Newaygo County, Michigan Market Strategy Report – 07/18/2014
Page 19
Newaygo County, Michigan Market Strategy Report – 07/18/2014
Page 20
Table 12Optimal Unit Sizes by Home Value Bracket
Newaygo County, Michigan
Price per Approximate # of Bed # of BathHome Values Square Foot Square Feet Rooms Rooms
<$100,000 $110 + < 900 1 1$100 - $124,999 $109 – $110 900 – 1,150 2 2$125 - $149,999 $108 – $109 1,150 – 1,350 2 2$150 - $174,999 $107 – $108 1,350 – 1,600 3 2.5$175 - $199,999 $106 – $107 1,600 – 1,875 3 2.5$200 - $249,999 $105 – $106 1,875 – 2,350 3 3$250,000+ < $105 2,350 + 3 3
Table 13Optimal Unit Sizes by Contract Rent Bracket
Newaygo County, Michigan
Monthly Price per Approximate # of Bed # of BathContract Rent Square Foot Square Feet Rooms Rooms
<$500 $1.00 + < 500 1 1$500 - $599 $1.00 – $0.75 500 – 800 2 1$600 - $699 $0.86 – $0.70 700 – 1,000 2 – 3 2 – 2.5$700 - $799 $0.78 – $0.67 900 – 1,200 3 2.5$800 - $899 $0.73 – $0.65 1,100 – 1,350 3 2.5$900 - $999 $0.72 – $0.64 1,250 – 1,500 3 2.5$1,000+ $0.71 – $0.63 1,400 – 1,600 3 2.5
Because the units sizes and prices per square foot are conservative averages for NewaygoCounty, they should not be used as the sole basis for financial pro forma analyses, propertyvaluations, pricing, leasing, or other real estate and development activities.

Newaygo County, Michigan Market Strategy Report – 07/18/2014
Page 21
Product Labeling
Developers interested in investing in Newaygo should strive to develop projects that meet avariety of these target markets, rather than singling out any one discrete market.We also recommend that developers avoid labeling projects according to the target marketsdescriptions. Labeling or differentiating projects as “affordable”, “subsidized”, “senior”, or“worker” housing should be avoided. Instead, projects should be described according to theirform and function: Single-use and mixed-use, including residential units above retail, civic, and/or office
space. Tenure, including renter, owner, lease-to-own, and mixed. Building scale, including mid-plex, mid-rise, low-rise, and units per building. Building format and style, attached, detached, row house, stacked flats, cottage, hard
and soft loft, etc.
TMA Approach and Assumptions
This study of market potential assumes that households moving into Newaygo County are lessthan satisfied with the existing choices and housing stock, and that they are all candidates fornew choices with modern amenities. Similarly, it assumes that all existing households who aremoving within Newaygo County are also seeking new choices.
The maximum market potential can be satisfied by developers in several ways, by:a) rehabilitating existing units; b) converting vacant buildings into new units; and/orc) building new projects with new units. If these efforts fall short of meeting the maximummarket potential in any given year, then the balance of the target households will dissipate intothe market. Some will settle for less by moving into whatever is vacant, available, andaffordable. Others will be deterred from buying units that require too much work, and willtrade-down into rental units until owner-occupied choices improve. Finally, others will simplyrelocate to other counties, markets, and states, exacerbating outflow and population loss.
The figures represent annual market opportunities, and any missed years cannot be rolled overto accumulate with subsequent years. In other words, if the market potential is not served anygiven year, then the migrating households simply shuffle among existing choices and dissipateinto the market. The clock will reset each year and be replenished with another group ofexisting and in-migrating households (and target markets) that are on the move.
Newaygo County, Michigan Market Strategy Report – 07/18/2014
Page 22
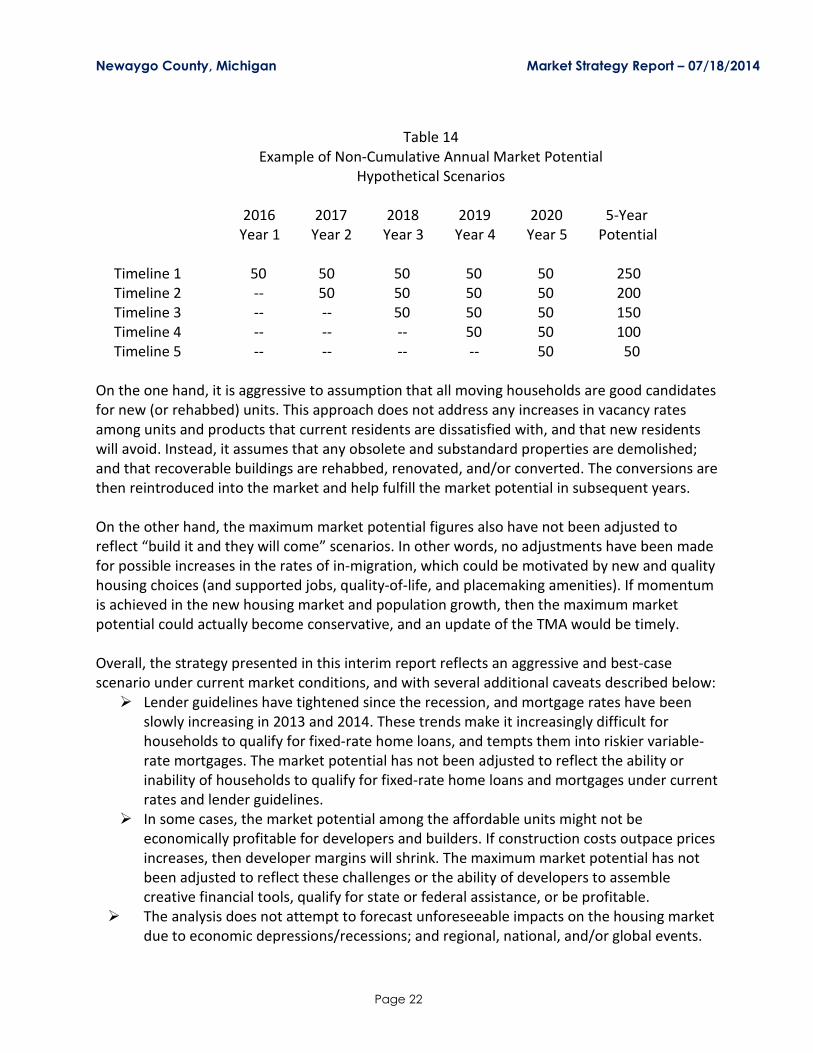
Table 14Example of Non-Cumulative Annual Market Potential
Hypothetical Scenarios
2016 2017 2018 2019 2020 5-YearYear 1 Year 2 Year 3 Year 4 Year 5 Potential
Timeline 1 50 50 50 50 50 250Timeline 2 -- 50 50 50 50 200Timeline 3 -- -- 50 50 50 150Timeline 4 -- -- -- 50 50 100Timeline 5 -- -- -- -- 50 50
On the one hand, it is aggressive to assumption that all moving households are good candidatesfor new (or rehabbed) units. This approach does not address any increases in vacancy ratesamong units and products that current residents are dissatisfied with, and that new residentswill avoid. Instead, it assumes that any obsolete and substandard properties are demolished;and that recoverable buildings are rehabbed, renovated, and/or converted. The conversions arethen reintroduced into the market and help fulfill the market potential in subsequent years.
On the other hand, the maximum market potential figures also have not been adjusted toreflect “build it and they will come” scenarios. In other words, no adjustments have been madefor possible increases in the rates of in-migration, which could be motivated by new and qualityhousing choices (and supported jobs, quality-of-life, and placemaking amenities). If momentumis achieved in the new housing market and population growth, then the maximum marketpotential could actually become conservative, and an update of the TMA would be timely.
Overall, the strategy presented in this interim report reflects an aggressive and best-casescenario under current market conditions, and with several additional caveats described below: Lender guidelines have tightened since the recession, and mortgage rates have been
slowly increasing in 2013 and 2014. These trends make it increasingly difficult forhouseholds to qualify for fixed-rate home loans, and tempts them into riskier variable-rate mortgages. The market potential has not been adjusted to reflect the ability orinability of households to qualify for fixed-rate home loans and mortgages under currentrates and lender guidelines.
In some cases, the market potential among the affordable units might not beeconomically profitable for developers and builders. If construction costs outpace pricesincreases, then developer margins will shrink. The maximum market potential has notbeen adjusted to reflect these challenges or the ability of developers to assemblecreative financial tools, qualify for state or federal assistance, or be profitable.
The analysis does not attempt to forecast unforeseeable impacts on the housing marketdue to economic depressions/recessions; and regional, national, and/or global events.
Newaygo County, Michigan Market Strategy Report – 07/18/2014
Page 23
With those caveats aside, we also observed and in some cases made adjustments for thefollowing: National Housing Trends – The national housing market has continued to be relatively
soft, although with improvement compared to 2008 – 2012. Demand for rental housinghas resulting in steady rent increases of 5% to +10% annually in most markets,regardless of growth in the total number of households. These trends are expected tocontinue through 2020.
Absorption of Vacancy Surplus – Compared to regional standards, some of the marketshave modest surplus in vacancies. The City of Newaygo has an estimated surplus of 10vacant renter units and 10 vacant owner units. There is also a surplus of 14 owner unitsin Fremont and 17 renter units in White Cloud, but no measureable surplus in the Grant.
Market Growth and Net In-migration – Newaygo County has proven its ability to achievenet in-migration with modest population gains. This net population inflow iscommendable given that many of Michigan’s other counties are struggling with netpopulation loss, and is a positive indicator of the market’s ability to intercepthouseholds who are on the move.
Movership Rates by Target Market – Movership rates vary between the target marketsand the market potential is largest for households with high movership rates. Theyinclude a prevalence of young renters seeking attached housing products in urban andexurban places. To be clear, the market potential is not necessarily representative of thecurrent demographic distribution of Newaygo County’s existing households, and this isan important differentiation.
Migration Patterns - Recent migration patterns within and into Newaygo County andeach of the 5 partner communities is assumed to continue at a stable rate over the nextfive years and through 2020, and is not assumed to increase with the introduction ofnew housing choices.
Job Stability – Major employers located in the county are not expected to undergosignificant staff cuts or downsizings, and instead are assumed to create good-payingjobs that help attract the target markets and households.
Placemaking Initiatives – It is assumed that the partner communities will continue withindividual and collaborative efforts to add new quality of life amenities, and convey asense of place and arrival in their respective downtowns.
Community Planning – It is assumed that the partner communities will proactively seekout opportunities to make real projects materialize by collaborating with localdevelopers; improving master plans, zoning ordinances, and other governingdocuments; packaging hard and soft incentives; and streamlining the permit applicationand review process.
Attached Units in Urban Places – Developers investing in Newaygo County will focusprimarily on urban (city and village) projects that introduce new formats of attachedhousing products in both the renter- and owner-occupied markets, and spanning theaffordable and market-rate markets. Detached products are also supportable in thesurrounding townships, particularly on the inland lakes, golf courses.
Newaygo County, Michigan Market Strategy Report – 07/18/2014
Page 24
Focus on Unique Products – Developers will focus on new housing formats that a) aretruly unique to each community; b) support socio-economic diversity; and c) are smartlyplanned and well-constructed as quality projects with appropriate placemakingamenities.
Agency Support - It is assumed that federal, state, and local agencies will continueworking with developers and will continue funding programs and initiatives that resultin profitable and economically sustainable projects.
Next-Steps
This Target Market Analysis has been prepared for a diverse group of stakeholders, including:
Newaygo County TMA StakeholdersThe 5 Partner Communities, and Newaygo CountyThe Fremont Area Community FoundationTrueNorth Community ServicesThe Local TMA Steering Committee MembersDevelopers, Real Estate Brokers, and Lending InstitutionsLocal Economic Development ProfessionalsPrivate Citizens and other StakeholdersThe Michigan State Housing and Development AuthorityThe Michigan Economic Development Corporation
These stakeholders are also listed on the first Acknowledgements page of this report in each ofthe two companion Workbooks. Next steps will depend on the steering committee activelymeeting, reviewing the report, asking questions and seeking clarification as needed, andworking together to disseminate the report among the various stakeholders. Hard-copies of thereport should be filed at the county, city, and village offices, and electronic .pdf copies shouldbe posted on their respective websites. Finally, electronic .pdf copies should be transmitted byemail to local developers, real estate broker offices, and selected property owners.
Developers, property owners, and real estate brokers should be invited to meet with thesteering committee and leaders in their respective communities. At those meetings, the groupshould discuss the report findings, goals and objectives for implementation, and strategies formaking real projects happen. When practical, MSHDA and MEDC regional teams should beincluded in the meetings to answer questions about state agency resources and programs.
Newaygo County, Michigan Market Strategy Report – 07/18/2014
Page 25
Developers seeking to implement individual projects should anticipate retaining theprofessional services of qualified experts to complete myriad due diligence tasks. These includecompleting financial pro formas; property valuations; land and traffic surveys; traffic,environment, and fiscal impact studies; site plans and elevations; business plans; feasibilitiesstudies; and related documents. In some cases, if the developer is also interested in applyingfor gap financing or other programs and assistance from Michigan’s state agencies, they mightalso be asked to demonstrate that their project aligns with this Target Market Analysis.
~ end of Market Strategy Report ~

S ectionsA – C
Prepared by:
Prepared for:
T argetM arketA nalysis
N ew aygoCounty,M I
S trategy R eport
July 18,2014
Prepared by:
Prepared for:
Target Market Analysis
Newaygo Co., MI
Strategy Report
July 18, 2014
Contents:
Market Potential
Strategy Tables

Newaygo County, Michigan and 5 Partner Communities
Annual Market Potential in Units by Top Target Market and Tenure
AGGRESSIVE UPSIDE SCENARIO 2016 - 2020
Target
Markets
Dare to
Dream
Bohemian
Groove
Senior
Discounts
Diapers
and
Debit
Cards
Digital
Depend-
ents
No Place
Like Home
Town
Elders
Enduring
Hardships
Unspoiled
Splendor
Rural
Escape
Total R66 K40 Q65 M45 O51 E20 Q64 S70 E21 J35
Urbanicity Index (USA) 0.88 1.13 1.10 1.05 0.97 0.92 0.90 0.85 0.82 0.58 0.43
Newaygo County Total 1,732 32 63 276 18 99 5 69 1,041 24 105
Renter Occupied 1,328 25 49 211 4 21 0 2 1,013 0 3
Owner Occupied 404 7 14 65 14 78 5 67 28 24 102
5 Partner Communities 328 17 19 58 4 18 1 7 188 3 13
Renter Occupied 268 15 16 47 1 6 0 0 183 0 0
Owner Occupied 60 2 3 11 3 12 1 7 5 3 13
City of White Cloud 76 13 2 8 3 3 0 1 43 1 2
Renter Occupied 64 11 2 7 1 1 0 0 42 0 0
Owner Occupied 12 2 0 1 2 2 0 1 1 1 2
City of Fremont 106 1 13 26 1 7 1 3 48 1 5
Renter Occupied 80 1 10 20 0 2 0 0 47 0 0
Owner Occupied 26 0 3 6 1 5 1 3 1 1 5
City of Newaygo 55 1 2 9 0 3 0 1 37 0 2
Renter Occupied 48 1 2 8 0 1 0 0 36 0 0
Owner Occupied 7 0 0 1 0 2 0 1 1 0 2
City of Grant 48 1 1 9 0 3 0 1 30 1 2
Renter Occupied 39 1 1 7 0 1 0 0 29 0 0
Owner Occupied 9 0 0 2 0 2 0 1 1 1 2
Village of Hesperia 43 1 1 6 0 2 0 1 30 0 2
Renter Occupied 37 1 1 5 0 1 0 0 29 0 0
Owner Occupied 6 0 0 1 0 1 0 1 1 0 2
Source: Analysis of market potential based on 100% capture rates of in-migration by community, adjusted for minor surpluses in vacancies.
Assumes that significant and tangible improvements are made in each community, including development of a diverse housing formats;
proactive initiatives to add quality-of-life amenities; and tangible efforts to advance the placemaking process with measurable results.
Micro-level geographical analysis of the individual downtown districts reveal insignificant differences from the municipal averages.
Sharon
Text Box
Exhibit A.1
Summary of Market Size and Annual Potential for New Urban Housing Units
5 Partner Communities Newaygo County, Michigan - 2012
Estimates of Potential by HUD Affordability Standards
Five Five Five
Newaygo Newaygo Newaygo Partner Partner Partner
County County County Places Places Places
Total Renters Owners Total Renters Owners
Households - 2012
Census 18,478 2,972 15,506 797 385 412
Experian 18,605 2,992 15,613 781 377 404
Market Potential 1,733 1,328 405 326 268 58
100%+ AMI 544 417 127 92 75 17
80% - 100% AMI 200 154 47 36 30 6
50% - 80% AMI 367 281 86 71 58 12
30% - 50% AMI 284 218 66 60 50 11
<30% AMI 337 258 79 66 55 12
Hhlds. <80% AMI 988 757 231 197 163 34
Hhlds. <50% AMI 621 476 145 127 104 22
Hhlds. <30% AMI 337 258 79 66 55 12
Share <80% AMI 57% 57% 57% 61% 61% 60%
Share <50% AMI 36% 36% 36% 39% 39% 38%
Share <30% AMI 19% 19% 19% 20% 20% 20%
Med. Hhld. Inc. - 2012
All Households $43,180 -- -- $29,180 -- --
Hhlds. in Occ. Units $43,218 $21,631 $48,260 $32,083 $21,630 $46,635
HUD AMI - 2014 1$52,500 $26,300 $58,600 -- -- --
80% AMI $42,000 $21,000 $46,900 -- -- --
50% AMI $26,250 $13,100 $29,300 -- -- --
30% AMI $15,750 $7,900 $17,600 -- -- --
1 Averages are based on a 4-person household income limits established by US Dept. of
Housing and Urban Development (HUD); and splits by renter- and owner-occupied
households are estimated by LandUse|USA based on the census.
Source: Target Market Analysis and model by LandUse|USA, with underlying data from
the U.S. Census, HUD, and Experian Decision Analytics.
Totals may not sum exact due to rounding.
Sharon
Text Box
Exhibit A.2
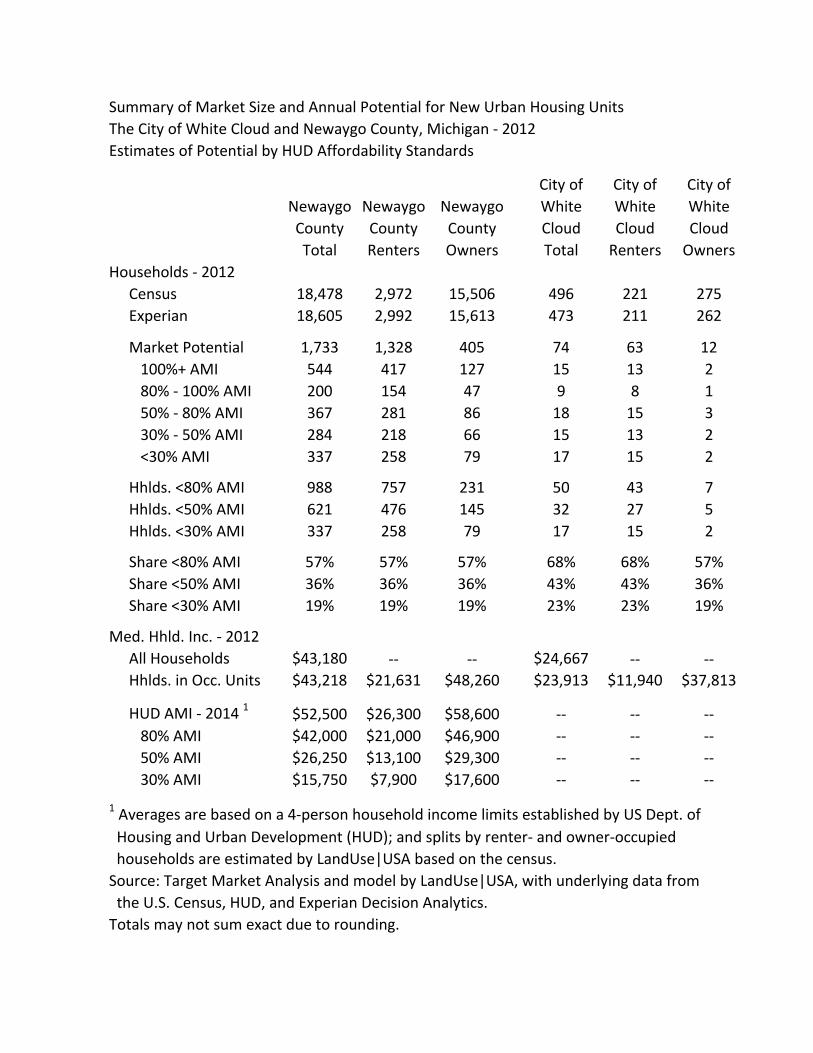
Summary of Market Size and Annual Potential for New Urban Housing Units
The City of White Cloud and Newaygo County, Michigan - 2012
Estimates of Potential by HUD Affordability Standards
City of City of City of
Newaygo Newaygo Newaygo White White White
County County County Cloud Cloud Cloud
Total Renters Owners Total Renters Owners
Households - 2012
Census 18,478 2,972 15,506 496 221 275
Experian 18,605 2,992 15,613 473 211 262
Market Potential 1,733 1,328 405 74 63 12
100%+ AMI 544 417 127 15 13 2
80% - 100% AMI 200 154 47 9 8 1
50% - 80% AMI 367 281 86 18 15 3
30% - 50% AMI 284 218 66 15 13 2
<30% AMI 337 258 79 17 15 2
Hhlds. <80% AMI 988 757 231 50 43 7
Hhlds. <50% AMI 621 476 145 32 27 5
Hhlds. <30% AMI 337 258 79 17 15 2
Share <80% AMI 57% 57% 57% 68% 68% 57%
Share <50% AMI 36% 36% 36% 43% 43% 36%
Share <30% AMI 19% 19% 19% 23% 23% 19%
Med. Hhld. Inc. - 2012
All Households $43,180 -- -- $24,667 -- --
Hhlds. in Occ. Units $43,218 $21,631 $48,260 $23,913 $11,940 $37,813
HUD AMI - 2014 1$52,500 $26,300 $58,600 -- -- --
80% AMI $42,000 $21,000 $46,900 -- -- --
50% AMI $26,250 $13,100 $29,300 -- -- --
30% AMI $15,750 $7,900 $17,600 -- -- --
1 Averages are based on a 4-person household income limits established by US Dept. of
Housing and Urban Development (HUD); and splits by renter- and owner-occupied
households are estimated by LandUse|USA based on the census.
Source: Target Market Analysis and model by LandUse|USA, with underlying data from
the U.S. Census, HUD, and Experian Decision Analytics.
Totals may not sum exact due to rounding.
Sharon
Text Box
Exhibit A.3

Summary of Market Size and Annual Potential for New Urban Housing Units
The City of Fremont and Newaygo County, Michigan - 2012
Estimates of Potential by HUD Affordability Standards
City City City
Newaygo Newaygo Newaygo of of of
County County County Fremont Fremont Fremont
Total Renters Owners Total Renters Owners
Households - 2012
Census 18,478 2,972 15,506 1,718 437 1,281
Experian 18,605 2,992 15,613 1,785 454 1,331
Market Potential 1,733 1,328 405 107 81 26
100%+ AMI 544 417 127 36 27 9
80% - 100% AMI 200 154 47 11 9 3
50% - 80% AMI 367 281 86 21 16 5
30% - 50% AMI 284 218 66 19 14 5
<30% AMI 337 258 79 20 15 5
Hhlds. <80% AMI 988 757 231 59 45 15
Hhlds. <50% AMI 621 476 145 38 29 9
Hhlds. <30% AMI 337 258 79 20 15 5
Share <80% AMI 57% 57% 57% 56% 56% 55%
Share <50% AMI 36% 36% 36% 36% 36% 36%
Share <30% AMI 19% 19% 19% 18% 18% 18%
Med. Hhld. Inc. - 2012
All Households $43,180 -- -- $37,627 -- --
Hhlds. in Occ. Units $43,218 $21,631 $48,260 $35,687 $15,673 $47,591
HUD AMI - 2014 1$52,500 $26,300 $58,600 -- -- --
80% AMI $42,000 $21,000 $46,900 -- -- --
50% AMI $26,250 $13,100 $29,300 -- -- --
30% AMI $15,750 $7,900 $17,600 -- -- --
1 Averages are based on a 4-person household income limits established by US Dept. of
Housing and Urban Development (HUD); and splits by renter- and owner-occupied
households are estimated by LandUse|USA based on the census.
Source: Target Market Analysis and model by LandUse|USA, with underlying data from
the U.S. Census, HUD, and Experian Decision Analytics.
Totals may not sum exact due to rounding.
Sharon
Text Box
Exhibit A.4

Summary of Market Size and Annual Potential for New Urban Housing Units
The City of Newaygo and Newaygo County, Michigan - 2012
Estimates of Potential by HUD Affordability Standards
City City City
Newaygo Newaygo Newaygo of of of
County County County Newaygo Newaygo Newaygo
Total Renters Owners Total Renters Owners
Households - 2012
Census 18,478 2,972 15,506 797 385 412
Experian 18,605 2,992 15,613 781 377 404
Market Potential 1,733 1,328 405 54 48 8
100%+ AMI 544 417 127 17 15 2
80% - 100% AMI 200 154 47 6 5 1
50% - 80% AMI 367 281 86 11 10 1
30% - 50% AMI 284 218 66 9 8 1
<30% AMI 337 258 79 11 9 1
Hhlds. <80% AMI 988 757 231 31 28 4
Hhlds. <50% AMI 621 476 145 20 18 2
Hhlds. <30% AMI 337 258 79 11 9 1
Share <80% AMI 57% 57% 57% 58% 58% 46%
Share <50% AMI 36% 36% 36% 37% 37% 29%
Share <30% AMI 19% 19% 19% 20% 20% 16%
Med. Hhld. Inc. - 2012
All Households $43,180 -- -- $29,180 -- --
Hhlds. in Occ. Units $43,218 $21,631 $48,260 $32,083 $21,630 $46,635
HUD AMI - 2014 1$52,500 $26,300 $58,600 -- -- --
80% AMI $42,000 $21,000 $46,900 -- -- --
50% AMI $26,250 $13,100 $29,300 -- -- --
30% AMI $15,750 $7,900 $17,600 -- -- --
1 Averages are based on a 4-person household income limits established by US Dept. of
Housing and Urban Development (HUD); and splits by renter- and owner-occupied
households are estimated by LandUse|USA based on the census.
Source: Target Market Analysis and model by LandUse|USA, with underlying data from
the U.S. Census, HUD, and Experian Decision Analytics.
Totals may not sum exact due to rounding.
Sharon
Text Box
Exhibit A.5

Summary of Market Size and Annual Potential for New Urban Housing Units
The City of Grant and Newaygo County, Michigan - 2012
Estimates of Potential by HUD Affordability Standards
City City City
Newaygo Newaygo Newaygo of of of
County County County Grant Grant Grant
Total Renters Owners Total Renters Owners
Households - 2012
Census 18,478 2,972 15,506 360 164 196
Experian 18,605 2,992 15,613 314 143 171
Market Potential 1,733 1,328 405 49 40 10
100%+ AMI 544 417 127 15 12 3
80% - 100% AMI 200 154 47 5 4 1
50% - 80% AMI 367 281 86 10 9 2
30% - 50% AMI 284 218 66 9 7 2
<30% AMI 337 258 79 9 8 2
Hhlds. <80% AMI 988 757 231 29 23 5
Hhlds. <50% AMI 621 476 145 18 15 3
Hhlds. <30% AMI 337 258 79 9 8 2
Share <80% AMI 57% 57% 57% 59% 59% 54%
Share <50% AMI 36% 36% 36% 37% 37% 34%
Share <30% AMI 19% 19% 19% 19% 19% 18%
Med. Hhld. Inc. - 2012
All Households $43,180 -- -- $33,250 -- --
Hhlds. in Occ. Units $43,218 $21,631 $48,260 $33,558 $21,528 $40,500
HUD AMI - 2014 1$52,500 $26,300 $58,600 -- -- --
80% AMI $42,000 $21,000 $46,900 -- -- --
50% AMI $26,250 $13,100 $29,300 -- -- --
30% AMI $15,750 $7,900 $17,600 -- -- --
1 Averages are based on a 4-person household income limits established by US Dept. of
Housing and Urban Development (HUD); and splits by renter- and owner-occupied
households are estimated by LandUse|USA based on the census.
Source: Target Market Analysis and model by LandUse|USA, with underlying data from
the U.S. Census, HUD, and Experian Decision Analytics.
Totals may not sum exact due to rounding.
Sharon
Text Box
Exhibit A.6

Summary of Market Size and Annual Potential for New Urban Housing Units
The Village of Hesperia and Newaygo County, Michigan - 2012
Estimates of Potential by HUD Affordability Standards
Village Village Village
Newaygo Newaygo Newaygo of of of
County County County Hesperia Hesperia Hesperia
Total Renters Owners Total Renters Owners
Households - 2012
Census 18,478 2,972 15,506 395 150 245
Experian 18,605 2,992 15,613 358 136 222
Market Potential 1,733 1,328 405 42 37 7
100%+ AMI 544 417 127 9 8 1
80% - 100% AMI 200 154 47 5 4 1
50% - 80% AMI 367 281 86 10 9 1
30% - 50% AMI 284 218 66 9 8 1
<30% AMI 337 258 79 10 8 1
Hhlds. <80% AMI 988 757 231 28 24 4
Hhlds. <50% AMI 621 476 145 18 16 3
Hhlds. <30% AMI 337 258 79 10 8 1
Share <80% AMI 57% 57% 57% 67% 67% 59%
Share <50% AMI 36% 36% 36% 43% 43% 38%
Share <30% AMI 19% 19% 19% 22% 22% 20%
Med. Hhld. Inc. - 2012
All Households $43,180 -- -- $30,163 -- --
Hhlds. in Occ. Units $43,218 $21,631 $48,260 $30,104 $15,893 $38,309
HUD AMI - 2014 1$52,500 $26,300 $58,600 -- -- --
80% AMI $42,000 $21,000 $46,900 -- -- --
50% AMI $26,250 $13,100 $29,300 -- -- --
30% AMI $15,750 $7,900 $17,600 -- -- --
1 Averages are based on a 4-person household income limits established by US Dept. of
Housing and Urban Development (HUD); and splits by renter- and owner-occupied
households are estimated by LandUse|USA based on the census.
Source: Target Market Analysis and model by LandUse|USA, with underlying data from
the U.S. Census, HUD, and Experian Decision Analytics.
Totals may not sum exact due to rounding.
Sharon
Text Box
Exhibit A.7

Market Potential by Home Value Bracket (adjusted for the local market)
Totals for Newaygo County, Michigan - 2014
Target Market:
Newaygo
County
Dare to
Dream
Bohemian
Groove
Senior
Discounts
Diapers
and
Debit
Cards
Digital
Dependents
No Place
Like Home
Town
Elders
Enduring
Hardships
Unspoiled
Splendor
Rural
Escape
Total R66 K40 Q65 M45 O51 E20 Q64 S70 E21 J35
Home Value Brackets
$0 - $14,999 36 2 1 12 3 3 0 6 5 1 6
$15 - $24,999 62 2 2 12 5 8 0 12 6 1 12
$25 - $34,999 79 2 3 12 4 16 1 15 6 2 19
$35 - $49,999 130 1 5 18 2 31 2 22 8 8 33
$50 - $74,999 34 0 1 3 0 8 1 5 2 3 10
$75 - $99,999 22 0 1 3 0 5 1 3 1 3 7
$100 - $124,999 24 0 1 3 0 4 1 3 1 3 8
$125 - $149,999 10 0 0 1 0 1 0 1 0 2 4
$150 - $174,999 3 0 0 0 0 0 0 0 0 1 1
$175 - $199,999 2 0 0 0 0 0 0 0 0 0 1
$200 - $249,999 1 0 0 0 0 0 0 0 0 0 0
$250,000+ 1 0 0 0 0 0 0 0 0 0 0
Summation 404 7 14 65 14 78 5 67 28 24 102
Control Total 405 7 14 65 14 78 5 67 28 24 102
< $100,000 364 7 12 60 14 71 4 63 27 18 87
$100,000 + 40 0 2 5 0 7 1 4 1 6 15
Source: Target Market Analysis prepared by LandUse|USA © 2014 with all rights reserved.
Sharon
Text Box
Exhibit A.8
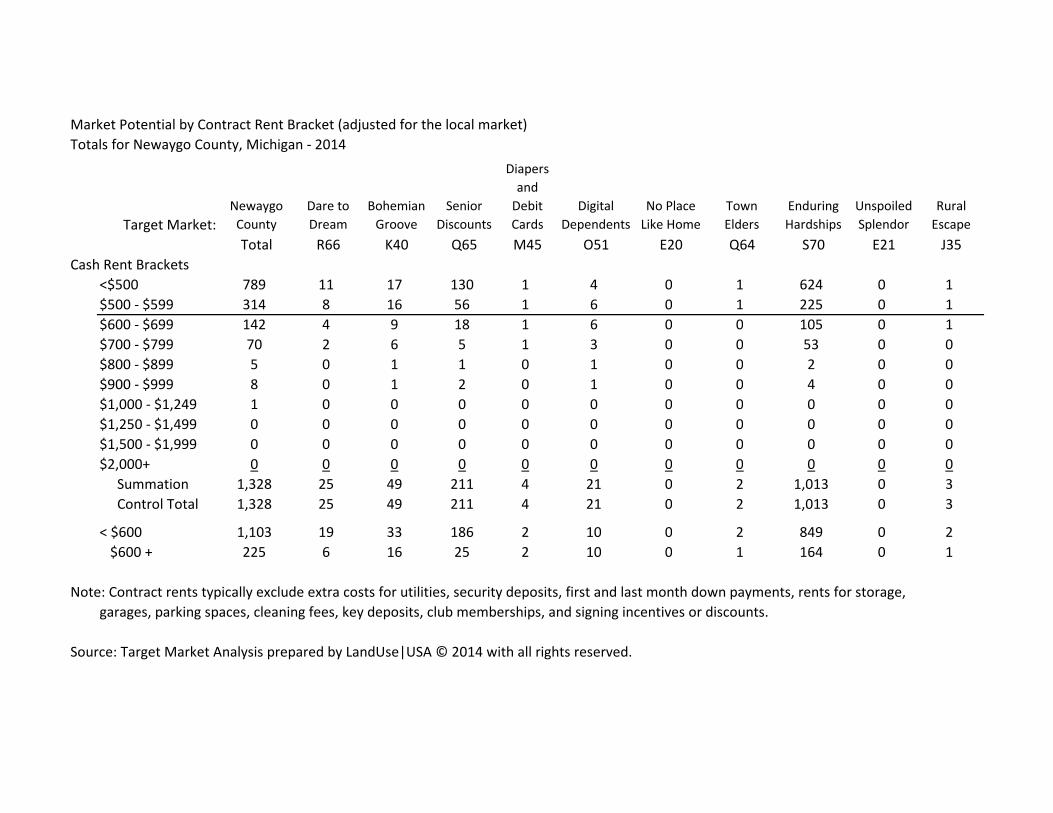
Market Potential by Contract Rent Bracket (adjusted for the local market)
Totals for Newaygo County, Michigan - 2014
Target Market:
Newaygo
County
Dare to
Dream
Bohemian
Groove
Senior
Discounts
Diapers
and
Debit
Cards
Digital
Dependents
No Place
Like Home
Town
Elders
Enduring
Hardships
Unspoiled
Splendor
Rural
Escape
Total R66 K40 Q65 M45 O51 E20 Q64 S70 E21 J35
Cash Rent Brackets
<$500 789 11 17 130 1 4 0 1 624 0 1
$500 - $599 314 8 16 56 1 6 0 1 225 0 1
$600 - $699 142 4 9 18 1 6 0 0 105 0 1
$700 - $799 70 2 6 5 1 3 0 0 53 0 0
$800 - $899 5 0 1 1 0 1 0 0 2 0 0
$900 - $999 8 0 1 2 0 1 0 0 4 0 0
$1,000 - $1,249 1 0 0 0 0 0 0 0 0 0 0
$1,250 - $1,499 0 0 0 0 0 0 0 0 0 0 0
$1,500 - $1,999 0 0 0 0 0 0 0 0 0 0 0
$2,000+ 0 0 0 0 0 0 0 0 0 0 0
Summation 1,328 25 49 211 4 21 0 2 1,013 0 3
Control Total 1,328 25 49 211 4 21 0 2 1,013 0 3
< $600 1,103 19 33 186 2 10 0 2 849 0 2
$600 + 225 6 16 25 2 10 0 1 164 0 1
Note: Contract rents typically exclude extra costs for utilities, security deposits, first and last month down payments, rents for storage,
garages, parking spaces, cleaning fees, key deposits, club memberships, and signing incentives or discounts.
Source: Target Market Analysis prepared by LandUse|USA © 2014 with all rights reserved.
Sharon
Text Box
Exhibit A.9
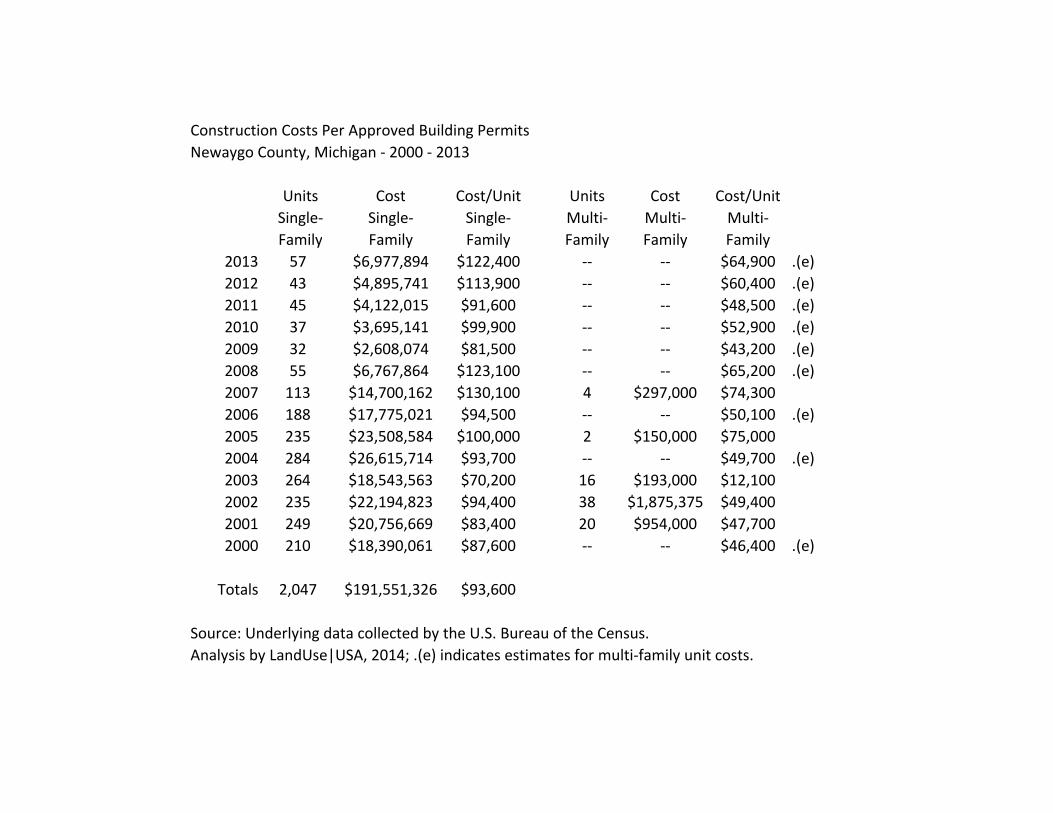
Construction Costs Per Approved Building Permits
Newaygo County, Michigan - 2000 - 2013
Units Cost Cost/Unit Units Cost Cost/Unit
Single- Single- Single- Multi- Multi- Multi-
Family Family Family Family Family Family
2013 57 $6,977,894 $122,400 -- -- $64,900 .(e)
2012 43 $4,895,741 $113,900 -- -- $60,400 .(e)
2011 45 $4,122,015 $91,600 -- -- $48,500 .(e)
2010 37 $3,695,141 $99,900 -- -- $52,900 .(e)
2009 32 $2,608,074 $81,500 -- -- $43,200 .(e)
2008 55 $6,767,864 $123,100 -- -- $65,200 .(e)
2007 113 $14,700,162 $130,100 4 $297,000 $74,300
2006 188 $17,775,021 $94,500 -- -- $50,100 .(e)
2005 235 $23,508,584 $100,000 2 $150,000 $75,000
2004 284 $26,615,714 $93,700 -- -- $49,700 .(e)
2003 264 $18,543,563 $70,200 16 $193,000 $12,100
2002 235 $22,194,823 $94,400 38 $1,875,375 $49,400
2001 249 $20,756,669 $83,400 20 $954,000 $47,700
2000 210 $18,390,061 $87,600 -- -- $46,400 .(e)
Totals 2,047 $191,551,326 $93,600
Source: Underlying data collected by the U.S. Bureau of the Census.
Analysis by LandUse|USA, 2014; .(e) indicates estimates for multi-family unit costs.
Sharon
Text Box
Exhibit A.10
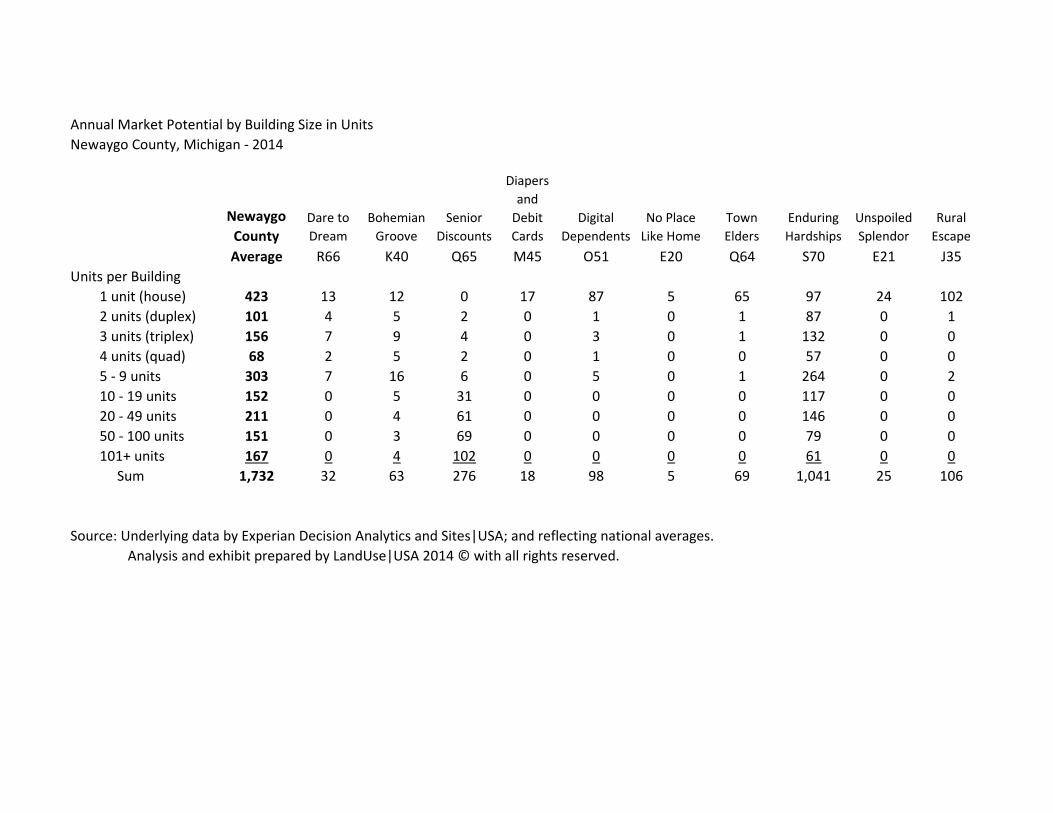
Annual Market Potential by Building Size in Units
Newaygo County, Michigan - 2014
Newaygo
CountyDare to
Dream
Bohemian
Groove
Senior
Discounts
Diapers
and
Debit
Cards
Digital
Dependents
No Place
Like Home
Town
Elders
Enduring
Hardships
Unspoiled
Splendor
Rural
Escape
Average R66 K40 Q65 M45 O51 E20 Q64 S70 E21 J35
Units per Building
1 unit (house) 423 13 12 0 17 87 5 65 97 24 102
2 units (duplex) 101 4 5 2 0 1 0 1 87 0 1
3 units (triplex) 156 7 9 4 0 3 0 1 132 0 0
4 units (quad) 68 2 5 2 0 1 0 0 57 0 0
5 - 9 units 303 7 16 6 0 5 0 1 264 0 2
10 - 19 units 152 0 5 31 0 0 0 0 117 0 0
20 - 49 units 211 0 4 61 0 0 0 0 146 0 0
50 - 100 units 151 0 3 69 0 0 0 0 79 0 0
101+ units 167 0 4 102 0 0 0 0 61 0 0
Sum 1,732 32 63 276 18 98 5 69 1,041 25 106
Source: Underlying data by Experian Decision Analytics and Sites|USA; and reflecting national averages.
Analysis and exhibit prepared by LandUse|USA 2014 © with all rights reserved.
Sharon
Text Box
Exhibit A.11
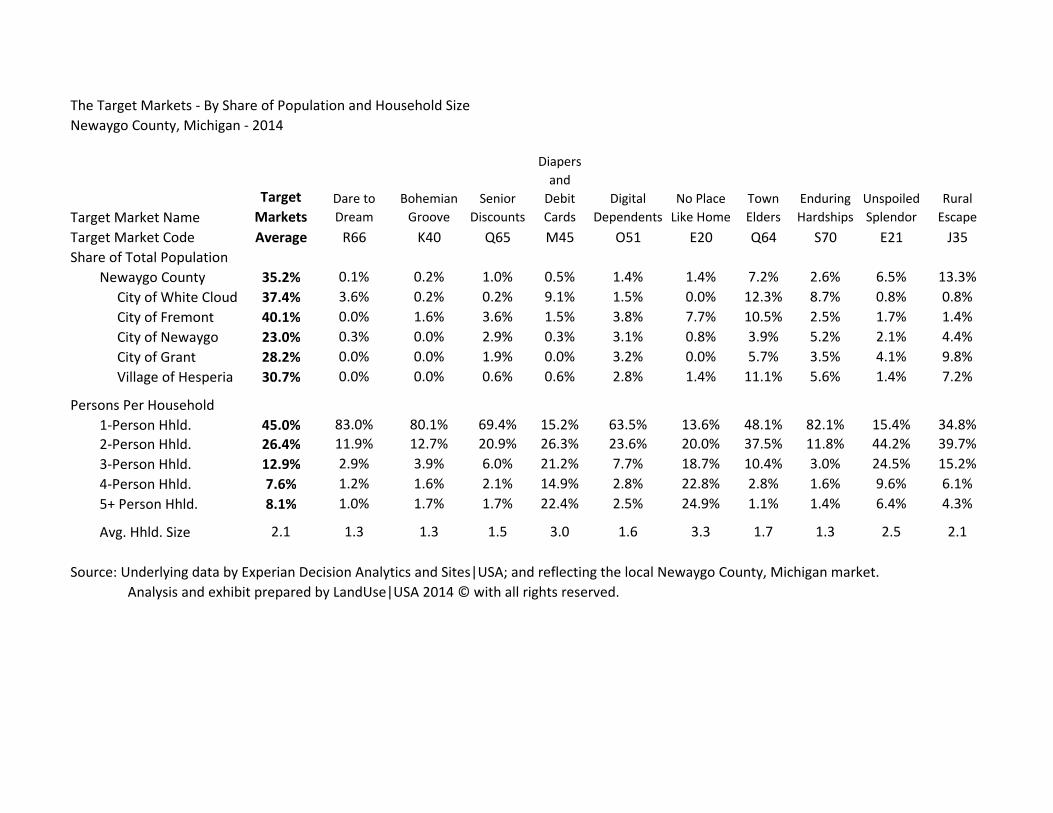
The Target Markets - By Share of Population and Household Size
Newaygo County, Michigan - 2014
Target Market Name
Target
MarketsDare to
Dream
Bohemian
Groove
Senior
Discounts
Diapers
and
Debit
Cards
Digital
Dependents
No Place
Like Home
Town
Elders
Enduring
Hardships
Unspoiled
Splendor
Rural
Escape
Target Market Code Average R66 K40 Q65 M45 O51 E20 Q64 S70 E21 J35
Share of Total Population
Newaygo County 35.2% 0.1% 0.2% 1.0% 0.5% 1.4% 1.4% 7.2% 2.6% 6.5% 13.3%
City of White Cloud 37.4% 3.6% 0.2% 0.2% 9.1% 1.5% 0.0% 12.3% 8.7% 0.8% 0.8%
City of Fremont 40.1% 0.0% 1.6% 3.6% 1.5% 3.8% 7.7% 10.5% 2.5% 1.7% 1.4%
City of Newaygo 23.0% 0.3% 0.0% 2.9% 0.3% 3.1% 0.8% 3.9% 5.2% 2.1% 4.4%
City of Grant 28.2% 0.0% 0.0% 1.9% 0.0% 3.2% 0.0% 5.7% 3.5% 4.1% 9.8%
Village of Hesperia 30.7% 0.0% 0.0% 0.6% 0.6% 2.8% 1.4% 11.1% 5.6% 1.4% 7.2%
Persons Per Household
1-Person Hhld. 45.0% 83.0% 80.1% 69.4% 15.2% 63.5% 13.6% 48.1% 82.1% 15.4% 34.8%
2-Person Hhld. 26.4% 11.9% 12.7% 20.9% 26.3% 23.6% 20.0% 37.5% 11.8% 44.2% 39.7%
3-Person Hhld. 12.9% 2.9% 3.9% 6.0% 21.2% 7.7% 18.7% 10.4% 3.0% 24.5% 15.2%
4-Person Hhld. 7.6% 1.2% 1.6% 2.1% 14.9% 2.8% 22.8% 2.8% 1.6% 9.6% 6.1%
5+ Person Hhld. 8.1% 1.0% 1.7% 1.7% 22.4% 2.5% 24.9% 1.1% 1.4% 6.4% 4.3%
Avg. Hhld. Size 2.1 1.3 1.3 1.5 3.0 1.6 3.3 1.7 1.3 2.5 2.1
Source: Underlying data by Experian Decision Analytics and Sites|USA; and reflecting the local Newaygo County, Michigan market.
Analysis and exhibit prepared by LandUse|USA 2014 © with all rights reserved.
Sharon
Text Box
Exhibit A.12
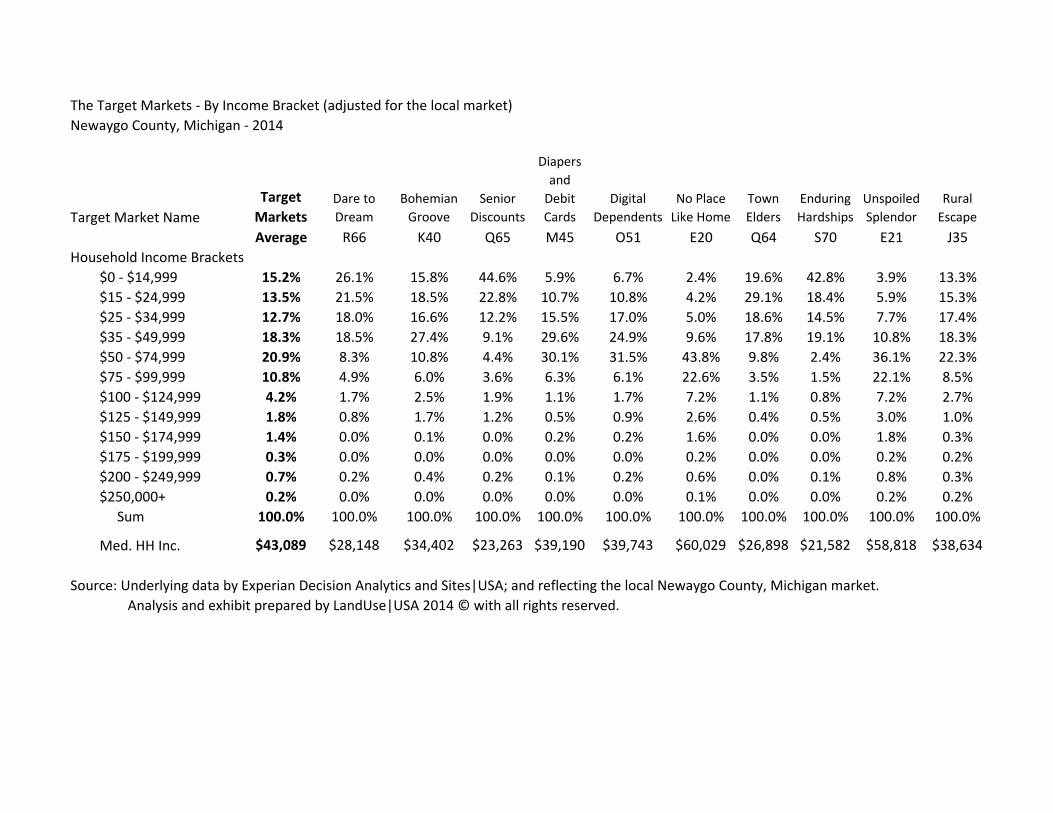
The Target Markets - By Income Bracket (adjusted for the local market)
Newaygo County, Michigan - 2014
Target Market Name
Target
MarketsDare to
Dream
Bohemian
Groove
Senior
Discounts
Diapers
and
Debit
Cards
Digital
Dependents
No Place
Like Home
Town
Elders
Enduring
Hardships
Unspoiled
Splendor
Rural
Escape
Average R66 K40 Q65 M45 O51 E20 Q64 S70 E21 J35
Household Income Brackets
$0 - $14,999 15.2% 26.1% 15.8% 44.6% 5.9% 6.7% 2.4% 19.6% 42.8% 3.9% 13.3%
$15 - $24,999 13.5% 21.5% 18.5% 22.8% 10.7% 10.8% 4.2% 29.1% 18.4% 5.9% 15.3%
$25 - $34,999 12.7% 18.0% 16.6% 12.2% 15.5% 17.0% 5.0% 18.6% 14.5% 7.7% 17.4%
$35 - $49,999 18.3% 18.5% 27.4% 9.1% 29.6% 24.9% 9.6% 17.8% 19.1% 10.8% 18.3%
$50 - $74,999 20.9% 8.3% 10.8% 4.4% 30.1% 31.5% 43.8% 9.8% 2.4% 36.1% 22.3%
$75 - $99,999 10.8% 4.9% 6.0% 3.6% 6.3% 6.1% 22.6% 3.5% 1.5% 22.1% 8.5%
$100 - $124,999 4.2% 1.7% 2.5% 1.9% 1.1% 1.7% 7.2% 1.1% 0.8% 7.2% 2.7%
$125 - $149,999 1.8% 0.8% 1.7% 1.2% 0.5% 0.9% 2.6% 0.4% 0.5% 3.0% 1.0%
$150 - $174,999 1.4% 0.0% 0.1% 0.0% 0.2% 0.2% 1.6% 0.0% 0.0% 1.8% 0.3%
$175 - $199,999 0.3% 0.0% 0.0% 0.0% 0.0% 0.0% 0.2% 0.0% 0.0% 0.2% 0.2%
$200 - $249,999 0.7% 0.2% 0.4% 0.2% 0.1% 0.2% 0.6% 0.0% 0.1% 0.8% 0.3%
$250,000+ 0.2% 0.0% 0.0% 0.0% 0.0% 0.0% 0.1% 0.0% 0.0% 0.2% 0.2%
Sum 100.0% 100.0% 100.0% 100.0% 100.0% 100.0% 100.0% 100.0% 100.0% 100.0% 100.0%
Med. HH Inc. $43,089 $28,148 $34,402 $23,263 $39,190 $39,743 $60,029 $26,898 $21,582 $58,818 $38,634
Source: Underlying data by Experian Decision Analytics and Sites|USA; and reflecting the local Newaygo County, Michigan market.
Analysis and exhibit prepared by LandUse|USA 2014 © with all rights reserved.
Sharon
Text Box
Exhibit A.13

The Target Markets - By Home Value Bracket (adjusted for the local market)
Newaygo County, Michigan - 2014
Target Market Name
Target
MarketsDare to
Dream
Bohemian
Groove
Senior
Discounts
Diapers
and
Debit
Cards
Digital
Dependents
No Place
Like Home
Town
Elders
Enduring
Hardships
Unspoiled
Splendor
Rural
Escape
Target Market Codes Average R66 K40 Q65 M45 O51 E20 Q64 S70 E21 J35
Home Value Brackets
Less than $50,000 8.6% 21.9% 5.0% 18.6% 17.5% 3.7% 1.1% 8.6% 16.2% 2.0% 5.6%
$50,000-$74,999 14.9% 30.5% 12.8% 19.1% 33.0% 10.4% 5.3% 18.4% 23.1% 6.0% 12.2%
$75,000-$99,999 17.1% 20.6% 20.2% 19.1% 28.4% 21.0% 10.1% 22.2% 20.7% 10.1% 18.3%
$100,000-$149,999 30.0% 19.4% 35.5% 27.6% 17.0% 39.8% 37.1% 33.5% 27.5% 31.5% 32.6%
$150,000-$174,999 9.3% 3.1% 8.2% 4.5% 2.6% 10.7% 15.3% 7.3% 6.2% 14.0% 9.8%
$175,000-$199,999 6.5% 1.9% 6.8% 4.0% 0.8% 6.1% 10.5% 4.1% 2.5% 10.5% 6.7%
$200,000-$249,999 7.7% 1.6% 5.7% 4.7% 0.4% 5.6% 12.5% 4.0% 2.5% 14.1% 8.1%
$250,000-$299,999 3.5% 0.7% 3.3% 1.4% 0.2% 1.9% 5.0% 1.4% 0.7% 6.8% 3.5%
$300,000-$349,999 1.2% 0.2% 1.2% 0.5% 0.0% 0.5% 1.6% 0.4% 0.4% 2.4% 1.4%
$350,000-$399,999 0.6% 0.1% 0.9% 0.3% 0.0% 0.2% 0.8% 0.1% 0.0% 1.3% 0.7%
$400,000-$499,999 0.3% 0.0% 0.3% 0.1% 0.0% 0.1% 0.3% 0.0% 0.1% 0.7% 0.5%
$500,000-$749,999 0.2% 0.0% 0.1% 0.1% 0.0% 0.1% 0.2% 0.0% 0.1% 0.5% 0.4%
Sum 99.9% 100.0% 100.0% 100.0% 100.0% 100.0% 100.0% 100.0% 99.9% 99.8% 99.8%
Source: Underlying data by Experian Decision Analytics and Sites|USA; and reflecting the local Newaygo County, Michigan market.
Analysis and exhibit prepared by LandUse|USA 2014 © with all rights reserved.
Sharon
Text Box
Exhibit A.14
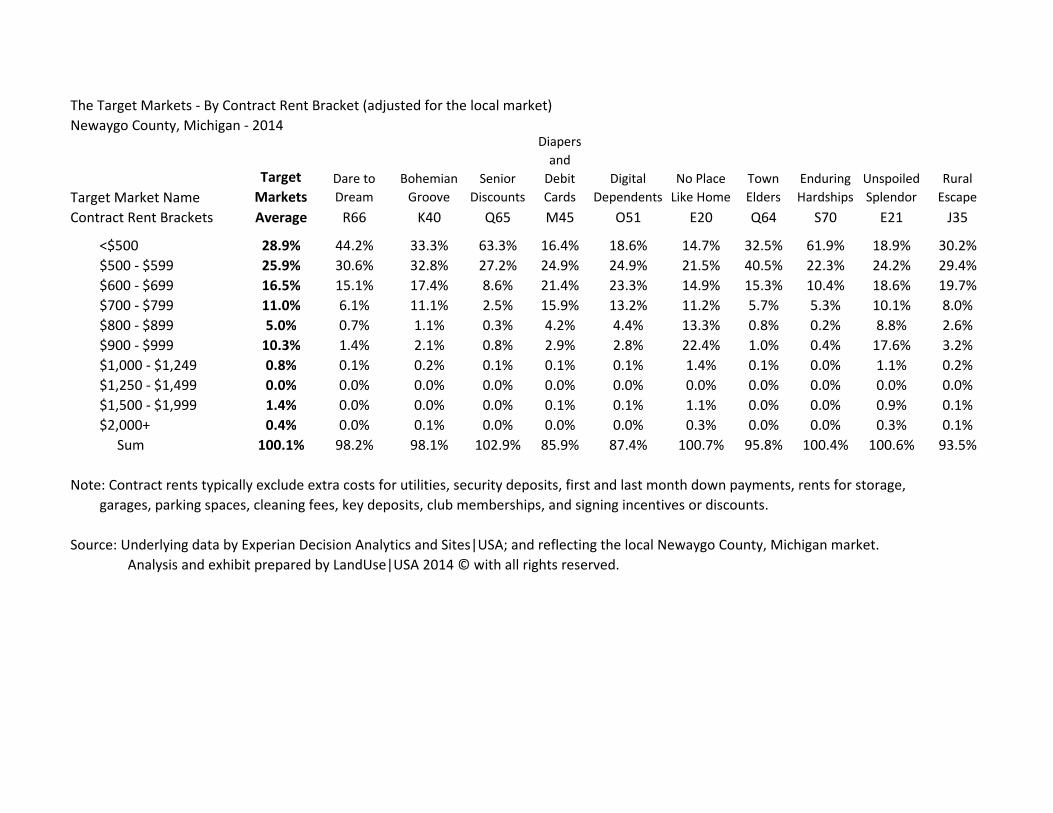
The Target Markets - By Contract Rent Bracket (adjusted for the local market)
Newaygo County, Michigan - 2014
Target Market Name
Target
MarketsDare to
Dream
Bohemian
Groove
Senior
Discounts
Diapers
and
Debit
Cards
Digital
Dependents
No Place
Like Home
Town
Elders
Enduring
Hardships
Unspoiled
Splendor
Rural
Escape
Contract Rent Brackets Average R66 K40 Q65 M45 O51 E20 Q64 S70 E21 J35
<$500 28.9% 44.2% 33.3% 63.3% 16.4% 18.6% 14.7% 32.5% 61.9% 18.9% 30.2%
$500 - $599 25.9% 30.6% 32.8% 27.2% 24.9% 24.9% 21.5% 40.5% 22.3% 24.2% 29.4%
$600 - $699 16.5% 15.1% 17.4% 8.6% 21.4% 23.3% 14.9% 15.3% 10.4% 18.6% 19.7%
$700 - $799 11.0% 6.1% 11.1% 2.5% 15.9% 13.2% 11.2% 5.7% 5.3% 10.1% 8.0%
$800 - $899 5.0% 0.7% 1.1% 0.3% 4.2% 4.4% 13.3% 0.8% 0.2% 8.8% 2.6%
$900 - $999 10.3% 1.4% 2.1% 0.8% 2.9% 2.8% 22.4% 1.0% 0.4% 17.6% 3.2%
$1,000 - $1,249 0.8% 0.1% 0.2% 0.1% 0.1% 0.1% 1.4% 0.1% 0.0% 1.1% 0.2%
$1,250 - $1,499 0.0% 0.0% 0.0% 0.0% 0.0% 0.0% 0.0% 0.0% 0.0% 0.0% 0.0%
$1,500 - $1,999 1.4% 0.0% 0.0% 0.0% 0.1% 0.1% 1.1% 0.0% 0.0% 0.9% 0.1%
$2,000+ 0.4% 0.0% 0.1% 0.0% 0.0% 0.0% 0.3% 0.0% 0.0% 0.3% 0.1%
Sum 100.1% 98.2% 98.1% 102.9% 85.9% 87.4% 100.7% 95.8% 100.4% 100.6% 93.5%
Note: Contract rents typically exclude extra costs for utilities, security deposits, first and last month down payments, rents for storage,
garages, parking spaces, cleaning fees, key deposits, club memberships, and signing incentives or discounts.
Source: Underlying data by Experian Decision Analytics and Sites|USA; and reflecting the local Newaygo County, Michigan market.
Analysis and exhibit prepared by LandUse|USA 2014 © with all rights reserved.
Sharon
Text Box
Exhibit A.15
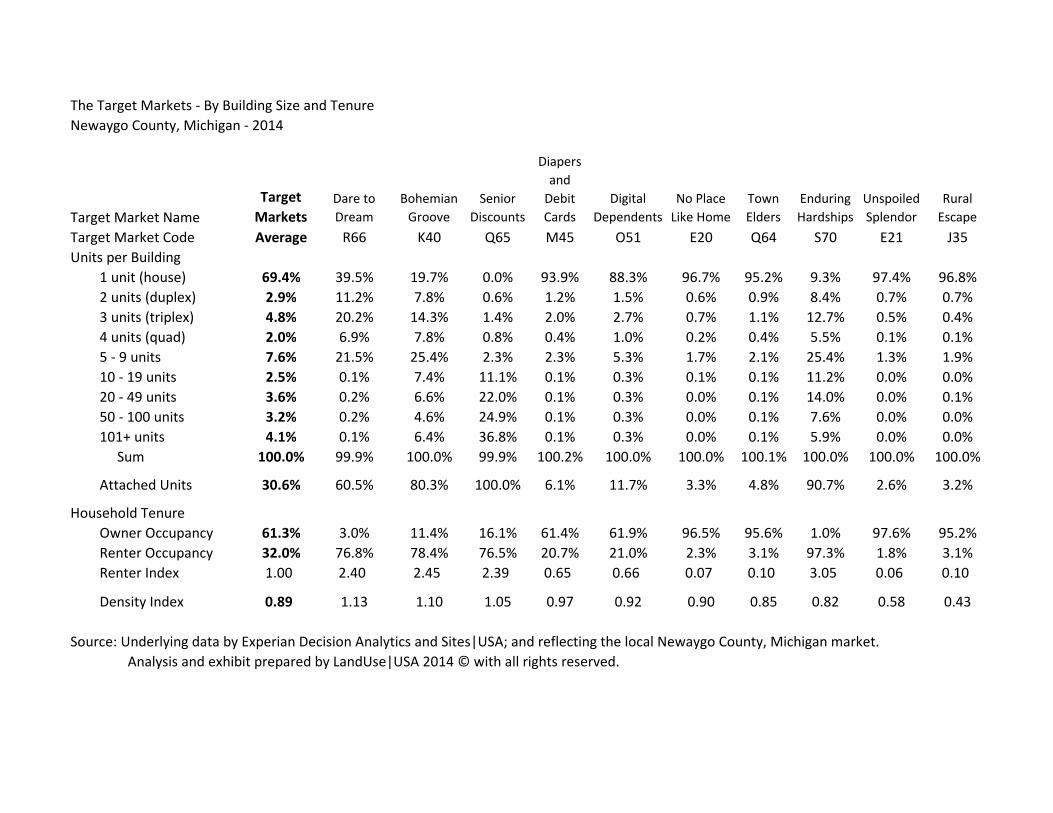
The Target Markets - By Building Size and Tenure
Newaygo County, Michigan - 2014
Target Market Name
Target
MarketsDare to
Dream
Bohemian
Groove
Senior
Discounts
Diapers
and
Debit
Cards
Digital
Dependents
No Place
Like Home
Town
Elders
Enduring
Hardships
Unspoiled
Splendor
Rural
Escape
Target Market Code Average R66 K40 Q65 M45 O51 E20 Q64 S70 E21 J35
Units per Building
1 unit (house) 69.4% 39.5% 19.7% 0.0% 93.9% 88.3% 96.7% 95.2% 9.3% 97.4% 96.8%
2 units (duplex) 2.9% 11.2% 7.8% 0.6% 1.2% 1.5% 0.6% 0.9% 8.4% 0.7% 0.7%
3 units (triplex) 4.8% 20.2% 14.3% 1.4% 2.0% 2.7% 0.7% 1.1% 12.7% 0.5% 0.4%
4 units (quad) 2.0% 6.9% 7.8% 0.8% 0.4% 1.0% 0.2% 0.4% 5.5% 0.1% 0.1%
5 - 9 units 7.6% 21.5% 25.4% 2.3% 2.3% 5.3% 1.7% 2.1% 25.4% 1.3% 1.9%
10 - 19 units 2.5% 0.1% 7.4% 11.1% 0.1% 0.3% 0.1% 0.1% 11.2% 0.0% 0.0%
20 - 49 units 3.6% 0.2% 6.6% 22.0% 0.1% 0.3% 0.0% 0.1% 14.0% 0.0% 0.1%
50 - 100 units 3.2% 0.2% 4.6% 24.9% 0.1% 0.3% 0.0% 0.1% 7.6% 0.0% 0.0%
101+ units 4.1% 0.1% 6.4% 36.8% 0.1% 0.3% 0.0% 0.1% 5.9% 0.0% 0.0%
Sum 100.0% 99.9% 100.0% 99.9% 100.2% 100.0% 100.0% 100.1% 100.0% 100.0% 100.0%
Attached Units 30.6% 60.5% 80.3% 100.0% 6.1% 11.7% 3.3% 4.8% 90.7% 2.6% 3.2%
Household Tenure
Owner Occupancy 61.3% 3.0% 11.4% 16.1% 61.4% 61.9% 96.5% 95.6% 1.0% 97.6% 95.2%
Renter Occupancy 32.0% 76.8% 78.4% 76.5% 20.7% 21.0% 2.3% 3.1% 97.3% 1.8% 3.1%
Renter Index 1.00 2.40 2.45 2.39 0.65 0.66 0.07 0.10 3.05 0.06 0.10
Density Index 0.89 1.13 1.10 1.05 0.97 0.92 0.90 0.85 0.82 0.58 0.43
Source: Underlying data by Experian Decision Analytics and Sites|USA; and reflecting the local Newaygo County, Michigan market.
Analysis and exhibit prepared by LandUse|USA 2014 © with all rights reserved.
Sharon
Text Box
Exhibit A.16

($/0.
($./+
($'--
0*,
/*(
./+
./)
,)0
)+'
(')
' )'' +'' -'' /'' ($''' ($)'' ($+'' ($-'' ($/'' )$'''
6HXL ZU 6XLHS ` D--
ELTPUX 6PYJU[TZY ` C-,
4UOLSPHT 9XUU\L ` =+'
5URRLNLY ! 5HMLY ` A,*
8HSPR_ 8[T%ZHYZPJ ` 4'0
6PNPZHR 6LVLTKLTZY ` A,(
6PHVLXY ! 6LIPZ 5HXKY ` ?+,
3NPTN PT BRHJL ` <*+
FU]T 7RKLXY ` C-+
7TK[XPTN ;HXKYOPVY ` E.'
;U[YLOURKY VLX EW[HXL ?PRL
9LTLXH
RG
XIHT
`G
XIHT
5LTZL
X`
GXI
HT
5UXL
FHXNLZ ?HXQLZY 5[XXLTZR_ >P\PTN PT @L]H_NU$ =LTZ$ HTK ?[YQLNUT 5U[TZPLY
I_ ;U[YLOURK 6LTYPZ_ ";U[YLOURKY VLX EW[HXL ?PRL#%)'(*
EUXZLK UT ZOL GXIHT ZU D[XHR FXHTYLJZ
;O
EU[XJL1 GTKLXR_PTN KHZH VXU\PKLK I_ 7^VLXPHT2 VU]LXLK I_ EPZLY`GE3& 6HZH HTHR_YPY HTK L^OPIPZ VXLVHXLK I_
>HTKGYL`GE3 ]PZO HRR XPNOZY XLYLX\LK a)'(+&
poe
Typewritten Text
Sharon
Rectangle
Sharon
Text Box
Households per Square Mile
Sharon
Text Box
Exhibit A.17
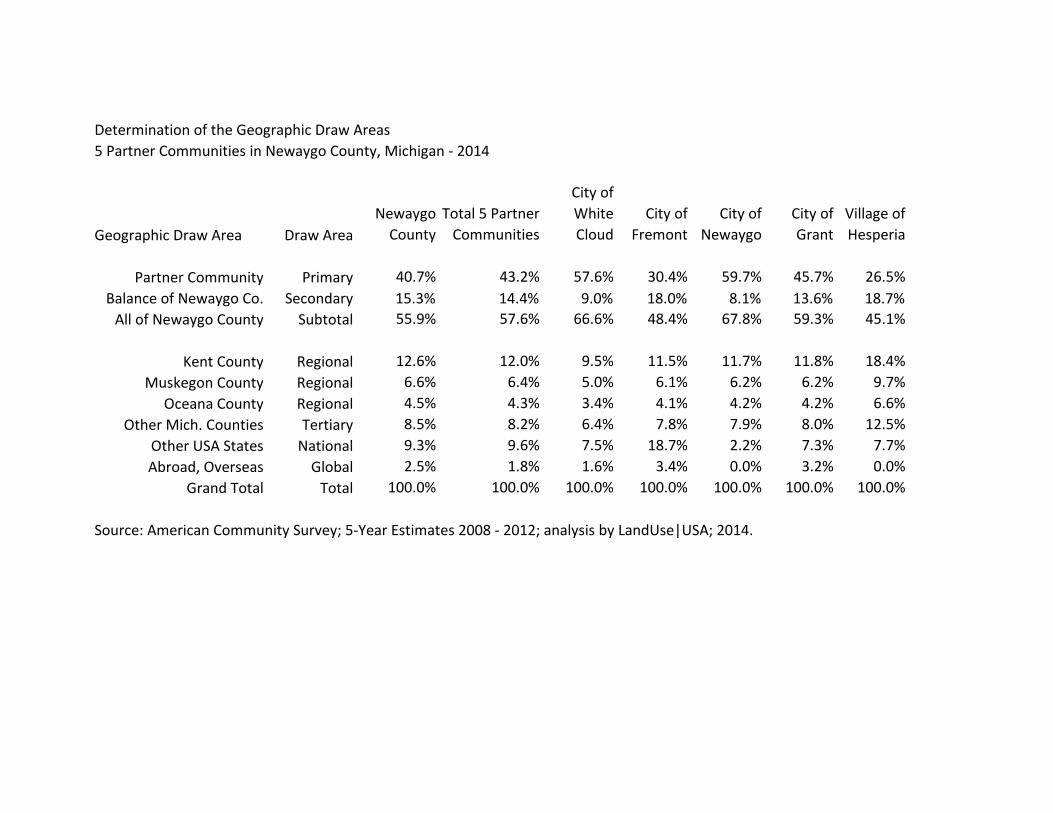
Determination of the Geographic Draw Areas
5 Partner Communities in Newaygo County, Michigan - 2014
Geographic Draw Area Draw Area
Newaygo
County
Total 5 Partner
Communities
City of
White
Cloud
City of
Fremont
City of
Newaygo
City of
Grant
Village of
Hesperia
Partner Community Primary 40.7% 43.2% 57.6% 30.4% 59.7% 45.7% 26.5%
Balance of Newaygo Co. Secondary 15.3% 14.4% 9.0% 18.0% 8.1% 13.6% 18.7%
All of Newaygo County Subtotal 55.9% 57.6% 66.6% 48.4% 67.8% 59.3% 45.1%
Kent County Regional 12.6% 12.0% 9.5% 11.5% 11.7% 11.8% 18.4%
Muskegon County Regional 6.6% 6.4% 5.0% 6.1% 6.2% 6.2% 9.7%
Oceana County Regional 4.5% 4.3% 3.4% 4.1% 4.2% 4.2% 6.6%
Other Mich. Counties Tertiary 8.5% 8.2% 6.4% 7.8% 7.9% 8.0% 12.5%
Other USA States National 9.3% 9.6% 7.5% 18.7% 2.2% 7.3% 7.7%
Abroad, Overseas Global 2.5% 1.8% 1.6% 3.4% 0.0% 3.2% 0.0%
Grand Total Total 100.0% 100.0% 100.0% 100.0% 100.0% 100.0% 100.0%
Source: American Community Survey; 5-Year Estimates 2008 - 2012; analysis by LandUse|USA; 2014.
Sharon
Text Box
Exhibit A.18
Prepared by:
Prepared for:
Target Market Analysis
Newaygo Co., MI
Strategy Report
July 18, 2014
Contents:
Placemaking Attributes
Downtown Environment

Map of Newaygo County in Southwest Michigan
Sharon
Text Box
Exhibit B.1
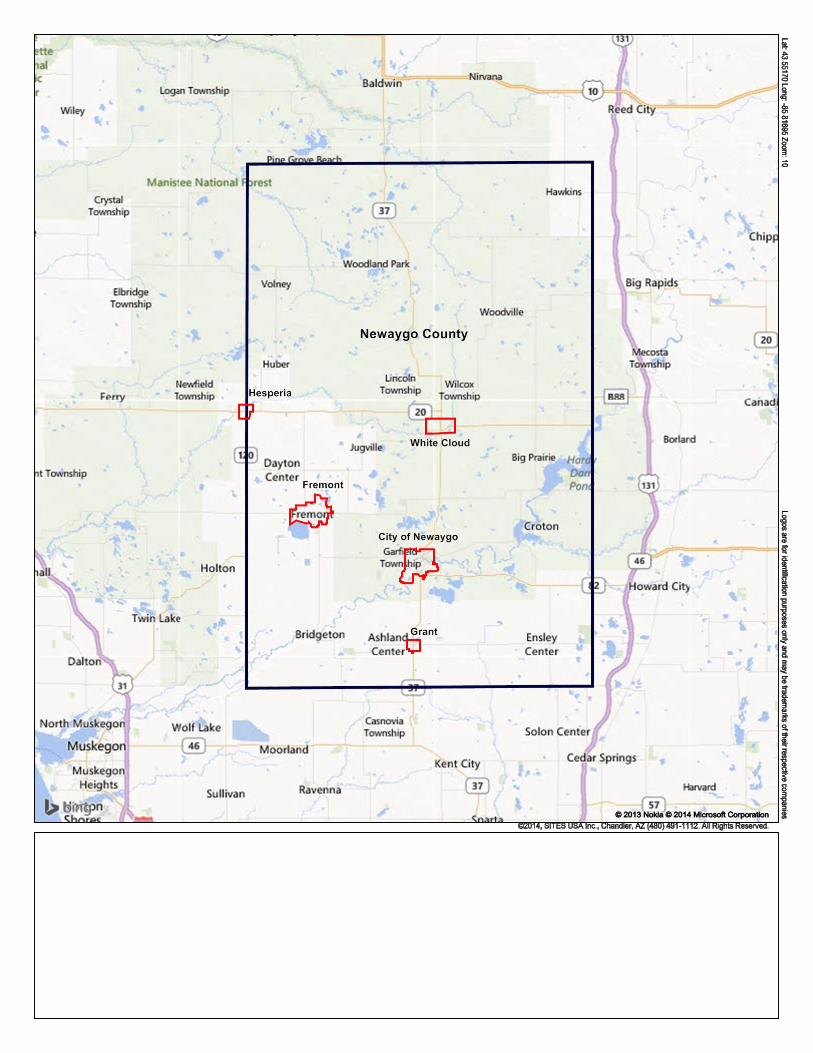
poe
Typewritten Text
poe
Typewritten Text
poe
Typewritten Text
poe
Typewritten Text
poe
Typewritten Text
Map of Selected Communities in Newaygo County, Michigan
poe
Typewritten Text
poe
Typewritten Text
poe
Typewritten Text
poe
Typewritten Text
poe
Typewritten Text
poe
Typewritten Text
poe
Typewritten Text
poe
Typewritten Text
Sharon
Text Box
Exhibit B.2
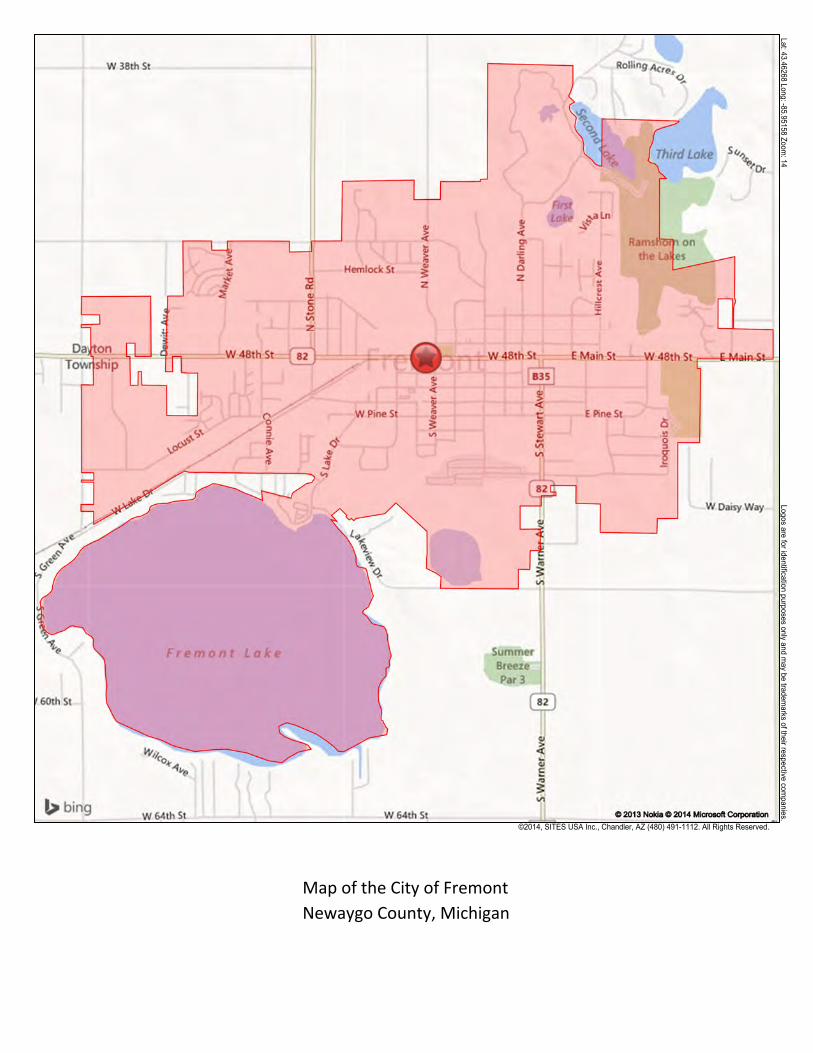
Lat: 43.46268 Long: -85.95158 Zoom: 14
Logos are for identification purposes only and may be tradem
arks of their respective companies.
©2014, SITES USA Inc., Chandler, AZ (480) 491-1112. All Rights Reserved.
Map of the City of Fremont Newaygo County, Michigan
Sharon
Text Box
Exhibit B.3
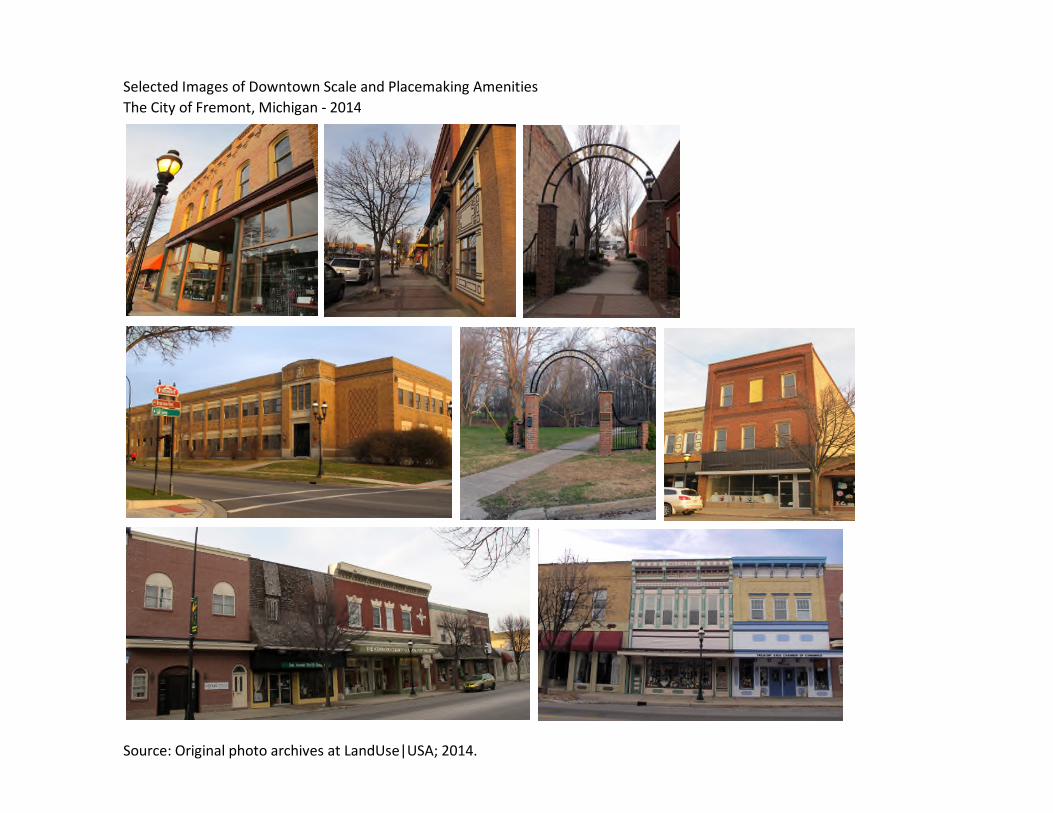
Selected Images of Downtown Scale and Placemaking Amenities
The City of Fremont, Michigan - 2014
Source: Original photo archives at LandUse|USA; 2014.
Sharon
Text Box
Exhibit B.4
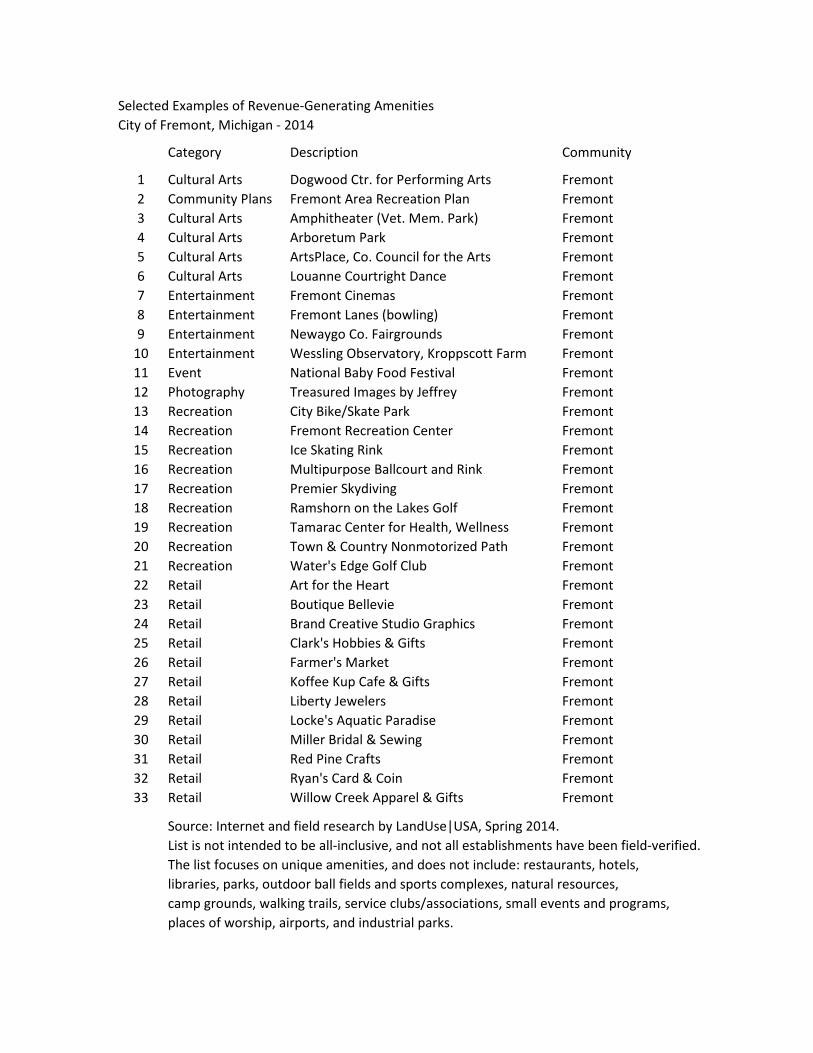
Selected Examples of Revenue-Generating Amenities
City of Fremont, Michigan - 2014
Category Description Community
1 Cultural Arts Dogwood Ctr. for Performing Arts Fremont
2 Community Plans Fremont Area Recreation Plan Fremont
3 Cultural Arts Amphitheater (Vet. Mem. Park) Fremont
4 Cultural Arts Arboretum Park Fremont
5 Cultural Arts ArtsPlace, Co. Council for the Arts Fremont
6 Cultural Arts Louanne Courtright Dance Fremont
7 Entertainment Fremont Cinemas Fremont
8 Entertainment Fremont Lanes (bowling) Fremont
9 Entertainment Newaygo Co. Fairgrounds Fremont
10 Entertainment Wessling Observatory, Kroppscott Farm Fremont
11 Event National Baby Food Festival Fremont
12 Photography Treasured Images by Jeffrey Fremont
13 Recreation City Bike/Skate Park Fremont
14 Recreation Fremont Recreation Center Fremont
15 Recreation Ice Skating Rink Fremont
16 Recreation Multipurpose Ballcourt and Rink Fremont
17 Recreation Premier Skydiving Fremont
18 Recreation Ramshorn on the Lakes Golf Fremont
19 Recreation Tamarac Center for Health, Wellness Fremont
20 Recreation Town & Country Nonmotorized Path Fremont
21 Recreation Water's Edge Golf Club Fremont
22 Retail Art for the Heart Fremont
23 Retail Boutique Bellevie Fremont
24 Retail Brand Creative Studio Graphics Fremont
25 Retail Clark's Hobbies & Gifts Fremont
26 Retail Farmer's Market Fremont
27 Retail Koffee Kup Cafe & Gifts Fremont
28 Retail Liberty Jewelers Fremont
29 Retail Locke's Aquatic Paradise Fremont
30 Retail Miller Bridal & Sewing Fremont
31 Retail Red Pine Crafts Fremont
32 Retail Ryan's Card & Coin Fremont
33 Retail Willow Creek Apparel & Gifts Fremont
Source: Internet and field research by LandUse|USA, Spring 2014.
List is not intended to be all-inclusive, and not all establishments have been field-verified.
The list focuses on unique amenities, and does not include: restaurants, hotels,
libraries, parks, outdoor ball fields and sports complexes, natural resources,
camp grounds, walking trails, service clubs/associations, small events and programs,
places of worship, airports, and industrial parks.
Sharon
Text Box
Exhibit B.5

Lat: 43.41182 Long: -85.80212 Zoom: 14
Logos are for identification purposes only and may be tradem
arks of their respective companies.
©2014, SITES USA Inc., Chandler, AZ (480) 491-1112. All Rights Reserved.
Map of the City of Newaygo Newaygo County, Michigan
Sharon
Text Box
Exhibit B.6

Selected Images of Downtown Scale and Placemaking Amenities
The City of Newaygo, Michigan - 2014
Source: Original photo archives at LandUse|USA; 2014.
Sharon
Text Box
Exhibit B.7
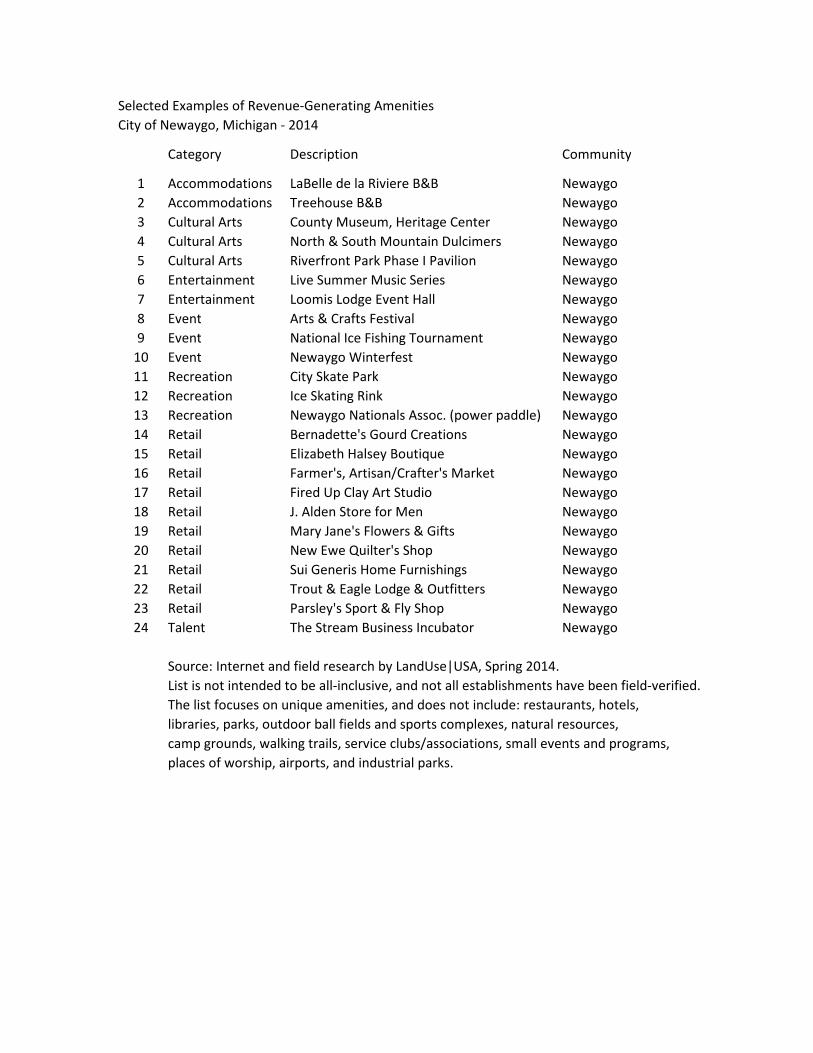
Selected Examples of Revenue-Generating Amenities
City of Newaygo, Michigan - 2014
Category Description Community
1 Accommodations LaBelle de la Riviere B&B Newaygo
2 Accommodations Treehouse B&B Newaygo
3 Cultural Arts County Museum, Heritage Center Newaygo
4 Cultural Arts North & South Mountain Dulcimers Newaygo
5 Cultural Arts Riverfront Park Phase I Pavilion Newaygo
6 Entertainment Live Summer Music Series Newaygo
7 Entertainment Loomis Lodge Event Hall Newaygo
8 Event Arts & Crafts Festival Newaygo
9 Event National Ice Fishing Tournament Newaygo
10 Event Newaygo Winterfest Newaygo
11 Recreation City Skate Park Newaygo
12 Recreation Ice Skating Rink Newaygo
13 Recreation Newaygo Nationals Assoc. (power paddle) Newaygo
14 Retail Bernadette's Gourd Creations Newaygo
15 Retail Elizabeth Halsey Boutique Newaygo
16 Retail Farmer's, Artisan/Crafter's Market Newaygo
17 Retail Fired Up Clay Art Studio Newaygo
18 Retail J. Alden Store for Men Newaygo
19 Retail Mary Jane's Flowers & Gifts Newaygo
20 Retail New Ewe Quilter's Shop Newaygo
21 Retail Sui Generis Home Furnishings Newaygo
22 Retail Trout & Eagle Lodge & Outfitters Newaygo
23 Retail Parsley's Sport & Fly Shop Newaygo
24 Talent The Stream Business Incubator Newaygo
Source: Internet and field research by LandUse|USA, Spring 2014.
List is not intended to be all-inclusive, and not all establishments have been field-verified.
The list focuses on unique amenities, and does not include: restaurants, hotels,
libraries, parks, outdoor ball fields and sports complexes, natural resources,
camp grounds, walking trails, service clubs/associations, small events and programs,
places of worship, airports, and industrial parks.
Sharon
Text Box
Exhibit B.8

Lat: 43.55389 Long: -85.77191 Zoom: 14
Logos are for identification purposes only and may be tradem
arks of their respective companies.
©2014, SITES USA Inc., Chandler, AZ (480) 491-1112. All Rights Reserved.
Map of the City of White Cloud Newaygo County, Michigan
Sharon
Text Box
Exhibit B.9
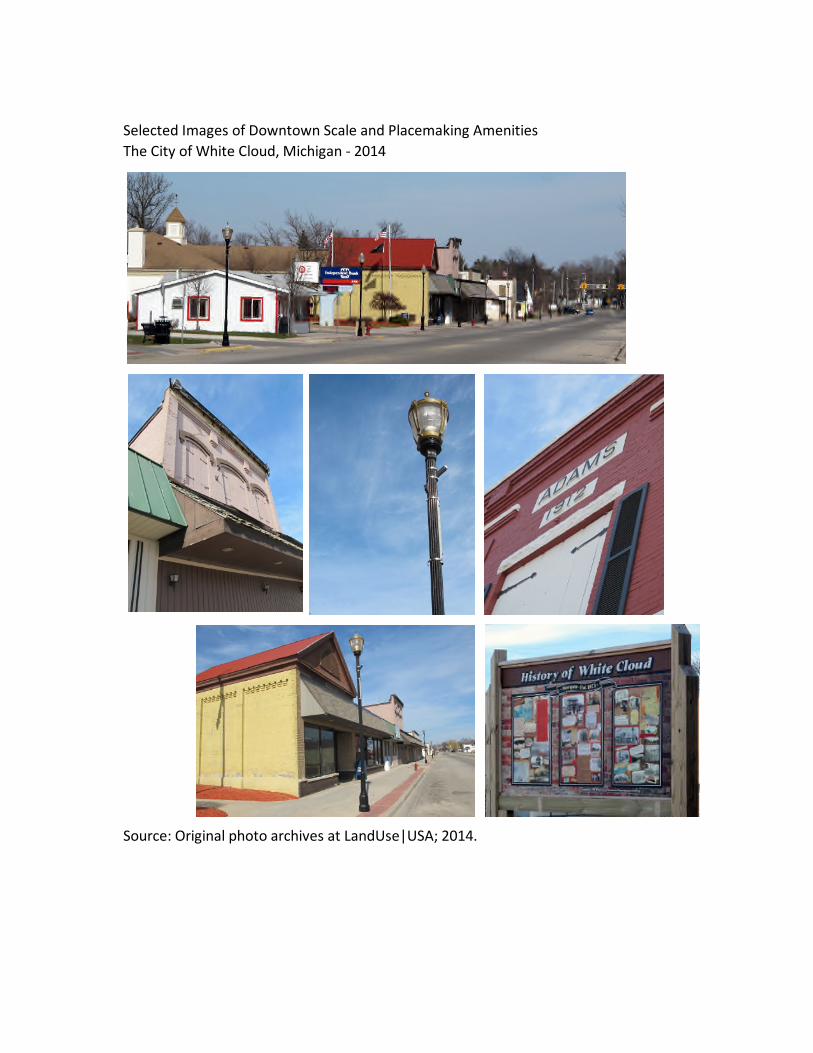
Selected Images of Downtown Scale and Placemaking Amenities
The City of White Cloud, Michigan - 2014
Source: Original photo archives at LandUse|USA; 2014.
Sharon
Text Box
Exhibit B.10
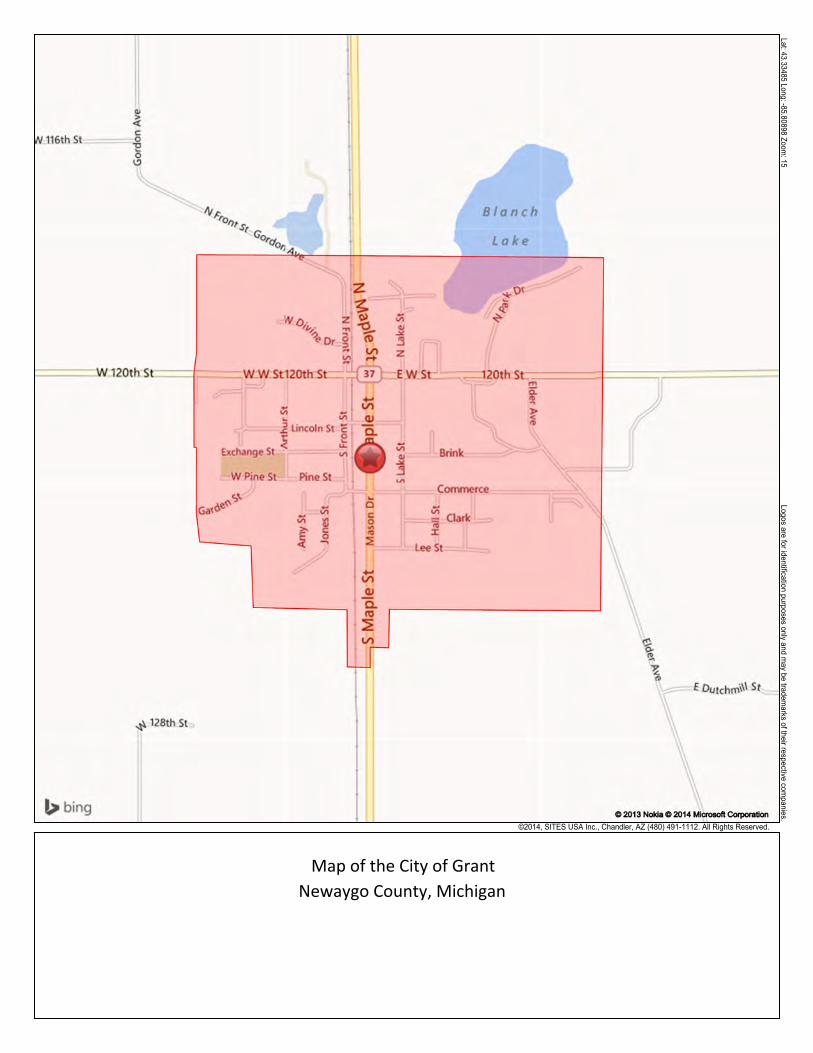
Lat: 43.33485 Long: -85.80898 Zoom: 15
Logos are for identification purposes only and may be tradem
arks of their respective companies.
©2014, SITES USA Inc., Chandler, AZ (480) 491-1112. All Rights Reserved.
Map of the City of Grant Newaygo County, Michigan
Sharon
Text Box
Exhibit B.11

Selected Images of Downtown Scale and Placemaking Amenities
The City of Grant, Michigan - 2014
Source: Original photo archives at LandUse|USA; 2014.
Sharon
Text Box
Exhibit B.12
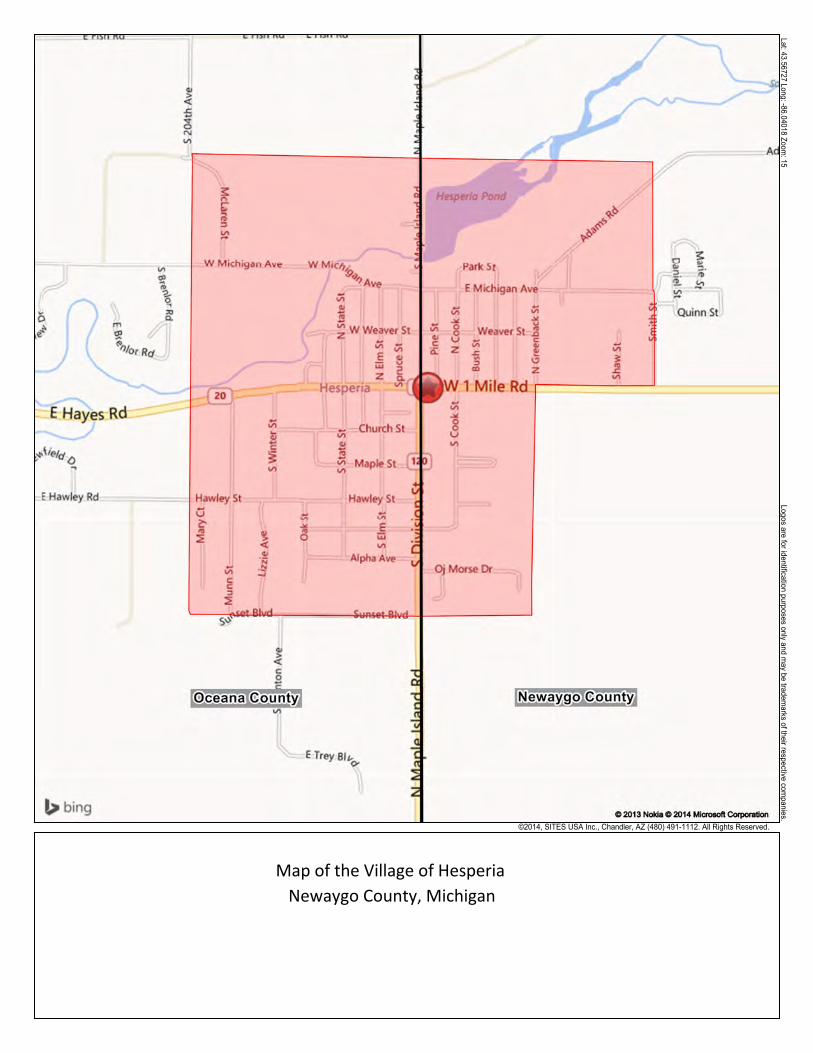
Lat: 43.56727 Long: -86.04018 Zoom: 15
Logos are for identification purposes only and may be tradem
arks of their respective companies.
©2014, SITES USA Inc., Chandler, AZ (480) 491-1112. All Rights Reserved.
Map of the Village of Hesperia Newaygo County, Michigan
Sharon
Text Box
Exhibit B.13
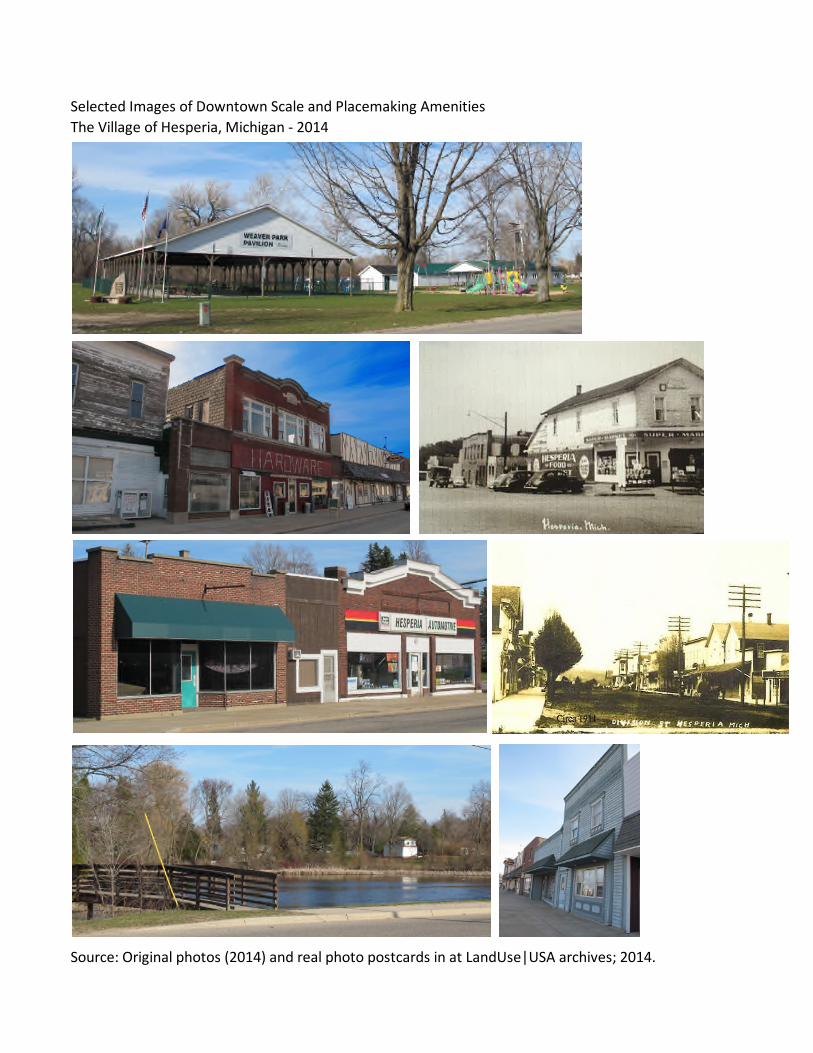
Selected Images of Downtown Scale and Placemaking Amenities
The Village of Hesperia, Michigan - 2014
Source: Original photos (2014) and real photo postcards in at LandUse|USA archives; 2014.
Sharon
Text Box
Exhibit B.14
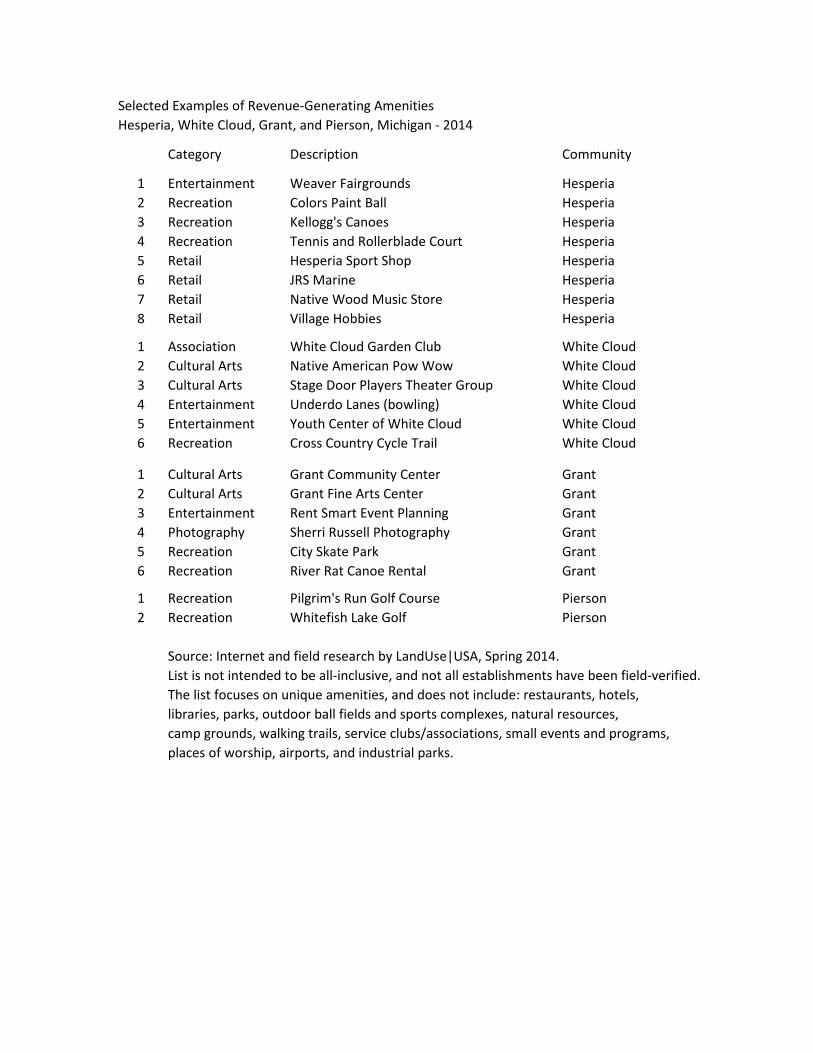
Selected Examples of Revenue-Generating Amenities
Hesperia, White Cloud, Grant, and Pierson, Michigan - 2014
Category Description Community
1 Entertainment Weaver Fairgrounds Hesperia
2 Recreation Colors Paint Ball Hesperia
3 Recreation Kellogg's Canoes Hesperia
4 Recreation Tennis and Rollerblade Court Hesperia
5 Retail Hesperia Sport Shop Hesperia
6 Retail JRS Marine Hesperia
7 Retail Native Wood Music Store Hesperia
8 Retail Village Hobbies Hesperia
1 Association White Cloud Garden Club White Cloud
2 Cultural Arts Native American Pow Wow White Cloud
3 Cultural Arts Stage Door Players Theater Group White Cloud
4 Entertainment Underdo Lanes (bowling) White Cloud
5 Entertainment Youth Center of White Cloud White Cloud
6 Recreation Cross Country Cycle Trail White Cloud
1 Cultural Arts Grant Community Center Grant
2 Cultural Arts Grant Fine Arts Center Grant
3 Entertainment Rent Smart Event Planning Grant
4 Photography Sherri Russell Photography Grant
5 Recreation City Skate Park Grant
6 Recreation River Rat Canoe Rental Grant
1 Recreation Pilgrim's Run Golf Course Pierson
2 Recreation Whitefish Lake Golf Pierson
Source: Internet and field research by LandUse|USA, Spring 2014.
List is not intended to be all-inclusive, and not all establishments have been field-verified.
The list focuses on unique amenities, and does not include: restaurants, hotels,
libraries, parks, outdoor ball fields and sports complexes, natural resources,
camp grounds, walking trails, service clubs/associations, small events and programs,
places of worship, airports, and industrial parks.
Sharon
Text Box
Exhibit B.15

Qualitative Assessment of Stakeholder Input
Newaygo County, Michigan - 2014
Share of
Category Community Priority - Short Description Surveys1
Unmet Housing Needs Newaygo Co. Affordable Rentals 48%
Unmet Housing Needs Newaygo Co. Affordable Choices 44%
Unmet Housing Needs Newaygo Co. House for Rentals 29%
Unmet Housing Needs Newaygo Co. Starter Homes 29%
Unmet Housing Needs Newaygo Co. Independent Senior Living 25%
Unmet Housing Needs Newaygo Co. Subsidized Vouchers / Sec. 8 17%
Unmet Housing Needs Newaygo Co. Townhomes/Row Houses 12%
Unmet Housing Needs Newaygo Co. Homeless / Transitional 12%
Unmet Housing Needs Newaygo Co. Barrier-Free, Special Needs 10%
Unmet Housing Needs Newaygo Co. Live-Work 6%
Unmet Housing Needs Newaygo Co. Mobile Homes 4%
Unmet Housing Needs Newaygo Co. Seasonal Cabins 4%
Unmet Housing Needs Newaygo Co. Upper Story Apts./Lofts 2%
Unmet Housing Needs Newaygo Co. Lots for Custom Built Homes 0%
Housing Challenges Newaygo Co. Not Enough Choices Overall 81%
Housing Challenges Newaygo Co. Poor Quality of Choices 71%
Housing Challenges Newaygo Co. High Foreclosure Rate 50%
Housing Challenges Newaygo Co. Landlords are Absentee 46%
Housing Challenges Newaygo Co. Utility Costs too High 45%
Housing Challenges Newaygo Co. Property Taxes too High 44%
Housing Challenges Newaygo Co. Mortgage Requirement High 35%
Housing Challenges Newaygo Co. Rents too High 35%
Housing Challenges Newaygo Co. Too Many Vacancies 29%
Housing Challenges Newaygo Co. Not Handicap Accessible 29%
Housing Challenges Newaygo Co. Too Many Residents per Units 21%
1 Source: Share of 50 surveys collected by Beckett & Raeder (in collaboration with LandUse|USA),
Spring 2014.
Sharon
Text Box
Exhibit B.16
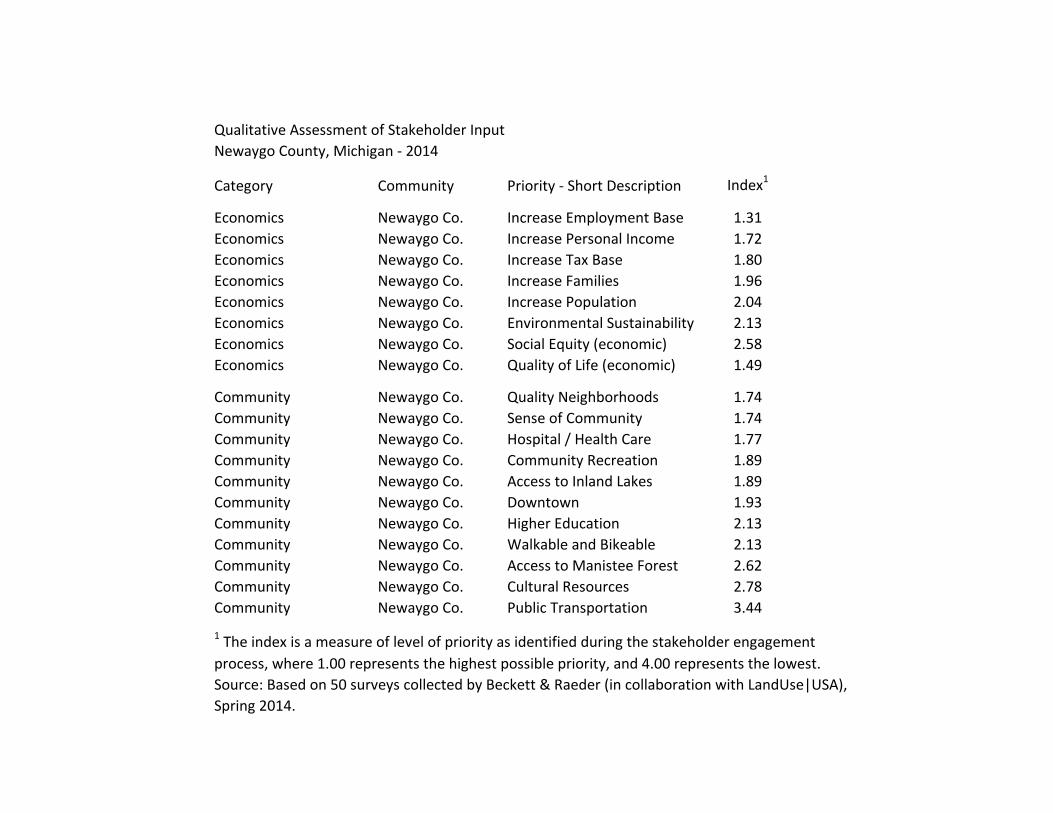
Qualitative Assessment of Stakeholder Input
Newaygo County, Michigan - 2014
Category Community Priority - Short Description Index1
Economics Newaygo Co. Increase Employment Base 1.31
Economics Newaygo Co. Increase Personal Income 1.72
Economics Newaygo Co. Increase Tax Base 1.80
Economics Newaygo Co. Increase Families 1.96
Economics Newaygo Co. Increase Population 2.04
Economics Newaygo Co. Environmental Sustainability 2.13
Economics Newaygo Co. Social Equity (economic) 2.58
Economics Newaygo Co. Quality of Life (economic) 1.49
Community Newaygo Co. Quality Neighborhoods 1.74
Community Newaygo Co. Sense of Community 1.74
Community Newaygo Co. Hospital / Health Care 1.77
Community Newaygo Co. Community Recreation 1.89
Community Newaygo Co. Access to Inland Lakes 1.89
Community Newaygo Co. Downtown 1.93
Community Newaygo Co. Higher Education 2.13
Community Newaygo Co. Walkable and Bikeable 2.13
Community Newaygo Co. Access to Manistee Forest 2.62
Community Newaygo Co. Cultural Resources 2.78
Community Newaygo Co. Public Transportation 3.44
1 The index is a measure of level of priority as identified during the stakeholder engagement
process, where 1.00 represents the highest possible priority, and 4.00 represents the lowest.
Source: Based on 50 surveys collected by Beckett & Raeder (in collaboration with LandUse|USA),
Spring 2014.
Sharon
Text Box
Exhibit B.17
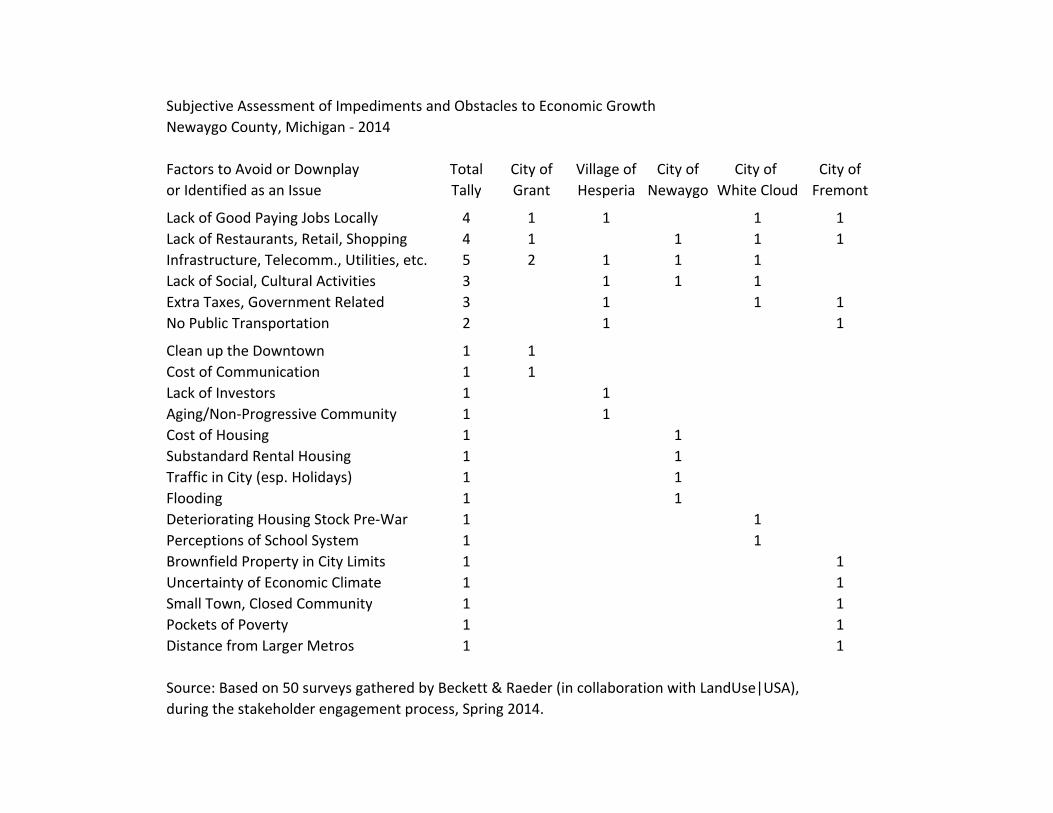
Subjective Assessment of Impediments and Obstacles to Economic Growth
Newaygo County, Michigan - 2014
Factors to Avoid or Downplay Total City of Village of City of City of City of
or Identified as an Issue Tally Grant Hesperia Newaygo White Cloud Fremont
Lack of Good Paying Jobs Locally 4 1 1 1 1
Lack of Restaurants, Retail, Shopping 4 1 1 1 1
Infrastructure, Telecomm., Utilities, etc. 5 2 1 1 1
Lack of Social, Cultural Activities 3 1 1 1
Extra Taxes, Government Related 3 1 1 1
No Public Transportation 2 1 1
Clean up the Downtown 1 1
Cost of Communication 1 1
Lack of Investors 1 1
Aging/Non-Progressive Community 1 1
Cost of Housing 1 1
Substandard Rental Housing 1 1
Traffic in City (esp. Holidays) 1 1
Flooding 1 1
Deteriorating Housing Stock Pre-War 1 1
Perceptions of School System 1 1
Brownfield Property in City Limits 1 1
Uncertainty of Economic Climate 1 1
Small Town, Closed Community 1 1
Pockets of Poverty 1 1
Distance from Larger Metros 1 1
Source: Based on 50 surveys gathered by Beckett & Raeder (in collaboration with LandUse|USA),
during the stakeholder engagement process, Spring 2014.
Sharon
Text Box
Exhibit B.18
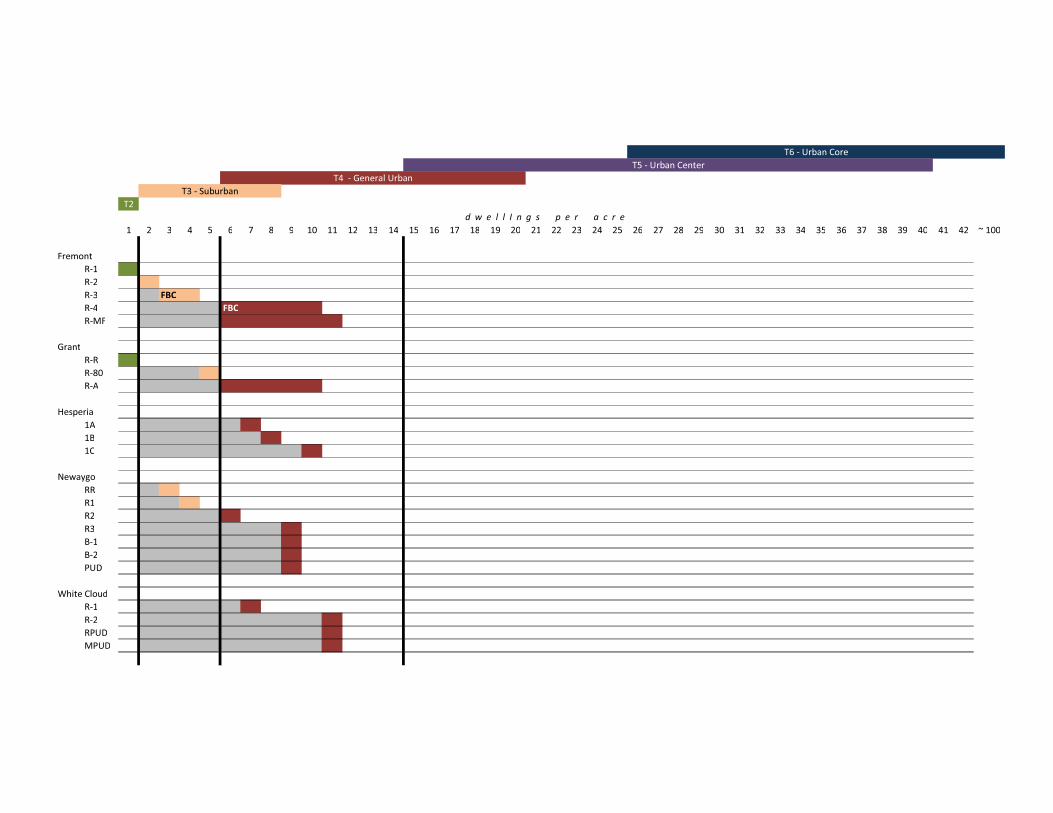
*>
? > @ A B C D E F ?G ?? ?> ?@ ?A ?B ?C ?D ?E ?F >G >? >> >@ >A >B >C >D >E >F @G @? @> @@ @A @B @C @D @E @F A G A ? A > H ?GG
I7,= 6-0
2J?
2J>
2J@ !"#
2JA !"#
2JK I
&73-0
2J2
2JEG
2J$
L,.<,7/3
?$
?M
?(
!,N 3146
22
2?
2>
2@
MJ?
MJ>
O)+
# P/0, (96Q8
2J?
2J>
2O)+
K O)+
! " # $ $ % & ' ( ) # * + , * #
*@ JRQSQ7S3-
*A J&,-,739)7S3-
*B J)7S3- (,-0,7
*C J)7S3- (67,
Sharon
Text Box
Assessment of Current Allowable Densities Partner Communities in Newaygo County, Michigan - 2014
Sharon
Text Box
Source: Assessment conducted by Beckett & Raeder in collaboration with LandUse|USA, Spring 2014. Exhibit demonstrates that existing zoning ordinances to not allow for urban formats or densities that would typically be expected in T5 and T6 zones of the Urban Transect, and in traditional downtown districts.
Sharon
Text Box
Exhibit B.19
Prepared by:
Prepared for:
Target Market Analysis
Newaygo Co., MI
Strategy Report
July 18, 2014
Contents:
Typical Housing Formats
of the Target Markets

Terry & Heather
0.63%0.98%Middle-aged, down-scale singles and divorced individuals in transitional small town and exurban apartments
K OJ NI MH LGFEDCBA SRQP
Group S: Struggling Societies
Type S70: Enduring Hardships
71706968
Strive for more
Meager means
Liberal views
Ad-conscious
Gaming
Television entertainment
Home-focused activities
Simple lifestyles
Transient
Exurban renters
Rankings
Key Traits
Overview
Children: Presence
Age: Head of Household
Income: Estimated Household
Exercise: Regularly
SMGreenAware : Behavioral Greens
Internet: Changed the Way I Shop for Products/Services
29/71
32/71
70/71
70/71
66/71
52/71
62/71Metropolitan City: Top 10 CBSA Markets
poe
Highlight
poe
Typewritten Text
poe
Typewritten Text
poe
Typewritten Text
poe
Typewritten Text
poe
Typewritten Text
poe
Typewritten Text
poe
Typewritten Text
poe
Typewritten Text
poe
Typewritten Text
poe
Typewritten Text
poe
Typewritten Text
poe
Typewritten Text
poe
Typewritten Text
poe
Typewritten Text
poe
Typewritten Text
poe
Typewritten Text
poe
Typewritten Text
poe
Typewritten Text
poe
Typewritten Text
poe
Typewritten Text
poe
Typewritten Text
poe
Typewritten Text
poe
Typewritten Text
poe
Typewritten Text
poe
Typewritten Text
poe
Typewritten Text
poe
Typewritten Text
Sharon
Text Box
Exhibit C.1
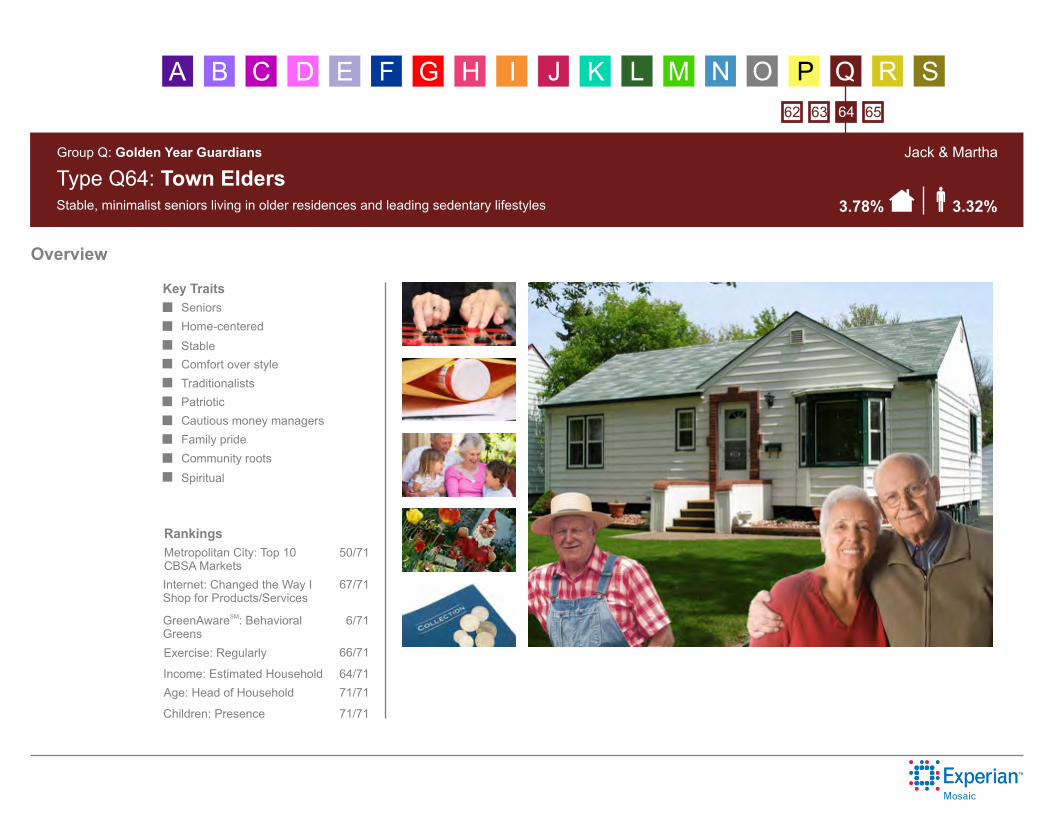
Jack & Martha
3.32%3.78%Stable, minimalist seniors living in older residences and leading sedentary lifestyles
K OJ NI MH LGFEDCBA SRQP
Group Q: Golden Year Guardians
Type Q64: Town Elders
65646362
Spiritual
Community roots
Family pride
Cautious money managers
Patriotic
Traditionalists
Comfort over style
Stable
Home-centered
Seniors
Rankings
Key Traits
Overview
Children: Presence
Age: Head of Household
Income: Estimated Household
Exercise: Regularly
SMGreenAware : Behavioral Greens
Internet: Changed the Way I Shop for Products/Services
71/71
71/71
64/71
66/71
6/71
67/71
50/71Metropolitan City: Top 10 CBSA Markets
poe
Typewritten Text
poe
Typewritten Text
poe
Typewritten Text
poe
Typewritten Text
poe
Typewritten Text
poe
Typewritten Text
poe
Typewritten Text
poe
Typewritten Text
poe
Typewritten Text
poe
Typewritten Text
Sharon
Text Box
Exhibit C.2
Sharon
Text Box
Rankings among 71 clusters
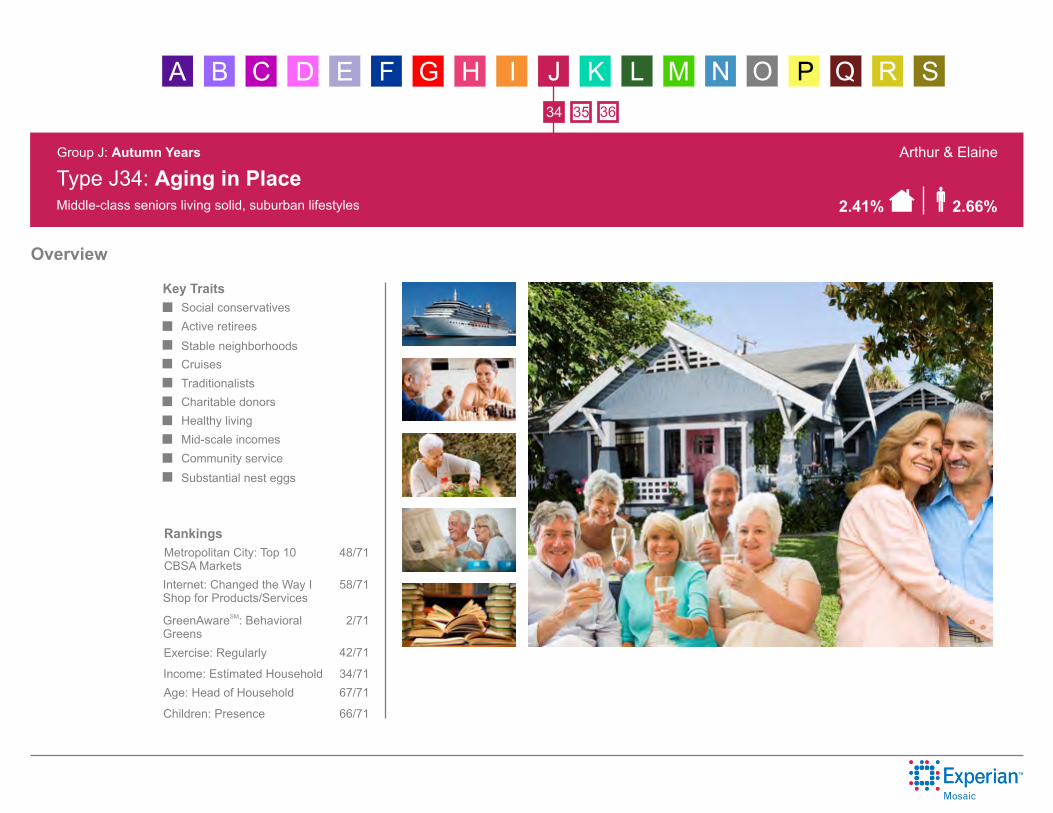
Arthur & Elaine
2.66%2.41%Middle-class seniors living solid, suburban lifestyles
K OJ NI MH LGFEDCBA SRQP
Group J: Autumn Years
Type J34: Aging in Place
363534
Substantial nest eggs
Community service
Mid-scale incomes
Healthy living
Charitable donors
Traditionalists
Cruises
Stable neighborhoods
Active retirees
Social conservatives
Rankings
Key Traits
Overview
Children: Presence
Age: Head of Household
Income: Estimated Household
Exercise: Regularly
SMGreenAware : Behavioral Greens
Internet: Changed the Way I Shop for Products/Services
66/71
67/71
34/71
42/71
2/71
58/71
48/71Metropolitan City: Top 10 CBSA Markets
poe
Typewritten Text
poe
Typewritten Text
poe
Typewritten Text
poe
Typewritten Text
poe
Typewritten Text
poe
Typewritten Text
poe
Typewritten Text
poe
Typewritten Text
Sharon
Text Box
Exhibit C.3
Sharon
Text Box
Rankings among 71 clusters

Daniel & Amanda
1.53%1.47%Young, working-class families and single parent households living in small established, city residences
K OJ NI MH LGFEDCBA SRQP
Group M: Families in Motion
Type M45: Diapers and Debit Cards
4544
Shallow pockets
Political centrists
Convenience food
Home-based family activities
Enjoy bargain hunting
Fixer-upper communities
Hectic lifestyles
Utilitarian Internet use
Team sports
Early childrearing years
Rankings
Key Traits
Overview
Children: Presence
Age: Head of Household
Income: Estimated Household
Exercise: Regularly
SMGreenAware : Behavioral Greens
Internet: Changed the Way I Shop for Products/Services
10/71
6/71
45/71
59/71
54/71
46/71
59/71Metropolitan City: Top 10 CBSA Markets
poe
Typewritten Text
poe
Typewritten Text
poe
Typewritten Text
Sharon
Text Box
Exhibit C.4
Sharon
Text Box
Rankings among 71 clusters
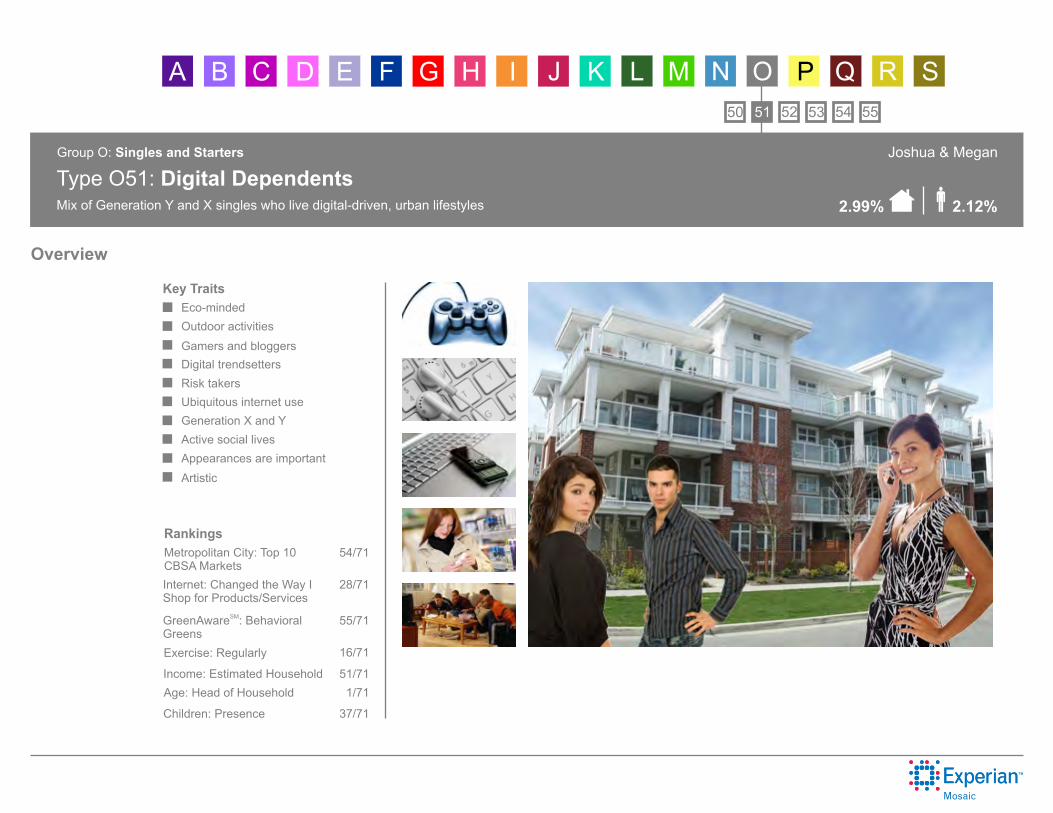
Joshua & Megan
2.12%2.99%Mix of Generation Y and X singles who live digital-driven, urban lifestyles
K OJ NI MH LGFEDCBA SRQP
Group O: Singles and Starters
Type O51: Digital Dependents
555453525150
Artistic
Appearances are important
Active social lives
Generation X and Y
Ubiquitous internet use
Risk takers
Digital trendsetters
Gamers and bloggers
Outdoor activities
Eco-minded
Rankings
Key Traits
Overview
Children: Presence
Age: Head of Household
Income: Estimated Household
Exercise: Regularly
SMGreenAware : Behavioral Greens
Internet: Changed the Way I Shop for Products/Services
37/71
1/71
51/71
16/71
55/71
28/71
54/71Metropolitan City: Top 10 CBSA Markets
poe
Typewritten Text
Sharon
Text Box
Exhibit C.5
Sharon
Text Box
Rankings among 71 clusters
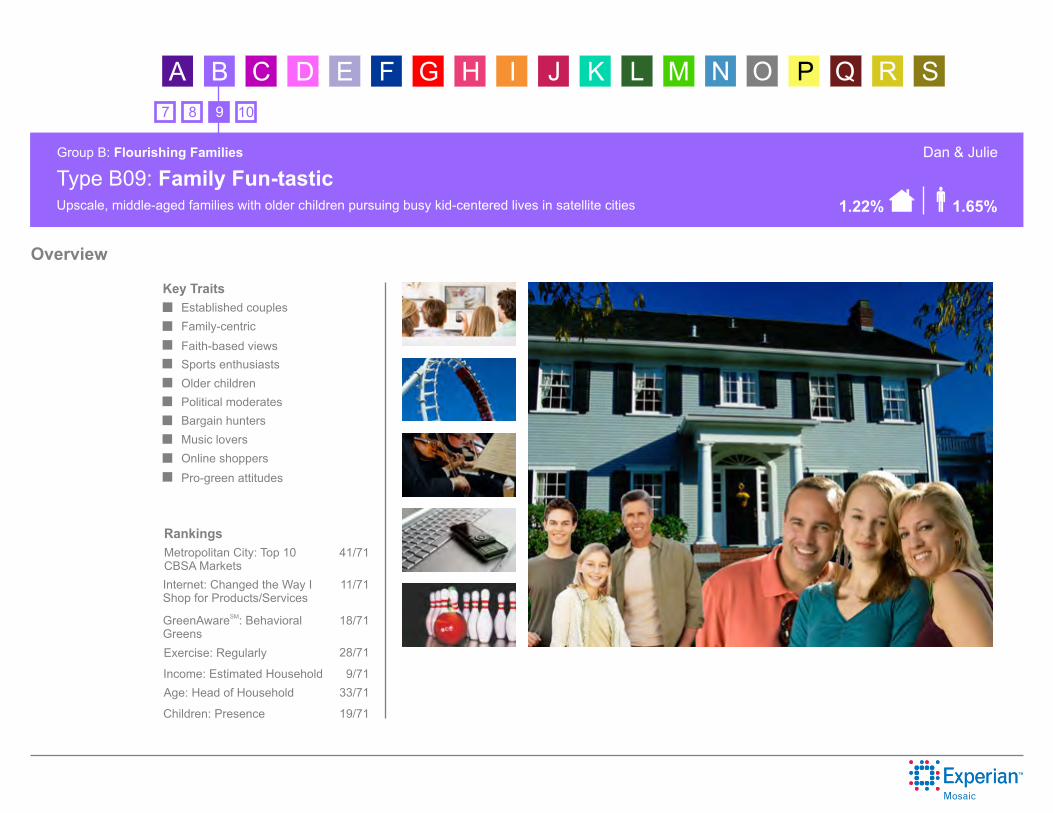
Dan & Julie
1.65%1.22%Upscale, middle-aged families with older children pursuing busy kid-centered lives in satellite cities
K OJ NI MH LGFEDCBA SRQP
Group B: Flourishing Families
Type B09: Family Fun-tastic
10987
Pro-green attitudes
Online shoppers
Music lovers
Bargain hunters
Political moderates
Older children
Sports enthusiasts
Faith-based views
Family-centric
Established couples
Rankings
Key Traits
Overview
Children: Presence
Age: Head of Household
Income: Estimated Household
Exercise: Regularly
SMGreenAware : Behavioral Greens
Internet: Changed the Way I Shop for Products/Services
19/71
33/71
9/71
28/71
18/71
11/71
41/71Metropolitan City: Top 10 CBSA Markets
poe
Typewritten Text
poe
Typewritten Text
poe
Typewritten Text
poe
Typewritten Text
Sharon
Text Box
Exhibit C.6
Sharon
Text Box
Rankings among 71 clusters
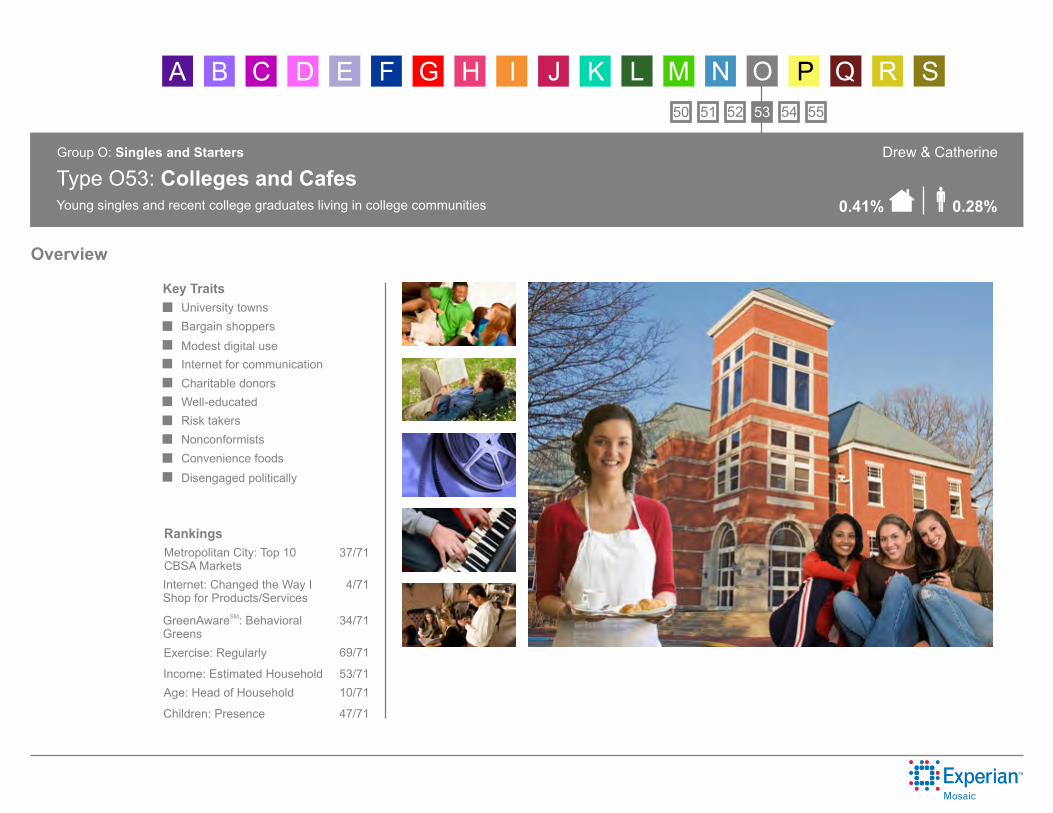
Drew & Catherine
0.28%0.41%Young singles and recent college graduates living in college communities
K OJ NI MH LGFEDCBA SRQP
Group O: Singles and Starters
Type O53: Colleges and Cafes
555453525150
Disengaged politically
Convenience foods
Nonconformists
Risk takers
Well-educated
Charitable donors
Internet for communication
Modest digital use
Bargain shoppers
University towns
Rankings
Key Traits
Overview
Children: Presence
Age: Head of Household
Income: Estimated Household
Exercise: Regularly
SMGreenAware : Behavioral Greens
Internet: Changed the Way I Shop for Products/Services
47/71
10/71
53/71
69/71
34/71
4/71
37/71Metropolitan City: Top 10 CBSA Markets
poe
Typewritten Text
Sharon
Text Box
Exhibit C.7
Sharon
Text Box
Rankings among 71 clusters
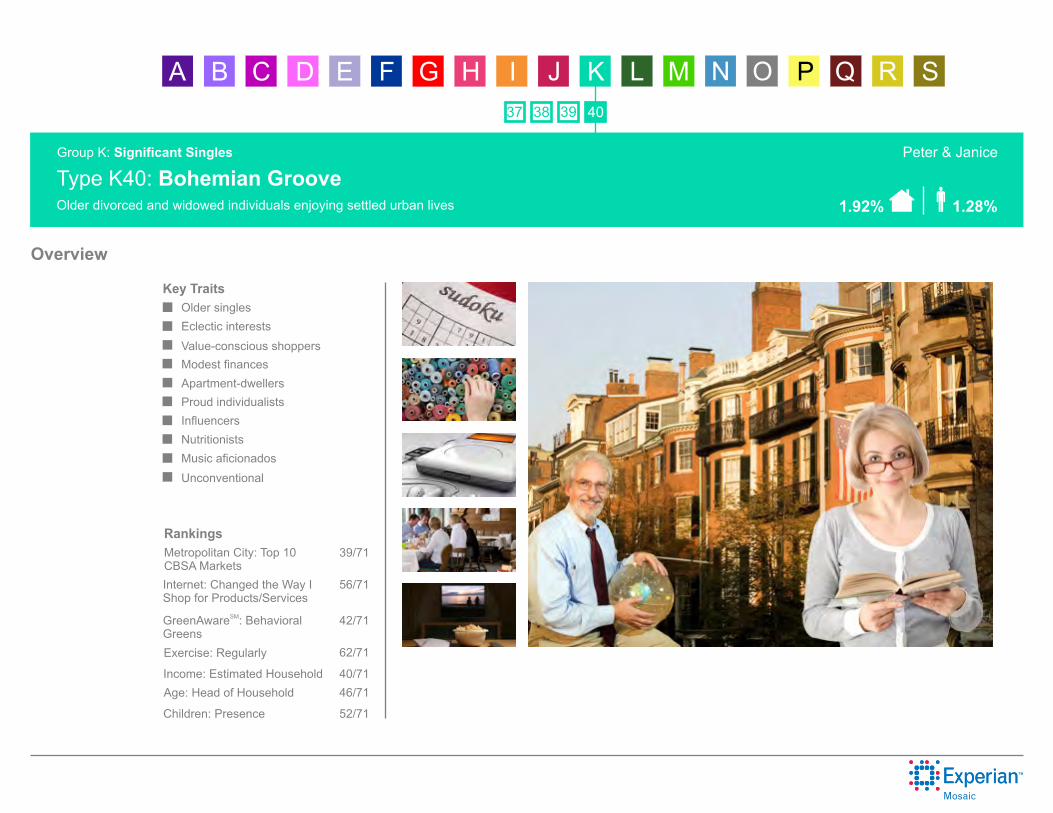
Peter & Janice
1.28%1.92%Older divorced and widowed individuals enjoying settled urban lives
K OJ NI MH LGFEDCBA SRQP
Group K: Significant Singles
Type K40: Bohemian Groove
40393837
Unconventional
Music aficionados
Nutritionists
Influencers
Proud individualists
Apartment-dwellers
Modest finances
Value-conscious shoppers
Eclectic interests
Older singles
Rankings
Key Traits
Overview
Children: Presence
Age: Head of Household
Income: Estimated Household
Exercise: Regularly
SMGreenAware : Behavioral Greens
Internet: Changed the Way I Shop for Products/Services
52/71
46/71
40/71
62/71
42/71
56/71
39/71Metropolitan City: Top 10 CBSA Markets
poe
Typewritten Text
Sharon
Text Box
Exhibit C.8
Sharon
Text Box
Rankings among 71 clusters

Harold & Joan
1.25%1.67%Downscale, settled retirees in metro apartment communities
K OJ NI MH LGFEDCBA SRQP
Group Q: Golden Year Guardians
Type Q65: Senior Discounts
65646362
Optimistic
Budget-minded
Health-conscious
Advertising skeptics
Solid media market
Discount shoppers
Active leisure lives
Renters
City-dwellers
Seniors
Rankings
Key Traits
Overview
Children: Presence
Age: Head of Household
Income: Estimated Household
Exercise: Regularly
SMGreenAware : Behavioral Greens
Internet: Changed the Way I Shop for Products/Services
68/71
69/71
65/71
68/71
12/71
66/71
24/71Metropolitan City: Top 10 CBSA Markets
poe
Typewritten Text
poe
Typewritten Text
poe
Typewritten Text
Sharon
Text Box
Exhibit C.9
Sharon
Text Box
Rankings among 71 clusters

Douglas & Amber
1.07%1.89%Young singles, couples and single parents with lower incomes starting out in city apartments
K OJ NI MH LGFEDCBA SRQP
Group R: Aspirational Fusion
Type R66: Dare to Dream
6766
Internet-savvy
Optimistic
Online gaming
Crowded households
Electronics
Team sports
Active lifestyles
Mobile singles
Single families
Younger
Rankings
Key Traits
Overview
Children: Presence
Age: Head of Household
Income: Estimated Household
Exercise: Regularly
SMGreenAware : Behavioral Greens
Internet: Changed the Way I Shop for Products/Services
20/71
13/71
66/71
67/71
67/71
69/71
40/71Metropolitan City: Top 10 CBSA Markets
poe
Typewritten Text
poe
Typewritten Text
poe
Typewritten Text
poe
Typewritten Text
poe
Typewritten Text
Sharon
Text Box
Exhibit C.10
Sharon
Text Box
Rankings among 71 clusters
Related Documents