University of South Carolina Scholar Commons eses and Dissertations 2013 Narrative Discourse in Aphasia: Main Concept and Core Lexicon Analyses of the Cinderella Story Emily Patricia Dillow University of South Carolina - Columbia Follow this and additional works at: hp://scholarcommons.sc.edu/etd is Open Access esis is brought to you for free and open access by Scholar Commons. It has been accepted for inclusion in eses and Dissertations by an authorized administrator of Scholar Commons. For more information, please contact [email protected]. Recommended Citation Dillow, E. P.(2013). Narrative Discourse in Aphasia: Main Concept and Core Lexicon Analyses of the Cinderella Story. (Master's thesis). Retrieved from hp://scholarcommons.sc.edu/etd/2623

Welcome message from author
This document is posted to help you gain knowledge. Please leave a comment to let me know what you think about it! Share it to your friends and learn new things together.
Transcript
University of South CarolinaScholar Commons
Theses and Dissertations
2013
Narrative Discourse in Aphasia: Main Concept andCore Lexicon Analyses of the Cinderella StoryEmily Patricia DillowUniversity of South Carolina - Columbia
Follow this and additional works at: http://scholarcommons.sc.edu/etd
This Open Access Thesis is brought to you for free and open access by Scholar Commons. It has been accepted for inclusion in Theses and Dissertationsby an authorized administrator of Scholar Commons. For more information, please contact [email protected].
Recommended CitationDillow, E. P.(2013). Narrative Discourse in Aphasia: Main Concept and Core Lexicon Analyses of the Cinderella Story. (Master's thesis).Retrieved from http://scholarcommons.sc.edu/etd/2623

Narrative Discourse in Aphasia: Main Concept and Core Lexicon Analyses of the Cinderella Story
by
Emily Dillow
Bachelor of Arts University of South Carolina, 2011
______________________________________
Submitted in Partial Fulfillment of the Requirements
For the Degree of Master of Speech Pathology in
Speech Pathology
Arnold School of Public Health
University of South Carolina
2013
Accepted by:
Jessica D. Richardson, Director of Thesis
Hiram L. McDade, Reader
Lacy Ford, Vice Provost and Dean of Graduate Studies

ii
© Copyright by Emily Dillow, 2013 All Rights Reserved.
iii
Dedication
To my parents for getting me started on my journey towards thesis completion by
emphasizing education and encouraging persistence from an early age. In the words of
Randy Pausch, “I won the parent lottery.” I cannot thank you enough for all the early
literacy exposure that set me up for success in life. If every child in America had the
upbringing I did, so many more potentials would be reached and ambitions would be
realized.

iv
Acknowledgments
First, I would like to thank those who fostered my initial interest in speech-
pathology in general, and research, in particular. Thank you, Dr. Crass, for teaching a
fantastic introductory speech pathology course, which can truly be described as the seed
of my passion for the study of communication disorders. Many professors have
influenced the clinician and researcher I have become, and I am grateful for every one of
them. I would like to specifically thank Dr. den Ouden for the role he played in inspiring
me to pursue research, as professor of my wonderful research course.
Thank you, Dr. Richardson and Dr. McDade, for contributing your valuable time
as members of my committee to make my goal possible. Thank you, especially, Dr.
Richardson, for not only agreeing to be my thesis director, but for projecting enthusiasm
from the get-go. Your passion for improving the lives of individuals with aphasia has
made working on this project so meaningful and enjoyable. I appreciate every minute you
have put into mentoring me and I will be forever grateful for my first amazing laboratory
experience. In the words of Eleanor Roosevelt, “A good leader inspires people to have
confidence in the leader, a great leader inspires people to have confidence in themselves.”
Dr. Richardson is, without a doubt, a great leader.
Finally, thank you to my labmates for being the most positive, hilarious, and
motivating labmates anyone could ask for.

v
Abstract
Discourse is a highly individualized and complex speech act essential for
effective communication in daily life. Individuals with language disorders demonstrate
impaired narrative ability and a resultant decline in functional communication (Webster,
Franklin, & Howard, 2007). Discourse analysis is often time-consuming and impractical
for everyday clinical use. Most informative discourse measures require specialized
training to perform and are time-consuming. A clinically practical measurement is
lacking. Standardized core lexicon and main concept lists for discourse tasks could
potentially allow clinicians to efficiently assess discourse skills and predict activity and
participation limitations. This study presents the development and application of a core
lexicon and main concept list for monologic narration of the Cinderella story (utilizing
AphasiaBank). Analyses were conducted on the following groups: controls, anomic,
Broca’s, conduction, Wernicke’s.
Results indicated that both analyses clearly separated individuals with aphasia
from those with typical language abilities. Both analyses were able to distinguish some
subtypes of aphasia but were unable to differentiate each subtype from one another.
Importantly, core lexicon analysis correlated strongly with the more time intensive
measure of main concept analysis for all groups. Results of this study lend support to the
usefulness of further development and application of core lexicon and main concept
analyses as efficient methods of determining narrative adequacy in PWAs.

vi
Table of Contents
Dedication……………………………………………………………………………...…iii
Acknowledgments………………………………………………………………………..iv
Abstract…………………………………………………………………………………....v
List of Tables…………………………………………………………………………….vii
List of Figures…………………………………………………………………………...viii
Chapter 1: Introduction……………………………………………………………………1 Chapter 2: Methods…………………………………………………………………...….10 Database……………………………………………………………………….....10 Materials…………………………………………………………………………11 Procedure…………………………………………………………………...........11 Statistical Analysis……………………………………………………………….14 Chapter 3: Results……………………………………………………………………..…17 Chapter 4: Discussion……………………………………………………………………28 References……………………………………………………………………………..…39 Appendix A: Cinderella Core Verb Lexicon………………………………………….…43 Appendix B: Cinderella Core Noun Lexicon…………………………………………….44 Appendix C: Cinderella Main Concepts………………………………………………....45
vii
List of Tables
Table 3.1 Subtypes vs. Controls: Entire Lexicon.………………………………….........20
Table 3.2 Subtypes vs. Controls: Core Verbs.…………………………………….……..20
Table 3.3 Subtypes vs. Controls: Core Nouns...…………………………………………20
Table 3.4 Subtype Comparisons: Entire Core Lexicon.…………………………………21
Table 3.5 Subtype Comparisons: Core Verbs…………….……………………….….…21
Table 3.6 Subtype Comparisons: Core Nouns…...…………………………………..…..22
Table 3.7 Subtypes vs. Controls: Main Concept Score….……………………...……….22
Table 3.8 Subtype Comparisons: Main Concept Score.……………………….……...…23
Table 3.9 Relationship Between Main Concepts and Core Lexicon………………….…23
viii
List of Figures
Figure 3.1 Core Lexicon Production…...…………………………………………...……24
Figure 3.2 Core Verb Production……...………………………………………...……….24
Figure 3.3 Core Noun Production…………...………………………………………...…25
Figure 3.4 Main Concept Scores.…………………………...…………………………....25
Figure 3.5 Relationship Between Main Concepts and Core Lexicon……………………26
Figure 3.6 Relationship Between Main Concepts and Core Verbs…………………...…26
Figure 3.7 Relationship Between Main Concepts and Core Nouns…….……………..…27

1
CHAPTER 1
Introduction
Due to productivity requirements and pressure from insurance companies, speech-
language pathologists must utilize the most time-efficient methods of assessing initial
impairments and measuring progress during treatment. Along with being time-efficient, it
is imperative that assessment tools are actually providing an indication of a patient’s
functional communication skills. MacWhinney, Fromm, Holland, Forbes, and Wright
(2010) suggest that comparing a patient’s noun and verb lexicon during a specific
narrative task to a created core lexicon may be a time-efficient and informative
assessment method. Core lexicons can be developed by analyzing transcripts of non-brain
injured individuals with the help of tools, such as Computerized Language Analysis
(CLAN). Grande et al. (2008) concluded that computer analysis of specific discourse
measurements (e.g., percentage open class words, mean length of utterance, syntactic
complexity) could be a practicable tool for use in clinical settings. Their study found that
not only was the analysis of basic parameters efficient, but also that the measurements
obtained were more sensitive to changes over the course of treatment than more
commonly used rating scales (i.e., Aachen Aphasia Test). While it should be noted that
the authors suggested further research is needed to determine the specificity of these
basic parameters, the fact that computer analysis of basic parameters appeared more
sensitive to improvement than rating measurements certainly warrants attention. A
measurement, such as percentage of core words produced, could potentially provide an
2
efficient and meaningful indication of narrative discourse skill and improvement over the
course of treatment. Because core lexicons would be based on narratives of non-brain
injured individuals, production of a greater number of core words would suggest a
narrative is more similar to that of typical speakers. Webster, Franklin, and Howard
(2007) emphasize the importance of performing extensive discourse analysis on control
subjects in order to have a relevant measure of comparison when analyzing the discourse
of persons with aphasia (PWAs). Without basing standards on actual productions of
control participants, there is no way of assuring relevancy.
Much of the research in the area of word retrieval involves assessment during
confrontation naming tasks (Mayer & Murray, 2003). Some studies have demonstrated a
relationship between word retrieval during confrontation naming and word retrieval
during conversation, suggesting that improved word retrieval during confrontation
naming results in similarly improved word retrieval during conversation (Brown &
Cullinan, 1981; Hickin, Best, Herbert, Howard, & Osborne, 2001). However, other
studies have failed to demonstrate a relationship between the two and emphasize the fact
that confrontation naming is quite different from real-word speaking situations. Berndt,
Haendiges, Burton, and Mitchum (2002) found that PWAs had much more difficulty with
sentence completion tasks than confrontation naming. Meanwhile, Mayer and Murray
(2003) found that confrontation naming was a more difficult task for PWAs when
compared to picture description or discourse. Together, these studies provide support for
the idea that performance on one speech-language production task cannot predict the
performance on another. Edwards (1998) clearly demonstrated this variability in deficits
of PWAs over a variety of tasks, suggesting that several different types of tasks must be

3
used to get a full picture of a PWA’s abilities. Given this information, most clinicians
would agree that narrative tasks should be included for a thorough sample of
communication.
Questions arise about what type of task should be used to elicit this narrative
sample. Previous research suggests that different narrative tasks do, indeed, facilitate
different levels of output quality and quality for both PWAs and control speakers
(Fergadiotis & Wright, 2011; Fergadiotis, Wright, & Capilouto, 2011). Some different
narrative tasks which have been used in research and clinical settings include procedural
accounts of common activities, picture description, story generation using a series of
pictures, story retell without pictures, and narration of a personal event (Fergadiotis &
Wright, 2011; Fergadiotis et al., 2011). Each of these tasks provides different levels of
support for semantic retrieval (Fergadiotis & Wright, 2011; Fergadiotis et al., 2011).
Personal narrative tasks, for example, provide the most freedom and least support, which
may seem optimal when trying to assess functional communication. However, several
practical concerns arise when considering the use of personal narrative tasks, the primary
concern being that because clinicians are unfamiliar with all personal events in each of
their client’s lives, they may be unable to judge the correctness of a personal narrative. In
addition, relying solely on the use of personal narratives would eliminate the possibility
of developing a standardized core lexicon for efficient and standardized performance
assessment.
Although discourse tasks, such as story narration, are thought to provide valuable
information to clinicians, they are underused due to practical concerns of time and
training (Armstrong, Brady, Mackenzie, & Norrie, 2007; Boles & Bombard, 1998;
4
Olness, Gyger, & Thomas, 2012). Thorough discourse analysis requires lengthy samples
of speech, which can be time-consuming in clinical settings (Boles & Bombard, 1998).
However, a study by Boles and Bombard (1998) found that even discourse samples as
short as five minutes can provide reliable information regarding discourse skill, as long as
the particular behavior of interest occurs at least three times per minute. Since core words
occur much more frequently than three per minute, one short story may very well provide
enough information for reliable assessment.
Along with obtaining a lengthy narrative sample, another concern is the amount
of time and training required for phonetic transcription and error coding (Armstrong et
al., 2007) in order to precisely record every word, including details such as paraphasias,
repetitions, and revisions, which characterize the speech of PWAs. Armstrong (2007)
reported that one researcher suggested that one minute of speech could take close to an
hour to transcribe, while another researcher reported that even when using computerized
software, one minute of speech takes about 10 minutes to perform accurate phonetic
transcription. In light of these time demands, Armstrong (2007) expresses the need for
non-transcription-based analysis in order to make narrative assessments feasible in
clinical settings. With a core lexicon analysis, a clinician would simply need to record a
certain class of words while listening to their patient’s narration of one story and later
compare the words produced to the core lexicon list.
The current study focused on monologic narration of a familiar story. This type of
task is confining enough to provide listeners with sufficient context and allow for
standardized measurement. Meanwhile, it is not so restrictive as to prevent valid
assessment of functional communication (Webster et al., 2007). The monologic narration

5
task was selected over a procedural task or picture descriptions that have been shown to
elicit less lexical diversity (Fergadiotis & Wright, 2011; Fergadiotis et al., 2011). Further,
monologic narrative tasks have been shown to elicit greater lexical diversity in control
speakers and illustrate disparities in output between PWAs and control speakers that may
not be apparent based on a short picture description task (Fergadiotis & Wright, 2011).
We selected the Cinderella story, a task commonly used for narrative assessment in
PWAs (MacWhinney et al., 2010; MacWhinney, Fromm, Forbes, & Holland, 2011; Bird
& Franklin, 1996; Webster et al., 2007). Bird and Franklin (1996) discussed the clinical
use of the Cinderella story as a means of measuring impairments and improvements of
PWAs. Cinderella is a story familiar to the general population and is of adequate length
to elicit sufficient output.
Speech production deficits are known to differ between the different aphasia
subtypes, suggesting that it may be necessary to analyze narrative skills of subtypes
separately. In Grande et al.’s (2008) study involving computerized analysis of discourse,
the parameters most sensitive to improvements in participants with fluent aphasia
differed from the parameters most sensitive to improvements in participants with non-
fluent aphasia. In light of this information, it may be the case that a core lexicon list is
more predictive of narrative adequacy for one subtype of aphasia, but less relevant for
another subtype. Due to this possibility, the current study looked at the different subtypes
of aphasia separately. It was decided that even grouping by fluent and non-fluent aphasias
would allow too much variability within groups, since the broad categories of fluent and
non-fluent aphasia each encompass a number of different subtypes with different speech
patterns. Therefore, the subgroups of anomic, Broca’s, conduction, and Wernicke’s were
6
each analyzed separately. Because limited sample sizes were available for the subtypes of
transcortical motor, transcortical sensory, and global aphasia, these subtypes were not
included in the analysis. However, it may be expected that individuals with transcortical
motor aphasia would perform similarly to our Broca’s subjects and individuals with
transcortical sensory aphasia would perform similarly to our Wernicke’s subjects.
Meanwhile, the deficits present in individuals with global aphasia make core lexicon
analysis an inappropriate assessment method due to the paucity of output.
Analyzing an entire lexicon, even just for one narrative task, does not seem to be
the most efficient usage of a core lexicon approach to assessing narrative skill. This
would be too time-intensive and may not provide specific information that may be
offered by a more narrow analysis. Creating core lexicons of specific lexical classes
allows us to see the predictive capabilities of lexical class usage independent of one
another, as well as in combination. In the current study, core lexicon lists were created for
the lexical classes of verbs, nouns, and adjectives, which are the classes that carry the
bulk of semantic information. A study by Berndt et al. (2002) provided support for the
countless researchers who have noted production deficits along lexical class lines. The
study looked at whether imageability can explain patterns of production, which have been
thought to be caused by the effects of lexical class. Results showed that there were
deficits specific to nouns or verbs, which were not simply due to imageability. This
possibility of potential lexical class deficits warrants investigation using separate target
lexicon lists for verbs, nouns, and adjectives.
When comparing different types of aphasia, numerous studies have found that
PWAs with agrammatic speech have greater difficulty with verbs, while individuals with

7
fluent aphasia have greater difficulty with nouns (Armstrong, 2001; Bird, Howard,
Franklin, 2003; Gordon, 2008; Luzzatti et al., 2002; Thompson, Lukic, King, Mesulam,
& Weintraub, 2012). Gordon (2008) explains that PWAs with agrammatic speech have
greater difficulty with verbs due to the fact that verbs have more syntactic weight than
nouns. Because individuals with agrammatic speech have a deficit in syntax that those
with fluent aphasia do not, agrammatic speakers are the ones who show a stronger verb
deficit. However, not every study follows this pattern. Some studies have, in fact,
reported verb impairments in non-agrammatic PWAs (Druks, 2002; Thompson et al.,
2012). By separating analyses of verbs, noun, and adjective core lexicons, as well as
separating the different classes of aphasia, in the current study we are able to observe
whether lexical class deficits exist and how they may differ between subtypes of aphasia.
Based on the previous literature, it was predicted that in the current study, subjects with
Broca’s aphasia would produce disproportionately fewer core verbs and adjectives than
core nouns. Subjects with anomic, conduction, and Wernicke’s aphasia were predicted to
exhibit greater impairment in producing core nouns and adjectives, as compared to core
verbs. While other parts of speech could provide additional information about narrative
adequacy, it was decided to only look at the chosen three lexical classes in order to
maintain the quick nature of the tool. Verbs, nouns, and adjectives are the three largest
categories of open-class words, and they carry the majority of meaning in discourse.
Since the goal was to develop a tool to assess the amount of information individuals were
able to express, it was felt that analysis of these three lexical classes would provide
sufficient information.
8
One limitation of a core lexicon analysis is that it does not assess the contextual
use of the core words. In order to be considered a clinically applicable tool for the
assessment of narrative adequacy, core lexicon production must be shown to correlate
with established measurements of narrative adequacy. Main concept analysis is a
narrative measure supported by previous studies as being an informative method of
assessing adequacy of communication (Nicholas & Brookshire, 1995; Kong, 2009). Main
concept analysis is not only sensitive to differences in information content, but it is also a
reliable measure when obtained by numerous evaluators (Nicholas & Brookshire, 1995).
Beyond providing information regarding ability during a specific narrative task, an
increase in the number of main concepts produced was shown to be significantly
correlated with listeners’ ratings of functional communication improvement (Ross &
Wertz, 1999). While it would be ideal to have information on how appropriately PWAs
are able to use the words in context, the process of obtaining such information detracts
from the efficiency. However, if core lexicon measures were to correlate highly with
main concept measures, then the former could prove to be an efficient assessment tool
that could predict functional communication ability and chart change in those abilities.
The current study began with the development of a core lexicon for the Cinderella
story. This lexicon was generated based on monologic narration by control participants
and was originally intended to include verbs, nouns, and adjectives. Because only one
adjective was produced by enough participants to be considered core, it was decided to
exclude the sole adjective and have the core lexicon be comprised entirely of nouns and
verbs. The total number of core verbs and nouns produced by each control and each
person with aphasia (anomic, Broca’s, conduction, and Wernicke’s) was determined.

9
Core lexicon productions of each subtype were compared to that of controls and to every
other subtype. A main concept list was also established based on control transcripts. With
the established list, Cinderella narratives of all control participants and persons with
anomic, Broca’s, conduction, and Wernicke’s were coded and scored. Scores were added
up for calculation of a main concept composite score for each participant. Main
composite scores of each subtype were compared to controls and to every other subtype.
Finally, core lexicon production was correlated to main concept composite score for
controls and each of the four aphasia subtypes. Core verb production and core noun
production were also separated correlated to main concept composite score for each of
the five groups.
For the current study, it was predicted that core lexicon production would
correlate significantly to main concept production, and that the correlation would be
stronger when investigating the correlation with the entire core lexicon than with just
verbs or nouns. It may be the case that these correlations differ for the aphasia subtypes,
but it was predicted that similar correlations would exist when looking at subjects with
different types of aphasia.

10
CHAPTER 2
Methods
Database
This study utilized AphasiaBank, an online database of multimedia resources
available for researchers and clinicians involved in the study and treatment of PWAs.
Along with providing demographic information and assessment scores of all subjects, the
database also includes videos and transcripts of subjects completing a variety of tasks,
including Cinderella story narration. One hundred fifty-eight non-aphasic control subjects
from the AphasiaBank database were used for the creation of a core lexicon for the
Cinderella story. A smaller sample of control transcripts (N = 51) were included in the
development of a main concept list than in the establishment of a core lexicon, simply
due to the fact that main concept analysis is a much more time intensive process. In order
to ensure that the main concepts would be reflective of a typical adult of any age, the
same numbers of control transcripts (N = 17) were analyzed from three age groups (20 -
40, 41 - 60, 61 - 80). In order to decrease risk of any bias of age or gender, during the
selection of controls, subjects in each of the three age groups were matched for gender
and age within each range. One hundred thirteen PWAs of four aphasia subtypes were
included in the analyses of core lexicons and main concepts. The total numbers of
participants separated by aphasia type were as follows: 45 anomic, 30 Broca’s, 25
conduction, and 13 Wernicke’s. Individuals with transcortical motor, transcortical

11
sensory, and global aphasia were not included due to the small number of these types
existing on AphasiaBank (range of one to five transcripts). Subjects without a Cinderella
transcript were also excluded from the study.
Materials
Cinderella story transcripts, of both PWAs and control subjects, were retrieved
from the AphasiaBank database. Computerized Language Analysis (CLAN) was used to
formulate lists of all the verbs and nouns produced by control subjects, along with the
number of subjects producing each word (incidence). After establishing core lexicon and
main concept lists with the use of Excel, CLAN was again utilized to generate
spreadsheets with the verbs, nouns, and adjectives produced by each PWA. SPSS
software was used to perform statistical analysis of the compiled data.
Procedure
Aim 1: Investigating Core Lexicon
Core verb, noun, and adjective lexicons were created for the Cinderella story,
based on the narratives of all control subjects on AphasiaBank (N = 158). Core verb and
core noun lists have been created for the Cinderella story in a previous study
(McWhinney et. al. 2010) based on 25 subjects. All verbs, nouns, and adjectives
produced by at least 20% of subjects were included in the core lexicon lists. The current
study included a larger group of control subjects (N = 158), and in order to be included in
the core lexicon list, a word had to be produced by at least 50% of subjects. Fifty percent
was selected due to the fact that it yielded a reasonably sized lexicon and has served as a
criterion in previous language research, such as in Brown’s stages of language
development (Owens, 2008). The inclusion criterion of 50% generated core lexicon lists

12
that reflect the elements that seem to be essential to successful narration of the Cinderella
story. The more stringent criterion resulted in only one adjective meeting the
qualification. Therefore, adjectives were not included in the analyses, as originally
intended. Once the lexicons were established, the numbers of core nouns and verbs
produced by each PWA (N = 113) and by each control (N = 158) were counted, and each
subtype was compared to controls. To determine how well each method of analysis was
able to differentially characterize the four subtypes of aphasia, the subtypes were first
compared on the number of core lexical items produced (nouns and verbs) and then a
closer examination of potential differences between nouns and verbs followed.
Aim 2: Investigating Main Concepts
Control transcripts were also analyzed in order to establish a list of main concepts,
again using the inclusion criterion of 50% production. All relevant concepts were
identified in each of 51 control transcripts. A relevant concept was defined as a correct
utterance about the Cinderella story that contained a subject, one main verb, and an
object, if appropriate. It could also contain subordinate clauses, as long as it contained
only one main verb (Nicholas & Brookshire, 1995). A master list of all relevant concepts
produced was developed, in which relevant concepts were simplified to the form of
subject, verb, and object for ease of comparison across participant. Any relevant concepts
that were judged to have the same basic message were regarded as the same concept to
allow for varying vocabulary (e.g., “his family decided it was time for him to take a
wife,” “the young prince is at a point where he needs to select a bride to get married to
carry on the lineage of the royal family”, and “once there was a prince who was looking
for a princess,” were judged to cover the same main concept of “the prince needed to find

13
a wife”). The frequency of occurrence of concepts was recorded across all subjects, and
any concept spoken by 50% or more of subjects was listed as a main concept. Using the
created main concept list, each transcript (51 controls, 113 PWAs) was scored according
to a scoring system we adapted from Nicholas and Brookshire (1992), which included the
following codes: inaccurate incomplete, inaccurate complete, accurate incomplete, and
accurate and complete. Every transcript received the same number of codes, one for each
concept on the master list of main concepts. In order to be coded as accurate, a statement
had to include no incorrect information. A single semantic paraphasia would result in a
statement being coded as inaccurate, because this meets the definition of incorrect
information. Statements including phonemic paraphasias, however, could be coded as
accurate as long as the phonemic error does not cause any ambiguity with the regards to
intended word production. Completeness was determined by whether every component
deemed to be a necessary concept of a main concept was mentioned in the speaker’s
production. Based on these definitions of accuracy and completeness, accurate and
complete concepts had to contain all components of the main concept with no incorrect
information. Accurate, but incomplete concepts contained no incorrect information, but
left out a component of the main concept. Inaccurate, yet complete statements contained
at least one incorrect piece of information, but mentioned all components of the
established main concept. Lastly, the coding of inaccurate and incomplete was given
when a statement clearly corresponded with a main concept, but included at least one
incorrect component and failed to include at least one component of the main concept.
After being coded based on accuracy and completeness, corresponding scores were
assigned, and a composite score for each subject was computed. Statements coded as

14
absent received a score of zero, statements coded as inaccurate and incomplete received a
score of one, statements coded as inaccurate but complete or accurate but incomplete
received scores of two, and statements coded as accurate and complete received scores of
three. The PWAs, and then each subtype separately, were compared to controls based on
main concept composite score. To determine how well each method of analysis was able
to differentially characterize the four subtypes of aphasia, the subtypes were compared
based on main concept composite score.
Aim 3: Relationship Between Core Lexicon and Main Concepts
Correlations were determined between the number of core words produced and
main concept scores for controls and each aphasia subtype separately. Further analyses
were conducted to look at relationships between core nouns and main concept scores and
core verbs and main concept scores for controls and each subtype.
Statistical Analysis
Aim 1: Investigating Core Lexicon
A median test was conducted comparing the entire core lexicon production of
PWAs to that of controls. Non-parametric tests were used throughout the analyses due to
skewed distributions of data. The median test was selected, as opposed to the Mann
Whitney U Test, because distributions were not homogeneous across groups. Four
median tests were conducted in order to compare each subtype (anomic, Broca’s,
conduction, Wernicke’s) to controls based on core lexicon production. Alpha levels for
these tests were determined based on the Holm-Bonferroni method of correction from an
original alpha level of .05 in order to decrease the likelihood of type I error. After
comparing each subtype to controls based on core lexicon, two more families of tests

15
were run using the aforementioned procedure to compare specifically the core verb and
noun productions of the four subtypes to those of controls. To determine whether any
differences existed in core lexicon productions across the four subtypes of aphasia,
another median test was conducted. Controls were not included in this comparison in
order to prevent the resulting magnitude of difference from being inflated by the much
higher core lexicon production of controls. For each family of tests, alpha levels were
adjusted using the Holm-Bonferroni method.
Aim 2: Investigating Main Concepts
A median test was conducted comparing main concept composite score of PWAs
and controls. Four median tests, with alpha levels adjusted by Holm-Bonferroni
correction, were then conducted comparing each subtype individually to controls. Next, a
median test was conducted to determine whether differences existed between main
concept scores across the four subtypes. Finally, median tests were conducted to compare
each subtype to each of the other subtypes based on main concept composite score. As
with previous analyses, alpha levels were adjusted using the Holm-Bonferroni method for
each family of tests.
Aim 3: Relationship Between Core Lexicon and Main Concepts
A Spearman’s correlation coefficient was computed on the relationship between
core lexicon production and main concept composite scores across all groups.
Spearman’s correlation coefficients were computed, as opposed to Pearson correlation
coefficients, because data was not normally distributed. Spearman’s correlation
coefficients were also calculated between each of the two individual lexical class
productions (verb and noun) and main concept scores. Fifteen more correlation

16
coefficients were computed in order to obtain the same information for the control,
anomic, Broca’s, conduction, and Wernicke’s groups, separately. For every correlation
coefficient obtained, a significance test was also conducted.
17
CHAPTER 3
Results
Aim 1: Investigating Core Lexicon
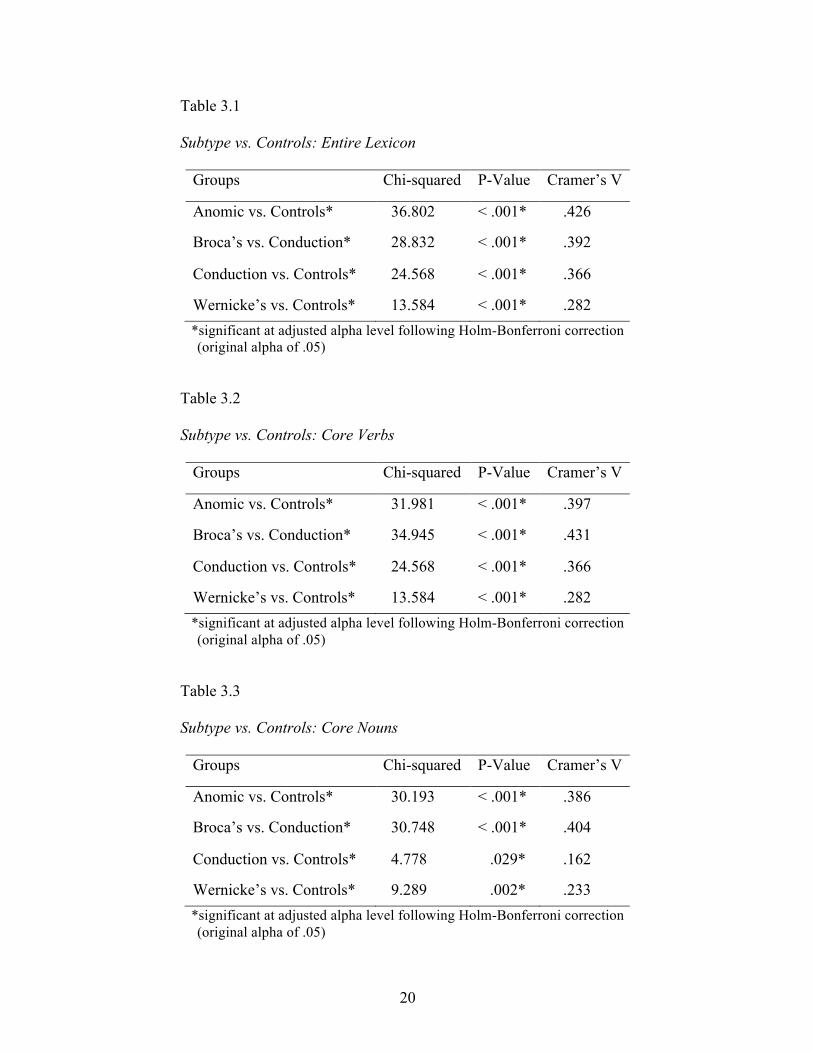
The established core lexicon consisted of 26 verbs and 19 nouns (Appendix A and
Appendix B). The median core lexicon production of controls was 32.5, while the median
for PWAs was 12. A median test evaluating the difference between core lexicon
production in controls and PWAs was significant, χ2 (1, n = 271) = 127.788, p < .001,
with a large Cramer’s V of .687. Median tests comparing core lexicon production for
each of the subtypes individually to controls were all significant, with effect sizes ranging
from .282 to .426 (Table 3.1). All median tests comparing specifically the number of core
verbs and nouns produced by the subtypes of aphasia to the numbers produced by
controls were also significant, with effect sizes ranging from small to somewhat large
(Tables 3.2 and 3.3).
Once establishing the difference between PWAs and controls, the difference
between subtypes was then explored. A median test indicated a significant difference
between groups, χ2 (3, n = 113) = 27.279, p <. 001 with a Cramer’s V of .491. When
further tests were conducted comparing every possible pair of subtypes, Broca’s was the
only subtype whose core lexicon production significantly differed from any of the others
(Table 3.4), differing significantly from both the anomic and conduction groups, but not
from the Wernicke’s group. Three of the six median tests subsequently conducted on core
verb productions of each pair of subtypes revealed significant differences (Table 3.5).

18
The significant differences in core verb production between Broca’s and anomic groups
and Broca’s and Wernicke’s groups both had large effect sizes (.512 and .503), while the
significant difference in core verb production between anomic and conduction groups had
a medium effect size (.346). The three pairs showing no significant difference in core
verb production were anomic and Wernicke’s, conduction and Wernicke’s, and
conduction and Broca’s (Table 3.5). Comparisons of individual subtypes revealed
significant differences between four of the six pairs of subtypes (Table 3.6). Differences
between core noun production of the anomic and Broca’s groups and the conduction and
Broca’s group were particularly strong, with effect sizes of .533 and .559, respectively
(Table 3.6). The pairs that were not differentiated by core noun production alone were
anomic and conduction and Broca’s and Wernicke’s (Table 3.6).
Aim 2: Investigating Main Concepts
During the development of a main concept list, 28 concepts met the 50%
inclusion criterion and were included as main concepts (Appendix C). Median main
concept composite scores were as follows: 63 for controls, 25 for anomic, 8.5 for
Broca’s, 12 for conduction, and 7 for Wernicke’s (Figure 3.4). A median test comparing
main concept scores of all PWAs to controls was significant, χ2 (1, n = 164) = 64.547, p <
.001, with a large effect size of .627. All median tests comparing individual subtypes to
controls were also significant, with large effect sizes ranging from .505 to .758 (Table
3.7). A subsequent median test comparing main concept production of the four subtypes
of aphasia indicated a significant difference, as well, χ2 (3, n = 113) = 21.867, p < .001,
with an effect size of .440. Two of the six median tests conducted between each pair of
subtypes were significant (Table 3.9) – the anomic subtype produced significantly more

19
main concepts than Broca’s and conduction subtypes. Boxplots of main concept scores of
all five groups can be found in Figure 3.4.
Aim 3: Relationship Between Core Lexicon and Main Concepts
Spearman correlations indicated significant relationships between main concept
score and core lexicon production for all groups (Table 3.9). A strong positive correlation
existed between the two variables for all groups (Figure 3.5). Correlations between main
concept score and core verb production were slightly weaker, but still significant for all
groups, except Wernicke’s, r (11) = .468, p = .106 (Table 3.9, Figure 3.6). Correlations
between main concept score and core noun production were also weaker than the
correlations involving the entire core lexicon. However, these correlations were still
significant for all groups (Table 3.9, Figure 3.7).
20
Table 3.1
Subtype vs. Controls: Entire Lexicon
Groups Chi-squared P-Value Cramer’s V
Anomic vs. Controls* 36.802 < .001* .426
Broca’s vs. Conduction* 28.832 < .001* .392
Conduction vs. Controls* 24.568 < .001* .366
Wernicke’s vs. Controls* 13.584 < .001* .282 *significant at adjusted alpha level following Holm-Bonferroni correction
(original alpha of .05)
Table 3.2
Subtype vs. Controls: Core Verbs
Groups Chi-squared P-Value Cramer’s V
Anomic vs. Controls* 31.981 < .001* .397
Broca’s vs. Conduction* 34.945 < .001* .431
Conduction vs. Controls* 24.568 < .001* .366
Wernicke’s vs. Controls* 13.584 < .001* .282 *significant at adjusted alpha level following Holm-Bonferroni correction
(original alpha of .05) Table 3.3
Subtype vs. Controls: Core Nouns
Groups Chi-squared P-Value Cramer’s V
Anomic vs. Controls* 30.193 < .001* .386
Broca’s vs. Conduction* 30.748 < .001* .404
Conduction vs. Controls* 4.778 .029* .162
Wernicke’s vs. Controls* 9.289 .002* .233 *significant at adjusted alpha level following Holm-Bonferroni correction
(original alpha of .05)

21
Table 3.4
Subtype comparisons: Entire Core Lexicon
Groups Chi-squared P-Value Cramer’s V
Anomic vs. Broca’s* 27.009 < .001* .600
Anomic vs. Conduction 3.579 .059 .226
Anomic vs. Wernicke’s .892 .345 .124
Broca’s vs. Conduction* 13.026 < .001* .487
Broca’s vs. Wernicke’s 5.736 .017 .365
Conduction vs. Wernicke’s .012 .899 .021 *significant at adjusted alpha level following Holm-Bonferroni correction
(original alpha of .05)
Table 3.5
Subtype Comparisons: Core Verbs
Groups Chi-squared P-Value Cramer’s V
Anomic vs. Broca’s* 19.667 < .001* .512
Anomic vs. Conduction* 8.359 .004* .346
Anomic vs. Wernicke’s .646 .421 .106
Broca’s vs. Conduction .120 .729 .047
Broca’s vs. Wernicke’s* 10.896 .001* .503
Conduction vs. Wernicke’s 1.117 .290 .171 *significant at adjusted alpha level following Holm-Bonferroni correction
(original alpha of .05)

22
Table 3.6
Subtype Comparisons: Core Nouns
Groups Chi-squared P-Value Cramer’s V
Anomic vs. Broca’s* 21.346 < .001* .533
Anomic vs. Conduction 1.556 .212 .149
Anomic vs. Wernicke’s* 7.259 .007* .354
Broca’s vs. Conduction* 17.160 < .001* .559
Broca’s vs. Wernicke’s 1.100 .294 .160
Conduction vs. Wernicke’s* 6.886 .009* .426 *significant at adjusted alpha level following Holm-Bonferroni correction
(original alpha of .05)
Table 3.7
Subtype vs. Controls: Main Concept Score
Groups Chi-squared P-Value Cramer’s V
Anomic vs. Controls* 45.553 < .001* .689
Broca’s vs. Conduction* 46.485 < .001* .758
Conduction vs. Controls* 31.803 < .001* .647
Wernicke’s vs. Controls* 16.314 < .001* .505 *significant at adjusted alpha level following Holm-Bonferroni correction
(original alpha of .05)

23
Table 3.8
Subtype Comparisons: Main Concept Scores
Groups Chi-squared P-Value Cramer’s V
Anomic vs. Broca’s* 15.705 < .001* .458
Anomic vs. Conduction* 8.359 .004* .346
Anomic vs. Wernicke’s 4.858 .028 .289
Broca’s vs. Conduction 2.183 .140 .199
Broca’s vs. Wernicke’s .054 .817 .035
Conduction vs. Wernicke’s 2.184 .139 .240 *significant at adjusted alpha level following Holm-Bonferroni correction
(original alpha of .05)
Table 3.9
Relationship Between Main Concepts and Core Lexicon
Groups MCs & Core Lexicon
MCs & Core Verbs
MCs & Core Nouns
All Groups (162)
.925, < .001* .878, < .001* .850, < .001*
Controls (49)
.771, < .001* .725, < .001* .621, < .001*
Anomic (43)
.894, < .001* .790, < .001* .851, <.001*
Broca’s (28)
.755, < .001* .648, < .001* .725, < .001*
Conduction (23)
.851, < .001* .798, < .001* .592, .002*
Wernicke’s (11)
.693, .009* .468, .106 .859, < .001*
*significant at adjusted alpha level following Holm-Bonferroni correction (original alpha of .05) Note. In column one, degrees of freedom are listed in parentheses. In
columns two through four, the first number listed is Spearman’s rank
correlation coefficient, and the second number listed is the p-value.

24
Figure 3.1. Core Lexicon Production.
Figure 3.2. Core Verb Production.

25
Figure 3.3. Core Noun Production.
Figure 3.4. Main Concepts.

26
Figure 3.5. Relationship Between Main Concepts and Core Lexicon.
R2 listed in parentheses; R2 across all groups=.856.
Figure 3.6. Relationship Between Main Concepts and Core Verbs.
R2 listed in parentheses; R2 across all groups=.771.

27
Figure 3.7. Relationship Between Main Concepts and Core Nouns. R2 listed in parentheses; R2 across all groups=.723.

28
CHAPTER 4
Discussion
Aim 1: Investigating Core Lexicon
MacWhinney et al. (2010) suggested core lexicon analysis during narration may
provide a time-efficient and informative indication of functional communication. For
example, clinicians would not need to perform lengthy transcription, but instead could
generate a list of words spoken during narration for later comparison to a core lexicon.
What is needed is a core lexicon derived from a large sample of controls, ensuring that
the lexicon reflects typical discourse abilities. After analyzing transcripts of 158 adults
with typical language and utilizing a more stringent criterion of 50% incidence, the
resultant core lexicon reflects what is essential to successful Cinderella narration. This
core lexicon list can be utilized by clinicians in the previously described manner as a tool
for narrative discourse assessment.
Comparison of the core lexicon production of controls and PWAs indicated
markedly greater production by controls. While this result was expected, establishing this
difference was a necessary initial step in core lexicon analysis. Results of the three
median tests comparing core lexicon, verb, and noun productions of the four subtypes
suggest that distinctions in core verb and noun production are evident between aphasia
subtypes. This information may have important implications for the validity of core
lexicon analysis, as it suggests that this measure may be sensitive to differences between
aphasia subtypes. When specifically comparing pairs of subtypes based on entire core

29
lexicon production, Broca’s was the only subtype that could be differentiated from others.
This suggests that core lexicon analysis may not be sensitive enough to differences
between the other subtypes.
The same findings do not hold true when looking specifically at individual lexical
class productions. While just looking at core verbs would be sufficient for differentiating
Broca’s from anomic and Wernicke’s subtypes, this information would not be adequate
for differentiating Broca’s from conduction. Based on findings from this study, analysis
of core verb and noun productions would be necessary in order to make the distinction
between Broca’s and conduction. Another interesting finding regarding core verb
comparisons was that anomic and conduction subtypes were differentiated on this
measure, even though this was not the case based on entire lexicon comparisons.
Meanwhile, core noun analysis could sufficiently make distinctions between all pairs,
except anomic and conduction and Broca’s and Wernicke’s subtypes. After comparing
groups based on the entire core lexicon and individual classes, it is clear that the different
measures result in varying degrees of discrimination between different pairs of aphasia
subtypes.
Aim 2: Investigating Main Concepts
Standardized main concept lists for discourse tasks could allow clinicians to
efficiently assess discourse skills and predict activity and participation limitations. The
generated main concept list could potentially serve as a clinically useful checklist for
narrative assessment of individuals with aphasia when the Cinderella narrative is elicited
according to AphasiaBank conventions. Similarly to the procedure with core lexicon
analysis, an important initial step in the exploration of main concept analysis was to

30
ensure its ability to highlight a clear difference between discourse skill of PWAs and
controls. The strong effect sizes of all tests comparing the different subtypes of aphasia to
controls based on main concept scores indicate that we can be confident in this measures’
ability to detect language impairment.
The median test comparing the four subtypes’ main concept scores suggested
that the measure was also able to distinguish subtypes within subjects with aphasia.
However, further median tests comparing each set of pairs indicated that anomic aphasia
was the only subtype significantly different from any of the others with regard to main
concept scores. Main concept scores of Broca’s, conduction, and Wernicke’s subtypes
were too similar to suggest any difference between these three subtypes.
It is interesting to note that while the median main concept score of 25 for the
anomic group was significantly higher than that of the Broca’s and conduction subtypes,
it was still significantly lower than the median score of 63, obtained by controls. While
anomic aphasia is primarily characterized as a word-finding disorder, Andreetta,
Cantagallo, and Marini (2012) suggested that narrative coherence can also be impacted in
this population. Deficits in discourse skills may be so minor with this population that they
are not apparent on many standardized assessment measures, but it should not be
assumed that they do not exist and do not affect functional communication abilities. The
notable gap apparent between main concept scores of controls and subjects with anomic
aphasia makes main concept analysis a promising tool for detecting discourse weaknesses
in anomic aphasia.

31
Aim 3: Relationship Between Core Lexicon and Main Concepts
The relationship between core lexicon production and main concept scores was
investigated to determine whether the quick core lexicon analysis correlated strongly with
the more thorough (but time-intensive) analysis of narrative discourse. Main concept
analysis is a narrative measure which has been supported by previous studies as being a
reliable and informative method of assessing adequacy of communication (Nicholas &
Brookshire, 1995; Kong, 2009). Our results suggest core lexicon production is strongly
related to main concept scores for all groups (controls and all subtypes of aphasia), which
makes it a promising method of assessment. This finding lends support to the idea that
core lexicon analysis may be a comparable and time-efficient method of characterizing
discourse abilities and, potentially, charting treatment outcomes.
Tests of whether core verbs or core nouns alone correlated with main concept
scores of each group indicated that individual lexical classes due, indeed, correlate
significantly with main concept productions, except in one particular case. For the
Wernicke’s group, core verb productions did not correlate significantly with main
concept scores. Meanwhile, the number of core nouns produced showed a stronger
correlation to main concept scores than did total core lexicon production (Table 3.9).
These results indicate a notable gap between the noun and verb usage of individual’s with
Wernicke’s aphasia (e.g. “and the two girls, they go to this meeting,” contains 1 core verb
“go,” but the participants fails to get credit for “stepsisters” or “ball” because of non-
specific noun usage.). This information is useful and suggests that if a clinician were to
use the core verb production of a patient with Wernicke’s aphasia to estimate their likely
main concept score, the clinician could be overestimating the patient’s actual abilities in
32
the area of main concept production. In fact, core noun analysis specifically would be
more appropriate than core lexicon analysis for individuals with Wernicke’s aphasia,
based on results of correlational tests in this study. For all other groups, the best method
of predicting main concept score would be core lexicon analysis, including both verbs
and nouns. The only other subtype exhibiting a noticeable difference between
correlations obtained with core verbs versus core nouns was the conduction group.
Unlike the Wernicke’s group, which seemed to show a greater deficit with nouns, the
conduction group seemed to show a greater deficit with verbs. However, this tendency
was not strong enough to prevent the combined measurement of verb and noun
production from being the stronger measurement of discourse skill, based on correlations
to main concept scores.
Further Discussion
Time-efficiency was a primary motivator for pursuing core lexicon and main
concept analyses as methods of assessment. While the CLAN system has yet to be
automated with these assessment functions, relative efficiency exists even in the manual
calculation of these measurements. While the completion of this study required much
deliberate analysis, the most time-consuming portions related to the creation of the core
lexicon and main concept lists, and not in the subsequent use of the tools. Core lexicon
analysis, in particular, was a quick method of acquiring a quantitative measurement.
Commands can be inserted into CLAN with desired specifications. For core lexicon
analysis, one can request the program to create an excel spreadsheet of all the verbs or all
the nouns a participant produced specifically during narration of one story. The assessor
can then highlight the columns corresponding to words included in the core lexicon and
33
count the total number produced by the participant. Once the core lexicon tool is created
within CLAN, even this short process will be eliminated, and simply typing in the core
words produced by a client will provide immediate results. Main concept analysis
required substantially more time than core lexicon analysis, and, admittedly, may be an
unrealistic tool for clinical use until automization occurs. Judging accuracy and
completeness of concepts requires careful consideration, and it is hoped that through the
input of many variations and alternative productions into CLAN, the system will be able
to code concepts accordingly.
Along with being time-efficient, the other main concern regarding these
assessment tools was that the information they provided actually indicate relevant skills.
The fact that we are in need of discourse analysis tools that reflect functional
communication and life participation make the task of establishing relevancy difficult.
We were not able to correlate our findings to an established standardized assessment tool
with strong psychometric properties, but several points can be made, which suggest
promise for the relevancy of these analyses. First, and foremost, core lexicon, core verb,
core noun, and main concept analyses all clearly separated speakers with and without
aphasia. Secondly, some logical results arose from these analyses, such as higher
production scores for anomic participants and lower production scores for Broca’s
participants. Lastly, the fact that core lexicon and main concept analyses were
significantly correlated for every subtype, and strongly so for most subtypes, serves as
somewhat of a validity check for the two measurements. The tools are designed to assess
narrative ability, they follow distinctly different methods, and, yet, they result in highly
correlated findings. In order to truly determine whether core lexicon and main concept

34
analysis are valid assessments for determining life participation and functional
communication ability, future studies will need to gather quantitative data for these
targeted outcomes. A study currently in progress within this lab involves investigating the
validity of core lexicon and main concept analysis as predictors of listener perceptions of
a speaker by correlating the scores of speaker to listener ratings of the speaker. Other
future studies could correlate the discourse analysis scores to results of questionnaires
completed by speakers themselves and by family members in order to determine how
they really relate to the measurements that matter, functional communication and life
participation.
Grande et al. (2008) found computer analysis of discourse measurements to be
sensitive enough to monitor improvement over the course of treatment. Because the
current study looked only at a single narrative sample of each participant, nothing can be
drawn from the data about the longitudinal abilities of core lexicon and main concept
analyses. Future research is needed, in which several narrative samples are collected and
analyzed at different times throughout the course of intervention.
Webster et al. (2007) stated the importance of first analyzing transcripts of control
subjects to get a clear picture of how a person without language impairment would
produce a story. This suggestion was followed in the current study to ensure that the core
lexicon and main concept lists reflected typical Cinderella narrative productions. The
production of PWAs was simply compared to that of adults of a similar age range, who,
as a group, were in no way more familiar with the task than the PWAs themselves. This
method of developing core lexicon and main concept lists based on control participants is
suggested for future studies, as opposed to having researchers generate lists based on

35
their own, perhaps biased, notions. Establishing core lexicons and main concepts for a
wide variety of tasks and a large number of prompts would allow clinicians to assess
skills for different communication needs and allow them to repeatedly assess progress
without the concern of improved performance simply due to familiarity with the prompt.
Another study currently in progress in this lab is developing a main concept list for a
sequencing task, as well as for a picture description task.
As suggested by Edwards (1998), no one task should be used to assess the speech
and language abilities of a client. Although, core lexicon and main concept analyses
could contribute to a well-rounded assessment, this is not to say that they should be used
in place of established aphasia assessment tools. These analyses should, instead, be tools
for use in conjunction with other measurements as a way of gaining additional
information not attained otherwise.
After analyzing 271 Cinderella transcripts, further support can be added to the
claim that the Cinderella story is ideal for a narrative task. The story was familiar to most,
predictable enough for researchers to interpret productions, and demanding enough to
require a lengthy and complex narrative. There was notable variability in the way
different narrators worded the same concepts, so it will be vital to develop methods of
recognizing such variable productions when creating the automatized program within
CLAN. A study currently in progress in this lab is investigating differences in the main
concepts produced during narration of the Cinderella story based on age. This could have
important implications for which main concepts and how many main concepts you should
expect a client to produce. Perhaps distinct main concept lists are warranted for different

36
age ranges. If this is the case, follow-up studies will explore the need for separate core
lexicon lists based on age, as well.
Core lexicon and main concept scores were reflective of speech production
differences between some subtypes, but were unable to differentiate each and every
subtype from one another. Grande et al.’s (2008) found that the best tools for showing
improvements of a speaker with one type of aphasia may not be the same as those most
sensitive to improvements made by a speaker with another type of aphasia. The current
study supported this finding in that core nouns are more strongly correlated to main
concept score in those with Wernicke’s aphasia, but core verbs are more strongly
correlated to main concept score in those with Conduction aphasia. Other differences can
be seen between groups in the tables and figures of results.
Core lexicon production correlated strongly to main concept scores for all
subtypes, despite the fact that the core lexicon established for this study included only
two lexicon classes. This provides evidence that analyzing only verb and noun production
is not only a time saving strategy, but it is also a technique that provides sufficient
information for judgment of narrative quality. Because time is a finite commodity and a
single client can only be allocated a certain amount of a clinician’s time, assessments
should only be as long as deemed necessary for obtaining relevant information. Seeing as
core lexicon production correlated strongly to main concept production while only
consisting of verbs and nouns, spending time analyzing other lexicon classes would likely
not provide enough additional information to be justifiable, though should be ruled in or
out with further research. Interesting, based on results of this study, analyzing noun
production alone, rather than noun and verb production, may actually provide a better

37
indication of narrative quality for individuals with Wernicke’s aphasia. Looking at nouns
and verbs is most informative for all other subtypes. However, if time is extremely
limited, verb production is most informative of speakers with conduction aphasia and
noun production is most informative of those with anomic and Broca’s aphasia.
Analyzing the suggested lexical classes for each subtype provides a slightly weakened
prediction of main concept production as compared to analyzing the two class lexicon
together. While there may be a situation in which a clinician opts for single lexical class
analysis, analyzing both verbs and nouns seems to be the most optimal and efficient use
of time for clients with all subtypes of aphasia, except Wernicke’s.
Future Research
A potentially informative follow-up study of this particular data would be to
further investigate the differences in main concept production between aphasia subtypes,
by comparing the accuracy and completeness codes received by each subtype. This study
judged main concept production only based on composite score, which may be leaving
out pertinent information regarding production. Perhaps, for example, certain subtypes
lost the majority of points in the area of accuracy, while another subtype lost the majority
of points in the area of completeness. This information would be helpful to know. The
developed core lexicon and main concept lists will be utilized in other investigations of
speakers with aphasia and of other populations, such as TBI. The effects of gender and
age on the quantitative and qualitative aspects of discourse will be explored using the
generated main concept list. If clear differences existed, several lists could be developed,
allowing clinicians to determine discourse adequacy using a list that is most appropriate
to a given client's demographics. As more subjects are added to AphasiaBank, and to the

38
newly developed TBIBank, lexicons and main concepts will be re-analyzed, and the lists
will be revised. Perhaps a future study could include other lexical classes, such as
pronouns and conjunctions, to investigate whether their inclusion may strengthen the
method’s predictive power or provide some information regarding coherence. Main
concept and core lexicon lists could also be developed for other discourse tasks, such as
picture description and sequencing. To establish functional relevance of these two
discourse measurements, future studies should investigate their correlations to quality of
life measures and to listener ratings of narrative adequacy. Along with making checklists
immediately available, another future direction of this research is to develop automatized
core lexicon and main concept analyses tools within Computerized Language Analysis
(CLAN). It is essential that researchers continue to develop time-efficient methods of
discourse analysis to equip clinicians and researchers with practicable tools for measuring
functional outcomes.
Conclusion
Discourse analysis is often time-consuming and impractical for everyday clinical
use. Results of this study lend support to the usefulness of further development and
application of core lexicon and main concept analyses as efficient methods of
determining narrative adequacy in PWAs. With these tools, the goal is that clinicians will
increasingly target narrative discourse during treatment of PWAs. Long-term, it is hoped
that an increased emphasis on discourse will result in greater quality of life for PWAs.

39
References
Andreetta S, Cantagallo A, & Marini A. (2012). Narrative discourse in anomic aphasia.
Neuropsychologia, 50(8), 1787-93.
Armstrong, E. (2001). Connecting lexical patterns of verb usage with discourse meanings
in aphasia. Aphasiology, 15(10/11), 1029-1045.
Armstrong, L., Brady, M., Mackenzie, C., & Norrie, J. (2007). Transcription-less analysis
of aphasic discourse: A clinician's dream or a possibility? Aphasiology, 21(3/4),
355-374.
Berndt, R. S., Haendiges, A. N., Burton, M. W., & Mitchum, C. C. (2002). Grammatical
class and imageability in aphasic word production: Their effects are independent.
Journal Of Neurolinguistics, 15(3-5), 353-371.
Bird, H., & Franklin, S. (1996). Cinderella revisited: a comparison of fluent and non-
fluent aphasic speech. Journal of Neurolinguistics, 9, 187–206.
Bird, H., Howard, D., & Franklin, S. (2003). Verbs and nouns: the importance of being
imageable. Journal Of Neurolinguistics, 16(2/3), 113.
Boles, L., & Bombard, T. (1998). Conversational discourse analysis: appropriate and
useful sample sizes. Aphasiology, 12(7/8), 547.
Brown, C.S., & Cullinan, W.L. (1981). Word-retrieval difficulty and disfluent speech in
adult anomic speakers. Journal of Speech and Hearing Research, 24, 358-365.
Druks, J. J. (2002). Verbs and nouns--A review of the literature. Journal Of
Neurolinguistics, 15(3-5), 289-319.
40
Edwards, S. (1998). Single words are not enough: verbs, grammar and fluent aphasia...
Communicating the evidence: the case for speech and language therapy.
Proceedings of the College's 1998 Conference, Liverpool 15-17 October 1998.
International Journal Of Language & Communication Disorders, 33190-195.
Fergadiotis, G. & Wright, H. (2011). Lexical diversity for adults with and without
aphasia across discourse elicitation tasks. Aphasiology, 25 (11), 1414 – 1430.
Fergadiotis, G., Wright, H. & Capilouto, G. J. (2011). Productive vocabulary across
discourse types . Aphasiology, 25 (10), 1261 – 1278.
Grande, M., Hussmann, K., Bay, E., Christoph, S., Piefke, M., Willmes, K., & Huber, W.
(2008). Basic parameters of spontaneous speech as a sensitive method for
measuring change during the course of aphasia. International Journal Of
Language & Communication Disorders, 43(4), 408-426.
Gordon, J. (2008). Measuring the lexical semantics of picture description in aphasia.
Aphasiology, 22(7-8), 839-852.
Hickin, J., Best, W., Herbert, R., Howard, D., & Osborne, F. (2001). Treatment of word
retrieval in aphasia: Generalisation to conversational speech. International
Journal of Language and Communication Disorders, 36(Suppl.), 3-8.
Kong, A. (2009). The Use of Main Concept Analysis to Measure Discourse Production in
Cantonese-Speaking Persons with Aphasia: A Preliminary Report. Journal Of
Communication Disorders, 42(6), 442-464.
Luzzatti, C., Raggi, R., Zonca, G., Pistarini, C., Contardi, A., & Pinna, G. (2002). Verb–
Noun Double Dissociation in Aphasic Lexical Impairments: The Role of Word
Frequency and Imageability. Brain & Language, 81(1-3), 432.

41
MacWhinney, B., Fromm, D., Holland, A., Forbes, M., & Wright, H. (2010). Automated
analysis of the Cinderella story. Aphasiology, 24(6-8), 856-868.
MacWhinney, B., Fromm, D., Forbes, M., & Holland, A. (2011). AphasiaBank: Methods
for studying discourse. Aphasiology, 25(11), 1286-1307.
Mayer, J. F., & Murray, L. L. (2003). Functional measures of naming in aphasia: Word
retrieval in confrontation naming versus connected speech. Aphasiology, 17(5),
481-497.
Nicholas, L. E., & Brookshire, R. H. (1992). A system for scoring main concepts in the
discourse of non-brain-damaged aphasic speakers. Clinical Aphasiology, 21.
Nicholas, L. E., & Brookshire, R. H. (1995). Presence, completeness, and accuracy of
main concepts in the connected speech of non-brain-damaged. Journal of Speech
& Hearing Research, 38(1), 145.
Olness, G. S., Gyger, J., & Thomas, K. (2012). Analysis of narrative functionality:
Toward evidence-based approaches in managed care settings. Seminars in Speech
and Language, 33(1), 55-67.
Owens, R. E. (2008). Language Development: An Introduction (7th Edition). Boston:
Pearson.
Roelofs, A., Meyer, A. S., & Levelt, W. J. (1998). A case for the lemma/lexeme
distinction in models of speaking: comment on Caramazza and Miozzo (1997).
Cognition, 69(2), 219-230.
Ross, K. B., & Wertz, R. T. (1999). Comparison of impairment and disability measures
for assessing severity of, and improvement in, aphasia. Aphasiology, 13(2), 113-
124.

42
Thompson, C. K., Lukic, S., King, M. C., Mesulam, M-M. and Weintraub, S. 2012. Verb
and noun deficits in stroke-induced and primary progressive aphasia: The
Northwestern Naming Battery. Aphasiology, 26(5): 632–655.
Webster, J., Franklin, S., & Howard, D. (2007). An analysis of thematic and phrasal
structure in people with aphasia: What more can we learn from the story of
Cinderella? Journal Of Neurolinguistics, 20(5), 363-394.

43
APPDENDIX A: Cinderella Core Verb Lexicon
Be
Come
Could
Dance
Do
Find
Fit
Get
Go
Have
Know
Leave
Live
Look
Lose
Make
Marry
Run
Say
See
Take
Tell
Try
Turn
Want
Will

44
APPENDIX B: Cinderella Core Noun Lexicon
Ball
Cinderella
Daughter
Dress
Fairy
Foot
Girl
Glass
Home
Horse
House
Midnight
Mother
Mouse
Prince
Pumpkin
Sister
Slipper
Time

45
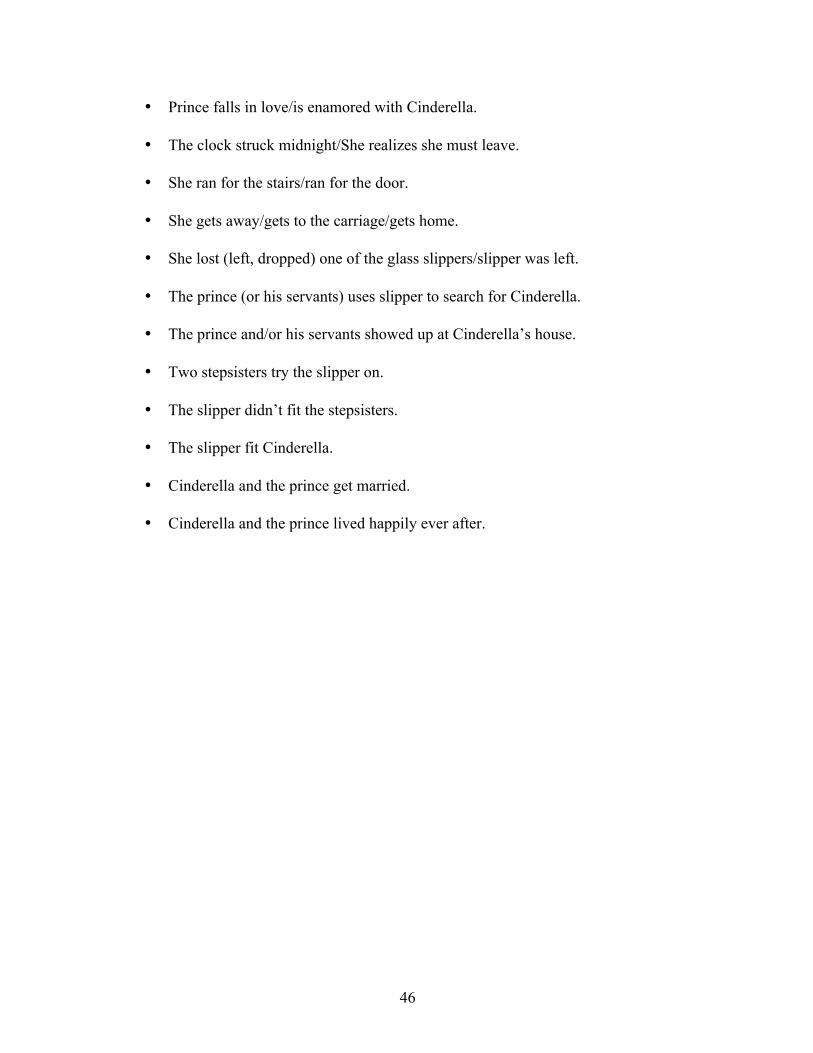
APPENDIX C: Cinderella Main Concepts
• Dad got remarried.
• Stepsister and/or stepmother were mean to Cinderella.
• Cinderella sweeps/cleans/does all the housework.
• The prince needs to find a wife.
• There is going to be a ball.
• They (or anyone in the house) got an invitation [to the ball].
• Cinderella isn’t allowed to go.
• Cinderella obtains (finds/makes) a dress.
• Stepsisters ruin/tear/throw away/take her dress.
• Cinderella was upset/crying.
• Along came her fairy godmother.
• Fairy godmother turned pumpkin and mice into carriage and horses.
• Fairy godmother made a beautiful gown and pretty glass slippers.
• Cinderella went to the ball/dance/party.
• Cinderella has to be home by midnight.
• Prince and Cinderella dance.
• Prince falls in love/is enamored with Cinderella.
• The clock struck midnight/She realizes she must leave.
• She ran for the stairs/ran for the door.
46
• Prince falls in love/is enamored with Cinderella.
• The clock struck midnight/She realizes she must leave.
• She ran for the stairs/ran for the door.
• She gets away/gets to the carriage/gets home.
• She lost (left, dropped) one of the glass slippers/slipper was left.
• The prince (or his servants) uses slipper to search for Cinderella.
• The prince and/or his servants showed up at Cinderella’s house.
• Two stepsisters try the slipper on.
• The slipper didn’t fit the stepsisters.
• The slipper fit Cinderella.
• Cinderella and the prince get married.
• Cinderella and the prince lived happily ever after.
Related Documents