APPROVED: Nandika D’Souza, Major Advisor Witold Brostow, Committee Member Zhenhai Xia, Committee Member Reza Mirshams, Committee Member Narendra Dahotre, Committee Member and Chair of the Department of Materials Science and Engineering Costas Tsatsoulis, Dean of the College of Engineering Mark Wardell, Dean of the Toulouse Graduate School INTERSPECIMEN STUDY OF BONE TO RELATE MACROMECHANICAL, NANOMECHANICAL AND COMPOSITIONAL CHANGES ACROSS THE FEMORAL CORTEX OF BONE Mangesh Nar, B.E. Thesis Prepared for the Degree of MASTER OF SCIENCE UNIVERSITY OF NORTH TEXAS May 2013

Welcome message from author
This document is posted to help you gain knowledge. Please leave a comment to let me know what you think about it! Share it to your friends and learn new things together.
Transcript

APPROVED: Nandika D’Souza, Major Advisor Witold Brostow, Committee Member Zhenhai Xia, Committee Member Reza Mirshams, Committee Member Narendra Dahotre, Committee Member
and Chair of the Department of Materials Science and Engineering
Costas Tsatsoulis, Dean of the College of Engineering
Mark Wardell, Dean of the Toulouse Graduate School
INTERSPECIMEN STUDY OF BONE TO RELATE MACROMECHANICAL,
NANOMECHANICAL AND COMPOSITIONAL CHANGES
ACROSS THE FEMORAL CORTEX OF BONE
Mangesh Nar, B.E.
Thesis Prepared for the Degree of
MASTER OF SCIENCE
UNIVERSITY OF NORTH TEXAS
May 2013

Nar, Mangesh, Interspecimen study of bone to relate macromechanical,
nanomechanical and compositional changes across the femoral cortex of bone. Master
of Science (Material Science and Engineering), May 2013, 96 pp., 6 tables, 62 figures,
62 numbered references.
Mechanics of bone is widely studied and researched, mainly for the study of
fracture. This has been done mostly on a macro scale. In this work hierarchical nature
of bone has been explored to investigate bone mechanics in more detail. Flexural test
were done to classify the bones according to their strength and deflection. Raman
spectroscopy analysis was done to map the mineralization, collagen crosslinking
changes across the thickness of the bone. Nanoindentation was done to map
indentation hardness and indentation modulus across femoral cortex of the bone. The
results indicate that the composition of the bone changes across the thickness of the
femoral cortex. The hypothesis is confirmed as increase in mineralization, carbonate to
phosphate ratio and collagen crosslinking shows the effect as increased indentation
hardness and modulus and decreased deflection.

Copyright 2013
by
Mangesh Nar
ii

ACKNOWLEDGEMENTS
I would like to extend my thanks to my advisor Dr. Nandika D'Souza who has
supported me constantly. This thesis would not have been possible without her
guidance. The in-depth knowledge of hers in mechanics and biology has helped me
throughout the completion of this thesis. I remember once she told me that
characterization is the beginning of every project, the real work is extracting the data
just like twisting the wet cloth till its last possible drop will what make a good researcher.
And this thesis is just an example of that. Her financial support has always kept me
comfortable. She is in true sense my philosopher and guide not only in research but in
academics and real life.
I would also like to thank Dr. Reza Mirshams and Okafer for letting me use the
Nanoindentor. David Garret for teaching me microscopy. Dr. Tom Scharf for teaching
me Raman spectroscopy and Hadeel who helped me process Raman spectroscopy
data.
My special thanks to my lab mates Shailesh Vidhate and Sandeep Manandhar
who have been with me since my very first day. Also, to my friends who have been with
me during all this good times Nikhil Kulkarni, Nikhil Yellakara, Farica Mascarenhas,
Fancine Mascarenhas and a very special thanks to Rachana Akhade.
Lastly thanks to my parents Anita and Anant and sister Sarika who always
encourage me to follow what I believe in.
iii
TABLE OF CONTENTS
Page ACKNOWLEDGEMENTS ............................................................................................... iii LIST OF TABLES ............................................................................................................ vi LIST OF ILLUSTRATIONS ............................................................................................. vii CHAPTER 1 SCOPE OF THESIS ................................................................................... 1 CHAPTER 2 INTRODUCTION AND BACKGROUND ..................................................... 3
2.1 Introduction ................................................................................................ 3 2.2 Morphology: Macroscopic and Microscopic Structures .............................. 3
2.2.1 Bone Nomenclature ........................................................................ 4 2.2.2 Composition of Bone ....................................................................... 6
2.3 Ageing of Bone .......................................................................................... 7 2.4 Bone Hardness and Bone Mineral Crystal Size ......................................... 8
CHAPTER 3 MATERIALS AND METHODS ................................................................... 9
3.1 Materials .................................................................................................... 9 3.1.1 Bone ................................................................................................ 9 3.1.2 Phosphate Buffered Solution (PBS) ................................................ 9
3.2 Sample Preparation ................................................................................. 10 3.2.1 X-ray Micro Tomography ............................................................... 10 3.2.2 Three Point Bend Test .................................................................. 10 3.2.3 Nanoindentation and Raman ........................................................ 10
3.3 Methods ................................................................................................... 11 3.3.1 X-ray Micro Tomography ............................................................... 11 3.3.2 Three Point Bend Test .................................................................. 12 3.3.3 Nanoindentation ............................................................................ 15 3.3.4 Raman Spectroscopic Characterization for Compositional Changes
...................................................................................................... 18 CHAPTER 4 RESULTS ................................................................................................. 21
4.1 Three Point Bend Test ............................................................................. 21 4.2 Hypothesis 1 ............................................................................................ 26
iv

4.3 Nanoindentation ....................................................................................... 26 4.4 Raman Spectroscopy............................................................................... 38 4.5 Hypothesis 2 ............................................................................................ 49
CHAPTER 5 DISCUSSION ........................................................................................... 66 CHAPTER 6 CONCLUSION ......................................................................................... 69 APPENDIX: SUPPLEMENTAL GRAPHS ..................................................................... 70 REFERENCES .............................................................................................................. 93
v
LIST OF TABLES
Page 4.1 Comparison of elastic modulus and ultimate stress from microCT and micrometer
........................................................................................................................... 23
4.2 Comparison of nano-mechanical properties of group A and B for endosteal and periosteal region ................................................................................................. 47
4.3 Comparison of micro-chemical properties of group A and B for endosteal and periosteal region ................................................................................................. 48
4.4 Comparison of macro and nano-mechanical properties ..................................... 61
4.5 Micro-chemical properties .................................................................................. 62
4.6 Correlation between nano-mechanical and compositional properties ................. 64
vi

LIST OF ILLUSTRATIONS
Page
2.1 Schematic showing the location of femur, the nomenclature for the femur parts and the cross section of femur showing the four quadrants ................................. 4
2.2 Schematic of bone cross section showing four quadrants, direction of bone growth and change in hardness, stiffness, modulus across the thickness of bone with change in mineralization and collagen crosslinks .......................................... 5
3.1 Distal end embedded in epoxy and polished ...................................................... 11
3.2 Placing of femur on three point bend fixture ....................................................... 14
3.3 Three point bend testing of femur ....................................................................... 15
3.4 Optical cross sectional bone view of the: (A) anterior quadrant, (B) lateral quadrant, (C) posterior quadrant, and (D) medial quadrant ................................ 18
3.5 Optical cross sectional bone view of the: (A) anterior quadrant, (B) lateral quadrant, (C) posterior quadrant, and (D) medial quadrant Nanoindentation locations are shown as yellow lines and Raman spectroscopy locations as a red line ...................................................................................................................... 20
4.1 Elastic modulus and ultimate stress plot showing the range of twenty-two right femurs three point bend test to form three clusters ............................................ 22
4.2 Comparison of elastic modulus, ultimate stress and displacement for randomized bone samples ..................................................................................................... 22
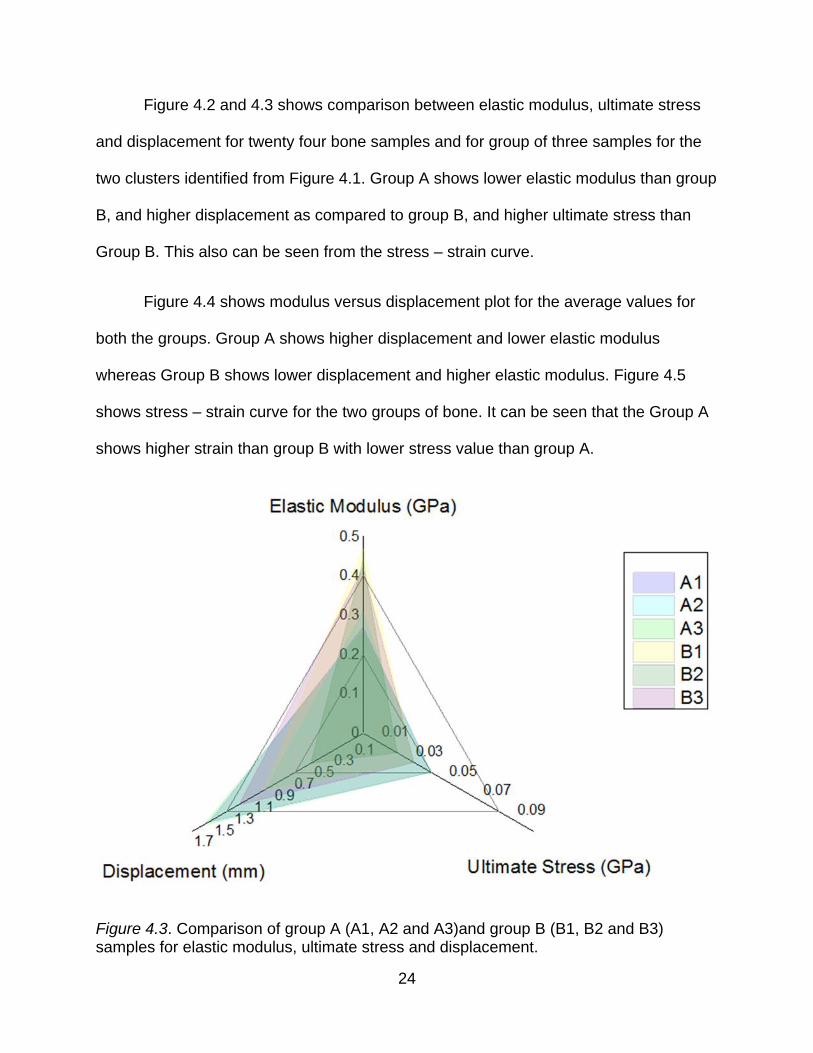
4.3 Comparison of group A (A1, A2 and A3)and group B (B1, B2 and B3) samples for elastic modulus, ultimate stress and displacement ............................................. 24
4.4 Groups A and B comparison on basis of modulus and displacement ................. 25
4.5 Stress – strain curve for group A and B .............................................................. 25
4.6 Indentation modulus values versus the distance from perioseal to endosteal surface of A1 for four quadrants investigated ..................................................... 27
4.7 Hardness values versus the distance from perioseal to endosteal surface of A1 for four quadrants investigated ........................................................................... 27
4.8 Indentation modulus values versus the distance from perioseal to endosteal surface of A2 for four quadrants investigated ..................................................... 29
4.9 Hardness values versus the distance from perioseal to endosteal surface of A2 for four quadrants investigated ........................................................................... 29
vii

4.10 Indentation modulus values versus the distance from perioseal to endosteal surface of A3 for four quadrants investigated ..................................................... 31
4.11 Hardness values versus the distance from perioseal to endosteal surface of A3 for four quadrants investigated ........................................................................... 31
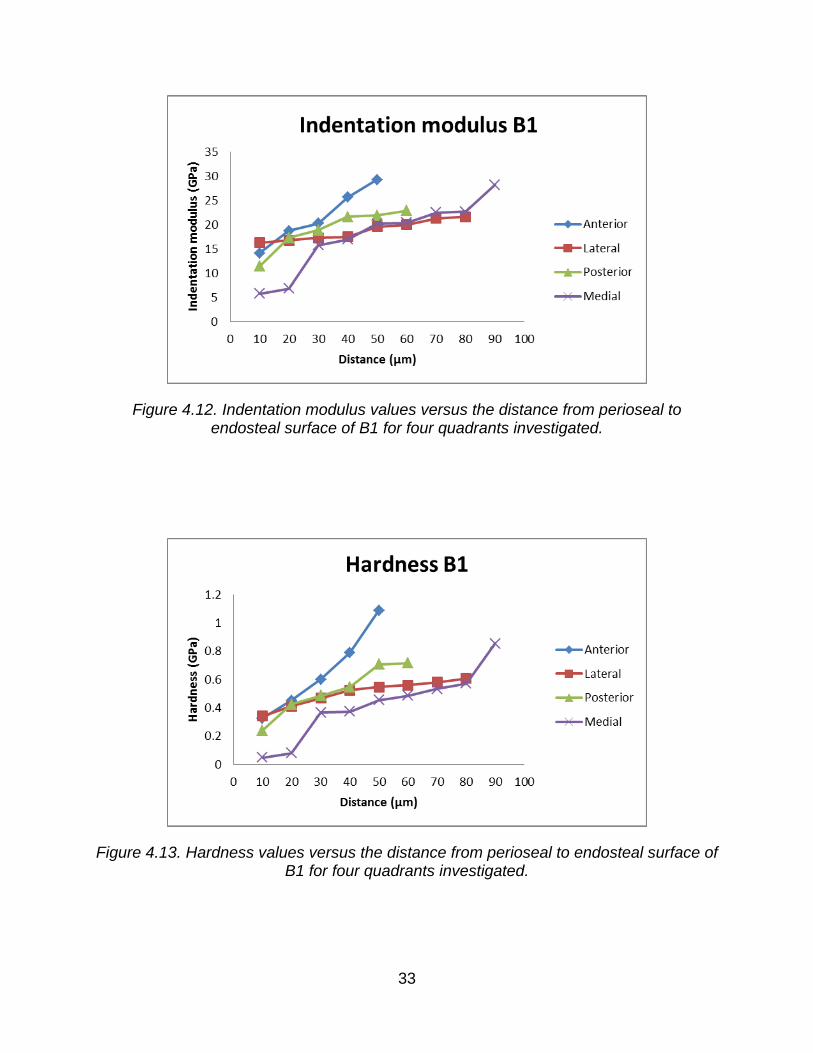
4.12 Indentation modulus values versus the distance from perioseal to endosteal surface of B1 for four quadrants investigated ..................................................... 33
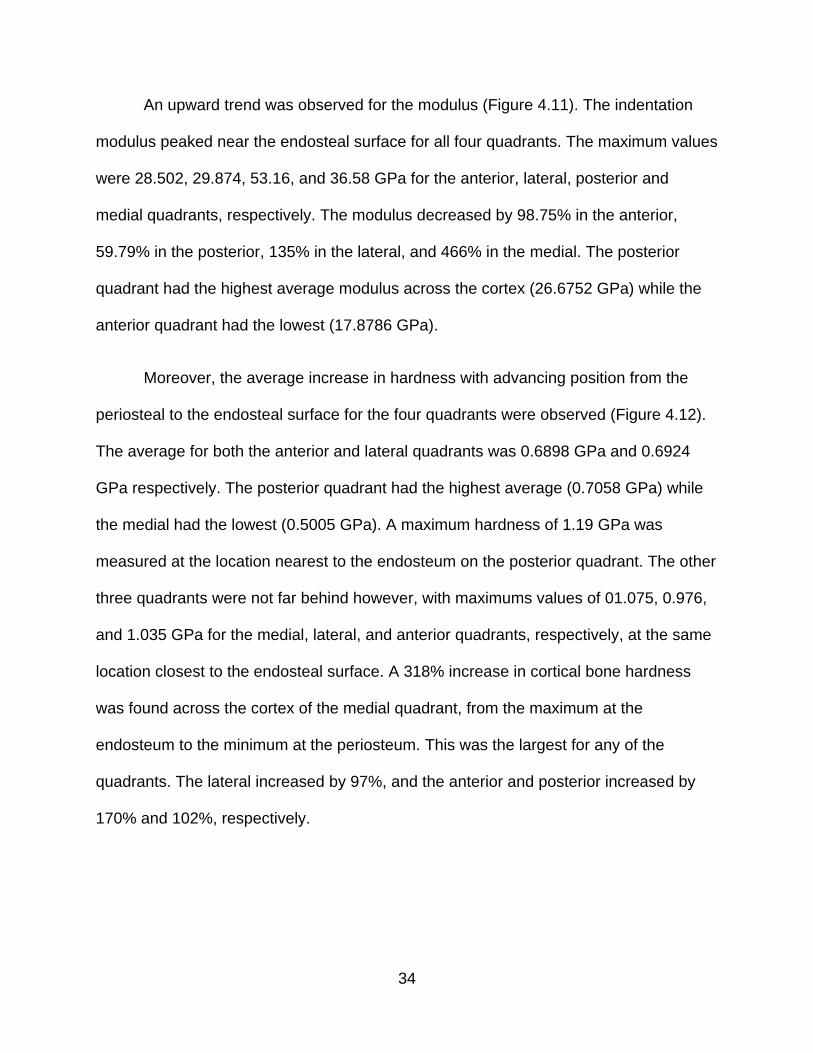
4.13 Hardness values versus the distance from perioseal to endosteal surface of B1 for four quadrants investigated ........................................................................... 33
4.14 Indentation modulus values versus the distance from perioseal to endosteal surface of B2 for four quadrants investigated ..................................................... 35
4.15 Hardness values versus the distance from perioseal to endosteal surface of B2 for four quadrants investigated ........................................................................... 35
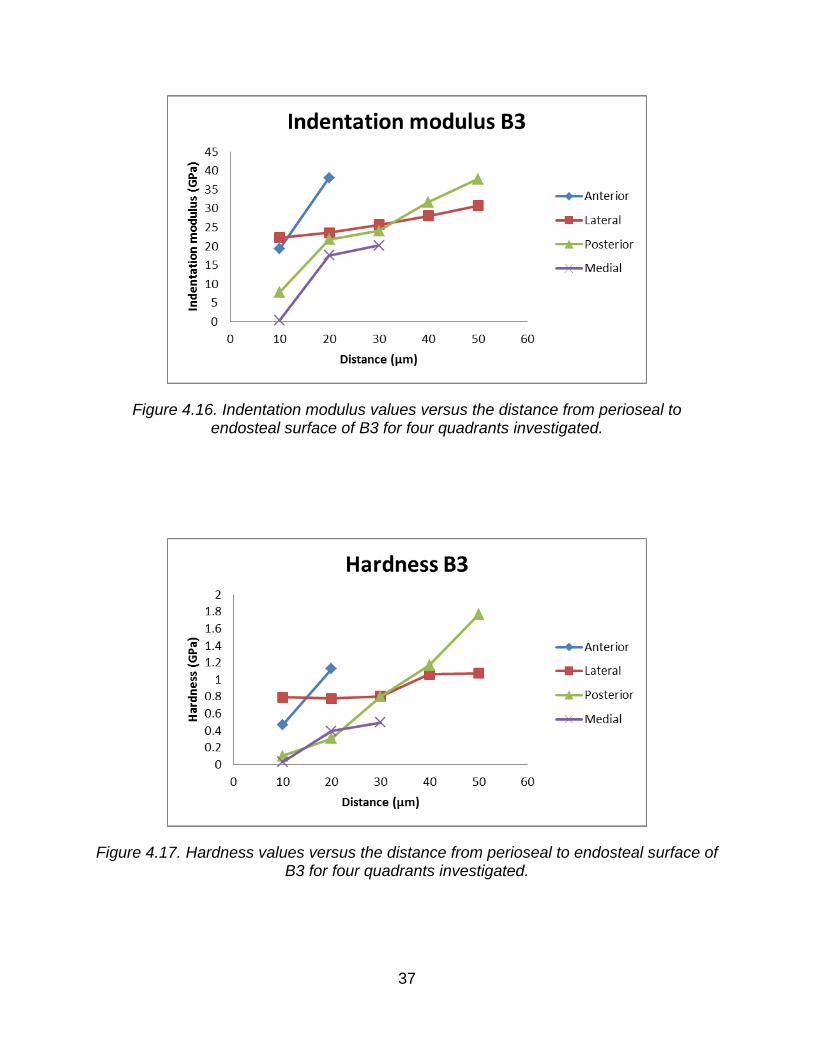
4.16 Indentation modulus values versus the distance from perioseal to endosteal surface of B3 for four quadrants investigated ..................................................... 37
4.17 Hardness values versus the distance from perioseal to endosteal surface of B3 for four quadrants investigated ........................................................................... 37
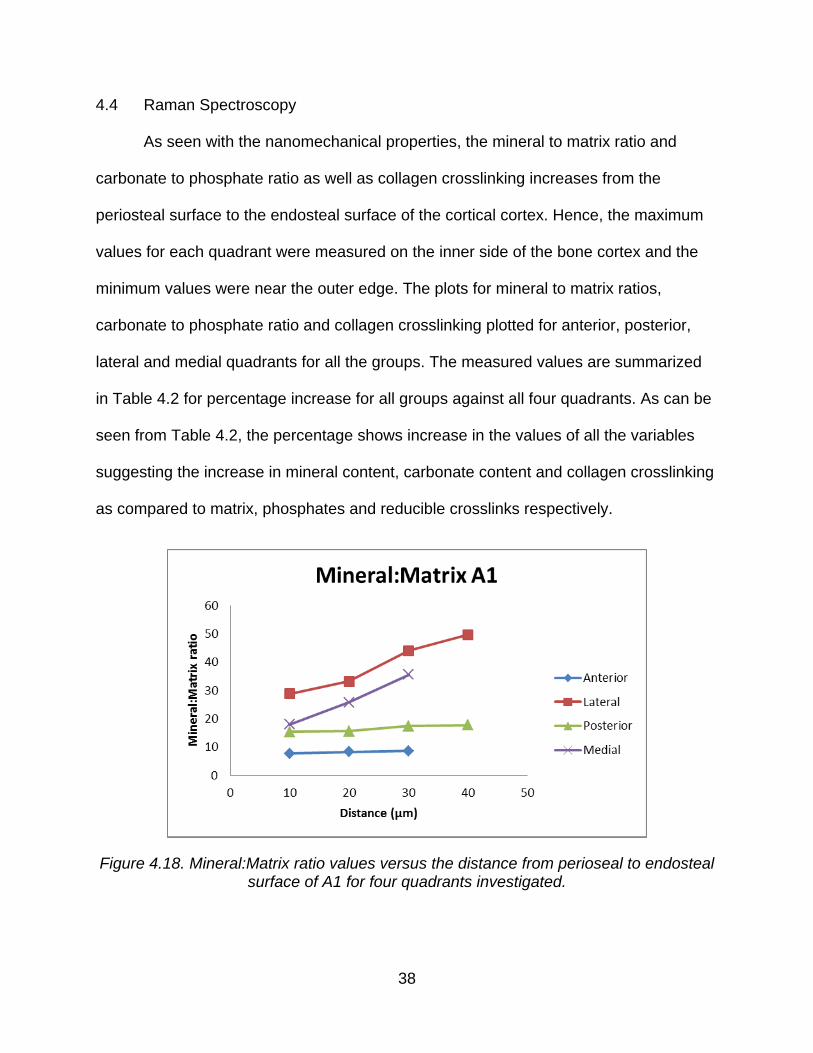
4.18 Mineral:Matrix ratio values versus the distance from perioseal to endosteal surface of A1 for four quadrants investigated ..................................................... 38
4.19 Carbonate:Phosphate ratio values versus the distance from perioseal to endosteal surface of A1 for four quadrants investigated ..................................... 39
4.20 Collagen cross-linking values versus the distance from perioseal to endosteal surface of A1 for four quadrants investigated ..................................................... 39
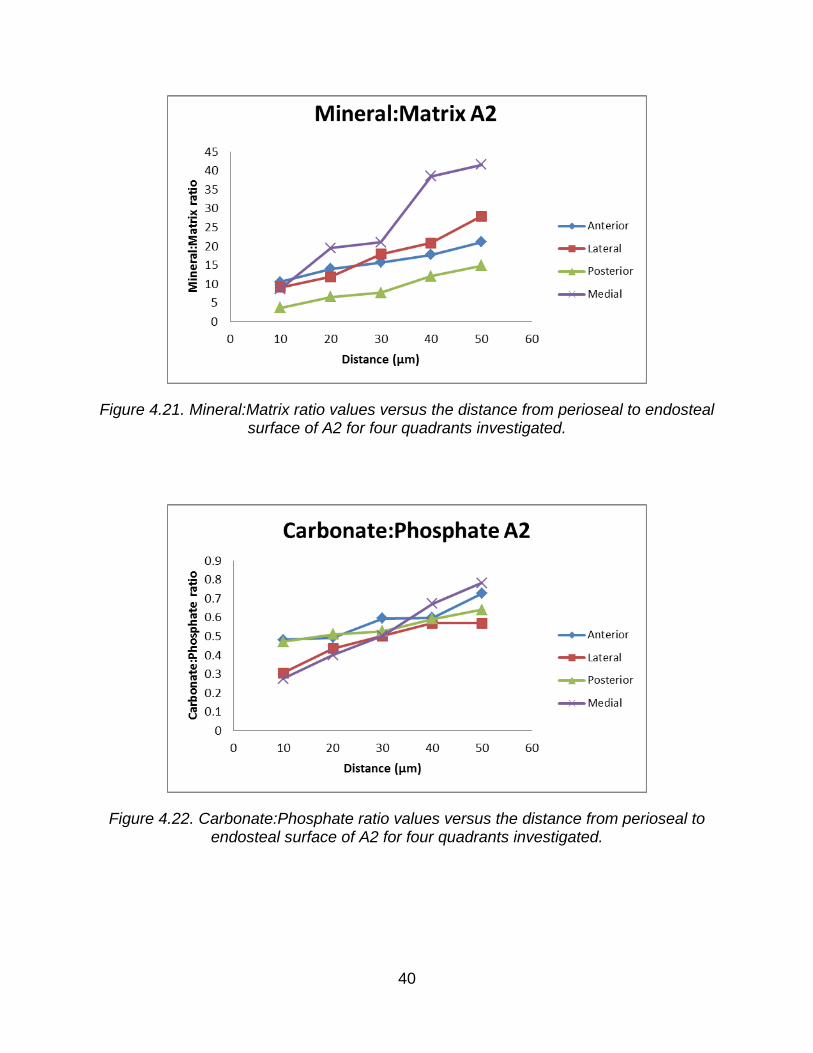
4.21 Mineral:Matrix ratio values versus the distance from perioseal to endosteal surface of A2 for four quadrants investigated ..................................................... 40
4.22 Carbonate:Phosphate ratio values versus the distance from perioseal to endosteal surface of A2 for four quadrants investigated ..................................... 40
4.23 Collagen cross-linking values versus the distance from perioseal to endosteal surface of A2 for four quadrants investigated ..................................................... 41
4.24 Mineral:Matrix ratio values versus the distance from perioseal to endosteal surface of A3 for four quadrants investigated ..................................................... 41
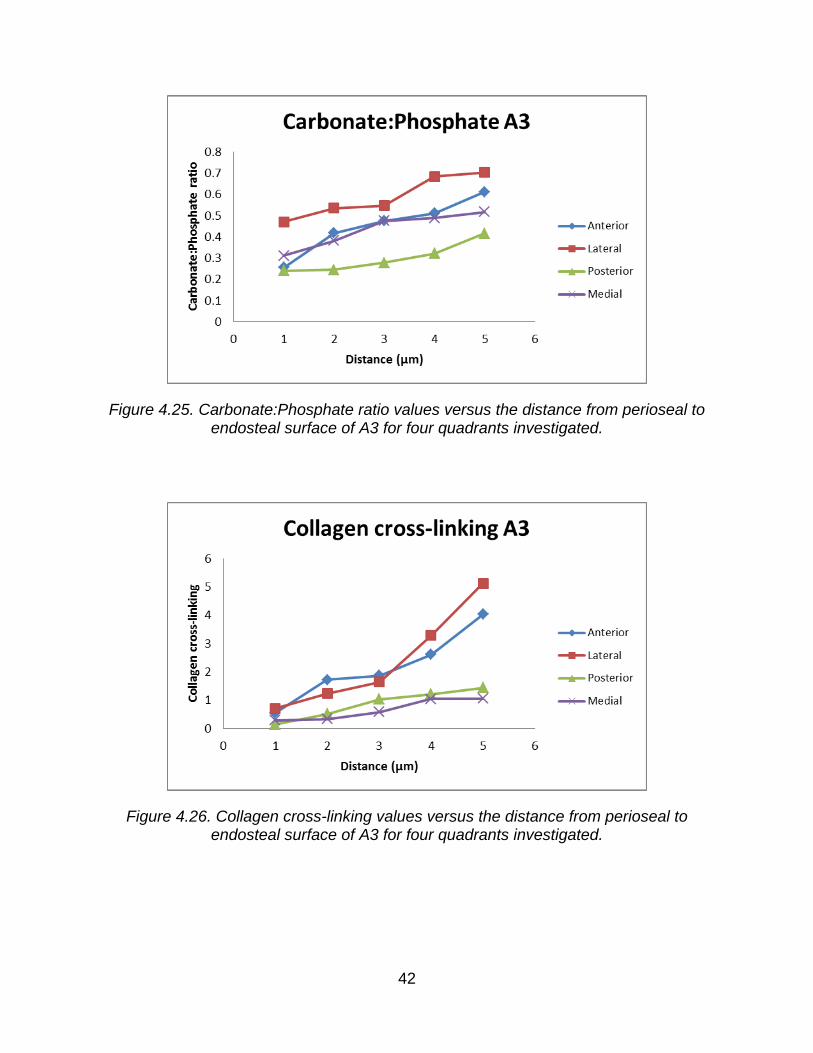
4.25 Carbonate:Phosphate ratio values versus the distance from perioseal to endosteal surface of A3 for four quadrants investigated ..................................... 42
viii

4.26 Collagen cross-linking values versus the distance from perioseal to endosteal surface of A3 for four quadrants investigated ..................................................... 42
4.27 Mineral:Matrix ratio values versus the distance from perioseal to endosteal surface of B1 for four quadrants investigated ..................................................... 43
4.28 Carbonate:Phosphate ratio values versus the distance from perioseal to endosteal surface of B1 for four quadrants investigated ..................................... 43
4.29 Collagen cross-linking values versus the distance from perioseal to endosteal surface of B1 for four quadrants investigated ..................................................... 44
4.30 Mineral:Matrix ratio values versus the distance from perioseal to endosteal surface of B2 for four quadrants investigated ..................................................... 44
4.31 Carbonate:Phosphate ratio values versus the distance from perioseal to endosteal surface of B2 for four quadrants investigated ..................................... 45
4.32 Collagen cross-linking values versus the distance from perioseal to endosteal surface of B2 for four quadrants investigated ..................................................... 45
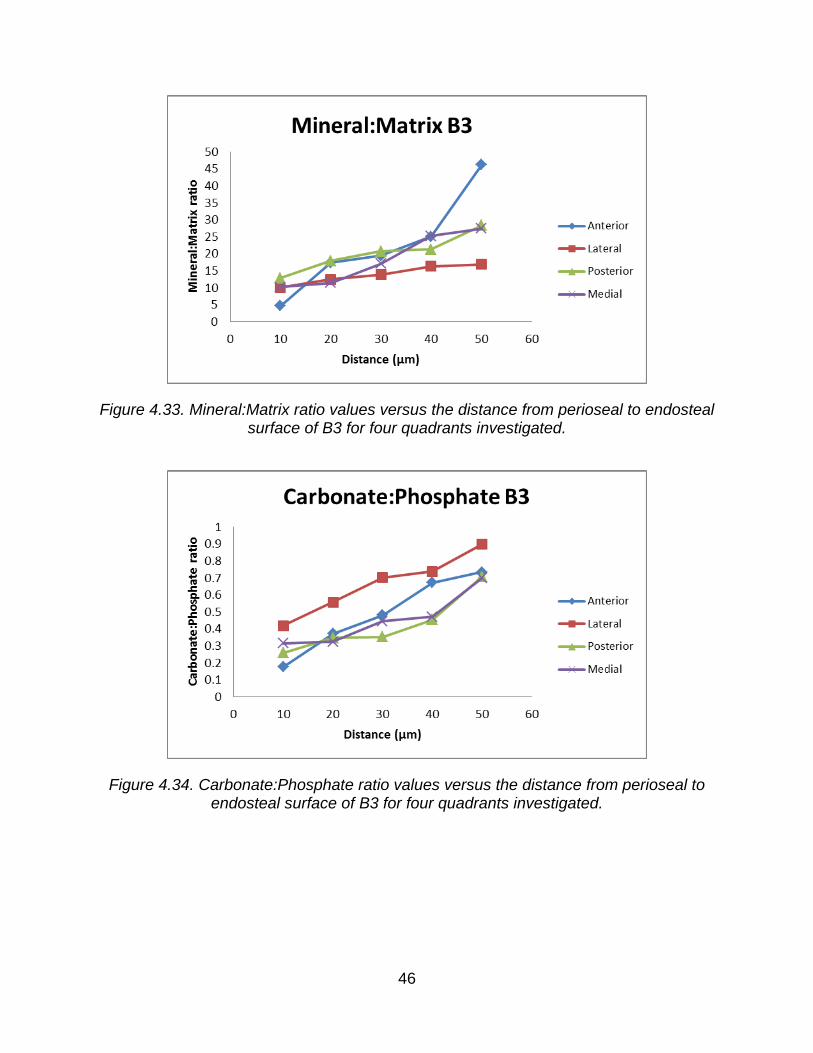
4.33 Mineral:Matrix ratio values versus the distance from perioseal to endosteal surface of B3 for four quadrants investigated ..................................................... 46
4.34 Carbonate:Phosphate ratio values versus the distance from perioseal to endosteal surface of B3 for four quadrants investigated ..................................... 46
4.35 Collagen cross-linking values versus the distance from perioseal to endosteal surface of B3 for four quadrants investigated ..................................................... 47
4.36 Comparison of indentation modulus for anterior group versus the distance from perioseal to endosteal surface ............................................................................ 50
4.37 Comparison of hardness for anterior group versus the distance from perioseal to endosteal surface ............................................................................................... 50
4.38 Comparison of indentation modulus for lateral group versus the distance from perioseal to endosteal surface ............................................................................ 51
4.39 Comparison of hardness for lateral group versus the distance from perioseal to endosteal surface ............................................................................................... 51
4.40 Comparison of indentation modulus for medial group versus the distance from perioseal to endosteal surface ............................................................................ 52
4.41 Comparison of hardness for medial group versus the distance from perioseal to endosteal surface ............................................................................................... 52
ix

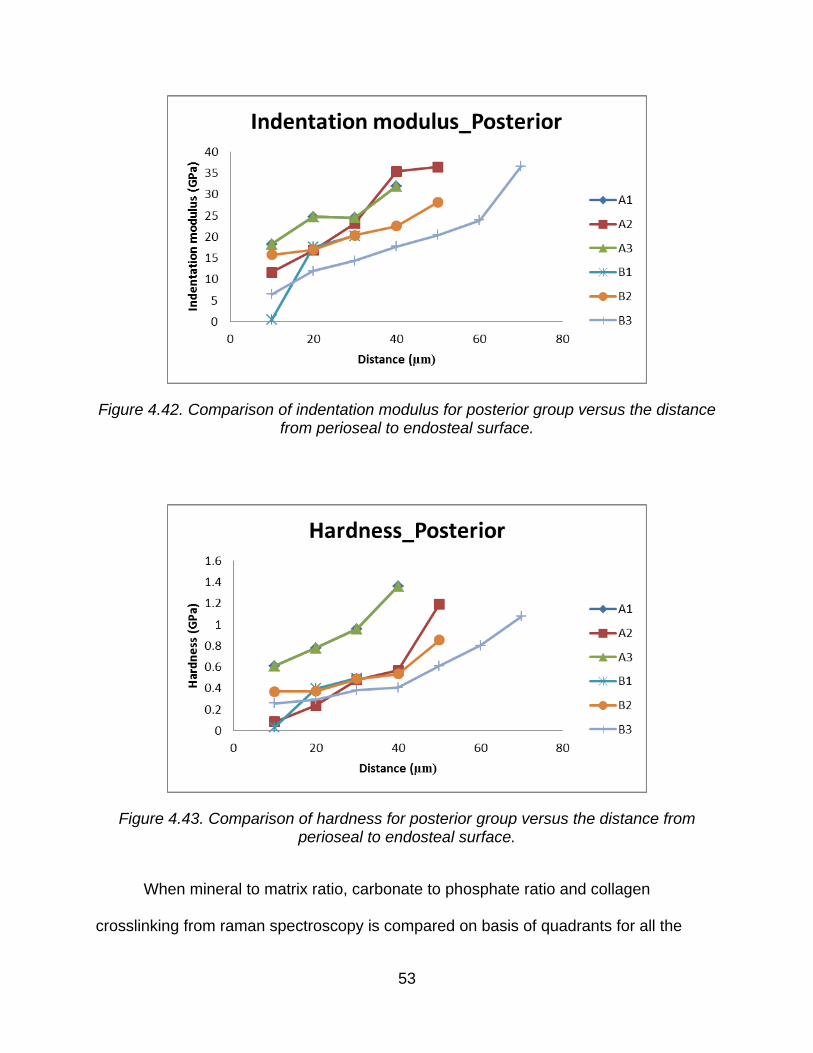
4.42 Comparison of indentation modulus for posterior group versus the distance from perioseal to endosteal surface ............................................................................ 53
4.43 Comparison of hardness for posterior group versus the distance from perioseal to endosteal surface ............................................................................................... 53
4.44 Comparison of mineral to matrix ratio for anterior group versus the distance from perioseal to endosteal surface ............................................................................ 55
4.45 Comparison of carbonate to phosphate ratio for anterior group versus the distance from perioseal to endosteal surface ..................................................... 55
4.46 Comparison of collagen crosslinking for anterior group versus the distance from perioseal to endosteal surface ............................................................................ 56
4.47 Comparison of mineral to matrix ratio for lateral group versus the distance from perioseal to endosteal surface ............................................................................ 56
4.48 Comparison of carbonate to phosphate ratio for lateral group versus the distance from perioseal to endosteal surface .................................................................... 57
4.49 Comparison of collagen crosslinking for lateral group versus the distance from perioseal to endosteal surface ............................................................................ 57
4.50 Comparison of mineral to matrix ratio for medial group versus the distance from perioseal to endosteal surface ............................................................................ 58
4.51 Comparison of carbonate to phosphate ratio for medial group versus the distance from perioseal to endosteal surface .................................................................... 58
4.52 Comparison of collagen crosslinking for medial group versus the distance from perioseal to endosteal surface ............................................................................ 59
4.53 Comparison of mineral to matrix ratio for posterior group versus the distance from perioseal to endosteal surface .................................................................... 59
4.54 Comparison of carbonate to phosphate ratio for posterior group versus the distance from perioseal to endosteal surface ..................................................... 60
4.55 Comparison of collagen crosslinking for posterior group versus the distance from perioseal to endosteal surface ............................................................................ 60
x

1
CHAPTER 1
SCOPE OF THESIS
In past much research have already been conducted on mice bones using
techniques such as three point bending, Raman spectroscopy and nanoindentation. But
no work has been done to relate them on macro, micro and nano scale, all the three
techniques together give a better picture of mineralization and collagen crosslinking
affecting the nano as well as macro mechanical properties.
In this thesis following hypothesis has been confirmed:
Hypothesis 1: The increase in indentation hardness and indentation modulus across the
thickness of the bone is co-related and paralleled to the increase in mineral to matrix
ratio, carbonate to phosphate ratio and collagen crosslinking.
Hypothesis 2: Stiffness increases due to increase in mineralization and increase in
collagen crosslinks, thereby decreasing the deflection.
The objective of this thesis is to relate two groups of mice bones deflection with
hardness, mineralization and collagen crosslinking. These mechanical properties are
related to chemical compositions like mineralization and collagen crosslinking with
nano-mechanical property like indentation hardness and elastic modulus.
The proposed hypothesis is that as the bone ages (the tissue gets aged from endosteal
to periosteal, the bones that are studied in this work are mature mice model they all are
of same age.), the tissue mineralizes and therefore the hardness increases, crosslinking
of collagen takes place and the stiffness of bone is increased. This can be seen on
nano level, the bone grows inside out and therefore the tissues which are outside are
young and have lower mineralization and therefore lower hardness, collagen

2
crosslinking is lower and therefore the stiffness is lower. Methods used for this are three
point bending, microCT, nanoindentation and Raman spectroscopy. microCT is used to
calculate the diameter and CSMI values to be input into the calculation of three point
bend test.
Three point bend test gives strength and deflection which is macro mechanical
property of the bone.
Raman spectroscopy gives chemical composition changes and influence on the
micro level.
Nanoindentation is used to measure indentation hardness and elastic moduli on
the nano level. The measurements thus obtained are correlated and compared
for four quadrants viz; anterior, lateral, medial and posterior.
Donnelly and colleagues characterized the nanomechanical properties and
composition of regions of differing tissue age in the femoral cortices of growing rats [1].
Their results show a very sharp and early increase in tissue modulus, hardness, and
mineral:matrix ratio with increasing distance for the first 35 microns from the periosteum
(youngest tissue). Kavukcuoglu et al. studied the effect of bone aging and deficiency of
osteopontin on the nanomechanical properties of femur of young, mature and old mice.
Many previous studies shows change in toughness and modulus with change in age [2,
3, 4, 5]. This work is a unique attempt to co-relate mechanical properties on nano, micro
and macro scale to give a broader idea about their influence.

3
CHAPTER 2
INTRODUCTION AND BACKGROUND
2.1 Introduction
Bone is a hierarchical composite composed of approximately 65% mineral and
35% organic matrix and serves as the primary structural element providing a framework
for skeletal motion. It differs from other tissues due to its hardness and rigidity. These
characteristics in bone are mainly due to inorganic salts that are impregnated in the
organic matrix, noncollagenous proteins and mineral. Moreover, bone is a living
composite that optimizes its structure to adapt to fluctuations in its mechanical
environment.
2.2 Morphology: Macroscopic and Microscopic Structures
The femur which is one of the long bones other than humerus and tibia, serves
as ideal model for the study of macroscopic structure of bone. A long bone consists of
cylindrical shaft which forms the majority of the bone and is located in the center this is
also called as diaphysis, and the ends are rounded which are termed as epiphysis. The
ends are wider and rounded because these are articulated and larger areas are
required to carry loads. The diaphysis is mainly composed of cortical bone. This is solid
mass highly dense with microscopic channels. Almost 80% of the bone is made of
cortical bone and is responsible for support and protect skeletal system. Rest 20% is
cancellous bone.

4
2.2.1 Bone Nomenclature
The bone has three major parts viz diaphysis, metaphysis and epiphysis (Figure
2.1). Diaphysis is mainly made up of cortical bone. Metaphysis and epiphysis on the
other hand is made up of cancellous bone. Periosteum is the outer surface of the bone
and is made up of fibrous connective tissues. Periosteum develops as into bone during
the growth of the bone and also provides healing of fractures. Endosteum is the inner
surface of the bone and is lined on the marrow cavity of the diaphysis.
Figure 2.1. Schematic showing the location of femur, the nomenclature for the femur parts and the cross section of femur showing the four quadrants.

5
Figure 2.2. Schematic of bone cross section showing four quadrants, direction of bone
growth and change in hardness, stiffness, modulus across the thickness of bone with change in mineralization and collagen crosslinks.
The above Figure 2.2 shows schematic of cross section of the right femur of mature
mice model with four quadrants marked viz anterior, lateral, posterior and medial. The
blue arrow shows the direction of bone growth, which is from inside to the out of the
bone. Hence the tissues at the inner side of the bone are matured and old, whereas
tissues which are at the outer surface of the bone are young. At the inner surface the
tissues the mineral size grows as a part of mineral absorption process on the hydroxy
6
apatite crystals. At the young tissue sites the nucleation takes place to form small
crystals of minerals. The hardness therefore is lower at the outer surface of the bone as
compared to the inner surface. There is more number of collagen crosslinks at the inner
surface of the bone than the outer surface. Moreover the reducible collagen crosslinks
reduces as the bone tissue matures thereby making the bone stiffer and less flexible
and hence lower deflection. At the outer surface the collagen crosslinks are reducible
and are labile, this crosslinks can be broken and again joined to remake the collagen
bonds. Hence the younger cells have lower collagen crosslinks and therefore lower
stiffness and higher deflection.
2.2.2 Composition of Bone
Hydroxyapatite, Ca10(PO4)6(OH)2, is the primary mineral of bone with elements
including carbonate, citrate, magnesium, fluoride, and strontium also found on the
crystal lattice, but to a much lesser extent. Bone mineral varies with age, in content,
composition and crystal size. Bone may be hypomineralized when there is rapid growth
and hypermineralized during senescent periods [6,7,8]. As the bone ages there is an
increase in crystal size [9,10], mineralization, and strength, but also a reduction in its
toughness [11] and ultimate strain which may lead to microcrack development [12].
Developed microcracks, which do not heal in a timely manner, may accumulate and
progress leading to increased fracture risk [13,14]. In contrast, when mineralization
levels are low, stiffness and strength are reduced [15,16,17,18]. The organic matrix,
composed of approximately 90% collagen and 10% of other noncollagenous proteins,
also plays a role in the mechanical behavior of bone [19, 20, 21]. Aging has been shown

7
to change the quality of the collagen network leading to reductions in bone toughness
[22, 23, 24, 25, 26].
2.3 Ageing of Bone
With age the structure of bone deteriorates and therefore the mechanical
properties changes. These changes happen for the overall complete bone as well as on
the nano, micro scale as well. Since bone has a hierarchical structure, changes in
chemical composition like carbonate, collagen etc exhibits a change in overall quality of
the bone. For example the quality of collagen deteriorates with age and that affects the
toughness of bone by decreasing to 35%, elastic modulus was decreased by 30%. The
decrease in toughness also affected the bones ability to dissipate energy and eventually
fracture by 50% [27]. The old tissues in bone have higher collagen crosslinks as
compared to young tissues, this affect the bones response to applied load, higher
crosslinks gives low deflection due to higher stiffness and vice versa [28]. Bone mineral
varies in content, composition and crystal size. With age mineral content varies, bone
tends to hypomineralized (less mineralization) when there is rapid growth which is
oseen in young tissues while hypermineralized in old tissues [29, 30, 31].
Hypermineralization in older bones have a tendency for developing macro and
dangerous crack [32]. As the bone ages there is increase in mineralization which
reduces toughness [33]. The aged bones develop microcracks which do not heal, this
has a potential to crack when loaded [34,35]. The mineral content increased with age
and the crystal size also showed increase in young human iliac crest was shown by
Handshin and Stein [36, 37]. The ash weight and mineral-to-matrix ratio is linearly
related [38]. Reduction in stiffness and strength have been attributed to low

8
mineralization levels, while lower one’s ultimate strain which increases the fragility is
attributed to high levels of mineralizations [39, 40, 41, 42, 43, 44, 45]. The effect of
increase age can be seen in quality of collagen network that has been shown to
decrease toughness in bone [46, 47, 48, 49, 50]. The organic matrix is composed of
90% collagen and 10% other noncollagenous proteins [51, 52, 53]. Although the roles of
noncollagenous proteins are unclear they can be used to clinically assess bone turnover
[54,55,56].
2.4 Bone Hardness and Bone Mineral Crystal Size
The increase in mineral size increases the hardness of the bone. The content of
carbonate in hydroxy apatite increases and phosphate decreases. This is seen from
carbonate to phosphate ratio calculation from raman spectra. The process of crystal
formation is a dynamic physiochemical process. As the osteoclasts resorb the crystals,
they get deposited on the osteoid. The smaller crystals are easy to resorb, so they gets
dissolved first. The larger crystals remain. The ions which are liberated due to the
resorbtion of the smaller crystals gets deposited on the existing larger crystals to make
them even larger in size. This process helps in ordered stucture formation.

9
CHAPTER 3
MATERIALS AND METHODS
3.1 Materials
3.1.1 Bone
The mature male C57BL/6 mice were allowed to acclimate for two-weeks, and
then sacrificed. These are commonly used inbred mouse strain and has been shown to
be a valid model for studying age-related bone loss [57, 58, 59]. A 12:12 hour light-dark
cycle and NIH-31 diet was maintained during the two-week acclimation period.
Immediately after the mice was euthanized, the right femurs were dissected free,
cleaned of soft tissue, and wrapped in phosphate-buffered saline (PBS) soaked gauze
to maintain moisture.
3.1.2 Phosphate Buffered Solution (PBS)
The phosphate buffer solution used was water based salt solution which has a
controlled mixture of various salts like ACS reagent grade dibasic sodium phosphate,
and monobasic potassium phosphate. The phosphate buffer solution used had a
concentration of 0.1M and pH of 7.4±0.01 at 25C. The solution was bought from Ricca
Chemical Company (Arlington, TX). This solution helps to simulate the pH of the human
body and also the osmolarity and ion concentrations of the human body.

10
3.2 Sample Preparation
3.2.1 X-ray Micro Tomography
After dissection, the right femoral bone of the mouse is wrapped in gauze soaked
with phosphate buffered saline (PBS), placed in a labeled vial, and kept in a freezer at -
23 °C. Once removed from the freezer, the bone sample is kept at room temperature for
30 min to allow it to partially defrost. The gauze is then separated carefully from the
bone and the bone is ready for microCT imaging.
3.2.2 Three Point Bend Test
The femurs were preserved in phosphate buffer solution wrapped in gauze and
frozen after dissection. Prior to three point testing these frozen samples were removed
and allowed to thawed for 30 min. The gauze was removed carefully to make sure that
the bone is not damaged. This femur is then ready for testing. After the testing the bone
breaks into two pieces one is termed as proximal end and the other is termed as distal
end. The proximal end is wrapped in PBS soaked gauze and again frozen. The distal
end is dried at room temperature for 24 hrs and then used for preparing sample for
nanoindentation and Raman spectroscopy. This procedure was repeated for all the
other twenty-four bones.
3.2.3 Nanoindentation and Raman
These dried distal femur ends were taken and embedded in a 25 mm height x 28
mm diameter polypropylene mold cup supplied by Electron Microscopy Sciences. In a
separate container, EpoFix epoxy is mixed with the EpoFix hardener supplied by
Electron Microscopy Sciences in 15:2 parts by volume, mixed thoroughly, and kept
11
aside to remove bubbles. The epoxy is then poured in the mold and allowed to cure for
24 hrs. Once the epoxy is cured, the plastic mold is cut open to get the mounted
specimen. The sample is then polished using a series of 400, 600, 800, 1200 silicon
carbide paper and later with 0.05 micron alumina suspension at 60 rpm. The polished
sample is then sonicated in deionized water for 15 minutes to remove all the debris
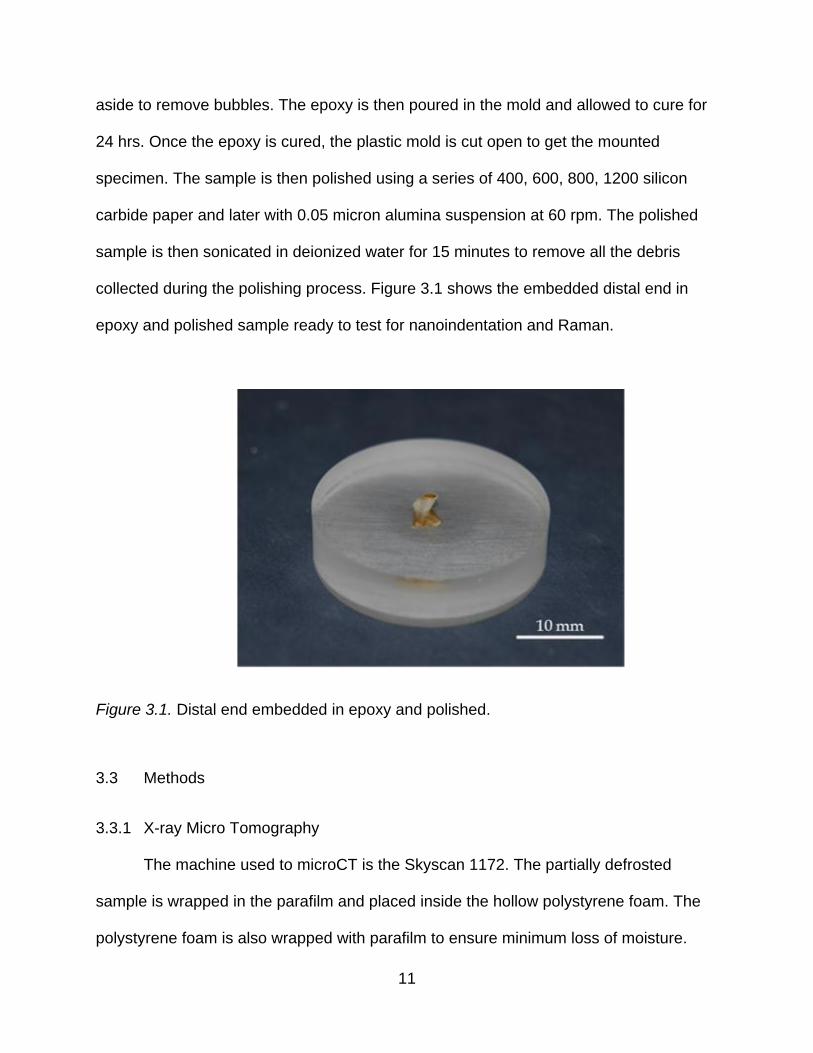
collected during the polishing process. Figure 3.1 shows the embedded distal end in
epoxy and polished sample ready to test for nanoindentation and Raman.
Figure 3.1. Distal end embedded in epoxy and polished.
3.3 Methods
3.3.1 X-ray Micro Tomography
The machine used to microCT is the Skyscan 1172. The partially defrosted
sample is wrapped in the parafilm and placed inside the hollow polystyrene foam. The
polystyrene foam is also wrapped with parafilm to ensure minimum loss of moisture.

12
Care is taken to align the bone vertically so that there is minimal misalignment in axis
while the sample rotates during imaging. With the help of clay the polystyrene foam is
fixed to the sample holder which is then screwed onto the stage. Preliminary trials were
done to set the following imaging parameters: voltage was adjusted to 48 kV and
current of 204 µA. A 0.5 mm Al filter was employed to give better contrast between the
bone and background. Before the actual scan is performed the flat field correction is
done for dark and bright field. The scan is then performed, with medium resolution
settings of 5 microns, with 180° for the region of interest.
To selecting the regions of interest, a microCT phantom image projection of the
whole specimen was first acquired. This image is used to (1) accurately measure the
bone length (confirmed using a micrometer); (2) accurately measure the mid-diaphyseal
bone diameter; and (3) to select a the approximate regions of interest, slightly larger
than needed so that all the images from the complete region of interest are available for
selective post-processing. The first region of interest was the distal femoral end which
was chosen such that the 1800 microns (for a 17 mm total femoral length) was adjusted
according to the individual length of each bone sample upwards from the growth plate.
The second region of interest was at the mid-diaphysis of the femur using a 1 mm thick
centered volume. These regions were reconstructed and analyzed. The raw images
were corrected for ring artifacts and beam hardening.
3.3.2 Three Point Bend Test
The instrument used is RSA3 from TA Instruments. For 3-pt bend test sample
mid-diaphyseal diameter and total length is measured from the phantom image of the
femur bone which was taken before region of interest. The span length of the lower
13
portion of the 3-pt bend fixture is 10 mm. The sample is removed from the PBS and
immediately setup for mechanical testing. The sample is placed in such a way that the
posterior side is in compression as shown in Figure 3.2. The test is done in
displacement control at room temperature, and the force – displacement and stress –
strain curve are plotted. The rate of displacement is set to 0.01 mm/sec (0.6 mm/min) to
ensure a high data acquisition rate and maximum deflection is set to 5 mm. Before the
test, extreme care is taken to align the bone samples properly and consistently
(confirming the posterior-anterior and proximal-distal placement) (see Figure 3.3) and
ensuring that while lowering the upper fixture the sample is just barely touched (for
correctly estimating the deformation and strain). After the sample breaks, the proximal
end is re-wrapped in PBS soaked gauze and kept in the freezer at -23 °C. The distal
end is prepared for nanoindentation and Raman spectroscopy as discussed in section
3.2.3.
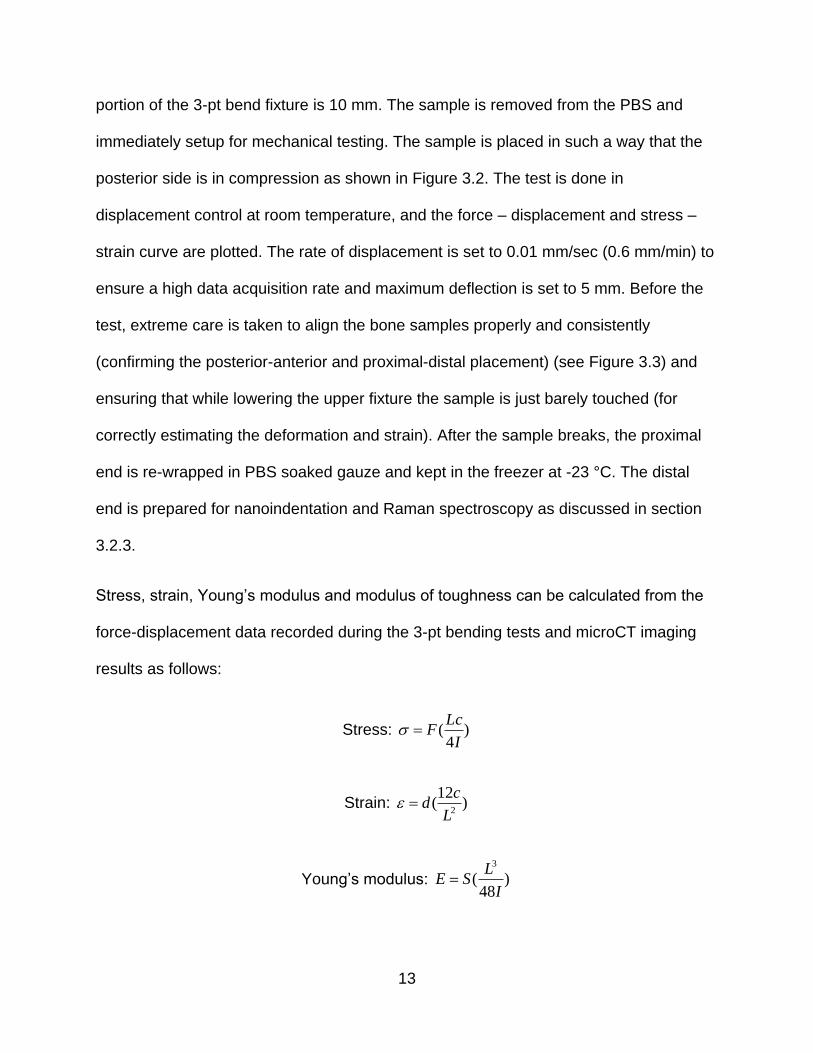
Stress, strain, Young’s modulus and modulus of toughness can be calculated from the
force-displacement data recorded during the 3-pt bending tests and microCT imaging
results as follows:
Stress: )4
(I
LcF
Strain: )12
(2L
cd
Young’s modulus: )48
(3
I
LSE

14
Modulus of toughness: )3
(2
IL
cUu
Where:
F: applied force, L: span, c: distance from center of mass of the cross section, I: cross
sectional moment of inertia, d: displacement, S: stiffness, U: work to failure.
Figure 3.2. Placing of femur on three point bend fixture.

15
Figure 3.3. Three point bend testing of femur.
3.3.3 Nanoindentation
The MTS nanoindenter XP was used following the Constant Stiffness Method
Standard Hardness/Modulus with a Berkovich tip. In order to provide environmental
isolation a combination of a minus k vibration isolation table and a thermal sound

16
vibration isolation cabinet were utilized. Prior to testing, the indenter system was
calibrated on a sample of fused silica.
The mounted specimen was fixed to the sample holder stage and with the help of
a microscope the anterior, posterior, medial and lateral quadrants were identified. The
indentations were done from the outer periosteum edge towards the inner endosteum
surface. A total of six indents were made in a straight line across the thickness of the
cortical bone, illustrated with a yellow line in Figure 3.4. Each indent was spaced 10
microns apart. The percent unload in the stiffness calculation was kept to 50% and
allowable drift correction was kept at 0.05 nm/s with a drift correction of 1. The depth
limit was restricted to 600 nm. Unloading percent was 90 and the strain target was 0.05
1/s. Hardness and indentation modulus were calculated using the Oliver-Pharr method
which assumes isotropic material behavior [60]. The elastic properties of the diamond
indenter were: νi=0.07 and Ei=1140 GPa and the Poisson’s ratio for bone was assumed
to be 0.3.
The Oliver–Pharr method for determining the elastic modulus has been
previously described (Oliver and Pharr, 1992). This method assumes isotropic material
behavior. The primary variables are contact area AC, peak force Pmax, and contact
stiffness S of the initial portion of the unloading curve. From these the reduced modulus
(Er) of the specimen– indenter combination is determined.

17
C
rA
SE
2
[1]
i
i
S
SS
EE
E
2
2
11
1
[2]
CA
PH max [3]
Where, Es is modulus of bone and H is hardness, ν is Poisson’s ratio and the subscripts
s and i refer to the bone specimen and the indenter, respectively. The elastic properties
of the diamond indenter are: νi=0.07 and Ei=1140GPa. The Poisson’s ratio of bone is
assumed to be 0.3. The indenter system was calibrated on a sample of fused silica.
18
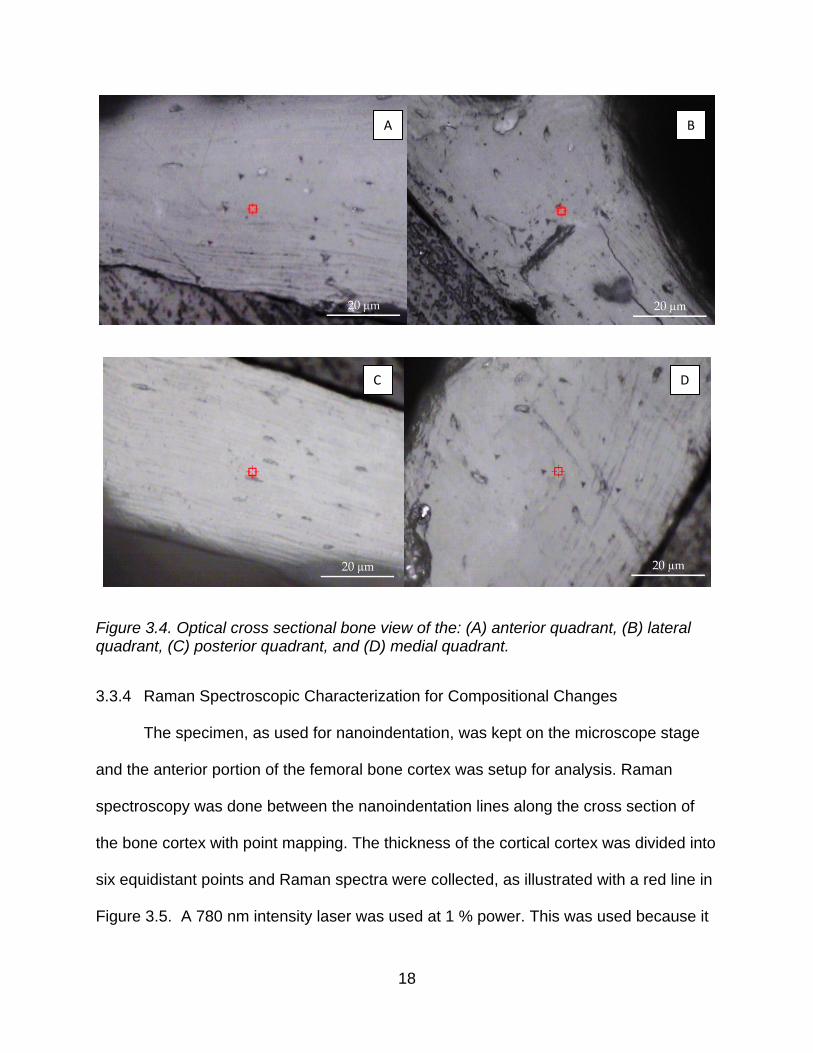
Figure 3.4. Optical cross sectional bone view of the: (A) anterior quadrant, (B) lateral quadrant, (C) posterior quadrant, and (D) medial quadrant.
3.3.4 Raman Spectroscopic Characterization for Compositional Changes
The specimen, as used for nanoindentation, was kept on the microscope stage
and the anterior portion of the femoral bone cortex was setup for analysis. Raman
spectroscopy was done between the nanoindentation lines along the cross section of
the bone cortex with point mapping. The thickness of the cortical cortex was divided into
six equidistant points and Raman spectra were collected, as illustrated with a red line in
Figure 3.5. A 780 nm intensity laser was used at 1 % power. This was used because it
A B
D C
19
results in very little florescence as compared to the 532 nm intensity setting. Aperture
was set to 100 µm slit with a spot size of 1.6 µm and a resolution of 25 to 33.8 1/cm.
The scan was done from 300 to 2000 1/cm. The exposure time was 18 sec and
background and sample exposure was performed 3 times. Background was collected
before every sample. This background was subtracted from the Raman spectroscopy
results and a baseline correction was performed. Twenty-four spectral lines were
collected from the sample. Six scans were done on each quadrant (anterior, lateral,
posterior and medial) directed from the endosteal to periosteal surface. Peak and
corrected area analyses were then performed.
The characteristics band areas were determined from the Raman spectra for the
calculations of mineral:matrix ratio, carbonate:phosphate ratio, collagen cross-linking
ratio. Mineral:matrix ratio was calculated from band area ratio of 958 to 1660.
Carbonate:phosphate ratio was calculated from band area ratio of 1070 to 958.
Collagen cross-linking was calculated from band area ratio of 1660 to 1690.
Raman spectroscopy is used to characterize the compositional changes on the
micron level as it gives a good comparision with the nanoindentation results as
nanoindentation is done on nanometer scale. Moreover Raman spectroscopy is a non-
destructive method for characterization.

20
Figure 3.5. Optical cross sectional bone view of the: (A) anterior quadrant, (B) lateral quadrant, (C) posterior quadrant, and (D) medial quadrant. Nanoindentation locations are shown as yellow lines and Raman spectroscopy locations as a red line.
A
D C
B

21
CHAPTER 4
RESULTS
4.1 Three Point Bend Test
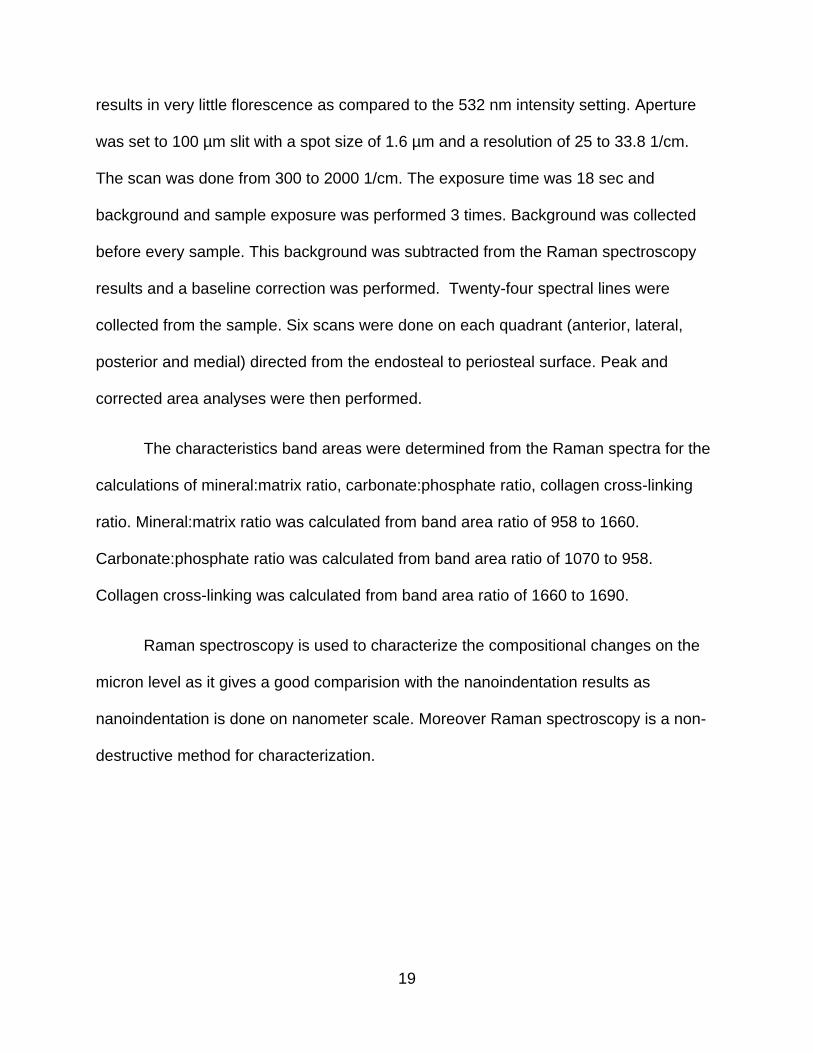
A total of twenty-four right femurs were tested for elastic modulus and ultimate
stress refer Figure 4.1. From three point bend test two clusters have been identified.
Group A (blue) is high elastic modulus and low ultimate stress. Group B (green) is low
elastic modulus and high ultimate stress. The samples from group A are termed as A1,
A2 and A3 where 1, 2 and 3 denote the specimen number under the group A. Similarly
B1, B2 and B3 are specimens 1, 2 and 3 from group B. The average value for group A
is 0.28 ± 0.028 Gpa and 38.01 ± 4.149 Mpa for elastic modulus and ultimate strength
respectively. The average value for group B is 0.44 ± 0.027 Gpa and 26.39 ± 6.847 Mpa
for elastic modulus and ultimate strength respectively.
22
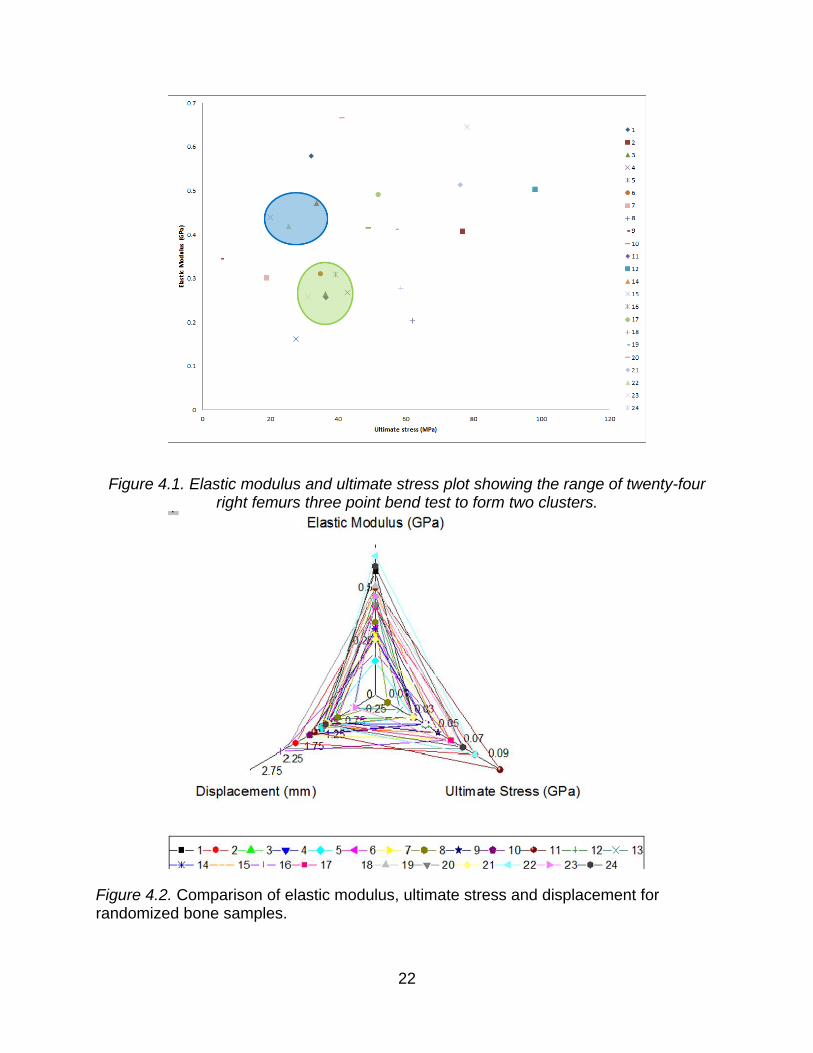
Figure 4.1. Elastic modulus and ultimate stress plot showing the range of twenty-four right femurs three point bend test to form two clusters.
Figure 4.2. Comparison of elastic modulus, ultimate stress and displacement for randomized bone samples.

23
Table 4.1
Comparison of elastic modulus and ultimate stress from microCT and micrometer
GROUP A
From microCT From micrometer
Sample no.
Elastic Modulus (Gpa)
Ultimate stress (MPa)
Elastic modulus (Gpa)
Ultimate stress (Mpa)
1 0.27 42.73 1.16 44.22
2 0.31 34.92 1.05 36.72
3 0.26 36.38 1.85 42.57
GROUP B
Elastic Modulus
(Gpa) Ultimate stress
(MPa) Elastic modulus
(Gpa) Ultimate stress
(MPa)
1 0.47 33.66 0.51 38.31
2 0.44 20.06 2.25 23.06
3 0.42 25.46 5.74 38.82
The above Table 4.1 shows comparison between calculated elastic modulus and
ultimate stress. While calculating the elastic modulus and ultimate stress from microCT,
the values of diameter and CSMI are directly taken from the skyscan 1172; whereas
from micrometer the diameter of bone is measured using micrometer and used for
calculation for CSMI values. The difference is values from microCT and micrometer is
observed. This is because the microCT calculates the diameter and CSMI values from
the crosssection image obtained from the scan and is therefore highly accurate as
compared to the values obtained from the micrometer. Henceforth the values from
microCT will be taken into consideration for the analysis of the data.
24
Figure 4.2 and 4.3 shows comparison between elastic modulus, ultimate stress
and displacement for twenty four bone samples and for group of three samples for the
two clusters identified from Figure 4.1. Group A shows lower elastic modulus than group
B, and higher displacement as compared to group B, and higher ultimate stress than
Group B. This also can be seen from the stress – strain curve.
Figure 4.4 shows modulus versus displacement plot for the average values for
both the groups. Group A shows higher displacement and lower elastic modulus
whereas Group B shows lower displacement and higher elastic modulus. Figure 4.5
shows stress – strain curve for the two groups of bone. It can be seen that the Group A
shows higher strain than group B with lower stress value than group A.
Figure 4.3. Comparison of group A (A1, A2 and A3)and group B (B1, B2 and B3) samples for elastic modulus, ultimate stress and displacement.

25
Figure 4.4. Groups A and B comparison on basis of modulus and displacement.
Figure 4.5. Stress – strain curve for group A and B.
26
4.2 Hypothesis 1
The increase in indentation hardness and indentation modulus across the
thickness of the bone is co-related and paralleled to the increase in mineral to matrix
ratio, carbonate to phosphate ratio and collagen crosslinking.
4.3 Nanoindentation
An upward trend was observed for the modulus (Figure 4.3). The indentation
modulus peaked near the endosteal surface for all four quadrants. The maximum values
were 16.149, 19.99, 31.956, and 25.412 GPa for the anterior, lateral, posterior and
medial quadrants, respectively. The modulus decreased by 45% in the anterior, 51% in
the posterior, 53% in the lateral, and 43% in the medial. The posterior quadrant had the
highest average modulus across the cortex (31.956 GPa) while the anterior quadrant
had the lowest (16.149 GPa).
Moreover, the average increase in hardness with advancing position from the
periosteal to the endosteal surface for the four quadrants were observed (Figure 4.4).
The average for both the medial and lateral quadrants was 0.786 GPa and 0.754 GPa
respectively. The posterior quadrant had the highest average (1.361 GPa) while the
anterior had the lowest (0.665 GPa). A maximum hardness of 1.361 GPa was
measured at the location nearest to the endosteum on the posterior quadrant. The other
three quadrants were not far behind however, with maximums values of 0.786, 0.754,
and 0.665 GPa for the medial, lateral, and anterior quadrants, respectively, at the same
location closest to the endosteal surface. A 156.7% increase in cortical bone hardness
was found across the cortex of the anterior quadrant, from the maximum at the
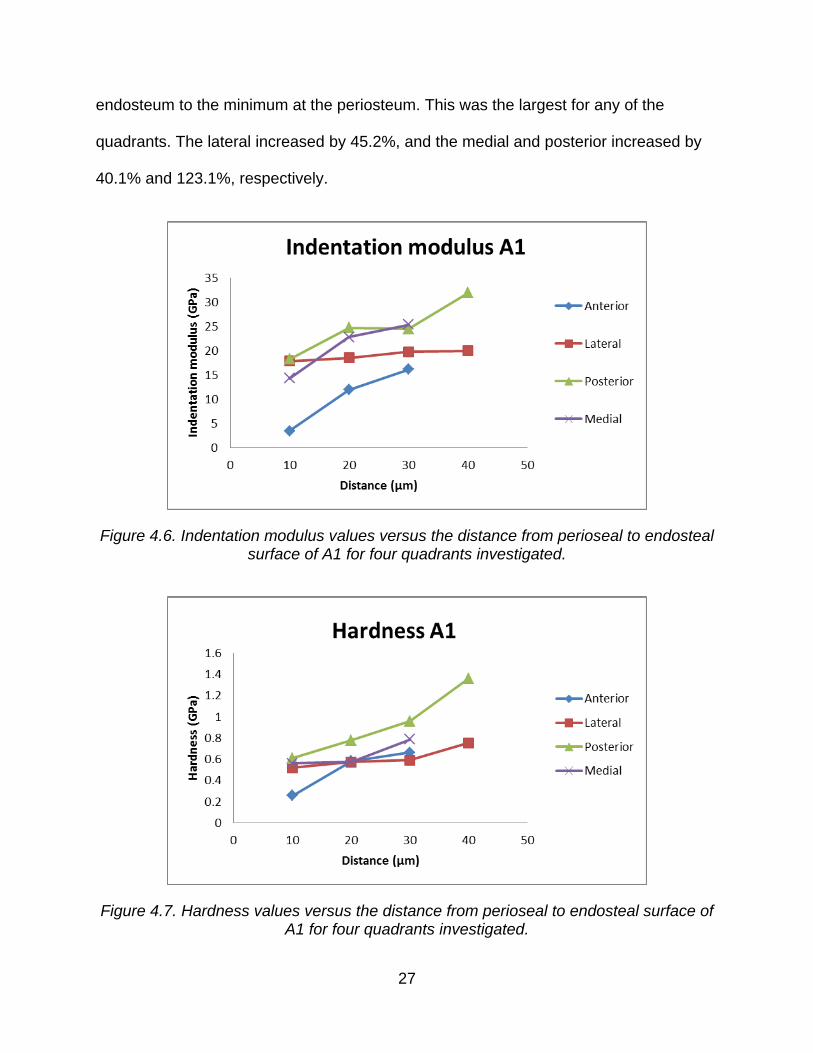
27
endosteum to the minimum at the periosteum. This was the largest for any of the
quadrants. The lateral increased by 45.2%, and the medial and posterior increased by
40.1% and 123.1%, respectively.
Figure 4.6. Indentation modulus values versus the distance from perioseal to endosteal surface of A1 for four quadrants investigated.
Figure 4.7. Hardness values versus the distance from perioseal to endosteal surface of A1 for four quadrants investigated.

28
A similar upward trend was observed for the modulus (Figure 4.5). The
indentation modulus peaked near the endosteal surface for all four quadrants. The
maximum values were 13.5, 3.07, 35.9 and 36.4 GPa for the anterior, lateral, posterior
and medial quadrants, respectively. The modulus decreased by 101% in the anterior,
140% in the posterior, 629% in the lateral, and 214% in the medial. The medial
quadrant had the highest average modulus across the cortex (36.4 GPa) while the
lateral quadrant had the lowest (3.07 GPa).
The average for both the medial and posterior quadrants was 1.192 GPa and
2.022 GPa respectively. The lateral quadrant had the lowest average (0.118 GPa) while
the anterior had 0.162 GPa. A maximum hardness of 2.022 GPa was measured at the
location nearest to the endosteum on the posterior quadrant. The other three quadrants
with maximums values of 1.192, 0.118 and 0.162 GPa for the medial, lateral, and
anterior quadrants, respectively, at the same location closest to the endosteal surface.
This was the largest for any of the quadrants. The anterior increased by 116%, and the
lateral increased by 306% from the maximum at the endosteum to the minimum at the
periosteum.

29
Figure 4.8. Indentation modulus values versus the distance from perioseal to endosteal surface of A2 for four quadrants investigated.
Figure 4.9. Hardness values versus the distance from perioseal to endosteal surface of A2 for four quadrants investigated.
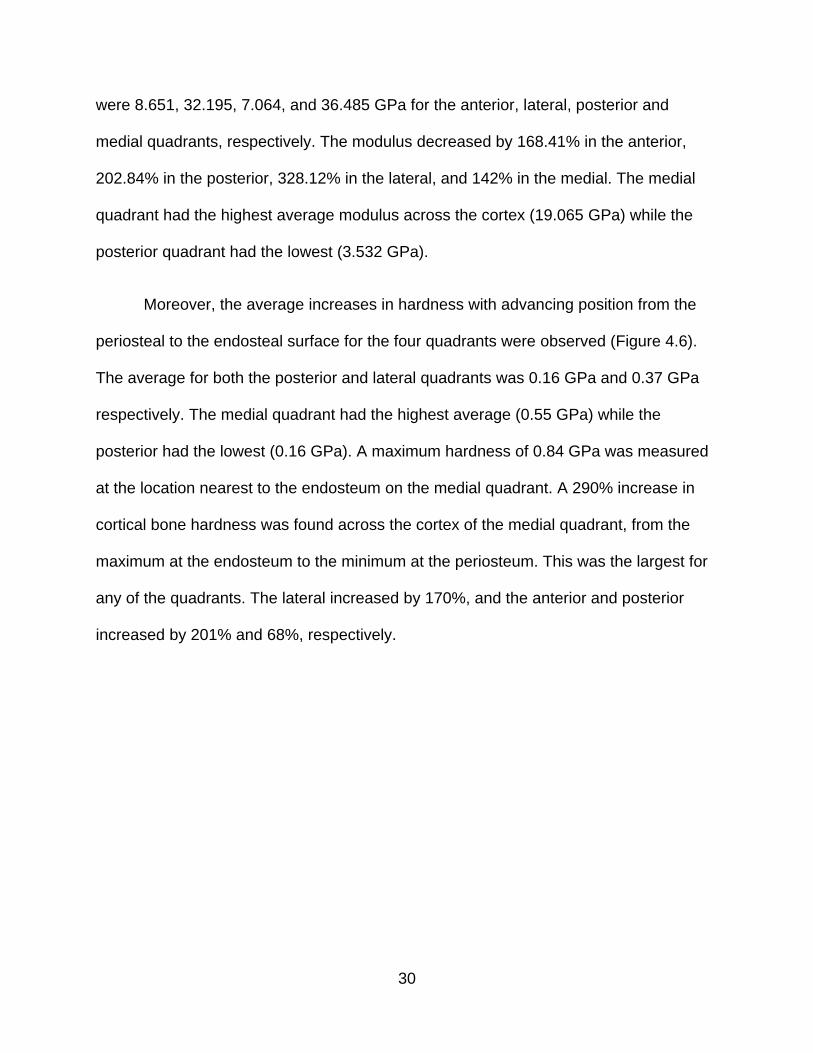
An upward trend was observed for the modulus (Figure 4.5). The indentation
modulus peaked near the endosteal surface for all four quadrants. The maximum values
30
were 8.651, 32.195, 7.064, and 36.485 GPa for the anterior, lateral, posterior and
medial quadrants, respectively. The modulus decreased by 168.41% in the anterior,
202.84% in the posterior, 328.12% in the lateral, and 142% in the medial. The medial
quadrant had the highest average modulus across the cortex (19.065 GPa) while the
posterior quadrant had the lowest (3.532 GPa).
Moreover, the average increases in hardness with advancing position from the
periosteal to the endosteal surface for the four quadrants were observed (Figure 4.6).
The average for both the posterior and lateral quadrants was 0.16 GPa and 0.37 GPa
respectively. The medial quadrant had the highest average (0.55 GPa) while the
posterior had the lowest (0.16 GPa). A maximum hardness of 0.84 GPa was measured
at the location nearest to the endosteum on the medial quadrant. A 290% increase in
cortical bone hardness was found across the cortex of the medial quadrant, from the
maximum at the endosteum to the minimum at the periosteum. This was the largest for
any of the quadrants. The lateral increased by 170%, and the anterior and posterior
increased by 201% and 68%, respectively.

31
Figure 4.10. Indentation modulus values versus the distance from perioseal to endosteal surface of A3 for four quadrants investigated.
Figure 4.11. Hardness values versus the distance from perioseal to endosteal surface of A3 for four quadrants investigated.

32
An upward trend was observed for the modulus (Figure 4.9). The indentation
modulus peaked near the endosteal surface for all four quadrants. The maximum values
were 29.274, 21.605, 22.9, and 28.189 GPa for the anterior, lateral, posterior and
medial quadrants, respectively. The modulus decreased by 107.32% in the anterior,
32.31% in the posterior, 100.14% in the lateral, and 78.51% in the medial. The anterior
quadrant had the highest average modulus across the cortex (21.5944 GPa) while the
medial quadrant had the lowest (17.7059 GPa).
Moreover, the average increase in hardness with advancing position from the
periosteal to the endosteal surface for the four quadrants were observed (Figure 4.10).
The average for both the medial and lateral quadrants was 0.41933 GPa and 0.506
GPa respectively. The anterior quadrant had the highest average (0.6526 GPa) while
the posterior had (0.5206 GPa). A maximum hardness of 1.089 GPa was measured at
the location nearest to the endosteum on the anterior quadrant. The other three
quadrants were not far behind however, with maximums values of 0.854, 0.609, and
0.717 GPa for the medial, lateral, and posterior quadrants, respectively, at the same
location closest to the endosteal surface. A 234% increase in cortical bone hardness
was found across the cortex of the anterior quadrant, from the maximum at the
endosteum to the minimum at the periosteum. This was the largest for any of the
quadrants. The lateral increased by 77%, and the medial and posterior increased by
132% and 198%, respectively.
33
Figure 4.12. Indentation modulus values versus the distance from perioseal to endosteal surface of B1 for four quadrants investigated.
Figure 4.13. Hardness values versus the distance from perioseal to endosteal surface of B1 for four quadrants investigated.
34
An upward trend was observed for the modulus (Figure 4.11). The indentation
modulus peaked near the endosteal surface for all four quadrants. The maximum values
were 28.502, 29.874, 53.16, and 36.58 GPa for the anterior, lateral, posterior and
medial quadrants, respectively. The modulus decreased by 98.75% in the anterior,
59.79% in the posterior, 135% in the lateral, and 466% in the medial. The posterior
quadrant had the highest average modulus across the cortex (26.6752 GPa) while the
anterior quadrant had the lowest (17.8786 GPa).
Moreover, the average increase in hardness with advancing position from the
periosteal to the endosteal surface for the four quadrants were observed (Figure 4.12).
The average for both the anterior and lateral quadrants was 0.6898 GPa and 0.6924
GPa respectively. The posterior quadrant had the highest average (0.7058 GPa) while
the medial had the lowest (0.5005 GPa). A maximum hardness of 1.19 GPa was
measured at the location nearest to the endosteum on the posterior quadrant. The other
three quadrants were not far behind however, with maximums values of 01.075, 0.976,
and 1.035 GPa for the medial, lateral, and anterior quadrants, respectively, at the same
location closest to the endosteal surface. A 318% increase in cortical bone hardness
was found across the cortex of the medial quadrant, from the maximum at the
endosteum to the minimum at the periosteum. This was the largest for any of the
quadrants. The lateral increased by 97%, and the anterior and posterior increased by
170% and 102%, respectively.

35
Figure 4.14. Indentation modulus values versus the distance from perioseal to endosteal surface of B2 for four quadrants investigated.
Figure 4.15. Hardness values versus the distance from perioseal to endosteal surface of B2 for four quadrants investigated.

36
An upward trend was observed for the modulus (Figure 4.13). The indentation
modulus peaked near the endosteal surface for all four quadrants. The maximum values
were 28.7415, 26.0878, 24.6524, and 12.7167 GPa for the anterior, lateral, posterior
and medial quadrants, respectively. The modulus decreased by 97.17% in the anterior,
37.86% in the posterior, 73.47% in the lateral, and 15.0077% in the medial. The anterior
quadrant had the highest average modulus across the cortex (28.7415 GPa) while the
medial quadrant had the lowest (12.71 GPa).
Moreover, the average increase in hardness with advancing position from the
periosteal to the endosteal surface for the four quadrants were observed (Figure 4.14).
The average for both the anterior and lateral quadrants was 0.797 GPa and 0.8294 GPa
respectively. The posterior quadrant had the highest average (0.902 GPa) while the
medial had the lowest (0.3076 GPa). A maximum hardness of 1.767 GPa was
measured at the location nearest to the endosteum on the posterior quadrant. The other
three quadrants were not far behind however, with maximums values of 0.497, 1.073,
and 1.128 GPa for the medial, lateral, and anterior quadrants, respectively, at the same
location closest to the endosteal surface. A 473% increase in cortical bone hardness
was found across the cortex of the posterior quadrant, from the maximum at the
endosteum to the minimum at the periosteum. This was the largest for any of the
quadrants. The lateral increased by 35%, and the medial and anterior increased by 25%
and 141%, respectively.
37
Figure 4.16. Indentation modulus values versus the distance from perioseal to endosteal surface of B3 for four quadrants investigated.
Figure 4.17. Hardness values versus the distance from perioseal to endosteal surface of B3 for four quadrants investigated.
38
4.4 Raman Spectroscopy
As seen with the nanomechanical properties, the mineral to matrix ratio and
carbonate to phosphate ratio as well as collagen crosslinking increases from the
periosteal surface to the endosteal surface of the cortical cortex. Hence, the maximum
values for each quadrant were measured on the inner side of the bone cortex and the
minimum values were near the outer edge. The plots for mineral to matrix ratios,
carbonate to phosphate ratio and collagen crosslinking plotted for anterior, posterior,
lateral and medial quadrants for all the groups. The measured values are summarized
in Table 4.2 for percentage increase for all groups against all four quadrants. As can be
seen from Table 4.2, the percentage shows increase in the values of all the variables
suggesting the increase in mineral content, carbonate content and collagen crosslinking
as compared to matrix, phosphates and reducible crosslinks respectively.
Figure 4.18. Mineral:Matrix ratio values versus the distance from perioseal to endosteal surface of A1 for four quadrants investigated.

39
Figure 4.19. Carbonate:Phosphate ratio values versus the distance from perioseal to endosteal surface of A1 for four quadrants investigated.
Figure 4.20. Collagen cross-linking values versus the distance from perioseal to endosteal surface of A1 for four quadrants investigated.
40
Figure 4.21. Mineral:Matrix ratio values versus the distance from perioseal to endosteal surface of A2 for four quadrants investigated.
Figure 4.22. Carbonate:Phosphate ratio values versus the distance from perioseal to endosteal surface of A2 for four quadrants investigated.

41
Figure 4.23. Collagen cross-linking values versus the distance from perioseal to endosteal surface of A2 for four quadrants investigated.
Figure 4.24. Mineral:Matrix ratio values versus the distance from perioseal to endosteal surface of A3 for four quadrants investigated.
42
Figure 4.25. Carbonate:Phosphate ratio values versus the distance from perioseal to endosteal surface of A3 for four quadrants investigated.
Figure 4.26. Collagen cross-linking values versus the distance from perioseal to endosteal surface of A3 for four quadrants investigated.

43
Figure 4.27. Mineral:Matrix ratio values versus the distance from perioseal to endosteal surface of B1 for four quadrants investigated.
Figure 4.28. Carbonate:Phosphate ratio values versus the distance from perioseal to endosteal surface of B1 for four quadrants investigated.

44
Figure 4.29. Collagen cross-linking values versus the distance from perioseal to endosteal surface of B1 for four quadrants investigated.
Figure 4.30. Mineral:Matrix ratio values versus the distance from perioseal to endosteal surface of B2 for four quadrants investigated.

45
Figure 4.31. Carbonate:Phosphate ratio values versus the distance from perioseal to endosteal surface of B2 for four quadrants investigated.
Figure 4.32. Collagen cross-linking values versus the distance from perioseal to endosteal surface of B2 for four quadrants investigated.
46
Figure 4.33. Mineral:Matrix ratio values versus the distance from perioseal to endosteal surface of B3 for four quadrants investigated.
Figure 4.34. Carbonate:Phosphate ratio values versus the distance from perioseal to endosteal surface of B3 for four quadrants investigated.

47
Figure 4.35. Collagen cross-linking values versus the distance from perioseal to endosteal surface of B3 for four quadrants investigated.
Table 4.2
Comparison of nano-mechanical properties of group A and B for endosteal and
periosteal region
Nano-mechanical property
Endosteal Periosteal
Groups Quadrants Elastic
Modulus (Gpa)
Hardness (Gpa)
Elastic Modulus
(Gpa)
Hardness (Gpa)
A1
Anterior 3.45 0.26 16.15 0.67
Lateral 17.90 0.52 19.99 0.75
Posterior 18.29 0.61 31.95 1.36
Medial 14.33 0.56 25.41 0.79
A2
Anterior 6.73 0.08 13.50 0.16
Lateral 0.42 0.03 3.07 0.12
Posterior 14.98 0.16 35.90 2.02
Medial 11.62 0.08 36.40 1.19
A3
Anterior 3.22 0.23 8.65 0.84
Lateral 2.09 0.11 32.20 0.37
Posterior 1.65 0.15 7.06 0.16
Medial 12.48 0.22 36.49 0.55

48
B1
Anterior 14.12 0.33 29.27 1.09
Lateral 16.33 0.34 21.61 0.72
Posterior 11.44 0.24 22.90 0.61
Medial 5.80 0.05 28.19 0.85
B2
Anterior 14.34 0.38 28.50 1.04
Lateral 18.70 0.50 29.87 0.98
Posterior 22.60 0.59 53.16 1.19
Medial 6.45 0.26 36.58 1.08
B3
Anterior 19.34 0.47 28.74 1.77
Lateral 22.34 0.79 26.08 1.13
Posterior 7.82 0.10 24.65 1.07
Medial 0.41 0.03 12.71 0.50
Table 4.3
Comparison of micro-chemical properties of group A and B for endosteal and periosteal
region
Micro-mechanical property
Groups Quadrants
Mineral to
matrix ratio
Carbonate to
phosphate ratio
Collagen cross linking
Mineral to
matrix ratio
Carbonat to
phosphate ratio
Collagen cross linking
A1
Anterior 7.74 0.44 0.19 8.68 0.50 0.91
Lateral 28.89 0.44 0.90 49.77 0.57 4.73
Posterior 18.02 0.54 0.35 35.62 0.59 2.55
Medial 15.41 0.43 0.38 17.77 0.54 4.28
A2
Anterior 10.56 0.48 0.51 21.14 0.73 1.53
Lateral 9.08 0.31 0.15 27.96 0.57 5.10
Posterior 8.71 0.28 0.51 41.62 0.78 2.67
Medial 3.72 0.47 0.95 14.84 0.64 3.83
A3
Anterior 7.74 0.44 0.19 8.68 0.50 0.91
Lateral 28.89 0.44 0.90 49.77 0.57 4.73
Posterior 18.02 0.54 0.35 35.62 0.59 2.55
Medial 15.41 0.43 0.38 17.77 0.54 4.28
B1
Anterior 4.68 0.18 0.47 46.23 0.73 3.82
Lateral 10.07 0.42 0.13 16.94 0.90 2.13
Posterior 10.26 0.32 0.05 27.40 0.70 4.10

49
Medial 12.88 0.26 0.37 28.39 0.71 4.54
B2
Anterior 4.83 0.36 0.22 17.26 0.97 6.99
Lateral 7.20 0.44 0.34 28.62 0.95 2.59
Posterior 8.60 0.59 0.18 16.88 0.99 2.98
Medial 8.88 0.45 0.23 52.70 0.87 5.75
B3
Anterior 5.09 0.32 0.99 9.68 0.90 4.98
Lateral 4.04 0.18 0.67 14.13 0.73 1.52
Posterior 9.07 0.28 0.71 34.36 0.68 2.76
Medial 5.24 0.35 0.76 43.02 2.59 6.58
Table 4.2 and 4.3 we can see that the indentation hardness as well as modulus
has increased from periosteal to endosteal region. This is observed in all the quadrants
for both the groups. The chemical composition changes too from endosteal to periosteal
region. We can see that the mineral to matrix ratio has increased. This is because the
mineralization increases as the tissue ages. This happens because of the deposition of
carbonate and hence can be seen that the carbonate to phosphate ratio increases too.
Collagen crosslinking is increased indicating the increase in stiffness of the bone, thus
attributing to the increase in elastic modulus.
4.5 Hypothesis 2
Stiffness increases due to increase in mineralization and increase in collagen crosslinks
thereby decreasing the deflection.
From Figures 4.33, 4.34, 4.35 and 4.36 it can be seen that for the anterior and
lateral quadrant the indentation modulus and hardness values for group B show steady
increase in the values from periosteal to endosteal surface. This group has lower
deflection as compared to group A. The anterior quadrant is under compression during
the three point bend test and higher indentation hardness and modulus contribute to

50
resistance to deflection. Group A shows lower elastic modulus as well as strength than
group B on macro level, refer to Figures 4.37, 4.38, 4.39 and 4.40.
Figure 4.36. Comparison of indentation modulus for anterior group versus the distance from perioseal to endosteal surface.
Figure 4.37. Comparison of hardness for anterior group versus the distance from perioseal to endosteal surface.

51
Figure 4.38. Comparison of indentation modulus for lateral group versus the distance from perioseal to endosteal surface.
Figure 4.39. Comparison of hardness for lateral group versus the distance from perioseal to endosteal surface.

52
Figure 4.40. Comparison of indentation modulus for medial group versus the distance from perioseal to endosteal surface.
Figure 4.41. Comparison of hardness for medial group versus the distance from perioseal to endosteal surface.
53
Figure 4.42. Comparison of indentation modulus for posterior group versus the distance from perioseal to endosteal surface.
Figure 4.43. Comparison of hardness for posterior group versus the distance from perioseal to endosteal surface.
When mineral to matrix ratio, carbonate to phosphate ratio and collagen
crosslinking from raman spectroscopy is compared on basis of quadrants for all the
54
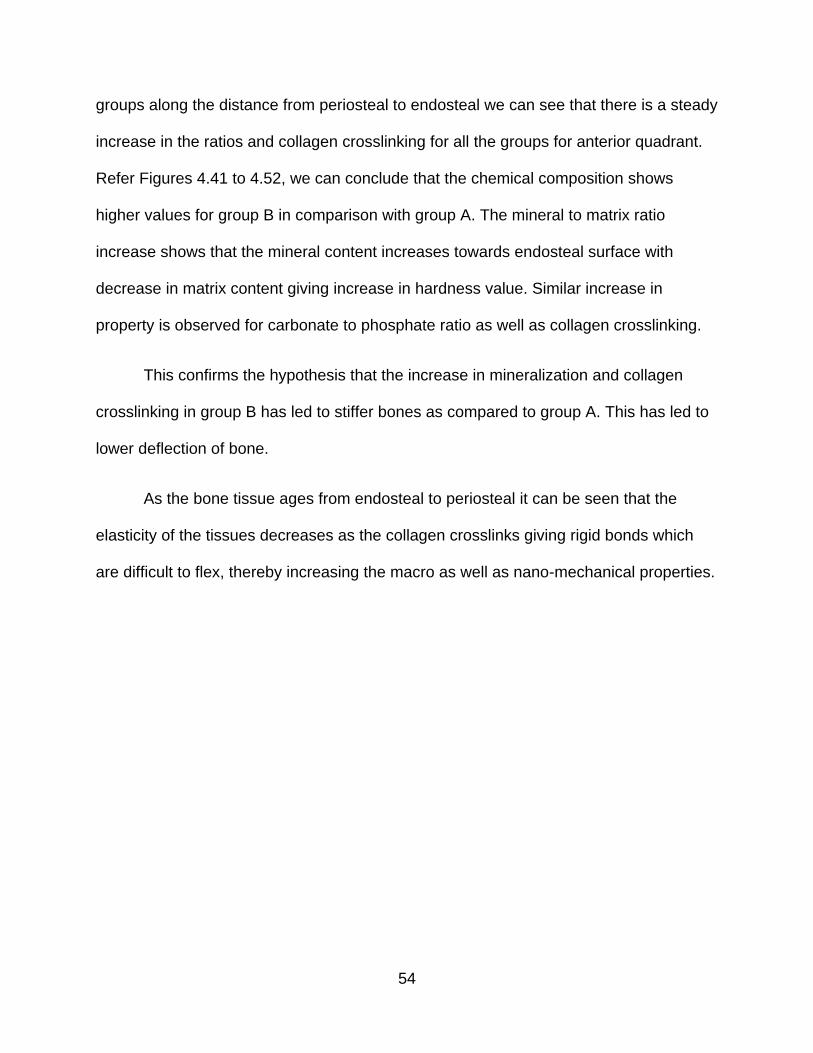
groups along the distance from periosteal to endosteal we can see that there is a steady
increase in the ratios and collagen crosslinking for all the groups for anterior quadrant.
Refer Figures 4.41 to 4.52, we can conclude that the chemical composition shows
higher values for group B in comparison with group A. The mineral to matrix ratio
increase shows that the mineral content increases towards endosteal surface with
decrease in matrix content giving increase in hardness value. Similar increase in
property is observed for carbonate to phosphate ratio as well as collagen crosslinking.
This confirms the hypothesis that the increase in mineralization and collagen
crosslinking in group B has led to stiffer bones as compared to group A. This has led to
lower deflection of bone.
As the bone tissue ages from endosteal to periosteal it can be seen that the
elasticity of the tissues decreases as the collagen crosslinks giving rigid bonds which
are difficult to flex, thereby increasing the macro as well as nano-mechanical properties.

55
Figure 4.44. Comparison of mineral to matrix ratio for anterior group versus the distance from perioseal to endosteal surface.
Figure 4.45. Comparison of carbonate to phosphate ratio for anterior group versus the distance from perioseal to endosteal surface.

56
Figure 4.46. Comparison of collagen crosslinking for anterior group versus the distance from perioseal to endosteal surface.
Figure 4.47. Comparison of mineral to matrix ratio for lateral group versus the distance from perioseal to endosteal surface.

57
Figure 4.48. Comparison of carbonate to phosphate ratio for lateral group versus the distance from perioseal to endosteal surface.
Figure 4.49. Comparison of collagen crosslinking for lateral group versus the distance from perioseal to endosteal surface.
58
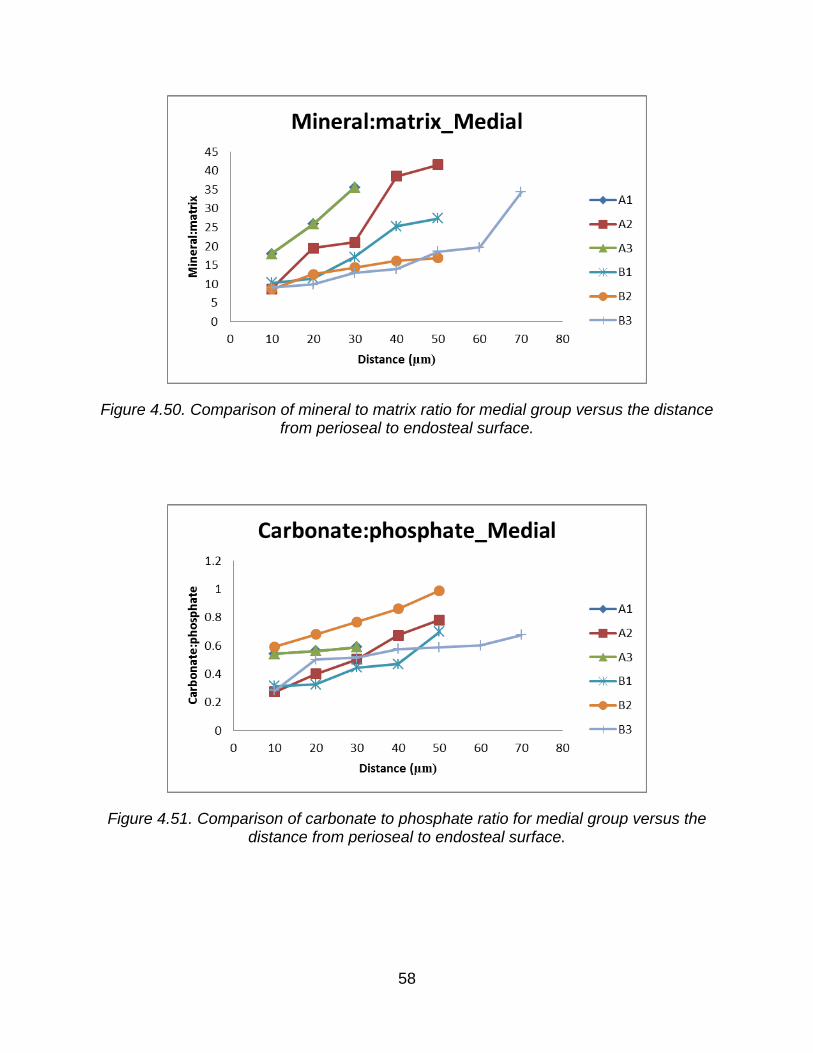
Figure 4.50. Comparison of mineral to matrix ratio for medial group versus the distance from perioseal to endosteal surface.
Figure 4.51. Comparison of carbonate to phosphate ratio for medial group versus the distance from perioseal to endosteal surface.

59
Figure 4.52. Comparison of collagen crosslinking for medial group versus the distance from perioseal to endosteal surface.
Figure 4.53. Comparison of mineral to matrix ratio for posterior group versus the distance from perioseal to endosteal surface.

60
Figure 4.54. Comparison of carbonate to phosphate ratio for posterior group versus the distance from perioseal to endosteal surface.
Figure 4.55. Comparison of collagen crosslinking for posterior group versus the distance from perioseal to endosteal surface.
61
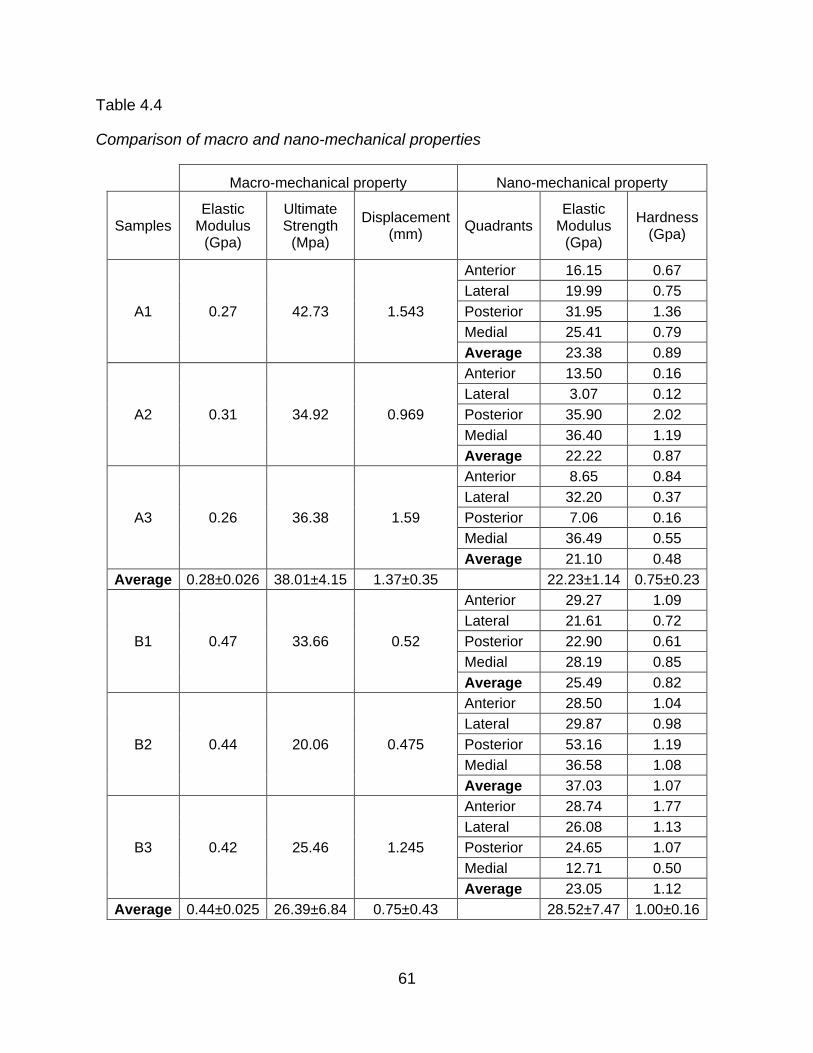
Table 4.4
Comparison of macro and nano-mechanical properties
Macro-mechanical property Nano-mechanical property
Samples Elastic
Modulus (Gpa)
Ultimate Strength
(Mpa)
Displacement (mm)
Quadrants Elastic
Modulus (Gpa)
Hardness (Gpa)
A1 0.27 42.73 1.543
Anterior 16.15 0.67
Lateral 19.99 0.75
Posterior 31.95 1.36
Medial 25.41 0.79
Average 23.38 0.89
A2 0.31 34.92 0.969
Anterior 13.50 0.16
Lateral 3.07 0.12
Posterior 35.90 2.02
Medial 36.40 1.19
Average 22.22 0.87
A3 0.26 36.38 1.59
Anterior 8.65 0.84
Lateral 32.20 0.37
Posterior 7.06 0.16
Medial 36.49 0.55
Average 21.10 0.48
Average 0.28±0.026 38.01±4.15 1.37±0.35 22.23±1.14 0.75±0.23
B1 0.47 33.66 0.52
Anterior 29.27 1.09
Lateral 21.61 0.72
Posterior 22.90 0.61
Medial 28.19 0.85
Average 25.49 0.82
B2 0.44 20.06 0.475
Anterior 28.50 1.04
Lateral 29.87 0.98
Posterior 53.16 1.19
Medial 36.58 1.08
Average 37.03 1.07
B3 0.42 25.46 1.245
Anterior 28.74 1.77
Lateral 26.08 1.13
Posterior 24.65 1.07
Medial 12.71 0.50
Average 23.05 1.12
Average 0.44±0.025 26.39±6.84 0.75±0.43 28.52±7.47 1.00±0.16

62
Table 4.5
Micro-chemical properties
Micro-chemical property
Samples Quadrants Mineral:matrix
ratio Carbonate:phosphate
ratio Collagen
crosslinking
A1
Anterior 8.68 0.50 0.91
Lateral 49.77 0.57 4.73
Posterior 35.62 0.59 2.55
Medial 17.77 0.54 4.28
Average 27.96 0.55 3.12
A2
Anterior 21.14 0.73 1.53
Lateral 27.96 0.57 5.10
Posterior 41.62 0.78 2.67
Medial 14.84 0.64 3.83
Average 26.39 0.68 3.28
A3
Anterior 8.68 0.50 0.91
Lateral 49.77 0.57 4.73
Posterior 35.62 0.59 2.55
Medial 17.77 0.54 4.28
Average 27.96 0.55 3.12
Average 27.44±0.9 0.59±0.07 3.17±0.09
B1
Anterior 46.23 0.73 3.82
Lateral 16.94 0.90 2.13
Posterior 27.40 0.70 4.10
Medial 28.39 0.71 4.54
Average 29.74 0.76 3.65
B2
Anterior 17.26 0.97 6.99
Lateral 28.62 0.95 2.59
Posterior 16.88 0.99 2.98
Medial 52.70 0.87 5.75
Average 28.87 0.95 4.58
B3
Anterior 9.68 0.90 4.98
Lateral 14.13 0.73 1.52
Posterior 34.36 0.68 2.76
Medial 43.02 2.59 6.58
Average 25.30 1.22 3.96
Average 27.97±2.35 0.98±0.23 4.06±0.47

63
From Table 4.4 it can be seen that group A has deflection of 1.37±0.35 which is
higher than group B with deflection of 0.75±0.43. The elastic modulus of group A is
0.28±0.026 GPa and for group B it is 0.44±0.25 GPa. This indicates that the higher
stiffness in bone has caused lower deflection and higher elastic modulus as can be
seen from increase in collagen crosslinking in group B which is 4.06±0.47 as compared
to group A which is 3.17±0.09 Table 4.5. The nano-mechanical results are parallel with
the macro-mechanical results. Showing group A has lower indentation modulus than
group B which are 22.23±1.14 GPa and 28.52±7.47 GPa respectively.
When values for the nanoindentation results are compared from Table 4.4 with
the chemical compositional changes on micro level from Table 4.5, we can say that the
elastic modulus on nanoscale can be better understood by the collagen crosslinking
ratio and hence can be seen that as collagen crosslinks in group B shows higher values
than group A, stiffness has affected. The bones have become more rigid and difficult to
flex showing higher values in elastic modulus from the nanoindentation data. So, more
collagen crosslinks in group B high stiffness and therefore high elastic modulus than
group A. Carbonate to phosphate ration indicates substitution of carbonates in the
hydroxyl apatite lattice and also higher mineral size due to mineralization. So, higher
carbonate to phosphate ratio shows higher overall hardness from the nanoindentation.
The nanoindentation as well as Raman spectroscopy probe the material properties at
the nano and micro level to give accurate properties as compared to macro mechanical
tests which are average of material properties.
Indentation hardness in group A is lower (0.75±0.23) than group B (1.00±0.16)
can be attributed to the increase in carbonate to phosphate ratio in group B than in A
64
which are 0.98±0.23 and 0.59±0.07 respectively. It is observed that the mineral to
matrix ratio for both the groups are almost equal.
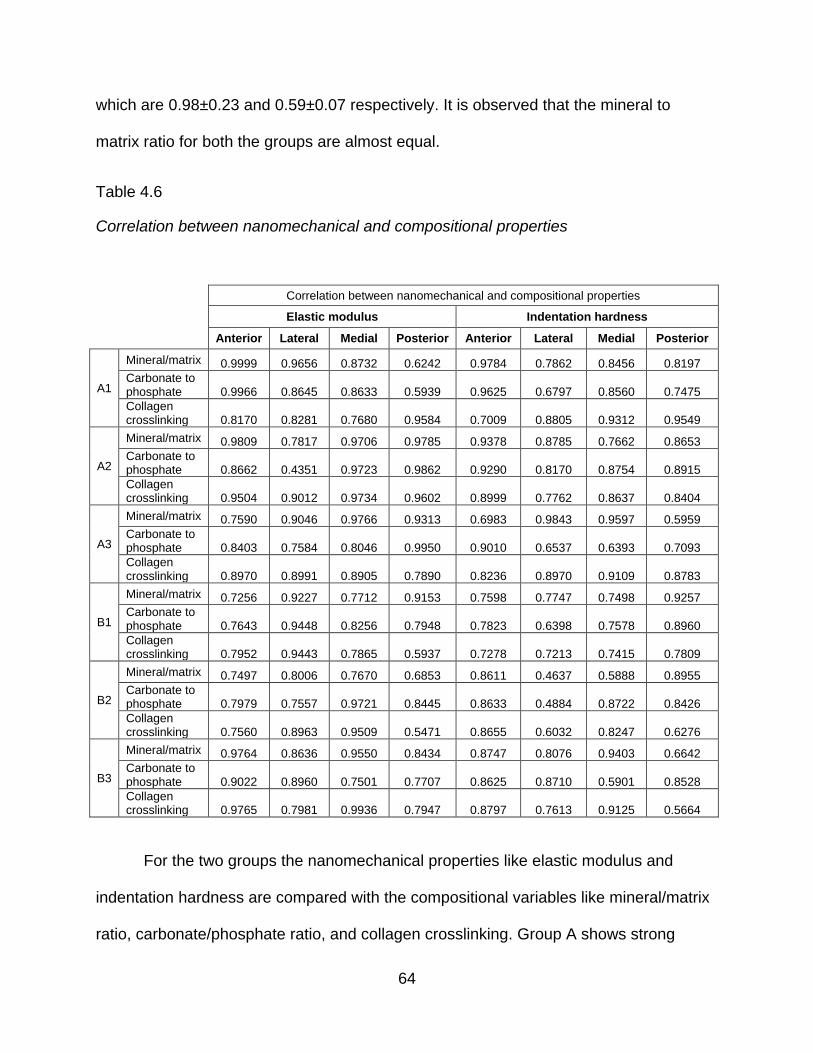
Table 4.6
Correlation between nanomechanical and compositional properties
Correlation between nanomechanical and compositional properties
Elastic modulus Indentation hardness
Anterior Lateral Medial Posterior Anterior Lateral Medial Posterior
A1
Mineral/matrix 0.9999 0.9656 0.8732 0.6242 0.9784 0.7862 0.8456 0.8197
Carbonate to phosphate 0.9966 0.8645 0.8633 0.5939 0.9625 0.6797 0.8560 0.7475
Collagen crosslinking 0.8170 0.8281 0.7680 0.9584 0.7009 0.8805 0.9312 0.9549
A2
Mineral/matrix 0.9809 0.7817 0.9706 0.9785 0.9378 0.8785 0.7662 0.8653
Carbonate to phosphate 0.8662 0.4351 0.9723 0.9862 0.9290 0.8170 0.8754 0.8915
Collagen crosslinking 0.9504 0.9012 0.9734 0.9602 0.8999 0.7762 0.8637 0.8404
A3
Mineral/matrix 0.7590 0.9046 0.9766 0.9313 0.6983 0.9843 0.9597 0.5959
Carbonate to phosphate 0.8403 0.7584 0.8046 0.9950 0.9010 0.6537 0.6393 0.7093
Collagen crosslinking 0.8970 0.8991 0.8905 0.7890 0.8236 0.8970 0.9109 0.8783
B1
Mineral/matrix 0.7256 0.9227 0.7712 0.9153 0.7598 0.7747 0.7498 0.9257
Carbonate to phosphate 0.7643 0.9448 0.8256 0.7948 0.7823 0.6398 0.7578 0.8960
Collagen crosslinking 0.7952 0.9443 0.7865 0.5937 0.7278 0.7213 0.7415 0.7809
B2
Mineral/matrix 0.7497 0.8006 0.7670 0.6853 0.8611 0.4637 0.5888 0.8955
Carbonate to phosphate 0.7979 0.7557 0.9721 0.8445 0.8633 0.4884 0.8722 0.8426
Collagen crosslinking 0.7560 0.8963 0.9509 0.5471 0.8655 0.6032 0.8247 0.6276
B3
Mineral/matrix 0.9764 0.8636 0.9550 0.8434 0.8747 0.8076 0.9403 0.6642
Carbonate to phosphate 0.9022 0.8960 0.7501 0.7707 0.8625 0.8710 0.5901 0.8528
Collagen crosslinking 0.9765 0.7981 0.9936 0.7947 0.8797 0.7613 0.9125 0.5664
For the two groups the nanomechanical properties like elastic modulus and
indentation hardness are compared with the compositional variables like mineral/matrix
ratio, carbonate/phosphate ratio, and collagen crosslinking. Group A shows strong

65
correlation with the elastic modulus for anterior, lateral and medial quadrants as
compared to posterior for indentation hardness for all the compositional variables, but
on an average the elastic modulus shows more strong correlation with the
compositional variables than the indentation hardness. For group B the elastic modulus
shows strong correlation in in all four quadrants as compared to indentation hardness.
The plots for all the correlations are appended at the end of the document in appendix.
The correlation r2 values for elastic modulus for group A and B are 0.8478 and 0.8611
respectively as compared to the less moderately correlated values of r2 for indentation
hardness for group A and B which are 0.8306 and 0.7969 respectively.

66
CHAPTER 5
DISCUSSION
The hypothesis of relating nano-mechanical properties and micro-chemical
properties is confirmed. The results show that as the carbonate to phosphate ratio
increases the hardness increases. Noteworthy is other observation that as the collagen
crosslinking increases the modulus increases. It is also seen that the young tissues
which are on the periosteal shows lower nano-mechanical properties than the matured
and older endosteal region.
As hypothesized, deflection of bone is related with the mineralization and
collagen crosslinks. The nano-mechanical properties like hardness and indentation
modulus affects the deflection and elastic modulus. It is clear that as the collagen
crosslink increases the deflection decreases, this implies that the bone has become
stiffer with increase in crosslink. This can be explained by the measurement of collagen
crosslinking which is the ratio of non-reducible to reducible crosslinks. The reducible
cross links are non-stable and are divalent. As the bone grows old and matures the
crosslinks transforms into non-reducible collagen by attaching one more collagen to the
link of two. These links are non-reducible and as the proportion of these crosslinks
increases the bone becomes stiff and thus loses its flexibility. This means that the bone
deflection reduces, which can be seen from the data. The influence of increase in
collagen crosslinks is evident from the elastic modulus values. As the collagen crosslink
ratio increases the elastic modulus increases too. Although mineral to matrix ratio is
approximately equal, the carbonate to phosphate ratio has contributed to the hardness.
The mineral matures as the age of the tissue increases towards endosteal, the mineral
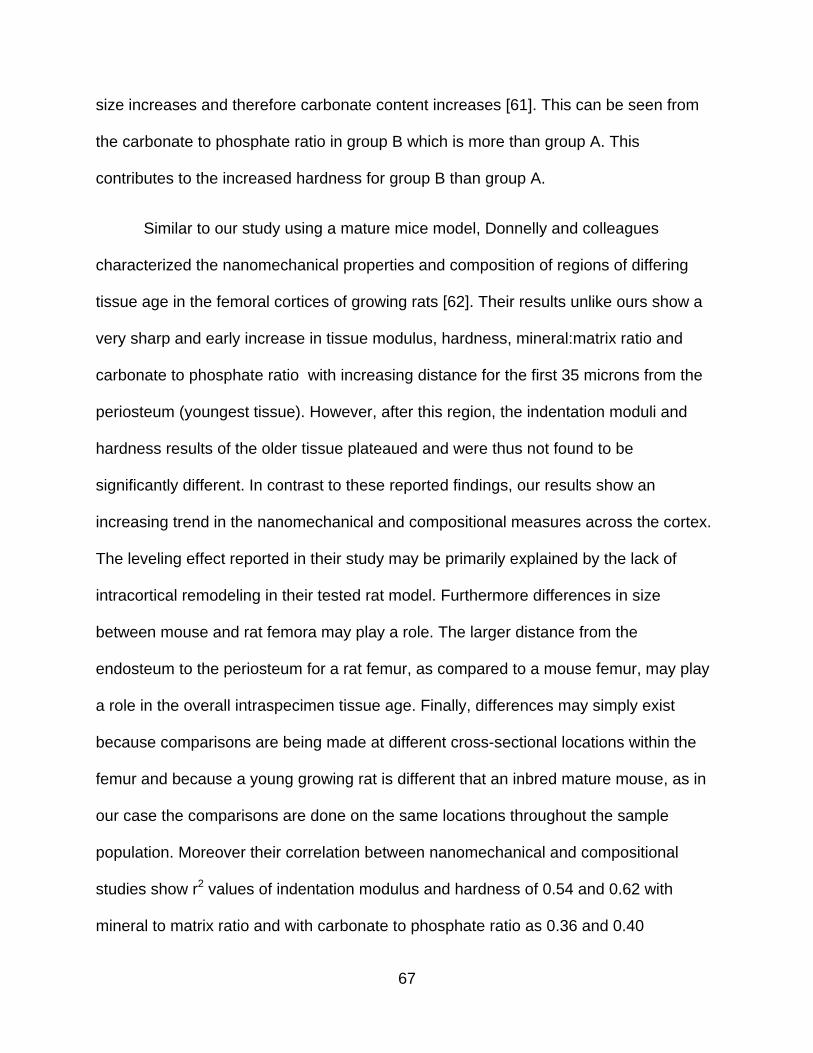
67
size increases and therefore carbonate content increases [61]. This can be seen from
the carbonate to phosphate ratio in group B which is more than group A. This
contributes to the increased hardness for group B than group A.
Similar to our study using a mature mice model, Donnelly and colleagues
characterized the nanomechanical properties and composition of regions of differing
tissue age in the femoral cortices of growing rats [62]. Their results unlike ours show a
very sharp and early increase in tissue modulus, hardness, mineral:matrix ratio and
carbonate to phosphate ratio with increasing distance for the first 35 microns from the
periosteum (youngest tissue). However, after this region, the indentation moduli and
hardness results of the older tissue plateaued and were thus not found to be
significantly different. In contrast to these reported findings, our results show an
increasing trend in the nanomechanical and compositional measures across the cortex.
The leveling effect reported in their study may be primarily explained by the lack of
intracortical remodeling in their tested rat model. Furthermore differences in size
between mouse and rat femora may play a role. The larger distance from the
endosteum to the periosteum for a rat femur, as compared to a mouse femur, may play
a role in the overall intraspecimen tissue age. Finally, differences may simply exist
because comparisons are being made at different cross-sectional locations within the
femur and because a young growing rat is different that an inbred mature mouse, as in
our case the comparisons are done on the same locations throughout the sample
population. Moreover their correlation between nanomechanical and compositional
studies show r2 values of indentation modulus and hardness of 0.54 and 0.62 with
mineral to matrix ratio and with carbonate to phosphate ratio as 0.36 and 0.40

68
respectively. Our results on the other hand show better correlation as shown in Table
4.6.

69
CHAPTER 6
CONCLUSION
In conclusion, the properties on all scales like macro, micro and nano have been
co-related to better understand the bone properties. The three point bending results like
elastic modulus and deflection were co-related to the collagen crosslinking obtained
from the Raman spectra. Thus, relating macro-mechanical and micro-compositional
properties. The hardness and indentation modulus were compared with the mineral to
matrix and carbonate to phosphate ratio from Raman spectra co-relating nano-
mechanical properties to micro-compositional properties. This thesis is an attempt to
understand the hierarchical nature of bone and the influence of the properties on all the
scales. The hypothesis put forth were confirmed on all the levels of hierarchy to better
understand the relation between chemical changes with the nano and macro
mechanical properties.

APPENDIX
SUPPLEMENTAL GRAPHS
70
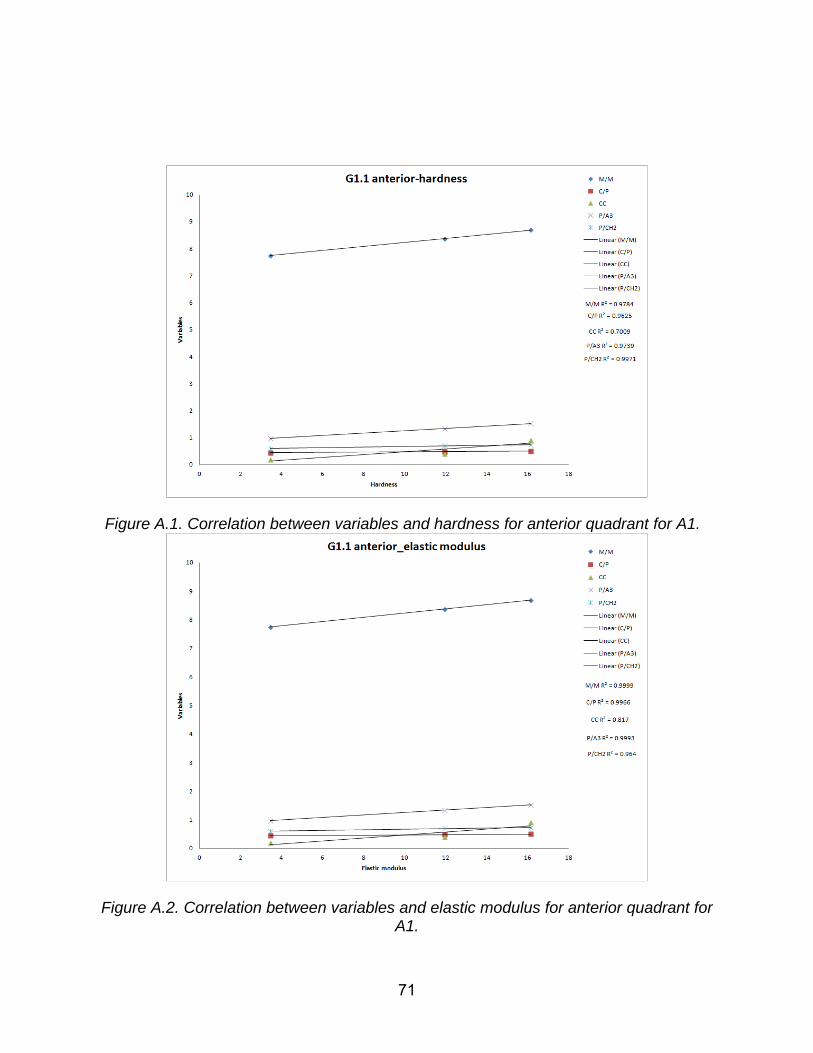
Figure A.1. Correlation between variables and hardness for anterior quadrant for A1.
Figure A.2. Correlation between variables and elastic modulus for anterior quadrant for A1.
71
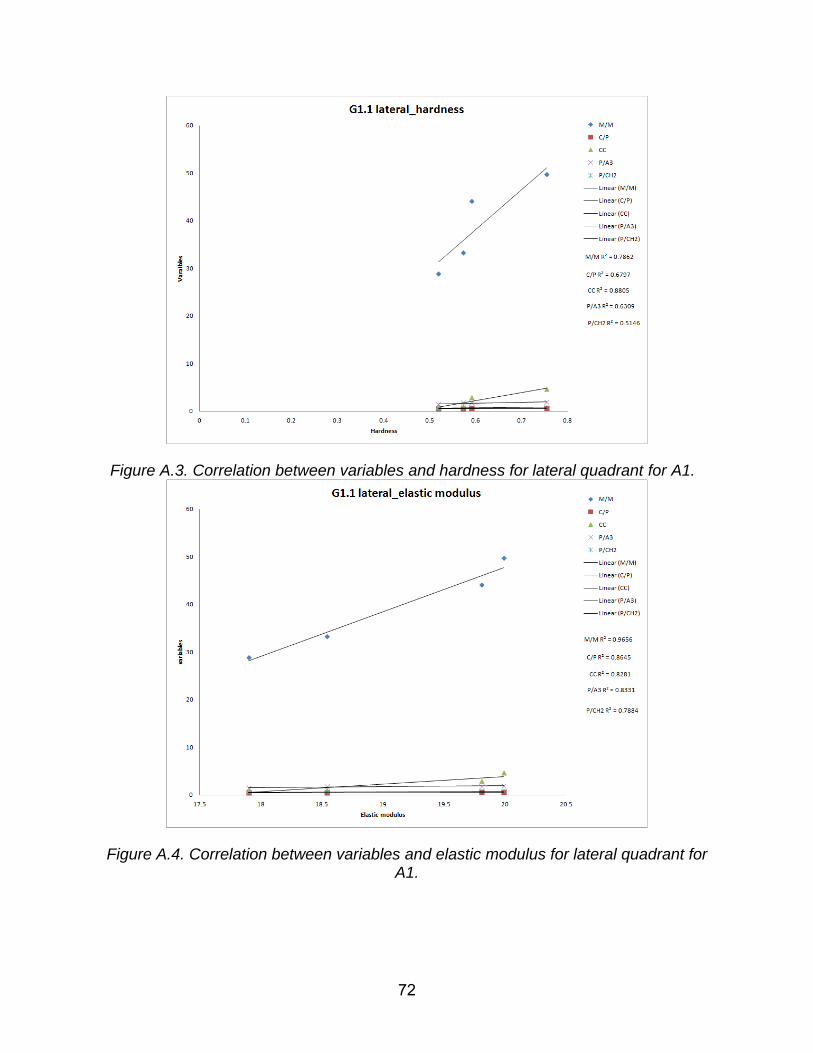
Figure A.3. Correlation between variables and hardness for lateral quadrant for A1.
Figure A.4. Correlation between variables and elastic modulus for lateral quadrant for A1.
72

Figure A.5. Correlation between variables and hardness for medial quadrant for A1.
Figure A.6. Correlation between variables and elastic modulus for medial quadrant for A1.
73

Figure A.7. Correlation between variables and hardness for posterior quadrant for A1.
Figure A.8. Correlation between variables and elastic modulus for posterior quadrant for A1.
74

Figure A.9. Correlation between variables and hardness for anterior quadrant for A2.
Figure A.10. Correlation between variables and elastic modulus for anterior quadrant for A2.
75

Figure A.11. Correlation between variables and hardness for lateral quadrant for A2.
Figure A.12. Correlation between variables and elastic modulus for lateral quadrant for A2.
76

Figure A.13. Correlation between variables and hardness for medial quadrant for A2.
Figure A.14. Correlation between variables and elastic modulus for medial quadrant for A2.
77

Figure A.15. Correlation between variables and hardness for posterior quadrant for A2.
Figure A.16. Correlation between variables and elastic modulus for posterior quadrant for A2.
78

Figure A.17. Correlation between variables and hardness for anterior quadrant for A3.
Figure A.18. Correlation between variables and elastic modulus for anterior quadrant for A3.
79

Figure A.19. Correlation between variables and hardness for lateral quadrant for A3.
Figure A.20. Correlation between variables and elastic modulus for lateral quadrant for A3.
80
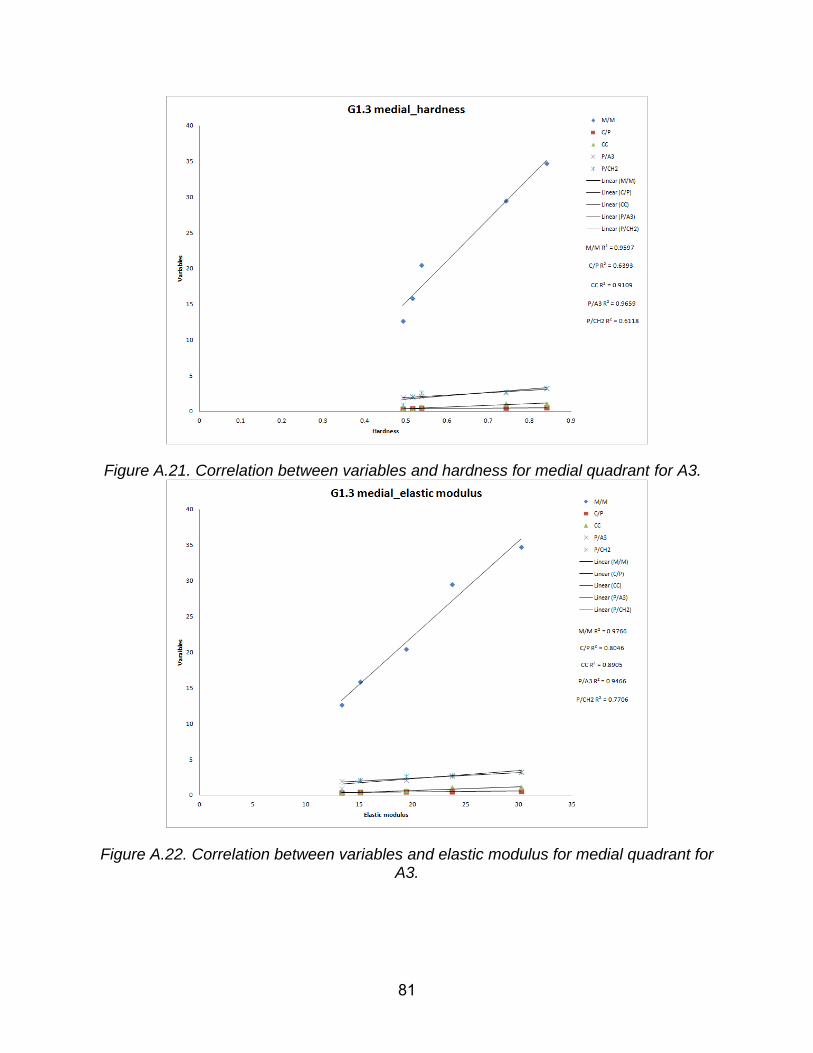
Figure A.21. Correlation between variables and hardness for medial quadrant for A3.
Figure A.22. Correlation between variables and elastic modulus for medial quadrant for A3.
81

Figure A.23. Correlation between variables and hardness for posterior quadrant for A3.
Figure A.24. Correlation between variables and elastic modulus for posterior quadrant for A3.
82

Figure A.25. Correlation between variables and hardness for lateral quadrant for B1.
Figure A.26. Correlation between variables and elastic modulus for lateral quadrant for B1.
83

Figure A.27. Correlation between variables and hardness for posterior quadrant for B1.
Figure A.28. Correlation between variables and elastic modulus for posterior quadrant for B1.
84

Figure A.29. Correlation between variables and hardness for anterior quadrant for B2.
Figure A.30. Correlation between variables and elastic modulus for anterior quadrant for B2.
85

Figure A.31. Correlation between variables and hardness for lateral quadrant for B2.
Figure A.32. Correlation between variables and elastic modulus for lateral quadrant for B2.
86

Figure A.33. Correlation between variables and hardness for medial quadrant for B2.
Figure A.34. Correlation between variables and elastic modulus for medial quadrant for B2.
87

Figure A1.35. Correlation between variables and hardness for posterior quadrant for B2.
Figure A.36. Correlation between variables and elastic modulus for posterior quadrant for B2.
88

Figure A.37. Correlation between variables and hardness for anterior quadrant for B3.
Figure A.38. Correlation between variables and elastic modulus for anterior quadrant for B3.
89

Figure A.39. Correlation between variables and hardness for lateral quadrant for B3.
Figure A.40. Correlation between variables and elastic modulus for lateral quadrant for B3.
90

Figure A.41. Correlation between variables and hardness for medial quadrant for B3.
Figure A.42. Correlation between variables and elastic modulus for medial quadrant for B3.
91
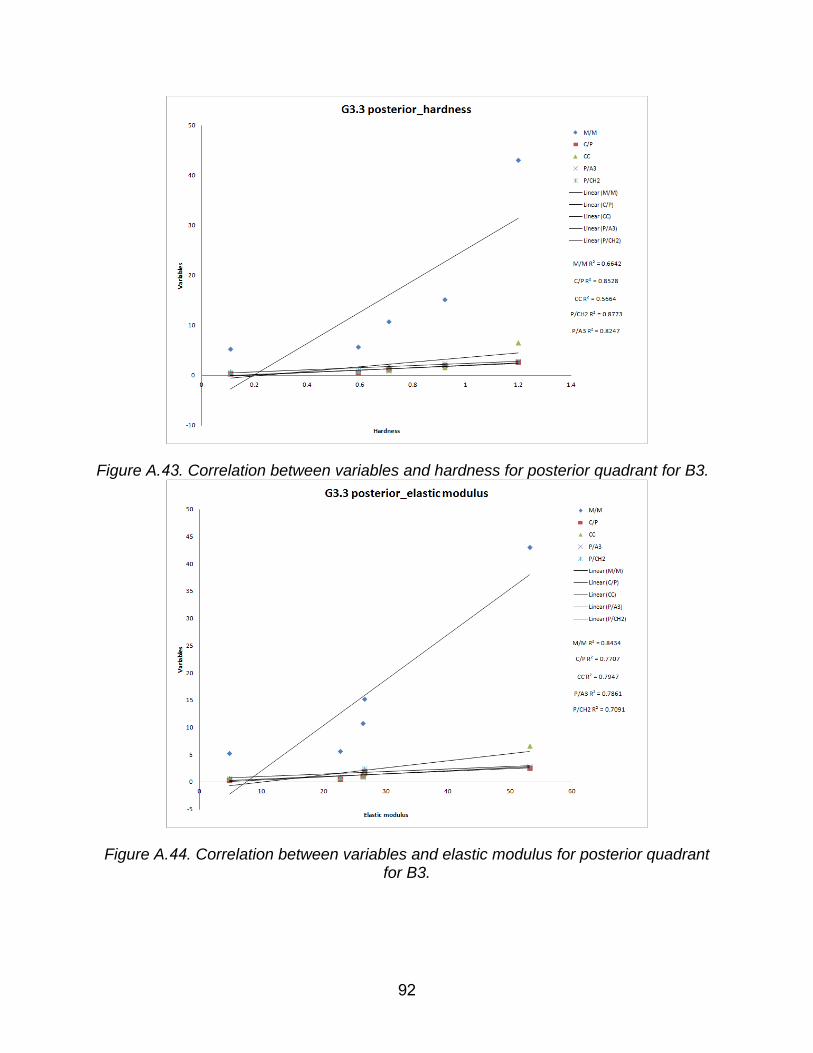
Figure A.43. Correlation between variables and hardness for posterior quadrant for B3.
Figure A.44. Correlation between variables and elastic modulus for posterior quadrant for B3.
92

REFERENCES
[1] Donnelly E, Boskey AL, Baker SP, van der Meulen MCH. J. Biomedical Materials
Research Part A 2010; 92: 1048 – 1056.
[2] Beril Kavukcuoglu N, David TD, Nejat G, Adrian BM. J. Biomedical Materials
Research Part A. 2007; 83A: 136-144.
[3] Rho JY, Ziopos P, Currey JD, Pharr GM. J Biomech 2002; 35: 189–198.
[4] Akkus O, Adar F, Schaffler MB. Bone 2004;34: 443–453.
[5] Hoffler CE, Moore KE, Kozloff K, Zysset PK, Brown MB, Goldstein SA. Bone
2000; 26: 603–609.
[6] Matsushima N, Hikichi K. Biochim. Biophys. Acta 992 1989;155-160.
[7] Grynpas M. Calcif. Tissue Int.1993;S57: 53-59.
[8] Burr DB, Martin RB J. Biomech. 1983;16:603.
[9] Handchin RG, Stern WB. Clin. Rheumatol.1994;13.
[10] Handchin RG, Stern WB. Bone 1995; 355S:16.
[11] Currey JD, Brear K, Zioupos P. J. Biomech. 1996;29:257.
[12] Boyce TM, Bloebaum RD. Bone 1993; 14:769.
[13] Schaffer MB, Choi K, Milgrom C, Bone 1996;16: 521.
[14] Courtney AC, Hayes WC, Gibson LJ, J. Biomechanics 1996; 29: 1463–1471.
[15] Currey JD. Journal of Experimental Biology 1999; 202: 3285–3294.
[16] Follet H, Boivin G, Rumelhart C, Meunier PJ. Bone 2004;34: 783–789.
[17] Mulder L, Koolstra JH, den Toonder JM, van Eijden TM. Bone 2007; 41: 256–
265.
[18] van Ruijven LJ, Mulder L, van Eijden TM. J. Biomechanics 2007; 40: 1211–1218.
93
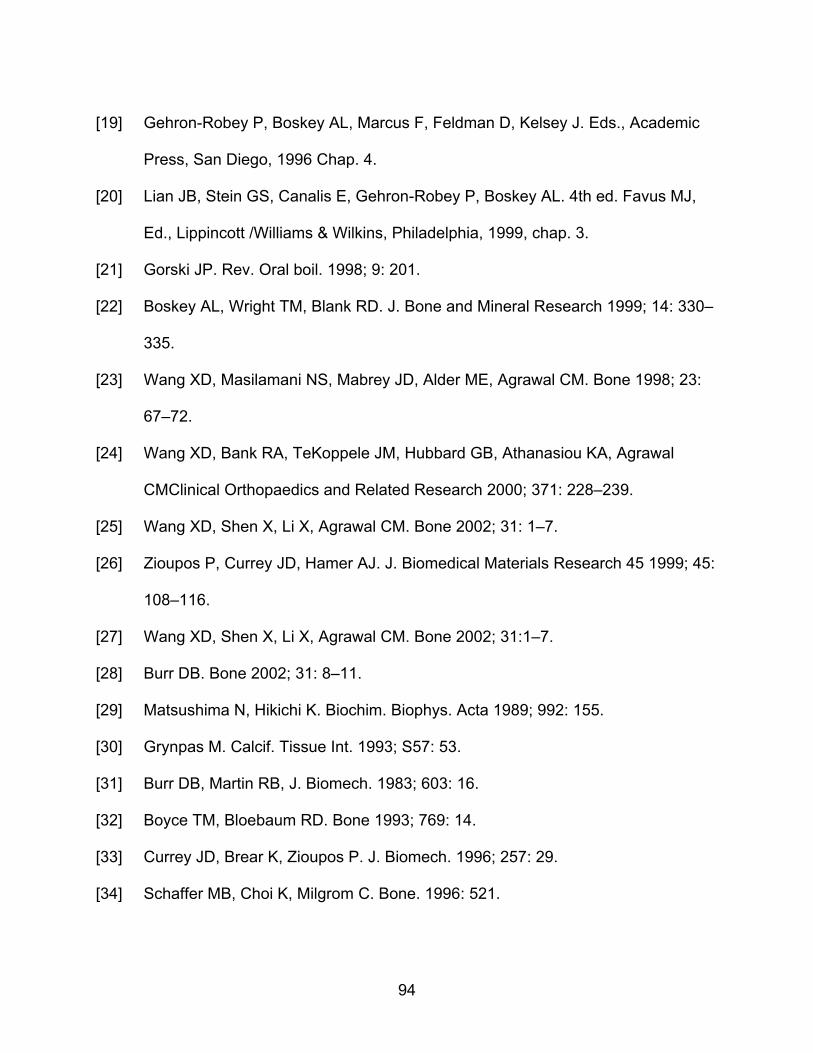
[19] Gehron-Robey P, Boskey AL, Marcus F, Feldman D, Kelsey J. Eds., Academic
Press, San Diego, 1996 Chap. 4.
[20] Lian JB, Stein GS, Canalis E, Gehron-Robey P, Boskey AL. 4th ed. Favus MJ,
Ed., Lippincott /Williams & Wilkins, Philadelphia, 1999, chap. 3.
[21] Gorski JP. Rev. Oral boil. 1998; 9: 201.
[22] Boskey AL, Wright TM, Blank RD. J. Bone and Mineral Research 1999; 14: 330–
335.
[23] Wang XD, Masilamani NS, Mabrey JD, Alder ME, Agrawal CM. Bone 1998; 23:
67–72.
[24] Wang XD, Bank RA, TeKoppele JM, Hubbard GB, Athanasiou KA, Agrawal
CMClinical Orthopaedics and Related Research 2000; 371: 228–239.
[25] Wang XD, Shen X, Li X, Agrawal CM. Bone 2002; 31: 1–7.
[26] Zioupos P, Currey JD, Hamer AJ. J. Biomedical Materials Research 45 1999; 45:
108–116.
[27] Wang XD, Shen X, Li X, Agrawal CM. Bone 2002; 31:1–7.
[28] Burr DB. Bone 2002; 31: 8–11.
[29] Matsushima N, Hikichi K. Biochim. Biophys. Acta 1989; 992: 155.
[30] Grynpas M. Calcif. Tissue Int. 1993; S57: 53.
[31] Burr DB, Martin RB, J. Biomech. 1983; 603: 16.
[32] Boyce TM, Bloebaum RD. Bone 1993; 769: 14.
[33] Currey JD, Brear K, Zioupos P. J. Biomech. 1996; 257: 29.
[34] Schaffer MB, Choi K, Milgrom C. Bone. 1996: 521.
94

[35] Courtney AC, Hayes WC, and L.J. Gibson LJ. J. Biomechanics 1996; 29: 1463–
1471.
[36] Handchin RG, Stern WB. Clin. Rheumatol. 1994; 13.
[37] Handchin RG, Stern WB. Bone 1995; 16: 355S-360S.
[38] Pienkowski D, Doers TM, Monier-Faugree MC, Geng Z, Camacho NP, Boskey
AL, Malluche HH. J. Bone Miner. Res. 1997; 12: 1936.
[39] Burr DB. Bone 2002; 31: 8–11.
[40] Ciarelli TE, Fyhrie DP, Parfitt AM. Bone 2003; 32: 311–315.
[41] Courtney AC, Hayes WC, Gibson LJ. J. Biomechanics 1996; 29: 1463–1471.
[42] Currey JD. J. Experimental Biology 1999; 202: 3285–3294.
[43] Follet H, Boivin G, Rumelhart C, Meunier PJ. Bone 2004; 34: 783–789.
[44] Mulder L, Koolstra JH, den Toonder JM, van Eijden TM. Bone 2007; 41: 256–
265.
[45] van Ruijven LJ, Mulder L, van Eijden TM. J. Biomechanics 2007; 40:1211–1218.
[46] Boskey AL, Wright TM, Blank RD. Journal of Bone and Mineral Research 1999;
14: 330–335.
[47] Wang XD, Masilamani NS, Mabrey JD, Alder ME, Agrawal CM. Bone 1998; 23:
67–72.
[48] Wang XD, Bank RA, TeKoppele JM, Hubbard GB, Athanasiou KA, Agrawal CM.
Clinical Orthopaedics and Related Research 2000; 371: 228–239.
[49] Wang XD, Shen X, Li X, Agrawal CM. Bone 2002; 31: 1–7.
[50] Zioupos P, Currey JD, Hamer AJ. Journal of Biomedical Materials Research
1999; 45: 108–116.
95

[51] Gehron-Robey P, Boskey AL, Feldman D, Kelsey J. Eds., Academic Press, San
Diego, 1996 Chap. 4.
[52] Lian JB, Stein GS, Canalis E, Gehron-Robey P, Boskey AL. 4th ed.,” Favus M. J.
Ed. Lippincott /Williams & Wilkins, Philadelphia. 1999. Chap. 3.
[53] Gorski JP. Rev. Oral boil. 1998; 9: 201.
[54] Gehron-Robey P, Boskey AL, Marcus F, Feldman D, Kelsey J. Eds. Academic
Press, San Diego. 1996 Chap. 4.
[55] Lian JB, Stein G S, Canalis E, Gehron-Robey P, Boskey A L. 4th ed. Favus M. J.
Ed. Lippincott /Williams & Wilkins, Philadelphia 1999 Chap. 3.
[56] Khosla S, Kleerkoper M. 4th ed. Favus MJ. Ed. Lippincott /Williams & Wilkins,
Philadelphia 1999 Chap. 22.
[57] Ferguson VL, Ayers RA, Bateman TA, Simske S. J. Bone 2003; 33: 387-98.
[58] Halloran BP, Ferguson VL, Simske SJ, Burghardt A, Venton LL, Majumdar S. J
Bone Miner Res 2002;17: 1044-1050.
[59] Watanabe K, Hishiya A. Molecular Aspects of Medicine 2005; 26: 221-31.
[60] Oliver WC, Pharr GM. J. Mater. 1992; 7: 1564 – 1583.
[61] Paschalis EP, DiCarlo E, Betts F, Sherman P, Mendelsohn R, Boskey A L. Calcif.
Tissue int. 1996; 59: 480.
[62] Donnelly E, Boskey AL, Baker SP, van der Meulen MCH. J. Biomedical Materials
Research Part A 2009; 1048 – 1056.
96
Related Documents


