Understanding the status of under- represented groups in the Information and Communication Technologies A report to the Engineering and Physical Sciences Research Council Helen Graham, Robert Raeside and Gavin Maclean Employment Research Institute, Edinburgh Napier University July 2017

Welcome message from author
This document is posted to help you gain knowledge. Please leave a comment to let me know what you think about it! Share it to your friends and learn new things together.
Transcript

Understanding the status of under-
represented groups in the Information and
Communication Technologies
A report to the Engineering and Physical
Sciences Research Council
Helen Graham, Robert Raeside and Gavin Maclean
Employment Research Institute, Edinburgh Napier University
July 2017

ii
Acknowledgements
The authors would like to thank everyone who gave up their time to participate in the
research, especially our interviewees – we appreciate how busy people are. Thank you also to
Nigel at EPSRC, and to Ann Blandford, Susan Stepney and Carron Shankland, for their helpful
advice and comments at every stage of the research.
The authors
Dr Helen Graham is a Research Fellow at the Employment Research Institute.
Prof Robert Raeside is the Director of the Employment Research Institute.
Dr Gavin Maclean is a Research Assistant at the Employment Research Institute.
The Employment Research Institute
The ERI is based within the Business School at Edinburgh Napier University. We carry out
independent, rigorous and interdisciplinary research that informs stakeholders in the public,
business and academic sectors on issues of employment, employability, skills, economic
development and equalities. We seek to advance understanding, develop new knowledge
and bring it to decision-makers, practitioners, funders, academics and society.
Contact us
Employment Research Institute
Edinburgh Napier University
Craiglockhart Campus
Edinburgh
EH14 1DJ
email: [email protected]
web: www.napier.ac.uk/eri
twitter: @napierERI

iii
Table of contents
List of figures ................................................................................................................................... v
List of tables .................................................................................................................................. vii
Executive summary ...................................................................................................................... viii
1. Introduction ............................................................................................................................... 13
1.1. Background ........................................................................................................................ 13
1.2. Project aims........................................................................................................................ 13
1.3. Report structure ................................................................................................................ 14
2. Literature ................................................................................................................................... 15
2.1. Working culture and value compatibility ......................................................................... 15
2.2. Support and working relationships ................................................................................... 16
2.3. Confidence ......................................................................................................................... 17
2.4. Discrimination .................................................................................................................... 17
2.5. Conclusion .......................................................................................................................... 19
3. Methodology ............................................................................................................................. 20
3.1. HESA data ........................................................................................................................... 20
3.2. Online survey ..................................................................................................................... 21
Survey content and dissemination ...................................................................................... 21
Survey analysis ...................................................................................................................... 22
3.3. Interviews ........................................................................................................................... 22
4. The composition of staff and research postgraduates ........................................................... 24
4.1. Staff .................................................................................................................................... 24
4.2. Students ............................................................................................................................. 24
5. Findings from the online survey and interviews ..................................................................... 26
5.1. Motivation for pursuing an academic career ................................................................... 26
5.2. Working conditions and expectations .............................................................................. 27
5.3. Confidence ......................................................................................................................... 32
5.4. Support and working relationships ................................................................................... 34
5.5. Caring responsibilities and flexible working ..................................................................... 37
5.6. Discrimination, harassment and aggression .................................................................... 39
5.7. Future career ..................................................................................................................... 41
Staff ....................................................................................................................................... 41

iv
Students ................................................................................................................................ 43
5.8. Diversity .............................................................................................................................. 44
6. Discussion and conclusion ........................................................................................................ 46
6.1. Key findings ........................................................................................................................ 46
6.2. Recommendations ............................................................................................................. 48
References ..................................................................................................................................... 52
Appendix 1: HESA data ................................................................................................................. 57
Staff ............................................................................................................................................ 57
Students ..................................................................................................................................... 69
Appendix 2: Online survey results ................................................................................................ 75
Survey demographics................................................................................................................ 75
Motivation for pursuing an academic career .......................................................................... 76
Working Conditions and Expectations ..................................................................................... 79
Support and working relationships .......................................................................................... 98
Caring Responsibilities and Flexible Working ........................................................................ 105
Discrimination, harassment and bullying .............................................................................. 110
Future plans ............................................................................................................................ 112
Appendix 3: Qualitative responses ............................................................................................. 119
Motivation for pursuing an academic career ........................................................................ 119
Working conditions and expectations ................................................................................... 122
Confidence .............................................................................................................................. 123
Support and working relationships ........................................................................................ 124
Caring responsibilities and flexible working .......................................................................... 126
Discrimination, harassment and aggression .......................................................................... 130
Future career ........................................................................................................................... 133
Diversity ................................................................................................................................... 136

v
List of figures
Figure 5.1: Challenges to sustaining an academic career, by gender ........................................ 30
Figure 5.2: Challenges to sustaining an academic career, by disability status – men ............... 31
Figure 5.3: Challenges to sustaining an academic career, by ethnicity – men .......................... 32
Figure 5.4: Confidence with selected career aspects, by gender – academic staff .................. 33
Figure 5.5: Confidence with selected career aspects, by gender – postgraduates ................... 34
Figure 5.6: Those who feel they are perceived as brilliant, and reliable, by gender ................. 37
Figure 5.7: Perceived impact of making use of flexible working provisions, and taking a career
break, by gender ........................................................................................................................... 38
Figure 5.8: Likelihood of postgraduate students seeking an academic job after completing
their studies ................................................................................................................................... 43
Figure A1.1: Disability status of academic staff, by gender ........................................................ 57
Figure A1.2: Ethnicity of academic staff, by gender .................................................................... 58
Figure A1.3: Age (banded) of academic staff, by gender ............................................................ 59
Figure A1.4: Percentage female staff in each age band, all academic staff and doctorate
holders ........................................................................................................................................... 59
Figure A1.5: Highest qualification held among academic staff, by gender................................ 60
Figure A1.6: Contract level of academic staff, by gender ........................................................... 61
Figure A1.7: Nationality of academic staff, by gender ................................................................ 62
Figure A1.8: Nationality of academic staff, by gender and contract level ................................. 63
Figure A1.9: Part-time employment among academic staff, by gender and contract level ..... 64
Figure A1.10: Part-time employment among academic staff, by gender and age band .......... 64
Figure A1.11: Fixed-term employment among academic staff, by gender and age band ........ 65
Figure A1.12: Fixed-term employment among academic staff, by gender and contract level 66
Figure A1.13: Academic employment function, by gender ........................................................ 66
Figure A1.14: Box plot of the proportion of female academic staff in computer science across
institutions ..................................................................................................................................... 67
Figure A1.15: Additional disciplines of academic staff, by gender ............................................. 68
Figure A1.16: Length of service of academic staff, by gender .................................................... 68
Figure A1.17: Disability status of postgraduate research students, by gender ......................... 70
Figure A1.18: Ethnicity of postgraduate research students, UK nationals only, by gender ...... 70
Figure A1.19: Nationality of postgraduate research students, by gender ................................. 71
Figure A1.20: Percentage studying part-time, by gender, disability status, age and nationality
........................................................................................................................................................ 72
Figure A1.21: Source of tuition fees (UK nationals only), by gender ......................................... 73
Figure A1.22: Source of tuition fees (UK nationals only), by disability status ........................... 73
Figure A1.23: Source of tuition fees (UK nationals only), by ethnicity ....................................... 74
Figure A2.1: Current job of academic staff respondents ............................................................ 76
Figure A2.2: Reasons for choosing an academic career, by gender – academic staff .............. 77
Figure A2.3: Reasons for pursuing postgraduate study, by gender – postgraduates ............... 78
Figure A2.4: Contracted working hours, by gender .................................................................... 80
Figure A2.5: Reported working hours of those contracted to work full-time, by gender ......... 81
Figure A2.6: Attitude towards hours worked, by contracted hours........................................... 82

vi
Figure A2.7: Attitude towards hours worked among those contracted to work full-time, by
gender ............................................................................................................................................ 83
Figure A2.8: Frequency expected to travel within the UK and abroad, by gender ................... 84
Figure A2.9: Mean satisfaction scores on job attributes, by gender .......................................... 85
Figure A2.10: Mean levels of stress reported in relation to selected tasks, by gender ............ 87
Figure A2.11: Mean extent to which aspects of the job represent a challenge to sustaining
current academic career, by gender ............................................................................................ 89
Figure A2.12: Mean extent to which aspects of the job represented a challenge to sustaining
previous academic career – current and former staff ................................................................ 90
Figure A2.13: Mean confidence scores for selected job aspects, by gender ............................ 93
Figure A2.14: Mean confidence scores of postgraduate students, by gender .......................... 95
Figure A2.15: Mean reported levels of stress among postgraduates, by gender ..................... 97
Figure A2.16: Mean satisfaction with support from different sources, by gender – academic
staff ................................................................................................................................................ 98
Figure A2.17: Mean satisfaction with support from different sources, by gender ................. 100
– postgraduates........................................................................................................................... 100
Figure A2.18: Mean scores on quality of working relationships and integration, by gender –
academic staff ............................................................................................................................. 101
Figure A2.19: Mean extent to which respondents feel peers perceive them to have certain
characteristics, by gender ........................................................................................................... 103
Figure A2.20: Mean scores on quality of working relationships and integration, by gender –
postgraduates.............................................................................................................................. 104
Figure A2.21: Mean scores on support, quality of working relationships and integration –
current and former staff and students ...................................................................................... 105
Figure A2.22: Proportion of academic staff who have made use of flexible working provisions,
by gender ..................................................................................................................................... 106
Figure A2.23: Proportion of academic staff who have taken a career break, by gender ....... 107
Figure A2.24: Perceived impact of taking flexible working, by gender and whether have taken
or might in future ........................................................................................................................ 108
Figure A2.25: Perceived impact of taking a career break, by gender and whether have taken
or might in future ........................................................................................................................ 109
Figure A2.26: Experiences of discrimination, bullying and micro-aggression, by gender –
academic staff ............................................................................................................................. 110
Figure A2.27: Experiences of discrimination, bullying and micro-aggression, by gender –
postgraduates.............................................................................................................................. 112
Figure A2.28: Willingness to relocate for a more senior position, by gender ......................... 113
Figure A2.29: Mean likelihood of seeking other types of job, by gender ................................ 114
Figure A2.30: Type of job that offers the most on selected attributes – academic staff ....... 115
Figure A2.31: Willingness to move in order to take up an academic position, by gender –
postgraduates.............................................................................................................................. 116
Figure A2.32: Mean likelihood of seeking other types of job, by gender – postgraduates .... 117
Figure A2.33: Type of job that offers the most on selected attributes – postgraduates ........ 118
vii
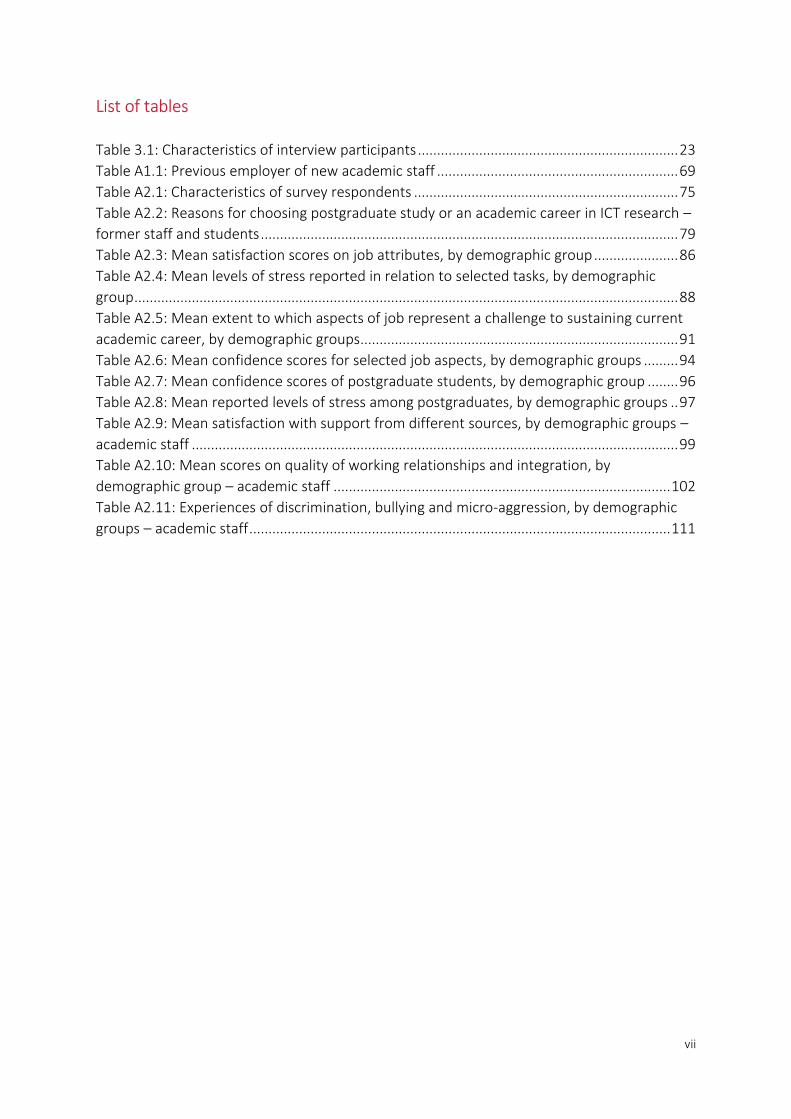
List of tables
Table 3.1: Characteristics of interview participants .................................................................... 23
Table A1.1: Previous employer of new academic staff ............................................................... 69
Table A2.1: Characteristics of survey respondents ..................................................................... 75
Table A2.2: Reasons for choosing postgraduate study or an academic career in ICT research –
former staff and students ............................................................................................................. 79
Table A2.3: Mean satisfaction scores on job attributes, by demographic group ...................... 86
Table A2.4: Mean levels of stress reported in relation to selected tasks, by demographic
group .............................................................................................................................................. 88
Table A2.5: Mean extent to which aspects of job represent a challenge to sustaining current
academic career, by demographic groups................................................................................... 91
Table A2.6: Mean confidence scores for selected job aspects, by demographic groups ......... 94
Table A2.7: Mean confidence scores of postgraduate students, by demographic group ........ 96
Table A2.8: Mean reported levels of stress among postgraduates, by demographic groups .. 97
Table A2.9: Mean satisfaction with support from different sources, by demographic groups –
academic staff ............................................................................................................................... 99
Table A2.10: Mean scores on quality of working relationships and integration, by
demographic group – academic staff ........................................................................................ 102
Table A2.11: Experiences of discrimination, bullying and micro-aggression, by demographic
groups – academic staff .............................................................................................................. 111

viii
Executive summary
This report presents the findings of a research project commissioned by the Engineering and
Physical Sciences Research Council (EPSRC) to explore the barriers facing under-represented
groups in Information and Communication Technologies (ICT) research. The focus of this
research is predominantly on the issue of gender, but other characteristics (disability,
ethnicity, age, and sexual orientation) were also considered.
To date there has been a lack of specific research looking at the experience of postgraduates
and staff in computer science and the related disciplines relevant to EPSRC’s ICT research
portfolio. Therefore the aim of the study was to identify and document the challenges and
barriers faced by under-represented groups pursuing careers in academic research in these
areas. This should help the academic community to better understand and therefore address
these barriers, so that more people from under-represented groups are attracted to, and
stay in, these disciplines.
The objectives of the study were therefore:
to investigate the nature of the cohort of researchers in ICT across the career stages;
to identify and describe the nature of the barriers and challenges facing under-
represented groups in pursuing academic careers;
to identify the features of the environment and culture of ICT as practised in
academia that make it more or less attractive to under-represented groups; and
to generate evidence-based recommendations that can be used by the community
and/or EPSRC as appropriate, to effect change.
The study had four elements:
1) A review of relevant literature in order to: identify the key likely issues from existing
work on women in STEM, academia and the tech industry more broadly; and to
develop the ensuing empirical work and help contextualise its findings.
2) Analysis of bespoke data from the Higher Education Statistics Authority (HESA), in
order to establish the extent of under-representation in computer science, and
whether job characteristics such as permanence and length of tenure were
concentrated within particular groups.
3) An online survey (which was completed by 866 respondents) to collect the views and
experiences of current and former postgraduates and staff.
4) 46 follow up interviews, to explore the issues raised in the survey in more depth.
ix
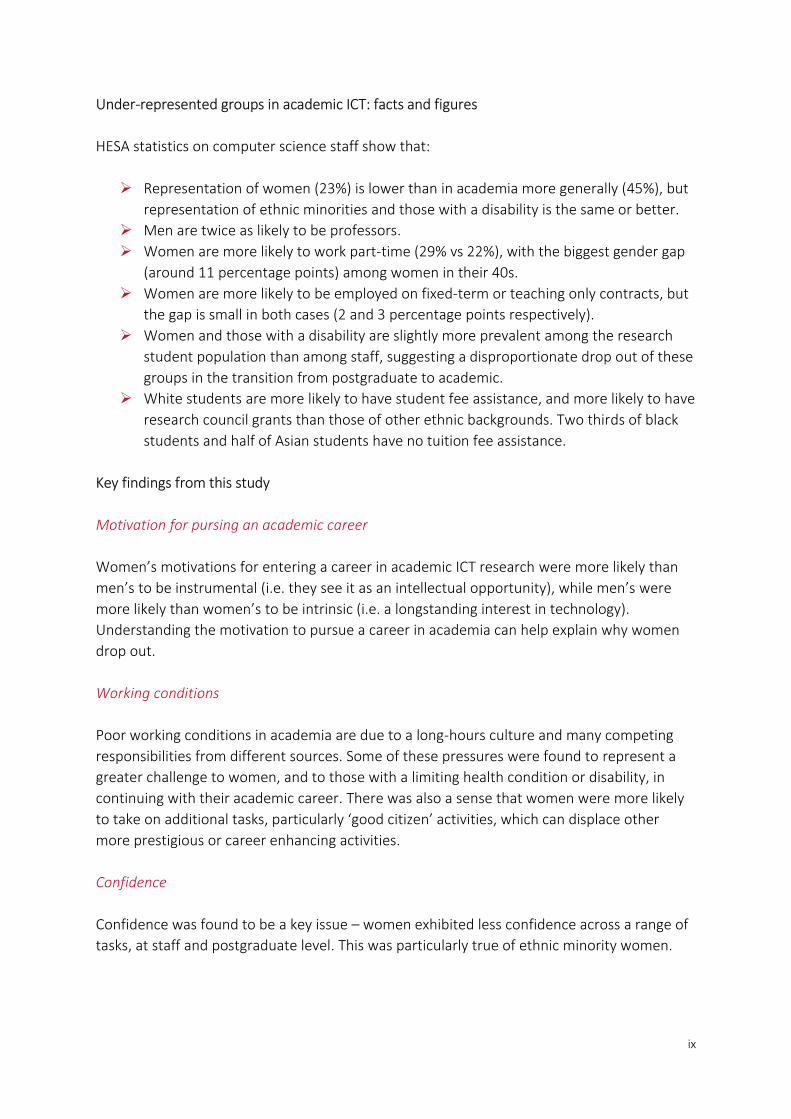
Under-represented groups in academic ICT: facts and figures
HESA statistics on computer science staff show that:
Representation of women (23%) is lower than in academia more generally (45%), but
representation of ethnic minorities and those with a disability is the same or better.
Men are twice as likely to be professors.
Women are more likely to work part-time (29% vs 22%), with the biggest gender gap
(around 11 percentage points) among women in their 40s.
Women are more likely to be employed on fixed-term or teaching only contracts, but
the gap is small in both cases (2 and 3 percentage points respectively).
Women and those with a disability are slightly more prevalent among the research
student population than among staff, suggesting a disproportionate drop out of these
groups in the transition from postgraduate to academic.
White students are more likely to have student fee assistance, and more likely to have
research council grants than those of other ethnic backgrounds. Two thirds of black
students and half of Asian students have no tuition fee assistance.
Key findings from this study
Motivation for pursing an academic career
Women’s motivations for entering a career in academic ICT research were more likely than
men’s to be instrumental (i.e. they see it as an intellectual opportunity), while men’s were
more likely than women’s to be intrinsic (i.e. a longstanding interest in technology).
Understanding the motivation to pursue a career in academia can help explain why women
drop out.
Working conditions
Poor working conditions in academia are due to a long-hours culture and many competing
responsibilities from different sources. Some of these pressures were found to represent a
greater challenge to women, and to those with a limiting health condition or disability, in
continuing with their academic career. There was also a sense that women were more likely
to take on additional tasks, particularly ‘good citizen’ activities, which can displace other
more prestigious or career enhancing activities.
Confidence
Confidence was found to be a key issue – women exhibited less confidence across a range of
tasks, at staff and postgraduate level. This was particularly true of ethnic minority women.

x
Support and working relationships
Good working relationships and feeling supported by colleagues are key sources of job
satisfaction and could foster retention. However, informal social events outside working
hours were found to present barriers and exclude people from developing work
relationships. In particular, ‘pub culture’ was found to be alienating to those who could not
attend due to caring responsibilities, or who did not drink alcohol. Around a quarter of staff
and students reported feeling isolated within their department, and women, ethnic
minorities, those with a limiting health condition or disability, and older postgraduates were
more likely to notice a feeling of ‘difference’ between themselves and others in their
department.
Caring responsibilities
Jobs, promotions, and funding are awarded based on the applicant’s accomplishments, but
this advantages a certain type of person, who both wants and is able to dedicate excessive
time and attention to the job. This is impossible for someone who has caring responsibilities,
which impose hard boundaries on the amount of time that can be spent on work. Women
were more likely to work part-time, and those who worked part-time were less likely to say it
was their preferred option than those who worked full-time. The tension between caring and
academic responsibilities was experienced to a similar degree among male and female survey
respondents. However, women were more likely to have caring responsibilities, and to have
made use of flexible working arrangements, or taken a career break, and women were more
likely to feel that this had had an impact on their job security or productivity. Those who had
taken absence from work due to maternity leave reported that this can be difficult to manage
for those with research grants or supervisory responsibilities, and on returning to work it can
be difficult to re-establish research activity at the same time as resuming a full teaching load.
Discrimination
Discrimination and negative attitudes exist and need to be challenged. Discrimination and
harassment examples were widely reported in the online survey, while interviews revealed a
more complex phenomenon of ‘indirect’ or ‘unquantifiable’ experiences of sexism and other
prejudice. Women in the research also recounted various instances of their competence
being questioned in ways their male colleagues do not experience.
Future career plans
Most respondents saw many positives about their career, but with some ambivalence about
its demands, and an attractive offer from industry could tempt them away – particularly for
students and early career researchers. A career in academia was seen as a trade-off, with less
pay and security traded for greater autonomy and more interesting work. Future planning
was restricted by caring responsibilities, partners’ jobs and location of family. Short term
contracts and the need to be mobile in pursuing postdoctoral opportunities were also found

xi
to be restricting future plans. The younger age groups responding to the survey were
particularly sceptical about pursuing an academic career, with clear reservations about career
progression opportunities and working conditions.
Diversity
Existing attempts to address the issue of diversity in STEM have attracted some backlash,
which was evident in the comments of some male respondents to the online survey. Female
respondents reported being on the receiving end of this; for example, being told they had
only succeeded due to reverse discrimination. However, the general feeling was that most of
their male colleagues accept the need to increase diversity, but are less aware of the need to
take positive action to achieve it. Some respondents felt that existing initiatives such as
Athena SWAN were not necessarily picking up on all facets of women’s experiences that
make their time in academia more difficult; for example, feelings of isolation or experiences
of micro-aggression. There was also a feeling that it is mainly female staff who are
shouldering the administrative burden of these diversity initiatives. Finally, some respondents
perceived a need to make more room for diversity of thought or approaches, and that there
is an inflexible mindset in academic computing that is in part responsible for reproducing
existing characteristics within the academic computing population.
Recommendations
Our main recommendation is that those who govern and lead HEIs and research institutes
attend to the findings which have emerged from this report and redouble efforts to make
HEIs and research institutes more inclusive bodies and become exemplars to the rest of
society. However, this they should not do on their own, but be aided by industry, professional
bodies and funding agencies. Industry has a role in giving guidance and advice on to the
creation of high performing work cultures, and could increase their role in offering
placements for staff and post graduate students, to give them experience of working in an
enterprise which has strong staff engagement. Professional bodies too have a role in
encouraging feelings of value and should be more proactive in their interaction with HEIs and
research institutions. Funders could strengthen their expectations upon HEIs and research
institutions. Perhaps metrics measuring the progress of women and those from minority
backgrounds could be used more explicitly by funders in relation to conditions of funding.
Those HEIs and research institutions who do not meet expectations could then be called to
account or face loss of funding. An explicit metric on tackling issues inhibiting the
advancement of women and minority groups could be introduced to assessments of HEIs and
research institutions made though the Research Excellence Framework.
Specific recommendations:
1) Ensure senior management of HEIs and research institutes are aware of the findings
of this report and develop mitigation plans. These plans should be developed in
consultation with those in high performance workplaces and professional bodies.

xii
2) Train all managers of research and teaching on combating barriers to the
advancement of women and those from minority groups. Develop these managers’
communication skills and how to enable inclusive work teams.
3) Train all research supervisors on how to better inspire and build confidence in those
they have responsibility for.
4) Ensure there is access to networking, training and development opportunities for all.
This might mean the need to consider access requirements, and when in the year or
day these events take place.
5) Funding panels should be cognisant about why some applicants may not have
expected levels of accumulated output-based evidence, at least allowing applicants to
explain any shortfall.
6) Encourage confidential discussion in performance reviews about barriers to progress
individuals have encountered or may perceive, and provide where possible
constructive suggestions.
7) Establish a web portal for reporting instances of discrimination, harassment and
micro-aggression and develop a culture of zero tolerance in regard to these issues.
8) Generally promote communication, engagement and group working. All staff and
students should be encouraged to examine any unconscious biases they may hold
against others, especially part-time workers, those who take career breaks, those with
a disability or those of a particular nationality or ethnic background, and to appreciate
the impact of their words and actions on the confidence or stress levels of those
around them.
9) Departments should monitor who is performing ‘good citizen’ activities such as
outreach, or diversity work such as Athena SWAN, and ensure that such activities are
allocated and rewarded in a fair and transparent manner.
10) Case studies of good practice in the development of women and minorities in ICT
should be established by unions and professional bodies.
11) Realistic expectations of what is required by staff and students should be established,
preferably by joint consent, and reviewed regularly, perhaps every quarter and no less
than twice a year.

13
1. Introduction
1.1. Background
This report presents the findings of a research project commissioned by the Engineering and
Physical Sciences Research Council (EPSRC) to explore the barriers facing under-represented
groups in Information and Communication Technologies (ICT) research. It was commissioned
because EPSRC and its partners felt that it is important for the strength of the UK research
base to harness talent and attract the best researchers. However, the ICT research
community is unbalanced with respect to gender and other characteristics.
To date there has been a lack of specific research on the experience of postgraduates and
staff in computer science and the related disciplines relevant to EPSRC’s ICT research
portfolio.1 Previous studies of doctoral students in physics (Institute of Physics, 2015) and
chemistry (Lober Newsome, 2008) have suggested that negative experiences may put
women off pursuing a career in academia, and female representation is even lower in
computer science than it is in other STEM subjects. The challenges faced and their impact on
diversity are also likely to vary throughout the career. Therefore, this project sought to gather
relevant data, alongside the views of those at all career stages, in order to address the issue
of under-representation in academic ICT research. The focus of this research is
predominantly on the issue of gender, but other characteristics (disability, ethnicity, age, and
sexual orientation) were also considered.
1.2. Project aims
The aim of the study was to identify and document the challenges and barriers faced by
under-represented groups pursuing careers in academic research in the Information and
Communication Technologies. This should help the academic community to better
understand and therefore address these barriers, so that more people from under-
represented groups are attracted to, and stay in, the discipline.
The objectives of the study were therefore:
to investigate the nature of the cohort of researchers in ICT across the career stages;
to identify and describe the nature of the barriers and challenges facing under-
represented groups in pursuing academic careers;
to identify the features of the environment and culture of ICT as practised in
academia that make it more or less attractive to under-represented groups; and
to generate evidence-based recommendations that can be used by the community
and/or EPSRC as appropriate, to effect change.
1 This encompasses all those in Computer Science or Electronic Engineering, but also includes anyone conducting research "which proposes new ways to transmit, present, manage, analyse, process, generate or understand information" (https://www.epsrc.ac.uk/research/ourportfolio/themes/ict/)

14
The study had four elements. Firstly, a review of relevant literature was conducted, in order
to identify the key likely issues from existing work on women in STEM, academia and the tech
industry more broadly, and to develop the ensuing empirical work and help contextualise its
findings. Secondly, bespoke data was obtained from the Higher Education Statistics Authority
(HESA), in order to establish the extent of under-representation in computer science, and
whether job characteristics such as permanence and length of tenure were concentrated
within particular groups. Thirdly, an online survey was conducted, in order to collect the
views and experiences of current and former postgraduates and staff. Finally, follow up
interviews were conducted, to explore the issues raised in the survey in more depth.
1.3. Report structure
The remainder of this report is structured as follows. Chapter 2 presents the key points raised
by the review of the relevant literature. Chapter 3 outlines the methodology of the study in
greater depth. A summary of the findings from the analysis of HESA data is presented in
Chapter 4, and then the main research findings from the online survey and interviews are
presented thematically in Chapter 5. Chapter 6 offers a conclusion and some
recommendations for future actions. Further detail from the empirical work is given in the
Appendices.

15
2. Literature
This brief literature review surveys the key work to date on the issue of under-representation
in ICT research. Although there is limited research specifically on women in academic
computing, it can be brought together with relevant insights from the literature on women in
STEM, women in academia, and women in the tech industry. The focus here is on the
representation of women, as this is both the focus of this study and the greatest availability
of literature, but intersectional issues such as race and sexual orientation are considered in
the few places that relevant literature is available.
Much of the research presented here was conducted in the USA, although some pertains to
the UK or other European countries. However, the aim of this review is not to paint a
comprehensive picture of the prevailing situation in UK academic ICT research, but to raise
the issues that may be present, in order to inform the direction and interpretation of the
subsequent empirical work.
2.1. Working culture and value compatibility
Previous research has suggested that women may enter their studies in computing for
systematically different reasons than men. Margolis and Fisher (2003) found that female
computing students reported different values and preferences, showing an instrumental
rationale for choosing computing and a preference for making a difference, rather than being
motivated by an intrinsic interest in the technology itself; a preference that was not always
supported by the design of the curriculum. They also suggested that female students were
more inclined to drop out because they did not identify with being ‘geeky’ or obsessed with
technology; a finding echoed by Rosenthal et al. (2011), whose study of STEM
undergraduates noted the importance of identity compatibility in retaining female students.
A preference for the practical application of computing over its intrinsic interest was also
noted by Machina and Grokhale (2015) in their study of US undergraduates, which suggested
that women were more likely to choose a computing major if exposed to information about
its practical applications.
Leaving academia will be more likely if the demands of an academic career are incompatible
with a person’s own priorities, values and life goals. A survey of 8,373 doctoral students in
California in 2006 found high concern about work-life balance, alongside a widespread
assumption that finding their desired balance will not be possible based on what they have
observed from the previous generation of academics; thus suggesting that values are
changing and institutions need to do so too (Mason, Goulden and Frasch, 2009). Lober
Newsome (2008) identified concern among chemistry PhD students in the UK that an
academic career is too all-consuming and competitive. This could pose a threat to diversity if
some groups’ values and preferences happen to be more compatible with the prevailing work
culture than others’, for example if women are more likely to prefer a more ‘balanced’ life.
Both of these studies found these concerns to be expressed by both sexes, but more
prevalent among female respondents.

16
Sang et al. (2015) argue that one reason academics work long hours is because work is their
‘passion’, and thus the boundary between work and leisure becomes blurred. The implication
of this is that anyone who does not work the same hours as the most passionate is at a
disadvantage. This is arguably problematic for anyone who does not wish to adopt this way of
working, but it is especially so for those whose working time is constrained by caring
responsibilities. Previous research on women in academia has highlighted the central role of
caring responsibilities in women’s difficulties in progressing in an academic career (Probert,
2005), and a lack of institutional support to manage work-family conflict can leave women
feeling marginalised (Gatta and Roos, 2004). A study of linguists and sociologists in the US
found that productivity (in terms of publication count) declines more for women than men
after having children (Hunter and Leahey, 2010). This may go some of the way to explaining
why female authors are under-represented in academic publishing relative to their presence
in academia (West et al., 2013). Family responsibilities can also impede women’s mobility,
thus narrowing the area in which they are able to consider employment and therefore their
career prospects (Ackers, 2004; González Ramos and Vergés Bosch, 2011). Lober Newsome
(2008) found that female postgraduates were more likely than male postgraduates to express
concern that academia is incompatible with family, and profess a lower desire to pursue an
academic career as a result.
2.2. Support and working relationships
The likelihood that someone will stay in an academic career may be influenced by the quality
of their working relationships and the degree of support they receive. The 2016 Athena
Survey of Science, Engineering and Technology (ASSET) found that women were less likely to
report that that their department offered them a supportive environment, or that they had a
line manager who was supportive of their career development (Aldercotte et al., 2017). In
Lober Newsome’s (2008) study, female chemistry PhD students were more likely to feel
uncomfortable with a ‘macho’ working culture, and to experience a lack of integration with
their research group. Kachchf et al. (2015) found that the intersection of ethnic and gender
identities may also generate a number of particular obstacles to integration for ethnic
minority women, resulting in their exclusion from professional networks and a lack of
support.
The dominant culture of a mostly male environment may be difficult to challenge, and
women entering this type of environment may feel they have to blend in, rather than
asserting themselves. Prescott and Bogg (2011) found that women in the male-dominated
gaming industry moderated their own gender identity, and therefore the introduction of
more women did not change the workplace dynamics. This effort to fit in can be considered a
kind of hidden additional work that is not required from those who already conform to the
existing culture (Andrew, 2009). However, women may not only accept, but also internalise,
the need to conform to the masculine ideal, and can therefore become complicit in
reinforcing gendered norms and hierarchies (Derks et al., 2011; Rhoton, 2011; Moss-Racusin
et al., 2012; Powell and Sang, 2015). For example, in interviews with female STEM academics,

17
Rhoton (2011) identified a tendency among many respondents to distance themselves from
female colleagues who cannot be ‘objective’ like male colleagues, or who ‘take things
personally’.
2.3. Confidence
A lack of confidence may be an impediment to progressing in an academic career. Confidence
is particularly important in achieving the self-promotion that an academic career demands,
but women may be particularly uncomfortable with this (Bagilhole and Goode, 2001; Fletcher
et al., 2007). A survey of PhD students in physics (Institute of Physics, 2015) found that
female students were considerably less likely to believe they would make good research
scientists (55%, compared to 70% of male students). Lober Newsome (2008) found that
female chemistry PhD students were more likely than male students to see experiment
failure as reflection of their own competence.
Women may be less likely to receive confidence-boosting affirmation from their colleagues
and peers. The 2016 ASSET survey found that women were less likely to say they had been
encouraged or invited to go for promotion (60% of male respondents said they had been,
compared with 49% of female respondents), and less likely to say they felt their research
contribution and external professional activities were valued (Aldercotte et al., 2017).
An issue often cited with relation to confidence is that of impostor syndrome. This can be
understood as feelings of fraudulence among successful people who do not attribute their
success to their own abilities, even in the presence of objective evidence of these abilities
(Parkman, 2016). Related to this is the idea of stereotype threat, where groups who are
stereotypically worse in a given area perform worse because the stereotype makes them feel
less confident; this can help to explain how women’s performance and interest in STEM can
be undermined (Shapiro and Williams, 2012). This is something that has been established for
example in relation to women’s confidence in completing computing tasks (Koch, Müller and
Sieverding, 2008). Ethnic minority women may be particularly susceptible to this problem,
due to particularly negative stereotypes about their abilities (Simard, 2010; Williams, Phillips
and Hall, 2014).
2.4. Discrimination
A number of studies have attempted to establish whether there is direct bias against women
in academia. Reuben, Sapienza and Zingales (2014) find experimental evidence of hiring bias,
which is exacerbated by a male tendency to overstate achievements, and recruiter blindness
to this tendency. Similarly, experiments have suggested gender bias in the evaluation of
student applications (Moss-Racusin et al., 2012), and that letters of interest sent to
professors ostensibly from students seeking mentoring were more likely to get a response if
they were signed with typically white male names (Milkman, Akinola and Chugh, 2015). A
study of applications to an early career funding grant in the Netherlands found that male
applicants were more successful and received higher ‘quality of researcher’ evaluations (van

18
der Lee and Ellemers, 2015). There is also experimental evidence of abstracts authored by
men on masculine topics being judged to have higher scientific quality than those authored
by women (Knobloch-Westerwick, Glynn and Huge, 2013).
However other evidence has suggested that, controlling for ability, female applicants are in
fact more likely to be hired in STEM subjects (Williams and Ceci, 2015). Another US study, of
hiring in computer science, did not find gender bias after controlling for scholarly productivity
– but noted that gender differences in doctoral training and career progression contributed
to the asymmetry in productivity (Way, Larremore and Clauset, 2016).
Female staff may also face bias from students, in evaluations of their teaching. There is
evidence of gender bias in student evaluations, both from experimental studies (MacNell,
Driscoll and Hunt, 2015; Boring, Ottoboni and Stark, 2016) and from analysis of real student
feedback (Wagner, Rieger and Voorvelt, 2016). Other staff characteristics have also been
found to affect student evaluations, such as sexuality (Ewing, Stukas and Sheehan, 2003) and
ethnicity (Pittman, 2010).
One factor that has been suggested as holding women back is gendered evaluations of
competence and likeability, and the fine balance between being ‘too masculine’ and ‘not
masculine enough’ in attempting to be regarded as such (Cuddy, Fiske and Glick, 2004). Leslie
et al. (2015) found that women were less likely to be perceived as naturally brilliant in
academic fields where this is seen as a key success factor. Women in masculine fields in STEM
may face particular challenges in being perceived as competent and likeable (Hill, Corbett
and St Rose, 2010), findings which echo those of Simard and Davies Henderson (2008) with
respect to female scientists and engineers in high tech firms.
Efforts have been made in recent years to undertake more careful monitoring of diversity
issues in universities, but this kind of ‘institutional housekeeping’ tends to be an additional
burden taken on by women (Bird, Litt and Wang, 2004). Indeed, with respect to Athena
SWAN, 73% of Institutional Champions and 80% of Departmental Champions are female, and
around half of these consider the associated workload excessive (Munir et al., 2014).
Although some positive impact may have occurred as a result of Athena SWAN (Munir et al.,
2014), subtle and intangible factors may limit its effectiveness. Interviews with female
academics by Fletcher et al. (2007) suggest that it is subtle forms of gender disadvantage that
exclude women from the research culture; not overt or even deliberate discrimination, but
rather a lack of transparency internally (e.g. in the distribution of resources) and externally
(e.g. selection for REF panels), as well as a working culture based around homosociability.
Gender equality at the policy level may not be enough if it is blind to the actual gender
dynamics in the workplace, as Rolin and Vainino (2011) found with respect to their study of a
physics department in Finland.
The success of equality and diversity initiatives may also be undermined by a response from
academic staff that is lukewarm, or even hostile. Interviews with academics across different
disciplines carried out in the 1990s found a number of reactions: some were basically

19
sympathetic but did not really understand the problem the initiatives were trying to solve;
some were fine with equality initiatives as long as they did not subvert existing power
structures; some thought that inequality was unfortunate but unavoidable, and women
should adapt accordingly; and some were actively hostile or resistant (Bagilhole, 2002).
Recent research has also suggested that men, and especially male STEM academics, are
reluctant to accept evidence of gender bias in STEM, and evaluate the quality of research
that unveils bias as less meritorious than women do (Handley et al., 2015).
Within academia, certain disciplines or sub-disciplines may be considered more ‘masculine’
or ‘feminine’, and this is highly correlated with fields that are considered ‘harder’ or ‘softer’
(Knights and Richards, 2003). Computer science could be considered not only a male-
dominated discipline but a masculine one; Ensmenger (2015) argues that this was by design
as the discipline came into being in the 1960s, to differentiate it from the traditionally female
(and thus lesser valued and lower paid) work of computer programming. Feminist scholars
such as Wajcman (2004) argue that the relationship between gender and technology is one
of mutual shaping, in which technology is both a source and a consequence of gender
relations. This gendering of technology manifests itself as sexism in online communities
(Reagle, 2013) and the insistence that women’s lack of participation has nothing to do with
sexism and is a rational choice (Massanari, 2017).
2.5. Conclusion
The literature therefore suggests a number of reasons why women (or other groups) might
be under-represented in computer science:
Their motivations for pursuing computer science are instrumental rather than
intrinsic – but they are unable to pursue a sufficiently applied or impactful direction.
They place a greater value on goals outside of academia, family related or not, which
are incompatible with the all-consuming nature of academia.
Responsibilities outside of work impede their ‘productivity’ (which is measured
against the norms of those who do not have these responsibilities) and mobility with
respect to pursuing available job opportunities in a tight labour market.
They feel less integrated into their workplaces and less supported by colleagues.
They lack confidence relative to their peers, and receive less confidence-boosting
encouragement.
They are more likely to doubt themselves and their abilities, and internalise
stereotypes, resulting in poorer performance and a drop off in interest.
They experience direct bias in hiring, promotion and grant application processes, as
well as from the students they teach.
They experience indirect bias, in the allocation of resources (facilitated by opaque
allocation processes), and in everyday interactions.
They are less likely to be perceived as competent and likeable.
Attempts to address diversity are not engaged with by the ‘majority’ groups.
Some of the literature argues that computer science is perceived as inherently
masculine.

20
3. Methodology
The research drew upon three sources of data in order to answer the research questions:
data on staff and postgraduates from HESA; an online survey of current and former staff and
postgraduates; and follow-up interviews with survey respondents.
3.1. HESA data
Sufficiently detailed information on the composition of staff and students in computer
science was not available from previously published outputs; therefore, a bespoke data
request was made to HESA. Data was obtained on staff and research postgraduate students
(masters by research or PhD students, including those at the writing up stage), for the most
recent year available (2015/16), who were currently working in a computer science discipline
(Computer science, Information systems, Software engineering, Artificial intelligence, Health
informatics, Games, Computer generated visual & audio effects or Others in Computer
sciences).2
The data on staff was used to address the following questions:
1) What is the composition of staff with respect to key demographic characteristics
(gender, disability, ethnicity, age, nationality)?
2) How does the gender balance vary across institutions?
3) Are there gender disparities in:
a. contract level
b. mode of employment (full-time/part-time)
c. terms of employment (permanent/fixed-term)
d. length of contract
e. academic employment function (research, teaching or both)?
4) Are there differences in the proportion of non-UK nationals at different career
stages?
The data on research postgraduates was used to address the following questions:
1) What is the composition of research postgraduates with respect to key demographic
characteristics (gender, disability, ethnicity, age, nationality)?
2) Are there gender (or other) disparities in:
a. mode of study (full-time/part-time/writing up/sabbatical)
b. source of tuition fees?
2 Although EPSRC’s ICT research theme encompasses those in disciplines beyond computer science, it was not possible to distinguish those outside of computer science carrying out relevant research from the information kept by HESA; the analysis should therefore be considered broadly representative but not exhaustive.

21
Data kept by HESA on the numbers and characteristics of staff and students is subject to
accurate reporting of this information by institutions. Some variables are also self-reported
and/or voluntary (e.g. ethnicity and disability), and are therefore subject to differences of
interpretation or missing data. However, the HESA data is the best available source of
information for exploring the characteristics of this population, as the figures cover the entire
population of staff and students, as opposed to information collected from a self-selected
sample such as an online survey.
3.2. Online survey
In order to explore the views and experiences of postgraduates and staff working in academic
ICT research, an online survey was conducted.
Survey content and dissemination
The survey aimed to establish whether systematic gender (and other) differences exist along
the following dimensions, as this may help to explain why women (or other groups) are less
likely to pursue academic careers in ICT research:
1) Motivation for pursuing an academic career
2) Attitude towards working conditions in academia, in particular:
a. attitudes towards hours worked
b. job satisfaction
c. levels of stress
d. the nature of perceived challenges
3) Level of confidence in own abilities as an academic
4) Support received from colleagues and at the institutional level, and the quality of
working relationships
5) Caring responsibilities and the impact these have
6) Experiences of discrimination, harassment and bullying
7) Likelihood of leaving academia and the relative attractions of other opportunities
The survey was open to all those whose research fell under EPSRC’s ICT theme, which was
described to potential participants as follows:
“This encompasses all those in Computer Science or Electronic Engineering, but also
includes anyone conducting research which proposes new ways to transmit, present,
manage, analyse, process, generate or understand information"
Data was collected through the SurveyMonkey online survey tool. A link to the survey was
sent by EPSRC to relevant heads of department in universities for dissemination to staff and
students, and the survey was publicised on social media.

22
Survey responses were anonymous, with no information about the user collected by the
software. However, respondents who wished to participate in follow-up interviews (see
Section 3.3 below) were invited to leave their email address so that the research team could
contact them. The results were reported in a way that would not identify any individual.
Survey analysis
866 people responded to the online survey; 520 current staff members, 300 current
postgraduates, 17 former staff and 29 former postgraduates. The level of response from
current staff and students meant that sub-group analysis (e.g. differences by gender) could
be carried out, but the relatively small number of former staff and student respondents
meant that the data from these groups had to be presented in a more aggregated way, with
considerable caveats about its wider generalisability to these groups.
Where sub-group analysis was carried out, statistical tests were used to establish the
significance of the observed relationships; t-tests or analysis of variance (ANOVA) were used
for continuous dependent variables, and chi-square tests for categorical variables. Findings
were reported as ‘significant’ when statistical tests indicated significance at the 5% level. The
p-values obtained are presented in Appendix 2. In order to establish the effect size, Cohen’s d
was calculated for comparisons between two groups (e.g. men and women), and Eta-squared
for comparisons across multiple groups (e.g. age categories). Effect sizes (where results were
found to be significant) are also presented in Appendix 2. The substantive interpretation of
the effect sizes was according to the following rules of thumb: for Cohen’s d, 0.2 was
considered a small effect, 0.5 a medium effect and 0.8 a large effect; while for Eta-squared,
0.01 was considered a small effect, 0.06 a medium effect, and 0.14 a large effect.
3.3. Interviews
To explore the themes of the online survey in greater depth, qualitative follow-up work was
carried out. Interviews were conducted by Skype or telephone with 46 participants, all of
whom had volunteered to participate by leaving their details at the end of the online survey.
The characteristics of the participants are shown in Table 3.1. Participants were drawn from
across the career stages. Most were female, although men were consulted where this was
expected to yield information about other relevant characteristics.
Participants were informed in advance of the interview that their responses would be
confidential, and reported in a way that did not identify any individual. Interviews were
recorded with participants’ permission.
Semi-structured interviews were carried out, based around the seven themes explored in the
online survey questionnaire, but also leaving room for participants to raise issues beyond
those already covered in the survey. Interview content was tailored to the participant
according to relevance and salience. Most interviews lasted between 20 minutes and 1 hour,
with an average duration of 35 minutes.
23
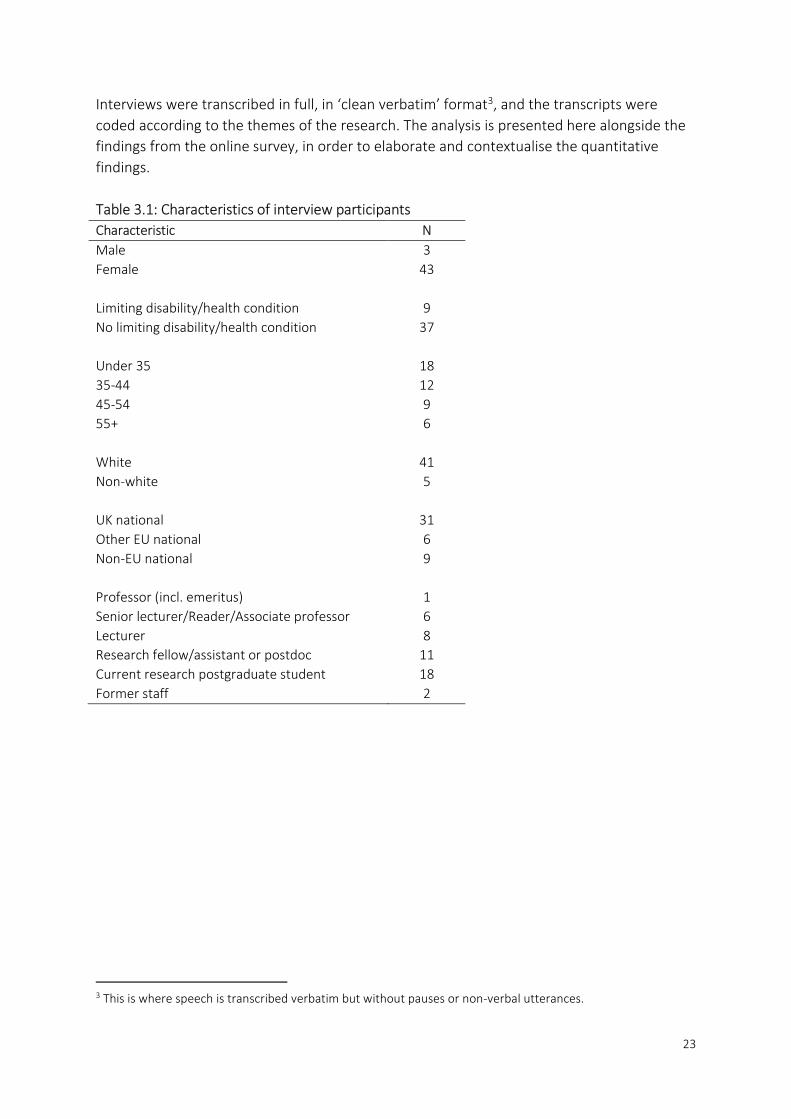
Interviews were transcribed in full, in ‘clean verbatim’ format3, and the transcripts were
coded according to the themes of the research. The analysis is presented here alongside the
findings from the online survey, in order to elaborate and contextualise the quantitative
findings.
Table 3.1: Characteristics of interview participants
Characteristic N
Male 3
Female 43
Limiting disability/health condition 9
No limiting disability/health condition 37
Under 35 18
35-44 12
45-54 9
55+ 6
White 41
Non-white 5
UK national 31
Other EU national 6
Non-EU national 9
Professor (incl. emeritus) 1
Senior lecturer/Reader/Associate professor 6
Lecturer 8
Research fellow/assistant or postdoc 11
Current research postgraduate student 18
Former staff 2
3 This is where speech is transcribed verbatim but without pauses or non-verbal utterances.

24
4. The composition of staff and research postgraduates
This chapter summarises the key findings of an analysis of the characteristics of academic
staff and research postgraduates in computer science (which is presented in full in Appendix
1). The analysis was conducted on a bespoke dataset obtained from HESA on academic staff
and research postgraduates, as outlined in Section 3.1. All data pertains to the academic year
2015/16.
4.1. Staff
Key findings:
Representation of…
o women was 22.7% - much lower than in the wider academic (45.3%) and
general (46%) labour markets
o those with a disability was 4.3% - comparable with the rest of academia (4.0%)
but lower than the labour force as a whole (10%)
o ethnic minorities was 22.3% - higher than the academic (14.5%) and general
(11%) labour market averages
Female representation among doctorate holders fell after age 30.
Men were twice as likely to be Professors.
Women were slightly less likely to be non-UK nationals. This was driven mainly by
differences at the Research Assistant level; non-UK nationals of both sexes became
more scarce at higher occupational levels.
Women were more likely to work part-time, particularly at the Lecturer and Senior
lecturer level.
Part-time working was most common among those aged over 55, but the largest
gender gap was among women in their 40s.
Women were more likely to be on a fixed-term contract, but the gap was small (less
than 2 percentage points), and there was no gender difference in length of tenure.
Women were more likely to be employed on a teaching-only contract, although the
gap was quite small (around 3 percentage points).
4.2. Students
Key findings:
The representation of women (26.1%) and disabled (6.7%) students was higher than
among staff, suggesting a disproportionate drop out of women and disabled students
in the transition from postgraduate to academia.
The research student body was considerably more diverse than staff with respect to
nationality; a minority of men were UK citizens (44.9%) and only a slim majority of
women (57.2%).

25
Among UK nationals…
o men were less likely than women to have tuition fee assistance. The
proportion of men and women with research council grants was about the
same.
o those with a disability were more likely to have assistance with their tuition
fees, and to have research council funding.
o there were notable ethnic disparities. White students were considerably more
likely to have tuition fee assistance, and more likely to have research council
grants, while two thirds of black students and half of Asian students had no
tuition fee assistance.
26
5. Findings from the online survey and interviews
This chapter presents the key findings from the online survey and interviews. Seven themes
were identified for the purposes of data collection (see Section 3.2), and findings were
analysed and presented under these headings, with a final section noting respondents’
thoughts on the issue of diversity in academic ICT research. A more comprehensive analysis
of the survey and interview data can be found in Appendices 2 and 3 respectively.
5.1. Motivation for pursuing an academic career
Survey respondents were presented with a variety of motivations for pursuing an academic
career, of which an interest in research was found to be the strongest motivator, selected by
81% of staff. There were two statistically significant differences between men and women;
men were significantly more likely to say they had pursued this career because they had
always been interested in technology (65%, compared with 51% of women), but women
were more likely to say it was because they wanted a challenging career (54%, compared
with 41% of men).
The overall ranking of motivations among students was similar to that found among staff,
with enjoyment of research a key factor. For students, the only significant gender difference
was that men were more likely to say it was because they had always been interested in
technology (74%, compared with 54% of women). These findings are consistent with what
previous literature has suggested – that men are more likely to have intrinsic motivations for
entering this career, while women are more attracted by the opportunities it offers for
intellectual challenge.
Among the former staff and postgraduates who responded to the online survey, only half
said they had initially pursued an academic career or postgraduate qualification in ICT
research because they had always been interested in technology, suggesting that lower
intrinsic attachment to technology may be a factor in dropping out. However, the proportion
who said they chose this path because they enjoyed research was also lower, at around 60%,
suggesting that this group may have been on average less interested in pursuing a research
career before they began. The link between people’s reasons for pursuing and leaving an
academic research career are arguably complex, and the data available here cannot draw
many firm conclusions in this respect.
In the qualitative sample, although some participants had come to the profession from a
longstanding interest in technology – often inspired by a parent or teacher – others had
moved from industry, or from other academic disciplines such as physics, maths or linguistics.
Some felt they had arrived almost ‘by accident’ in their academic careers – they had started
on this path and continued because they enjoyed it – while others had felt a strong calling
towards the intellectual or teaching aspects of the profession.

27
The survey data indicated that around two thirds of women had pursued a career in
academia because they wanted a challenging career, and this quote from an interview
respondent elaborates on this:
“I suppose it remains the closest you can get in the modern age to being a pioneer.
They’ve explored most of the earth already, and interspace travel just doesn’t seem to be
on the cards anytime soon, so the only place you can break new ground is in research and
academia. And the speed with which we are moving forward, especially in information
technology, is exciting and I guess I want to contribute my small bit to whatever comes
next.” (Interview respondent, female)
The implication of pursuing an academic career for the intellectual challenge is that a person
could be equally happy in an equally challenging role outside of academia, and indeed several
interview participants said that they would work anywhere that they could find the
intellectual challenge they sought. There is therefore a risk that negative aspects of the job
could be more likely to discourage those without a specific commitment to technology or
academia from pursuing or continuing their career.
“[Academia is] not necessarily the field that I want to stay in, because of the publication
pressure put on us, and focus on things that I don’t believe are worth focusing on.”
(Interview respondent, female)
The literature has suggested that women are more likely to drop out of academia if it is
incompatible with their goals and values, and there was evidence of this from the qualitative
data. Women may feel unhappy in an environment where they are expected to display
‘masculine’ characteristics (e.g. being driven and competitive).
“Female members of staff, they expect us to act in a way that a male would, so very
egotistically and very driven, very competitive, you know, all the sort of male
characteristics, and I think they find it puzzling that women have a different way of
approaching some things, and that doesn’t then play into what they see as a high-flying
researcher.” (Interview respondent, female)
5.2. Working conditions and expectations
Academic staff responding to the online survey were asked a number of questions about
their working conditions; the hours they worked, the expectations upon them, and how they
felt about this.
Staff were asked what hours they were contracted to work, and whether this was their
preferred arrangement. Part-time working was significantly more common among women
(18%) than men (8%). Working part-time was less likely to be a preferred option; 93% of
those who work full-time said this was their preferred arrangement, compared with 71% of
those who work part-time.

28
Respondents were also asked how many hours they worked in practice. There was no
significant difference between men and women in mean hours worked, once the differences
between full-time and part-time workers were accounted for, but among those contracted to
work full-time, men were more likely than women to work at least 50 hours a week (53%,
compared to 42% of women). There was no significant gender difference in the (minority)
proportion who reported ‘extreme’ working hours of 60 or more per week.
A feeling of working too many hours was found to be common but not universal; 57% of full-
time workers felt that they work too many hours, and there was no significant gender
difference in this respect. In the qualitative data, many respondents reported feeling that the
requirements upon them necessitated unreasonably long hours, due to competing teaching,
research and administrative pressures:
“I have way too much work to do within a reasonable amount of time, and I think there’s a
lot of pressure… I feel very squeezed in the number of hours that I have to do, and the
things that I’m required to do... And so I, you know, in practice I end up working closer to
60 hours a week on a good week, and more than that when there’s a deadline.” (Interview
respondent, female)
Some interview respondents felt this problem was exacerbated for women, because they
took on a disproportionate burden of ‘good citizen’ activities, such as outreach work. The
survey data suggested that women do not routinely work longer hours than men, therefore if
they are taking on these additional tasks, it may be at the expense of other activities that are
more important for career progression. These reports are consistent with the argument
made by Grove (2016) in the Times Higher Education that female professors pay a
disproportionate price to males by engaging more in “academic citizenship”.
“We are told that unless we do what we would call ‘citizenship duties’, that it will affect
promotion, however I know of several colleagues who [don’t do this] and still seem to be
promoted, and I would say are promoted over people who actually are good citizens
within their workplace… And it seems to be the female members of staff that are the ones
that take on a lot more of these good citizenship roles generally, probably at the expense
of their own research outputs and probably at the expense of their own health, but they
seem to have less of a capacity to say no to people, and so if we look at...most of the
outreach things that are done in this department are done by me and one or two other
female colleagues, whereas the guys just go ‘sorry I haven’t got time’, well we don’t
actually either but somebody’s got to do it.” (Interview participant, female)
Another interview respondent pointed out that it was a problem not having set hours:
“The problem I think with our job is that there is no clearly defined set of tasks you have to
do, especially when you do research… It’s open-ended, you can always do more and you
have to do more to stay at the forefront of research.” (Interview respondent, female)

29
Workload was an aspect of the job that a majority of online survey respondents reported as a
source of stress – 65% did so (i.e. rated this aspect at least 4 out of 5, where 5 was the most
stressful) – but there was no significant gender difference in this. Indeed, no gender
differences emerged at all with respect to the sources of stress presented to respondents.
Most stressful was felt to be the pressure to acquire funding (69%), while respondents were
least stressed about job security (37%). There were however, some other group differences
in sources of stress reported. Men with a limiting health condition or disability were
significantly more stressed about job security than men without, while women with a limiting
health condition or disability were more stressed about their workload than women without.
Ethnic minority men also reported higher levels of stress than white men with respect to
applying for funding, and the highest levels of reported stress were found among the 35-44
age group.
Staff online survey respondents were asked how satisfied they were with their job as a whole,
as well as specific aspects of it. High levels of satisfaction were reported with flexibility and
holiday entitlement (80% in both cases rated this at least 4 out of 5, where 5 represents the
most satisfied), less so with pay (45%), job security (56%) and career progression (41%). The
only statistically significant difference between men and women was satisfaction regarding
pay, with men less satisfied (41%, compared with 51% of women). In terms of other group
differences, men with a limiting health condition were less satisfied with their career
progression than men without, while older age groups were more satisfied with their job
security.
In order to explore the factors that might cause someone to leave an academic research
career, staff were asked about the extent to which different issues represented a challenge
to sustaining their academic career. There were a number of significant gender differences in
this respect. Women perceived job security, the travel expected and demands from students
as more challenging, while insufficient pay was more challenging for men. Figure 5.1 shows
the gender differences in the extent to which these aspects were rated as challenging (at
least 4 out of 5, where 5 represents a huge challenge).
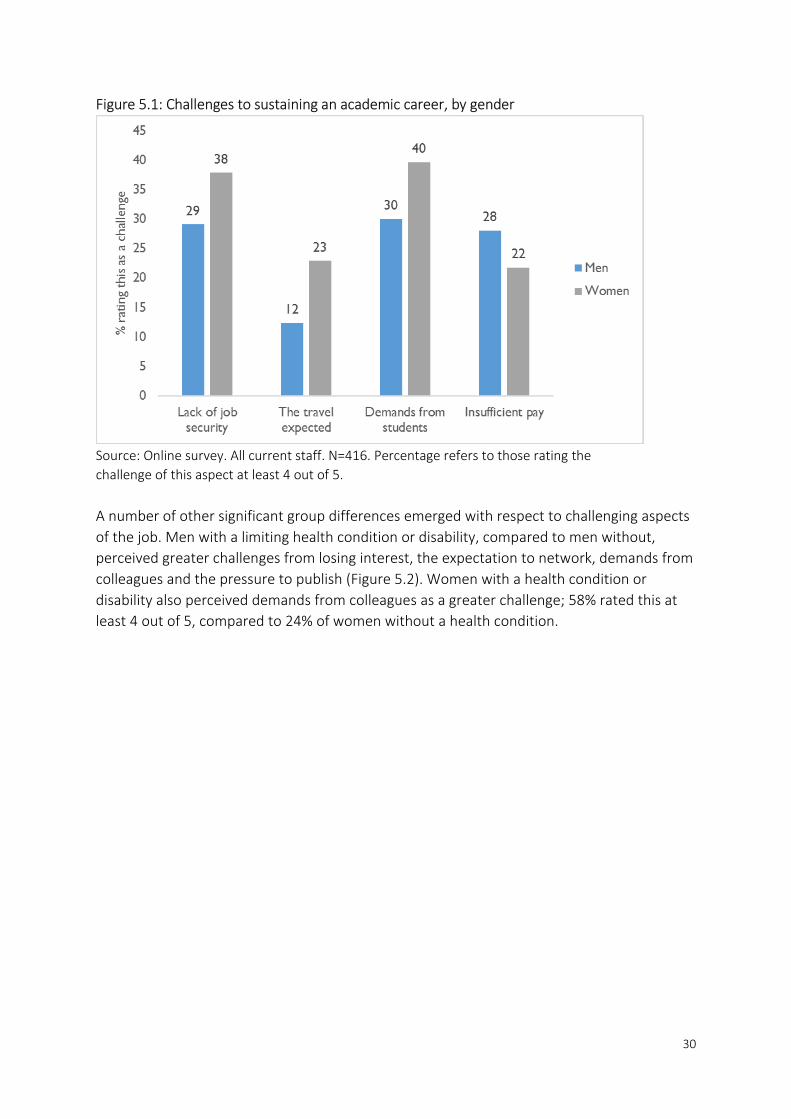
30
Figure 5.1: Challenges to sustaining an academic career, by gender
Source: Online survey. All current staff. N=416. Percentage refers to those rating the
challenge of this aspect at least 4 out of 5.
A number of other significant group differences emerged with respect to challenging aspects
of the job. Men with a limiting health condition or disability, compared to men without,
perceived greater challenges from losing interest, the expectation to network, demands from
colleagues and the pressure to publish (Figure 5.2). Women with a health condition or
disability also perceived demands from colleagues as a greater challenge; 58% rated this at
least 4 out of 5, compared to 24% of women without a health condition.

31
Figure 5.2: Challenges to sustaining an academic career, by disability status – men
Source: Online survey. Current staff, men only. N=242. Percentage refers to those rating the
challenge of this aspect at least 4 out of 5.
Ethnic minority men perceived a number of factors to be more challenging than white men
did (Figure 5.3); travel, the expectation to network, the lack of job security, insufficient pay,
the hours expected, and the pressure to acquire funding. Ethnic minority women also
perceived pay (47%) to be a greater challenge than white women did (18%).
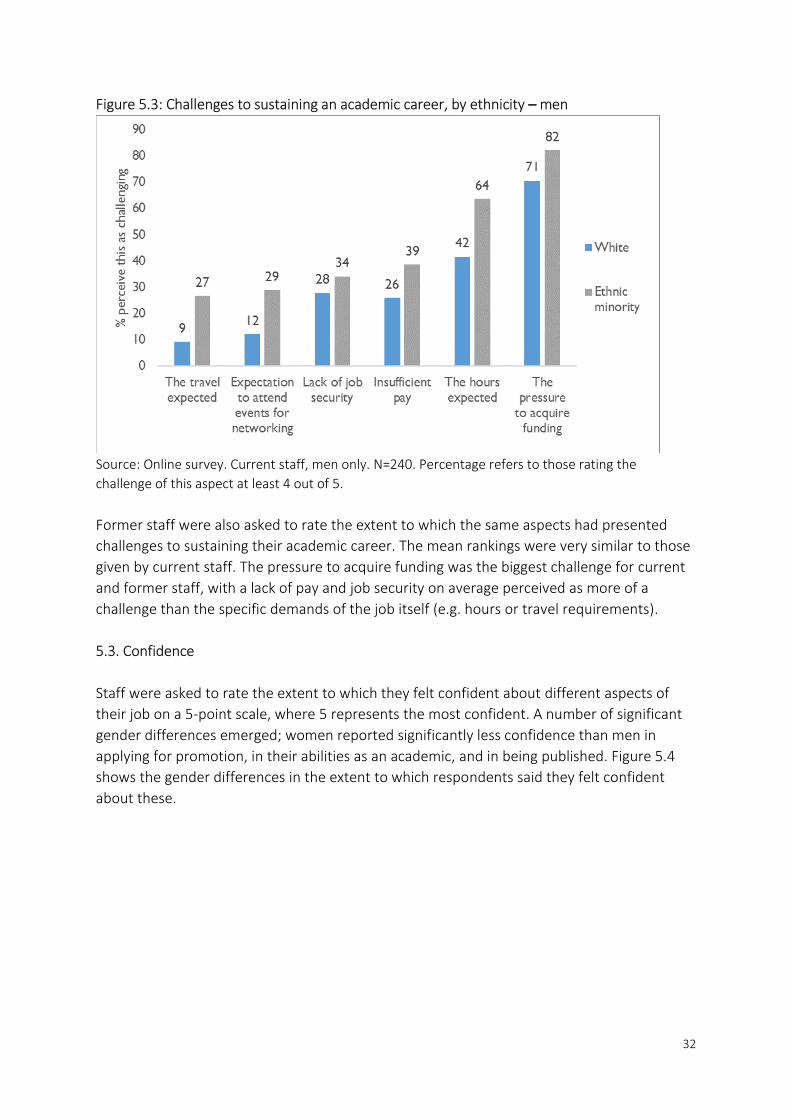
32
Figure 5.3: Challenges to sustaining an academic career, by ethnicity – men
Source: Online survey. Current staff, men only. N=240. Percentage refers to those rating the
challenge of this aspect at least 4 out of 5.
Former staff were also asked to rate the extent to which the same aspects had presented
challenges to sustaining their academic career. The mean rankings were very similar to those
given by current staff. The pressure to acquire funding was the biggest challenge for current
and former staff, with a lack of pay and job security on average perceived as more of a
challenge than the specific demands of the job itself (e.g. hours or travel requirements).
5.3. Confidence
Staff were asked to rate the extent to which they felt confident about different aspects of
their job on a 5-point scale, where 5 represents the most confident. A number of significant
gender differences emerged; women reported significantly less confidence than men in
applying for promotion, in their abilities as an academic, and in being published. Figure 5.4
shows the gender differences in the extent to which respondents said they felt confident
about these.

33
Figure 5.4: Confidence with selected career aspects, by gender – academic staff
Source: Online survey. All current staff. N=395. Percentage refers to those rating their confidence
with this aspect at least 4 out of 5.
Confidence was also an issue for men with a limiting health condition or disability, who
expressed lower confidence across all aspects apart from their teaching abilities, compared
to men without a health condition. Ethnic minority women were found to be less confident
about applying for grants; just 23% said they felt confident about this, compared with 46% of
white women.
Students were also asked to rate the extent to which they felt confident about different
aspects of being a research postgraduate. Women reported feeling less confident about
finding a job after completing their studies, their abilities as an academic and being
published. No gender difference was found with respect to confidence in teaching abilities.
Figure 5.5 shows the gender differences in the extent to which respondents said they felt
confident about different aspects.
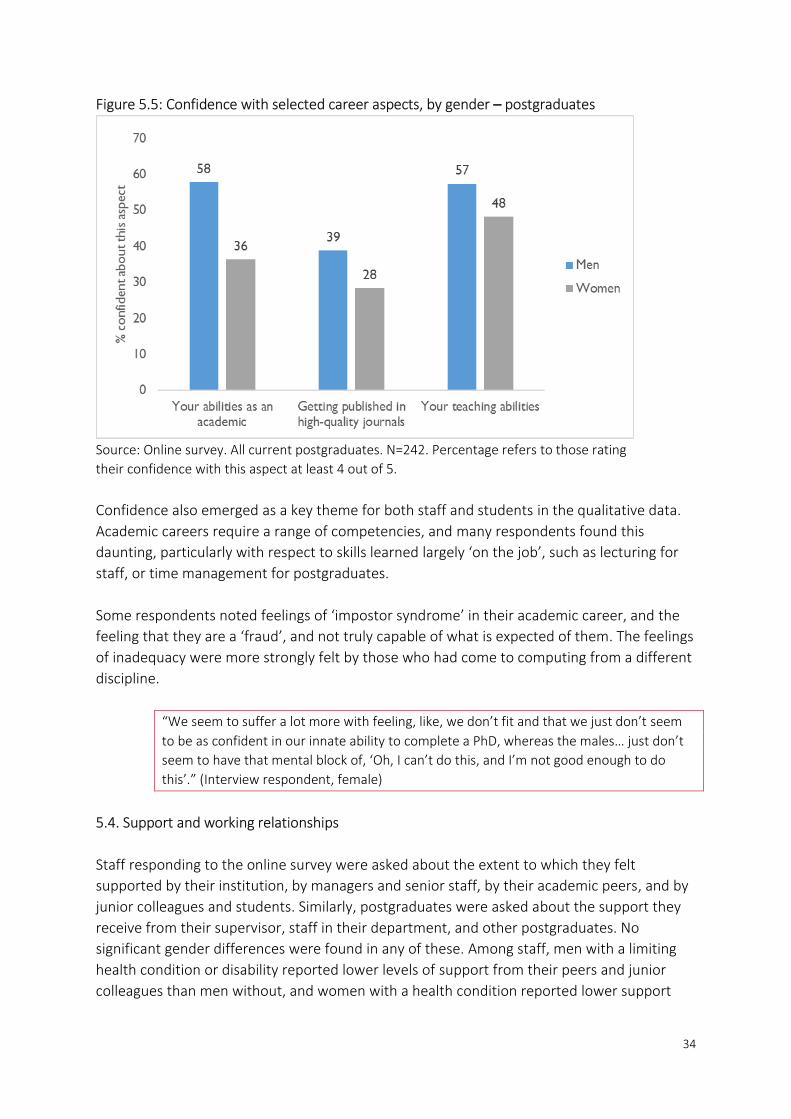
34
Figure 5.5: Confidence with selected career aspects, by gender – postgraduates
Source: Online survey. All current postgraduates. N=242. Percentage refers to those rating
their confidence with this aspect at least 4 out of 5.
Confidence also emerged as a key theme for both staff and students in the qualitative data.
Academic careers require a range of competencies, and many respondents found this
daunting, particularly with respect to skills learned largely ‘on the job’, such as lecturing for
staff, or time management for postgraduates.
Some respondents noted feelings of ‘impostor syndrome’ in their academic career, and the
feeling that they are a ‘fraud’, and not truly capable of what is expected of them. The feelings
of inadequacy were more strongly felt by those who had come to computing from a different
discipline.
“We seem to suffer a lot more with feeling, like, we don’t fit and that we just don’t seem
to be as confident in our innate ability to complete a PhD, whereas the males… just don’t
seem to have that mental block of, ‘Oh, I can’t do this, and I’m not good enough to do
this’.” (Interview respondent, female)
5.4. Support and working relationships
Staff responding to the online survey were asked about the extent to which they felt
supported by their institution, by managers and senior staff, by their academic peers, and by
junior colleagues and students. Similarly, postgraduates were asked about the support they
receive from their supervisor, staff in their department, and other postgraduates. No
significant gender differences were found in any of these. Among staff, men with a limiting
health condition or disability reported lower levels of support from their peers and junior
colleagues than men without, and women with a health condition reported lower support

35
from their junior colleagues than women without. Ethnic minority students felt less
supported by their postgraduate colleagues than white students did.
Respondents were also asked about the quality of their working relationships. For staff, no
significant gender differences were found, and in general relationships were reported to be
fairly good, with 70% agreeing that they had good working relationships with managers and
peers, and 81% that they had good working relationships with junior colleagues. The only
significant group difference found was that men with a limiting health condition or disability
were less likely to agree that they had a good working relationship with their peers than men
without.
Among students, men were more likely to agree that they had a good relationship with their
supervisor (90% agreed, compared with 82% of women), but there were no gender
differences with respect to working relationships with the academic staff in their department,
or with other postgraduates. Postgraduates aged 35 and over were less likely to say they had
a good working relationship with other postgraduates, but no differences were found with
respect to disability or ethnicity.
Survey respondents were asked about the extent to which they felt isolated in their
department, and if they felt or looked different from their colleagues. A substantial minority
reported feeling isolated (25% of staff and 23% of students), but there were no significant
gender differences in this. Among staff, women were more likely to report that they looked
different from the others in their department (40% agreed, compared with 21% of men).
Men with a health condition or disability were more likely to say they felt isolated (42%) than
men without (21%), and to say that they looked and felt different. Ethnic minority men were
also more likely to say that they looked different.
An interview response gives further insight into these feelings of isolation and difference:
“The group that I work with at [University], I work with two people very closely and it’s not a
clash, it’s just that they are a lot more similar and I’m very different to both of them and I get
left out, pushed aside. I’ve had my ideas stolen. I’ve not been given opportunities that other
people are given. I bring up things and they get ignored. I get talked over. It’s not a clash, we
can get along fine. We can all go to the pub together and socialise but, again, it’s just not the
environment that’s good for me to move up in. I’ll never move up in this situation and I’m not
happy. I’m not fine with that.” (Interview respondent, female)
Among students, women were more likely to agree that they felt different to others in their
department (46% agreed, compared with 29% of men), and to say that they looked different
(30% agreed, compared with 10% of men). Those aged 35 and over were more likely to say
that they felt different.
These findings suggest that on the whole, female staff and students integrate well into their
departments and get on with colleagues at different levels, but that they do perceive subtle

36
differences between themselves and the men in their department. This was also found in the
qualitative data, with participants largely feeling well integrated, but noting the impact of
more intangible feelings of difference.
“People are generally, you know, really friendly towards me but I still, although I’m
included, I do get treated a bit differently. Maybe, like, the attitudes towards me are a
little bit different than to everyone else… Maybe it’s just me being paranoid, but I just feel
like I stand out a little bit.” (Interview respondent, female)
High quality personal connections may be important for career progression, but some
interview participants expressed concern that they were unable to fully participate in
networking due to their background. One respondent felt excluded by the men in her
discipline, while another noted the impact of his autism on being able to participate in this
type of activity. Another issue raised, both in the interviews and via open responses to the
online survey, was the issue of ‘pub culture’, which could be inaccessible for those who did
not feel comfortable in this environment (e.g. due to religious beliefs), or to those with caring
responsibilities.
“There is a disturbing drink culture that includes post-meeting/lecture "networking" drinks
and post-work visits to the pub.” (Online survey respondent, female)
“People always select evening- pub events to socialize. I have to pick children from
childminder and I do not consume alcohol nor enjoy being in that setting. So I did feel
excluded.” (Online survey respondent, female)
An issue that has arisen in the literature is that women in STEM may find it harder than men
to be perceived as competent and likeable by colleagues. In fact, staff responding to the
online survey were asked about the extent to which they believed their peers and senior staff
perceived them as such, and no gender differences were found with respect to this.
However, some interview participants, as well as those leaving responses to the open
questions in the online survey, noted examples in which their competence was not
questioned directly, but colleagues behaved in a way that suggested they perceived them as
less competent. Common experiences included being interrupted more frequently by male
colleagues, having their answers double-checked when provided to ensure they were
accurate, or having basic things explained unnecessarily to them.
“Yes on numerous occasions, definitely, always challenged, always questioned by men,
and one of the things that really used to annoy me is that when they would ask you a
question and you would give them the answer, and then they would go and check up with
somebody else to see whether your answer matched their answer, and quite often they’d
do it in front of you.” (Interview respondent, female)
There were however, some significant gender differences in how respondents felt they were
perceived. Women were significantly less likely to feel they are perceived as brilliant, which is

37
consistent with the issues raised here with respect to confidence. They were also more likely
to feel they are perceived as reliable, which perhaps relates to the suggestion above that
they are more likely to take on ‘good citizen’ roles. Figure 5.6 shows the gender differences in
the extent to which respondents agreed they were perceived to have these characteristics
(i.e. rated them at least 4 out of 5, where 5 implies that they definitely are perceived in this
way).
Figure 5.6: Those who feel they are perceived as brilliant, and reliable, by gender
Source: Online survey. All current staff. N=406. Percentage refers to those rating their
agreement at least 4 out of 5.
5.5. Caring responsibilities and flexible working
34% of staff responding to the online survey reported having caring responsibilities for a child
or elderly or disabled adult; 41% of women and 28% of men. Respondents with caring
responsibilities were asked to rate on a five-point scale the extent to which they felt that
their academic work interfered with their caring responsibilities; just over half rated this at
least 4 out of 5 (where 5 represents a great deal of interference), with only 6% saying it did
not interfere at all. There was no statistically significant gender difference in this respect.
Among students responding to the online survey, 15% had caring responsibilities; 20% of
women and 11% of men. As with staff, just over half of those with caring responsibilities
rated the extent to which their academic work interfered with these at least 4 out of 5, with
no significant gender difference.
Staff were also asked whether they had made use of flexible working provisions (beyond the
flexibility generally accessible to staff), or had taken a career break (including time off to care
for dependents). Women were more likely to have made use of flexible working; 35% had

38
done so, compared with 21% of men. Women were also more likely to have taken a career
break; only 8% of men had done so, and two fifths would rule it out altogether, compared
36% of women who had taken a career break and only a quarter said they would not do so.
Among those who had made use of flexible working, it was found that women were more
likely to feel that it had a negative impact on their promotion prospects and their productivity
as a researcher, and the same was the case for those who had taken a career beak. Figure 5.7
shows the gender differences in perceptions of impact (i.e. those who rated this at least 4 out
of 5, where 5 represents a huge impact), among those who had taken flexible working or a
career break.
Figure 5.7: Perceived impact of making use of flexible working provisions, and taking a
career break, by gender
Source: Online survey. All current staff who have taken up flexible working provisions or taken a
career break. N=118. Percentage refers to those rating the impact at least 4 out of 5.
Among those who had not made use of flexible working but said they might in future, women
were more likely to be concerned at the impact on how others at work perceive their
competence, but not on their own performance. Of those who had not taken a career break
but might do so in future, women were more concerned than men about the impact this
would have on their promotion prospects and productivity, but not on how others would
perceive them.
The tension between academic and caring responsibilities was a key theme in the qualitative
data, and there was a strong perception among interview participants that those with caring
responsibilities are disadvantaged in the long-hours culture of academia. Indeed, many saw
this as the key, or in some cases only, difference in their experience as a female academic

39
relative to their male counterparts, and most struggled to think of fathers in their
department who had experienced these issues to the same degree.
In addition to being unable to put in the excessive hours required, caring responsibilities were
an issue for participants in being able to attend seminars or social events if these were
scheduled after school pick-up times. Many felt they were missing out on academic and
social opportunities for this reason. Postgraduate student respondents also cited the
difficulties in attending intensive and/or residential courses when they had caring
responsibilities.
“Events often happen in the later afternoon and early evening which are the times that are
difficult for me to do. I don’t think people are intentionally excluding, but it is a common
problem that if you’ve got to get back for children you can’t do those events… The way
that I’ve felt not included in the department is because of me not being able to be at
group events, whether they are academic or social. A classic example is that there will be a
late afternoon seminar…and people say we’ll go to the pub afterwards, and even if I can
come to the seminar, I can’t come to the pub afterwards and that’s where the soft
networking stuff goes on and it’s frustrating.” (Interview respondent, female)
On the other hand, interview participants also noted that their job, or being a postgraduate
student, provided them with a valued source of flexibility in their family lives. However, the
disadvantage of this was the difficulty in drawing boundaries between work and home, and
often working late into the evening. Some interview participants had managed to negotiate
alternative working arrangements that suited them (e.g. part-time or remote working), but all
felt they had paid a price for this; for example having to accept a job at a lower level, or being
looked upon unfavourably around promotion time.
“I think you can’t have it all, unfortunately, and I think I have suffered because I took that
decision and I have had to say no to things… I think it’s a gradual erosion process and you
don’t really notice it’s happening for quite a long time, and then you look at colleagues
who are working full-time and you think, actually, they’ve been able to say yes to
everything.” (Interview respondent, female)
Finally, it is worth noting the issues that some participants experienced around taking, and
returning from, maternity leave. For those with research grants and students, it was difficult
to step away from these, both practically and in terms of feeling guilty about abandoning
them and leaving their equally busy colleagues to take them on. It can also be difficult to re-
establish research on returning to a full teaching load.
5.6. Discrimination, harassment and aggression
Around 30% of staff felt they had experienced discrimination during a recruitment process.
There was no statistically significant gender difference in this respect. However, female staff
were more likely to say they had experienced harassment or bullying (49%, compared to 34%

40
of male staff), and that they had experienced ‘micro-aggression’4 – i.e. felt excluded or
inferior due to remarks made by their colleagues (67% of women, compared to 42% of men).
Thus, although bullying and micro-aggression were revealed to be widespread phenomena,
they were experienced disproportionately by women.
Those with a limiting health condition were more likely than those without to say they had
experienced all three of these, and ethnic minority staff were more likely to feel they had
been discriminated against in a recruitment process. Apart from this there were no
significant differences that would suggest greater experiences of discrimination, bullying or
micro-aggression among ethnic minorities, those of different religions or ages, or those who
are not heterosexual.
Only around 13% of postgraduate students felt they had been discriminated against in a
recruitment process for postgraduate study, with a slightly higher but still fairly low
proportion reporting that they had been bullied or harassed (16%). There were no significant
gender differences with respect to either of these. However, female postgraduates were
more likely to say that they had felt excluded or inferior due to remarks made by their
colleagues (54%, compared with 20% of male postgraduates).
The qualitative responses to the online survey presented numerous examples of the
discrimination experienced by women in their academic careers. Particularly notable were
examples of discrimination based on maternity leave – or potential maternity leave.
“Expressions of interest were requested for an internal role. I was the only one who
responded. Was told that someone else was invited to job share it with me in case I
‘became pregnant again’.” (Online survey respondent, female).
Female survey respondents also reported instances of sexual harassment, as well as direct
and indirect sexism. Examples from the online survey included:
“When I started my PhD, in my office of nine men, most of them had page 3 girls as screen
savers, and they would make sexual comments about pretty much every female PhD
student in the dept. I was also propositioned quite a lot.” (Online survey respondent,
female)
“Sexual harassment online from other students who are part of the same doctoral training
centre… Being threatened and called a snitch when complaints have been made of sexual
harassment (although the complaints were not from me).” (Online survey respondent,
female)
“A colleague telling me that women only get appointed to jobs because of reverse
discrimination.” (Online survey respondent, female)
4 This term was not used in the survey question presented to respondents, but is used here in the reporting of the results.

41
More prevalent within the qualitative data were experiences of sexism that many of the
participants felt were not at the level of harassment or discrimination. There was a
reluctance to identify these incidents as sexism. Many of the respondents might recount an
incident, but would either preface this by saying their experiences were “nothing direct” or
“quantifiable”, or qualify their statement by saying that they could not be sure it was due to
sexism.
Participants also noted a divide between the ‘softer’ sub-disciplines, such as Human
Computer Interaction and Information Science, which tend to have more female staff, and
those in the more male-dominated ‘harder’ computer science disciplines, and some
negativity from men in the latter:
“[With my sub-discipline] there’s always an element of ‘it’s not the technical side of
computer science therefore she’s a second class citizen’, there’s still some dinosaurs that
have that attitude, and therefore you’re maybe not seen as being technical by some
people and therefore they look down on some of the work you do.” (Interview
respondent, female)
“I used to joke, in a sort of half-hearted way, that every time I stood up in a department
seminar and gave the topic of what I was working on, a lot of men would stand up and tell
me that my problem didn’t exist or that they’d already solved it” (Interview respondent,
female)
A small number of participants engaged in teaching cited their experiences with
undergraduate students as a source of problems. Within these discussions, participants
would highlight that these classes are themselves male-dominated environments and would
sometimes lead to experiences of sexism or having their competence questioned.
5.7. Future career
Staff
There was no significant difference between men and women with respect to how far they
would be willing to move if the opportunity arose to progress in their career. Most would be
willing to move institution, just over half said they would be willing to move to a different
city, and around two fifths said they would be willing to move to a different country.
Respondents were asked how likely they were to consider leaving their academic research
career for other types of job, but this was largely considered unlikely, and there were no
significant gender differences in these attitudes. The most popular option was a research
career in another sector, with 30% of respondents indicating that it was likely they would
leave academia for this kind of job (i.e. rated this likelihood at least 4 out of 5, where 5 was
the most likely). Only 12% thought it was likely they would leave for a job within higher
education but not research, and 19% for a job not in higher education or research. Men with

42
a limiting health condition reported a higher likelihood that they would seek another job in
higher education, or outside of research or higher education altogether, compared to men
without a health condition. Seeking a research job in a different sector or outside of research
or higher education altogether were also cited as more likely by younger staff. In the
interviews, early career staff (e.g. those at the postdoctoral level) noted the difficulty of
moving from short-term research positions and permanent lecturing posts, with many
arguing that it is difficult to meet the requirements for permanent posts while in fixed-term
low level research posts.
Academia was considered to offer a number of advantages over other types of job; a majority
of respondents to the online survey felt that academia offered the most to them in terms of
personal interest, depth, autonomy, range of tasks, innovation and job security. A research
career outside of academia was thought to offer a better salary and work-life balance. This
was true for both men and women, with no significant gender differences.
These findings suggest that any frustration expressed by academics with respect to their jobs
should be taken in the context of a generally low desire to leave, and highlight the tension
between the pecuniary and non-pecuniary aspects of the job. Many interview participants
noted that the choice of an academic career amounted to a trade-off, between autonomy
and money, and choosing the academic career was a choice to allow themselves more
freedom or flexibility despite the lower pay compared to industry.
“Well, I think you basically sacrifice pay for freedom of being able to study things that are
interesting to you, and that certainly was why at the moment.” (Interview respondent,
female)
Salary was an issue that arose frequently in interviews when discussing the relative
attractions of academia compared to industry. Although most survey respondents believed
that industry offered better work-life balance, some interview participants noted that this
was dependent on which company you worked for. Start-ups, or large American tech firms,
were not necessarily considered better places to work, due to the dedication and working
hours typically expected in such companies.
Although most online survey respondents felt that academia had the most to offer them in
terms of personal interest, a minority of participants wondered if they might have more
opportunity in industry to pursue the ‘real life’ application of their research that they wanted.
This especially applies to women who were seeking to make their research more impactful
and applicable.
Former staff responding to the online survey were offered an open response to state the
main reason they left academia. Of the 14 responses to this question: four pertained to stress
or overwork; three to the actions of management or senior staff; three to job security or lack
of funding; three to a lack of opportunities where they were or more interesting
opportunities elsewhere; and one to the incompatibility of academia with having children.

43
Thus, even from this small sample of responses, it is clear that there is a range of reasons why
someone might leave an academic career, which will vary according to individual
circumstances and preferences.
Students
There was no significant gender difference with respect to how likely postgraduates felt they
were to seek an academic job after they completed their studies. The response to this
question is shown in Figure 5.8. Around half said this was likely, with only 9% stating they
definitely would not, and the remainder more ambivalent. There were no significant
differences with respect to ethnicity or health condition or disability, but postgraduates aged
35 and over were more likely to seek an academic career than those under 35.
Figure 5.8: Likelihood of postgraduate students seeking an academic job after
completing their studies
Source: Online survey. All current postgraduates. N=243.
Those who had not ruled out an academic position were asked how far they would be willing
to move to take one up. Again, there were no significant gender differences in this respect.
Around three quarters said they would move to a different city, and three fifths were willing
to move to a different country. However, interview participants noted the complication of
the ‘two-body’ problem of two professionals – in some cases two academics – seeking jobs in
the same location.
All students were asked in the online survey how likely they were to seek different types of
job after completing their postgraduate studies, and there were no gender differences with
respect to these intentions. As with staff, the most popular option was a research career in
another sector, with 52% of students indicating, that it was likely they would seek this kind of
job (i.e. rated this likelihood at least 4 out of 5, where 5 was very likely). 18% thought it was

44
likely they would leave for a job within higher education but not research, and 32% for a job
that is not in higher education or research.
Students had slightly different perceptions to staff with respect to which type of job offered
them more. Like staff, students felt that academia offered the most in terms of personal
interest, depth and autonomy, and research outside of academia offered a better salary and
work-life balance. However, unlike staff, students perceived greater opportunities for
innovation and range of tasks in research outside of academia, as well as greater job security.
There were no statistically significant gender differences in these attitudes.
Students were therefore somewhat less committed to pursuing an academic career or less
convinced of its advantages, than staff. Among interview participants, the key disadvantages
that affected plans to stay in academia were the lack of a clearly defined career path and the
lack of permanent jobs. The early stages of an academic career were perceived as challenging
and competitive, and perhaps just too all-consuming, even by those who wanted to stay in
academia, and this was something that put people off.
“There is still the attitude that your work is more than a job and it’s your raison d’être and
everything else gets pushed to the side lines.” (interview participant, female)
5.8. Diversity
In the interviews and open survey responses, respondents raised a number of issues
pertinent to the research theme of increasing diversity in academic computer science, and it
is worth presenting some of these with respect to their perceived barriers to diversity, and
attitudes towards diversity endeavours to date.
Existing attempts to address diversity in academic STEM subjects were the subject of some
backlash. Some female respondents noted being on the receiving end of this, with
experiences of being told by male staff that they only got a job or promotion because of
reverse discrimination. Perhaps internalising this discourse, some expressed discomfort with
particular initiatives aimed at women on the grounds of wanting to compete on an equal
playing field rather than attract attention as a ‘special case’. A handful of male respondents
said that they saw diversity initiatives as ‘special treatment’ that was in fact discriminating
against them. These respondents also tended to dismiss or trivialise the idea of
discrimination or micro-aggression; that it existed, or that it had an impact on other people’s
experiences, or that it was a legitimate target for intervention rather than ‘just life’.

45
The general feeling among most female respondents was that their male colleagues were
broadly supportive of attempts to improve diversity, but although they did not actively resist
it, they did not necessarily appreciate the need to address it directly:
“But the male staff are all saying, “Oh, yes, yes, you know, we’re very equitable minded,”
and all the rest of it, but I don’t think they understand the difference between personally
kind of advocating that this should be done and the changes which have to be made.”
(Interview respondent, female)
The onus on addressing diversity tended to fall upon women, taking further time out of their
teaching and research time for this specific kind of academic citizenship activity:
“Because I am a female in STEM I am expected to spend some part of my time working on
the women in STEM issue. The expectation is quite explicit to the point where people will
not accept ‘no’ as an answer, but my male colleagues are never even asked. Through my
whole career I have spent countless hours on the topic at the expense of personal
research and growth goals. As I write this I am in the middle of sorting out a cake for an
Athena SWAN event while the guy in the next office is writing a grant ... And yes it is
10pm.” (Online survey respondent, female)
Furthermore, not everyone felt that initiatives such as Athena SWAN really captured their
experience as a woman in STEM. As one respondent put it:
“I feel like I fill out these surveys, I give my input and I know other people are having the
same experiences and I share my opinion honestly, but I feel like we’re winning all these
awards for being very open and I’m wondering how. Most of the women I’ve known in
academia within the department, they’ve had issues with very similar things to me so I’m
wondering how we can say we’re very cultured and cutting edge in terms of equality and
at the same time everyone’s experience is the same.” (Interview respondent, female)
Finally, some respondents suggested that diversity is hindered by a prevailing ‘this is how we
do things here’ attitude, which is hostile to those who do not fit the existing mould:
“They don’t quite see… that there is a different way of doing things and that women do
things differently, and you can achieve the same end through different ways.” (Interview
respondent, female)
“You have to constantly fight to have your voice heard and that’s exhausting. Especially
when you feel like you’re constantly pushed back and somebody says that’s not a valid
opinion.” (Interview respondent, female)

46
6. Discussion and conclusion
6.1. Key findings
Motivation for pursing an academic career
Understanding the motivation to pursue a career in academia can help explain why women
drop out. Women’s motivations for entering a career in academic ICT research are more
likely than men’s to be instrumental (i.e. as an intellectual opportunity), while men’s are
more likely than women’s to be intrinsic (i.e. a longstanding interest in technology). A person
with neither an inherent interest in technology nor a particular commitment to academia
may be more vulnerable to leaving academic ICT research if their job is causing them stress,
or is inconsistent with their goals and values.
Working conditions
Poor working conditions in academia are due to a long-hours culture and many competing
responsibilities from different sources. Some of these pressures may represent a greater
challenge to women, and to those with a limiting health condition or disability, in continuing
with their academic career. Women may also be more likely to take on additional tasks,
particularly ‘good citizen’ activities, which can then displace other more prestigious or career
enhancing activities.
Confidence
Confidence is a key issue – women exhibit less confidence across a range of tasks, at staff and
postgraduate level. This is particularly true for ethnic minority women. Someone already
struggling with confidence may be more easily discouraged from continuing in academia.
Support and working relationships
Good working relationships and feeling supported by colleagues are key sources of job
satisfaction and could foster retention. However, informal social events outside working
hours can present barriers and exclude people from developing work relationships. In
particular, ‘pub culture’ is often portrayed as a relaxed way of encouraging sociality, yet the
need to fit this around caring responsibilities or the presence of alcohol may obviate
participation. Around a quarter of staff and students reported feeling isolated within their
department, and women, ethnic minorities, those with a limiting health condition or
disability, and older postgraduates were more likely to notice a feeling of ‘difference’
between themselves and others in their department.
Caring responsibilities
Jobs, promotions, and funding are awarded based on the applicant’s accomplishments, but
this advantages a certain type of person, who both wants and is able to dedicate excessive
time and attention to the job. This is impossible for someone who has caring responsibilities,
which impose hard boundaries on the amount of time that can be spent on work. The tension
between caring and academic responsibilities was experienced in a similar way among male

47
and female survey respondents. However, women were more likely to have caring
responsibilities, and to have made use of flexible working arrangements, or taken a career
break, and a disparity was noted in the qualitative data between female and male
experiences of reconciling caring responsibilities with academic jobs. Absence from work due
to maternity leave can be difficult to manage for those with research grants or supervisory
responsibilities, and on returning to work it can be difficult to re-establish research activity at
the same time as resuming a full teaching load.
Discrimination
Discrimination and negative attitudes exist and need to be challenged. While discrimination
and harassment examples were widely reported in the online survey, interviews placed an
emphasis on the ‘indirect’ or ‘unquantifiable’ perceptions of sexism. Women in the research
recounted various instances of their competence being questioned in ways their male
colleagues do not experience. Universities’ attempts to address diversity issues may not be
successful if they cannot challenge these subtle and informal mechanisms of discrimination.
Future career plans
Most see many positives about their career, but with some ambivalence about its demands,
and an attractive offer from industry could tempt them away – particularly for students and
early career researchers. A career in academia is seen as a trade-off, with less pay and
security traded for greater autonomy and more interesting work.
Future planning is restricted by caring responsibilities, partners’ jobs and location of family.
Short term contracts and the need to be mobile in pursuing postdoctoral opportunities were
also found to be restricting future plans.
The younger age groups responding to the survey were particularly sceptical about pursuing
an academic career. This will be to some extent a selection effect – it would not be expected
that all postgraduates or early career staff would wish to continue in academia in the long
term. However, this appeared to be more than simply not wanting an academic career; this
group had clear reservations about career progression and working conditions. Bridging the
gap between postdoc and lecturer is important; respondents reported a lack of confidence or
a lack of sufficient experience to advance. A conflict exists between research and teaching for
the early career researcher. A lack of teaching experience for ECRs mean that they may be
unable to access permanent positions, while the most accessible role for many are teaching
fellowships which can result in a lack of research and result in a ‘dead end’.
Diversity
Existing attempts to address the issue of diversity in STEM have attracted some backlash,
which was evident in the comments of some male respondents to the online survey. Female
respondents reported being on the receiving end of this; for example, being told they had
only succeeded due to reverse discrimination. However, the general feeling was that most of
their male colleagues accept the need to increase diversity, but are less aware of the need to
take positive action to achieve it.

48
Some respondents felt that existing initiatives such as Athena SWAN were not necessarily
picking up on all facets of women’s experiences that make their time in academia more
difficult; for example, feelings of isolation or experiences of micro-aggression. There was also
a feeling that it is mainly female staff who are shouldering the administrative burden of these
initiatives.
Finally, some respondents perceived greater scope for diversity of thought or approaches,
and that there is an inflexible mindset in academic computing that is in part responsible for
reproducing existing characteristics within the academic computing population.
6.2. Recommendations
It is evident from the findings that there exist measurable differences in the career progress
and day to day experience of different groups in academic computer science; these
differences are apparent between men and women, those with a health condition and those
without, those with caring responsibilities and those without, and those from ethnic minority
and non-minority backgrounds. These findings are persistent in research on academia, but
the phenomenon is also widely present across the labour market. Career disadvantage is to
some extent due to factors such as caring responsibilities, which disproportionately fall to
women, or poor physical or mental health, both of which preclude full involvement in the
labour market or in study. In academia, additional factors may also be at play; for example,
there is evidence that women take on a disproportionate burden of ‘good citizen’ activities
and, perhaps ironically, of the work involved in diversity initiatives such as Athena SWAN,
which may displace time for writing research papers and funding bids. These factors all have
the effect of reducing the hours that a person can commit to accumulating the experience
and outputs that are valued by promotion panels and funding bodies as evidence of
competency.
It is however difficult to challenge this ‘merit’ based system and level the playing field. It
might be possible to adjust funding or promotion criteria in a way that recognises the uneven
opportunities that individuals have to accumulate outputs and experience. Another route
might be to establish positive discrimination measures, such as targeted funding schemes, or
establishing quotas of particular groups in the allocation of funding or promotions. However,
this could be controversial, potentially stigmatising those from the disadvantaged groups,
and lead to accusations of tokenism.
Expressions of disadvantage are also manifest amongst women and some minority groups for
less tangible facets of their academic careers, such as feeling of (dis)satisfaction, confidence,
security and isolation, perceptions of inadequacy and feelings of stress. These observations
are applicable to postgraduates as well, and continue or even grow as they develop their
careers as lecturers or researchers. This is leading to a loss of skills and the agenda being set
by the mainstream hegemony, which is not conducive to diversity. Feeling disengaged from,
or lacking coherence with, one’s institution is considered to be a promoter of dissatisfaction

49
and exclusion (Oshagbemi, 1997a; Kinman, 2008; Bos et al., 2009). These issues are also
exacerbated by having a subordinate place in the hierarchy (Oshagbemi, 1997b).
In light of these findings, it could be argued that a systemic approach is needed to address
these less tangible aspects. All agents in the system need to develop a recognition of the
problem and do something about it. The principal agents in this system are the HEIs
themselves. Many HEIs and research institutions have realised that they are high performing
workplaces, in which staff are their greatest asset, and they have endeavoured to introduce
leadership commensurate with high performing workplaces and to have a more engaged
workforce (Manville et al., 2015). Training schemes are promoted, communication between
those of different organisational status is encouraged, and interlinked high function teams
are advocated and given autonomy. This activity has led to some improvements (Deem,
2003). Perhaps interventions are best made earlier (e.g. during doctoral study) to build
confidence as well as skills.
However, HEIs especially remain highly hierarchical in terms of management structure and
appear status ridden (Reskin and Roos, 1987). There is little evidence that staff engagement
activities have created a culture of cooperation and respect between management and
colleagues that would boost and sustain creativity, innovation and excellence. Thus our main
recommendation is that those who govern and lead HEIs and research institutes attend to
the findings which have emerged from this report and redouble efforts to make HEIs and
research institutes more inclusive bodies and become exemplars to the rest of society. This
we believe can be achieved through better leadership, and HEIs and research institutes
adopting the attributes of high perfuming workplaces (Boxall and Macky, 2014; Manville et
al., 2015). There is also a need for management at all levels in the university to be
appreciative of diversity issues and act to ensure inclusion and communicate openly and
effectively to staff and research students. This they should not do on their own, but be aided
by industry, professional bodies and funding agencies. In some institutions it is possible that
senior management need further training and development to effectively tackle the issues
that have emerged in this report. The Athena SWAN Charter is a promising approach and
offers a framework for minority groups.
All have a role in the provision of training and resources to boost confidence and encourage
interaction amongst staff. Industry has a role in giving guidance and advice on to the creation
of high performing work cultures, and industry could increase their role in offering
placements for staff and post graduate students, to give them experience of working in an
enterprise which has strong staff engagement. Professional bodies too have a role in
encouraging feelings of value and should be more proactive in their interaction with HEIs and
research institutions.
Funders could strengthen their expectations upon HEIs and research institutions. Perhaps
metrics of measuring the progress of women and those from minority backgrounds could be
used more explicitly by funders in relation to conditions of funding. Those HEIs and research
institutions who do not meet expectations could then be called to account or face loss of

50
funding. An explicit metric on tackling issues inhibiting the advancement of women and
minority groups could be introduced to assessments of HEIs and research institutions made
though the Research Excellence Framework.
In regard to reports of discrimination, harassment, bullying and micro-aggression, a zero-
tolerance approach should be adopted and enforced at an institutional level. A mechanism to
facilitate this could be confidential and anonymous reporting via a web portal to funders,
unions and professional bodies. These three agents would have responsibility to question the
relevant HEI over the reason for these reports.
Specific Recommendations
1) Ensure senior management of HEIs and research institutes are aware of the findings
of this report and develop mitigation plans. These plans should be developed in
consultation with those in high performance workplaces and professional bodies.
2) Train all managers of research and teaching on combating barriers to the
advancement of women and those from minority groups. Develop these
managers’ communication skills and how to enable inclusive work teams.
3) Train all research supervisors on how to better inspire and build confidence in those
they have responsibility for.
4) Ensure there is access to networking, training and development opportunities for all.
This might mean the need to consider access requirements, and when in the year
or day these events take place.
5) Funding panels should be cognisant about why some applicants may not have
expected levels of accumulated output-based evidence, at least allowing
applicants to explain any shortfall.
6) Encourage confidential discussion in performance reviews about barriers to progress
individuals have encountered or may perceive, and provide where possible
constructive suggestions.
7) Establish a web portal for reporting instances of discrimination, harassment and
micro-aggression and develop a culture of zero tolerance in regard to these
issues.
8) Generally promote communication, engagement and group working. All staff and
students should be encouraged to examine any unconscious biases they may hold
against others, especially part-time workers, those who take career breaks, those
with a disability or those of a particular nationality or ethnic background, and to

51
appreciate the impact of their words and actions on the confidence or stress
levels of those around them.
9) Departments should monitor who is performing ‘good citizen’ activities such as
outreach, or diversity work such as Athena SWAN, and ensure that such activities
are allocated and rewarded in a fair and transparent manner.
10) Case studies of good practice in the development of women and minorities in ICT
should be established by unions and professional bodies.
11) Realistic expectations of what is required by staff and students should be established,
preferably by joint consent, and reviewed regularly, perhaps every quarter and no
less than twice a year.
To conclude, in a system where everyone aspires to do better, we recommend that
management of HEIs and research institutions recognise that they are the principal agents for
their staff and doctoral students, and take the lead on addressing the issues in this report.
However, they should be supported by unions, industry and professional bodies, with funding
agencies also having a role to provide guidance and develop metrics to allow progress to be
managed.
52
References
Ackers, L. (2004) ‘Managing relationships in peripatetic careers: Scientific mobility in the
European Union’, Women’s Studies International Forum, 27(3), pp. 189–201. doi:
10.1016/j.wsif.2004.03.001.
Aldercotte, A., Guyan, K., Lawson, J., Neave, S. and Altorjai, S. (2017) ASSET 2016: experiences of gender equality in STEMM academia and their intersections with ethnicity, sexual orientation, disability and age. London: Equality Challenge Unit.
Andrew, A. (2009) ‘Challenging Boundaries to ‘Employability’: Women Apprentices in a Non-
Traditional Occupation’, Social Policy and Society, 8(3), pp. 347-359. doi:
10.1017/S1474746409004898.
Bagilhole, B. (2002) ‘Challenging Equal Opportunities: Changing and adapting male hegemony
in academia’, British Journal of Sociology of Education, 23(1), pp. 19–33. doi:
10.1080/01425690120102836.
Bagilhole, B. and Goode, J. (2001) ‘The Contradiction of the Myth of Individual Merit, and the
Reality of a Patriarchal Support System in Academic Careers: A Feminist Investigation’,
European Journal of Women’s Studies, 8(2), pp. 161–180. doi:
10.1177/135050680100800203.
Bird, S., Litt, J. S. and Wang, Y. (2004) ‘Creating Status of Women Reports: Institutional
Housekeeping as “Women’s Work”’, NWSA Journal, 16(1), pp. 194–206. doi:
10.1353/nwsa.2004.0027.
Boring, A., Ottoboni, K. and Stark, P. B. (2016) ‘Student Evaluations of Teaching (Mostly) Do
Not Measure Teaching Effectiveness’, ScienceOpen Research. doi: 10.14293/S2199-
1006.1.SOR-EDU.AETBZC.v1.
Bos, J. T., Donders, N. C., Bouwman-Brouwer, K. M., and Van der Gulden, J. W. (2009) ‘Work
characteristics and determinants of job satisfaction in four age groups: university
employees’ point of view’, International Archives of Occupational and Environmental
Health, 82(10), pp. 1249-1259. doi: 10.1007/s00420-009-0451-4
Boxall, P. and Macky, K. (2014) ‘High-involvement work processes, work intensification and
employee well-being’, Work, Employment and Society, 28(6), pp. 963-984. doi:
10.1177/0950017013512714
Cuddy, A. J. C., Fiske, S. T. and Glick, P. (2004) ‘When Professionals Become Mothers, Warmth
Doesn’t Cut the Ice’, Journal of Social Issues, 60(4), pp. 701–718.
Derks, B., Ellemers, N., van Laar, C. and de Groot, K. (2011) ‘Do sexist organizational cultures
create the Queen Bee?’, British Journal of Social Psychology, 50(3), pp. 519–535. doi:
10.1348/014466610X525280.
Deem, R. (2003) ‘Gender, organizational cultures and the practices of manager‐academics in
UK universities’, Gender, Work & Organization, 10(2), pp. 239-259. doi: 10.1111/1468-
0432.t01-1-00013
Ensmenger, N. (2015) ‘“Beards, Sandals, and Other Signs of Rugged Individualism”: Masculine
Culture within the Computing Professions’, Osiris, 31(1), pp. 38–65. doi: 10.1086/682955
Ewing, V. L., Stukas, A. a and Sheehan, E. P. (2003) ‘Student prejudice against gay male and
lesbian lecturers.’, The Journal of Social Psychology, 143(5), pp. 569–579. doi:
10.1080/00224540309598464.

53
Fletcher, C., Boden, R., Kent, J. and Tinson, J. (2007) ‘Performing Women: The Gendered
Dimensions of the UK New Research Economy’, Gender, Work & Organization, 14(5), pp.
433–453. doi: 10.1111/j.1468-0432.2007.00359.x.
Gatta, M.L. and Roos, P.A. (2004) ‘Balancing without a net in academia: integrating family and
work lives’, Equal Opportunities International, 23(3/4/5), pp. 124–142. doi:
10.1108/02610150410787765.
González Ramos, A. M. and Vergés Bosch, N. (2011) ‘Moving for What? International Mobility
Strategies of Women in ICT Careers’, International Journal of Gender, Science and
Technology, pp. 501–516.
Grove, J. (2016). ‘Female professors ‘pay price for academic citizenship’, Times Higher
Education, 14th December 2016. Available at:
https://www.timeshighereducation.com/news/female-professors-pay-price-academic-
citizenship
Handley, I.M., Brown, E.R., Moss-Racusin, C.A., and Smith, J.L. (2015) ‘Quality of evidence revealing subtle gender biases in science is in the eye of the beholder’, Proceedings of the National Academy of Sciences, 112(43), pp. 13201–13206. doi: 10.1073/pnas.1510649112
Hill, C., Corbett, C. and St Rose, A. (2010) Why so few? Women in Science, technology,
engineering and mathematics. Washington DC: American Association of University Women.
Available at: http://www.aauw.org/files/2013/02/Why-So-Few-Women-in-Science-
Technology-Engineering-and-Mathematics.pdf.
Hunter, L. A. and Leahey, E. (2010) ‘Parenting and research productivity: New evidence and
methods’, Social Studies of Science, 40(3), pp. 433–451. doi: 10.1177/0306312709358472.
Institute of Physics (2015) Gazing at the Future: The experiences of male and female physics
and astronomy doctoral students in the UK. Available at:
http://www.iop.org/publications/iop/2015/file_65624.pdf
Kachchaf, R., Ko, L., Hodari, A. and Ong, M. (2015) ‘Career–life balance for women of color:
Experiences in science and engineering academia’, Journal of Diversity in Higher Education,
8(3), pp. 175–191. doi: 10.1037/a0039068.
Kinman, G. (2008) ‘Work stressors, health and sense of coherence in UK academic
employees’, Educational Psychology, 28(7), pp. 823-835. doi: 10.1080/01443410802366298
Knights, D. and Richards, W. (2003) ‘Sex discrimination in UK academia’, Gender, Work and
Organization, 10(2), pp. 213–238. doi: 10.1111/1468-0432.t01-1-00012.
Knobloch-Westerwick, S., Glynn, C. J. and Huge, M. (2013) ‘The Matilda Effect in Science
Communication’, Science Communication, 35(5), pp. 603–625. doi:
10.1177/1075547012472684.
Koch, S. C., Müller, S. M. and Sieverding, M. (2008) ‘Women and computers. Effects of
stereotype threat on attribution of failure’, Computers and Education, 51(4), pp. 1795–
1803. doi: 10.1016/j.compedu.2008.05.007.
van der Lee, R. and Ellemers, N. (2015) ‘Gender contributes to personal research funding
success in The Netherlands’, Proceedings of the National Academy of Sciences, 112(40), pp.
12349–12353. doi: 10.1073/pnas.1510159112.
Leslie, S., Cimpian, A., Meyer, M. and Freeland, E. (2015) ‘Expectations of brilliance underlie
gender distributions across academic disciplines’, Science, 347(6219), pp. 262–265. doi:
10.1126/science.1261375.
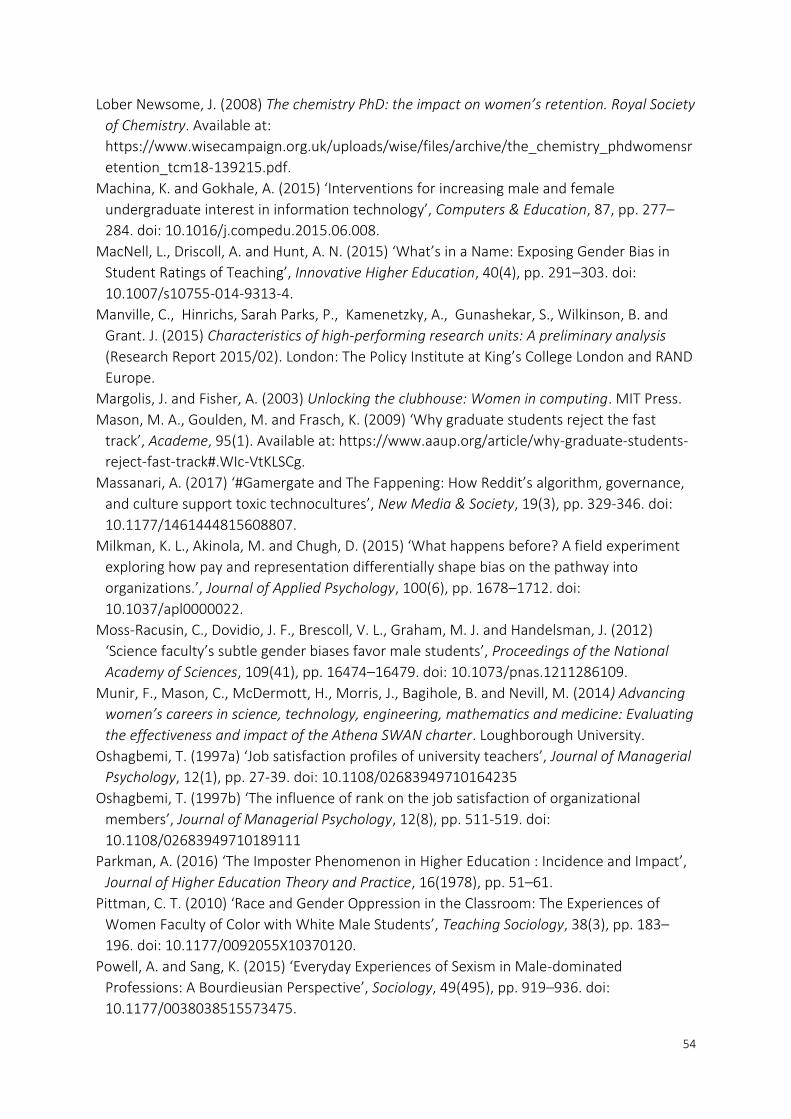
54
Lober Newsome, J. (2008) The chemistry PhD: the impact on women’s retention. Royal Society
of Chemistry. Available at:
https://www.wisecampaign.org.uk/uploads/wise/files/archive/the_chemistry_phdwomensr
etention_tcm18-139215.pdf.
Machina, K. and Gokhale, A. (2015) ‘Interventions for increasing male and female
undergraduate interest in information technology’, Computers & Education, 87, pp. 277–
284. doi: 10.1016/j.compedu.2015.06.008.
MacNell, L., Driscoll, A. and Hunt, A. N. (2015) ‘What’s in a Name: Exposing Gender Bias in
Student Ratings of Teaching’, Innovative Higher Education, 40(4), pp. 291–303. doi:
10.1007/s10755-014-9313-4.
Manville, C., Hinrichs, Sarah Parks, P., Kamenetzky, A., Gunashekar, S., Wilkinson, B. and
Grant. J. (2015) Characteristics of high-performing research units: A preliminary analysis
(Research Report 2015/02). London: The Policy Institute at King’s College London and RAND
Europe.
Margolis, J. and Fisher, A. (2003) Unlocking the clubhouse: Women in computing. MIT Press.
Mason, M. A., Goulden, M. and Frasch, K. (2009) ‘Why graduate students reject the fast
track’, Academe, 95(1). Available at: https://www.aaup.org/article/why-graduate-students-
reject-fast-track#.WIc-VtKLSCg.
Massanari, A. (2017) ‘#Gamergate and The Fappening: How Reddit’s algorithm, governance,
and culture support toxic technocultures’, New Media & Society, 19(3), pp. 329-346. doi:
10.1177/1461444815608807.
Milkman, K. L., Akinola, M. and Chugh, D. (2015) ‘What happens before? A field experiment
exploring how pay and representation differentially shape bias on the pathway into
organizations.’, Journal of Applied Psychology, 100(6), pp. 1678–1712. doi:
10.1037/apl0000022.
Moss-Racusin, C., Dovidio, J. F., Brescoll, V. L., Graham, M. J. and Handelsman, J. (2012)
‘Science faculty’s subtle gender biases favor male students’, Proceedings of the National
Academy of Sciences, 109(41), pp. 16474–16479. doi: 10.1073/pnas.1211286109.
Munir, F., Mason, C., McDermott, H., Morris, J., Bagihole, B. and Nevill, M. (2014) Advancing
women’s careers in science, technology, engineering, mathematics and medicine: Evaluating
the effectiveness and impact of the Athena SWAN charter. Loughborough University.
Oshagbemi, T. (1997a) ‘Job satisfaction profiles of university teachers’, Journal of Managerial
Psychology, 12(1), pp. 27-39. doi: 10.1108/02683949710164235
Oshagbemi, T. (1997b) ‘The influence of rank on the job satisfaction of organizational
members’, Journal of Managerial Psychology, 12(8), pp. 511-519. doi:
10.1108/02683949710189111
Parkman, A. (2016) ‘The Imposter Phenomenon in Higher Education : Incidence and Impact’,
Journal of Higher Education Theory and Practice, 16(1978), pp. 51–61.
Pittman, C. T. (2010) ‘Race and Gender Oppression in the Classroom: The Experiences of
Women Faculty of Color with White Male Students’, Teaching Sociology, 38(3), pp. 183–
196. doi: 10.1177/0092055X10370120.
Powell, A. and Sang, K. (2015) ‘Everyday Experiences of Sexism in Male-dominated
Professions: A Bourdieusian Perspective’, Sociology, 49(495), pp. 919–936. doi:
10.1177/0038038515573475.

55
Prescott, J. and Bogg, J. (2011) ‘Segregation in a Male-Dominated Industry : Women Working
in the Computer Games Industry’, Gender, Science and Technology, 3(1), pp. 1–23. doi:
10.4018/978-1-4666-6142-4.ch005.
Probert, B. (2005) ‘“I just couldn”t fit it in’: Gender and unequal outcomes in academic
careers’, Gender, Work and Organization, 12(1), pp. 50–72. doi: 10.1111/j.1468-
0432.2005.00262.x.
Reagle, J. (2013) ‘“Free as in sexist?” Free culture and the gender gap’, First Monday, 18(1).
doi: 10.5210/fm.v18i1.4291.
Reskin, B. F. and Roos, P. (1987) ‘Status Hierarchies and Sex Segregation’, in Ingredients for
Women’s Employment Policy, Bose, G. and Spitze, G. (eds), pp. 3-21. New York: State
University of New York Press.
Reuben, E., Sapienza, P. and Zingales, L. (2014) ‘How stereotypes impair women’s careers in
science.’, Proceedings of the National Academy of Sciences of the United States of America,
111(12), pp. 4403–8. doi: 10.1073/pnas.1314788111.
Rhoton, L.A. (2011) ‘Distancing as a Gendered Barrier: Understanding Women Scientists’
Gender Practices’, Gender & Society, 25(6), pp. 696–716. doi: 10.1177/0891243211422717.
Rolin, K. and Vainio, J. (2011) ‘Gender in Academia in Finland: Tensions between Policies and
Gendering Processes in Physics Departments.’, Science Studies, 24(1), pp. 26–46.
Rosenthal, L., London, B., Levy, S. R. and Lobel, M. (2011) ‘The Roles of Perceived Identity
Compatibility and Social Support for Women in a Single-Sex STEM Program at a Co-
educational University’, Sex Roles, 65(9–10), pp. 725–736. doi: 10.1007/s11199-011-9945-0.
Sang, K., Powell, A., Finkel, R. and Richards, J. (2015) ‘“Being an academic is not a 9–5 job’:
long working hours and the ‘ideal worker’ in UK academia”’, Labour & Industry: a journal of
the social and economic relations of work, 25(3), pp. 235–249. doi:
10.1080/10301763.2015.1081723.
Shapiro, J. R. and Williams, A. M. (2012) ‘The Role of Stereotype Threats in Undermining Girls’
and Women’s Performance and Interest in STEM Fields’, Sex Roles, 66(3–4), pp. 175–183.
doi: 10.1007/s11199-011-0051-0.
Simard, C. (2010) Obstacles and Solutions for Underrepresented Minorities in Technology.
Palo Alto: Anita Borg Institute for Women and Technology. Available at:
http://ww.cssia.com/pdf/20000076-
ObstaclesandSolutionsforUnderrepresentedMinoritiesinTechnology.pdf.
Simard, C. and Davies Henderson, A. (2008) Climbing the technical ladder: Obstacles and
solutions for mid-level women in technology. Michelle R. Clayman Institute for Gender
Research, Stanford University, Anita Borg Institute for Women and Technology.
Wagner, N., Rieger, M. and Voorvelt, K. (2016) ‘Gender, ethnicity and teaching evaluations:
Evidence from mixed teaching teams’, Economics of Education Review, 54, pp. 79–94. doi:
10.1016/j.econedurev.2016.06.004.
Wajcman, J. (2004) Technofeminism. Cambridge: Polity Press.
Way, S. F., Larremore, D. B. and Clauset, A. (2016) ‘Gender, Productivity, and Prestige in
Computer Science Faculty Hiring Networks’, Proc. 2016 World Wide Web Conference, pp.
1169–1179. doi: 10.1145/2872427.2883073.

56
West, J. D., Jacquet, J., King, M. M., Correll, S. J. and Bergstrom, C. T. (2013) ‘The Role of
Gender in Scholarly Authorship’, PLoS ONE, 8(7), e66212. doi:
10.1371/journal.pone.0066212.
Williams, J. C., Phillips, K. W. and Hall, E. V. (2014) Double Jeopardy? Gender Bias Against
Women of color in Science. UC Hastings College of the Law. Available at:
http://www.uchastings.edu/news/articles/2015/01/double-jeopardy-report.pdf.
Williams, W. M. and Ceci, S. J. (2015) ‘National hiring experiments reveal 2:1 faculty
preference for women on STEM tenure track’, Proceedings of the National Academy of
Sciences, 112(17), pp. 5360–5365. doi: 10.1073/pnas.1418878112.
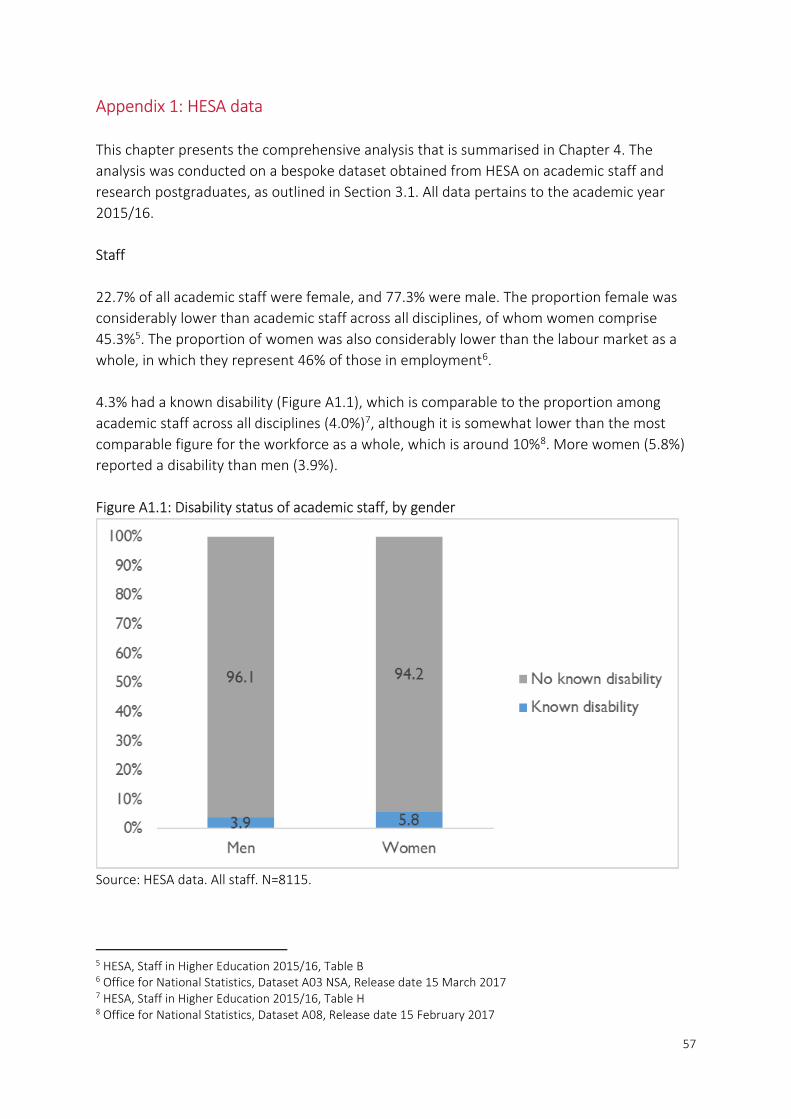
57
Appendix 1: HESA data
This chapter presents the comprehensive analysis that is summarised in Chapter 4. The
analysis was conducted on a bespoke dataset obtained from HESA on academic staff and
research postgraduates, as outlined in Section 3.1. All data pertains to the academic year
2015/16.
Staff
22.7% of all academic staff were female, and 77.3% were male. The proportion female was
considerably lower than academic staff across all disciplines, of whom women comprise
45.3%5. The proportion of women was also considerably lower than the labour market as a
whole, in which they represent 46% of those in employment6.
4.3% had a known disability (Figure A1.1), which is comparable to the proportion among
academic staff across all disciplines (4.0%)7, although it is somewhat lower than the most
comparable figure for the workforce as a whole, which is around 10%8. More women (5.8%)
reported a disability than men (3.9%).
Figure A1.1: Disability status of academic staff, by gender
Source: HESA data. All staff. N=8115.
5 HESA, Staff in Higher Education 2015/16, Table B 6 Office for National Statistics, Dataset A03 NSA, Release date 15 March 2017 7 HESA, Staff in Higher Education 2015/16, Table H 8 Office for National Statistics, Dataset A08, Release date 15 February 2017
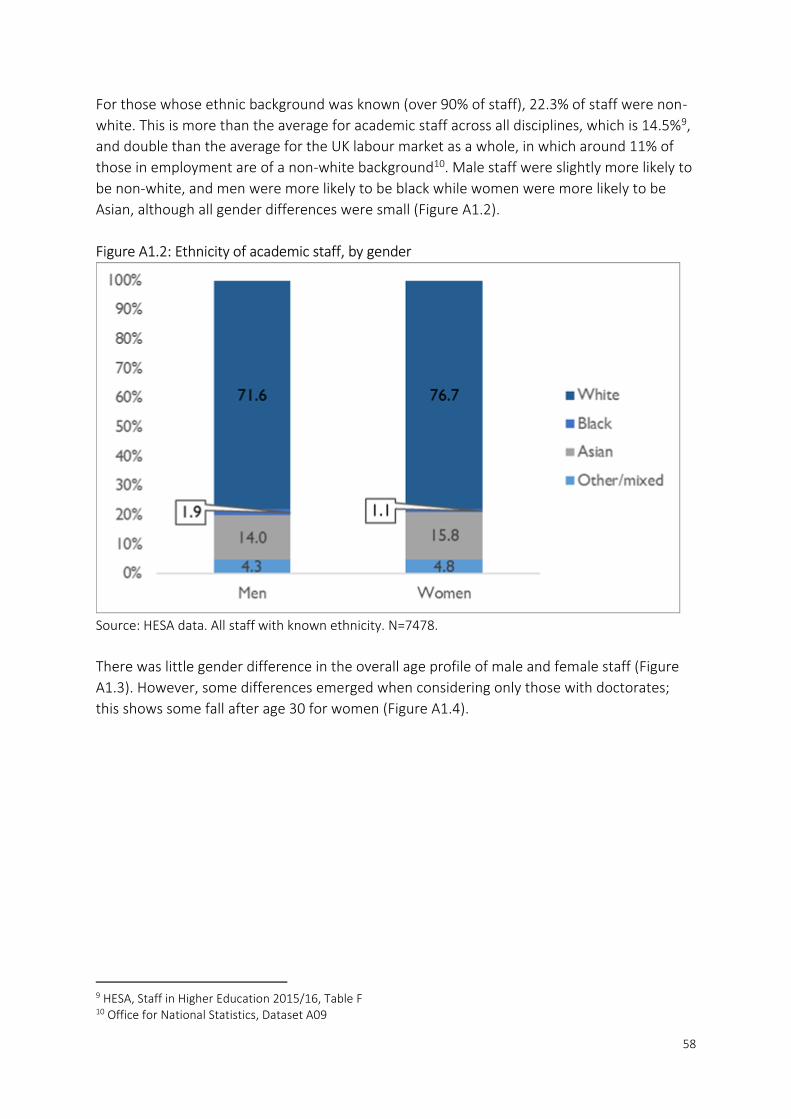
58
For those whose ethnic background was known (over 90% of staff), 22.3% of staff were non-
white. This is more than the average for academic staff across all disciplines, which is 14.5%9,
and double than the average for the UK labour market as a whole, in which around 11% of
those in employment are of a non-white background10. Male staff were slightly more likely to
be non-white, and men were more likely to be black while women were more likely to be
Asian, although all gender differences were small (Figure A1.2).
Figure A1.2: Ethnicity of academic staff, by gender
Source: HESA data. All staff with known ethnicity. N=7478.
There was little gender difference in the overall age profile of male and female staff (Figure
A1.3). However, some differences emerged when considering only those with doctorates;
this shows some fall after age 30 for women (Figure A1.4).
9 HESA, Staff in Higher Education 2015/16, Table F 10 Office for National Statistics, Dataset A09
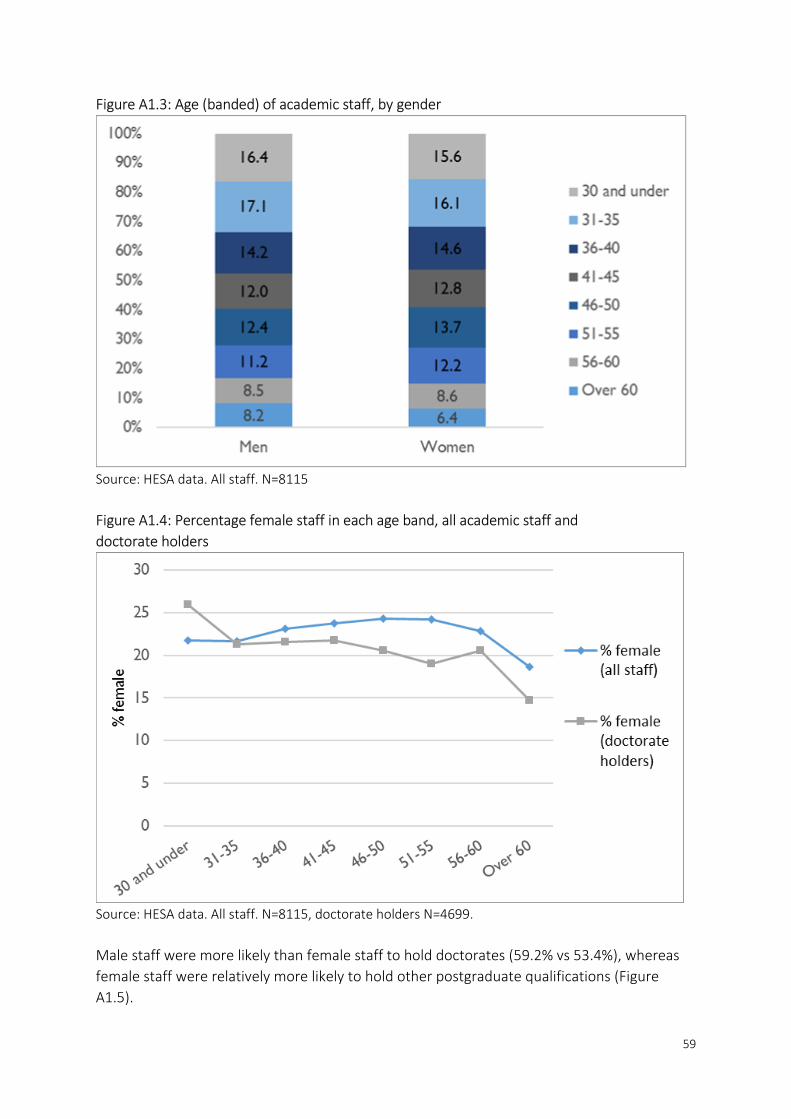
59
Figure A1.3: Age (banded) of academic staff, by gender
Source: HESA data. All staff. N=8115
Figure A1.4: Percentage female staff in each age band, all academic staff and
doctorate holders
Source: HESA data. All staff. N=8115, doctorate holders N=4699.
Male staff were more likely than female staff to hold doctorates (59.2% vs 53.4%), whereas
female staff were relatively more likely to hold other postgraduate qualifications (Figure
A1.5).

60
Figure A1.5: Highest qualification held among academic staff, by gender
Source: HESA data. All staff. N=8115.
The occupational structure was quite similar for male and female staff (Figure A1.6), but men
were around twice as likely to be Professors (10.6% vs 5.6%), while women were more likely
to be employed at Lecturer or Research assistant level.

61
Figure A1.6: Contract level of academic staff, by gender
Source: HESA data. All staff. N=8115.
Information on nationality was available for over 99% of the staff, and the proportion of UK,
EU and non-EU nationals are shown in Figure A1.7. Around 40% were non-UK nationals, with
women slightly less likely than men to be of UK nationality (41.6% were non-UK nationals,
compared with 39.3% of men), but among those not of UK nationality, there was no gender
difference in the ratio of EU to non-EU nationals. The proportion of non-UK nationals was
considerably higher than the labour market as a whole, where it is around 11%11.
11 Office for National Statistics, Dataset A01, Table 8(2), Release date 15 March 2017

62
Figure A1.7: Nationality of academic staff, by gender
Source: HESA data. All staff with known nationality. N=8053.
The main gender disparities in nationality were at Research assistant level, where women are
more likely to be non-UK nationals, and Senior Management/Head of School level, where
men are more likely to be non-UK nationals (Figure A1.8). These figures also show that non-
UK nationals are disproportionately likely to be employed at lower occupational levels, and
become more scarce at higher levels.

63
Figure A1.8: Nationality of academic staff, by gender and contract level
Source: HESA data. All staff with known nationality. N=8053.
Female staff were more likely to work part-time (Figure A1.9), but the gender difference in
this respect was not large, and over a fifth of male staff did so as well. Men were more likely
to work part-time as Professors, and women in other roles, particularly at the Lecturer and
Senior lecturer level. Part-time working was more common among women at all age groups
apart from the under-30s, and the gender gap was largest among women in their forties
(Figure A1.10).

64
Figure A1.9: Part-time employment among academic staff, by gender and contract level
Source: HESA data. All staff. N=8115.
Figure A1.10: Part-time employment among academic staff, by gender and age band
Source: HESA data. All staff. N=8115.
Female staff were more likely to be on a fixed-term contract (Figure A1.11), but the
difference was small (1.7 percentage points). Across the age groups, fixed-term contracts
followed a U shaped pattern; they were most common among those in their twenties and
thirties, least common among those in their forties and fifties, but then increased in

65
prevalence among those in their sixties. The proportion of female staff on fixed-term
contracts was higher in all age groups apart from the under 30s, and those aged 56-60.
However, the gender disparity seems to be largely driven by the higher prevalence of fixed-
term contracts among women in senior management positions, who are more likely than
men to be in fixed-term jobs, but less likely in most other positions (Figure A1.12).
Figure A1.11: Fixed-term employment among academic staff, by gender and age band
Source: HESA data. All staff. N=8115.
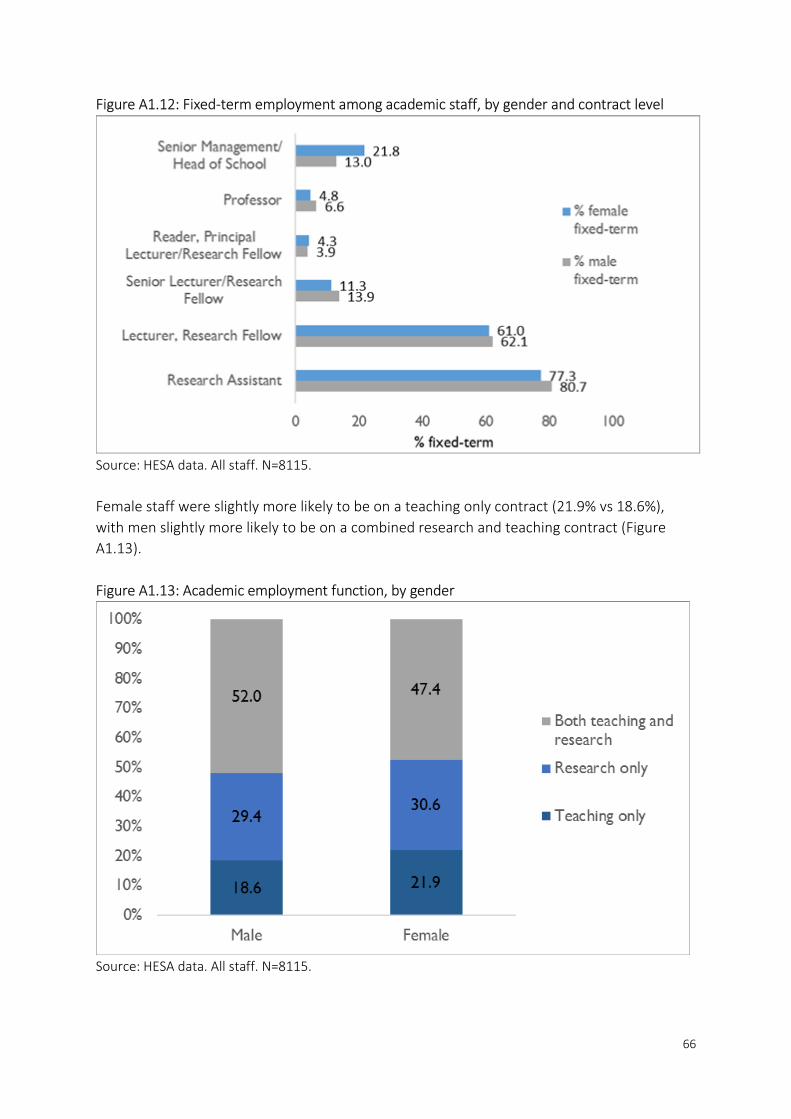
66
Figure A1.12: Fixed-term employment among academic staff, by gender and contract level
Source: HESA data. All staff. N=8115.
Female staff were slightly more likely to be on a teaching only contract (21.9% vs 18.6%),
with men slightly more likely to be on a combined research and teaching contract (Figure
A1.13).
Figure A1.13: Academic employment function, by gender
Source: HESA data. All staff. N=8115.
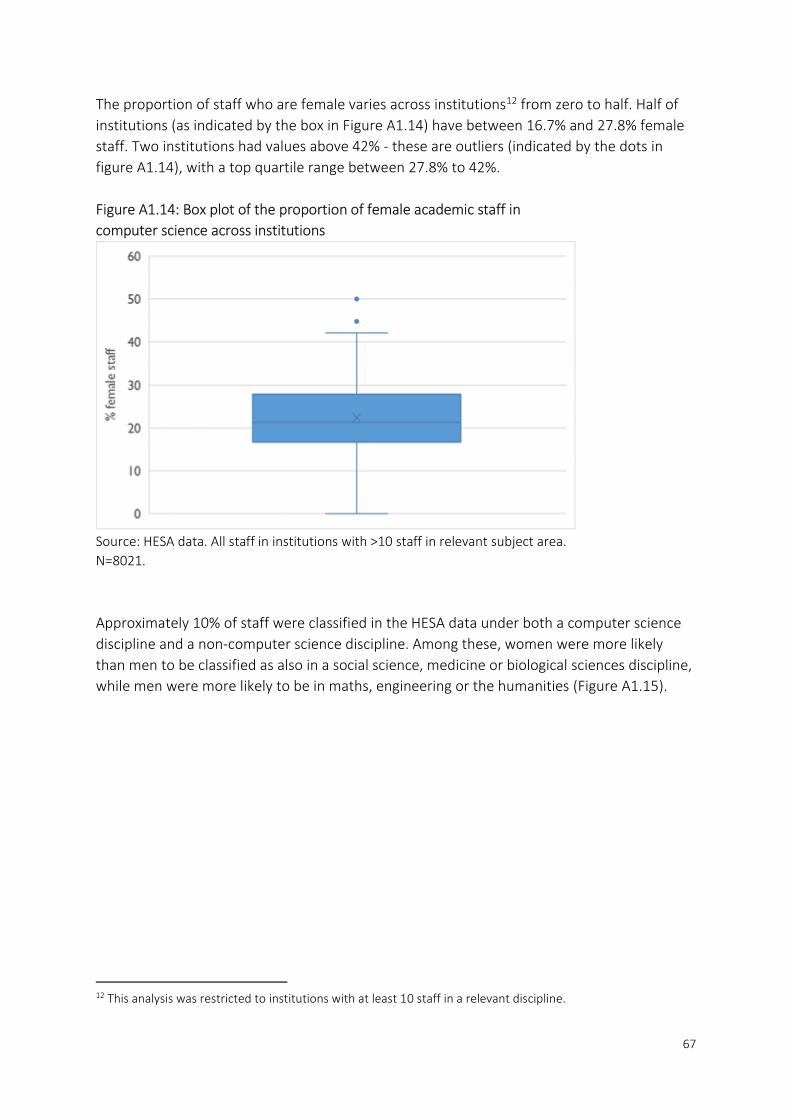
67
The proportion of staff who are female varies across institutions12 from zero to half. Half of
institutions (as indicated by the box in Figure A1.14) have between 16.7% and 27.8% female
staff. Two institutions had values above 42% - these are outliers (indicated by the dots in
figure A1.14), with a top quartile range between 27.8% to 42%.
Figure A1.14: Box plot of the proportion of female academic staff in
computer science across institutions
Source: HESA data. All staff in institutions with >10 staff in relevant subject area.
N=8021.
Approximately 10% of staff were classified in the HESA data under both a computer science
discipline and a non-computer science discipline. Among these, women were more likely
than men to be classified as also in a social science, medicine or biological sciences discipline,
while men were more likely to be in maths, engineering or the humanities (Figure A1.15).
12 This analysis was restricted to institutions with at least 10 staff in a relevant discipline.
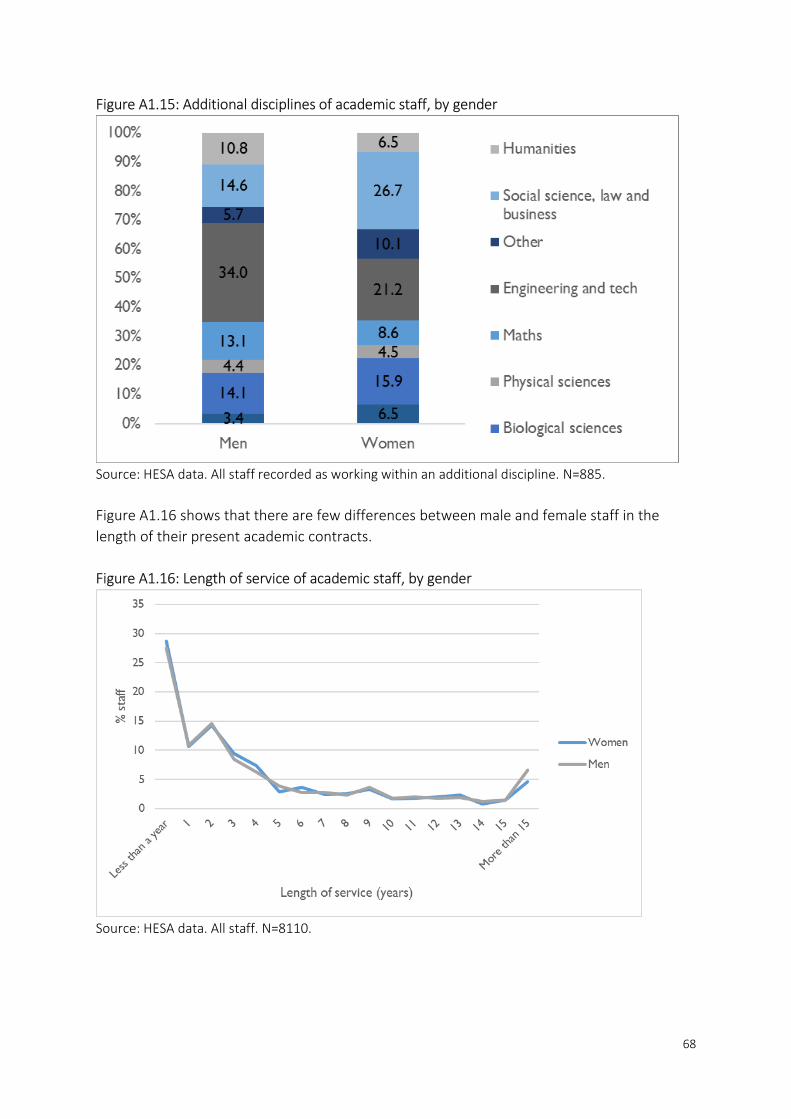
68
Figure A1.15: Additional disciplines of academic staff, by gender
Source: HESA data. All staff recorded as working within an additional discipline. N=885.
Figure A1.16 shows that there are few differences between male and female staff in the
length of their present academic contracts.
Figure A1.16: Length of service of academic staff, by gender
Source: HESA data. All staff. N=8110.

69
Table A1.1 shows the previous employers of new starters in the previous year.13 Women
were more likely to have come from the UK education sector, and men were more likely from
private industry.
Table A1.1: Previous employer of new academic staff
Women Men
UK education 35.2 27.3
Student in UK 22.4 23.7
UK research institution 1.5 1.2
Private industry/commerce in UK 4.2 9.9
Other UK employment 12.9 7.7
Overseas education 9.2 14.8
Student in an overseas country 3.7 3.8
Overseas research institution 3.1 2.9
Other overseas employment 3.1 4.2
Not in regular employment 4.7 4.4
N 325 1067
Source: HESA data. All staff who started in the last year.
Students
The gender balance among postgraduate research students in computer science was
comparable to that among staff, although it was slightly better at 26.1% female (compared
with 22.7% for staff), suggesting a slightly disproportionate drop out of women between
postgraduate studies and an academic career.
There was not a notable gender gap with respect to disability (Figure A1.17). 6.6% of female
students had a known disability and 7.0% of male. The overall rate was comparable to that of
postgraduate students as a whole of 6.7%14, but it represented a higher proportion than
among staff (4.3%), suggesting again a slightly disproportionate drop out of disabled students
in the transition to an academic career.
13 Data is only available on the previous employer of those classified as new starters. These account for around 17% of the total. 14 HESA, Higher education student enrolments and qualifications obtained at higher education providers in the United Kingdom 2015/16, Statistical First Release 242, Table 6a

70
Figure A1.17: Disability status of postgraduate research students, by gender
Source: HESA data. All students. N=6676.
The research postgraduate student body in computer science was predominantly white. Data
on ethnicity is shown here for UK nationals only, due to large amounts of missing data on
ethnicity for other EU students (75% missing) and non-EU students (92% missing). Figure
A1.18 shows that men were more likely to be white (84.7%) than women (78.2%).
Figure A1.18: Ethnicity of postgraduate research students, UK nationals only, by gender
Source: HESA data. All UK national students with known ethnicity. N=2588.
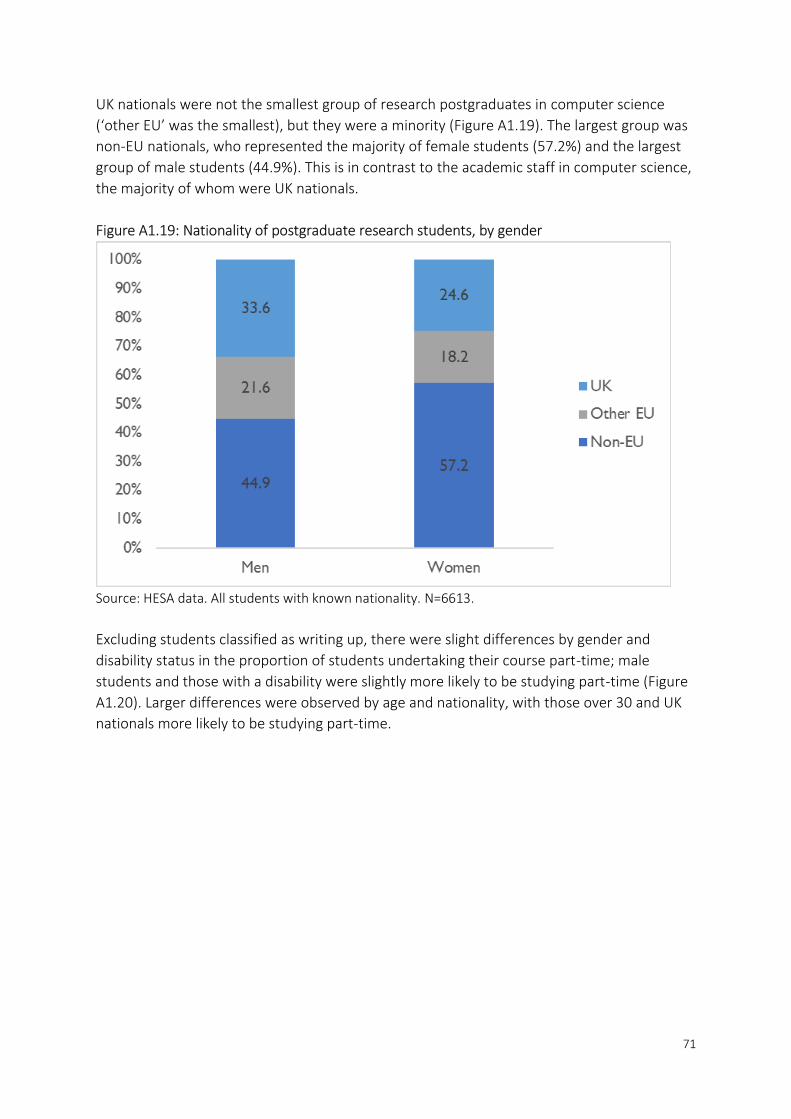
71
UK nationals were not the smallest group of research postgraduates in computer science
(‘other EU’ was the smallest), but they were a minority (Figure A1.19). The largest group was
non-EU nationals, who represented the majority of female students (57.2%) and the largest
group of male students (44.9%). This is in contrast to the academic staff in computer science,
the majority of whom were UK nationals.
Figure A1.19: Nationality of postgraduate research students, by gender
Source: HESA data. All students with known nationality. N=6613.
Excluding students classified as writing up, there were slight differences by gender and
disability status in the proportion of students undertaking their course part-time; male
students and those with a disability were slightly more likely to be studying part-time (Figure
A1.20). Larger differences were observed by age and nationality, with those over 30 and UK
nationals more likely to be studying part-time.

72
Figure A1.20: Percentage studying part-time, by gender, disability status, age and
nationality
Source: HESA data. All students with known nationality. N=4888.
Looking only at UK nationals, male research postgraduates in computer science were more
likely to not have funding assistance with paying their tuition fees (Figure A1.21); 33.0%,
compared with 29.6% of female postgraduates. Similar proportions of male (34.8%) and
female (33.0%) postgraduates had research council grants, and female postgraduates were
more likely to be sponsored by an employer.

73
Figure A1.21: Source of tuition fees (UK nationals only), by gender
Source: HESA data. All UK national students with known tuition fee status. N=1938.
Those with a known disability were less likely to be paying their tuition fees without
assistance (Figure A1.22); 28.1%, compared with 33.1% of those without a known disability.
They were also more likely to have most forms of funding including research council grants;
38.5%, compared with 33.7% of those without a known disability.
Figure A1.22: Source of tuition fees (UK nationals only), by disability status
Source: HESA data. All UK national students with known tuition fee status. N=1938.

74
There were notable ethnic disparities in funding sources (Figure A1.23). Two thirds of black
students did not have financial support for paying their tuition fees, while white students
were least likely to be self-funded. The proportion receiving research council grants was
similar for white (37.1%) and other (34.7%), with fewer Asian students (22.2%) and few black
(8.9%) students.
Figure A1.23: Source of tuition fees (UK nationals only), by ethnicity
Source: HESA data. All UK national students with known tuition fee status and
ethnicity. N=1823.

75
Appendix 2: Online survey results
This appendix presents a comprehensive analysis of the quantitative data collected via the
online survey.
Survey demographics
866 people responded to the online survey. A breakdown of their characteristics is shown in
Table A2.1.
Table A2.1: Characteristics of survey respondents
Online survey HESA
N % known % known
Male 388 53 77
Female 331 46 23
Other 7 1 0
Unknown 140
Under 25 53 7 4
25-34 268 37 29
35-44 196 27 26
45-54 124 17 24
55+ 77 11 16
Unknown 148
Limiting health condition or disability 76 10 4
No limiting health condition or disability 654 90 96
Unknown 136
White 571 79 78
Black 11 2 2
Asian 74 10 16
Other/mixed 65 9 5
Unknown 145
UK national 401 55 60
Other EU national 205 28 21
Non-EU national 122 17 19
Unknown 138
The characteristics of the survey respondents are presented next to the proportions of these
characteristics among computer science staff according to HESA. This is a rough comparison,
as the two populations differ; the survey includes students and former staff and students,
and disciplines beyond computer science. However, it suggests that the response to the
survey was broadly in line with the expected profile of respondents, with some ‘under-

76
represented’ groups in the sector somewhat over-represented among survey respondents, as
might be expected in a survey about diversity.
Academic staff respondents were drawn from across the career spectrum (Figure A2.1).
Figure A2.1: Current job of academic staff respondents
Source: Online survey. All current staff who stated current position. N=520.
Motivation for pursuing an academic career
Figure A2.2 shows the responses for male and female staff to the question of why they
pursued an academic career. The only differences that were found to be statistically
significant were that men were more likely to say they had always been interested in
technology (p=0.004, while women were more likely to say they wanted a challenging career
(p=0.009), although the effect size was small in both cases (d=0.28 and d=0.25 respectively).

77
Figure A2.2: Reasons for choosing an academic career, by gender – academic staff
Source: Online survey. All current staff. N=438. Patterned bars represent non-significant differences
between men and women.
For students, the main motivations for pursuing postgraduate study are displayed in Figure
A2.3. In general, the hierarchy of motivations was very similar to that of the academic staff.
The only statistically significant gender difference was that male students were more likely to
cite a longstanding interest in technology (p=0.001), with a moderate effect size in this case
(d=0.42).

78
Figure A2.3: Reasons for pursuing postgraduate study, by gender – postgraduates
Source: Online survey. All current students. N=246. Patterned bars represent non-significant
differences between men and women.
The responses of former staff and postgraduates to these questions are shown in Table A2.2.
The low sample sizes mean that these results should be interpreted with some caution.
However, they imply that the most common reason for initially pursuing a postgraduate
course or career in academic ICT research was, as for current staff and students, an interest
in research, although a lower proportion selected this as a motivation. Only half said they had
chosen this path because they had a longstanding interest in technology. Around two fifths
said they had wanted a challenging career; similar to the proportion of current staff and
students selecting this as a motivation.
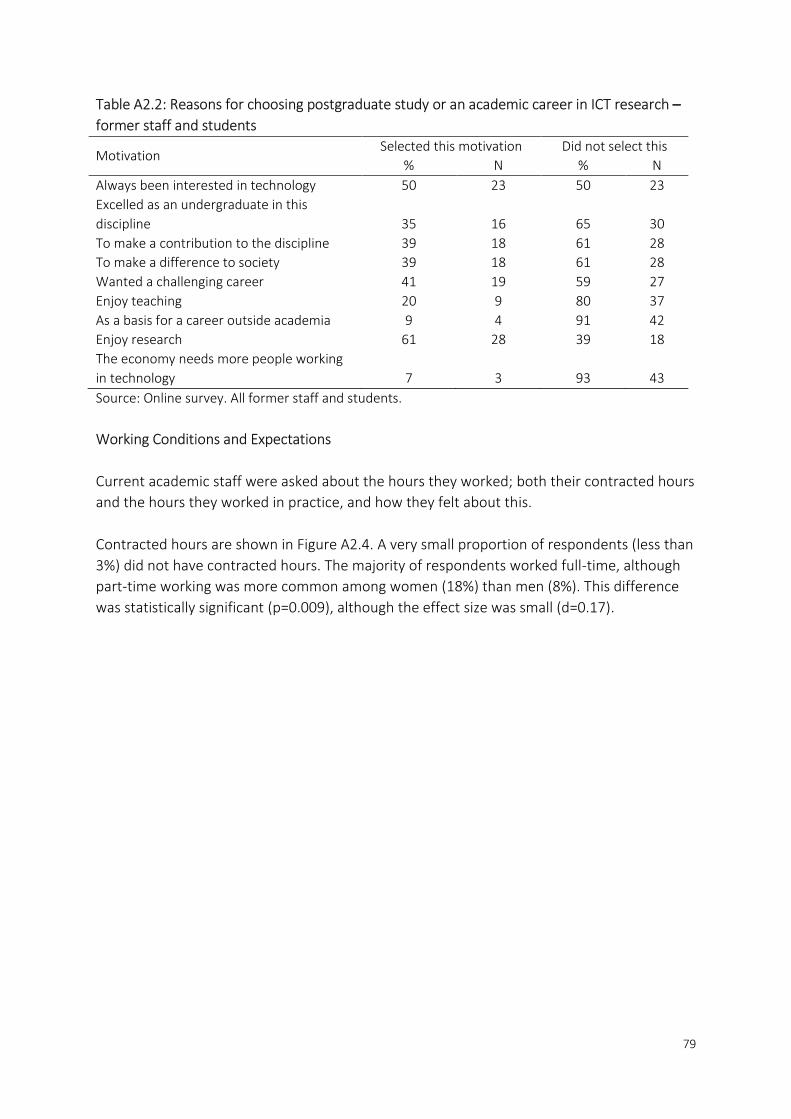
79
Table A2.2: Reasons for choosing postgraduate study or an academic career in ICT research –
former staff and students
Motivation Selected this motivation Did not select this
% N % N
Always been interested in technology 50 23 50 23
Excelled as an undergraduate in this
discipline 35 16 65 30
To make a contribution to the discipline 39 18 61 28
To make a difference to society 39 18 61 28
Wanted a challenging career 41 19 59 27
Enjoy teaching 20 9 80 37
As a basis for a career outside academia 9 4 91 42
Enjoy research 61 28 39 18
The economy needs more people working
in technology 7 3 93 43
Source: Online survey. All former staff and students.
Working Conditions and Expectations
Current academic staff were asked about the hours they worked; both their contracted hours
and the hours they worked in practice, and how they felt about this.
Contracted hours are shown in Figure A2.4. A very small proportion of respondents (less than
3%) did not have contracted hours. The majority of respondents worked full-time, although
part-time working was more common among women (18%) than men (8%). This difference
was statistically significant (p=0.009), although the effect size was small (d=0.17).

80
Figure A2.4: Contracted working hours, by gender
Source: Online survey. All current staff. N=421
Of those who were contracted to work full-time, 93% said this was their preferred
arrangement, with 7% saying they would prefer to work part-time. Of those who were
contracted to work part-time, 71% said this was their preferred arrangement, and 29% said
they would prefer to work full-time. Small sample sizes obviated any robust estimate of
whether these attitudes differed by gender.
Respondents were also asked about the hours they worked in practice. Among those
contracted to work full-time, the median hours worked were 51 for men and 46 for women,
and among those contracted to work part-time, the median hours were 26 for men and 31
for women. Significance tests of differences in mean hours did not reveal a significant gender
difference, although mean hours is not the best measure in this case because the data is
censored (i.e. the highest number respondents could choose was 61 hours or more) and
therefore does not fully represent the variation in hours worked above this level.
Reported hours worked by those contracted to work full-time are shown in Figure A2.5. The
only significant gender difference was in those reporting working at least 50 hours per week,
with men (53%) more likely than women (42%) to do so (p=0.025, with a small effect size of
d=0.23). There was no significant gender difference in the minority who reported ‘extreme’
working hours of 60 or more per week.
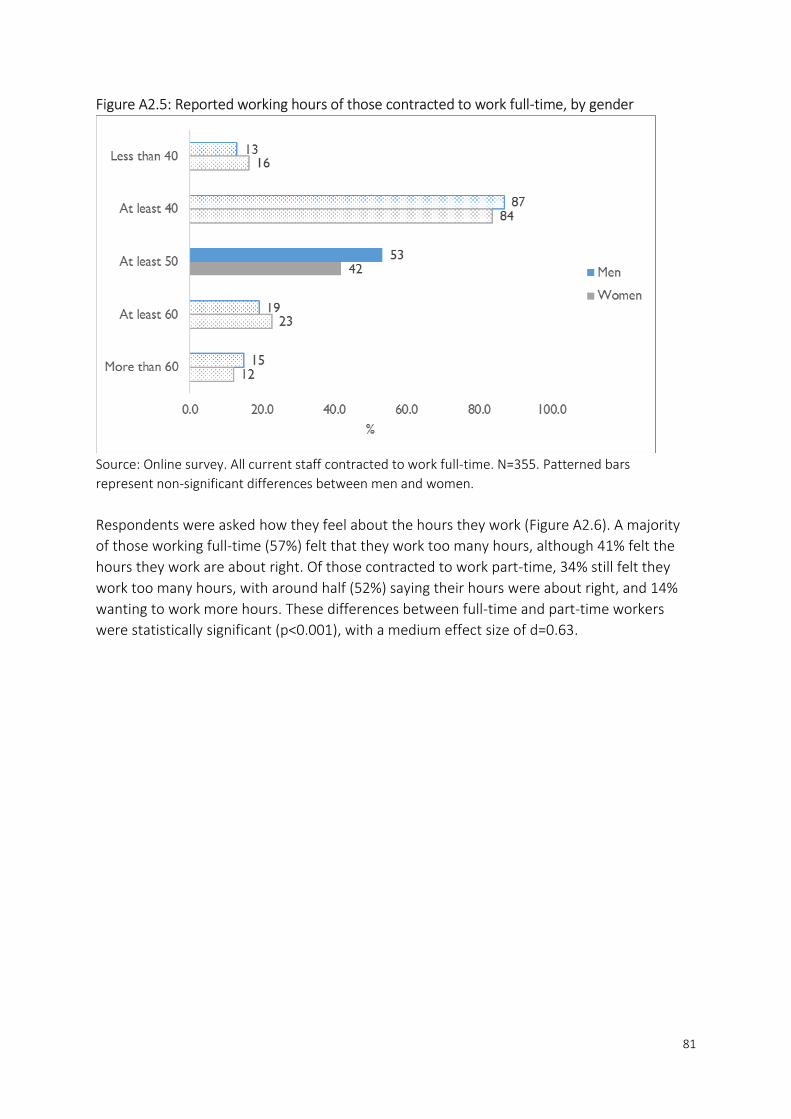
81
Figure A2.5: Reported working hours of those contracted to work full-time, by gender
Source: Online survey. All current staff contracted to work full-time. N=355. Patterned bars
represent non-significant differences between men and women.
Respondents were asked how they feel about the hours they work (Figure A2.6). A majority
of those working full-time (57%) felt that they work too many hours, although 41% felt the
hours they work are about right. Of those contracted to work part-time, 34% still felt they
work too many hours, with around half (52%) saying their hours were about right, and 14%
wanting to work more hours. These differences between full-time and part-time workers
were statistically significant (p<0.001), with a medium effect size of d=0.63.

82
Figure A2.6: Attitude towards hours worked, by contracted hours
Source: Online survey. All current staff contracted to work full-time or part-time. N=450.
Among those contracted to work full-time, there was no statistically significant gender
difference in attitudes towards hours worked (Figure A2.7). It was not possible to carry out
this analysis for part-time workers due to small sample sizes.

83
Figure A2.7: Attitude towards hours worked among those contracted to work full-time,
by gender
Source: Online survey. All current staff contracted to work full-time. N=355. Patterned
bars represent non-significant differences between men and women.
Respondents were asked how often they were expected to travel as part of their job, for
conferences, meetings, teaching or other events (Figure A2.8). Travel was commonplace,
with over half expected to travel within the UK at least once a term, and expected to travel
abroad at least once a year. Around a quarter reported monthly travel requirements and only
around 1 in 10 said they did not have to travel. There were no statistically significant
differences between men and women.

84
Figure A2.8: Frequency expected to travel within the UK and abroad, by gender
Source: Online survey. All current staff. N=436. Patterned bars represent non-significant differences
between men and women.
Respondents were asked to score their satisfaction with a number of aspects of their job on a
five-point scale, where 5 represents a high level of satisfaction. The mean scores on each
aspect are shown in Figure A2.9. Respondents were in general satisfied with the flexibility
and holiday entitlement available to them, and with their job as a whole. The only significant
difference between men and women was for pay, with which men were less satisfied
(p=0.025), although the effect size was small (d=0.23).
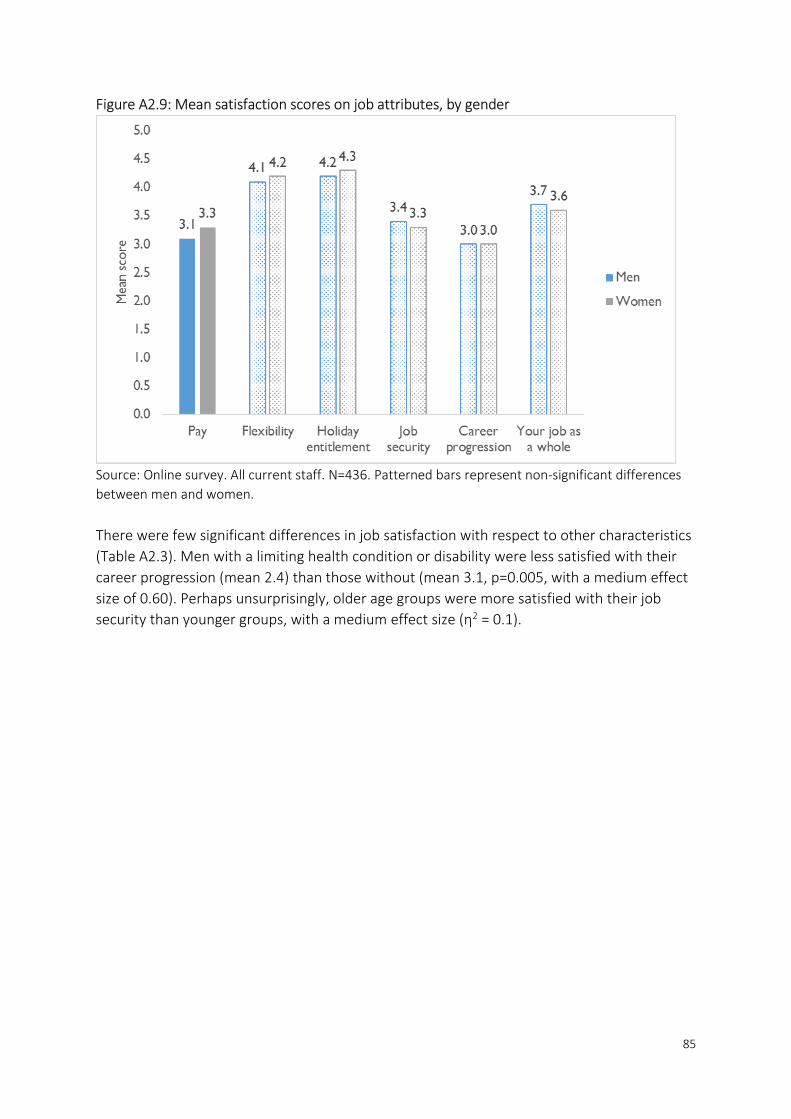
85
Figure A2.9: Mean satisfaction scores on job attributes, by gender
Source: Online survey. All current staff. N=436. Patterned bars represent non-significant differences
between men and women.
There were few significant differences in job satisfaction with respect to other characteristics
(Table A2.3). Men with a limiting health condition or disability were less satisfied with their
career progression (mean 2.4) than those without (mean 3.1, p=0.005, with a medium effect
size of 0.60). Perhaps unsurprisingly, older age groups were more satisfied with their job
security than younger groups, with a medium effect size (ƞ2 = 0.1).

86
Table A2.3: Mean satisfaction scores on job attributes, by demographic group
Pay Flexibility
Holiday entitlement
Job security
Career progression
Your job as a whole
N
Limiting health condition
Men - yes 2.7 4.2 3.9 3.0 2.4 3.3 25
Men - none 3.1 4.1 4.2 3.5 3.1 3.7 224
p-value 0.069 0.951 0.144 0.116 0.005 0.053
Cohen's d -0.600
Women - yes 3.4 3.8 4.3 3.0 2.6 3.6 20
Women - none 3.4 4.2 4.3 3.3 3.1 3.6 165
p-value 0.968 0.098 0.983 0.386 0.104 0.833
Cohen's d
Ethnicity
Men - white 3.1 4.1 4.2 3.5 3.1 3.7 202
Men - not white 3.1 4.2 4.1 3.4 2.9 3.5 45
p-value 0.947 0.661 0.799 0.691 0.375 0.326
Cohen's d
Women - white 3.4 4.2 4.3 3.3 3.0 3.6 163
Women - not white 3.2 3.9 4.2 3.1 3.0 3.6 21
p-value 0.510 0.199 0.495 0.657 0.975 0.911
Cohen's d
Age
Under 35 3.3 4.3 4.3 2.7 3.0 3.6 104
35-44 3.1 4.1 4.1 3.4 3.1 3.6 156
45-54 3.2 4.1 4.2 3.5 3.0 3.6 104
55-64 3.3 4.1 4.4 4.1 3.1 3.8 55
65+ 3.8 4.4 4.2 4.0 3.7 4.5 12
p-value 0.173 0.233 0.425 0.000 0.675 0.008
ƞ2 0.095 0.032
Source: Online survey. All current staff. Shaded cells indicate non-significant results.
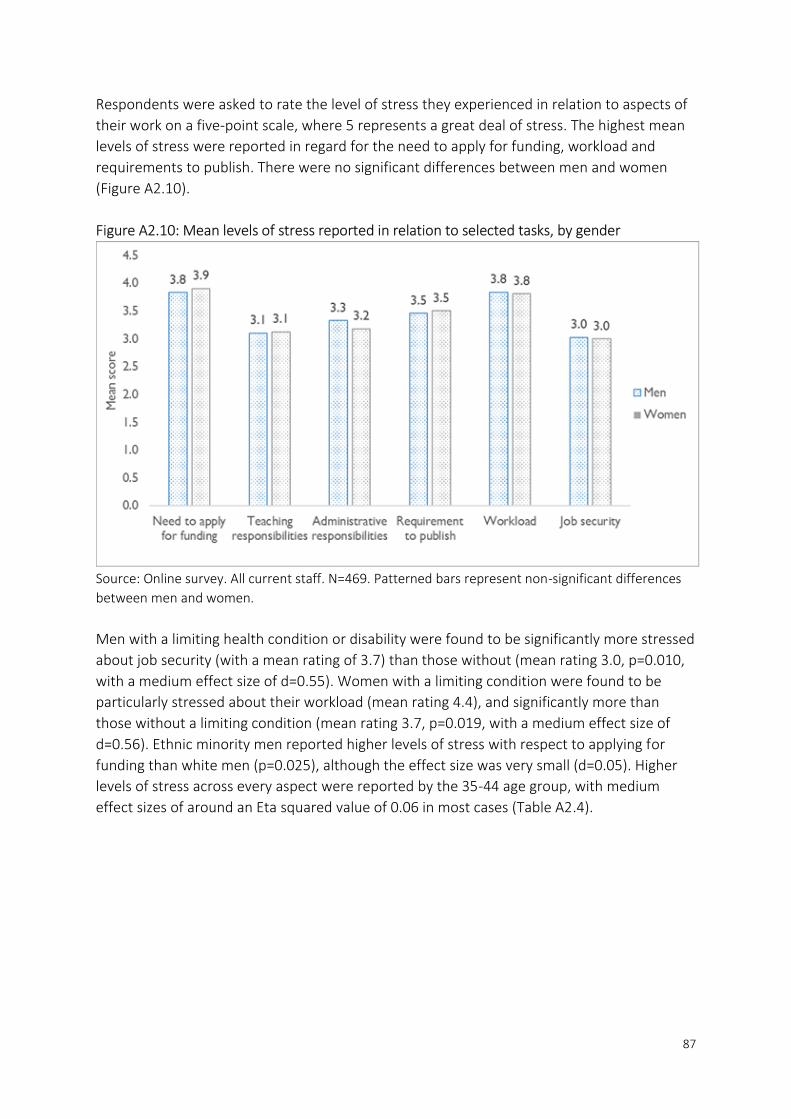
87
Respondents were asked to rate the level of stress they experienced in relation to aspects of
their work on a five-point scale, where 5 represents a great deal of stress. The highest mean
levels of stress were reported in regard for the need to apply for funding, workload and
requirements to publish. There were no significant differences between men and women
(Figure A2.10).
Figure A2.10: Mean levels of stress reported in relation to selected tasks, by gender
Source: Online survey. All current staff. N=469. Patterned bars represent non-significant differences
between men and women.
Men with a limiting health condition or disability were found to be significantly more stressed
about job security (with a mean rating of 3.7) than those without (mean rating 3.0, p=0.010,
with a medium effect size of d=0.55). Women with a limiting condition were found to be
particularly stressed about their workload (mean rating 4.4), and significantly more than
those without a limiting condition (mean rating 3.7, p=0.019, with a medium effect size of
d=0.56). Ethnic minority men reported higher levels of stress with respect to applying for
funding than white men (p=0.025), although the effect size was very small (d=0.05). Higher
levels of stress across every aspect were reported by the 35-44 age group, with medium
effect sizes of around an Eta squared value of 0.06 in most cases (Table A2.4).
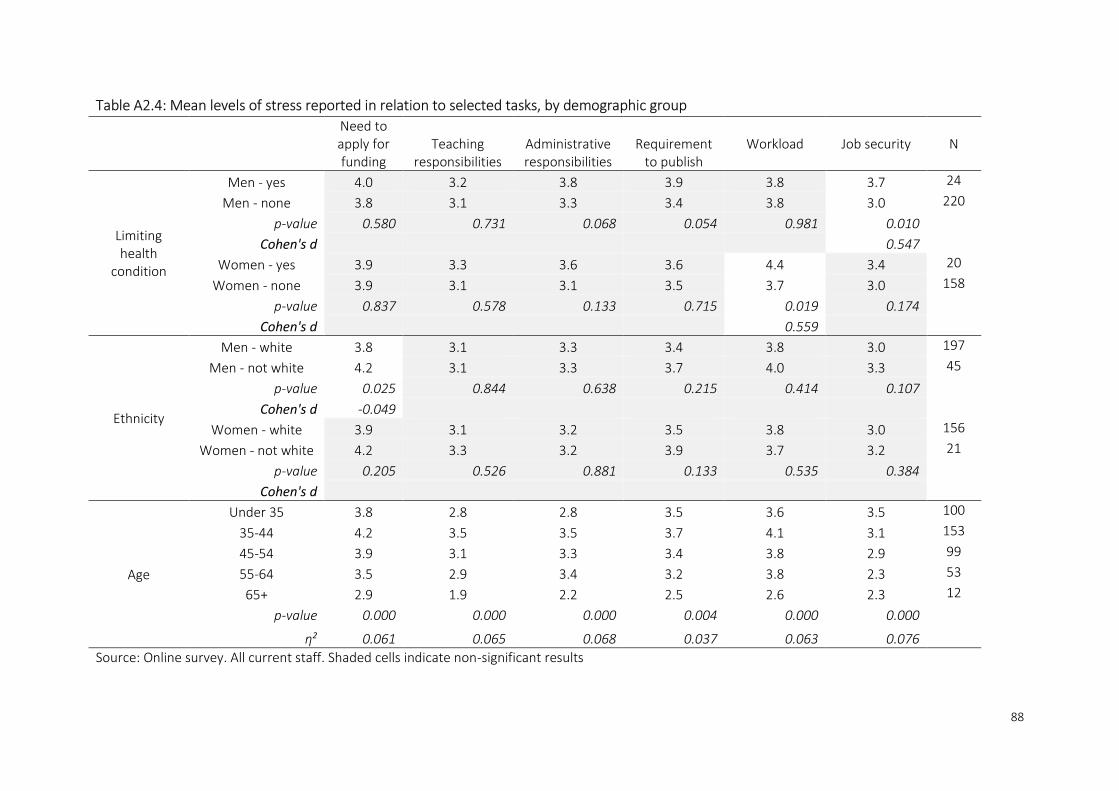
88
Table A2.4: Mean levels of stress reported in relation to selected tasks, by demographic group
Need to apply for funding
Teaching responsibilities
Administrative responsibilities
Requirement to publish
Workload Job security N
Limiting health
condition
Men - yes 4.0 3.2 3.8 3.9 3.8 3.7 24
Men - none 3.8 3.1 3.3 3.4 3.8 3.0 220
p-value 0.580 0.731 0.068 0.054 0.981 0.010
Cohen's d 0.547
Women - yes 3.9 3.3 3.6 3.6 4.4 3.4 20
Women - none 3.9 3.1 3.1 3.5 3.7 3.0 158
p-value 0.837 0.578 0.133 0.715 0.019 0.174
Cohen's d 0.559
Ethnicity
Men - white 3.8 3.1 3.3 3.4 3.8 3.0 197
Men - not white 4.2 3.1 3.3 3.7 4.0 3.3 45
p-value 0.025 0.844 0.638 0.215 0.414 0.107
Cohen's d -0.049
Women - white 3.9 3.1 3.2 3.5 3.8 3.0 156
Women - not white 4.2 3.3 3.2 3.9 3.7 3.2 21
p-value 0.205 0.526 0.881 0.133 0.535 0.384
Cohen's d
Age
Under 35 3.8 2.8 2.8 3.5 3.6 3.5 100
35-44 4.2 3.5 3.5 3.7 4.1 3.1 153
45-54 3.9 3.1 3.3 3.4 3.8 2.9 99
55-64 3.5 2.9 3.4 3.2 3.8 2.3 53
65+ 2.9 1.9 2.2 2.5 2.6 2.3 12
p-value 0.000 0.000 0.000 0.004 0.000 0.000
ƞ2 0.061 0.065 0.068 0.037 0.063 0.076
Source: Online survey. All current staff. Shaded cells indicate non-significant results

89
Respondents were asked to rate the extent to which different aspects of their job
represented a challenge to sustaining their academic career, on a five-point scale where 5
implies a huge challenge. The highest score (i.e. greatest challenge) was found to be the
pressure to acquire funding (Figure A2.11). Although comparatively less challenging, the
travel expected, was significantly more challenging for women (p=0.010) and insufficient pay
was more challenging for men (p=0.034), although the effect sizes were small in both cases
(0.26 and 0.21 respectively). No other significant differences were found between men and
women.
Figure A2.11: Mean extent to which aspects of the job represent a challenge to
sustaining current academic career, by gender
Source: Online survey. All current staff. N=416. Patterned bars represent non-significant differences
between men and women.
There were a number of significant differences with respect to other groups, and the effect
sizes were medium in most cases (Table A2.5). Men with a limiting health condition on
average perceived greater challenges than men without a health condition from losing
interest (p=0.010, d=0.56), the expectation to attend events (p=(0.000, d=0.87), demands
from colleagues (p=0.032, d=0.455) and the pressure to publish (p=0.039, d=0.45). Women
with a health condition also perceived demands from colleagues as a greater challenge than
women with no health condition (p=0.021, d=0.563). Ethnic minority men perceived a

90
number of factors to be more challenging than white men did; travel (p=0.002, d=0.53), the
expectation to network (p=0.014, d=0.41), the lack of job security (p=0.036, d=0.35),
insufficient pay (p=0.022, d=0.38), the hours expected (p=0.005, d=0.47) and the pressure to
acquire funding (p=0.011, d=0.42). Ethnic minority women also perceived pay to be a greater
challenge than white women (p=0.012, d=0.61). Most aspects were perceived as most
challenging by those in the 35-44 age group.
Former staff were also asked to rate the extent to which the same aspects had presented
challenges to sustaining their academic career. The mean rankings were very similar to those
given by current staff (Figure A2.12). The pressure to acquire funding was the biggest
challenge for both groups, with a lack of pay and job security considered greater issues than
the specific demands of the job itself.
Figure A2.12: Mean extent to which aspects of the job represented a challenge to
sustaining previous academic career – current and former staff
Source: Online survey. All current staff (N=446) and former staff (N=13).
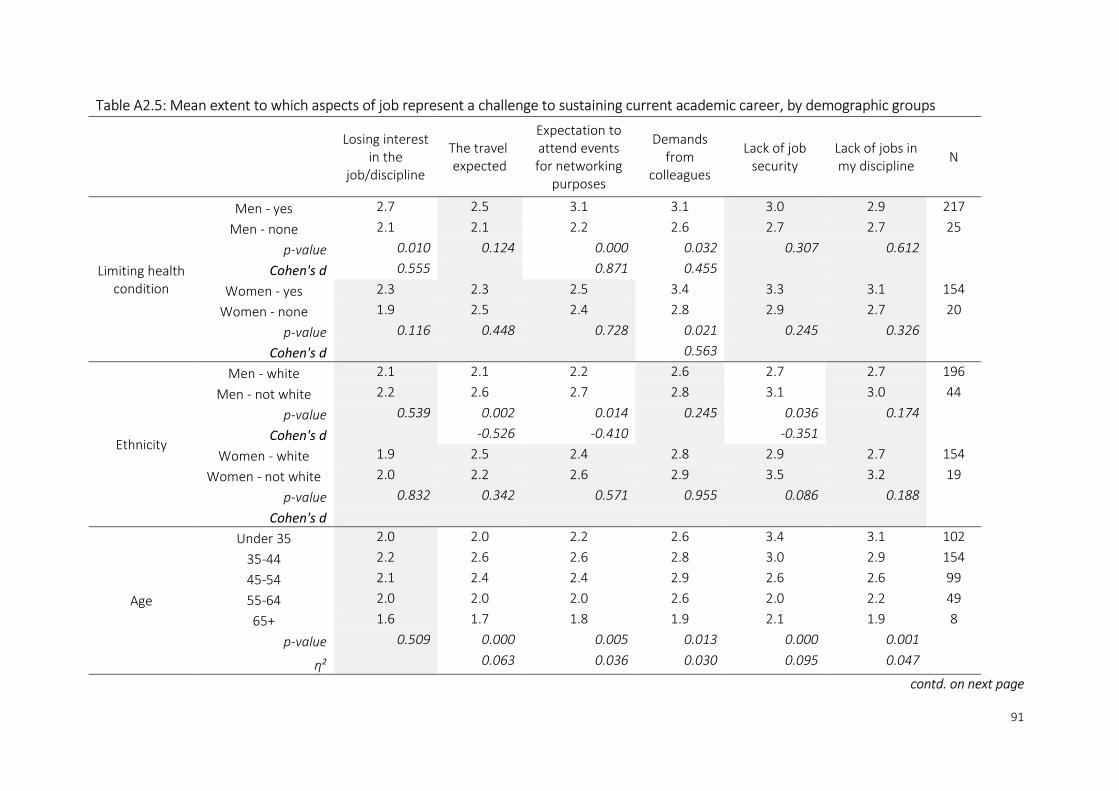
91
Table A2.5: Mean extent to which aspects of job represent a challenge to sustaining current academic career, by demographic groups
Losing interest in the
job/discipline
The travel expected
Expectation to attend events for networking
purposes
Demands from
colleagues
Lack of job security
Lack of jobs in my discipline
N
Limiting health condition
Men - yes 2.7 2.5 3.1 3.1 3.0 2.9 217
Men - none 2.1 2.1 2.2 2.6 2.7 2.7 25
p-value 0.010 0.124 0.000 0.032 0.307 0.612
Cohen's d 0.555 0.871 0.455
Women - yes 2.3 2.3 2.5 3.4 3.3 3.1 154
Women - none 1.9 2.5 2.4 2.8 2.9 2.7 20
p-value 0.116 0.448 0.728 0.021 0.245 0.326
Cohen's d 0.563
Ethnicity
Men - white 2.1 2.1 2.2 2.6 2.7 2.7 196
Men - not white 2.2 2.6 2.7 2.8 3.1 3.0 44
p-value 0.539 0.002 0.014 0.245 0.036 0.174
Cohen's d -0.526 -0.410 -0.351
Women - white 1.9 2.5 2.4 2.8 2.9 2.7 154
Women - not white 2.0 2.2 2.6 2.9 3.5 3.2 19
p-value 0.832 0.342 0.571 0.955 0.086 0.188
Cohen's d
Age
Under 35 2.0 2.0 2.2 2.6 3.4 3.1 102
35-44 2.2 2.6 2.6 2.8 3.0 2.9 154
45-54 2.1 2.4 2.4 2.9 2.6 2.6 99
55-64 2.0 2.0 2.0 2.6 2.0 2.2 49
65+ 1.6 1.7 1.8 1.9 2.1 1.9 8
p-value 0.509 0.000 0.005 0.013 0.000 0.001
ƞ2 0.063 0.036 0.030 0.095 0.047
contd. on next page
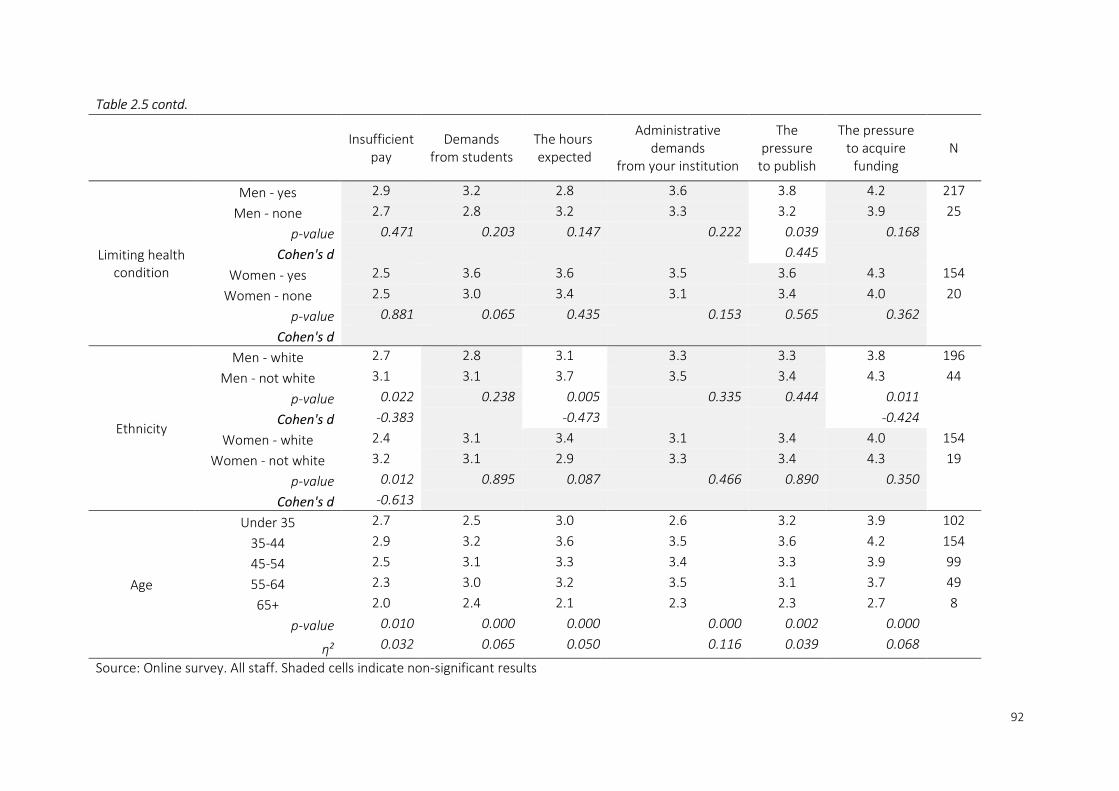
92
Table 2.5 contd.
Insufficient pay
Demands from students
The hours expected
Administrative demands
from your institution
The pressure
to publish
The pressure to acquire
funding N
Limiting health condition
Men - yes 2.9 3.2 2.8 3.6 3.8 4.2 217
Men - none 2.7 2.8 3.2 3.3 3.2 3.9 25
p-value 0.471 0.203 0.147 0.222 0.039 0.168
Cohen's d 0.445
Women - yes 2.5 3.6 3.6 3.5 3.6 4.3 154
Women - none 2.5 3.0 3.4 3.1 3.4 4.0 20
p-value 0.881 0.065 0.435 0.153 0.565 0.362
Cohen's d
Ethnicity
Men - white 2.7 2.8 3.1 3.3 3.3 3.8 196
Men - not white 3.1 3.1 3.7 3.5 3.4 4.3 44
p-value 0.022 0.238 0.005 0.335 0.444 0.011
Cohen's d -0.383 -0.473 -0.424
Women - white 2.4 3.1 3.4 3.1 3.4 4.0 154
Women - not white 3.2 3.1 2.9 3.3 3.4 4.3 19
p-value 0.012 0.895 0.087 0.466 0.890 0.350
Cohen's d -0.613
Age
Under 35 2.7 2.5 3.0 2.6 3.2 3.9 102
35-44 2.9 3.2 3.6 3.5 3.6 4.2 154
45-54 2.5 3.1 3.3 3.4 3.3 3.9 99
55-64 2.3 3.0 3.2 3.5 3.1 3.7 49
65+ 2.0 2.4 2.1 2.3 2.3 2.7 8
p-value 0.010 0.000 0.000 0.000 0.002 0.000
ƞ2 0.032 0.065 0.050 0.116 0.039 0.068
Source: Online survey. All staff. Shaded cells indicate non-significant results
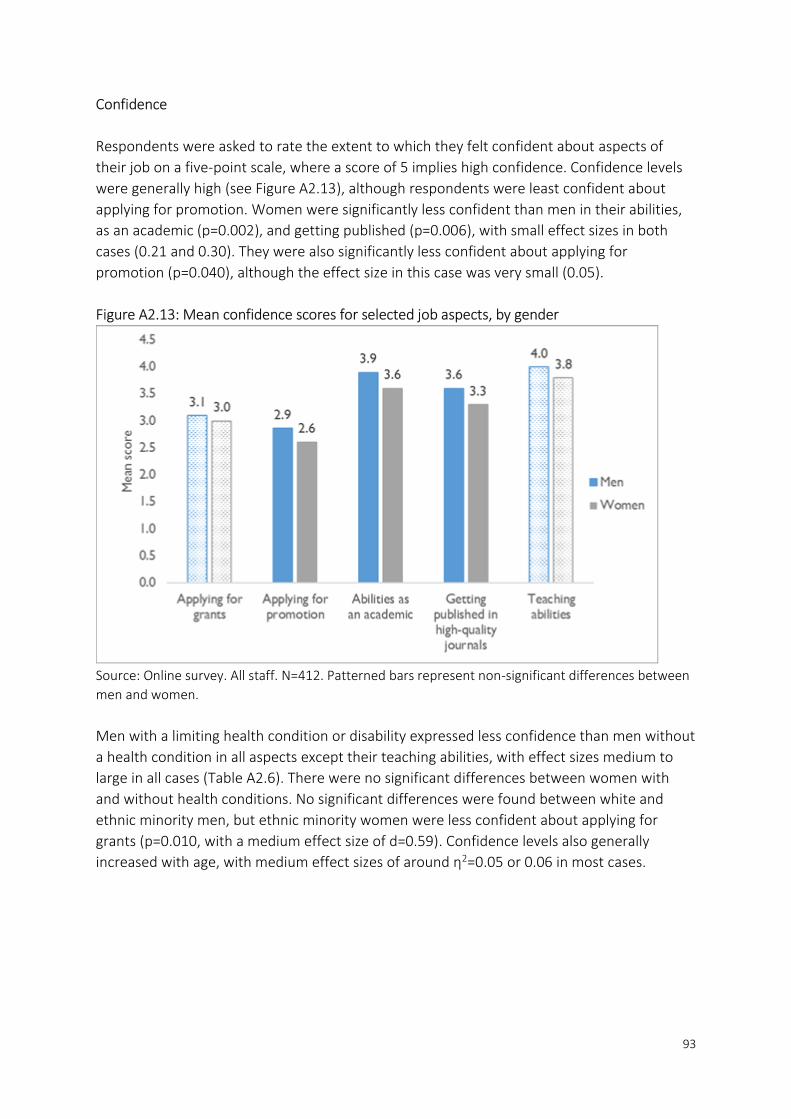
93
Confidence
Respondents were asked to rate the extent to which they felt confident about aspects of
their job on a five-point scale, where a score of 5 implies high confidence. Confidence levels
were generally high (see Figure A2.13), although respondents were least confident about
applying for promotion. Women were significantly less confident than men in their abilities,
as an academic (p=0.002), and getting published (p=0.006), with small effect sizes in both
cases (0.21 and 0.30). They were also significantly less confident about applying for
promotion (p=0.040), although the effect size in this case was very small (0.05).
Figure A2.13: Mean confidence scores for selected job aspects, by gender
Source: Online survey. All staff. N=412. Patterned bars represent non-significant differences between
men and women.
Men with a limiting health condition or disability expressed less confidence than men without
a health condition in all aspects except their teaching abilities, with effect sizes medium to
large in all cases (Table A2.6). There were no significant differences between women with
and without health conditions. No significant differences were found between white and
ethnic minority men, but ethnic minority women were less confident about applying for
grants (p=0.010, with a medium effect size of d=0.59). Confidence levels also generally
increased with age, with medium effect sizes of around ƞ2=0.05 or 0.06 in most cases.
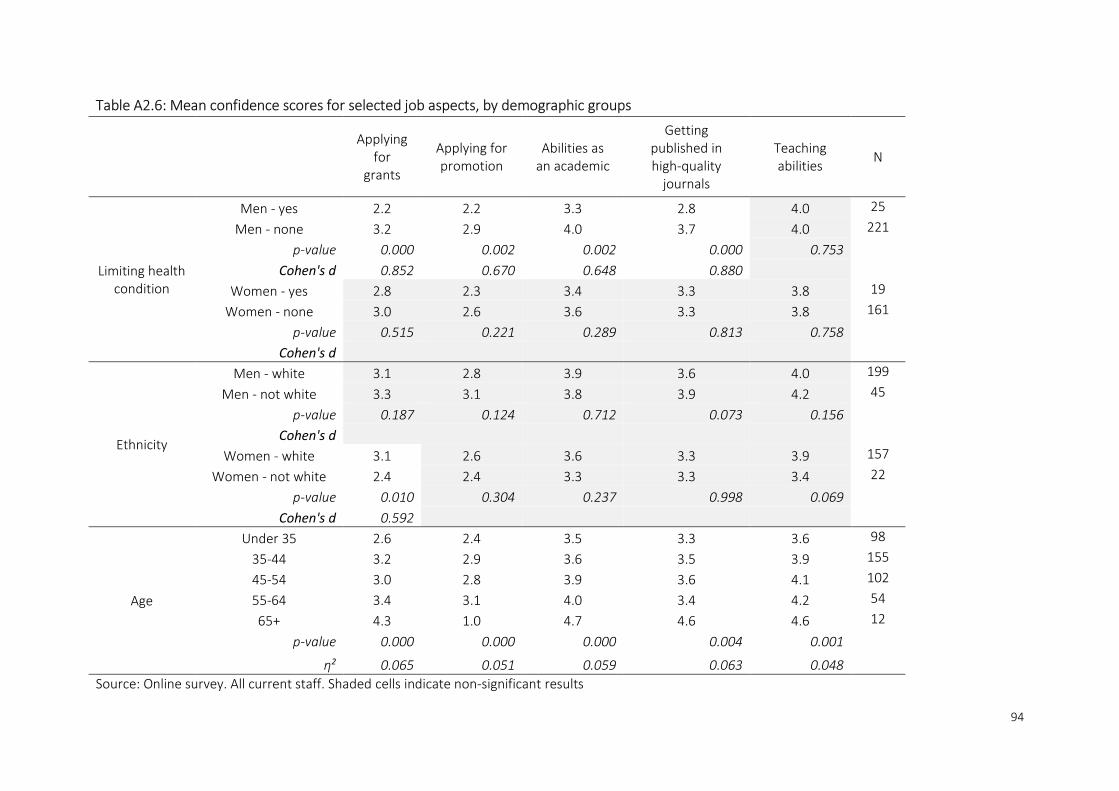
94
Table A2.6: Mean confidence scores for selected job aspects, by demographic groups
Applying for
grants
Applying for promotion
Abilities as an academic
Getting published in high-quality
journals
Teaching abilities
N
Limiting health condition
Men - yes 2.2 2.2 3.3 2.8 4.0 25
Men - none 3.2 2.9 4.0 3.7 4.0 221
p-value 0.000 0.002 0.002 0.000 0.753
Cohen's d 0.852 0.670 0.648 0.880
Women - yes 2.8 2.3 3.4 3.3 3.8 19
Women - none 3.0 2.6 3.6 3.3 3.8 161
p-value 0.515 0.221 0.289 0.813 0.758
Cohen's d
Ethnicity
Men - white 3.1 2.8 3.9 3.6 4.0 199
Men - not white 3.3 3.1 3.8 3.9 4.2 45
p-value 0.187 0.124 0.712 0.073 0.156
Cohen's d
Women - white 3.1 2.6 3.6 3.3 3.9 157
Women - not white 2.4 2.4 3.3 3.3 3.4 22
p-value 0.010 0.304 0.237 0.998 0.069
Cohen's d 0.592
Age
Under 35 2.6 2.4 3.5 3.3 3.6 98
35-44 3.2 2.9 3.6 3.5 3.9 155
45-54 3.0 2.8 3.9 3.6 4.1 102
55-64 3.4 3.1 4.0 3.4 4.2 54
65+ 4.3 1.0 4.7 4.6 4.6 12
p-value 0.000 0.000 0.000 0.004 0.001
ƞ2 0.065 0.051 0.059 0.063 0.048
Source: Online survey. All current staff. Shaded cells indicate non-significant results

95
In regard to confidence among students (Figure A2.14), men reported being more confident
with respect to applying for jobs (p=0.002) and getting published (p=0.002), and in their
abilities as an academic (p=0.001), although the effect sizes were very small (0.1, 0.1 and 0.01
respectively).
Figure A2.14: Mean confidence scores of postgraduate students, by gender
Source: Online survey. All current students. N=238. Patterned bars represent non-significant
differences between men and women.
The only difference in confidence by ethnicity was that ethnic minority students expressed
greater confidence about applying for jobs after completing their postgraduate studies
(p=0.006, d=0.40). Those aged under 35 were also more confident in this respect than those
aged 35 and over (p=0.016, d=0.41). No differences were found between those with and
without a limiting health condition (Table A2.7).
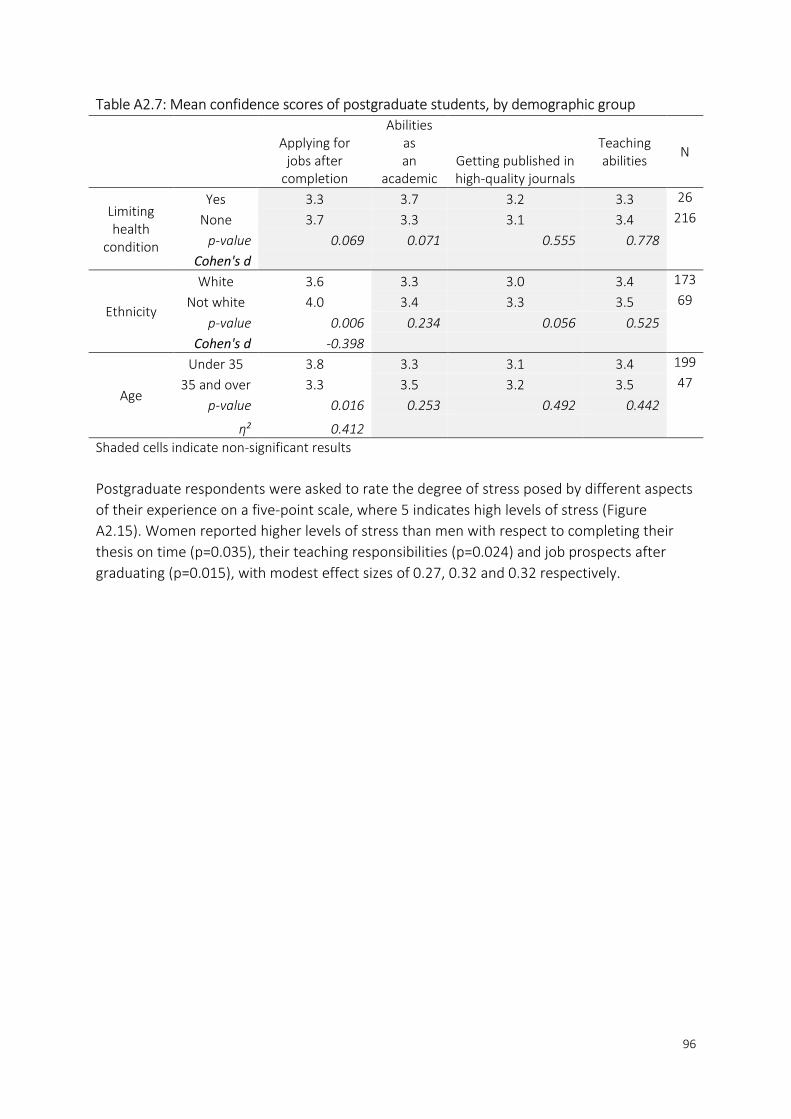
96
Table A2.7: Mean confidence scores of postgraduate students, by demographic group
Applying for jobs after
completion
Abilities as an
academic Getting published in high-quality journals
Teaching abilities
N
Limiting health
condition
Yes 3.3 3.7 3.2 3.3 26
None 3.7 3.3 3.1 3.4 216
p-value 0.069 0.071 0.555 0.778
Cohen's d
Ethnicity
White 3.6 3.3 3.0 3.4 173
Not white 4.0 3.4 3.3 3.5 69
p-value 0.006 0.234 0.056 0.525
Cohen's d -0.398
Age
Under 35 3.8 3.3 3.1 3.4 199
35 and over 3.3 3.5 3.2 3.5 47
p-value 0.016 0.253 0.492 0.442
ƞ2 0.412
Shaded cells indicate non-significant results
Postgraduate respondents were asked to rate the degree of stress posed by different aspects
of their experience on a five-point scale, where 5 indicates high levels of stress (Figure
A2.15). Women reported higher levels of stress than men with respect to completing their
thesis on time (p=0.035), their teaching responsibilities (p=0.024) and job prospects after
graduating (p=0.015), with modest effect sizes of 0.27, 0.32 and 0.32 respectively.

97
Figure A2.15: Mean reported levels of stress among postgraduates, by gender
Source: Online survey. All current students. N=239. Patterned bars represent non-significant
differences between men and women.
There were few differences in reported stress between other groups (Table A2.8). Ethnic
minority students reported greater levels of stress with regard to their teaching
responsibilities (p=0.035, d=0.32), while those aged 35 and over were more stressed than
those under 35 about completing their thesis on time (p=0.032, d=0.34).
Table A2.8: Mean reported levels of stress among postgraduates, by demographic groups
Completing thesis to required standard
Completing thesis on
time Teaching
responsibilities Requirement
to publish
Job prospects
after graduating
N
Hea
lth
co
nd
itio
n Yes 3.5 3.2 2.0 3.3 3.4 26
None 3.5 3.4 2.3 3.3 3.0 217
p-value 0.950 0.472 0.192 0.916 0.143
Cohen's d
Eth
nic
ity White 3.4 3.4 2.2 3.3 3.1 173
Not white 3.6 3.4 2.5 3.3 3.1 71
p-value 0.493 0.828 0.035 0.933 0.639
Cohen's d -0.320
Age
Under 35 3.4 3.3 2.3 3.3 3.0 199
35 and over
3.8 3.8 2.4 3.0 3.3 46
p-value 0.051 0.032 0.594 0.105 0.213
ƞ2 -0.346
Shaded cells indicate non-significant results

98
Support and working relationships
Academic staff were asked to rate the extent to which they felt supported by their institution,
and by colleagues at different levels, on a five-point scale where 5 indicated high levels of
support (Figure A2.16). The highest level of support was reported from academic peers (i.e.
those around the same career stage), and the lowest from institutions. No statistically
significant differences were found between men and women.
Figure A2.16: Mean satisfaction with support from different sources, by gender –
academic staff
Source: Online survey. All current staff. N=431. Patterned bars represent non-significant differences
between men and women.
Men with a limiting health condition reported significantly lower levels of support from their
peers (p=0.004) and from junior colleagues (p=0.029) than men without a health condition,
with medium effect sizes of 0.62 and 0.49 respectively. Women with a health condition also
reported lower levels of support from their junior colleagues (p=0.017, with a medium effect
size of 0.59). Although some significant differences emerged between the age groups, there
was no clear pattern in this regard (Table A2.9).

99
Table A2.9: Mean satisfaction with support from different sources, by demographic groups –
academic staff
Your institution
Managers and senior
staff
Your academic
peers
Junior colleagues
and students N
Limiting health
condition
Men - yes 2.7 3.2 3.0 3.0 221
Men - none 2.9 3.1 3.7 3.5 25
p-value 0.419 0.599 0.004 0.029
Cohen's d 0.620 0.491
Women - yes 2.5 3.0 3.3 2.8 164
Women - none 2.9 3.2 3.6 3.4 20
p-value 0.116 0.429 0.251 0.017
Cohen's d 0.590
Ethnicity
Men - white 2.8 3.2 3.6 3.5 202
Men - not white 2.9 2.9 3.4 3.4 43
p-value 0.921 0.193 0.194 0.685
Cohen's d
Women - white 2.9 3.2 3.5 3.4 162
Women - not white 2.6 3.4 3.6 3.5 21
p-value 0.269 0.421 0.791 0.636
Cohen's d
Age
Under 35 3.1 3.4 3.7 3.4 103
35-44 2.9 3.2 3.6 3.3 154
45-54 2.7 3.0 3.4 3.6 104
55-64 2.8 3.1 3.4 3.5 54
65+ 3.0 3.3 4.2 4.2 12
p-value 0.106 0.110 0.036 0.028
ƞ2 0.024 0.027
Source: Online survey. All staff. Shaded cells indicate non-significant results.
Students were also asked about the degree of support they received from different sources
(Figure A2.17). In general, reported scores were higher than those of staff, with the highest
levels of support received from supervisors. There were no statistically significant differences
between men and women. The only other significant difference found was that ethnic
minority students felt on average less supported by other postgraduates, with a mean of 3.7
compared with 4.0 for white students (p=0.034, with a modest effect size of d=0.31).

100
Figure A2.17: Mean satisfaction with support from different sources, by gender
– postgraduates
Source: Online survey. All current students. N=231. Patterned bars represent non-significant
differences between men and women.
Staff were asked to indicate the extent to which they agreed that they had good working
relationships on a five-point scale, where 5 indicates strong agreement that these
relationships are good (Figure A2.18). In general, working relationships were reported to be
good with all three groups; senior staff, peers and junior staff and students. Staff were also
asked to indicate the extent to which they felt isolated or different within their group or
department. The only significant difference between men and women across any of these
questions was in responses to the statement “I look different from most people in my
department”, to which women expressed significantly higher agreement (p=0.001, with a
modest effect size of d=0.39).

101
Figure A2.18: Mean scores on quality of working relationships and integration, by
gender – academic staff
Source: Online survey. All current staff. N=435. Patterned bars represent non-significant differences
between men and women.
The main other significant differences with respect to working relationships were found
between men with and without a limiting health condition or disability (Table A2.10). Men
with a health condition were less likely to agree they had a good working relationship with
their peers (p=0.042, with a moderate effect size of 0.43), and more likely to say they felt
isolated (p=0.030, d=0.47), and that compared to others in their department they felt
different (p=0.000, d=0.76) and looked different (p=0.000, d=0.87). Ethnic minority men were
also more likely to say they looked different (p=0.000, d=0.86).

102
Table A2.10: Mean scores on quality of working relationships and integration, by demographic group – academic staff
Good working relationship with… I feel isolated
within my
group or
department
I feel different
from most
people in my
department
I look different
from most people
in my department
N
Managers and
senior staff Academic peers
Junior
colleagues and
students
Limiting health
condition
Men - yes 3.8 3.8 4.1 3.0 3.8 3.4 224
Men - none 3.9 4.2 4.2 2.4 2.9 2.3 25
p-value 0.714 0.042 0.567 0.030 0.000 0.000
Cohen's d -0.432 0.468 0.755 0.865
Women - yes 3.6 4.1 4.2 2.8 2.9 3.0 165
Women - none 3.8 4.1 4.1 2.7 3.2 2.9 20
p-value 0.394 0.897 0.740 0.747 0.423 0.787
Cohen's d
Ethnicity
Men - white 3.9 4.2 4.2 2.4 2.9 2.2 202
Men - not white 3.6 4.0 4.2 2.7 3.2 3.3 45
p-value 0.129 0.079 0.998 0.221 0.151 0.000
Cohen's d -0.861
Women - white 3.8 4.1 4.1 2.7 3.2 2.9 163
Women - not white 3.9 4.0 4.1 3.0 3.0 3.1 21
p-value 0.676 0.346 0.799 0.386 0.487 0.573
Cohen's d
Age
Under 35 3.9 4.1 4.0 2.6 3.0 2.4 104
35-44 3.8 4.2 4.2 2.5 2.9 2.6 155
45-54 3.8 4.2 4.2 2.7 3.3 2.8 103
55-64 4.0 4.2 4.3 2.5 3.0 2.6 55
65+ 4.1 4.7 4.5 2.0 3.0 2.3 13
p-value 0.642 0.168 0.075 0.352 0.248 0.394
Source: Online survey. All current staff. Shaded cells indicate non-significant results

103
Staff were asked to rate the extent to which they felt that senior colleagues and peers
perceived them to have certain characteristics, on a five-point scale, where 5 indicates strong
agreement. In general, respondents felt quite well-regarded by their peers (Figure A2.19).
Men were significantly more likely to say they were perceived as brilliant (p=0.013, with a
modest effect size of d=0.38), while women were more likely to say they were perceived as
reliable (p=0.002, effect size d=0.34).
Figure A2.19: Mean extent to which respondents feel peers perceive them to have
certain characteristics, by gender
Source: Online survey. All current staff. N=426. Patterned bars represent non-significant differences
between men and women.
Similar results were found with respect to respondents’ perceptions of how senior colleagues
saw them, with men agreeing more strongly that they are perceived as brilliant (p=0.001),
while women are more likely to agree that they are perceived as reliable (p=0.000) and one
of the team (p=0.029). Effect sizes were of a similar magnitude (0.34, 0.37 and 0.22
respectively).
Students were also asked to indicate the extent to which they felt they had good working
relationships, and felt integrated within their group or department (Figure A2.20), on the
same scale as staff. Men were more likely to say they had a good working relationship with
their supervisor (p=0.011, d=0.33), while women were more likely to say that compared to
others in their department they felt different (p=0.011, d=0.33) or looked different (p=0.000,
with a medium effect size of d=0.59).
There were no differences in these perceptions with respect to health conditions or ethnicity.
Postgraduates aged 35 and over were less likely to say they had a good working relationship
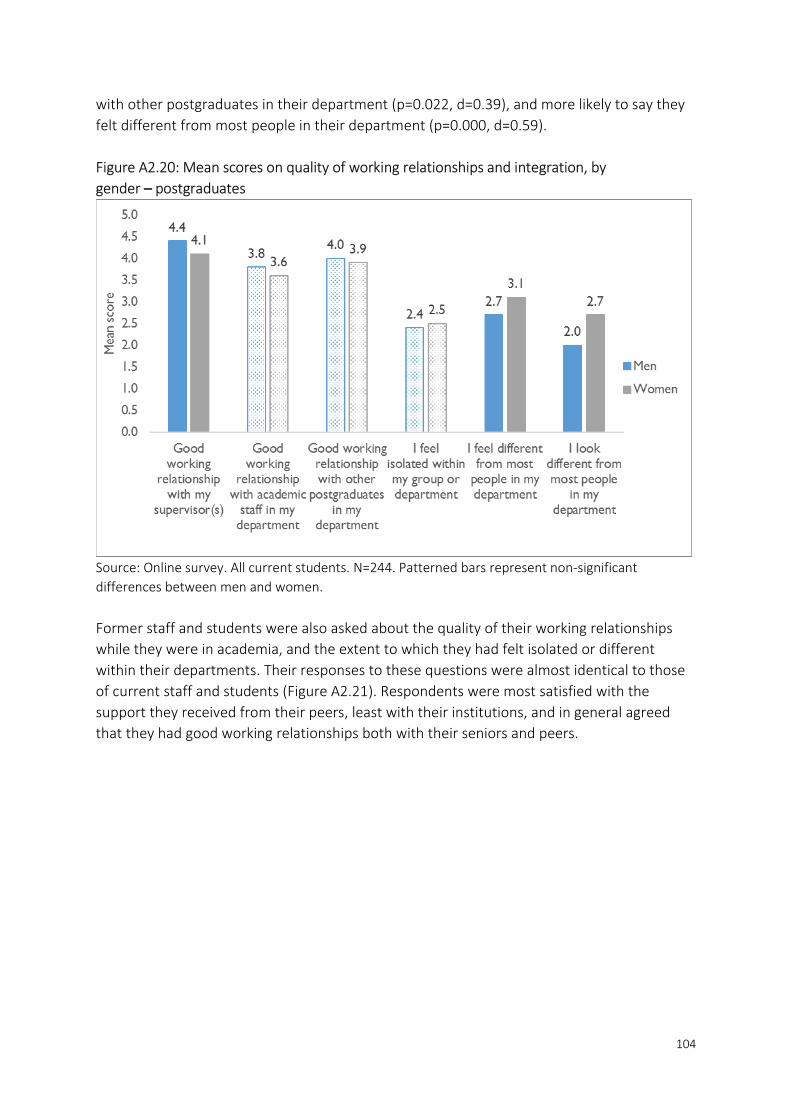
104
with other postgraduates in their department (p=0.022, d=0.39), and more likely to say they
felt different from most people in their department (p=0.000, d=0.59).
Figure A2.20: Mean scores on quality of working relationships and integration, by
gender – postgraduates
Source: Online survey. All current students. N=244. Patterned bars represent non-significant
differences between men and women.
Former staff and students were also asked about the quality of their working relationships
while they were in academia, and the extent to which they had felt isolated or different
within their departments. Their responses to these questions were almost identical to those
of current staff and students (Figure A2.21). Respondents were most satisfied with the
support they received from their peers, least with their institutions, and in general agreed
that they had good working relationships both with their seniors and peers.

105
Figure A2.21: Mean scores on support, quality of working relationships and integration
– current and former staff and students
Source: Online survey. All current staff and students (N=656) and former staff and students
(N=35).
Caring Responsibilities and Flexible Working
34% of staff reported having caring responsibilities for a child or elderly or disabled adult;
42% of women and 28% of men. Respondents were asked to indicate the extent to which
their academic responsibilities interfered with their caring responsibilities on a five-point
scale, with a score of 5 implying that they interfered a great deal. The mean score for men
was 3.4, while the mean for women was 3.7, but this difference was not found to be
statistically significant.
15% of students said they had caring responsibilities; 20% of women and 11% of men. The
mean score for the extent to which they felt their academic responsibilities interfered with
their caring responsibilities was 3.1 for women and 3.6 for men; this difference was not
found to be statistically significant.
Staff were also asked whether they had made use of flexible working provisions (in excess of
the standard flexibility available in the job), or intended to do so (Figure A2.22). A
considerable proportion of women (35%) had taken up flexible working arrangements, while
only 21% of men had. 27% of men and 29% of women had not worked flexibly but would
consider doing so, and more men reported that they would not work flexibly (29%, compared
with 20% of women). These differences were found to be statistically significant (p=0.004).

106
Figure A2.22: Proportion of academic staff who have made use of flexible working
provisions, by gender
Source: Online survey. All current staff. N=434.
Those who said they had taken up flexible working provisions were asked to score on a five-
point scale the extent to which they believed aspects of their job may have been affected as
a result (with 5 implying a large impact). Those who had not taken these provision but said
they might in future were asked to indicate the extent to which they thought it might affect
these same aspects of their work. The results of this are shown in Figure A2.24. Among those
who had taken flexible working, women were more likely than men to believe that it might
affect their promotion prospects (p=0.012) and their productivity as a researcher (p=0.002),
with moderate effect sizes of 0.50 and 0.60 respectively. Those who had not taken these
provisions but might in future expressed generally higher levels of concern than those who
had. The only significant gender difference in this group was that women were more likely to
express concern that it would affect how others at work perceived their abilities (p=0.007,
with an effect size of 0.47).
Respondents were also asked whether they had taken a career break, including time off to
care for dependents (Figure A2.23). 36% of women had done so, but only 8% of men had.
Although similar proportions of men and women said they would consider it, men were more
likely to say they would not take a career break (38% of men compared to 27% of women).
This association was found to be statistically significant (p<0.001).

107
Figure A2.23: Proportion of academic staff who have taken a career break, by gender
Source: Online survey. All current staff. N=434.
Again, those who had taken a career break, or thought they might in future, were asked to
score on a five-point scale the extent to which they felt taking a career break would have
consequences for aspects of their work (Figure A2.25). For both those who had taken or
might take a career break, women were more likely than men to express concern at the
impact on their promotion prospects (p=0.006 for those who had taken a career break and
p=0.024 for those who might take one), and their productivity (p=0.000 for those who had
taken a career break, and p=0.038 for those who might take one). Effect sizes were moderate
for those who might take a career break (d=0.45 and 0.41 respectively), and large for those
who had taken a career break (d=0.70 and 0.93). Again, those who had not taken a career
break but might do so in future expressed slightly higher levels of concern overall.

108
Figure A2.24: Perceived impact of taking flexible working, by gender and whether have taken or might in future
Source: Online survey. All current staff who have taken or would take up flexible working provisions. N=239. Patterned bars represent
non-significant differences between men and women.

109
Figure A2.25: Perceived impact of taking a career break, by gender and whether have taken or might in future
Source: Online survey. All current staff who have taken or would take a career break. N=204. Patterned bars represent non-significant differences between
men and women.
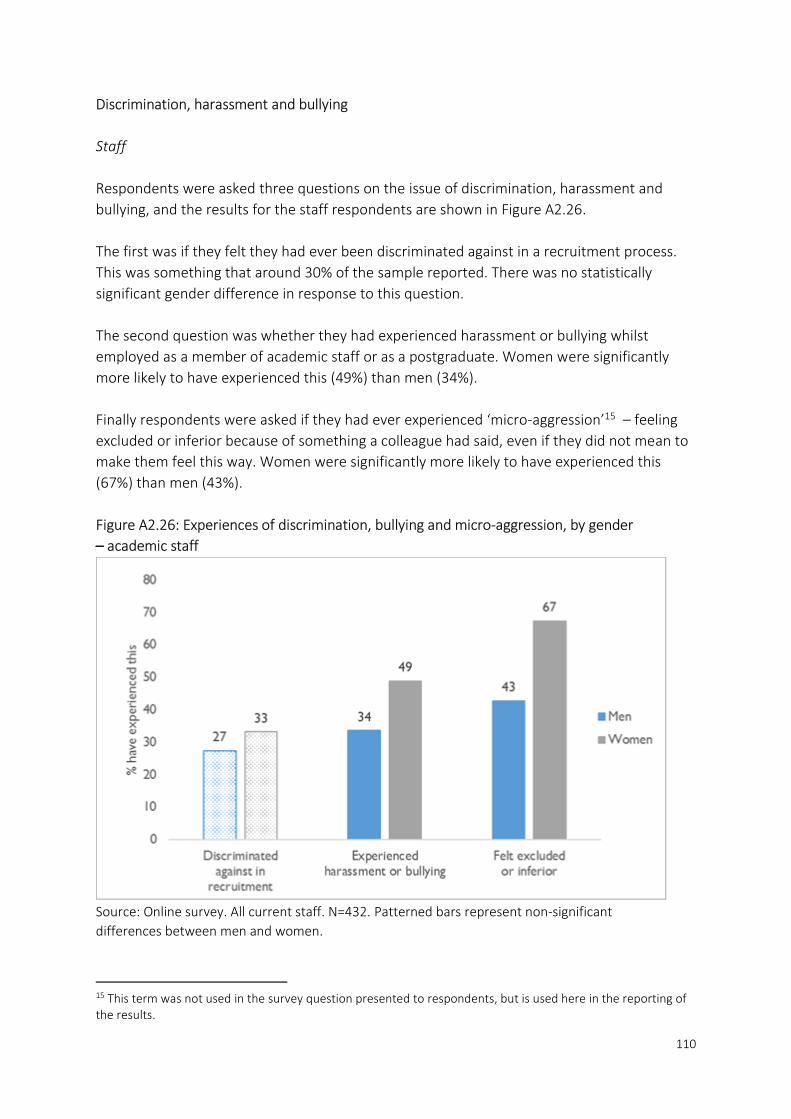
110
Discrimination, harassment and bullying
Staff
Respondents were asked three questions on the issue of discrimination, harassment and
bullying, and the results for the staff respondents are shown in Figure A2.26.
The first was if they felt they had ever been discriminated against in a recruitment process.
This was something that around 30% of the sample reported. There was no statistically
significant gender difference in response to this question.
The second question was whether they had experienced harassment or bullying whilst
employed as a member of academic staff or as a postgraduate. Women were significantly
more likely to have experienced this (49%) than men (34%).
Finally respondents were asked if they had ever experienced ‘micro-aggression’15 – feeling
excluded or inferior because of something a colleague had said, even if they did not mean to
make them feel this way. Women were significantly more likely to have experienced this
(67%) than men (43%).
Figure A2.26: Experiences of discrimination, bullying and micro-aggression, by gender
– academic staff
Source: Online survey. All current staff. N=432. Patterned bars represent non-significant
differences between men and women.
15 This term was not used in the survey question presented to respondents, but is used here in the reporting of the results.

111
Those with a limiting health condition were more likely than those without to say they had
experienced all three of these (Table A2.11). Ethnic minority staff were more likely to feel
they had been discriminated against in a recruitment process (p=0.038, d=0.28). Apart from
this there were no significant differences that would suggest greater experiences of
discrimination, bullying or micro-aggression among ethnic minorities, those of different
religions or ages, or those who are not heterosexual.
Table A2.11: Experiences of discrimination, bullying and micro-aggression, by demographic
groups – academic staff
Discriminated against in
recruitment (%)
Experienced harassment or
bullying (%)
Felt excluded or inferior
(%) N
Gender
Men 27.4 33.6 42.7 248
Women 33.2 48.9 67.4 184
p-value 0.198 0.001 0.000
Cohen's d -0.235 -0.558
Limiting health
condition
Yes 48.8 71.1 71.1 45
None 27.7 36.2 51.4 397
p-value 0.004 0.000 0.012
Cohen's d 0.465 0.729 0.397
Ethnicity
White 28.2 39.6 53.1 68
Not white 40.9 43.5 58.8 369
p-value 0.038 0.543 0.386
Cohen's d -0.278
Sexual orientation
Heterosexual 31.4 41.0 55.1 45
Not heterosexual 15.6 31.1 46.7 376
p-value 0.028 0.202 0.286
Cohen's d 0.347
Age
Under 35 26.5 35.6 48.1 104
35-44 26.5 39.4 56.8 155
45-54 34.6 44.8 55.2 105
55-64 37.0 40.7 54.7 53
65+ 23.1 46.2 23.1 13
p-value 0.384 0.721 0.144
ƞ2
Religion
None 27.2 41.4 55.3 266
Christian 31.1 41.0 52.4 105
Other 38.0 30.2 50.9 53
p-value 0.277 0.306 0.786
ƞ2
Shaded cells indicate non-significant results

112
Students
Respondents were asked the same three questions as staff on the issue of discrimination,
harassment and bullying, and the results for the student respondents are shown in Figure
A2.27. Only around 13% of the sample reported that they had ever been discriminated
against in a recruitment process, and 16% that they had experienced harassment or bullying
There was no statistically significant gender difference in the responses to either of these
questions. However, women were significantly more likely to have experienced micro-
aggression; 54%, compared with 20% of men.
Figure A2.27: Experiences of discrimination, bullying and micro-aggression, by gender
– postgraduates
Source: Online survey. All current students. N=246. Patterned bars represent non-significant
differences between men and women.
No significant differences in these experiences were found by ethnicity, sexual orientation,
age, religion or health condition or disability.
Future plans
Staff
Respondents were asked how far they would be willing to move if they had the opportunity
to move to a higher level in their career (Figure A2.28). Most were willing to move to a
different institution if it did not mean having to relocate their household – only around 12%
were committed to staying at their present institution. A majority said they would move to a
different city, with fewer saying they would move to a different country. There were no
statistically significant gender differences in this respect.

113
Figure A2.28: Willingness to relocate for a more senior position, by gender
Source: Online survey. All current staff. N=412. Patterned bars represent non-significant differences
between men and women.
Respondents were asked how likely they were to search for other types of job, on a five-point
scale, where 5 equated to very likely. The mean scores are shown in Figure A2.29. The
relatively low mean scores indicate that in general respondents were not that likely to
consider jobs outside of academic research. There were no statistically significant gender
differences in these intentions.

114
Figure A2.29: Mean likelihood of seeking other types of job, by gender
Source: Online survey. All current staff. N=422. Patterned bars represent non-significant differences
between men and women.
Men with a limiting health condition reported a significantly higher likelihood that they would
seek another job in higher education (p=0.019, d=0.50), or outside of research or higher
education altogether (p=0.009, d=0.56). Younger age groups were more likely to seek a
research job in a different sector (p=0.000, ƞ2=0.14), or outside of research or higher
education altogether (p=0.009, ƞ2=0.03).
Respondents were asked to indicate the extent to which they felt different jobs offered
different attributes (Figure A2.30). Academia was felt to offer most in terms of interest,
depth, range of tasks, innovation and job security. A research career outside of academia was
thought to offer a better salary and work-life balance. There were no significant gender
differences.

115
Figure A2.30: Type of job that offers the most on selected attributes – academic staff
Source: Online survey. All current staff. N=364.

116
Students
Students were asked to rate how likely they were to seek an academic job after they
completed their postgraduate studies, on a five-point scale, where 5 indicates highly likely.
The mean scores were for men and women were 3.5 and 3.4 respectively, and this difference
was not statistically significant. There were no significant differences with respect to ethnicity
or health condition or disability, but postgraduates aged 35 and over were more likely to seek
an academic career than those under 35 (p=0.043, d=0.35).
Those who did not rule out an academic job were asked how far they would be willing to
move to obtain one (Figure A2.31). Over half were willing to move to a different country, and
the majority were willing to move to a different city. There were no statistically significant
gender differences in this respect.
Figure A2.31: Willingness to move in order to take up an academic position, by gender
– postgraduates
Source: Online survey. All current students who have not ruled out seeking an academic position.
N=190. Patterned bars represent non-significant differences between men and women.
Students were asked on a five-point scale, with 5 representing ‘definitely’, how likely they
were to seek other types of job after their postgraduate studies (Figure A2.32). Respondents
were most likely to say they would look for a research job in a different sector. There were no
significant differences between men and women.
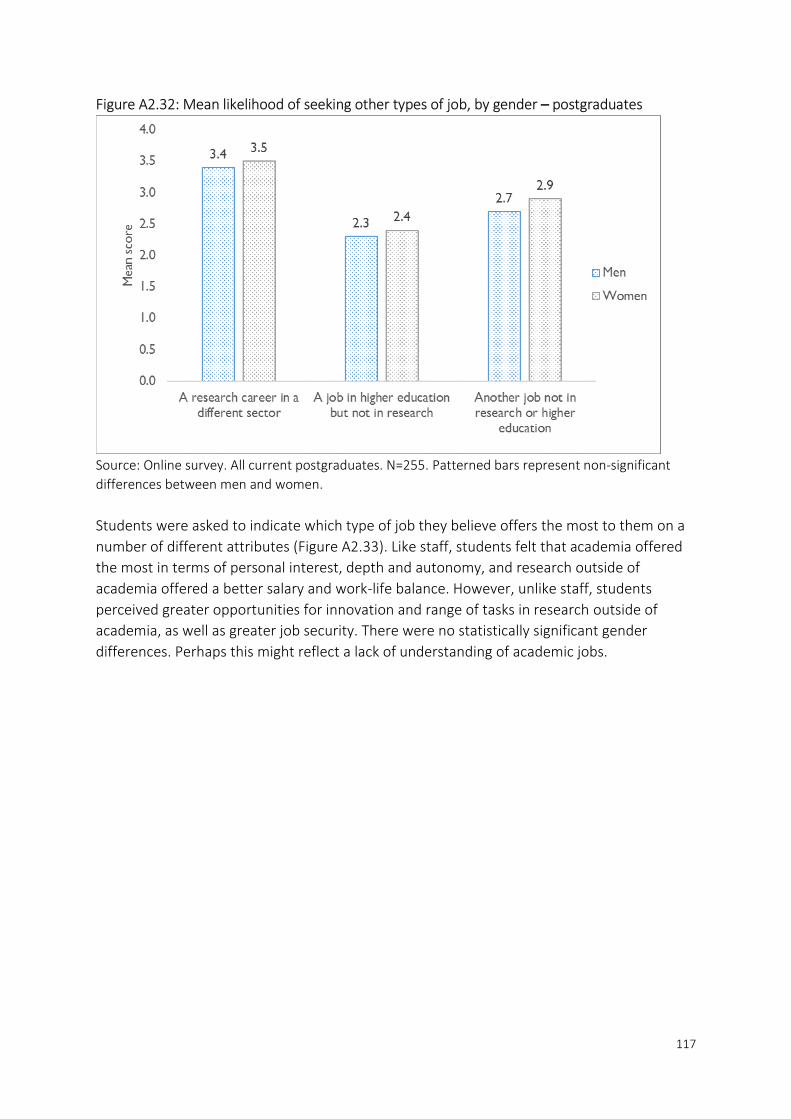
117
Figure A2.32: Mean likelihood of seeking other types of job, by gender – postgraduates
Source: Online survey. All current postgraduates. N=255. Patterned bars represent non-significant
differences between men and women.
Students were asked to indicate which type of job they believe offers the most to them on a
number of different attributes (Figure A2.33). Like staff, students felt that academia offered
the most in terms of personal interest, depth and autonomy, and research outside of
academia offered a better salary and work-life balance. However, unlike staff, students
perceived greater opportunities for innovation and range of tasks in research outside of
academia, as well as greater job security. There were no statistically significant gender
differences. Perhaps this might reflect a lack of understanding of academic jobs.

Figure A2.33: Type of job that offers the most on selected attributes – postgraduates
Source: Online survey. All current students. N=231.

Appendix 3: Qualitative responses
This chapter presents a comprehensive analysis of the qualitative data collected through the
interviews, and through the open response questions in the online survey.
Motivation for pursuing an academic career
This section will consider the participants’ motivations for undertaking an academic career or
pursuing a PhD, and how the participants’ interests in technology developed, as found within
the qualitative data. The analysis of the qualitative findings produced two distinct paths
toward a career in technology and computing. Some participants developed an interest in
technology from a young age under the influence of their parents, particularly their fathers,
or an influential teacher in primary or high school. Participants would recall stories of their
first computer at home or the first times they were exposed to computers in school. For this
grouping, their interest was then pursued through their studies when able to – particularly in
the choice of computing, maths and physics courses in later high school.
“I was about seven years old and we bought our first computer in 1997, and I was the only
one who could pick it out how to get it to work, the DOS part of it and make anything
work. Yeah, I’ve always been into computers in general, and then I started studying it
properly in about sixth grade. We started coding and stuff.” (Interview Respondent No. 31,
female)
For the other group of participants, an interest in computing and technology developed from
their career. Some of the older participants for example had pursued mathematics degrees
and then encountered computers within their university careers, which then led them into
the direction of a more technological career.
“I started out by studying literature and comparative literature studies, but then [I
discovered] there is such a thing as information science in German, and… it has some
programming in it, and then I also became interested in linguistics rather than literature,
and linguistics has quite a bit of formula in it, so I gradually became more interested in the
mathematical computing side of things, but I didn’t start out studying that.” (Interview
Respondent No. 17, female)
I guess I’m old enough to have grown when we didn’t have computers or anything at all, so
my first encounter with computers was when I got to university and we learned
programming as part of a mechanical engineering degree, and at that point I realised that I
was reasonable at programming, so that’s where my sort of interest started and then my
PhD was sort of developing a computer controlled machine, so that’s when I realised that I
was actually better at being a software engineer than a mechanical engineer.” (Interview
Respondent No. 36, female)
From this developing interest in technology, the participants were then asked about how
their interest in an academic career developed. For the PhD students interviewed a number

120
of motivations were discussed. The most common explanations were either that the project
sounded interesting or that further study was a logical progression from their undergraduate
work.
“Part of it was I wasn’t sure what else to do. I didn’t really know about industry jobs at the
time when I was deciding what to do, but also I just quite enjoyed the research aspect. I
felt like I was actually doing something fun and useful. I mean, I really enjoyed my
undergraduate research projects, so that made me want to do a masters and PhD.”
(Interview Respondent No. 12, female)
Other participants cited the example of tutors or lecturers, with a number explaining that
they had decided to pursue their PhD at the personal suggestion or recommendation of one
of their tutors.
“One of the tutors I had there, my logic tutor, suggested that I consider doing a master’s in
artificial intelligence. He had a previous student who had gone on to do that particular
master’s and he felt that it would suit me so he suggested I look at it and it looked like an
interesting thing to do, so that’s what I did.” (Interview Respondent No. 8, female)
While many of the participants felt they had almost fallen into academia by accident through
these routes, a number of the participants felt a strong calling to the intellectual or teaching
aspects of the career. The decision to pursue a career in academia was seen as a means of
pursuing the cutting edge in technology:
“I suppose it remains the closest you can get in the modern age to being a pioneer.
They’ve explored most of the earth already, and interspace travel just doesn’t seem to be
on the cards anytime soon, so the only place you can break new ground is in research and
academia. And the speed with which we are moving forward, especially in information
technology, is exciting and I guess I want to contribute my small bit to whatever comes
next.” (Interview Respondent No. 31, female)
While a number of participants cited an academic career as very important to them, others
argued that they were primarily interested in technology and research, and that pursuing a
career in academia was not their primary motivation. For these participants, academia
provided them a means of pursuing applied research.
“I wanted work that’s interesting. If you’re spending so much time working, you want it to
be working on something interesting and with people that are interesting, doing
something that will hopefully make some sort of progress. I’m not wedded to academia,
but if I moved to industry, it would be an industry where I would still be doing research. I
try to combine physics and IT, which is what I started from [..] so even if I moved from
academia, it would still be working at some other research institute that used the super-
computer” (Interview Respondent No. 32, female)
121
“I just like programming, analysing data, finding results… so yeah, I think as long as I’m
gainfully employed, I’ll be quite happy anywhere, to be honest.” (Interview Respondent
No. 21, female)
Understanding motivation to pursue a career in academia can help explain why women drop
out, if their experience is not compatible with this. Women may not necessarily be
intrinsically interested in tech, but rather instrumentally interested in its applications and the
intellectual opportunities presented by an academic career. However, this may not keep
them in a job that does not give them the opportunity to pursue the things that matter to
them:
“I’m actually thinking about leaving academia because really, this experience here has
showed me that it’s not necessarily the field that I want to stay in, because of most
publication pressure put on us, and focus on things that I don’t believe are worth focusing
on, which is just getting publications out for the sake of it without really necessarily caring
… about whether the quality is great.” (Interview Respondent No. 27, female)
Similarly, women may feel unhappy in an environment where they are expected to display
characteristics that do not come naturally to them:
“Female members of staff, they expect us to act in a way that a male would, so very
egotistically and very driven, very competitive, you know, all the sort of male
characteristics, and I think they find it puzzling that women have a different way of
approach some things, and that doesn’t then play into what they see as a high-flying
researcher. I think some of the more male characteristics – again, I’m generalising horribly
– of, you know, being highly competitive, highly driven, to the point where they almost
have blinkered vision on what they’re trying to achieve, is very male and they can’t
understand how a woman might not be able to do that.” (Interview Respondent No. 41,
female)
One respondent cited the applied focus of her institution as something she valued, because it
was compatible with her own motivations, and that she might be less happy in a more
theory-orientated environment:
“I do this because I want to help people work better with information and computers and
the things that I know how to do and improve systems… [That’s] one of the reasons I came
here… I think if I went to [Russell Group university], they are not as focussed on that…
They don’t value that practicality as much as the prestige of being academic and that
notion of ‘this is a big fancy university and we do what we want here’… I think we have in
general just a better grounding of realising that we’re in a very privileged position but
being able to use that to help the world in whatever way our expertise will help us to do.
Rather than just being able to sit around and think great thoughts all day, or whatever they
do at [Russell Group university]” (Interview Respondent No. 7, female)

122
Working conditions and expectations
Within the qualitative data, it was widely held that the academic career had a number of
disadvantages. For a number of the participants, the choice of an academic career amounts
to a trade-off, between autonomy and money, and choosing an academic career was a choice
to allow themselves more freedom or flexibility despite the lower pay compared to industry:
“Well, I think you basically sacrifice pay for freedom of being able to study things that are
interesting to you, and that certainly was why at the moment. It will depend a little bit on
how this field that I’m in develops, so it’s not clear at the moment if I have career
progression. At the moment, as a young researcher, I’m very happy. If I become more
senior and stay at the same pay grade for years, I won’t be so … yeah, it will depend a bit
on whether people recognise that, what I’m doing is something useful.” (Interview
Respondent No. 32, female)
From this central tension, a number of other disadvantages emerged. Many respondents felt
the expectations upon them to be unreasonable. Most in lecturing positions felt it was not
possible to carry out all their teaching and admin duties and also achieve the expected
research grants and outputs. Pressures came both from institutional pressures (REF, NSS,
etc.) but also leadership within departments, with bad practices cascading down from the
top.
“I have way too much work to do within a reasonable amount of time, and I think there’s a
lot of pressure, not just from my department and from [my university], but… the way that
higher education is set up in the UK right now, you have the REF every seven years, you’ve
got now the TEF coming in, there are all these metrics that we’re supposed to be meeting,
and at the same time, you know, this idea that students are consumers and you have to
keep them happy and, you know, there’s a lot of pressure to do well against these
metrics… And, you know, I feel very squeezed in the number of hours that I have to do,
and the things that I’m required to do, and the things that I actually feel like are going to
make the most difference to my students or to the research. And so I, you know, in
practice I end up working closer to 60 hours a week on a good week, and more than that
when there’s a deadline, and it’s just very tiring.” (Interview Respondent No. 25)
One respondent summarised the problem of a lack of a ‘ceiling’ on hours or outputs – more
is always better in academia:
“The problem I think with our job is that there is no clearly defined set of tasks you have to
do, especially when you do research… It’s open-ended, you can always do more and you
have to do more to stay at the forefront of research.” (Interview Respondent No. 17,
female)
There was some suspicion about work allocation mechanisms, with some staff members
seeming to end up with more time for research than others, and there was considered to be
room for favouritism and prejudice in this, as well as other colleagues being selfish.

123
“I think you could make this career work for you if you are very principled, if you could say
no, if you really trained yourself to be a bit more ruthless, to really follow your career path
and not care too much.” (Interview Respondent No. 17, female)
Some respondents talked about the difficulty they had in saying no to things. There were
various reasons why they struggled with this. One was a feeling of guilt that another equally
busy colleague would be burdened with the task if they did not do it. There was also a
concern about the impact of saying no on sustaining and progressing in their career.
Respondents also genuinely wanted ‘extras’ such as outreach to happen because they are
important or valuable, even if they are not strictly necessary or personally career enhancing.
However doing these things (being a ‘good citizen’) was seen as not valued in promotions.
“We are told that unless we do what we would call ‘citizenship duties’, that it will affect
promotion, however I know of several colleagues who [don’t do this] and still seem to be
promoted, and I would say are promoted over people who actually are good citizens
within their workplace… And it seems to be the female members of staff that are the ones
that take on a lot more of these good citizenship roles generally, probably at the expense
of their own research outputs and probably at the expense of their own health, but they
seem to have less of a capacity to say no to people, and so if we look at...most of the
outreach things that are done in this department are done by me and one or two other
female colleagues, whereas the guys just go ‘sorry I haven’t got time’, well we don’t
actually either but somebody’s got to do it.” (Interview Respondent No. 4, female)
Confidence
Confidence emerged as a key theme from the qualitative data collected. Some respondents
noted feelings of ‘impostor syndrome’ in their academic career – the feeling that they are a
‘fraud’ and about to be discovered as inadequate in their work. The feelings of inadequacy
were more strongly felt by those who had come to computing from a different discipline:
“I think there is no reason I shouldn’t be able to do [my job]. But I do have insecurities
from time to time. Irrational mostly.” (Interview Respondent No. 5, female)
“I’ve looked at PhD’s from other people, they’re either so technical I can’t read them
because they’re about something really computer sciencey, or they’re kind of just based
on a complete literature review [..] it seems a little bit bonkers because people have done
what I’m doing before, so why can’t I just get hold of them, but that seems to be because
then you’re seen to be cheating, because you might copy someone else’s, but then I don’t
know what I’m doing, so it all seems a little bit...I think again I’m being naive but I don’t
know if I’m doing enough, and I don’t know if what I’m doing is good enough, that sounds
awful doesn’t it?” (Interview Respondent No. 1, female)
Academic careers combine a wide range of competencies – writing, researching, teaching,
public speaking, time management – and for many it is a daunting experience. In many cases,
developing competence is achieved on the job. Teaching in particular can be particularly
daunting as a new lecturer:
124
“[When you are a PhD student or postdoc] you’re trained to do research, and then
suddenly [when you become a lecturer] you’re expected to do teaching and a couple of
other things such as pastoral care for students, and all these things you’re actually not
trained for… Certainly I didn’t feel very competent to start with… You do get some formal
training, and you have to actually do a two year course on that, where you get trained to
do all these things, the problem is that when you arrive there you immediately start
teaching without having this training.” (Interview Respondent No. 17, female)
Some of the PhD students interviewed reported lacking confidence across a range of
competencies.
“The things that I’m struggling with now…. organisation and so on, in a career in academia,
there’s just more things that you need to juggle and more deadlines that you need to
meet, and more responsibility and I just don’t feel like I’m cut out to do that. And giving
talks and things is obviously something that will improve over time as you do it more, but I
just feel like a lot of the key things in academia are things that I actually find really
difficult.” (Interview Respondent No. 30, female)
Issues of confidence related to diversity appeared within the qualitative data, with a number
of respondents linking the confidence with which some people display with social
background. The following accounts link specifically to issues of class and gender. For
example, the first participant commented that she did not feel her background had given her
a sense of entitlement to pursue an academic career. The second participant argues that
feelings of ‘imposter syndrome’ do not seem to affect her male counterparts.
“No-one in my family would have guessed that I would even try to pursue research and
certainly not in computing… so I’m not sure that I was prepared socially for going forward
after finishing. I don’t know if that makes sense. I had a few colleagues who finished and it
was clear that they were going to continue with research, and it wasn’t because their work
was much better than mine, but maybe they had a different, or ended at least, with a
different sense of entitlement than I did.” (Interview Respondent No. 6, female)
“We seem to suffer a lot more with feeling, like, we don’t fit and that we just don’t seem
to be as confident in our innate ability to complete a PhD, whereas the males seem to …
even though some of them are significantly less well-qualified than us, and achieve less
than us, just don’t seem to have that mental block of, “Oh, I can’t do this, and I’m not good
enough to do this,” and those kind of things. They just don’t have that.” (Interview
Respondent No. 40, female)
Support and working relationships
Throughout the research, ‘the people I work with’ was something that was repeatedly cited
as a major positive in most respondents’ accounts of their jobs. A number of the participants
felt that collaboration, meeting people and networking were seen to be among the most
important sources of job satisfaction:

125
“As I said before the opportunity to travel and to meet people, the networking [socially]
aspect, to be involved in technology at the forefront, to see what’s happening out there
and to feel like you are actually a part of all that, you’re integral to the way that technology
is developing and the impact that that’s going to have on the future generations, and
that’s quite an amazing feeling when you sit back and take that in a little bit.” (Interview
Respondent No. 14, female)
Some of the staff within the interviews recounted that they had experienced issues with
colleagues:
“The group that I work with at [University], I work with two people very closely and it’s not
a clash, it’s just that they are a lot more similar and I’m very different to both of them and I
get left out, pushed aside. I’ve had my ideas stolen. I’ve not been given opportunities that
other people are given. I bring up things and they get ignored. I get talked over. It’s not a
clash, we can get along fine. We can all go to the pub together and socialise but, again, it’s
just not the environment that’s good for me to move up in. I’ll never move up in this
situation and I’m not happy. I’m not fine with that.” (Interview Respondent No. 9, female)
Although most students generally felt well integrated, some expressed a sense of being
different, for example one student noted that they were less interested in computer gaming
then their peers, while another (who was the only girl in her student cohort) noted a more
intangible feeling of being ‘different’:
“People are generally, you know, really friendly towards me but I still, like, although I’m
included, I do get treated a bit differently. Maybe, like, the attitudes towards me are a
little bit different than to everyone else… Maybe it’s just me being paranoid, but I just feel
like I stand out a little bit.” (Interview Respondent No. 26, female)
One respondent commented on the importance of personal connections in helping with the
next stage of career after PhD, e.g. who gets the (best) first jobs:
“I think that through your PhD that in order to progress onto your first job afterwards, a lot
of it comes down to personal recommendation and there’s a thing about if a supervisor
has goodies to hand out, it’s who they go to, who gets invited along with the supervisor
and is who the supervisor introduces people to.” (Interview Respondent No. 11, female)
Yet, not all the participants felt they were successful in this respect. Acknowledging that
academic work by its very nature involves a great amount of networking, some of the
participants specifically cited networking as a barrier to their participation in an academic
career. Illustrative of this is this account from an experienced lecturer with autism:
“One of the things you have to do as an academic is networking to further your career and
talk to people and do collaborative research and stuff, and that’s particularly hard if you’re

126
autistic, because autism essentially puts a brake on social interactions.” (Interview
Respondent No. 33, male)
“Academic work requires networking and likability. Men in this discipline are often
overpowering and refuse to involve women especially those with ethnic minority
background. Networking has started to be an impossible task...I hate it” (Online survey
respondent, female)
Furthermore, some have found that cultural differences can cause isolation. One of the
participants recounted that, coming from a Muslim background, he feels isolated from what
he perceives as a less sociable atmosphere compared to the background he comes from:
“It’s accepting people socially and trying to be more sociable, that they have really failed
miserably and a lot of my Muslim colleagues that I speak to, they say the same things, that
social isolation, and it’s really affecting them and they’re thinking of new jobs, thinking of
moving and even me, I’m thinking of moving. I can’t cope with this.” (Interview
Respondent No. 39, male)
He then goes on to specifically link ‘pub culture’ as a key barrier that often results in him
being excluded by virtue of being a Muslim. This site of networking was widely reported by a
number of participants from different backgrounds as problematic. Participants often
explained that because a lot of informal networking was conducted in pub, or involving
alcohol, females were often excluded in addition to those who were uninterested for
religious reasons. A number of the female participants recounted their discomfort of or
inability to access these informal sources of networking:
“Building connections and networking in my field is done mainly by spending after work
time in pubs, which I cannot do due to caring responsibilities” (Online survey respondent,
female)
“There is a disturbing drink culture that includes post-meeting/lecture "networking" drinks
and post-work visits to the pub.” (Online survey respondent, female)
“People always select evening- pub events to socialize. I have to pick children from
childminder and I do not consume alcohol nor enjoy being in that setting. So I did feel
excluded.” (Online survey respondent, female)
Caring responsibilities and flexible working
Academic work was widely held by the participants to have a long-hours culture. For the
participants in this study, many found it hard to find a balance between working long hours
and managing their own personal lives. For those with caring responsibilities, there was a
strong perception that those who cannot work excessive hours are disadvantaged in
academic work.

127
While many people felt that an academic career was incompatible with having caring
responsibilities, a number actually found that an academic career was giving them invaluable
flexibility in their family lives.
‘It was a lot more flexible… because I came from a background where you never brought
your children into work and you didn’t mention them, and so I joined the university
because they had a really good play scheme, and it was only later that I gradually noticed
that people brought their children in occasionally and worked at home and things like that.
So yes, I achieved what I wanted, but I didn’t realise how flexible it could be, and I certainly
didn’t take advantage of that at the beginning.’ (Interview Respondent No. 34, female)
‘I kind of fell into teaching and it was just something I did a long time, and it was easier to
hold down a job while I had a job while my son was growing up, and it meant we always
had that extra income so from that point of view it kind of made sense to stay there’
(Interview Respondent No. 14, female)
The flexibility of being a PhD student was also valued in meeting their caring responsibilities:
“They are very happy to be flexible about my needs as a carer, the time I need to spend as
a carer. When I started, I spoke to my supervisor and said, “Look, I’m concerned that this is
full-time and I’m not going to be able to commit to that level,” and my supervisor said,
“Well, you know, you’ve got a good background… We know that you can do the work and
that you can fit yourself round it. Basically, I think they just trust me to do the best I can
and that’s okay.” (Interview Respondent No. 22, female)
However, although the flexibility of academia was valued in reconciling work and family, the
downside of this was still working or answering emails late at night:
“There’s a very grey dividing area between life and work, and work inevitably spills over
into the rest of my life. So like I said, I work in the evenings when my kids have gone to
bed, I have email on my phone which I find incredibly useful for keeping in communication
with colleagues and students, but at the same time it’s a doubled-edged sword because it
does mean that you’re constantly on call. So it’s very hard to entirely turn off from work, I
think.” (Interview Respondent No. 24, female)
Another issue for those with caring responsibilities was being unable to attend seminars or
social events because they are after school pick up times. Some participants were not
particularly aggrieved at missing out on some social events, arguing this is not limited to
academia but their wider social lives. Yet, many felt that they were missing out on academic
events because these events were not arranged with parents in mind. Furthermore, the PhD
students who also had caring responsibilities, reported similar issues with regard to missing
seminars and social events:
“Events often happen in the later afternoon and early evening which are the times that are
difficult for me to do. I don’t think people are intentionally excluding, but it is a common
problem that if you’ve got to get back for children you can’t do those events… The way

128
that I’ve felt not included in the department is because of me not being able to be at
group events, whether they are academic or social. A classic example is that there will be a
late afternoon seminar…and people say we’ll go to the pub afterwards, and even if I can
come to the seminar, I can’t come to the pub afterwards and that’s where the soft
networking stuff goes on and it’s frustrating.” (Interview Respondent No. 11, female)
“Things like workshops and seminars, I’ve quite frequently not been able to attend those
because they’re outside my working hours when I have childcare responsibilities.”
(Interview Respondent No. 24, female)
As the PhD students interviewed explained, some PhD courses require intensive and/or
residential courses, which is difficult to balance with other responsibilities. Indeed, there is
perhaps an assumption by those designing courses that a PhD student does not have caring
responsibilities. Having children also limits mobility with respect to finding a postdoc position.
The future career plans of many of those with caring responsibilities was consistently found
to be limited as a result.
For many respondents, the impact of caring responsibilities was seen as the biggest
difference between male and female academics – even male academics with children did not
seem to have to make the same career compromises:
“No I don’t think they do, which sounds awful but if you’ve got children, and this is going
to sound terrible, but if you’ve got kids I think it’s less frequent that you come across dads
being single dads with sole responsibility for their children, so I certainly don’t come across
it so often, and I haven’t met anybody doing a PhD who is a single dad looking after a
young person, they’re either single men who have no responsibilities or they’re married
men who have got a wife who is a part of that family unit.” (Interview Respondent No. 1,
female)
“Some of my male colleagues have children about the same age as my little daughter, they
seem to be staying quite a long time in the department, and they’re coming in early, I
don’t know how they do it, they must have very supportive wives.” (Interview Respondent
No. 17, female)
“Most of my male colleagues that have families are lucky enough to have a partner who is
largely stay at home, and so they end up doing very little of the caring part of it, so I think
there’s an imbalance there… I think a lot of male staff also see maternity leave and caring
leave as, well, it only affects your career for the time that you’re actually on the leave.
They don’t perhaps realise that it takes a while to get back into the swing of things.”
(Interview Respondent No. 41, female)
Some had managed to negotiate alternative working arrangements that suited them (e.g.
part-time or remote working), but all felt they had paid a price for this, such as having to
accept a job at a lower level, or being looked upon unfavourably around promotion time.

129
“Possibly if I had continued [full-time], I would probably now be in a much more secure
employment… One of my colleagues, we were about the same age, we did our PhDs at the
same time, so she’s now a lecturer and I’m just a Research Fellow… In hindsight, I probably
shouldn’t have taken a big gap, but the gap ended up being longer than I had envisaged to
start with… I hate to think what my pension’s going to be! It’s not going to be very good.
And also scrabbling around for part-time contracts, you know, they’re always short-term,
about 18 months, two years, and then, you know, often there’s a couple of months’ break
while they try and sort out some more funding, and then I get another 18 months. It’s not
ideal.” (Interview Respondent No. 21, female)
“I think you can’t have it all, unfortunately, and I think I have suffered because I took that
decision and I have had to say no to things… I think most of it is the kind of slow kind of
eating away at the time where you would use activities to develop your own career. So
things like attending workshops, presenting at workshops, possibly travelling to
conferences and things like that. I think it’s a gradual erosion process and you don’t really
notice it’s happening for quite a long time, and then you look at colleagues who are
working full-time and you think, ‘actually, they’ve been able to say yes to everything’… So I
think yes, I think my career has suffered, but I don’t think there was anything I could have
done differently apart from going back to work full-time, but they’ve changed that
significantly and that’s something that I didn’t want to do.” (Interview Respondent No. 24,
female)
One respondent noted the guilt they felt when they took maternity leave, not only in
abandoning their students and postdocs, but also leaving colleagues to pick up the slack, and
she had continued to carry out some duties whilst supposedly on leave:
“In some ways I feel like I didn’t get my maternity leave, I didn’t get time off much; I was
working from home trying to balance a small baby and a flood of incoming emails, and I’m
not sure how this could be handled better, also the problem was that the colleagues who
were asked to look after my students and my postdocs didn’t get any compensation for
that, so they felt ‘oh it’s just another task I have to do’, and for example some of my
colleagues just didn’t meet with my PhD students, even though they were supposed to
cover, so it’s really hard going on maternity leave when you’re research active” (Interview
Respondent No. 17)
One respondent also noted that being overwhelmed with teaching on returning from leave
makes it difficult to re-establish research:
“It might have helped if there’d been a more specific get back to work package after
maternity leave with a focus more on getting me back up to speed quickly. I came back
and went straight back into the second semester teach team which was my heavy teaching
half of the year anyway so I didn’t have any chance to re-establish myself.” (Interview
Respondent No. 8, female)
130
Discrimination, harassment and aggression
Discrimination and harassment
The qualitative responses to the online survey presented numerous examples of the
discrimination experienced by women in their academic careers. Particularly notable were
examples of discrimination based on maternity leave – or potential maternity leave.
“Expressions of interest were requested for an internal role. I was the only one who
responded. Was told that someone else was invited to job share it with me in case I
‘became pregnant again’.” (Online survey respondent, female)
“I was asked if I wanted babies in a job interview” (Online survey respondent, female)
Of particular note was the specific issue of maternity leave and funding grants:
“Insufficient guidance and support available from UK funding providers for when a PI takes
maternity leave. If a grant is suspended or extended as a result there are no additional
funds to extend the researcher's salary so there is usually a far from ideal situation in
which the researcher continues on without the PI. This pretty much always ends up as a
mess. This is likely to become more problematic now that men can also take shared
parental leave.” (Online survey respondent, female)
“As a postgraduate researcher, I wasn't allowed to take two maternity leaves on an EPSRC
grant. After the maternity leave, I came back to the department working as a teaching
assistant and someone else was working on ‘my’ previous grant.” (Online survey
respondent, female)
“[I was] asked not to get pregnant again by my doctoral training centre as they don't have
any money in the budget for maternity leave.” (Online survey respondent, female)
Female members of staff and PhD students alike, particularly in the online survey responses,
indicated they had experienced instances of sexual harassment throughout their time in
academia.
“During a tour for VIPs in the lab I was doing my PhD at, I was introduced as ‘this is [name]
who is not only beautiful but also brilliant at the work she is doing’” (Online survey
respondent, female)
“Sexual harassment online from other students who are part of the same doctoral training
centre… Being threatened and called a snitch when complaints have been made of sexual
harassment (although the complaints were not from me)” (Online survey respondent,
female)
“When I started my PhD, in my office of 9 men, most of them had page 3 girls as screen
savers, and they would make sexual comments about pretty much every female PhD

131
student in the dept. I was also propositioned quite a lot” (Online survey respondent,
female)
The online survey responses also presented a number of examples of racist discrimination.
For a number of the non-UK nationals within the online survey recounted that they had
experienced discrimination felt that their competencies were under-estimated or opinions
disregarded because they were not British, especially if their English language skills were not
perfect.
Incidents were not always dealt with well. For example one respondent had been harassed by
another student. The university ostensibly condemned the behaviour, and the perpetrator
was investigated but ultimately not sanctioned, and it was only when the police became
involved that the perpetrator ceased their harassment. The respondent was particularly
critical of the length of time the matter took to resolve, and the poor communication she
received from the university during this time.
‘Direct’ and ‘indirect’ sexism
More prevalent within the qualitative data were experiences of sexism that many of the
participants felt were not at the level of harassment or discrimination. There was a
reluctance to identify the various incidents as sexism. Many of the respondents might
recount an incident, but would either preface by saying their experiences were “nothing
direct” or “quantifiable”, or qualify their statement by saying that they could not be sure it
was due to sexism.
“It’s not exactly quantifiable, you know, but sometimes you get the feeling, so to speak,
that sometimes your male co-workers talk over you, which they stop if you, you know,
interrupt them and point out what they’ve done which, again, you know, I think that
happens in most places, but it’s still a bit … you don’t see them doing it with their male co-
workers as much. So it’s little things like that which sort of tend to add up all the time, and
again, you know, it’s not like they mean to, you know … it’s not that it’s done intentionally,
it’s almost subconscious for them as well, so it’s really hard to point it out” (Interview
Respondent No. 32, female)
“Yeah, I also feel like the most challenging personal situations I’ve had with people I
worked with have had other issues at play, where it’s, you know, I wouldn’t want to say,
“Oh, it’s because of sexism,” and I wouldn’t want to say, “Oh, well, sexism had nothing to
do with it.” I think, you know, there are complicated situations … yeah, it’s hard to
generalise from them.” (Interview Respondent No. 25, female)
As a result of these qualifications on their experience, many of the participants felt that their
experiences were not worthy enough of HR’s consideration.
“I feel like if I went to someone and said, “This person made this sexist comment,” they’d
be like, ‘That doesn’t sound that bad. It didn’t affect your performance.’ So I don’t really

132
feel like I can deal with them in any way. I usually just laugh along with them and then I go
and complain to my supervisor as a friend, rather than as a work thing. I just say, “So and
so said this and it was really frustrating,” and he goes, “That would be frustrating. I feel
really bad for you.” That’s about it. I don’t ever really think about escalating it because it’s
never what I think an HR-type person would consider sexual harassment. It’s just sexist
comments that are demeaning without people realising it, I think is the key.” (Interview
Respondent No. 12, female)
Indeed, rather than overt forms of discrimination and harassment, the majority of women
within the study reported that it was their competence that was often in doubt because of
their gender. Broadly, women reported that there was an assumption that, within computing
and software development, “women won’t be the programmers, and women will do the
softer jobs so to speak, and not the hardcore” (Interview respondent, female). They would
then recount instances when they were made to feel their competence questioned. Common
experiences included being interrupted more frequently by male colleagues, or having their
answers double checked when provided to ensure they were accurate:
“Yes on numerous occasions, definitely, always challenged, always questioned by men,
and one of the things that really used to annoy me is that when they would ask you a
question and you would give them the answer, and then they would go and check up with
somebody else to see whether your answer matched their answer, and quite often they’d
do it in front of you.” (Interview Respondent No. 14, female)
Some respondents perceived some disciplinary ‘snobbery’ regarding their work, with those in
more ‘technical’ research areas telling them (with varying degrees of seriousness) that their
work was less valuable:
“[With my sub-discipline] there’s always an element of ‘it’s not the technical side of
computer science therefore she’s a second class citizen’, there’s still some dinosaurs that
have that attitude, and therefore you’re maybe not seen as being technical by some
people and therefore they look down on some of the work you do.” (Interview
Respondent No. 4, female)
“I used to joke, in a sort of half-hearted way, that every time I stood up in a department
seminar and gave the topic of what I was working on, a lot of men would stand up and tell
me that my problem didn’t exist or that they’d already solved it” (Interview Respondent
No. 16, female)
Furthermore, a small number of participants engaged in teaching cited their experiences with
undergraduate students as a source of problems. Within these discussions participants would
highlight that these classes are themselves male-dominated environments and would
sometimes lead to experiences of sexism or experience their competence being questioned.
“I mean, there have been … well, the obvious way has been students who have just said
they don’t want a female lecturer, and in that case I have been fully supported by a

133
Director of Programmes who just basically said words to the equivalent, ‘Tough, that’s the
person taking the course’.” (Interview Respondent No. 34, female)
“I wonder if sometimes the students can be more critical of a female lecturer. I think
maybe … I don’t know, this might just be my paranoia or something, but sometimes I feel
like things that a male lecturer could say and get away with, or could sort of, you know,
would just be accepted. There’s sort of a tendency to either appeal to our maternal nature
… it can be two things. It can be them sort of thinking, ‘Oh, she’s nice’, you know, ‘I can
sort of get one over’ kind of thing, or just not taking my word for it, or getting more critical
and sort of jumping on things that I say. But yeah, I don’t know. Maybe that’s just in my
head, but I’ve felt that a couple of times.” (Interview Respondent No. 29, female)
The experiences of the classroom are often mirrored with other staff. A number of the
participants felt that they were looked at unfavourably when it came to promotions.
“I was always knocked back because of the male being in the same situation and in the
same workplace, if there was a chance for promotion the male always got it and I was
always overlooked, and it used to drive me mad, so that’s not a nice place to be.”
(Interview Respondent No. 14, female)
Future career
As discussed previously, the academic career was felt to have many disadvantages. Within
this section, the future plans of the staff and students will be discussed. Within the
qualitative findings, emphasis was made by the participants on how these disadvantages
impacted their future plans. In particular, the key disadvantages of the academic career that
affected future plans to stay in academia was the lack of a clearly defined career path and the
lack of permanent jobs. Indeed, the early stages of an academic career were perceived as
challenging and competitive, even by those who wanted to stay in academia, and something
that put people off:
“There is still the attitude that your work is more than a job and it’s your raison d’être and
everything else gets pushed to the side lines… Even if I wanted to make it the
overwhelming thing in my life, I’m not going to be able to because I have caring
responsibilities both of young kids and older parents. Permanently working weekends and
evenings is not practical, but I also recognise if you’re coming up to deadlines you might
need to put in those extra hours. All the people who I have talked to in the department will
talk about the culture of very long hours and very high workloads.” (Interview Respondent
No. 11, female)
“I’d definitely like to stay in something science-related, but I don’t think that I’d like to go
into academia… It seems from the lecturers I met when I was an undergrad, it seems like
it’s very stressful work for not a lot of money... The folk I’ve met in academia, they all seem
to take their work with them home a lot. I quite often see lecturers or professors working
late in the department, and then they’ll go into work and they’ll say, ‘I was working on this
at home last night, or at home over the weekend’” (Interview Respondent No. 26, female)

134
In addition, the jump between short-term research positions and permanent lecturing posts
was considered a problem, with many arguing that it is difficult to meet the requirements for
permanent posts while in fixed-term low-level research posts. Indeed, this balance between
teaching and research was cited as a key theme. For some short-term researchers, there was
a feeling that they lacked teaching experience sufficient to make the move to lecturing
position. Others argued that if they are looking to get experience they may end up in
teaching-only positions which restrict their ability to maintain their research record.
“We have a lot of people on these short term contracts without the university particularly
viewing them as future permanent employees and I think it would help to have less
uncertainty at that stage in people’s careers… They come in and they do research, usually
in a fairly direct fashion, and they don’t get that much experience of teaching normally.”
(Interview Respondent No. 8, female)
“[You’re in a situation of] you’ve got your PhD but you haven’t got the experience to get
that next step, so how do I get that experience, so a lot of people have ended up going
into a teaching fellow position, which obviously is not great for your research output. I
suppose it keeps you on staff but it’s very difficult to make that step to junior lecturer from
a postdoc.” (Interview Respondent No. 4, female)
Industry was always in the background of discussions with participants. As discussed
previously, intellectual challenge and autonomy generally seen as a trade-off for better pay in
academia. A number of participants said that while they were making this trade-off for an
academic career, the situation might not remain this way for the rest of their career:
“I could be working in industry and easily make three times my salary, so it’s the constant
sort of waking up in the morning and saying, ‘Well, I’m sacrificing a lot for this job, and is
really the right thing to be doing?’” (Interview Respondent No. 25, female)
“My whole life I’ve said I’m not going to choose a job just for money and I know I would
never choose a job just for money, but at some point that becomes a practical concern.
I’m almost 35 and I’ve only ever been barely making enough money to scrape by and then
there’s this whole other field where I’d have a million opportunities and could literally
make three times what I’m making and at some point you have to think of it practically.”
(Interview Respondent No. 8, female)
In contrast, a minority of participants felt that industry was an environment where they could
apply their research into more ‘real life’ situations than academia. For these participants,
academia was found to be somewhat restricting and that industry could provide them with
more practical research:
“I think I’m more goal-orientated and like the problems that apply more to real life. There
isn’t a lot of freedom to do that in academia. It’s more blue sky research, which is great in
some ways, but a lot of the times the problems that we study are not very applicable to

135
real life and there’s a lot of real world problems that aren’t always considered. I just like
problems that are a little more tangible.” (Interview Respondent No. 9, female)
In addition to the greater pay on offer, participants perceived industry as likely to offer
greater security with official HR procedures, a clear career path and realistic goals. The
contrast between industry and academia is often pronounced in the eyes of the participants:
“I’ve had people coming from industry and find this very peculiar that we have no
specified scheme of progression that you would normally expect to help people up
through grades to get on and different methods that you would normally have, and we
just don’t have that.” (Interview Respondent No. 23, female)
However, there was also some reluctance to move into industry or disadvantages perceived
Participants were then aware of that industry could potentially restrict the participants’
autonomy. Importantly too, the criticisms of a long hours culture directed to academia were
believed to be equally valid in industry. Discussions in the qualitative interviews indicated an
awareness that many small companies would be dependent on long working hours, or moves
abroad might equally result in long hours. “[I am concerned that] because they are American companies, and most of them want
you to move to America, that the work life balance is even worse, and that there is less
personal freedom which [is why I] want to stay in academia.” (Interview Respondent No.
17, female)
One respondent who had worked in academia outside of the UK noted that advantages in
other countries included a greater sense of entitlement to work-life balance, and less of an
audit culture:
“The audit culture in the UK both REF as well as exam boards and the way that teaching is
also audited, it’s a lot of work. It’s something that I didn’t quite anticipate coming from
[other country], not that it doesn’t have audit culture but… I feel like it’s somewhat less
intrusive… I think those will be the things that would push me potentially in a few years’
time to start looking for something [abroad].” (Interview Respondent No. 10, female)
A further problem observed by the staff and students interviewed was the ‘two-body’
problem. This problem was faced by those contemplating life as an early career researcher
but who had dependents – partners, children or family – nearby and were reluctant to move
away. For the students or early career researchers, short contracts and postdoctoral
opportunities put an emphasis on being mobile that can act to restrict the ability of
participants to maintain their academic careers:
“[Husband] has a [new job], so we will be here for another four or five years. So I’m here
and I don’t really know what I can do. I would love to do some research, probably I would
need to do research in English. I can’t research in the UK, legally, anymore. I don’t have the
right to work there, so that’s out. So I don’t really know. I don’t really what my future is…
I’m trying to get excited about industry!” (Interview Respondent No. 6, female)
136
“It’s one thing that does annoy me about me and my career, because I’ve got, like, a really
close family close where I live, and I’ve got a long-term boyfriend, been together for a long
time now, so you know, I can’t just pick up and leave without thinking about him and also
buying the house now as well, we’re even more tied down. So I guess yeah, there’s not
much … I would be willing to move for a job, but it would just be difficult” (Interview
Respondent No. 35, female)
Some of the participants too felt they were ‘too late’ for a move to industry, with their
lengthy tenure in academia making they felt they would be unable to adjust to work outside
of the University:
“At this point, I don’t think I could fit in. I think I’ve been doing this for too long now and
this is where the majority of my experience is.” (Interview Respondent No. 7, female)
Some of those who had previously worked in industry said they had actually found it more
sexist than academia; others had found no difference, but none reported finding academia
more sexist than industry.
“I actually found it was more in industry where I felt excluded, more than I do here. Just
because there were so many more men and a lot of them had the attitude that I couldn’t
do the job for whatever reason, so I had to prove myself.” (Interview Respondent No. 7,
female)
“I don’t generally notice it most of the time, because the people that I speak to a lot, my
supervisors and my office, and they’re normally alright. So I don’t feel, like, sexism there. I
felt it at my work quite a bit when I worked outside of academia” (Interview Respondent
No. 35, female)
Diversity
A number of more general findings emerged with respect to respondents’ views on diversity,
and it is worth presenting these here.
Attitudes to increasing diversity initiatives
Within the qualitative interviews, participants were asked about their views on the diversity
of academic computer science. A number of participants were optimistic that things might be
changing. Participants noted greater awareness and efforts within this area from universities
and funders. In addition, there was greater awareness noted of things like all male panels at
conferences. Yet, there was variation between the participants and the various departments
they described in how committed those at the top seemed to improving diversity. Indeed,
there was a sense that improving diversity in academic ICT will not happen without firm
actions - good intentions are not enough:
137
“But the male staff are all saying, “Oh, yes, yes, you know, we’re very equitable minded,”
and all the rest of it, but I don’t think they understand the difference between personally
kind of advocating that this should be done and the changes which have to be made.”
(Interview Respondent No. 41, female)
Some respondents reported that they were grateful that initiatives such as Athena SWAN
were giving the problem of diversity greater recognition in universities. Yet, there was
concern that a focus on the formal – e.g., numbers, flexible working policies - did not capture
more subtle forms of discrimination experienced by those interviewed:
“It doesn’t always accurately reflect what’s happening within the department… I feel like I
fill out these surveys, I give my input and I know other people are having the same
experiences and I share my opinion honestly, but I feel like we’re winning all these awards
for being very open and I’m wondering how. Most of the women I’ve known in academia
within the department, they’ve had issues with very similar things to me so I’m wondering
how we can say we’re very cultured and cutting edge in terms of equality and at the same
time everyone’s experience is the same… I know that, in some respects, we are moving
forward so I don’t want to act like it just happened overnight, but I think that there’s still a
lot of room for growth and we’re still missing a lot of people’s voices when we collect
feedback.” (Interview Respondent No. 9, female)
Furthermore, there was an expectation reported in the qualitative data that women would
take on diversity work such as Athena SWAN:
“There are always other things that are expected of us. I’m the lead for my department on
Athena SWAN, and the application was completed in pretty much my spare time, and all
the other bits and pieces that go along with, like, my outreach work, that again has to be
done in my spare time. And that’s seen as de rigueur, you know, that you’re going to put
these extra hours in to do these extra activities which the department values but doesn’t
take account of in your workload.” (Interview Respondent No. 41, female)
“Because I am a female in STEM I am expected to spend some part of my time working on
the women in STEM issue. The expectation is quite explicit to the point where people will
not accept ‘no’ as an answer, but my male colleagues are never even asked. Through my
whole career I have spent countless hours on the topic at the expense of personal
research and growth goals. As I write this I am in the middle of sorting out a cake for an
Athena SWAN event while the guy in the next office is writing a grant ... And yes it is
10pm.” (Online survey respondent, female)
Importantly, a minority view was also observed within the qualitative interviews. Some
participants argued that technology and computers were neutral to issues of inequality and a
lack of diversity. The belief here was that simply having an interest and being good at
computing was all that was required to have advance in an academic career. For some of the
participants, there was the feeling that initiatives, like female only fellowships, were actually
counterproductive as this interviewee explained:

138
“I keep finding that I have to fight to make people stop giving me extra help for being a
female, so for example things like they have these female only fellowships, and that’s
really nice but I always try very hard not to apply for any of those because I want to know
that I was the best out of everyone, not just the best out of the other women, but that is
my biggest issue, even at school, there were activities just for girls and I used to find that
very annoying, and just recently somebody was implying I got the fellowship because I’m a
woman and I don’t like that, there are equal chances to both male and female, so that is
my biggest thing, it’s the other way.” (Interview Respondent No. 15, female)
It is important to qualify this by citing other examples from the online survey. The feeling that
women’s achievements are devalued because of policies to address diversity was reported by
other respondents. These respondents recounted that they had experienced sexism from
colleagues based on achieving promotions or research grants. Examples from the survey
included:
“A colleague telling me that women only get appointed to jobs because of reverse
discrimination.” (Online survey respondent, female)
“When I received a grant ahead of a male colleague, he said it was only because I was a
woman and he wasn't.” (Online survey respondent, female)
Diversity initiatives may be met with backlash from those not the target of the initiatives. The
online survey yielded a handful of negative responses in this respect, with complaints falling
into five main categories.
1) Resentment at specific attempts to recruit under-represented groups, and citing ‘meritocracy’ as an argument against this.
“Posts were advertised as especially welcoming applications from persons of a background
other than my own, rather than as looking for the best person for the role.” (Online survey
respondent, male)
“[I was discriminated against because] women applied.” (Online survey respondent, male)
2) Feeling that they are unable to be themselves or express their opinions at work because they are too ‘un-politically correct’
“Sure, pretty much everyone is now too afraid to talk about anything which is not the
"party line", to disagree with certain ideas… because otherwise harassment and/or
bullying by the administration, interest groups, state officials and so on is guaranteed plus
losing his or her career. This is pretty much the only kind of systematic and
institutionalized bullying and harassment occurring.” (Online survey respondent, male)
“I feel excluded because of my conservative views and I'm rather afraid to share my
opinion with others at work.” (Online survey respondent, male)
139
3) Dismissing or trivialising the issue of micro-aggression in the workplace
“I think this is the least of the concerns.” (Online survey respondent, male)
“I think that's just workplace life isn't it?” (Online survey respondent, male)
4) Not accepting any onus on individuals to examine the impact of their own words or behaviour:
“[I experience micro-aggression] All the time, that's life, but nice that you make it even
independent of intent...” (Online survey respondent, male)
5) Taking attempts to increase female participation as a personal attack:
“Constantly being told that there are too many men around, even when working in female
dominated departments.” (Online survey respondent, male)
Barriers to diversity
When considering why more women were not talking part in academic ICT occupations, a
number of participants argued that there was a ‘leaky pipeline’ problem from initially gaining
an interest in technology, to education to finally arriving in computing careers. Although she
managed to avoid dropping out of the industry after facing these barriers, this interviewee
outlines the barriers she perceives women have to face:
“The issue is people dropping out, really. We start off with a higher percentage of women
and then they sort of fizzle, fade out, so I don’t think there’s any reason why it shouldn’t
be an excellent career for women [..] I think some of it is that people do encounter sort of
men’s club type, you know, sort of old boys network type of thing and feel that they don’t
fit in. I think some of it can be that they leave when they have families and whatever, and
it can be difficult to get back in. Because it’s such a fast-moving industry, it can be difficult
to get back in, although there are programmes for women returners” (Interview
Respondent No. 36, female)
As has been discussed throughout the previous sections, the working conditions within
academia make it difficult for anyone not committing excessive time and effort. Indeed, a
number of participants outlined they worked in departments that had a ‘that’s the way we do
things here’ attitude. The departmental culture meant that there was hostility to those who
take different approaches:
“They don’t quite see… that there is a different way of doing things and that women do
things differently, and you can achieve the same end through different ways.” (Interview
Respondent No. 23, female)
“I think that it would be extremely beneficial for there to be more diversity in academia
and in sciences. I think confining ourselves to hiring white males with a common purpose

140
or not, is taking away options for very, very good people who are ethnic minorities or who
are female. I think that that’s not necessarily a hiring problem. It’s also a pipeline problem.
I think there’s definitely room for diversity and it would greatly improve things.” (Interview
Respondent No. 40, female)
Furthermore, there was a widely shared view that the prevailing culture in academia favours
the extrovert and the selfish over those who have less confidence or are more collegial.
“Not everybody is as extroverted and loud with their opinion and people that are more
introverted and quiet… are not always heard. In some ways there’s free flowing ideas [in
academia] but I still think there’s a whole demographic that’s often missed. I think they’re
the people you see leaving academia because you have to constantly fight to have your
voice heard and that’s exhausting. Especially when you feel like you’re constantly pushed
back and somebody says that’s not a valid opinion.” (Interview Respondent No. 9, female)
Related Documents