S1 Nanostructured Ni 2 P as an Electrocatalyst for the Hydrogen Evolution Reaction Eric J. Popczun, 1 James R. McKone, 2 Carlos G. Read, 1 Adam J. Biacchi, 1 Alex M. Wiltrout, 1 Nathan S. Lewis, 2 * Raymond E. Schaak 1 * 1 Department of Chemistry and Materials Research Institute, The Pennsylvania State University, University Park, PA 16802. 2 Division of Chemistry and Chemical Engineering, California Institute of Technology, Pasadena, CA 91125. Materials and Methods Chemicals and Materials. Nickel(II) 2,4-pentanedionate [95%, Ni(acac) 2 ] (Alfa-Aesar) and tri-n- octylphosphine [tech. 85%, P(C 8 H 16 ) 3 , Lot #ROY7AGE] (TCI America), as well as oleylamine [tech. 70%, C 18 H 37 N, Lot #BCBG1298V], 1-octadecene [tech. 90%, C 18 H 36 , Lot #MKBH2370V], titanium foil [99.7%, 0.25 mm thickness], sulfuric acid [99.999%], and Nafion-117 solution [5% in a mixture of lower aliphatic alcohols and water] (Sigma-Aldrich),were used as received. High-quality colloidal Ag paint was purchased from SPI Supplies. Two-part epoxy [HYSOL 9460] was purchased from McMaster-Carr, and Nafion was purchased from FuelCellStore.com. Synthesis of Ni 2 P nanoparticles. Caution: Because this procedure involves the high-temperature decomposition of a phosphine that can liberate phosphorus, this reaction should be considered as highly corrosive and flammable, and therefore should only be carried out by appropriately trained personnel using rigorously air-free conditions. Ni(acac) 2 (250 mg, 0.98 mmol) was added to a 50-mL three-necked, round bottom flask containing a borosilicate stir bar. The flask was also equipped with a thermometer adapter, thermometer, Liebig condenser, and rubber septum. Prior to sealing the flask, 1-octadecene (4.5 mL, 14.1 mmol), oleylamine (6.4 mL, 19.5 mmol), and tri-n-octylphosphine (2 mL, 4.4 mmol) were added to the vessel. The reaction mixture was stirred moderately and was heated, using a heating mantle, for 1 h at 120 °C under vacuum, to remove water and other low-boiling impurities. The solution was then placed under Ar and heated to 320 °C. Starting at 220 °C, the solution exhibited a stark color change and turned black. After holding the solution at 320 °C for 2 h, the reaction was cooled slowly by turning off the heating mantle until the solution reached 200 °C. The flask was then removed from the heating mantle to effect rapid cooling to room temperature. The contents of the reaction mixture were transferred into centrifuge tubes equipped with caps, followed by centrifugation at 7000 rpm for 5 min (~2800 × g). The isolated powder was re-suspended using 1:3 (v:v) hexanes:ethanol and then was centrifuged again. This entire process was repeated two additional times. The resulting powder was re-suspended in hexanes and centrifuged one final time, and the supernatant was discarded. The resulting powder, consisting of the Ni 2 P nanoparticles, was suspended in hexanes and stored in a 20-mL scintillation vial.

Welcome message from author
This document is posted to help you gain knowledge. Please leave a comment to let me know what you think about it! Share it to your friends and learn new things together.
Transcript

S1
Nanostructured Ni2P as an Electrocatalyst for the Hydrogen Evolution Reaction Eric J. Popczun,1 James R. McKone,2 Carlos G. Read,1 Adam J. Biacchi,1 Alex M. Wiltrout,1 Nathan S. Lewis,2* Raymond E. Schaak1* 1 Department of Chemistry and Materials Research Institute, The Pennsylvania State University, University Park, PA 16802. 2 Division of Chemistry and Chemical Engineering, California Institute of Technology, Pasadena, CA 91125.
Materials and Methods
Chemicals and Materials. Nickel(II) 2,4-pentanedionate [95%, Ni(acac)2] (Alfa-Aesar) and tri-n-octylphosphine [tech. 85%, P(C8H16)3, Lot #ROY7AGE] (TCI America), as well as oleylamine [tech. 70%, C18H37N, Lot #BCBG1298V], 1-octadecene [tech. 90%, C18H36, Lot #MKBH2370V], titanium foil [99.7%, 0.25 mm thickness], sulfuric acid [99.999%], and Nafion-117 solution [5% in a mixture of lower aliphatic alcohols and water] (Sigma-Aldrich),were used as received. High-quality colloidal Ag paint was purchased from SPI Supplies. Two-part epoxy [HYSOL 9460] was purchased from McMaster-Carr, and Nafion was purchased from FuelCellStore.com.
Synthesis of Ni2P nanoparticles. Caution: Because this procedure involves the high-temperature decomposition of a phosphine that can liberate phosphorus, this reaction should be considered as highly corrosive and flammable, and therefore should only be carried out by appropriately trained personnel using rigorously air-free conditions. Ni(acac)2 (250 mg, 0.98 mmol) was added to a 50-mL three-necked, round bottom flask containing a borosilicate stir bar. The flask was also equipped with a thermometer adapter, thermometer, Liebig condenser, and rubber septum. Prior to sealing the flask, 1-octadecene (4.5 mL, 14.1 mmol), oleylamine (6.4 mL, 19.5 mmol), and tri-n-octylphosphine (2 mL, 4.4 mmol) were added to the vessel. The reaction mixture was stirred moderately and was heated, using a heating mantle, for 1 h at 120 °C under vacuum, to remove water and other low-boiling impurities. The solution was then placed under Ar and heated to 320 °C. Starting at 220 °C, the solution exhibited a stark color change and turned black. After holding the solution at 320 °C for 2 h, the reaction was cooled slowly by turning off the heating mantle until the solution reached 200 °C. The flask was then removed from the heating mantle to effect rapid cooling to room temperature. The contents of the reaction mixture were transferred into centrifuge tubes equipped with caps, followed by centrifugation at 7000 rpm for 5 min (~2800 × g). The isolated powder was re-suspended using 1:3 (v:v) hexanes:ethanol and then was centrifuged again. This entire process was repeated two additional times. The resulting powder was re-suspended in hexanes and centrifuged one final time, and the supernatant was discarded. The resulting powder, consisting of the Ni2P nanoparticles, was suspended in hexanes and stored in a 20-mL scintillation vial.
S2
Preparation of working electrodes. A stock solution of Ni2P nanoparticles (5 mg/mL, based on the dried Ni2P nanoparticles, in hexanes) was prepared and 5 or 10 µL increments of the stock solution (40 µL) were used to deposit the nanoparticles onto 0.2 cm2 pieces of titanium foil. Following deposition and drying under ambient conditions, the Ni2P-decorated titanium foils were annealed at 450 °C under 5% H2/Ar or H2/N2. Ag paint was then used to fasten the foils to a polyvinylchloride PVC-coated Cu wire that had been threaded through a 6 mm diameter glass capillary. All surfaces except the Ni2P-decorated side of the titanium electrode were then insulated from the solution by application of two-part epoxy.
Electrochemical measurements. Electrochemical measurements were performed using a Gamry Instruments Reference 600 potentiostat. All measurements in 0.5 M H2SO4 were performed using a two-compartment, three-electrode cell. The two compartments were separated by a Nafion® membrane to inhibit contamination of the working electrode by the contents of the counter electrode solution. All measurements in 0.5 M H2SO4 were performed using either a saturated calomel electrode (SCE) or Ag/AgCl (1 M KCl) electrode as the reference electrode. The counter electrode was a Ti mesh that had been coated with a 50/50 mixture of Ru and Ir chlorides and that had been pyrolyzed at 400 °C to generate a mixed Ru/Ir oxide. Electrochemical measurements in alkaline solutions were performed in 1 M KOH(aq). The alkaline electrochemical measurements were performed in a single-compartment three-electrode cell with Ti foil working electrodes, a Hg/HgO reference electrode, and a nickel mesh counter electrode.
Polarization data were obtained at a sweep rate of 5 mV/s while rapidly stirring the solution with a magnetic stir bar. The current-interrupt method was used to account for uncompensated resistance. A constant value for the real hydrogen electrode (RHE) potential was maintained by continually bubbling the solution with ~ 1 atm of research-grade H2(g). After electrochemical characterization of the Ni2P nanoparticles, the RHE potential was determined by measurement of the open-circuit potential of a clean platinum electrode in the electrolyte solution of interest. The short-term electrochemical stability was measured galvanostatically without any corrections for uncompensated resistance. Long-term electrochemical stability measurements were performed by use of cyclic voltammetric sweeps at 100 mV/s between +0.23 V and -0.22 V vs RHE without accounting for uncompensated resistance.
Modeling and additional discussion of polarization data. Figure S3 shows the polarization data for four Ni2P on Ti electrodes and one Pt electrode, along with a Butler-Volmer electrochemical kinetic model of
the form ! = !! 10!! − 10!
!! . For Ni2P, two regions were used for the model, with !! = 3.3 ∙ 10!!
and 4.91 ∙ 10!! A cm-2, and ! = 46 and 81 mV decade-1, respectively, for the low and high overpotential components. For Pt, a single set of parameters was used with !! = 2.73 ∙ 10!! A cm-2 and ! = 30 mV decade-1. The b constant was kept the same for the forward and reverse rate, which implies that the symmetry factor α for the reaction barrier is equal to 0.5 for both catalysts. However, the quality of the fit did not change significantly when the b factor was varied from 30 mV to 120 mV decade-1.
The Butler-Volmer model clearly matched the Pt polarization data well, including the non-linear “tail” at very low overpotentials. However, a Tafel fit would be similarly suitable for overpotentials > 15-20 mV. The Ni2P data showed an inconsistent deviation from linear Tafel behavior that also did not match the Butler-Volmer model at overpotentials below about 50 mV. We attribute this behavior to the likely presence of more complex redox equilibria associated with the nonzero oxidation state for Ni and P in the catalyst compound. The presence of catalyst-derived redox phenomena other than the HER is also

S3
consistent with the small hysteretic redox feature observed in the CV cycling stability experiment (Figure S4). Therefore it may be expected that Ni2P would not produce hydrogen with a good faradaic yield at ≤ 50 mV overpotential. Another possible explanation is redox processes in exposed Ti substrate, which is prone to irreversible oxidation in aqueous acidic solution.
Quantitative hydrogen yield measurements. Quantitative H2 yield measurements were performed in 0.5 M H2SO4(aq) using a two-electrode cell that had two compartments separated by a Nafion® membrane. The working electrode and counter electrode were identical to those employed for the three-electrode measurements described above. An inverted solution-containing graduated cylinder was positioned around the working electrode, and the volume of H2 produced from the constant cathodic current of 10 mA on a 0.2 cm2 electrode was collected in this graduated cylinder. This current was maintained for 50 min (3000 seconds), after which the volume of H2 was recorded and compared to the volume calculated from the current passed and the ideal gas law. Ni2P electrodes gave measured gas yields of 3.98 ± 0.03 mL (n=4), and Pt electrodes also gave measured gas yields of 3.98 ± 0.03 mL (n=3), as compared to the theoretical gas yield of 3.74 mL for passage of 30 coulombs of charge at 1 atm and 20 °C ambient conditions. Due to the identical measured gas volume for Ni2P and Pt, the hydrogen yield was concluded to be quantitative. The systematically larger measured gas yield compared to the theoretical value was attributed to excess electrolyte solution clinging to the sidewalls of the graduated cylinder.
Materials characterization. Powder X-ray diffraction (XRD) patterns were acquired at room temperature using a Bruker-AXS D8 Advance diffractometer with Cu Kα radiation and a LynxEye 1-D detector. Simulated XRD patterns were produced by the CrystalMaker / CrystalDiffract software package. Transmission electron microscopy (TEM) images were collected using a JEOL 1200 EX-II microscope that was operated at an accelerating voltage of 80 kV. High-resolution TEM images were collected at an accelerating voltage of 200 kV using a JEOL 2010 microscope with a LaB6 electron source and a JEOL EM-2010F STEM with a typical probe size of 0.7 nm. Lattice spacings were measured from the fast-Fourier transform (FFT) of the HRTEM images, using Gatan Digital MicrographTM software. TEM samples were prepared by drop-casting the hexane-dispersed nanoparticles onto formvar-coated copper TEM grids. Scanning electron microscopy (SEM) images were collected using a FEI NovaTM NanoSEM 630 microscope at an accelerating voltage of 2.00 kV and at a working distance of 1.5 mm. Energy dispersive X-Ray spectroscopy (EDX) data and elemental mapping data were obtained at an accelerating voltage of 10.0 kV and at a working distance of 5.0 mm. Brunauer-Emmett-Teller (BET) surface area measurements were performed using a using a Micromeretics ASAP 2020 at liquid nitrogen temperatures, and the data were analyzed using the ASAP 2020 software version 3.04 (2007). Diffuse reflectance infrared spectra were acquired using a Spectra-Tech Collector II DRIFTS accessory installed in a Bruker IFS 66/s spectrometer (Bruker Optics, Billerica MA). The nanoparticles were diluted in KBr for analysis. 400 scans at 6 cm-1 resolution were averaged for each sample using a MCT detector and scanner velocity of 40 kHz. In all cases, the spectrum of neat KBr was used as the reference spectrum. All spectral manipulations were performed using OPUS 6.0 (Bruker Optics, Billerica MA).
Estimation of turnover frequencies. The calculations used to determine the TOF values are shown below. The density was calculated using the crystal structure (unit cell) of Ni2P. Theoretical surface area values were obtained by assuming that a 0.5 nm shell represents the surface of a solid 20 nm particle. Actual surface area values were obtained from the BET measurements. Turnover frequencies were estimated per
S4
surface atom (both Ni and P), rather than per hydrogen binding site, because the hydrogen binding sites are not explicitly known.
Calculation of TOF values
Molar mass – 148.36 g/mol
Density – 7.35 g/cm3
Molar Volume – 20.2 mL/mol
Volume of a 20 nm sphere – 4.19×10⁻¹⁸ cm3
Surface area of a 20 nm sphere – 1.26×10⁻¹¹ cm2
Current Density at 100 mV overpotential – 3.16 × 10⁻³ A/cm2
Current Density at 200 mV overpotential – 0.105 A/cm2
Surface area per gram of 20 nm sphere (BET value of 327 cm2/mg):
1.26 ×10!!!!"! 1 !"#$!"#$
×1 !"#$%&'(
4.19 ×10!!"!"! × 1 !"!
7.35 != 408
!"!
!"
Average surface atoms per 1 square centimeter (used for BET-based calculations also):
3 ×6.022× 10!"!"#$%1 !"#
×1 !"#
20.2 !"!
!!= 2.00 ×10!"
!"#$%!"!
Surface Atoms per testing area (BET value = 6.56 × 10¹⁷ atoms/foil):
1 !"1 !"! (!"#$)
×4.08 ×10!!"! (!"#$%&'()
!"×2.00 ×10!" !"#$%1!"! (!"#$%&'()
= 8.17 ×10!"!"#$%!"#!
Turnover frequency (per surface atom) at η = 100 mV:
1 !"#$%&'# 2 !!
×3.16× 10!!!
1 !"! ×1 !"#96485 !
×6.022 × 10!"!!
1 !"#×
1 !"#!8.17×10!" !"#$%
= 1.21×10!!!!!!"#$!!
100 mV overpotential (theoretical value) − 1.21×10!!!!!!"#$!!
100 mV overpotential (BET-based value) − 1.50×10!!!!!!"#$!!
200 mV overpotential (theoretical value) − 0.401 !!!!"#$!!
200 mV overpotential (BET-based value) − 0.500 !!!!"#$!!
S5
Supplementary Figures
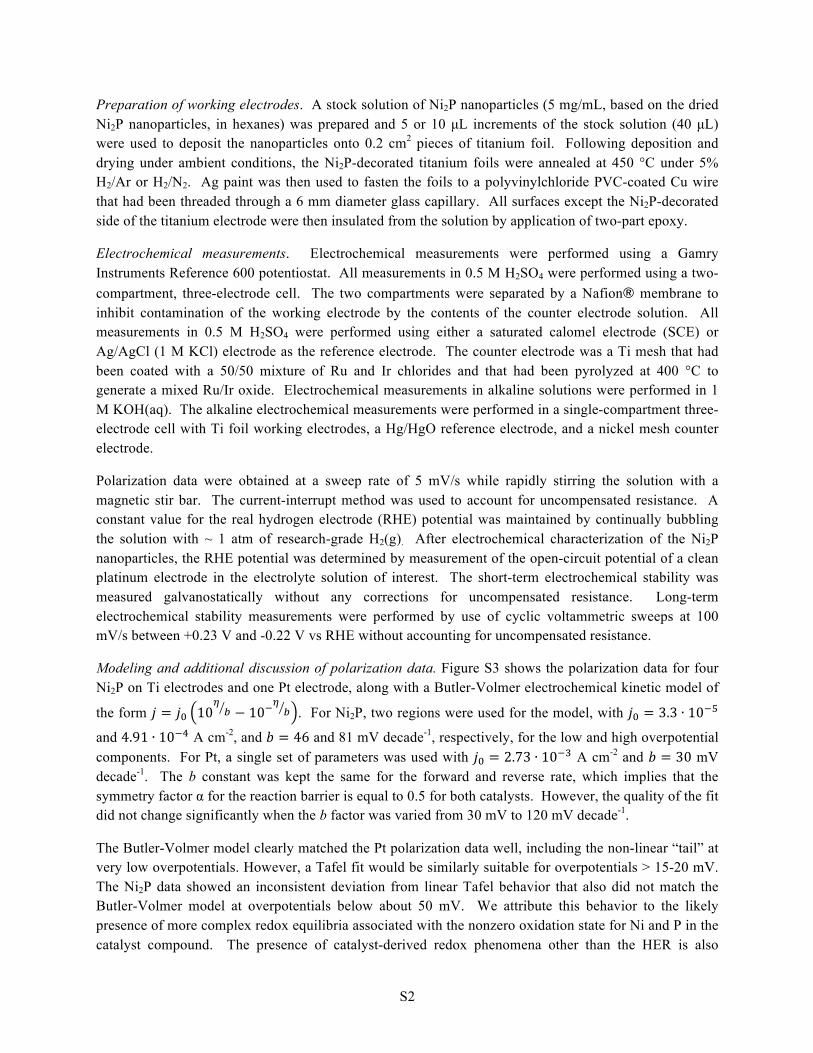
Figure S1. (Left) Indexed powder XRD pattern, enlarged from the one shown in Figure 1D of the main text. (Right) Energy-dispersive X-ray spectrum and (inset) a selected area electron diffraction pattern for the Ni2P nanoparticles shown in Figure 2A of the main text.
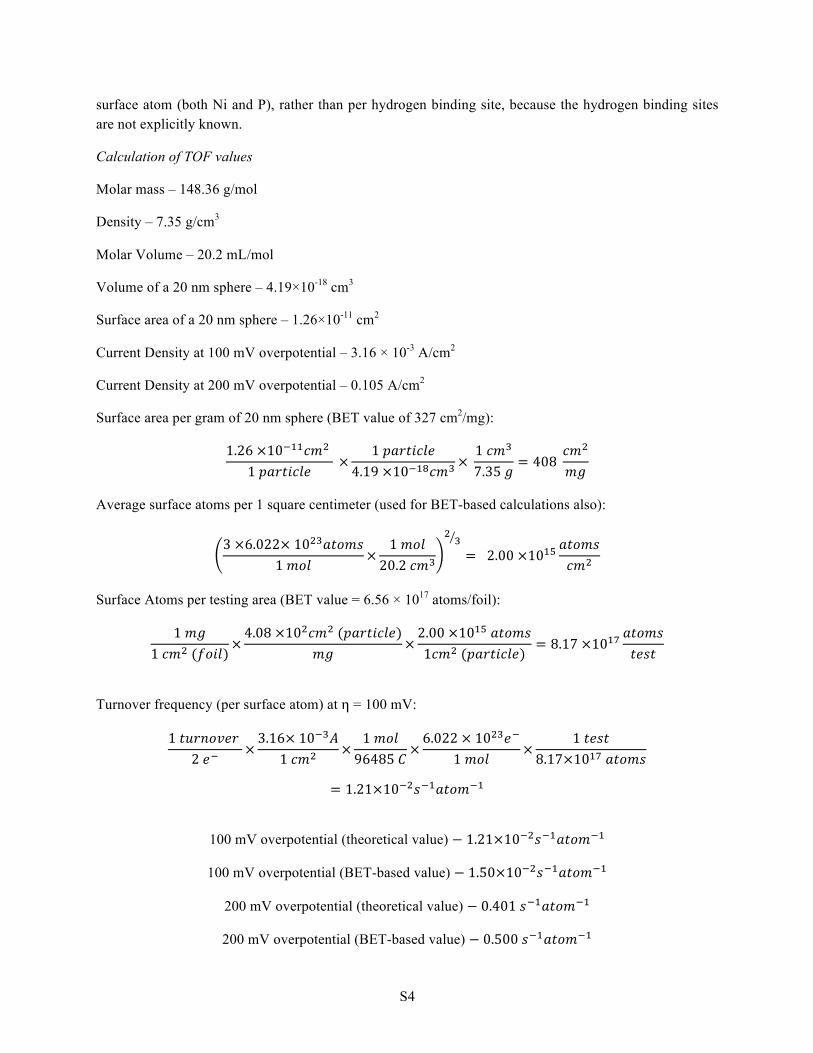
Figure S2. Scanning electron microscope (SEM) images of (A) the as-prepared Ni2P / Ti foil electrode and (B) the same electrode after annealing at 450 ºC in 5% H2/Ar. (C) Larger-area SEM image of the Ni2P / Ti foil electrode and the corresponding EDX element maps for Ni (green) and P (red). (D) Diffuse reflectance infrared Fourier

S6
transform spectroscopy (DRIFTS) data for the as-prepared Ni2P / Ti foil electrode (bottom spectrum, green) and for the same electrode after annealing at 450 ºC in 5% H2/Ar (top spectrum, blue). The peaks at 2924 and 2854 cm-1 correspond to C-H stretches of the organic surface ligands in the as-prepared sample
Figure S3. Tafel plots for the Ni2P and Pt electrodes (as in Figure 3b). The Tafel plot shows the HER activity for three Ni2P films and a Pt electrode in 0.50 M H2SO4 solution. Solid lines are the empirical HER data, and dashed lines correspond to a Butler-Volmer model.
Figure S4. Cyclic voltammograms in 0.50 M H2SO4 of a Ni2P sample on a 0.2 cm2 titanium substrate. Minimal performance degradation was observed after 500 cyclic voltammetry sweeps between +0.22 V and -0.23 V vs. RHE.
S7
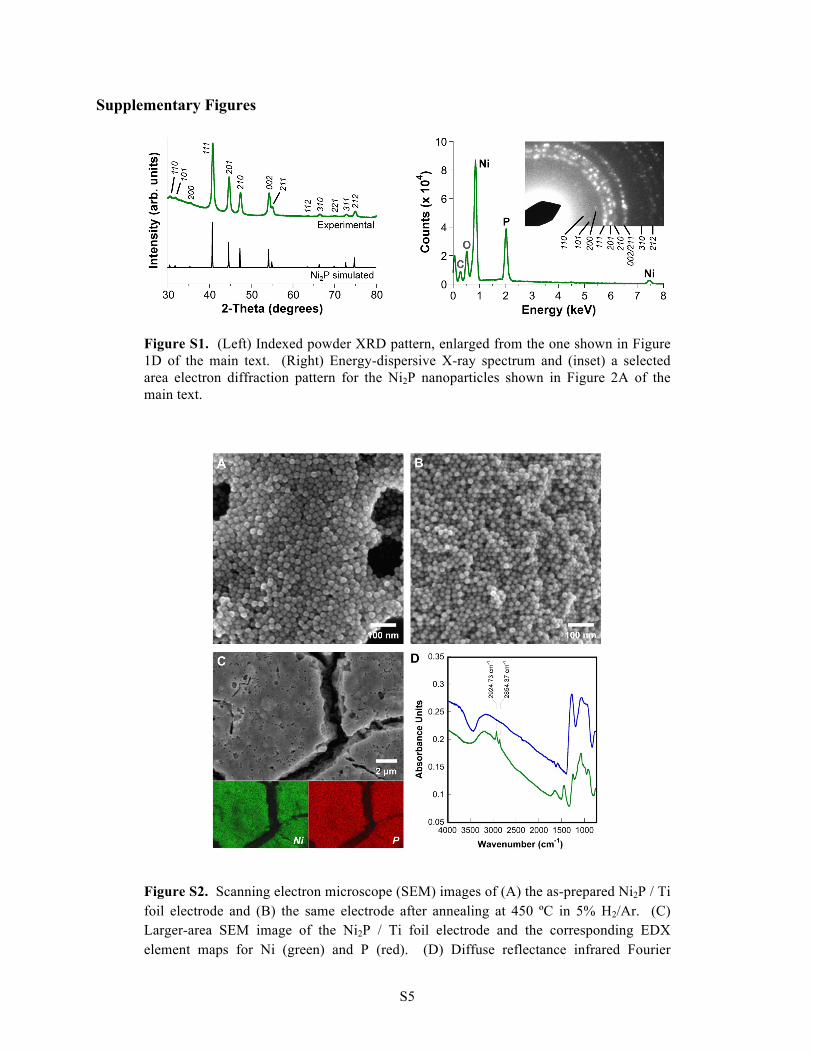
Figure S5. Representative (A) TEM image and (B) corresponding SAED pattern of the Ni2P nanoparticles taken after electrochemistry under galvanostatic conditions (C) for 4 h at a current density of -10 mA cm-2 in 0.5 M H2SO4. The nanoparticles remained Ni2P in composition and structure [confirmed by the SAED pattern in (B)] but decreased in diameter to 12 ± 2 nm, indicating that some corrosion occurred. During this process (4 h at -10 mV cm-2), the overpotential increased by 15 mV. When the Ni2P/Ti electrode was treated with 5 wt.% Nafion-117, a similar 15-mV overpotential increase required galvanostatic operation for 18 h, indicating that Nafion reduced the corrosion, as well as improved the binding of the particles to the Ti substrate. Notably, after 18 h of galvanostatic operation, the overpotential still was lower than that reported for other Ni-based catalysts, as discussed in the main text and summarized Table S1. This behavior suggests that the stability of the Ni2P system is impacted by particle desorption from the titanium substrate as well as by some chemical degradation of the particles.
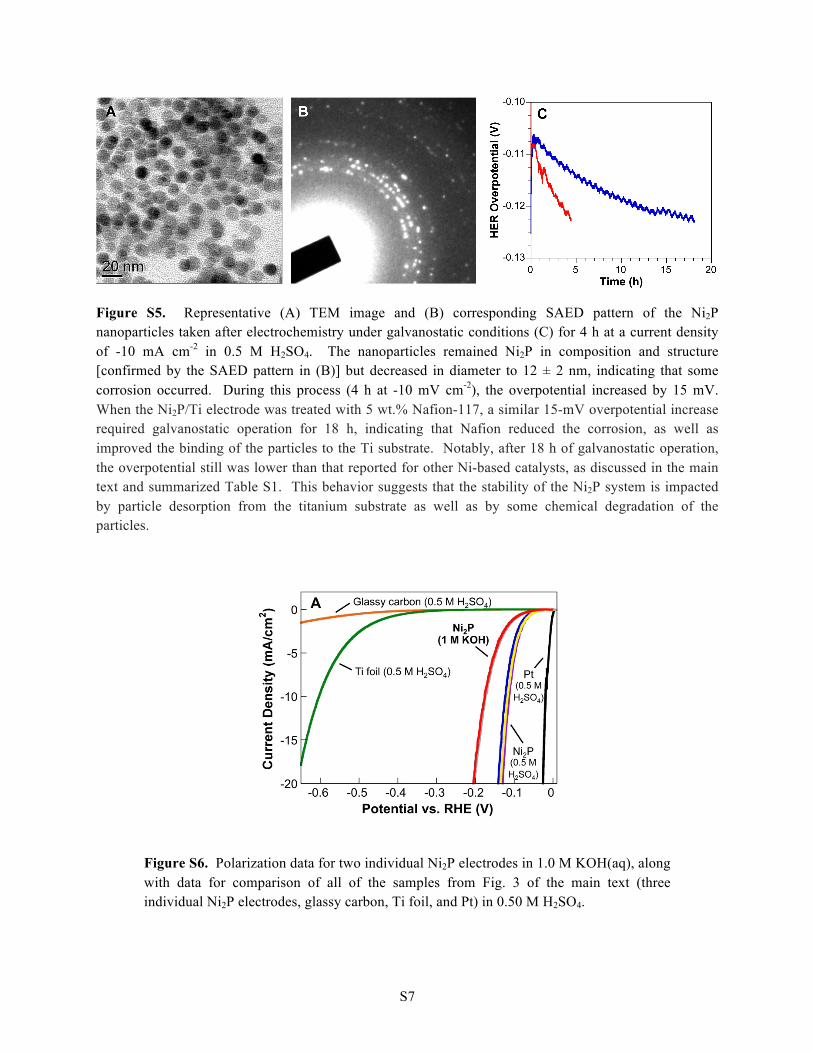
Figure S6. Polarization data for two individual Ni2P electrodes in 1.0 M KOH(aq), along with data for comparison of all of the samples from Fig. 3 of the main text (three individual Ni2P electrodes, glassy carbon, Ti foil, and Pt) in 0.50 M H2SO4.
S8
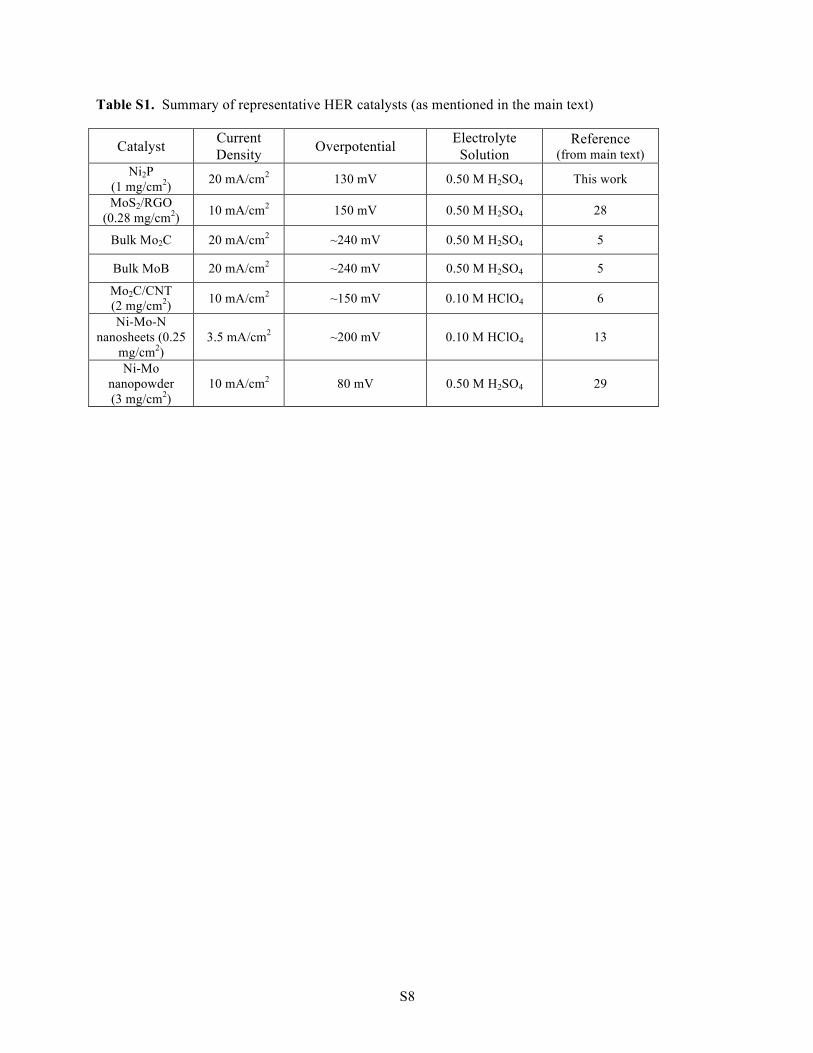
Table S1. Summary of representative HER catalysts (as mentioned in the main text)
Catalyst Current Density Overpotential Electrolyte
Solution Reference
(from main text) Ni2P
(1 mg/cm2) 20 mA/cm2 130 mV 0.50 M H2SO4 This work
MoS2/RGO (0.28 mg/cm2) 10 mA/cm2 150 mV 0.50 M H2SO4 28
Bulk Mo2C 20 mA/cm2 ~240 mV 0.50 M H2SO4 5
Bulk MoB 20 mA/cm2 ~240 mV 0.50 M H2SO4 5
Mo2C/CNT (2 mg/cm2) 10 mA/cm2 ~150 mV 0.10 M HClO4 6
Ni-Mo-N nanosheets (0.25
mg/cm2) 3.5 mA/cm2 ~200 mV 0.10 M HClO4 13
Ni-Mo nanopowder (3 mg/cm2)
10 mA/cm2 80 mV 0.50 M H2SO4 29
Related Documents