Nanoscale PAPER Cite this: Nanoscale, 2017, 9, 16446 Received 15th June 2017, Accepted 2nd October 2017 DOI: 10.1039/c7nr04296e rsc.li/nanoscale Shell thickness effects on quantum dot brightness and energy transfer† Margaret Chern, a Thuy T. Nguyen, b Andrew H. Mahler b and Allison M. Dennis * b Heterostructured core/shell quantum dots (QDs) are prized in biomedical imaging and biosensing appli- cations because of their bright, photostable emission and effectiveness as Förster resonance energy transfer (FRET) donors. However, as nanomaterials chemistry has progressed beyond traditional QDs to incorporate new compositions, ultra-thick shells, and alloyed structures, few of these materials have had their optical properties systematically characterized for effective application. For example, thick-shelled QDs, also known as ‘giant’ QDs (gQDs) are useful in single-particle tracking microscopy because of their reduced blinking, but we know only that CdSe/CdS gQDs are qualitatively brighter than thin-shelled CdSe/CdS in aqueous media. In this study, we quantify the impact of shell thickness on the nanoparticle molar extinction coefficient, quantum yield, brightness, and effectiveness as a FRET donor for CdSe/xCdS core/shell and CdSe/xCdS/ZnS core/shell/shell QDs, with variable thicknesses of the CdS shell (x). Molar extinction coefficients up to three orders of magnitude higher than conventional dyes and forty-fold greater than traditional QDs are reported. When thick CdS shells are combined with ZnS capping, quantum yields following thiol ligand exchange reach nearly 40%—5–10× higher than either the com- mercially available QDs or gQDs without ZnS caps treated the same way. These results clearly show that thick CdS shells and ZnS capping shells work in concert to provide the brightest possible CdSe-based QDs for bioimaging applications. We demonstrate that thicker shelled gQDs are over 50-fold brighter than their thin-shelled counterparts because of significant increases in their absorption cross-sections and higher quantum yield in aqueous milieu. Consistent with the point-dipole approximation commonly used for QD-FRET, these data show that thick shells contribute to the donor–acceptor distance, reducing FRET efficiency. Despite the reduction in FRET efficiency, even the thickest-shell gQDs exhibited energy transfer. Through this systematic study, we elucidate the tradeoffs between signal output, which is much higher for the gQDs, and FRET efficiency, which decreases with shell thickness. This study serves as a guide to nanobiotechnologists striving to use gQDs in imaging and sensing devices. Introduction Semiconductor quantum dots (QDs) have been used for nearly twenty years in biological imaging and sensing applications due to their brightness, high quantum yields, chemical robust- ness, and the versatility of the nanoparticle platform. 1–3 While the commercial availability of traditional CdSe/ZnS QDs makes the nanoparticles accessible for broad use, advances in QD chemistry beyond this standard composition provide further opportunities to tailor material properties to the application at hand. Alloyed, thick-shelled, and tertiary heterostructures each present a different approach to bandgap engineering, 4,5 redu- cing blinking due to charging and Auger recombination, 6,7 and brightness-matching of QD emissions at different colors. 8 Thick-shelled QDs, also known as ‘giant’ nanocrystal quantum dots or gQDs, utilize up to 20 atomic monolayers of a second semiconductor epitaxially grown on the optically active core to function as a protective layer as well as affect the localization of the electron and hole in the exciton. Examples of thick-shelled QDs include the prototypical gQD comprising CdSe/CdS, 9,10 gQDs with an alloyed shell (CdSe/Cd x Zn 1−x S), the Type II near infrared emitter InP/CdS, 11 and cadmium-free varieties comprising InP/ZnSe. 12 Thorough investigations into ensemble and single-particle gQD optical properties have con- tributed to a deeper understanding of the blinking dynamics of semiconductor nanocrystals. 6,7,9,10,13–16 The CdSe/CdS core/shell was chosen for our investigation because these well-established, thick-shelled heterostructures exhibit exceptional photophysical properties including † Electronic supplementary information (ESI) available. See DOI: 10.1039/ c7nr04296e a Division of Materials Science and Engineering, Boston University, Boston, Massachusetts, 02446, USA b Department of Biomedical Engineering, Boston University, Boston, Massachusetts, 02446, USA. E-mail: [email protected] 16446 | Nanoscale, 2017, 9, 16446–16458 This journal is © The Royal Society of Chemistry 2017 Published on 03 October 2017. Downloaded by Boston University on 08/06/2018 13:22:15. View Article Online View Journal | View Issue

Welcome message from author
This document is posted to help you gain knowledge. Please leave a comment to let me know what you think about it! Share it to your friends and learn new things together.
Transcript
Nanoscale
PAPER
Cite this: Nanoscale, 2017, 9, 16446
Received 15th June 2017,Accepted 2nd October 2017
DOI: 10.1039/c7nr04296e
rsc.li/nanoscale
Shell thickness effects on quantum dot brightnessand energy transfer†
Margaret Chern,a Thuy T. Nguyen,b Andrew H. Mahlerb and Allison M. Dennis *b
Heterostructured core/shell quantum dots (QDs) are prized in biomedical imaging and biosensing appli-
cations because of their bright, photostable emission and effectiveness as Förster resonance energy
transfer (FRET) donors. However, as nanomaterials chemistry has progressed beyond traditional QDs to
incorporate new compositions, ultra-thick shells, and alloyed structures, few of these materials have had
their optical properties systematically characterized for effective application. For example, thick-shelled
QDs, also known as ‘giant’ QDs (gQDs) are useful in single-particle tracking microscopy because of their
reduced blinking, but we know only that CdSe/CdS gQDs are qualitatively brighter than thin-shelled
CdSe/CdS in aqueous media. In this study, we quantify the impact of shell thickness on the nanoparticle
molar extinction coefficient, quantum yield, brightness, and effectiveness as a FRET donor for CdSe/xCdS
core/shell and CdSe/xCdS/ZnS core/shell/shell QDs, with variable thicknesses of the CdS shell (x). Molar
extinction coefficients up to three orders of magnitude higher than conventional dyes and forty-fold
greater than traditional QDs are reported. When thick CdS shells are combined with ZnS capping,
quantum yields following thiol ligand exchange reach nearly 40%—5–10× higher than either the com-
mercially available QDs or gQDs without ZnS caps treated the same way. These results clearly show that
thick CdS shells and ZnS capping shells work in concert to provide the brightest possible CdSe-based
QDs for bioimaging applications. We demonstrate that thicker shelled gQDs are over 50-fold brighter
than their thin-shelled counterparts because of significant increases in their absorption cross-sections
and higher quantum yield in aqueous milieu. Consistent with the point-dipole approximation commonly
used for QD-FRET, these data show that thick shells contribute to the donor–acceptor distance, reducing
FRET efficiency. Despite the reduction in FRET efficiency, even the thickest-shell gQDs exhibited energy
transfer. Through this systematic study, we elucidate the tradeoffs between signal output, which is much
higher for the gQDs, and FRET efficiency, which decreases with shell thickness. This study serves as a
guide to nanobiotechnologists striving to use gQDs in imaging and sensing devices.
Introduction
Semiconductor quantum dots (QDs) have been used for nearlytwenty years in biological imaging and sensing applicationsdue to their brightness, high quantum yields, chemical robust-ness, and the versatility of the nanoparticle platform.1–3 Whilethe commercial availability of traditional CdSe/ZnS QDs makesthe nanoparticles accessible for broad use, advances in QDchemistry beyond this standard composition provide furtheropportunities to tailor material properties to the application athand. Alloyed, thick-shelled, and tertiary heterostructures each
present a different approach to bandgap engineering,4,5 redu-cing blinking due to charging and Auger recombination,6,7
and brightness-matching of QD emissions at different colors.8
Thick-shelled QDs, also known as ‘giant’ nanocrystalquantum dots or gQDs, utilize up to 20 atomic monolayers ofa second semiconductor epitaxially grown on the opticallyactive core to function as a protective layer as well as affect thelocalization of the electron and hole in the exciton. Examplesof thick-shelled QDs include the prototypical gQD comprisingCdSe/CdS,9,10 gQDs with an alloyed shell (CdSe/CdxZn1−xS),the Type II near infrared emitter InP/CdS,11 and cadmium-freevarieties comprising InP/ZnSe.12 Thorough investigations intoensemble and single-particle gQD optical properties have con-tributed to a deeper understanding of the blinking dynamicsof semiconductor nanocrystals.6,7,9,10,13–16
The CdSe/CdS core/shell was chosen for our investigationbecause these well-established, thick-shelled heterostructuresexhibit exceptional photophysical properties including
†Electronic supplementary information (ESI) available. See DOI: 10.1039/c7nr04296e
aDivision of Materials Science and Engineering, Boston University, Boston,
Massachusetts, 02446, USAbDepartment of Biomedical Engineering, Boston University, Boston, Massachusetts,
02446, USA. E-mail: [email protected]
16446 | Nanoscale, 2017, 9, 16446–16458 This journal is © The Royal Society of Chemistry 2017
Publ
ishe
d on
03
Oct
ober
201
7. D
ownl
oade
d by
Bos
ton
Uni
vers
ity o
n 08
/06/
2018
13:
22:1
5.
View Article OnlineView Journal | View Issue
reduced Auger recombination and suppressed blinking,7,10,17
increased brightness due to large molar extinction coeffi-cients,8 and chemical robustness allowing for surface ligandtransfer with a smaller reduction in quantum yield (QY).7,8
Their non-blinking nature has been effectively applied in bothsolid state lighting applications18 and single particle trackingmicroscopy.19 Due to the small difference in the CdSe and CdSconduction band energies, the CdSe/xCdS heterostructureexhibits hole confinement in the core and spreading of theexcited electron across the core and shell, yielding a quasi-typeII bandgap alignment.20,21 It was qualitatively shown that thethick-shelled CdSe/CdS QDs luminesce visibly in aqueousmilieu following thiol-based ligand exchange, while thin-shelled CdSe/CdS QDs are quenched.7 This result is not sur-prising given the (finite) spreading of the exciton probabilityfunction to the particle surface.22 Traditional QDs (i.e., non-thick-shelled CdSe) typically utilize a passivating shell of thehigh bandgap semiconductor ZnS to fully confine the excitonto the core before phase transfer to aqueous media for bio-medical applications.1 Here we systematically investigate theimpact of the ZnS shell on quasi-type II CdSe/CdS QDs withvarious CdS shell thicknesses to assess the benefit of eachshell in biological imaging and sensing applications.
In addition to the particle brightness in aqueous milieu, weexamine the impact of the QD heterostructure on energy trans-fer. Förster resonance energy transfer (FRET) is a dipole–dipole interaction between fluorescent species that results innon-radiative energy transfer from a donor to acceptor mole-cule. FRET efficiency is inversely proportional to the donor–acceptor distance to the sixth power.23 The strength of thisdependence makes FRET a valuable tool for sensing nano-meter scale changes in distance that may arise from confor-mational changes, biomolecular binding, or enzymaticcleavage.24–28 QDs are effective FRET donors due to their excel-lent photostability, ability to bind multiple acceptors perdonor, and broadband absorption.1,27,29,30 The absorptionprofile of QDs enables photonic excitation of the FRET donorat wavelengths distinct from the acceptor absorption. Thiseliminates excitation cross talk, simplifying assay design andanalysis. The optical versatility of QDs has resulted in theirapplication in more exotic energy transfer schemes as well,including bioluminescence or chemiluminescence resonanceenergy transfer (BRET or CRET, respectively),31,32 sensors uti-lizing QDs as fluorescent acceptors,33 and multistep and/ortime gated energy transfer devices.34,35 The long list of sensorsdeveloped using QDs in energy transfer devices includemeasures of the environment like pH36–38 or O2 saturation,39
enzymatic cleavage,28,40–44 DNA hybridization,45–47 label-freedetection of small molecule analytes or microRNA,48,49 andimmunoassays.50,51
While the increased quantum yields of thick-shelled QDdonors increases the spectral overlap integral of the donor–acceptor pair, thereby lengthening the Förster distance for theQD-acceptor system, increasing donor radius increases the dis-tance between donor and acceptor molecules and decreasesFRET efficiency (EFRET). Our systematic analysis shows the
advantages and disadvantages of using gQDs in aqueousmedia and particularly as FRET donors in biomedicalapplications.
Results and discussionImpact of shells on QD brightness
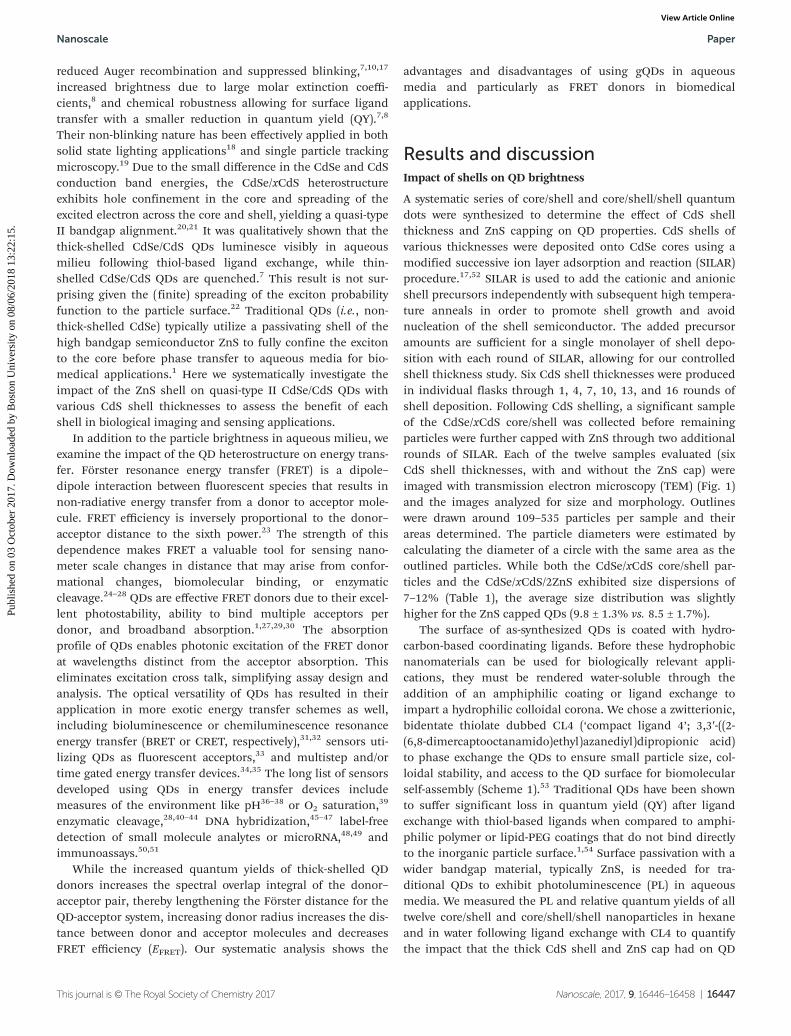
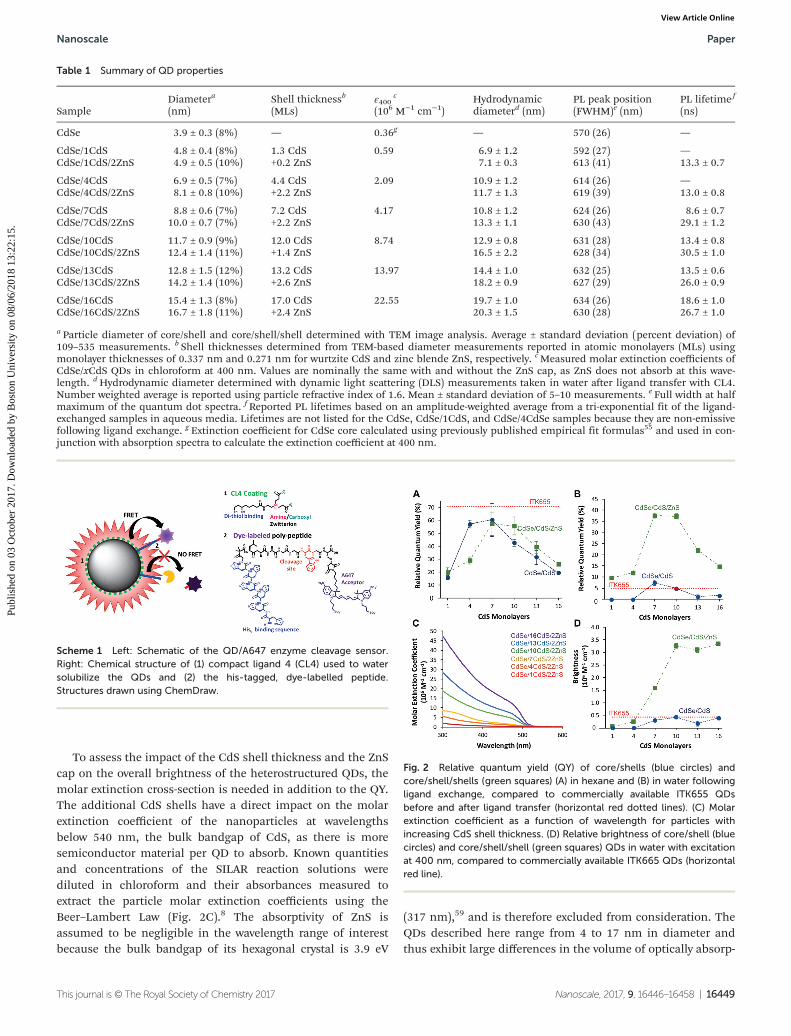
A systematic series of core/shell and core/shell/shell quantumdots were synthesized to determine the effect of CdS shellthickness and ZnS capping on QD properties. CdS shells ofvarious thicknesses were deposited onto CdSe cores using amodified successive ion layer adsorption and reaction (SILAR)procedure.17,52 SILAR is used to add the cationic and anionicshell precursors independently with subsequent high tempera-ture anneals in order to promote shell growth and avoidnucleation of the shell semiconductor. The added precursoramounts are sufficient for a single monolayer of shell depo-sition with each round of SILAR, allowing for our controlledshell thickness study. Six CdS shell thicknesses were producedin individual flasks through 1, 4, 7, 10, 13, and 16 rounds ofshell deposition. Following CdS shelling, a significant sampleof the CdSe/xCdS core/shell was collected before remainingparticles were further capped with ZnS through two additionalrounds of SILAR. Each of the twelve samples evaluated (sixCdS shell thicknesses, with and without the ZnS cap) wereimaged with transmission electron microscopy (TEM) (Fig. 1)and the images analyzed for size and morphology. Outlineswere drawn around 109–535 particles per sample and theirareas determined. The particle diameters were estimated bycalculating the diameter of a circle with the same area as theoutlined particles. While both the CdSe/xCdS core/shell par-ticles and the CdSe/xCdS/2ZnS exhibited size dispersions of7–12% (Table 1), the average size distribution was slightlyhigher for the ZnS capped QDs (9.8 ± 1.3% vs. 8.5 ± 1.7%).
The surface of as-synthesized QDs is coated with hydro-carbon-based coordinating ligands. Before these hydrophobicnanomaterials can be used for biologically relevant appli-cations, they must be rendered water-soluble through theaddition of an amphiphilic coating or ligand exchange toimpart a hydrophilic colloidal corona. We chose a zwitterionic,bidentate thiolate dubbed CL4 (‘compact ligand 4’; 3,3′-((2-(6,8-dimercaptooctanamido)ethyl)azanediyl)dipropionic acid)to phase exchange the QDs to ensure small particle size, col-loidal stability, and access to the QD surface for biomolecularself-assembly (Scheme 1).53 Traditional QDs have been shownto suffer significant loss in quantum yield (QY) after ligandexchange with thiol-based ligands when compared to amphi-philic polymer or lipid-PEG coatings that do not bind directlyto the inorganic particle surface.1,54 Surface passivation with awider bandgap material, typically ZnS, is needed for tra-ditional QDs to exhibit photoluminescence (PL) in aqueousmedia. We measured the PL and relative quantum yields of alltwelve core/shell and core/shell/shell nanoparticles in hexaneand in water following ligand exchange with CL4 to quantifythe impact that the thick CdS shell and ZnS cap had on QD
Nanoscale Paper
This journal is © The Royal Society of Chemistry 2017 Nanoscale, 2017, 9, 16446–16458 | 16447
Publ
ishe
d on
03
Oct
ober
201
7. D
ownl
oade
d by
Bos
ton
Uni
vers
ity o
n 08
/06/
2018
13:
22:1
5.
View Article Online
emission. The CdS shelling induced a redshift in the PL emis-sion peak that increased with thicker shells until stabilizingaround 630 nm (Fig. S1†). The ZnS cap resulted in nominalred- or blue-shifting of the PL peak position, but significantlyincreased the full width half max (FWHM) of the PL peak from26 ± 1 to 36 ± 6 (p < 0.05) (Table 1).
The photoluminescence decay of each of the QD sampleswas measured in both hexane and water. For the core/shell
samples, lifetime increased slightly with QD size/shell thick-ness because of the Quasi-Type II bandstructure of CdSe/CdS(Fig. S2†). The conduction band offset for this system is low,and the electron probability density spreads into the shell,reducing the electron–hole overlap. The increase in lifetimeplateaued for the thicker shells (10–16 CdS), indicating thatthe decrease in electron confinement no longer significantlyimpacts its probability distribution. This correlates withminimal red-shift between samples with 10 or more CdSmonolayers (Fig. S1†). Samples that have been ligandexchanged or that include ZnS caps follow a similar trend, butless uniformly. The addition of a third semiconductorincreases the PL lifetime, but variably, as the efficiencyof ZnS shelling varies between samples (Table 1) and the be-havior of the electron probability density is less well defined.For samples that have undergone ligand exchange, the surfaceof the QDs have been disrupted, possibly resulting in the cre-ation of surface traps that affect the QD fluorescent lifetimes.
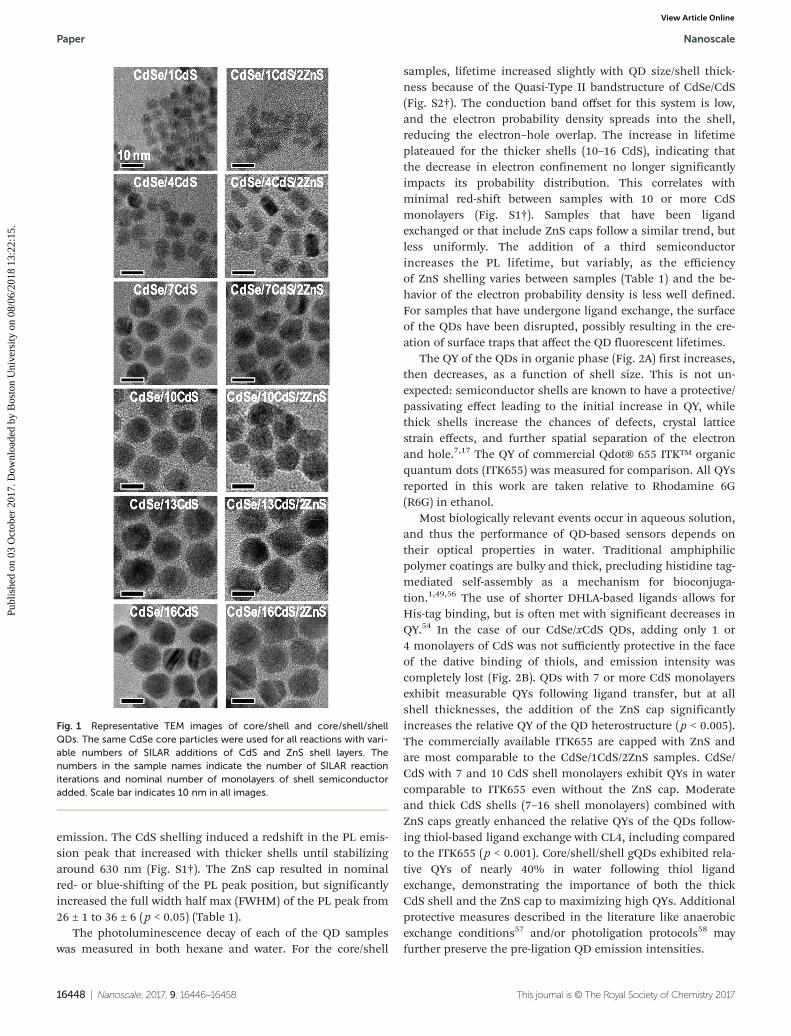
The QY of the QDs in organic phase (Fig. 2A) first increases,then decreases, as a function of shell size. This is not un-expected: semiconductor shells are known to have a protective/passivating effect leading to the initial increase in QY, whilethick shells increase the chances of defects, crystal latticestrain effects, and further spatial separation of the electronand hole.7,17 The QY of commercial Qdot® 655 ITK™ organicquantum dots (ITK655) was measured for comparison. All QYsreported in this work are taken relative to Rhodamine 6G(R6G) in ethanol.
Most biologically relevant events occur in aqueous solution,and thus the performance of QD-based sensors depends ontheir optical properties in water. Traditional amphiphilicpolymer coatings are bulky and thick, precluding histidine tag-mediated self-assembly as a mechanism for bioconjuga-tion.1,49,56 The use of shorter DHLA-based ligands allows forHis-tag binding, but is often met with significant decreases inQY.54 In the case of our CdSe/xCdS QDs, adding only 1 or4 monolayers of CdS was not sufficiently protective in the faceof the dative binding of thiols, and emission intensity wascompletely lost (Fig. 2B). QDs with 7 or more CdS monolayersexhibit measurable QYs following ligand transfer, but at allshell thicknesses, the addition of the ZnS cap significantlyincreases the relative QY of the QD heterostructure (p < 0.005).The commercially available ITK655 are capped with ZnS andare most comparable to the CdSe/1CdS/2ZnS samples. CdSe/CdS with 7 and 10 CdS shell monolayers exhibit QYs in watercomparable to ITK655 even without the ZnS cap. Moderateand thick CdS shells (7–16 shell monolayers) combined withZnS caps greatly enhanced the relative QYs of the QDs follow-ing thiol-based ligand exchange with CL4, including comparedto the ITK655 (p < 0.001). Core/shell/shell gQDs exhibited rela-tive QYs of nearly 40% in water following thiol ligandexchange, demonstrating the importance of both the thickCdS shell and the ZnS cap to maximizing high QYs. Additionalprotective measures described in the literature like anaerobicexchange conditions57 and/or photoligation protocols58 mayfurther preserve the pre-ligation QD emission intensities.
Fig. 1 Representative TEM images of core/shell and core/shell/shellQDs. The same CdSe core particles were used for all reactions with vari-able numbers of SILAR additions of CdS and ZnS shell layers. Thenumbers in the sample names indicate the number of SILAR reactioniterations and nominal number of monolayers of shell semiconductoradded. Scale bar indicates 10 nm in all images.
Paper Nanoscale
16448 | Nanoscale, 2017, 9, 16446–16458 This journal is © The Royal Society of Chemistry 2017
Publ
ishe
d on
03
Oct
ober
201
7. D
ownl
oade
d by
Bos
ton
Uni
vers
ity o
n 08
/06/
2018
13:
22:1
5.
View Article Online
To assess the impact of the CdS shell thickness and the ZnScap on the overall brightness of the heterostructured QDs, themolar extinction cross-section is needed in addition to the QY.The additional CdS shells have a direct impact on the molarextinction coefficient of the nanoparticles at wavelengthsbelow 540 nm, the bulk bandgap of CdS, as there is moresemiconductor material per QD to absorb. Known quantitiesand concentrations of the SILAR reaction solutions werediluted in chloroform and their absorbances measured toextract the particle molar extinction coefficients using theBeer–Lambert Law (Fig. 2C).8 The absorptivity of ZnS isassumed to be negligible in the wavelength range of interestbecause the bulk bandgap of its hexagonal crystal is 3.9 eV
(317 nm),59 and is therefore excluded from consideration. TheQDs described here range from 4 to 17 nm in diameter andthus exhibit large differences in the volume of optically absorp-
Table 1 Summary of QD properties
SampleDiametera
(nm)Shell thicknessb
(MLs)ε400
c
(106 M−1 cm−1)Hydrodynamicdiameterd (nm)
PL peak position(FWHM)e (nm)
PL lifetime f
(ns)
CdSe 3.9 ± 0.3 (8%) — 0.36g — 570 (26) —
CdSe/1CdS 4.8 ± 0.4 (8%) 1.3 CdS 0.59 6.9 ± 1.2 592 (27) —CdSe/1CdS/2ZnS 4.9 ± 0.5 (10%) +0.2 ZnS 7.1 ± 0.3 613 (41) 13.3 ± 0.7
CdSe/4CdS 6.9 ± 0.5 (7%) 4.4 CdS 2.09 10.9 ± 1.2 614 (26) —CdSe/4CdS/2ZnS 8.1 ± 0.8 (10%) +2.2 ZnS 11.7 ± 1.3 619 (39) 13.0 ± 0.8
CdSe/7CdS 8.8 ± 0.6 (7%) 7.2 CdS 4.17 10.8 ± 1.2 624 (26) 8.6 ± 0.7CdSe/7CdS/2ZnS 10.0 ± 0.7 (7%) +2.2 ZnS 13.3 ± 1.1 630 (43) 29.1 ± 1.2
CdSe/10CdS 11.7 ± 0.9 (9%) 12.0 CdS 8.74 12.9 ± 0.8 631 (28) 13.4 ± 0.8CdSe/10CdS/2ZnS 12.4 ± 1.4 (11%) +1.4 ZnS 16.5 ± 2.2 628 (34) 30.5 ± 1.0
CdSe/13CdS 12.8 ± 1.5 (12%) 13.2 CdS 13.97 14.4 ± 1.0 632 (25) 13.5 ± 0.6CdSe/13CdS/2ZnS 14.2 ± 1.4 (10%) +2.6 ZnS 18.2 ± 0.9 627 (29) 26.0 ± 0.9
CdSe/16CdS 15.4 ± 1.3 (8%) 17.0 CdS 22.55 19.7 ± 1.0 634 (26) 18.6 ± 1.0CdSe/16CdS/2ZnS 16.7 ± 1.8 (11%) +2.4 ZnS 20.3 ± 1.5 630 (28) 26.7 ± 1.0
a Particle diameter of core/shell and core/shell/shell determined with TEM image analysis. Average ± standard deviation (percent deviation) of109–535 measurements. b Shell thicknesses determined from TEM-based diameter measurements reported in atomic monolayers (MLs) usingmonolayer thicknesses of 0.337 nm and 0.271 nm for wurtzite CdS and zinc blende ZnS, respectively. cMeasured molar extinction coefficients ofCdSe/xCdS QDs in chloroform at 400 nm. Values are nominally the same with and without the ZnS cap, as ZnS does not absorb at this wave-length. dHydrodynamic diameter determined with dynamic light scattering (DLS) measurements taken in water after ligand transfer with CL4.Number weighted average is reported using particle refractive index of 1.6. Mean ± standard deviation of 5–10 measurements. e Full width at halfmaximum of the quantum dot spectra. f Reported PL lifetimes based on an amplitude-weighted average from a tri-exponential fit of the ligand-exchanged samples in aqueous media. Lifetimes are not listed for the CdSe, CdSe/1CdS, and CdSe/4CdSe samples because they are non-emissivefollowing ligand exchange. g Extinction coefficient for CdSe core calculated using previously published empirical fit formulas55 and used in con-junction with absorption spectra to calculate the extinction coefficient at 400 nm.
Scheme 1 Left: Schematic of the QD/A647 enzyme cleavage sensor.Right: Chemical structure of (1) compact ligand 4 (CL4) used to watersolubilize the QDs and (2) the his-tagged, dye-labelled peptide.Structures drawn using ChemDraw.
Fig. 2 Relative quantum yield (QY) of core/shells (blue circles) andcore/shell/shells (green squares) (A) in hexane and (B) in water followingligand exchange, compared to commercially available ITK655 QDsbefore and after ligand transfer (horizontal red dotted lines). (C) Molarextinction coefficient as a function of wavelength for particles withincreasing CdS shell thickness. (D) Relative brightness of core/shell (bluecircles) and core/shell/shell (green squares) QDs in water with excitationat 400 nm, compared to commercially available ITK665 QDs (horizontalred line).
Nanoscale Paper
This journal is © The Royal Society of Chemistry 2017 Nanoscale, 2017, 9, 16446–16458 | 16449
Publ
ishe
d on
03
Oct
ober
201
7. D
ownl
oade
d by
Bos
ton
Uni
vers
ity o
n 08
/06/
2018
13:
22:1
5.
View Article Online
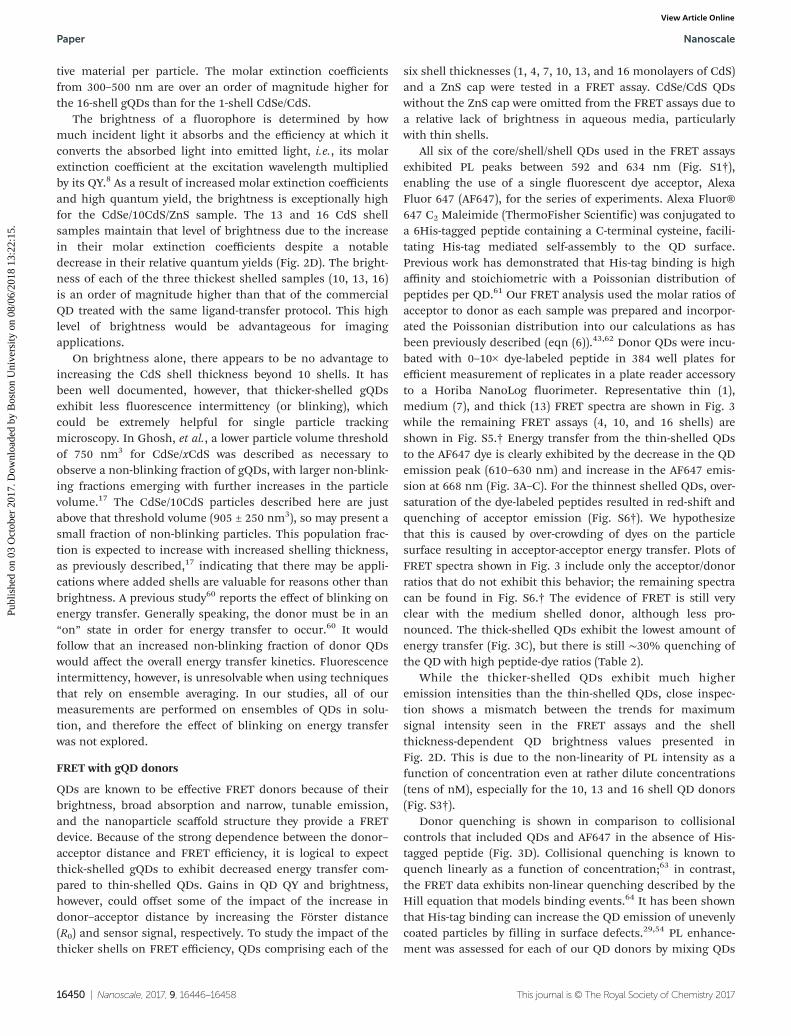
tive material per particle. The molar extinction coefficientsfrom 300–500 nm are over an order of magnitude higher forthe 16-shell gQDs than for the 1-shell CdSe/CdS.
The brightness of a fluorophore is determined by howmuch incident light it absorbs and the efficiency at which itconverts the absorbed light into emitted light, i.e., its molarextinction coefficient at the excitation wavelength multipliedby its QY.8 As a result of increased molar extinction coefficientsand high quantum yield, the brightness is exceptionally highfor the CdSe/10CdS/ZnS sample. The 13 and 16 CdS shellsamples maintain that level of brightness due to the increasein their molar extinction coefficients despite a notabledecrease in their relative quantum yields (Fig. 2D). The bright-ness of each of the three thickest shelled samples (10, 13, 16)is an order of magnitude higher than that of the commercialQD treated with the same ligand-transfer protocol. This highlevel of brightness would be advantageous for imagingapplications.
On brightness alone, there appears to be no advantage toincreasing the CdS shell thickness beyond 10 shells. It hasbeen well documented, however, that thicker-shelled gQDsexhibit less fluorescence intermittency (or blinking), whichcould be extremely helpful for single particle trackingmicroscopy. In Ghosh, et al., a lower particle volume thresholdof 750 nm3 for CdSe/xCdS was described as necessary toobserve a non-blinking fraction of gQDs, with larger non-blink-ing fractions emerging with further increases in the particlevolume.17 The CdSe/10CdS particles described here are justabove that threshold volume (905 ± 250 nm3), so may present asmall fraction of non-blinking particles. This population frac-tion is expected to increase with increased shelling thickness,as previously described,17 indicating that there may be appli-cations where added shells are valuable for reasons other thanbrightness. A previous study60 reports the effect of blinking onenergy transfer. Generally speaking, the donor must be in an“on” state in order for energy transfer to occur.60 It wouldfollow that an increased non-blinking fraction of donor QDswould affect the overall energy transfer kinetics. Fluorescenceintermittency, however, is unresolvable when using techniquesthat rely on ensemble averaging. In our studies, all of ourmeasurements are performed on ensembles of QDs in solu-tion, and therefore the effect of blinking on energy transferwas not explored.
FRET with gQD donors
QDs are known to be effective FRET donors because of theirbrightness, broad absorption and narrow, tunable emission,and the nanoparticle scaffold structure they provide a FRETdevice. Because of the strong dependence between the donor–acceptor distance and FRET efficiency, it is logical to expectthick-shelled gQDs to exhibit decreased energy transfer com-pared to thin-shelled QDs. Gains in QD QY and brightness,however, could offset some of the impact of the increase indonor–acceptor distance by increasing the Förster distance(R0) and sensor signal, respectively. To study the impact of thethicker shells on FRET efficiency, QDs comprising each of the
six shell thicknesses (1, 4, 7, 10, 13, and 16 monolayers of CdS)and a ZnS cap were tested in a FRET assay. CdSe/CdS QDswithout the ZnS cap were omitted from the FRET assays due toa relative lack of brightness in aqueous media, particularlywith thin shells.
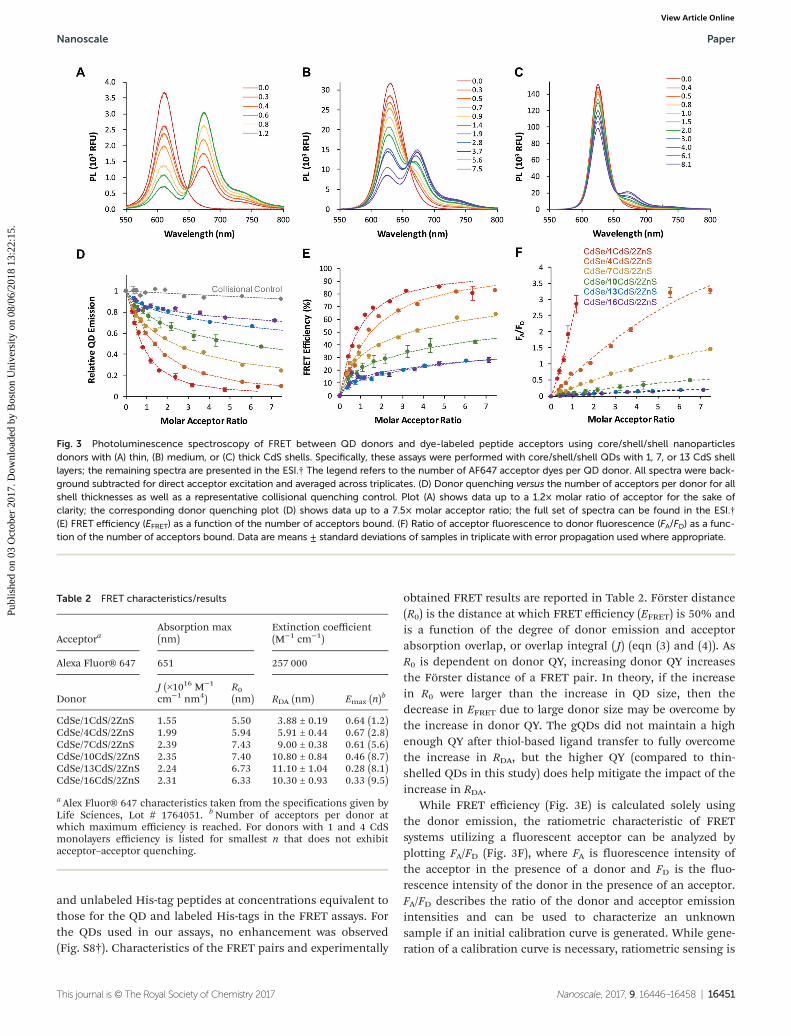
All six of the core/shell/shell QDs used in the FRET assaysexhibited PL peaks between 592 and 634 nm (Fig. S1†),enabling the use of a single fluorescent dye acceptor, AlexaFluor 647 (AF647), for the series of experiments. Alexa Fluor®647 C2 Maleimide (ThermoFisher Scientific) was conjugated toa 6His-tagged peptide containing a C-terminal cysteine, facili-tating His-tag mediated self-assembly to the QD surface.Previous work has demonstrated that His-tag binding is highaffinity and stoichiometric with a Poissonian distribution ofpeptides per QD.61 Our FRET analysis used the molar ratios ofacceptor to donor as each sample was prepared and incorpor-ated the Poissonian distribution into our calculations as hasbeen previously described (eqn (6)).43,62 Donor QDs were incu-bated with 0–10× dye-labeled peptide in 384 well plates forefficient measurement of replicates in a plate reader accessoryto a Horiba NanoLog fluorimeter. Representative thin (1),medium (7), and thick (13) FRET spectra are shown in Fig. 3while the remaining FRET assays (4, 10, and 16 shells) areshown in Fig. S5.† Energy transfer from the thin-shelled QDsto the AF647 dye is clearly exhibited by the decrease in the QDemission peak (610–630 nm) and increase in the AF647 emis-sion at 668 nm (Fig. 3A–C). For the thinnest shelled QDs, over-saturation of the dye-labeled peptides resulted in red-shift andquenching of acceptor emission (Fig. S6†). We hypothesizethat this is caused by over-crowding of dyes on the particlesurface resulting in acceptor-acceptor energy transfer. Plots ofFRET spectra shown in Fig. 3 include only the acceptor/donorratios that do not exhibit this behavior; the remaining spectracan be found in Fig. S6.† The evidence of FRET is still veryclear with the medium shelled donor, although less pro-nounced. The thick-shelled QDs exhibit the lowest amount ofenergy transfer (Fig. 3C), but there is still ∼30% quenching ofthe QD with high peptide-dye ratios (Table 2).
While the thicker-shelled QDs exhibit much higheremission intensities than the thin-shelled QDs, close inspec-tion shows a mismatch between the trends for maximumsignal intensity seen in the FRET assays and the shellthickness-dependent QD brightness values presented inFig. 2D. This is due to the non-linearity of PL intensity as afunction of concentration even at rather dilute concentrations(tens of nM), especially for the 10, 13 and 16 shell QD donors(Fig. S3†).
Donor quenching is shown in comparison to collisionalcontrols that included QDs and AF647 in the absence of His-tagged peptide (Fig. 3D). Collisional quenching is known toquench linearly as a function of concentration;63 in contrast,the FRET data exhibits non-linear quenching described by theHill equation that models binding events.64 It has been shownthat His-tag binding can increase the QD emission of unevenlycoated particles by filling in surface defects.29,54 PL enhance-ment was assessed for each of our QD donors by mixing QDs
Paper Nanoscale
16450 | Nanoscale, 2017, 9, 16446–16458 This journal is © The Royal Society of Chemistry 2017
Publ
ishe
d on
03
Oct
ober
201
7. D
ownl
oade
d by
Bos
ton
Uni
vers
ity o
n 08
/06/
2018
13:
22:1
5.
View Article Online
and unlabeled His-tag peptides at concentrations equivalent tothose for the QD and labeled His-tags in the FRET assays. Forthe QDs used in our assays, no enhancement was observed(Fig. S8†). Characteristics of the FRET pairs and experimentally
obtained FRET results are reported in Table 2. Förster distance(R0) is the distance at which FRET efficiency (EFRET) is 50% andis a function of the degree of donor emission and acceptorabsorption overlap, or overlap integral ( J) (eqn (3) and (4)). AsR0 is dependent on donor QY, increasing donor QY increasesthe Förster distance of a FRET pair. In theory, if the increasein R0 were larger than the increase in QD size, then thedecrease in EFRET due to large donor size may be overcome bythe increase in donor QY. The gQDs did not maintain a highenough QY after thiol-based ligand transfer to fully overcomethe increase in RDA, but the higher QY (compared to thin-shelled QDs in this study) does help mitigate the impact of theincrease in RDA.
While FRET efficiency (Fig. 3E) is calculated solely usingthe donor emission, the ratiometric characteristic of FRETsystems utilizing a fluorescent acceptor can be analyzed byplotting FA/FD (Fig. 3F), where FA is fluorescence intensity ofthe acceptor in the presence of a donor and FD is the fluo-rescence intensity of the donor in the presence of an acceptor.FA/FD describes the ratio of the donor and acceptor emissionintensities and can be used to characterize an unknownsample if an initial calibration curve is generated. While gene-ration of a calibration curve is necessary, ratiometric sensing is
Table 2 FRET characteristics/results
AcceptoraAbsorption max(nm)
Extinction coefficient(M−1 cm−1)
Alexa Fluor® 647 651 257 000
DonorJ (×1016 M−1
cm−1 nm4)R0(nm) RDA (nm) Emax (n)
b
CdSe/1CdS/2ZnS 1.55 5.50 3.88 ± 0.19 0.64 (1.2)CdSe/4CdS/2ZnS 1.99 5.94 5.91 ± 0.44 0.67 (2.8)CdSe/7CdS/2ZnS 2.39 7.43 9.00 ± 0.38 0.61 (5.6)CdSe/10CdS/2ZnS 2.35 7.40 10.80 ± 0.84 0.46 (8.7)CdSe/13CdS/2ZnS 2.24 6.73 11.10 ± 1.04 0.28 (8.1)CdSe/16CdS/2ZnS 2.31 6.33 10.30 ± 0.93 0.33 (9.5)
a Alex Fluor® 647 characteristics taken from the specifications given byLife Sciences, Lot # 1764051. bNumber of acceptors per donor atwhich maximum efficiency is reached. For donors with 1 and 4 CdSmonolayers efficiency is listed for smallest n that does not exhibitacceptor–acceptor quenching.
Fig. 3 Photoluminescence spectroscopy of FRET between QD donors and dye-labeled peptide acceptors using core/shell/shell nanoparticlesdonors with (A) thin, (B) medium, or (C) thick CdS shells. Specifically, these assays were performed with core/shell/shell QDs with 1, 7, or 13 CdS shelllayers; the remaining spectra are presented in the ESI.† The legend refers to the number of AF647 acceptor dyes per QD donor. All spectra were back-ground subtracted for direct acceptor excitation and averaged across triplicates. (D) Donor quenching versus the number of acceptors per donor for allshell thicknesses as well as a representative collisional quenching control. Plot (A) shows data up to a 1.2× molar ratio of acceptor for the sake ofclarity; the corresponding donor quenching plot (D) shows data up to a 7.5× molar acceptor ratio; the full set of spectra can be found in the ESI.†(E) FRET efficiency (EFRET) as a function of the number of acceptors bound. (F) Ratio of acceptor fluorescence to donor fluorescence (FA/FD) as a func-tion of the number of acceptors bound. Data are means ± standard deviations of samples in triplicate with error propagation used where appropriate.
Nanoscale Paper
This journal is © The Royal Society of Chemistry 2017 Nanoscale, 2017, 9, 16446–16458 | 16451
Publ
ishe
d on
03
Oct
ober
201
7. D
ownl
oade
d by
Bos
ton
Uni
vers
ity o
n 08
/06/
2018
13:
22:1
5.
View Article Online
sensor concentration independent and thus more reliable incomplex sensing scenarios than single-color FRET-basedsensors. Both the largest maximum efficiency and greatestrange in FA/FD was achieved using the thinnest shelled donor(CdSe/1CdS/2ZnS). The signal intensity obtained from thisassay, however, is ∼50 times lower than that obtained from theassay using the CdSe/10CdS/2ZnS donor. To match signalintensities, the concentrations of donors and acceptorsneeded in a thin-shelled QD FRET system is much higher thanthose needed in assays that use gQDs. The CdSe/1CdS/2ZnSQDs need ∼0.6 acceptors per donor to achieve ∼50% EFRET.Table 1 shows that the CdSe/10CdS/2ZnS QD achieves ∼50%EFRET at a ∼1 : 6 ratio. To produce the same signal output as aQD with 10 CdS MLs, the smaller QD must be used at a con-centration ∼50× that of the gQD. This means that the gQDFRET assay can experience 50% EFRET with the addition of ∼5×less acceptor. In addition, high signal intensities would bebeneficial in visual sensors where quick color-metric changesare preferred over measurements requiring expensive and/orcomplex instruments. If instrumentation is sensitive and EFRETis the main concern, use of traditional QDs is preferable; ifhigh and easily discernable signal output is the greaterconcern, then thick-shelled gQDs may provide an advantage.
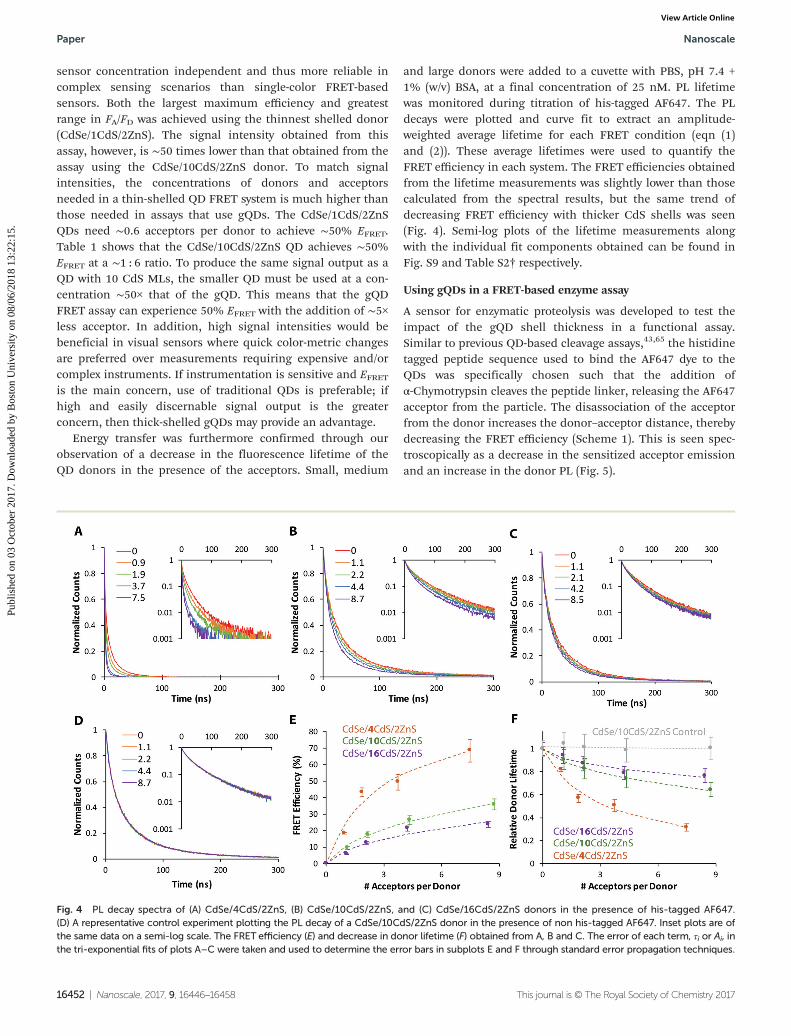
Energy transfer was furthermore confirmed through ourobservation of a decrease in the fluorescence lifetime of theQD donors in the presence of the acceptors. Small, medium
and large donors were added to a cuvette with PBS, pH 7.4 +1% (w/v) BSA, at a final concentration of 25 nM. PL lifetimewas monitored during titration of his-tagged AF647. The PLdecays were plotted and curve fit to extract an amplitude-weighted average lifetime for each FRET condition (eqn (1)and (2)). These average lifetimes were used to quantify theFRET efficiency in each system. The FRET efficiencies obtainedfrom the lifetime measurements was slightly lower than thosecalculated from the spectral results, but the same trend ofdecreasing FRET efficiency with thicker CdS shells was seen(Fig. 4). Semi-log plots of the lifetime measurements alongwith the individual fit components obtained can be found inFig. S9 and Table S2† respectively.
Using gQDs in a FRET-based enzyme assay
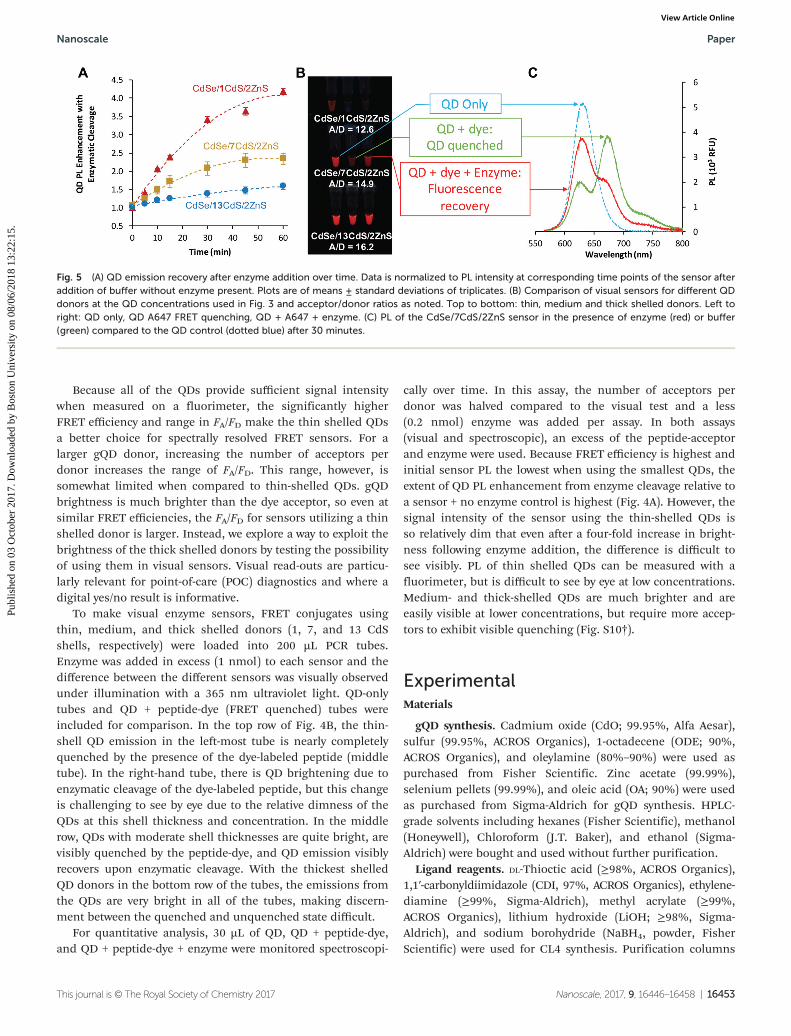
A sensor for enzymatic proteolysis was developed to test theimpact of the gQD shell thickness in a functional assay.Similar to previous QD-based cleavage assays,43,65 the histidinetagged peptide sequence used to bind the AF647 dye to theQDs was specifically chosen such that the addition ofα-Chymotrypsin cleaves the peptide linker, releasing the AF647acceptor from the particle. The disassociation of the acceptorfrom the donor increases the donor–acceptor distance, therebydecreasing the FRET efficiency (Scheme 1). This is seen spec-troscopically as a decrease in the sensitized acceptor emissionand an increase in the donor PL (Fig. 5).
Fig. 4 PL decay spectra of (A) CdSe/4CdS/2ZnS, (B) CdSe/10CdS/2ZnS, and (C) CdSe/16CdS/2ZnS donors in the presence of his-tagged AF647.(D) A representative control experiment plotting the PL decay of a CdSe/10CdS/2ZnS donor in the presence of non his-tagged AF647. Inset plots are ofthe same data on a semi-log scale. The FRET efficiency (E) and decrease in donor lifetime (F) obtained from A, B and C. The error of each term, τi or Ai, inthe tri-exponential fits of plots A–C were taken and used to determine the error bars in subplots E and F through standard error propagation techniques.
Paper Nanoscale
16452 | Nanoscale, 2017, 9, 16446–16458 This journal is © The Royal Society of Chemistry 2017
Publ
ishe
d on
03
Oct
ober
201
7. D
ownl
oade
d by
Bos
ton
Uni
vers
ity o
n 08
/06/
2018
13:
22:1
5.
View Article Online
Because all of the QDs provide sufficient signal intensitywhen measured on a fluorimeter, the significantly higherFRET efficiency and range in FA/FD make the thin shelled QDsa better choice for spectrally resolved FRET sensors. For alarger gQD donor, increasing the number of acceptors perdonor increases the range of FA/FD. This range, however, issomewhat limited when compared to thin-shelled QDs. gQDbrightness is much brighter than the dye acceptor, so even atsimilar FRET efficiencies, the FA/FD for sensors utilizing a thinshelled donor is larger. Instead, we explore a way to exploit thebrightness of the thick shelled donors by testing the possibilityof using them in visual sensors. Visual read-outs are particu-larly relevant for point-of-care (POC) diagnostics and where adigital yes/no result is informative.
To make visual enzyme sensors, FRET conjugates usingthin, medium, and thick shelled donors (1, 7, and 13 CdSshells, respectively) were loaded into 200 µL PCR tubes.Enzyme was added in excess (1 nmol) to each sensor and thedifference between the different sensors was visually observedunder illumination with a 365 nm ultraviolet light. QD-onlytubes and QD + peptide-dye (FRET quenched) tubes wereincluded for comparison. In the top row of Fig. 4B, the thin-shell QD emission in the left-most tube is nearly completelyquenched by the presence of the dye-labeled peptide (middletube). In the right-hand tube, there is QD brightening due toenzymatic cleavage of the dye-labeled peptide, but this changeis challenging to see by eye due to the relative dimness of theQDs at this shell thickness and concentration. In the middlerow, QDs with moderate shell thicknesses are quite bright, arevisibly quenched by the peptide-dye, and QD emission visiblyrecovers upon enzymatic cleavage. With the thickest shelledQD donors in the bottom row of the tubes, the emissions fromthe QDs are very bright in all of the tubes, making discern-ment between the quenched and unquenched state difficult.
For quantitative analysis, 30 µL of QD, QD + peptide-dye,and QD + peptide-dye + enzyme were monitored spectroscopi-
cally over time. In this assay, the number of acceptors perdonor was halved compared to the visual test and a less(0.2 nmol) enzyme was added per assay. In both assays(visual and spectroscopic), an excess of the peptide-acceptorand enzyme were used. Because FRET efficiency is highest andinitial sensor PL the lowest when using the smallest QDs, theextent of QD PL enhancement from enzyme cleavage relative toa sensor + no enzyme control is highest (Fig. 4A). However, thesignal intensity of the sensor using the thin-shelled QDs isso relatively dim that even after a four-fold increase in bright-ness following enzyme addition, the difference is difficult tosee visibly. PL of thin shelled QDs can be measured with afluorimeter, but is difficult to see by eye at low concentrations.Medium- and thick-shelled QDs are much brighter and areeasily visible at lower concentrations, but require more accep-tors to exhibit visible quenching (Fig. S10†).
ExperimentalMaterials
gQD synthesis. Cadmium oxide (CdO; 99.95%, Alfa Aesar),sulfur (99.95%, ACROS Organics), 1-octadecene (ODE; 90%,ACROS Organics), and oleylamine (80%–90%) were used aspurchased from Fisher Scientific. Zinc acetate (99.99%),selenium pellets (99.99%), and oleic acid (OA; 90%) were usedas purchased from Sigma-Aldrich for gQD synthesis. HPLC-grade solvents including hexanes (Fisher Scientific), methanol(Honeywell), Chloroform (J.T. Baker), and ethanol (Sigma-Aldrich) were bought and used without further purification.
Ligand reagents. DL-Thioctic acid (≥98%, ACROS Organics),1,1′-carbonyldiimidazole (CDI, 97%, ACROS Organics), ethylene-diamine (≥99%, Sigma-Aldrich), methyl acrylate (≥99%,ACROS Organics), lithium hydroxide (LiOH; ≥98%, Sigma-Aldrich), and sodium borohydride (NaBH4, powder, FisherScientific) were used for CL4 synthesis. Purification columns
Fig. 5 (A) QD emission recovery after enzyme addition over time. Data is normalized to PL intensity at corresponding time points of the sensor afteraddition of buffer without enzyme present. Plots are of means ± standard deviations of triplicates. (B) Comparison of visual sensors for different QDdonors at the QD concentrations used in Fig. 3 and acceptor/donor ratios as noted. Top to bottom: thin, medium and thick shelled donors. Left toright: QD only, QD A647 FRET quenching, QD + A647 + enzyme. (C) PL of the CdSe/7CdS/2ZnS sensor in the presence of enzyme (red) or buffer(green) compared to the QD control (dotted blue) after 30 minutes.
Nanoscale Paper
This journal is © The Royal Society of Chemistry 2017 Nanoscale, 2017, 9, 16446–16458 | 16453
Publ
ishe
d on
03
Oct
ober
201
7. D
ownl
oade
d by
Bos
ton
Uni
vers
ity o
n 08
/06/
2018
13:
22:1
5.
View Article Online
run during CL4 synthesis used silica gel sorbent (230–400Mesh, Grade 60, Fisher Scientific).
Peptide-dye conjugates and FRET assays. Alexa Fluor® 647C2 Maleimide was purchased from Life Technologies andbovine serum albumin powder from Fisher Scientific. Dimethyl-sulfoxide (DMSO; 99.5%), phosphate buffered saline, pH 7.4,α-Chymotrypsin from Bovine Pancreas, Type II, ≥40 units permg and HEPES were purchased from Sigma-Aldrich and usedfor preparation of buffers and reagents for FRET assays.
Quantum dot synthesis
Precursor preparation. To prepare 0.2 M cadmium oleate(Cd(OA)2), 2.57 g of CdO and 28.07 or 70.18 mL of OA wasloaded into a 250 mL round bottom flask (rbf) for a Cd : OAratio of 1 : 4 or 1 : 10, respectively. The mixture was thendegassed and heated to 100 °C. The reaction was vacuumed at100 °C until it began to clarify, at which point it was backfilledwith argon and 72 or 29.89 mL of ODE was added to the flaskto yield a 100 mL solution at 0.2 M Cd(OA)2. Complete conver-sion of the CdO occurred upon heating to 180 °C under argon,as indicated by the solution turning clear. Once complete con-version has occurred, the precursor was allowed to cool to100 °C and degassed for ∼1 h to ensure complete removal ofwater. The precursor solution is a waxy solid at room tempera-ture and warmed under argon to 80 °C when in use.
The 0.2 M zinc oleate (Zn(OA)2) precursor was prepared witha 1 : 4 Zn : OA ratio in the same manner as Cd(OA)2. Specifically,4.39 g of zinc acetate was added to 28.05 mL of OA and con-verted before 71.95 mL of ODE were added to dilute the productto 0.2 M in 100 mL. The precursor solution is solid at roomtemperature and stored under argon at 95 °C when in use.
A 1 M TOP : Se stock was made by adding 3.95 g of seleniumpellets to 50.03 mL of TOP and stirring overnight at 80 °C.100 mL of 0.2 M precursor solution was made by diluting 20 mLof the 1 M stock to a total volume of 100 mL with 80 mL of ODE.The precursor was then stored at room temperature under argon.
A 0.2 M sulfur precursor was made by adding 1.28 g ofelemental sulfur to 199.59 mL of ODE and stirred overnight at80 °C. Sulfur precipitates from solution at room temperatureand is kept at 80 °C under argon when in use.
Quantum dot core synthesis. CdSe cores were nucleatedusing a modified version of a previously described hot injectionmethod.17 1 g TOPO, 8 mL ODE, and 10 mL of 0.2 M Cd(OA)2(1 : 4) were loaded into a 100 mL rbf and degassed at roomtemperature and at 80 °C for 30 min each. The solution wasthen heated to 300 °C at which point a pre-mixed bolus injec-tion comprising 0.4 mL 1 M TOP : Se, 3 mL oleylamine, and1 mL ODE solution was added to the flask. After 3 min, the rbfwas removed from its heating mantle and cooled to room temp-erature. The solution was degassed for 45 min at room tempera-ture. The cores were precipitated under air-free conditions usingethanol and methanol and redispersed in hexane.
Shelling reactions. 1–16 atomic monolayers of CdS wereadded to the CdSe core via a modified successive ion layeradsorption reaction (SILAR) method as reported by Ghosh,et al.17 Briefly, 5 mL of ODE and 5 mL oleylamine were added
to 6 different 100 mL rbfs and heated to 80 °C under vacuumfor 30 min each. The amount of precursor needed to add asingle atomic monolayer of shell material was calculated on avolume basis using the density and lattice constant for wurt-zite CdS. The calculated amount of 0.2 M Cd(OA)2 correlatingto a single cation layer was added dropwise to the core solutionat 160 °C and annealed for 2.5 h. After 2.5 h, the temperatureof the reaction flask was raised to 240 °C and the same volumeof 0.2 M sulfur precursor was injected dropwise, followed by a1 h anneal. The anneal temperature was set to 240 °C for allsubsequent cation/anion addition and anneal cycles. Eachflask differed only in the number of CdS shells added to theinitial core solution. Shells 1–4 were made using Cd(OA)2 witha 1 : 4 ratio of Cd to OA, while shells 5 and above utilized the1 : 10 Cd : OA Cd(OA)2. The Cd additions were halted in the sixflasks after 1, 4, 7, 10, 13, or 16 rounds of SILAR, respectively.After substantial samples of the core/shell heterostructureswere removed, 2 layers of ZnS shell were added to each shell-thickness reaction using 0.2 M Zn(OA)2 and 0.2 M sulfur inODE and 30 min anneals at 240 °C after each injection.
Ligand synthesis. A short hydrophilic ligand, compactligand four (CL4), developed by Susumu, et al., was used towater solubilize the QDs.53 The ligand was synthesized as pre-viously described,53 with the following modification: reactionvolumes were increased four-fold and extra salts were removedby filtration prior to the evaporation of ethanol. For example,12 g (0.0145 mol) of thioctic acid and 10.36 g (0.064 mol) ofCDI were added to a 250 mL rbf and purged with argon.120 mL of chloroform was added by syringe and the mixturewas stirred for 1 h at room temperature under active argonflow. 32 mL of ethylene diamine and 120 mL of chloroformwere loaded into a separate 1 L rbf under argon with anaddition funnel attached. The thioctic acid/CDI/chloroformmixture was then added dropwise to the ethylene diaminemixture dropwise over the course of 4 h and left to stir at roomtemperature overnight under active argon flow. The solutionwas transferred to a separatory funnel and 400 mL of DI wateradded. The mixture was shaken and left to separate. Thechloroform layer was collected and the water layer washed threeadditional times with chloroform. The organic layers were com-bined and vacuum concentrated to ∼80 mL to be purified onsilica gel with CHCl3/MeOH (5 : 1) as eluent. The purified crudeproduct was concentrated under vacuum to ∼60 mL and dilutedwith 280 mL MeOH. 40 mL of methyl acrylate was added drop-wise via addition funnel and the resulting solution was left tostir for 2 days under active argon flow at room temperature. Theexcess methyl acrylate and solvent was evaporated off and theproduct purified by silica gel with CHCl3/MeOH (20 : 1) aseluent. Excess solvent was then evaporated off until a yellow oilremained. The product was weighed and stored at 4 °C for sub-sequent ring-opening immediately prior to QD ligand exchange.
To ring open the stored product, 20.9 mg LiOH, 2 mL EtOHand 1 mL DI H2O was added for every 0.321 g of product. Themixture was allowed to react for 2 hours at room temperaturebefore 4 M HCl was used to adjust the pH of the solutionto ∼8. For every 0.321 g of product, 60.6 mg of NaBH4 was
Paper Nanoscale
16454 | Nanoscale, 2017, 9, 16446–16458 This journal is © The Royal Society of Chemistry 2017
Publ
ishe
d on
03
Oct
ober
201
7. D
ownl
oade
d by
Bos
ton
Uni
vers
ity o
n 08
/06/
2018
13:
22:1
5.
View Article Online
added, and the mixture was stirred for 1.5 h under activeargon flow. The pH of the solution was then adjusted to ∼7–8and filtered through a cotton plug in order to remove precipi-tated salts. The excess EtOH was evaporated off, resulting in aclear aqueous CL4 solution at a ∼760 mM concentration.
Ligand exchange. A biphasic mixture of QDs in chloroformand 760 mM CL4 in water was left to stir overnight in argonfilled glass vials. The ratio of CL4 to QD was adjusted to accountfor the larger surface area of gQDs such that 3500 molecules ofCL4 per unit surface area (nm2) of QD was used in each transfer.For example, 1.4 mL of 760 mM CL4 was added to 1 mL of a3.96 μM CdSe/1CdS/2ZnS QD solution in chloroform and left tostir overnight after flushing with argon and capping. With over-night stirring, the QDs transfered to the water phase and thechloroform phase became clear. The water phase was collected,filtered through a 0.1 µm PVDF syringe filter (Celltreat ScientificProducts LLC), and buffer exchanged with PBS, pH 7.4, threetimes using 30 kDa centrifugal filters (EMD Millipore). Ligand-exchanged QDs were stored concentrated at 4 °C.
Dye-labeling of acceptor peptide. The peptide sequence usedfor all FRET and enzymatic cleavage assays was ordered fromand synthesized by Biomatik. The sequence used, Ac-HHHHHH-GL(Aib)AAGGWGC-NH2, was previously describedby Medintz, et al.43 The peptide includes six histidines for che-lation to the QD surface and a chymotrypsin cleavage site sep-arated by a generic spacer sequence. Aib refers to the syntheticamino acid alpha-aminoisobutryic acid.
A 100 µM peptide solution in 10 mM PBS, pH 7.4, wastreated with a 10-fold molar excess of TCEP to reduce disulfidebonds. A freshly made 10 mM solution of Alexa Fluor® C2Maleimide in DMSO was added dropwise to the peptide solu-tion. The final reaction contained 800 nmol of maleimide-dyeand 160 nmol of peptide. The conjugation ran overnight at4 °C and was subsequently purified via Ni-NTA immobilizedmetal affinity chromatography (IMAC). The purified productwas buffer exchanged to PBS, pH 7.4, using 3 kDa MWCO cen-trifugal filters (EMD Millipore) to remove excess peptide andconcentrate the labeled peptide solution.
Quantum dot characterization
Transmission electron microscopy. The core, core/shell, andcore/shell/shell samples were imaged on a JEOL 2100 TEM.Analysis of many transmission electron micrographs (n =109–535) yielded the core and shell size of each QD.
Dynamic light scattering. DLS measurements were taken ona Brookhaven 90plus Nano-particle Sizer. The run time foreach measurement was set for 1 min and each sample wasmeasured 3–5 times. Reported hydrodynamic diameters weretaken from the number averaged measurements using a par-ticle refractive index of 1.6.
QD optical characterization. The initial concentration andsubsequent dilution of each SILAR reaction flask was kepttrack of and samples of as-synthesized QDs at known concen-tration were stored in glass vials. Absorption measurements ofas-synthesized CdSe/xCdS QDs diluted in chloroform weretaken on a Nanodrop 2000c (Thermo Scientific) in cuvettes to
back-calculate their molar extinction coefficients at 400 nm.This was not done for CdSe/xCdS/2ZnS QD samples due to theturbidity of the as-synthesized solutions of the samples with>10 CdS monolayers. Absorbance measurements of the CdSe/xCdS/2ZnS QDs were taken in water and then normalized tothe measured molar extinction coefficient to generate the plotin Fig. 2D.
Photoluminescence was measured on a Horiba Jobin YvonNanolog. The relative quantum yields of each of the sampleswas determined by plotting integrated emission as a functionof absorption at excitation wavelength (400 nm) of 3–5 sampledilutions and comparing the resulting slope to that ofRhodamine 6G (R6G) in ethanol. The quantum yield of R6G inethanol is 94% and independent of concentration up to 20 µMwhen excited at 488 nm.66 The differences in excitation wave-lengths were accounted for by dividing the measured emissionintensity by the lamp intensity at each wavelength. The bright-ness of each heterostructure was determined by multiplyingthe εQD at 400 nm (the excitation wavelength for the QYmeasurements) by the relative QY.
PL decay measurements were taken using a fluorescencelifetime spectrometer (LifeSpec II, Edinburg Instruments),employing a time-correlated single photon countingtechnique. Samples were excited at 405 nm using a pulsediode laser (EPL-405, Edinburg Instruments) at 2 μs pulseperiod. Photons were collected over a 0.5–2 μs time range withchannel widths of 1.02 ns. The collected lifetimes were fit to atri-exponential decay (F980 Software, Edinburg Instruments):
IðtÞ ¼ A1e� t
τ1 þ A2e� t
τ2 þ A3e� t
τ3 ð1Þwhere t represents time and Ai are coefficients that indicate theweight associated with each decay time. Average amplitudeweighted lifetimes were calculated using:67
τave ¼ A1τ1 þ A2τ2 þ A3τ3A1 þ A2 þ A3
ð2ÞFRET assays
The QD : AF647 FRET systems were allowed to bind via histi-dine-mediated self-assembly in PBS + 1% (w/v) BSA solution.Well plate assays were prepared in triplicate using black, non-binding 384 well-plates (Corning) such that donor to acceptorratios (D : A) ranged from 0 to 10. QD excitation was set to400 nm with a slit width of 2 nm and spectra was collectedusing the MicroMax Plate Reader attachment for the HoribaNanolog Fluorimeter. The PL decay of QD + his-tagged AF647solutions prepared in a similar manner was measured in cuv-ettes while stirring. For enzymatic cleavage assays, QD only,QD + His6 + AF647 (no FRET control), and QD + His6 : AF647(FRET quenched sensor) wells were prepared in sextuplicatefor each QD donor. PL spectra were taken before addition ofenzyme. After initial measurement, 5 µL of 1 mg mL−1
α-chymotrypsin in 10 mM HEPES, pH 8 was added to 3 repli-cates while the remaining 3 were loaded with 10 µL of 10 mMHEPES, pH 8. PL was measured every 5 min over 1 h in orderto monitor change in sensor brightness over time. Change insensor brightness was calculated by normalizing the PL of the
Nanoscale Paper
This journal is © The Royal Society of Chemistry 2017 Nanoscale, 2017, 9, 16446–16458 | 16455
Publ
ishe
d on
03
Oct
ober
201
7. D
ownl
oade
d by
Bos
ton
Uni
vers
ity o
n 08
/06/
2018
13:
22:1
5.
View Article Online
enzyme loaded wells to that of the buffer only controls. Thiswas then multiplied by initial FRET quenched QD PL tocompare brightness between QD donors. The photo in Fig. 4Awas generated by replicating the wells used in the enzyme clea-vage assays in 200 µL PCR tubes. 1 nmol of enzyme was addedto the rightmost tube and the photo was taken approximately10 minutes after addition of enzyme.
FRET analysis
The overlap integral, J, describes the spectral overlap of thedonor emission and acceptor absorption. Specifically:
J ¼ðFDðλÞεAðλÞλ4dλ ð3Þ
where FDðλÞ is the normalized emission spectrum of the donorand εA(λ) is the molar extinction coefficient of the acceptor as afunction of wavelength, λ. Förster distance, R0, defined as thedistance at which EFRET is 50%, is a function of dipole orien-tation factor, κ2, donor QY, QD, overlap integral, and solventrefractive index, η:
R06 ¼ ð8:785� 10�5Þκ2QD
Jη4
: ð4Þ
The dipole orientation has been assumed to be random, soκ2 has been set to 2/3 for all calculations.
EFRET is experimentally determined by the degree of donorquenching. Raw FRET spectra were background subtracted fordirect acceptor excitation and peak fitted using OriginPro. TheEFRET of the peak-fitted and background-subtracted data wascalculated using the following expression:
EFRET ¼ 1� FDAFD
¼ 1� τDAτD
ð5Þ
where FD and τD are the emission intensity and average fluo-rescence lifetime of the donor alone, and FDA and τD are theemission intensity and average fluorescence lifetime of thedonor in the presence of acceptor(s). FD is normalized to thecollisional quenching control at the same dye concentration inorder to account for non-FRET based quenching. EFRET can alsobe described as a function of the average number of acceptorsper donor, n, taking into account that given a specific donoracceptor ratio, the specific number of acceptors, k, bound toeach donor is described by a Poissonian distribution:40,68
EFRETðnÞ ¼X1k¼1
nke�n
k!kR0
6
kR06 þ kRDA
6ð Þ ð6Þ
RDA was calculated from eqn (6) using the experimentallydetermined FRET efficiency and R0, as calculated with eqn (4).
Conclusions
High-quality CdSe/xCdS and CdSe/xCdSe/2ZnS heterostruc-tured QDs were synthesized and characterized to demonstratethe advantages and disadvantages of gQDs in biological appli-cations. The thick-shelled, Zn-capped gQDs exhibit relative
brightness 38-fold larger than those of thin-shelled, ZnS-capped QDs. For energy transfer, high brightness is useful inlow concentration assays when enhanced signal to noise ratiosis beneficial. The disadvantage of using gQD donors in FRETassays is the increased donor–acceptor distance that decreasesmaximum FRET efficiency. The overall QD size is minimizedby using short, thiol-based ligands for water solubilization.Thin-shelled or core-only QDs are non-emissive followingthiol-based bond ligand transfer, but photoluminescence canpersist (albeit dimmed) when the QDs are capped by a protec-tive layer of the high bandgap semiconductor, ZnS. QDs withmore than 7 CdS MLs do not need the ZnS layer to exhibitmeasurable PL following ligand exchange, but quantum yieldsare higher for all samples with the ZnS cap. CdSe/7CdS/2ZnSQDs showed optimal properties as gQD FRET donors. Theymaintain the highest QY after ligand transfer with the thiol-based ligand and exhibit FRET efficiencies of up to 60% whenattached to a dye-labeled peptide. Furthermore, their bright-ness in water is up to 8 times that of thin shelled or commer-cially available ITK655 QDs. A test sensor was made to monitorα-chymotrypsin proteolytic activity. The sensor exhibited a sig-nificant decrease in FRET signal as a direct consequence ofpeptide cleavage and demonstrated the viability of gQD donorFRET assemblies as biological sensors.
Conflicts of interest
There are no conflicts to declare.
Acknowledgements
This work was performed in part at the Center for NanoscaleSystems (CNS), a member of the National NanotechnologyInfrastructure Network (NNIN), which is supported by theNational Science Foundation under NSF award no.ECS-0335765. CNS is part of Harvard University. This work wassupported in part through a Boston University MaterialsScience and Engineering Innovation Grant. Financial supportfor Margaret Chern was provided through the Clare BootheLuce (CBL) Program from the Henry Luce Foundation.
Notes and references
1 I. L. Medintz, H. T. Uyeda, E. R. Goldman andH. Mattoussi, Nat. Mater., 2005, 4, 435–446.
2 A. M. Dennis, J. B. Delehanty and I. L. Medintz, J. Phys.Chem. Lett., 2016, 7, 2139–2150.
3 A. M. Smith and S. Nie, Acc. Chem. Res., 2010, 43, 190–200.4 Z. Deng, H. Yan and Y. Liu, J. Am. Chem. Soc., 2009, 131,
17744.5 O. Adegoke and E. Y. Park, Sci. Rep., 2016, 6, 27288.6 F. García-Santamaría, Y. Chen, J. Vela, R. D. Schaller,
J. A. Hollingsworth and V. I. Klimov, Nano Lett., 2009, 9,3482.
Paper Nanoscale
16456 | Nanoscale, 2017, 9, 16446–16458 This journal is © The Royal Society of Chemistry 2017
Publ
ishe
d on
03
Oct
ober
201
7. D
ownl
oade
d by
Bos
ton
Uni
vers
ity o
n 08
/06/
2018
13:
22:1
5.
View Article Online
7 J. Vela, H. Htoon, Y. Chen, Y. S. Park, Y. Ghosh,P. M. Goodwin, J. H. Werner, N. P. Wells, J. L. Casson andJ. A. Hollingsworth, J. Biophotonics, 2010, 3, 706–717.
8 S. J. Lim, M. U. Zahid, P. Le, L. Ma, D. Entenberg,A. S. Harney, J. Condeelis and A. M. Smith, Nat. Commun.,2015, 6, 8210.
9 Y. Chen, J. Vela, H. Htoon, J. L. Casson, D. J. Werder,D. A. Bussian, V. I. Klimov and J. A. Hollingsworth, J. Am.Chem. Soc., 2008, 130, 5026.
10 M. Benoit, S. Piernicola, B. Stéphanie, Q. Xavier, H. Jean-Pierre and D. Benoit, Nat. Mater., 2008, 7, 659.
11 A. M. Dennis, B. D. Mangum, A. Piryatinski, Y.-S. Park,D. C. Hannah, J. L. Casson, D. J. Williams, R. D. Schaller,H. Htoon and J. A. Hollingsworth, Nano Lett., 2012, 12,5545.
12 K. Kim, H. Lee, J. Ahn and S. Jeong, Appl. Phys. Lett., 2012,101, 073107.
13 B. D. Mangum, F. Wang, A. M. Dennis, Y. Gao, X. Ma,J. A. Hollingsworth and H. Htoon, Small, 2014, 10, 2892–2901.
14 D. Canneson, L. Biadala, S. Buil, X. Quelin, C. Javaux,B. Dubertret and J. P. Hermier, Phys. Rev. B: Condens.Matter, 2014, 89, 035303.
15 M. Nasilowski, P. Spinicelli, G. Patriarche and B. Dubertret,Nano Lett., 2015, 15, 3953.
16 Y.-S. Park, A. V. Malko, J. Vela, Y. Chen, Y. Ghosh, F. Garcia-Santamaria, J. A. Hollingsworth, V. I. Klimov and H. Htoon,Phys. Rev. Lett., 2011, 106, 187401.
17 Y. Ghosh, B. D. Mangum, J. L. Casson, D. J. Williams,H. Htoon and J. A. Hollingsworth, J. Am. Chem. Soc., 2012,134, 9634–9643.
18 J. Kundu, Y. Ghosh, A. M. Dennis, H. Htoon andJ. A. Hollingsworth, Nano Lett., 2012, 12, 3031–3037.
19 A. M. Keller, Y. Ghosh, M. S. Devore, M. E. Phipps,M. H. Stewart, B. S. Wilson, D. S. Lidke, J. A. Hollingsworthand J. H. Werner, Adv. Funct. Mater., 2014, 24, 4796–4803.
20 X. Peng, M. C. Schlamp, A. Kadavanich and A. P. Alivisatos,J. Am. Chem. Soc., 1997, 119, 7019–7029.
21 J. van Embden, J. Jasieniak and P. Mulvaney, J. Am. Chem.Soc., 2009, 131, 14299.
22 F. Garcia-Santamaria, S. Brovelli, R. Viswanatha,J. A. Hollingsworth, H. Htoon, S. A. Crooker andV. I. Klimov, Nano Lett., 2011, 11, 687–693.
23 J. R. Lakowicz, Principles of fluorescence spectroscopy,Springer, New York, 3rd edn, 2006.
24 I. Medintz and N. Hildebrandt, FRET - Förster resonanceenergy transfer: from theory to applications, Wiley-VCH,2014.
25 M. Stewart, A. Huston, A. Scott, E. Oh, W. Algar,J. Deschamps, K. Susumu, V. Jain, D. Prasuhn, J. Blanco-Canosa, P. Dawson and I. Medintz, ACS Nano, 2013,7, 9489.
26 S. Huang, H. Qiu, Q. Xiao, C. S. Huang, W. Su and B. Hu,J. Fluoresc., 2013, 23, 1089–1098.
27 I. L. Medintz and H. Mattoussi, Phys. Chem. Chem. Phys.,2008, 11, 17–45.
28 D. E. Prasuhn, A. Feltz, J. B. Blanco-Canosa, K. Susumu,M. H. Stewart, B. C. Mei, A. V. Yakovlev, C. Loukov,J.-M. Mallet, M. Oheim, P. E. Dawson and I. L. Medintz,ACS Nano, 2010, 4, 5487.
29 A. R. Clapp, I. L. Medintz, J. M. Mauro, B. R. Fisher,M. G. Bawendi and H. Mattoussi, J. Am. Chem. Soc., 2004,126, 301.
30 A. Shamirian, A. Ghai and P. Snee, Sensors, 2015, 15,13028–13051.
31 R. Alam, D. M. Fontaine, B. R. Branchini and M. M. Maye,Nano Lett., 2012, 12, 3251.
32 R. Alam, J. Zylstra, D. M. Fontaine, B. R. Branchini andM. M. Maye, Nanoscale, 2013, 5, 5303–5306.
33 R. Alam, L. M. Karam, T. L. Doane, J. Zylstra,D. M. Fontaine, B. R. Branchini and M. M. Maye,Nanotechnology, 2014, 25, 495606.
34 W. R. Algar, D. Wegner, A. L. Huston, J. B. Blanco-Canosa,M. H. Stewart, A. Armstrong, P. E. Dawson, N. Hildebrandtand I. L. Medintz, J. Am. Chem. Soc., 2012, 134, 1876.
35 H. S. Afsari, M. Cardoso Dos Santos, S. Lindén, T. Chen,X. Qiu, P. M. P. van Bergen en Henegouwen, T. L. Jennings,K. Susumu, I. L. Medintz, N. Hildebrandt and L. W. Miller,Sci. Adv., 2016, 2, e1600265.
36 M. Suzuki, Y. Husimi, H. Komatsu, K. Suzuki andK. T. Douglas, J. Am. Chem. Soc., 2008, 130, 5720.
37 A. M. Dennis, W. J. Rhee, D. Sotto, S. N. Dublin and G. Bao,ACS Nano, 2012, 6, 2917.
38 P. T. Snee, R. C. Somers, G. Nair, J. P. Zimmer,M. G. Bawendi and D. G. Nocera, J. Am. Chem. Soc., 2006,128, 13320.
39 A. Shamirian, H. Samareh Afsari, A. Hassan, L. W. Millerand P. T. Snee, ACS Sens., 2016, 1, 1244–1250.
40 W. R. Algar, M. G. Ancona, A. P. Malanoski, K. Susumu andI. L. Medintz, ACS Nano, 2012, 6, 11044–11058.
41 M. Massey, J. J. Li and W. R. Algar, in CancerNanotechnology: Methods and Protocols, ed. R. Zeineldin,Springer New York, New York, NY, 2017, pp. 63–97, DOI:10.1007/978-1-4939-6646-2_4.
42 W. R. Algar, A. Malonoski, J. R. Deschamps, J. B. Blanco-Canosa, K. Susumu, M. H. Stewart, B. J. Johnson,P. E. Dawson and I. L. Medintz, Nano Lett., 2012, 12, 3793–3802.
43 I. L. Medintz, A. R. Clapp, F. M. Brunel, T. Tiefenbrunn,H. T. Uyeda, E. L. Chang, J. R. Deschamps, P. E. Dawsonand H. Mattoussi, Nat. Mater., 2006, 5, 581–589.
44 K. Boeneman, B. C. Mei, A. M. Dennis, G. Bao,J. R. Deschamps, H. Mattoussi and I. L. Medintz, J. Am.Chem. Soc., 2009, 131, 3828.
45 S. Thiollet, C. Bessant and S. L. Morgan, Anal. Biochem.,2011, 414, 23.
46 H. Peng, L. Zhang, T. H. M. Kjällman, C. Soeller andJ. Travas-Sejdic, J. Am. Chem. Soc., 2007, 129, 3048.
47 X. Qiu, J. Guo, Z. Jin, I. L. Medintz and N. Hildebrandt,Small, 2017, 1700332, DOI: 10.1002/smll.201700332.
48 J. Lee, M. B. Brennan, R. Wilton, C. E. Rowland,E. A. Rozhkova, S. Forrester, D. C. Hannah, J. Carlson,
Nanoscale Paper
This journal is © The Royal Society of Chemistry 2017 Nanoscale, 2017, 9, 16446–16458 | 16457
Publ
ishe
d on
03
Oct
ober
201
7. D
ownl
oade
d by
Bos
ton
Uni
vers
ity o
n 08
/06/
2018
13:
22:1
5.
View Article Online
E. V. Shevchenko, D. S. Schabacker and R. D. Schaller,Nano Lett., 2015, 15, 7161–7167.
49 E. R. Goldman, I. L. Medintz, J. L. Whitley, A. Hayhurst,A. R. Clapp, H. T. Uyeda, J. R. Deschamps, M. E. Lassmanand H. Mattoussi, J. Am. Chem. Soc., 2005, 127, 6744.
50 S. Bhuckory, O. Lefebvre, X. Qiu, K. D. Wegner andN. Hildebrandt, Sensors, 2016, 16, 197.
51 X. Qiu, K. D. Wegner, Y.-T. Wu, P. M. P. van Bergen EnHenegouwen, T. L. Jennings and N. Hildebrandt, Chem.Mater., 2016, 28, 8256.
52 J. J. Li, Y. A. Wang, W. Guo, J. C. Keay, T. D. Mishima,M. B. Johnson and X. Peng, J. Am. Chem. Soc., 2003, 125,12567.
53 K. Susumu, E. Oh, J. B. Delehanty, J. B. Blanco-Canosa,B. J. Johnson, V. Jain, W. J. T. Hervey, W. R. Algar,K. Boeneman, P. E. Dawson and I. L. Medintz, J. Am. Chem.Soc., 2011, 133, 9480–9496.
54 A. M. Dennis, D. C. Sotto, B. C. Mei, I. L. Medintz,H. Mattoussi and G. Bao, Bioconjugate Chem., 2010, 21,1160–1170.
55 P. Reiss, M. Protiere and L. Li, Small, 2009, 5, 154–168.56 H. T. Uyeda, I. L. Medintz, J. K. Jaiswal, S. M. Simon and
H. Mattoussi, J. Am. Chem. Soc., 2005, 127, 3870–3878.57 E. Cai, P. Ge, S. H. Lee, O. Jeyifous, Y. Wang, Y. Liu,
K. M. Wilson, S. J. Lim, M. A. Baird, J. E. Stone, K. Y. Lee,M. W. Davidson, H. J. Chung, K. Schulten, A. M. Smith,W. N. Green and P. R. Selvin, Angew. Chem., Int. Ed., 2014,53, 12484–12488.
58 G. Palui, T. Avellini, N. Zhan, F. Pan, D. Gray, I. Alabuginand H. Mattoussi, J. Am. Chem. Soc., 2012, 134, 16370–16378.
59 D. Reddy, D. Kim, S. Rhee, B. Lee and C. Liu, NanoscaleRes. Lett., 2014, 9, 1–8.
60 D. Shepherd, K. Whitcomb, K. Milligan, P. Goodwin,M. P. Gelfand and A. Van Orden, J. Phys. Chem. C, 2010,114, 14831–14837.
61 A. Clapp, E. Goldman and H. Mattoussi, Nat. Protoc., 2006,1, 1258–1266.
62 K. Boeneman, J. R. Deschamps, S. Buckhout-White,D. E. Prasuhn, J. B. Blanco-Canosa, P. E. Dawson,M. H. Stewart, K. Susumu, E. R. Goldman, M. Ancona andI. L. Medintz, ACS Nano, 2010, 4, 7253.
63 D. J. Desilets, P. T. Kissinger and F. E. Lytle, Anal. Chem.,1987, 59, 1244–1246.
64 H. D. Heck, J. Am. Chem. Soc., 1971, 93, 23–29.65 A. Nagy, K. Gemmill, J. Delehanty, I. Medintz and
K. Sapsford, IEEE J. Sel. Top. Quantum Electron., 2014, 20,115–126.
66 M. Fischer and J. Georges, Chem. Phys. Lett., 1996, 260,115–118.
67 I. L. Medintz, T. Pons, K. Susumu, K. Boeneman,A. Dennis, D. Farrell, J. R. Deschamps, J. S. Melinger,G. Bao and H. Mattoussi, J. Phys. Chem. C, 2009, 113,18552–18561.
68 T. Pons, I. L. Medintz, X. Wang, D. S. English andH. Mattoussi, J. Am. Chem. Soc., 2006, 128, 15324.
Paper Nanoscale
16458 | Nanoscale, 2017, 9, 16446–16458 This journal is © The Royal Society of Chemistry 2017
Publ
ishe
d on
03
Oct
ober
201
7. D
ownl
oade
d by
Bos
ton
Uni
vers
ity o
n 08
/06/
2018
13:
22:1
5.
View Article Online
Related Documents


