Nanofibrous fibrinogen scaffolds Towards an understanding of the self- assembly mechanisms and an application as a biomaterial Dissertation Zur Erlangung des Doktorgrades in den Naturwissenschaften (Dr. rer. nat.) Fachbereich 1 (Physik, Elektrotechnik) Universität Bremen Karsten Stapelfeldt Termin des Kolloquiums: 02.10.2020

Welcome message from author
This document is posted to help you gain knowledge. Please leave a comment to let me know what you think about it! Share it to your friends and learn new things together.
Transcript
Nanofibrous fibrinogen scaffolds
Towards an understanding of the self-
assembly mechanisms and an application
as a biomaterial
Dissertation
Zur Erlangung des Doktorgrades in den Naturwissenschaften (Dr. rer. nat.)
Fachbereich 1 (Physik, Elektrotechnik)
Universität Bremen
Karsten Stapelfeldt
Termin des Kolloquiums: 02.10.2020

Erstgutachterin: Prof. Dr. Dorothea Brüggemann
Zweitgutachterin: Prof. Dr. Monika Fritz
Table of contents
I. List of figures ......................................................................................................... i
II. List of tables .......................................................................................................... ii
III. Summary .............................................................................................................. iii
IV. Zusammenfassung ................................................................................................. v
1. Motivation ............................................................................................................. 1
2. Introduction .......................................................................................................... 4
2.1. The extracellular matrix ........................................................................................ 4
2.2. Wound healing ...................................................................................................... 6
2.3. Fibrinogen and fibrin ............................................................................................ 7
2.3.1. Molecular Structure of fibrinogen ......................................................................... 8
2.3.2. Conversion of fibrinogen into fibrin nanofibers .................................................. 11
2.3.3. Fibrin as a provisional extracellular matrix ........................................................ 18
2.3.4. Cellular interactions with the fibrin clot .............................................................. 21
2.4. Tissue engineering using fibrin and fibrinogen .................................................... 23
2.4.1. Fibrin as a biomaterial for tissue engineering ...................................................... 25
2.4.2. Fibrinogen as biomaterial for tissue engineering ................................................. 26
2.4.2.1. Electrospinning of fibrinogen fibers .................................................................... 30
2.5. Aim of the thesis .................................................................................................. 34
3. Background of the main analytical techniques .................................................... 36
3.1. Scanning electron microscopy ............................................................................. 36
3.2. Circular Dichroism Spectroscopy ........................................................................ 38
4. Methods .............................................................................................................. 47
4.1. Preparation of fibrinogen, buffers and solutions ................................................. 47
4.1.1. Buffer preparation .............................................................................................. 47
4.1.2. Fibrinogen solutions ............................................................................................ 48
4.2. Substrate preparation ......................................................................................... 49
4.3. Assembly of fibrin and fibrinogen scaffolds ......................................................... 51
4.3.1. Measurements of turbidity .................................................................................. 54
4.4. Stabilization and crosslinking of fibrinogen samples ........................................... 56
4.4.1. Washing and detachment of fibrinogen scaffolds ................................................ 58
4.5. Scanning electron microscopy ............................................................................. 59

4.6. Structural analysis of self-assembled fibrinogen .................................................. 60
4.6.1. Circular dichroism measurements of fibrinogen solution and fibrin .................... 61
4.6.2. Circular dichroism measurements of dried fibrinogen scaffolds .......................... 62
4.7. Long-term degradation of self-assembled fibrinogen scaffolds............................. 65
4.7.1. Enzymatic degradation of fibrinogen in solution.................................................. 65
4.8. Binding of fibrinogen and heparin to self-assembled fibrinogen scaffolds ............ 67
5. Results ................................................................................................................. 69
5.1. Morphology of self-assembled fibrinogen scaffolds .............................................. 69
5.1.1. Assembly of fibrinogen scaffolds, comparison to fibrin ........................................ 70
5.1.2. Influence of fibrinogen concentration .................................................................. 74
5.1.3. Effect of varying buffer concentrations ................................................................ 79
5.1.4. Influence of different salts on fibrinogen assembly .............................................. 83
5.1.5. Fibrinogen assembly under varying pH conditions .............................................. 85
5.1.6. Effect of different humidities during fibrinogen assembly ................................... 89
5.1.7. Assembly of fibrinogen nanofibers on different substrate materials .................... 91
5.1.8. Fiber stability and crosslinking ............................................................................ 95
5.1.9. Free-standing and immobilized fibrinogen scaffolds ............................................ 99
5.2. Conformational changes in self-assembled fibrinogen nanofibers ...................... 101
5.2.1. Secondary structure of fibrinogen in solution and fibrin ................................... 101
5.2.2. Structural analysis of nanofibrous and planar fibrinogen .................................. 102
5.2.3. Concentration dependence of fibrinogen fiber secondary structure ................... 104
5.2.4. Secondary structure of fibrinogen nanofibers under varying pH conditions ...... 105
5.2.5. Influence of humidity on the secondary structure of fibrinogen nanofibers ....... 107
5.2.6. Effect of crosslinking on the secondary structure of nanofibrous fibrinogen
scaffolds 107
5.2.7. Secondary structure of dried and rehydrated fibrinogen nanofibers ................. 109
5.3. Bioactivity of self-assembled fibrinogen scaffolds .............................................. 111
5.3.1. Enzymatic degradation of fibrinogen in solution................................................ 111
5.3.2. Long-term enzymatic degradation of self-assembled fibrinogen scaffolds .......... 113
5.3.3. Binding of fibrinogen and heparin to self-assembled fibrinogen scaffolds .......... 119
6. Discussion .......................................................................................................... 122
6.1. Morphology of self-assembled fibrinogen scaffolds ............................................ 122
6.2. Changes of secondary structure accompanying fibrinogen self-assembly ........... 137
6.3. Bioactivity of self-assembled fibrinogen scaffolds .............................................. 142
6.4. Mechanism of fibrinogen self-assembly ............................................................. 148
7. Conclusion and Outlook .................................................................................... 154
8. References ......................................................................................................... 158
9. Acknowledgements ............................................................................................ 170
10. Eigenständigkeitserklärung ............................................................................... 171
List of abbreviations
a.u. Absorbance unit
AEBSF 4-(2-aminoethyl)benzenesulfonyl fluoride hydrochloride
APTES (3-Aminopropyl)triethoxysilane
DMEM Dulbecco’s modified Eagle’s medium
ECM Extracellular matrix
EDC 1-Ethyl-3-(3-dimethylaminopropyl)carbodiimid
EDTA Ethylenediaminetetraacetic acid
FPA Fibrinopeptide A
FPB Fibrinopeptide B
HEPES 4-(2-hydroxyethyl)-1-piperazineethanesulfonic acid
NHS-ester N-Hydroxysuccinimide-ester
N-terminus Amino-terminus
PBAT Polybutylene adipate terephthalate
PBS Phosphate buffered saline
PDMS Polydimethylsiloxan
PLA Polylactic acid
Plas Plasmin
PS Polystyrene
RGD-sequence Arginine, glycine, aspartate sequence
SDS PAGE Sodiumdodecylsulfate polyacrylamide gel electrophoresis
SEM Scanning electron microscope
ThT Thioflavine T
Uro Urokinase
UV Ultraviolet


List of figures
i
I. List of figures Figure 1: Time scale of wound healing.. ............................................................................................................. 7
Figure 2: Domain structure of the fibrinogen molecule ..................................................................................... 9
Figure 3: Conformational fluctuations of fibrinogens αC-domains. ................................................................. 10
Figure 4: Extrinsic and intrinsic pathway of the blood coagulation cascade .................................................... 13
Figure 5: Formation of a fibrin protofibril ......................................................................................................... 15
Figure 6: Transglutaminase crosslinking of fibrin protofibrils .......................................................................... 17
Figure 7: Scaffold types used in tissue engineering. ......................................................................................... 24
Figure 8: Scheme of an electrospinning setup .................................................................................................. 31
Figure 9: Schematic setup of an electron microscope. ..................................................................................... 37
Figure 10: Schematic setup of liquid and solid state spectroscopy. ................................................................. 39
Figure 11: Polarization of light .......................................................................................................................... 40
Figure 12: Scheme of a photoelastic modulator. .............................................................................................. 41
Figure 13: Elliptical orientation of field vectors. ............................................................................................... 42
Figure 14: Ramchandran plot of possible φ and ψ angles in a protein backbone. ........................................... 43
Figure 15: Schematic and molecular representation of α-helix and β-sheet structures in the protein
backbone. ................................................................................................................................................. 44
Figure 16: Calibration curve of fibrinogen absorbance .................................................................................... 49
Figure 17: Hydrophilicity of an untreated and a piranha cleaned glass slide ................................................... 50
Figure 18: Schematic representation of the fibrinogen sample preparation with addition of PBS .................. 52
Figure 19: Inside view of the humidity chamber .............................................................................................. 54
Figure 20: Representation of determination of sample coverage using ImageJ .............................................. 55
Figure 21: Reaction mechanisms of different crosslinking agents.................................................................... 57
Figure 22: Representation of fiber diameter analysis using ImageJ ................................................................. 60
Figure 23: Circular dichroism spectra of fibrinopeptides and thrombin .......................................................... 62
Figure 24: Calibration curves for the determination of the fibrinogen extinction coefficient at 214 nm ........ 63
Figure 25: Drying of fibrinogen in citrate buffer results in fibrinogen fibers .................................................... 70
Figure 26: Self-assembly of fibrinogen in phosphate buffer and PBS compared to fibrin ................................ 71
Figure 27: Self-assembly of fibrinogen scaffolds in the presence of AEBSF ..................................................... 72
Figure 28: Time series of the fibrinogen drying process ................................................................................... 73
Figure 29: Self-assembly of different fibrinogen concentrations in the presence of phosphate buffer or PBS 75
Figure 30: Average diameter of fibrinogen fibers assembled with different fibrinogen concentrations in
phosphate buffer or PBS .......................................................................................................................... 76
Figure 31: Cross-sections of self-assembled fibrinogen scaffolds .................................................................... 78
Figure 32: Self-assembly of fibrinogen scaffolds in the presence of different phosphate buffer or PBS
concentrations. ........................................................................................................................................ 80
Figure 33: Average diameter of fibrinogen fibers assembled with different phosphate buffer or PBS
concentrations ......................................................................................................................................... 81
Figure 34: Fibrinogen nanofiber scaffold coverage of 15 mm glass slides in dependence of the buffer
concentration used for self-assembly ...................................................................................................... 83
Figure 35: Self-assembly of fibrinogen in the presence of different PBS components .................................... 84
Figure 36: Self-assembly of fibrinogen in the presence of phosphate buffer or PBS with different pH values 86
Figure 37: Cross-sections of fibrinogen scaffolds prepared in the presence of PBS with different pH values . 88
Figure 38: Self-assembled fibrinogen scaffolds prepared at different humidities ........................................... 90
Figure 39: Self-assembly of fibrinogen in the presence of PBS on gold ............................................................ 91
ii
Figure 40: Concentration and pH dependency of fibrinogen self-assembly on gold substrates ...................... 93
Figure 41: Fibrinogen self-assembly in the presence of PBS on different surface materials ............................ 94
Figure 42: Washing of self-assembled fibrinogen scaffolds .............................................................................. 96
Figure 43: Stabilization of self-assembled fibrinogen scaffolds ........................................................................ 97
Figure 44: Crosslinking of self-assembled fibrinogen scaffolds ........................................................................ 98
Figure 45: Detachment or immobilization of crosslinked fibrinogen scaffolds ................................................ 99
Figure 46: Large self-assembled fibrinogen scaffold on a 24 x 24 mm slide ................................................... 100
Figure 47: Circular dichroism spectra of fibrin and fibrinogen in solution ..................................................... 102
Figure 48: Circular dichroism spectra of planar fibrinogen layers and self-assembled fibrinogen fibers ....... 103
Figure 49: Thioflavin T staining of fibrinogen fiber scaffolds .......................................................................... 104
Figure 50: Secondary structure of fibrinogen scaffolds prepared by self-assembly of different fibrinogen
concentrations ....................................................................................................................................... 105
Figure 51: Secondary structure of fibrinogen scaffolds prepared by self-assembly at different pH values ... 106
Figure 52: Secondary structure of fibrinogen scaffolds prepared by self-assembly at different pH values ... 107
Figure 53: Secondary structure of self-assembled fibrinogen fiber scaffolds in APTES modified cuvettes .... 108
Figure 54: Secondary structure of self-assembled fibrinogen scaffold before and after crosslinking ............ 109
Figure 55: Effect of rehydration on the secondary structure of crosslinked fibrinogen fibers ....................... 110
Figure 56: Enzymatic digestion of fibrinogen solution .................................................................................... 112
Figure 57: Long-term degradation of fibrinogen scaffolds ............................................................................. 113
Figure 58: Fibrinogen scaffolds crosslinked for 1 h after 35 days of degradation .......................................... 116
Figure 59: Fibrinogen scaffolds crosslinked for 2 h after 35 days of degradation .......................................... 117
Figure 60: Binding of fibrinogen or heparin to planar or nanofibrous fibrinogen .......................................... 120
II. List of tables Table 1: Path length of fibrinogen scaffolds ..................................................................................................... 64
Table 2: Average diameter of fibers assembled with different fibrinogen concentrations. ............................. 77
Table 3: Average diameter of fibers assembled with different buffer concentrations. .................................... 82
Table 4: Ionic strength of 25 mM phosphate buffer and 2.5x PBS prepared at different pH values. ............... 85
Table 5: Percentage of remaining fibrinogen on 1 h crosslinked scaffolds. .................................................... 114
Table 6: Percentage of remaining fibrinogen on 2 h crosslinked scaffolds. .................................................... 114
Summary
iii
III. Summary
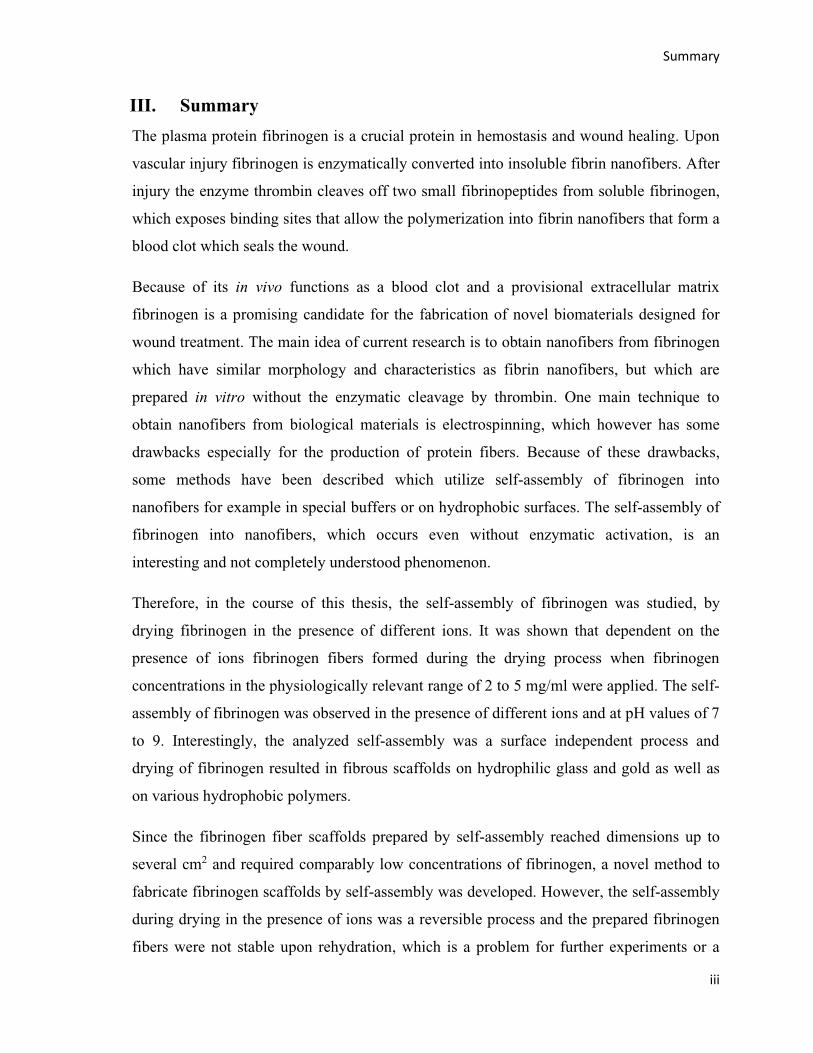
The plasma protein fibrinogen is a crucial protein in hemostasis and wound healing. Upon
vascular injury fibrinogen is enzymatically converted into insoluble fibrin nanofibers. After
injury the enzyme thrombin cleaves off two small fibrinopeptides from soluble fibrinogen,
which exposes binding sites that allow the polymerization into fibrin nanofibers that form a
blood clot which seals the wound.
Because of its in vivo functions as a blood clot and a provisional extracellular matrix
fibrinogen is a promising candidate for the fabrication of novel biomaterials designed for
wound treatment. The main idea of current research is to obtain nanofibers from fibrinogen
which have similar morphology and characteristics as fibrin nanofibers, but which are
prepared in vitro without the enzymatic cleavage by thrombin. One main technique to
obtain nanofibers from biological materials is electrospinning, which however has some
drawbacks especially for the production of protein fibers. Because of these drawbacks,
some methods have been described which utilize self-assembly of fibrinogen into
nanofibers for example in special buffers or on hydrophobic surfaces. The self-assembly of
fibrinogen into nanofibers, which occurs even without enzymatic activation, is an
interesting and not completely understood phenomenon.
Therefore, in the course of this thesis, the self-assembly of fibrinogen was studied, by
drying fibrinogen in the presence of different ions. It was shown that dependent on the
presence of ions fibrinogen fibers formed during the drying process when fibrinogen
concentrations in the physiologically relevant range of 2 to 5 mg/ml were applied. The self-
assembly of fibrinogen was observed in the presence of different ions and at pH values of 7
to 9. Interestingly, the analyzed self-assembly was a surface independent process and
drying of fibrinogen resulted in fibrous scaffolds on hydrophilic glass and gold as well as
on various hydrophobic polymers.
Since the fibrinogen fiber scaffolds prepared by self-assembly reached dimensions up to
several cm2 and required comparably low concentrations of fibrinogen, a novel method to
fabricate fibrinogen scaffolds by self-assembly was developed. However, the self-assembly
during drying in the presence of ions was a reversible process and the prepared fibrinogen
fibers were not stable upon rehydration, which is a problem for further experiments or a

iv
potential future application. Therefore, different crosslinking procedures were analyzed for
their potential to stabilize the fibrinogen scaffolds. It was shown that treatment with
formaldehyde or glutaraldehyde vapor resulted in a reliable crosslinking of the fibrinogen
scaffold and maintained the fibrous structure.
In a second main experimental part of this thesis changes in secondary structure during the
fibrinogen self-assembly were analyzed using circular dichroism. It was shown that the
formation of fibrinogen fibers was accompanied by a transition of α-helical into β-sheet
structures. The native content of 23 % α-helical and 28 % β-sheet structures was shifted to
19 % and 32 %, respectively. Remarkably, the change in secondary structure was reversible
when crosslinked fibers were rehydrated. An additional thioflavin T staining revealed that
the observed change in secondary structure was not due to the formation of β-amyloid
structures.
Since an understanding of fibrinogen self-assembly allows preparation of fibrinogen
scaffolds which could be used in the future as a biomaterial for tissue engineering and
wound healing application, the bioactivity of self-assembled scaffolds was studied in the
third main part of this thesis. In experiments carried out for 35 days it was shown that the
long-term degradation of fibrinogen scaffolds was dependent on the crosslinking time in
formaldehyde vapor. Furthermore, the long-term incubations revealed that single enzymes
like plasmin or thrombin had no additional effect on the fibrinogen scaffold stability while
a combination of plasmin and urokinase resulted in an accelerated degradation.
The results of this thesis allow some insight into the mechanism of fibrinogen, which seems
to rely on the exclusions of water during the drying process and on the effect that ions have
on the hydration shell of the fibrinogen molecule. Overall the fibrinogen self-assembly can
be used on many surfaces materials, requires low fibrinogen concentration and can be
carried out at physiological pH, which makes fibrinogen self-assembly a potential
alternative to other fabrication techniques for fibrinogen biomaterials. In addition, the
results of the secondary structure analysis and the bioactivity investigation indicate that the
fibrinogen remained intact and bioactive during the self-assembly process. Therefore,
fibrinogen scaffolds prepared by the newly developed method of salt-induced self-assembly
have a high potential for cell culture tests and even future application in wound healing.
Zusammenfassung
v
IV. Zusammenfassung
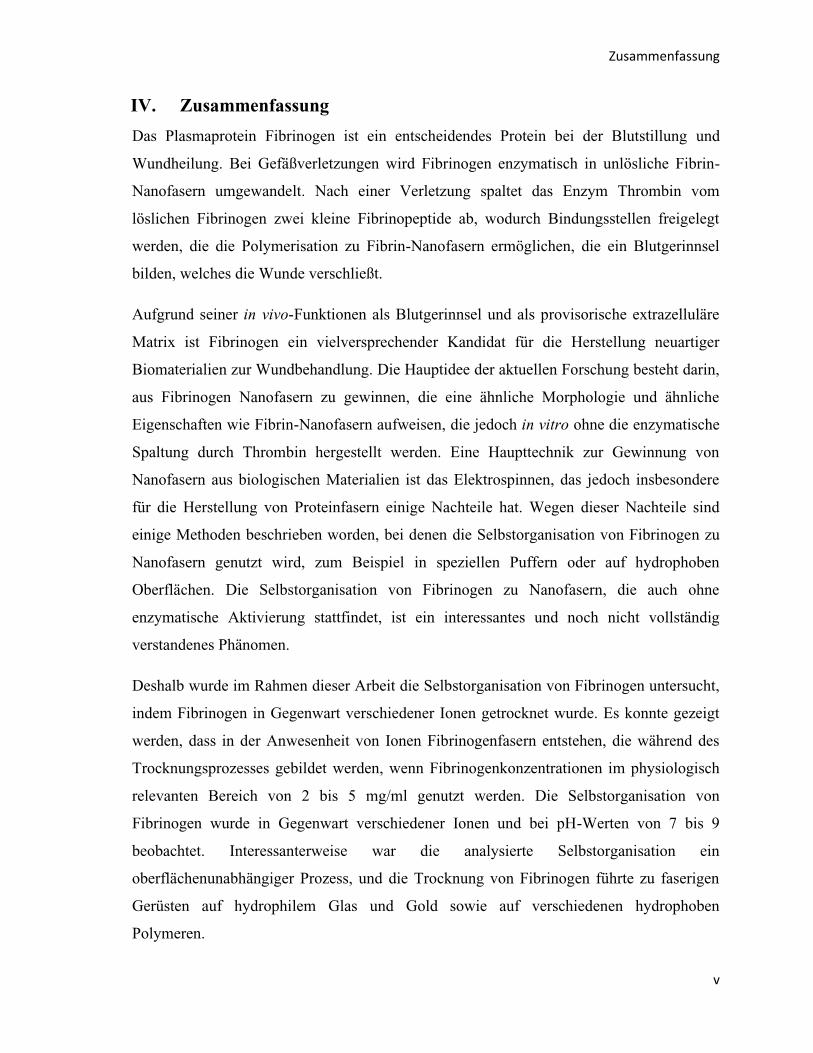
Das Plasmaprotein Fibrinogen ist ein entscheidendes Protein bei der Blutstillung und
Wundheilung. Bei Gefäßverletzungen wird Fibrinogen enzymatisch in unlösliche Fibrin-
Nanofasern umgewandelt. Nach einer Verletzung spaltet das Enzym Thrombin vom
löslichen Fibrinogen zwei kleine Fibrinopeptide ab, wodurch Bindungsstellen freigelegt
werden, die die Polymerisation zu Fibrin-Nanofasern ermöglichen, die ein Blutgerinnsel
bilden, welches die Wunde verschließt.
Aufgrund seiner in vivo-Funktionen als Blutgerinnsel und als provisorische extrazelluläre
Matrix ist Fibrinogen ein vielversprechender Kandidat für die Herstellung neuartiger
Biomaterialien zur Wundbehandlung. Die Hauptidee der aktuellen Forschung besteht darin,
aus Fibrinogen Nanofasern zu gewinnen, die eine ähnliche Morphologie und ähnliche
Eigenschaften wie Fibrin-Nanofasern aufweisen, die jedoch in vitro ohne die enzymatische
Spaltung durch Thrombin hergestellt werden. Eine Haupttechnik zur Gewinnung von
Nanofasern aus biologischen Materialien ist das Elektrospinnen, das jedoch insbesondere
für die Herstellung von Proteinfasern einige Nachteile hat. Wegen dieser Nachteile sind
einige Methoden beschrieben worden, bei denen die Selbstorganisation von Fibrinogen zu
Nanofasern genutzt wird, zum Beispiel in speziellen Puffern oder auf hydrophoben
Oberflächen. Die Selbstorganisation von Fibrinogen zu Nanofasern, die auch ohne
enzymatische Aktivierung stattfindet, ist ein interessantes und noch nicht vollständig
verstandenes Phänomen.
Deshalb wurde im Rahmen dieser Arbeit die Selbstorganisation von Fibrinogen untersucht,
indem Fibrinogen in Gegenwart verschiedener Ionen getrocknet wurde. Es konnte gezeigt
werden, dass in der Anwesenheit von Ionen Fibrinogenfasern entstehen, die während des
Trocknungsprozesses gebildet werden, wenn Fibrinogenkonzentrationen im physiologisch
relevanten Bereich von 2 bis 5 mg/ml genutzt werden. Die Selbstorganisation von
Fibrinogen wurde in Gegenwart verschiedener Ionen und bei pH-Werten von 7 bis 9
beobachtet. Interessanterweise war die analysierte Selbstorganisation ein
oberflächenunabhängiger Prozess, und die Trocknung von Fibrinogen führte zu faserigen
Gerüsten auf hydrophilem Glas und Gold sowie auf verschiedenen hydrophoben
Polymeren.

vi
Da die durch Self-Assembly hergestellten Fibrinogen-Fasergerüste Abmessungen bis zu
mehreren cm2 erreichten und vergleichsweise niedrige Fibrinogenkonzentrationen
benötigten, wurde eine neue Methode zur Herstellung von Fibrinogengerüsten durch
Selbstorganisation entwickelt. Die Selbstorganisation während des Trocknens in Gegenwart
von Ionen war jedoch ein reversibler Prozess, und die präparierten Fibrinogenfasern waren
bei der Rehydratation nicht stabil, was ein Problem für weitere Experimente oder eine
potentielle zukünftige Anwendung darstellt. Daher wurden verschiedene chemische
Quervernetzungsverfahren auf ihr Potenzial zur Stabilisierung der Fibrinogengerüste
analysiert. Es zeigte sich, dass die Behandlung mit Formaldehyd- oder Glutaraldehyddampf
zu einer zuverlässigen Vernetzung des Fibrinogen-Gerüsts führte und die Faserstruktur
erhalten blieb.
Im zweiten experimentellen Hauptteil dieser Arbeit wurden Veränderungen der
Sekundärstruktur während der Fibrinogen-Selbstorganisation mittels Zirkulardichroismus
analysiert. Es konnte gezeigt werden, dass die Bildung von Fibrinogenfasern mit einem
Übergang von α-helikalen in β-Faltblattstrukturen einhergeht. Der native Gehalt von 23 %
α-helikal und 28 % β-Blattstrukturen wurde zu 19 % bzw. 32 % verschoben.
Bemerkenswert ist, dass die Veränderung der Sekundärstruktur reversibel war, wenn
vernetzte Fasern rehydriert wurden. Eine zusätzliche Thioflavin T-Färbung zeigte, dass die
beobachtete Veränderung der Sekundärstruktur nicht auf die Bildung von β-
Amyloidstrukturen zurückzuführen war.
Da das Verständnis der Fibrinogen-Selbstorganisation die Herstellung von
Fibrinogengerüsten ermöglicht, die in Zukunft als Biomaterial für Tissue Engineering und
Wundheilungsanwendungen eingesetzt werden könnten, wurde im dritten Hauptteil dieser
Arbeit die Bioaktivität von selbstorganisierten Gerüsten untersucht. In Experimenten, die
über 35 Tage durchgeführt wurden, konnte gezeigt werden, dass der Langzeitabbau von
Fibrinogen-Gerüsten von der Vernetzungszeit in Formaldehyddampf abhängig ist. Darüber
hinaus zeigten die Langzeitinkubationen, dass einzelne Enzyme wie Plasmin oder
Thrombin keinen zusätzlichen Einfluss auf die Stabilität des Fibrinogen-Gerüstes hatten,
während eine Kombination von Plasmin und Urokinase zu einem beschleunigten Abbau
führte.
Zusammenfassung
vii
Die Ergebnisse dieser Arbeit erlauben einen Einblick in den Mechanismus der Fibrinogen
Faserbildung, der scheinbar auf dem Ausschluss von Wasser während des
Trocknungsprozesses und auf dem dem Effekt von Ionen auf die Hydratationshülle des
Fibrinogenmoleküls beruht. Insgesamt kann die Fibrinogen-Selbstorganisation auf vielen
Oberflächenmaterialien verwendet werden, erfordert eine niedrige Fibrinogenkonzentration
und kann bei physiologischem pH-Wert durchgeführt werden, was die Fibrinogen-
Selbstorganisation zu einer potenziellen Alternative zu anderen Herstellungstechniken für
Fibrinogen-Biomaterialien macht. Darüber hinaus deuten die Ergebnisse der
Sekundärstrukturanalyse und der Bioaktivitätsuntersuchung darauf hin, dass das Fibrinogen
während der Selbstorganisation intakt und biologisch aktiv blieb. Daher verfügen
Fibrinogengerüste, die mit dem neu entwickelten Verfahren der salzinduzierten
Selbstorganisation hergestellt wurden, über ein großes Potential für zellbiologische
Untersuchungen oder sogar zukünftige Anwendungen in der Wundheilung.

Motivation
1
1. Motivation
The sealing of a wound in the human body is facilitated by the enzymatic conversion of the
soluble plasma protein fibrinogen into fibrin nanofibers. Therefore, fibrin has attracted
great attention to be applied in wound treatment and has become an interesting material for
the field of tissue engineering. In addition, one approach in tissue engineering is to prepare
fibrinogen fibers in vitro without an enzymatic activation by electrospinning fibrinogen
solution. However, this approach requires organic solvents and high voltage that possibly
have negative effects on the bioactivity of the fibers. Therefore, some recent publications
have also presented methods, which induced the formation of fibrinogen nanofibers without
enzymatic activation in solution or as a surface reaction. This remarkable property of
fibrinogen was termed self-assembly and it was discussed to use self-assembled fibrinogen
fibers for tissue engineering and wound healing applications. However, the mechanism
behind fibrinogen self-assembly remains elusive. Some studies focused on the exposure of
fibrinogen solution to hydrophobic surfaces as the main driving force while others
investigated the self-assembly at low pH values or in the presence of ethanol. Most of these
studies proposed a change in secondary structure as an underlying mechanism of fibrinogen
self-assembly, but no detailed investigation of structural changes was conducted. In most of
these studies the samples of self-assembled fibrinogen were dried for analysis. The drying
of the fibrinogen is an important factor that has been largely neglected. Only a few studies
discussed that changes in ionic strength and drying effects during the preparation of
fibrinogen samples could have an additional effect on fibrinogen self-assembly, but did not
identify, which of these factors is the actual driving force that results in the organization of
fibrinogen molecules into fibers. Without a fundamental understanding of the self-assembly
process it is not possible to tailor self-assembled fibrinogen scaffolds towards selected
applications in tissue engineering because neither the assembly process nor the bioactivity
of the fibrinogen fibers can be sufficiently controlled or evaluated.
The main scientific motivation of this thesis is to gain insight into the fundamental
principles of fibrinogen self-assembly. One key question is whether drying of fibrinogen
solutions is sufficient to induce fibrinogen self-assembly. Therefore, in this thesis
fibrinogen self-assembly induced by drying was systemically investigated for the first time
2
in respect of factors like presence of ions, ion composition, fibrinogen concentration, pH,
surface material or humidity. The results obtained allow formulating a potential mechanism
of drying induced fibrinogen self-assembly, which might also help to explain self-assembly
of fibrinogen fibers observed in other studies.
Furthermore, changes in the secondary structure of fibrinogen were analyzed to elucidate
the role of conformational changes during fibrinogen self-assembly. For the first time, with
the data obtained it will be possible to discuss the role of conformational changes during
fibrinogen self-assembly proposed in other studies based on the foundation of measured
results.
Overall, the systematic investigation of factors contributing to fibrinogen self-assembly will
provide a framework, which will allow specific use of self-assembly as a process for the
preparation of fibrinogen scaffolds as bio- and tissue engineering materials. Furthermore,
the detailed analysis of single parameters will provide a first basis for potential application
of tailored self-assembled fibrinogen for selected tissue engineering approaches, like for
example wound healing.
This is closely related to the second and more application-driven motivation of this thesis:
To evaluate whether self-assembled fibrinogen scaffolds are suitable biomaterials for tissue
engineering or wound healing applications. This evaluation also relies on the fundamental
understanding of the self-assembly process and the associated conformational changes.
Additionally, other factors like fiber yield and the dimension of the obtained fibrinogen
fiber scaffolds as well as their stability in an aqueous environment are crucial. These
application relevant factors will also be addressed in this thesis, which will allow an
assessment of the practical feasibility of fibrinogen self-assembly in tissue engineering
applications.
Another important question that should precede an application of self-assembled fibrinogen
is whether fibrinogen maintains its biological activity. The structural analysis gives some
indication about the biological activity. In addition, the bioactivity of self-assembled
fibrinogen will be addressed using binding and degradation experiments with biologically
relevant partners or enzymes in this thesis. This will allow a first interpretation whether
fibrinogen stays biologically active during the self-assembly processes and provide a
Motivation
3
foundation for future cell culture experiments and a potential future application of
fibrinogen as a biomaterial.
The findings presented in this thesis will shed light on the fundamental mechanism of
fibrinogen self-assembly and the biological activity of self-assembled fibrinogen
nanofibers. A basic understanding of fibrinogen self-assembly can be a future basis for the
tailored fabrication of fibrinogen biomaterials for applications in tissue engineering.
4
2. Introduction
2.1. The extracellular matrix
In native tissue cells are surrounded by a nanofibrous network of proteins and
proteoglycans termed extracellular matrix (ECM). One of the main functions of the ECM is
the structural and support of tissue and cells by offering a three-dimensional architecture
with various binding sites for cells. Many ECM components offer sequences to which cells
can bind via integrins like for example the RGD sequence; a sequence of the tree amino
acids arginine, glycine and aspartate (Kular et al., 2014). However, the function of the
ECM is not limited to a passive role as a static scaffold. The ECM is subject to constant
remodeling by the cells in it and likewise influences cellular migration, differentiation and
proliferation (Kular et al., 2014). The ECM does affect cellular behavior by providing
biochemical clues of the single ECM components or their degradation products.
Furthermore, the ECM also influences cells by mechanical signaling. Some ECM proteins
include cryptic binding sites whose availability depends on the tensile state and a partial
unfolding of the molecule. At the same time the fiber formation of many ECM components
is also dependent of the tensile state of the tissue. Cell on the other hand can sense as well
as induce mechanical forces, which makes the ECM an topographical, biochemical and
biomechanical regulatory environment (Vogel, 2018).
The most abundant ECM protein is collagen. The ubiquitous protein is present in almost all
tissues and over 20 different collagens have been characterized. In various tissues different
types of collagen are present. For example, the ubiquitous major form collagen type I is
found in almost all kinds of tissue, while type III collagen is mainly found in the walls of
blood vessels (Bosman and Stamenkovic, 2003). One of the functions of collagen is to
provide mechanical strength to tissues, which are exposed to pressure, shear or tensile
forces like for example skin, the walls of blood vessels, bone or tendons (Bosman and
Stamenkovic, 2003). The mechanical strength of the collagen in the ECM of these tissues is
due to its fibrous morphology. The collagen molecule itself has an elongated triple-helical
structure and in the collagen types occurring in tissues the collagen molecules are arranged
in fibrils. Only the collagen type I, II, III, V and XI assemble into fibrils while other
The extracellular matrix
5
collagen types are often of regulatory function (Bosman and Stamenkovic, 2003; Kular et
al., 2014).
Elastin is another important ECM component, which as the name implicates gives tissue its
elasticity. It is mainly found in connective tissue and in the walls of blood vessels. Elastin
is produced by crosslinking its soluble precursor tropoelastin by the enzyme lysyloxidase.
The final elastin in tissue is a crosslinked polymer that is extremely stable and lasts for the
entire lifetime of the host. Although crosslinked elastin is highly stable, it has large
domains of repetitive hydrophobic amino acids. The dynamic interactions of the
hydrophobic domains give the crosslinked elastin polymer its elasticity (Debelle and
Tamburro, 1999).
The protein fibronectin is another important component of the native ECM. Fibronectin is a
ubiquitous protein that is present in the ECM of almost all tissues. In vivo fibronectin is
assembled into fibrous networks by a cell driven process. Cells bind to the RGD sequence
of fibronectin via integrins. The interaction of cells and fibronectin is a process that is
essential from the first embryonal development to the matured tissue. Interestingly, the
fibronectin fiber network of the ECM also matures with age and function of the respective
tissue. Fibronectin fibers are present as small elastic fibers that are still rearrangeable as
well as matured insoluble fibers of larger sizes. The functions of fibronectin range from
structural functions and cellular support of cells due to the strong integrin binding to
signaling and migratory functions for cells. Furthermore, the fibronectin network plays a
crucial role in the assembly, regulation and organization of other ECM components like for
example collagen.
In the case of a wound the skin is penetrated and the underlying tissue is damaged. This
does not only mean that cells in the wounded area are lost, but also that the ECM is
damaged and that the various functions of the different ECM components are impaired.
During the wound healing process the functions of the ECM are carried out by a
provisional matrix out of fibrin.
6
2.2. Wound healing
The human body has a great capability to withstand and regenerate injuries. In case of a
wound the blood released during hemorrhage has its own integrated mechanism to seal the
site of injury and to prevent further blood loss. During vascular lesion the soluble plasma
protein fibrinogen is enzymatically converted to fibrin. The fibrin forms a meshwork of
nanofibers, which aggregate with blood platelets to seal the wound. The meshwork of fibrin
fibers serves as a provisional ECM and temporarily replaces many functions of the native
ECM (Clark, 2001).
The sealing of the wound is only the very first step of wound healing. Although, wound
healing is a continuous process of overlapping events it is generally divided into four
phases: Hemostasis, inflammation, proliferation and remodeling (Guo and DiPietro, 2010).
The Hemostasis is the initial formation of a blood clot by the conversion of fibrinogen into
fibrin fibers and the attachment of platelets, which stops the bleeding. The initial
hemostasis is completed in the first hours after wounding and sometimes can be prolonged
up to the first three days. Nevertheless, the fibrin network, which is formed during
hemostasis, is also crucial for later stages of the wound healing process (Braiman-Wiksman
et al., 2016). The second phase of wound healing, the inflammation, occurs simultaneously
with hemostasis. Neutrophil immune cells from the blood invade into the wound space. The
main function of the inflammatory response is to protect the wound site from potential
infections with pathogens but an additional function is the secretion of cytokines, which
attract and stimulate the proliferation of fibroblasts (Cumming et al., 2009).
The third phase is the proliferation phase in which fibroblasts and epithelial cells from the
surrounding tissue start to migrate and proliferate into the wound site and start to regenerate
the lost tissue. During this phase the fibrin clot serves as a scaffold for the cells, which
continually replace the fibrin with collagen. The proliferation phase starts in the first days
after the wound is inflicted and continues for weeks up to several months after the
wounding (Braiman-Wiksman et al., 2016). The final remodeling phase can continue for
month or even years and is defined by a maturation of the regenerated tissue towards native
tissue (Guo and DiPietro, 2010). An overview about the phases of wound healing is given
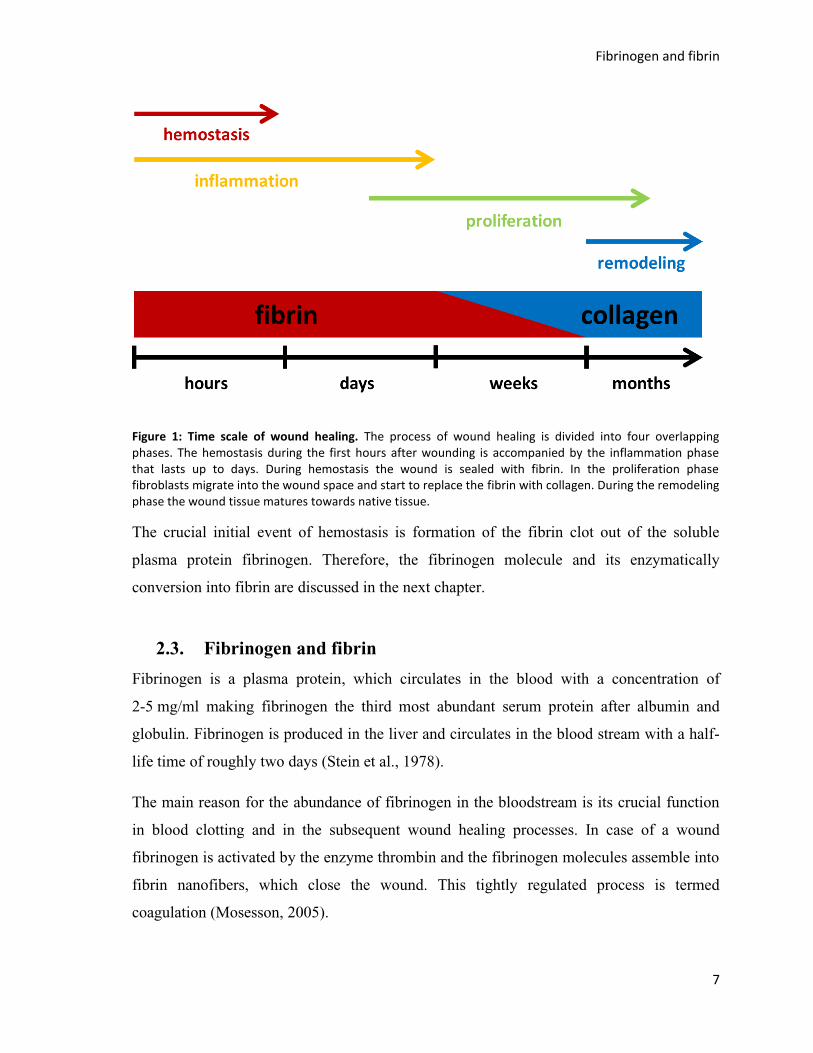
in Figure 1.
Fibrinogen and fibrin
7
Figure 1: Time scale of wound healing. The process of wound healing is divided into four overlapping phases. The hemostasis during the first hours after wounding is accompanied by the inflammation phase that lasts up to days. During hemostasis the wound is sealed with fibrin. In the proliferation phase fibroblasts migrate into the wound space and start to replace the fibrin with collagen. During the remodeling phase the wound tissue matures towards native tissue.
The crucial initial event of hemostasis is formation of the fibrin clot out of the soluble
plasma protein fibrinogen. Therefore, the fibrinogen molecule and its enzymatically
conversion into fibrin are discussed in the next chapter.
2.3. Fibrinogen and fibrin
Fibrinogen is a plasma protein, which circulates in the blood with a concentration of
2-5 mg/ml making fibrinogen the third most abundant serum protein after albumin and
globulin. Fibrinogen is produced in the liver and circulates in the blood stream with a half-
life time of roughly two days (Stein et al., 1978).
The main reason for the abundance of fibrinogen in the bloodstream is its crucial function
in blood clotting and in the subsequent wound healing processes. In case of a wound
fibrinogen is activated by the enzyme thrombin and the fibrinogen molecules assemble into
fibrin nanofibers, which close the wound. This tightly regulated process is termed
coagulation (Mosesson, 2005).

8
2.3.1. Molecular Structure of fibrinogen
Fibrinogen is a dimeric macromolecule with a molecular weight of 340 kDa. It is composed
of two Aα-chains, two Bβ-chains and two γ-chains (Kattula et al., 2017; Mosesson, 2005).
One set of Aα-, Bβ- and γ-chains forms a coiled coil triple-helix structure, respectively. The
different chains of the half molecule are linked by disulfide bridges at the borders of the
coiled coil structure. The N-termini of the single chains of the two half molecules are
linked together by disulfide bridges and form the center of the fibrinogen molecule, the so
called E-domain (Huang et al., 1993). The C-termini of the Bβ- and γ-chains of each half
molecule form a β-nodule and a γ-nodule rich in β-sheet structures. The β- and γ- nodule
are referred to as D-domain (Zuev et al., 2017). In the fibrinogen molecule two D-domains
of the half molecules face in opposite directions at the periphery. The two D-domains are
linked by coiled coil triple-helix structures to the central E-domain and give rise to a three
nodular geometry of the fibrinogen molecule with an overall length of 45 nm (Figure 2 A).
This three nodular shape of the fibrinogen molecule was confirmed in vitro using electron
and atomic force microscopy (Fowler and Erickson, 1979; Protopopova et al., 2015). To
each D-domain an α-C domain is linked with a flexible connector. The α-C domains are
usually folded back from the D-domain to the central E-domain as depicted in Figure 2 A
(Zuev et al., 2017).
Molecular Structure of fibrinogen
9
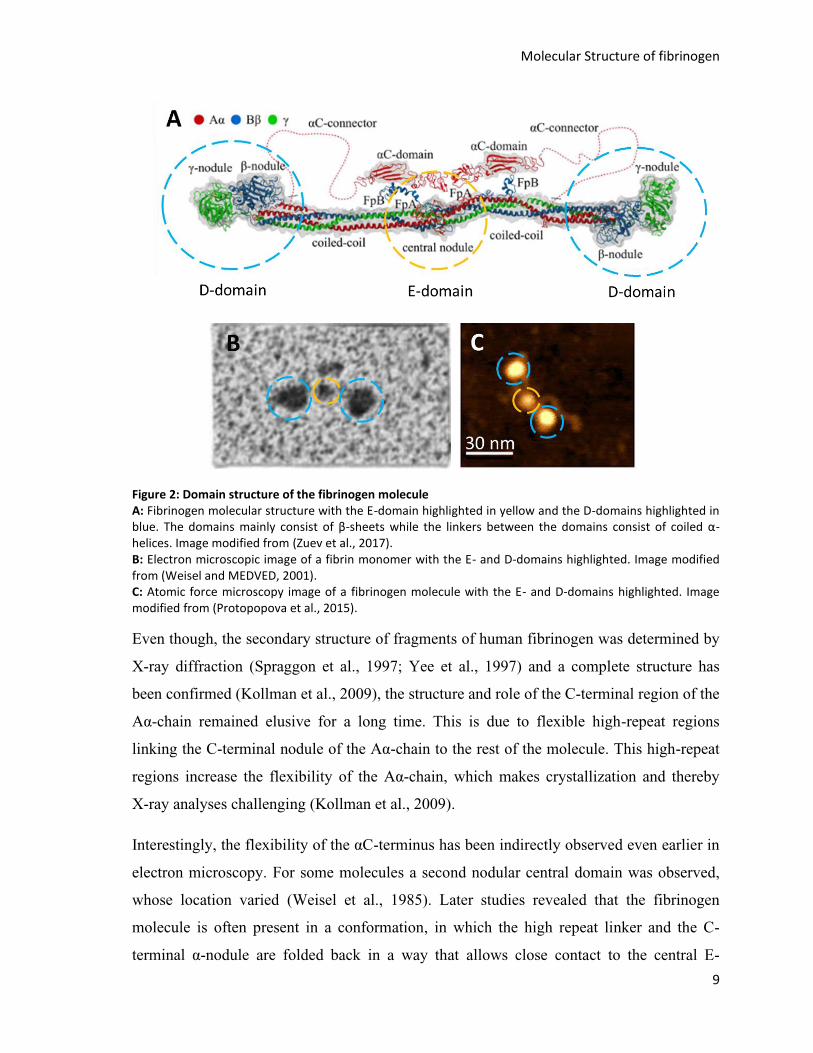
Figure 2: Domain structure of the fibrinogen molecule A: Fibrinogen molecular structure with the E-domain highlighted in yellow and the D-domains highlighted in blue. The domains mainly consist of β-sheets while the linkers between the domains consist of coiled α-helices. Image modified from (Zuev et al., 2017). B: Electron microscopic image of a fibrin monomer with the E- and D-domains highlighted. Image modified from (Weisel and MEDVED, 2001). C: Atomic force microscopy image of a fibrinogen molecule with the E- and D-domains highlighted. Image modified from (Protopopova et al., 2015).
Even though, the secondary structure of fragments of human fibrinogen was determined by
X-ray diffraction (Spraggon et al., 1997; Yee et al., 1997) and a complete structure has
been confirmed (Kollman et al., 2009), the structure and role of the C-terminal region of the
Aα-chain remained elusive for a long time. This is due to flexible high-repeat regions
linking the C-terminal nodule of the Aα-chain to the rest of the molecule. This high-repeat
regions increase the flexibility of the Aα-chain, which makes crystallization and thereby
X-ray analyses challenging (Kollman et al., 2009).
Interestingly, the flexibility of the αC-terminus has been indirectly observed even earlier in
electron microscopy. For some molecules a second nodular central domain was observed,
whose location varied (Weisel et al., 1985). Later studies revealed that the fibrinogen
molecule is often present in a conformation, in which the high repeat linker and the C-
terminal α-nodule are folded back in a way that allows close contact to the central E-
10
domain (Weisel and Medved, 2001). Nevertheless, the C-terminal α-nodules have also been
found in various other constellations with respect to the central E-domain and it is very
likely that the fibrinogen molecules in solution or in the blood stream have highly flexible
αC-termini, which change their conformation constantly (Protopopova et al., 2015; Weisel
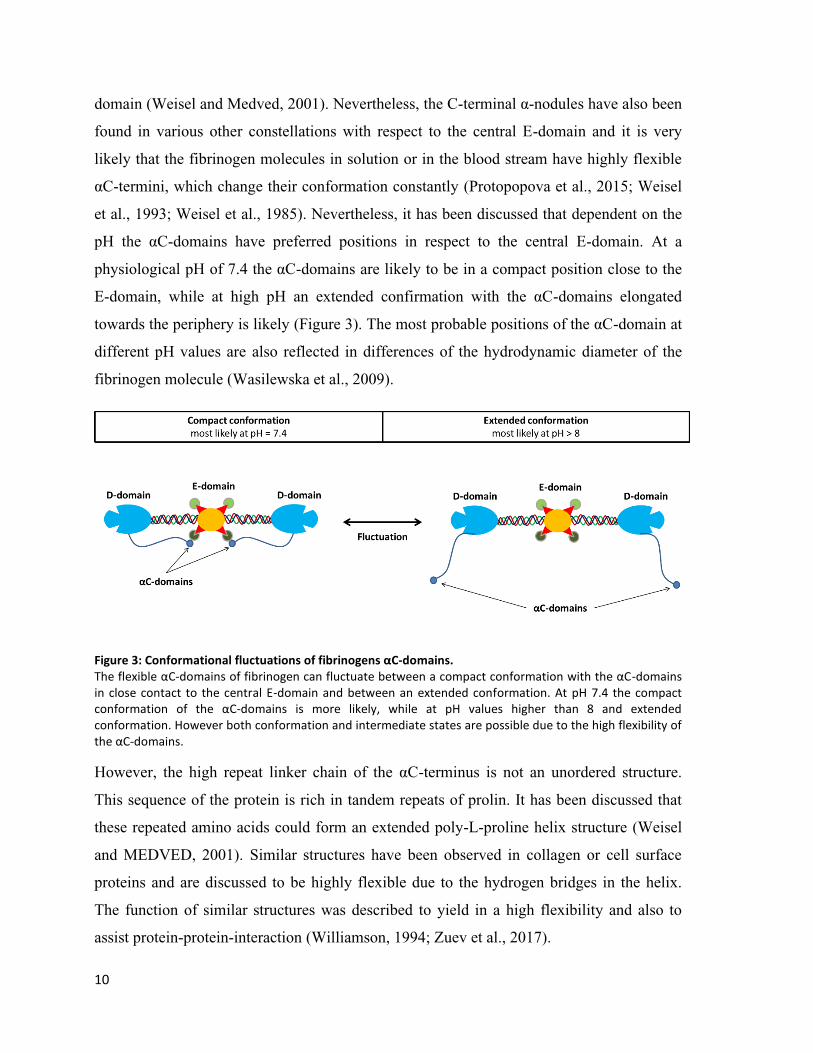
et al., 1993; Weisel et al., 1985). Nevertheless, it has been discussed that dependent on the
pH the αC-domains have preferred positions in respect to the central E-domain. At a
physiological pH of 7.4 the αC-domains are likely to be in a compact position close to the
E-domain, while at high pH an extended confirmation with the αC-domains elongated
towards the periphery is likely (Figure 3). The most probable positions of the αC-domain at
different pH values are also reflected in differences of the hydrodynamic diameter of the
fibrinogen molecule (Wasilewska et al., 2009).
Figure 3: Conformational fluctuations of fibrinogens αC-domains. The flexible αC-domains of fibrinogen can fluctuate between a compact conformation with the αC-domains in close contact to the central E-domain and between an extended conformation. At pH 7.4 the compact conformation of the αC-domains is more likely, while at pH values higher than 8 and extended conformation. However both conformation and intermediate states are possible due to the high flexibility of the αC-domains.
However, the high repeat linker chain of the αC-terminus is not an unordered structure.
This sequence of the protein is rich in tandem repeats of prolin. It has been discussed that
these repeated amino acids could form an extended poly-L-proline helix structure (Weisel
and MEDVED, 2001). Similar structures have been observed in collagen or cell surface
proteins and are discussed to be highly flexible due to the hydrogen bridges in the helix.
The function of similar structures was described to yield in a high flexibility and also to
assist protein-protein-interaction (Williamson, 1994; Zuev et al., 2017).
Conversion of fibrinogen into fibrin nanofibers
11
The highly flexible αC-termini of fibrinogen have been shown to be important for later
stages of fibrinogen interaction and for the crosslinking of single fibrin fibers (Collet et al.,
2005; Zuev et al., 2017).
Two other structural components of fibrinogen, which have a crucial function in the
assembly of fibrinogen molecules into fibrin fibers, are the fibrinopeptides A and B. They
are located at the central E-domain at the N-termini of the Aα-chain and the Bβ-chain, what
is also indicated by the nomenclature (Blombäck and Blombäck, 1972). Although the
fibrinopeptides A and B are very short α-helical domains consisting of only 16 or 12 amino
acids, respectively, they prevent the association of fibrinogen molecules to fibrin by
masking binding sites at the central E-domain (Mosesson, 2005). If fibrinopeptides A and B
are cleaved off by the proteolytic enzyme thrombin, these binding sites become exposed
allowing the association of fibrinogen molecules into fibrin fibers, as described in the next
chapter (Mosesson, 2005; Weisel et al., 1993).
2.3.2. Conversion of fibrinogen into fibrin nanofibers
The emergency of a wound requires a fast wound closure response in vivo. However, under
non-hemorrhage circumstances fibrinogen in the blood should not be converted to fibrin at
all cost. The formation of fibrin in an intact blood vessel could clock the blood vessels and
lead to insufficient perfusion of vital organs or even death (Fowkes et al., 1993). Therefore,
it is crucial that the activation of fibrinogen by thrombin is tightly regulated. Thrombin is
the core enzyme of the blood clotting process, which under normal non-hemorrhage
conditions, is only present in its inactive precursor form, so called prothrombin. The
activation of prothrombin is achieved by two linked pathways referred to as coagulation
cascade (Figure 4). The enzymes involved in this cascade are historically named as factors
with a roman numeral. Since most of the factors are proteases, which are present in their
inactive form, the convention is to add the suffix ‘a’ to the factor name, if the factor is
activated during the coagulation cascade (Palta et al., 2014).
The first pathway for thrombin activation is the extrinsic pathway. In case of a tissue
wound, which also damages a blood vessel, blood will be permeating into the damaged
tissue. Factor III (tissue factor), which is bound to the sub-endothelial tissue becomes
12
exposed to the blood. Factor VII (Proconvertin), which is present in the blood, can now
bind to factor III initiating the FIII/FVIIa complex. This complex hydrolyses factor X
(Stuart-Prower factor) to factor Xa. Factor Xa in combination with factor V hydrolyses
factor II (Prothrombin) to factor IIa (Thrombin) (Figure 4).
The second pathway to activate thrombin is the intrinsic pathway. In this pathway, the
blood plasma components factor XII (Hageman factor), high-molecular-weight kininogen
and prekallikrein form a complex with a negatively charged surface for example the
collagen of the tissue, which is exposed during the injury of a blood vessel. The activation
complex can also be formed intrinsically at the wall of a blood vessel without an injury of
the surrounding tissue. This complex converts factor XI to factor Xia, which activates
factor IX, which in turn converts factor VIII to factor VIIIa. Factor VIIIa activates factor X,
which similarly to the extrinsic pathway leads to the activation of thrombin (Dahlbäck,
2000; Palta et al., 2014).
Conversion of fibrinogen into fibrin nanofibers
13
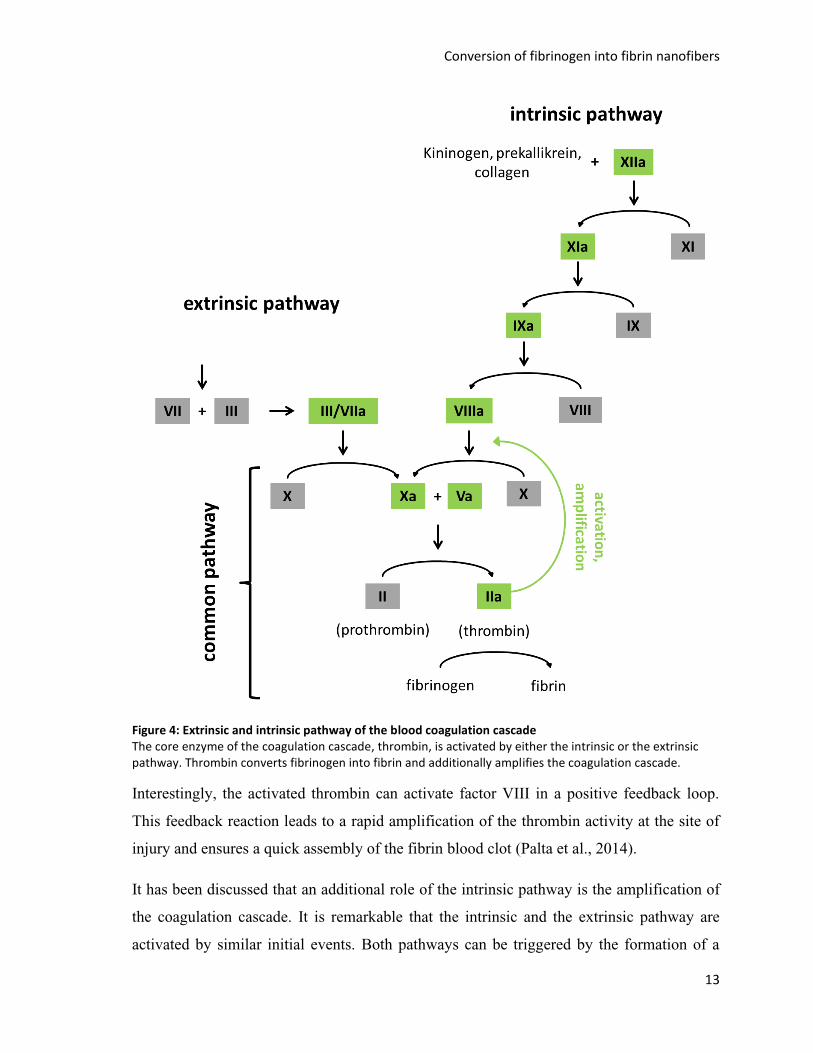
Figure 4: Extrinsic and intrinsic pathway of the blood coagulation cascade The core enzyme of the coagulation cascade, thrombin, is activated by either the intrinsic or the extrinsic pathway. Thrombin converts fibrinogen into fibrin and additionally amplifies the coagulation cascade.
Interestingly, the activated thrombin can activate factor VIII in a positive feedback loop.
This feedback reaction leads to a rapid amplification of the thrombin activity at the site of
injury and ensures a quick assembly of the fibrin blood clot (Palta et al., 2014).
It has been discussed that an additional role of the intrinsic pathway is the amplification of
the coagulation cascade. It is remarkable that the intrinsic and the extrinsic pathway are
activated by similar initial events. Both pathways can be triggered by the formation of a
14
complex made out of proenzymes in the blood and a tissue component which is not present
in the blood at all. For the extrinsic pathway the complex is formed out of tissue factor and
factor VII, for the intrinsic pathway the complex can consist of collagen and factor XII
(Dahlbäck, 2000).
Additionally, the activation of the intrinsic or the extrinsic pathway is also crucial for the
regulation of the blood coagulation cascade. One of the most important inhibitors of the
coagulation cascade is antithrombin, which can inhibit almost all proteases of the
coagulation cascade (Palta et al., 2014). The inhibition activity of antithrombin is even
increased by the presence of heparin on the surface of vascular epithelium cells, which
results in a strong inhibition of the free coagulation enzymes in the blood plasma of an
intact blood vessel. However, in case of a vascular lesion less heparin is present and the
coagulation enzymes form complexes with the underlying tissue becoming less accessible
for inhibition by antithrombin. This efficient regulatory mechanism allows a strong
restriction of coagulation in the blood plasma without any spontaneous coagulation or
fibrin formation while promoting rapid and local thrombin activation and fibrin formation
at the injury site (Rosenberg, 1989; Weitz et al., 1990).
When thrombin is activated by the coagulation cascade, it utilizes soluble fibrinogen from
the blood plasma as the major component for fibrin fiber formation. Thrombin cleaves off
fibrinopeptide A from the N-terminus of the α-chain of fibrinogen, which makes a
polymerization site accessible, which is called EA or also referred to as knob A. The
EA-polymerization site is a gly-pro-arg-val motive starting at the seventeenth amino acid
residue of the newly formed fibrin α-chain N-terminus. Similarly to fibrinopeptide A, a
thrombin-catalyzed cleavage of fibrinopeptide B exposes gly-his-arg-pro motives at the E-
domain-located terminus of the β-chain, which are correspondingly termed EB or knob B
(Chernysh et al., 2012).
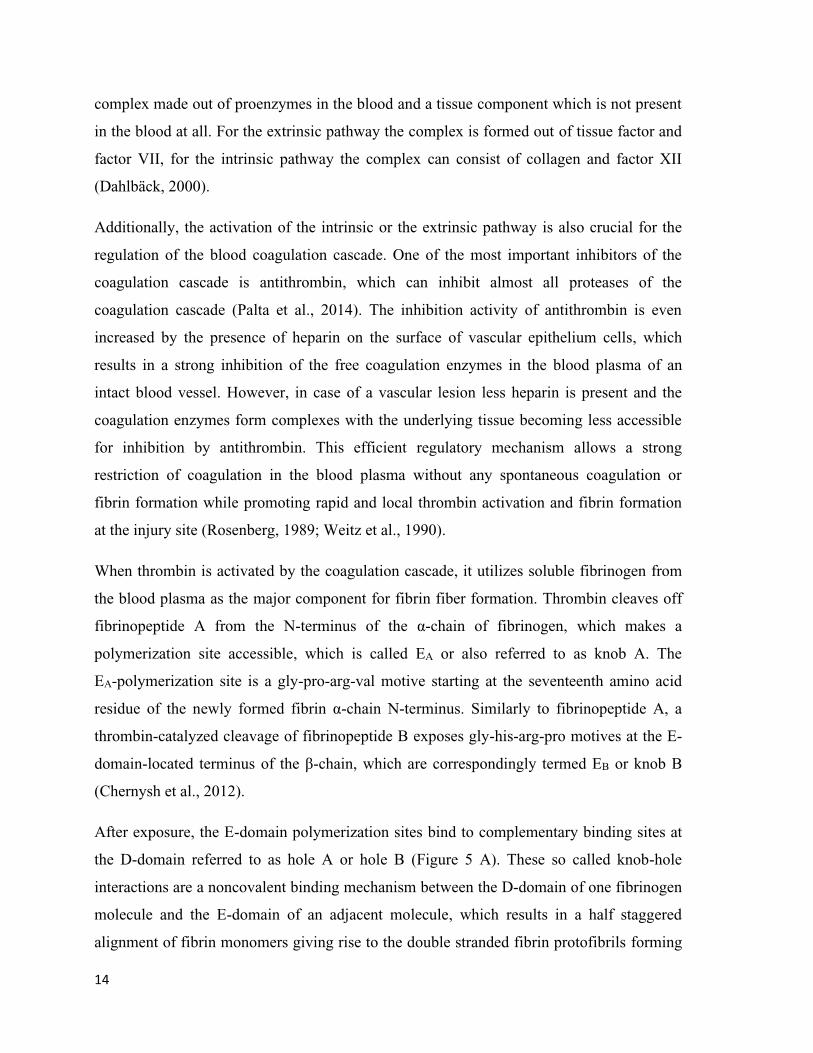
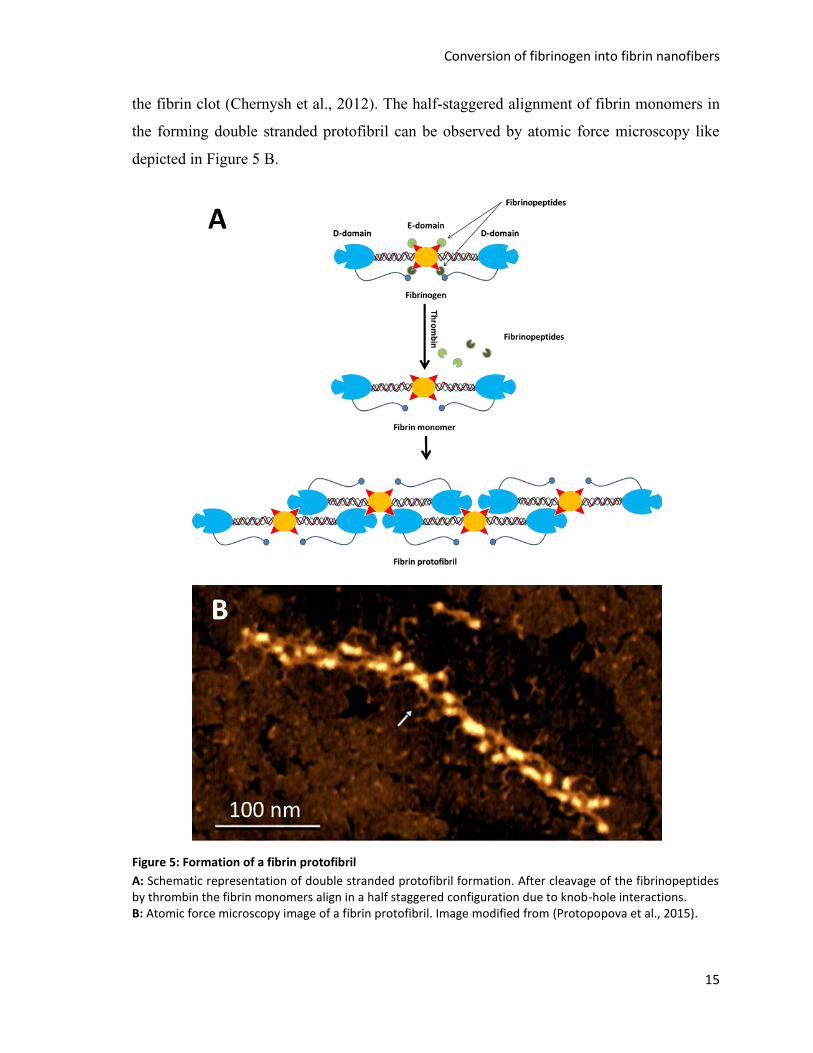
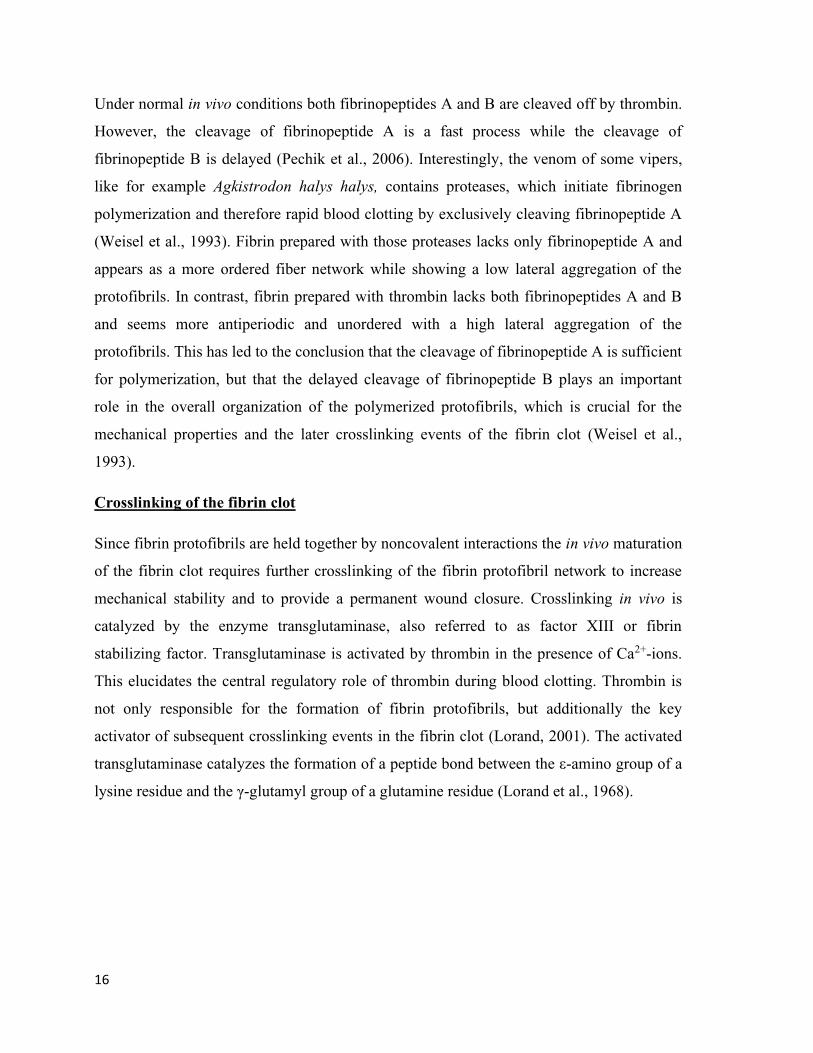
After exposure, the E-domain polymerization sites bind to complementary binding sites at
the D-domain referred to as hole A or hole B (Figure 5 A). These so called knob-hole
interactions are a noncovalent binding mechanism between the D-domain of one fibrinogen
molecule and the E-domain of an adjacent molecule, which results in a half staggered
alignment of fibrin monomers giving rise to the double stranded fibrin protofibrils forming
Conversion of fibrinogen into fibrin nanofibers
15
the fibrin clot (Chernysh et al., 2012). The half-staggered alignment of fibrin monomers in
the forming double stranded protofibril can be observed by atomic force microscopy like
depicted in Figure 5 B.
Figure 5: Formation of a fibrin protofibril
A: Schematic representation of double stranded protofibril formation. After cleavage of the fibrinopeptides by thrombin the fibrin monomers align in a half staggered configuration due to knob-hole interactions. B: Atomic force microscopy image of a fibrin protofibril. Image modified from (Protopopova et al., 2015).
16
Under normal in vivo conditions both fibrinopeptides A and B are cleaved off by thrombin.
However, the cleavage of fibrinopeptide A is a fast process while the cleavage of
fibrinopeptide B is delayed (Pechik et al., 2006). Interestingly, the venom of some vipers,
like for example Agkistrodon halys halys, contains proteases, which initiate fibrinogen
polymerization and therefore rapid blood clotting by exclusively cleaving fibrinopeptide A
(Weisel et al., 1993). Fibrin prepared with those proteases lacks only fibrinopeptide A and
appears as a more ordered fiber network while showing a low lateral aggregation of the
protofibrils. In contrast, fibrin prepared with thrombin lacks both fibrinopeptides A and B
and seems more antiperiodic and unordered with a high lateral aggregation of the
protofibrils. This has led to the conclusion that the cleavage of fibrinopeptide A is sufficient
for polymerization, but that the delayed cleavage of fibrinopeptide B plays an important
role in the overall organization of the polymerized protofibrils, which is crucial for the
mechanical properties and the later crosslinking events of the fibrin clot (Weisel et al.,
1993).
Crosslinking of the fibrin clot
Since fibrin protofibrils are held together by noncovalent interactions the in vivo maturation
of the fibrin clot requires further crosslinking of the fibrin protofibril network to increase
mechanical stability and to provide a permanent wound closure. Crosslinking in vivo is
catalyzed by the enzyme transglutaminase, also referred to as factor XIII or fibrin
stabilizing factor. Transglutaminase is activated by thrombin in the presence of Ca2+-ions.
This elucidates the central regulatory role of thrombin during blood clotting. Thrombin is
not only responsible for the formation of fibrin protofibrils, but additionally the key
activator of subsequent crosslinking events in the fibrin clot (Lorand, 2001). The activated
transglutaminase catalyzes the formation of a peptide bond between the ε-amino group of a
lysine residue and the γ-glutamyl group of a glutamine residue (Lorand et al., 1968).
Conversion of fibrinogen into fibrin nanofibers
17
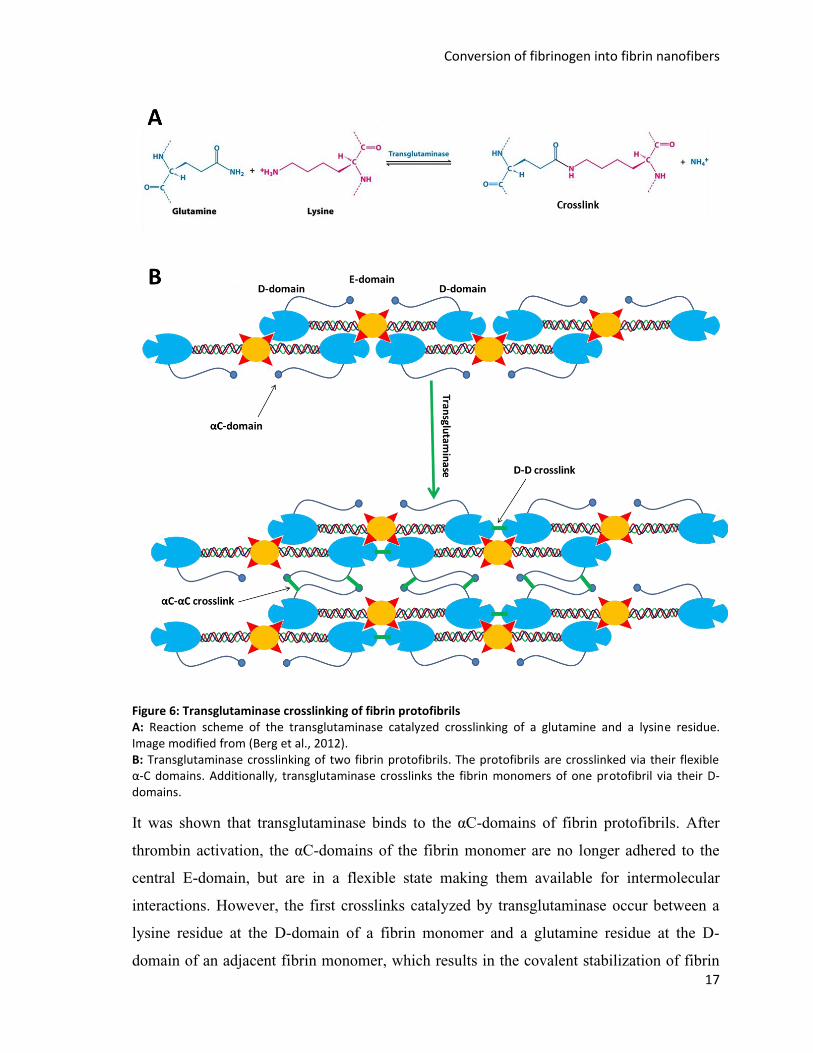
Figure 6: Transglutaminase crosslinking of fibrin protofibrils A: Reaction scheme of the transglutaminase catalyzed crosslinking of a glutamine and a lysine residue. Image modified from (Berg et al., 2012). B: Transglutaminase crosslinking of two fibrin protofibrils. The protofibrils are crosslinked via their flexible α-C domains. Additionally, transglutaminase crosslinks the fibrin monomers of one protofibril via their D-domains.
It was shown that transglutaminase binds to the αC-domains of fibrin protofibrils. After
thrombin activation, the αC-domains of the fibrin monomer are no longer adhered to the
central E-domain, but are in a flexible state making them available for intermolecular
interactions. However, the first crosslinks catalyzed by transglutaminase occur between a
lysine residue at the D-domain of a fibrin monomer and a glutamine residue at the D-
domain of an adjacent fibrin monomer, which results in the covalent stabilization of fibrin
18
monomers in the fibrin protofibril. Crosslinking of the fibrin monomers increases the
viscoelastic modulus and the clot resistance against enzymatic degradation (Lorand, 2001).
In a second slower reaction, transglutaminase catalyzes crosslinking of lysine and
glutamine residue at the αC-domains of adjacent fibrin protofibrils. This second
crosslinking reaction covalently links the different protofibrils via the flexible αC-domains
forming the matured fibrin network. The αC-domains of the protofibrils maintain their
flexibility even after crosslinking. However, due to steric hindrance they are less likely to
be found in contact with the E-domain. This is sometimes considered as change in tertiary
structure although the overall conformation of the αC-domains remains flexible and
fluctuating (Mosesson, 2005).
It is remarkable that the same crosslinking reaction increases the mechanical stability to
fibrin by covalently linking the fibrin monomers in the protofibrils, while also maintaining
the elasticity of the fibrin network by crosslinking different fibrin protofibrils over their
flexible αC domains (Ariëns et al., 2002).
Although the transglutaminase-catalyzed crosslinking of the fibrin protofibrils is well
understood, it should not be neglected that transglutaminase crosslinking can also occur
between the forming fibrin clot and other proteins. It is highly probable that during wound
healing transglutaminase plays an additional role in the crosslinking of the fibrin clot to the
surrounding tissue (Muszbek et al., 1999).
2.3.3. Fibrin as a provisional extracellular matrix
If tissue is wounded or if larger parts of the tissues are lost none of the native ECM
components remains intact or even present in the site of injury. The fibrin fiber network
serves as a wound closure, but it also fulfills the function of a provisional ECM into which
cells from the surrounding tissue migrate and regenerate and replace the lost tissue (Clark,
2001). Fibrinogen has RGD binding sites to which cells can bind via integrins. In addition,
many cells are also able to bind fibrinogen without integrin receptors. Fibrin also has
specific binding sites for fibroblast growth factor and for endothelial cell growth factor,
which regulate the cellular migration and proliferation during later stages of the wound

Fibrin as a provisional extracellular matrix
19
healing. This makes the fibrin a structural support between cells, which also has regulatory
functions (Laurens et al., 2006).
In addition to cells and growth factors, fibrin also binds to other blood plasma proteins,
which are integrated into the fibrin network during hemostasis. Especially plasma
fibronectin, a soluble form of fibronectin related to tissue fibronectin, is co-assembled into
the fibrin network in high concentrations (Laurens et al., 2006). Fibronectin binds to a
fibrin at a specific binding site located in the α-C domain of fibrin while other domains of
fibrin are not able to bind fibronectin. Interestingly fibrinogen does not bind fibronectin,
which indicates that the binding site at the α-C domain of fibrinogen is not accessible
because the α-C domain of fibrinogen is in contact with the central E-domain of the
molecule (Makogonenko et al., 2002). Fibronectin also binds to collagen, which makes it
an important linker between the fibrin clot and the periwound tissue collagen as well as an
important regulator of collagen deposition in the fibrin clot during the proliferation phase
(Lenselink, 2015).
Similar to fibronectin the glycoprotein vitronectin is incorporated into the blood clot during
hemostasis. Both proteins act as an additional amplification for cell adhesion in the forming
blood clot because both contain many RGD sequences to which cells can bind (Laurens et
al., 2006). Furthermore, fibronectin and vitronectin are chemically crosslinked to the fibrin
fiber network by the transglutaminase reaction, which also crosslinks the fibrin fibers
during the maturation of the fibrin clot (Laurens et al., 2006). Interestingly, fibrinogen has
an additional binding site for transglutaminase, which is not the site of active crosslinking.
Transglutaminase is bound to this exosite in its inactive form. This way transglutaminase is
already incorporated into the blood clot during the first stage of hemostasis where it can be
activated to crosslink the fibrin fibers as well as binding partners of fibrin (Hornyak and
Shafer, 2002).
Another binding partner of fibrin is heparin. Heparin binds to a specific binding site at the
new N-terminus of the fibrin β-chain where fibrinopeptide B was cleaved of by thrombin
during the fibrin formation. Heparin hardly binds to fibrinogen since fibrinopeptide B is
still present and blocks the binding site due to steric hindrance (Odrljin et al., 1996b). The
heparin binding site of fibrin has two functions. Heparin is involved in the inhibition of
20
thrombin by forming a complex with antithrombin and activating it. By binding of heparin
to fibrin, this formation of an inhibitory complex does not take place and thrombin remains
active. This way the presence of fibrin ensures a continuous formation of more fibrin in the
blood clot and keeps thrombin in its active form by binding the heparin (Hogg and Jackson,
1989). Furthermore, many cells as for example endothelial cells present heparin like
molecules at their cell surface and can use the heparin binding site of fibrin. The heparin
binding site is one of the major integrin independent binding sites for cells in the fibrin clot
(Odrljin et al., 1996a).
In addition to the scaffold function of fibrin and its central role in the binding of cells and
the factors mentioned above, the fibrin clot temporarily also has to fulfill the function of
ECM elasticity. This function is accomplished by the coiled coil linker domains, which
connect the central E-domain with the D-domains. The α-helical coiled coil structures are
refolded into β-sheets upon stretching of the fibrin, which results in a high elasticity (Lim et
al., 2008; Litvinov et al., 2012a). Another important factor contributing to the high
elasticity of the fibrin clot is the transglutaminase crosslinking of the fibrin protofibrils. The
protofibrils are crosslinked via their flexible α-C domains, which allows single protofibrils
to displace in respect to each other and thereby extend the fibrin clot (Helms et al., 2012).
Degradation of fibrin
For the remodeling of the provisional fibrin matrix into a collagen matrix by the cell types
introduced in the next section, it is necessary that cells can degrade the fibrin fibers. A
partial degradation is required to enhance the invasion of cells into the fibrin matrix, while
during remodeling of the fibrin clot the fibrin has to be gradually degraded and replaced
with collagen until the wound tissue is completely converted into native tissue without
fibrinogen present. The main mechanism used by cells to degrade fibrin is the proteolytic
digestion by plasmin, which is termed fibrinolysis (Kane, 1984). Plasmin is a protease,
which cleaves fibrin monomers into various smaller fragments in a gradual process and
thereby destroys the fibrous structure of the fibrin clot (Pizzo et al., 1972).
Plasmin is present in the bloodstream in its inactive precursor form plasminogen. During
the formation of the fibrin clot plasminogen is incorporated into the emerging fibrin fiber
network. Cells migrating into the fibrin clot can activate the deposited plasminogen by

Cellular interactions with the fibrin clot
21
means of tissue plasminogen activator. Interestingly, activated plasmin itself converts
plasminogen into plasmin in a positive feedback loop. The activation of plasmin can also be
achieved or enhanced by exogenous factors that are not involved in the in vivo activation.
One major exogenous activator of plasmin is the enzyme urokinase, which is produced by
epithelial cells of the urinary tract and has a similar activating function like the tissue
plasminogen activator. Urokinase is also used for the activation of plasminogen in clinical
applications (Kane, 1984).
Plasmin-catalyzed fibrinolysis is the main in vivo pathway for fibrin degradation, but it was
shown that cells in vitro can also use matrix metalloproteinases, which degrade collagen in
vivo, to degrade fibrin. The cellular degradation of fibrinogen catalyzed by matrix
metalloproteinases is only observed in cells, which lack the capability to utilize plasmin or
for in vitro systems, where the plasmin activation is inhibited. This shows that the matrix
metalloproteinase system is not the main in vivo degradation path for fibrin (Hotary et al.,
2002).
The conversion of plasminogen to activated plasmin is not limited to the fibrin clot. Some
activation of plasmin also occurs in the bloodstream as a mechanism to dissolve potential
aggregations of fibrinogen or fibrin in the blood vessel and to prevent thrombosis (Ambrus
et al., 1962). Overall, plasmin is the key counterpart to thrombin, which disassembles the
fibrin formed by thrombin and additionally prevents aggregations of fibrin or fibrinogen.
2.3.4. Cellular interactions with the fibrin clot
Platelets
The first cellular components, which interact with the fibrin network, are blood platelets.
Platelets are cellular fragments, which have no nucleus and are derived from
megakaryocytes. Platelets have a disc-like shape if they are present in the bloodstream
(Palta et al., 2014). As soon as they bind to the site of a blood vessel injury and to the
collagen of the underlying tissue, they undergo a transition to a star-shaped morphology
(Caen and Michel, 1972). These activated platelets aggregate simultaneously with the
formation of fibrin at the injury site. The first blood clot is sometimes also referred to as

22
platelet plug. Integrin αIIbβ3-, a receptor that binds to fibrin, is present in the platelet
membrane and allows a tight binding of activated platelets to the forming fibrin network.
Only the combination of a fibrin network and platelets forms a mechanically stable barrier
to seal the injury site and to prevent blood loss (Mosesson, 2005).
The presence of thrombin activates platelets while activated platelets further activate the
coagulation cascade by providing an additional assembly surface for the initial complexes
of coagulation factors. Moreover, activated platelets release calcium ions, which further
increase the activity of most enzymes in the coagulation cascade (Monroe et al., 2002; Palta
et al., 2014). In later stages of the matured blood clot the platelets start to secrete a platelet
derived growth factor, a cytokine, which activates the migration and proliferation of
fibroblasts and endothelial cells (Palta et al., 2014).
Fibroblasts
Roughly, five days after injury, fibroblasts start to migrate into the fibrin clot from the
surrounding tissue. This process is accelerated by the platelet-derived growth factor and by
fibroblast growth factor-2, which binds to fibrin. Fibroblasts themselves can also bind to
fibrin via integrin αIIbβ3. Thereby, the fibrin network provides a provisional extracellular
matrix allowing migration and proliferation of fibroblasts (Laurens et al., 2006). However,
it has been shown that the morphological characteristics like fiber thickness or the number
of branching points of the fibrin network have a strong influence on fibroblast binding and
proliferation (Sporn et al., 1995).
Binding to fibrin can trigger fibroblasts to switch into the myofibroblast phenotype. These
myofibroblasts are rich in actin fibers and can contract similarly to muscle cells (Laurens et
al., 2006). It is assumed that the contractile force of the myofibroblast plays a key role in
the mechanics of the mature blood clot and in keeping the wound closed (Laurens et al.,
2006).
Another main role of the fibroblasts migrating into the blood clot is the synthesis and
deposition of collagen fibers, which usually start in the first days post wounding. At the
same time fibroblasts are capable to digest the fibrin network, thereby gradually replacing
the fibrin fibers of the provisional extracellular matrix with collagen fibers and creating the

Tissue engineering using fibrin and fibrinogen
23
matrix of a regenerated tissue in the proliferative and the remodeling phase (Laurens et al.,
2006).
Endothelial cells
In case of large injuries, small blood vessels in the tissue might also be destroyed. New
blood vessels in the clot and regenerating tissue are formed by endothelial cells, which also
migrate to the site of injury from the surrounding tissue (Hinsbergh et al., 2001).
Endothelial cells digest the fibrin network by secreting plasmin and matrix
metalloproteinases. The local degradation of the fibrin network allows an accelerated
migration of endothelial cells and forms cavities in the fibrin network. The endothelial cells
reorganize in those cavities and start the formation of new blood vessels in a complex
process, which is called angiogenesis (Laurens et al., 2006).
Remarkably, the process of angiogenesis is strongly influenced by the morphology of the
fibrin network. Dense fibrin networks with a low porosity only allow slow angiogenesis
while fibrin with a high porosity alleviates blood vessel formation (Annemie Collen et al.,
1998). It was even demonstrated that in fibrin with artificial cavities, endothelial cells
utilized those preexisting cavities and formed blood vessels in them. For large blood clots
an early start of angiogenesis is important to ensure the supply with oxygen and nutrients
for the regenerating tissue (Laurens et al., 2006).
2.4. Tissue engineering using fibrin and fibrinogen
The rapidly growing interdisciplinary field of tissue engineering utilizes the current
knowledge about the structure and function of living tissue to generate artificial tissue with
biomimetic characteristics. Tissue engineering aims to create artificial tissue replacements,
which mimic the morphological architecture and biochemical environment of natural ECM.
The aim is to establish reproducible in vitro methods to generate artificial scaffolds for
medical applications like for example as tissue replacements or as wound healing grafts
(Chaudhari et al., 2016).
These replacements are fabricated either by using decellularized donor tissue or by
preparing either synthetic or natural ECM materials in a way that mimics native tissue
architecture and function (Fisher and Mauck, 2013). When these scaffolds are applied to a

24
defect, they serve as ECM replacement that promotes healing of the defect as depicted in
Figure 7.
Figure 7: Scaffold types used in tissue engineering. Tissue engineering aims to treat tissue defects by a provisional scaffold, which provides the functions of the native tissue ECM. Common scaffolds for this purpose are decellularized tissue, synthetic scaffolds or ECM material scaffolds.
An ideal tissue engineering scaffold would have the same nanofibrous morphology and a
similar biochemistry as the ECM in native tissue. In addition, the material should be
biocompatible, non-immunogenic and biodegradable. Although decellularized tissues fulfill
most of these requirements and have been successfully used in tissue engineering, the
availability and preparation of such custom-made tissues is often complicated. Moreover,
the risk of immunogenic responses is high, when decellularized tissue is transferred into a
patient. Therefore, efforts have been made to utilize synthetic materials for the fabrication
of tissue engineering scaffolds, since such scaffolds are widely available and a controlled
fabrication might lead to tissue engineering scaffolds allowing a better control of the
cellular response (Lutolf and Hubbell, 2005). However, synthetic materials often lack the
desired biochemical properties or even have a low biocompatibility, which led to the idea
of using the native materials present in the ECM for tissue engineering. These natural
material scaffolds often contain purified ECM components like collagen or fibronectin,
which have the inherent biochemistry and biocompatibility but do not provide all functions
of native ECM. However, there is no clear-cut definition of synthetic or ECM materials
used in tissue engineering and combinations of both material classes have been tested
(O'Brien, 2011).
Fibrin as a biomaterial for tissue engineering
25
Especially for the engineering of biomaterial scaffolds to replace lost tissue or for wound
healing applications it seems reasonable to use fibrin or its soluble precursor fibrinogen.
The enzymatic conversion of fibrinogen into fibrin can easily be utilized to obtain fibrin
scaffolds for tissue engineering applications. Therefore, fibrin-based materials have been
tested for the treatment of wounds and have successfully been applied in clinical
procedures long before the term tissue engineering was introduced (Sierra, 1993). Although
fibrin-based materials show the remarkable qualities of native fibrin and are inherently
suited for wound treatment, the novel discipline of tissue engineering has recently focused
on the production of materials from the fibrin precursor molecule fibrinogen. Interestingly,
fibrinogen can be processed into (nano-)fibrous biomaterials either by electrospinning or
under versatile self-assembly conditions. However, the question how useful these
fibrinogen scaffolds are from a fabrication or from an application point of view is still
under discussion and it still has to be determined whether such fibrinogen fibers are a
reasonable alternative or a possible addition to fibrin materials.
2.4.1. Fibrin as a biomaterial for tissue engineering
Since fibrin can be easily prepared in vitro by incubating fibrinogen with the enzyme
thrombin and the resulting fibrin scaffold inherently has the required biochemistry and
morphology for cellular interactions, it is one of the first successfully used biomaterials in
tissue engineering, especially in applications to prevent bleeding and promote wound
healing (Brown and Barker, 2014; Janmey et al., 2009).
The first idea to use fibrin in the treatment of wounds was discussed by Bergel in 1909.
More than 100 years ago Bergel realized that the use of the native material for wound
closure would not only provide an initial wound closure, but would also help in subsequent
tissue regeneration (Bergel, 1909). Since the 1940s, fibrin and the process of fibrin
formation were understood well enough to fabricate gels or patches of fibrin in vitro, which
were applied as wound healing materials (Sierra, 1993). Newer approaches even try to
directly embed cells into those preformed fibrin scaffolds. Fibrin gels have been used in
vitro to induce stem cell differentiation (Catelas et al., 2006). Furthermore, fibrin patches
loaded with stem cells have been developed for stem cell delivery (Zhang et al., 2006).
Even a co-culture fibrin scaffold with one layer containing fibroblasts and a second layer
26
containing keratinocytes stacked on top has been established. This two-layer cellular skin
equivalent scaffold has been successfully tested in an animal model already (Mazlyzam et
al., 2007). Additional advantages of fibrin for biomaterial applications are that the gelation
time, porosity, fiber thickness and mechanical properties can be controlled by adjusting the
thrombin concentration, the addition of transglutaminase or changes of the pH (Brown and
Barker, 2014; Janmey et al., 2009).
In addition to prefabricated in vitro fibrin scaffolds, there is a second and more common
way to apply fibrin as a biomaterial. Clinically, fibrin is often applied in the form of fibrin
sealant or so called fibrin glue. For this application highly concentrated fibrinogen and
thrombin solutions are supplied in different vials, which are mixed and immediately
sprayed or dripped onto the tissue (Albala and Lawson, 2006). Such fibrin sealants have
been widely applied in Europe since the 1970s and have been approved in the United States
in the late 1990s (Brown and Barker, 2014). In addition to the applications of fibrin sealant
for dermal and burning wounds (Mittermayr et al., 2006), fibrin glue has also been utilized
for many other clinical and surgical applications. For example, fibrin sealant has been used
to connect larger blood vessels (Dascombe et al., 1997; Shireman and Greisler, 1998) as
well as in microsurgical blood vessel reconnection (Andree et al., 2008), which makes
fibrin sealant a very useful tool in vascular surgery. Furthermore, fibrin sealants have been
employed in hernia repair (Fortelny et al., 2008; Santoro et al., 2007) and in neuro-surgery
(Bjarkam et al., 2008).
In summary, the easy handling and the unmatched biocompatibility of fibrin make it an
ideal biomaterial for clinical applications and it is not surprising that fibrin-based materials
are already used in most fields of modern surgery (Albala and Lawson, 2006).
2.4.2. Fibrinogen as biomaterial for tissue engineering
The rise of the relatively new scientific field of tissue engineering was accompanied by the
interesting new idea to prepare fibrous scaffolds out of the fibrin precursor fibrinogen.
Many methods have been described to produce fibrinogen nanofibers in vitro without the
addition of the enzyme thrombin. Since the fibrinogen molecules in those fibers still
comprise fibrinopeptides A and B, these fibers cannot be considered to be fibrin. Although
Fibrinogen as biomaterial for tissue engineering
27
fibrin nanofibers are a biocompatible material, which is inherently suitable for tissue
engineering, new methods to produce fibrinogen nanofibers in vitro have been established
with the aim to use fibrinogen nanofibers as a potential alternative to fibrin fibers for tissue
engineering (Rajangam and An, 2013).
Fibrinogen fiber formation in solution
The formation of fibrinogen nanofibers without thrombin can be achieved by different self-
assembly methods. Two methods for the in vitro preparation of fibrinogen fibers in solution
have been described by Wei and coworkers. Fibrinogen fiber formation has been induced
by incubation of fibrinogen in acidic pH (Wei et al., 2008a) or in ethanol solution (Wei et
al., 2008b). Upon incubation in an acidic pH of 2 or incubation in 80% ethanol the
formation of fibrinogen fibers was observed. For acid-induced fibrinogen fiber formation, a
conformational change and a partial denaturation were proposed as a potential mechanism
of self-assembly. Furthermore, it was speculated about an amyloid-like nature of the
fibrinogen fibers (Wei et al., 2008a). Similarly for ethanol-induced fibrinogen fiber
formation conformational changes were discussed as a potential mechanism (Wei et al.,
2008b). However, in both studies no further investigation of the fibrinogen conformation or
formation of amyloid structures was conducted. Amyloids are stacked and self-propagating
β-sheet motives, which result in long and unbranched fibers, which are insoluble (Toyama
and Weissman, 2011). The formation of β-amyloid structures occurs during the assembly of
some natural polymers like for example silk and has been discussed to be involved in many
self- assembly processes of nanofibers for biomaterial application (Wei et al., 2017).
Nevertheless, the transition of many proteins into insoluble amyloid fibers is accompanied
by a loss in protein function and many diseases are linked to the formation of amyloid
structures, which are also referred to as protein misfolding diseases (Chiti and Dobson,
2006). Amyloid misfolding of fibrinogen has been reported as hereditary fibrinogen
amyloidosis, a genetic disease in which beta amyloid fibrinogen agglomerates in organs
due to a mutation in the primary structure of fibrinogen (Picken, 2010). Wei and coworkers
used fibrinogen without any mutations in their studies, which makes a potential amyloid
formation unlikely. Additionally, the harsh pH value of 2 potentially denatured fibrinogen
completely (Marguerie, 1977), which makes a profound interpretation of the self-assembly
processes presented by Wei and coworkers challenging. A major drawback for the use of

28
these methods in tissue engineering is that the yield of fibrinogen fibers is very low and the
preparation of applicable scaffolds seems unfeasible. In addition, the harsh pH or ethanol
treatments most likely involved, have adverse effects on the bioactivity and
biocompatibility of the newly formed fibrinogen fibers.
Nevertheless, the ethanol induced fibrinogen self-assembly described by Wei and
coworkers was used in one further study to generate alternating sheets of graphene and
fibrinogen fibers in a layer by layer approach (Wang et al., 2014).
Another method to induce the self-assembly of fibrinogen in aqueous solution was recently
described by Hämisch and coworkers. The ionic strength of a fibrinogen and NaCl solution
was decreased by diluting the solution, which resulted in an aggregation of fibrinogen in
the solution as confirmed by light scattering. Additionally, the formation of aggregates
upon a drop in ionic strength was confirmed using AFM. Interestingly, the formation of
fibrinogen aggregates was fastest with the lowest final ionic strength. However, if the
fibrinogen aggregated in a fibrous form was not confirmed (Hämisch et al., 2019).
Fibrinogen fiber formation on hydrophobic surfaces
Self-assembly of fibrinogen has also been observed as a surface reaction. Especially
hydrophobic surfaces like for example nanostructured graphite (Reichert et al., 2009),
trioctylmethylamine (Koo et al., 2012), gold surfaces (Chen et al., 2009) or polystyrene
(Zhang et al., 2017) have been reported to induce the self-assembly of fibrinogen fibers.
The mechanism inducing self-assembly on hydrophobic surfaces is not obvious. An
orientation of fibrinogen molecules on the surface and an exposure of cryptic binding sites
on the α-C domains of the molecule has been discussed in some studies (Chen et al., 2009;
Koo et al., 2010; Reichert et al., 2009), although a concrete mechanism has not been
revealed to date. One factor that makes the investigation of the mechanism of surface
induced fibrinogen fiber formation challenging is the change in concentration and ionic
strength during the drying of the samples, which was postulated to have an additional effect
on the fiber formation (Reichert et al., 2009).

Fibrinogen as biomaterial for tissue engineering
29
A more recent study has investigated the adhesion of fibrinogen molecules to a
polyethylene single crystal at different pH values. It was shown that fibrinogen formed
fibrous agglomerates upon adsorption to the polyethylene surface at a pH of 7.4. At a pH of
9.2 only single molecules adsorbed to the surface. However, it has to be noted, that the
samples at a pH 7.4 were prepared in a buffer containing Na+-ions, while for the samples at
a pH of 9.2 a buffer containing Ca2+-ions was used. This is likely to have a strong
additional influence on fibrinogen adsorption (Helbing et al., 2016).
Dubrovin and coworkers conducted another interesting recent atomic force microscopy
study of fibrinogen fiber formation on hydrophobic surfaces, which investigated the
fibrinogen self-assembly on highly oriented pyrolytic graphite modified with
anoligoglycine-hydrocarbon. This treatment makes the graphite surface slightly more
hydrophilic (10° of static contact angle). It was shown that fibrinogen adsorption to the
modified surface resulted in the gradual formation of fibrinogen fibrils within several
minutes. The formation of fibrinogen fibrils was accompanied by an unfolding of different
fibrinogen domains and a reduction of sample height, which indicates a change in
fibrinogen conformation (Dubrovin et al., 2019).
The biocompatibility and bioactivity of fibers prepared by self-assembly on hydrophobic
surfaces has not been determined, although the milder way to induce self-assembly
implicates better biological functions as compared to ethanol- or acid-induced assembly.
The major drawback of the self-assembly on hydrophobic surfaces also lies in the poor
fiber yield. For the fabrication of tissue engineering scaffolds, the fiber formation is to
scarce and the hydrophobic surface limits the formation of a two-dimensional fiber
network. Although fibrinogen fibers prepared on hydrophobic surfaces are not applied in
tissue engineering, the research of fibrinogen self-assembly on hydrophobic surfaces has
strong implications for potential surface coatings of implant materials. If an implant is
designed to have contact with blood, like for example a stent, an agglomeration of
fibrinogen fibers can have unwanted and even fatal consequences like thrombosis (van
Kampen et al., 1979). This can potentially be avoided by coating the implant with a surface
that shows a low fibrinogen adsorption and fiber formation (Zhang et al., 2017).
Fibrinogen fiber formation by extrusion
30
Recently, extrusion through hydrophilic aluminum oxide nanopores has been introduced as
a new method to prepare nanofibers from various biopolymers including fibrinogen (Raoufi
et al., 2016). It was discussed that during the extrusion of a viscous fibrinogen solution
through a nanopore shear forces are present, which partially unfold the fibrinogen
molecule. A conformational change during the extrusion process has been confirmed for
the ECM protein fibronectin, which makes a confirmation change during fibrinogen
extrusion plausible (Raoufi et al., 2015). However, the extrusion approach mostly results in
bundles of fibers instead of porous scaffolds with nanofibers and the outcome can vary,
which makes extrusion of fibrinogen not suitable for the fabrication of tissue engineering
scaffolds.
2.4.2.1. Electrospinning of fibrinogen fibers
None of the techniques mentioned above is reliable enough or has sufficient fiber yield to
produce dense fibrinogen fiber networks, which could be applied for tissue engineering.
However, as a well-established technique, electrospinning facilitates the preparation of
nanofibers on a large scale in vitro and can be used for fibrinogen (Wnek et al., 2003).
Electrospinning was originally designed for the production of non-biological polymer
nanofibers, but has been introduced as a tool to prepare nanofibers from many different
biological materials. The usual setup for electrospinning consists of a grounded collector
and a metallic needle as a spinneret, which are connected to a high voltage power supply
like schematically shown in Figure 8 (Li and Xia, 2004).
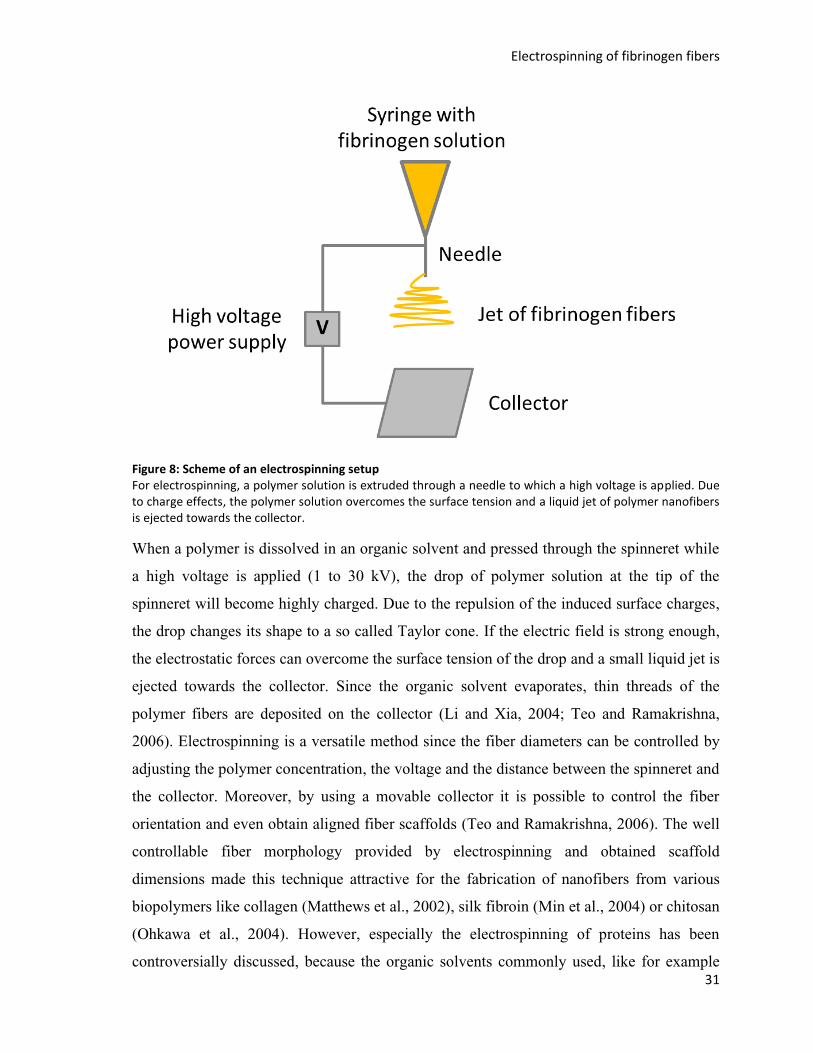
Electrospinning of fibrinogen fibers
31
Figure 8: Scheme of an electrospinning setup For electrospinning, a polymer solution is extruded through a needle to which a high voltage is applied. Due to charge effects, the polymer solution overcomes the surface tension and a liquid jet of polymer nanofibers is ejected towards the collector.
When a polymer is dissolved in an organic solvent and pressed through the spinneret while
a high voltage is applied (1 to 30 kV), the drop of polymer solution at the tip of the
spinneret will become highly charged. Due to the repulsion of the induced surface charges,
the drop changes its shape to a so called Taylor cone. If the electric field is strong enough,
the electrostatic forces can overcome the surface tension of the drop and a small liquid jet is
ejected towards the collector. Since the organic solvent evaporates, thin threads of the
polymer fibers are deposited on the collector (Li and Xia, 2004; Teo and Ramakrishna,
2006). Electrospinning is a versatile method since the fiber diameters can be controlled by
adjusting the polymer concentration, the voltage and the distance between the spinneret and
the collector. Moreover, by using a movable collector it is possible to control the fiber
orientation and even obtain aligned fiber scaffolds (Teo and Ramakrishna, 2006). The well
controllable fiber morphology provided by electrospinning and obtained scaffold
dimensions made this technique attractive for the fabrication of nanofibers from various
biopolymers like collagen (Matthews et al., 2002), silk fibroin (Min et al., 2004) or chitosan
(Ohkawa et al., 2004). However, especially the electrospinning of proteins has been
controversially discussed, because the organic solvents commonly used, like for example
32
1,1,1,3,3,3-hexafluoro-2-propanol, have been shown to denature proteins (Kundu and
Kishore, 2004). Circular dichroism studies of the secondary structure in electrospun protein
fibers have shown that collagen was completely denatured by the organic solvent and the
high voltages during the electrospinning process. The electrospun fibers had lost 99% of
their native secondary structure (Zeugolis et al., 2008).
Despite the denaturation problem, electrospinning has also been used to produce fibers
from fibrinogen, which was first described by Wnek and coworkers (Wnek et al., 2003).
Wnek achieved fibrinogen fibers with a wide diameter range of 80 to 700 nm, which
organized into fibrous networks with dimensions of several cm2. The production of large-
scale scaffolds seemed like a first step to produce fibrinogen fibers that could be applied for
tissue engineering. However, the fibrinogen had to be dissolved in 1,1,1,3,3,3-hexafluoro-
2-propanol. If this solvent or the electrospinning process affects the secondary structure or
even denatures the fibrinogen has not been addressed (Wnek et al., 2003). During
electrospinning of fibrinogen, the fiber diameter and orientation can be controlled by
adjusting the voltage, the fibrinogen concentration and the collector. These advantages led
to follow up studies, which characterized the mechanics and the liquid flow permeability of
fibrinogen fiber scaffolds, but did not investigate structural changes, biological function or
cell interactions (McManus et al., 2006; Sell et al., 2008a)
Later, the feasibility of electrospun scaffolds for tissue engineering applications was tested
in two studies without a prior investigation of structural changes of the fibrinogen during
electrospinning. These experiments showed that fibroblasts as well as smooth muscle cells
proliferated on electrospun fibrinogen nanofibers and even started to deposit collagen over
a time course of 14 days. Therefore, the authors of the studies concluded that electrospun
fibrinogen nanofibers are bio-mimicking, still biologically active and have great potential
for applications in tissue engineering (McManus et al., 2007b; McManus et al., 2007a).
However, this conclusion should be treated with caution. Since both proliferation studies
failed to include crucial control groups, a final conclusion about cell proliferation cannot be
made. The fact that fibroblasts as well as smooth muscle cells started to deposit collagen on
electrospun fibrinogen fibers is likewise no proof for bioactivity or biocompatibility since it
is long known that fibroblasts and smooth muscle cells deposit collagen even on standard
polystyrene cell culture surfaces (Amento et al., 1991; Diegelmann et al., 1979).

Electrospinning of fibrinogen fibers
33
Despite these undiscussed questions electrospun fiber materials were further developed by
modification with different crosslinking agents (Sell et al., 2008b). It was shown that the
mechanical properties could be altered and the degradation time of electrospun fibrinogen
nanofibers could be delayed. Nevertheless, glutaraldehyde crosslinking and 1-ethyl-3-(3-
dimethylaminopropyl) carbodiimide hydrochloride crosslinking had negative effects on the
biocompatibility of the electrospun fibrinogen fibers indicated by a poor collagen
deposition (Sell et al., 2008b).
The first study that actually investigated secondary structure changes in fibrinogen fibers
induced by electrospinning was conducted by Carlisle and coworkers (Carlisle et al., 2009).
In this study the structural changes of fibrinogen upon dissolving in 1,1,1,3,3,3-hexafluoro-
2-propanol were analyzed using circular dichroism spectroscopy. It was shown that the
content of α-helices increased from 25% to 60% in the spinning solution. Interestingly, this
massive change of secondary structure was interpreted as a proof that fibrinogen stayed
largely folded in the spinning solution. Unfortunately, only the structure of fibrinogen in
the spinning solution before the actual electrospinning process was analyzed (Carlisle et al.,
2009). The structure of fibrinogen in the electrospun fiber therefore stays elusive. One
attempt to overcome the drawbacks of the organic solvent was the electrospinning of
fibrinogen in a mixture of formic and acetic acid. The secondary structure of the resulting
fibers was analyzed using Fourier-transform infrared spectroscopy. Fibers prepared in the
acidic solvent showed no differences in secondary structure when compared to fibers
prepared with the 1,1,1,3,3,3-hexafluoro-2-propanol solvent (Mirzaei-Parsa et al., 2018).
Electrospun ccomposites of fibrinogen and poly-lactic acid fibers have been used to
investigate the effects of electrospun fibrinogen scaffolds on stem cell differentiation
(Forget et al., 2016). Interestingly, the chondrogenic differentiation of mesenchymal stem
cells was favorable on randomly oriented fibers rather than on aligned fibers and a thin
two-dimensional scaffold proved to be more useful for differentiation than a thicker three-
dimensional scaffold (Forget et al., 2016).
In another recent study, electrospun fibrinogen fibers were also applied to guide endothelial
cell migration (Gugutkov et al., 2013). This study analyzed the primary structure of
electrospun fibrinogen by SDS PAGE. With this method, it was shown that the peptide
34
backbones of the Aα-, Bβ- and γ-chains were still intact after electrospinning. However,
this method did not allow any conclusion about the secondary structure of fibrinogen in
electrospun fibers. In summary, electrospinning is one of the most applied techniques for
the production of fibrinogen fibers, because of its well-characterized fabrication process,
adjustable fiber dimensions and scaffold porosities. However, there is a lack of studies,
which focus on the secondary structure of the electrospun fibrinogen fibers. It is remarkable
that the secondary structure, which is responsible for all the advantageous properties of
fibrinogen including the promotion of cell adhesion, biocompatibility and bioactivity, has
been widely neglected during the establishment of electrospun fibrinogen fibers as a
biomaterial for future tissue engineering applications.
2.5. Aim of the thesis
This thesis aims at a fundamental understanding of fibrinogen fiber assembly under in vitro
conditions in a cell- and enzyme-free environment. Towards novel concepts in wound
healing therapy it is of particular interest, how the presence of different salts and varying
environmental conditions influences the assembly of fibrinogen into fibrillar networks.
The first key question will be how different environmental conditions induce fibrillogenesis
of fibrinogen and which morphological characteristics the fiber assemblies exhibit.
Therefore, the influence of different ion species, variations in ionic strength, fibrinogen
concentration or pH value, different drying conditions as well as different substrate
materials on fibrinogen assembly will be investigated. First, the morphological
characteristics of fibrinogen scaffolds will be studied to identify key parameters, which
induce fibrillogenesis. The findings of these studies will be used to propose a fundamental
mechanism for fibrinogen self-assembly under in vitro conditions.
Another focus of this thesis will be the protein conformation in self-assembled fibrinogen
nanofibers. To answer the second key question whether fibrinogen self-assembly in vitro is
accompanied by conformational changes, the results from morphological analysis will be
correlated with secondary structure analysis. This project part also aims at the question
whether fibrinogen self-assembly in vitro is associated with the formation of pathogenic
amyloid fibrils.
Aim of the thesis
35
Finally, the biofunctionality of self-assembled fibrinogen nanofibers will be in the focus of
this thesis. After key parameters for in vitro assembly of fibrinogen into nanofibers have
been identified it will be the next aim to investigate the fiber ability to bind to other
molecules. Moreover, the degradation characteristics of self-assembled fibrinogen fibers
under the influence of varying enzymes will be studied. The results of this project part will
be important to answer the question whether fibrinogen fibers, assembled under in vitro
conditions, are biologically active.
The expected results of this dissertation will be used to gain insight into the fundamental
mechanisms of fibrinogen fiber formation in vitro. The expected findings will also provide
a first indication of the potential use of self-assembled fibrinogen fibers in future wound
healing applications.
36
3. Background of the main analytical techniques
In order to understand the self-assembly of fibrinogen, the presence and the morphology of
fibrinogen fibers prepared under various in vitro conditions was analyzed using scanning
electron microscopy. To gain an insight into potential changes in secondary structure
during fibrinogen self-assembly, the fibrinogen samples were analyzed using circular
dichroism spectroscopy. Therefore, a detailed introduction into the background of these two
techniques is given in this chapter.
3.1. Scanning electron microscopy
The principal of scanning electron microscopy is similar to optical microscopy only that a
focused electron beam is used instead of a light beam for imaging. The electrons are
generated by either a field emission or a thermionic cathode. When a high voltage of
usually 0.1 to 50 kV is applied, the electrons are accelerated towards the anode. This
primary electron beam is generated in high vacuum and can be focused by a set of
(electro)magnetic lenses (Figure 9). When the focused primary electron beam hits a point of
the specimen surface, electrons of the specimen with low exit energy are emitted, which is
also referred to as inelastic scattering. These secondary electrons are collected by a
positively biased collector and an intensity value for this point of the specimen is calculated
based on the number of detected secondary electrons. By scanning the sample point by
point, an image of the specimen can be generated. Since secondary electrons show an
enhanced emission on edges and small particles, the position of the detector generates
artificial shadow contrast at deeper positions and a topographical image of the specimen
surface with a high depth of focus can be achieved. Secondary electrons can only be
emitted from a depth of a few nanometers of the specimen surface. In combination with the
focus of the electron beam this allows a resolution of 1-10 nm (Pfützner, 2012; Reimer,
1998).
In addition to secondary electrons, backscattered electrons are also detected in a scanning
electron microscope. Backscattered electrons are high-energy electrons of the primary
electron beam, which are reflected upon collisions with atoms of the specimen, which is
also referred to as elastic scattering. Since the number of these collisions and the
penetration depth into the specimen can vary, backscattered electrons are decelerated
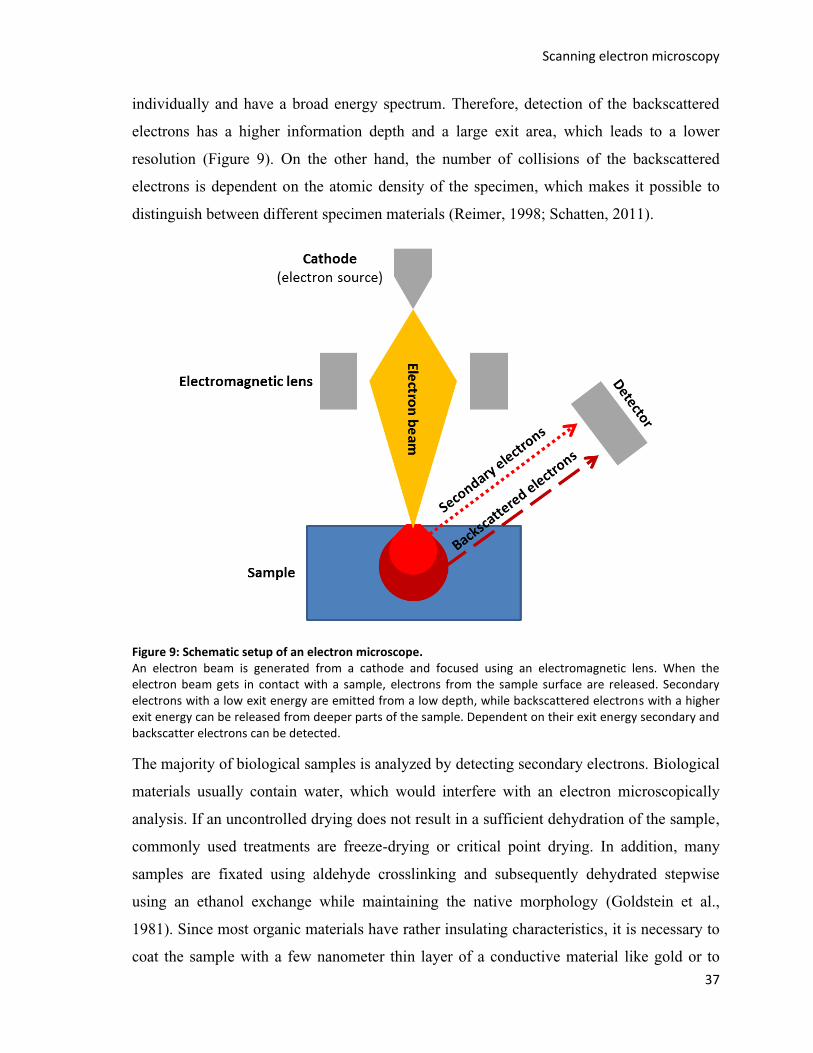
Scanning electron microscopy
37
individually and have a broad energy spectrum. Therefore, detection of the backscattered
electrons has a higher information depth and a large exit area, which leads to a lower
resolution (Figure 9). On the other hand, the number of collisions of the backscattered
electrons is dependent on the atomic density of the specimen, which makes it possible to
distinguish between different specimen materials (Reimer, 1998; Schatten, 2011).
Figure 9: Schematic setup of an electron microscope. An electron beam is generated from a cathode and focused using an electromagnetic lens. When the electron beam gets in contact with a sample, electrons from the sample surface are released. Secondary electrons with a low exit energy are emitted from a low depth, while backscattered electrons with a higher exit energy can be released from deeper parts of the sample. Dependent on their exit energy secondary and backscatter electrons can be detected.
The majority of biological samples is analyzed by detecting secondary electrons. Biological
materials usually contain water, which would interfere with an electron microscopically
analysis. If an uncontrolled drying does not result in a sufficient dehydration of the sample,
commonly used treatments are freeze-drying or critical point drying. In addition, many
samples are fixated using aldehyde crosslinking and subsequently dehydrated stepwise
using an ethanol exchange while maintaining the native morphology (Goldstein et al.,
1981). Since most organic materials have rather insulating characteristics, it is necessary to
coat the sample with a few nanometer thin layer of a conductive material like gold or to

38
work with low acceleration voltages (Schatten and Pawley, 2008). The insulation properties
of biological materials also cause an accumulation of electrons at the sample surface
leading to charge effects. At the same time, secondary electrons of uncoated samples can be
released from a certain depth of the sample, which decreases the resolution, when working
with unsputtered samples (Schatten and Pawley, 2008). These drawbacks are overcome by
sputtering the sample with a layer of gold or another heavy metal. Secondary electrons of
sputter-coated samples are mostly released from the metal layer, which prevents charging
of the biological material beneath. On the other hand, the coating of biological samples
only results in an indirect image of the sample morphology, since only the morphology of
the metal layer on the specimen surface is detected. This makes the sample preparation and
the coating procedure a crucial factor for the electron microscopically analysis of biological
samples (Schatten, 2011).
3.2. Circular Dichroism Spectroscopy
Like for other spectroscopy techniques the main underlying principle of circular dichroism
spectroscopy is the measurement of the absorbance of light with a certain wavelength as
defined by Lambert-Beer’s law:
𝐴 = log (𝐼0
𝐼) = 𝜀𝑐𝑙
Here A is the absorbance, which is defined as the logarithm of the ratio of incoming light
intensity (I0) and the outgoing intensity (I). The absorbance can also be calculated by
multiplying the concentration c (in M) by the path length l (in cm) with a material specific
extinction coefficient ε (in M-1 cm-1) (Berova et al., 2000).
The measurement of absorption and the determination of concentration by spectroscopy are
mostly used for components in solution, but can also be used for solids. Every
spectroscopic method has two crucial prerequisites: The exact knowledge of the path
length, which for solutions is determined by the used cuvette and a homogenous
distribution of the measured material in the sample (Mark, 1991).
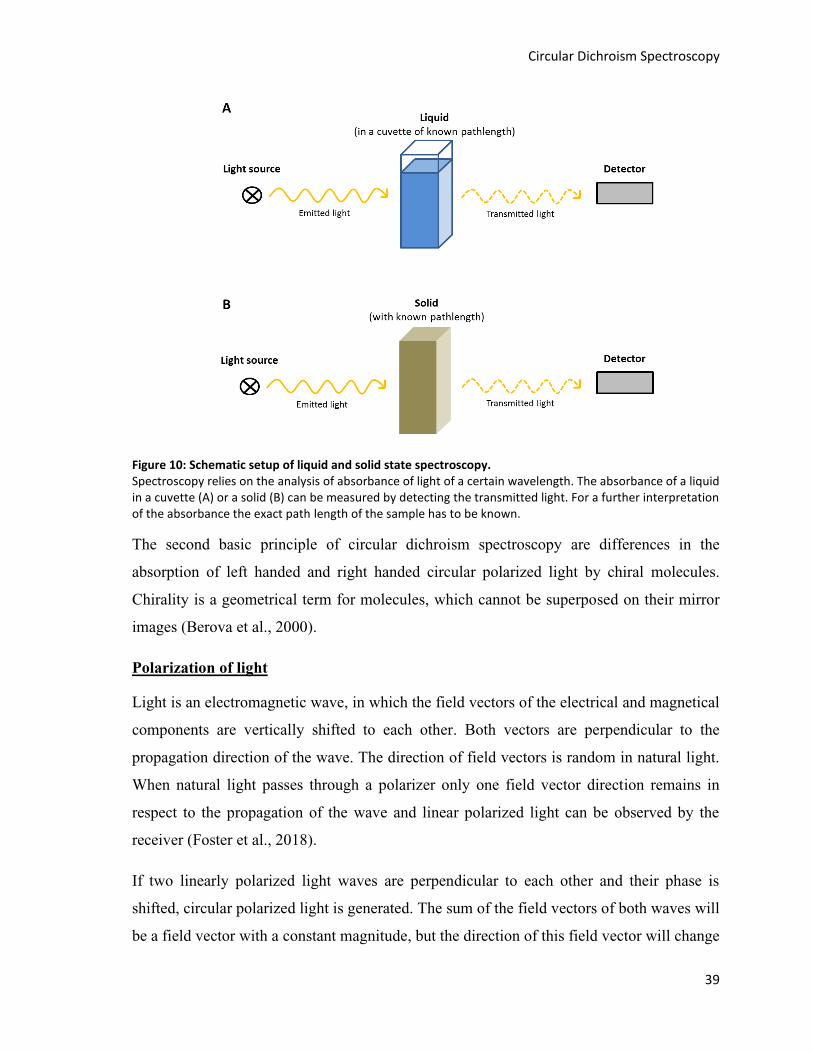
Circular Dichroism Spectroscopy
39
Figure 10: Schematic setup of liquid and solid state spectroscopy. Spectroscopy relies on the analysis of absorbance of light of a certain wavelength. The absorbance of a liquid in a cuvette (A) or a solid (B) can be measured by detecting the transmitted light. For a further interpretation of the absorbance the exact path length of the sample has to be known.
The second basic principle of circular dichroism spectroscopy are differences in the
absorption of left handed and right handed circular polarized light by chiral molecules.
Chirality is a geometrical term for molecules, which cannot be superposed on their mirror
images (Berova et al., 2000).
Polarization of light
Light is an electromagnetic wave, in which the field vectors of the electrical and magnetical
components are vertically shifted to each other. Both vectors are perpendicular to the
propagation direction of the wave. The direction of field vectors is random in natural light.
When natural light passes through a polarizer only one field vector direction remains in
respect to the propagation of the wave and linear polarized light can be observed by the
receiver (Foster et al., 2018).
If two linearly polarized light waves are perpendicular to each other and their phase is
shifted, circular polarized light is generated. The sum of the field vectors of both waves will
be a field vector with a constant magnitude, but the direction of this field vector will change
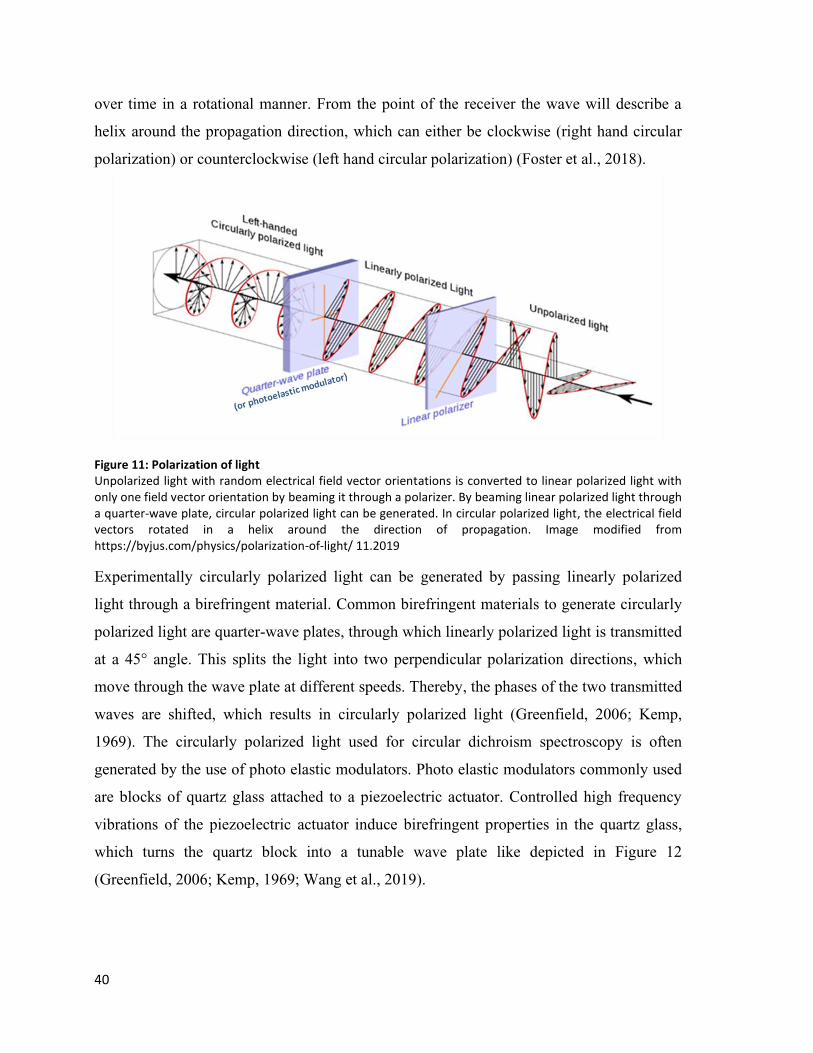
40
over time in a rotational manner. From the point of the receiver the wave will describe a
helix around the propagation direction, which can either be clockwise (right hand circular
polarization) or counterclockwise (left hand circular polarization) (Foster et al., 2018).
Figure 11: Polarization of light Unpolarized light with random electrical field vector orientations is converted to linear polarized light with only one field vector orientation by beaming it through a polarizer. By beaming linear polarized light through a quarter-wave plate, circular polarized light can be generated. In circular polarized light, the electrical field vectors rotated in a helix around the direction of propagation. Image modified from https://byjus.com/physics/polarization-of-light/ 11.2019
Experimentally circularly polarized light can be generated by passing linearly polarized
light through a birefringent material. Common birefringent materials to generate circularly
polarized light are quarter-wave plates, through which linearly polarized light is transmitted
at a 45° angle. This splits the light into two perpendicular polarization directions, which
move through the wave plate at different speeds. Thereby, the phases of the two transmitted
waves are shifted, which results in circularly polarized light (Greenfield, 2006; Kemp,
1969). The circularly polarized light used for circular dichroism spectroscopy is often
generated by the use of photo elastic modulators. Photo elastic modulators commonly used
are blocks of quartz glass attached to a piezoelectric actuator. Controlled high frequency
vibrations of the piezoelectric actuator induce birefringent properties in the quartz glass,
which turns the quartz block into a tunable wave plate like depicted in Figure 12
(Greenfield, 2006; Kemp, 1969; Wang et al., 2019).
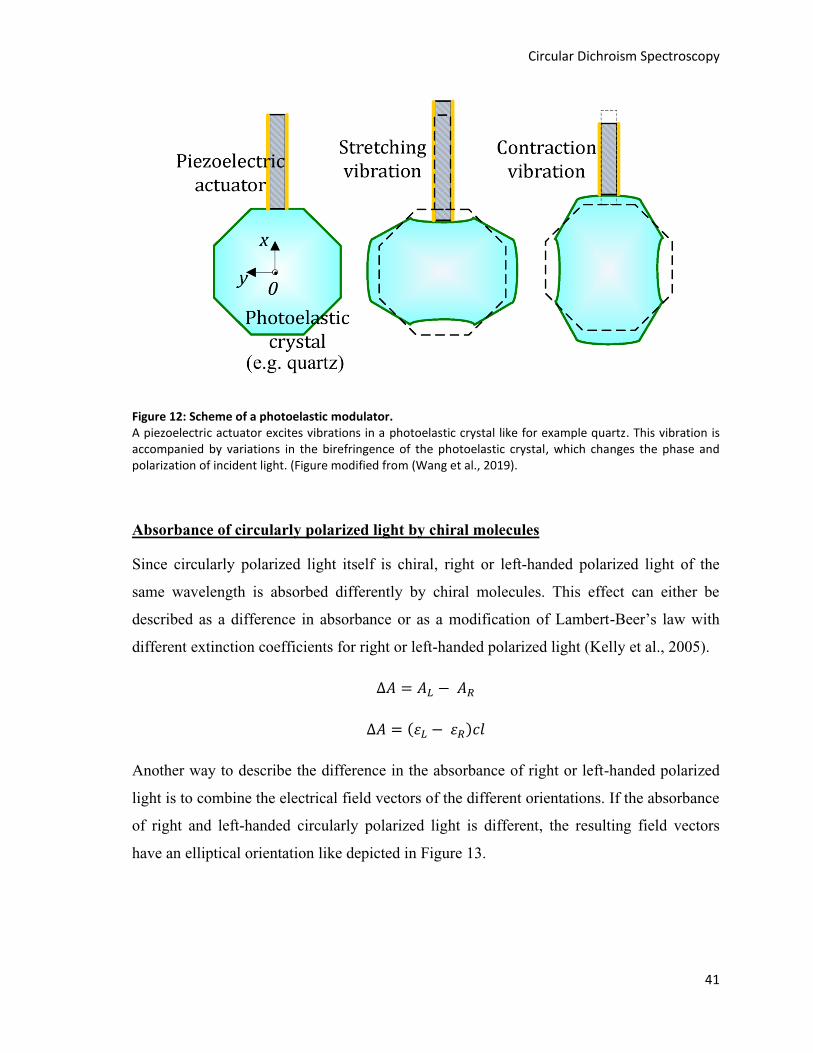
Circular Dichroism Spectroscopy
41
Figure 12: Scheme of a photoelastic modulator. A piezoelectric actuator excites vibrations in a photoelastic crystal like for example quartz. This vibration is accompanied by variations in the birefringence of the photoelastic crystal, which changes the phase and polarization of incident light. (Figure modified from (Wang et al., 2019).
Absorbance of circularly polarized light by chiral molecules
Since circularly polarized light itself is chiral, right or left-handed polarized light of the
same wavelength is absorbed differently by chiral molecules. This effect can either be
described as a difference in absorbance or as a modification of Lambert-Beer’s law with
different extinction coefficients for right or left-handed polarized light (Kelly et al., 2005).
∆𝐴 = 𝐴𝐿 − 𝐴𝑅
∆𝐴 = (𝜀𝐿 − 𝜀𝑅)𝑐𝑙
Another way to describe the difference in the absorbance of right or left-handed polarized
light is to combine the electrical field vectors of the different orientations. If the absorbance
of right and left-handed circularly polarized light is different, the resulting field vectors
have an elliptical orientation like depicted in Figure 13.
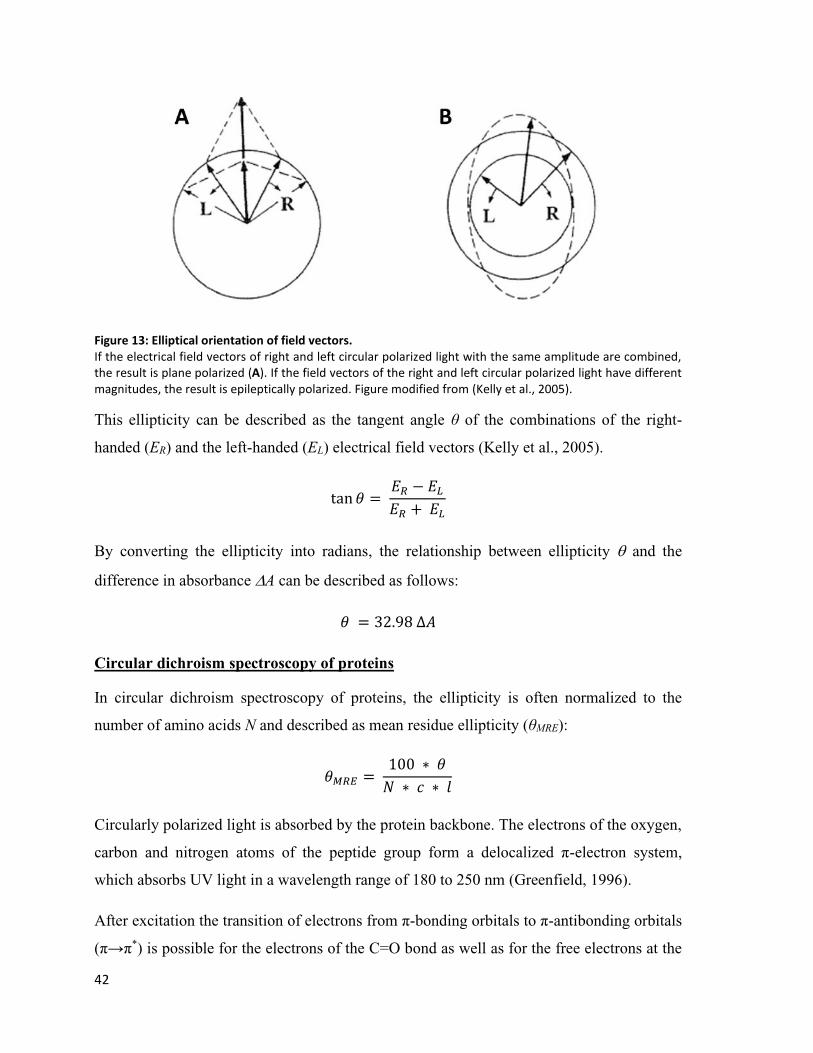
42
Figure 13: Elliptical orientation of field vectors. If the electrical field vectors of right and left circular polarized light with the same amplitude are combined, the result is plane polarized (A). If the field vectors of the right and left circular polarized light have different magnitudes, the result is epileptically polarized. Figure modified from (Kelly et al., 2005).
This ellipticity can be described as the tangent angle θ of the combinations of the right-
handed (ER) and the left-handed (EL) electrical field vectors (Kelly et al., 2005).
tan 𝜃 = 𝐸𝑅 − 𝐸𝐿
𝐸𝑅 + 𝐸𝐿
By converting the ellipticity into radians, the relationship between ellipticity and the
difference in absorbance A can be described as follows:
𝜃 = 32.98 ∆𝐴
Circular dichroism spectroscopy of proteins
In circular dichroism spectroscopy of proteins, the ellipticity is often normalized to the
number of amino acids N and described as mean residue ellipticity (θMRE):
𝜃𝑀𝑅𝐸 = 100 ∗ 𝜃
𝑁 ∗ 𝑐 ∗ 𝑙
Circularly polarized light is absorbed by the protein backbone. The electrons of the oxygen,
carbon and nitrogen atoms of the peptide group form a delocalized π-electron system,
which absorbs UV light in a wavelength range of 180 to 250 nm (Greenfield, 1996).
After excitation the transition of electrons from π-bonding orbitals to π-antibonding orbitals
(π→π*) is possible for the electrons of the C=O bond as well as for the free electrons at the
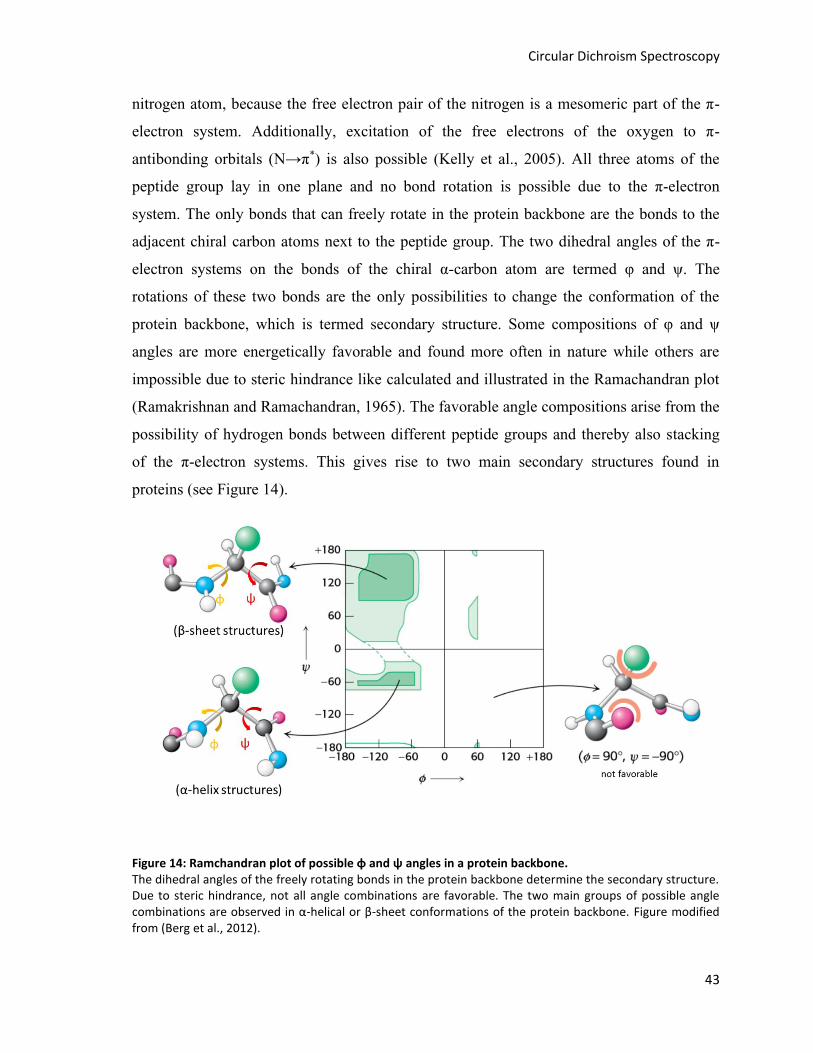
Circular Dichroism Spectroscopy
43
nitrogen atom, because the free electron pair of the nitrogen is a mesomeric part of the π-
electron system. Additionally, excitation of the free electrons of the oxygen to π-
antibonding orbitals (N→π*) is also possible (Kelly et al., 2005). All three atoms of the
peptide group lay in one plane and no bond rotation is possible due to the π-electron
system. The only bonds that can freely rotate in the protein backbone are the bonds to the
adjacent chiral carbon atoms next to the peptide group. The two dihedral angles of the π-
electron systems on the bonds of the chiral α-carbon atom are termed φ and ψ. The
rotations of these two bonds are the only possibilities to change the conformation of the
protein backbone, which is termed secondary structure. Some compositions of φ and ψ
angles are more energetically favorable and found more often in nature while others are
impossible due to steric hindrance like calculated and illustrated in the Ramachandran plot
(Ramakrishnan and Ramachandran, 1965). The favorable angle compositions arise from the
possibility of hydrogen bonds between different peptide groups and thereby also stacking
of the π-electron systems. This gives rise to two main secondary structures found in
proteins (see Figure 14).
Figure 14: Ramchandran plot of possible φ and ψ angles in a protein backbone. The dihedral angles of the freely rotating bonds in the protein backbone determine the secondary structure. Due to steric hindrance, not all angle combinations are favorable. The two main groups of possible angle combinations are observed in α-helical or β-sheet conformations of the protein backbone. Figure modified from (Berg et al., 2012).

44
The first major secondary structure that is found in proteins is the α-helix, where angles φ
and ψ are around -60° and 45°, respectively. This results in a total angle of around -105°
from one amino acid residue to the next and ultimately leads to a right-handed helical
structure with 3.6 amino acids per turn. The α-helix is stabilized by hydrogen bridges
between one peptide group and the fourth peptide group downstream in the protein
backbone, which is located in the next turn of the helix slightly shifted (Berg et al., 2012).
The second predominant secondary structure found in proteins are β-sheets with φ and ψ
angles of -135° and 135°. This allows a concertina-like shape in long strands wherein the
hydrogen bridges form between peptide groups of neighboring strands (Berg et al., 2012).
Figure 15: Schematic and molecular representation of α-helix and β-sheet structures in the protein backbone. In a α-helix the hydrogen bridges are formed between one peptide group and the fourth downstream peptide group (A). In a beta sheet structure, hydrogen bridges are formed between the peptide groups of neighboring strands (B). Figure modified from (Berg et al., 2012).
One can envision the protein backbone as a pearl chain of small π-electron systems.
Dependent on how the chain is folded, the π-electron systems have a different orientation to
each other. This influences the ratios of left and right-handed circularly polarized light
absorbed by different conformations. Furthermore, the orientation of π-electron systems
also has an influence on inductive effects between the single systems, which influences the
energy required to excite the π-electron and thereby changes the wavelength, which is
absorbed by the system. Therefore, α-helix and β-sheet structures show different circular
dichroism spectra, which are characteristic for the respective secondary structure. Circular
dichroism spectra of a α-helix show a local maximum in ellipticity at 192 nm and two

Circular Dichroism Spectroscopy
45
separate minima at 208 and 222 nm. In contrast, circular dichroism spectra of a β-sheet
only show a maximum in ellipticity at 195 nm, a shoulder at 212 nm and a minimum at
216 nm (Berova et al., 2000).
Since most proteins contain different secondary structures, the measured circular dichroism
spectra often contain different structural signals. One also has to consider the circular
dichroism spectroscopy does not provide a measurement of the structure of a single protein
molecule, but it yields a measurement of an ensemble of many molecules of the same
protein. Hence, many algorithms have been developed to determine individual secondary
structure components from a circular dichroism spectrum. These algorithms predicted the
secondary structure from a circular dichroism spectrum based on variable selection or
singular value decomposition of reference spectra from proteins with a known structure.
However, most of these algorithms failed , which consist of a combination of α-helices and
β-sheets or have a high content of β-sheets in general. In this thesis the BeStSel web server
was used to analyze circular dichroism spectra, since it accurately distinguishes different
structural components and therefore reliably estimates the secondary structure (Micsonai et
al., 2018; Micsonai et al., 2015).
The BeStSeL web server determines secondary structure based on a circular dichroism
spectrum by fitting a linear combination of eight different basis spectra. Each basis
spectrum is representative for one secondary structure component. The basis spectra are
based on a set of 73 reference spectra of proteins with a known structure. Since these basis
spectra also contain spectra for beta sheet structures of different twists and orientations, a
more reliable structure analysis of proteins containing α-helices and β-sheets is possible. In
addition, each basis spectrum is optimized separately and combined to the fitting procedure
by a least square method. (Micsonai et al., 2018).
Solid state circular dichroism spectroscopy
In this thesis the circular dichroism of planar or fibrous fibrinogen scaffolds was measured
in a dried state. Even though circular dichroism spectroscopy is mostly used as a method
for the analysis of proteins in solution, the analysis of a protein in a solid state is also
possible like for most other spectroscopic methods (Harada and Kuroda, 2002). When
working with dried protein samples it has to be considered that the dried protein is possibly
46
not homogenously distributed. This results in turbidity and dispersion of light. In a non-
homogenous solid there is even the risk of birefringence or even macroscopic anisotropy,
which potentially results in measurement artifacts (Kuroda and Honma, 2000); (Castiglioni
et al., 2009). Some approaches in sold state circular dichroism use grinded solids in Nujol
mulls (refined mineral oil) to overcome the heterogeneity induced light dispersion effects.
However, the use of this approach leads to refraction and scattering effects at the grain
boundaries (Kuroda and Honma, 2000).
When working with solid-state samples prepared by drying, an additional challenge is the
heterogeneity in sample thickness, which makes a correct determination of the path length
difficult. In addition, heterogeneity in sample thickness can become problematic when only
a small part of the sample is scanned during circular dichroism. One method to minimize
these effects is to measure the sample in different orientation or if possible to measure
different parts of the sample (Castiglioni et al., 2009).
During the sample preparation for solid stated circular dichroism of dried proteins, the
molecules might orient during the drying process giving rise to a highly ordered structure
as compared to the randomly orientated protein molecules in solution (Kuroda and Honma,
2000). Due to the drying, the degrees of freedom of a protein molecule especially the
rotation and orientation of chemical bonds can become severely restricted. This results in
an artificial solid-state chirality of components, which are not chiral in the liquid state, and
leads to measurement artifacts. These artifacts in combination with anisotropy might also
lead to an overestimation of β-sheet structure content (Harada and Kuroda, 2002) One easy
method to exclude those artifacts is to measure the solid state sample from front and
backside (Castiglioni et al., 2009; Harada and Kuroda, 2002). Despite these challenges,
solid-state circular dichroism spectroscopy is an applied technique to measure secondary
structure of proteins. Especially for protein samples, it is advisable to measure the samples
from front and back side. Furthermore, an exact determination of sample thickness and
heterogeneity with the used concentrations is crucial (Castiglioni et al., 2009; Harada and
Kuroda, 2002). Like for any measurement technique, an additional analysis with other
methods is advisable to validate the results obtained using solid state circular dichroism
spectroscopy and allow a profound interpretation of the structural data obtained.
Methods
47
4. Methods
4.1. Preparation of fibrinogen, buffers and solutions
All aqueous buffers and solutions were prepared using deionized water from a TKA Gen
Pure water purification system (Thermo Fisher Scientific, Schwerte, Germany).
4.1.1. Buffer preparation
For self-assembly studies, different aqueous buffer systems were used. Solutions of 10 mM
NH4HCO3 (Roth, Karlsruhe, Germany), 20 mM sodium citrate (Sigma, Steinheim,
Germany), 750 mM NaCl (AppliChem, Darmstadt, Germany), 20 or 750 mM KCl (Roth,
Karlsruhe, Germany), were prepared by dissolving the desired concentration in deionized
water. In addition, solutions of 50 mM NaH2PO4 (Roth, Karlsruhe, Germany), 50 mM
Na2HPO4 (Roth, Karlsruhe, Germany), 50 mM KH2PO4 (AppliChem, Darmstadt,
Germany) and 50 mM K2HPO4 (AppliChem, Darmstadt, Germany) were prepared. Sodium
and potassium phosphate buffers were prepared by either mixing 50 mM NaH2PO4 and
50 mM Na2HPO4 solution or mixing 50 mM KH2PO4 and 50 mM K2HPO4 solution to
obtain buffers with a pH of 7.4. The pH was monitored using a pH meter (Roth, Karlsruhe,
Germany). Sodium phosphate buffers were also prepared with pH values of 5, 6, 7, 8 or 9.
Five times concentrated phosphate buffered saline (5x PBS) with pH values of 5, 6, 7, 8 or
9 was prepared by adding 700 mM of NaCl into the previously prepared sodium phosphate
buffers. To obtain 5x PBS with a pH of 7.4 commercially available PBS tablets (Thermo
Fisher, Schwerte, Germany) were used. One PBS tablet was dissolved in 100 ml of
deionized water.
HEPES buffered saline was prepared by adjusting a solution of 10 mM 2-(4-(2-
Hydroxyethyl)-1-piperazinyl)-ethansulfonsäure (HEPES; Acròs organics, New Jersey,
USA) to a pH of 7.4. 150 mM NaCl (AppliChem, Darmstadt, Germany) and 5 mM CaCl2
(Sigma, Steinheim, Germany) were added to the HEPES solution.
The buffers used for sodium dodecyl sulfate polyacrylamide gel electrophoresis (SDS
PAGE) were all purchased from Thermo Fisher (Thermo Fisher, Schwerte, Germany). The
SDS sample buffer contained 106 mM Tris HCl, 141 mM Tris Base, 2% LDS, 10%
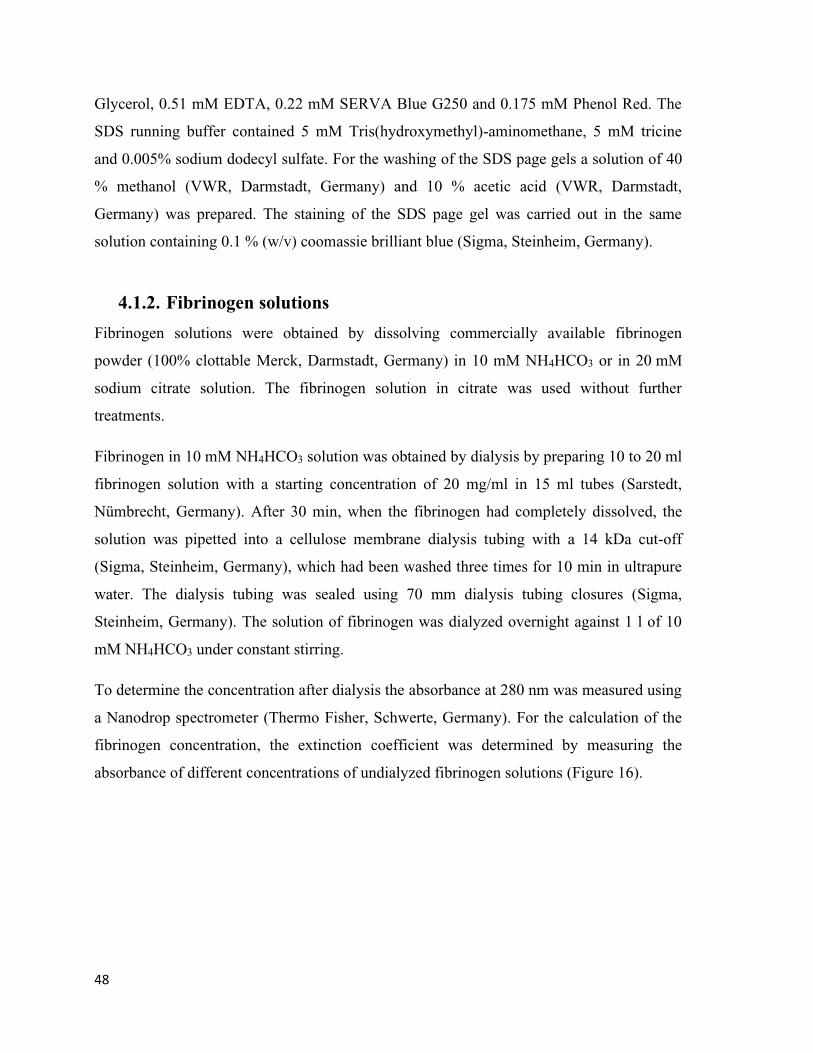
48
Glycerol, 0.51 mM EDTA, 0.22 mM SERVA Blue G250 and 0.175 mM Phenol Red. The
SDS running buffer contained 5 mM Tris(hydroxymethyl)-aminomethane, 5 mM tricine
and 0.005% sodium dodecyl sulfate. For the washing of the SDS page gels a solution of 40
% methanol (VWR, Darmstadt, Germany) and 10 % acetic acid (VWR, Darmstadt,
Germany) was prepared. The staining of the SDS page gel was carried out in the same
solution containing 0.1 % (w/v) coomassie brilliant blue (Sigma, Steinheim, Germany).
4.1.2. Fibrinogen solutions
Fibrinogen solutions were obtained by dissolving commercially available fibrinogen
powder (100% clottable Merck, Darmstadt, Germany) in 10 mM NH4HCO3 or in 20 mM
sodium citrate solution. The fibrinogen solution in citrate was used without further
treatments.
Fibrinogen in 10 mM NH4HCO3 solution was obtained by dialysis by preparing 10 to 20 ml
fibrinogen solution with a starting concentration of 20 mg/ml in 15 ml tubes (Sarstedt,
Nümbrecht, Germany). After 30 min, when the fibrinogen had completely dissolved, the
solution was pipetted into a cellulose membrane dialysis tubing with a 14 kDa cut-off
(Sigma, Steinheim, Germany), which had been washed three times for 10 min in ultrapure
water. The dialysis tubing was sealed using 70 mm dialysis tubing closures (Sigma,
Steinheim, Germany). The solution of fibrinogen was dialyzed overnight against 1 l of 10
mM NH4HCO3 under constant stirring.
To determine the concentration after dialysis the absorbance at 280 nm was measured using
a Nanodrop spectrometer (Thermo Fisher, Schwerte, Germany). For the calculation of the
fibrinogen concentration, the extinction coefficient was determined by measuring the
absorbance of different concentrations of undialyzed fibrinogen solutions (Figure 16).
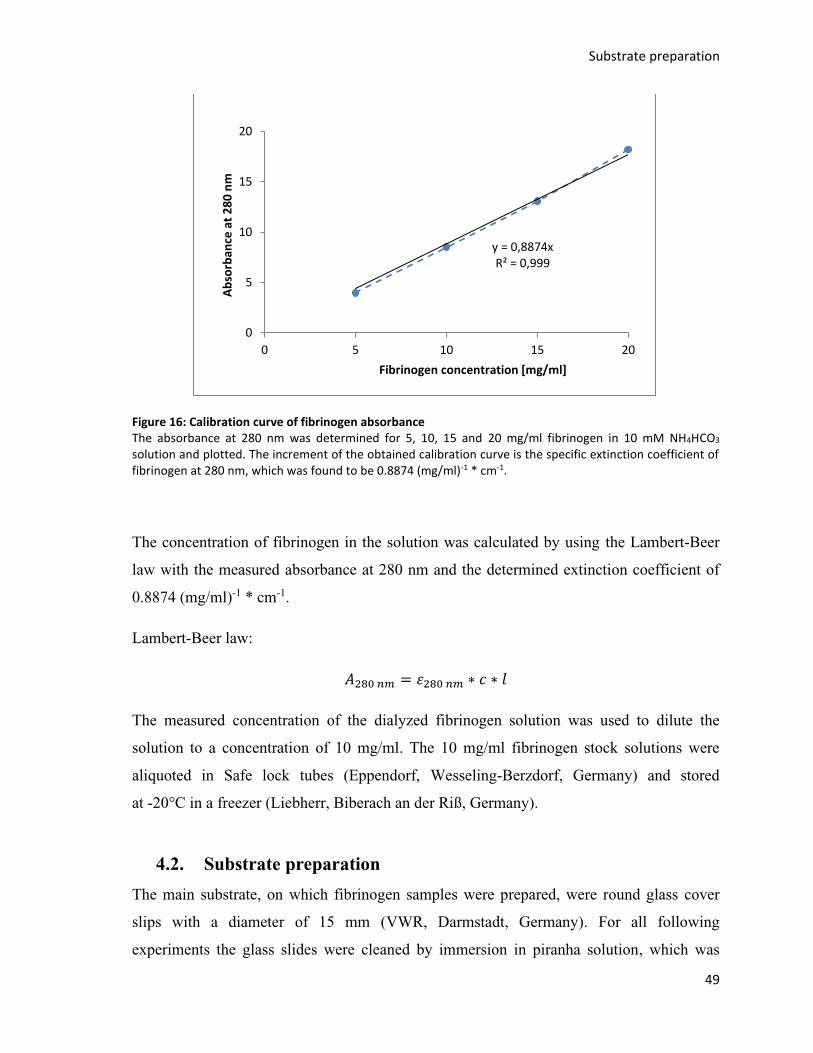
Substrate preparation
49
Figure 16: Calibration curve of fibrinogen absorbance The absorbance at 280 nm was determined for 5, 10, 15 and 20 mg/ml fibrinogen in 10 mM NH4HCO3 solution and plotted. The increment of the obtained calibration curve is the specific extinction coefficient of fibrinogen at 280 nm, which was found to be 0.8874 (mg/ml)-1 * cm-1.
The concentration of fibrinogen in the solution was calculated by using the Lambert-Beer
law with the measured absorbance at 280 nm and the determined extinction coefficient of
0.8874 (mg/ml)-1 * cm-1.
Lambert-Beer law:
𝐴280 𝑛𝑚 = 𝜀280 𝑛𝑚 ∗ 𝑐 ∗ 𝑙
The measured concentration of the dialyzed fibrinogen solution was used to dilute the
solution to a concentration of 10 mg/ml. The 10 mg/ml fibrinogen stock solutions were
aliquoted in Safe lock tubes (Eppendorf, Wesseling-Berzdorf, Germany) and stored
at -20°C in a freezer (Liebherr, Biberach an der Riß, Germany).
4.2. Substrate preparation
The main substrate, on which fibrinogen samples were prepared, were round glass cover
slips with a diameter of 15 mm (VWR, Darmstadt, Germany). For all following
experiments the glass slides were cleaned by immersion in piranha solution, which was
y = 0,8874xR² = 0,999
0
5
10
15
20
0 5 10 15 20
Ab
sorb
ance
at
28
0 n
m
Fibrinogen concentration [mg/ml]

50
freshly prepared by mixing 95% sulfuric acid (VWR, Darmstadt, Germany) with 30%
hydrogen peroxide solution (VWR, Darmstadt, Germany) in a 3:1 ratio. The glass slides
were placed in a polyoxymethylene sample holder and immersed in the priranha solution
for 5 min. Directly after cleaning in the piranha solution the samples were washed three
times with one litre of deionized water from a Genepure water purification system (Thermo
Fisher Scientific, Schwerte, Germany). The cleaned glass slides were stored in deionized
water. Directly before use, the glass slides were dried under nitrogen flow. The piranha
cleaning treatment made the glass slides highly hydrophilic, which became visible when 1
µl drop of deionized water was placed on a dried piranha cleaned slide (Figure 17).
Figure 17: Hydrophilicity of an untreated and a piranha cleaned glass slide 1 µl of deionized water was added onto an untreated or onto a piranha cleaned glass slide. On untreated glass, the drop stayed at one spot while on piranha cleaned glass the drop rapidly covers the surface as a thin layer.
For circular dichroism experiments, Suprasil quartz cuvettes (Hellma UK Ltd.) with path
lengths of 0.01, 0.1 or 0.5 mm were used as substrates. The cuvettes were cleaned in an
UV−ozone cleaner (BioForce Nanosciences Inc., Salt Lake City, United States) for 1 h.
Other substrate materials used in this thesis were: Polylactic acid (PLA) and polybutylene
adipate terephthalate (PBAT) (kindly provided by Prof. Dr. Jörg Müssig, HSB City
University of Applied Sciences, Bremen) as well as polystyrene (PS; Sarstedt, Nümbrecht,
Germany), polydimethylsiloxane (PDMS; Distrelec GmbH, Bremen, Germany and
parafilm (Thermo Fisher Scientific, Schwerte, Germany) substrates, which were directly
used without further treatment.
Assembly of fibrin and fibrinogen scaffolds
51
Surface modification of glass substrates
For some experiments the surface of glass slides was modified either by coating it with
gold or by modifying it using a silanization with (3-Aminopropyl)triethoxysilane (APTES).
Gold-coated glass slides were prepared by sputter coating untreated 15 mm diameter glass
slides in an EM ACE600 high vacuum sputter coater (Leica Microsystems, Wetzlar,
Germany) with a 5 nm adhesion layer of chromium and subsequently with 50 nm of gold.
Substrates modified with (3-Aminopropyl)triethoxysilane (APTES) were prepared by
immersion of piranha cleaned glass slides into a mixture of 5% APTES (Sigma, Steinheim,
Germany) and 95% ethanol (VWR, Darmstadt, Germany) for 16 h under constant stirring.
For this procedure a custom-made PLA glass slide holder was used, which was fabricated
using a MakerBot replicator 3D printer (MakerBot industries, New York, United States).
After modification, the substrates were washed three times in 200 ml pure ethanol and dried
for storage.
4.3. Assembly of fibrin and fibrinogen scaffolds
Fibrin samples were used as reference samples for fibrinogen self-assembly experiments
and were prepared on piranha-cleaned glass slides using NH4HCO3, phosphate buffer or
PBS by the addition of thrombin. 200 µl 10 mg/ml fibrinogen in 10 mM NH4HCO3 were
incubated with 10 U Thrombin. Additionally, 200 µl 10 mg/ml fibrinogen in 10 mM
NH4HCO3 were incubated with 10 U Thrombin in the presence of 10 mM phosphate buffer.
For thrombin incubations in the presence of PBS, 5 mg/ml fibrinogen, 5 mM NH4HCO3
and 2.5x PBS were incubated with 5 U Thrombin. The samples were incubated at 37°C on
a heating plate for 1 h and subsequently dried at room temperature.
Fibrinogen scaffolds in citrate solution were prepared by pipetting 200 µl of a 5 mg/ml
fibrinogen solution in 20 mM citrate onto a piranha cleaned glass slide and dried overnight
at ambient conditions.
All other fibrinogen samples were prepared following the routine depicted in Figure 18.
100 µl of 10 mg/ml fibrinogen in 10 mM NH4HCO3 solution were pipetted onto piranha
cleaned glass slides (Figure 18 A). In a second step, 100 µl of 5x PBS were added (Figure
18 B), which resulted in final concentrations of 5 mg/ml fibrinogen, 5 mM NH4HCO3
52
solution and 2.5x PBS before the drying procedure (Figure 18 C). For reference samples,
on which fibrinogen was dried only in the presence of NH4HCO3, 100 µl deionized water
were added during step B. This resulted in final concentrations of 5 mg/ml fibrinogen and 5
mM NH4HCO3 solution before the drying process started.
For other samples either 100 µl of 50 mM phosphate buffer or 100 µl of 5x PBS were
added, which resulted in final concentrations of 5 mg/ml fibrinogen, 5 mM NH4HCO3
solution and either 25 mM phosphate buffer or 2.5x PBS.
Figure 18: Schematic representation of the fibrinogen sample preparation with addition of PBS In a first step, fibrinogen in NH4HCO3 solution is placed on a piranha cleaned glass slide (A). In a second step, the PBS is added (B). The mix of fibrinogen, NH4HCO3 and PBS (C) is dried overnight and a fibrinogen scaffold is obtained (D).
All other fibrinogen scaffolds were prepared by variations of the standard routine shown in
Figure 18. In addition to piranha cleaned glass as a substrate, the fibrinogen samples were
also prepared on gold coated surfaces, in cleaned quartz glass cuvettes (the total sample
volume was adjusted to 40 µl), on APTES modified glass, PLA, PS, PBAT, PDMS or on
parafilm surfaces.
The fibrinogen concentration of the stock solution applied in step A was varied in a way
that final fibrinogen concentrations of 0, 1, 2, 3, 4 or 5 mg/ml were present on the sample.
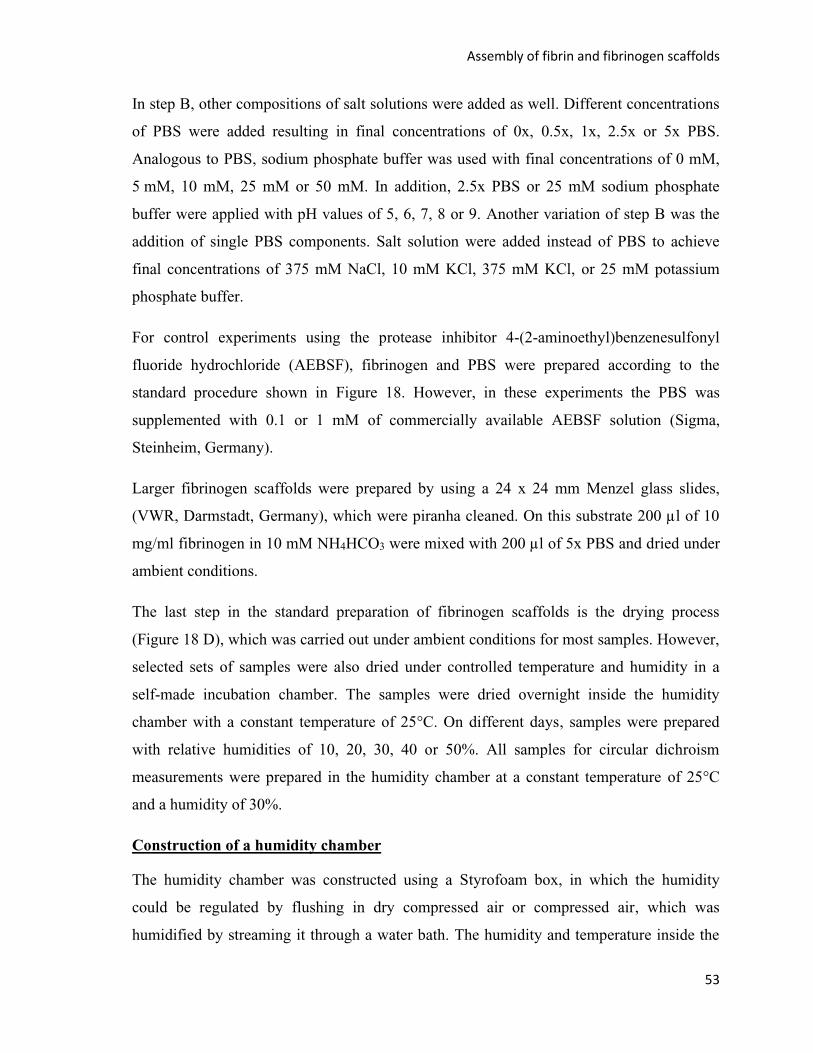
Assembly of fibrin and fibrinogen scaffolds
53
In step B, other compositions of salt solutions were added as well. Different concentrations
of PBS were added resulting in final concentrations of 0x, 0.5x, 1x, 2.5x or 5x PBS.
Analogous to PBS, sodium phosphate buffer was used with final concentrations of 0 mM,
5 mM, 10 mM, 25 mM or 50 mM. In addition, 2.5x PBS or 25 mM sodium phosphate
buffer were applied with pH values of 5, 6, 7, 8 or 9. Another variation of step B was the
addition of single PBS components. Salt solution were added instead of PBS to achieve
final concentrations of 375 mM NaCl, 10 mM KCl, 375 mM KCl, or 25 mM potassium
phosphate buffer.
For control experiments using the protease inhibitor 4-(2-aminoethyl)benzenesulfonyl
fluoride hydrochloride (AEBSF), fibrinogen and PBS were prepared according to the
standard procedure shown in Figure 18. However, in these experiments the PBS was
supplemented with 0.1 or 1 mM of commercially available AEBSF solution (Sigma,
Steinheim, Germany).
Larger fibrinogen scaffolds were prepared by using a 24 x 24 mm Menzel glass slides,
(VWR, Darmstadt, Germany), which were piranha cleaned. On this substrate 200 µl of 10
mg/ml fibrinogen in 10 mM NH4HCO3 were mixed with 200 µl of 5x PBS and dried under
ambient conditions.
The last step in the standard preparation of fibrinogen scaffolds is the drying process
(Figure 18 D), which was carried out under ambient conditions for most samples. However,
selected sets of samples were also dried under controlled temperature and humidity in a
self-made incubation chamber. The samples were dried overnight inside the humidity
chamber with a constant temperature of 25°C. On different days, samples were prepared
with relative humidities of 10, 20, 30, 40 or 50%. All samples for circular dichroism
measurements were prepared in the humidity chamber at a constant temperature of 25°C
and a humidity of 30%.
Construction of a humidity chamber
The humidity chamber was constructed using a Styrofoam box, in which the humidity
could be regulated by flushing in dry compressed air or compressed air, which was
humidified by streaming it through a water bath. The humidity and temperature inside the
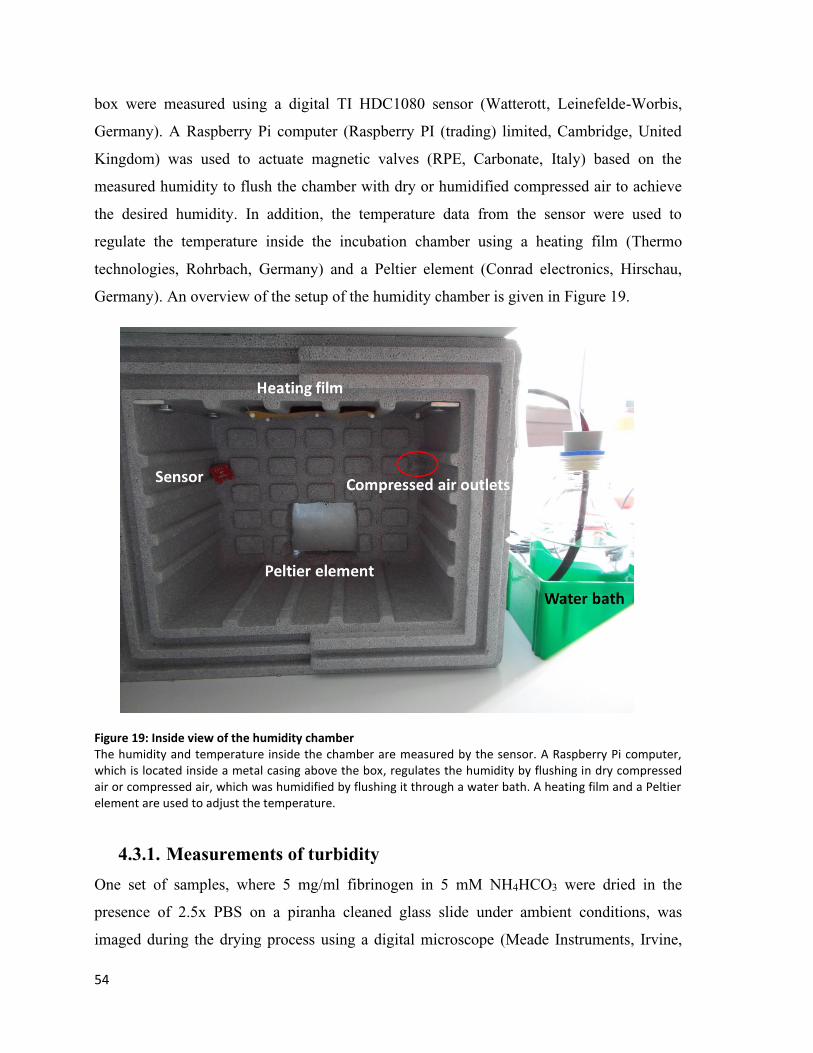
54
box were measured using a digital TI HDC1080 sensor (Watterott, Leinefelde-Worbis,
Germany). A Raspberry Pi computer (Raspberry PI (trading) limited, Cambridge, United
Kingdom) was used to actuate magnetic valves (RPE, Carbonate, Italy) based on the
measured humidity to flush the chamber with dry or humidified compressed air to achieve
the desired humidity. In addition, the temperature data from the sensor were used to
regulate the temperature inside the incubation chamber using a heating film (Thermo
technologies, Rohrbach, Germany) and a Peltier element (Conrad electronics, Hirschau,
Germany). An overview of the setup of the humidity chamber is given in Figure 19.
Figure 19: Inside view of the humidity chamber The humidity and temperature inside the chamber are measured by the sensor. A Raspberry Pi computer, which is located inside a metal casing above the box, regulates the humidity by flushing in dry compressed air or compressed air, which was humidified by flushing it through a water bath. A heating film and a Peltier element are used to adjust the temperature.
4.3.1. Measurements of turbidity
One set of samples, where 5 mg/ml fibrinogen in 5 mM NH4HCO3 were dried in the
presence of 2.5x PBS on a piranha cleaned glass slide under ambient conditions, was
imaged during the drying process using a digital microscope (Meade Instruments, Irvine,
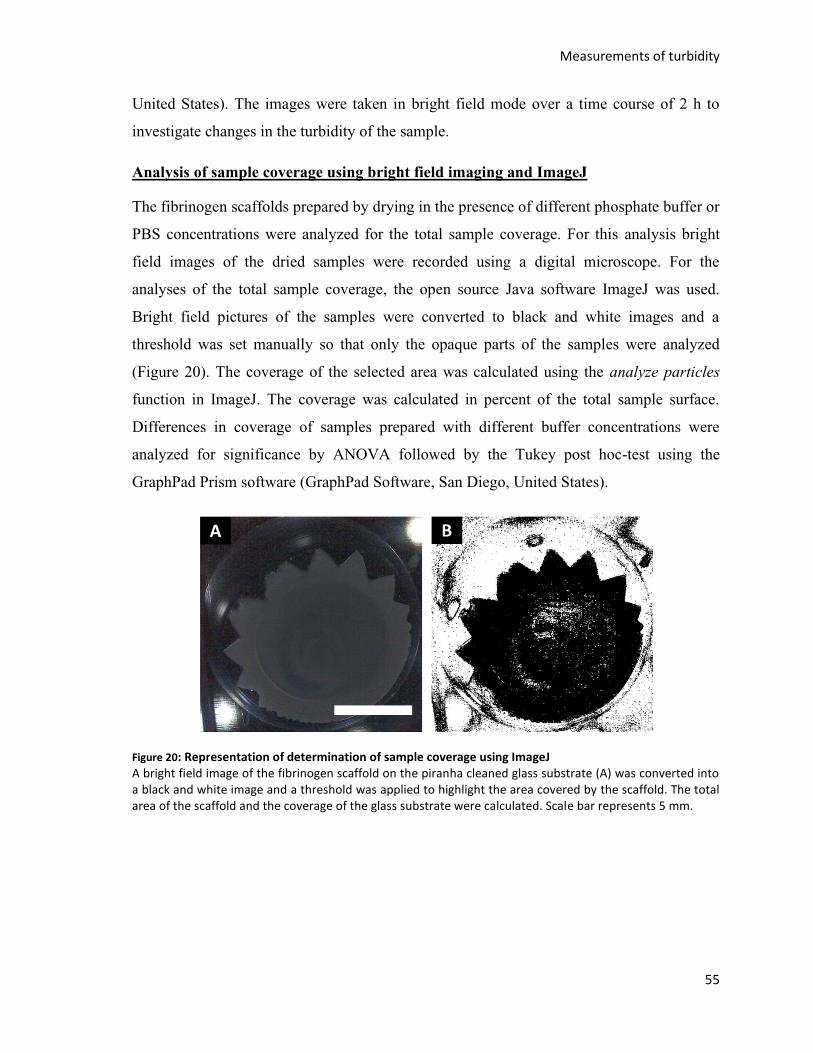
Measurements of turbidity
55
United States). The images were taken in bright field mode over a time course of 2 h to
investigate changes in the turbidity of the sample.
Analysis of sample coverage using bright field imaging and ImageJ
The fibrinogen scaffolds prepared by drying in the presence of different phosphate buffer or
PBS concentrations were analyzed for the total sample coverage. For this analysis bright
field images of the dried samples were recorded using a digital microscope. For the
analyses of the total sample coverage, the open source Java software ImageJ was used.
Bright field pictures of the samples were converted to black and white images and a
threshold was set manually so that only the opaque parts of the samples were analyzed
(Figure 20). The coverage of the selected area was calculated using the analyze particles
function in ImageJ. The coverage was calculated in percent of the total sample surface.
Differences in coverage of samples prepared with different buffer concentrations were
analyzed for significance by ANOVA followed by the Tukey post hoc-test using the
GraphPad Prism software (GraphPad Software, San Diego, United States).
Figure 20: Representation of determination of sample coverage using ImageJ A bright field image of the fibrinogen scaffold on the piranha cleaned glass substrate (A) was converted into a black and white image and a threshold was applied to highlight the area covered by the scaffold. The total area of the scaffold and the coverage of the glass substrate were calculated. Scale bar represents 5 mm.

56
4.4. Stabilization and crosslinking of fibrinogen samples
Stabilization of fibrinogen scaffolds
Three different approaches were investigated to further increase the resistance of the
fibrinogen scaffolds to hydrolysis in aqueous environment. For a treatment with methanol
vapor, the samples were incubated overnight in a methanol (VWR, Darmstadt, Germany)
vapor atmosphere. The methanol vapor atmosphere was generated by putting the sample in
a beaker and adding a petri dish filled with 1 µl of methanol per cm3 of beaker volume. The
beaker was sealed using parafilm and kept at room temperature overnight, which allowed
methanol to evaporate and generate a methanol-saturated atmosphere inside of the sealed
beaker. The other two stabilization approaches were UV treatment and UV treatment in the
presence of riboflavin. Samples for UV treatment in the presence of riboflavin were
prepared with PBS, which contained 2 mM riboflavin (Sigma, Steinheim, Germany). Both
types of samples were exposed to UV light generated by an UV lamp (MS Laborgeräte,
Heidelberg Germany) for 1 h.
Crosslinking of fibrinogen scaffolds
Seven different crosslinking approaches were tested for the potential to increase the
stability of fibrinogen scaffolds and will be described in detail below. The tested
crosslinking procedures were transglutaminase treatment, EDC crosslinking (1-Ethyl-3-(3-
dimethylaminopropyl)carbodiimide), genipin crosslinking as well as crosslinking in liquid
glutaraldehyde or glutaraldehyde vapor and crosslinking in liquid formaldehyde or
formaldehyde vapor. All crosslinking methods link fibrinogen molecules by covalent
bonds, but the functional groups, which are crosslinked, and the crosslinking reactions are
different. Therefore, the mechanisms of the applied crosslinking reactions are demonstrated
in Figure 21.
Stabilization and crosslinking of fibrinogen samples
57
Figure 21: Reaction mechanisms of different crosslinking agents A: A glutamine and a lysine residue can be crosslinked by the enzyme transglutaminase, which results in an isopeptide bond. The transglutaminase itself is not integrated in the crosslinked structure. B: A glutamic acid residue and a lysine residue can be crosslinked by 1-Ethyl-3-(3-dimethylaminopropyl)carbodiimid (EDC), which results in an isopeptide bond. The EDC itself is not integrated in the crosslinked structure. C: Two lysine residues can react with different groups of one genipin molecule. This reaction covalently links the lysine residue via a genipin bridge. D: Two lysine residues can react with the two aldehyde groups of one glutaraldehyde molecule. This reaction covalently links the lysine residues via a di-ketobuthylene bridge. E: Two lysine residues can successively react with the aldehyde group of one formaldehyde molecule and the resulting imine group. This reaction covalently links the lysine residues via a methylene bridge.
For transglutaminase crosslinking 200 µl of 5 U/ml transglutaminase (Thermo Fisher
Scientific, Schwerte, Germany) in PBS were pipetted onto the fibrinogen scaffolds and
incubated for 1 h at 37°C on a heating plate (IKA, Staufen, Germany). After the incubation,
the transglutaminase solution was carefully removed and the samples were dried under
ambient conditions.
For EDC crosslinking 200 µl 50 mM 1-Ethyl-3-(3 dimethylaminopropyl)carbodiimid
(Sigma, Steinheim, Germany) in deionized water were added to the fibrinogen scaffolds for

58
30 min. The crosslinking solution was carefully removed and the samples were dried in
ambient conditions.
For genipin crosslinking. the dried scaffolds were incubated for 1 h in 200 µl 30 mM
genipin (Sigma, Steinheim, Germany). The crosslinking solution was carefully removed
and the samples were dried in ambient conditions.
An approach based on glutaraldehyde solution and a glutaraldehyde vapor crosslinking
were used. For glutaraldehyde solution crosslinking the dried fibrinogen scaffolds were
exposed to 200 µl of an aqueous solution of 2% glutaraldehyde (AppliChem, Darmstadt,
Germany) for 30 min. The crosslinking solution was carefully removed and the samples
were dried in ambient conditions. For glutaraldehyde vapor crosslinking, the samples were
placed in a beaker together with a petri dish filled with 1 µl of 50% glutaraldehyde solution
per cm3 of beaker volume. The beaker was sealed with parafilm and the samples were
incubated overnight in the glutaraldehyde vapor atmosphere.
Formaldehyde crosslinking was tested similarly in a solution-based and a vapor-based
crosslinking approach. For formaldehyde solution crosslinking, the dried fibrinogen
scaffolds were exposed to 200 µl of an aqueous solution of 4% formaldehyde (AppliChem,
Darmstadt, Germany) for 30 min. The crosslinking solution was carefully removed and the
samples were dried in ambient conditions. For formaldehyde vapor crosslinking, the
samples were placed in a beaker together with a petri dish filled with 1 µl of 37%
formaldehyde solution per cm3 of beaker volume. The beaker was sealed with parafilm and
the samples were incubated overnight in the formaldehyde vapor atmosphere.
4.4.1. Washing and detachment of fibrinogen scaffolds
Fibrinogen scaffolds prepared without stabilization treatment or crosslinking were either
washed twice in 200 µl of deionized water or washed one time in 10 mM NH4HCO3 or
PBS. The supernatant was carefully pipetted of the samples after 5 min of washing. The
samples were subsequently dried in ambient conditions. The fibrinogen scaffolds that were
used for stabilization treatments were washed for 5 min using 200 µl of ultrapure water.
After washing, the samples were dried in ambient conditions.
Scanning electron microscopy
59
Fibrinogen scaffolds crosslinked by the described procedures were carefully washed three
times with 2 ml of deionized water for 5 min. Some of the samples partially detached
during the washing procedure and it was taken care that the detached parts remained on the
sample while pipetting off the washing fractions. All samples were subsequently dried
under ambient conditions. For some formaldehyde crosslinked samples, the detachment
was investigated by washing vigorously three times with 2 ml of deionized water until the
fibrinogen scaffold had completely detached. For the detachment experiments, scaffolds
crosslinked on piranha cleaned glass slides and on APTES modified glass slides were used.
4.5. Scanning electron microscopy
To analyze the morphology of dried fibrinogen scaffolds SEM analysis was carried out.
Samples for top view SEM analysis were mounted on a flat SEM holder. Before imaging in
the SEM, all samples were sputter coated with a 7 nm gold layer in a Bal-Tec SCD 005
sputtering system (Leica Microsystems, Wetzlar, Germany). The sputtered samples were
analyzed in a Zeiss Auriga field emission device (Carl Zeiss, Oberkochen, Germany) using
acceleration voltage of 3 kV and the SE2 detector for imaging.
In addition to the SEM top view analysis, cross-sections of samples were imaged. The
cross-sections were prepared by carefully fixating the samples in a pair of forceps and
scratching the backside of the glass substrate using a diamond cutter. The glass was broken
with a pair of forceps while avoiding compression of the fibrinogen scaffold on the top of
the glass substrate. The broken substrates were fixated in a 90° angle on a SEM holder and
the cross-section was also sputtered with a 7 nm gold layer in a Bal-Tec SCD 005
sputtering system. SEM imaging of the samples was carried out using the SE2 detector and
acceleration voltage of 3 kV. The scaffold thickness was analyzed on three independently
prepared cross-section samples using ImageJ. For each sample, five images of cross-
sections were measured at five different positions of each image.
Calculation fiber diameter using Image J
From the SEM images, the fiber thickness was calculated using the open source software
ImageJ with the BoneJ plugin. The SEM images were cropped to exclude areas, which
showed large agglomerations of fibers. A threshold was manually set to highlight the fibers.
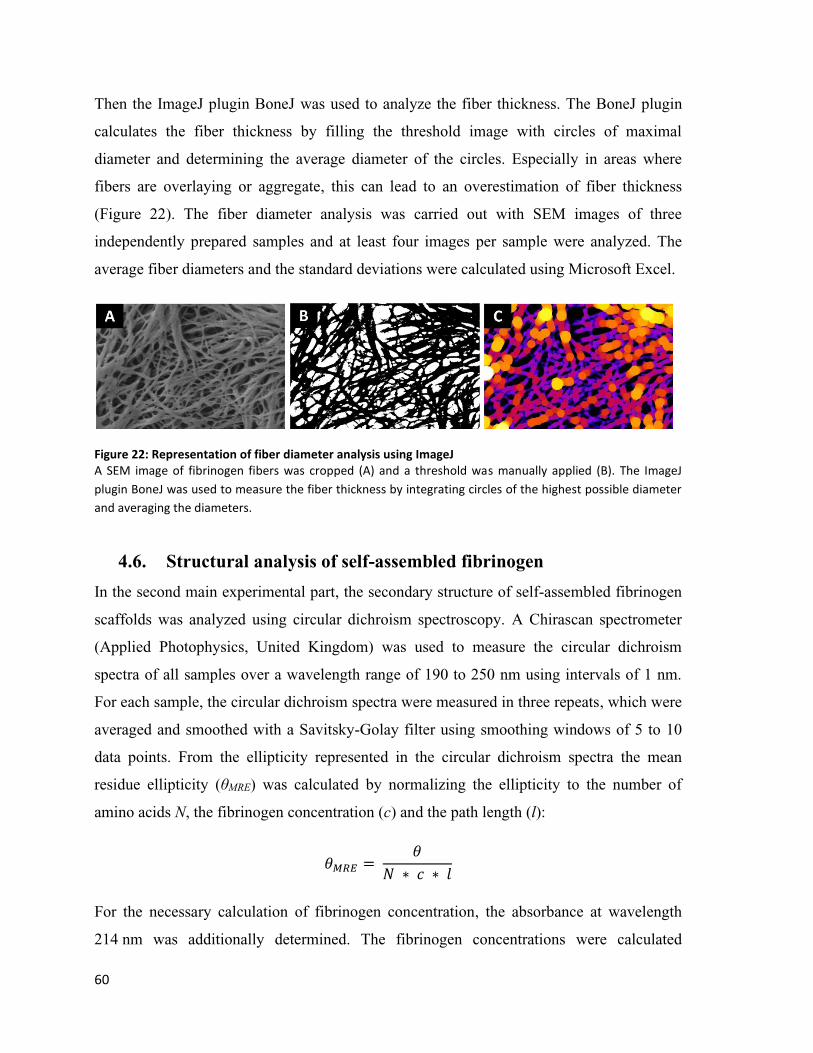
60
Then the ImageJ plugin BoneJ was used to analyze the fiber thickness. The BoneJ plugin
calculates the fiber thickness by filling the threshold image with circles of maximal
diameter and determining the average diameter of the circles. Especially in areas where
fibers are overlaying or aggregate, this can lead to an overestimation of fiber thickness
(Figure 22). The fiber diameter analysis was carried out with SEM images of three
independently prepared samples and at least four images per sample were analyzed. The
average fiber diameters and the standard deviations were calculated using Microsoft Excel.
Figure 22: Representation of fiber diameter analysis using ImageJ A SEM image of fibrinogen fibers was cropped (A) and a threshold was manually applied (B). The ImageJ
plugin BoneJ was used to measure the fiber thickness by integrating circles of the highest possible diameter
and averaging the diameters.
4.6. Structural analysis of self-assembled fibrinogen
In the second main experimental part, the secondary structure of self-assembled fibrinogen
scaffolds was analyzed using circular dichroism spectroscopy. A Chirascan spectrometer
(Applied Photophysics, United Kingdom) was used to measure the circular dichroism
spectra of all samples over a wavelength range of 190 to 250 nm using intervals of 1 nm.
For each sample, the circular dichroism spectra were measured in three repeats, which were
averaged and smoothed with a Savitsky-Golay filter using smoothing windows of 5 to 10
data points. From the ellipticity represented in the circular dichroism spectra the mean
residue ellipticity (θMRE) was calculated by normalizing the ellipticity to the number of
amino acids N, the fibrinogen concentration (c) and the path length (l):
𝜃𝑀𝑅𝐸 = 𝜃
𝑁 ∗ 𝑐 ∗ 𝑙
For the necessary calculation of fibrinogen concentration, the absorbance at wavelength
214 nm was additionally determined. The fibrinogen concentrations were calculated
Circular dichroism measurements of fibrinogen solution and fibrin
61
according to the method described by (Kuipers and Gruppen, 2007). Some samples were
measured in a liquid state while the main fibrinogen scaffold samples were measured dry
using solid-state circular dichroism spectroscopy. The calculation of the used extinction
coefficients and the path length for solid-state samples will be introduced in the next
section. For samples, which were measured in liquid, the path lengths of the respective
cuvettes were used.
4.6.1. Circular dichroism measurements of fibrinogen solution and
fibrin
To gain a first understanding of the secondary structure the circular dichroism spectrum of
fibrinogen in solution was recorded. 10 µl of 5 mg/ml fibrinogen in 5 mM NH4HCO3
solution were measured in a 0.01 mm path length cuvette. After baseline correction for the
5 mM NH4HCO3 solution, the mean residue ellipticity of fibrinogen was calculated from
the averaged circular dichroism spectra obtained in three independent experiments.
For comparison, the circular dichroism spectrum of fibrin was recorded. The fibrin
hydrogel was directly prepared in a 0.01 mm cuvette by incubating 5 mg/ml fibrinogen in 5
mM NH4HCO3 solution in the presence of 25 U/ml thrombin for 15 min at room
temperature. Since the cleaved fibrinopetides A and B and the thrombin were still present
in the formed fibrin, the circular dichroism spectrum of fibrin also had to be corrected for
the signal generated by fibrinopeptides A and B as well as thrombin. The circular dichroism
spectra of 14 mM fibrinopeptide A or 14 mM fibrinopeptide B in 5 mM NH4HCO3 were
both measured in 0.5 mm path length cuvettes. The spectrum of thrombin was measured
with 25 U/ml thrombin in 5 mM NH4HCO3 in a 0.1 mm path length cuvette (Figure 23).

62
Figure 23: Circular dichroism spectra of fibrinopeptides and thrombin The spectra of 14 mM fibrinopeptide A (FPA) or 14 mM fibrinopeptide B (FPB) in 5 mM NH4HCO3 were both measured in 0.5 mm path length cuvettes. The spectrum of thrombin was measured with 25 U/ml thrombin in 5 mM NH4HCO3 in a 0.1 mm path length cuvette. The graph has been published in the supplementary information of (Stapelfeldt et al., 2019b).
With the data obtained for thrombin and the fibrinopeptides, the fibrin spectrum was
corrected and the mean residue ellipticity of fibrin was calculated from the averaged
circular dichroism spectra obtained in three independent experiments.
Both the mean residue ellipticity of fibrinogen in solution and fibrin were analyzed for the
content of secondary structure motives using the BeStSel web server (Micsonai et al., 2018;
Micsonai et al., 2015). The secondary structure motives were summed up in α-helical
structure and β-sheet structure. All other secondary structure motives were categorized as
other.
4.6.2. Circular dichroism measurements of dried fibrinogen scaffolds
The circular dichroism spectra of fibrinogen scaffolds prepared with different
concentrations, pH values or humidities were analyzed in a dried state. In order to calculate
the mean residue ellipticity, the fibrinogen concentration had to be determined. Therefore,
the extinction coefficient and the path length of the dried samples are required. Using the
experimentally determined extinction coefficients and the path lengths described in the
following, the mean residue ellipticity of the dried samples was calculated. For each
investigated parameter, the circular dichroism spectra obtained in three independent
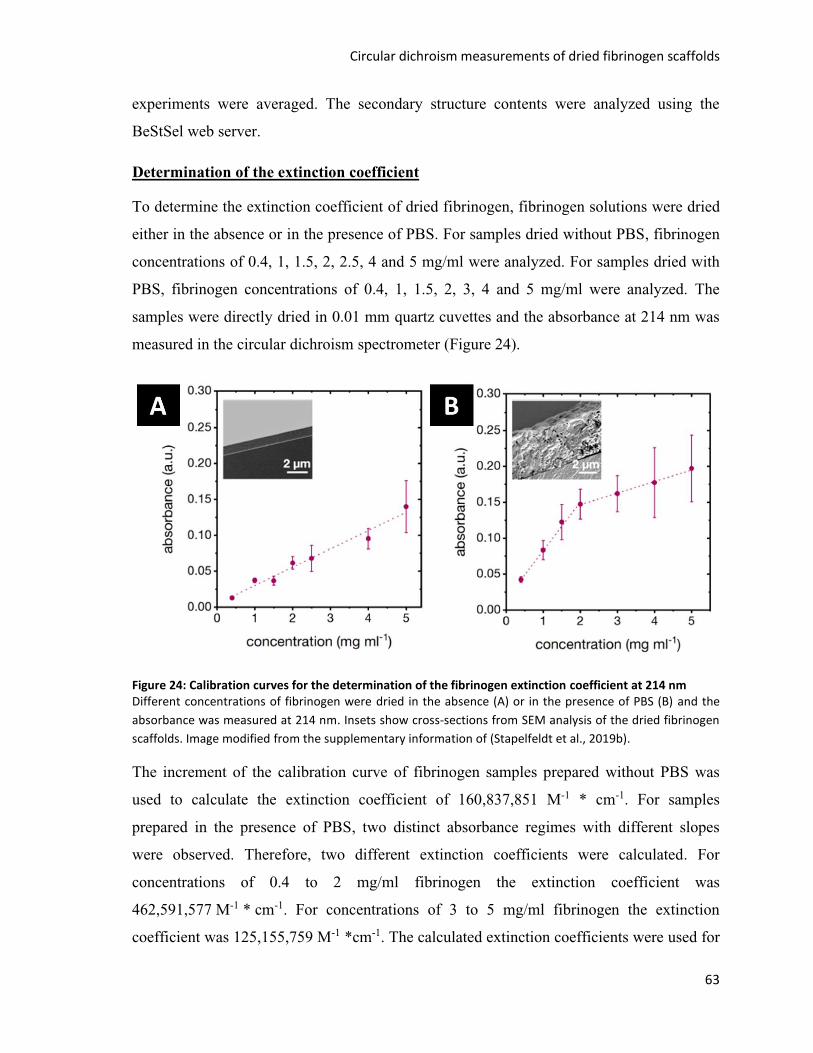
Circular dichroism measurements of dried fibrinogen scaffolds
63
experiments were averaged. The secondary structure contents were analyzed using the
BeStSel web server.
Determination of the extinction coefficient
To determine the extinction coefficient of dried fibrinogen, fibrinogen solutions were dried
either in the absence or in the presence of PBS. For samples dried without PBS, fibrinogen
concentrations of 0.4, 1, 1.5, 2, 2.5, 4 and 5 mg/ml were analyzed. For samples dried with
PBS, fibrinogen concentrations of 0.4, 1, 1.5, 2, 3, 4 and 5 mg/ml were analyzed. The
samples were directly dried in 0.01 mm quartz cuvettes and the absorbance at 214 nm was
measured in the circular dichroism spectrometer (Figure 24).
Figure 24: Calibration curves for the determination of the fibrinogen extinction coefficient at 214 nm Different concentrations of fibrinogen were dried in the absence (A) or in the presence of PBS (B) and the
absorbance was measured at 214 nm. Insets show cross-sections from SEM analysis of the dried fibrinogen
scaffolds. Image modified from the supplementary information of (Stapelfeldt et al., 2019b).
The increment of the calibration curve of fibrinogen samples prepared without PBS was
used to calculate the extinction coefficient of 160,837,851 M-1 * cm-1. For samples
prepared in the presence of PBS, two distinct absorbance regimes with different slopes
were observed. Therefore, two different extinction coefficients were calculated. For
concentrations of 0.4 to 2 mg/ml fibrinogen the extinction coefficient was
462,591,577 M-1 * cm-1. For concentrations of 3 to 5 mg/ml fibrinogen the extinction
coefficient was 125,155,759 M-1 *cm-1. The calculated extinction coefficients were used for
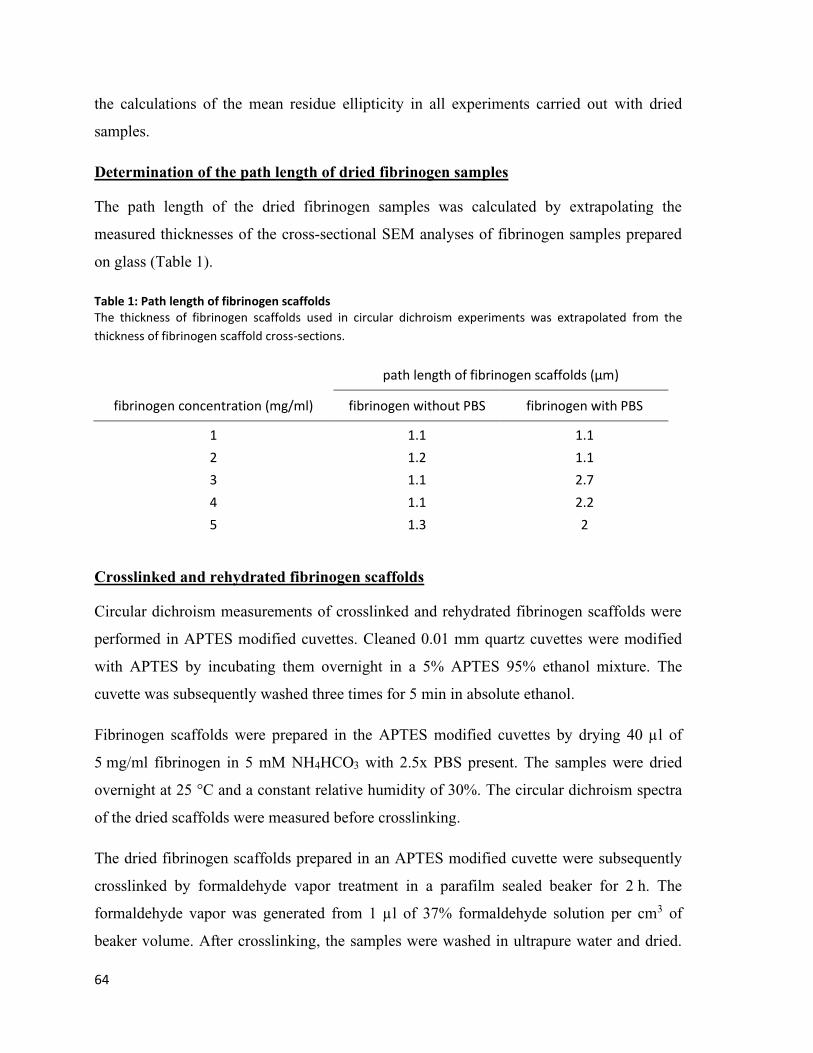
64
the calculations of the mean residue ellipticity in all experiments carried out with dried
samples.
Determination of the path length of dried fibrinogen samples
The path length of the dried fibrinogen samples was calculated by extrapolating the
measured thicknesses of the cross-sectional SEM analyses of fibrinogen samples prepared
on glass (Table 1).
Table 1: Path length of fibrinogen scaffolds The thickness of fibrinogen scaffolds used in circular dichroism experiments was extrapolated from the
thickness of fibrinogen scaffold cross-sections.
path length of fibrinogen scaffolds (µm)
fibrinogen concentration (mg/ml) fibrinogen without PBS fibrinogen with PBS
1 1.1 1.1
2 1.2 1.1
3 1.1 2.7
4 1.1 2.2
5 1.3 2
Crosslinked and rehydrated fibrinogen scaffolds
Circular dichroism measurements of crosslinked and rehydrated fibrinogen scaffolds were
performed in APTES modified cuvettes. Cleaned 0.01 mm quartz cuvettes were modified
with APTES by incubating them overnight in a 5% APTES 95% ethanol mixture. The
cuvette was subsequently washed three times for 5 min in absolute ethanol.
Fibrinogen scaffolds were prepared in the APTES modified cuvettes by drying 40 µl of
5 mg/ml fibrinogen in 5 mM NH4HCO3 with 2.5x PBS present. The samples were dried
overnight at 25 °C and a constant relative humidity of 30%. The circular dichroism spectra
of the dried scaffolds were measured before crosslinking.
The dried fibrinogen scaffolds prepared in an APTES modified cuvette were subsequently
crosslinked by formaldehyde vapor treatment in a parafilm sealed beaker for 2 h. The
formaldehyde vapor was generated from 1 µl of 37% formaldehyde solution per cm3 of
beaker volume. After crosslinking, the samples were washed in ultrapure water and dried.
Long-term degradation of self-assembled fibrinogen scaffolds
65
The circular dichroism spectra of the dried and crosslinked samples were measured.
Additionally, crosslinked and washed samples were measured in a rehydrated state where
40 µl of deionized water were added to the cuvette before closing it and measuring the
circular dichroism spectrum.
For the samples prepared on APTES, the crosslinked samples or the crosslinked and
rehydrated samples, the mean residue ellipticity was calculated from the averaged circular
dichroism spectra obtained in three independent experiments. The extinction coefficients
and the path lengths determined in the previous sections were used. The secondary
structure contents were calculated using the BeStSel web server.
4.7. Long-term degradation of self-assembled fibrinogen scaffolds
In the third main experimental part of this thesis, the long-term degradation of fibrinogen
scaffolds was studied. In addition to the degradation in aqueous solution, the degradation of
fibrinogen scaffolds was analyzed in the presence of the enzymes thrombin, plasmin or
urokinase. The fibrinogen degradation potential of the enzymes was analyzed in solution
before the enzymes were used for long-term degradation experiments on crosslinked
fibrinogen scaffolds.
4.7.1. Enzymatic degradation of fibrinogen in solution
Solutions of 1 mg/ml fibrinogen were incubated overnight at 37°C either in DMEM
(Dulbecco’s Modified Eagle’s Medium; Sigma, Steinheim, Germany) or in HEPES
buffered saline. Either no enzyme was present during the incubation or 0.01 U/ml plasmin
(Sigma, Steinheim, Germany), 1 µg/ml urokinase (Merck, Darmstadt, Germany) or a
combination of 0.01 U/ml plasmin and 1 µg/ml urokinase were applied. After incubation,
the samples were analyzed using gel electrophoresis. The degradation of fibrinogen by
plasmin was reported by (Pizzo et al., 1972), while urkinase was described as an activator
of plasminogen (Blasi et al., 1987).

66
Gel electrophoresis
The enzymatically digested samples were analyzed using sodium dodecyl sulfate
polyacrylamide gel electrophoresis (SDS PAGE). 18 µl of each sample were mixed with
5 µl of SDS sample buffer and heated to 70°C for 10 min. After the heating, the samples
and pre-stained protein standard were loaded onto a precast Nupage tris acetate gel
(Thermo Fisher Scientific, Schwerte, Germany). The gel ran at 150 V (Consort nv,
Turnhout, Belgium) for 1 h in a gel chamber filled with SDS running buffer. After
electrophoresis, the protein bands within the gel were stained in coomassie solution (Sigma,
Steinheim, Germany) on a shaker for 1 h. The gels were washed twice in a solution of 40%
methanol, 10% acetic acid and 50% deionized water without coomassie for 1 h,
subsequently. In a final washing step the gels were washed with deionized water for 1 h.
Long-term degradation of fibrinogen scaffolds
Fibrinogen scaffolds were prepared by drying 200 µl of 5 mg/ml fibrinogen in 5 mM
NH4HCO3 solution either in the absence or presence of 2.5x PBS on APTES modified glass
slides. The drying was carried out overnight at 25°C and a constant relative humidity of
30%. The samples were crosslinked in formaldehyde vapor in a parafilm sealed beaker. The
formaldehyde vapor was generated from 1 µl of 37% formaldehyde solution per cm3 of
beaker volume. One set of samples was crosslinked for 1 h, while a second set of samples
was crosslinked for 2 h. After crosslinking, the samples were washed four times in 500 ml
deionized water for 15 min. The samples were sterilized using the UV light of a sterile
bench (MS Laborgeräte, Heidelberg Germany) for 15 min.
Solutions of 1 U/ml thrombin, 0.01 U/ml plasmin or a combination of 0.01 U/ml plasmin
with 1 µg/ml urokinase were prepared in HEPES buffered saline. All enzyme solutions and
HEPES buffered saline without any enzymes were sterile filtrated using a Millipore syringe
filter (Merck, Darmstadt, Germany).
For each enzyme three samples were placed in individual wells of a 12-well plate (Greiner
Bio-One, Frickenhausen, Germany) and 2 ml of enzyme solution per sample were added.
Plates were kept at 37°C in an incubator (Heracell, Thermo Fisher Scientific, Schwerte,
Germany) for 35 days. Every 7 days 20 µl were taken out for further analysis. The
concentrations of fibrinogen, which had been released into the supernatant, were measured
Binding of fibrinogen and heparin to self-assembled fibrinogen scaffolds
67
using a Nanodrop spectrometer at a wavelength of 280 nm the same day the samples were
taken. The concentrations were calculated using Lambert Beers law and the determined
extinction coefficient of fibrinogen like described above. To calculate the total amount of
fibrinogen released into the supernatant, the exact volume of supernatant on the sampling
day has to be known. Therefore, evaporation controls were prepared by incubating 2 ml of
HEPES buffered saline in the incubator and measuring the volume on each sampling day.
With the volume and the determined concentration, the total amount of fibrinogen was
calculated. For treatments in HEPES buffered saline with thrombin, plasmin or a
combination of plasmin and urokinase the experiment was independently repeated three
times. After 35 days of incubation, the samples were dried in ambient conditions and the
morphology was analyzed in the SEM like described above.
4.8. Binding of fibrinogen and heparin to self-assembled fibrinogen
scaffolds
To investigate the binding affinities of fibrinogen and heparin to crosslinked fibrinogen
scaffolds, fibrinogen and heparin were fluorescently labeled using Alexa 488 NHS-ester
(Sigma, Steinheim, Germany). 30 μl of 5 mM Alexa 488 NHS-ester were added to 5 ml of
1 mg/ml fibrinogen or 1 mg/ml heparin (Sigma, Steinheim, Germany) in 10 mM NH4HCO3
solution and incubated for 1 h in the dark at room temperature. To remove unbound
Alexa 448 dye the samples were dialyzed using cellulose membrane tubing with a 14 kDa
cut-off, which had been washed three times for 10 min in ultrapure water. The dialysis
tubing was sealed using 70 mm dialysis tubing closures. The solutions of fibrinogen were
dialyzed two times overnight against 1 l of 10 mM NH4HCO3.
Fibrinogen scaffolds for the binding experiment were prepared like described above. 200 µl
of 5 mg/ml fibrinogen in 5 mM NH4HCO3 solution were dried on APTES modified glass
slides either in the absence or the presence of 2.5x PBS. For comparison, samples with
bovine serum albumin (BSA, Sigma, Steinheim, Germany) were prepared similarly. 200 µl
of 5 mg/ml BSA in 5 mM NH4HCO3 solution were dried on APTES modified glass slides
either in the absence or the presence of 2.5x PBS. The samples were dried overnight at a
temperature of 25°C and a constant relative humidity of 30%. After drying, the samples
were crosslinked in formaldehyde vapor in a parafilm sealed beaker for 1 h. The
68
formaldehyde vapor was generated from 1 µl of 37% formaldehyde solution per cm3 of
beaker volume. After crosslinking, the samples were washed four times in 500 ml
deionized water for 15 min. In addition, the binding experiment was also carried out on
APTES modified glass slides without any protein scaffolds. The APTES controls were not
crosslinked.
For the binding experiment 200 µl of the 7 µg/ml Alexa 488 labeled fibrinogen solution or
70 µg/ml Alexa 488 labeled heparin solution were pipetted onto the samples. The samples
were incubated for 1 h at ambient conditions in the dark. After the incubation, the
supernatant was harvested and the samples were washed with 200 µl 10 mM NH4HCO3 for
1 h. The washing fractions were collected. The fluorescence intensity of the fibrinogen and
heparin stock solutions, the intensity of the incubation fractions and the intensity of the
washing fractions were measured in a LS 50 fluorimeter (Perkin Elmer, Hamburg,
Germany). Excitation wavelengths of 490 nm were used and the emission was measured at
a wavelength of 525 nm.

Results
69
5. Results
Since fibrinogen nanofibers are promising biomaterials for wound healing and tissue
engineering applications, a number of techniques have been described to produce fibers out
of fibrinogen including some approaches utilizing self-assembly. The aim of this thesis was
to study the self-assembly during drying in the presence of ions in order to understand the
self-assembly mechanism leading to the formation of fibrinogen fibers. Scanning electron
microscopy was used to characterize the morphology of the fibrinogen scaffolds prepared
under different parameters that allow conclusions about the mechanism of self-assembly.
In a second main part, the changes in secondary structure, which accompanied self-
assembly were studied using circular dichroism. The structural analysis provides additional
insight into the mechanism of fibrinogen self-assembly as well as a first indication of the
biological activity.
The biological activity of self-assembled fibrinogen was further investigated in the third
main part of this thesis, by binding experiments as well as an analysis of the enzymatic
long-term degradation.
5.1. Morphology of self-assembled fibrinogen scaffolds
In the first set of experiments of this thesis, fibrinogen the self-assembly of fibrinogen was
investigated by analyzing the morphology of fibrinogen dried under various conditions by
SEM. The first observation of a fibrinogen self-assembly was made, when 5 mg/ml
fibrinogen in 20 mM sodium citrate buffer with a pH of 9 were dried on a piranha cleaned
glass slide. SEM analysis revealed that on some parts of the samples fibrinogen nanofibers
had formed. The fibrinogen fibers were mainly found at the edges of a ring of the dried
citrate (Figure 25).
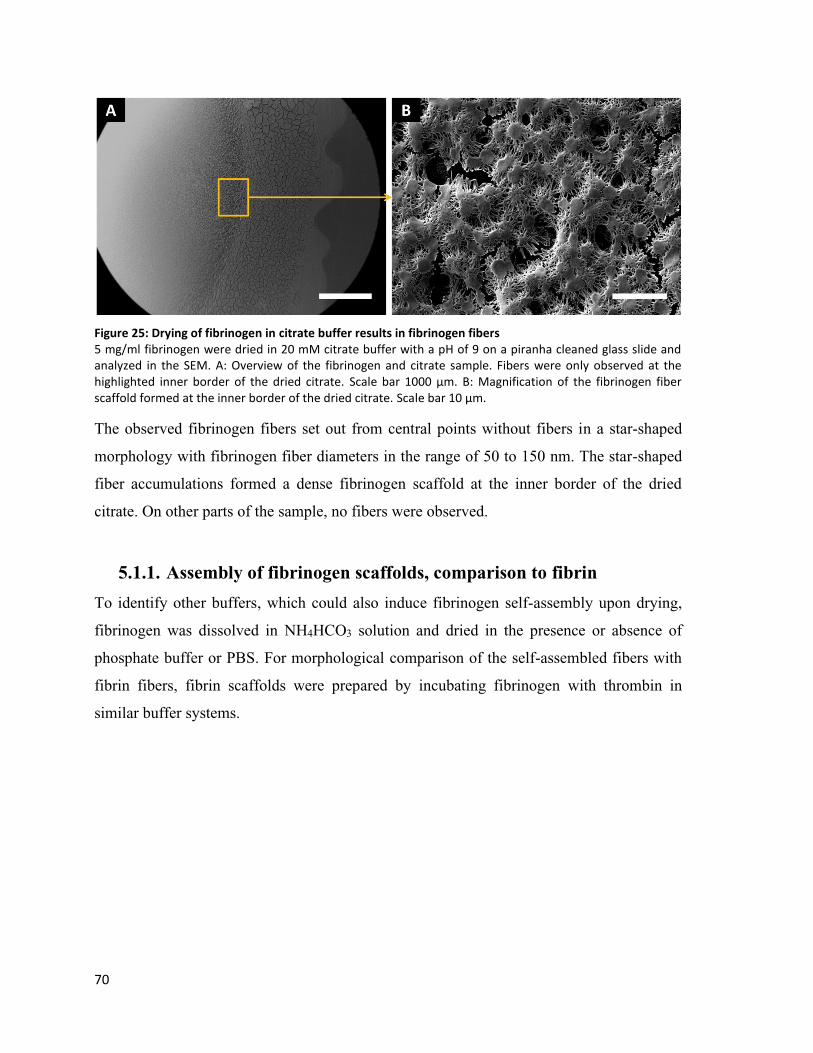
70
Figure 25: Drying of fibrinogen in citrate buffer results in fibrinogen fibers 5 mg/ml fibrinogen were dried in 20 mM citrate buffer with a pH of 9 on a piranha cleaned glass slide and analyzed in the SEM. A: Overview of the fibrinogen and citrate sample. Fibers were only observed at the highlighted inner border of the dried citrate. Scale bar 1000 µm. B: Magnification of the fibrinogen fiber scaffold formed at the inner border of the dried citrate. Scale bar 10 µm.
The observed fibrinogen fibers set out from central points without fibers in a star-shaped
morphology with fibrinogen fiber diameters in the range of 50 to 150 nm. The star-shaped
fiber accumulations formed a dense fibrinogen scaffold at the inner border of the dried
citrate. On other parts of the sample, no fibers were observed.
5.1.1. Assembly of fibrinogen scaffolds, comparison to fibrin
To identify other buffers, which could also induce fibrinogen self-assembly upon drying,
fibrinogen was dissolved in NH4HCO3 solution and dried in the presence or absence of
phosphate buffer or PBS. For morphological comparison of the self-assembled fibers with
fibrin fibers, fibrin scaffolds were prepared by incubating fibrinogen with thrombin in
similar buffer systems.

Assembly of fibrinogen scaffolds, comparison to fibrin
71
Figure 26: Self-assembly of fibrinogen in phosphate buffer and PBS compared to fibrin A-C: 5 mg/ml fibrinogen in 5 mM NH4HCO3 were dried on a piranha cleaned glass slide without the addition of any enzyme and analyzed in the SEM. For B and C 25 mM phosphate buffer (pH 7.4) or 2.5x PBS (pH 7.4) were present during the drying process respectively, which led to the self-assembly of fibrinogen fibers. D: Fibrin fibers prepared by incubating 10 mg/ml fibrinogen in 10 mM NH4HCO3 with 10 U of thrombin for 1 h at 37°C. Fibrin fibers were subsequently dried and analyzed in the SEM. E: Fibrin fibers prepared by incubating 10 mg/ml fibrinogen in 10 mM phosphate buffer with 10 U of thrombin for 1 h at 37°C. Fibrin fibers were subsequently dried and analyzed in the SEM. F: Fibrin fibers prepared by incubating 5 mg/ml fibrinogen in 5 mM NH4HCO3 and 2.5x PBS with 5 U of thrombin for 1 h at 37°C. Fibrin fibers were subsequently dried and analyzed in the SEM. All scale bars represent 2 µm.
When fibrinogen was dried in the presence of NH4HCO3 alone, planar fibrinogen layers
without any fibrous structures were observed. The additional presence of PBS or phosphate
buffer during drying resulted in fibrinogen nanofiber meshes with characteristic star-shaped
morphologies with concentrated central points similar to the morphology already observed
for fibrinogen and citrate (Figure 26 A-C). However, the coverage and the distribution of
fibers on the sample differed, which will be presented in detail in following chapters. The
morphology of the self-assembled fibrinogen fibers differed from the morphology of fibrin
fibers prepared with thrombin. In similar buffer systems, fibrin fibers prepared with
thrombin showed a more homogeneous morphology as well as an even distribution. A star-
shaped morphology with pronounced central points was not observed in fibrin (Figure 26
D-F).

72
Influence of the thrombin inhibitor AEBSF on fibrinogen self-assembly
To exclude the involvement of a potential trace contamination of thrombin in the self-
assembly process, a control experiment utilizing AEBSF was conducted. AEBSF is a
strong inhibitor for serine proteases, which covalently binds to the active center and thereby
inactivates potential trace amounts of thrombin. For the control experiment, fibrinogen self-
assembly was induced by drying in the presence of PBS with addition of AEBSF.
Figure 27: Self-assembly of fibrinogen scaffolds in the presence of AEBSF Fibrinogen nanofibers were assembled by drying a 5 mg/ml fibrinogen in 5 mM NH4HCO3 in the presence of 2.5x PBS (pH 7.4) and 0.1 mM (A) or 1 mM (B) AEBSF on a piranha cleaned glass slide. Subsequent SEM analyses revealed that even in the presence of the thrombin inhibitor AEBSF fiber formation occurred. Scale bars represent 2 µm. Image from (Stapelfeldt et al., 2019a) supplementary material.
Self-assembly of fibrinogen fibers upon drying in PBS still occurred when 0.1 mM or even
1 mM AEBSF were present (Figure 27). The assembly process was not inhibited by the
presence of AEBSF and the star-shaped morphology of the self-assembled fibrinogen was
not affected.
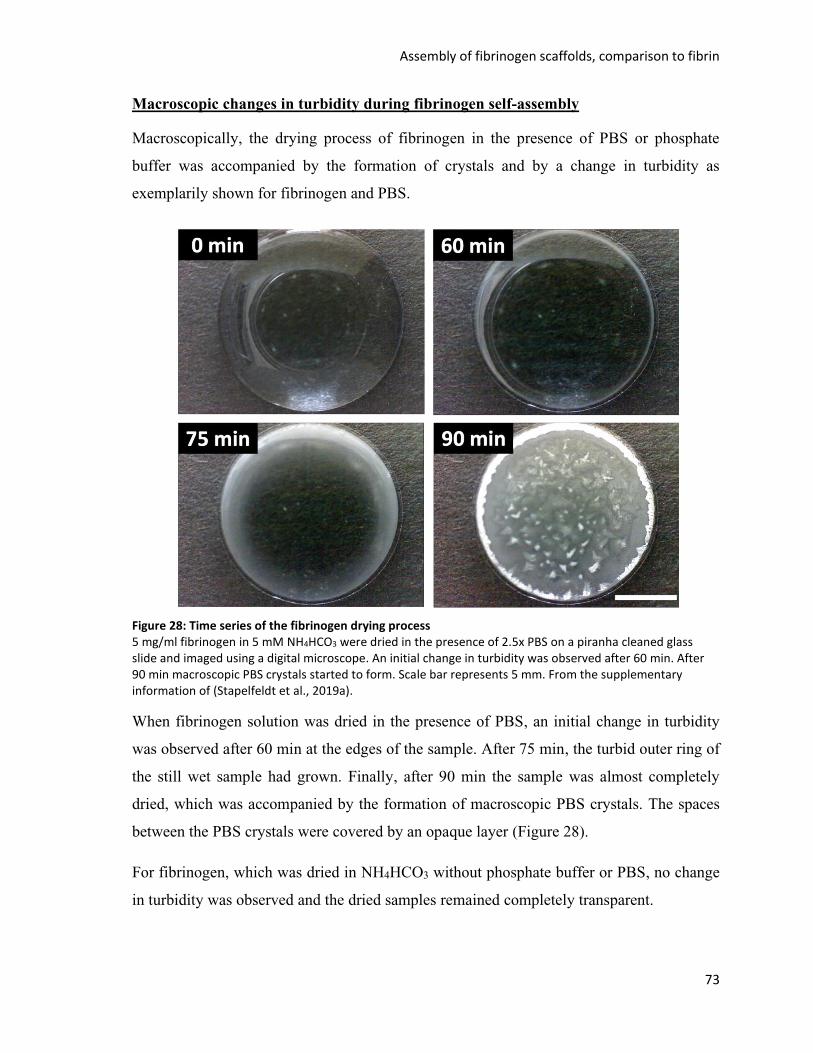
Assembly of fibrinogen scaffolds, comparison to fibrin
73
Macroscopic changes in turbidity during fibrinogen self-assembly
Macroscopically, the drying process of fibrinogen in the presence of PBS or phosphate
buffer was accompanied by the formation of crystals and by a change in turbidity as
exemplarily shown for fibrinogen and PBS.
Figure 28: Time series of the fibrinogen drying process 5 mg/ml fibrinogen in 5 mM NH4HCO3 were dried in the presence of 2.5x PBS on a piranha cleaned glass slide and imaged using a digital microscope. An initial change in turbidity was observed after 60 min. After 90 min macroscopic PBS crystals started to form. Scale bar represents 5 mm. From the supplementary information of (Stapelfeldt et al., 2019a).
When fibrinogen solution was dried in the presence of PBS, an initial change in turbidity
was observed after 60 min at the edges of the sample. After 75 min, the turbid outer ring of
the still wet sample had grown. Finally, after 90 min the sample was almost completely
dried, which was accompanied by the formation of macroscopic PBS crystals. The spaces
between the PBS crystals were covered by an opaque layer (Figure 28).
For fibrinogen, which was dried in NH4HCO3 without phosphate buffer or PBS, no change
in turbidity was observed and the dried samples remained completely transparent.
74
5.1.2. Influence of fibrinogen concentration
Different concentrations of fibrinogen in NH4HCO3 solution were dried in the presence of
either phosphate buffer or PBS. A distinct fibrinogen concentration threshold of fiber
formation was observed in both buffer systems.
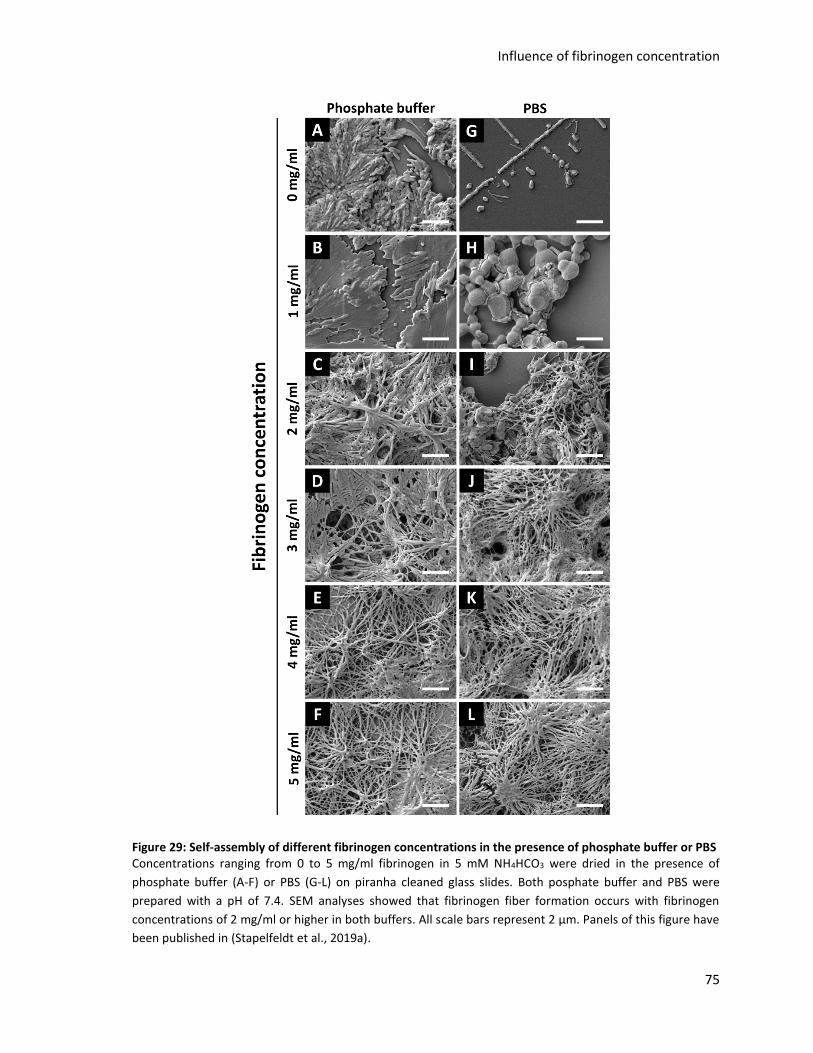
Influence of fibrinogen concentration
75
Figure 29: Self-assembly of different fibrinogen concentrations in the presence of phosphate buffer or PBS Concentrations ranging from 0 to 5 mg/ml fibrinogen in 5 mM NH4HCO3 were dried in the presence of
phosphate buffer (A-F) or PBS (G-L) on piranha cleaned glass slides. Both posphate buffer and PBS were
prepared with a pH of 7.4. SEM analyses showed that fibrinogen fiber formation occurs with fibrinogen
concentrations of 2 mg/ml or higher in both buffers. All scale bars represent 2 µm. Panels of this figure have
been published in (Stapelfeldt et al., 2019a).
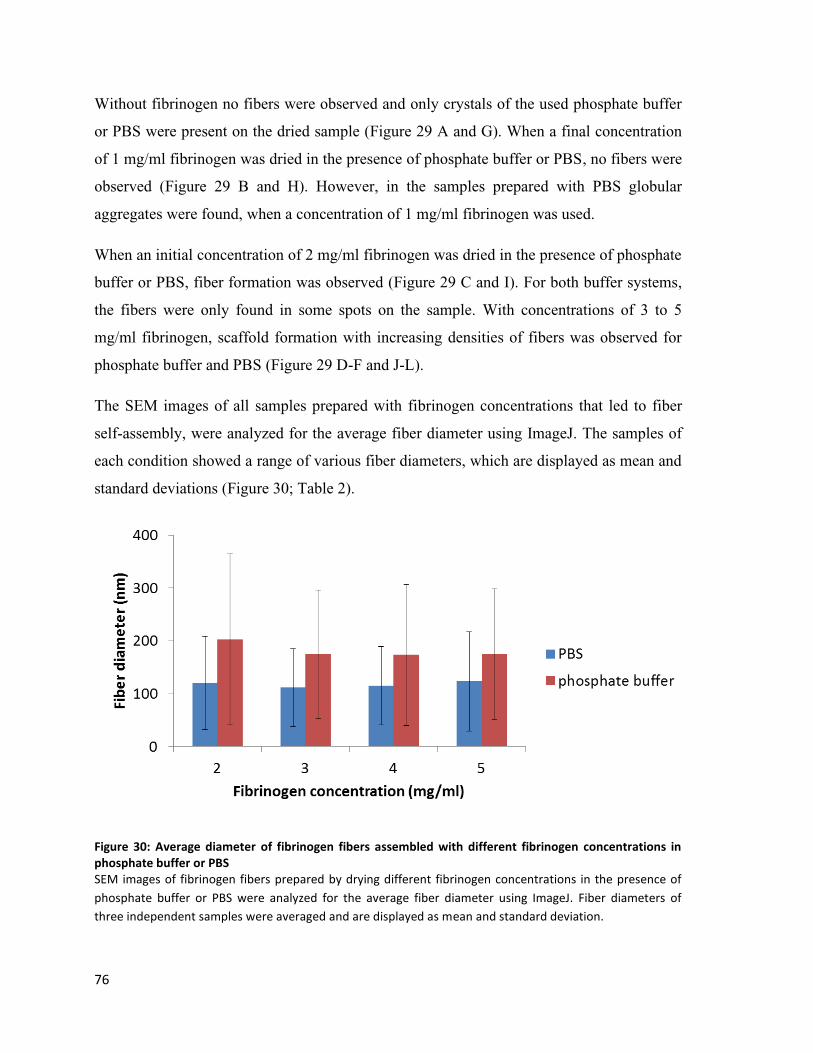
76
Without fibrinogen no fibers were observed and only crystals of the used phosphate buffer
or PBS were present on the dried sample (Figure 29 A and G). When a final concentration
of 1 mg/ml fibrinogen was dried in the presence of phosphate buffer or PBS, no fibers were
observed (Figure 29 B and H). However, in the samples prepared with PBS globular
aggregates were found, when a concentration of 1 mg/ml fibrinogen was used.
When an initial concentration of 2 mg/ml fibrinogen was dried in the presence of phosphate
buffer or PBS, fiber formation was observed (Figure 29 C and I). For both buffer systems,
the fibers were only found in some spots on the sample. With concentrations of 3 to 5
mg/ml fibrinogen, scaffold formation with increasing densities of fibers was observed for
phosphate buffer and PBS (Figure 29 D-F and J-L).
The SEM images of all samples prepared with fibrinogen concentrations that led to fiber
self-assembly, were analyzed for the average fiber diameter using ImageJ. The samples of
each condition showed a range of various fiber diameters, which are displayed as mean and
standard deviations (Figure 30; Table 2).
Figure 30: Average diameter of fibrinogen fibers assembled with different fibrinogen concentrations in phosphate buffer or PBS SEM images of fibrinogen fibers prepared by drying different fibrinogen concentrations in the presence of
phosphate buffer or PBS were analyzed for the average fiber diameter using ImageJ. Fiber diameters of
three independent samples were averaged and are displayed as mean and standard deviation.
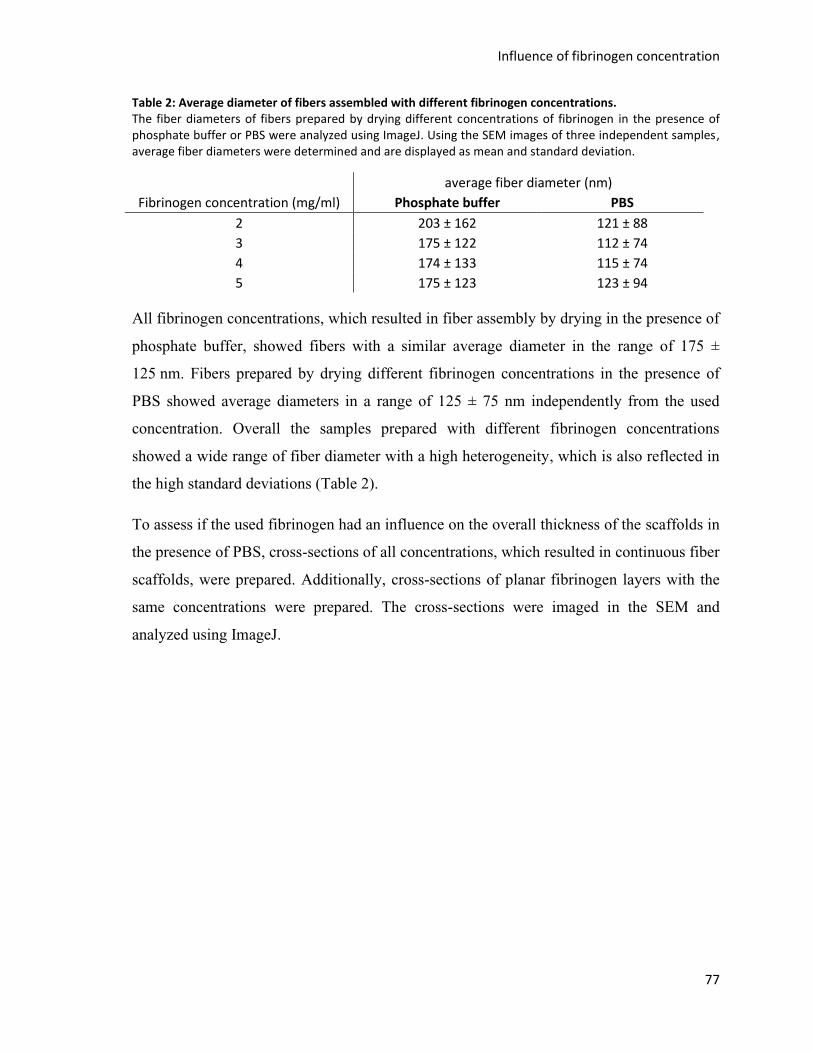
Influence of fibrinogen concentration
77
Table 2: Average diameter of fibers assembled with different fibrinogen concentrations. The fiber diameters of fibers prepared by drying different concentrations of fibrinogen in the presence of phosphate buffer or PBS were analyzed using ImageJ. Using the SEM images of three independent samples, average fiber diameters were determined and are displayed as mean and standard deviation.
average fiber diameter (nm)
Fibrinogen concentration (mg/ml) Phosphate buffer PBS
2 203 ± 162 121 ± 88
3 175 ± 122 112 ± 74
4 174 ± 133 115 ± 74
5 175 ± 123 123 ± 94
All fibrinogen concentrations, which resulted in fiber assembly by drying in the presence of
phosphate buffer, showed fibers with a similar average diameter in the range of 175 ±
125 nm. Fibers prepared by drying different fibrinogen concentrations in the presence of
PBS showed average diameters in a range of 125 ± 75 nm independently from the used
concentration. Overall the samples prepared with different fibrinogen concentrations
showed a wide range of fiber diameter with a high heterogeneity, which is also reflected in
the high standard deviations (Table 2).
To assess if the used fibrinogen had an influence on the overall thickness of the scaffolds in
the presence of PBS, cross-sections of all concentrations, which resulted in continuous fiber
scaffolds, were prepared. Additionally, cross-sections of planar fibrinogen layers with the
same concentrations were prepared. The cross-sections were imaged in the SEM and
analyzed using ImageJ.
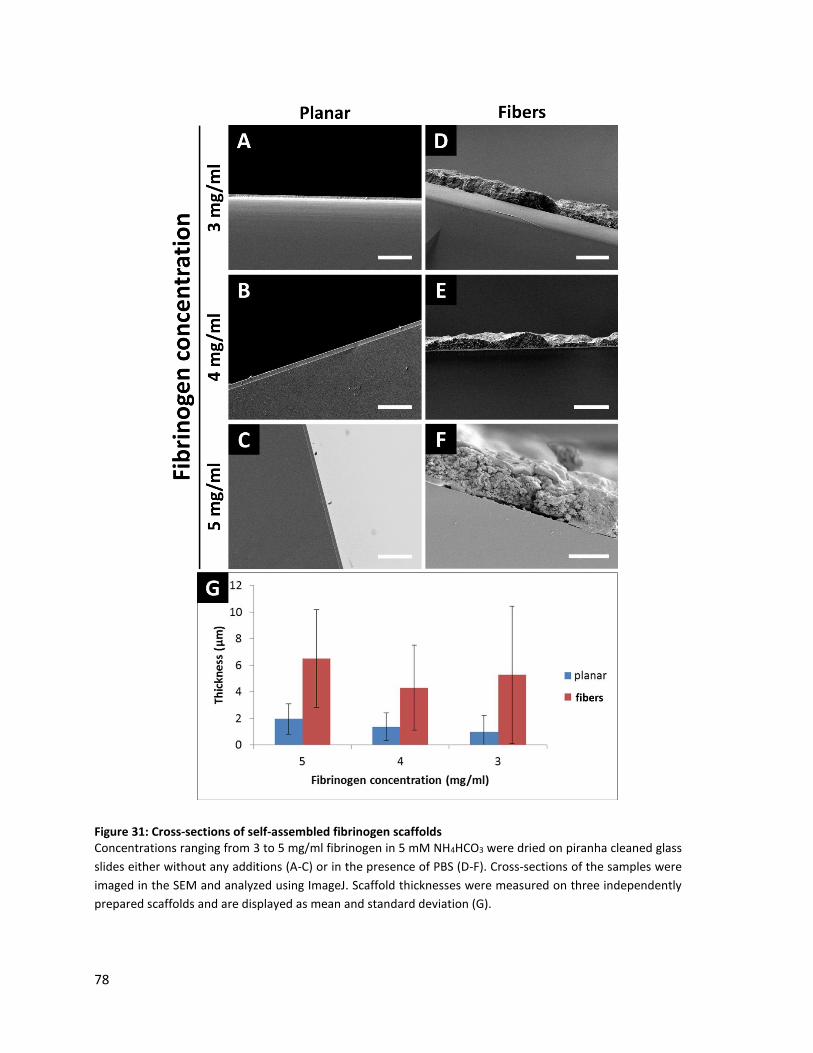
78
Figure 31: Cross-sections of self-assembled fibrinogen scaffolds Concentrations ranging from 3 to 5 mg/ml fibrinogen in 5 mM NH4HCO3 were dried on piranha cleaned glass
slides either without any additions (A-C) or in the presence of PBS (D-F). Cross-sections of the samples were
imaged in the SEM and analyzed using ImageJ. Scaffold thicknesses were measured on three independently
prepared scaffolds and are displayed as mean and standard deviation (G).

Effect of varying buffer concentrations
79
Planar scaffolds showed average thicknesses of 1.5 ± 1 µm (Figure 31 A-C) while fibrous
scaffolds had thicknesses of 3 to 12 µm (Figure 31 D-F). Fibers in the scaffolds were
observed through the whole scaffold. Due to the high standard deviations, a clear
correlation of used fibrinogen concentration and scaffold thickness was not confirmed.
Overall, planar fibrinogen layers had a more uniform thickness. Fibrous fibrinogen
scaffolds showed a high heterogeneity in thicknesses, which is reflected in the high
standard deviations of average scaffold thickness. Large differences could even be observed
at very close positions (Figure 31 E).
5.1.3. Effect of varying buffer concentrations
Fibrinogen in NH4HCO3 solution was dried in the presence of different phosphate buffer or
PBS concentrations. When no phosphate buffer or PBS was added, only planar layers
(Figure 32 A and F) formed similar to the previously observed samples, on which
fibrinogen was dried solely in the presence of NH4HCO3. However, all concentrations of
phosphate buffer (Figure 32 B-E) or PBS (Figure 32 G-J), which were applied during the
drying process, resulted in the formation of fibrinogen fibers. Even the presence of 5 mM
phosphate buffer or 0.5x PBS, was sufficient to induce self-assembly of fibrinogen into
fibers.
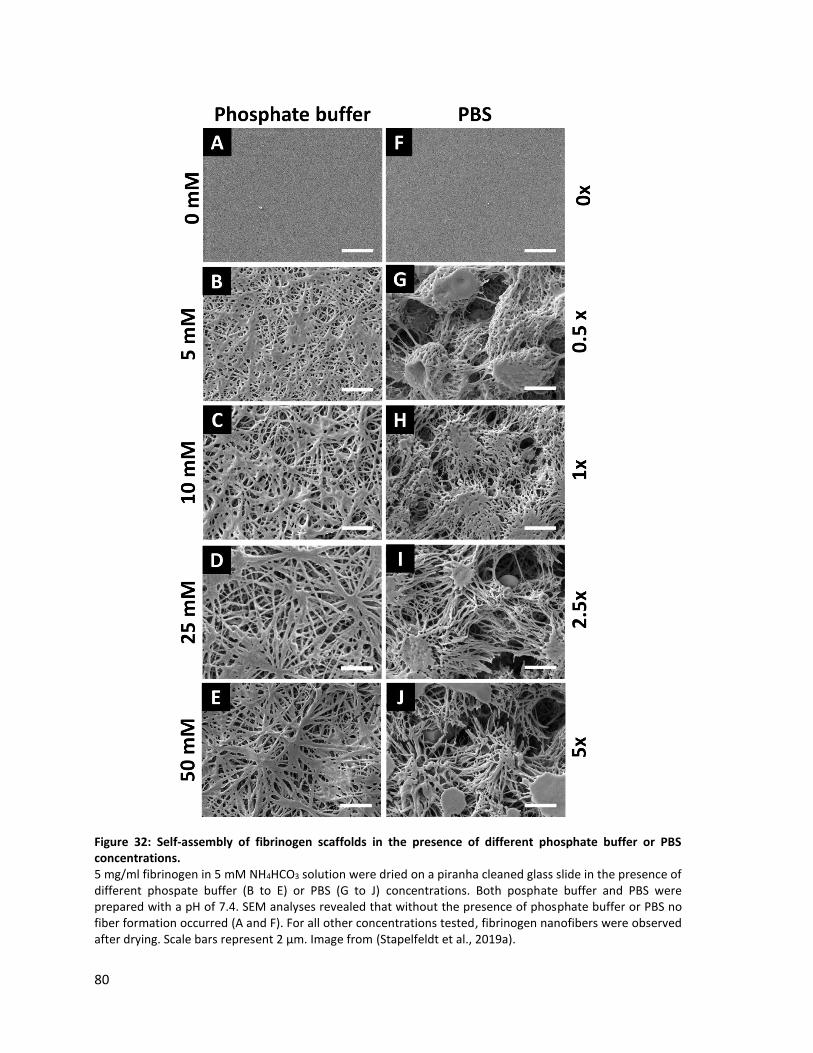
80
Figure 32: Self-assembly of fibrinogen scaffolds in the presence of different phosphate buffer or PBS concentrations. 5 mg/ml fibrinogen in 5 mM NH4HCO3 solution were dried on a piranha cleaned glass slide in the presence of different phospate buffer (B to E) or PBS (G to J) concentrations. Both posphate buffer and PBS were prepared with a pH of 7.4. SEM analyses revealed that without the presence of phosphate buffer or PBS no fiber formation occurred (A and F). For all other concentrations tested, fibrinogen nanofibers were observed after drying. Scale bars represent 2 µm. Image from (Stapelfeldt et al., 2019a).

Effect of varying buffer concentrations
81
Drying in the presence of low phosphate buffer concentrations (5 and 10 mM) resulted in
fibrinogen scaffolds, which only rarely showed the characteristic star-shaped morphology.
Instead, the fiber scaffolds showed more loosely aggregated fibers without concentrated
central points. Overall, fiber scaffolds prepared with PBS showed more prominent central
points with high fiber density and drying in all PBS concentrations resulted in a similar
star-shaped morphology.
The SEM images of fibrinogen assembled in different phosphate buffer and PBS
concentrations were analyzed with regard to the average fiber diameter using ImageJ. The
samples of each condition showed a wide range of various fiber diameters, which are
displayed as mean and standard deviation (Figure 33; Table 3).
Figure 33: Average diameter of fibrinogen fibers assembled with different phosphate buffer or PBS concentrations SEM images of fibrinogen fibers prepared by drying in the presence of different phosphate buffer (A) or PBS (B) concentrations were analyzed for the average fiber diameter using ImageJ. Fiber diameters of three independent samples were averaged and are displayed as mean and standard deviation.
Fibers prepared in the presence of 5 mM phosphate buffer showed diameters in a range of
25 to 200 nm, while the diameters of fibers prepared with 10, 25, or 50 mM phosphate
buffer ranged from 25 to 350 nm. For fibers prepared in the presence of 0.5x, 1x, or 2.5x
PBS fiber diameters in a range of 50 to 250 nm were observed. Only fibers prepared in the
presence of 5x PBS showed a broader diameter range of 25 to 350 nm. Overall, the fiber
diameters of self-assembled fibrinogen fibers stayed in a wide range and the different
concentrations of phosphate buffer had little effect on the observed fiber thickness, which is
reflected in the high standard deviation (Table 3).

82
Table 3: Average diameter of fibers assembled with different buffer concentrations. The fiber diameters of fibers prepared by drying fibrinogen in the presence of different phosphate buffer or PBS concentrations were analyzed using ImageJ. Using the SEM images of three independent samples average fiber diameters were determined and are displayed as mean and standard deviation.
Phosphate buffer PBS
concentration (mM) fiber diameter (nm) concentration (x) fiber diameter (nm)
5 104 ± 85 0.5 133 ± 94
10 165 ± 179 1 159 ± 117
25 157 ± 107 2.5 154 ± 104
50 205 ± 193 5 178 ± 163
Although the concentration of phosphate buffer had hardly any effect on the fiber diameter,
the macroscopic total coverage of the 15 mm diameter glass slides with fibrinogen
scaffolds was dependent on the buffer and the applied buffer concentration (Figure 34).
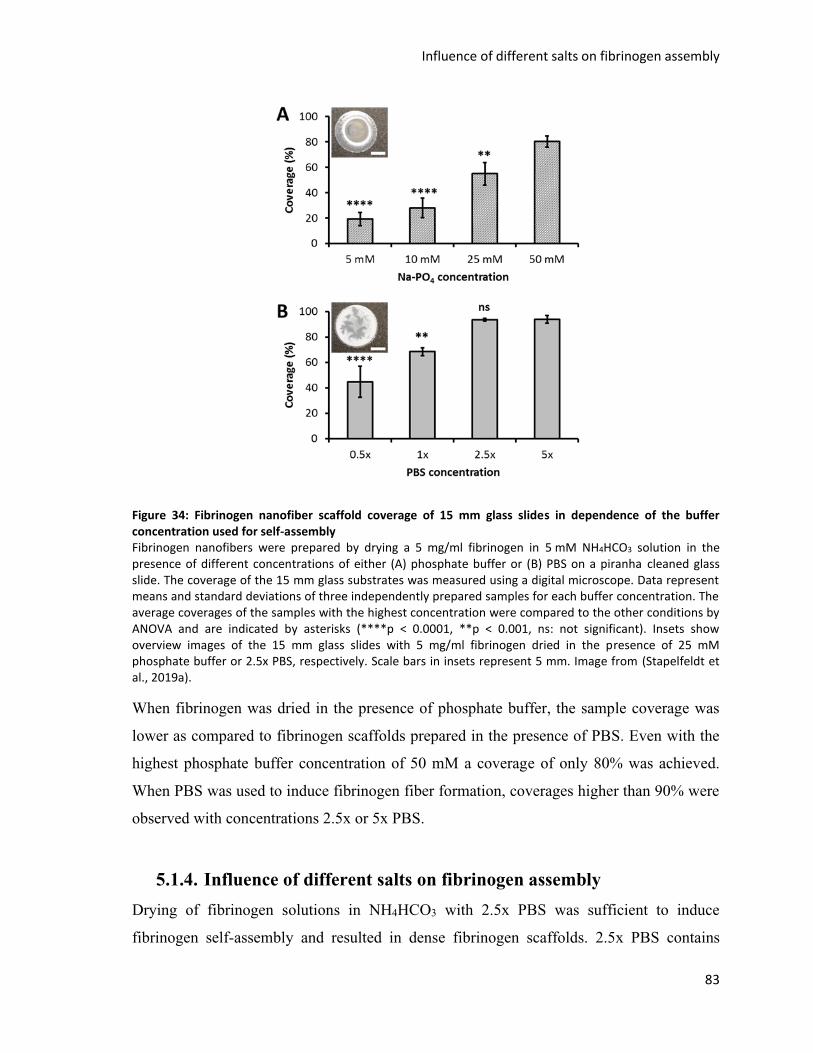
Influence of different salts on fibrinogen assembly
83
Figure 34: Fibrinogen nanofiber scaffold coverage of 15 mm glass slides in dependence of the buffer concentration used for self-assembly Fibrinogen nanofibers were prepared by drying a 5 mg/ml fibrinogen in 5 mM NH4HCO3 solution in the presence of different concentrations of either (A) phosphate buffer or (B) PBS on a piranha cleaned glass slide. The coverage of the 15 mm glass substrates was measured using a digital microscope. Data represent means and standard deviations of three independently prepared samples for each buffer concentration. The average coverages of the samples with the highest concentration were compared to the other conditions by ANOVA and are indicated by asterisks (****p < 0.0001, **p < 0.001, ns: not significant). Insets show overview images of the 15 mm glass slides with 5 mg/ml fibrinogen dried in the presence of 25 mM phosphate buffer or 2.5x PBS, respectively. Scale bars in insets represent 5 mm. Image from (Stapelfeldt et al., 2019a).
When fibrinogen was dried in the presence of phosphate buffer, the sample coverage was
lower as compared to fibrinogen scaffolds prepared in the presence of PBS. Even with the
highest phosphate buffer concentration of 50 mM a coverage of only 80% was achieved.
When PBS was used to induce fibrinogen fiber formation, coverages higher than 90% were
observed with concentrations 2.5x or 5x PBS.
5.1.4. Influence of different salts on fibrinogen assembly
Drying of fibrinogen solutions in NH4HCO3 with 2.5x PBS was sufficient to induce
fibrinogen self-assembly and resulted in dense fibrinogen scaffolds. 2.5x PBS contains

84
375 mM NaCl, 10 mM KCl and 25 mM sodium phosphate buffer. Therefore, the individual
potential of NaCl and KCl to induce fibrinogen self-assembly upon drying was investigated
further. Additionally, fibrinogen in NH4HCO3 was dried in the presence of 375 mM KCl
and 25 mM potassium phosphate buffer to elucidate, if these ion combinations had an effect
on fiber formation, when similar concentrations to the sodium based salts in PBS were
used.
Figure 35: Self-assembly of fibrinogen in the presence of different PBS components 5 mg/ml fibrinogen in 5 nM NH4HCO3 were dried in the presence of (A) 375 mM NaCl, (B) 10 mM KCl, (C) 375 mM KCl or (D) 25 mM K-PO4 buffer. SEM analyses revealed that nanofibers could be assembled in all buffers, if the salt concentration was at least 25 mM. No fibrinogen fibers formed with 10 mM KCl. Fiber morphology was less defined, when single PBS components were used. Scale bars represent 2 µm. Image from (Stapelfeldt et al., 2019a).
Drying with 375 mM NaCl or KCl was sufficient to induce fibrinogen fiber formation, but
with less fibers and a less defined fiber morphology as compared to drying in the presence
of PBS (Figure 35 A and C). Nevertheless, with a low concentration of 10 mM KCl no
fiber formation was observed (Figure 35 B). Similar to sodium phosphate buffer, drying in
the presence of 25 mM potassium phosphate buffer resulted in fibrinogen fibers but with
less defined fiber morphology (Figure 35 D).
Although single buffer components were sufficient to induce fibrinogen self-assembly, the
overall fiber morphology was most defined when phosphate buffer or PBS were used in
25 mM or 2.5x concentration respectively.
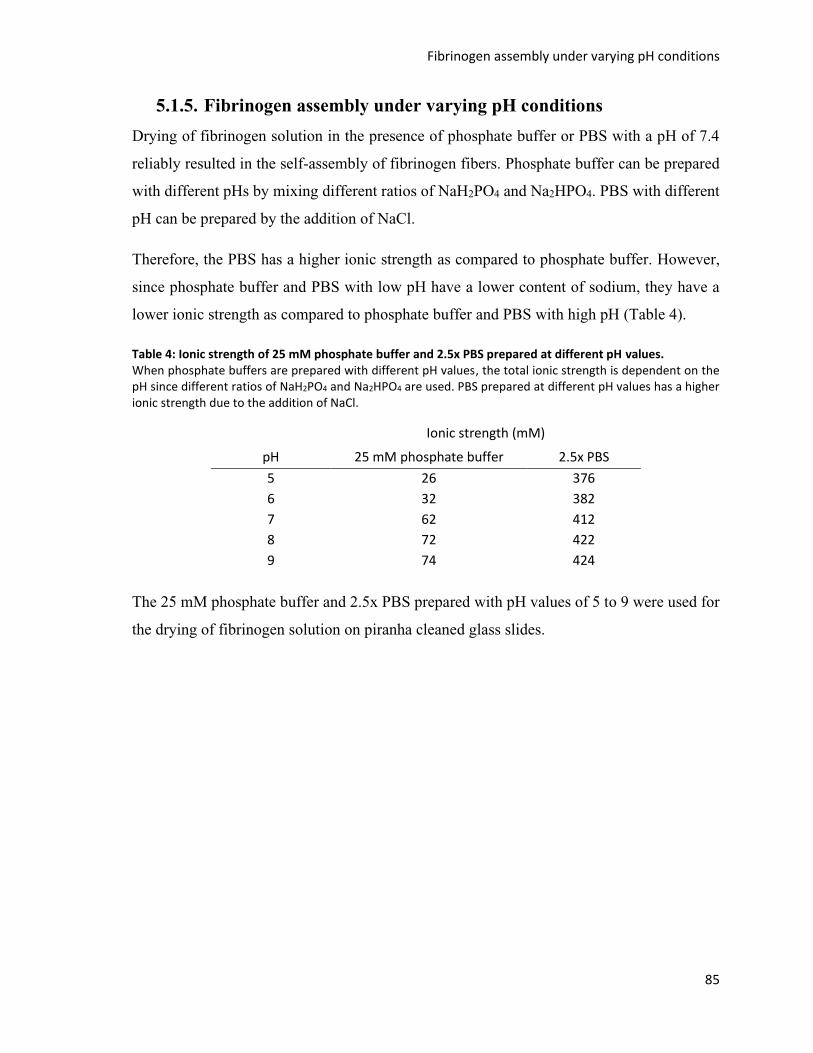
Fibrinogen assembly under varying pH conditions
85
5.1.5. Fibrinogen assembly under varying pH conditions
Drying of fibrinogen solution in the presence of phosphate buffer or PBS with a pH of 7.4
reliably resulted in the self-assembly of fibrinogen fibers. Phosphate buffer can be prepared
with different pHs by mixing different ratios of NaH2PO4 and Na2HPO4. PBS with different
pH can be prepared by the addition of NaCl.
Therefore, the PBS has a higher ionic strength as compared to phosphate buffer. However,
since phosphate buffer and PBS with low pH have a lower content of sodium, they have a
lower ionic strength as compared to phosphate buffer and PBS with high pH (Table 4).
Table 4: Ionic strength of 25 mM phosphate buffer and 2.5x PBS prepared at different pH values. When phosphate buffers are prepared with different pH values, the total ionic strength is dependent on the pH since different ratios of NaH2PO4 and Na2HPO4 are used. PBS prepared at different pH values has a higher ionic strength due to the addition of NaCl.
Ionic strength (mM)
pH 25 mM phosphate buffer 2.5x PBS
5 26 376
6 32 382
7 62 412
8 72 422
9 74 424
The 25 mM phosphate buffer and 2.5x PBS prepared with pH values of 5 to 9 were used for
the drying of fibrinogen solution on piranha cleaned glass slides.

86
Figure 36: Self-assembly of fibrinogen in the presence of phosphate buffer or PBS with different pH values
5 mg/ml fibrinogen solution in 5 mM NH4HCO3 in the presence of either 25 mM Na-PO4 buffer (A to E) or 2.5x PBS (F to J) were dried under varying pH conditions and subsequently analyzed using SEM. In both buffers the pH was varied from 5 to 9. Fiber formation was only induced for pH 7 to 9, whereas more acidic pH ranges did not yield any nanofibers. Scale bars represent 2 µm. Image from (Stapelfeldt et al., 2019a).
The pH dependence of fiber formation was similar in phosphate buffer and PBS. Both
buffers showed a clear threshold pH of 7 for fiber formation. When phosphate buffer with a
pH of 5 or 6 was present during drying only planar fibrinogen layers were observed (Figure
Fibrinogen assembly under varying pH conditions
87
36 A and B). PBS with a pH of 5 or 6 resulted in fibrinogen layers and globular aggregates
(Figure 27 F and G). Starting with a pH of 7, the presence of phosphate buffer or PBS
resulted in the formation of fibrinogen fibers (Figure 36 C-E and H-J). At a pH of 7
combinations of fiber and globular aggregates were observed, especially when PBS was
used as buffer. The scaffolds prepared with phosphate buffer or PBS at a pH of 8 showed
the most defined fiber scaffolds with thin fibers and a high porosity. At a pH of 9 the fibers
prepared in both buffer appeared slightly thicker and the scaffolds were less porous.
To show that the observed morphology of the fibrinogen scaffolds prepared with different
pH values was present throughout the scaffold, cross-sections of the samples prepared with
PBS were prepared. The cross-sections were imaged at a 90° angle in the SEM.

88
Figure 37: Cross-sections of fibrinogen scaffolds prepared in the presence of PBS with different pH values 5 mg/ml fibrinogen solution in 5 mM NH4HCO3 in the presence of 2.5x PBS were dried under pH 5 to 9.
Cross-sections of the resulting fibrinogen scaffolds were subsequently prepared and imaged in a 90° angle
using SEM. Fiber formation was only induced for pH 7 to 9, whereas more acidic pH ranges resulted in
globular aggregates and thin planar layers. Scale bars represent 2 µm.
Effect of different humidities during fibrinogen assembly
89
The cross-sections revealed that the morphology observed in the top view SEM analyses
was present throughout the whole scaffold thickness. Scaffolds prepared at a pH of 5 or 6
showed a planar top layer and globular aggregates of fibrinogen without any fibrous
structure througout the whole scaffold thickness (Figure 37 A and B). Samples prepared
with pH 7, 8 or 9 on the other hand consisted of continious scaffolds of fibrinogen
nanofibers throughout the full scaffold thickness (Figure 37 C to E).
5.1.6. Effect of different humidities during fibrinogen assembly
Fibrinogen was assembled into scaffolds by a drying step in the presence of PBS.
Therefore, it was of interest to investigate the influence of different relative humidities on
the drying and self-assembly process. For this purpose an incubation chamber was
constructed, which allowed the assembly of fibrinogen scaffolds under controlled
temperature and humidity.
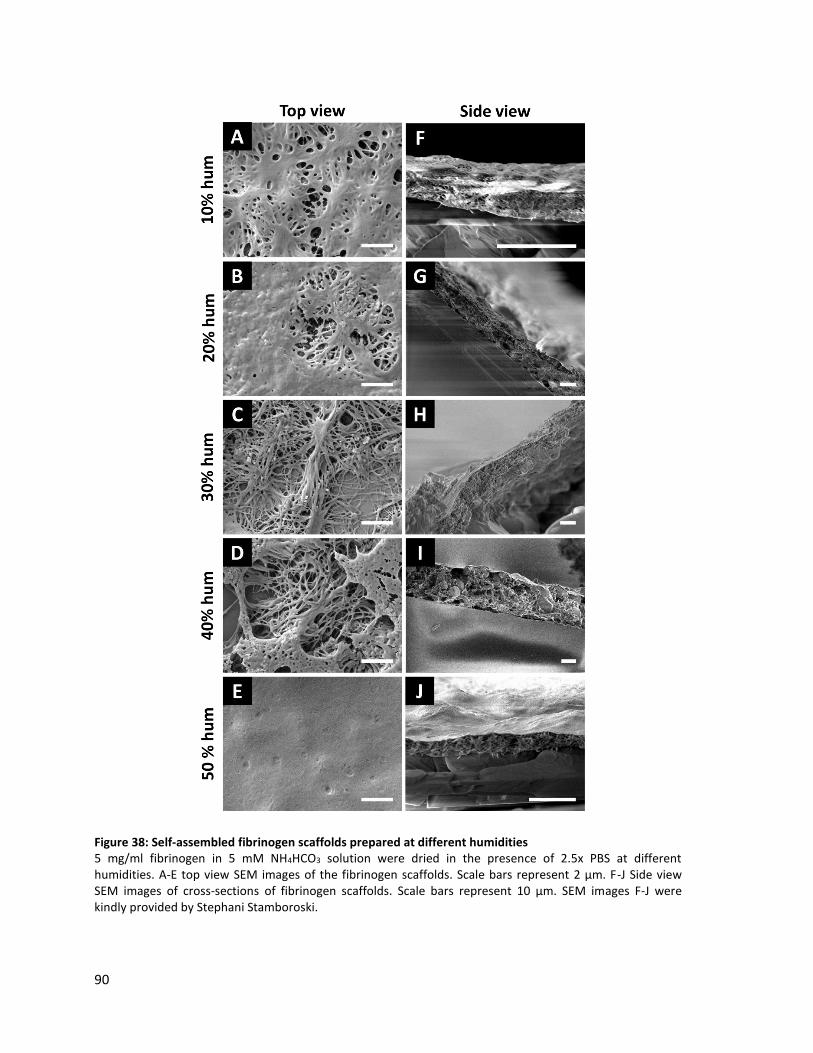
90
Figure 38: Self-assembled fibrinogen scaffolds prepared at different humidities 5 mg/ml fibrinogen in 5 mM NH4HCO3 solution were dried in the presence of 2.5x PBS at different humidities. A-E top view SEM images of the fibrinogen scaffolds. Scale bars represent 2 µm. F-J Side view SEM images of cross-sections of fibrinogen scaffolds. Scale bars represent 10 µm. SEM images F-J were kindly provided by Stephani Stamboroski.

Assembly of fibrinogen nanofibers on different substrate materials
91
The top view SEM analyses of the fibrinogen scaffolds prepared at different humidities
revealed that with relative humidities of 10-40% fibrous scaffolds had formed during the
drying process (Figure 38 A-D). However, the samples prepared at a humidity of 50% only
showed a planar top layer, on which no fibers could be determined (Figure 38 E). Only an
additional analysis of scaffold cross-sections revealed that fiber formation occurred even at
50% humidity. Only the topmost layer of the sample prepared with a humidity of 50% was
planar. Underneath this top layer a dense scaffold of fibrinogen fibers was present (Figure
37 J). Furthermore, the cross-sections of the samples prepared at 10% up to 40% humidity
showed that the fibrous scaffolds were continuous throughout the whole scaffold thickness.
5.1.7. Assembly of fibrinogen nanofibers on different substrate
materials
The fibrinogen self-assembly by drying in the presence of salt buffers described in this
thesis was observed on highly hydrophilic piranha cleaned glass slides. Therefore, it was
analyzed if the discovered self-assembly process would also occur on gold-sputtered 15
mm glass slides with a higher hydrophobicity.
Figure 39: Self-assembly of fibrinogen in the presence of PBS on gold 5mg/ml fibrinogen in 5 mM NH4HCO3 solution were either dried without additions or in the presence of 2.5x PBS on a gold coated glass slide. SEM analyses showed that without additions a planar fibrinogen layer had formed. When PBS was present during drying fibrinogen self-assembled into nanofibers.
The fibrinogen self-assembly on gold substrate was analogous to the self-assembly
observed on the piranha cleaned glass slides. Without the presence of PBS only planar
fibrinogen layers formed (Figure 39 A), while when PBS was present during drying a
scaffold of fibrinogen nanofibers was observed (Figure 39 B). The fibrinogen nanofibers
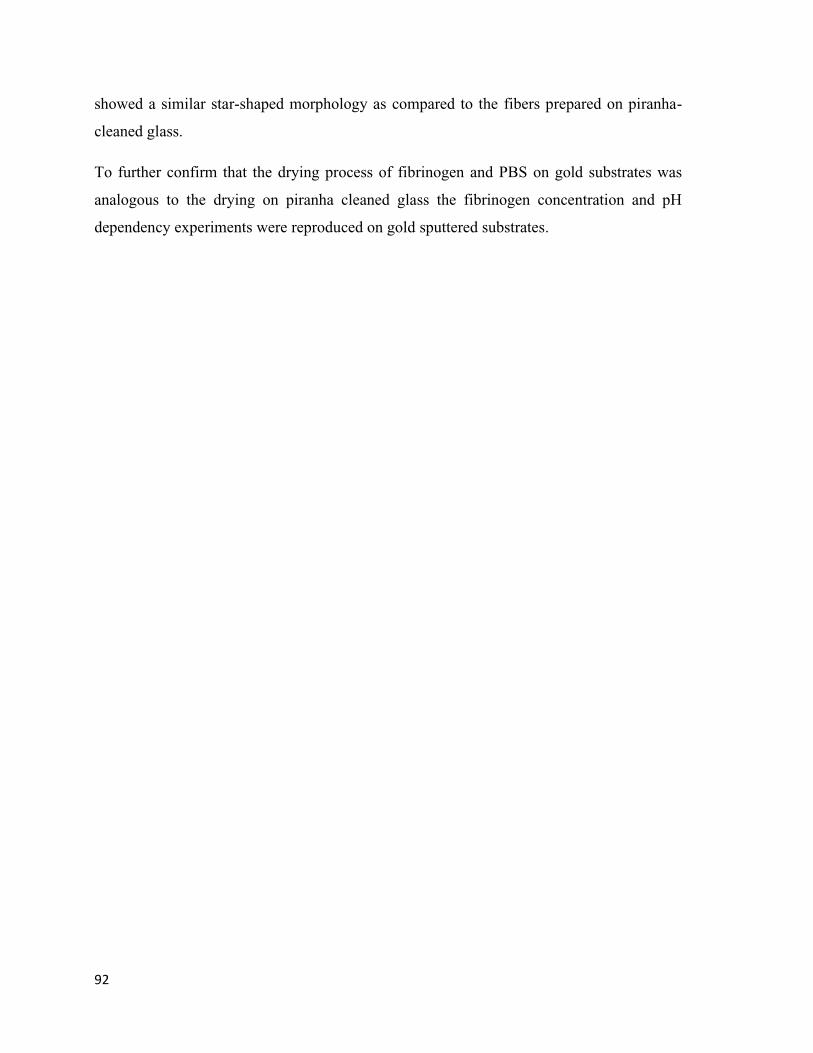
92
showed a similar star-shaped morphology as compared to the fibers prepared on piranha-
cleaned glass.
To further confirm that the drying process of fibrinogen and PBS on gold substrates was
analogous to the drying on piranha cleaned glass the fibrinogen concentration and pH
dependency experiments were reproduced on gold sputtered substrates.
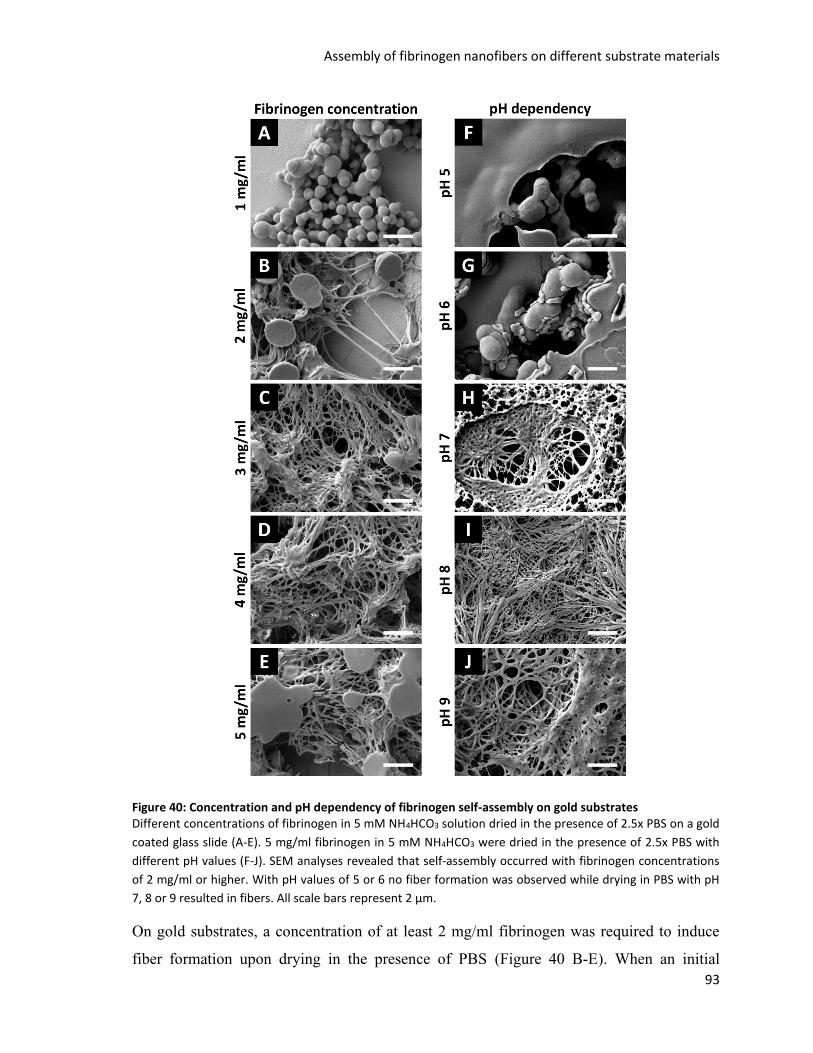
Assembly of fibrinogen nanofibers on different substrate materials
93
Figure 40: Concentration and pH dependency of fibrinogen self-assembly on gold substrates Different concentrations of fibrinogen in 5 mM NH4HCO3 solution dried in the presence of 2.5x PBS on a gold
coated glass slide (A-E). 5 mg/ml fibrinogen in 5 mM NH4HCO3 were dried in the presence of 2.5x PBS with
different pH values (F-J). SEM analyses revealed that self-assembly occurred with fibrinogen concentrations
of 2 mg/ml or higher. With pH values of 5 or 6 no fiber formation was observed while drying in PBS with pH
7, 8 or 9 resulted in fibers. All scale bars represent 2 µm.
On gold substrates, a concentration of at least 2 mg/ml fibrinogen was required to induce
fiber formation upon drying in the presence of PBS (Figure 40 B-E). When an initial
94
concentration of 1 mg/ml fibrinogen was used, no fiber formation was observed (Figure
40 A). These findings are consistent with the observation of fibrinogen self-assembly on
piranha cleaned glass slides. When fibrinogen was dried on gold substrates in the presence
of PBS with pH values of 5 or 6 no fiber formation was observed (Figure 40 F and G).
When the used PBS had a pH value of 7, 8 or 9 fiber formation was observed on gold
substrates.
Fibrinogen self-assembly on other substrates
Since the fibrinogen fiber self-assembly induced by drying in the presence of PBS on gold
substrate was analogous to the fibrinogen fiber self-assembly on piranha cleaned glass
slides, other substrate materials were tested for a fibrinogen self-assembly by drying in the
presence of PBS. Fibrinogen in NH4HCO3 solution was dried in the presence of PBS on
APTES, polylactic acid (PLA), polystyrene (PS), polybutylene adipate terephthalate
(PBAT), on parafilm surfaces and on polydimethylsiloxane (PDMS).
Figure 41: Fibrinogen self-assembly in the presence of PBS on different surface materials 5 mg/ml fibrinogen in 5 mM NH4HCO3 were dried in the presence of 2.5x PBS on APTES (A), polylactic acid
(B), polystyrene (C), polybutylene adipate terephthalate (D), parafilm surfaces (E) or PDMS (F; here 10
mg/ml fibrinogen were used). SEM analyses revealed that self-assembly of fibrinogen fibers occurred on all
tested substrate materials. Scale bars represent 2 µm.
Self-assembly of fibrinogen was observed on all substrate materials, when fibrinogen was
dried in the presence of PBS (Figure 41). Although the fiber formation was independent of

Fiber stability and crosslinking
95
the underlying substrate material, fibers showed a less distinct morphology and more
aggregation on polystyrene and on polydimethylsiloxane substrates, which showed some
non-fibrous areas on the samples (Figure 41 C and F). The fiber scaffolds on APTES
modified surfaces, on polylactic acid and on polystyrene showed a star shaped scaffold
with distinct fibers and an overall flat morphology (Figure 41 A, B and E). On polybutylene
adipate terephthalate surfaces the fibrinogen scaffolds showed a star shaped morphology
with a stronger topography.
5.1.8. Fiber stability and crosslinking
For further investigation and for a potential future application of fibrinogen fibers prepared
by self-assembly, it is crucial that the fibers are stable in aqueous environment; therefore it
was tested how the prepared scaffolds react to rehydration. It was shown that fibrinogen
scaffolds prepared by drying in the presence of PBS were not stable in aqueous solution
and rapidly redissolved. Fibrinogen solution was dried on piranha cleaned glass slides in
the presence of PBS. After the drying procedure, the influence of washing with different
solvents and solution was tested.
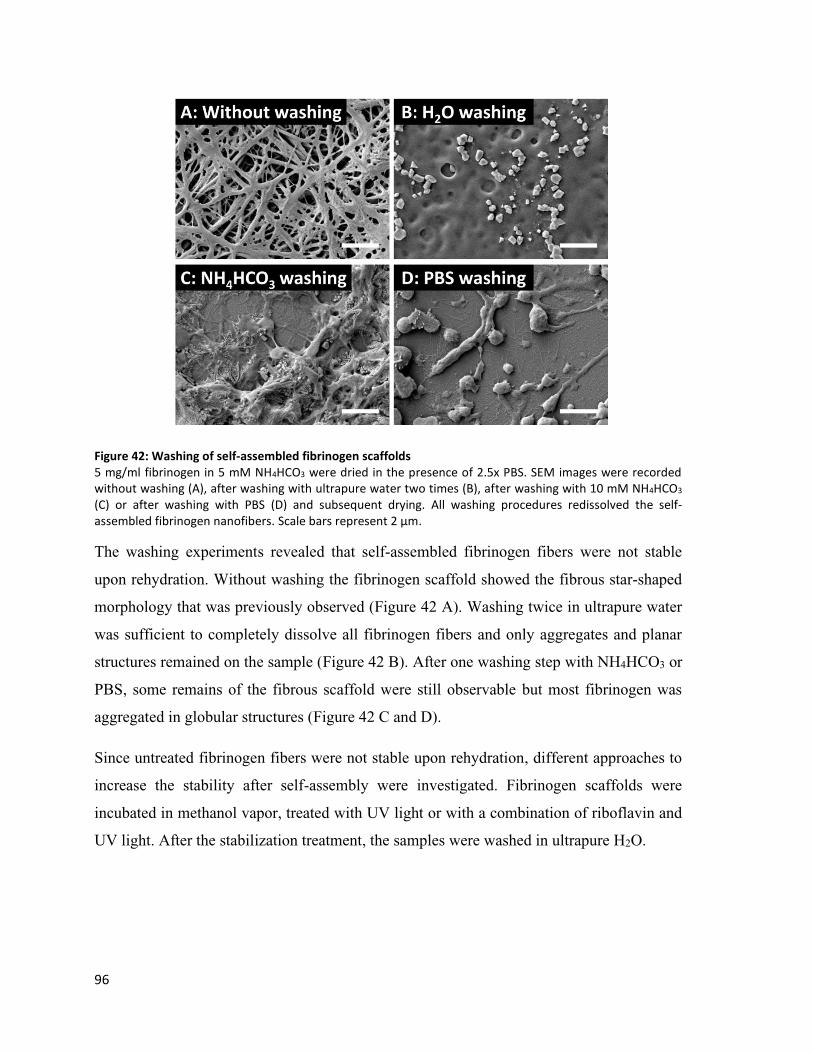
96
Figure 42: Washing of self-assembled fibrinogen scaffolds 5 mg/ml fibrinogen in 5 mM NH4HCO3 were dried in the presence of 2.5x PBS. SEM images were recorded without washing (A), after washing with ultrapure water two times (B), after washing with 10 mM NH4HCO3 (C) or after washing with PBS (D) and subsequent drying. All washing procedures redissolved the self-assembled fibrinogen nanofibers. Scale bars represent 2 µm.
The washing experiments revealed that self-assembled fibrinogen fibers were not stable
upon rehydration. Without washing the fibrinogen scaffold showed the fibrous star-shaped
morphology that was previously observed (Figure 42 A). Washing twice in ultrapure water
was sufficient to completely dissolve all fibrinogen fibers and only aggregates and planar
structures remained on the sample (Figure 42 B). After one washing step with NH4HCO3 or
PBS, some remains of the fibrous scaffold were still observable but most fibrinogen was
aggregated in globular structures (Figure 42 C and D).
Since untreated fibrinogen fibers were not stable upon rehydration, different approaches to
increase the stability after self-assembly were investigated. Fibrinogen scaffolds were
incubated in methanol vapor, treated with UV light or with a combination of riboflavin and
UV light. After the stabilization treatment, the samples were washed in ultrapure H2O.
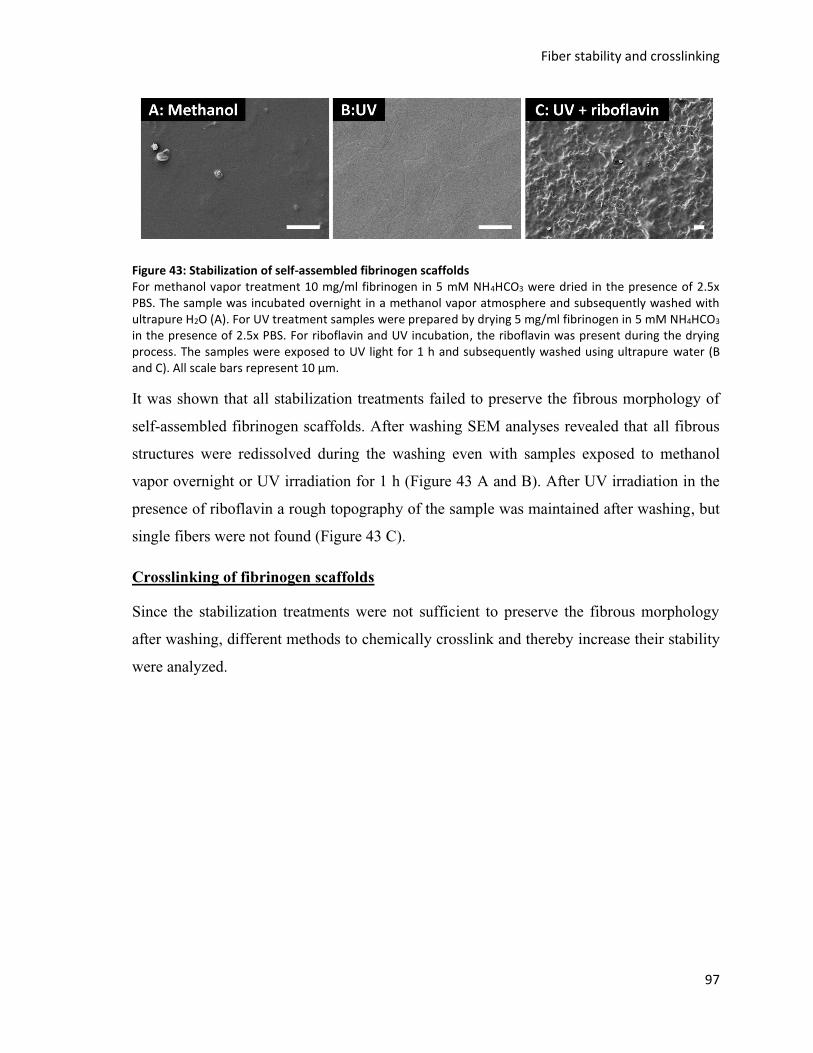
Fiber stability and crosslinking
97
Figure 43: Stabilization of self-assembled fibrinogen scaffolds For methanol vapor treatment 10 mg/ml fibrinogen in 5 mM NH4HCO3 were dried in the presence of 2.5x PBS. The sample was incubated overnight in a methanol vapor atmosphere and subsequently washed with ultrapure H2O (A). For UV treatment samples were prepared by drying 5 mg/ml fibrinogen in 5 mM NH4HCO3 in the presence of 2.5x PBS. For riboflavin and UV incubation, the riboflavin was present during the drying process. The samples were exposed to UV light for 1 h and subsequently washed using ultrapure water (B and C). All scale bars represent 10 µm.
It was shown that all stabilization treatments failed to preserve the fibrous morphology of
self-assembled fibrinogen scaffolds. After washing SEM analyses revealed that all fibrous
structures were redissolved during the washing even with samples exposed to methanol
vapor overnight or UV irradiation for 1 h (Figure 43 A and B). After UV irradiation in the
presence of riboflavin a rough topography of the sample was maintained after washing, but
single fibers were not found (Figure 43 C).
Crosslinking of fibrinogen scaffolds
Since the stabilization treatments were not sufficient to preserve the fibrous morphology
after washing, different methods to chemically crosslink and thereby increase their stability
were analyzed.
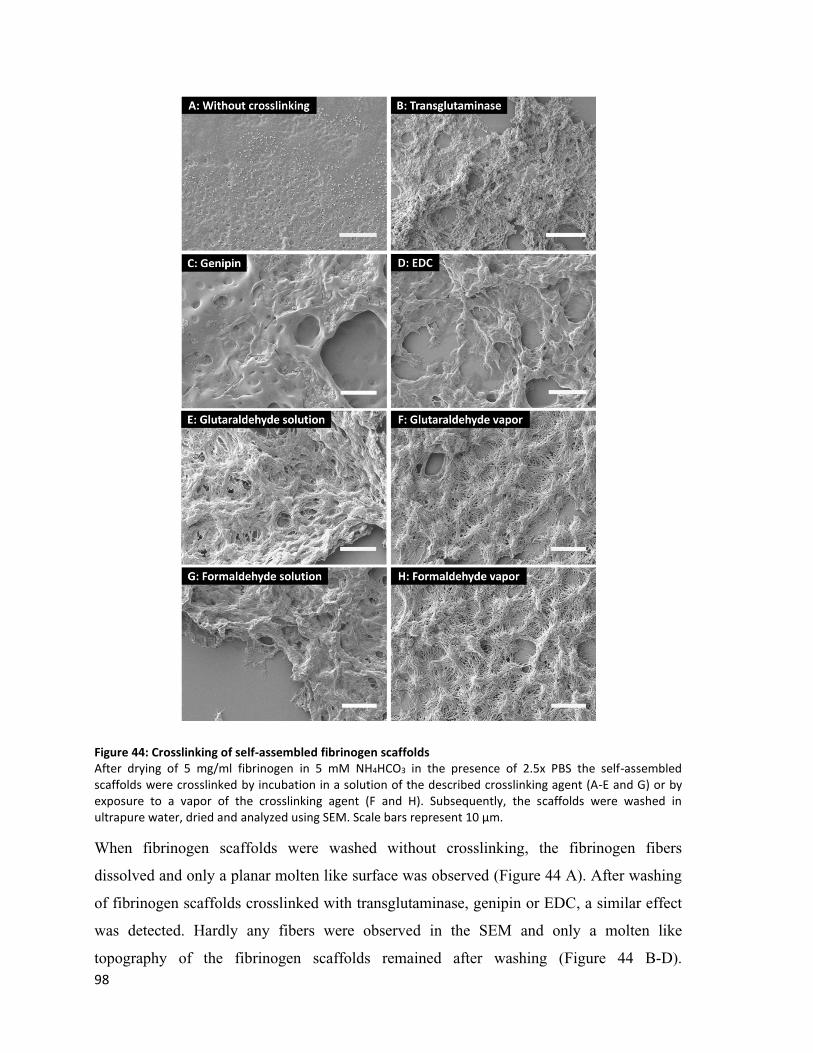
98
Figure 44: Crosslinking of self-assembled fibrinogen scaffolds
After drying of 5 mg/ml fibrinogen in 5 mM NH4HCO3 in the presence of 2.5x PBS the self-assembled scaffolds were crosslinked by incubation in a solution of the described crosslinking agent (A-E and G) or by exposure to a vapor of the crosslinking agent (F and H). Subsequently, the scaffolds were washed in ultrapure water, dried and analyzed using SEM. Scale bars represent 10 µm.
When fibrinogen scaffolds were washed without crosslinking, the fibrinogen fibers
dissolved and only a planar molten like surface was observed (Figure 44 A). After washing
of fibrinogen scaffolds crosslinked with transglutaminase, genipin or EDC, a similar effect
was detected. Hardly any fibers were observed in the SEM and only a molten like
topography of the fibrinogen scaffolds remained after washing (Figure 44 B-D).

Free-standing and immobilized fibrinogen scaffolds
99
Crosslinking with glutaraldehyde or formaldehyde solutions for 30 min was more efficient
for the preservation of the nanofibrous fibrinogen scaffold. When fibrinogen nanofiber
scaffolds were crosslinked in formaldehyde or glutaraldehyde solution, that morphology
was largely preserved and define fibers were visible after washing. Only in some parts of
the sample, the fibers had redissolved and some gaps in the scaffold were visible especially
when glutaraldehyde solution was used (Figure 44 E and G).
The best crosslinking result was achieved when glutaraldehyde or formaldehyde were
applied as vapor. The overall morphology of the crosslinked fibrous scaffold was
maintained with even fewer gaps and well defined fibers (Figure 44 F and H). Therefore,
formaldehyde vapor treatment was chosen as crosslinking method for further experiments
that required a rehydration of the fibrinogen scaffolds.
5.1.9. Free-standing and immobilized fibrinogen scaffolds
An additional observation during the crosslinking experiments was that the self-assembled
fibrinogen scaffolds, which were prepared on piranha cleaned glass slides and crosslinked
using formaldehyde vapor, easily detached form the piranha-cleaned substrate. Therefore,
the detachment of crosslinked scaffolds was further investigated using piranha cleaned
substrates and APTES modified substrates.
Figure 45: Detachment or immobilization of crosslinked fibrinogen scaffolds Scaffolds were prepared drying 5 mg/ml fibrinogen in 5 mM NH4HCO3 in the presence of 2.5x PBS. After crosslinking in formaldehyde vapor and washing with water, scaffolds on glass substrates detached immediately (A and B), whereas on APTES-modified substrates fibrinogen scaffolds stayed immobilized (C and D). Scale bars represent 1 cm. Image from (Stapelfeldt et al., 2019a).
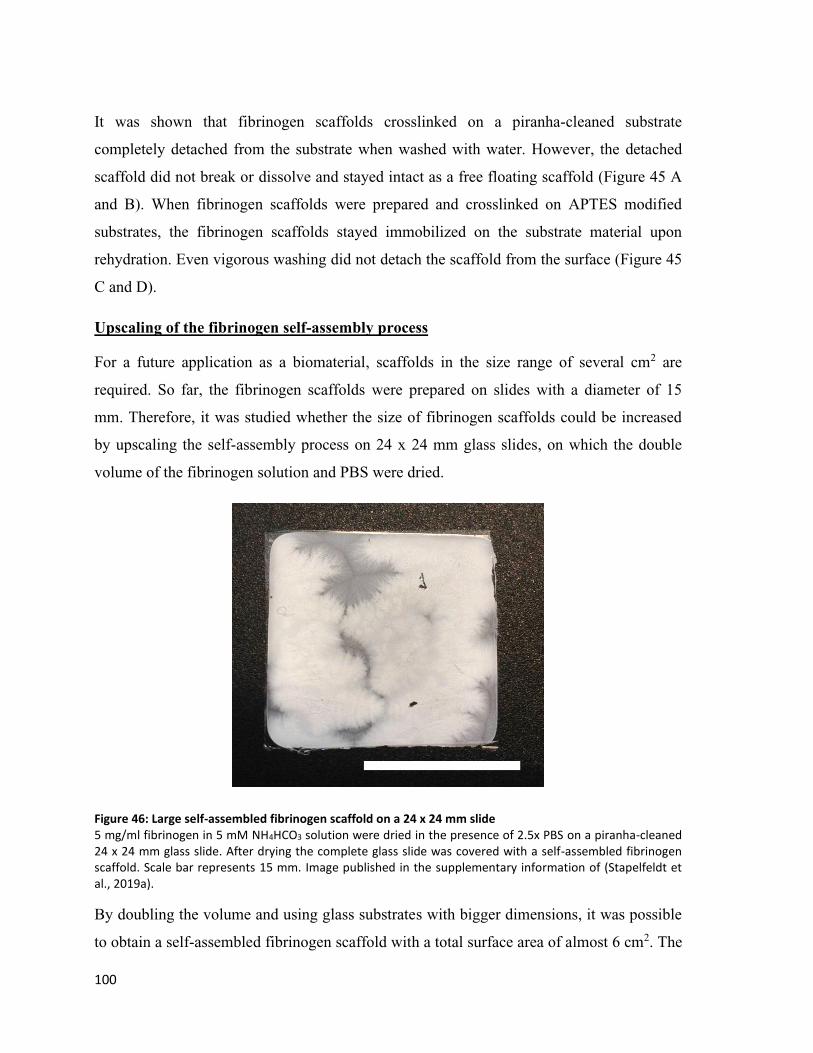
100
It was shown that fibrinogen scaffolds crosslinked on a piranha-cleaned substrate
completely detached from the substrate when washed with water. However, the detached
scaffold did not break or dissolve and stayed intact as a free floating scaffold (Figure 45 A
and B). When fibrinogen scaffolds were prepared and crosslinked on APTES modified
substrates, the fibrinogen scaffolds stayed immobilized on the substrate material upon
rehydration. Even vigorous washing did not detach the scaffold from the surface (Figure 45
C and D).
Upscaling of the fibrinogen self-assembly process
For a future application as a biomaterial, scaffolds in the size range of several cm2 are
required. So far, the fibrinogen scaffolds were prepared on slides with a diameter of 15
mm. Therefore, it was studied whether the size of fibrinogen scaffolds could be increased
by upscaling the self-assembly process on 24 x 24 mm glass slides, on which the double
volume of the fibrinogen solution and PBS were dried.
Figure 46: Large self-assembled fibrinogen scaffold on a 24 x 24 mm slide 5 mg/ml fibrinogen in 5 mM NH4HCO3 solution were dried in the presence of 2.5x PBS on a piranha-cleaned 24 x 24 mm glass slide. After drying the complete glass slide was covered with a self-assembled fibrinogen scaffold. Scale bar represents 15 mm. Image published in the supplementary information of (Stapelfeldt et al., 2019a).
By doubling the volume and using glass substrates with bigger dimensions, it was possible
to obtain a self-assembled fibrinogen scaffold with a total surface area of almost 6 cm2. The
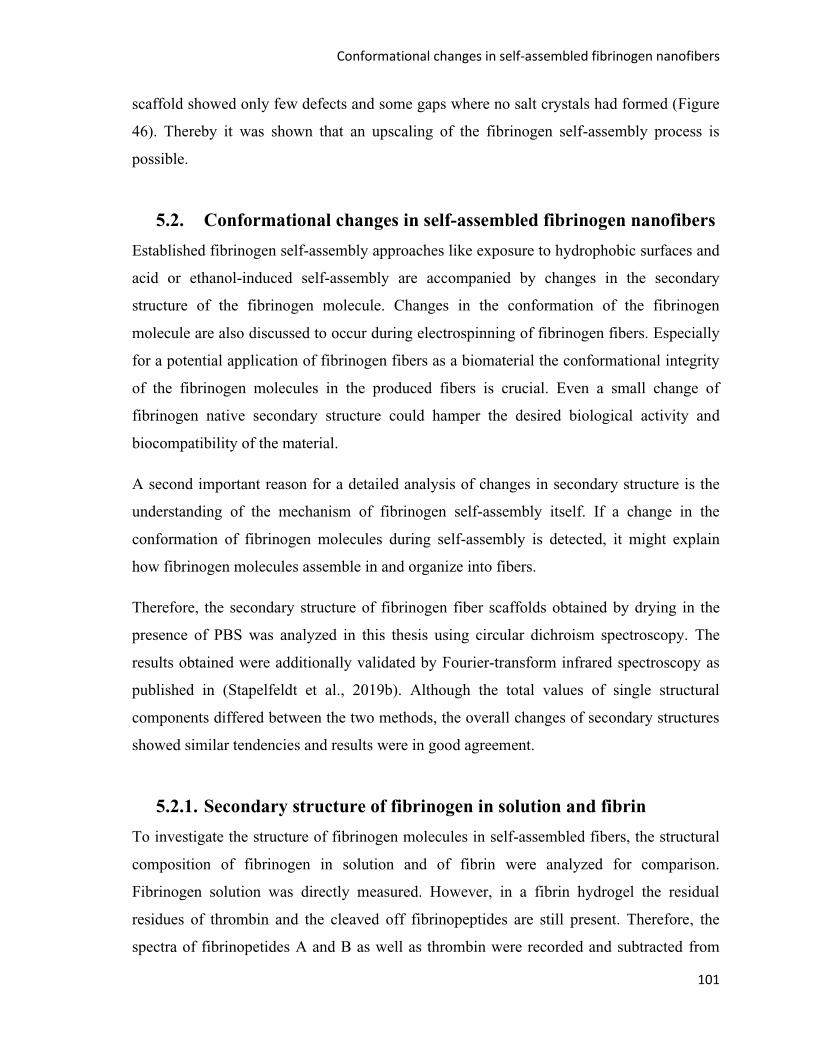
Conformational changes in self-assembled fibrinogen nanofibers
101
scaffold showed only few defects and some gaps where no salt crystals had formed (Figure
46). Thereby it was shown that an upscaling of the fibrinogen self-assembly process is
possible.
5.2. Conformational changes in self-assembled fibrinogen nanofibers
Established fibrinogen self-assembly approaches like exposure to hydrophobic surfaces and
acid or ethanol-induced self-assembly are accompanied by changes in the secondary
structure of the fibrinogen molecule. Changes in the conformation of the fibrinogen
molecule are also discussed to occur during electrospinning of fibrinogen fibers. Especially
for a potential application of fibrinogen fibers as a biomaterial the conformational integrity
of the fibrinogen molecules in the produced fibers is crucial. Even a small change of
fibrinogen native secondary structure could hamper the desired biological activity and
biocompatibility of the material.
A second important reason for a detailed analysis of changes in secondary structure is the
understanding of the mechanism of fibrinogen self-assembly itself. If a change in the
conformation of fibrinogen molecules during self-assembly is detected, it might explain
how fibrinogen molecules assemble in and organize into fibers.
Therefore, the secondary structure of fibrinogen fiber scaffolds obtained by drying in the
presence of PBS was analyzed in this thesis using circular dichroism spectroscopy. The
results obtained were additionally validated by Fourier-transform infrared spectroscopy as
published in (Stapelfeldt et al., 2019b). Although the total values of single structural
components differed between the two methods, the overall changes of secondary structures
showed similar tendencies and results were in good agreement.
5.2.1. Secondary structure of fibrinogen in solution and fibrin
To investigate the structure of fibrinogen molecules in self-assembled fibers, the structural
composition of fibrinogen in solution and of fibrin were analyzed for comparison.
Fibrinogen solution was directly measured. However, in a fibrin hydrogel the residual
residues of thrombin and the cleaved off fibrinopeptides are still present. Therefore, the
spectra of fibrinopetides A and B as well as thrombin were recorded and subtracted from
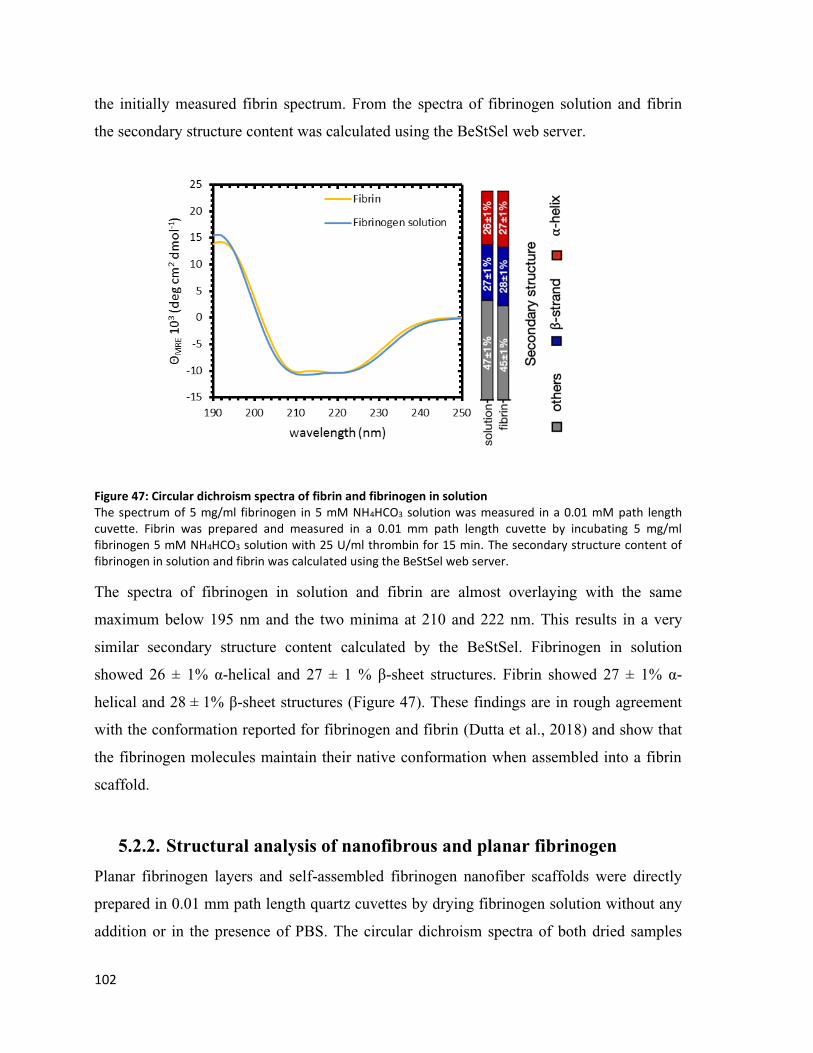
102
the initially measured fibrin spectrum. From the spectra of fibrinogen solution and fibrin
the secondary structure content was calculated using the BeStSel web server.
Figure 47: Circular dichroism spectra of fibrin and fibrinogen in solution The spectrum of 5 mg/ml fibrinogen in 5 mM NH4HCO3 solution was measured in a 0.01 mM path length cuvette. Fibrin was prepared and measured in a 0.01 mm path length cuvette by incubating 5 mg/ml fibrinogen 5 mM NH4HCO3 solution with 25 U/ml thrombin for 15 min. The secondary structure content of fibrinogen in solution and fibrin was calculated using the BeStSel web server.
The spectra of fibrinogen in solution and fibrin are almost overlaying with the same
maximum below 195 nm and the two minima at 210 and 222 nm. This results in a very
similar secondary structure content calculated by the BeStSel. Fibrinogen in solution
showed 26 ± 1% α-helical and 27 ± 1 % β-sheet structures. Fibrin showed 27 ± 1% α-
helical and 28 ± 1% β-sheet structures (Figure 47). These findings are in rough agreement
with the conformation reported for fibrinogen and fibrin (Dutta et al., 2018) and show that
the fibrinogen molecules maintain their native conformation when assembled into a fibrin
scaffold.
5.2.2. Structural analysis of nanofibrous and planar fibrinogen
Planar fibrinogen layers and self-assembled fibrinogen nanofiber scaffolds were directly
prepared in 0.01 mm path length quartz cuvettes by drying fibrinogen solution without any
addition or in the presence of PBS. The circular dichroism spectra of both dried samples

Structural analysis of nanofibrous and planar fibrinogen
103
were recorded and the secondary structure content was calculated using the BeStSel web
server.
Figure 48: Circular dichroism spectra of planar fibrinogen layers and self-assembled fibrinogen fibers Both scaffold types were prepared by drying 5 mg/ml fibrinogen in 5 mM NH4HCO3 directly in a 0.01 mm path length cuvette. For fibrinogen nanofibers 2.5x PBS at pH 7.4 was present during the drying process. Insets show the morphological differences using SEM analysis. The secondary structure contents shown in the bar chart were calculated from the spectra using the BeStSel web server. Image modified from (Stapelfeldt et al., 2019b).
Interestingly, the circular dichroism spectra of planar fibrinogen layers and self-assembled
fibrinogen fibers differed. The local minimum around 210 nm was less distinct for fibrous
scaffolds than for planar fibrinogen while the local minimum at 222 nm was in a similar
range. This also results in a difference in the analyzed secondary structure content. While
planar fibrinogen layers showed 23 ± 1% α-helical and 28 ± 1 % β-sheet structures, which
is in the range of native fibrinogen in solution, self-assembled fibrinogen fibers showed 19
± 1% α-helical and 32 ± 1 % β-sheet structures (Figure 48). During the self-assembly
process in the presence of PBS upon drying, a transition of α-helical structures to β-sheets
took place.
Thioflavin T staining of self-assembled fibrinogen scaffolds.
In comparison to fibrinogen in solution or planar fibrinogen layers, fibrinogen fiber
scaffolds prepared by drying in the presence of PBS showed a higher content of β-sheet
structures. For the self-assembly of other proteins into fibers an increased content of β-
sheet structures has previously been reported, which was associated with the formation of
β-amyloid structures, which are affiliated with various diseases.
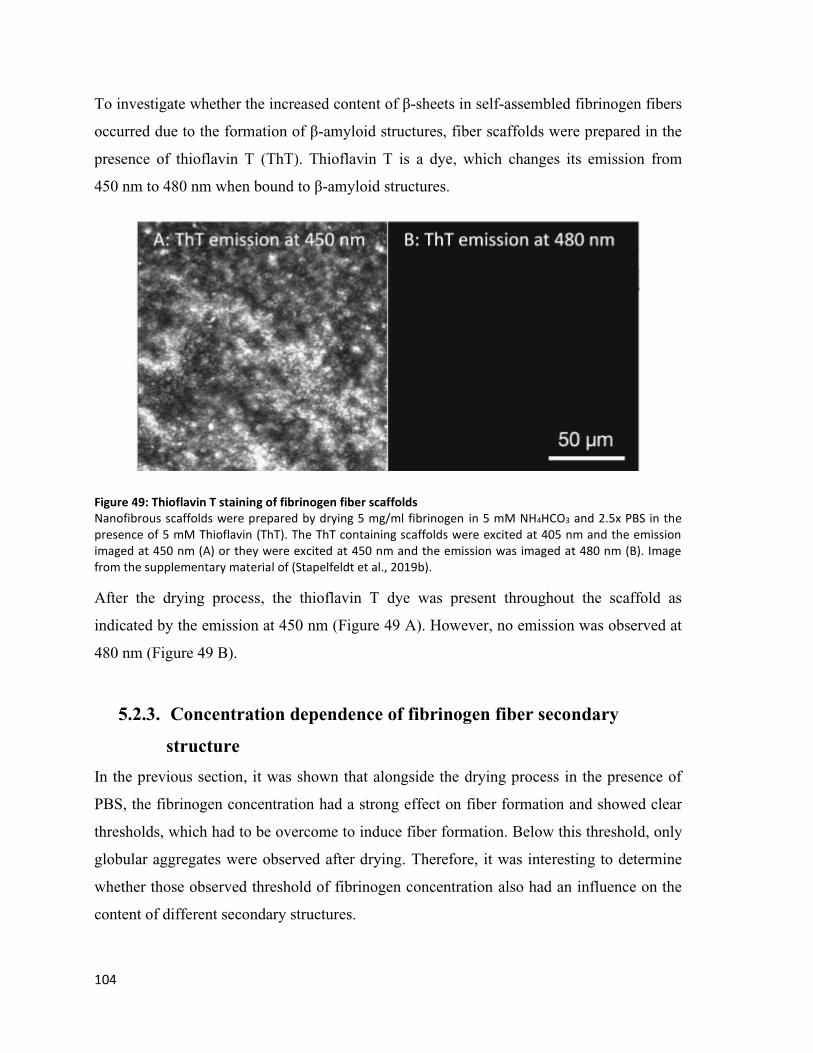
104
To investigate whether the increased content of β-sheets in self-assembled fibrinogen fibers
occurred due to the formation of β-amyloid structures, fiber scaffolds were prepared in the
presence of thioflavin T (ThT). Thioflavin T is a dye, which changes its emission from
450 nm to 480 nm when bound to β-amyloid structures.
Figure 49: Thioflavin T staining of fibrinogen fiber scaffolds
Nanofibrous scaffolds were prepared by drying 5 mg/ml fibrinogen in 5 mM NH4HCO3 and 2.5x PBS in the presence of 5 mM Thioflavin (ThT). The ThT containing scaffolds were excited at 405 nm and the emission imaged at 450 nm (A) or they were excited at 450 nm and the emission was imaged at 480 nm (B). Image from the supplementary material of (Stapelfeldt et al., 2019b).
After the drying process, the thioflavin T dye was present throughout the scaffold as
indicated by the emission at 450 nm (Figure 49 A). However, no emission was observed at
480 nm (Figure 49 B).
5.2.3. Concentration dependence of fibrinogen fiber secondary
structure
In the previous section, it was shown that alongside the drying process in the presence of
PBS, the fibrinogen concentration had a strong effect on fiber formation and showed clear
thresholds, which had to be overcome to induce fiber formation. Below this threshold, only
globular aggregates were observed after drying. Therefore, it was interesting to determine
whether those observed threshold of fibrinogen concentration also had an influence on the
content of different secondary structures.

Secondary structure of fibrinogen nanofibers under varying pH conditions
105
Figure 50: Secondary structure of fibrinogen scaffolds prepared by self-assembly of different fibrinogen concentrations 1 to 5 mg/ml fibrinogen in 5 mM NH4HCO3 were dried in 0.01 mm quartz cuvettes in the presence of 2.5x PBS and subsequently analyzed using circular dichroism spectroscopy. The circular dichroism spectra were converted into secondary structure content represented in the bar chart using the BeStSel web server. Image modified from (Stapelfeldt et al., 2019b).
When 1 or 2 mg/ml fibrinogen were dried in the presence of PBS, the corresponding
circular dichroism spectra almost overlapped with a strong maximum at 195 nm and local
minima at 210 and 222 nm. The BeStSel analyses showed that scaffolds prepared by drying
1 or 2 mg/ml fibrinogen had a content of 23 ± 1 % α-helical structures and 27 ± 1 % β-sheet
structures (Figure 50). Scaffolds prepared with 3, 4 or 5 mg/ml fibrinogen showed similar
circular dichroism spectra, which had a lower intensity compared to the spectra of 1 or 2
mg/ml especially for the maximum at 195 nm. In addition, the local minimum around 210
nm was less distinct for scaffolds prepared with 3, 4 or 5 mg/ml. The BeStSel analysis of
the circular dichroism spectra revealed an increased content of β-sheet structures of 31 ± 1
% for 3 mg/ml, 32 ± 1 % for 4 mg/ml and 31 ± 1 % for 5 mg/ml. The content of α-helical
structures, on the other hand, was decreased to 19 ± 1 %, 19 ± 1 % or 20 ± 1 % for 3, 4 or 5
mg/ml, respectively (Figure 50).
5.2.4. Secondary structure of fibrinogen nanofibers under varying pH
conditions
Similar to the concentration threshold of fibrinogen fiber formation, a clear pH threshold,
which had to be overcome for fiber formation, was observed in the previous section. When
106
the pH was below a threshold of 7 only globular aggregates of fibrinogen were observed
after drying. Therefore, it was determined whether the pH thresholds of fibrinogen fiber
formation also had an influence on the content of different secondary structures.
Figure 51: Secondary structure of fibrinogen scaffolds prepared by self-assembly at different pH values Scaffolds were prepared by drying 5 mg/ml fibrinogen in the presence of 2.5x PBS with varying pH in 0.01 mm quartz cuvettes and subsequently analyzed using circular dichroism. The circular dichroism spectra were converted into secondary structure content represented in the bar chart using the BeStSel web server. Image modified from (Stapelfeldt et al., 2019b).
The circular dichroism spectra of fibrinogen scaffolds prepared with a pH of 5, 6 or 7
partially overlapped and had a high intensity while the spectra of scaffolds prepared with a
pH of 8 or 9 had a lower intensity. The two minima were observed at wavelengths of 210
and 222 nm for the spectra and were not affected by the pH during fiber formation. The
secondary structure content calculated using the BeStSel sever was in a similar range for
pH 5, 6 and 7 with an α-helical content of 25 ± 1 %, 24 ± 1 % or 23 ± 1 % and a β-sheet
content of 26 ± 1 %, 27 ± 1 % or 28 ± 1 %, respectively. When scaffolds were prepared at
pH 8 or 9, a higher content of β-sheet structures was observed. Scaffolds prepared at pH 8
showed 18 ± 1 % α-helical and 33 ± 1 % β-sheet structures. Scaffolds prepared at pH 9 had
a content 18 ± 1 % α-helical and 30 ± 1 % β-sheet structures (Figure 51).

Influence of humidity on the secondary structure of fibrinogen nanofibers
107
5.2.5. Influence of humidity on the secondary structure of fibrinogen
nanofibers
High humidities during drying resulted in fibrinogen scaffolds with a planar fibrinogen
layer on top but with a fiber scaffold beneath the planar layer, which was confirmed by
cross-sectional SEM analysis. Hence, the influence of different humidities during the
drying process on the secondary structure of the fibrinogen scaffolds was additionally
investigated.
Figure 52: Secondary structure of fibrinogen scaffolds prepared by self-assembly at different pH values Scaffolds were prepared by drying 5 mg/ml fibrinogen in the presence of 2.5x PBS with varying pH in 0.01 mm quartz cuvettes and subsequently analyzed using circular dichroism.
The circular dichroism spectra of fibrinogen scaffolds prepared by drying at different
humidities almost perfectly overlapped. The local minima at 210 and 222 nm were not
affected and the intensities did not change due to the humidity. The humidity during
scaffold preparation had no influence on the circular dichroism of the samples (Figure 52).
5.2.6. Effect of crosslinking on the secondary structure of nanofibrous
fibrinogen scaffolds
In the previous section, it was shown that the fibrinogen scaffolds prepared by drying in the
presence of PBS were not stable upon rehydration. This drawback was overcome by a
crosslinking step in formaldehyde vapor. Since further experiments for a potential future
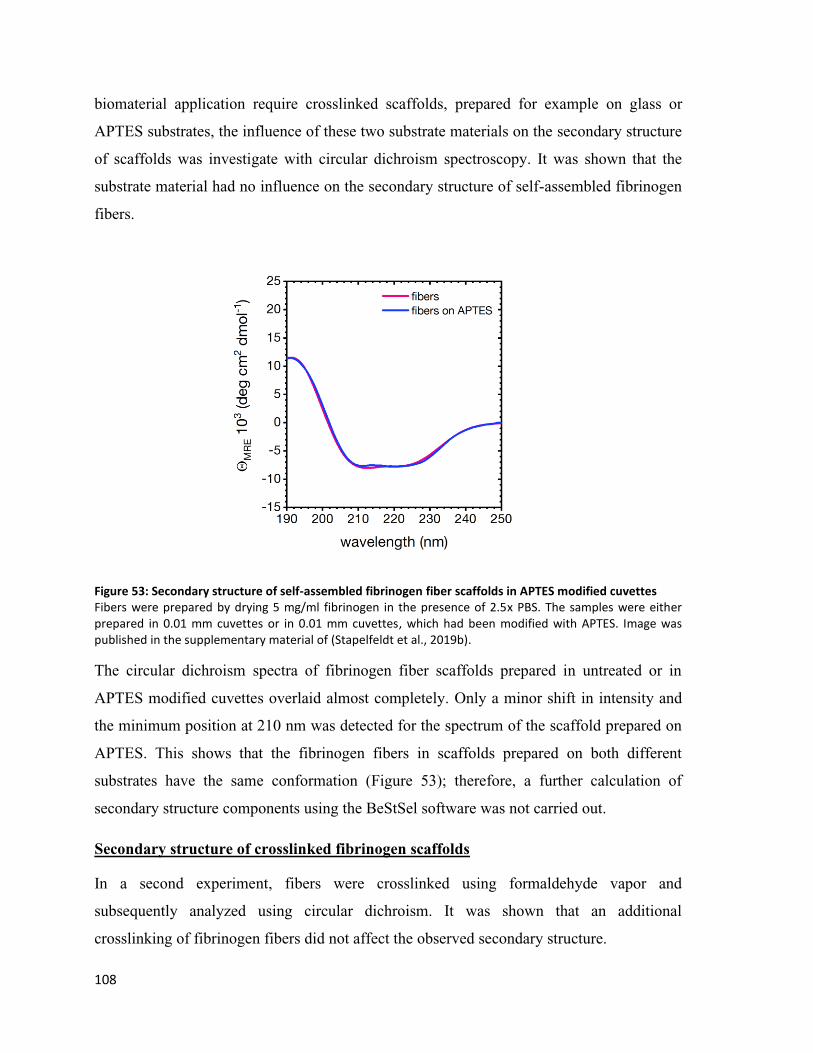
108
biomaterial application require crosslinked scaffolds, prepared for example on glass or
APTES substrates, the influence of these two substrate materials on the secondary structure
of scaffolds was investigate with circular dichroism spectroscopy. It was shown that the
substrate material had no influence on the secondary structure of self-assembled fibrinogen
fibers.
Figure 53: Secondary structure of self-assembled fibrinogen fiber scaffolds in APTES modified cuvettes Fibers were prepared by drying 5 mg/ml fibrinogen in the presence of 2.5x PBS. The samples were either prepared in 0.01 mm cuvettes or in 0.01 mm cuvettes, which had been modified with APTES. Image was published in the supplementary material of (Stapelfeldt et al., 2019b).
The circular dichroism spectra of fibrinogen fiber scaffolds prepared in untreated or in
APTES modified cuvettes overlaid almost completely. Only a minor shift in intensity and
the minimum position at 210 nm was detected for the spectrum of the scaffold prepared on
APTES. This shows that the fibrinogen fibers in scaffolds prepared on both different
substrates have the same conformation (Figure 53); therefore, a further calculation of
secondary structure components using the BeStSel software was not carried out.
Secondary structure of crosslinked fibrinogen scaffolds
In a second experiment, fibers were crosslinked using formaldehyde vapor and
subsequently analyzed using circular dichroism. It was shown that an additional
crosslinking of fibrinogen fibers did not affect the observed secondary structure.

Secondary structure of dried and rehydrated fibrinogen nanofibers
109
Figure 54: Secondary structure of self-assembled fibrinogen scaffold before and after crosslinking Fibrinogen scaffolds were prepared by drying 5 mg/ml fibrinogen in the presence of 2.5x PBS in 0.01 mm cuvettes. The circular dichroism spectra were recorded either directly or after crosslinking in formaldehyde vapor. Spectra were converted into secondary structure content represented in the bar chart using the BeStSel web server. Image modified from (Stapelfeldt et al., 2019b).
The circular dichroism spectra of untreated fibrinogen scaffolds and of scaffolds
crosslinked in formaldehyde vapor were overlaying with a slightly stronger minimum at
222 nm for the formaldehyde crosslinked fibers. The local minimum at 210 nm and the
maximum at 195 nm as well as the overall intensity were similar for crosslinked and
noncrosslinked fibers. Hence, the untreated and crosslinked scaffolds have a similar content
of secondary structures. Untreated fibrinogen scaffolds showed 19 ± 1 % α-helical and 32 ±
1 % β-sheet structures. Crosslinked fibrinogen scaffolds showed 20 ± 1 % α-helical and 33
± 1 % β-sheet content (Figure 54).
5.2.7. Secondary structure of dried and rehydrated fibrinogen
nanofibers
In the third experiment, the secondary structure of the crosslinked fibrinogen fibers was
analyzed after rehydration in water to investigate whether the changes in secondary

110
structure observed during the fiber formation were persistent. Surprisingly, the rehydration
experiments revealed that crosslinked fibers change their conformation upon rehydration.
The secondary structure of crosslinked fibers after rehydration returned into α-helical and
β-sheet contents close to native fibrinogen or fibrin.
Figure 55: Effect of rehydration on the secondary structure of crosslinked fibrinogen fibers CD spectra for fibrinogen in solution, fibrinogen nanofibers prepared by drying in the presence of PBS, formaldehyde vapor crosslinked fibrinogen nanofibers, which were subsequently rehydrated, and fibrin. The circular dichroism spectra were converted into secondary structure content represented in the bar chart using the BeStSel web server. Image modified from (Stapelfeldt et al., 2019b).
For comparison, the spectra and structure composition of fibrinogen solution and fibrin
shown above were added to the graph. The spectra of dried and of rehydrated fibers showed
similar minima at 210 and 222 nm; however, the spectrum of rehydrated fibers had a higher
intensity. Interestingly, the spectrum of rehydrated fibers had an intermediate intensity
between the spectra of dried fibers and the spectra of fibrin or fibrinogen in solution. In
addition, the calculated secondary structure content returned to values similar to fibrinogen
solution or fibrin. While crosslinked fibrinogen still showed an increased β-sheet content of
32 ± 1 % and 19 ± 1 % α-helical content, the rehydrated fibrinogen showed a β-sheet
content of only 26 ± 1 % and a α-helix content 24 ± 1 %. This is close to the 27 ± 1 % or 28
± 1 % of β-sheets and the 26 ± 1 % or 27 ± 1 % of α-helix content calculated for fibrinogen
in solution and fibrin.
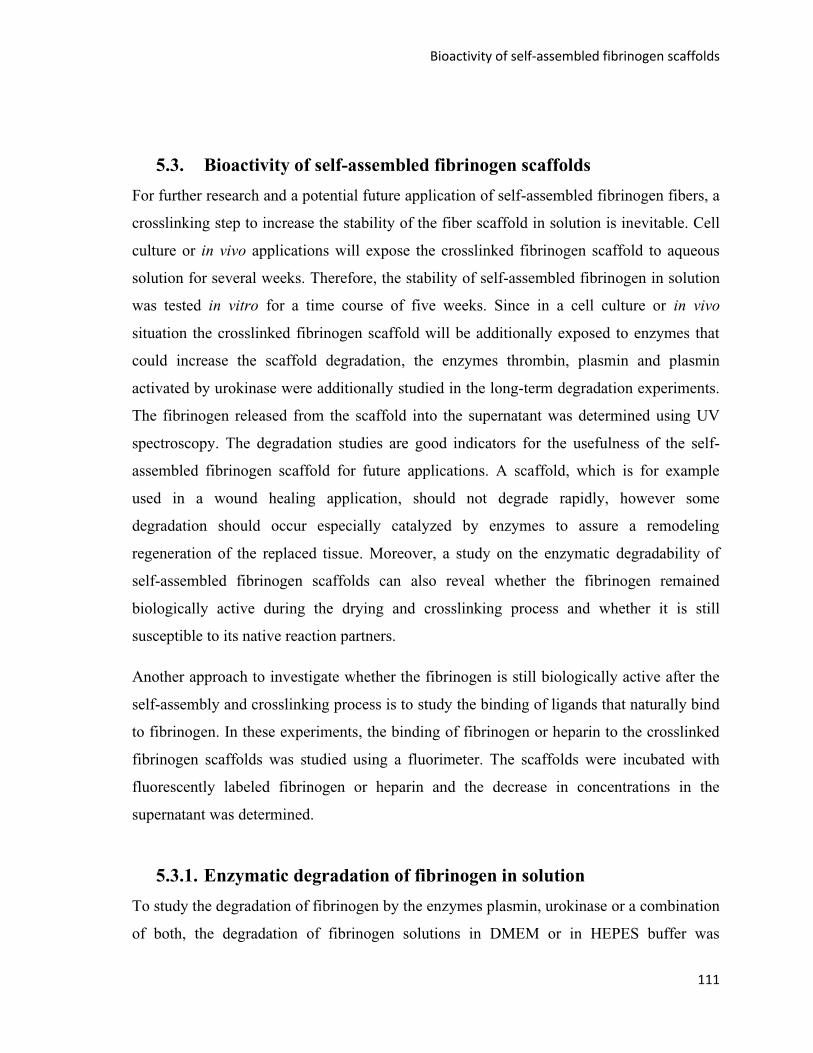
Bioactivity of self-assembled fibrinogen scaffolds
111
5.3. Bioactivity of self-assembled fibrinogen scaffolds
For further research and a potential future application of self-assembled fibrinogen fibers, a
crosslinking step to increase the stability of the fiber scaffold in solution is inevitable. Cell
culture or in vivo applications will expose the crosslinked fibrinogen scaffold to aqueous
solution for several weeks. Therefore, the stability of self-assembled fibrinogen in solution
was tested in vitro for a time course of five weeks. Since in a cell culture or in vivo
situation the crosslinked fibrinogen scaffold will be additionally exposed to enzymes that
could increase the scaffold degradation, the enzymes thrombin, plasmin and plasmin
activated by urokinase were additionally studied in the long-term degradation experiments.
The fibrinogen released from the scaffold into the supernatant was determined using UV
spectroscopy. The degradation studies are good indicators for the usefulness of the self-
assembled fibrinogen scaffold for future applications. A scaffold, which is for example
used in a wound healing application, should not degrade rapidly, however some
degradation should occur especially catalyzed by enzymes to assure a remodeling
regeneration of the replaced tissue. Moreover, a study on the enzymatic degradability of
self-assembled fibrinogen scaffolds can also reveal whether the fibrinogen remained
biologically active during the drying and crosslinking process and whether it is still
susceptible to its native reaction partners.
Another approach to investigate whether the fibrinogen is still biologically active after the
self-assembly and crosslinking process is to study the binding of ligands that naturally bind
to fibrinogen. In these experiments, the binding of fibrinogen or heparin to the crosslinked
fibrinogen scaffolds was studied using a fluorimeter. The scaffolds were incubated with
fluorescently labeled fibrinogen or heparin and the decrease in concentrations in the
supernatant was determined.
5.3.1. Enzymatic degradation of fibrinogen in solution
To study the degradation of fibrinogen by the enzymes plasmin, urokinase or a combination
of both, the degradation of fibrinogen solutions in DMEM or in HEPES buffer was
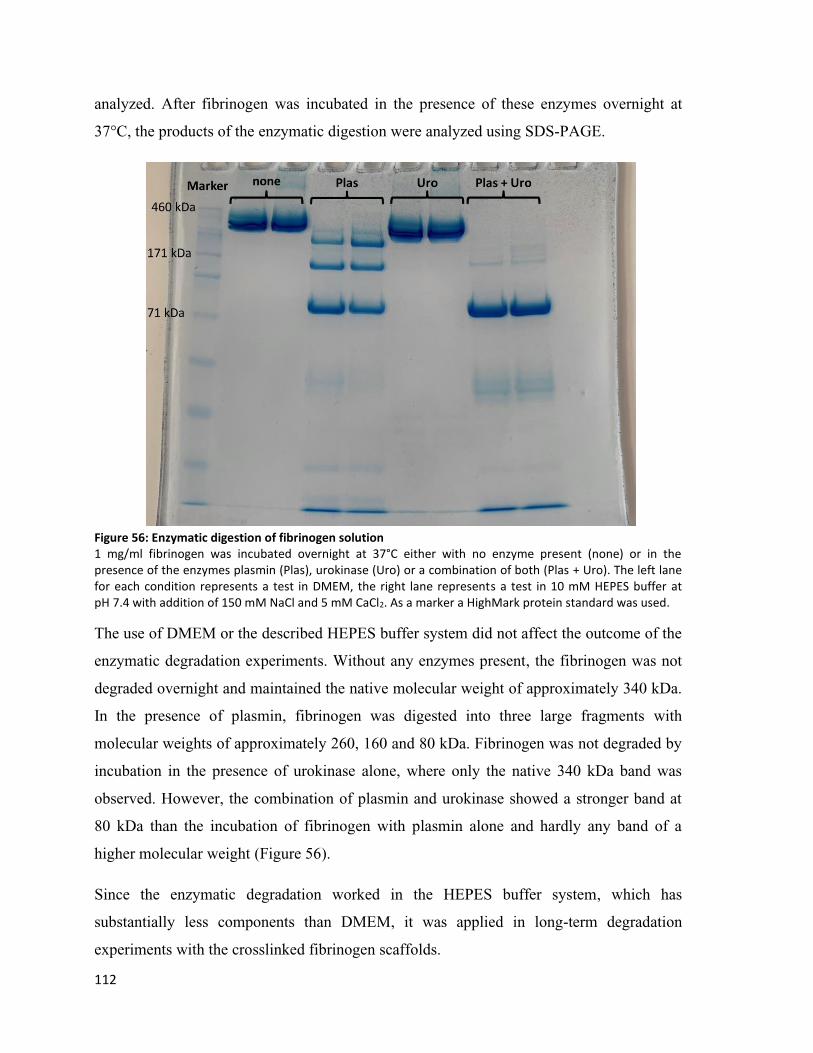
112
analyzed. After fibrinogen was incubated in the presence of these enzymes overnight at
37°C, the products of the enzymatic digestion were analyzed using SDS-PAGE.
Figure 56: Enzymatic digestion of fibrinogen solution 1 mg/ml fibrinogen was incubated overnight at 37°C either with no enzyme present (none) or in the presence of the enzymes plasmin (Plas), urokinase (Uro) or a combination of both (Plas + Uro). The left lane for each condition represents a test in DMEM, the right lane represents a test in 10 mM HEPES buffer at pH 7.4 with addition of 150 mM NaCl and 5 mM CaCl2. As a marker a HighMark protein standard was used.
The use of DMEM or the described HEPES buffer system did not affect the outcome of the
enzymatic degradation experiments. Without any enzymes present, the fibrinogen was not
degraded overnight and maintained the native molecular weight of approximately 340 kDa.
In the presence of plasmin, fibrinogen was digested into three large fragments with
molecular weights of approximately 260, 160 and 80 kDa. Fibrinogen was not degraded by
incubation in the presence of urokinase alone, where only the native 340 kDa band was
observed. However, the combination of plasmin and urokinase showed a stronger band at
80 kDa than the incubation of fibrinogen with plasmin alone and hardly any band of a
higher molecular weight (Figure 56).
Since the enzymatic degradation worked in the HEPES buffer system, which has
substantially less components than DMEM, it was applied in long-term degradation
experiments with the crosslinked fibrinogen scaffolds.
Long-term enzymatic degradation of self-assembled fibrinogen scaffolds
113
5.3.2. Long-term enzymatic degradation of self-assembled fibrinogen
scaffolds
The long-term stability of fibrinogen scaffolds prepared by self-assembly was investigated
in solution or in the presence of the enzymes thrombin, urokinase or plasmin, since these
enzymes are interacting with fibrin or fibrinogen in the in vivo environment. Planar or
nanofibrous fibrinogen scaffolds were crosslinked in formaldehyde vapor for one or two
hours, respectively, and were subsequently incubated in the presence of different enzymes
for 35 days at 37°C. To measure whether degraded fragments of fibrinogen were released
into the supernatant, each week the total protein amount in the supernatant was determined
by spectroscopy.
Figure 57: Long-term degradation of fibrinogen scaffolds Scaffolds were prepared by drying a 5 mg/ml fibrinogen solution. For the induction of nanofiber formation 2.5x PBS were present. The scaffolds were crosslinked by exposing them to formaldehyde vapor for 1 or 2 h. After washing, the scaffolds were exposed to the indicated enzymes or HEPES buffer at 37°C for 35 days and the total protein amount in the supernatant was determined each week. The data displayed for HEPES, thrombin, plasmin and plasmin + urokinase represent means and standard deviation of three independent experiments. The data of thrombin and plasmin for each time point were analyzed for significant differences in respect to the HEPES buffer data of that condition by two way ANOVA and a Tukey’s multiple comparison test. No significant differences between the protein amount of HEPES and the protein amounts of thrombin or plasmin were found.
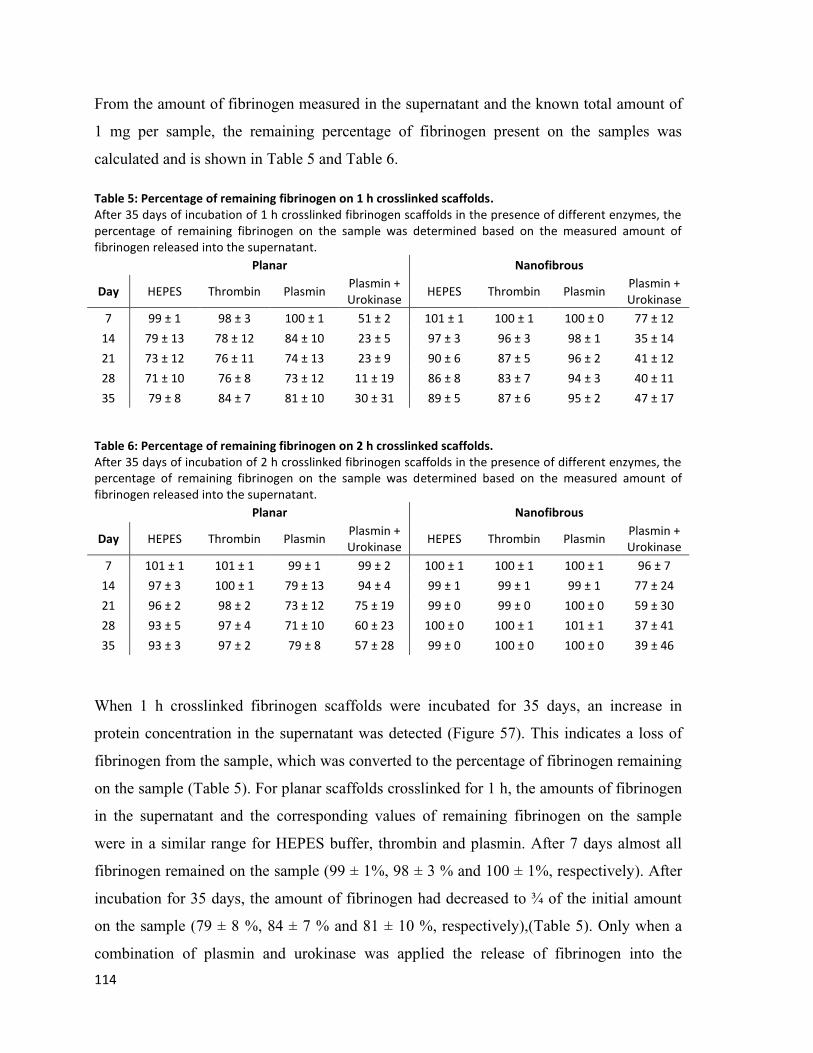
114
From the amount of fibrinogen measured in the supernatant and the known total amount of
1 mg per sample, the remaining percentage of fibrinogen present on the samples was
calculated and is shown in Table 5 and Table 6.
Table 5: Percentage of remaining fibrinogen on 1 h crosslinked scaffolds. After 35 days of incubation of 1 h crosslinked fibrinogen scaffolds in the presence of different enzymes, the percentage of remaining fibrinogen on the sample was determined based on the measured amount of fibrinogen released into the supernatant.
Planar Nanofibrous
Day HEPES Thrombin Plasmin Plasmin + Urokinase
HEPES Thrombin Plasmin Plasmin + Urokinase
7 99 ± 1 98 ± 3 100 ± 1 51 ± 2 101 ± 1 100 ± 1 100 ± 0 77 ± 12
14 79 ± 13 78 ± 12 84 ± 10 23 ± 5 97 ± 3 96 ± 3 98 ± 1 35 ± 14
21 73 ± 12 76 ± 11 74 ± 13 23 ± 9 90 ± 6 87 ± 5 96 ± 2 41 ± 12
28 71 ± 10 76 ± 8 73 ± 12 11 ± 19 86 ± 8 83 ± 7 94 ± 3 40 ± 11
35 79 ± 8 84 ± 7 81 ± 10 30 ± 31 89 ± 5 87 ± 6 95 ± 2 47 ± 17
Table 6: Percentage of remaining fibrinogen on 2 h crosslinked scaffolds. After 35 days of incubation of 2 h crosslinked fibrinogen scaffolds in the presence of different enzymes, the percentage of remaining fibrinogen on the sample was determined based on the measured amount of fibrinogen released into the supernatant.
Planar Nanofibrous
Day HEPES Thrombin Plasmin Plasmin + Urokinase
HEPES Thrombin Plasmin Plasmin + Urokinase
7 101 ± 1 101 ± 1 99 ± 1 99 ± 2 100 ± 1 100 ± 1 100 ± 1 96 ± 7
14 97 ± 3 100 ± 1 79 ± 13 94 ± 4 99 ± 1 99 ± 1 99 ± 1 77 ± 24
21 96 ± 2 98 ± 2 73 ± 12 75 ± 19 99 ± 0 99 ± 0 100 ± 0 59 ± 30
28 93 ± 5 97 ± 4 71 ± 10 60 ± 23 100 ± 0 100 ± 1 101 ± 1 37 ± 41
35 93 ± 3 97 ± 2 79 ± 8 57 ± 28 99 ± 0 100 ± 0 100 ± 0 39 ± 46
When 1 h crosslinked fibrinogen scaffolds were incubated for 35 days, an increase in
protein concentration in the supernatant was detected (Figure 57). This indicates a loss of
fibrinogen from the sample, which was converted to the percentage of fibrinogen remaining
on the sample (Table 5). For planar scaffolds crosslinked for 1 h, the amounts of fibrinogen
in the supernatant and the corresponding values of remaining fibrinogen on the sample
were in a similar range for HEPES buffer, thrombin and plasmin. After 7 days almost all
fibrinogen remained on the sample (99 ± 1%, 98 ± 3 % and 100 ± 1%, respectively). After
incubation for 35 days, the amount of fibrinogen had decreased to ¾ of the initial amount
on the sample (79 ± 8 %, 84 ± 7 % and 81 ± 10 %, respectively),(Table 5). Only when a
combination of plasmin and urokinase was applied the release of fibrinogen into the

Long-term enzymatic degradation of self-assembled fibrinogen scaffolds
115
supernatant was accelerated. Even after 7 days, a substantial amount of fibrinogen was
detected in the supernatant and only 51 ± 2 % of fibrinogen remained on the sample (Figure
57, Table 5). Fibrous scaffolds showed a similar degradation behavior but with a lower
release of fibrinogen into the supernatant. After 35 days incubation in HEPES buffer
thrombin or plasmin 89 ± 5%, 87 ± 6% and 95 ± 2 % of fibrinogen remained on the
scaffold, respectively (Table 5). Here the combination of plasmin and urokinase resulted in
a stronger release of fibrinogen into the supernatant, too. After 7 days 77 ± 12 % of
fibrinogen was still present on the sample, while after 35 only 47 ± 17% were present,
when the samples were incubated with plasmin and urokinase (Figure 57, Table 5).
The release of fibrinogen into the supernatant was overall lower when planar of
nanofibrous fibrinogen scaffolds were crosslinked for 2 h (Figure 57). When planar
scaffolds crosslinked for 2 h were incubated in HEPES buffer, thrombin or plasmin 93 ±
3 %, 97 ± 2% or 79 ± 8% of the fibrinogen were still present on the sample after 35 days
(Table 6). Incubation with a combination of plasmin and urokinase resulted in a higher
content of fibrinogen into the supernatant while 57 ± 28% remained on the planar samples
after 35 days (Figure 57, Table 6).
Nanofibrous samples crosslinked for 2 h showed an even lower release of fibrinogen into
the supernatant (Figure 57). When the scaffolds were incubated in HEPES buffer, thrombin
or plasmin hardly any fibrinogen was detected in the supernatant and almost all fibrinogen
remained on the sample. Only incubation in the presence of plasmin and urokinase resulted
in a release of fibrinogen into the supernatant and after 35 days 39 ± 46 % remained on the
sample (Figure 57, Table 6).
Morphology of self-assembled fibrinogen scaffolds after 35 days of degradation
After 35 days of incubation, the samples of the long-term experiment were dried and the
morphology was analyzed in the SEM.
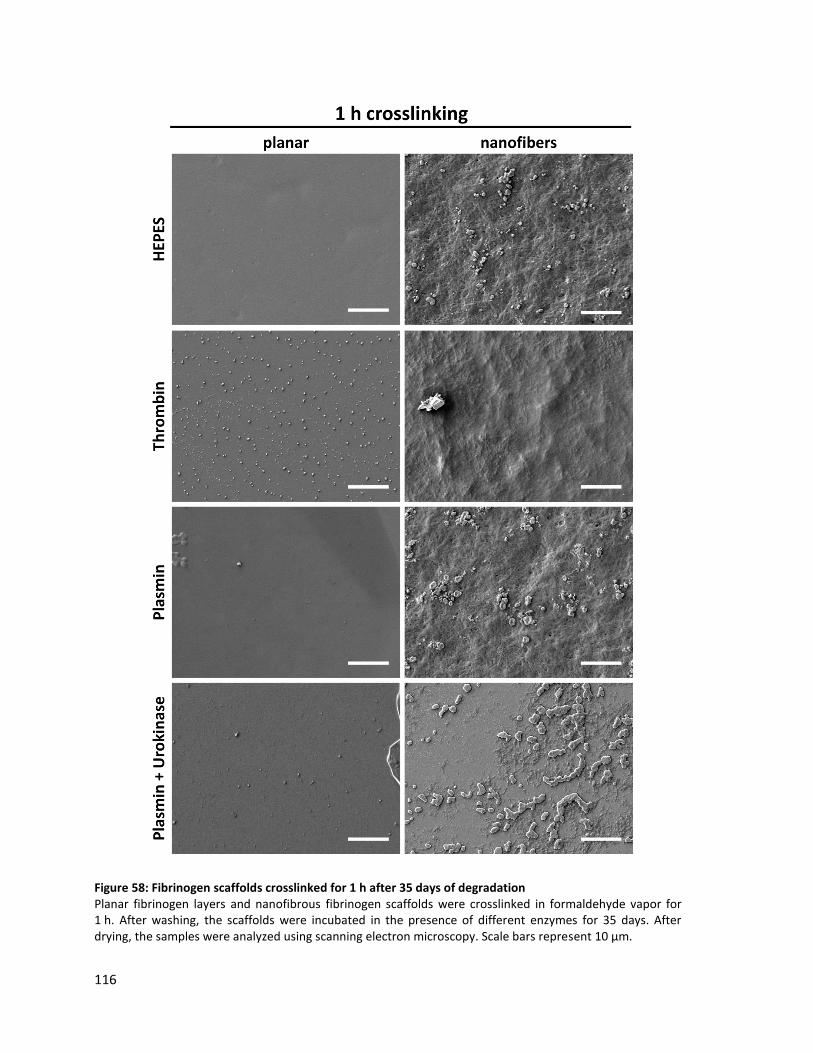
116
Figure 58: Fibrinogen scaffolds crosslinked for 1 h after 35 days of degradation Planar fibrinogen layers and nanofibrous fibrinogen scaffolds were crosslinked in formaldehyde vapor for 1 h. After washing, the scaffolds were incubated in the presence of different enzymes for 35 days. After drying, the samples were analyzed using scanning electron microscopy. Scale bars represent 10 µm.

Long-term enzymatic degradation of self-assembled fibrinogen scaffolds
117
Figure 59: Fibrinogen scaffolds crosslinked for 2 h after 35 days of degradation
Planar fibrinogen layers and nanofibrous fibrinogen scaffolds were crosslinked in formaldehyde vapor for 2 h. After washing, the scaffolds were incubated in the presence of different enzymes for 35 days. After drying, the samples were analyzed using scanning electron microscopy. Scale bars represent 10 µm.
118
Scanning electron microscopy revealed that the planar samples crosslinked for 1 h
maintained a planar morphology after 35 days of incubation with HEPES buffer, thrombin,
plasmin or a combination of plasmin and urokinase. Some salt crystals were observed,
especially on thrombin treated samples (Figure 58). Fibrous samples crosslinked for 1 h
showed some remains of the nanofiber scaffolds after 35 days of incubation in the presence
of HEPES buffer, thrombin or plasmin. However, the scaffolds showed a poor fiber
morphology and appeared in a molten like shape, especially after incubation with thrombin
(Figure 58). After incubation of a 1 h crosslinked nanofiber scaffold with plasmin and
urokinase on the other hand only a few aggregated remains of the fibrinogen scaffold were
observed under the SEM (Figure 58).
Planar samples that were crosslinked for 2 h remained planar after 35 days of incubation in
HEPES buffer, thrombin, plasmin or a combination of plasmin and urokinase. On samples
incubated in HEPES buffer, additional crystal formation was observed (Figure 59). When
fibrous samples crosslinked for 2 h were incubated in HEPES buffer, intact scaffold
morphology with defined fibers was still observed under SEM. After incubation in the
presence of thrombin or plasmin, the overall scaffold morphology was not affected but the
fibers of the scaffold showed a molten like topography. However, after 35 days incubation
in the presence of plasmin and urokinase only patchy aggregates of fibrinogen remained on
the surface of the 2 h crosslinked samples (Figure 59).
Overall, the long-term experiments indicate that crosslinked fibrinogen scaffolds prepared
by self-assembly slowly degraded over time. This trend is stronger for planar as for fibrous
samples. The crosslinking time had a strong impact on the scaffold morphology after 35
days, which is in agreement with the measured amounts of fibrinogen in the supernatant.
With 1 h formaldehyde vapor crosslinking, more fibrinogen is released into the supernatant
and fibrinogen scaffolds showed fewer nanofibers, whereas with 2 h crosslinking, less
fibrinogen was released into the supernatant and some fibrous structures remained on the
samples. Incubation with a combination of plasmin and urokinase resulted in high amounts
of protein in the supernatant. Consistent with these findings the morphology of the
fibrinogen scaffolds incubated with plasmin and urokinase showed only a few patchy
scaffold remains. The data indicate a slow degradation that is present in all buffers
Binding of fibrinogen and heparin to self-assembled fibrinogen scaffolds
119
dependent on the crosslinking time. This degradation was accelerated by the combination
of plasmin and urokinase.
5.3.3. Binding of fibrinogen and heparin to self-assembled fibrinogen
scaffolds
In order to analyze if crosslinked planar layers or self-assembled fibrous scaffolds of
fibrinogen are still able to interact with some of their native ligands, binding experiments
were conducted using fibrinogen or heparin in solution as potential binding partners for the
crosslinked fibrinogen. Planar layers of self-assembled fibrous scaffolds of fibrinogen were
prepared on APTES slides and crosslinked in formaldehyde vapor for 1 h, because 1 h
crosslinking showed the highest susceptibility to enzymatic degradation in the previous
experiments. In a second step, fluorescently labeled fibrinogen or heparin solution was
added upon the samples. After 1 h incubation at room temperature, the concentration of
labeled fibrinogen or heparin in the supernatant was measured to analyze how much
fibrinogen or heparin had bound to the sample. The samples were washed and the
fibrinogen or heparin concentration in the washing fraction was measured to exclude
unbound fibrinogen or heparin.
To compare the amount of bound fibrinogen or heparin, the experiment was also carried out
on APTES surfaces or on BSA surfaces that were prepared in the presence or absence of
PBS. With these control experiments, the unspecific binding to APTES surfaces and
unspecific protein interactions of the labeled fibrinogen or heparin was determined.

120
Figure 60: Binding of fibrinogen or heparin to planar or nanofibrous fibrinogen Planar fibrinogen layers and nanofibrous fibrinogen scaffolds were prepared on APTES surfaces and crosslinked in formaldehyde vapor for 1 h. Similar to planar and nanofibrous fibrinogen, BSA control samples were prepared and crosslinked. The binding to APTES surfaces was analyzed without further crosslinking. Alexa 488-labeled fibrinogen or heparin were incubated on the samples and after 1 h, the remaining concentration in the supernatant was measured using fluorimetry. The samples were washed and the concentration of labeled fibrinogen or heparin in the washing fraction was determined. With the remaining concentration and the concentration redissolved into the supernatant the concentration of bound fibrinogen was calculated.

Binding of fibrinogen and heparin to self-assembled fibrinogen scaffolds
121
The binding experiments revealed that most of the labeled fibrinogen (60 to 90 %)
remained in the incubation supernatant and was not bound to any of the substrates. In
addition, 10 to 15% of the labeled fibrinogen, which had not bound to the substrates, was
observed in the washing fraction. Only 22, 18, 17, 11 or 6 % of the labeled fibrinogen had
bound to APTES, BSA, BSA and PBS, planar fibrinogen scaffolds or fibrous fibrinogen
scaffolds, respectively.
In addition, the binding of heparin to the substrates was low. The majority of the labeled
heparin was detected in the incubation supernatant (50 to 95 %) and roughly 10% were
additionally found in the washing fraction. This resulted in a percentage of fibrinogen
bound to APTES, BSA, BSA and PBS, planar fibrinogen scaffolds or fibrous fibrinogen of
18, 9, 36, 0 or 13 %, respectively.
Overall, planar and nanofibrous fibrinogen scaffolds showed the lowest binding of labeled
fibrinogen and of labeled heparin, while the unspecific binding to APTES or to BSA
substrates was higher.
122
6. Discussion
6.1. Morphology of self-assembled fibrinogen scaffolds
When fibrinogen solutions were dried in the presence of citrate, phosphate buffer or PBS
the SEM analysis revealed that networks of fibrinogen nanofibers had formed. The fiber
networks had similar fiber diameters and showed a characteristic star-shaped morphology.
However, when fibrinogen was dried in the presence of NH4HCO3 solution without any
additions only planar fibrinogen layers were observed.
The possibility to prepare planar fibrinogen layers is one major advantage of the newly
discovered fibrinogen self-assembly. This allows to prepare planar 2D fibrinogen controls
in addition to the 3D fibrinogen fiber scaffolds. The preparation of planar fibrinogen layers
as reference samples has been neglected by other methods described for fabrication of
fibrinogen nanofibers (Koo et al., 2010; Wei et al., 2008b; Wnek et al., 2003). Planar
control samples are a useful tool to design experiments, which investigate and distinguish
the effects of fibrinogen biochemistry and the morphology of the fibrinogen substrate,
especially concerning cellular interactions. Moreover, planar samples might also prove
useful for an application as a biomaterial because they have different structural properties
and therefore provide a different interface for biological interactions.
During the drying, the NH4HCO3 solution completely evaporated in the form of ammonia
carbon dioxide and water. In contrast, citrate, phosphate buffer or PBS contain ions that do
not evaporate during the drying process. Apparently, the combination of drying and the
presence of ions are crucial for the self-assembly of the fibrinogen into fiber scaffolds.
Fibrinogen fiber formation due to drying in the presence of ions has not been described
before. However, Reichert and coworkers, who investigated fibrinogen assembly on
hydrophobic surfaces, discussed that the presence of positively charged potassium and
sodium ions might have an additional effect on fiber formation (Reichert et al., 2009).
However, Reichert and coworkers considered the exposure of fibrinogen to hydrophobic
surfaces as the main driving force of fiber formation and did not further investigate their
hypothesis about the effect of ions. In contrast, the presence of ions during drying seems to
be the main driving force for the self-assembly mechanism discovered in this thesis.
Morphology of self-assembled fibrinogen scaffolds
123
Planar fibrinogen prepared by drying in the presence of NH4HCO3 solution was
transparent, while the fibrinogen fiber formation during the drying in the presence of ions
was accompanied by a change in turbidity. A change of turbidity is also observed during
the formation of fibrin fibers and is frequently used to quantify the thrombin catalyzed
conversion of fibrinogen into fibrin (Davis et al., 2011) as well as the formation of other
fibrous protein networks, like for example collagen (Zhu and Kaufman, 2014). However,
these changes in turbidity already occur in solution. Nevertheless, the change in turbidity
observed during late stages of fibrinogen self-assembly raises one of the main initial
questions about the newly found mechanism of fibrinogen fiber formation; if the fibrous
scaffolds consist of fibrinogen fibers or if they are actual fibrin fibers formed by the
reaction of fibrinogen and some thrombin contamination.
Although the fibrinogen used in this thesis had a purity of 99%, it is important to prove that
the observed fiber formation is not due to some trace contaminations of thrombin. A first
indication that the fibers prepared by drying in the presence of ions are no fibrin fibers, are
the morphological differences. Although the fibers prepared by drying in the presence of
ions had diameters in the range of fibrin fiber diameters, the overall morphology of the
fibrinogen scaffolds was different compared to fibrin. While fibrin fibers show a
homogenous network, the fibrinogen fibers prepared by drying formed a fibrous network
with local star-shaped center points of a higher fibrinogen density (Figure 26). A further
strong indicator that the fiber formation relied on an unknown and thrombin-independent
mechanism is the fact that planar fibrinogen layers can be prepared by drying fibrinogen in
NH4HCO3 solution. A trace contamination of thrombin in the fibrinogen stock would have
induced fiber formation in all samples including those where fibrinogen was dried in
NH4HCO3 solution without additional ions present.
To fully exclude any possible involvement of thrombin residues in the fiber formation,
fibrinogen was dried in the presence of PBS with an addition of 4-(2-
aminoethyl)benzenesulfonyl fluoride hydrochloride (AEBSF). AEBSF is a strong inhibitor
for serine proteases, which covalently binds to the active center and thereby inactivates any
potential trace amounts of thrombin (Markwardt et al., 1973).

124
The self-assembly studies with the thrombin inhibitor AEBSF showed that fiber formation
still occurred even when high concentrations of AEBSF were present. Therefore, it can be
concluded that thrombin is not involved in the formation of fibrinogen fibers and that the
salt-induced self-assembly is based on an enzyme-independent mechanism.
An additional indication that the fibrinogen fiber scaffolds are not fibrin is the fact that
fibrin is stable in solution while the fibrinogen fibers prepared by drying in the presence of
ions were not stable without further crosslinking treatment.
The findings of this thesis show that drying of fibrinogen in the presence of PBS induces
fiber formation. Since PBS contains different salts, fibrinogen was also dried in the
presence of the single components of PBS. Drying with high concentrations of NaCl or KCl
was sufficient to induce fibrinogen fiber formation, but with less abundant fibers and a less
distinct fiber morphology as compared to drying with PBS. With a low concentration of
KCl no fiber formation was observed, which could indicate that KCl has a lower potential
to initiate self-assembly and that a KCl concentration threshold has to be overcome obtain
fibrinogen fiber networks.
Interestingly, a recent study by Hämisch and coworkers investigated the aggregation of
fibrinogen in solutions of with different ion compositions and different ionic strengths and
found an opposite effect of the fiber formation observed in this thesis. Hämisch and
coworkers observed an aggregation of fibrinogen when the concentration of ions was
diluted, which was confirmed by an increase in hydrodynamic diameter. This was
interpreted as a form of self-assembly, although it is unclear if this assembly leads to
fibrinogen fibers. AFM images presented by Hämisch rather indicate an assembly into
globular aggregates (Hämisch et al., 2019).
In contrast, the fibrinogen self-assembly of fibrinogen observed in this thesis resulted in
aggregation of fibrinogen into fibers and was initiated by an increasing ion concentration
during the drying process.
High concentrations of certain salts can be used to precipitate proteins by salting them out.
The potential of ions to precipitate proteins has been described in the Hofmeister series,
which categorizes ions as chaotropic or kosmotropic. Chaotropic ions disrupt hydrogen

Morphology of self-assembled fibrinogen scaffolds
125
bridges and therefore have a low potential to precipitate proteins. Strong chaotropic ions
can even denature protein structures by reducing the order in of hydrogen bridges.
Kosmotropic ions, on the other hand, stabilize hydrogen bridges and have a great potential
to precipitate proteins (Baldwin, 1996; Zhang and Cremer, 2006).
All ion species used for the preparation of fibrinogen networks are classified somewhere in
the middle of the Hofmeister series. Remarkable is the fact that KCl, which showed less
potential to form fibrinogen fibers, has a slightly higher potential to precipitate proteins
compared to NaCl. Even more remarkable, the NH4HCO3 solution, which resulted in planar
fibrinogen layers, has an even higher potential for protein aggregation, since NH4+ ions and
CO3- ions are even less chaotropic than NaCl or KCl (Baldwin, 1996; Zhang and Cremer,
2006).
During drying the concentration of each ion increases up to the point, where fibrinogen
began to precipitate. It is counterintuitive that the most chaotropic salt NaCl resulted in
organized fibrinogen fibers, while salts with a better potential to aggregate fibrinogen
resulted in planar or globular structures. This indicates that planar fibrinogen layers formed
under drying conditions where fibrinogen has a low solubility, while fibrinogen fibers
formed during drying under conditions where fibrinogen had a high solubility. Probably
planar layers prepared in the presence of NH4HCO3 form during an early stage within the
drying process since the point where the NH4HCO3 concentration is sufficient to precipitate
is reached quicker in comparison to fibrinogen, which is dried in the presence of ions. Here,
the point of fibrinogen precipitation will be reached in a very late stage because higher
concentrations of sodium or potassium ions are needed to precipitate the fibrinogen.
Nevertheless, the formation of planar and fibrous fibrinogen scaffolds is not directly
induced and both events happen most likely at the end of the drying process. It also has to
be taken into account that the NH4HCO3 evaporated during the drying process, which leads
to a lower potential for protein aggregation. Nevertheless, to fully understand the influence
of chaotropic agents, the fibrinogen drying experiments should be continued with even
more chaotropic salts from the Hofmeister series like nitrate or iodide salts. In addition,
charge effects could be investigated using divalent ions like calcium or magnesium.
However, this approach would be challenging and the results would be hard to interpret,
due to two reasons. Calcium and magnesium have a high potential to form complexes with
126
proteins, which might interfere with the fiber formation observed in the presence of
monovalent cations. Secondly, it has been shown that different ion species of the same
charge (like sodium or potassium) show a different fibrinogen precipitation behavior. This
indicates that charge effects are not the main factor during fibrinogen fibrillogenesis and
that the Hofmeister effects have a stronger influence like describe for other proteins
(Moreira et al., 2006).
The precipitation of proteins by different salts is not completely understood. Less
chaotropic salts are known to stabilize hydrogen bridges between protein molecules thereby
allowing aggregation. On the other hand, the presence of ions also has an influence on the
hydration shell of the protein molecules in solution, which is even higher for more
chaotropic salts. Since more chaotropic salts showed a slightly higher effect on fibrinogen
fiber formation, it seems likely that the effect on the hydration shell of the protein is
involved in the formation of fibrinogen fibers. Interactions and even aggregation of
fibrinogen molecules with a weaker hydration shell, induced by chaotropic salts seems
plausible. It has been shown that the hydrodynamic diameter of fibrinogen changes
dependent on the pH and on the ionic strength, which makes a similar effect due to the
presence of chaotropic salts likely (Wasilewska et al., 2009).
It also has to be considered that the pH value of pure NaCl and KCl solutions differs from
the pH value of PBS. The influence of the pH is an important aspect of fiber formation.
Fiber formation was also observed, when potassium phosphate buffer (pH 7.4) was used
but with a lower fiber density and less distinct fiber morphology as compared to fibers
prepared with sodium phosphate buffer. This is an additional indication that buffer
containing potassium has a lower potential to induce self-assembly of fibrinogen fiber
because potassium ions are not as chaotropic as sodium ions.
Overall, the findings show that a high concentration of monovalent ions during drying
alone is sufficient to induce fibrinogen fiber formation and that the chaotropic potential of
the used ions has an influence. Nevertheless, the following experiments were conducted
using PBS and sodium phosphate buffer, because drying in the presence of those buffers
resulted in the most defined fibrinogen fiber morphology and those buffers allow an
accurate adjustment of the pH.
Morphology of self-assembled fibrinogen scaffolds
127
The thresholds of fibrinogen fiber formation were analyzed with regard to fibrinogen
concentration, buffer concentration and pH. The determination of conditions under which
fiber formation does occur or does not occur allows to gain insight into the mechanism of
fiber formation.
Formation of fibrinogen fibers was observed with all applied concentrations of phosphate
buffer or PBS. Apparently, fiber formation during drying is even induced when only low
concentrations of ions are present. The phosphate buffer or PBS concentration also had no
effect on the fiber diameter. However, the used buffer concentration was correlated to total
substrate coverage of the fibrinogen scaffold on the glass slides. With low concentrations of
phosphate buffer or PBS the fibrinogen fiber scaffolds were only observed in a small part in
the center of the sample. This indicates that with low buffer concentrations the required
conditions are reached in a very late stage of the drying process, but are reached due to a
concentration of the buffer during drying.
During the drying process, water evaporates and the fibrinogen concentration increases,
therefore, the concentration independent behavior observed for the buffers should be
similar for the starting concentration of fibrinogen, but interestingly it is not. The
experiments, which analyzed the fiber formation with different fibrinogen starting
concentrations showed that with concentrations lower than 2 mg/ml no fiber formation was
observed at all in both buffer systems. It is remarkable that the increase in fibrinogen
concentration during the drying process is not sufficient to induce at least some fiber
formation when the starting concentration is too low. Interestingly, the useful initial
concentrations for salt-induced self-assembly of fibrinogen fibers are in the range of the
concentration of fibrinogen in the blood plasma (Mosesson, 2005; Stein et al., 1978). Other
investigations of fibrinogen self-assembly, for example on hydrophobic surfaces, observed
fibrinogen fibers with concentration of even 1 µg/ml (Wei et al., 2008a) or 200 µg/ml (Koo
et al., 2010). The use of electrospinning for the fabrication of fibrinogen fibers on the other
hand requires fibrinogen high concentrations of up to 167 g/ml (Wnek et al., 2003).
The fibrinogen concentration of 2 mg/ml, which is required for salt induced self-assembly
is an interesting observation, especially since the threshold for fiber formation seems to be
much lower for the self-assembly of fibrinogen on hydrophobic surfaces. This could
128
indicate that either both self-assembly methods rely on different mechanisms or that the
presence of a hydrophobic surface strongly enhances the self-assembly of fibrinogen fibers.
An additional observation of the concentration experiments was the fact that total scaffold
thickness increased when higher starting concentrations were used. The scaffolds reached
thicknesses up to 10 µm, while the studies that used low fibrinogen concentrations only
resulted in single fibers. The findings in this thesis also show that fibrinogen fibers are
present throughout the whole scaffold thickness. This indicates that none of the used
fibrinogen concentration was too high and had an inhibitory effect on fibrinogen self-
assembly. It can be presumed that even higher concentrations of fibrinogen or a layer-by-
layer approach could be used to prepare thicker scaffolds. The scaffold thickness will be an
important factor for wound healing applications of fibrinogen scaffolds, because the
scaffolds should be thick enough to withstand the blood pressure and the mechanical stress
of a wound. A thick scaffold is also easier to handle during application. However, the
thicker the fibrinogen scaffolds the longer the integration time and the replacement of
fibrinogen with regenerated tissue. Therefore, the suggested layer-by-layer approach might
be useful to create scaffolds with applicable mechanic and a low scaffold thickness.
Other approaches like fibrinogen fiber formation on hydrophobic surfaces (Koo et al.,
2010; Reichert et al., 2009), ethanol-induced fibrinogen fiber formation (Wei et al., 2008b),
acidic fibrinogen denaturation (Wei et al., 2008a) or fibrinogen extrusion (Raoufi et al.,
2016) only yielded in scarce fibrinogen fibers or had a poor reproducibility, which makes
the application of these methods impractical. The only other reproducible method to
fabricate self-supporting fibrinogen fiber scaffolds with a high density of fibers and
dimensions in the centimeter range is electrospinning. However, obtaining an electrospun
fibrinogen scaffold with similar dimensions requires several ml of a 100 to 167 mg/ml
fibrinogen solution (Sell et al., 2008a; Wnek et al., 2003), while for salt-induced self-
assembly 200 µl of a 5 mg/ml solution was sufficient. In contrast to the electrospinning, for
salt-induced fiber formation, no high voltage equipment is necessary and only aqueous
solutions are required instead of organic solvents. Therefore, salt-induced fiber formation is
a more gentle process and also more cost efficient.
Morphology of self-assembled fibrinogen scaffolds
129
The formation of fibrinogen fibers upon drying in the presence of salt ions was investigated
with phosphate buffer or PBS prepared with a pH of 5 to 9. A correlation of pH and fiber
formation was found. For both buffers a pH value of 7 or higher resulted in fibrinogen
fibers, while at pH values lower than 7 no fiber formation was observed.
The isoelectric point of fibrinogen is 5.8. Fibrinogen at higher pH is negatively charged,
while fibrinogen at lower pH is positively charged (Wasilewska et al., 2009). The absence
of fiber formation with pH values around or under the isoelectric point strongly indicates
that a negative net charge of the fibrinogen molecule is required for fiber formation.
However, the pH cannot be considered as the main driving force of fiber formation,
because fibrinogen in NH4HCO3 buffer did not form fibers even though NH4HCO3 buffer
has a pH of roughly 8.6, which should be in the pH range required for fiber formation.
Wei and coworkers used an acidic pH of 2 to induce the formation of fibrinogen fibers
(Wei et al., 2008b). In this thesis, no fibrinogen fiber formation was observed with pH
values lower than 7, with pH 5 being the lowest value. It is likely that the fiber formation
observed by Wei and coworkers was due to a different mechanism than the salt-induced
fiber formation investigated in this study. Especially since fibrinogen starts to denature at
pH values lower than 5 (Marguerie, 1977), it is likely that Wei and coworkers observed a
denaturation-induced aggregation of fibrinogen.
It also has to be taken into account that phosphate buffer or PBS have a different ionic
strength when they are prepared with different pH values. With a pH of 5 or 6 the ionic
strength of both buffers is lower as compared to higher pH. Nevertheless, the ionic strength
is probably not the reason for the absence of fiber formation at pH 5 or 6, since the
differences in ionic strength in phosphate buffer and PBS are even larger, but both show the
same pH threshold for fibrinogen fiber formation (see Table 4).
The pH also has an influence on the solubility of fibrinogen. It was shown that fibrinogen
has the lowest solubility in PBS with a pH of 5.8 (Leavis and Rothstein, 1974). The trend
that fibrinogen forms no fibers at pH values where it has a low solubility is consistent with
the influence of ions on solubility, which was discussed above. It seems that low fibrinogen
solubility leads to planar or globular fibrinogen aggregates while a high solubility results in
the formation of fibrinogen fibers. These findings indicate that the formation of fibrinogen
130
fibers or planar fibrinogen layers might occur at different time points during the drying
process. It can be presumed that under conditions wherein the pH or the ion composition
result in a low solubility of fibrinogen, the threshold for fibrinogen precipitation is reached
quickly during the drying process, which might lead to planar layers or globular aggregates.
Under conditions where fibrinogen has a high solubility, the threshold of precipitation will
be reached later. Interestingly, this delayed precipitation of fibrinogen may be the reason
for the formation of nanofibrous structures.
A recent study by Helbing and coworkers has shown that fibrinogen forms fibers on a
polyethylene surface at pH 7.4. However, at a pH of 9.2 no fiber formation was observed.
This is in contrast to our finding of fiber formation over a brought pH range during self-
assembly (pH 7 to 9). However, Helbing and coworkers used different buffers for the
experiments. Samples at a pH 7.4 were prepared in a buffer containing Na+-ions, while for
the preparation of samples at a pH of 9.2 a Ca2+-ion containing buffer was used (Helbing et
al., 2016). The presence of monovalent or divalent ions possibly had a strong influence on
the experiment conducted by Helbing and therefore an interpretation of the pH as a solely
reason for the observed fiber formation seems farfetched.
During the experiments in the self-made humidity chamber it occurred that fibrinogen dried
in the presence of PBS at high relative humidities of 50%, showed no fibers in the top view
SEM analysis. Only a later cross-sectional SEM analysis of the same samples revealed that
just the topmost layer of the sample was planar while fibrinogen fibers were present
throughout most of the sample thickness. This shows that the self-assembly of fibrinogen
by drying in the presence of salts is humidity independent. The reason for the planar top
layer that occurs when the samples are dried at high humidities is most likely condensation
of water on top of the sample, which results in a partial redissolving of the top fibrinogen
layer. Samples that contain fibers but also a planar top layer might not be suited for follow
up experiments. Therefore, it is advisable to carry out the fibrinogen self-assembly at
relative humidities of 30% to obtain fibrous scaffolds throughout the whole sample
thickness.
Many different publications described surface-induced self-assembly of fibrinogen
nanofibers, especially on hydrophobic surfaces (Dubrovin et al., 2019; Feinberg and Parker,
Morphology of self-assembled fibrinogen scaffolds
131
2010; Koo et al., 2010; Reichert et al., 2009; Zhang et al., 2017). Since the salt-induced
self-assembly of fibrinogen nanofibers was first discovered on piranha-cleaned glass, which
in contrast is very hydrophilic, it was of great interest to test the influence of surface
chemistry on the self-assembly process.
The self-assembly of fibrinogen on gold substrates resulted in planar or nanofibrous
scaffolds similar to those observed on glass substrates. Drying of fibrinogen in NH4HCO3
resulted in planar fibrinogen layers while drying in the presence of PBS resulted in
scaffolds of fibrinogen fibers. The fibrinogen scaffolds prepared on gold show a similar
star-shaped morphology as scaffold prepared on glass. Moreover, the threshold
concentration of fibrinogen and the pH threshold required for fiber formation were the
same on gold and on glass. These findings show that the self-assembly process of
fibrinogen self-assembly upon drying is possible on a more hydrophobic surface as well
and that the mechanism of fiber formation is largely independent of the surface chemistry
of the substrate. In other studies, the self-assembly of fibrinogen on gold coated substrates
has been observed as a surface reaction. However, these experiments were conducted in
solution containing 1 mg/l fibrinogen and the fiber formation was analyzed in solution
without a further drying step (Chen et al., 2009). The single fibrinogen fibers observed in
these studies strongly differed from the fibrinogen fiber scaffold prepared by drying on a
gold-coated surface in this thesis.
A gold-coated surface is more hydrophobic than a piranha-cleaned glass surfaces.
Nevertheless, most polymer surfaces are even more hydrophobic. Therefore, in addition to
glass and gold surfaces the fibrinogen fiber formation upon drying in the presence of PBS
was also studied on APTES modified glass, PLA, PS, PBAT, on parafilm and on PDMS.
The wide range of different substrates with distinct surface chemistry and hydrophobicity
that can be used as a substrate for fibrinogen fiber formation by drying in the presence of
PBS leads to the conclusion that the discovered fibrinogen self-assembly process is largely
independent of the used substrate. This is in contrast to many studies that investigated
fibrinogen self-assembly on hydrophobic surfaces and concluded that the observed fiber
formation was a surface-induced process (Dubrovin et al., 2019; Koo et al., 2010; Reichert
et al., 2009). The fibers, which were observed on hydrophobic surfaces in those studies, had
a low fiber yield and no dense fibrous scaffolds were formed. In contrast, the self-assembly
132
process established in this thesis yielded fibrous scaffolds with overall thicknesses of up to
10 µm. It seems unlikely that the bulk of fibrinogen assembled into fibers because of a
surface interaction, although it might be possible that the substrate had an influence in the
lowermost layer of fibrinogen fibers.
The possible mechanism of the fibrinogen self-assembly on hydrophobic surfaces is not
completely understood, like the mechanism studied in this thesis. Although the drying of
fibrinogen in the presence of PBS worked on all investigated surfaces and the fiber yield is
much higher than the yield of fibers formed by interaction on hydrophobic surfaces, it has
to be considered that both self-assembly processes might occur due to a similar or related
underlying mechanism. For instance, one main driving force of the PBS induced fiber
formation is the drying process. During drying water is evaporated and the fiber formation
occurs in an environment, which gradually becomes water free. A hydrophobic surface
likewise provides a two-dimensional partially water free environment. The exclusion of
water might be one underlying principle that is crucial for salt-induced self-assembly as
well as for surface-induced self-assembly of fibrinogen. This could possibly indicate that
these two ways of self-assembly are actually relying on the same mechanism, but that the
surface induced self-assembly takes place in a two-dimensional water free environment
while the salt induced self-assembly takes place in three-dimensional environment, that
become gradually water free.
The necessary absence of water for fiber formation is a factor that has not been discussed in
detail in other publications concerning the self-assembly of fibrinogen, but it seems to be a
crucial factor since fibrinogen fibers prepared by self-assembly could also easily redissolve
in water. Only Reichert and coworkers shortly discussed that the change of chemical
conditions, which occurs during the drying of the sample, might be related to fiber
formation (Reichert et al., 2009).
Fibrinogen fiber scaffolds prepared by drying in the presence of ions were not stable upon
rehydration and rapidly dissolved in aqueous buffers. Therefore, different approaches were
studied to increase the stability of fibrinogen scaffolds in aqueous environment. A
stabilization of the fibrinogen scaffolds is required since further research and a potential
future application will take place in aqueous conditions. Furthermore, an understanding of
Morphology of self-assembled fibrinogen scaffolds
133
the rapid redissolving of fibrinogen scaffolds gives some additional insight in the
mechanism of fiber formation.
When fibrinogen scaffolds prepared by drying in the presence of PBS were exposed to
water, NH4HCO3 solution or PBS, the scaffolds were completely dissolved even after
incubations as short as 5 min. The rapid dissolving of the fibrinogen scaffolds is an
additional indicator that the scaffolds are actually fibrinogen and not fibrin. Fibrin
monomers would aggregate due to the knob hole interactions, which makes a fibrin
scaffold stable in water even without additional crosslinking (Kolehmainen and Willerth,
2012). Although it has been assumed for a long time that the knob hole interactions of
fibrin are irreversible, newer studies suggest a slow dissolving and turnover rate even for
knob hole interactions. However, the dissociation of knob hole interactions is a slow
process that mostly takes place at the ends of fibrin protofibrils and does not affect the
overall stability of fibrin in solution (Chernysh et al., 2012).
The poor stability of fibrinogen scaffolds in water shows that fibrinogen fibers prepared by
drying in the presence of PBS are not fibrin. Additionally, this is a strong indication that the
binding of fibrinogen molecules involves different sequences than the knob hole domains
on the fibrinogen molecules, which results in an aggregation that is strongly susceptible to
dissolution in water. It seems likely that these unknown noncovalent binding sites of
fibrinogen include ionic bonds or hydrogen bridges, which are affected by competing water
molecules. This could also be a possible explanation for the inevitability of the drying step
for the formation of fibrinogen fibers.
The fist approaches that were tested to increase the stability of fibrinogen scaffolds were
UV irradiation and treatment with methanol. UV-irradiation for 1 h was not sufficient to
stabilize the self-assembled fibrinogen scaffold. This is an interesting observation since UV
irradiation is commonly used for stabilization of biomaterials and for example has been
shown to increase the mechanical stability of fibrin threads (Cornwell and Pins, 2007).
During UV exposure, the irradiation generates radicals, which should crosslink the
substrate. The process of radical generation can be accelerated by addition of riboflavin, a
method that is often applied for the crosslinking of collagen. The combination of UV
134
irradiation and riboflavin is also used for cornea crosslinking during some treatments of
corneal ectatic diseases (Raiskup and Spoerl, 2013).
Interestingly, the combination of UV light and riboflavin was also not sufficient to
crosslink the fibrinogen scaffolds prepared by drying in the presence of PBS. It has to be
considered that the intensity of the used UV lamp might have been too low to efficiently
crosslink the fibrinogen scaffolds.
As an alternative to UV irradiation different chemical crosslinking agents were
investigated. Fibrinogen scaffolds, which were treated with transglutaminase, genipin or
EDC were not stable upon rehydration. Incubation with glutar- or formaldehyde solution on
the other hand preserved some of the fibrinogen fibers, but with an overall poor fiber and
scaffold morphology. It is interesting that no solution-based crosslinking procedure was
sufficient to completely crosslink the fibrinogen scaffold. Electrospun fibrinogen scaffolds
can be crosslinked by solutions of EDC or genipin (Sell et al., 2008b), but incubation in
EDC or genipin solution did not preserve the morphology of self-assembled fibrinogen.
This shows that the dissolving of the fibrinogen scaffold is a rapid process. The water
molecules in the respective crosslinking solution dissolved the fibrinogen with a higher rate
than the rate covalent bonds were formed between fibrinogen molecules by the
crosslinkers. This effect is especially visible for transglutaminase, genipin and EDC. These
crosslinkers were used in concentrations, which have been reported to have a low toxicity
and no negative effect on the biocompatibility of the crosslinked product (Azeredo and
Waldron, 2016). However, this treatment also resulted in a very slow crosslinking, which is
apparently completely outcompeted by the dissolution of fibrinogen fibers in water.
Especially the failure of the transglutaminase treatment to maintain the fibrinogen fiber
scaffold is an interesting observation. Transglutaminase is the enzyme that covalently
crosslinks the fibrin monomers of the fibrin clot in vivo (Ariëns et al., 2002). Therefore, one
would expect transglutaminase to be an optimal crosslinker for fibrinogen fibers that
consist of fibrinogen molecules with the same groups for binding. In addition to the
rehydration and dissolving that is introduced during the transglutaminase crosslinking, the
unsuccessful transglutaminase incubation might also indicate that the fibrinogen molecules
in the self-assembled fibrinogen fibers are ordered in an arrangement that differs from the

Morphology of self-assembled fibrinogen scaffolds
135
arrangement of the fibrin monomers in fibrin fibers. In fibrin fibers, the fibrin monomers
are oriented in a half staggered arrangement, which allows the close contact of the D-
domains of two adjacent monomers. At this position, the first crosslink between two fibrin
monomers is catalyzed by transglutaminase. Only in later stages other domains of the
molecule especially the α-C domains are crosslinked (Ariëns et al., 2002). If the fibrinogen
molecules in self-assembled fibrinogen fibers have a different orientation, transglutaminase
crosslinking of the D-domains would not be possible, which could explain the inefficiency
of transglutaminase incubation observed for self-assembled fibrinogen.
In contrast to the three rather mild crosslinkers the harsher treatments with glutar- or
formaldehyde were more successful. Although aldehyde crosslinking is not ideal for
biomaterials, because aldehydes show high toxicity and change the mechanics of
biomaterials (Heck et al., 1990), glutar- or formaldehyde solution were able to preserve
some of the fibrinogen fibers upon rehydration. However, the aldehyde crosslinked
scaffolds still showed a less defined morphology. Since the dissolving of the scaffolds even
outcompeted the aldehyde solution crosslinking, glutar- or formaldehyde vapor treatment
was investigated afterwards. Crosslinking with aldehyde vapor was also used in studies that
crosslinked electrospun fibrinogen scaffolds. By applying glutar- or formalaldehyde as a
vapor an additional exposure to water during the crosslinking procedure was circumvented.
Both, crosslinking with glutar- and formaldehyde vapor preserved the fibrinogen fiber
morphology and stabilized self-assembled fibrinogen scaffolds completely. Even after
multiple washing steps, the fibrinogen scaffolds maintained their fiber structure. Although
aldehyde treatment is harsh, it was the most efficient way to stabilize self-assembled
fibrinogen scaffolds. When aldehyde vapor crosslinking will be used to crosslink scaffolds
for applications involving cells or living tissue, a prolonged washing procedure has to be
considered, since formaldehyde is cytotoxic and mutagenic (Heck et al., 1990). With
extensive washing and shorter time for the vapor incubation, it should be possible to lower
the concentration of unbound aldehyde in the samples to a non-toxic level. Eukaryotic cells
have mechanisms to metabolize aldehydes and for example have been shown to endure
formaldehyde concentrations of up to 1 mM without a loss in cellular viability (Heck et al.,
1990; Nilsson et al., 1998).
136
An additional surprising observation that was made during the washing of aldehyde
crosslinked fibrinogen scaffolds was the partial detachment of fibrinogen scaffolds from the
underlying glass. With some agitation, the crosslinked scaffolds completely detached and
floated on top of the washing solution. The freestanding scaffolds prepared that way could
be removed with forceps and dried without damage of the scaffold. The possibility to
prepare freestanding scaffolds is especially promising for a future biomaterial application
of the self-assembled fibrinogen scaffolds. As a biomaterial, the fibrinogen should be
applied without other materials that might have different effects on the living tissue or have
mechanical properties that complicate the handling. It was possible to detach intact
scaffolds with a size of several cm2, although only a few µm in thickness. These
freestanding scaffolds could be easily handled and for example be applied to a wound.
After removal from the surface and handling with forceps, the fibrinogen scaffold still
showed its original fiber morphology. In addition, crosslinking planar fibrinogen scaffold
could be detached from piranha cleaned substrate, but the washing had to be even more
vigorously and took longer to detach planar scaffolds completely.
The only other described method that was able to produce freestanding fibrinogen fiber
scaffolds so far is electrospinning (Wnek et al., 2003). However, the scaffolds produced by
electrospinning had thicknesses of several hundred µm and required lager amounts of
fibrinogen.
The detachment of fibrinogen is promising for future applications of self-assembled
fibrinogen scaffolds. However, for the in vitro studies that have to precede a future
application of fibrinogen scaffolds, a freestanding scaffold might be hard to handle.
Therefore, fibrinogen scaffolds were prepared on APTES-modified substrate and
immobilized by crosslinking in formaldehyde vapor. Scaffolds crosslinked on APTES did
not detach even after vigorous washing. Since the modification with APTES introduces
amino groups on the glass surface, the aldehyde treatment does not only crosslink amino
groups of different fibrinogen molecules but also crosslinks the fibrinogen fibers with the
amino groups of the APTES substrate. It can be assumed that the fibrinogen scaffolds were
immobilized to the APTES modified surface after crosslinking, because the fibrinogen was
covalently bound to the amino groups of the APTES. The immobilized fibrinogen scaffolds
on APTES are a useful additional class of fibrinogen scaffolds, especially for research

Changes of secondary structure accompanying fibrinogen self-assembly
137
purposes like for example cell compatibility experiments or degradation studies. An
immobilization of crosslinked fibrinogen samples has also been observed on gold substrates
(Stamboroski, personal communications). However since a gold substrate lacks amino
groups it can be assumed that the immobilization on gold is due to a different mechanism.
It was also possible to prepare fibrinogen scaffolds by drying in the presence of PBS on a
24 x 24 mm glass slide. The resulting fibrinogen scaffolds of several cm2 showed that an
upscaling of the fibrinogen self-assembly process is possible by adjusting the volume of the
fibrinogen and the salt solution.
6.2. Changes of secondary structure accompanying fibrinogen self-
assembly
In many other studies investigating fibrinogen assembly in vitro, changes in the secondary
structure of fibrinogen are used as an hypothesis to explain fiber formation (Feinberg and
Parker, 2010; Koo et al., 2012; Wei et al., 2008a). The idea that a conformational change
makes binding sites of the fibrinogen molecule available, which are blocked in a native
conformation, seems plausible. Nevertheless, none of the aforementioned publications
included detailed investigation of the changes in fibrinogen secondary structure that could
confirm this hypothesis. Therefore, it is an interesting question whether and to what extent
conformational changes play a role during fiber formation by salt-induced self-assembly.
The secondary structure of planar and nanofibrous fibrinogen layers was analyzed using
solid state circular dichroism and the content of different secondary structure components
was calculated using the BeStSel server (Micsonai et al., 2018). The results discussed in
this section are one main part of the publication (Stapelfeldt et al., 2019b), in which the
structural data acquired using circular dichroism spectroscopy were additionally validated
by Fourier transformed infrared spectroscopy. Overall, the changes of the secondary
structure analyzed with both methods were in good accordance. However, the absolute
content of different secondary structure motives derived from these methods sometimes
differed.
Fibrinogen in solution and fibrin sowed a similar content of α-helical and β-sheet
structures. This is in agreement with other studies that reported no change in secondary
138
structure during the conversion of fibrinogen into fibrin (Dutta et al., 2018). Moreover, the
structural data obtained for fibrinogen solution and fibrin are in good agreement with the
BeStSel analyses of the x-ray crystallography structure reported for fibrinogen (Kollman et
al., 2009). In planar fibrinogen scaffolds prepared by drying in the presence of NH4HCO3
without additional ions, the content of α-helical and β-sheet structures was similar to the
ones determined for fibrinogen in solution and fibrin. This indicates that during the drying
and the formation of the planar fibrinogen layer no change of fibrinogen secondary
structure occurred. Furthermore, this shows that none of the experimental conditions like
the drying or the used surface material affected the fibrinogen conformation per se.
Interestingly, the circular dichroism spectra of the dried planar and nanofibrous fibrinogen
scaffolds differed, which resulted in a difference in the secondary structure content
calculated by the BeStSel server. Fibrinogen nanofiber scaffolds showed an increased
content of β-sheet structures while a lower content of α-helical structures was observed.
This finding shows that the formation of fibrinogen fibers is accompanied by a
conformational change of the fibrinogen molecule. It is unclear if this conformational
change is responsible for fiber formation or just a side effect of fiber formation by salt-
induced self-assembly. However, since the conformational change is rather small (4%), it
can be concluded that the overall structure of fibrinogen is maintained during fiber
formation and no major denaturation is occurring. Other studies investigating structural
changes of fibrinogen during fiber formation are scarce, but one circular dichroism study
was carried out on the changes of fibrinogen when it is prepared in the organic solvent for
electrospinning (Carlisle et al., 2009). In this study a 30% change of secondary structure
was observed upon dissolving fibrinogen in hexafluoropropanol, unfortunately the
secondary structure was not analyzed after the fibrinogen had been spun into fibers.
Interestingly, the change observed when fibrinogen was dissolved in the
hexafluoropropanol was an increase of α-helical structures. In contrast, the structural
change observed during self-assembly of fibrinogen was a conversation of α-helical into
β-sheet structures, which seems to be minor in comparison.
Recent studies investigating self-assembly of peptides or proteins into fibers found
increased content of β-sheets linked to the formation of β-amyloid structures (Wei et al.,
2017). To investigate if the observed increase in β-sheet structures was due to the formation
Changes of secondary structure accompanying fibrinogen self-assembly
139
of β-amyloid structures during the self-assembly, fibrinogen scaffolds were prepared in the
presence of thioflavin T (ThT). ThT changes its emission spectrum to 480 nm when it is
bound to β-amyloid structures. (Biancalana and Koide, 2010). Since the ThT staining
showed no emission at 480 nm, it was concluded that the observed change in secondary
structure was not correlated with a transition into β-amyloid structures. This was also
indicated by the low stability of fibrinogen scaffolds in aqueous environment without
additional crosslinking. In contrast, protein fibers, which form due to the aggregation of β-
amyloids were reported to have a high stability (Makin et al., 2005; Toyama and
Weissman, 2011).
β-amyloid structures have been attributed to various protein misfolding diseases (Chiti and
Dobson, 2006). A genetic mutation of fibrinogen can result in a pathogenic misfolding of
fibrinogen into β-amyloid structures. The misfolded fibrinogen can accumulate in the liver
and other organs, which leads to a condition called fibrinogen amyloidosis (Picken, 2010).
However, this change in secondary structure requires a mutation of the primary amino acid
sequence of fibrinogen, which makes such transitions highly unlikely for samples prepared
with native fibrinogen. In accordance with this the absence of β-amyloid transitions during
the fibrinogen self-assembly was confirmed in the ThT staining, which makes a misfolding
related pathogenicity of the fibrinogen scaffolds unlikely.
The formation of fibrinogen fibers shows a clear fibrinogen concentration threshold. When
2 mg/ml or higher fibrinogen concentrations were dried in the presence of PBS, fiber
formation was observed while with 1 mg/l or lower fibrinogen no fiber formation was
observed. Remarkably, the analysis of secondary structure and the analysis of morphology
revealed the same fibrinogen concentration threshold for fiber formation.
An increase in β-sheet structures accompanied by a decrease of α-helical structures was
only observed when fibrinogen concentrations were used, which were sufficient to induce
fiber formation. When fibrinogen was present in concentrations too low to induce fiber
formation, the secondary structure was similar to the conformation of planar fibrinogen,
even though PBS was present during the drying process. This shows that only fiber
formation is accompanied by a conformational change and that the presence of PBS alone
is not sufficient to induce a conformational change of fibrinogen. These results show that
140
the observed conformational change is not the driving force but rather a result of fiber
formation. The conformational change only seems to occur in the presence of PBS and a
fibrinogen concentration sufficient for fiber formation. A PBS induced conformational
change that leads to the formation of fibers was not confirmed since such a change in
secondary structure would also be measurable with low fibrinogen concentrations. An
additional mechanism seems to be the reason for the observed conformational change when
the fibrinogen concentration is sufficient for fiber formation.
Other studies that hypothesized about an involvement of changes in secondary structure,
were carried out using fibrinogen concentrations that were substantially lower than the
lowest concentration used in this thesis (Koo et al., 2010; Wei et al., 2008b). However, in
this thesis no structural changes where observed when low concentrations of fibrinogen
were used, which makes the structural changes postulated by Koo or Wei seem unlikely.
Another observed threshold of fiber formation is a pH threshold. While fibers are formed,
when fibrinogen was dried in the presence of PBS with a pH of 7 or higher, with a pH
below 7 no fiber formation is observed. The pH threshold of fiber formation is also a
threshold for the transition of secondary structure.
When the PBS had a pH higher than 7 during the drying of fibrinogen solution, a transition
of α-helical structures to β-sheets was observed. However, with pH 7 or lower fibrinogen
showed a conformation similar to the one observed for planar fibrinogen. The isoelectric
point of fibrinogen is 5.8. At a pH higher than 7 fibrinogen will be negatively charged
(Wasilewska et al., 2009). It seems likely that the negative net charge due to deprotonated
glutamic or aspartic acid residues of the fibrinogen is required for fibrinogen fiber
formation and that ionic interactions are involved in the assembly of fibrinogen molecules.
For the protein serum albumin it has been shown that changes in the pH resulted in changes
in the protonation state of glutamic and aspartic acid residues. The protonated acids can
form additional hydrogen bonds, which disrupted some α-helical structures in the albumin
molecule. However, the experiments on pH induced changes of secondary structure were
carried out in solution (Murayama et al., 2001). The conformational changes observed in
this thesis do not necessarily indicate that the observed conformational change is pH
dependent or even is a driving force of the fiber formation process. It seems likely that no
Changes of secondary structure accompanying fibrinogen self-assembly
141
fibrinogen fibers form at low pH because acidic residues are protonated and inhibit fiber
formation. The observed conformational change does not necessarily have to be a result of
the pH. It could also be due to the drying process of the fibers that formed under certain pH
conditions.
In addition to the fibrinogen concentration and to the pH, the effects of the humidity during
the drying process were analyzed. It was shown that the planar layer of fibrinogen, which
forms on top of the scaffold when the drying process is carried out at high relative
humidities only affects the topmost layer of fibrinogen while the bulk scaffold underneath
stays in its fibrous form. Therefore, it is not surprising, that all circular dichroism spectra of
fibrinogen scaffolds prepared at different humidities were similar to the spectra of fibrous
fibrinogen prepared with a standard humidity of 30%. Apparently, the planar top layer,
which forms while drying at a humidity of 50% has no observable effect on the circular
dichroism spectrum of the fibrinogen scaffold, which becomes clear when morphological
cross-sections are analyzed. Only a thin layer at the top has planar appearance, while the
majority of fibrinogen contributing to the pathway is fibrous. Since the contribution of
fibrous fibrinogen is higher to the CD signal, the resulting spectrum is characteristic for
self-assembled fibrinogen fibers.
When fibrinogen scaffolds prepared by drying in the presence of PBS were crosslinked in
formaldehyde vapor, the secondary structure remained the same. The increased content of
β-sheet structures and the decreased content of α-helical structures were still observable.
The crosslinking treatment alone did not affect the conformation of the fibrinogen
molecules. However, the secondary structure of crosslinked fibrinogen scaffold changed
when they were rehydrated.
The secondary structure analysis revealed that rehydration of fibrinogen nanofibers
reversed the transition of α-helical structures into β-sheets. After rehydration, the
crosslinked fibers showed a secondary structure composition, which was closer to native
fibrinogen solution or even fibrin as to the structure observed for dried fibers. The content
of α-helical and β-sheet structures after rehydration was in the range that was reported for
fibrinogen (Kollman et al., 2009) or even fibrin fibers (Dutta et al., 2018). Apparently, the
change in secondary structure that was observed after drying of fibrinogen fibers was not
142
permanent. This result strongly supports the hypothesis that the changes in secondary
structure observed in fibrinogen, which was dried in the presence of high ion concentration,
are a result of the drying process. The return to an almost native structure after rehydration
shows that the conformational changes were not permanent and therefore a crucial role in
the self-assembly process seems most unlikely.
For the point of cell experiments or even a future biomedical application, the results are
promising. The structural analysis showed no indications of any pathogenic β-amyloid
transitions during the fibrinogen self-assembly process. Furthermore, crosslinked and
rehydrated fibrinogen showed a conformation close to native fibrinogen solution or even
fibrin. Hence, it can be assumed that the crosslinked fibrinogen fibers prepared by salt-
induced self-assembly mostly contain fibrinogen with correctly folded secondary structure,
which is a promising indication that the fibrinogen fibers maintained their bio-activity and -
compatibility during the self-assembly process.
6.3. Bioactivity of self-assembled fibrinogen scaffolds
In the application of biomaterials, the persistence of the material which is introduced into
the living organism has to be considered. While for some applications, like for example
bone replacements or artificial heart valves a long durability is desired, other applications
like soft tissue engineering or wound healing materials are aiming for a temporary
persistence of the material. A biomaterial applied for wound healing purposes should be
able to disintegrate on its own or to be degraded by cellular enzymes during later stages of
the regeneration process.
The natural mechanism for the degradation of the fibrin clot during later stages of wound
healing relies on the serum protease plasmin, which is able to cleave fibrin (Rijken and
Sakharov, 2001; Walker and Nesheim, 1999) as well as fibrinogen (Pizzo et al., 1972).
Plasmin can be activated from its precursor plasminogen by the enzyme urokinase (Blasi et
al., 1987). If a fibrinogen-based biomaterial is applied in tissue engineering, especially as a
wound healing material it will be exposed to the same plasmin-based degradation
mechanism. On the other hand, a fibrinogen-based biomaterial in such a scenario would
also be exposed to the present thrombin, which might even have a stabilizing effect by

Bioactivity of self-assembled fibrinogen scaffolds
143
converting the fibrinogen material into fibrin. To assess whether fibrinogen scaffolds
prepared by salt-induced self-assembly are suitable substrates for those enzymes and will
be integrated in the enzymatic in vivo processes, enzyme experiments were performed. The
potential of plasmin or urokinase to degrade fibrinogen was tested in soulton in the first
experiment. In the second long-term experiment crosslinked fibrinogen scaffolds were
exposed thrombin, plasmin and a combination of plasmin and urokinase. In addition, the
capacity of fibrinogen scaffolds to bind other fibrinogen molecules or heparin molecules
was studied to assess if the fibrinogen scaffolds were able to bind to in vivo interaction
partners of fibrin.
The fibrinogen degradation was analyzed in DMEM or HEPES buffer, both solutions did
not affect the outcome of the enzymatic degradation experiments. Without any enzymes
present, fibrinogen was not degraded overnight and maintained the native molecular weight
of approximately 340 kDa. In the presence of plasmin, however, fibrinogen was digested
into three large fragments with molecular weights of approximately 260, 160 and 80 kDa.
This finding is consistent with the data reported for in vitro fibrinogen digestion by plasmin
(Pizzo et al., 1972). Fibrinogen was not degraded by incubation in the presence of
urokinase and only the native 340 kDa band was observed. However, the combination of
plasmin and urokinase showed a stronger band at 80 kDa than the incubation with plasmin
alone, and hardly any band of a higher molecular weight was observed. This observation
indicates an acceleration of the plasmin activity by urokinase, which is remarkable, since
urokinase was originally reported to convert the precursor plasminogen into active plasmin
(Blasi et al., 1987). The acceleration of the plasmin activity could indicate that not all of the
used plasmin was actually in its active form. Gel electrophoresis could elucidate if some
plasminogen of larger molecular weight is present in the plasmin stock.
For a long-term investigation planar or nanofibrous fibrinogen scaffolds were crosslinked
in formaldehyde vapor and incubated in the presence of different enzymes for 35 days.
Fibrinogen scaffolds, which were crosslinked for 1 h, showed degradation over time when
incubated in HEPES buffer. When scaffolds were crosslinked for 2 h, only slow
degradation was observed in HEPES buffer. Apparently, a long crosslinking time resulted
in a scaffold stable in solution, while after 1 h crosslinking a slow hydrolysis of the
fibrinogen scaffold was still possible.
144
A similar hydrolysation behavior in solution was shown for the in vitro degradation of
fibrin. Fibrin gels prepared with high fibrinogen and calcium concentrations only showed
slow degradation over a time course of three weeks. However, fibrin gels prepared with a
low fibrinogen concentration or a low content of calcium almost completely dissolved
within three weeks (Eyrich et al., 2007).
Some studies have been carried out on the degradation behavior of electrospun fibrinogen
scaffolds, but those studies investigated the degradation of fibrinogen by cells and failed to
analyze a potential hydrolization of the scaffold in the solvent alone. Furthermore, these
studies did not investigate a degradation of the scaffold by single enzymes without the
presence of cells (McManus et al., 2007b; McManus et al., 2007a).
In contrast, the self-assembled fibrinogen scaffolds prepared in this thesis were analyzed to
potentially degrading or stabilizing enzymes. Interestingly, the presence of thrombin had no
effect on the stability of the scaffold. If thrombin still cleaves off the fibrinopeptides of the
fibrinogen molecules in the crosslinked scaffolds, an additional stabilization should occur
via the possible knob hole interactions (Mosesson, 2005). However, no indication of such a
thrombin stabilization was observed in this thesis. Interestingly SEM analysis revealed that
a thrombin treatment influenced the surface morphology especially visible on fibrous
scaffolds. After 35 days of thrombin incubation, the samples showed a poorer fiber
morphology, which could indicate some degradation of fibrin fibers by thrombin. Another
possible explanation would be a binding of thrombin molecules, which covers the fiber
scaffold by a layer of thrombin molecules.
Even more remarkably, the presence of plasmin during the 35 days of incubation had no
effect on the fibrinogen scaffold stability, even though the previous experiments had
confirmed the activity of plasmin in the HEPES buffer system. After 35 days of incubation
in the presence of plasmin the fibrinogen content in the supernatant of 1 or 2 h crosslinked
scaffolds was similar to the one measured from samples exposed to buffer without any
enzyme. Either the activity of plasmin was not high enough to degrade the crosslinked
fibrinogen or the targeted amino acid sequence, which is cleaved by plasmin, was modified
by the crosslinking procedure.

Bioactivity of self-assembled fibrinogen scaffolds
145
It was shown for collagen fibers that a scaffold, which was exposed to high concentrations
of a crosslinking agent, could not be degraded by collagenase anymore. A collagen fiber
scaffold, which was crosslinked using low concentrations of crosslinking agent, on the
other hand was still susceptible to enzymatic degradation and was completely degraded
after four weeks. Also in this study the crosslinking density was correlated to a resistance
against enzymatic degradation and with the highest crosslinking density tested no
degradation was observed during the four week experiment (Kishan et al., 2015). It seems
likely that even when fibrinogen scaffolds are crosslinked for 1 h, the resulting crosslinking
density is too high for efficient plasmin degradation. This idea is supported by SEM
observation of almost intact fiber scaffold after plasmin treatment of 2 h crosslinked
scaffolds. However, the scaffolds crosslinked for only 1 h showed a poorer fiber
morphology, which indicates that at least some effect of plasmin.
The combination of plasmin with the plasmin activator urokinase resulted in an accelerated
degradation under all tested conditions during both experimental trials. In contrast to all
other enzymes or buffer controls, which showed that 90 % of the 1 h crosslinked and 100 %
of the 2 h crosslinked fibrinogen scaffolds were still intact after 35 days, a treatment with
plasmin and urokinase resulted in a degradation, which only left roughly 40% of the 1 and
2 h crosslinked scaffolds intact. The strong degradation by plasmin and urokinase was also
confirmed by SEM analysis of the samples, which in contrast to the other tested buffers or
enzymes showed only a few patchy scaffold remains after 35 days. The accelerated
degradation of the scaffold by plasmin and urokinase is an interesting observation, which
like the accelerated degradation in solution is hard to explain.
Urokinase was originally described as an activator of the plasmin precursor plasminogen,
but no effect of urokinase on the already active plasmin was described (Blasi et al., 1987).
The findings of this thesis indicate that the capacity of plasmin to degrade crosslinked
fibrinogen fibers is strongly increased when urokinase is present. An older publication
discussed some combined effect of urokinase and plasmin during fibrin degradation, but
this effect was not observed when fibrinogen was used (Müllertz, 1974). One possible
explanation for the additional effect of urokinase is the digestion of fibrinogen by urokinase
itself. It was shown that urokinase itself has a direct catalytic activity towards fibrinogen
and is able to cleave of fibrinopeptide B (Weitz and Leslie, 1990). The degradation

146
experiment using urokinase and fibrinogen in solution in this thesis did not indicate a
cleavage of fibrinopeptide B, however fibrinopeptide B is only a 12 amino acid fragment,
which would not have been detected by the used gel electrophoresis (Mosesson, 2005).
If fibrinopeptide B was cleaved during the incubation with urokinase and plasmin, two
explanations of the accelerated degradation are possible. The cleavage of fibrinopeptide B
from the crosslinked fibrinogen fibers would make those fibers at least partially fibrin,
therefore a combined effect of plasmin and urokinase like described above is maybe
possible, since the scaffolds present a fibrin-like substrate.
Another possible explanation would be an initial cleavage of the fibrinogen by urokinase
and a subsequent cleavage by plasmin. If the cleavage of fibrinopeptide B by urokinase
makes additional plasmin cleavage sites available that are usually blocked in the
crosslinked fibrinogen, this could result in a plasmin degradation. That would not be
possible in fibrinogen scaffolds that still contain fibrinopeptide B. In this hypothesis, an
initial cleavage of the small fibrinopeptide B is needed to allow the subsequent main
degradation by plasmin. One simple way to test this hypothesis would be an experiment
where crosslinked fibrinogen fibers are incubated in a combination of plasmin and
thrombin. Since thrombin should also cleave of fibrinopeptide B, a combination of
thrombin and plasmin should also result in an accelerated degradation of the fibrin scaffold.
Overall, single enzymes had hardly any effect on the degradation kinetics of crosslinked
scaffolds, while combinations of enzymes were able to accelerate the degradation. In an in
vivo system the fibrinogen scaffolds will be exposed to a variety of enzymes and other
factors at the same time, therefore more experiments with combinations of different
enzyme are needed to make a profound assessment of the stability of fibrinogen scaffolds.
Based on the degradation experiments, future cell culture experiments will be the next
important step to study further, whether, for instance, fibroblasts will be able to degrade
and remodel the fibrinogen scaffolds under in vitro conditions. Moreover, the degradation
experiments are an additional indicator that the structure and bioactivity of fibrinogen were
maintained during salt-induced fiber formation and that the binding sites and activity of the
fibrinogen degrading in vivo enzymes was not compromised.
Bioactivity of self-assembled fibrinogen scaffolds
147
When the interaction of fluorescently labeled ligands with self-assembled fibrinogen was
studied it was observed that neither fibrinogen nor heparin bind to the fibrinogen scaffolds.
It was shown that fibrinogen had a stronger affinity towards control samples prepared with
BSA or even bare APTES surfaces than to fibrinogen scaffolds. This observation shows
that even the unspecific binding to BSA or APTES was higher than the fibrinogen-
fibrinogen interaction. Apparently, no further fibrinogen is able to attach to the crosslinked
fibrinogen scaffolds, as they were prepared in this study. This could indicate that an
incorporation of the crosslinked fibrinogen scaffold into a living tissue might be difficult.
However, in vivo there are more binding partners like for example fibronectin, which
bridges fibrin with other ECM molecules during wound healing (Laurens et al., 2006).
Furthermore, it has to be considered that the used methods in this study might not elucidate
the dynamic binging and unbinding that occurs in vivo.
Interestingly, also heparin showed a much lower affinity towards fibrinogen scaffolds than
to BSA samples or to bare APTES surface. This is surprising since fibrinogen was expected
to bind to heparin. Heparin is a known binding partner of fibrin that binds to the central E-
domain and partially to the α-C-domains (Fredenburgh et al., 2013). The lack of heparin
binding to crosslinked fibrinogen fibers could be explained by the fact that the main
binding site, to which heparin binds to fibrin, is located at the central E domain close to the
site where fibrinopeptide A and B are cleaved off during fibrin formation. This binding site
is not accessible without cleavage of the fibrinopeptides (Odrljin et al., 1996b). Since the
fibrinogen scaffolds prepared in this study most likely still comprise both fibrinopeptides,
the main heparin binding site is not available. Some heparin binding also has been reported
to occur at the α-C domains of fibrinogen (Fredenburgh et al., 2013). This could indicate
that also the α-C domains in self-assembled fibrinogen are not accessible for binding.
The observed differences in fibrinogen or heparin binding might also be due to the use of
fluorimetry as an endpoint-based method. Like for most biological molecules the binding of
fibrinogen to the crosslinked fibrinogen scaffolds will occur with certain on and off rates
like for example the binding of intergins to fibrinogen (Litvinov et al., 2012b). However,
the approach used in this study only detected the final concentration of bound fibrinogen
and was not suited to determine the kinetics of binding or unbinding. A much more detailed
investigation of the binding characteristics would be possible with other techniques, for
148
example, a quartz crystal microbalance based approach, which would allow kinetic studies
of the binding processes. The dynamics of the formation of fibrin for example have been
studied using a quartz crystal microbalance approach. In the same study the influence and
the kinetics of heparin binding during the fibrin formation have been studied (Vikinge et
al., 2000). In addition to quartz crystal microbalance this study also used surface plasmon
resonance, which shows that both methods are useful to study dynamic binding events
(Vikinge et al., 2000). Therefore, it is to assume that the methods hold the potential for an
in depth investigation of the binding events occurring on self-assembled fibrinogen as well.
6.4. Mechanism of fibrinogen self-assembly
When all the analyzed factors that were found to influence the fibrinogen self-assembly in
the first main experimental part of this thesis are taken into consideration, it is possible to
formulate some conclusions about the potential mechanism of fibrinogen fiber formation.
Additionally, the results of the second main experimental part give some indication on the
structural changes and their role in the mechanism of fibrinogen self-assembly.
The binding sites, which facilitate the assembly of fibrinogen molecules into fibrin, so
called knob hole interactions, are normally blocked by the fibrinopeptides, which in vivo
are cleaved off by the enzyme thrombin (Mosesson, 2005). The results of this thesis clearly
show that the self-assembled fibers do not consist of fibrin and that thrombin is not
involved in the fiber formation process. This is strongly supported by the results, which
showed that fibrinogen fibers also formed in the presence of the thrombin inhibitor AEBSF.
However, fiber formation might also involve the same knob hole interactions without the
presence of thrombin and lead to fibrinogen molecules oriented in a half staggered way
with interactions between the D-domains and the E-domains like in fibrin. Other studies on
self-assembly of fibrinogen, for example by fibrinogen denaturation in ethanol (Wei et al.,
2008b) or by surface induced self-assembly (Koo et al., 2012), also discussed that an
interaction of D-and E-domains plays a major role in the investigated assembly processes.
Nevertheless, they avoided to declare the same knob hole interactions, which occur after
thrombin activation as the single mechanism.
Mechanism of fibrinogen self-assembly
149
In the case of the self-assembly mechanism an involvement of the knob hole interactions
seems unlikely for two reasons. First of all, the knob hole interactions are blocked by the
fibrinopeptides and there is no indication that the drying or the presence of ions could
hydrolyze the fibrinopeptides or change the conformation of the molecules to make them
available. An antibody staining of the fibrinopeptides could reveal if they are still present in
a self-assembled fibrinogen scaffold.
Second, the fibrinogen fibers formed by self-assembly were not stable in aqueous solution.
The noncovalent knob hole interactions are a combination of an ionic bond between a
positively charged arginine residue at the knob domain and a negatively charged hole
domain, which are surrounded by hydrophobic interactions (Mosesson, 2005). This makes
the knob hole interactions highly resistant to redissolving in water and is the reason why
fibrin does not dissolve in water. Therefore, it seems unlikely that the fibrinogen fiber
formation during drying in the presence of ions relies on knob hole interactions. The
binding during self-assembly possibly occurs via a different binding mechanism which is
weaker and water sensitive.
One additional experiment to prove that self-assembly of fibrinogen does not involve knob
hole interactions and is not similar to fibrin, would be the use of fibrinogen including point
mutations at the knob or hole binding sites. If fibrinogen molecules without the knob hole
binding site would still self-assemble into fibers upon drying in the presence of salts, this
would confirm other cryptic binding sites, which are responsible for self-assembly. Some
mutations of knob hole sequences are known to result in impaired fibrin formation and
could be utilized for such an experiment (Bowley and Lord, 2009; Hogan et al., 2001).
The fibrinogen domain with the highest conformational flexibility is the α-C domain
(Protopopova et al., 2015; Weisel and Medved, 2001). The flexible α-C domain was
associated with accumulation and self-assembly of fibrinogen in many publications (Collet
et al., 2005; Weisel and MEDVED, 2001; Williamson, 1994; Zuev et al., 2017). It might be
possible that the salt-induced self-assembly takes place in the α-C domains and allows the
organization of fibrinogen molecules. The flexible poly-proline helix of the α-C domain is
stabilized by hydrogen bridges involving adjacent water molecules (Weisel and MEDVED,

150
2001). Therefore, it is to assume that the α-C domain is strongly affected by the drying
process and the effects that ions have on the hydration shell of the molecule.
The removal of water is one of the main driving forces of the fibrinogen self-assembly. It
would be interesting to investigate, if other approaches, which remove the water instantly,
would also result in fiber formation. Possible approaches would be to mix an aqueous
fibrinogen solution with an organic solvent or to even overlay an organic phase with an
aqueous phase of fibrinogen solution. At the interface of the two phases the fibrinogen
should be converted from a hydrated to a dehydrated state instantly, which might also lead
to self-assembly. Similar approaches have been described for the extraction of proteins
from an aqueous phase into an organic solvent (Chin et al., 1994).
The second main driving force of fibrinogen fiber formation is the presence of salts. During
drying, bulk waters evaporate until the fibrinogen starts to precipitate. However, for fiber
formation the additional presence of ions is required, since without the presence of ions
only planar fibrinogen layers are formed. If high concentrations of ions are present, surface
charges of the fibrinogen molecules will be compensated. Moreover, the presence of high
ion concentrations has direct influence on the first hydration shell of the fibrinogen
molecules (Zhang and Cremer, 2006). During the drying in solutions with high ion
concentrations the point where the hydration shells are weakened and the fibrinogen starts
to precipitate, will be reached faster as in solutions with low ion concentrations. This
allows Van der Waals forces, hydrogen bridges and possibly ionic interactions between
molecules of fibrinogen, which might allow a self-organization of adjacent fibrinogen
molecules into fibers (Baldwin, 1996). During drying without the presence of high ion
concentrations the hydration shell of fibrinogen will be maintained until the very end of the
drying process and interactions of fibrinogen molecules will be prohibited by repulsion of
the hydration shells (Baldwin, 1996). Therefore, only planar layers will form under those
conditions.
The fiber formation during drying in the presence of salts relies on noncovalent interactions
between fibrinogen molecules, which can be interfered by the presence of water. Although
hydrogen bridges and ionic interactions seem to be possible candidates to enable the
assembly of fibrinogen into nanofibers, most likely, both kinds of interactions contribute to
Mechanism of fibrinogen self-assembly
151
the fibrinogen assembly. Based on the results of this thesis, there is a strong indication that
ionic interactions are crucial for the self-assembly of fibrinogen fibers. A correlation of pH
and fiber formation was observed. A pH value of 7 or higher resulted in fibrinogen fibers,
while at pH values lower than 7 no fiber formation was observed. This indicates that the
charge of fibrinogen side chains plays a role in fiber assembly. Presumably charged amino
acids of fibrinogen molecules form ionic bonds during the fiber formation process.
The isoelectric point of fibrinogen is 5.8. Fibrinogen at higher pH is negatively charged,
while fibrinogen at lower pH is positively charged (Wasilewska et al., 2009). The absence
of fiber formation with pH values around or under the isoelectric point strongly indicates
that a negative net charge of the fibrinogen molecule is required for fiber formation. Most
likely aspartic and glutamic acid resides are involved in this ionic interaction since they
have a negative charge at physiological and high pH and are not charged at low pH.
However, the pH cannot be considered as the main driving force of fiber formation,
because fibrinogen in NH4HCO3 buffer did not form fibers even though NH4HCO3 buffer
has a pH of roughly 8.6, which should be in the pH range required for fiber formation. It is
also possible that the negative net charge of the fibrinogen is required for the interaction
with positively charged ions in the solution. A contribution of the presence of positively
charged ions was also discussed for other observed mechanism of fibrinogen self-assembly
but was not identified as one of the main driving forces (Reichert et al., 2009) .
The fibrinogen fiber self-assembly relies on a water removal during drying and on the
presence of ions. During precipitation, noncovalent interactions, which are most likely
ionic bonds, between single fibrinogen molecules allow an arrangement into fibers. This
arrangement is reversible, and the ionic bonds can be disrupted by introducing water again.
Interestingly, this proposed mechanism relies on the arrangement of fibrinogen molecules
and the modification of the fibrinogen hydration shell. A change of secondary structure of
the fibrinogen molecules is not necessarily involved in the self-assembly.
It was hypothesized in many publications that fibrinogen self-assembly is based on a
change in the fibrinogen secondary structure, which makes cryptic binding sites accessible
(Feinberg and Parker, 2010; Koo et al., 2012; Wei et al., 2008a). In these publications, it is
assumed that a change in secondary structure is the driving force of fiber formation, which
152
allows fibrinogen to aggregate and form fibers. Although a minor change in conformation
was observed for fibrinogen fibers prepared by drying in the presence of PBS, the results
obtained using circular dichroism spectroscopy show that this change in secondary
structure is rather a result of the drying process of the fibers than a crucial driving force of
the self-assembly. The formation and aggregation of fibrinogen in fiber form allow the
small change in secondary structure. Two of the main findings support this interpretation:
The absence of conformational changes when low fibrinogen concentrations are used and
the reversibility of the conformational change when crosslinked fibers were rehydrated.
The observed conversion of α-helical into β-sheet structures only occurred under conditions
that allowed fiber formation. If this conformational change of fibrinogen molecules would
be a prerequisite for fiber formation, it would occur even at low fibrinogen concentrations.
But no conformational change of the fibrinogen was detected when low fibrinogen
concentrations were exposed to the same concentrations of PBS and the same drying
process, therefore it seems unlikely that a conformational change is initiated by the initial
reaction and drying conditions. It is more likely that the conformational change occurs after
the formation of fibers, possibly due to the shrinking of fibers during the drying.
The fact that crosslinked fibers returned to an almost native conformation after rehydration
also indicates that the conformational change is not a driving force of fibrinogen fiber
formation. If the conformational change would expose some cryptic binding sites that are
involved in the aggregation of fibrinogen fibers, a reversibility of that change would be
highly unlikely. The results indicate that the observed small change in secondary structure
occurs in a domain of the fibrinogen that is of some conformational flexibility but is not
involved in the fiber formation during self-assembly.
The domains with the highest content of α-helical motives in the fibrinogen molecule are
the coiled coil domains, which link the E-domain and the two D-domains (Mosesson,
2005). It is likely that the observed conversion of α-helical motives into β-sheet takes place
in these domains.
Actually, Litvinov and coworkers observed a very similar α-helix to β-sheet transition in
the coiled coil regions of fibrin monomers in a fibrin gel. If strain was applied to a fibrin
Mechanism of fibrinogen self-assembly
153
gel a transition of α-helical to β-sheet structures was observed, which was interpreted as a
refolding of the α-helical coiled coil linker domains into β-sheet structures (Litvinov et al.,
2012a). The coiled coil domains function like springs, which elongate by refolding α-
helical domains into β-sheets and thereby give fibrin its high elasticity (Litvinov and
Weisel, 2017). It seems likely that a similar strain-induced transition of α-helices into β-
sheets could also occur during the drying process of self-assembled fibrinogen fibers, since
the fibrinogen molecules have a similar structure to the fibrin monomers. A possible
mechanism would be that during the self-assembly of fibrinogen strain is induced in the
fibers. During an early stage of the drying process where some water is still present, the
fibers are in a relaxed state. However, as more water evaporates during the final stage of the
drying process the fibers might shrink, which creates strain. It is possible that such an
induced strain in the fibers would be compensated by partially refolding the coiled coil α-
helices into β-sheets as it was shown in fibrin.
It was shown using atomic force microscopy that crosslinked fibers swell again upon
rehydration (Stapelfeldt et al., 2019b). This indicates that at least crosslinked fibrinogen
fibers in a dried state could be under strain due to shrinkage during the drying. The swelling
upon rehydration results in a relaxation of the fibers, which perfectly explains the observed
refolding into an almost native state, which was observed for rehydrated fibers.
Moreover, the idea that fibrinogen fibers change their conformation because of the strain
created during drying, could also explain why no conformational changes were observed
when fibrinogen concentrations were not sufficient to form fibers.
Therefore, it can be concluded that changes in the secondary structure are not a driving
force of the newly discovered fibrinogen self-assembly. However, a minor conformational
change occurs in the fibrinogen fibers, which might be due to strain induced in the fibers
during the drying process. The conformational change most likely occurred in the α-helical
coiled coil domains and is reversible upon rehydration. This indicates that the formed
fibrinogen fibers are a conformational flexible material, which was able to refold during
rehydration similar to the well-understood fibrin.
Overall the findings of this thesis strongly indicated that the self-assembly of fibrinogen is
due to noncovalent interaction of fibrinogen, which occur during the drying process in the
154
presence of ions. The potential of ions to interfere with the hydration shell of the fibrinogen
seems to play an important role for the fiber formation. Since the self-assembly is a
reversible process it seems likely that the arrangement of fibrinogen occurs due to ionic
interaction, which is also supported by the fact that the self-assembly only occurs in a
certain pH regime. Some changes in secondary structure have been observed to result of
fiber formation, which were possible induced by the drying process. However, the
presented results do not indicate a direct involvement of conformational changes in the
mechanism of fibrinogen self-assembly itself.
7. Conclusion and Outlook
The results of this thesis lead to many conclusions, which imply future experiments. During
the first main part of this thesis, a novel in vitro self-assembly mechanism of fibrinogen
into nanofibers was introduced. When fibrinogen solution was dried in the presence of high
ion concentrations, dense fibrinogen nanofiber networks were obtained. Interestingly, the
morphological analysis revealed that without high ion concentration no fibrinogen fibers
had formed. The presence of different ions species during the drying were able to induce
fibrinogen self-assembly, however, the resulting fiber morphology was dependent on the
chaotropic potential of the used ions. Crucial factors for the fibrinogen self-assembly seem
to be the drying process and the influence that chaotropic ions have on the hydration shell
of the fibrinogen molecule. To gain a better understanding of the relation of hydration shell
and fibrinogen self-assembly, future experiments with salts from the Hofmeister series are a
good option. Especially, more chaotropic salts like lithium chloride or even guanidinium
hydrochloride should have a higher potential to form fibers while salts with a high potential
to precipitate fibrinogen like ammonium sulfate should result in planar layers. Further
experiments with divalent cations like calcium or magnesium could bring some additional
insight into fiber formation upon drying. However, it has to be taken into account that
fibrinogen binding sites for divalent ions or potential complex formation with divalent ions
might have some additional influence on the self-assembly process. Closely related to the
effect of ions is the observed pH threshold of fibrinogen fiber self-assembly. Fibrinogen
fibers only formed when the pH was higher than the isoelectric point of fibrinogen, which
Conclusion and Outlook
155
shows that a negative net charge of fibrinogen is required for fiber formation. The pH
threshold is a major challenge for the design of future experiments because an investigation
of other factors combined with pH would require a buffer system out of components, which
allows different pH values, but do not contribute to the formation of fibers themselves.
In this thesis, it was shown for the first time that fibrinogen self-assembly can occur surface
independent on different substrate materials. This is contrast to many other publications,
which identified fibrinogen self-assembly as a surface induced mechanism. It has to be
clarified if the self-assembly described in this thesis is due to a completely different
mechanism or if the surface induced self-assembly described by others relies on similar
factors like for example water exclusion and changes of the fibrinogen hydration, which
might take place at certain surface materials.
In the second main part of this thesis it was confirmed that the self-assembly of fibrinogen
fibers is accompanied by a small change in secondary structure. When the results of the
morphological analysis were correlated to the investigation of fibrinogen conformation, it
became clear that the changes in secondary structure are a result of the fiber formation.
However, a crucial role of changes in secondary structure for the mechanism of fibrinogen
self-assembly, like it was proposed in many other studies, could not be confirmed. Most
likely, the observed conversion of α-helical into β-sheet structures was due to strain
induced in the fibers during the drying process. This is also indicated by the return of those
secondary structure motives into a native state when fibrinogen fibers were rehydrated. To
fully understand the conformational changes during fibrinogens self-assembly a real time
investigation of secondary structure during the drying process would be required. A
potential method that could yield some structural data in such a challenging setting, which
includes a transition from a liquid to a dried state, could be nuclear magnetic resonance
spectroscopy.
The structural analysis also revealed that no potentially pathogenic formation of β-amyloid
structures took place during the self-assembly of fibrinogen. This and the reversibility of
the changes in fibrinogen secondary structure upon rehydration are first indicators that the
fibrinogen stayed biologically active during the self-assembly process.

156
The biofunctionality of self-assembled fibrinogen scaffolds was confirmed in the final part
of this thesis. Although an in vitro degradation of crosslinked fibrinogen scaffolds was not
possible when single enzymes were used, a combination of different enzymes resulted in an
enzymatic degradation of the scaffolds. Additionally, it was shown that the crosslinking
time had a strong influence on the scaffold stability in aqueous solution or in the presence
of enzymes. The findings of the thesis provide a good foundation for future cell culture
experiments. It can be assumed that the fibrinogen in self-assembled fibers has a high
biocompatibility and is still a biologically active substrate, they were susceptible to
degradation by plasmin, the same enzymatic reaction utilized by fibroblasts to remodel
fibrin. For cell culture experiments, a careful selection of fibrinogen scaffold samples and a
number of control samples has to be made. To avoid a detachment during cell culture,
fibrinogen samples crosslinked to APTES should be used. Therefore, a control with cells on
the bare APTES substrate is inevitable. In addition to salt-induced fibrinogen fibers, the
process described in this thesis also allows the fabrication of planar fibrinogen scaffolds,
which for comparison should be analyzed in cell culture as well. With planar reference
samples, it will be possible to distinguish, if an observed cell behavior is due to the
biochemical environment presented by crosslinked fibrinogen or a specific result of the
fibrous three-dimensional morphology of fibrinogen fibers.
The most important control samples for cell experiments will be fibrin samples, which are
prepared with the same fibrinogen concentration as the self-assembled scaffolds. It is
advisable to use non-crosslinked fibrin samples as well as fibrin samples that were
additionally crosslinked in formaldehyde vapor for comparison with the fibrinogen fibers.
Although the self-assembly process is not completely understood, it resulted in fibrinogen
scaffolds with dimensions up to several cm2, which could also be prepared as freestanding
scaffolds. This holds some potential for an application as a biomaterial, especially as a
wound dressing material similar to the desired use of electrospun fibrinogen mats or the
already used fibrin-based materials. With degradation times of roughly one month the self-
assembled fibrinogen would be a suitable wound dressing material, which would provide a
provisional extracellular matrix and could be absorbed during later stages of the wound
healing process.
Conclusion and Outlook
157
With a further investigation of the newly found salt-induced fibrinogen self-assembly in
combination with cell culture tests, it will be possible to make a concluding assessment for
the future application of self-assembled fibrinogen scaffolds as a biomaterial. From the
results obtained in this thesis, self-assembled fibrinogen scaffolds seem to be a promising
undenatured alternative to electrospun fibrinogen scaffolds. To determine how useful self-
assembled fibrinogen will be in comparison to fibrin is up to future research studies.
158
8. References
Albala, D.M., Lawson, J.H., 2006. Recent clinical and investigational applications of fibrin
sealant in selected surgical specialties. Journal of the American College of Surgeons
202, 685–697. 10.1016/j.jamcollsurg.2005.11.027.
Ambrus, C.M., Back, N., Ambrus, J.L., 1962. On the Mechanism of Thrombolysis by
Plasmin. Circulation Research 10, 161–165. 10.1161/01.RES.10.2.161.
Amento, E.P., Ehsani, N., Palmer, H., Libby, P., 1991. Cytokines and growth factors
positively and negatively regulate interstitial collagen gene expression in human
vascular smooth muscle cells. Arterioscler Thromb 11, 1223–1230.
10.1161/01.ATV.11.5.1223.
Andree, C., Munder, B.I.J., Behrendt, P., Hellmann, S., Audretsch, W., Voigt, M., Reis, C.,
Beckmann, M.W., Horch, R.E., Bach, A.D., 2008. Improved safety of autologous breast
reconstruction surgery by stabilisation of microsurgical vessel anastomoses using fibrin
sealant in 349 free DIEP or fascia-muscle-sparing (fms)-TRAM flaps: A two-centre
study. Breast (Edinburgh, Scotland) 17, 492–498. 10.1016/j.breast.2008.03.010.
Annemie Collen, Pieter Koolwijk, Marielle Kroon, Victor W. M. van Hinsbergh, 1998.
Influence of fibrin structure on the formation and maintenance of capillary-like tubules
by human microvascular endothelial cells. Angiogenesis 2, 153–166.
10.1023/A:1009240522808.
Ariëns, R.A.S., Lai, T.-S., Weisel, J.W., Greenberg, C.S., Grant, P.J., 2002. Role of factor
XIII in fibrin clot formation and effects of genetic polymorphisms. Blood 100, 743–
754. 10.1182/blood.v100.3.743.
Azeredo, H.M.C., Waldron, K.W., 2016. Crosslinking in polysaccharide and protein films
and coatings for food contact – A review. Trends in Food Science & Technology 52,
109–122. 10.1016/j.tifs.2016.04.008.
Baldwin, R.L., 1996. How Hofmeister ion interactions affect protein stability. Biophysical
Journal 71, 2056–2063. 10.1016/S0006-3495(96)79404-3.
Berg, J.M., Tymoczko, J.L., Stryer, L., 2012. Biochemistry: [this edition is for use outside
the USA and Canada], 7th ed. Freeman Palgrave Macmillan, New York, NY.
Bergel, S., 1909. Ueber Wirkungen des Fibrins. Dtsch med Wochenschr 35, 663–665.
10.1055/s-0029-1201395.
Berova, N., Nakanishi, K., Woody, R.W. (Eds.), 2000. Circular dichroism: Principles and
applications, 2nd ed. Wiley-VCH, New York, NY, 877 pp.
Biancalana, M., Koide, S., 2010. Molecular mechanism of Thioflavin-T binding to amyloid
fibrils. Biochimica et Biophysica Acta (BBA) - Proteins and Proteomics 1804, 1405–
1412. 10.1016/j.bbapap.2010.04.001.
Bjarkam, C.R., Jorgensen, R.L., Jensen, K.N., Sunde, N.A., Sørensen, J.-C.H., 2008. Deep
brain stimulation electrode anchoring using BioGlue((R)), a protective electrode
covering, and a titanium microplate. Journal of neuroscience methods 168, 151–155.
10.1016/j.jneumeth.2007.09.008.
References
159
Blasi, F., Vassalli, J.D., Danø, K., 1987. Urokinase-type plasminogen activator:
Proenzyme, receptor, and inhibitors. The Journal of cell biology 104, 801–804.
10.1083/jcb.104.4.801.
Blombäck, B., Blombäck, M., 1972. The molecular structure of fibrinogen. Annals of the
New York Academy of Sciences 202, 77–97. 10.1111/j.1749-6632.1972.tb16323.x.
Bosman, F.T., Stamenkovic, I., 2003. Functional structure and composition of the
extracellular matrix. J. Pathol. 200, 423–428. 10.1002/path.1437.
Bowley, S.R., Lord, S.T., 2009. Fibrinogen variant BbetaD432A has normal
polymerization but does not bind knob "B". Blood 113, 4425–4430. 10.1182/blood-
2008-09-178178.
Braiman-Wiksman, L., Solomonik, I., Spira, R., Tennenbaum, T., 2016. Novel Insights into
Wound Healing Sequence of Events. Toxicol Pathol 35, 767–779.
10.1080/01926230701584189.
Brown, A.C., Barker, T.H., 2014. Fibrin-based biomaterials: Modulation of macroscopic
properties through rational design at the molecular level. Acta biomaterialia 10, 1502–
1514. 10.1016/j.actbio.2013.09.008.
Caen, J.P., Michel, H., 1972. Platelet Shape Change and Aggregation. Nature 240, 148–
149. 10.1038/240148a0.
Carlisle, C.R., Coulais, C., Namboothiry, M., Carroll, D.L., Hantgan, R.R., Guthold, M.,
2009. The mechanical properties of individual, electrospun fibrinogen fibers.
Biomaterials 30, 1205–1213.
Castiglioni, E., Biscarini, P., Abbate, S., 2009. Experimental aspects of solid state circular
dichroism. Chirality 21 Suppl 1, E28-36. 10.1002/chir.20770.
Catelas, I., Sese, N., Wu, B.M., Dunn, J.C.Y., Helgerson, S., Tawil, B., 2006. Human
mesenchymal stem cell proliferation and osteogenic differentiation in fibrin gels in
vitro. Tissue engineering 12, 2385–2396. 10.1089/ten.2006.12.2385.
Chaudhari, A.A., Vig, K., Baganizi, D.R., Sahu, R., Dixit, S., Dennis, V., Singh, S.R.,
Pillai, S.R., 2016. Future Prospects for Scaffolding Methods and Biomaterials in Skin
Tissue Engineering: A Review. International journal of molecular sciences 17.
10.3390/ijms17121974.
Chen, G., Ni, N., Wang, B., Xu, B., 2009. Fibrinogen Nanofibril Growth and Self-
Assembly on Au (1,1,1) Surface in the Absence of Thrombin. Chemphyschem 11, 565–
568.
Chernysh, I.N., Nagaswami, C., Purohit, P.K., Weisel, J.W., 2012. Fibrin Clots Are
Equilibrium Polymers That Can Be Remodeled Without Proteolytic Digestion. Nature
Publishing Group 2, 1–6.
Chin, J.T., Wheeler, S.L., Klibanov, A.M., 1994. On protein solubility in organic solvent.
Biotechnol. Bioeng. 44, 140–145. 10.1002/bit.260440120.
Chiti, F., Dobson, C.M., 2006. Protein misfolding, functional amyloid, and human disease.
Annual review of biochemistry 75, 333–366.
10.1146/annurev.biochem.75.101304.123901.
160
Clark, R.A.F., 2001. Fibrin and Wound Healing. Annals of the New York Academy of
Sciences 936, 355–367. 10.1111/j.1749-6632.2001.tb03522.x.
Collet, J.-P., Moen, J.L., Veklich, Y.I., Gorkun, O.V., Lord, S.T., Montalescot, G., Weisel,
J.W., 2005. The alphaC domains of fibrinogen affect the structure of the fibrin clot, its
physical properties, and its susceptibility to fibrinolysis. Blood 106, 3824–3830.
10.1182/blood-2005-05-2150.
Cornwell, K.G., Pins, G.D., 2007. Discrete crosslinked fibrin microthread scaffolds for
tissue regeneration. Journal of biomedical materials research. Part A 82, 104–112.
10.1002/jbm.a.31057.
Cumming, B.D., McElwain, D.L.S., Upton, Z., 2009. A mathematical model of wound
healing and subsequent scarring. Journal of The Royal Society Interface 7, 19–34.
10.1098/rsif.2008.0536.
Dahlbäck, B., 2000. Blood coagulation. The Lancet 355, 1627–1632. 10.1016/S0140-
6736(00)02225-X.
Dascombe, W.H., Dumanian, G., Hong, C., Heil, B.V., Labadie, K., Hessel, B., Blombäck,
B., Johnson, P.C., 1997. Application of thrombin based fibrin glue and non-thrombin
based batroxobin glue on intact human blood vessels: Evidence for transmural thrombin
activity. Thrombosis and haemostasis 78, 947–951.
Debelle, L., Tamburro, A.M., 1999. Elastin: Molecular description and function. The
International Journal of Biochemistry & Cell Biology 31, 261–272. 10.1016/S1357-
2725(98)00098-3.
Diegelmann, R.F., Cohen, I.K., McCoy, B.J., 1979. Growth kinetics and collagen synthesis
of normal skin, normal scar and keloid fibroblasts in vitro. Journal of cellular
physiology 98, 341–346. 10.1002/jcp.1040980210.
Dubrovin, E.V., Barinov, N.A., Schäffer, T.E., Klinov, D.V., 2019. In Situ Single-Molecule
AFM Investigation of Surface-Induced Fibrinogen Unfolding on Graphite. Langmuir :
the ACS journal of surfaces and colloids 35, 9732–9739.
10.1021/acs.langmuir.9b01178.
Dutta, B., Vos, B.E., Rezus, Y.L.A., Koenderink, G.H., Bakker, H.J., 2018. Observation of
Ultrafast Vibrational Energy Transfer in Fibrinogen and Fibrin Fibers. J. Phys. Chem. B
122, 5870–5876. 10.1021/acs.jpcb.8b03490.
Eyrich, D., Brandl, F., Appel, B., Wiese, H., Maier, G., Wenzel, M., Staudenmaier, R.,
Goepferich, A., Blunk, T., 2007. Long-term stable fibrin gels for cartilage engineering.
Biomaterials 28, 55–65. 10.1016/j.biomaterials.2006.08.027.
Feinberg, A.W., Parker, K.K., 2010. Surface-initiated assembly of protein nanofabrics.
Nano letters 10, 2184–2191. 10.1021/nl100998p.
Fisher, M.B., Mauck, R.L., 2013. Tissue Engineering and Regenerative Medicine: Recent
Innovations and the Transition to Translation. Tissue Engineering Part B: Reviews 19,
1–13. 10.1089/ten.teb.2012.0723.
Forget, J., Awaja, F., Gugutkov, D., Gustavsson, J., Gallego Ferrer, G., Coelho-Sampaio,
T., Hochman-Mendez, C., Salmeron-Sánchez, M., Altankov, G., 2016. Differentiation
References
161
of Human Mesenchymal Stem Cells Toward Quality Cartilage Using Fibrinogen-Based
Nanofibers. Macromol. Biosci. 16, 1348–1359. 10.1002/mabi.201600080.
Fortelny, R.H., Schwab, R., Glaser, K.S., Puchner, K.U., May, C., König, F., Redl, H.,
Petter-Puchner, A.H., 2008. The assessment of quality of life in a trial on lightweight
mesh fixation with fibrin sealant in transabdominal preperitoneal hernia repair. Hernia :
the journal of hernias and abdominal wall surgery 12, 499–505. 10.1007/s10029-008-
0365-1.
Foster, J.J., Temple, S.E., How, M.J., Daly, I.M., Sharkey, C.R., Wilby, D., Roberts, N.W.,
2018. Polarisation vision: Overcoming challenges of working with a property of light
we barely see. Die Naturwissenschaften 105, 27. 10.1007/s00114-018-1551-3.
Fowkes, F.G.R., Housley, E., Rattray, A., Lowe, G.D.O., Rumley, A., Elton, R.A.,
MacGregor, I.R., Dawes, J., 1993. Cross-linked fibrin degradation products, progression
of peripheral arterial disease, and risk of coronary heart disease. The Lancet 342, 84–86.
10.1016/0140-6736(93)91288-W.
Fowler, W.E., Erickson, H.P., 1979. Trinodular structure of fibrinogen. Journal of
Molecular Biology 134, 241–249. 10.1016/0022-2836(79)90034-2.
Fredenburgh, J.C., Leslie, B.A., Stafford, A.R., Lim, T., Chan, H.H., Weitz, J.I., 2013. Zn
2+ Mediates High Affinity Binding of Heparin to the αC Domain of Fibrinogen. J. Biol.
Chem. 288, 29394–29402. 10.1074/jbc.M113.469916.
Goldstein, J.I., Newbury, D.E., Echlin, P., Joy, D.C., Fiori, C., Lifshin, E., 1981.
Preparation of Biological Samples for Scanning Electron Microscopy, in: Goldstein,
J.I., Newbury, D.E., Echlin, P., Joy, D.C., Fiori, C., Lifshin, E. (Eds.), Scanning
Electron Microscopy and X-Ray Microanalysis. A Text for Biologist, Materials
Scientist, and Geologists. Springer US, Boston, MA, pp. 495–539.
Greenfield, N.J., 1996. Methods to estimate the conformation of proteins and polypeptides
from circular dichroism data. Analytical biochemistry 235, 1–10.
10.1006/abio.1996.0084.
Greenfield, N.J., 2006. Using circular dichroism spectra to estimate protein secondary
structure. Nature protocols 1, 2876–2890. 10.1038/nprot.2006.202.
Gugutkov, D., Gustavsson, J., Ginebra, M.P., Altankov, G., 2013. Fibrinogen nanofibers
for guiding endothelial cell behavior. Biomaterials Science 1, 1065–1069.
Guo, S., DiPietro, L.A., 2010. Factors Affecting Wound Healing. Journal of dental research
89, 219–229. 10.1177/0022034509359125.
Hämisch, B., Büngeler, A., Kielar, C., Keller, A., Strube, O., Huber, K., 2019. Self-
Assembly of Fibrinogen in Aqueous, Thrombin-Free Solutions of Variable Ionic
Strengths. Langmuir : the ACS journal of surfaces and colloids 35, 12113–12122.
10.1021/acs.langmuir.9b01515.
Harada, T., Kuroda, R., 2002. Circular Dichroism Measurement of a Protein in Dried Thin
Films. Chem. Lett. 31, 326–327. 10.1246/cl.2002.326.
Heck, H.D., Casanova, M., Starr, T.B., 1990. Formaldehyde toxicity--new understanding.
Critical reviews in toxicology 20, 397–426. 10.3109/10408449009029329.

162
Helbing, C., Stoeßel, R., Hering, D.A., Arras, M.M.L., Bossert, J., Jandt, K.D., 2016. pH-
Dependent Ordered Fibrinogen Adsorption on Polyethylene Single Crystals. Langmuir :
the ACS journal of surfaces and colloids 32, 11868–11877.
10.1021/acs.langmuir.6b03110.
Helms, C.C., Ariëns, R.A.S., Uitte de Willige, S., Standeven, K.F., Guthold, M., 2012. α−α
Cross-Links Increase Fibrin Fiber Elasticity and Stiffness. Biophysical Journal 102,
168–175. 10.1016/j.bpj.2011.11.4016.
Hinsbergh, V.W.M., Collen, A., Koolwijk, P., 2001. Role of Fibrin Matrix in Angiogenesis.
Annals of the New York Academy of Sciences 936, 426–437. 10.1111/j.1749-
6632.2001.tb03526.x.
Hogan, K.A., Bolliger, B., Okumura, N., Lord, S.T., 2001. The Formation of β Fibrin
Requires a Functional a Site. Annals of the New York Academy of Sciences 936, 219–
222. 10.1111/j.1749-6632.2001.tb03509.x.
Hogg, P.J., Jackson, C.M., 1989. Fibrin monomer protects thrombin from inactivation by
heparin-antithrombin III: Implications for heparin efficacy. Proceedings of the National
Academy of Sciences 86, 3619–3623. 10.1073/pnas.86.10.3619.
Hornyak, T.J., Shafer, J.A., 2002. Interactions of factor XIII with fibrin as substrate and
cofactor. Biochemistry 31, 423–429. 10.1021/bi00117a017.
Hotary, K.B., Yana, I., Sabeh, F., Li, X.-Y., Holmbeck, K., Birkedal-Hansen, H., Allen,
E.D., Hiraoka, N., Weiss, S.J., 2002. Matrix Metalloproteinases (MMPs) Regulate
Fibrin-invasive Activity via MT1-MMP–dependent and –independent Processes.
Journal of Experimental Medicine 195, 295–308. 10.1084/jem.20010815.
Huang, S., Cao, Z., Davie, E.W., 1993. The role of amino-terminal disulfide bonds in the
structure and assembly of human fibrinogen. Biochemical and biophysical research
communications 190, 488–495. 10.1006/bbrc.1993.1074.
Janmey, P.A., Winer, J.P., Weisel, J.W., 2009. Fibrin gels and their clinical and
bioengineering applications. Journal of the Royal Society, Interface 6, 1–10.
10.1098/rsif.2008.0327.
Kattula, S., Byrnes, J.R., Wolberg, A.S., 2017. Fibrinogen and Fibrin in Hemostasis and
Thrombosis. Arteriosclerosis, thrombosis, and vascular biology 37, e13-e21.
10.1161/ATVBAHA.117.308564.
Kelly, S.M., Jess, T.J., Price, N.C., 2005. How to study proteins by circular dichroism.
Biochimica et biophysica acta 1751, 119–139. 10.1016/j.bbapap.2005.06.005.
Kemp, J.C., 1969. Piezo-Optical Birefringence Modulators: New Use for a Long-Known
Effect. J. Opt. Soc. Am. 59, 950. 10.1364/JOSA.59.000950.
Kishan, A.P., Nezarati, R.M., Radzicki, C.M., Renfro, A.L., Robinson, J.L., Whitely, M.E.,
Cosgriff-Hernandez, E.M., 2015. In situ crosslinking of electrospun gelatin for
improved fiber morphology retention and tunable degradation. Journal of materials
chemistry. B 3, 7930–7938. 10.1039/c5tb00937e.
KK Kane, 1984. Fibrinolysis--a review. Ann Clin Lab Sci 14, 443–449.

References
163
Kolehmainen, K., Willerth, S.M., 2012. Preparation of 3D fibrin scaffolds for stem cell
culture applications. Journal of visualized experiments : JoVE, e3641. 10.3791/3641.
Kollman, J.M., Pandi, L., Sawaya, M.R., Riley, M., Doolittle, R.F., 2009. Crystal structure
of human fibrinogen. Biochemistry 48, 3877–3886. 10.1021/bi802205g.
Koo, J., Galanakis, D., Liu, Y., Ramek, A., Fields, A., Ba, X., Simon, M., Rafailovich,
M.H., 2012. Control of Anti-Thrombogenic Properties: Surface-Induced Self-Assembly
of Fibrinogen Fibers. Biomacromolecules 13, 1259–1268.
Koo, J., Rafailovich, M.H., Medved, L., Tsurupa, G., Kudryk, B.J., Liu, Y., Galanakis,
D.K., 2010. Evaluation of fibrinogen self-assembly: role of its \alphaC region. Journal
of Thrombosis and Haemostasis 8, 2727–2735.
Kuipers, B.J.H., Gruppen, H., 2007. Prediction of molar extinction coefficients of proteins
and peptides using UV absorption of the constituent amino acids at 214 nm to enable
quantitative reverse phase high-performance liquid chromatography-mass spectrometry
analysis. Journal of agricultural and food chemistry 55, 5445–5451. 10.1021/jf070337l.
Kular, J.K., Basu, S., Sharma, R.I., 2014. The extracellular matrix: Structure, composition,
age-related differences, tools for analysis and applications for tissue engineering. J
Tissue Eng 5, 204173141455711. 10.1177/2041731414557112.
Kundu, A., Kishore, N., 2004. 1,1,1,3,3,3-hexafluoroisopropanol induced thermal
unfolding and molten globule state of bovine alpha-lactalbumin: Calorimetric and
spectroscopic studies. Biopolymers 73, 405–420. 10.1002/bip.20014.
Kuroda, R., Honma, T., 2000. CD spectra of solid-state samples. Chirality 12, 269–277.
10.1002/(SICI)1520-636X(2000)12:4<269:AID-CHIR13>3.0.CO;2-P.
Laurens, N., Koolwijk, P., Maat, M.P.M. de, 2006. Fibrin structure and wound healing.
Journal of thrombosis and haemostasis : JTH 4, 932–939. 10.1111/j.1538-
7836.2006.01861.x.
Lenselink, E.A., 2015. Role of fibronectin in normal wound healing. Int Wound J 12, 313–
316. 10.1111/iwj.12109.
Li, D., Xia, Y., 2004. Electrospinning of Nanofibers: Reinventing the Wheel? Advanced
Materials 16, 1151–1170. 10.1002/adma.200400719.
Lim, B.B.C., Lee, E.H., Sotomayor, M., Schulten, K., 2008. Molecular Basis of Fibrin Clot
Elasticity. Structure 16, 449–459. 10.1016/j.str.2007.12.019.
Litvinov, R.I., Faizullin, D.A., Zuev, Y.F., Weisel, J.W., 2012a. The α-Helix to β-Sheet
Transition in Stretched and Compressed Hydrated Fibrin Clots. Biophysical Journal
103, 1020–1027. 10.1016/j.bpj.2012.07.046.
Litvinov, R.I., Mekler, A., Shuman, H., Bennett, J.S., Barsegov, V., Weisel, J.W., 2012b.
Resolving two-dimensional kinetics of the integrin αIIbβ3-fibrinogen interactions using
binding-unbinding correlation spectroscopy. The Journal of biological chemistry 287,
35275–35285. 10.1074/jbc.M112.404848.
Litvinov, R.I., Weisel, J.W., 2017. Fibrin mechanical properties and their structural origins.
Matrix Biology 60-61, 110–123. 10.1016/j.matbio.2016.08.003.
164
Lorand, L., 2001. Factor XIII: Structure, activation, and interactions with fibrinogen and
fibrin. Annals of the New York Academy of Sciences 936, 291–311. 10.1111/j.1749-
6632.2001.tb03516.x.
Lorand, L., Downey, J., Gotoh, T., Jacobsen, A., Tokura, S., 1968. The transpeptidase
system which crosslinks fibrin by γ-glutamyl-ε-lysine bonds. Biochemical and
biophysical research communications 31, 222–230. 10.1016/0006-291X(68)90734-1.
Lutolf, M.P., Hubbell, J.A., 2005. Synthetic biomaterials as instructive extracellular
microenvironments for morphogenesis in tissue engineering. Nat Biotechnol 23, 47–55.
10.1038/nbt1055.
Makin, O.S., Atkins, E., Sikorski, P., Johansson, J., Serpell, L.C., 2005. Molecular basis for
amyloid fibril formation and stability. Proceedings of the National Academy of
Sciences 102, 315–320. 10.1073/pnas.0406847102.
Makogonenko, E., Tsurupa, G., Ingham, K., Medved, L., 2002. Interaction of Fibrin(ogen)
with Fibronectin: Further Characterization and Localization of the Fibronectin-Binding
Site †. Biochemistry 41, 7907–7913. 10.1021/bi025770x.
Marguerie, G., 1977. The binding of calcium to fibrinogen: Some structural features.
Biochimica et Biophysica Acta (BBA) - Protein Structure 494, 172–181. 10.1016/0005-
2795(77)90145-3.
Mark, H., 1991. Principles and practice of spectroscopic calibration. Wiley, New York,
NY, 170 pp.
Markwardt, F., Hoffmann, J., Körbs, E., 1973. The influence of synthetic thrombin
inhibitors on the thrombin-antithrombin reaction. Thrombosis Research 2, 343–348.
10.1016/0049-3848(73)90044-3.
Matthews, J.A., Wnek, G.E., Simpson, D.G., Bowlin, G.L., 2002. Electrospinning of
Collagen Nanofibers. Biomacromolecules 3, 232–238. 10.1021/bm015533u.
Mazlyzam, A.L., Aminuddin, B.S., Fuzina, N.H., Norhayati, M.M., Fauziah, O., Isa, M.R.,
Saim, L., Ruszymah, B.H.I., 2007. Reconstruction of living bilayer human skin
equivalent utilizing human fibrin as a scaffold. Burns : journal of the International
Society for Burn Injuries 33, 355–363. 10.1016/j.burns.2006.08.022.
McManus, M., Boland, E., Sell, S., Bowen, W., Koo, H., Simpson, D., Bowlin, G., 2007a.
Electrospun nanofibre fibrinogen for urinary tract tissue reconstruction. Biomedical
Materials 2, 257–262.
McManus, M.C., Boland, E.D., Koo, H.P., Barnes, C.P., Pawlowski, K.J., Wnek, G.E.,
Simpson, D.G., Bowlin, G.L., 2006. Mechanical properties of electrospun fibrinogen
structures. Acta Biomater 2, 19–28.
McManus, M.C., Boland, E.D., Simpson, D.G., Barnes, C.P., Bowlin, G.L., 2007b.
Electrospun fibrinogen: Feasibility as a tissue engineering scaffold in a rat cell culture
model. Journal of Biomedical Materials Research Part A 81A, 299–309.
Micsonai, A., Wien, F., Bulyáki, É., Kun, J., Moussong, É., Lee, Y.-H., Goto, Y.,
Réfrégiers, M., Kardos, J., 2018. BeStSel: A web server for accurate protein secondary
References
165
structure prediction and fold recognition from the circular dichroism spectra. Nucleic
acids research 46, W315-W322. 10.1093/nar/gky497.
Micsonai, A., Wien, F., Kernya, L., Lee, Y.-H., Goto, Y., Réfrégiers, M., Kardos, J., 2015.
Accurate secondary structure prediction and fold recognition for circular dichroism
spectroscopy. Proceedings of the National Academy of Sciences of the United States of
America 112, E3095-103. 10.1073/pnas.1500851112.
Min, B.-M., Lee, G., Kim, S.H., Nam, Y.S., Lee, T.S., Park, W.H., 2004. Electrospinning
of silk fibroin nanofibers and its effect on the adhesion and spreading of normal human
keratinocytes and fibroblasts in vitro. Biomaterials 25, 1289–1297.
10.1016/j.biomaterials.2003.08.045.
Mirzaei-Parsa, M.J., Ghanizadeh, A., Ebadi, M.T.K., Faridi-Majidi, R., 2018. An
alternative solvent for electrospinning of fibrinogen nanofibers. BME 29, 279–287.
10.3233/BME-181736.
Mittermayr, R., Wassermann, E., Thurnher, M., Simunek, M., Redl, H., 2006. Skin graft
fixation by slow clotting fibrin sealant applied as a thin layer. Burns : journal of the
International Society for Burn Injuries 32, 305–311. 10.1016/j.burns.2005.10.010.
Monroe, D.M., Hoffman, M., Roberts, H.R., 2002. Platelets and thrombin generation.
Arteriosclerosis, thrombosis, and vascular biology 22, 1381–1389.
10.1161/01.atv.0000031340.68494.34.
Moreira, L.A., Boström, M., Ninham, B.W., Biscaia, E.C., Tavares, F.W., 2006.
Hofmeister effects: Why protein charge, pH titration and protein precipitation depend
on the choice of background salt solution. Colloids and Surfaces A: Physicochemical
and Engineering Aspects 282-283, 457–463. 10.1016/j.colsurfa.2005.11.021.
Mosesson, M.W., 2005. Fibrinogen and fibrin structure and functions. Journal of
thrombosis and haemostasis : JTH 3, 1894–1904. 10.1111/j.1538-7836.2005.01365.x.
Müllertz, S., 1974. Different molecular forms of plasminogen and plasmin produced by
urokinase in human plasma and their relation to protease inhibitors and lysis of
fibrinogen and fibrin. The Biochemical journal 143, 273–283. 10.1042/bj1430273.
Murayama, K., Wu, Y., Czarnik-Matusewicz, B., Ozaki, Y., 2001. Two-
Dimensional/Attenuated Total Reflection Infrared Correlation Spectroscopy Studies on
Secondary Structural Changes in Human Serum Albumin in Aqueous Solutions: PH-
Dependent Structural Changes in the Secondary Structures and in the Hydrogen
Bondings of Side Chains. J. Phys. Chem. B 105, 4763–4769. 10.1021/jp004537a.
Muszbek, L., Yee, V.C., Hevessy, Z., 1999. Blood Coagulation Factor XIII. Thrombosis
Research 94, 271–305. 10.1016/S0049-3848(99)00023-7.
O'Brien, F.J., 2011. Biomaterials & scaffolds for tissue engineering. Materials Today 14,
88–95. 10.1016/S1369-7021(11)70058-X.
Odrljin, T.M., Francis, C.W., Sporn, L.A., Bunce, L.A., Marder, V.J., Simpson-Haidaris,
P.J., 1996a. Heparin-Binding Domain of Fibrin Mediates Its Binding to Endothelial
Cells. ATVB 16, 1544–1551. 10.1161/01.ATV.16.12.1544.

166
Odrljin, T.M., Shainoff, JR, Lawrence, S.O., Simpson-Haidaris, P.J., 1996b. Thrombin
cleavage enhances exposure of a heparin binding domain in the N-terminus of the fibrin
beta chain. Blood 88, 2050–2061. 10.1182/blood.V88.6.2050.bloodjournal8862050.
Ohkawa, K., Cha, D., Kim, H., Nishida, A., Yamamoto, H., 2004. Electrospinning of
Chitosan. Macromol. Rapid Commun. 25, 1600–1605. 10.1002/marc.200400253.
Palta, S., Saroa, R., Palta, A., 2014. Overview of the coagulation system. Indian journal of
anaesthesia 58, 515–523. 10.4103/0019-5049.144643.
Pechik, I., Yakovlev, S., Mosesson, M.W., Gilliland, G.L., Medved, L., 2006. Structural
Basis for Sequential Cleavage of Fibrinopeptides upon Fibrin Assembly †,‡.
Biochemistry 45, 3588–3597. 10.1021/bi0525369.
Pfützner, H., 2012. Angewandte Biophysik, 2nd ed. Springer, Vienna, 321 pp.
Picken, M.M., 2010. Fibrinogen amyloidosis: The clot thickens! Blood 115, 2985–2986.
10.1182/blood-2009-12-236810.
Pizzo, S.V., Schwartz, M.L., Hill, R.L., McKee, P.A., 1972. The effect of plasmin on the
subunit structure of human fibrinogen. The Journal of biological chemistry 247, 636–
645.
Protopopova, A.D., Barinov, N.A., Zavyalova, E.G., Kopylov, A.M., Sergienko, V.I.,
Klinov, D.V., 2015. Visualization of fibrinogen αC regions and their arrangement
during fibrin network formation by high-resolution AFM. Journal of thrombosis and
haemostasis : JTH 13, 570–579. 10.1111/jth.12785.
Raiskup, F., Spoerl, E., 2013. Corneal crosslinking with riboflavin and ultraviolet A. I.
Principles. The ocular surface 11, 65–74. 10.1016/j.jtos.2013.01.002.
Rajangam, T., An, S.S.A., 2013. Fibrinogen and fibrin based micro and nano scaffolds
incorporated with drugs, proteins, cells and genes for therapeutic biomedical
applications. International Journal of Nanomedicine 8, 3641–3662.
10.2147/IJN.S43945.
Ramakrishnan, C., Ramachandran, G.N., 1965. Stereochemical Criteria for Polypeptide and
Protein Chain Conformations. Biophysical Journal 5, 909–933. 10.1016/S0006-
3495(65)86759-5.
Raoufi, M., Aslankoohi, N., Mollenhauer, C., Boehm, H., Spatz, J.P., Bruggemann, D.,
2016. Template-assisted extrusion of biopolymer nanofibers under physiological
conditions. Integrative biology : quantitative biosciences from nano to macro 8, 1059–
1066. 10.1039/c6ib00045b.
Raoufi, M., Das, T., Schoen, I., Vogel, V., Bruggemann, D., Spatz, J.P., 2015. Nanopore
Diameters Tune Strain in Extruded Fibronectin Fibers. Nano letters 15, 6357–6364.
10.1021/acs.nanolett.5b01356.
Reichert, J., Wei, G., Jandt, K.D., 2009. Formation and Topotactical Orientation of
Fibrinogen Nanofibrils on Graphite Nanostructures. Advanced Engineering Materials
11, B177‐B181.
Reimer, L., 1998. Scanning Electron Microscopy: Physics of Image Formation and
Microanalysis. Springer Berlin Heidelberg, Berlin, Heidelberg, s.l., 529 pp.

References
167
Rosenberg, R.D., 1989. Biochemistry of heparin antithrombin interactions, and the
physiologic role of this natural anticoagulant mechanism. The American Journal of
Medicine 87, S2-S9. 10.1016/0002-9343(89)80523-6.
Santoro, E., Agresta, F., Buscaglia, F., Mulieri, G., Mazzarolo, G., Bedin, N., Mulieri, M.,
2007. Preliminary experience using fibrin glue for mesh fixation in 250 patients
undergoing minilaparoscopic transabdominal preperitoneal hernia repair. Journal of
laparoendoscopic & advanced surgical techniques. Part A 17, 12–15.
10.1089/lap.2006.0107.
Schatten, H., 2011. Low voltage high-resolution SEM (LVHRSEM) for biological
structural and molecular analysis. Micron (Oxford, England : 1993) 42, 175–185.
10.1016/j.micron.2010.08.008.
Schatten, H., Pawley, J.B. (Eds.), 2008. Biological Low-Voltage Scanning Electron
Microscopy. Springer Science+Business Media LLC, New York, NY.
Sell, S., Barnes, C., Simpson, D., Bowlin, G., 2008a. Scaffold permeability as a means to
determine fiber diameter and pore size of electrospun fibrinogen. Journal of Biomedical
Materials Research Part A 85A, 115–126.
Sell, S.A., Francis, M.P., Garg, K., McClure, M.J., Simpson, D.G., Bowlin, G.L., 2008b.
Cross-linking methods of electrospun fibrinogen scaffolds for tissue engineering
applications. Biomedical Materials 3, 45001–45012.
Shireman, P.K., Greisler, H.P., 1998. Fibrin sealant in vascular surgery: A review. Journal
of long-term effects of medical implants 8, 117–132.
Sierra, D.H., 1993. Fibrin sealant adhesive systems: A review of their chemistry, material
properties and clinical applications. Journal of biomaterials applications 7, 309–352.
10.1177/088532829300700402.
Sporn, L.A., Bunce, L.A., Francis, C.W., 1995. Cell proliferation on fibrin: Modulation by
fibrinopeptide cleavage. Blood 86, 1802–1810.
Spraggon, G., Everse, S.J., Doolittle, R.F., 1997. Crystal structures of fragment D from
human fibrinogen and its crosslinked counterpart from fibrin. Nature 389, 455–462.
10.1038/38947.
Stapelfeldt, K., Stamboroski, S., Mednikova, P., Brüggemann, D., 2019a. Fabrication of
3D-nanofibrous fibrinogen scaffolds using salt-induced self assembly. Biofabrication
11, 25010. 10.1088/1758-5090/ab0681.
Stapelfeldt, K., Stamboroski, S., Walter, I., Suter, N., Kowalik, T., Michaelis, M.,
Brüggemann, D., 2019b. Controlling the Multiscale Structure of Nanofibrous
Fibrinogen Scaffolds for Wound Healing. Nano letters 19, 6554–6563.
10.1021/acs.nanolett.9b02798.
Stein, T.P., Leskiw, M.J., Wallace, H.W., 1978. Measurement of half-life human plasma
fibrinogen. The American journal of physiology 234, D504-10.
10.1152/ajpendo.1978.234.5.E504.
Teo, W.E., Ramakrishna, S., 2006. A review on electrospinning design and nanofibre
assemblies. Nanotechnology 17, R89. 10.1088/0957-4484/17/14/R01.

168
Toyama, B.H., Weissman, J.S., 2011. Amyloid Structure: Conformational Diversity and
Consequences. Annual review of biochemistry 80, 557–585. 10.1146/annurev-biochem-
090908-120656.
van Kampen, C.L., Gibbons, D.F., Jones, R.D., 1979. Effect of implant surface chemistry
upon arterial thrombosis. J. Biomed. Mater. Res. 13, 517–541. 10.1002/jbm.820130402.
Vikinge, T.P., Hansson, K.M., Sandström, P., Liedberg, B., Lindahl, T.L., Lundström, I.,
Tengvall, P., Höök, F., 2000. Comparison of surface plasmon resonance and quartz
crystal microbalance in the study of whole blood and plasma coagulation. Biosensors
and Bioelectronics 15, 605–613. 10.1016/S0956-5663(00)00125-1.
Vogel, V., 2018. Unraveling the Mechanobiology of Extracellular Matrix. Annu. Rev.
Physiol. 80, 353–387. 10.1146/annurev-physiol-021317-121312.
Wang, J., Wang, H., Wang, Y., Li, J., Su, Z., Wei, G., 2014. Alternate layer-by-layer
assembly of graphene oxide nanosheets and fibrinogen nanofibers on a silicon substrate
for a biomimetic three-dimensional hydroxyapatite scaffold. J. Mater. Chem. B 2,
7360–7368. 10.1039/C4TB01324G.
Wang, S., Han, X., Wang, Y., Li, K., 2019. Dispersion of the Retardation of a Photoelastic
Modulator. Applied Sciences 9, 341. 10.3390/app9020341.
Wasilewska, M., Adamczyk, Z., Jachimska, B., 2009. Structure of fibrinogen in electrolyte
solutions derived from dynamic light scattering (DLS) and viscosity measurements.
Langmuir : the ACS journal of surfaces and colloids 25, 3698–3704.
10.1021/la803662a.
Wei, G., Reichert, J., Bossert, J., Jandt, K.D., 2008a. Novel Biopolymeric Template for the
Nucleation and Growth of Hydroxyapatite Crystals Based on Self-Assembled
Fibrinogen Fibrils. Biomacromolecules 9, 3258–3267.
Wei, G., Reichert, J., Jandt, K.D., 2008b. Controlled self-assembly and templated
metallization of fibrinogen nanofibrils. Chemical communications, 3903‐3.
Wei, G., Su, Z., Reynolds, N.P., Arosio, P., Hamley, I.W., Gazit, E., Mezzenga, R., 2017.
Self-assembling peptide and protein amyloids: From structure to tailored function in
nanotechnology. Chemical Society reviews 46, 4661–4708. 10.1039/c6cs00542j.
Weisel, J.W., MEDVED, L., 2001. The structure and function of the alpha C domains of
fibrinogen. Annals of the New York Academy of Sciences 936, 312–327.
10.1111/j.1749-6632.2001.tb03517.x.
Weisel, J.W., Stauffacher, C.V., Bullitt, E., Cohen, C., 1985. A model for fibrinogen:
Domains and sequence. Science (New York, N.Y.) 230, 1388–1391.
10.1126/science.4071058.
Weisel, J.W., Veklich, Y., Gorkun, O., 1993. The sequence of cleavage of fibrinopeptides
from fibrinogen is important for protofibril formation and enhancement of lateral
aggregation in fibrin clots. Journal of Molecular Biology 232, 285–297.
10.1006/jmbi.1993.1382.
Weitz, J.I., Hudoba, M., Massel, D., Maraganore, J., Hirsh, J., 1990. Clot-bound thrombin
is protected from inhibition by heparin-antithrombin III but is susceptible to inactivation
References
169
by antithrombin III-independent inhibitors. The Journal of clinical investigation 86,
385–391. 10.1172/JCI114723.
Weitz, J.I., Leslie, B., 1990. Urokinase has direct catalytic activity against fibrinogen and
renders it less clottable by thrombin. The Journal of clinical investigation 86, 203–212.
10.1172/JCI114685.
Williamson, M.P., 1994. The structure and function of proline-rich regions in proteins. The
Biochemical journal 297 (Pt 2), 249–260. 10.1042/bj2970249.
Wnek, G.E., Carr, M.E., Simpson, D.G., Bowlin, G.L., 2003. Electrospinning of Nanofiber
Fibrinogen Structures. Nano letters 3, 213–216.
Yee, V.C., Pratt, K.P., Côté, H.C., Trong, I.L., Chung, D.W., Davie, E.W., Stenkamp, R.E.,
Teller, D.C., 1997. Crystal structure of a 30 kDa C-terminal fragment from the gamma
chain of human fibrinogen. Structure (London, England : 1993) 5, 125–138.
Zeugolis, D.I., Khew, S.T., Yew, E.S.Y., Ekaputra, A.K., Tong, Y.W., Yung, L.-Y.L.,
Hutmacher, D.W., Sheppard, C., Raghunath, M., 2008. Electro-spinning of pure
collagen nano-fibres - just an expensive way to make gelatin? Biomaterials 29, 2293–
2305. 10.1016/j.biomaterials.2008.02.009.
Zhang, G., Wang, X., Wang, Z., Zhang, J., Suggs, L., 2006. A PEGylated fibrin patch for
mesenchymal stem cell delivery. Tissue engineering 12, 9–19. 10.1089/ten.2006.12.9.
Zhang, L., Casey, B., Galanakis, D.K., Marmorat, C., Skoog, S., Vorvolakos, K., Simon,
M., Rafailovich, M.H., 2017. The influence of surface chemistry on adsorbed fibrinogen
conformation, orientation, fiber formation and platelet adhesion. Acta biomaterialia 54,
164–174. 10.1016/j.actbio.2017.03.002.
Zhang, Y., Cremer, P.S., 2006. Interactions between macromolecules and ions: The
Hofmeister series. Current opinion in chemical biology 10, 658–663.
10.1016/j.cbpa.2006.09.020.
Zhu, J., Kaufman, L.J., 2014. Collagen I Self-Assembly: Revealing the Developing
Structures that Generate Turbidity. Biophysical Journal 106, 1822–1831.
10.1016/j.bpj.2014.03.011.
Zuev, Y.F., Litvinov, R.I., Sitnitsky, A.E., Idiyatullin, B.Z., Bakirova, D.R., Galanakis,
D.K., Zhmurov, A., Barsegov, V., Weisel, J.W., 2017. Conformational Flexibility and
Self-Association of Fibrinogen in Concentrated Solutions. The journal of physical
chemistry. B 121, 7833–7843. 10.1021/acs.jpcb.7b05654.

170
9. Acknowledgements
First of all, I would like to thank Prof. Dr. Dorothea Brüggemann for giving me the
opportunity to join her working group for my doctoral thesis. I am thankful for her
guidance, her supervision and scientific discussion.
I would like to especially thank her for her efforts allowing me to start this thesis and for
her efforts making it possible to complete this thesis.
Secondly, I would like to thank Prof. Dr. Monika Fritz for agreeing to review this thesis
and for her advice and ideas she contributed to this project during the Biophysics seminars.
My special thanks go to Monika Michaelis who taught me to measure and to interpret
circular dichroism. I am thankful for her advice and her diplomatic skills.
I also would like to thank especially Naiana Suter for being one of the best colleagues,
motivational coaches, friends and housekeepers I know. One of the other best colleagues
that I would like to thank is of course Dr. Jana Markhoff. I will miss all the scientific and
nonscientific discussions I had with both of you.
Thanks also to Eva Eilers who contributed to a lot of basic infrastructure, a lot of work and
even more cake, without which the thesis would not have been possible.
Furthermore, I would like to thank all the other members and students of the Biophysics
Institute. Thank you for the amazing times we had.
Last but not least I would like to thank all of my friends and family members who
supported me during the past years.

Eigenständigkeitserklärung
171
10. Eigenständigkeitserklärung
Hiermit versichere ich, dass ich
1. die Arbeit ohne unerlaubte fremde Hilfe angefertigt habe,
2. keine anderen als die von mir angegeben Quellen und Hilfsmittel benutzt habe,
3. die, den benutzten Werken wörtlich oder inhaltlich entnommenen Stellen als
solche kenntlich gemacht habe.
Des Weiteren versichere ich, dass ich mich bisher keinem Promotionsverfahren unterzogen
bzw. ein solches beantragt habe.
Ich bin damit einverstanden, dass eine Überprüfung der Dissertation mit qualifizierter
Software im Rahmen der Untersuchung von Plagiatsvorwürfen gestattet ist.
Datum: _____________ Unterschrift: __________________________
Related Documents