Ferroelectric Phase Transition in Individual Single-Crystalline BaTiO 3 Nanowires Jonathan E. Spanier, ²,§, | Alexie M. Kolpak, ², ⊥ Jeffrey J. Urban, § Ilya Grinberg, ⊥ Lian Ouyang, § Wan Soo Yun, ‡,§ Andrew M. Rappe,* ,⊥ and Hongkun Park* ,§ Department of Chemistry and Chemical Biology, HarVard UniVersity, Cambridge Massachusetts 02138, Department of Materials Science and Engineering, Drexel UniVersity, Philadelphia, PennsylVania 19104, and The Makineni Theoretical Laboratories, Department of Chemistry, UniVersity of PennsylVania, Philadelphia, PennsylVania 19104-6323 Received December 24, 2005 ABSTRACT We report scanned probe characterizations of the ferroelectric phase transition in individual barium titanate (BaTiO 3 ) nanowires. Variable- temperature electrostatic force microscopy is used to manipulate, image, and evaluate the diameter-dependent stability of ferroelectric polarizations. These measurements show that the ferroelectric phase transition temperature (T C ) is depressed as the nanowire diameter (d nw ) decreases, following a 1/d nw scaling. The diameter at which T C falls below room temperature is determined to be ∼3 nm, and extrapolation of the data indicates that nanowires with d nw as small as 0.8 nm can support ferroelectricity at lower temperatures. We also present density functional theory (DFT) calculations of bare and molecule-covered BaTiO 3 surfaces. These calculations indicate that ferroelectricity in nanowires is stabilized by molecular adsorbates such as OH and carboxylates. These adsorbates are found to passivate polarization charge more effectively than metallic electrodes, explaining the observed stability of ferroelectricity in small-diameter BaTiO 3 nanowires. Ferroelectric phase transitions of perovskite-based oxides represent an important class of structural phase transitions that bear significant technological implications. 1,2 Ferroelec- tric perovskites exhibit a spontaneous electric polarization that can be reoriented by an external electric field. 1,2 As the temperature increases and reaches a critical temperature, T C , these oxides undergo a polar-to-centrosymmetric structural transformation. The size dependence of T C governs the ultimate size limit of ferroelectric nonvolatile memory 3,4 and has been the subject of numerous investigations. 5-12 One of the most important factors determining the stability of nanoscale ferroelectricity is the compensation of polariza- tion-induced surface charges. 1,2 Incomplete screening of surface charges results in a depolarization field that opposes the bulk polarization, thereby suppressing ferroelectricity. In typical ferroelectric devices, the surface charge is screened by two metallic electrodes that sandwich the ferroelectric material. 1,2 The observations of stable ferroelectricity in thin ferroelectric films 5-7,13-15 and nanocrystalline materials 11,12 in the absence of metallic electrodes suggest, however, that other screening mechanisms may also be operative in stabilizing nanoscale ferroelectricity. Here, we report combined experimental and theoretical investigations that characterize nanoscale ferroelectricity in single-crystalline BaTiO 3 nanowires and propose a new mechanism for the screening of surface charge by atomic and molecular adsorbates. Variable-temperature scanned probe microscopy is used to probe temperature-induced phase transitions in individual single-crystalline BaTiO 3 nanowires lying on gold (Au) substrates, thereby removing the difficul- ties associated with ensemble averaging. 11,12 Our density functional theory (DFT) calculations and first-principles statistical mechanical modeling 16,17 indicate that charge compensation is provided by molecular hydroxyl (OH) and/ or carboxylate (R-COO) adsorbates, which are prevalent on oxide surfaces 16,18-20 and confirmed to be present in our experiments. Our theoretical calculations show that these adsorbates provide more effective charge screening than metallic and oxide electrodes, 9,10 stabilizing ferroelectricity in smaller BaTiO 3 structures. These findings suggest that perovskite-based ferroelectric devices can be miniaturized * To whom correspondence should be addressed. E-mail: [email protected]; [email protected]. ² These authors contributed equally to this work. ‡ Present Address: Korea Research Institute of Standards and Science, Daejeon, Republic of Korea. § Harvard University. | Drexel University. ⊥ University of Pennsylvania. NANO LETTERS 2006 Vol. 6, No. 4 735-739 10.1021/nl052538e CCC: $33.50 © 2006 American Chemical Society Published on Web 03/15/2006

Welcome message from author
This document is posted to help you gain knowledge. Please leave a comment to let me know what you think about it! Share it to your friends and learn new things together.
Transcript
Ferroelectric Phase Transition inIndividual Single-Crystalline BaTiO 3NanowiresJonathan E. Spanier, †,§,| Alexie M. Kolpak, †,⊥ Jeffrey J. Urban, § Ilya Grinberg, ⊥
Lian Ouyang, § Wan Soo Yun, ‡,§ Andrew M. Rappe,* ,⊥ and Hongkun Park* ,§
Department of Chemistry and Chemical Biology, HarVard UniVersity, CambridgeMassachusetts 02138, Department of Materials Science and Engineering, DrexelUniVersity, Philadelphia, PennsylVania 19104, and The Makineni TheoreticalLaboratories, Department of Chemistry, UniVersity of PennsylVania,Philadelphia, PennsylVania 19104-6323
Received December 24, 2005
ABSTRACT
We report scanned probe characterizations of the ferroelectric phase transition in individual barium titanate (BaTiO 3) nanowires. Variable-temperature electrostatic force microscopy is used to manipulate, image, and evaluate the diameter-dependent stability of ferroelectricpolarizations. These measurements show that the ferroelectric phase transition temperature ( TC) is depressed as the nanowire diameter ( dnw)decreases, following a 1/ dnw scaling. The diameter at which TC falls below room temperature is determined to be ∼3 nm, and extrapolation ofthe data indicates that nanowires with dnw as small as 0.8 nm can support ferroelectricity at lower temperatures. We also present densityfunctional theory (DFT) calculations of bare and molecule-covered BaTiO 3 surfaces. These calculations indicate that ferroelectricity in nanowiresis stabilized by molecular adsorbates such as OH and carboxylates. These adsorbates are found to passivate polarization charge more effectivelythan metallic electrodes, explaining the observed stability of ferroelectricity in small-diameter BaTiO 3 nanowires.
Ferroelectric phase transitions of perovskite-based oxidesrepresent an important class of structural phase transitionsthat bear significant technological implications.1,2 Ferroelec-tric perovskites exhibit a spontaneous electric polarizationthat can be reoriented by an external electric field.1,2 As thetemperature increases and reaches a critical temperature,TC,these oxides undergo a polar-to-centrosymmetric structuraltransformation. The size dependence ofTC governs theultimate size limit of ferroelectric nonvolatile memory3,4 andhas been the subject of numerous investigations.5-12
One of the most important factors determining the stabilityof nanoscale ferroelectricity is the compensation of polariza-tion-induced surface charges.1,2 Incomplete screening ofsurface charges results in a depolarization field that opposesthe bulk polarization, thereby suppressing ferroelectricity.In typical ferroelectric devices, the surface charge is screenedby two metallic electrodes that sandwich the ferroelectricmaterial.1,2 The observations of stable ferroelectricity in thin
ferroelectric films5-7,13-15 and nanocrystalline materials11,12
in the absence of metallic electrodes suggest, however, thatother screening mechanisms may also be operative instabilizing nanoscale ferroelectricity.
Here, we report combined experimental and theoreticalinvestigations that characterize nanoscale ferroelectricity insingle-crystalline BaTiO3 nanowires and propose a newmechanism for the screening of surface charge by atomicand molecular adsorbates. Variable-temperature scannedprobe microscopy is used to probe temperature-induced phasetransitions in individual single-crystalline BaTiO3 nanowireslying on gold (Au) substrates, thereby removing the difficul-ties associated with ensemble averaging.11,12 Our densityfunctional theory (DFT) calculations and first-principlesstatistical mechanical modeling16,17 indicate that chargecompensation is provided by molecular hydroxyl (OH) and/or carboxylate (R-COO) adsorbates, which are prevalenton oxide surfaces16,18-20 and confirmed to be present in ourexperiments. Our theoretical calculations show that theseadsorbates provide more effective charge screening thanmetallic and oxide electrodes,9,10 stabilizing ferroelectricityin smaller BaTiO3 structures. These findings suggest thatperovskite-based ferroelectric devices can be miniaturized
* To whom correspondence should be addressed. E-mail:[email protected]; [email protected].
† These authors contributed equally to this work.‡ Present Address: Korea Research Institute of Standards and Science,
Daejeon, Republic of Korea.§ Harvard University.| Drexel University.⊥ University of Pennsylvania.
NANOLETTERS
2006Vol. 6, No. 4
735-739
10.1021/nl052538e CCC: $33.50 © 2006 American Chemical SocietyPublished on Web 03/15/2006

further than imagined previously by exploiting the newcharge compensation mechanism.
The single-crystalline BaTiO3 nanowires were synthesizedby solution-phase decomposition of barium titanium isopro-poxide as reported previously.21 The procedure yields well-isolated BaTiO3 nanowires with diameters ranging from 3to 100 nm and lengths up to and above 10µm. Electronmicroscopy and converging beam electron diffraction mea-surements show that these nanowires possess a single-crystalline perovskite structure with a principal axis lyingalong the nanowire length.
The ferroelectric properties of individual BaTiO3 nano-wires were investigated by dispersing them onto a Ausubstrate and probing them using a variable-temperaturescanned probe microscope (SPM) in an ultrahigh-vacuumenvironment (base pressure∼10-10 Torr), as reported previ-ously.22 Topographic images of the nanowires were obtainedby operating the SPM in a noncontact atomic force micros-copy (AFM) mode. Once a nanowire was located and itsdiameter (dnw) was measured, ferroelectric polarization wasinduced or “written” on the nanowire (perpendicular to thewire axis) by applying a large voltage (Vtip) to a conductiveSPM tip. The written polarization was then probed or “read”using electrostatic force microscopy (EFM) by measuringthe shift (∆ν) in the cantilever resonance frequency whilescanning the tip with a smallVtip.1,5,13-15,22
The actual polarization maps were obtained by subtractingan EFM image atVtip ) +1.5 V from another taken atVtip
) -1.5 V, as shown in Figure 1b. This procedure eliminatesthe capacitive contribution between the tip and the nanowireso that the resulting map exhibits only the contribution fromthe surface charges associated with a local electric polariza-tion. Specifically, the contrast in an EFM image reflects thevariation in the electrostatic potential across the surface ofthe nanowire arising from the presence of localized surfacecharges, a finite-range dipole layer, and/or variations in thework function. Previous studies have shown that the lateralextent of the polarized domain does not affect the behaviorof the nanowires significantly and that the nanowireseffectively act as one-dimensional systems that can becharacterized only bydnw.22
Ferroelectric phase transitions were investigated by record-ing the time variation of the EFM signal from individualnanowires as a function of temperature (T). Figure 1c showsa series of such images obtained from a 25-nm-diameternanowire at two different temperatures. At sufficiently lowT, the signal did not decay over a period of>7 days,indicating that the nanowire was ferroelectric. At higherT,the induced polarization became metastable, decaying withtime as shown in the lower panels of Figure 1c. This time-scale behavior and its interpretation as evidence of theferroelectric phase transition is consistent with previouslypublished electrostatic scanning probe characterizations offerroelectric thin films at temperatures below, near, and aboveTC.23 For each wire diameter, a phase transition temperature,TC, was identified below which the polarization was abso-lutely stable for the duration of the experiment (∼200 h.).Although this operational definition can overestimate the true
phase transition temperature, the extrapolation of the ex-perimentally determinedTC reproduced the bulk phasetransition temperature (TC,bulk) in the limit of large dnw,substantiating the validity of the experimental procedure.
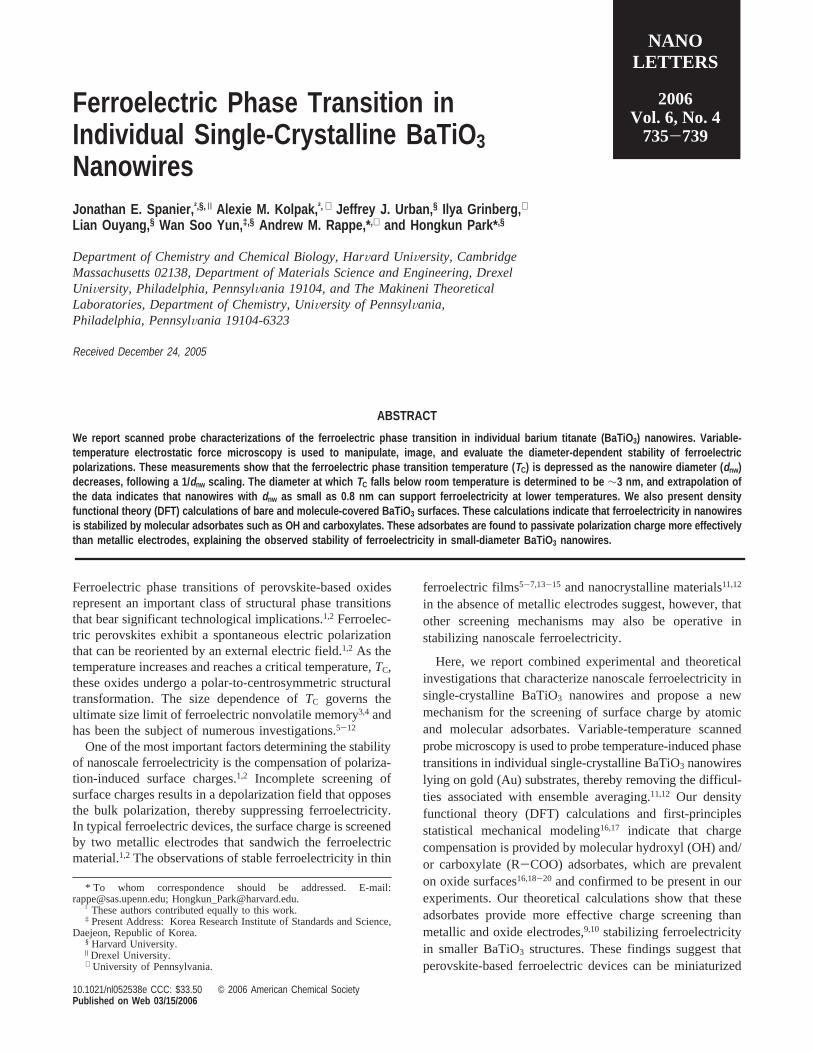
The strong dependence ofTC ondnw is illustrated in Figure2. The figure shows thatTC in larger diameter nanowires isclose toTC,bulk (∼400 K) but drops rapidly asdnw decreases.Furthermore, the inset to Figure 2 clearly shows that thereduction ofTC is inversely proportional todnw. Notably,TC
reaches room temperature whendnw is ∼3 nm, thus estab-lishing the smallest diameter at which a stable polarizationsignal can be measured at room temperature. Extrapolationof the experimental data indicates that nanowires withdnw
as small as 0.8 nm can support ferroelectricity at lowertemperatures.
Figure 1. (a) Schematic diagram illustrating the experimentalgeometry. HereVtip represents the voltage applied to a conductivetip. (b) A topographic image (left) and a spatial map of the electricpolarization (right) of an 11-nm-diameter nanowire. The scale baron the left image represents 200 nm. The polarization map wasobtained by subtracting the electric force microscope (EFM)response atVtip ) +1.5 V from that atVtip ) -1.5 V to removethe contributions from capacitive and topological interactionsbetween the tip and the sample. The writing of the polarizationspot was performed withVtip ) -10 V. The tip-surface distancewas held at 10 nm during the writing procedure and at 35 nm duringthe reading procedure. On the right panel, white corresponds to aresonance frequency shift (∆ν) of 15 Hz. (c) Time series of EFMimages (300× 300 nm2) for a 25-nm-diameter nanowire followingthe polarization writing below and above the phase transitiontemperature. The writing and reading conditions were identical tothose in b.
736 Nano Lett., Vol. 6, No. 4, 2006
The 1/dnw scaling relation shown in Figure 2 suggests thatthe observed suppression of ferroelectricity is caused by thedepolarizing field.24,25However, current views of ferroelectricdestabilization with size suggest that the magnitude of thisdepolarizing field should become too large to support stablepolarization at significantly greater values ofdnw than thoseobserved in Figure 2, particularly in a geometry lacking atop metallic electrode that screens the polarization charge.8,9,11,12
The data therefore suggest that a new screening mechanismis responsible for stabilizing nanoscale ferroelectricity inBaTiO3 nanowires.
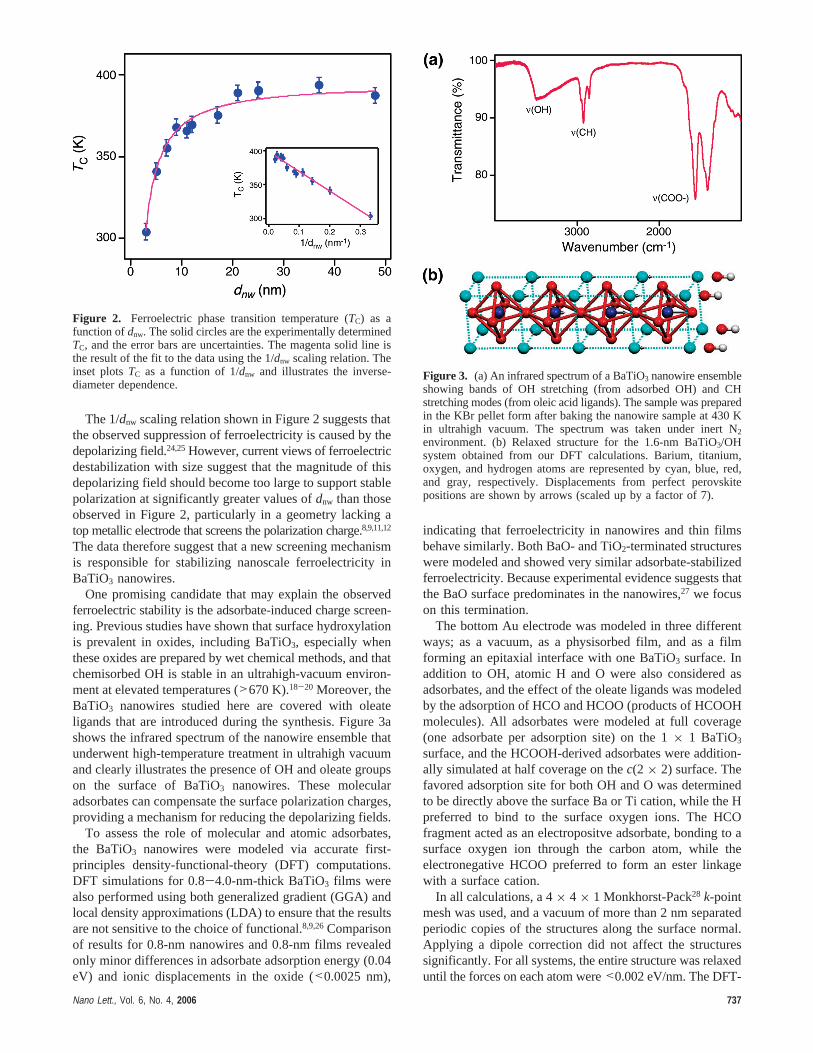
One promising candidate that may explain the observedferroelectric stability is the adsorbate-induced charge screen-ing. Previous studies have shown that surface hydroxylationis prevalent in oxides, including BaTiO3, especially whenthese oxides are prepared by wet chemical methods, and thatchemisorbed OH is stable in an ultrahigh-vacuum environ-ment at elevated temperatures (>670 K).18-20 Moreover, theBaTiO3 nanowires studied here are covered with oleateligands that are introduced during the synthesis. Figure 3ashows the infrared spectrum of the nanowire ensemble thatunderwent high-temperature treatment in ultrahigh vacuumand clearly illustrates the presence of OH and oleate groupson the surface of BaTiO3 nanowires. These molecularadsorbates can compensate the surface polarization charges,providing a mechanism for reducing the depolarizing fields.
To assess the role of molecular and atomic adsorbates,the BaTiO3 nanowires were modeled via accurate first-principles density-functional-theory (DFT) computations.DFT simulations for 0.8-4.0-nm-thick BaTiO3 films werealso performed using both generalized gradient (GGA) andlocal density approximations (LDA) to ensure that the resultsare not sensitive to the choice of functional.8,9,26Comparisonof results for 0.8-nm nanowires and 0.8-nm films revealedonly minor differences in adsorbate adsorption energy (0.04eV) and ionic displacements in the oxide (<0.0025 nm),
indicating that ferroelectricity in nanowires and thin filmsbehave similarly. Both BaO- and TiO2-terminated structureswere modeled and showed very similar adsorbate-stabilizedferroelectricity. Because experimental evidence suggests thatthe BaO surface predominates in the nanowires,27 we focuson this termination.
The bottom Au electrode was modeled in three differentways; as a vacuum, as a physisorbed film, and as a filmforming an epitaxial interface with one BaTiO3 surface. Inaddition to OH, atomic H and O were also considered asadsorbates, and the effect of the oleate ligands was modeledby the adsorption of HCO and HCOO (products of HCOOHmolecules). All adsorbates were modeled at full coverage(one adsorbate per adsorption site) on the 1× 1 BaTiO3
surface, and the HCOOH-derived adsorbates were addition-ally simulated at half coverage on thec(2 × 2) surface. Thefavored adsorption site for both OH and O was determinedto be directly above the surface Ba or Ti cation, while the Hpreferred to bind to the surface oxygen ions. The HCOfragment acted as an electropositve adsorbate, bonding to asurface oxygen ion through the carbon atom, while theelectronegative HCOO preferred to form an ester linkagewith a surface cation.
In all calculations, a 4× 4 × 1 Monkhorst-Pack28 k-pointmesh was used, and a vacuum of more than 2 nm separatedperiodic copies of the structures along the surface normal.Applying a dipole correction did not affect the structuressignificantly. For all systems, the entire structure was relaxeduntil the forces on each atom were<0.002 eV/nm. The DFT-
Figure 2. Ferroelectric phase transition temperature (TC) as afunction ofdnw. The solid circles are the experimentally determinedTC, and the error bars are uncertainties. The magenta solid line isthe result of the fit to the data using the 1/dnw scaling relation. Theinset plotsTC as a function of 1/dnw and illustrates the inverse-diameter dependence.
Figure 3. (a) An infrared spectrum of a BaTiO3 nanowire ensembleshowing bands of OH stretching (from adsorbed OH) and CHstretching modes (from oleic acid ligands). The sample was preparedin the KBr pellet form after baking the nanowire sample at 430 Kin ultrahigh vacuum. The spectrum was taken under inert N2
environment. (b) Relaxed structure for the 1.6-nm BaTiO3/OHsystem obtained from our DFT calculations. Barium, titanium,oxygen, and hydrogen atoms are represented by cyan, blue, red,and gray, respectively. Displacements from perfect perovskitepositions are shown by arrows (scaled up by a factor of 7).
Nano Lett., Vol. 6, No. 4, 2006 737

GGA calculations were performed using ultra-soft pseudo-potentials29 as implemented in the ab initio code Dacapo(http://fysik.dtu.dk/campos), with a plane-wave cutoff of 30Ry. The in-plane lattice constant was fixed to the theoretical(unstrained) BaTiO3 value of 0.396 nm. The optimalcparameter for the tetragonal phase of BaTiO3 was determinedto be 0.406 nm, the ferroelectric well depth was 28 meV/unit cell, and the polarization for the ground-state BaTiO3
structure was 0.26 C/m2. The DFT-LDA calculations wereperformed with our in-house plane wave code, usingoptimized norm-conserving pseudopotentials30-32 with a 50Ry cutoff. The in-plane lattice constant was fixed to 0.398nm, and calculations with ac parameter value of 0.403 nmfound a ferroelectric instability of 9 meV/unit cell, and aminimum energy polarization of 0.25 C/m2.
The results of our simulations demonstrate unambiguouslythat molecules are dramatically more effective than vacuumor metal electrodes at stabilizing ferroelectricity. In agreementwith previous studies,8 none of the bare BaTiO3 filmsconsidered were found to have a stable ferroelectric state;the thinnest SrRuO3/BaTiO3/SrRuO3 film with nonzeropolarization atT ) 0 K in a recent study was 3.2 nm (8 unitcells) thick, with polarization that is a small fraction of thebulk value.8 In contrast, our LDA and GGA calculationsdemonstrate that all of the BaTiO3/adsorbate systems con-sidered exhibit bulklike ferroelectricity in even the thinnestfilms and nanowires. Regardless of the method used tosimulate the Au electrode, our results show that the elec-tronegative adsorbates (OH, O, HCOO) stabilize a positivepolarization (cations toward the surface), while the electro-positive adsorbates (H, HCO) induce a negative polarizationdirection (cations away from the surface). Figure 3b showsa representative structure of a 1.6 nm BaTiO3 film with afull coverage of OH adsorbates. As the figure illustrates, thepresence of the OH adsorbates enhances ferroelectricity atthe positively polarized surface, and maintains a characteristicferroelectric displacement pattern throughout the film. Similartrends are observed in the other BaTiO3/adsorbate systems,with the ferroelectric displacements enhanced at the BaTiO3/adsorbate interface in all cases.
Our DFT calculations show that an overlayer of adsorbatesstabilizes strong ferroelectricity throughout the nanowires,whether an Au electrode is present. This suggests that atomicor molecular adsorption screens a significant amount of thepolarization charge on the surface, reducing the depolarizingfield relative to bare BaTiO3.
First-principles statistical mechanical analysis16,17demon-strates that OH, O, and H adsorbates are thermodynamicallystable under experimental temperatures and pressures. Weuse OH adsorption as an example, as it turned out to be themost stable. For a nanowire or film in equilibrium with anatmosphere of H2O and O2 at fixed temperatureT andpressurep, the Gibbs free energy,∆G ) ∆H - T∆S) ∆E+ p∆V - T∆Scan be computed for the adsorption reactionOH(g) + BaTiO3(s) f BaTiO3/OH(s). Here,∆E is thechemisorption energy (Echem ) EBaTiO3/OH - EBaTiO3 - EOH)determined from the calculated DFT total energies forBaTiO3/OH, bare BaTiO3, and gas-phase OH, with correction
terms for the changes in zero point and spin polarizationenergy upon OH adsorption. The pressure-volume termp∆V, which is dominated by the contribution of the gas-phase adsorbate, is approximated by-kBT (wherekB is theBoltzmann constant). The entropy contribution of the adsorp-tion reaction,T∆S, is determined primarily by the differencein the vibrational entropy of the adsorbed OH and the entropyof the gas phase OH. The former is computed directly fromthe DFT values of the vibrational modes (found at 20, 30,130, 470, 650, and 3860 cm-1), and the latter is knownexperimentally and can be found tabulated online at http://webbook.nist.gov/chemistry.
The computation of∆G as a function of temperature atthe experimental H2O and O2 gas pressures (pH2O) pO2 ≈10-12 atm) allows the determination ofT above which OHadsorption becomes thermodynamically unstable for eachfilm thickness. The value of this temperature ranges from380 to 420 K depending on film thickness and is higher thanthe experimental value ofTC at all film thicknesses. Althoughour calculations show that∆G for O and H adsorption isalso favorable under some range of temperature, OH adsorp-tion is the most favorable, indicating that sufficient OHmolecules are present in the temperature and pressure rangeaccessed in the experiment, and providing further evidencethat OH-induced charge screening is responsible for theobserved ferroelectric stabilization.
In summary, we determined experimentally the size scalingof nanoscale ferroelectricity in single BaTiO3 nanowires. Theenhanced stability relative to previous reports is explainedby the presence of molecular adsorbates. The experimentalstrategy presented here allows the investigation of the size-dependent evolution ofTC without the complication ofensemble averaging, and it should be applicable to phasetransitions of other nanoscale systems. Furthermore, thepresent theoretical study suggests that atomic and molecularadsorbates are more effective than metallic electrodes instabilizing the ferroelectric stability of nanoscale domains,suggesting the possibility of new design principles forferroelectric memory devices.
Acknowledgment. We gratefully acknowledge Qian Gu,Jun-Jieh Wang, and Xiaolin Nan for their technical assistanceand scientific discussions. We also acknowledge ProfessorsR. H. Holm and X. S. Xie for allowing access to theirspectroscopy facilities. This work is supported by theNational Science Foundation, the Packard Foundation, theDreyfus Foundation (H.P.), and by the Office of NavalResearch, the Center for Piezoelectric Design, and theNational Science Foundation, HPCMO and DURIP (A.M.R.).J.S. acknowledges support from the Army Research Office.
References
(1) Lines, M. E.; Glass, A. M.Principles and Applications of Ferro-electrics and Related Materials; Clarendon Press: Oxford, 1977.
(2) Shaw, T. M.; Trolier-McKinstry, S.; McIntyre, P. C.Annu. ReV.Mater. Res.2000, 30, 263-298.
(3) Mathews, S.; Ramesh, R.; Venkatesan, T.; Benedetto, J.Science1997,276, 238-240.
(4) Scott, J. F.; de Araujo, C. A. P.Science1989, 246, 1400-1405.(5) Ahn, C. H.; Rabe, K. M.; Triscone, J. M.Science2004, 303, 488-
491.
738 Nano Lett., Vol. 6, No. 4, 2006
(6) Fong, D. D.; Stephenson, G. B.; Streiffer, S. K.; Eastman, J. A.;Auciello, O.; Fuoss, P. H.; Thompson, C.Science2004, 304, 1650-1653.
(7) Bune, A. V.; Fridkin, V. M.; Ducharme, S.; Blinov, L. M.; Palto, S.P.; Sorokin, A. V.; Yudin, S. G.; Zlatkin, A.Nature1998, 391, 874-877.
(8) Junquera, J.; Ghosez, P.Nature2003, 422, 506-509.(9) Sai, N.; Kolpak, A. M.; Rappe, A. M.Phys. ReV. B 2005, 72, 020101.
(10) Choi, K. J.; Biegalski, M.; Li, Y. L.; Sharan, A.; Schubert, J.; Uecker,R.; Reiche, P.; Chen, Y. B.; Pan, X. Q.; Gopalan, V.; Chen, L. Q.;Schlom, D. G.; Eom, C. B.Science2004, 306, 1005-1009.
(11) Jiang, J.; Krauss, T. D.; Brus, L. E.J. Phys. Chem. B2000, 104,11936-11941.
(12) Tsunekawa, S.; Ito, S.; Mori, T.; Ishikawa, K.; Li, Z.-Q.; Kawazoe,Y. Phys. ReV. B 2000, 62, 3065-3070.
(13) Ahn, C. H.; Tybell, T.; Antognazza, L.; Char, K.; Hammond, R. H.;Beasley, M. R.; Fischer, Ø.; Triscone, J.-M.Science1997, 276,1100-1103.
(14) Kalinin, S. V.; Bonnell, D. A.Phys. ReV. B 2001, 63, 125411-23.(15) Kalinin, S. V.; Bonnell, D. A.Appl. Phys. Lett.2001, 78, 1116-
1118.(16) Sun, Q.; Reuter, K.; Scheffler, M.Phys. ReV. B 2003, 67, 205424.(17) Reuter, K.; Scheffler, M.Phys. ReV. Lett. 2003, 90, 046103.(18) Noda, T.; Wada, S.; Yano, M.; Suzuki, T.J. Appl. Phys.1996, 80,
5223-5233.
(19) Abicht, H. P.; Voltzke, D.; Schneider, R.; Woltersdorf, J.; Lichten-berger, O.Mater. Chem. Phys.1998, 55, 188-192.
(20) Wegmann, M.; Watson, L.; Hendry, A.J. Am. Ceram. Soc.2004,87, 371-377.
(21) Urban, J. J.; Yun, W. S.; Gu, Q.; Park, H.J. Am. Chem. Soc.2002,124, 1186-1187.
(22) Yun, W. S.; Urban, J. J.; Gu, Q.; Park, H.Nano Lett.2002, 2, 447-450.
(23) Kalinin, S. V.; Bonnell, D. A.J. Appl. Phys.2000, 87, 3950-3957.(24) Dawber, M.; Chandra, P.; Littlewood, P. B.; Scott, J. F.J. Phys.:
Condens. Matter2003, 15, L393-L398.(25) Batra, I. P.; Wurfel, P.; Silverman, B. D.Phys. ReV. B 1973, 8, 3257-
3265.(26) Kohn, W.; Sham, L. J.Phys. ReV. 1965, 140, A1133-1138.(27) Bonnell, D. A. Private communication, 2005.(28) Monkhorst, H. J.; Pack, J. D.Phys. ReV. B 1976, 13, 5188-92.(29) Vanderbilt, D.Phys. ReV. B 1990, 41, 7892-7895.(30) Rappe, A. M.; Rabe, K. M.; Kaxiras, E.; Joannopoulos, J. D.Phys.
ReV. B 1990, 41, 1227-30.(31) Ramer, N. J.; Rappe, A. M.Phys. ReV. B 1999, 59, 12471-12478.(32) Grinberg, I.; Ramer, N. J.; Rappe, A. M.Phys. ReV. B 2001, 63,
201102.
NL052538E
Nano Lett., Vol. 6, No. 4, 2006 739
Related Documents