Óbuda University Material Science and Technology PhD School Faculty of Light Industry and Environmental Engineering Nano-layers against material deterioration in aqueous environment Talah Abohalkuma Supervisor: Dr. Judit Telegdi Budapest 2018

Welcome message from author
This document is posted to help you gain knowledge. Please leave a comment to let me know what you think about it! Share it to your friends and learn new things together.
Transcript

Óbuda University
Material Science and Technology PhD School
Faculty of Light Industry and Environmental Engineering
Nano-layers against material deterioration in aqueous environment
Talah Abohalkuma
Supervisor: Dr. Judit Telegdi
Budapest 2018

Nano-layers against material deterioration in aqueous environment
Ph.D Thesis
Talah Abohalkuma
This dissertation is presented as part of the requirements for
the award of the Ph.D degree of Obuda University
Budapest 2018

Declaration
The research work reported in this thesis has been carried out under the
supervision of Dr. Judit Telegdi member of the Obuda Doctoral School
Comity. The subject matter of the thesis is original and has not previously
been submitted in part or in full for any degree or diploma at this or any
other tertiary educational institution.
Talah Abohalkuma

Dedication
TO MY BELOVED PARENTS
i
Acknowledgment
Firstly, I would like to express my sincere gratitude to my advisor Dr. Judit Telegdi for
her continuous support, patience, motivation, and immense knowledge through my Ph.D
study. Her guidance helped me in all times of research and writing of this thesis. I could
not have imagined having a better advisor and mentor for my Ph.D study. She was my
teacher and mentor and has taught me more than I could ever give her credit for here.
Besides my advisor, each of the staff members of the Óbuda University who has
provided me extensive personal assistance and taught me a great deal about scientific
maters. My gratitude goes to Dr. Judit Borsa for her professional guidance though out
my study.
I would like to thank the Institute of Materials and Environmental Chemistry, Functional
Interfaces Research Group specially Dr. Abdul Shaban for his insightful help and
encouragement. My sincere thanks also go to Dr. Ilona Felhősi and Dr. Zsófia
Keresztes. I am grateful to all of those with whom I have had the pleasure to work during
this project.
As well as to my thanks goes to Zoltán Papp (Cetre for Energy Reseach, Hungarian
Academy of Sciences) for the irradiation of my samples.
My superior thanks to my life-coach my father, for whom words can never express how
grateful I am for all his inspiration, drive, guardian, support, and sacrifice that he made
on my behalf, without him I might not be the person I am today. His prayer for me was
what sustained me this far. My thanks also go to my beloved sisters for supporting me
spiritually throughout this study and in my life in general. I owe it all to my family.

ii
TABLE OF CONTENT
Acknowledgment i
Table of contents ii
List of abbreviations vii
List of symbols viii
List of figures ix
List of tables xiii
Chapter One 1
1. Introduction 1
Chapter Two 3
2. Literature Survey 3
2.1 Corrosion basics 3
2.1.1 Electrochemical reaction 4
2.1.2 Corrosion appearance 4
2.1.3 Corrosion of metals 5
2.1.3.1 Corrosion of iron and its alloys 5
2.1.3.2 Corrosion of stainless steel 6
2.1.3.3 Corrosion of Aluminum 7
2.2 Corrosion protection 7
2.2.1 Organic inhibitors 9
2.2.1.1 Phosphoric acids as corrosion inhibitors 10
i. Phosphonic acids corrosion inhibitors in a dissolved form 10
ii. Phosphonic acids in nanolayer 11

iii
2.3 Self-Assembled Monolayers 13
2.3.1 Self-Assembled Monolayers theory 13
2.4.2 Self-Assembled Monolayers applications 17
Chapter Three 20
3. Employed Experimental Techniques 20
3.1. Contact angle 20
3.1.1. Static contact angle 22
3.1.2. Dynamic contact angle values measured by Wilhelmy balance 23
3.2. Atomic force microscopy (AFM) 24
3.3. Infrared (IR) spectroscopy 26
3.3.1. FT-IR spectrometer 26
3.3.1.1. The Michelson Interferometer 26
3.3.1.2. Microscopy and imaging 26
3.4. Electrochemical Methods 27
3.4.1. DC Methods 28
3.4.1.1. Potentiodynamic technique 28
3.4.2 AC method 30
3.4.2.1. Electrochemical impedance spectroscopy (EIS) 30
3.5 Adsorption on metal surface 33
3.5.1 Types of adsorption 33
3.5.2 Adsorption Isotherms 33
i. Langmuir adsorption isotherm 34
ii. BET adsorption isotherm 34
iii. Freundlich adsorption isotherm 34

iv
iv. Temkin isotherm 35
v. Dubinin-Radushkevich model 35
Chapter Four 36
4. Experimental Work 36
4.1. Materials and methods 36
4.1.1. Chemicals used for SAM layer formation 36
4.1.2 Metals of study 38
4.1.3 Metal sample preparation 38
4.1.3.1. Samples for contact angle measurements and atomic force microscopy
38
4.1.3.2. Samples for electrochemical measurements 39
4.1.3.3. Additional oxide layer formation 39
4.1.4 Self-assembled molecular layer preparation 39
4.1.4.1 Modification of undecenyl phosphonic acid SAM layers 39
i. Irradiation by Co-60 gamma source 39
ii. Illumination with UV light 40
4.2 Methods of SAM layers characterization 40
4.2.1 Surface characterization by contact angle 40
4.2.1.1 Static contact angle 40
4.2.1.2 Dynamic contact angles 40
4.2.2 Atomic force microscopy 41
4.2.3 Fourier transform infrared (FTIR) spectroscopy 41
4.2.4Electrochemical techniques 42
4.2.4.1 Electrochemical cell 42

v
4.2.4.2 Open circuit potential (OCP) values vs time 42
4.2.4.3 Potentiodynamic polarization measurements 43
4.2.4.4 Electrochemical Impedance Spectroscopy (EIS) 43
Chapter Five 45
5. Results and discussion 45
5.1 SAM layer formation 45
5.2 SAM layer characterization 46
5.2.1 Characterization by contact angle measurements 46
5.2.1.1 Surface characterization by dynamic contact angle 47
5.2.1.1.1 Wettability change caused by SAM layers on different metal surfaces
48
i. Influence of SAM on carbon steel surfaces 48
ii. Influence of SAM on stainless steel surfaces 52
iii. Influence of SAM on aluminum surfaces 56
5.2.1.1.2 Influence of the surface roughness on the SAM layer formation 61
5.2.1.1.3 Influence of the SAM layer curing by UV light on the wettabililty 62
5.2.1.2. Surface characterization by static contact angle values 63
5.2.1.2.1. Influence of the SAM layer curing by UV light 64
5.2.1.2.2. Influence of irradiation by 60Co gamma source 65
5.3 Surface visualization by atomic force microscopy (AFM) 66
5.3.1 Influence of short layer formation time on the surface morphology and the anticorrosion activity
67
5.3.2 Influence of longer SAM layer formation time and irradiation on the surface morphology of different metals
69
5.3.3 Influence of SAM layers on pitting corrosion 72
5.3.4 Influence of SAM layers on general corrosion 75

vi
5.3.5 Influence of the SAM layer post-treatment on the anticorrosion efficacy
76
5.3.6 Surface characterization by roughness parameters 72
5.4 Characterization by IR spectroscopy 80
5.4.1. The effect of UV and irradiation on solid UPA revealed by IR spectroscopy
80
5.5 Electrochemical measurements 84
5.5.1 Open circuit potential (OCP) vs. time 84
5.5.2 Effect of layer formation time on the electrochemical processes 86
5.5.2.1. Potentiodynamic polarization 86
5.5.2.2 Electrochemical Impedance Spectroscopy (EIS) 92
5.5.3 Effect of electrolyte pH on the anticorrosion efficiency 98
5.5.3.1 Influence of the pH measured by potentiodynamic polarization 98
5.5.3.2 Influence of the pH measured by electrochemical impedance spectroscopy
101
5.5.4 Time dependence of protectively effect on of SAM layer covered metal
105
Chapter Six 110
6. Summary 110
References 118
Thesis points 123
Publications 126

vii
List of Abbreviations
AFM Atomic force microscopy
AC Alternating current
AW Atomic weight
CA Contact angle
CE Counter electrode
CS Carbon steel
DC Direct current
EIS Electrochemical impedance spectroscopy
IE Inhibition efficiency
IR Infrared
FTIR Fourier-transform infrared spectroscopy
M Metal
OCP Open circuit potential
SAM Self-assembly monolayers
SCE Saturated calomel electrode
St. St Stainless steel
WE Working electrode

viii
List of Symbols
Density of copper
F Faradays constant
Frequency
Ohm
Over-potential
Phase shift
, Transfer coefficients
a Anodic Tafel slope
c Cathodic Tafel slope
Cl- Chloride ion
E Electrode potential
Ecorr Corrosion potential
I Applied current
i Net current density
icorr Corrosion current
Rp Polarization resistance
Rt Charge transfer resistance
t Time
Z Vertical distance factor
Z(j) Impedance Z’ Real part of the impedance Z’’ Imaginary part of the impedance
ix
List of figures
Fig. 3.1 Wettability of a solid surface 21
Fig. 3.2 Contact angle for a liquid drop on a solid surface 22
Fig. 3.3 Schematic of static contact angle measurement 23
Fig. 3.4 Schematic of dynamic contact angel measurement 24
Fig. 3.5 Schematic representation of the AFM set-u. 25
Fig. 3.6 Schematic of Michelson Interferometer 27
Fig. 3.7 Tafel extrapolation showing the anodic ( a) and cathodic ( c) Tafel constants
29
Fig. 3.8 Schematic of EIS data interpretations 32
Fig. 3.9 Different types of the isotherms 35
Fig. 4.1 Tensiometer (NIMA Ltd, Model DST 9005 41
Fig. 4.2 Atomic force microscop device 41
Fig. 4.3 Potentiostat used for electrochemical measurements 42
Fig. 4.4 Schematic of electrochemical cell (a) and the equivalent electric circuit of the working system (b)
44
Fig. 5.1 Influence of inhibitor type on carbon steel with layers formed at 24h
48
Fig. 5.2 Influence of concentration on the wettability of carbon steel with fluorophosphonic acid and undecenyl phosphonic acid layers formed at 24h
49
Fig. 5.3 Influence of inhibitor types on St. St. 304 with layers formed at 24h
53
Fig. 5.4
Influence of the concentration on the wettability of St. St. 304 with fluorophosphonic acid and undecenyl phosphonic acid layers formed at 24h
55
Fig. 5.5 Influence of inhibitor types on St. St. 316 with layers formed at 24h
56
Fig. 5.6 Influence of inhibitor types on aluminum with layers formed at 48h
59
Fig. 5.7 Comparizon of wettabilities measured on different metal surfaces covered by fluorophosphonic acid SAM layer formed in 24 h
60

x
Fig. 5.8 Wettability measured on different metal surfaces covered by undecenyl phosphonic acid SAM layer formed in 24 h
61
Fig. 5.9 Influence of the aluminum surface finishing on the contact angle change
62
Fig. 5.10 Wetting properties by different fluids 63
Fig. 5.11 Static contact angle values for carbon steel samples 66
Fig. 5.12 Carbon steel surfaces before and after immersion into sodium chloride
67
Fig. 5.13 The influence electrolytes on carbon steel surface 68
Fig. 5.14
SAM layers of fluorophosphonic acid (a) and undecenyl phosphonic acid (b) and its section (c) on carbon steel surfaces (layer formation time: 24 h)
69
Fig. 5.15 Undecenyl phosphonic acid SAM layer (24 h) after irradiation: absorption 2kGy; carbon steel
70
Fig. 5.16 Undecenyl phosphonic acid SAM layer (24 hrs) after irradiation: absorption 20kGy; carbon steel
70
Fig. 5.17
Oxide layer covered aluminum surface (a,b) and with fluorophosphonic acid SAM layer (c,d) visualized in 3D and by section analysis
71
Fig. 5.18
Influence of sodium chloride solution on carbon steelμ “a” and “c”μ bare metal surface before and after immersion in chloride solution for 1 h; “b” and d”μ undecenyl phosphonic acid SAM covered carbon steel surface and after immersion into chloride solution for 1 h
72
Fig. 5.19
Influence of sodium chloride solution of aluminum surface; “a” and “b”μ metal surface visualized in γD and its section; “c” and “d”μ aluminum surface after immersion into chloride solution for 1 h
73
Fig. 5.20
Influence of chloride solution on aluminum surface covered by fluorophosphonic acid SAM layer after 1 h; “a” and “b”μ SAM surface morphology and its section before corrosion test; “c” and “d”μ the SAM layer after immersion into the chloride solution for 1 h
74
Fig. 5.21 Aluminum alloy surface without nanolayer in sodium perchlorate for 1 h, visualized by 3D and section analysis
75
Fig. 5.22
Aluminum alloy surface covered by fluorophosphonic acid SAM layer in sodium perchlorate for 1 h, visualized by 3D and section analysis
75

xi
Fig. 5.23 Influence of the surface modification by irradiation on the anticorrosion activity (UP:undecenyl phosphonic acid)
76
Fig. 5.24 IR1 C-H vibration regions of UPA samples spectra: right: C-H stretching region; left: C-H scissoring region
81
Fig. 5.25
IR2 Stretching region of phosphonic groups in UPA samples 82
Fig. 5.26 Open circuit potential results for layers formed by fluorophosphonic acid
85
Fig. 5.27
Open circuit potential results of layers formed by udecenyl phosphonic acid
85
Fig. 5.28 Effect of SAM layer formation time of fluorophosphonic acid on the corrosion reactions
88
Fig. 5.29 Effect of SAM layer formation time on the corrosion reactions in the case of undecenyl phosphonic acid
88
Fig. 5.30 Time dependent effectiveness values of nanolayers formed on carbon steel surfaces
90
Fig. 5.31 Correlation between the SAM layer formation time of fluorphosphonic acid and undecenyl phosphonic acid and the formation time divided by the surface coverage
91
Fig. 5.32 Equivalent electric circuit for the EIS results 93
Fig. 5.33 Fluorophosphonic acid-SAM layer formed on carbon steel; time dependent Nyquist and Bode plots
94
Fig. 5.34 Undecenyl phosphonic acid-SAM layer formed on carbon steel; time dependent Nyquist and Bode plots
95
Fig. 5.35 Correlation between the polarization resistance and the layer formation time measured on fluorophosphonic acid (FP) and undecenyl phosphonic acid (UP) SAM coated carbon steel
97
Fig. 5.36 Behavior of the bare metal, fluorophosphonic acid and undecenyl phosphonic acid SAM layers covered carbon steel in electrolyte at pH = 3
98
Fig. 5.37 Influence of the electrolyte pH values on the anticorrosion activity of the SAM layers formed by fluorophosphonic acid on carbon steel (NaClO4; 24 h SAM layer formation time)
100
Fig. 5.38 Influence of the electrolyte pH values on the anticorrosion activity of the SAM layers formed by undecenyl phosphonic acid on carbon steel (NaClO4; 24 h SAM layer formation time)
100

xii
Fig. 5.39 Comparison of EIS results got in corrosion experiment by bare metal, layers formed by fluorophosphonic acid and undecenyl phosphonic acid on carbon steel in electrolyte at pH=3
102
Fig. 5.40 Nyquest and Bode plots for layers formed by fluorophosphonic acid on carbon steel in electrolyte at different pH values
103
Fig. 5.41 Nyquist and Bode plots measured on carbon steel surface covered by undecenyl phosphonic acid SAM layer in electrolyte at different pH values
104
Fig. 5.42 Effect of immersion time into electrolyte on fluorophosphonic acid SAM layer covered carbon steel surface
107
Fig. 5.43 Effect of immersion time into electrolyte on undecenyl hosphonic acid SAM layer covered carbon steel surface
108

xiii
List of tables
Table 5.1 Wettability in the mirror of the contact angles 47
Table 5.2 Contact angle values measured on carbon steel surfaces covered by SAM layers formed by different chemicals; influence of the layer formation time, concentrations and dipping number
51
Table 5.3
Contact angle values measured on stainless steel 304 surfaces covered by SAM layers; influence of the chemicals, layer formation time, concentrations and dipping time
54
Table 5.4
Contact angle values measured on SAMs covered stainless steel 316 surfaces; influence of the amphiphiles, layer formation time, and concentrations
56
Table 5.5 Contact angle values measured on SAMs covered aluminum surfaces; influence of the amphiphiles, layer formation time, and concentrations
58
Table 5.6 Static contact angle values measured on carbon steel samples with or without coatings, before and after curing
65
Table 5.7 Roughness parameters of carbon steel surfaces covered by undecenyl phosphonic acid SAM layer formed at 24h with and without radiation treatment
79
Table 5.8
Effect of NaCl on roughness parameters of carbon steel surfaces covered with undecenyl phosphonic acid SAM layer formed at 24h
79
Table 5.9 Effect of NaCl and NaClO4 on roughness parameters and depth analysis data of aluminum surfaces covered with fluorophosphonic acid SAM layer formed at 4h
80
Table 5.10 IR band positions with possible assignments and explanations 83
Table 5.11 Steady-state values of bare carbon steel + SAM nano- layer of fluorophosphonic acid
86
Table 5.12 Steady-state values of bare carbon steel + SAM nan-olayer of undecenyl phosphonic acid
86
Table 5.13 Corrosion parameters for fluorophosphonic acid SAM layers 89
Table 5.14 Corrosion parameters for undecenyl phosphonic acid SAM layers
89

xiv
Table 5.15 EIS parameters for SAM layers formed by fluorophosphonic acid on carbon steel
96
Table 5.16 EIS parameters for SAM layers formed by undecenyl phosphonic acid on carbon steel
97
Table 5.17 Effect of pH on layers formed by fluorophosphonic acid and undecenyl phosphonic acid in electrolyte with pH = 3
99
Table 5.18
Corrosion parameters measured at different pH values in the presence of fluorophosphonic acid SAM layers (NaClO4; 24 h layer formation time)
101
Table 5.19
Corrosion parameters measured at different pH values in the presence of undecenyl phosphonic acid SAM layers (NaClO4; 24 h layer formation time)
101
Table 5.20 EIS parameters measured on carbon steel as bare metal, SAM layers formed by fluorophosphonic acid and undecenyl phosphonic acid on carbon steel in electrolyte at pH=3
101
Table 5.21 EIS parameters for layers formed by fluorophosphonic acid on carbon steel at different pH values of the electrolyte
105
Table 5.22 EIS parameters for layers formed by undecenyl phosphonic acid on carbon steel at different pH values of the electrolyte
105
Table 5.23 Effect of immersion time on fluorophosphonic acid SAM layers
109
Table 5.24 Effect of immersion time on undecenyl phosphonic acid SAM layers
109

1
Chapter One
1. Introduction
The metal corrosion is an important expense in all countries budgets every year. Its efficient
control needs a lot of academic and industrial research, especially because the use of the most
effective inhibitor – chromate – is banned since the last decade. Among the enormous number of
chemicals used as inhibitors in case of different metals, the phosphonic acids - both in dissolved
form as well as in molecular layers - can very effectively inhibit metal corrosion.
My work is focused on the research of self-assembled molecular layers (SAMs) of two special
phosphonic acids. Both are amphiphiles; they consist of a –P (O)(OH)2 head group (the geometry
of the hydrophilic head group is nearly tetrahedral, and can act both as a hydrogen-bond donor
via two P-OH groups and a hydrogen-bond acceptor through the P=O oxygen) and a
hydrophobic side chain. These amphiphilic molecules differ in the hydrophobic molecular part.
One has an alkenyl side chain with a double bond at the end position. I intended to polymerize
this unsaturated bond to form a polymer net over the metal surface that could increase the
compactness of the surface layer and parallel the anticorrosion activity. The other amphiphile is a
semi-fluorinated alkyl phosphonic acid with several fluorine atoms along the carbon chain. It is
well known that the fluorinated groups increase the hydrophobicity of the nanolayer-covered
metal surface, and the barrier properties improve the anticorrosion protection in an aqueous
solution.
The SAM layers are monolayers of organic molecules that form ordered molecular assemblies on
the surface of an appropriate substrate and modify the metal surfaces by spontaneous adsorption
of head groups that show affinity to the solid surface. This methodology is a versatile route for
surface modification. The change in the tail group of the molecules in the SAM nanolayer easily
results in different surface properties.
The complex investigation of self-assembled molecular layers, formed by the two amphiphiles
mentioned above, makes up the main line of the dissertation. Some other amphiphilic molecules

2
were also investigated for comparison. The SAM nanolayers were deposited on iron alloys and
aluminum surfaces from organic solvents of the amphiphiles. First, the effect of layer formation
time on the quality of the SAM layers’, the amphiphile concentration as well as the post-treating
of the undecenyl nanolayer was extensively investigated by specific techniques such as dynamic
and static contact angle measurements in order to study the change in the wettability caused by
the applied surface layers. The time-dependent layer formation was visualized by the maximum
advancing and receding water contact angles. The SAM layer covered metal surfaces were
visualized be atomic force microscopy (AFM). This technique, demonstrated in 3D and in
surface section that allowed the observation of the change in the surface morphology caused by
the presence of the nanolayers without or with post-treatment, on one hand, and, in the other
hand, it monitored the influence of the electrolytes that could cause either general or pitting
corrosion. The surface roughness parameters numerically characterized the change on the
nanocoated surfaces subjected to corrosive environment. The anticorrosion behaviors of the
SAM layers were investigated by electrochemical techniques like potentiodynamic polarization
and electrochemical impedance spectroscopy (EIS). By these techniques not only the type of
inhibition but also the effectiveness of the SAM layer was identified. All these complementary
techniques demonstrated the usefulness of these two amphipiles as SAM layers in aggressive
environment.
The extensive investigation of these SAM layers formed by the above-mentioned phosphonic
acids could be in the future contribute to their use in different fields (e.g in electronic industry) as
they can control the corrosion in molecular layer thickness (which eventuates decrease of
materials applied against corrosion) in the presence of water (liquid or vapor).

3
Chapter Two
2. Literature survey
Metals such as iron and its alloys, copper as well as aluminum have found a wide use in
technical and industrial applications and their corrosion has received a fundamental concern in
the academic and industrial research (1). The metal surfaces are covered by inhomogeneous
oxides, which are not stable against external influences.
2.1 Corrosion basics
Corrosion is known to be a chemical/electrochemical reaction between the metal or metal alloy
and its environment, which leads to destruction. The energy of the chemical reaction that
produces corrosion is equal to the energy amount needed to extract metals from their minerals.
Consequently when a metal is extracted from its ore, it is transformed from a low energy state to
a higher energy level due to the applied external energy. In return, metals do not stay in this
higher energetic state but revert to a lower energy when different metal salts as corrosion
products are formed.
In aqueous environment almost all corrosion processes of metals involve electron charge
transfer. Accordingly, the electrochemical nature of a corrosion process is very important (2).
Corrosion reaction depends on the type and rate of reaction, on environmental factors that are
most important (3). It also depends on the microstructure, chemical nature, roughness, and heat
treatment of the metal. The flow velocity of the electrolyte due to the mass transport distribution
(4) influences the corrosion potential.
As soon as a metallic surface gets in contact with humidity, water or electrolyte, corrosion can
take place by electrochemical reactions and two corrosion sites are formed on the metal surface;
they are known as an anodic site and a cathodic sites. At the anodic site a charge transfer
(electrons) occur which leads to a metal dissolution where metal atoms as metal ions dissolute

4
and form soluble ionic products or insoluble compounds of the metal that is generally an oxide.
This electrochemical reaction is known as an oxidation reaction (5) and as electrons are
produced, a less stable site is formed usually at surface areas that contain e.g., dislocation or
imperfection. On the cathodic site the electrons are consumed and the reaction is reduction. The
cathodic reaction depends on the pH of the media; either HO- ions or hydrogen are evolved and
on the metal surface oxide or hydroxide is formed (4, 6).
2.1.1 Electrochemical reaction
Corrosion reactions of metals can be symbolized with the following equations:
Electrochemical reaction at the anodic site (metal dissolution) is:
M → M2+ + 2e- (2.1)
An example of the electrochemical anodic reactions is the dissolution of some metals such as:
Fe → Fe 2+ + 2e- (2.2)
Cu → Cu+ + e- (2.3)
Al → Al 3+ + 3e- (2.4)
The pH-dependent electrochemical reactions at the cathodic site are:
1. In neutral or alkaline solutions:
O2 + 2H2O + 4e- → 4OH- (oxygen reduction) (2.5)
2. In acidic solutions:
i. in the absence of oxygen:
2H+ + 2e- → H2 (hydrogen evolution) (2.6)
ii. in the presence of oxygen:
O2 + 4H+ + 4e- → βH2O (oxygen reduction) (2.7)
2.1.2. Corrosion appearance
There are several corrosion forms such as uniform, crevice, galvanic, stress, intergranular,
pitting, erosion corrosion, etc. My PhD work has focused on the investigation of uniform and

5
pitting corrosion that is the reason for me to give a short summary on these two forms of
corrosion.
Uniform corrosion: when the complete metal surface is submitted to the same corrosive
environment, a large part of the metal surface is deteriorated (2, 7).
Pitting corrosion: this is a localized form of corrosion that takes place at small areas on
a metal surface and results in a rapid penetration. The size of orifice is much smaller than
the depth of holes. Surface discontinuities can initiate pits (2). The presence of chloride
ions increases the danger of pit formation where in the case of stainless steel in neutral
and acidic solution the chloride ions increase the pitting corrosion. On iron and aluminum
in alkaline chloride solution the mechanism of the pitting corrosion is the same (4).
2.1.3 Corrosion of metals
2.1.3.1. Corrosion of iron and its alloys Products from the anodic and cathodic reactions can interact and form a solid corrosion product
on the metal surface (7). An example of that is the interaction between the ferrous ions Fe+2
(produced in anodic reaction) and the hydroxyl ions OH- (produced in cathodic reaction) as
shown in equation (2.8).
Fe 2+ + 2OH- → Fe(OH)2 (2.8)
The first formed ferrous hydroxide Fe(OH)2 is transformed to ferric hydroxide, Fe(OH)3 via
oxidization by dissolved atmospheric oxygen:
4Fe (OH)2 + O2 + 2H2O → 4Fe(OH)3 (2.9)
Iron dissolution in neutral and alkaline media has similar mechanism (7, 8). These mechanisms
are characterized by the formation of different oxide intermediates [Fe (OH)n]ads depending on
the pH and electrode potential.

6
Bessone’s proposal on the mechanism of iron dissolution in acidic media is that iron oxide is
formed on the metal surface as the stability and protection of this film depends on several factors
(9). In the pH range of 4 – 5.4 it is a time-dependent, porous oxide layer formation on the iron
surface as reported Geana et al. (7,10) while [Fe(OH)2]ads forms at a higher pH ≥ η.η when the
iron dissolution is reduced. In alkaline solutions the first step is the formation of Fe (OH)ads via
the adsorption of OH- ions on the iron surface (11, 12).
Guzman et. al. suggested structural rearrangements through a chemical reaction; the FeOOH and
Fe(OH)2 transform into more stable compounds at higher potentials (13). Depending on the pH
of the solution, the cathodic reaction can be either a diffusion controlled oxygen reduction or
charge transfer controlled hydrogen evaluation, even though at all pH values the iron dissolution
is the main reaction(14, 15). In aerated solutions at pH >4.2 the dominant cathodic reaction is the
oxygen reduction as reported by Lorbeer and Lorenz (16). Turgoose reported (17) that in
unbuffered solution the pH increases up to 10 on the metal surface due to the oxygen reduction
when the formation of a three dimensional oxide is favorable. A relationship between pH and
passivation at a constant Fe2+ concentration and in alkaline state had been demonstrated by
Nagayama and Cohen (18).
2.1.3.2. Corrosion of stainless steel
As a part of my research I worked with two stainless steels (304, 316), I summarize shortly the
corrosion processes that would take place on their surfaces since they are the two most common
stainless steel grades. The only difference is the presence of molybdenum in the composition of
316 stainless steel where as 304 stainless steel does not contain any.
Stainless steel 304 (which is mainly consists of 18% chromium and 8% nickel) is one of
the most widely used stainless steel around the world, which is due to its excellent
corrosion resistance. It can withstand corrosive attack of most oxidizing acids. Stainless
steels do not corrode uniformly (i.e. they resist to general corrosion) as do the carbon
steels do. The most common form of corrosion of stainless steels is the pitting corrosion
when the passive layer on stainless steel is attacked by certain chemical species.

7
However, the stainless steel 304 does have one weakness: it is susceptible to corrosion in
chloride solutions. The chloride ions (even in less than 25ppm concentration!) create
localized areas of corrosion, called "pitting," which can spread beneath the protective
chromium oxide barrier and interacts with the internal structures.
Stainless steel 316 is the second-most common form of steel used all over the world. It
has almost the same physical and mechanical properties as stainless steel 304. The key
difference is that stainless steel 316 contains about 2 to 3 percent molybdenum, which
can drastically enhance the corrosion resistance, especially in environments that contain
chloride ions.
2.1.3.3. Corrosion of aluminum
Aluminum and its alloys have good corrosion resistance because of the oxide layer formed as a
protective film on the aluminum surface when it is exposed to oxygen. This coherent surface
oxide hinders the further reactions with the environment and protects the aluminum surface from
corrosion. In case of mechanical damage of the oxide layer, in the presence of oxygen it will be
repaired immediately. The oxide layer, which provides protection against corrosion, is stable in
the pH range 4-9. Out of this pH range, violent metal corrosion/dissolution will occur. Pitting
corrosion is the most dangerous corrosion attack on aluminum; this could be very easily formed
in the presence of chloride ions.
2.2 Corrosion protection
The corrosion processes i.e. the mechanism of metal dissolution and the cathodic reactions could
be affected by the proper material selection, by dissolved corrosion inhibitors as well as by
several methods such as cathodic protection, and surface treatments/coatings by paints,
molecular layers and metallic layers (plating) (19, 20).
I will give a short summary on the corrosion inhibitors applied in dissolved form and then a more
detailed discussion on organic nanolayers as this topic forms the main part of my research.

8
For a long time, corrosion inhibitors were used to protect metals against aggressive industrial
environments (oil wells, refinery units, cooling systems, acid pickling processes etc.). At first,
mainly inorganic chemicals (chromate, nitrite, nitrate, phosphates, etc.) were applied to protect
metals against corrosion. Chromate is one of the most effective inhibitors, but it is already
banned because of its toxicity (4). The need for developing chromate-, nitrite- and inorganic
phosphorus free inhibitors drove the scientists to search for environmentally friendly organic
inhibitors (21, 22).
Inhibitors are substances or mixtures that inhibit or minimize corrosion when added in small
concentration to an aggressive environment (21). Corrosion inhibitors can slow down the rate of
one or both of the anodic or cathodic reactions. It can happen through the formation of a barrier
between the metal surface and the environment that would reduce the rate of the corrosion
process. There is a wide range of inhibitor application almost in all industries and they can
influence the corrosion kinetics. An efficient inhibitor should meet certain requirements such as
formation of a barrier film, chemisorptions or precipitation on metal surfaces (23).
In general, the mechanism of inhibition can be one or more of the following:
i. Formation of an inhibitor thin film by interaction between inhibitor molecules and
the metallic surface through chemical/physical adsorption.
ii. A film formation by oxide layer on the metal surface with the inhibitor.
iii. Production of a complex due to the reaction of the inhibitor with components
present in the corrosive aqueous media (21).
Corrosion inhibitors can be classified according to their mechanism of action: cathodic, anodic or
as a mix type of anodic- cathodic; adsorption; according to the chemical nature of the inhibitor as
organic or inorganic, or oxidants or non oxidants (21). Inhibitors can also be classified
concerning their retardation mechanism, whether they are interface or interphase inhibitors. As
suggested by Lorenz and Mansfeld (24), interface inhibitors form a two dimensional (2D) films
that reacts directly with the metal surface, assuming that the mechanism is a strong interaction

9
between the metal surface and the inhibitor that forms a barrier due to the inhibitor adsorption as
a two dimensional layer. The 2D films react with a strong interaction directly with the metal
surface and as the inhibitor adsorps a barrier is formed.
The behavior of the inhibitor can be either by geometric blocking of metal surface and the
solution; thus deactivation of the active sites by coverage, or by the inhibitor’s self-reaction that
would take place instead of the metal layer. The other type of inhibition is the interphase
inhibition when three-dimensional (3D) layers are formed by chemisorption or by reaction of the
inhibitor with the film of the corrosion products; the inhibitors diffuses through the diffusion
layer.
2.2.1 Organic inhibitors
Inhibitors used previously are of a wide range of chemicals and most are toxic in nature (25).
Due to the environmental restrictions on heavy metal-based corrosion inhibitors, the researchers
were motivated to study non-toxic and environmentally friendly corrosion inhibitors (26) such as
organic compounds. Organic compounds are the majority of known inhibitors that contain
hetero atoms (phosphorous, nitrogen, sulphur or oxygen), and a multiple bond for allowing
adoption on the metal surface (25, 27). The efficiency of a corrosion inhibitor increases in the
order of O ˂ N˂ S ˂ P (βη). The adsorption depends on the electron density of the donor atom
and of the functional group, which is influenced by the charge, type of electrolyte, the structure
of the metal surface etc.
An organic inhibitor efficiency depends on the structure and the size of the inhibitor’s head
group, hydrophobic part etc., the number and type of bonding groups (π or σ) or atoms in the
molecule, ability to a complex formation with the atoms in the metal lattice, charges, and the
nature of the metallic surface (substrate’s bonding strength).
Existing data show that adsorption interaction between the inhibitor and the metal surface is how
the most organic inhibitor behaves (28, 29). They form a hydrophobic film of adsorbed
molecules, which acts as protective film on the metal surface. Adsorption of these organic
inhibitors is dependent on the electron density at the donor atom on the functional group. It is

10
also influenced by the charge, type of electrolyte, and the structure of the metal surface (25).
Organic phosphorus compounds as corrosion inhibitors are commonly applied on carbon steel,
aluminum, and zinc due to their low toxicity (30, 31).
In my work amphiphilic phosphonic acids are in the focus. This is the reason that in the next part
the phosphonic acid inhibitors are discussed.
2.2.1.1. Phosphonic acids as corrosion inhibitors
Organic phosphonic acids (which were developed instead of phosphates that increased the
eutrophication of natural waters) are very effective in metal corrosion inhibition because of the
stable P-C bond and the easy complexes formation of phosphonic groups with different
metal/oxide/ions (6, 7, 10). They have been widely used in cooling water treatment because of
their low toxicity, high stability and corrosion inhibition activity in aqueous media (32). They
form strong bonds with several metal oxide substrates mostly through the formation of stable
Me-O-P bonds (5, 33). The other factor that influences the effectiveness is the molecular
structures of corrosion inhibitors that have important impact on the anticorrosion efficacy as
pointed out by several authors (34-36).
Phosphonic acids as corrosion inhibitors employed often in case of different metals (iron, low-
alloyed steel, stainless steels, zinc and aluminum) have been extensively studied because of their
stabile complexes with metal ions (24, 25, 28, 29, 37, 38).
i. Phosphonic acid corrosion inhibitors used in dissolved form
The use of dissolved inhibitors is one of the most practical methods for metal protection against
corrosion. Inhibitors are those substances that inhibit, minimize corrosion rate when added in
small concentration to an aggressive solution (19).
Researchers reported the protection of several metals against corrosion in aqueous solution by
phosphonic acids (23, 39). They could be simple molecules with phosphono functional groups

11
like the hydroxyethan diphosphonic acid, nitrilotriphosphonic acid or the 1-phosphonobuthan
tricarboxylic acid and there are several others where not only the phosphonic group, but also
other molecular parts (e.g. amino, substituted amino etc) help to improve the anticorrosion
properties. The anticorrosion efficiency of the phosphonic acids depends not only on the
anchoring effect of the phosphonic group but on the hydrophobic molecular part, too. Shorter
carbon chain results in less effective inhibition than a longer one although the activity depends
on the water solubility. Also when the functional groups are not only in the α, but ω positions,
they also can improve the anticorrosion efficacy (9, 11, 40).
As previously mentioned, the water-soluble phosphonic acids with shorter alkyl chain can
effectively inhibit corrosion by adsorption to metal surfaces. In these cases the corrosion goes
parallel with the deposition of the inhibitor molecules on the metal that could protect the surface
from further corrosion, which means these are competitive reactions.
When metal surfaces - prior to corrosion attack - are coated with non water soluble phosphonic
acids (with phosphono head group and bigger hydrophobic molecular part) the molecular film on
the solid can control the metal dissolution in aggressive environment. This is the other possibility
to control the undesired metal dissolution by coatings.
ii. Phosphonic acids in nanolayers
In contrast to inhibitors used in dissolved form, another possibility for corrosion protection is the
application of coatings on metal surfaces. These layers could be macroscopic like in case of
paints on metals, or a very thin molecular films and nanolayers that can also effectively hinder
corrosion processes (6, 9, 41, 42). The selection of the protection techniques depends on the
solids and on the corrosive environment. The organic nanolayers differ not only in the
preparation method, but also in the thickness of the films formed on the metal surface.
There are several possibilities for thin layer preparation (vapor deposition, layer-by-layer
deposition, sol-gel technique, spin coating electrodeposition etc.).

12
Especially for organic molecular layer deposition generally there are two methods used. The
techniques that are mainly applied for molecular film preparation are the Langmuir-Blodgett
(LB) and the self-assembling molecular (SAM) layer formation.
In corrosive environments, stearic acid nanolayers could inhibit the corrosion on iron (23, 31).
Other studies include palmitic acid on aluminum (25, 43) and 12-amino lauric acid (44), which
also effectively mitigated the corrosion. Considering the type of corrosion there are differences
in inhibiting effectiveness of nanolayers. For example, the alkyl hydroxamic acid nanolayers are
more efficient than fatty carboxylic acids in the prevention of pitting corrosion of copper (23).
Due to the ability of the alkyl phosphonic acids to form SAMs on a range of metal oxide layers,
they have become one of the most important classes of self-assembling organic molecules in
anticorrosive coatings. The surface modification by these organic materials with functional
phosphono head groups can ascertain the modified solid surface characteristics by the self-
assembling process, thus the structure and the chemical properties of the surface are controlled.
A variety of phosphonic acids are commonly used to modify the surfaces of metals and their
oxides for their corrosion protection.
It is important to understand the molecular interactions involved in the surface modification and
the effects that the modification has on the electronic state of the surface (45). The
functionalization of normal alkyl phosphonic acids is easy by the formation of thin films, not
only on pure metals but on the metal alloys and metal oxide surfaces which is due to the strong
interactions between the adsorbing molecules and the substrate surfaces (46-48).
Surface modification of stainless steel is also an important part of the research. The phosphonic
acid-steel interaction is significant from industrial point of view. At room temperature SAM
phosphonic acid monolayer are formed on stainless steels. The compact coverage of the metal
surface was confirmed by contact angle measurement and atomic force microscopy (49). In the
case of a shorter carbon chain, especially under strong basic condition, the stability decreases
(50, 51). Long chain alkane phosphonic acids adsorb onto metal surfaces (9, 28, 37, 52, 53) and
form dense layer. When copper corrosion was in the focus, the use of alkyl phosphonic acids
turned to be effective. The phosphonic groups interact with the copper oxide layer via

13
condensation reaction between the phosphonic head groups and the surface-bound copper-
hydroxyl species, copper-phosphonate and different by-products are formed. These nanolayers
are useful in micro- and nano-electromechanical systems (54).
The barrier property of octadecyl phosphonic acid nanofilms on oxyhydroxide-covered
aluminum surface is a result of a strong acid-base interaction of the phosphonate head group with
the aluminum ions in the oxy-hydoxide film. The phosphonic amphiphile in SAM layer on
aluminum strongly reduces the amount of adsorbed water (55). Alyphatic groups or fluorinated
groups in phosphonic amphiphiles increase the hydrophobicity of the coated metal surface, and
act as a barrier to the aqueous environment at the same time improve the anticorrosion
activity (56).
Alkyl-, benzyl- and fluorinated alkyl phosphonic acids were studied at critical interfaces between
transparent conductive oxides and organic active layers in photovoltaic devices (57). In some
cases the efficiency of amphiphiles with the same chain length (C16) with and without fluorine
substitution were compared and the influence of the higher hydrophobicity of fluorinated alkyl
chain was demonstrated (58).
The application of molecular nanolayer coatings in the electronic industry up to now is not wide-
spread (59). However, this could be an important application possibility because several metals
are involved in these systems and the phosphonic acid nanolayers can control the corrosion
processes of these components.
2.3. Self-Assembled Monolayers (SAM) 2.3.1 Self-Assembled Monolayers theory In the previous part I gave examples on the nanolayer application against corrosion. Now I give a
detailed description on the technique, which results in molecular films, i.e. on the self-
assembling molecular layer preparation, characterization. The study of this layer formation
technique started in the 1940s (60) and in the last 20 years organic self-assembled monolayers
have attracted a significant interest among researchers in order to prepare a surface with tailored
properties.
14
The self-assembly is a nanofabrication method that has a number of advantages: the self-
assembly is inherently a parallel process; it creates a structure with sub-nanometer precision; this
process at molecular level can generate three-dimensional structure; external forces and
geometrical constraints can alter the self-assembling. The self-assembling film is a monolayer of
the organic amphiphile that forms spontaneously an ordered structure by adsorption and
organization on a solid surface.
The self- assembly is a key tool in supramolecular chemistry. As a system, it lies at the interface
between molecular biology, chemistry, polymer science, materials sciences and engineering. The
formation of the nanolayer is the consequence of multiple weak intermolecular forces that leads
to formation of large, discrete, ordered structures from relatively simple units; it resembles on
self-assembled natural phenomena (amphiphiles with bioactive moieties, self-assemblies of
peptides etc.). There is a great potential for their use as smart materials and surfaces of non-
fouling properties, of corrosion resistance, and of molecular electronics. They are important in a
variety of fields (chemistry, physics, biology, materials science, nanoscience). The application
of SAMs is very divergent: increase in the non-wetting surfaces properties combined together
with higher lubrication and enhanced corrosion inhibition, higher biocompatibility,
applicability in lithography, etc.
Self-assembled monolayer is a powerful, simple and highly flexible means for functionalizing
solid surfaces. The self-assembly is a spontaneous process when an ordered pattern develops
from a disordered state. In other words, during this process an assembly of molecules and
organized structures are formed via intermolecular forces that include weak non-covalent
interaction (hydrogen bonding, π- π stacking, electrostatic interaction, ion-dipole interaction
etc.). Through the self-assembly a new class of materials at molecular level are formed. Mainly
two kinds of self-assemblies are discussed. Static self-assembly is when, via ordered structure
formation, the system reaches an energy minimum (and do not dissipate energy: nanorods,
nanoparticles, structured block polymers etc.). In dynamic self-assembly the system dissipates
energy via formation of patterned components (biological oscillation, electronic circuits).
Another categorization of the molecular assembly is the electrostatic self-assembly (alternate
adsorption of anionic and cationic electrolytes onto the proper structure, e.g. layer-by-layer

15
assembly) and the self-assembled monolayers when the basic building blocks evolve via
weaker or stronger forces (adsorption, van der Waals bond, hydrogen and coordinate bonds,
hydrophobic interaction etc.) and create a spontaneously formed, well-defined structure.
There are several factors that influence the self-assembled molecular layer formation like
roughness and charge of a surface, polarizability, as well as the molecular structure of the
amphiphiles (dipole character, ionizable groups, and hydrophobic molecular part).
The self-assembly requires mobile molecules, the layer formation happens in fluid phase when a
nanolayer is formed at the solid/liquid interface in a simple and inexpensive adsorption method.
The formation of a nanofilm with well-ordered structure is spontaneous and happens upon
immersion of a solid substrate into a dilute solution of amphiphilic molecules, which have ionic
(or ionizable) head group and bulky hydrophobic part. The functional head groups of the
amphiphiles interact with the solid surface by chemisorptions or physisorptions when the
molecules are anchored to the solid substrate (16, 33); this is determined by the binding force
intensity between the functional group and the solid surface. The chemisorption represents high
adsorption energy and strong metal-amphiphile interaction. The layer is organized through van
der Waals interactions among the hydrophobic molecular parts, mainly between the long
aliphatic chains (33). Minimum 11 – 12 carbons in the backbone are required for formation of a
closely packed monolayer. It is accepted that there is a subtle balance between substrate-head
group interactions and chain length-dependent intermolecular interactions that determines the
growth kinetics of a film.
The preparation of thin films by self-assembling method permits atomic/molecular level control
over the structure and composition of the exposed interface. The coated metal surface properties
are defined by the head and tail groups in the molecules involved in the SAM.
Self-assembled monolayer (SAM) preparation is a flexible and simple method to form thin and
well-defined organic coatings. It is a considerably new potential alternative for the pre-treatment
of metal surfaces by ultrathin organic films such as hydroxamic and phosphonic acids (1, 61, 62).
It is applied on a variety of solid surfaces where the deposition process is spontaneous upon the
immersion of a solid substrate into a dilute solution containing organic adsorbate molecules. A

16
relatively strong bond between atoms or moieties in the molecule and the substrate and
additionally lateral interaction of molecules in the monolayer is required for SAM formation
(63). The functional group is accountable for the strong metal-molecule interaction, which is
commonly a chemisorption interaction. The hydrophobic tail groups form the outer surface of
the film and changes the physical and chemical surface properties (40). The long hydrophobic
chains interact with each other via different forces (e.g. hydrogen interaction, van der Waals
interaction). The results of the formation of a highly ordered molecular assembly are summarized
in some papers (40, 64, 65).
Apart from the SAM layer formation, there are a number of other methods like Langmuir-
Blodgett (LB) techniques. The Langmuir-Blodgett film preparation starts with formation of a
compact Langmuir monomolecular layer of well-ordered structure built from amphiphiles at the
air-water interface. The head group of the organic compound faces the water while the tail
groups, the hydrophobic parts, hang away from the water (66, 67).
The Langmuir films transformation onto a solid substrate results in the Langmuir-Blodgett (LB)
films (68). By repeating the dipping process of the substrate into the solution containing the
organic molecules, multilayers could be produced on the surface. The effectiveness of the LB
layers deposited onto copper and iron surfaces was published in several papers (9, 69).
The SAM technique used in a wide range of functional groups (40) has advantages over the LB
preparation such as it is a simpler and flexible method, also there are no specific experimental
equipment requirements for the formation of SAM thin films, and there is a strong attachment
between the substrate and the formed layers through electrostatic and/or chemisorptions
interactions. The preparation of thin films by self-assembling method permits atomic level
control over the structure and composition of the exposed interface. The metal surface properties
are defined jointly by the head and tail groups in the molecules involved into the SAM (70).
17
2.3.2 Self-Assembled Monolayers applications
Large numbers of molecules were already used in nanolayers like alkyl amines and carboxylic as
well as phosphonic and hydroxamic acids, though in the very first set of experiments thiol
amphiphiles with various carbon chains formed nanolayers on copper, silver, and gold. The
assortment of molecules is determined by the metal and the functional group in the amphiphile.
The use of organic coating is by far one of the main methods used in corrosion protection. They
form barriers between the metal surface and the media. In modern areas of materials research
such as microelectronic devices or micromechanics, the SAM films with thicknesses less than
10nm have become of a great interest.
The iron alloys like stainless steels have been extensively used in different industries (chemical
plants, medical fields like in the manufacturing of vascular stents or orthopedic implants) due to
its resistance against oxidation and corrosion, relative ease of fabrication, and good mechanical
properties. Self-assembled monolayers of long-chain carboxylic acids with different terminal
groups were formed on stainless steel 316L substrates using the solution-deposition technique.
SAM layers of alkanoic acids e.g. on stainless steel 316L were formed in a one-step solution-
deposition method forming a bidentate bond with the substrate (71). Amphiphilic phosphonic
acid SAM layers on stainless steels resulted in high contact angle (108o) which is much higher
than measured on the unmodified stainless steel. This proves the presence of an ordered
film (72).
The SAM formation provides a simple strategy to preparation of ultrathin and
thermodynamically stable organic films; for functionalization of a metal surface by phosphonic
acids is an easy technique (73). The self-assembling of alkyl phosphonic acids monolayers on
metals such as on steel, stainless steel, and aluminum, is an easy route to modify a metal surface
(74, 75). The structure of the barrier layer formed under this condition increases the anticorrosion
intensity as the metal dissolution is significantly depressed by the formation of a stable, densely
packed hydrophobic film, which hinders the contact between the metal/metal oxide surface and
the aggressive environment.

18
Some other literature examples are also presented when corrosion inhibiting nanolayers were
applied in corrosive environments. When a phosphonic acid SAM monolayer is formed on
stainless steel 316L, the amphiphilic molecule is covalently bound to the surface as a bidentate
complex, which was determined by diffuse reflectance Fourier transform infrared spectroscopy
and X-ray photoelectron spectroscopy. The compact coverage of the metal surface was
confirmed by contact angle measurement and atomic force microscopy (49).
All alkyl phosphonic acids molecules with longer chain (C > 10) form ordered monolayers with
hydrophobic properties (47, 69, 76, 77), with excellent stability, even until 30 days in acid,
neutral and physiological solution and for up to 7 days under dry heating. The stability of a layer
with a shorter alkyl chain decreases, especially under strong basic condition (46,40).
Fluorinated alkyl phosphonic acids were studied in photovoltaic devices (57). The importance of
the fluorine in the alkyl chain was demonstrated by their increased effectiveness compared with
the alkyl amphiphiles with the same chain length (56).
In the medical field one of the applications of these amphiphile molecular layers is the coverage
of Co-Cr alloys with drug-eluting stents against inflammatory reactions. Other territory of
surface modification with alkyl phosphonic acid SAM layers is the implant biomaterials (e.g.
titanium alloys, stainless steel, alumina, calcium phosphates) (78).
Summarizing the information appeared in the literature, I can emphasize that phosphonic acid
nanolayers were intensively studied on different metal surfaces (8, 9, 17-23). It is clear that the
increased hydrophobic molecular character enhances the compactness of a SAM layer;
disturbance in the compactness (e.g. substituent in α-position to the phosphonic group) decreases
the efficacy of the nanolayer. A densely packed film structure results in a significantly improved
anticorrosion efficiency, the stable hydrophobic film decreases the metal dissolution. Different
conditions like temperature, type of solvent for dissolution of amphiphiles, concentration of
functional molecules, adsorption time and metal surface smoothness/roughness all play
important role in the adsorption of amphiphilic molecules on a metal surface. In the adhesion of
phosphonic acid the presence of oxide layer on a metal surface is indispensable (unlike in case of
alkyl thiols that can adsorb only on pure metal surface, without any oxide layer). Several factors

19
explain the success of phosphonic acid amphiphiles such as: they bind strongly to a relatively
wide range of metals and inorganic surfaces; the densely packed ordered phosphonic acid SAM
layers are stable under ambient conditions that facilitate their application and storage.

20
Chapter Three
3. Employed Experimental Techniques
The nanolayers have special morphology, electric properties, and spectroscopic character. For
the characterization of a SAM layer, a number of methods are applied. The change in the
wettability is represented by contact angle values. For visualization of the surface morphology
the atomic force microscope and the scanning tunneling microscope are proper instruments;
different spectroscopic techniques help in the determination of the coating compositions like
surface enhanced Raman spectroscopy, Fourier transform infra-red spectroscopy, and X-ray
photoelectron spectroscopy that demonstrates the bonding between coating and metal as well as
characterize the bonding states of the metal surface.
In my work I used the contact angle values for characterization of the nanolayer-modified metal
surfaces to demonstrate the change in the metal surface wettability caused by the amphiphilic
nanolayer. The morphological change in 3D, the section analysis and the roughening of metal
surface with and without SAM layers, before and after immersion into aqueous solution (in the
presence of oxygen as well as chloride ions) were demonstrated by atomic force microscopy. To
measure the anticorrosion efficiency of the SAM layers, I used electrochemical methods. They
are sensitive to the electron transport through the nanolayer and gives information about the
compactness of the molecular film that is responsible for the corrosion protection by the SAM
layers and in other set of electrochemical measurements (polarization) reactions were
demonstrated (anodic, cathodic or both) that are influenced by the nanolayers. In the next part,
the techniques used in my research work will be introduced.
3.1. Contact angle
In surface science the understanding of the wetting phenomena is a critical subject (79) since the
surface wettability plays a great role in several processes including lubrication, printing, and
coating (important in corrosion). Studies of the wettability include the contact angle values as

21
basic data. Its definition is the angle formed at the interface of the solid-liquid and the vapor-
liquid (80). These values indicate the hydrophobic and hydrophilic properties of a solid surface.
The hydrophilicity or hydrophobicity of the surface is determined by the surface molecular
groups, which would indicate the properties of the layer formed on the solid surface. The contact
angle values predict the degree of surface protection. If the contact angle (ɵ) value in water
is < 90o, then the surface is hydrophilic, while at values of ɵ > 90o the wettability in water
becomes very low and the surface is hydrophobic (Figure 3.1) (81).
Figure 3.1: Wettability of a solid surface The force of wetting (f) is given as following: (80)
ƒ= lυ p cos ɵ (3.1)
where: f = wetting force; lυ = liquid surface tension; p = perimeter of contact line (i.e., the
same as the perimeter of solid sample’s cross- section); ɵ = contact angle.
There are several techniques for measuring contact angles: telescope-goniometer, captive bubble,
tilting plate and Wilhelmy balance method (80). The measurements could be static and dynamic.

22
3.1.1. Static contact angle
A surface wettability is best described by the angle between the tangent of the liquid/solid
interface at the three phase contact line and the baseline of the sessile droplet of a defined liquid
on the solid surface, which is known as the macroscopic contact angle.
The setup of the telescope-goniometer has measured the contact angle of various types of liquids
on a polished surface and afterwards appeared the contact angle goniometer. The measurements
are achieved by measuring the sessile drop’s tangent angle at the point of contact with the
surface and reading the protractor along the eyepiece. Modification of the equipment was made
over the years to improve the precision and accuracy. High magnification is used in order to
enable a detailed testing of the intersection profile. A camera takes the drop profile’ photograph
as the drop relaxes. Motor-driven syringe can be used in controlling the rate of liquid addition
and removal in order to study the receding and advancing static contact angles (Figure 3.2) (80).
Figure 3.2: Contact angle of a liquid drop on a solid surface.
The resulting angle is due to the interfacial energies at the liquid/vapor LV, solid/liquid SL and
solid/vapor SV. These boundaries are expressed by the Young’s equation for an ideal surface as:
lv
slsv
cos (3.2)

23
In case of a real surface, several factors like roughness and chemical heterogeneity are not taken
into account by the Young’s expression (79).
Figure 3.3: Schematic presentation of static contact angle.
The advantages of this method is its simplicity and that it uses few microliters of liquid and a few
square millimeters of the substrate’s surface; although the risk not to realize the impurities is
higher because of the small size of the investigated substrate surface (80). Also a value less than
20o is not measurable precisely because it is hard to assign the tangent line. Figure 3.3
demonstrates schematically of the instrument.
3..1.2. Dynamic contact angle values measured by Wilhelmy balance
The surface tension of a liquid by a Wilhelmy plate apparatus is represented by the force of the
liquid pulling down on a plate and measures the contact angle between the plate and the liquid.
When a vertically suspended plate touches a liquid surface, then a force (F) acts on this plate,
that correlates with the surface tension and with the contact angle ( ) according to the following
equation: σ = F/L . cos , where σ is the liquid surface tension, L is the perimeter of the probe.
Two different angles can be seen: as the plate enters the liquid, there will be an advancing angle,
and as the plate exits, this is represented by a receding angle.

24
This technique is widely used on solid samples, which measures the contact angle indirectly.
This method is based on the surface tension measurements whereas the flat plate is immersed in
a liquid having a horizontal upper surface; the total force needed in keeping the plate fixed is
related to the weight of the plate resistance forces and the surface tension σ. The advancing
contact angle is measured because of the liquid advances on the immersed plate into the liquid.
As a result of the withdrawing of the plate from the liquid, the liquid would recede so the
receding dynamic contact angle is measured (Figure 3.4). The force change detected on the
balance is the buoyancy and the wetting force where the force of gravity remains the same
(80,81).The high difference in the advancing and receding contact angle values is either due to
the inhomogeneous or the roughness of the surface.
Figure 3.4: Schematic representation of the dynamic contact angle measurement.
3.2 Atomic force microscopy (AFM)
The history of the scanning probe microscopy (where to the AFM belongs) started in the eighties
of the last century. First the scanning tunneling microscope (STM) was developed (the inventors
deserved the Nobel Prize for it) where the tunneling current is measured along the scanning. As
the STM could visualize only the conducting materials, the researcher worked further and they
invented the AFM which can visualize all surfaces irrespectively they are conductive or not. In
the case of AFM (which is the most popular type of the scanning probe microscopy) the force

25
between a very sharp tip and the solid surface under investigation is recorded. This
revolutionized the nanoscale characterization. The important parts of the AFM are as follows: a
spring (cantilever) equipped with a tip, a piezo tube which can move the sample in the nanometer
(nm) and some hundred micrometer range, a laser beam that illuminates the cantilever from
where the laser light will be reflected (through a mirror) into a position sensitive photodetector.
The heart of the AFM is the cantilever-tip assembly that interacts with the sample in a raster
scanning mode. The AFM can characterize a wide variety of material properties achieving
resolution down to the nanometer scale and beyond. The AFM can operation on air, in vacuum,
under liquid, that is why it is applicable in a wide range of sciences (materials science,
chemistry, physics, and biology) (82). The AFM can operate in non-contact mode (attractive
force range), in contact mode (repulsive force range) and in tapping mode when the tip
constantly changes its position between the two modes. This technique allows the surface
visualization in 2D and 3D, as well as the section analysis gives numerical information about the
surface irregularity and by the roughness parameters the solid surface could also be
characterized. The operating principle of atomic force microscopy is illustrated in Figure 3.5.
Figure 3.5: Schematic representation of the AFM set-up (83)

26
3.3 Infrared (IR) spectroscopy
IR spectroscopy is one of the common spectroscopic techniques used by organic and inorganic
chemists. By interaction of a molecule with the IR photons the molecular vibrations and rotations
of the molecule are excited. A vibration (or rotation) is IR active only, when a change in the
dipole moment of the molecule (or bond) occurs as a result of the molecular vibration (rotation)
excitation. For example, symmetric molecules (or bonds) have no IR spectrum. Common bands
of molecular bond and functional groups absorb at characteristic frequencies, called group
frequencies, which enables identification and /or structural analysis of samples by means of IR
spectroscopy.
3.3.1 FT-IR Spectrometer
The development of the IR spectrometers where the data is collected converted to a spectrum
from an interface pattern is known as the Fourier Transform Infrared Spectroscopy (FTIR) term.
3.3.1.1 The Michelson Interferometer
The Michelson Interferometer Experimental Setup is the base of the FTIR spectrometers
where the interferometer consists of a fixed mirror, a moving mirror (back and forth), a beam
splitter of a special material. The radiation from the source strikes the beam splitter where it
is separated into two beams, one of is transmitted to the fixed mirror and other is reflected to
the moving mirror. Afterwards, the radiation is reflected back to the beam splitter by the
fixed and the moving mirrors. Half of the reflected radiation is transmitted and the other half
is reflected to the beam splitter which would result in a one beam that passes to the detector
the other goes back to the source (84).
3.3.2.1 Microscopy and imaging
The IR microscope permits the observation and spectra measurements of regions as small as just
5 microns across. Images are generated by the combination of a microscope with a 2D array

27
detector with a resolution of 5 microns and thousands of pixels. The resulting images indicate
spectrum for each of the pixel and is viewed as maps at any wavelength. This would specify the
different chemical species of the sample (84).
The Michelson Interferometer Experimental Setup is the base of the FTIR where the
interferometer consists of a fixed mirror, a moving mirror (back and forth), a beam splitter of
a special material. The radiation from the source strikes the beam splitter where it is
separated into two beams, one of is transmitted to the fixed mirror and other is reflected to
the moving mirror. Afterwards, the radiation is reflected back to the beam splitter by the
fixed and the moving mirrors. Half of the reflected radiation is transmitted and the other half
is reflected to the beam splitter which would result in a one beam that passes to the detector
the other goes back to the source (84) as shown in Figure 3.6.
Figure 3.6: Schematic of Michelson Interferometer (85).
3.4 Electrochemical Methods
Corrosion phenomena in aqueous environments being of an electrochemical nature and
controlled by the corrosion potential of the metal, which makes the electrochemical methods
28
have an important impact on corrosion testing and research (86). As the corrosion is an
electrochemical process, it is logical to use electrochemical techniques to evaluate the properties
of nanocoatings.
The polarization is defined according to the ASTM as “the change of the open-circuit electrode
potential as a result of the passage of current”. The change of the potential of the working
electrode and detecting the produced current, which is a function of time, is the work of the
polarization methods. During the last 75 years, the researchers had applied electrochemical
techniques to the corrosion processes. In the1λγ0’s C. Wagner and W. Traud were the first
developers publishers of the mixed-potential theory, that helped in the explanation of
experimental results (86). The determination of the corrosion rate at which a metal dissolves
under certain conditions and environment is of a great importance in the field and laboratory
corrosion studies; several other techniques have been developed throughout the years in
determining the corrosion, such as linear polarization resistance (LPR), potentiodynamic
polarization, weight loss measurements, electrochemical impedance spectroscopy (EIS), Tafel
extrapolation method, and electrochemical noise nalysis, which is a more recent technique (86,
87). These methods are based on the detection of corrosion by the observation of the charge-
transfer process response to a controlled electrochemical disturbance.
3.4.1 DC Methods
Techniques such as the LPR, potentiodynamic polarization are so-called direct current (DC)
methods where the current is measured by applying a DC potential excitation.
3.4.1.1. Potentiodynamic technique
Potentiodynamic polarization is an electrochemical technique that presents a significant amount
of information such as corrosion kinetics, corrosion rate of the working electrode, pitting, and
passivity. It also determines the type of the electrochemical reaction, whether it is a cathodic
(reduction) or an anodic (oxidation) reaction.

29
The electrode is submitted to a potential, and the outcome current is measured. The plotting of
the potential (V) vs. the current density (A/cm2) results in the Tafel plots. The current density
values are plotted in logarithmic scale.
The corrosion kinetic parameters such as corrosion potential (Ecorr) and the current density (icorr)
are determined by intersecting both straight lines in the linear regions on the anodic and the
cathodic curves. The slopes of the linear regions are represented by Tafel constantsμ a for the
anodic and c for the cathodic reactions. All information is shown in Figure.3.7.
Figure γ.7μ Tafel extrapolation showing the anodic ( a) and cathodic ( c) Tafel constants.
The corrosion current (icorr) can be determined as:
Rpca
caicorr )(303.2
.
(3.3)
where:
βa = anodic Tafel constant expressed in Volts per decade current
βc = cathodic Tafel constant expressed in Volts per decade of current
icorr = corrosion current density expressed in current unites per unit area

30
At the measurement setup, the scan rate has to be carefully chosen in order to obtain full
information taking place on the electrode surface; thus relatively slow potential of e.g.
0.1mV/sec is preferable where at high potential less information can be obtained on the rate
establishing step of the working electrode process and information on the fast reaction step.
This technique is widely used in corrosion studies as it can evaluate the efficiency of corrosion
inhibition (9). It has also been used for the evaluation of self-assembled monolayers (SAM)
formed e.g. by hydroxamic acids on carbon steel (9). In my study on carbon steel surfaces the
polarization method had been used to measure the effect of layer formation time and the pH
effect of the electrolyte.
3.4.2 AC method
In this method, an AC potential excitation is used instead of the DC potential excitation. 3.4.2.1 Electrochemical impedance spectroscopy (EIS)
The use of electrochemical impedance spectroscopy in evaluation of electrochemical and
corrosion mechanism is due to its ability of probing electrochemical systems even at very low
frequencies. This technique was developed after the elaboration of the potentiostat in the 1940s
followed by the frequency response analyzer in the 1970s (13). The EIS has become a powerful
tool in the study of metal electrode/electrolyte interface, coatings, porous electrodes, electrode
/layer/ electrolyte interface (55). Additionally, electrochemical reaction mechanisms, kinetic,
passive surfaces, materials of dielectric and transport properties of an electrode, protection
properties of corrosion inhibitors, e.g: corrosion inhibition via phosphonic acids formed by
absorption on metal surfaces (7, 88), metal coatings and thin film had been studied (89). It is a
non-destructive method (advantages over the DC methods) since it uses very small excitation
potential amplitudes, and has a minimal perturbation to the working system.
EIS as an electrochemical measuring method quantifies the protective behavior of coatings. EIS
results can indicate the state of coating degradation, the efficacy of corrosion protection and can
even identify protective mechanisms. EIS measurements on organic coatings apply alternating

31
voltage over a counter electrode and the coated metal substrate, and the response of the system is
registered. Impedance (Z) is a measure of a circuit’s tendency to resist (impede) the flow of an
alternating electrical current and is the AC equivalent of electrical resistance (R) in DC
applications.
A sine wave voltage applied to an electrochemical cell gives a current response, which is shifted
in time due to the influence of the system. This time shift is expressed as the phase angle.Since
the impedance is frequency dependent, the measurements go over a wide range of frequencies.
By measuring the high frequency impedance (105- 103 Hz) and using equivalent circuit modeling
the time of measurement can be kept to a minimum.
Data achieved by impedance spectroscopy are fitted to an equivalent circuit when enough
parameters (elements in the equivalent circuit) are used. It is preferred to fit the data to the most
probable equivalent circuits. The fitting parameters are as follows: electrolyte resistance (Rs: the
solution resistance between the working electrode and the reference electrode ), constant phase
elements (CPE: used instead of a capacitor to represent the non-homogeneity such as the
roughness or the energetic inhomogeneity of the system), coating resistance (Rc: electrochemical
(corrosion) behavior of the system), metal double layer capacitance (Cdl: capacitance between
the working electrode and the electrolyte; controlled by many variables such as temperature,
electrode potential, types of ions, impurity adsorption, ionic concentrations, oxide layers,
electrode roughness, etc), charge transfer resistance (Rct). Two parameters can characterize the
CPE. The diffusion on the metal surface is represented by the Warburg element (W) that would
appear at low frequency of the Nyquist plot (90, 91).
The EIS data can be displayed by two common methods, which are Nyquist and Bode plots.
Nyquist plots are usually used for mechanistic analysis due to mechanistic implications (e.g.
planar diffusion vs. pore diffusion) of number of relaxations (88). In the Nyquist plots the real
part (Z’) is plotted on the x axis while the imaginary part (Z”) on the y axis. The low frequencies
resemble to slower processes arising on the metal interface while the higher frequencies
resemble reactions that are kinetically controlled as well as to the charge transfer processes that
is usually related to the coating interface.

32
By the application of sinusoidal AC potential centered at the open circuit potential (EOCP) of the
sample that causes it to cycle between the anodic and cathodic polarization as a result of a small
AC current. Amplitude signal ≤ 10mV is applied (81) to the sample with the use of a
potentiostat; the resulting current is analyzed to extract the phase and the amplitude relationship
between the current and the voltage signals. Usually the impedance is measured as a function of
frequency at a number of decades from 100 kHz to 1 mHz as an example (92). The low
frequency choice is usually compromise between the resolution and the acquisition time, a
common compromise between the time needed for data collection and accuracy is the choice of
5- 10 points per decade and a low frequency limit of 10- 1mHz. In Bode plots, the frequency is
an independent variable where an accurate compression can be applied between the experimental
and the calculated impedance spectra. In Bode graphs with the same data the logarithm of the
modulus of the impedance where log |Z| vs. log ω is the Bode module plot and the phase angle
(ϴ) vs. log ω is the Bode phase plot (8θ) (Figure γ.8).
Figure 3.8: EIS data interpretations.

33
3.5 Adsorption on metal surface
Adsorption is known to be the adhesion of ions, atoms, molecules of dissolved solids, liquid or
gas that are called adsorbate to create a film on a surface, which is the adsorbent (93). This
happens when a self-assembled monolayer of molecules is formed on a solid surface (94). The
adsorption process on a metal surface is usually visualized by plots that show the concentration
dependent change of the surface coverage on a solid surface. These graphs known as adsorption
isotherms have several types of isotherms such as Freundlich, Langmuir and the Stephen
Brunauer, Paul Emmet and Edward Teller which is called the BET isotherm. There are several
factors that can affect the process of adsorption such as (93):
Surface area.
Condition of experiments, eg, pressure temperature, pH, etc.
Nature of adsorbent and adsorbate.
Activation of adsorbent.
3.5.1 Types of adsorption:
There are two types of adsorption depending on the nature of the forces between the adsorbent
and the adsorbate molecules. In the case of the physical adsorption (physisorption) the attraction
forces are weak (like van der Waal’s and hydrogen forces). At these week forces the adsorption
can be reversed according to the circumstances (pressure, concentration, and change in heating).
The second type of the adsorption is the chemical adsorption (chemisorption) where the forces
between the adsorbate and the adsorbent almost equal to the strength of the chemical bonds thus
resulting in a very strong attraction; therefore the process cannot be reversed.
3.5.2 Adsorption Isotherms
The relationship between the equilibrium concentration of a substrate that is in contact with an
adsorbent and the adsorbed adsorbate on a surface at a constant temperature is known as the
adsorption isotherm (95).

34
vi. Langmuir adsorption isotherm
This type of adsorption describes quantitatively the formation of a monolayer on the solid
surface and after that no further adsorption takes place. The Langmuir adsorption represents the
equilibrium between the solid and liquid phase, which contains a finite number of identical sites.
This type of adsorption isotherm that can predict chemisorption as well as physisorption of a
monolayer were driven by Langmuir in 1916. The Langmuir derive was a relation between
adsorbed material and its equilibrium concentration as Figure 3.9 (b) shows. Some main
assumptions were proposed by Langmuir such as (93):
There are many identical active sites on the surface known as adsorbing.
Only one molecule can be adsorbed by each active site.
No multilayer can be adsorbed on the surface but a monolayer.
Constant heat of adsorption is on all sites of the surface.
Interaction of the adsorbed molecules does not take place on the surface.
The surface of the active sites is seamlessly as a flat plane containing no corrugations.
vii. BET adsorption isotherm
In this type of isotherm the adsorption on a single site does not affect the other sites the same as
in the Langmuir theory. Adsorbed molecules can form multiple layers as well as the assumption
is that the surface possess is uniform as shown in Figure 3.9(c).
viii. Freundlich adsorption isotherm
This type of adsorption describes the characteristics for a heterogeneous surface.
There is an empirical relation between the quantities of the adsorbed adsorbate and the adsorbate
concentration at equilibrium (Figure 3.9(d)) (93).

35
Figure 3.9: Different types of the isotherms; (a): linear (when the surface coverage linearly depends on the adsorbate concentration); (b) Langmuir type; (c) BET
type; (d) Freundlich type (96).
There are some other types of adsorptions such as:
ix. Temkin isotherm
This isotherm contains a factor that explicitly takes into account the interaction between the
adrobate and the adsorbed molecules. This model assumes that the heat of adsorption of all
molecules in the lazer would decrease linearly rather that logarithmic with the coverage.
x. Dubinin-Radushkevich model
The Dubinin-Radushkevich isotherm is generally applied to express the adsorption
mechanismswith a Gaussian energy distribution onto a heterogeneous surface.

36
Chapter Four
4. Experimental Work 4.1 Materials and methods
4.1.1 Chemicals used for SAM layer formation
Fluorophosphonic acid: C6F13–C2H4–PO(OH)2 is a fluoroalkyl chemical with phosphonic acid functional group, Specific Polymers, Castries, France: SP-01-003; MW: 428.08; solubility: ethanol, methanol; pKa :first acidity: 2.08, second acidity: 7.63
1H NMR (Methanol) 31P NMR (Methanol)
19F NMR (Methanol)
Undecenyl phosphonic acid: CH2=CH-[CH2]9-PO(OH)2, Product of: Specific Polymers, Castries, France: SP-61-003, MW:234.27; solubility in: acetone, ethanol, THF; pKa: first acidity 2.42, second acidity: 8.08

37
1H NMR ( Methanol) 31P NMR (Methanol)
Styren-co-styphos acid
x=0.5; y=0.5; MW: 12250; solubility: DMSO
1H NMR (DMSO) 31P NMR (DMSO)
Dodecyl and hexadecyl phosphonic acid: prepared and purified in the laboratory.
Sodium perchlorate (NaClO4)H2O; M=140.46g/mol. Merck, D-6100 Darmstadt, F.R.
Germany
Sodium chloride (NaCl) M: 58.441g/mol, Reanal, Budapest, Hungary

38
Sodium hydroxide (NaOH) Reanal, Budapest, Hungary.
Sulfuric acid (H2SO4) 96%, Farmitalia Carloerba S.P.A, Milan
Methanol, ethanol, chloroform acetone, Reanal, Budapest, Hungary
Water: in all experiments ultra-clear water (Milli-Q water) was used (conductivity:
18MΩ cm-1 (5.5x10⁻⁶S/m at 25 oC).
All chemicals were used without further purification.
4.1.2 Metals of study The chemical compositions of metals under investigation are the follows:
i. Carbon steel composition: C:2.29%; Fe:97.71%
ii. Stainless steel 316: C:0.08%; Mn:2.0%; Si:0.75%; P:0.045%; S::0.03%; Cr:18%; Mo: 3.00%; Ni: 14%; N: 0.1%
In the chromium-nickel stainless steel the molybdenum content increases the corrosion resistance, improves resistance to pitting in chloride ion solution.
iii. Stainless steel 304: C:0.08%; Mn:2.0%; Si:0.75%; P:0.045%; S::0.03%; Cr:20%; Ni: 10.5%; N: 0.1%.
The significant difference between the two stainless steels is that the 304 type does not contain molybdenum.
iv. Aluminum 5052: Mg: 0.8%, Al:99.8%
4.1.3 Metal sample preparation 4.1.3.1 Samples for contact angle measurements and for atomic force microscopy Iron alloy samples in dimension of 10x11x2 mm were grinded using silicon carbide emery paper
(grit sizes: 220, 400, 600, 800, 1200, 2200 and 4000). Afterwards, the samples were polished
with diamond pastes of different grain sizes (15-9-6-3µ), washed with distilled water, degreased
with acetone and dried at atmospheric conditions. In the case of aluminum to the last surface
finishing Al2O3 powder (grain size:3µ) was used.

39
4.1.3.2 Samples for electrochemical measurements The metal samples of 14 mm in diameter were connected to a copper wire by welding, embedded
into epoxy resin (Araldite AY 103 Resin and Hardener HY 956 Adhesive, Huntsman), then were
grinded with silicon carbide emery paper of different grits (200, 400, 600, 800, to 1200grit),
washed with distilled water, acetone and dried in air.
4.1.3.3 Additional oxide layer formation On aluminum alloy: after surface finishing by Al2O3 powder (grain sizeμ λ m), the coupons
were kept in boiling water for one hour, dried on air at room temperature and kept under normal
atmosphere before SAM layer preparation.
4.1.4 Self-assembled molecular layer preparation The solid phosphonic acid powders were dissolved in organic solvents (methanol, chloroform) in
the concentration range of 5x10⁻² and 5x10⁻³ M. Metal samples were immersed and left for pre-
defined times ranging from 30min, 2, 3, 4, 24, 48, 72h in the phosphonic acid solutions. After the
required contact time, the superfluous of the amphiphile solution was removed by letting to drop
the solution and the last small remedy from the metal surface was removed by dipping the solids
into the pure organic solvent. Finally the SAM-coated metal samples with self-assembled
molecular layers were left to dry in air.
4.1.4.1 Modification of undecenyl phosphonic SAM
I have investigated the influence of irradiation and illumination on the CH2=CH- groups in the
undecenyl phosphonic acid SAM layers.
i. Irradiation by 60Co gamma source
Irradiation of undecenyl phosphonic acid SAM layers deposited on carbon steel was performed
at room temperature in an SLL-01 type pilot scale facility equipped with 60Co gamma source

40
applying a dose rate of 11.5 kGy/h (equal to 11.5 kJ/kg,h) (Institute of Isotopes Co. Ltd.,
Budapest, Hungary). In one case 2kGy, in the other 20kGy was the absorbed dose.
ii. Illumination by UV light
The SAM layer built from undecenyl phosphonic acid, deposited onto carbon steel was
illuminated by UV light ( =βη4nm) for γ0 and θ0 min. In case of undecenyl phosphonic acid
SAM layer developed on aluminum alloy surface longer (3 h) illumination was also used.
4.2 Methods of SAM layer characterization 4.2.1 Surface characterization by contact angle values
4.2.1.1 Static contact angle
Values were determined by a β L sessile drop measurement on a home-built device equipped
with Hamilton micropipette and CCD camera. The contact angle was determined by geometrical
evaluation of the spherical drop (97).
4.2.1.2 Dynamic contact angle measurement
A digital surface tensiometer (NIMA Ltd, Model DST 9005, UK) as shown in Figure 4.1,
allowed the determination of dynamic contact angles based on the Wilhelmy theory. The metal
samples with and without nanolayers were automatically dipped into the pure water (advancing
contact angle) and pulled out from it (receding contact angle). The depth of immersion was 8
mm, the rate of the sample movement was 5 mm/min, and the apparent change in weight of the
sample was registered (98). This was automatically converted to the advancing and receding
contact angle values. In the static and dynamic contact angle measurements Milli Q water was
used.

41
Figure 4.1: Tensiometer (NIMA Ltd, Model DST 9005).
4.2.2 Atomic force microscopy The surface visualization was performed by atomic force microscope (Digital Instruments,
NanoScope III). The tip was Si3N4 (Veeco, Santa Barbara, CA, USA). The change in the
morphology of the metal surface with and without nanolayers was imaged in contact mode, on
air, before and after the corrosive attack. The section profile and the roughness of the surfaces
were numerically characterized. Figure 4.2 shows the device used for these measurements.
Figure 4.2: NanoScope III (Digital Instrument)
4.2.3 Fourier transform infrared (FTIR) spectroscopy Fourier transform infrared (FTIR) spectroscopy was used to identify structural changes of UPA
starting material caused by UV treatment or irradiation. IR spectra were collected by the means

42
of a Varian 2000 (Scimitar Series) FTIR spectrometer equipped with an MCT (Mercury-
Cadmium-Telluride) detector and fitted with a single reflection diamond ATR accessory (Specac
Ltd, UK). No sample preparation was needed before spectrum collection. For each spectrum 64
individual spectra were averaged with a spectral resolution of 4 cm-1.
4.2.4 Electrochemical techniques The experiments were carried out in a 0.1M NaClO4 electrolyte (saturated with air). The pH of
the solutions was controlled by diluted NaOH solution to reach the alkalinity level and by H2SO4
when the measurement goes at pH= 3.
4.2.4.1 Electrochemical cell
A three electrode cell (500ml) was used that consisted of a platinum sheet (surface area:
7.5cm2) as an auxiliary or a counter electrode (CCE), a saturated calomel electrode (SCE) as a
reference electrode (RE) and coated/non-coated metal surfaces as the working electrodes (WE)
with a surface area: 1.54cm2.
4.2.4.2 Open circuit potential (OCP) values vs time
The potential change as a function of time was monitored during a time-period of 20 minutes
using the Autolab PGSTAT 30 Autolab Instrument (Metrohm). Potentiostat / Galvanostat
PGP201 VoltaLab (Figure 4.3).
Figure 4.3: Potentiostat used in the experiments

43
4.2.4.3 Potentiodynamic polarization measurement The experiments were carried out in 0.1M NaClO4 electrolyte (saturated with air). For
controlling the pH values of the electrolytes, NaOH (pH=9 and pH=11) and H2SO4 (to pH=3)
solutions were used. The measurement started after the settling of the open circuit potential (Eocp,
20min.). The measurements were performed with a sweep rate of 0.166mV/s (Autolab PGSTAT
30 Autolab Instrument (Metrohm)).
The anticorrosion efficiency of the surface layers was calculated by the following equation:
= (1- j/jcorr) x100 (4.1)
where: = efficacy (%)
jcorr= current density measured on the uncoated surface (mA/cm2)
j= current density measured on the SAM-coated surface (mA/cm2)
The surface coverage (Θ) is calculated from the efficiency data (99):
100
(4.2)
4.2.4.4 Electrochemical Impedance Spectroscopy (EIS) The metal samples with and without SAM layer were placed in a teflon holder with an 1cm2
exposed metal surface. Impedance spectra were measured at the open circuit potential [Eocp ]
with 10 mHz signal amplitude in the frequency range of 10 kHz and 0.1 mHz with a 5 points per
decade. The experiments, which began after the settling of the Eocp of the working electrode,
were carried out using a Solartron 1286 electrochemical interface and 1250 frequency response
analyzer. The measurements were applied using the ZPlot software and the data fitting with the
ZView software.
Figure 4.4 illustrates the electrochemical cell and the equivalent circuit for both of the
electrochemical measurements applied in the study.

44
All measurements were carried out at atmospheric pressure and room temperature.
Figure 4.4: Schematic of electrochemical cell (a) and the equivalent electric
circuit of the working system (b).
45
Chapter Five
5. Results and discussion
Carbon steel, stainless steel types 304 and 316, and aluminum as bare metal samples were SAM-
layer coated with different amphiphiles such as fluorophosphonic acid, undecenyl phosphonic
acid, styrene-co-styphos acid, dodecyl- and hexadecyl phosphonic acids. Results and
characterizations of the influences of the metal types, type of amphiphilic molecules, layer
formation time, surface roughness, and irradiation/illumination on the SAM layer are illustrated
and discussed in this chapter.
5.1 SAM layer formation
The self-assembly of surfactant-type molecules/amphiphiles in solution has been widely
investigated both experimentally and theoretically, because of the numerous practical application
possibilities of molecular layers.
In a self-assembling system, individual components (molecules and solids) interact in a
predefined way and result in a spontaneous self-organization of the molecules into higher
ordered structure. It is easy to obtain different surface properties when the tail groups of the
amphiphilic molecules in the SAM layer are changed. For the SAM layer formation on metal
surfaces covered by native metallic oxide layer (which is more-or-less hydrated) by alkyl
phosphonic acids, an acid-base condensation mechanism in three steps is proposed (54). The first
step is a hydrogen bond formation between the polar head group of phosphonic acid and the
surface hydroxyl groups; this is followed by a reaction between the P-OH groups of phosphonic
acid containing two hydroxyl groups by the surface via acid-base condensation when
monodentate and bidentate bonds are formed. This reaction produces phosphonate salts and
water. The formation of tridentate bond (which enables the phosphonic acids to form self-
assembled monolayers on metal surfaces) is the consequence of hydrogen bond formation
between the phosphoryl oxygen and the surface hydroxyl groups (P=O…H-O) (100-103). The
hydrophobic tail of the phosphonic amphiphiles helps in formation of supramolecular SAM

46
structures (104, 105). The hydrogen bonding, the acid-base interaction as well as covalent
bonding between the -P(O)(OH)2 groups and the metal oxide layer can attribute to the formation
of a densely packed, and well organized organic SAM film on the metal surface (106).
It is essential to characterize the SAM-layer coated metal surfaces. The compactness of the SAM
layer can determine its anticorrosion efficiency. My work focused on those SAM layers that
were supposed to significantly decrease the corrosion. The SAM layers of phosphonic acids were
developed on the native metal oxide surface using a simple room-temperature solution deposition
method. As the head group faces the metal surface, the hydrophobic molecular part is
perpendicular to it. Later, when already a total surface is covered by the amphiphiles, generally
the molecules are not in perpendicular position, but tilted to the surface. A dense hydrophobic
layer can well control the access of water (with or without dissolved gases and ions) to the metal
surface, i.e. the possibility of corrosion. The measurement of the water wettability is by the
surface contact angle. I have prepared SAM layers that could significantly decrease the surface
wettability i.e. increase the hydrophobic character of the surface coating and, as a consequence,
the anticorrosion activity. The results of the changes in the parameters of the SAM formation
(amphiphile concentration, layer formation time, metals, surface roughness, pH values) are
demonstrated in the next part of the thesis by different characterization techniques of SAM-layer
coated metal surfaces.
5.2. SAM layer characterization 5.2.1 Characterization by contact angle measurements
One of the most obvious surface characteristics that can be affected by the environment is the
wetting properties. The wettabilaty of solid surfaces by liquid materials is an important aspect of
materials science and surface chemistry that plays an important role in the corrosion coatings. In
wetting studies, usually the contact angle is one of the most important data that show the wetting
values when a liquid and a solid are in contact. The wettability is summarized in the next
Table 5.1.

47
Table 5.1:Wettability in the mirror of the contact angles (79). strength of strength of
contact angle degree of wetting solid/liquid
interaction
liquid/liquid
interaction
(S) = 0 perfect wetting strong weak
(C) 0 < < λ0° high wettability strong strong
(B) λ0° ≤ < 180° low wettability weak strong
(A) = 180° perfect non-wetting weak strong
In my experiments, the liquid was water as the corrosion starts always in the presence of water.
The metal surfaces with or without SAM layers were analyzed and characterized by dynamic and
static contact angle values.
5.2.1.2 Surface characterization by dynamic contact angle values
The dynamic contact angle measurement allows measuring of two different angles: the
advancing contact angle (when the solid sample enters the water) and the receding contact angle
(when the solid sample exits the water). Almost in all cases, there are differences between the
two values. The magnitude of the difference indicates that the compactness of the layer is not
dens enough to produce a superhydrophobic nanofilm; in other words, the nanolayer does not
cover the solid surface perfectly. A water contact angle higher than 100° indicates the formation
of an ordered film, which is more hydrophobic than the control sample. According to the
literature (49) the phosphonic groups are bond to the metal surface, covered by oxide layer, in a
bi- and tridentate mode, determined by diffuse reflectance FTIR spectroscopy.
Lower average advancing contact angle represents SAM layers when the amphiphile has a
shorter carbon chain / smaller hydrophobic part or when in the amphiphilic carbon chain there
are substituent or double bonds. Not only the inhomogeneity of the molecular layer, but also the
surface roughness can influence the change in the advancing and receding contact angle values.

48
5.2.1.2.1 Wettability change caused by SAM layers on different metal surfaces
i. Influence of SAM layers on carbon steel surfaces
a. Effect of the amphiphiles and their concentration
In the first set of contact angle experiments the question to answer was how do the phosphonic
acid amphiphiles with different hydrophobic parts influence the surface wettability, i.e. under
identical condition, the layers formed on the metal surface (covered by native oxide layer) can
increase the surface hydrophobicity with the same rate or not. Dynamic contact angle values
measured on carbon steel covered by different phosphonic acid SAM layers, formed in 24 h are
shown in Figure 5.1. First the behavior of the fluorinated alkyl phosphonic acid SAM layer,
developed on carbon steel is discussed. Fluorophosphonic acid layer achieved the highest contact
angle values: 129° / 80° (advancing and receding angles, respectively). These values prove the
formation of a compact layer on the metal surface and the influence of the superhydrophobic
fluorine atoms; both factors result in reduced water wettability. Surfactants, like amphiphiles, are
used for lowering the surface energy, and the decrease in the surface energy results in formation
of superhydrophobic surfaces. Fluorine atoms in the alkyl chain have a great impact on reducing
the surface energy, the presence of CF3 and CF2 groups assign high hydrophobicity to the
fluorophosphonic acid SAM layer.
Figure 5.1: Influence of hydrophobic molecular part in SAM layers on the wettability of coated carbon steel (layer formation: 24 h; U.P:undecenyl phosphonic acid, Sty: styren-co-styphos acid;
F.P: fluorophosphonic acid).

49
The hydrophobicity of the SAM layers formed by the second amphiphilic molecules, the
undecenyl phosphonic acid, could not reach the level of the fluorophosphonic amphiphile. It is
also evident that the highest difference between the advancing and receding contact angles is in
the case of the undecenyl phosphonic acid SAM layer. The explanation is clear: in this case the
nanolayer is less compact than at the other two amphiphiles.
The third chemical is the styrene-co-styphos acid. As its structure suggests, the anchoring
phosphonic groups fix the molecules to the metal surface and, additionally, a horizontal
hydrophobic net is formed from the polymeric chain. This is reflected in the higher advancing as
well as in receding contact angle values.
The influence of the concentration of the amphiphile solutions is demonstrated in Figure 5.2. It is
evident that in the case of the fluorophosphonic acid already a less concentrated amphiphile
solution is enough to reach low water wettability, which is almost equivalent with that value
measured in case at its more concentrated solution (Figure 5.2).
Figure 5.2: Influence of concentration on the wettability of carbon steel with fluorophosphonic acid and undecenyl phosphonic acid SAM layers formed at 24 h
(5E-3=5x10⁻³ M; 5E-2=5x10⁻² M).
50
On the other hand, the lower concentration of the undecenyl phosphonic acid does not allow the
formation of a compact layer. It is reflected in the change in the receding contact angle values: at
lower concentration this is much lower than measured in the case of the SAM layer formed from
the more concentrated solution. Though the increase in the amphiphile concentration resulted in
a better surface coverage, i.e. SAM layer formed in more concentrated solution shows higher
receding contact angle value. The consequence is that SAM layers formed from more
concentrated solution (5x10⁻² M) resulted in better surface coverage (Figure 5.2).
b. Effect of the SAM layer formation time
In the case of the fluorophosphonic acid the layer formation time has less important impact on
the increase in the contact angle than in case of the undecenyl phosphonic acid; i.e. in a short
time the layer formed from the fluoro amphiphilic molecule shows a real well ordered structure,
compactness.
Evaluating the influence of the film formation time in case of undecenyl phosphonic acid SAM
layer, there was an increase in the advancing contact angle values: after 4 h the contact angle
was 83° that increased to 107° when more time (24 h) was left for the self-assembling process. It
shows that in a shorter time less amphiphilic molecules can absorb onto the carbon steel, and
domains of disordered molecules are present. With the increase in the layer formation time, more
phosphonic groups attach to the solid, thus less free space is for the hydrophobic molecular parts,
which results in an increased interaction among the hydrophobic chains. At the end of long SAM
formation time a more hydrophobic surface is formed on the carbon steel surface. Even in this
case, the high advancing contact angle (107o) was followed by low receding angle (15o). This is
the consequence of the double bond at the end of the alkenyl chain, which does not allow the
formation of a densely packed surface film. It is clear that the phosphonic head groups interact
with the metal surface through oxygen bridges anchoring the molecules to the solid surface. On
the other hand, the alkyl part of the alkenyl chain that is nearer to the solid, can keep together
this hydrophobic part of the chain through different forces (hydrogen bond, van der Waals force),
but the double bonds at the end of the carbon chain does not allow a firm association. As a result,
the water molecules can approach the metal surface easier.

51
Table 5.2 illustrates the influence of the immersion cycles during the dynamic contact angle
measurement. When a self-assembled molecular layer of undecenyl phosphonic acid covers the
carbon steel surface (formed in 24h), at the first dip high contact angle is observed (advancing:
107o). However, after the second, third and fourth dip this value decreases drastically
(advancing: 60o), which immediately indicates that the layer is not compact, the alkenyl chain
cannot form a densely packed surface layer (due to the double bond). The low receding contact
angle value (15o) shows the same. When the amphiphile is the fluorophosphonic acid (SAM
layer formed in 24h), the formation of a molecular layer with well-defined, compact structure is
mirrored in the contact angle values; the consequence is that the contact angle measured at the
fist dip (advancing: 129o) have only slight decrease after the second, third and fourth immersion
cycle (advancing: 125o). It proves unequivocally that the fluorophosphonic acid nanolayer has a
close-packed structure. The same is reflected in the high receding contact angle value: 80o. This
indicates that the monolayer is stable in neutral water. Generally, the magnitude of the contact
angle hysteresis is correlated with the monolayer packing densities. The high contact angle
values suggest that the hydrophobic barrier effect originates from the well-structured
hydrophobic molecular part.
Table 5.2: Contact angle values measured on carbon steel surfaces covered by SAM layers formed by different chemicals; influence of the layer formation time, concentrations and dipping
number.
Metal Chemical Time C. A (Adv, Rec) Remarks
carbon steel
Undeceyl phosphonic acid(5x10⁻³ M)
4 h 83, 45
24 h 107, 15 (1st dip)
60, 15(4 other dips)
Undeceyl phosphonic acid(5x10⁻³ M)
24 h 108, 52(1st dip)
105, 45(4 other dips)
Exposed to UV for 30min each side
Undeceyl phosphonic acid(5x10⁻² M)
24 h 110,45
Styrene co Styphos acid(5x10⁻² M)
24 h 115, 70
Fluorophosphonic acid(5x10⁻³ M)
24 h 129, 80(1st dip)
125, 80(4 other dips)

52
ii. Influence of SAM coatings on stainless steel surfaces
The stainless steels are important alloys, their resistance against corrosion determines their
usage. Under special conditions (e.g. in body fluid) the release of the iron, chromium, nickel and
any other alloying metals can generate allergic and carcinogenic effect. Therefore, the surface
properties of stainless steels determine their application conditions. This explains why it is
necessary to treat properly their surfaces that lead to enhanced applicability without losing the
physical and mechanical properties.
The SAM layers of the phosphonic acid amphiphiles used in my experiments were deposited
onto stainless steel surfaces by room-temperature solution deposition.
a. Stainless steel 304
Results achieved on SAM coated 304 stainless steel (Figure 5.3) show that the highest contact
angle value was achieved with the fluorophosphonic acid SAM layer formed at 24h (advancing
angle: 127o). The high contact angle value can be related to the dense oxide layer that covered
the stainless steel surface. It is interesting that there was almost no change in the contact angle
values when the concentration increased from 5x10⁻³ M to 5x10⁻² M. This shows that a well-
defined, densely packed SAM layer is formed already in the less concentrated amphiphile
solution. For comparison, alkyl phosphonic acids with shorter (dodecyl: C12) and longer
(hexadecyl: C16) carbon chains were investigated. In the case of these two chemicals, I also
could follow the influence of the layer formation time on the change in the surface
hydrophobicity. When the SAM layer was developed from dodecyl phosphonic acid solution, the
layer formation time affected the formation of a dense layer. The contact angle values increased
from 95o achieved at 15min to 118o measured at 24 h (Table 5.3), which indicates that longer
time was needed for the formation of a more condensed, compact layer in the case of the
amphiphile with shorter carbon chain. It is interesting that the longer alkyl chain does not create
a more hydrophobic surface: the layer wettabiliy is almost the same as measured on C12 layer.
Nevertheless, the influence of the longer carbon chain is reflected in the higher receding contact
angel (proving a more compact state of the nanolayer). In both cases (C12 and C16) increasing

53
the layer formation time as well as the concentration of the amphiphiles more hydrophobic
nanofilms were produced on the metal surface; I noticed similar effect in the case of the carbon
steel covered by the same SAM films.
It is interesting that the dynamic contact angle values measured on stainless steel 304 with SAM
layers of styrene-co-styphos acid, fluorophosphonic acid and undecenyl phosphonic acid are
similar to those measured on carbon steel. The highest hydrophobicity – superhydrophobicity -
was observed on the fluorophosphonic SAM layer; the increase in the concentration during the
film formation resulted in a slightly enhanced contact angle. On the other hand, the higher
concentration eventuates in smaller hysteresis, i.e. the receding contact angle value is higher; the
layer is more compact (Figure 5.4). In case of the undecenyl phosphonic acid SAM layer the
nanofilm shows denser structure as the receding contact angle is much higher than was on carbon
steel.
107 110115 118
128
75
60
80
6560
0
20
40
60
80
100
120
140
160
C16P Sty. U. P C12P F. P
C. A
(de
gr.)
Inhibitor type
Adv.…
Figure 5.3: Influence of amphiphile types of SAMs on stainless steel 304 (layer formation time: 24h; The surfaces are covered by SAM of: C12P: dodecyl phosphonic acid; C16P: hexadecyl
phosphonic acid; U.P:undecenyl phosphonic acid, Sty: styren-co-styphos acid; F.P: fluorophosphonic acid ).

54
Table 5.3: Contact angle values measured on stainless steel 304 surfaces covered by SAM layers; influence of the chemicals, layer formation time, concentrations and dipping time.
Metal Chemical Time C. A. (Adv, Rec)
stainless steel 304
dodecyl phosphonic acid 15 min 95, 60
24 h 118, 65(1st dip)
112, 65(4 other dips)
hexadecyl phosphonic acid( 5x10⁻³ M) 15 min 103 , 55 97 , 60
4 h 100 , 72
24 h 107, 75 100 , 55
5 days 120, 80
7 days 95 , 45
hexadecyl phosphonic acid(8x10⁻³ M) 4 h 103, 46 (1st dip)
95, 46 (4 other dips)
24 h 103, 45 (1st dip)
Undeceyl phosphonic acid (5x10⁻³ M) 4 h 115, 45(1st dip)
85, 45 (others 4 dips)
24 h 115, 80
Styrene-co-styphos acid (5x10⁻² M) 24 h 110, 60
Fluorophosphonic acid (5x10⁻² M) 24 h 127, 70(1st dip)
123, 70(others 4 dips)
Fluorophosphonic acid (5x10⁻³ M) 128, 60(1st dip)
120, 58(2nd
dip) 117, 57(others 3 dips)

55
78
115
127 128
40
8070
120
0
20
40
60
80
100
120
140
160
U. P (5E-2) U. P (5E-3) F. P (5E-2) F. P (5E-3)
C A
(dg
re.)
Inhibitor type and concentration
Adv. angleRec. angle
Figure 5.4: Influence of the concentration on the wettability of stainless steel 304 with fluorophosphonic acid (F.P) and undecenyl phosphonic acid (U.P) SAM layers formed at 24h
(5E-3=5x10⁻³ M; 5E-2=5x10⁻² M).
b. Stainless steel 316
The effect of layer formation time in cases of undeceyl phosphonic acid, styrene-co-styphos acid
and fluorophosphonic acid on stainless steel 316 samples is illustrated in Figure 5.5 and data are
depicted in Table 5.4. One can notice that the highest advancing contact angle of 118o was again
achieved with the fluorophosphonic acid. The undecenyl phosphonic acid and the styrene-co-
styphos acid solution after 24 h immersion gave almost the same contact angles. It is important
to mention that on the stainless steel 316 the receding values are lower; the differences between
the advancing and receding contact angle values are higher than in the case of the stainless steel
304. This could be explained by the differences in the surface oxide layer. In the case of stainless
steel 316 the interaction between the molybdenum oxide that partly covers the metal surface and
the phosphonic groups is less powerful than on the chromium oxide and iron oxide surface (e.g.
in case of 304 oxide layer).

56
102 100
118
30 33
55
0
20
40
60
80
100
120
140
160
U. P Sty. F. P
C. A
(deg
r.)
Inhibitor type
Adv. angle
Rec. angle
Figure 5.5: Influence of amphiphile types in SAMs on stainless steel 316 wettability (layer
formation time: 24 h; U.P:undecenyl phosphonic acid, Sty: styren-co-styphos acid; F.P: fluorophosphonic acid).
Table 5.4: Contact angle values measured on SAMs covered stainless steel 316 surfaces; influence of the amphiphiles, layer formation time, and concentrations.
iii Influence of SAM coatings on aluminum surfaces
In this part I present the contact angle values measurements on aluminum surfaces covered by
phosphonic acid SAM layers and the numerical data are discussed. It is well known that the
aluminum alloys are often used in different industries like aircraft, automobiles, construction
because of their strength to weight ratio, ductility and low cost. The wide application is due to
the corrosion resistance caused by the easily formed passive oxide layer on the aluminum.
Metal Chemical Time C. A (Adv, Rec) [o]
stainless steel 316 Undecenyl phosphonic acid (5x10⁻³ M)
24 h 102, 35(1st dip)
95, 35(other 4 dips)
Styrene-co-styphos acid(5x10⁻³ M ) 24 h 100, 30(1st dip)
93, 30(other 4 dips)
Fluorophosphonic acid(5x10⁻³ M ) 24 h 118, 55(1st dip)
110, 52(other 4 dips)

57
The surface hydrophobicity increases when the SAM films of alkenyl and fluorophosphonic
acids cover the metal as these molecular layers act as barrier to the aqueous solutions and the
anticorrosion activity improves. The phosphonic amphiphiles form the SAMs by condensation
reactions of the acid functional group (that show strong affinity to the aluminum) with the basic
surface bound alumino-hydroxil species via Al-O-P bond:
R-PO(OH)2 + Al-OH R-(OH)OP-O-Al + H2O (5.1)
To understand the anticorrosion protection of the SAM layers on the aluminum surface it is
important to characterize the layers. The next Table 5.5 summarizes the results of the dynamic
contact angle measurements. The high contact angle values show that the phosphonic groups
adsorb very well on the metal surface, and reduce the metal solubility in the aqueous media with
decreasing the active spots on the surface.
The fluorophosphonic acid resulted in the highest contact angle values (168o and 95o) (Figure
5.5) among all three chemicals used. Although after 48 h immersion time the results of styrene-
co-styphos acid and fluorophosphonic acid were almost the same, in the case of the styrene-co-
styphos acid there was a decrease in the contact angle values as the number of dips increased.
This indicates that fast surface adsorption of amphiphiles occurs within a short time; however,
well-oriented high-quality SAMs are formed after longer period (some hours). The nanolayer
formed in short period could have some inhomogeneity and in this case, the water molecules
could approach the metal surface. There was almost no change in the contact angle values with
time-increase for both the undecenyl phosphonic acid and fluorophosphonic acid whereas for
styrene-co-styphos acid the value increased from 150o at 2 h to 165o at 48 h. Nevertheless, one
has to keep in mind that the fluorophosphono amphiphile is the only one where the repeated
dipping into the water did not cause significant decrease in the contact angle; in other words, this
is the most compact layer comparing with the other two SAMs. It is important to mention that
the increase in the layer formation time and in the amphiphile concentration influenced the
contact angle values in the same direction as in the case of the other alloys i.e. the wettability in
water decreased. In order to see the influence of the pure solvents used for developing the SAM
layers, the metals were immersed into methanol and chloroform, and the contact angles were
followed. As contact angle values proved, the organic solvents did not cause change in the
wettability of the bare metal; the advancing angle was 63o.

58
Table 5.5: Contact angle values measured on SAMs covered aluminum surfaces; influence of the amphiphiles, layer formation time, and concentrations
Metal Chemical Time C. A (Adv, Rec)
Aluminum Undeceyl phosphonic acid(5x10⁻³ M)
24 h 138, 20(1st dip) 45, 20(2nd dip) 40, 15(other 3 dips)
48 h 145, 45(1st dip) 85, 45(2nd dip) 70, 45(3rd dip) 63, 45(4th dip) 50, 45(5th dip)
Styrene-co-styphos acid(5x10⁻³ M)
2 h 150, 38(1st dip) 55, 38(other dips)
4 h 170, 45(1st dip) 60, 45(other 4 dips)
24 h 170, 45(1st dip) 60, 45(other dips)
48 h 165, 50(1st dip) 100, 50(2nd dip) 95-80,50(other 3dips)
Styrene-co-styphos acid (5x10⁻² M)
24 h 160, 40(1st dip) 60, 40(2nd dip) 48, 40(other 3 dips)
Fluorophosphonic acid(5x10⁻³ M)
2h 162, 80(1st dip) 140, 60(2nd dip) 132, 55(3rd dip) 125, 50(4th dip) 120, 50(5th dip)
4 h
175, 65(1st dip) 130, 57(2nd dip) 118, 53(3rd dip) 110, 50(4th dip) 103, 50(5th dip)
48h 168, 95
Fluorophosphonic acid(5x10⁻² M)
48h
175, 135(1st dip) 170, 130(other 4dips)

59
145
165 168
4550
95
0
20
40
60
80
100
120
140
160
180
200
U. P Sty. F.P
Inhibitor type
C. A
(deg
r.)
Adv. angle
Rec. angle
Figure 5. 6: Influence of amphiphile types in SAMs on aluminum wettability
(layer formation time: 48 h; U.P:undecenyl phosphonic acid, Sty: styren-co-styphos acid; F.P: fluorophosphonic acid).
It is important to mention that on aluminum the increase in the layer formation time and in the
amphiphile concentration influenced the contact angle in the same way as in the case of the other
iron alloys. For the sake of the comparison, I show the wettability changes on all SAM-covered
metals that were investigated (carbon steel, stainless steels 304 and 316, aluminum). The most
hydrophobic, so-called superhydrophobic surfaces were developed on aluminum surface by these
phosphonic acid amphiphiles (Figure 5.7 and 5.8). These figures confirm the statement by
showing the contact angle values of nanolayers formed from fluorophosphonic and undecenyl
phosphonic acids. On all metals both amphiphiles form very hydrophobic layers and it is
important to mention that on the stainless steel 304 developed compact, dense layer, which is
reflected in high receding values. The most hydrophobic – superhydrophobic - SAM layer is
formed from the flourophosphonic acid on aluminum.

60
Figure 5.7: Comparizon of wettabilities measured on different metal surfaces covered by fluorophosphonic acid SAM layer formed in 24 h (amphiphile concentration: 5x10⁻³ M;
St.St.= stainless steel ).
Figure 5.8: Wettability measured on different metal surfaces covered by undecenyl phosphonic acid SAM layer formed in 24 h (amphiphile concentration: 5x10⁻³ M;
St.St.= stainless steel).

61
As for aluminum samples, the contact angle value was higher than those on carbon steel due to
the hard aluminum oxide that formed on the surface where the chemical interacted with the oxide
layer on the metal surface to form a protective layer
From the achieved results, it can be observed that the fluorophosphonic acid forms a more
hydrophobic coating than the undecenyl phosphonic acid, which is due to the structure of the
molecules involved into the self-assembling process.
5.2.1.1.2. Influence of the surface roughness on the SAM layer formation
In the literature, there are information about the surface roughness and the bias toward to
corrosion. The roughness of a surface can determine the characteristics of SAM nanolayers. With
increasing roughness the surface area increases, more amphiphilic molecules will be absorbed
through adhesion of head groups.
As previously I had mentioned, the surface free energy (influenced by the surface chemistry),
surface roughness and its structure/homogeneity can control the surface wettability as they can
trap air on the surface and stabilize the Cassie-Baxter state. When the metal surface is flat, and,
additionally, covered by nanolayers, the surface energy is reduced (107, 108). In my
experiments, I have investigated the influence of the surface finishing (roughness) on the change
in the dynamic water contact angle. Figure 5.9 summarizes what happens when the metal
surface, before the SAM layer deposition, was grinded with a series of emery paper (started from
400 up to 4000-grain size). Then on the bare metal of different roughness SAM layers of the two
amphiphiles (fluorophosphonic and undecenyl phosphonic acid) were deposited. The increase in
the contact angle values with increasing emery paper grain sizes is well demonstrated in Figure
5.9. It is interesting that the fluorophosphonic amphiphile (which generally produces more
hydrophobic surface than the undecenyl one) cannot deposit a more hydrophobic SAM layer of
high contact angle on the roughest surface, contrary to the undecenyl phosphonic acid.
As the bare metal surface is more and more smother, the tendency changes and, at last, on the
smoothest surface the SAM nanolayer of the flourophosphonic amphiphile is more hydrophobic

62
than the undecenyl one. The structure of the undecenyl phosphonic acid assists to this behavior,
as the double bond at the end of the carbon chain helps to disguise air bubbles. The hydrophobic
character of the bare metal disappears after the second dip, in the case of the undecenyl
phosphono amphiphile layer it deceases, the wetting ability of the fluorophosphonic layer does
not change; it stays very hydrophobic as the results of dynamic contact angles demonstrate.
70
80
72
95
90
110
88
95
105
128 128130
110
120
110
118120
122
0
20
40
60
80
100
120
140
160
400gr 600gr 800gr 1200gr 2000gr 4000gr
C. A
(deg
r.)
Roughness
Bare metal
Fluorophosphonic acid
Und phosphonic acid
Figure 5.9: Influence of the aluminum surface finishing on the changes in the contact angle values (concentration: 5x10⁻³ M; Und phosphonic acid= undecenyl phosphonic acid).
5.2.1.1.3. Influence of the SAM layer curing by UV light on the wettabililty
The undecenyl phosphonic acid with a double bound in the alkenyl chain is capable for
polymerization. Its SAM layer showed less ordered structure then the other amphiphiles due to
the destruction of the ordering by the CH2=CH- group at the end of the alkenyl chain. The idea to
polymerize these molecules to form a “hydrophobic net” over the metal surface (to increase the
anticorrosion activity) was achieved by two techniques.

63
After exposing the carbon steel metal sample coated by an undecenyl phosphonic acid layer to a
UV light ( = βη4 nm) for γ0 minutes, the advancing angle value was 108° for the first dip and
105° for the other dips. This indicates that the layer became more compact due to the influence
of the UV light that led to the polymerization of the double bounds (Table 5.2).
UV exposition of undecenyl phosphonic acid layers on aluminum showed no change for samples
that were immersed for 2hrs into the amphiphile solution and exposed to UV light for 30
minutes. While those samples when the exposure time was longer (3hrs) on samples when the
SAM layer formation time was 2 and 48hrs, the contact angle values decrease which indicate that
the layer became looser and the water molecules could penetrate to the metal surface.
It is clear when the contact angle value without illumination was already high; the layer was
already compact enough (due to the dense oxide surface layer which allows adsorption of much
more phosphonic acid molecules notwithstanding the presence of the interfering double bonds.
In the next experiments the change in the wettability will be analyzed by measuring the static
contact angles.
5.2.1.3 Surface characterization by static contact angle values
A liquid drop can spread across a surface because of the adhesive forces between the liquid and
the solid. When the cohesive force is high in the liquid, the drop avoids the contact with the
surface. When a contact angle is less than 90o (case:C), the surface wetting is favorable; the
water will spread over the surface area. At above 90o (case:A), the surface wetting is
unfavorable, a compact liquid drop will be formed (Figure 5.10).
Figure 5.10:Wetting properties by different fluids (79)Sμ = 0; Cμ0 < < λ0°;Bμλ0° ≤ < 180°;
Aμ = 180°

64
5.2.1.2.1. Influence of the SAM layer curing by UV light
The wetting of the carbon steel surface (coated and uncoated with fluorophosphonic or
undecenyl phosphonic acid layers) was investigated in water. Static contact angle results are
illustrated in Figures 5.11 and in Table 5.6. In case of measuring the static contact angle, small
drop of water is placed on the solid surface (80).
In the first set of experiments carbon steel surface was investigated in uncoated and coated form
with undecenyl phosphonic acid SAM layer. For the sake of comparison result got by dynamic
and static contact angle measurements, the fluorophosphonic acid SAM layer was also analyzed.
The static contact angle values are summarized in Table 5.6. As long as the fluoro amphiphile in
SAM nanolayer gave a high value (124o) the undecenyl phosphonic acid in nanofilm produced a
less value of 88 o.
In order to polymerize the double bond in the SAM layer formed by undecenyl phosphonic acid,
two methods were chosen to carry out these experiments and the influence was measured with
the use of the static contact angle since only one side of the surface could be treated while for the
dynamic contact angle measurements both sides needed treatment.
In order to investigate the effect of curing of the double bond in the undecenyl phosphonic acid
SAM layer on the carbon steel sample formed in β4hrs, it was undertaken to UV light ( = βη4
nm) for 30 and 60 minutes. The influence of the shorter and longer illumination time, which was
followed by contact angle measurement showed that the shorter time has a much less important
effect on the layer hydrophobicity (contact angle of SAM without illumination: 88o; after
illumination for 30 min: 81o). With other words, this time was enough for polymerization of the
minority of the double bounds. On the other hand, 60 min UV light illumination resulted in an
increased contact angle value: from 88o to 102°. This indicates that the layer became more
compact due to the influence of the UV light that led to the polymerization of the majority of the
double bounds (Table 5.6).
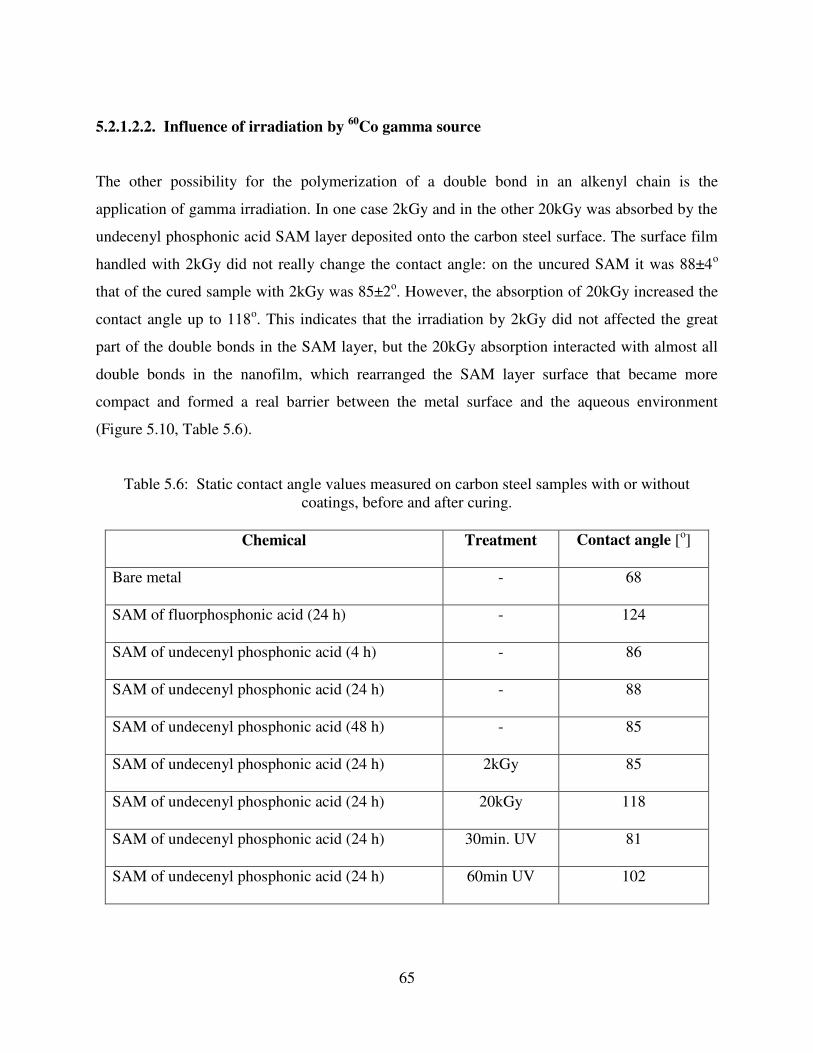
65
5.2.1.2.2. Influence of irradiation by 60Co gamma source
The other possibility for the polymerization of a double bond in an alkenyl chain is the
application of gamma irradiation. In one case 2kGy and in the other 20kGy was absorbed by the
undecenyl phosphonic acid SAM layer deposited onto the carbon steel surface. The surface film
handled with 2kGy did not really change the contact angle: on the uncured SAM it was 88±4o
that of the cured sample with 2kGy was 85±2o. However, the absorption of 20kGy increased the
contact angle up to 118o. This indicates that the irradiation by 2kGy did not affected the great
part of the double bonds in the SAM layer, but the 20kGy absorption interacted with almost all
double bonds in the nanofilm, which rearranged the SAM layer surface that became more
compact and formed a real barrier between the metal surface and the aqueous environment
(Figure 5.10, Table 5.6).
Table 5.6: Static contact angle values measured on carbon steel samples with or without coatings, before and after curing.
Chemical Treatment Contact angle [o]
Bare metal - 68
SAM of fluorphosphonic acid (24 h) - 124
SAM of undecenyl phosphonic acid (4 h) - 86
SAM of undecenyl phosphonic acid (24 h) - 88
SAM of undecenyl phosphonic acid (48 h) - 85
SAM of undecenyl phosphonic acid (24 h) 2kGy 85
SAM of undecenyl phosphonic acid (24 h) 20kGy 118
SAM of undecenyl phosphonic acid (24 h) 30min. UV 81
SAM of undecenyl phosphonic acid (24 h) 60min UV 102

66
Fig. 5.11: Static contact angle values measured on cured and not cured SAM layers deposited onto carbon steel samples.
The comparison of the dynamic and static contact angle values measured on similar surfaces in
case of fluorophosphonic acid SAM layer gave almost the same value (129o and 124o
respectively), but the undecenyl phosphonic acid nanofilm behaved differently which could be
due to the slightly different roughness of the metal surface.
5.3 Surface visualization by atomic force microscopy(AFM)
The SAM coated surfaces were characterized by AFM, too. This technique allows the surface
visualization in 3D as well as the numerical characterization of the surface (measure of
roughness, section analysis).

67
5.3.1 Influence of short SAM layer formation time on the surface morphology and on the
anticorrosion activity
Carbon steel samples, with and without coatings, were visualized by AFM. The images on the
surface morphology showed that both chemicals (fluorophosphonic and undecenyl phosphonic
acids) formed compact layers on the metal surface.
By this technique not only the SAM layer covered metal surfaces are characterized, but the
anticorrosion activity of these layers, too.
In the first set of AFM experiments, I was interested not only in the surface morphology of the
SAM layer covered metal surfaces but in the influence of the layer formation time on the
anticorrosion activity. In Figures 5.12 and 5.13 the AFM images visualize the carbon steel
surface without and with SAM layers built in 30 minutes, handled with different (NaCl, NaClO4)
electrolytes. The carbon steel shows a smooth, partly irregular metal surface, which, after
nanolayer deposition has already more regular patterns on the surface. After immersion of SAM
coated metal into perchlorate, small depositions appear on the surface showing the formation of
corrosion products in the aerated electrolyte. The sodium chloride deteriorated the surface; the
formation of deep pits is visible, which is clearly demonstrated on the 3D images. The
comparison of the surface roughness of the bare metal and of the nanocoated surface after
immersion into NaCl assures that the layer is much less rough when the nanocoating is present
than without it.
Carbon steel on air
Carbon steel immersed in NaCl for 1 h
Figure 5.12: Carbon steel surface before and after immersion into sodium chloride.

68
Undecenyl phosphonic acid layer on carbon steel, (layer formation time 30 min)
Undecenyl phosphonic acid SAM after 1h immersion in NaClO4 solution.
Undecenyl phosphonic acid SAM after 1h
immersion in NaCl solution.
Fluorophosphonic acid SAM
Fluorophosphonic acid SAM after 1h immersion in NaCl
Figure 5.13: Influence electrolytes on SAM layers on carbon steel (layer formation
time: 30 min).
The last two images in Figure 5.13 show that even in the case of short coating time the
fluorophosphonic acid SAM layer can inhibit the pitting corrosion. There is not any pit on the
metal surface after1 h long immersion into sodium chloride.

69
5.3.2 Influence of longer SAM layer formation time and irradiation on the surface
morphology of different metals
The results presented here show the influence of the longer nanolayer formation time (24 h) on
the surface morphology, without and with curing the undecenyl phosphonic acid SAM layer, and
the influence of the two electrolytes. On Figure 5.14 the change caused by longer nanolayer
deposition is visualized in 3D as well as in section images. The surface of the fluoro amphiphile-
covered metal surface is similar either 30 minutes or 24 h was left for layer deposition. It was
interesting that the undecenyl phosphonic acid after adsorption onto the metal surface made a
special surface appearance, which differs from that one shown after 30 min deposition. Previous
XPS results confirmed the possibility of multilayer appearance on the surface.
(a) (b)
(c)
Figure 5.14: SAM layers of fluorophosphonic acid (a) and undecenyl phosphonic acid (b) and its section (c) on carbon steel surfaces (layer formation time: 24 h).

70
Images in Figure 5.15 and 5.16 show the influence of the irradiation on the undecenyl SAM
layers.
Figure 5.15: Undecenyl phosphonic acid SAM layer (layer formation time: 24 h) after irradiation: absorption of 2 kGy; carbon steel.
Figure 5.16: Undecenyl phosphonic acid SAM layer (layer formation time: 24 hrs) after irradiation:
absorption 20kGy; carbon steel.

71
Figure 5.17: Oxide layer covered aluminum surface (a, b) and fluorophosphonic acid SAM layer covered
aluminum surface (c, d) visualized in 3D and by section analysis.
The 3D images and the section analysis proved that the presence of the molecular layers changes
the surface morphology. It is visible that these amphiphiles develop special coverage on the
metals. On the other hand, the irradiation left “special signs” on the SAM layers. Even in the
case of 2 kGy absorption, the surface morphology did not significantly changed, however, the 20
kGy altered the surface. This drastic change appeared already in the contact angle values.
The same SAM-covered samples were further investigated to study the influence of the SAM
layers on the general and pitting corrosion.

72
5.3.3 Influence of SAM layers on pitting corrosion
The influence of sodium chloride solution on carbon steel surfaces covered by nanolayers was
investigated. After one hour of immersion in sodium chloride, the carbon steel surface coated
with fluorophosphonic acid SAM layer –formed in 2 hours - did not suffer from pit formation,
not any sign of pits was observed. It means that the layer worked as a good, dense barrier
between the metal and the solution. Similar observation was done when the layer deposition time
was short (Figure 5.13). The undecenyl phosphonic acid SAM layer could only protect partly the
metal surface from pitting; the surface roughening was much less, than without SAM layer
(Figure 5.18), though this nanolayer is less effective than the fluoro amphiphile in SAM layer. It
is due to the nanolayer structure, which is negatively influenced by the double bond in the
molecules and this structure allows the Cl- ion penetration onto the metal surface.
(a) (b) ↓ ↓
(c) (d)
Figure 5.18: Influence of sodium chloride solution on carbon steel: (a): bare metal surface before and (c): after immersion in chloride solution for 1 h; (b): undecenyl phosphonic acid SAM
nanolayer covered carbon steel surface and (d) after immersion into chloride solution for 1 h.

73
↓
Figure 5.19: Influence of sodium chloride solution on the aluminum surface (a, b): metal surface visualized in 3D and its section; (c, d): aluminum surface after immersion into chloride solution
for 1 h.

74
↓
Figure 5.20: Influence of chloride solution on aluminum surface covered by fluorophosphonic
acid SAM layer after 1 h (a, b):SAM surface morphology and its section before corrosion test (c, d):the SAM layer after immersion into the chloride solution for 1h.
Similar experiments were done with aluminum. SAM layers were formed from both
amphiphiles. As Figure 5.19 and 5.20 show, when the metal without nanolayer, was immersed
into sodium chloride, the metal surface became very rough. However, the presence of the fluoro
amphihile in SAM film could control the pitting corrosion: there was not any sign of pits on the
surface. This is very important in the case of aluminum as this metal is very sensitive to the
pitting corrosion.
(a) (b)
(c) (d)

75
5.3.4 Influence of SAM layers on general corrosion
The influence of fluorophosphonic and undecenyl phosphonic acid SAM layers on general
corrosion was investigated in aerated sodium perchlorate solution. AFM images taken after one
hour immersion in the electrolyte solution are shown in Figures 5.21 and 5.22.
Figure 5.21: Aluminum alloy surface without nanolayer in sodium perchlorate for 1 h, visualized by section analysis and in 3D and.
Figure 5.22: Aluminum alloy surface covered by fluorophosphonic acid SAM layer after
immersion in sodium perchlorate for 1 h, visualized by section analysis and in 3D. The first set of images demonstrates the significant roughening of the aluminum surface in
perchlorate solution (see the section lines). The fluorophosphonic acid SAM nanolayer could
inhibit the surface deterioration, the corrosion, which is reflected in the smooth section line.

76
The AFM images showed in 3D as well as the section lines prove that the nanolayers developed
on different metals inhibit both the general and the pitting corrosion. The inhibition efficiency
depends on the amphiphile structure.
5.3.5 Influence of the SAM layer post-treatment on the anticorrosion efficacy
Carbon steel UP24h
Carbon steel UP24h +2kGy Carbon steel UP24h +20kGy
Carbon steel UP24h +2kGy +1h NaCl Carbon steel UP24h +20kGy +1hNaCl
Figure 5.23: Influence of the SAM modification by irradiation on the anticorrosion activity (UP:undecenyl phosphonic acid; SAM layer formation time:24 h; irradiation by 2 kGy and 20
kGy; immersion into NaCl solution).

77
I previously mentioned the change in the wettability caused by irradiated undecenyl phosphonic
acid SAM surface. This modification of the SAM layer caused alteration in the anticorrosion
activity, too. Figure 5.23 demonstrates the increased corrosion inhibition caused by the irradiated
nanolayer coating on the carbon steel surfaces. It is clear that even the 2 kGy absorption made
the nanolayer more resistant against corrosion, i.e. the layer compactness increased.
5.3.6 Surface characterization by roughness parameters
In order to characterize the influence of the corrosive environment numerically, I used the
roughness parameters offered by the AFM software.
With increasing surface roughness the possibility of pitting corrosion increases, with other words
a smoother surface is less corroded than a rougher one. On a smoother surface the defect places
are reduced. Two different processes contribute to the pitting corrosion on smooth and rougher
surface:
1. The pit formation ability is contributed to the presence of surface defects, which are more numerous on rough surface. On smooth surface the number of the defect places is reduced because of passivation (109, 110).
2. The diffusion of corrosion causing species (e.g. chloride ions) is affected by the
surface roughness. In case of the aggressive species are in contact with the surface and the diffusion of the corrosion
products are limited, the repassivation of the metal is reduced and that allows the growing of a
pit (109, 111, 112). The deep grooves trap the aggressive species, and the corrosion product
cannot diffuse out of the groove; this increases the growth of the pit. On the other hand, when
corrosion products can diffuse out quickly, no accumulation of the aggressive species can
happen, the metal surface could be repassivated. In case of repassivation or stable oxide layer
formation pit nucleation and growth is reduced (113).
The visualization of a surface by atomic force microscope permits the calculation of the surface
roughness at nanoscale. It far exceeds the resolution achieved by other (e.g. optical) methods and
is becoming increasingly important.

78
The measured surface roughness depends on the spatial and vertical resolution of an instrument.
A real surface exhibits roughness on many length scales. Two important factors affect the
resolution of roughness values measured at the metal surface: the vertical resolution, which is
limited by the noise, and the spatial resolution limited by the tip radius.
The roughness can be characterized by several parameters.
i. Maximum height of the profile (Rmax): the most significant parameter: the
vertical distance between the deepest valley and highest peak around the surface
profile.
ii. Roughness average (Ra): this is the most widely used parameter as it is easy to
measure. The average roughness is the mean absolute profile; it does not make
any distinction between valleys and peaks, the measure depends on the average
heights profile.
iii. Root means square roughness (Rq): this is a statistical measure, which is similar
to the roughness average; the only difference is the mean squared absolute value
of surface roughness.
I used atomic force microscopy to determine the roughness parameters, which are summarized in
Table 5.7 and 5.8 (the solid surface was carbon steel) and in Table 5.9 (the SAM layers were
deposited onto aluminum surface). Both the undecenyl and fluorophosphonic acid SAM layers
were investigated in aggressive solutions.
The average roughness profile (Ra) values measured on the bare carbon steel metal and on the
nanolayer did not show significant difference, but after irradiation the Ra values increase a little.
The root means square roughness (Rq) values, which are more sensitive to the valleys and peaks
than the average roughness, show similar trend than the Ra values. Additionally, the Rmax
parameters followed the same tendency.
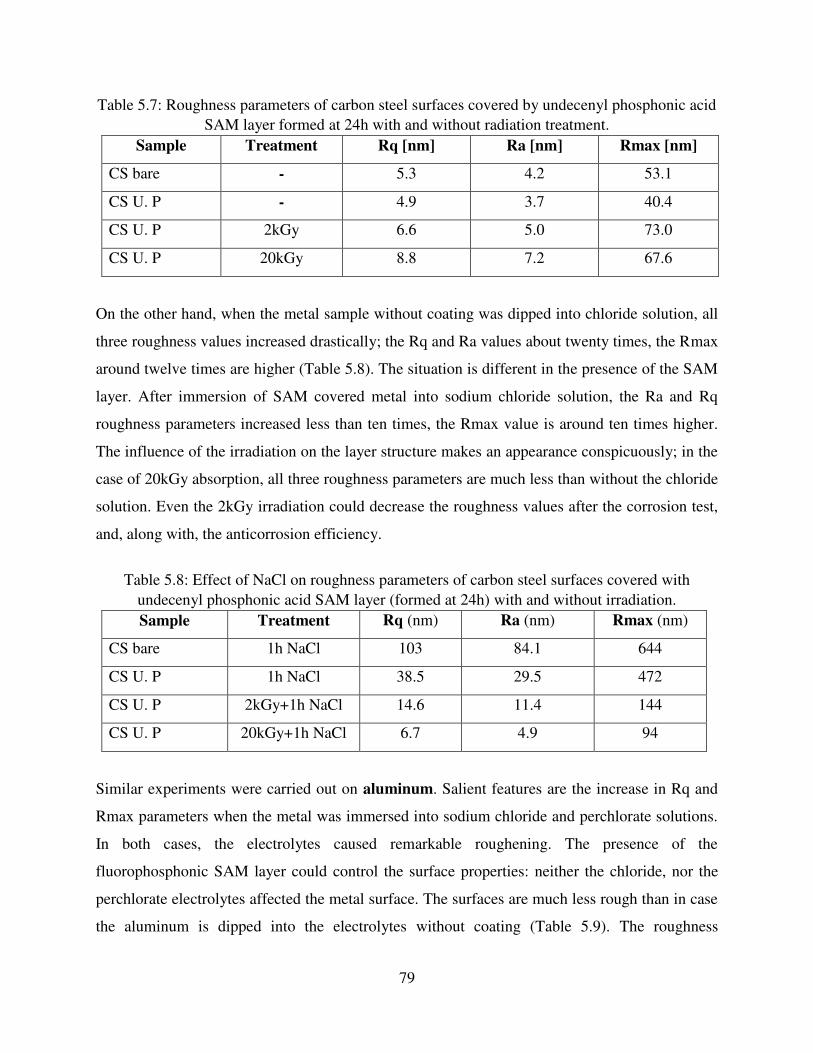
79
Table 5.7: Roughness parameters of carbon steel surfaces covered by undecenyl phosphonic acid SAM layer formed at 24h with and without radiation treatment.
Sample Treatment Rq [nm] Ra [nm] Rmax [nm]
CS bare - 5.3 4.2 53.1
CS U. P - 4.9 3.7 40.4
CS U. P 2kGy 6.6 5.0 73.0
CS U. P 20kGy 8.8 7.2 67.6
On the other hand, when the metal sample without coating was dipped into chloride solution, all
three roughness values increased drastically; the Rq and Ra values about twenty times, the Rmax
around twelve times are higher (Table 5.8). The situation is different in the presence of the SAM
layer. After immersion of SAM covered metal into sodium chloride solution, the Ra and Rq
roughness parameters increased less than ten times, the Rmax value is around ten times higher.
The influence of the irradiation on the layer structure makes an appearance conspicuously; in the
case of 20kGy absorption, all three roughness parameters are much less than without the chloride
solution. Even the 2kGy irradiation could decrease the roughness values after the corrosion test,
and, along with, the anticorrosion efficiency.
Table 5.8: Effect of NaCl on roughness parameters of carbon steel surfaces covered with
undecenyl phosphonic acid SAM layer (formed at 24h) with and without irradiation. Sample Treatment Rq (nm) Ra (nm) Rmax (nm)
CS bare 1h NaCl 103 84.1 644
CS U. P 1h NaCl 38.5 29.5 472
CS U. P 2kGy+1h NaCl 14.6 11.4 144
CS U. P 20kGy+1h NaCl 6.7 4.9 94
Similar experiments were carried out on aluminum. Salient features are the increase in Rq and
Rmax parameters when the metal was immersed into sodium chloride and perchlorate solutions.
In both cases, the electrolytes caused remarkable roughening. The presence of the
fluorophosphonic SAM layer could control the surface properties: neither the chloride, nor the
perchlorate electrolytes affected the metal surface. The surfaces are much less rough than in case
the aluminum is dipped into the electrolytes without coating (Table 5.9). The roughness

80
parameters observed on the AFM images show the importance of these phosphonic acid
amphiphiles applied in SAM layers and prove that they can effectively decrease both the general
and the pitting corrosion though the fluoro amphipile is more effective. SAM layers on the
carbon steel and aluminum drastically decreased the Rmax values that represent – as it was
mentioned - the vertical distance between the deepest valley and highest peak around the surface
profile.
Table 5.9: Effect of NaCl and NaClO4 electrolytes on the roughness parameters and depth analysis
data of aluminum surfaces covered with fluorophosphonic acid SAM layer formed at 4h.
Sample Treatment Rq (nm) Rmax (nm)
Al - 9.4 122
Al 1h NaCl 86.2 413
Al 1h NaClO4 139.0 422
Al F. P SAM - 11.5 88
Al F. P SAM 1h NaCl 14.5 145
Al F. P SAM 1h NaClO4 26.2 217
5.5 Characterization by IR spectroscopy 5.4.1. The effect of UV and irradiation on solid UPA revealed by IR spectroscopy
On the right spectra of Figure 5.24. IR1 the C-H stretching region of UPA samples is shown. The
spectra are dominated by the antisymmetric (as) and symmetric (s) methylene stretching modes
at 2918 and 2851 cm-1, respectively. The position and shape of these two bands reflect an
ordered conformation of the aliphatic chains (114). No changes were observed on the spectra of
irradiated samples suggesting that the alkyl chains of the molecules remained intact. Small shift
towards lower wavenumber were witnessed for sample UV treated for 180min. The band shift
from higher to lower wavenumbers means that the number of gauche conformers decreases and
the number of highly ordered all-trans conformers of alkyl chain increases. It seems plausible
that the C=C double bonds of UPA are saturated upon UV treatment leading to the formation of
a more ordered structure. The presence of C=C double bond produce only a very weak C-H
stretching band at 3065 cm-1 (=C-H) not suitable for direct monitoring of structural changes.

81
Figure 5.24: IR1 C-H vibration regions of UPA samples’ spectraμ rightμ C-H stretching region; left: C-H scissoring region.
Additional information about alkyl chain packing can be obtained also from the position and
shape of methylene scissoring mode (CH2). This spectral feature is very sensitive to side-by-
side chain interactions as well as the packing organization of the methylene chain. IR1 two
medium intense bands are observed for UPA samples. The high frequency band around 1471 cm-
1 indicates partially ordered chains, while the low frequency band is characteristic for reduced
side-by-side interactions and an increase in chain motion (115). It is worth to note that upon
irradiation and 180min UV treatment the relative intensity of the higher frequency band of CH2
scissoring mode is increasing suggesting a more pronounced side-by-side interaction of alkyl
chains parallel with reducing gauche defects caused by C=C moieties.

82
Figure 5.25: IR2 Stretching region of phosphonic groups in UPA samples.
The relative intensities and shape of stretching vibrations of phosphonic group are presented in
Figure 5.25. IR2. The most prominent is the shift of the P=O stretching band from 1178 towards
1184 cm-1 for UV treated samples. It seems plausible that the UV treatment disrupt some of the
P=O bonds. An increase in band intensity can be observed also for C=C-H deformation modes at

83
993 and 907 cm-1, respectively, suggesting that 180min UV treatment and irradiation may affect
the C=C bond of starting UPA.
Table 5.10: IR band positions with possible assignments and explanations
UPA UPA_UV
120min
UPA_UV
180min
UPA
2kGy
UPA 20
kGy
Assignment
3078 w 3078 w 3078 3078 w 3078 vw -OH stretching
3065 w 3065 w 3065 3065 w 3065 vw =C-H stretching
2999 w 2999 w 2996 2999 w 2999 vw CH2 stretching
2978 w 2978 w 2976 2978 w 2978 vw CH2 stretching
2960 w 2960 w 2959 2960 w 2959 vw CH2 stretching
2918 vs 2918 vs 2916 vs 2918 vs 2919 vs CH2 antisymmetric
stretching of ordered chain
2851 vs 2851 vs 2849 vs 2851 vs 2851 vs CH2 symmetric stretching
of ordered chain
1643 m 1643 m 1642 m 1644 m 1644 m C=C stretching
1471 m 1471 m 1469 m 1469 m 1469 m CH2 scissoring
1462 m 1462 m 1462 1462 m 1462 m CH2 scissoring
1401 w 1401 w 1402 w 1402 w 1402 w CH2 wagging
1287 w 1287 w 1288 w 1288w 1288 w CH2 twisting
- 1253 w 1253 vw - - P-OH deformation
1204 w 1204 1204 w 1204 w 1204 w C-C stretching
1179 m 1184 1183 m 1178 m 1176 m P=O stretching
1115 m 1115 m 1115 m 1116 m 1115 m PO32-
1045 w 1044 1045 w 1043 w 1043 w PO43-
993 s 993 s 993 s 994 s 995 s C=C-H deformation
907 s 907 s 907 s 907 s 907 s C=C-H deformation
779 m 779 m 779 m 780 m 780 m
718 m 718 m 718 m 718 m 717 m CH2 rocking

84
5.5 Electrochemical measurements
During the corrosion of metals electrochemical processes take place in electrolytes that could be
followed by different electrochemical techniques that all can contribute to the understanding of
processes happen on the anode and cathode and help in elucidation of the mechanisms of the
corrosion. The corrosion resistance of the SAM coated metal surfaces was evaluated either by
the change of the open circuit potential in time, by potentiodynamic polarization, or by
electrochemical impedance spectroscopy.
5.5.1 Open circuit potential (Eocp) vs. time
The value of the open circuit potential (Eocp) is a parameter determined by the rates of cathodic
and anodic reactions on the corroding surface; then the rate of the anodic and cathodic reactions
are equal and the net current is zero. It depends on the corrosion media, and chemical
composition of the metal. The change in the open circuit potential as a function of time (Eocp vs
time), under static conditions on bare and fluorophosphonic as well as undecenyl phosphonic
acid SAM layer-coated carbon steel surfaces are presented in Figures 5.26 and 5.27 and in
Tables 5.11 and 5.12. The time-dependent change of the open circuit potentials goes parallel
with the self-assembled layer formation time: with increasing molecular layer formation time,
the values of the Eocp change in the more positive direction, which shows that the surface
coatings formed at longer time, altered significantly the metal surface. Comparing the shift of the
Eocp of the coated samples with the uncoated, the highest shift was measured for SAM layer of
undecenyl phosphonic acid formed at 24h, when the potential shifted from -502 mV (bare metal)
to -209 mV. In the case of the more hydrophobic fluorophosphonic acid, already at shorter film
formation time (0.5 h), there was a significant positive shift in the Eocp value: from -502 mV to -
313 mV. Longer film formation time with fluoro amphiphile did not resulted in significant
increase in the Eocp. The 0.5 h gave an Eocp value of -313mV while that of 24h formed layer was -
320mV. This indicates that the metal surface - already after half an hour - was mostly covered by
fluoro amphiphile molecules. On the other hand, when the SAM layer was formed from the less
hydrophobic undecenyl phosphonic acid molecules (which, additionally, contain double bond) to
reach the same, significant shift in the Eocp needed more time; after 2 h film formation the Eocp

85
shifted to -243mV. It means that the molecules needed more time to arrange themselves in a
compact layer that can cover the more active sites on the metal surface.
00 250 500500 750 10001000 1250
-500
-450
-400
-350
-300
-250
-200
Po
ten
tia
l (m
V)
Time [sec.]
Bare metal
F.P0.5h
F.P 1h
F.P 2h
F.P 24h
F.P 48h
Figure 5.26: Open circuit potential results for layers formed by fluorophosphonic acid.
0 250 500 750 1000 1250
-550
-500
-450
-400
-350
-300
-250
-200
-150
-100
-50
Po
ten
tia
l (m
V)
Time [sec.]
Bare metal
U.P 0.5h
U.P 1h
U.P 2h
U.P 24h
U.P 48h
Figure 5.27: Open circuit potential results of layers formed by undecenyl phosphonic acid.

86
Table 5.11: Steady-state potential values of carbon steel covered by SAM nanolayer of fluorophosphonic acid (formed in 20min).
Layer formation time (h) E (mV)
Bare metal -502
0.5 -313
1 -298
2 -319
24 -320
48 -305
Table 5.12: Steady-state potential values of carbon steel covered by SAM nanolayer of
undecenyl phosphonic acid.
Layer formation time (h) E (mV)
Ø -502
0,5 -413
1 -336
2 -243
24 -209
5.5.2 Effect of layer formation time on the electrochemical processes
5.5.2.1 Potentiodynamic polarization results
The inhibitor efficiencies of the SAM layers formed on carbon steel surfaces were analyzed by
electrochemical potentiodynamic measurements. This technique helps in the determination of the
type and the function of the nanolayers. The results can answer whether the layers controlled the
anodic reaction (metal dissolution) or the cathodic process. The carbon steel electrodes with or

87
without nanolayers were investigated in perchlorate solution. The results are plotted as potential
(mV) versus logarithm of the current density (mA/cm2).
In cases of the fluorophosphonic and undecenyl phosphonic acid SAM layers, with increasing
layer formation time there is a shift in the Ecorr potential in the more positive direction (Figures
5.28 and 5.29). It indicates that the anodic process (i.e. the metal dissolution) is inhibited. It is
clear that the anticorrosion efficiency of the films increases with increasing layer formation time
by both amphiphile nanolayers. The curves also show that in short nanolayer formation time
inhomogeneous, not very compact layers are formed.
Effective SAM layers were formed by undecenyl phosphonic acid at 24hrs where the icorr was
shifted to a very low value, similarly to the fluoro amphiphilic SAM layers. This demonstrates
that with increasing layer formation time there is an improvement in the quality of the film
structure, which is due to the formation of well-organized molecular structure within the films. In
longer time, after the amphiphiles anchor to the metal surface through the phosphonic head
groups, the molecules cover the whole surface and the hydrophobic molecular part vertically
cover the area, which gives a hydrophobic character to the surface. Even in a short layer
formation time (0.5 h), there was a decrease in the icorr (0.7 x10⁻⁶A/cm2 for fluorophosphonic acid
SAM layer and 3 x10⁻⁶ A/cm2 for the undecenyl phosphonic acid). We should keep in mind that
the same influence of the layer formation time was observed on the corrosion potential (Ecorr); it
decreased as the time increased. Corrosion kinetic parameters icorr , Ecorr, efficiencyμ [%] , are
shown in Tables 5.13 and 5.14.

88
Figure 5.28: Effect of SAM layer formation time of fluorophosphonic acid on the corrosion reactions.
Figure 5.29: Effect of SAM layer formation time on the corrosion reactions in the case of undecenyl phosphonic acid.
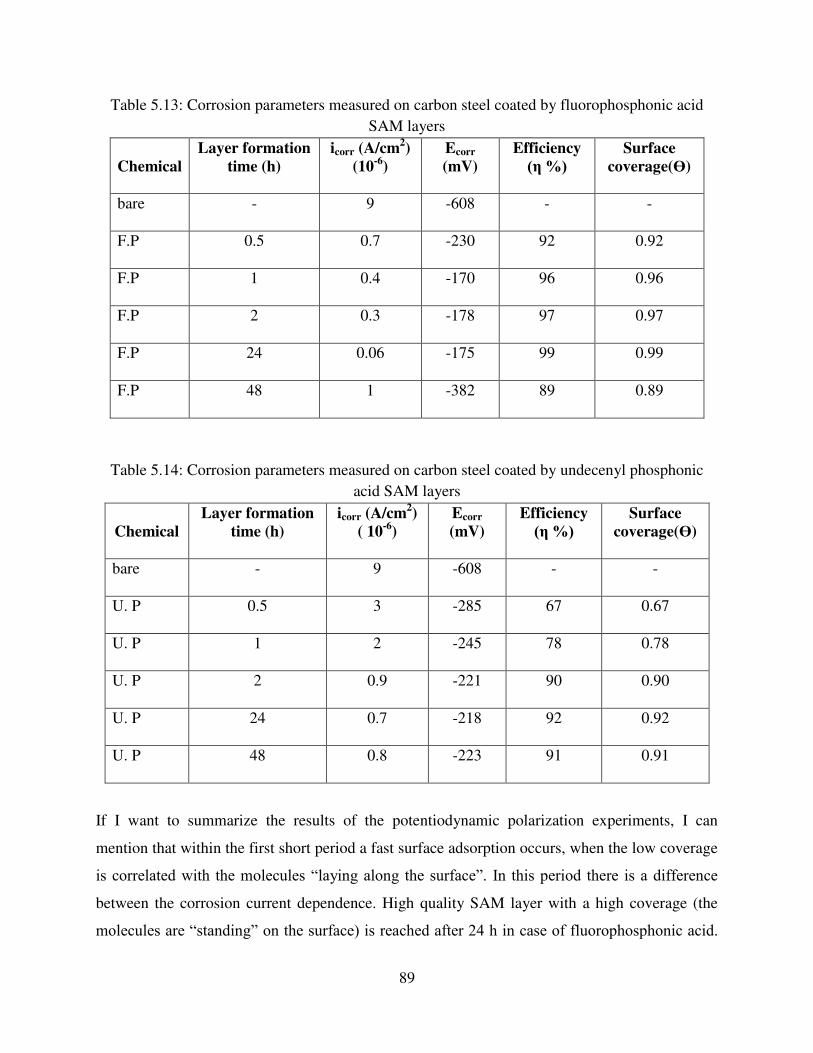
89
Table 5.13: Corrosion parameters measured on carbon steel coated by fluorophosphonic acid SAM layers
Chemical Layer formation
time (h)
icorr (A/cm2) (10-6)
Ecorr (mV)
Efficiency (η %)
Surface coverage(ϴ)
bare - 9 -608 - -
F.P 0.5 0.7 -230 92 0.92
F.P 1 0.4 -170 96 0.96
F.P 2 0.3 -178 97 0.97
F.P 24 0.06 -175 99 0.99
F.P 48 1 -382 89 0.89
Table 5.14: Corrosion parameters measured on carbon steel coated by undecenyl phosphonic acid SAM layers
Chemical Layer formation
time (h)
icorr (A/cm2) ( 10-6)
Ecorr (mV)
Efficiency (η %)
Surface coverage(ϴ)
bare - 9 -608 - -
U. P 0.5 3 -285 67 0.67
U. P 1 2 -245 78 0.78
U. P 2 0.9 -221 90 0.90
U. P 24 0.7 -218 92 0.92
U. P 48 0.8 -223 91 0.91
If I want to summarize the results of the potentiodynamic polarization experiments, I can
mention that within the first short period a fast surface adsorption occurs, when the low coverage
is correlated with the molecules “laying along the surface”. In this period there is a difference
between the corrosion current dependence. High quality SAM layer with a high coverage (the
molecules are “standing” on the surface) is reached after β4 h in case of fluorophosphonic acid.

90
It is interesting that after 48 h molecular layer formation time, a small decrease in the efficiency
of fluoro amphiphile was observed. It could be explained with adsorption of further molecules
onto the first layer forming a second layer, which disturbs the orientation of the first line of
molecules. In this case a small part of the head groups will face the aqueous environment that
decreases the water contact angle value, i.e. increases the hydrophilicity. There is similar
observation given in the literature. In case of the undecenyl phosphonic acid, a dense nanolayer
forms in 24 h. It shows that the undecenyl amphiphile needs more time for formation of a well-
structured nanolayer. The film formation happens through continuous molecular adsorption and
desorption as well as by molecular reorientation. The well-oriented dense structure is responsible
for the high anticorrosion efficiency.
0 5 10 15 20 25
50
60
70
80
90
100
110
Effic
ien
cy [%
]
Time [h ]
F.P
U.P
Figure 5.30: Time dependent effectiveness values of nanolayers formed on carbon steel surfaces.
Correlation was found between the layer formation time and the efficiencies (Figure 5.30) and
also between the calculated surface coverage from the efficiencies (Tables 5.13, 5.14). In the
case of these amphiphiles the curves followed Langmuir kinetics; i.e. the number of the active
locations is infrequent, there is a specific bound and the result is a monolayer. To prove the
Langmuir type correlation, the time (Time (h)) and the time/coverage (Time (h) / Ɵ) were plotted
(Figure 5.31). As for the undecenyl amphiphile the correlation between time and coverage was a
little similar to a Freundlich isotherm, which is also a classical isotherm, like the Langmuir one.
The difference between them is that during the layer formation, the binding force decreases and
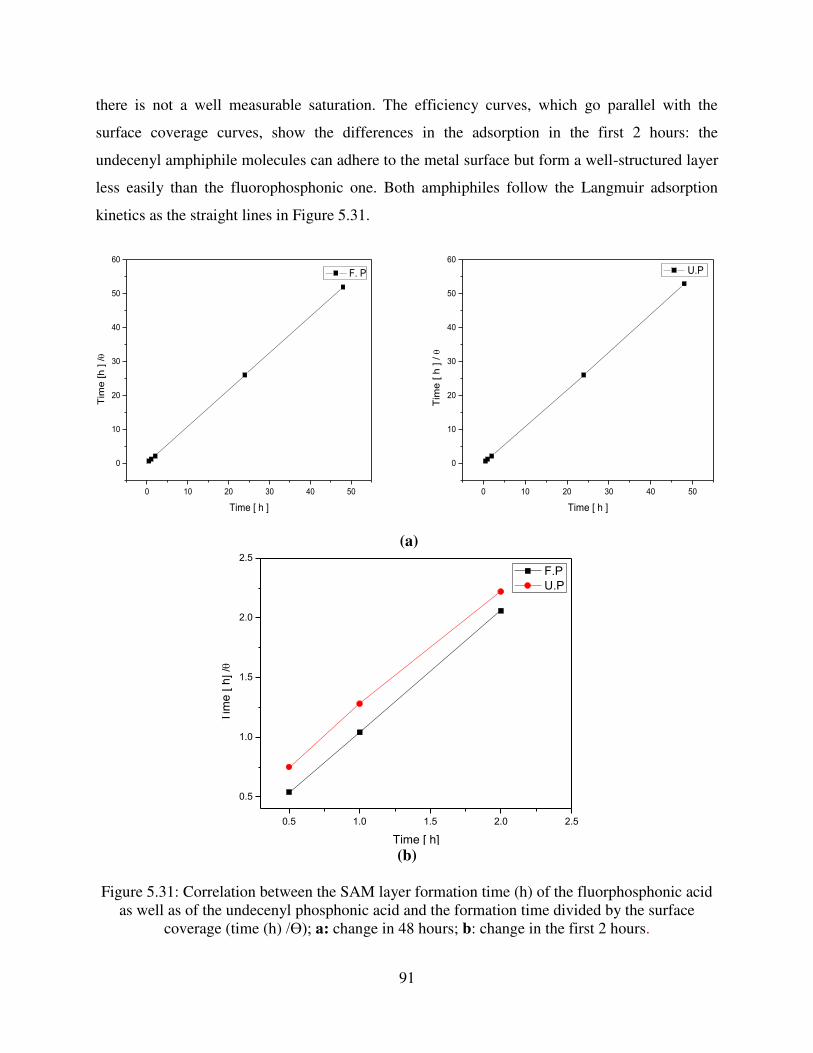
91
there is not a well measurable saturation. The efficiency curves, which go parallel with the
surface coverage curves, show the differences in the adsorption in the first 2 hours: the
undecenyl amphiphile molecules can adhere to the metal surface but form a well-structured layer
less easily than the fluorophosphonic one. Both amphiphiles follow the Langmuir adsorption
kinetics as the straight lines in Figure 5.31.
0 10 20 30 40 50
0
10
20
30
40
50
60
Tim
e [h
] /
Time [ h ]
F. P
0 10 20 30 40 50
0
10
20
30
40
50
60
Tim
e [ h
] /
Time [ h ]
U.P
(a)
0.5 1.0 1.5 2.0 2.5
0.5
1.0
1.5
2.0
2.5
Tim
e [ h
] /
Time [ h]
F.P
U.P
(b)
Figure 5.31: Correlation between the SAM layer formation time (h) of the fluorphosphonic acid
as well as of the undecenyl phosphonic acid and the formation time divided by the surface coverage (time (h) /Ɵ); a: change in 48 hours; b: change in the first 2 hours.

92
In both cases, the correlation gave straight lines not only in the early period of the adsorption but
at the longer layer formation time, too. It proves that the process of the layer formation follows
Langmuir adsorption as shown in Figure 5.30. This is an important correlation as originally the
Langmuir adsorption is correlated with the concentration of the molecular concentration but I
could replace this value with the SAM layer formation time.
5.5.2.2 Electrochemical Impedance Spectroscopy (EIS) results
Organic SAM nanofilms were developed that could successfully resist to the aggressive
environments metals are exposed to. In order to assist the development and characterization of
these films, in the evaluation of their performance the electrochemical impedance spectroscopy
is of great importance.
The EIS is a non-destructive measurement, provides information on surfaces in corrosive
medium. A small amplitude sinusoidal alternating signal is applied on the SAM-modified metal
surface. The analysis of the impedance spectrum results in an equivalent circuit model, which
allows the evaluation of the electrochemical information measured on the nanocoated surface.
The equivalent circuit, which interprets data and gives physical meanings of the studied system,
is used in electrochemical systems. In my case, the equivalent circuit is composed of Rs bulk
solution resistance, of the constant phase element (CPE: it replaces the double layer capacitance
models the behavior of an imperfect capacitor), and parallel with it, the Rct charge transfer
resistance that describes the electrochemical reactions under control. This technique is very
useful to investigate organic films on metallic surfaces used as corrosion inhibitors. Using the Rct
values, we can evaluate the corrosion behavior of the nanolayers as the charge transfer resistance
is inversely related to corrosion rate.
EIS technique was utilized to probe the quality and the behavior of nanolayers on electrodes
under the effects of layer formation time, pH of the electrolyte, and the time of immersion in the
electrolyte. The results are shown in forms of: 1. Nyquist plot where the real vs. imaginary

93
amplitudes are plotted; a Nyquist plot is a parametric plot of a frequency response used in
automatic control and signal processing as well as is applied for assessing the stability of a
system; 2. Bode plots are very useful to represent the gain and phase of a system as a function of
frequency. This is referred to as the frequency domain behavior of a system. In Bode graphs
with the same data the logarithm of the modulus of the impedance log |Z| vs. log ω is the Bode
module plot and the phase angle (ϴ) vs. log ω is the Bode phase plot.
The EIS results were evaluated by the Zview software in order to fit the measured data to the
best electric circuit model in which the Rs, Rct and the CPE values are calculated. The CPE is
used to replace a capacitor that represents the double layer or non- homogeneity of the surface.
Two components are represented by the CPE, the (Q) reflects the capacitance of the CPE
impedance and the (n) reflects the phase shift degree of the non-ideality in the capacitive
behavior and the uniformity of the surface.
All electrochemical results achieved by the EIS technique were represented by the equivalent
circuit as shown in Figure 5.32.
Rs CPE
R
Figure 5.32: Equivalent electric circuit for the EIS results.
As the Nyquist and Bode plots show (Figures 5.33 and 5.34), the nanolayers of both amphiphiles
on carbon steel surfaces affected the surface properties; this resulted in higher protection as the
layer formation time increased. In the case of the fluorophosphonic acid nanolayer the charge
transfer resistance (which informs about the surface compactness) results in the highest value
(Rp: 54ηη0 Ω.cm2) in case when the layer formed in 24 h. At shorter nanofilm formation (0.5 h)
this value is much less: 10718 Ω.cm2, which is due to the submolecular island nucleation; they
will gradually grow and coalesce in longer time. With other words: in shorter time the molecules
cannot occupy all the active places on the metal surface, active sites are left on the metal surface.

94
More time is needed for seize the full surface. Yet even at a short time (0.5 h) the layer formed
by fluorophosphonic acid gave 8-times better result when compared with the Rp of bare metal
(Table 5.15).
0 2500 5000 7500 10000
-10000
-7500
-5000
-2500
0
Z'
Z''
Bare metal.zFP 0.5 h.zFP 1 h.zFP 2 h.zFP 24 h.zFP 48 h.z
100 101 102 103 104101
102
103
104
105
Frequency (Hz)
|Z|
Bare metal.zFP 0.5 h.zFP 1 h.zFP 2 h.zFP 24 h.zFP 48 h.z
100 101 102 103 104
-75
-50
-25
0
Frequency (Hz)
the
ta
Figure 5.33: Fluorophosphonic acid-SAM layer formed on carbon steel; time dependent Nyquist and Bode plots.

95
0 1000 2000 3000 4000 5000
-5000
-4000
-3000
-2000
-1000
0
Z'
Z''
Bare metal.zUP 0.5h.zUP 1h.zUP 2h.zUP 24h.zUP 48h.z
100 101 102 103 104101
102
103
104
105
Frequency (Hz)
|Z|
Bare metal.zUP 0.5h.zUP 1h.zUP 2h.zUP 24h.zUP 48h.z
100 101 102 103 104
-75
-50
-25
0
Frequency (Hz)
the
ta
Figure 5.34: Undecenyl phosphonic acid-SAM layer formed on carbon steel; time dependent Nyquist and Bode plots.
Results of the undecenyl phosphonic acid (Table 5.16) showed the same trend in the function of
layer formation time as the fluorophosphonic acid. For the layer formed at 0.5 h, the Rp value

96
recorded was 8671 Ω.cm2; when the time increased up to 1 h and 2 h, the Rp increased to 19975
Ω.cm2 and βλθγ8 Ω.cm2, respectively, resulting in an efficiency increase from 91% to 95%. An
Rp value of 44λ4β Ω.cm2 was recorded for the layer formed at 24 h, which is almost five fold of
that achieved by the 0.5 h layer, which is due to the formation of a more compact, protective thin
film that inhibited the corrosion sites on the metal surface. Evaluation of these results, the
electrochemical process taking place on the metal surface is charge transfer and the diffusion
does not really influence; the layers managed to a certain point to prevent the oxygen diffusion to
the base metal. It can also be noticed that as the Rp increases, the Q decreases; the n does not
change significantly. It means that the surface uniformity is almost constant. These results
indicate that the charge transfer from the metal decreased due to the blocking of some corrosion
sites on the metal surface.
This reveals itself in the change of the Rp as well as in the Q values. The higher Rp values
represent the increase in the charge transfer resistance; the decrease in the Q values the positive
change in the capacitance, the almost constant n values inform about the surface homogeneity.
Even though the results of the undecenyl phosphonic acid nanolayer were good in protecting the
metal surface, yet again the results of fluorophosphonic acid nanolayer were better due to the
more compact and more hydrophobic fluorophosphonic acid SAM layer. The contact angle
values prognosticated these results: the more hydrophobic nanofilms can stand against better to
the attack of a corrosive environment.
Table 5.15: EIS parameters for SAM layers formed by fluorophosphonic acid on carbon steel.
Chemical Layer formation time (h)
Q (μF/cm2 )
n Rp (Ω. cm2) η (%) Surface coverage(ϴ)
Bare - 78 0.θ8 1β4θ -
FP
0.5 21 0.79 10718 76 0,76
1 9 0.76 24254 95 0,95
2 8 0.75 28923 96 0,96
24 4 0.73 54550 98 0,98
48 4 0.76 47703 97 0,97

97
Table 5.16:EIS parameters for SAM layers formed by undecenyl phosphonic acid on carbon steel
Figure 5.35: Correlation between the polarization resistance and the layer formation time measured on fluorophosphonic acid (FP) and undecenyl
phosphonic acid (UP) SAM coated carbon steel.
These curves depicted in Figure 5.35 support the observation given in case of correlation
between the layer formation time and the surface coverage. The fluorophosphonic acid follows
saturation already in the first period of the layer formation (a rapid increase in the Rp values
reaching saturation) but when the undecenyl phosphonic acid builds the nanolayer, the
saturations is reached at a much longer time.
Chemical Layer formation
time (h) Q (μF/cm2 ) n Rp (Ω. cm2) η (%)
Bare - 78 0.θ8 1β4θ -
UP
0.5 23 0.81 8671 59
1 9 0.75 19975 91
2 8 0.80 29638 95
24 9 0.77 44942 97
48 20 0.73 31243 97

98
5.5.3 Effect of electrolyte pH on the anticorrosion efficiency
5.5.3.1 Influence of the pH measured by potentiodynamic polarization
It was interesting how these SAM layers behave in electrolytes with different pH values. Results
are summarized in Figures 5.36- 5.38 and Table 5.17- 5.19. At pH=3 both chemicals behaved in
the same trend as the bare metal in spite of a slight shift in the Ecorr to the positive range. There
was a rapid increase in the icorr values above the Ecorr that might be related to the distorted SAM
layer structure, which could be caused by the H+ ions’ effect on the phosphono head group
structure. We should keep in mind that the pK1 value of these amphiphiles are between 2 and 3
(fluorophosphonic acid: 2.08; undecenyl phosphonic acid: 2.42), the acidic environment changes
the place the head group occupy and the ratio among the mono- bi- or tridentate- adsorption
types could also be changed that results in a less compact SAM structure. This leads to an
enhanced metal dissolution.
Figure 5.36: Behavior of the bare metal, fluorophosphonic acid and undecenyl phosphonic acid SAM layers covered carbon steel in electrolyte at pH = 3.

99
Table 5.17: Effect of pH on the anticorrosion behavior of layers formed by fluorophosphonic acid and undecenyl phosphonic acid on carbon steel in electrolyte with pH = 3
Chemical pH icorr (A/cm2) (10-6) Ecorr (mV) Efficiency (%)
Bare metal 3 8 -475 -
F. P 3 7 -370 13
U. P 3 4 -370 50
As the pH value increased to pH 7, the carbon steel electrode covered by fluorophosphonic acid
SAM layer showed a rapid decrease in the corrosion current density (icorr ) up to 0.02x10⁻⁶A/cm2
value (at pH 3: 7 x10⁻⁶A/cm2 ) and the Ecorr also shifted to the anodic direction. There parameters
indicate that the layer could control much better the corrosion processes in neutral solution. The
same was observed on the undecenyl phosphonic acid SAM at pH 7 value: decrease in the icorr
and positive shift in the Ecorr. Accordingly, the rate of the corrosive metal dissolution decreased
significantly. At pH 9 and 11 values there were changes in the Ecorr and icorr values compared to
that of the pH 7 measured on the fluorophosphonic and undecenyl phosphonic acid nanolayers.
There is a small increase in the metal dissolution. These changes could be due to the start in the
amphiphile dissolution and to change in the structure of the head group within the SAM layers;
both effects are influenced by the second pK values (undecenyl: 8.08; flurophosphonic: 7.63)
and the result is a little decrease in the anticorrosion activity of both SAM layers at higher than
neutral pH values (Figures 5.37 and 5.38, Tables 5.18 and 5.19).
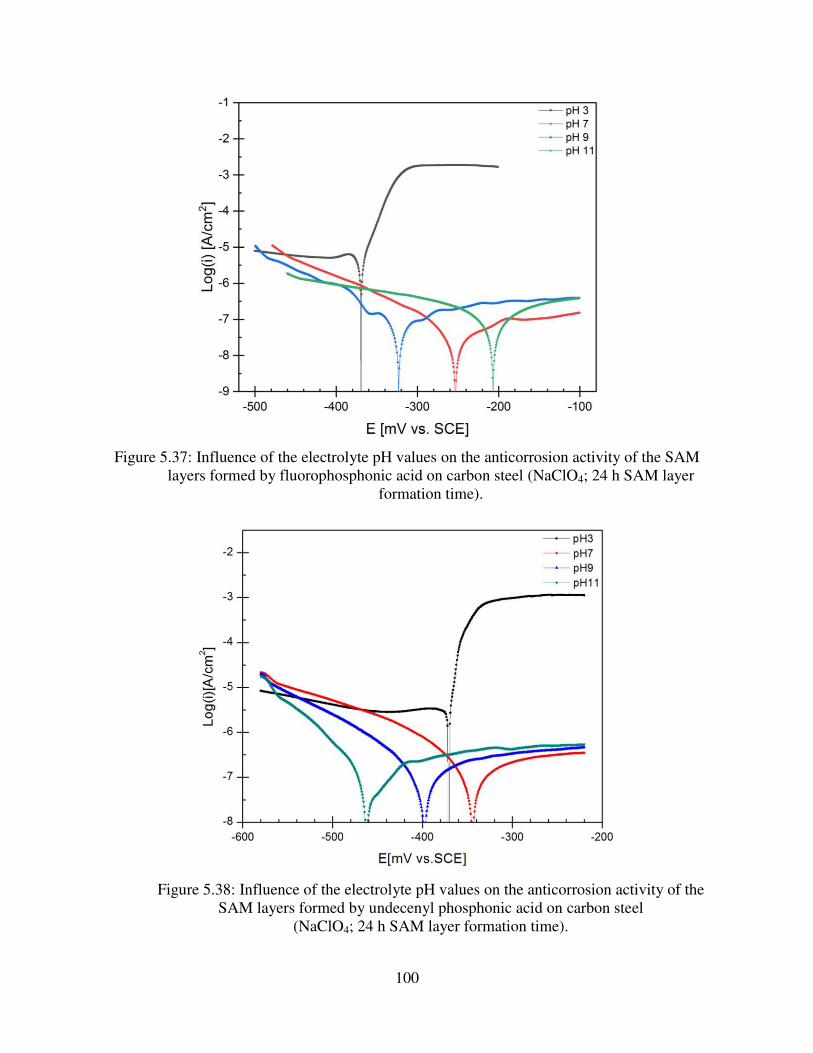
100
Figure 5.37: Influence of the electrolyte pH values on the anticorrosion activity of the SAM layers formed by fluorophosphonic acid on carbon steel (NaClO4; 24 h SAM layer
formation time).
Figure 5.38: Influence of the electrolyte pH values on the anticorrosion activity of the SAM layers formed by undecenyl phosphonic acid on carbon steel
(NaClO4; 24 h SAM layer formation time).

101
Table 5.18: Corrosion parameters measured at different pH values in the presence of fluorophosphonic acid SAM layers on carbon steel (NaClO4; 24 h layer formation time).
Chemical pH icorr (A/cm2) (10-6) Ecorr (mV)
F. P 3 7 -370
F. P 7 0.02 -253
F. P 9 0.06 -321
F. P 11 0.05 -208
Table 5.19: Corrosion parameters measured at different pH values in the presence of
undecenyl phosphonic acid SAM layers on carbon steel (NaClO4; 24 h) SAM layer formation time).
Chemical pH icorr (A/cm2) (10-6) Ecorr (mV)
U. P 3 4 -370
U. P 7 0.06 -342
U. P 9 0.06 -398
U. P 11 0.04 -462
5.5.3.2 Influence of the pH measured by electrochemical impedance spectroscopy
The pH effect on the fluorophosphonic acid and undecenyl phosphonic acid nanolayers along
with the bare metal in electrolyte at pH=3 are shown in Figure 5.39. The effect is the same that
was presented with the other electrochemical technique and the explanation is the same: there is
a change in the head group structures initialized by the acidic environment. The Rp values were
quite the same for all three surfaces (fluorophosphonic acid layer, undecenyl phosphonic acid
nanolayer and bare metal) as shown in Table 5.20.
Table 5.20: EIS parameters measured on carbon steel as bare metal, SAM layers formed by fluorophosphonic acid and undecenyl phosphonic acid on carbon steel in electrolyte at pH=3
Chemical pH Q (μF/cm2 ) n Rp (Ω. cm2)
Bare metal 3 38 0.78 1650
F. P 3 38 0.72 1790
U. P 3 40 0.70 1691

102
0 250 500 750 1000
-850
-600
-350
-100
Z'
Z''
Bare metal pH3.zF.P 24h pH3U.P 24h pH3
100 101 102 103 104101
102
103
104
Frequency (Hz)
|Z|
Bare metal pH3.zF.P 24h pH3U.P 24h pH3
100 101 102 103 104
-70
-60
-50
-40
-30
-20
-10
0
Frequency (Hz)
the
ta
Figure 5.39: Comparison of EIS results got in corrosion experiment by bare metal, layers formed by fluorophosphonic acid and undecenyl phosphonic acid on carbon steel in electrolyte at pH=3.

103
0 2500 5000 7500 10000
-10000
-7500
-5000
-2500
0
Z'
Z''
F.P 24h pH3FP 24h pH 7.zF.P 24h pH9FP 24hrs pH11.z
100 101 102 103 104101
102
103
104
105
Frequency (Hz)
|Z|
F.P 24h pH3FP 24h pH 7.zF.P 24h pH9FP 24hrs pH11.z
100 101 102 103 104
-75
-50
-25
0
Frequency (Hz)
the
ta
Figure 5.40: Nyquest and Bode plots for layers formed by fluorophosphonic acid on
carbon steel in electrolyte at different pH values.

104
0 2500 5000 7500 10000
-10000
-7500
-5000
-2500
0
Z'
Z''
U.P 24h pH3UP 24h pH7.zUP 24h pH9UP 24h pH11.z
100 101 102 103 104101
102
103
104
105
Frequency (Hz)
|Z|
U.P 24h pH3UP 24h pH7.zUP 24h pH9UP 24h pH11.z
100 101 102 103 104
-100
-75
-50
-25
0
Frequency (Hz)
the
ta
Figure 5.41: Nyquist and Bode plots measured on carbon steel surface covered by undecenyl phosphonic acid SAM layer in electrolyte at different pH values.

105
The SAM layer performed best at pH=7, the efficiency was the highest at neutral pH. As the pH
increased above this value (pH=9 and pH=11) the Rp decreased, the anticorrosion efficacy
decreased. The Rp of fluorophosphonic acid layer in a solution with a pH of 9 resulted in an Rp
value of just 6546 Ω. cm2 while for pH=11 it was γγ71 Ω. cm2. This also might be related to the
change in the head group structure within the SAM layers because of the second pK values.
Similar behavior was noticed at the undecenyl phosphonic acid SAM layers as Figures 5.40 and
5.41 and Tables 5.21 and 5.22 illustrate.
Table 5.21: EIS parameters for SAM layers formed by fluorophosphonic acid on carbon steel in
electrolyte at different pH values Chemical pH Q (μF/cm2 ) n Rp (Ω. cm2)
FP 3 38 0.72 1790
FP 7 5 0.78 40366
FP 9 7 0.75 6546
FP 11 3 0.75 3371
Table 5.22: EIS parameters measured on SAM layers formed by undecenyl phosphonic acid on
carbon steel in electrolyte at different pH values Chemical pH Q (μF/cm2 ) n Rp (Ω. cm2)
UP 3 40 0.7 1691
UP 7 9 0.77 38065
UP 9 16 0.76 29061
UP 11 4 0.9 35454
5.5.4 Time dependence of protectively effect on of SAM layer covered metal
The effect of the immersion of metals (with and without SAM coating, formed at 24 h) in
electrolyte had been studied for both of the SAM layers formed from fluorophosphonic acid and
undecenyl phosphonic acid.
As shown in Figures 5.42 and 5.43 the Rp values decrease as the immersion time in electrolyte
increases, which indicates that the nanolayer starts to change the structure, becomes less
106
compact, more permeable, and thus less protective. The Rp value of the fluorophosphonic acid
SAM layer formed at 24h and immersed in the electrolyte for β0 min was η4ηη0 Ω. cm2 (Table
η.βγ) and after θh of immersion dropped to β7γλ0 Ω. cm2, even though this value is about 22-
times higher than that of the bare metal (1β4θ Ω. cm2) handled under the same conditions.
Increasing the immersion to 24 h, there was a decrease to Rp (β14γ8 Ω. cm2). This means that in
24 h the layer effectiveness decreased to almost the half, but this value is still 17-time higher
than that of the bare metal. The reason for the decrease in the anticorrosion activity could be that
the longer SAM layer formation time allows the adhesion of a secondary molecular layer, which
results in a more hydrophilic surface.
The behavior of the undecenyl-phosphonic acid SAM layer is similar to the fluoro amphiphiles;
there is a decrease in the Rp values after dipping the coated samples into the electrolyte. The
starting Rp value measured at 20 min was 4494β Ω. cm2, which sharply decreased to 17λλ Ω.
cm2 at β4 h of immersion time (Table η.β4). This value is close to the bare metal’s, which shows
that the surface metal was corroded, even though there were no signs of corrosive attacks by
visual inspection, the nanolayer turned to be permeable for the electrolyte, the metal corrosion
was initiated.
This big difference in the Rp values observed between those achieved by fluorophosphonic acid
SAM layers and those of undecenyl phosphonic acid SAM nanocoating (layer formation time in
both cases was 24h) is related to the differences in the structure of the two amphiphiles: the
undecenyl has a double bond that does not allow the formation of a compact layer, but the
fluorophosphonic amphiphile has a hydrophobic alkyl chain, which supports the formation of a
densely packed, well-ordered nanofilm. All these observations are reflected in the Nyquist and
Bode plots.

107
0 5000 10000 15000 20000
-20000
-15000
-10000
-5000
0
Z'
Z''
FP 24h and in solution 20min..zFP 24h and in solution 1h.zFP 24h and in solution 2h.zFP 24h and in solution 3h.zFP 24h and in solution 4hrs.zFP 24h and in solution 5h.zFP 24h and in solution 6h.zFP 24h and in solution 24h.z
100 101 102 103 104102
103
104
105
Frequency (Hz)
|Z|
FP 24h and in solution 20min..zFP 24h and in solution 1h.zFP 24h and in solution 2h.zFP 24h and in solution 3h.zFP 24h and in solution 4hrs.zFP 24h and in solution 5h.zFP 24h and in solution 6h.zFP 24h and in solution 24h.z
100 101 102 103 104
-100
-75
-50
-25
0
Frequency (Hz)
the
ta
Figure 5.42: Effect of immersion time into electrolyte on fluorophosphonic acid SAM
layer covered carbon steel surface.

108
0 1000 2000 3000 4000 5000
-5000
-4000
-3000
-2000
-1000
0
Z'
Z''
UP 24h and in solution 20min.zUP 24h and in solution 1h.zUP 24h and in solution 2h.zUP 24h and in solution 3h.zUP 24h and in solution 4h.zUP 24h and in solution 5h.zUP 24h and in solution 6h.zUP 24h and in solution 24h.z
100 101 102 103 104102
103
104
Frequency (Hz)
|Z|
UP 24h and in solution 20min.zUP 24h and in solution 1h.zUP 24h and in solution 2h.zUP 24h and in solution 3h.zUP 24h and in solution 4h.zUP 24h and in solution 5h.zUP 24h and in solution 6h.zUP 24h and in solution 24h.z
100 101 102 103 104
-75
-50
-25
0
Frequency (Hz)
the
ta
Figure 5.43: Effect of immersion time into electrolyte on undecenyl hosphonic acid SAM layer covered carbon steel surface.
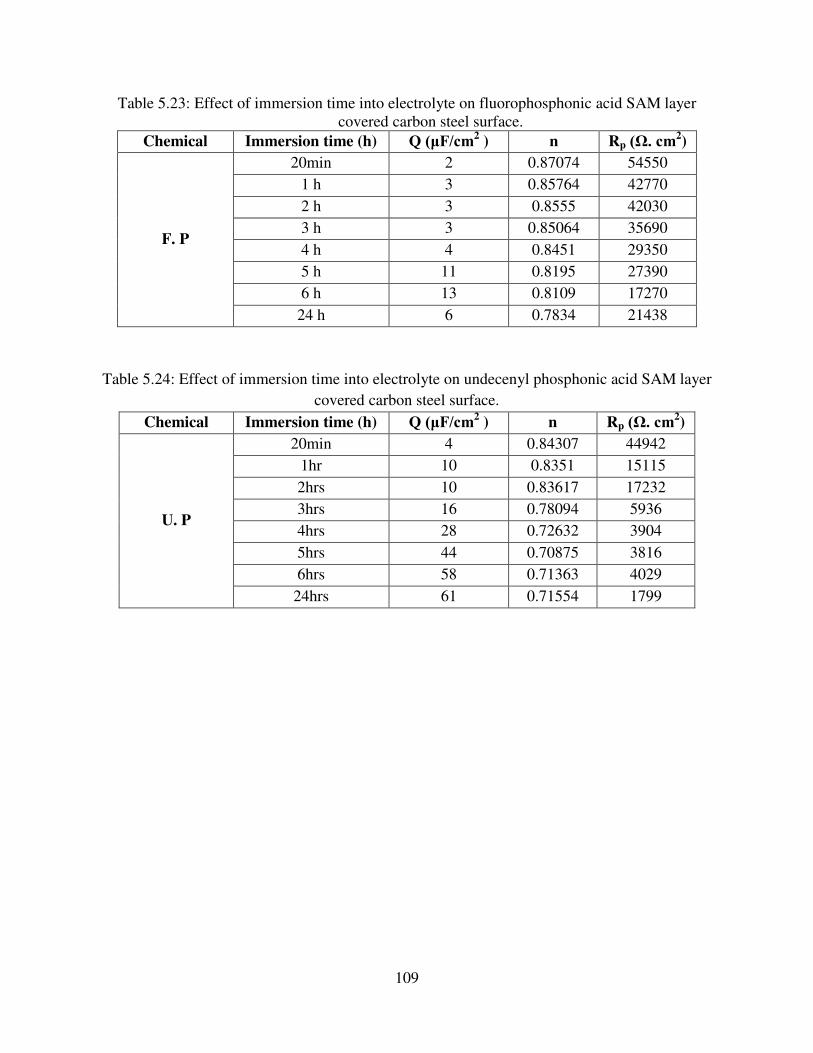
109
Table 5.23: Effect of immersion time into electrolyte on fluorophosphonic acid SAM layer covered carbon steel surface.
Chemical Immersion time (h) Q (μF/cm2 ) n Rp (Ω. cm2)
F. P
20min 2 0.87074 54550 1 h 3 0.85764 42770 2 h 3 0.8555 42030 3 h 3 0.85064 35690 4 h 4 0.8451 29350 5 h 11 0.8195 27390 6 h 13 0.8109 17270 24 h 6 0.7834 21438
Table 5.24: Effect of immersion time into electrolyte on undecenyl phosphonic acid SAM layer covered carbon steel surface.
Chemical Immersion time (h) Q (μF/cm2 ) n Rp (Ω. cm2)
U. P
20min 4 0.84307 44942 1hr 10 0.8351 15115 2hrs 10 0.83617 17232 3hrs 16 0.78094 5936 4hrs 28 0.72632 3904 5hrs 44 0.70875 3816 6hrs 58 0.71363 4029 24hrs 61 0.71554 1799

110
Chapter Six
6. Summary
6.1 Preparation of SAM layers; amphiphiles and metals
My PhD work was dedicated to the investigation of special self-assembled molecular layers
formed by two phosphonic acid amphiphiles:
Undecenyl phosphonic acid: CH2=CH-(CH2)9-PO(OH)2, that contains a double
bond at the end of the carbon chain;
Fluorophosphonic acid: C6F13–C2H4–PO(OH)2, where the majority of the
hydrogen atoms in the carbon chain is replaced by fluorine atoms.
Parameters influenced the preparation of compact self-assembled molecular layers::
the layer formation time
the amphiphile concentration
In order to compare the influence of the molecular structure on the properties of the deposited
layers, some other amphiphiles were also used in SAM film such as:
- styren-co-styphos acid that had a special structure; when this molecules (like the
other phosphonic amphiphiles) are anchored to the metal surfaces through the
phosphonic head groups, the remarkable polymeric aralkyl chain could form a
hydrophobic net over the metal surface.
- dodecyl and hexadecyl phosphonic acids: The difference in the carbon chain length
increases the hydrophobicity that influences the compactness of a SAM layer.
Metals under investigation
- Iron alloys:
carbon steel, stainless steels 304 and 316 as these are the mostly used iron alloys.
- Aluminum alloy with a small Mg content is also important industrial metal.

111
6.2 Characterization of the SAM layers
The techniques listed below were used for the characterization of the SAM
nanolayers.
6.2.1 Change in the wettability followed by dynamic and static contact angle values
At first the SAM layers formed on metal surfaces were characterized by the changes in the
contact angle/wettability caused by the presence of the nanolayers, due to the different
chemicals, deposition time and the increase in the amphiphile concentration.
The conclusions drawn from the contact angle data are as following:
i. Influence of the layer deposition time: With increasing layer deposition time the
wettability measured in water decreases. On all types of metals, the formation of a very compact
layer needs longer time (around 24 h). But a very long time (around 48 h) does not always
increase the surface hydrophobicity, which could be due to deposition of a second layer (in this
case the outer groups are the hydrophilic phosphonic ones).
ii. Influence of the amphiphile type: Considering the chemicals that formed the
SAM layers, the fluorophosphonic acid produced the most hydrophobic nanolayers on all metals.
This is understandable as the presence of fluorine atoms in the alkyl chain increases the water
repulsive effect significantly. It is clearly demonstrated when I compared the contact angles of
the SAM layers formed by the dodecyl and hexadecyl phophonic acid with that one of
fluorophosphonic acid. The presence of even longer alkyl chains in C12P (the number of carbon
atoms is twelve) and C16P (the number of carbon atoms is sixteen) cannot overcome the
hydrophobicity of fluorophosphonic acid (where the alkyl chain is shorter, the number of carbon
atoms in the backbone is eight) SAM layers. The wettability value of the styren-co-styphos acid
SAM nanofilms was between those values produced by the undecenyl and fluorophosphonic acid
nanolayers. The undecenyl phosphonic acid amphiphile does not produce as hydrophobic surface
as the fluorophosphonic acid. The contact angle data clearly proved that the undecenyl
amphiphile cannot form very densely packed nanolayer because of the double bond at the end of

112
the alkenyl chain. It is not striking as a CH2=CH- groups hinder the formation of a well-ordered
molecular structure. The SAM never reaches a very well ordered state, even at longer assembly
time and at higher concentration.
iii. Influence of the amphiphile concentration: Other information derived from the
contact angle measurements is that the increase in the concentration of the amphiphiles (from
where the deposition of nanolayer happens) results in lower water wettability, which means that
the metal surface turned to be more hydrophobic. It is also important to mention that the
increasing immersion time has more significant impact on the contact angle values than the
increase in the concentration. In a shorter time the amphiphilic molecules start to cover the metal
surface and the layer does not cover fully the solid, though the surface is more hydrophobic than
the bare metal. At higher concentration (and at longer deposition time) the SAM layer islands
grow together and cover homogeneously the metal surface.
iv. Analysis of the advancing an receding contact angle values after multiple
dipping: The layer compactness was characterized by the change in the advancing and receding
contact angle values after several dipping of the coated metal samples into water. In case of
amphiphiles like the undecenyl phosphonic acid the compactness of the SAM layer never reaches
a very well ordered state, even at longer assembly time and at higher amphiphile concentration. It
is reflected in the differences between the advancing and receding contact angle values. After the
second, third etc. immersion, both the advancing and the receding contact angle values decreased,
which is the consequence of the non-ideal ordering of the molecules in the nanolayer.
v. Influence of the post-treatment of the undecenyl phosphonic acid SAM layer:
When the SAM nanolayers of the undecenyl phospohonic acid were modified via external
actions, i.e. by illumination with UV light and irradiation by 60CO–gamma ray, according to the
wettability of the coated surfaces, the original undecenyl SAM films were converted into a more
compact ones as not only the advancing but the receding contact angle values increased. The two
different influences were supposed to interact with the double bonds at the SAM surface. These
modifications were supposed to change the hydrophobicity i.e. the compactness of the nanofilms.
The illumination by UV light increased the contact angle (i.e. the SAM layer turned to be more

113
compact) especially when it was used for longer time. The irradiation with 2kGy could less
interfere with the nanolayers, but the 10-times stronger irradiation (20kGy) modified already the
coating surface wettability significantly causing a film with much higher hydrophobicity. The
altered structures were investigated by infrared spectroscopy. The results confirmed the change in
the structure of the post-treated surface in both cases. The increase in the compactness of the
nanofilms is important from the point of view of application possibilities of this type of coatings
(e.g. as anticorrosion layers). The influence of the post-treatment was evidenced by other
techniques (AFM, IR), too.
i. Influence of metals: There were significant differences in the surface
hydrophobicity measured on certain metals covered by the same amphiphilic SAM. The highest
contact angle values, so-called superhydrophobic surfaces were produced on aluminum by SAM
layers built of the undecenyl- and fluorophosphonic acids as well as of the styren-co-styphos
acid. These layers were not “destroyed” by further dipping into water, which is due to the very
compact oxide layer on the aluminum surface whereto the phosphonic groups could anchor; and
the result was a high density of the amphiphile on the metal surface. The second highest
hydrophobic value was measured on the stainless steel 304. The difference in the wettability of
SAM layer-covered stainless steel 304 and 316 is due to the presence of the molybdenum, which
is present (though in small concentration) in the stainless steel 316; it disturbs the homogeneity of
the surface oxide layer whereto the phosphonic groups are attached.
ii. Influence of the surface roughness on the SAM layer formation: The impact of
the roughness factor showed that the SAMs on rougher surface behave interestingly. The wetting
behavior of undecenyl nanolayers differed from the characteristic of the nanolayer formed from
fluorophosphonic acid amphiphile: generally, on smooth metal surfaces always the
fluorophosphonic molecules produce more hydrophobic coating (under identical conditions). On
rougher surface the undecenyl amphiphile produced more hydrophobic layer, which is due to the
structure of this molecule (double bond at the end of the alkenyl chain). This molecular part could
support the retention of air bubbles near to the solid surface. This is clearly shown by the
behavior of the bare metal. The increasing smoothness on the surface allowed the formation of

114
more compact film of the fluoro amphiphilic molecule; the undecenyl one on smoother surface
produced less hydrophobic surface due to the molecular structure.
iii. Influence of the post-treatment on the undecenyl amphiphile SAM layer: The
molecular structure of the undecenyl phosphonic acid SAM layers was altered via illumination
with UV light and by irradiation by 60Co-gamma ray. The two different influences were supposed
to interact with the double bonds at the SAM surface producing a polymer network which should
result in a more compact nanofilm. The illumination by UV light increased the contact angle (i.e.
the SAM layer turned to be more hydrophobic) especially when it was used for longer time. The
irradiation with 2kGy could less interfere with the nanolayer, but the 10-times stronger irradiation
(20kGy) modified already the coating surface significantly causing a film with much higher
hydrophobicity. The altered structures were investigated by XPS technique and infrared
spectroscopy and in both cases the preliminary results confirmed the change in the structure of
the post-treated surface. This was important from the point of view of anticorrosion activity (as
the AFM measurements proved).
6.2.2 Visualization of surface morphology of SAM nanolayer coated metal surfaces
on air and in corrosive environment
The contact angle values characterized the change in the wettability of SAM layers of different
amphiphiles deposited onto several metal surfaces, under different deposition conditions.
Subsequent methods were used to demonstrate the preparation-dependent change in the surface
morphology and, additionally, their influence on the anticorrosion activity of the SAM layers.
The AFM technique allowed the presentation of the change in the surface morphology of
different metals caused by the coatings as well as by the illumination/irradiation. All results were
demonstrated by 3D imaging, by section analysis and by roughness parameters, too.
The SAM nanofilm behaviors were characterized in the case of two types of corrosion: the
general corrosion measurements were carried out in aerated sodium perchlorate and the pitting
corrosion in sodium chloride solution.

115
i. Influence of the SAM layers on the general corrosion
The immersion of uncoated sample in perchlorate solution resulted in rough surface. This was
especially visible on aluminum surface. But both amphiphile under investigation could
effectively control the general corrosion. The fluorophosphonic SAM nanolayer was more
effective, it did not allow approaching the aerated electrolyte to the metal surface and so, the
corrosion was efficiently inhibited. The diminution of general corrosion was demonstrated by 3D
images and characterized numerically by section analysis.
ii. Influence of the SAM layers on the pitting corrosion
The sodium chloride electrolyte causes pitting corrosion. The question arose: can these SAM
layers control only the general corrosion or they are active against the pit formation. The pitting
inhibition activities of both SAM amphiphiles were checked on different metals. It was clearly
demonstrated that the metal surfaces without coatings suffered pitting corrosion. The fluoro
amphiphile SAM-covered solids were almost intact on carbon steel and on aluminum. Important
to mention, that this layer could control the pit formation, even in case of short layer formation
time. The undecenyl nanolayer was less active but it also decreased the pitting corrosion. It was
proved not only by the 3D images but by the section analysis: the deepness of the pits informs us
about the seriousness of corrosive effect.
iii. Anticorrosion effectiveness of the post-treated undecenyl amphiphile in SAM
nanolayer
The same technique, i.e. the AFM proved the usefulness of the irradiation: the SAM covered
metal surface built from undecenyl phosphonic acid either after UV treatment or after irradiation
can much better control the pit formation even at lower irradiation (2kGy); but the efficiency of
the post-treated nanofilms are much better after 20 kGy irradiation. The chloride ions cannot
destroy the surfaces, it stayed very smooth.
iv. Change in roughness parameters measured on surfaces without and with
coatings, before and after corrosion tests
The AFM software furnishes three different roughness parameters (Rq: rout mean square
roughness, Ra: roughness average, Rmax: maximum height of the profile) on the visualized

116
surfaces. All these numbers unequivocally showed that the nanocoatings decreased the surface
roughness. Both electrolytes caused significant increase in the roughness parameters on uncoated
metals. The presence of SAM nanolayers decreased the roughness parameters not only before,
but after immersion into the both electrolytes. The highest decrease was achieved when the
undecenyl SAM layer was irradiated by 20kGy and then immersed into the chloride solution.
6.2.3 Demonstration of the anticorrosion activity of SAM-coated metal surfaces by
electrochemical techniques
Potentiodynamic measurement and electrochemical impedance spectroscopy helped in the
characterization of the anticorrosion activity of the SAM layers. The first type of measurement
informed me about the type of corrosion (anodic or cathodic inhibition). The EIS could answer
the question how the layers control the corrosive deterioration (inhibition of charge transfer).
The influence of the layer formation time on the corrosion inhibitive efficacy was demonstrated
by both electrochemical measurements and proved that with increasing layer formation time
the anticorrosion efficiency increased. In the case of fluorophosphonic amphiphile coating the
anticorrosion efficiency reaches already very high value when the layer formation time is shorter
(2 h). At the undecenyl phosphonic acid the time-dependent increase in the corrosion inhibiting
efficacy is slower; to get a more effective anticorrosion nanocoating needs longer time.
According to the Tafel curves, at both SAM layers the Ecorr values shifted into the positive
direction and the anodic current decreased indicating that these nanofilms control the metal
dissolution, they behave like anodic inhibitors. According to the EIS results the increased
anticorrosion effectiveness of the layers are due to increase in the polarization resistance of the
nanolayers.
I have found an interesting relationship between the layer formation time and the efficiency:
both amphiphiles follow Langmuir-type correlation (generally not the layer formation time, but
the concentration is correlated with the efficiency in Langmuir isotherm). The undecenyl
phosphonic acid adsorption takes more time (as it was already shown by other techniques). The
Langmuir-type correlation was confirmed by the graph when the layer formation time/surface

117
coverage was depicted as a function of the layer formation time. At both SAM layers it gave
straight lines proving the validity of the Langmuir correlation.
When the pH of electrolyte was changed, both electrochemical techniques proved that the
efficiency of either SAM layers is pH-dependent. At low pH values these SAM film cannot
control the corrosion, the metal dissolution increases. The explanation could be that the head
group structure of both amphiphiles in SAM films changes in acidic solution and occupies
smaller place because of their pK values, and the so-called tridentate bonding (which is effectual
for the SAM layer formation) is altered to di- and mono-dentate bonding. So, more free locations
are available for the deteriorating aqueous solvent components and, as a consequence, for the
metal dissolution. Around neutral pH values and above them the corrosion current decreases
drastically, i.e. the anticorrosion effect increases. Both the electrochemical impedance
spectroscopy and the potentiodynamic technique gave similar results. When the layer
formation time increased, the anticorrosion efficacy increased. A saturation type correlation was
found between the layer formation time and the polarization resistance values.

118
References 1. H. Amar, J. Benzakour, A. Derja, D. Villemin, B. Moreau,J. of Electroanal. Chem., 2003,
558, 131. Plenum Press, New York, London, 1996. 2. Denny A. Jones, Principles and prevention of corrosion of Macmillan, Inc, 2nd ed. 1992, P
4-14, 143- 161. 3. E. Heitz, R. Henkhaus and A. Rahmel, Corrosion Science, Ellis Horwood lim. 1992, 13,
57-68, 127-130. 4. J. Telegdi, T. Szabó, L. Románszki, M., Handbook of smart coatings for materials
protection Cambridge, Woodhead Ltd, 2014, P 135-182. 5. Atkins, P. de Paula, J. Physical Chemistry for the Life Sciences, Oxford University (2006)
209-225. 6. Abdulmajed Alagta, Ilona Felhösi, Imre Bertoti, Erika Kálmán, Corrosion Science 50
(2008) P 1644-169. 7. A.Paszternák, I.Felhősi, Z.Pászti, E.Kuzmann, A.Vértes, E.Kálmán, L.Nyikos,
Electrochimica Acta, 55( 2010) P 804-812. 8. M. Prabakaran, M. Venkatesh, S. Ramesh, V. Periasamy, Applied Surface Science 276
(2013) P592– 603. 9. Ilona Felhősi, Erika Kálmán, Corrosion Science 47 (β00η) P θλη–708. 10. Adam Winkleman, Erik B. Svedberg, Robert E. Schafrik, David J. Duquette, Advanced
material and processes (2011) 26-31. 11. J. Bockris, D. Drazic and A. Despuc, Electrochim. Acta, 4 (1961) 325. 12. W. Lorenz and F. Eichhorm, J. Electrochem. Soc., 12 (1965) 1255. 13. R. Guzman, J. Vilche and A. Arvia, Electrochim. Acta, 24 (1979) 395. 14. M. Fontana, Corrosion Engineering, 3rd ed. Mc Graw Hill Book Company, New York,
1986. 15. H. Uhlig and R. Revie, Corrosion and Corrosion Control, 3rd ed. John Wiley & Sons,
New York, 1985. 16. P. Lobeer and W. Lorenz, Electrochim. Acta, 25 (1980) 375. 17. S. Turgoose, Chemical Inhibitors for Corrosion Control, Royal Society of Chemistry,
England, B. G. Gluby (Ed), 1990. 18. M. Nagayama and J. Cohen, J. Electrochem. Soc. 110 (1963) 670. 19. Camila G. Dariva and Alexandre F. Galio, Corrosion Inhibitors - Principles, Mechanisms
and Applications, http://dx.doi.org/10.5772/57255. 20. M Lakatos-Varsányi, M. Furko, T. Pozman: Electrochemical impedance spectroscopy
study on silver coated metallic implants, electrochimca Acta 56 (23) (2011) 7787-7795. 21. M Furko, M Lakatos-Varsányi, C Balázsi: Comparative corrosion study on silver coated
metallic implants, 9th Hungarian Conference on Materials Science. October 13-15, 2013, Balatonkenese, Hungary, 812 (2015) 327-332.
22. A. Shaban, E. Kálmán and I. Biczo, Corrosion Science, 35, (1993) 1463-1470. 23. H. Amar , A. Tounsi, A. Makayssi, A. Derja, J. Benzakour, A. Outzourhit, Corrosion
Science 49 (2007) 2936–2945 24. W. J. Lorenz and F. Mansfeld, Electrochimica Acta, 31(1986) 467-476. 25. R. Laamari, J. Benzakour, F. Berrekhis, A. Abouelfida, A. Derja, D. Villemin, Arabian
Journal of Chemistry, 4 (2011) 271-277.

119
26. M. Prabakaran, S. Ramesh Email author , V. Periasamy, Research on Chemical Intermediates 39 ( 2013) 3507–3524.
27. S. Ramesh, S. Rajeswari, S. Maruthamuthu, Materials Letters, 57 (2003) 4547– 4554 28. H. Amar, T. Braisaz, D. Villemin, B. Moreau, Materials Chemistry and Physics, 110
(2008) 1–6 29. R. S. Abdel Hameed, Abd-Alhakeem, H. Abu-Nawwasb, and H. A. Shehata, Advances in
Applied Science Research, 4 (2013) 126-129. 30. X. H. To, N. Pebere, N. Pelaprat , B. Boutevin, and Y. Hervaud, Corrosion Science, 39
(1997) 1925-1934. 31. A. Paszternak, S. Stichleutner, I. Felhősi, Z. Keresztes, F. Nagy, E. Kuzmann, A. Vertes ,
Z. Homonnay, G. Pető, E. Kálmán, Electrochimica Acta, ηγ (β007) γγ7–345. 32. E. Kálmán, I. Felhősi, F. H. Kármán, I. Lukovits, J. Telegdi and G. Pálinkás, Corrosion
and Environmental Degradation, 1 (2000) 472-537. 33. T. Abohalguma, W. Bin Ziglam, and N. Elahresh, F. Elshawesh, Effect of Chloride and
Sulfate Ions on the Performance of Sodium Nitrite Inhibitor, EUROCORR 2003, 29 Sep.-2 Oct. 2003, Budapest- Hungary.
34. J. Telegdi, E. Kálmán, F. H. Kármán, Corrosion Science, 33 (1992) 1099-1103. 35. E. Kálmán, I. Lukovits, G. Pálinkás, F. H. Kármán, J. Telegdi, Corrosion 92 Vol. II.
(1992) 531-536. 36. J. Telegdi, International Journal of Corrosion and Scale Inhibition 5(2) (2016) 183–189. 37. J. Telegdi, M.M. Shaglouf, A. Shaban, F.H. Kármán, I. Betróti, M. Mohai, E. Kálmán,
Electrochimica Acta 46 (2001) 3791–3799. 38. R. Touira, N. Dkhireche, M. Ebn Touhami, M. Sfaira, O. Senhaji, J.J. Robin, B. Boutevin,
M. Cherkaoui, Materials Chemistry and Physics 122 (2010) 1–9. 39. Najoua Labjara, Mounim Lebrini, Fouad Bentiss, Nour-Eddine Chihib, Souad El Hajjaji,
Charafeddine Jama, Materials Chemistry and Physics 119 (2010) 330–336. 40. Ilona Felhosi, Judit Telegdi, Gábor Pálinkás, Erika Kálmán, Electrochimica Acta 47
(2002) 2335- 2340. 41. D.L. Allara, R.G. Nuzzo, Spontaneously organized molecular assemblies 1. Langmuir,
1(1985) 45-52. 42. L. Allara, R.G. Nuzzo, Spontaneously organized molecular assemblies 2. Langmuir,
1(1985) 52-66. 43. Evelin Jaehne, Sonia Oberoi, Hans-Juergen P. Adler, Progress in Organic Coatings 61
(2008) 211-223. 44. E. Hoque, J.A. DeRose, B. Bhushan, K.W. Hipps, Ultramicroscopy 109 (2009) 1015-
1022 45. A. Cattani-Scholz, Functional Organophosphonate Interfaces for Nanotechnology: A
Review; ACS Appl. Mater. Interfaces, 9(31) (2017) 25643-25655. 46. Min Soo Lim, Katelyn J. Smiley, Ellen S. Gawalt; Amphiphiles, Molecular Assembly and
Applications, American Chemical Society, Vol. 1070 (2011) 193–204. 47. Doudevski, I.; Schwartz, D. K., Langmuir 16 (2000) 9381–9384. 48. Nie, H.-Y.; Miller, D. J.; Francis, J. T.; Walzak, M. J.; McIntyre, N. S. Robust, Langmuir,
21 (2005) 2773–2778. 49. Aparna Raman, Manish Dubey, Irina Gouzman, Ellen S. Gawalt, Langmuir, 22 (15)
(2006) 6469–6472. 50. Medea Kosian, M.M. J. Smulders, Han Zuilhof, Langmuir, 32 (2016) 1047-1057.

120
51. Min Soo Lim, Katelyn J. Smiley1, Ellen S. Gawalt, Molecular Assembly and Applications, American Chemical Society, Vol. 1070 2011.
52. J. Bockris, D. Drazic and A. Despuc, Electrochimica Acta, 4 (1961) 325. 53. Faraj Al-Taher, Judit Telegdi, Erika Kálmán, Colloids and Surfaces A Physicochemical
and Engineering Aspects 321(1) (2008) 34-38. 54. E. Hoque, J.A. DeRose, B. Bhushan, K.W. Hipps, Ultramicroscop, 109 (2009) 1015-
1022. 55. Maxisch, Michael; Thissen, Peter; Giza, Miroslaw; Langmuir, 27(10) (2011) 6042-6048. 56. Ruohan Zhao, Patrick Rupper, ID and Sabyasachi Gaan, Coatings, 7 (2017) 133. 57. Sang, Lingzi; Knesting, Kristina M.; Bulusu, Anuradha, Applied Surface Science, 389
(2016) 190-198. 58. Chul Soon Park, Han Ju Lee, Dahye Lee, Andrew C. Jamison, Eduard Galstyan, Wanda
Zagozdzon-Wosik, Herbert C. Freyhardt, Allan J. Jacobson, and T. Randall Lee, Langmuir, 32 (34) (2016) 8623–8630.
59. Ma, Hong; Acton, Orb; Hutchins, Daniel O, Physical Chemistry Chemical Physics, 14(41) (2012) 14110-14126.
60. W. A. Zisman, Adv. Chem. Ser., (1964) 34. 61. E. Jaehne, S. Oberoi and H.-J. P. Adler, Progress in Organic Coatings, 61 (2008) 211. 62. Yu. I. Kuznetsov, Bull. Electrochimica Acta, 6 (1990) 571. 63. Costa, J.M. and A.D. Mercer, Progress in the Understanding and Prevention of Corrosion,
Institute of Materials, London, Vol. 1(1993) 844. 64. Y. I. Kuznetsov, Organic inhibitors of corrosion of metals, J. G. N. Thomas, Plenum
Press, New York, London, 1996 65. H. N. Shubha, T. V. Venkatesha, K. Vathsala, M. K. Pavitra, and M. K. Punith Kumar,
ACS Applied Materials Interfaces, 5 (21) (2013) 10738–10744. 66. V. Kaganer, H. Möhwald, P. Dutta, Rev. Mod. Phys., 71 (1999) 779 67. G. Gaines; Insoluble Monolayers at Liquid-Gas Interfaces, Interscience, New York,
1966. 68. A. Ulman, An Introduction to Ultrathin Organic Films: From Langmuir-Blodgett to Self-
Assembly, Academic Press, San Diego, USA, 1991. 69. J. Telegdi, T. Rigó, É. Pfeifer, T. Keszthelyi, E. Kálmán, Progress in Colloid & Polymer
Science, 135 (2008) 77- 86. 70. N. L. Abbott, J. P. Folkers, and G. M. Whitesides, Science, 257 (1992) 1380–1382. 71. Aparna Raman and Ellen S. Gawalt, Langmuir, 23 (2007) 2284-2288. 72. Aparna Raman, Manish Dubey, Irina Gouzman, Ellen S. Gawalt, Langmuir, 22 (2006)
6469-6472. 73. M. Volmer, M. Stratmann, and H. Viefhaus, Surf. Interface Anal., 16, (1990) 278–282. 74. Van Alsten, JG; Self-assembled monolayers on engineering metals: Langmuir, 15(22)
(1999) 7605-7614. 75. Gao W, Dickinson L, Grozinger C, Morin FG, Reven L, Langmuir, 12 (1996) 6429–6435. 76. T. Rigó, A. Mikó, J. Telegdi, M. Lakatos-Varsányi, A. Shaban, E. Kálmán,
Electrochemical and Solid State Letters, 8(10) (2005) B51-B54. 77. J. Telegdi, T. Rigó, J. Beczner, E. Kálmán, Surface Engineering, 21(2) (2005) 107-112. 78. Filiberto Mastrangelo, Giulia Fioravanti, Raimondo Quaresima, Raffaele Vinci, Enrico
Gherlone, Biomaterials and Nanobiotechnology, 2 (2011) 533-543. 79. R. Pericet‐Camara, C. L. Moraila‐Martínez, M. A. Rodríguez‐Valverde, M. Cabrerizo‐
Vílchez, https://www.researchgate.net/publication/283413453

121
80. Y. Yuan, T. R. Lee, Surface Science Techniques, Springer Series in Surface Sciences 51 (2013) 3-34.
81. Amer Al-Shareef, P. Neogi, Baojun Bai, Chemical Engineering Science, 9 (2013) 113-117.
82. Zs. Keresztes, T. Rigó, J. Telegdi, E. Kálmán, Applied Physics, A 72 (2001) S113-S116. 83. Schematic representation of the AFM set-up (http://web.mit.edu/cortiz/www) 84. F. A. Settle, Handbook of instrumental techniques for analytical chemistry, Upper Saddle
River, NJ, Hall PTR, 1997. 85. Schematic of Michelson Interferometer https://www.researchgate.net/figure/ Schematic-
figure-of-Michelson-interferometer_fig1_306050242 86. John N. Murray, Progress in Organic Coatings, 31 (1997) 375–391. 87. J. Genescaa, J. Mendozab, R. Duranb and E. Garciab, Conference: Proceeding of the 15th
International Corrosion Congress, Granada –Spain, September 2002. 88. F. H. Kármán, I. Felhősi, E. Kálmán, I. Cserny, L. Kövér, Electrochimica Acta. 4γ (1λλ8)
69-75. 89. Amel Delimi, Elisabeth Galopin, Yannick Coffinier, Marcin Pisarek, Rabah Boukherroub,
Brahim Talhi, Sabine Szunerits, Surface & Coatings Technology, 205 (2011) 4011–4017. 90. W.M. Bos, Prediction of coatingt durability, Early detection using electrochemical
methods, PhD Thesis TU Delft, The Netherlands, 2008. 91. M. Kendig, J. Scully, Corrosion, NACE, January 1990. 92. Digby D. Macdonald, Electrochimica Acta, 35(10) (1990) 1509-1525. 93. Robert J. Silbey, Robert A. Alberty, Moungi Gabriel Bawendi, Physical Chemistry,
Wiley, 2005. 94. K. de Weldige, M. Rohwerder, E. Vago, H. Viefhaus, M. Stratmann, Fresenius, Journal
of Analytical Chemistry, 353, ( 3–4) (1995) 329–332 95. Peter Atkins, Julio de Paula, and James Keeler, Physical Chemistry, 1 (2018) 1104 ISBN:
9780198817895 96. 1S.Alexandar,M.Pharm, Adsorption pharmaceutical analysis Pin:636008
https://www.slideshare.net/alexmpharm/adsorption-pharmaceutical-analysis. 97. H.Y. Erbil, Advances in Colloid and Interface Science, 170(1-2) (2012) 67-86. 98. Masayo Miyama, Yanxia Yang, Takeshi Yasuda, Tsumuko Okuno, and Hirotsugu K.
Yasuda, Langmuir, 13(20) (1997) 5494–5503. 99. A. Zarrouk, H. Zarrok, R. Salghi, N. Bouroumane, B. Hammouti, S. S. Al-Deyab,
R.Touzani, Results in Physics 8 (2018) 172-179. 100. S.C. D’Andrea, A.Y. Fadeev, Langmuir, 1λ (β00γ) 7λ04. 101. Regina Luschtinetz, A. F. O. Surface Science, 602 (2008) 1347. 102. Quiñones, R.; Raman, A.; Gawalt, E. S. Thin Solid Films, 516 (2008) 8774. 103. Vallant, T.; Brunner, H.; Mayer, U.; Hoffmann, H. Langmuir, 14 (1998) 5826. 104. Nakamoto, T.; Katada, M.; Endo, K.; Sano, H. Polyhedron, 17 (1998) 3507. 105. Valiyaveettil, S.; Enkelmann, V.; Müllen, K. J. Chem. Soc. Chem. Commun., 18 (1994)
2097 106. Foster, T. T.; Alexander, M. R.; Leggett, G. J.; McAlpine, E. Langmuir, 22 (2006) 9254. 107. Onda, T., Shibuichi, S., Satoh, N., Tsuji, K. Langmuir, 12 (9) (1996) 2125–2127. 108. Onda, T., Satoh, N., Tsujii, Phys. Chem. 100 (50) (1996) 19512–19517. 109. Y. Zuo, H. Wang, J. Xiong, Corrosion Science, 44 (2002) 25-35. 110. T. Suter, Y. Muller, P. Schmutz, O. von Trzebiatowski, Adv. Eng. Mater., 7 (2005) 339-
348.
122
111. G.T: Burstein, P.C: Pistorius, Corrosion Science, 51 (1995) 380-385. 112. P.C. Pistorius, G. T. Burstein, Corrosion Science, 33 (1992) 1885-1897. 113. R. G. Snyder, S. L. Hsu, and S. Krimm, Spectrochimica Acta, 34 (4) (1978) 395–406. 114. R. B. Viana, A. B. F. da Silva, A. S. Pimentel, Advances in Physical Chemistry, 2012, ID
903272, 14 pages doi:10.1155/2012/903272 115. R.B. Alvares, H.J. Martin, M.F. Horstemeyer, Science, 52 (2010) 1635-1648.

123
- Thesis points
1. I demonstrated that the time of layer formation had a major influence on the performance
of the coated surface and it has a more decisive impact on the nanolayer structure than the
increase in the amphiphile concentration. (T. Abohalkuma, F. Shawish, J. Telegdi;
“Phosphonic acid derivatives in self assembled layers against metal corrosion”
International Journal of Corrosion and Scale Inhibition 3(3) (2014) 151-159).
2. I have proven by contact angle values as well as by the decreased anticorrosion activity
that the double bond in the undecenyl phosphonic acid nanolyer disturbs the SAM layer
structure. These amphiphilic molecules in SAM layers were less active than that of the
fluorophospohonic amphiphile. This is due to the less ordered structure in the case of the
undecenyl amphiphile. At the same time, the influence of hydrophobic fluorine atoms in
the amphiphile on the increased hydrophobicity was demonstrated, which resulted in a
very condensed molecular layer that was correlated with the very effective corrosion
inhibition. (Talah Abohalkuma, Abdul Shaban, Judit Telegdi “Corrosion Processes
Controlled by Phosphonic Acid Nano-layers” Periodica Polytechnica Chemical
Engineering 60(3), 165-168, (2016) DOI: 10.3311/PPch.8260).
3. In case of the undecenyl phosphonic acid SAM layer, (which has a less ordered structure
and, as a consequence, it can control the corrosion processes with less activity,) I was who
first modified the SAM layer by post-treatments (by illumination and irradiation); both
types of handlings changed not only the surface wettability (because of the
polymerization of the double bonds in the nanolayer), but the anticorrosion efficacy was
also significantly increased. In the case of the UV light a longer-time treatment (1 h)
could successfully modify the layer structure. As to the irradiation, already β kGy of -ray
altered the structure of the nanofilm that resulted in an increased prevention of the metal
surface against the pitting corrosion; a much higher dose (20 kGy) produced already a
compact nanolyer that was effective against the general and the pitting corrosion. . (J.
Telegdi and T. Abohalkuma, “Influence of the nanolayer’ post-treatment on the

124
anticorrosion activity”, International Journal of Corrosion and Scale Inhibition, 7 (3)
352–365 (2018) DOI: 10.17675/2305-6894-2018-7-3-6).
4. The importance of the oxide layer was demonstrated in my work. It was proven that an
increased oxide layer thickness on aluminum adsorbs the phosphonic acid amphiphiles
more effectively than a thinner one like in the case of the carbon steel oxide layer. On the
other hand, I have shown the importance of the alloying elements on the surface
characteristics: the different wettability of the two stainless steels (304 and 3016) was
confirmed with the differences in the surface oxide layer composition. (Judit Telegdi,
Giorgio Luciano, Soumitro Mahantry, Talah Abohalkuma, “Inhibition of aluminum
alloy corrosion in electrolytes by self assembled fluorophosphonic acid molecular layer”
Materials and Corrosion, 67(10) 1027-1033 (2016) DOI: 10.1002/maco.201508304).
5. I proved that the SAM layers formed by fluorophosphonic acid show anticorrosion
performance towards both general and pitting corrosion while those formed by undecenyl
phosphonic acid are active mainly against the general corrosion. (Tala
Abohalkuma, Judit Telegdi “Corrosion protection of carbon steel by special phosphonic
acid nano-layers” Materials and Corrosion 66(12) 1382-1390 (2015) DOI:
10.1002/maco.201508304).
6. On the basis of electrochemical results, I have found special correlation between the layer
formation time and the anticorrosion activity, which follows Langmuir-type adsorption; in
my case, instead of the amphiphile concentration, the layer formation time and the
anticorrosion activity is correlated. . (J. Telegdi and T. Abohalkuma, “Influence of the
nanolayer’ post-treatment on the anticorrosion activity”, International Journal of
Corrosion and Scale Inhibition, 7 (3) 352–365 (2018) DOI: 10.17675/2305-6894-2018-7-
3-6).
7. The importance of the environmental pH was demonstrated and explained: the SAM layer
formed at 24h by fluorophosphonic acid and by undecenyl phosphonic acid could not
keep their anticorrosion activity at pH=3, but these layers are very active at neutral and

125
alkali pH values in inhibiting the metal dissolution. I explained the decreased efficiency
by the change in the head group structure. (J. Telegdi and T. Abohalkuma, “Influence of
the nanolayer’ post-treatment on the anticorrosion activity”, International Journal of
Corrosion and Scale Inhibition, 7 (3) 352–365 (2018) DOI: 10.17675/2305-6894-2018-7-
3-6).

126
- Publications
i. Journal papers:
1. T. Abohalkuma, F. Shawish, J. Telegdi “Phosphonic acid derivatives in self assembled
layers against metal corrosion” International Journal of Corrosion and Scale Inhibition
3(3) (2014) 151-159.
Cited by
i. F. Bolzoni, A. Brenna, G. Fumagalli, S. Goidanich, L. Lazzari, M. Ormellese and MP.
Pedeferri, “Experiences on corrosion inhibitors for reinforced concrete”, International
Journal of Corrosion and Scale Inhibition, 2014 (3) 254–278. DOI: 10.17675/2305-6894-
2014-3-4-254-278.
ii. Yu.I. Kuznetsov, A.A. Chirkunov, A.S. Gorbachev and N.P. Andreeva, “Passivation of
mild steel by sodium octylphosphonate in neutral aqueous solution” International Journal
of Corrosion and Scale Inhibition, 2017 (3) 318–332, DOI: 10.17675/2305-6894-2014-3-
3-151-159.
ii. iii. Yu. I. Kuznetsov, G. V. Red’kina, N. P. Andreev “Adsorption from Neutral
Solutions of Sodium Alkyl Phosphonates on Zinc and its Passivation”, Russian Journal of
Physical Chemistry A, 2018, 92 (12) 2548–2555.
iii. iv. Yu. I. Kuznetsov, A. M. Semiletov, A. A. Chirkunov, I. A. Arkhipushkin, L. P.
Kazanskii, N. P. Andreeva, “Protecting Aluminum from Atmospheric Corrosion via
Surface Hydrophobization with Stearic Acid and Trialkoxysilanes”, Russian Journal of
Physical Chemistry A, 2018, 92 (4) 621–629.
2. Tala Abohalkuma, Judit Telegdi “Corrosion protection of carbon steel by special
phosphonic acid nano-layers” Materials and Corrosion, 66(12) 1382-1390 (2015) DOI:
10.1002/maco.201508304
IF: 1.37

127
Cited by
i. M. Yuan, I. Tanabe, Jean-Marie Bernard-Schaaf a, Q-Y. Shi, V. Schlegel, R.
Schurhammer, P. A. Dowben, B. Doudin, L. Routaboul, and P. Braunstein, “Influence
of steric hindrance on the molecular packing and the anchoring of quinonoid zwitterions
on gold surfaces”, New Journal of Chemistry, 2016 (40) 5782- 5796 ,
DOI: 10.1039/C5NJ03251B.
ii. Y. Huang,Y. Xu,B. Li,L. Ying,F. Yang &X. Wang, “Novel electrical resistance
method to measure underdeposit corrosion and its inhibition in pipeline steels”,
Corrosion Engineering , Science and Technology, The Internatial Jornal of
Corrosion Processes and Corrosion Control, 2016 (51) 211- 222,
DOI.org/10.1179/1743278215Y.0000000047.
iii. F Bolzoni, A Brenna, G Fumagalli, S Goidanich, “Experienceon corrosion inhibitors
for reinforced concrete” International Journal of Corrosion and Scale Inhibition,
February 13, 2017. DOI: 10.17675/2305-6894-2017-6-1-5. Int. J.
iv. Charlotte M. Sevrain, Mathieu Berchel, Hélène Couthon, Paul-Alain Jaffrès,
“Phosphonic acidμ preparation and applications”; Beilstein Journal of Organic
Chemistry, 2017 (13) 2186–2213. DOI:10.3762/bjoc.13.219.
v. Valbonë V. Mehmeti and Avni R. Berisha “Aqueous Sulfuric Acid Solution Using 4-
Methyl-4H-1,2,4 Triazole-3-Thiol and 2-Mercaptonicotinic Acid—An Experimental
and Theoretical Study” Frontier in Chemistry, DOI: 10.3389/fchem.2017.00061.
vi. V. Mehmeti, K. Kalcher, F. Podvorica, A. Berisha, “Corrosion Inhibition of Mild
Steel in Aqueous Sulfuric Acid Solution Using Heterocyclic Mercapto Compounds-
an Experimental and Theoretical Study”, Radiation and Applications, rad-journal.org,
2017 (2) 41–45, DOI: 10.21175/RadJ.2017.01.009.
3. Talah Abohalkuma, Abdul Shaban, Judit Telegdi “Corrosion Processes Controlled by
Phosphonic Acid Nano-layers” Periodica Polytechnica Chemical Engineering, 60 (3)
165-168, (2016) DOI: 10.3311/PPch.8260.
IF: 0,13

128
4. Judit Telegdi, Giorgio Luciano, Soumitro Mahantry, Talah Abohalkuma, “Inhibition of aluminum alloy corrosion in electrolytes by self assembled fluorophosphonic acid molecular layer” Materials and Corrosion, 67(10) 1027-1033 (2016) DOI: 10.1002/maco.201508304.
IF: 1.4
Cited by
i. Yu. I. Kuznetsov, “Organic corrosion inhibitorsμ Where are we now? A review. Part
IV. Passivation and the role of mono- and diphosphonates” International Journal of
Corrosion and Scale Inhibition, 2017, 6, 4, 384-427, DOI: 10.17675 / 2305-6894-
2017-6-4-3.
ii. B. Arrotin, J. Delhalle, P. Dubois, L. Mespouille, and Z. Mekhalif, “Electroassisted
Functionalization of Nitinol Surface, a Powerful Strategy for Polymer Coating
through Controlled Radical Surface Initiation”, Langmuir, 2017, 33 (12), 2977–2985,
DOI: 10.1021/acs.langmuir.6b04536.
iii. F. Yang, X. Li, S. Qiu, W. Zheng, H. Zhaoβ, L. Wang, “Water Soluble Trianiline
Containing Polyurethane (TAPU) as an Efficient Corrosion Inhibitor for Mild Steel”,
International Journal of Electrochemical Science, 2017 (12) 5349 – 5362, DOI:
10.20964/2017.06.53.
iv. F. Yang, X. Li, Z. Dai, T. Liu, W. Zheng, H. Zhao, L. Wang, “Corrosion Inhibition of
Polydopamine Nanoparticles on Mild Steel in Hydrochloric Acid Solution”,
International Journal of Electrochemical Science, 2017 (12) 7469 – 7480, DOI:
10.20964/2017.08.52.
5. J. Telegdi and T. Abohalkuma, “Influence of the nanolayer’ post-treatment on the anticorrosion activity”, International Journal of Corrosion and Scale Inhibition, 7 (3) 352–365 (2018) DOI: 10.17675/2305-6894-2018-7-3-6.

129
ii. Conference publication:
Oral presentations
1. T. Abohalkuma, Ahlam BenHamed, Evaluation of four different corrosion inhibitors on mild steel used in cooling systems”, 6th International conference on Technology of Oil and Gas (TOG 2012) , 16 − 18 October 2012, Tripoli, Libya.
2. Talah Abohalkuma, Judit Telegdi “Micro and nano- layers against material
deterioration in aggressive ions environment” COST Action FP 1003: Impact of renewable materials in packaging for sustainability – Development of renewable fibre and bio-based materials for new packaging applications, 24 – 27 September 2013, Budapest- Hungary.
3. T. Abohalkuma and J. Telegdi “Protection of mild steel against corrosion by
flourophosphonic acid and undecenynel phosphonic acid nanolayers”, 14th Conference Day of PhD Students, Veszprém, Hungary, 24th November 2014.
4. Talah Abohalkuma, Judit Telegdi “Corrosion processes controlled by phosphonic
acid nano-layers”, Veszprém, Hungary, April 2015.
5. T. Abohalkuma, J. Telegdi, G. Lucian, A. Shaban “Surface treatment with unusual phosphonic acids”, 7th Kurt-Schwabe-Symposium, University of Applied Science Mittweida/Germany, 4 – 7 September 2016.
6. Telegdi Judit, Tala Abohalkuma, Shaban Abdul “Hogyan befolyásolja az
önszerveződött amfifil molekulák szerkezete a nanorétegek viselkedését?” MTA TTK AKI, Funkcionális Határfelületek Kutatócsoport, Intézeti Szeminárium, Budapest, Hungary, 14th February 2017.
7. Talah Abohalkuma, Abdul Shaban, Judit Telegdi, “Corrosion control by self-
assembled nanolayer coatings” Functional coatings ETCC-303, Amsterdam, The Netherlands, 26- 29 June 2018.
8. Six presentations at the end of each of the first six semesters.
Poster presentations:
1. T. Abohalkuma “Effect of Galvanic Coupling of Metals on Efficiency of Inhibitors in Cooling Systems” EUROCORR 2012, 9-13 September, Istanbul- Turkey.

130
2. T. Abohalkuma and J. Telegdi “Comparative Analysis of Chemicals Used in
Dissolved Form and in Nano-Layer” at the International joint conference on environment and light industry technologies, β1 −ββ- 2012 November, Budapest- Hungary.
3. T. Abohalkuma and J. Telegdi “Micro and nanolayers against material deterioration in aggressive ions environment” Conference of Chemical Engineering days 2013, April 23 − 25, Veszprém, Hungary.
4. T. Abohalkuma and J. Telegdi “Special phosphonic acids used in nanolayers against
corrosion” at the EUROCORR β01γ September 1 - 5, 2013, Estoril, Portugal.
5. T. Abohalkuma, Judit Telegdi “Phosphonic acid derivatives used in self assembled layers against metal corrosion” at the International Joint Conference on Environmental and Light Industry Technologies 20 – 22 November 2013, Budapest, Hungary.
Related Documents