NEIGHBORHOOD BUILT ENVIRONMENT AND TRAJECTORY OF LOWER EXTREMITY FUNCTION AMONG OLDER WOMEN By Corey L. Nagel, MS, MPH, RN A Dissertation Presented to Oregon Health & Science University School of Nursing in partial fulfillment of the requirements of the degree of Doctor of Philosophy

Welcome message from author
This document is posted to help you gain knowledge. Please leave a comment to let me know what you think about it! Share it to your friends and learn new things together.
Transcript
NEIGHBORHOOD BUILT ENVIRONMENT AND
TRAJECTORY OF LOWER EXTREMITY FUNCTION
AMONG OLDER WOMEN
By
Corey L. Nagel, MS, MPH, RN
A Dissertation
Presented to
Oregon Health & Science University
School of Nursing
in partial fulfillment
of the requirements of the degree of
Doctor of Philosophy
ii
Faculty Approval:
___________________________________________________
Deborah Messecar, PhD, MPH, RN, CNS, Dissertation Chair
__________________________________________________
Christopher Lee, PhD, RN, Committee Member
__________________________________________________
Yvonne L. Michael, ScD, SM, Committee Member
__________________________________________________
Chris A. Tanner, RN, PhD, FAAN,
Interim Dean, School of Nursing

iii
Acknowledgement of Financial Support
This study was supported by the John A. Hartford Foundation, Building
Academic Geriatric Nursing Capacity Predoctoral Scholarship.
iv
Acknowledgements
I would like to thank my dissertation committee chair, Dr. Deborah Messecar, for
many years of support, guidance, and friendship during my studies at OHSU. I would like
to thank Dr. Yvonne Michael for generously sharing her time and intellect with me, and
acknowledge the pivotal role that her mentorship has played in my academic and
professional development. I would like to thank Dr. Christopher Lee, for his time,
methodological insight, and clarity of thought. I would also like to thank Dr. Theresa
Harvath for her wisdom and guidance, both during my doctoral studies and as a new
member of the OHSU faculty. I would like to acknowledge Dr. Jason Newsom at
Portland State University for his guidance in formulating the statistical approach used in
this study. Lastly, this study would not have been possible without the work of Vivian
Sui, Mark Bosworth, and the Portland Metro Data Resource Center.
My deepest thanks are for the love, encouragement, and support of my wife,
Dominique, my children, Dominic, Gideon, Ivy, and Delilah, and my mother and father
in-law, Rachel Young and Luis DuBois.
v
Abstract
Background
Among older adults, lower-extremity functional decline is strongly associated with risk of
future disability. Because regular engagement in physical activity is an effective means of
slowing functional decline and preserving functional health, characteristics of the
neighborhood built environment associated with physical activity among older adults
should result in downstream effects on the trajectory of lower extremity functional
decline. However, few studies have explored the relationship between neighborhood built
environment and the trajectory of lower-extremity functional decline, and none have
examined the effect of change in neighborhood built environment over time on physical
function among older adults. The purpose of this study was to describe the association of
objectively measured characteristics of the neighborhood built environment with the
trajectory of lower-extremity function among older women over a 12-year period in
Portland, Oregon.
Methods
This retrospective, cohort study examined the association between objective measures of
neighborhood built environment and gait speed, a widely used measure of lower
extremity function, among a sample of 1256 community-dwelling older women enrolled
in the Portland, Oregon cohort of the Study of Osteoporotic Fractures. Participants‘
baseline visit occurred between 1986 and 1988, and follow-up visits occurred every two
years thereafter. Data from participants first six visits, a follow-up period of
approximately 12 years, were used in this analysis. Measures of the neighborhood built
vi
environment corresponding to the time period of the study were constructed from
historical data in the Regional Land Information System and linked to participants‘
residential addresses using geographic information system technology. Measures of
public transit accessibility, street connectivity, and land-use mix were combined in an
index of neighborhood walkability. Parallel-process, latent growth curve models were
constructed to examine the association of baseline neighborhood walkability with
baseline gait speed, baseline neighborhood walkability with change in gait speed, and
change in neighborhood walkability with change in gait speed. A similar series of models
examined the association of distance to parks/green spaces with gait speed. Models were
adjusted for age, educational attainment, complex comorbidity, incident fracture, and
neighborhood socioeconomic status. A pattern-mixture modeling approach was employed
to adjust for attrition.
Results
Advanced age, lower educational attainment, and the presence of complex comorbidity
were all significantly associated with lower gait speed at baseline. Advanced age was
associated with greater decline in gait speed over time. After controlling for age,
education, complex comorbidity, incident fractures, and neighborhood socioeconomic
status, baseline neighborhood walkability was not significantly associated with baseline
gait speed or change in gait speed over time. There was, however, a statistically
significant association between the slope of neighborhood walkability and the slope of
gait speed (b=.024, p=.020). A one-decile increase in walkability over the study period
was associated with a .024 m/sec reduction in the rate of gait speed decline. There were
vii
no significant associations between neighborhood distance to parks/green space and the
trajectory of gait speed.
Conclusions
This study found that change in neighborhood walkability over time was associated with
the degree of change in gait speed over time. Women who lived in neighborhoods that
became more walkable over the 12-year study period (i.e. increased access to public
transit, more diverse land-use mix, and greater street connectivity) had a reduced rate of
gait speed decline. These findings indicate that characteristics of the neighborhood built
environment are a modifiable determinant of lower-extremity function among older
women, and suggest that efforts to promote pedestrian-friendly urban design may be a
valuable means of reducing disability among older adults.
viii
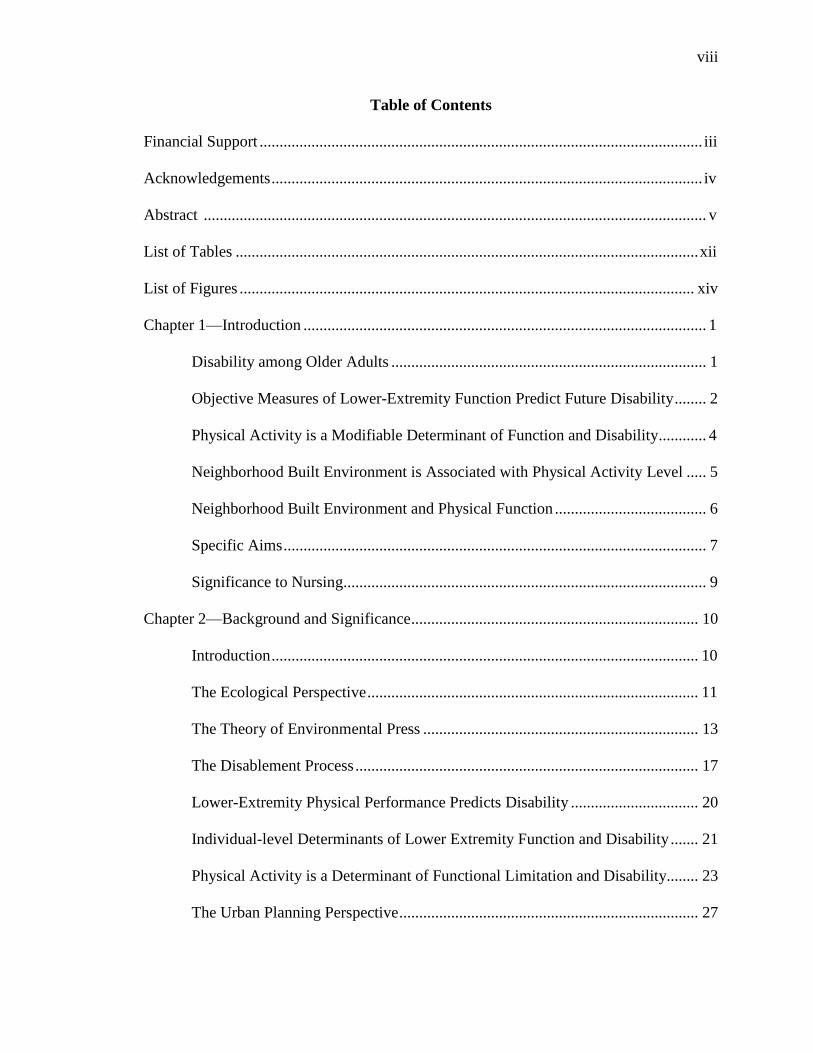
Table of Contents
Financial Support ............................................................................................................... iii
Acknowledgements ............................................................................................................ iv
Abstract .............................................................................................................................. v
List of Tables .................................................................................................................... xii
List of Figures .................................................................................................................. xiv
Chapter 1—Introduction ..................................................................................................... 1
Disability among Older Adults ............................................................................... 1
Objective Measures of Lower-Extremity Function Predict Future Disability ........ 2
Physical Activity is a Modifiable Determinant of Function and Disability............ 4
Neighborhood Built Environment is Associated with Physical Activity Level ..... 5
Neighborhood Built Environment and Physical Function ...................................... 6
Specific Aims .......................................................................................................... 7
Significance to Nursing........................................................................................... 9
Chapter 2—Background and Significance ........................................................................ 10
Introduction ........................................................................................................... 10
The Ecological Perspective ................................................................................... 11
The Theory of Environmental Press ..................................................................... 13
The Disablement Process ...................................................................................... 17
Lower-Extremity Physical Performance Predicts Disability ................................ 20
Individual-level Determinants of Lower Extremity Function and Disability ....... 21
Physical Activity is a Determinant of Functional Limitation and Disability........ 23
The Urban Planning Perspective ........................................................................... 27

ix
Demand theory .......................................................................................... 27
The three d‘s: Density, diversity, and design ............................................ 28
Neighborhood accessibility ....................................................................... 30
Empirical evidence.................................................................................... 31
Conceptual Model ................................................................................................. 33
Built Environment as a Determinant of Functional Limitation and Disability ..... 36
Chapter 3—Research Design and Methods ...................................................................... 43
Overview and Design ............................................................................................ 43
Sample and Setting ............................................................................................... 45
Exclusion criteria ...................................................................................... 50
Informed consent procedures .................................................................... 52
Individual-Level Variables ................................................................................... 52
Measurement of lower-extremity function ............................................... 53
Gait speed.................................................................................................. 56
Age ............................................................................................................ 56
Educational attainment.............................................................................. 56
Complex comorbidity ............................................................................... 57
Incident fracture ........................................................................................ 58
Neighborhood-Level Variables ............................................................................. 58
Data sources .............................................................................................. 59
Land-use mix ............................................................................................ 60
Street connectivity .................................................................................... 62
Public transit access .................................................................................. 63
x
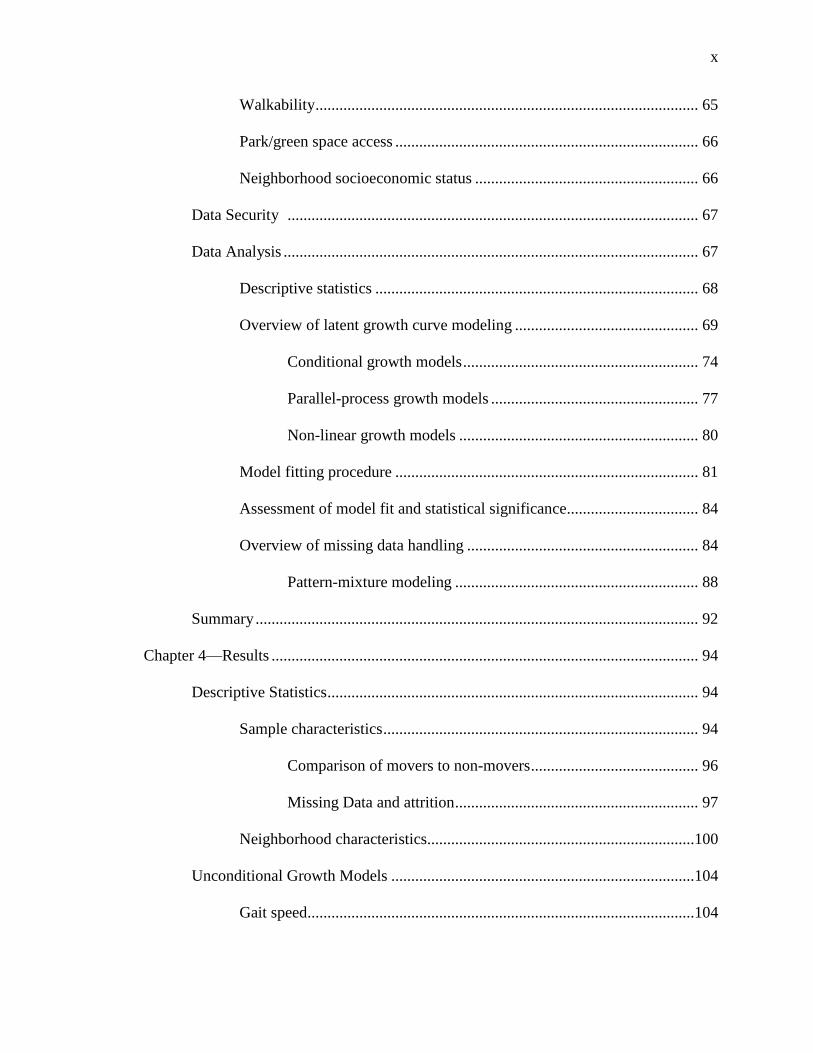
Walkability ................................................................................................ 65
Park/green space access ............................................................................ 66
Neighborhood socioeconomic status ........................................................ 66
Data Security ....................................................................................................... 67
Data Analysis ........................................................................................................ 67
Descriptive statistics ................................................................................. 68
Overview of latent growth curve modeling .............................................. 69
Conditional growth models ........................................................... 74
Parallel-process growth models .................................................... 77
Non-linear growth models ............................................................ 80
Model fitting procedure ............................................................................ 81
Assessment of model fit and statistical significance ................................. 84
Overview of missing data handling .......................................................... 84
Pattern-mixture modeling ............................................................. 88
Summary ............................................................................................................... 92
Chapter 4—Results ........................................................................................................... 94
Descriptive Statistics ............................................................................................. 94
Sample characteristics ............................................................................... 94
Comparison of movers to non-movers .......................................... 96
Missing Data and attrition ............................................................. 97
Neighborhood characteristics...................................................................100
Unconditional Growth Models ............................................................................104
Gait speed.................................................................................................104
xi
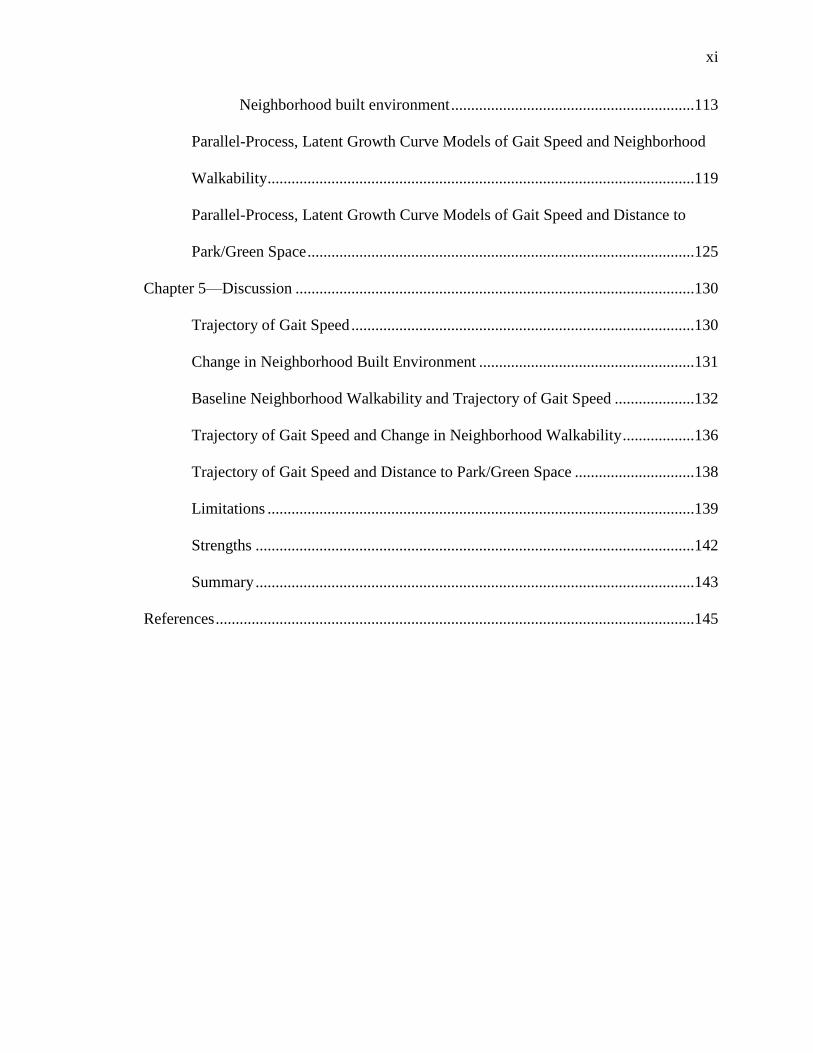
Neighborhood built environment .............................................................113
Parallel-Process, Latent Growth Curve Models of Gait Speed and Neighborhood
Walkability ...........................................................................................................119
Parallel-Process, Latent Growth Curve Models of Gait Speed and Distance to
Park/Green Space .................................................................................................125
Chapter 5—Discussion ....................................................................................................130
Trajectory of Gait Speed ......................................................................................130
Change in Neighborhood Built Environment ......................................................131
Baseline Neighborhood Walkability and Trajectory of Gait Speed ....................132
Trajectory of Gait Speed and Change in Neighborhood Walkability ..................136
Trajectory of Gait Speed and Distance to Park/Green Space ..............................138
Limitations ...........................................................................................................139
Strengths ..............................................................................................................142
Summary ..............................................................................................................143
References ........................................................................................................................145
xii
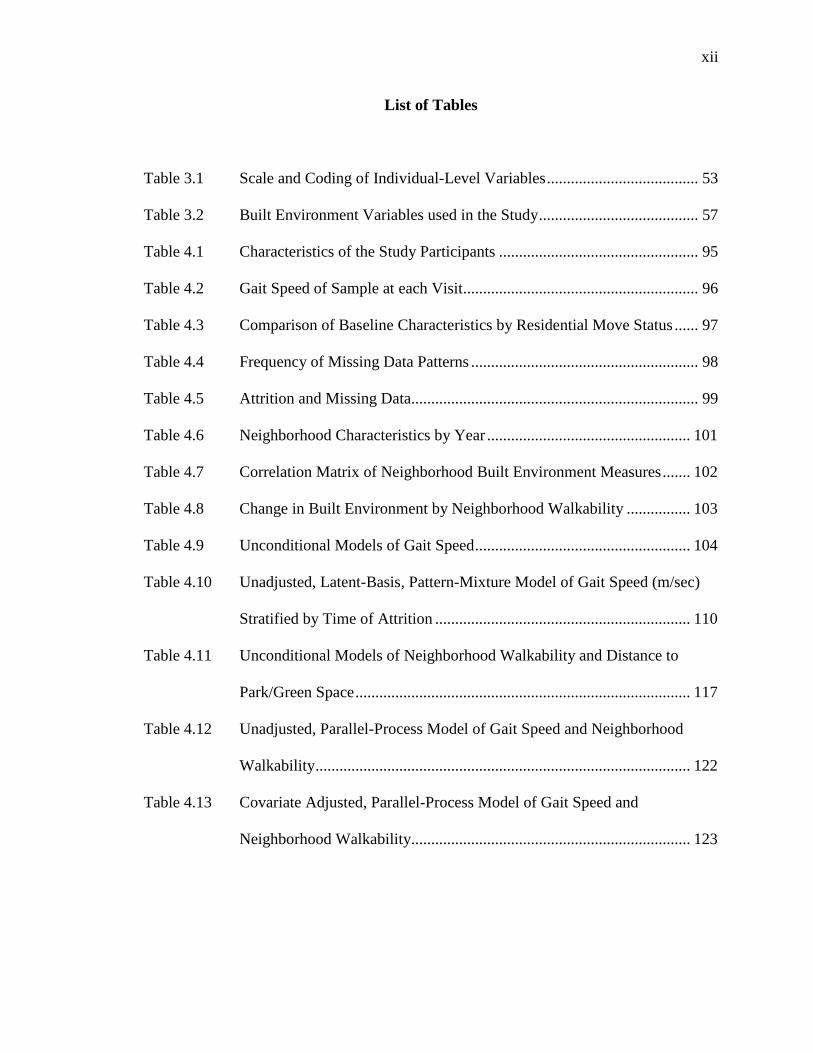
List of Tables
Table 3.1 Scale and Coding of Individual-Level Variables ...................................... 53
Table 3.2 Built Environment Variables used in the Study ........................................ 57
Table 4.1 Characteristics of the Study Participants .................................................. 95
Table 4.2 Gait Speed of Sample at each Visit........................................................... 96
Table 4.3 Comparison of Baseline Characteristics by Residential Move Status ...... 97
Table 4.4 Frequency of Missing Data Patterns ......................................................... 98
Table 4.5 Attrition and Missing Data........................................................................ 99
Table 4.6 Neighborhood Characteristics by Year ................................................... 101
Table 4.7 Correlation Matrix of Neighborhood Built Environment Measures ....... 102
Table 4.8 Change in Built Environment by Neighborhood Walkability ................ 103
Table 4.9 Unconditional Models of Gait Speed ...................................................... 104
Table 4.10 Unadjusted, Latent-Basis, Pattern-Mixture Model of Gait Speed (m/sec)
Stratified by Time of Attrition ................................................................ 110
Table 4.11 Unconditional Models of Neighborhood Walkability and Distance to
Park/Green Space .................................................................................... 117
Table 4.12 Unadjusted, Parallel-Process Model of Gait Speed and Neighborhood
Walkability .............................................................................................. 122
Table 4.13 Covariate Adjusted, Parallel-Process Model of Gait Speed and
Neighborhood Walkability...................................................................... 123
xiii
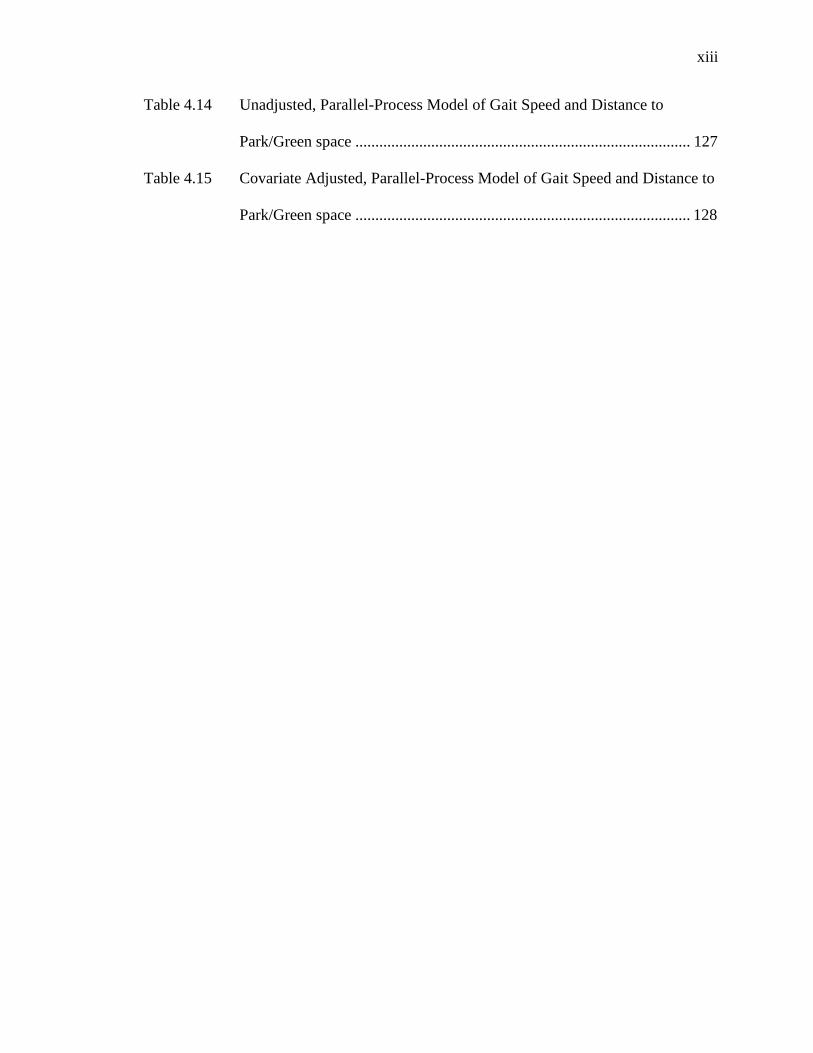
Table 4.14 Unadjusted, Parallel-Process Model of Gait Speed and Distance to
Park/Green space .................................................................................... 127
Table 4.15 Covariate Adjusted, Parallel-Process Model of Gait Speed and Distance to
Park/Green space .................................................................................... 128
xiv
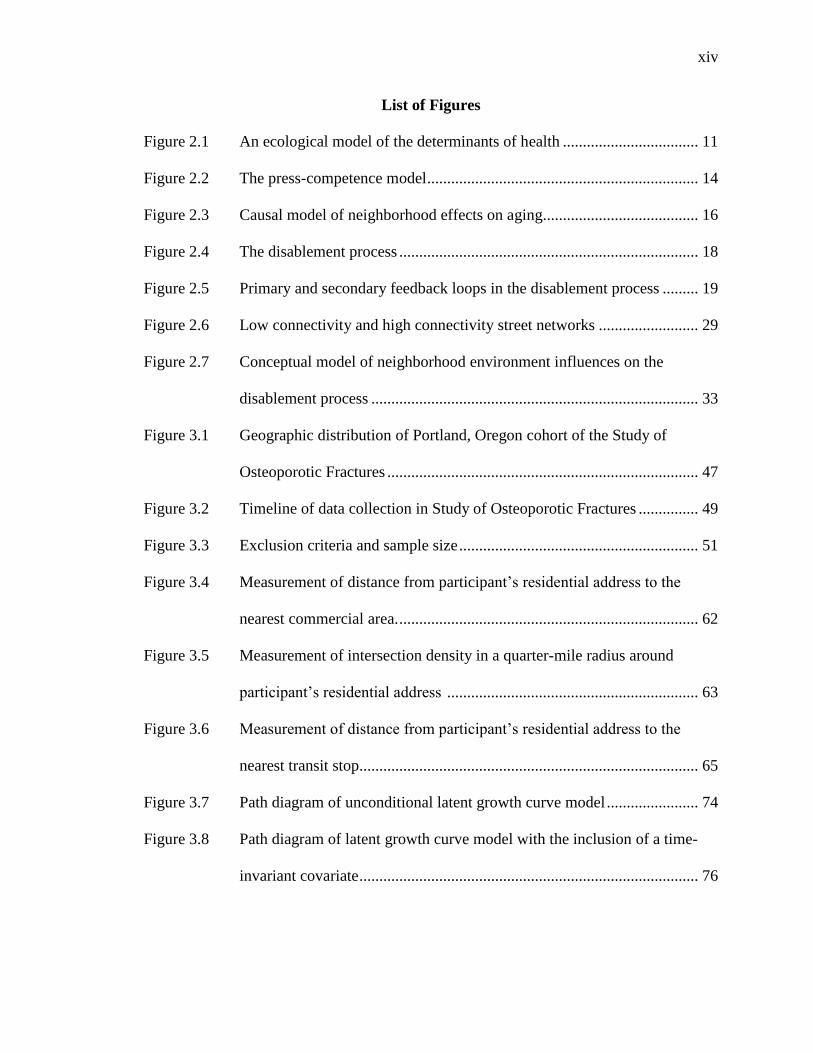
List of Figures
Figure 2.1 An ecological model of the determinants of health .................................. 11
Figure 2.2 The press-competence model .................................................................... 14
Figure 2.3 Causal model of neighborhood effects on aging....................................... 16
Figure 2.4 The disablement process ........................................................................... 18
Figure 2.5 Primary and secondary feedback loops in the disablement process ......... 19
Figure 2.6 Low connectivity and high connectivity street networks ......................... 29
Figure 2.7 Conceptual model of neighborhood environment influences on the
disablement process .................................................................................. 33
Figure 3.1 Geographic distribution of Portland, Oregon cohort of the Study of
Osteoporotic Fractures .............................................................................. 47
Figure 3.2 Timeline of data collection in Study of Osteoporotic Fractures ............... 49
Figure 3.3 Exclusion criteria and sample size ............................................................ 51
Figure 3.4 Measurement of distance from participant‘s residential address to the
nearest commercial area. ........................................................................... 62
Figure 3.5 Measurement of intersection density in a quarter-mile radius around
participant‘s residential address ............................................................... 63
Figure 3.6 Measurement of distance from participant‘s residential address to the
nearest transit stop..................................................................................... 65
Figure 3.7 Path diagram of unconditional latent growth curve model ....................... 74
Figure 3.8 Path diagram of latent growth curve model with the inclusion of a time-
invariant covariate ..................................................................................... 76
xv
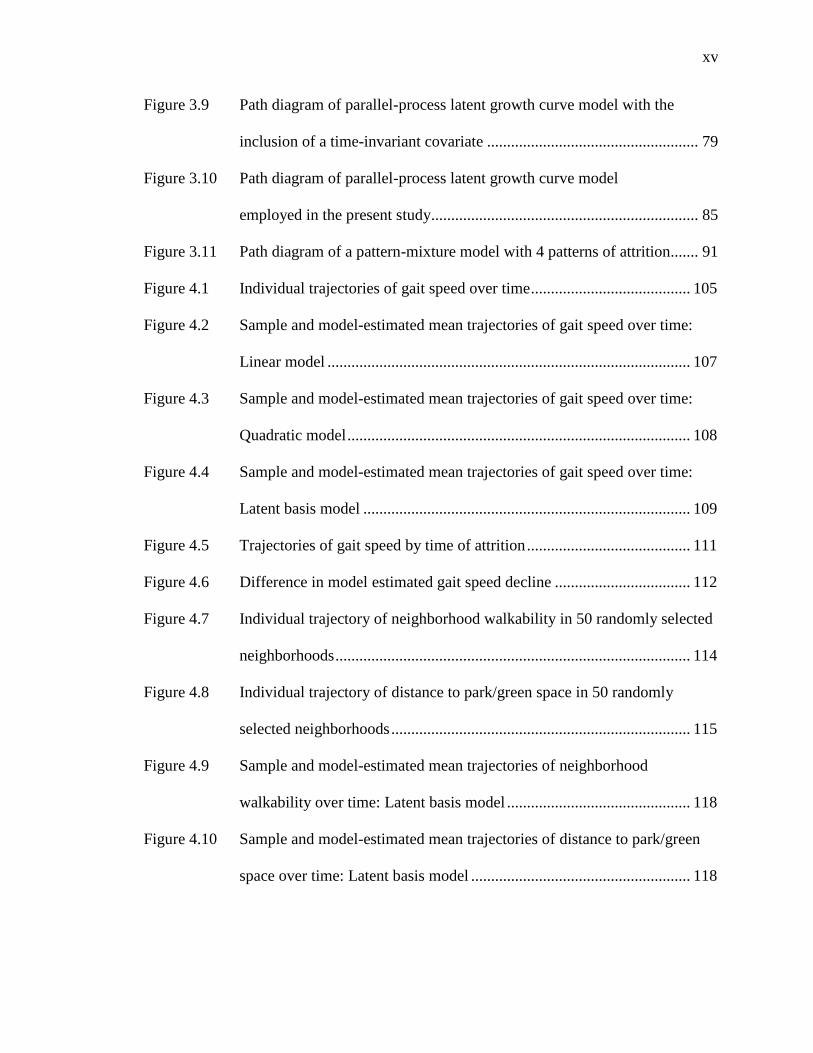
Figure 3.9 Path diagram of parallel-process latent growth curve model with the
inclusion of a time-invariant covariate ..................................................... 79
Figure 3.10 Path diagram of parallel-process latent growth curve model
employed in the present study................................................................... 85
Figure 3.11 Path diagram of a pattern-mixture model with 4 patterns of attrition....... 91
Figure 4.1 Individual trajectories of gait speed over time ........................................ 105
Figure 4.2 Sample and model-estimated mean trajectories of gait speed over time:
Linear model ........................................................................................... 107
Figure 4.3 Sample and model-estimated mean trajectories of gait speed over time:
Quadratic model ...................................................................................... 108
Figure 4.4 Sample and model-estimated mean trajectories of gait speed over time:
Latent basis model .................................................................................. 109
Figure 4.5 Trajectories of gait speed by time of attrition ......................................... 111
Figure 4.6 Difference in model estimated gait speed decline .................................. 112
Figure 4.7 Individual trajectory of neighborhood walkability in 50 randomly selected
neighborhoods ......................................................................................... 114
Figure 4.8 Individual trajectory of distance to park/green space in 50 randomly
selected neighborhoods ........................................................................... 115
Figure 4.9 Sample and model-estimated mean trajectories of neighborhood
walkability over time: Latent basis model .............................................. 118
Figure 4.10 Sample and model-estimated mean trajectories of distance to park/green
space over time: Latent basis model ....................................................... 118

xvi
Figure 4.11 Path diagram of covariate adjusted, parallel-process model of gait speed
and neighborhood walkability................................................................. 124
Figure 4.12 Path diagram of covariate adjusted, parallel-process model of gait speed
and distance to park/green space ............................................................. 129
1
Chapter 1—Introduction
Disability among Older Adults
Disability is a major public health issue among older adults. Broadly defined as
substantial limitation in life activities, disability is highly prevalent among adults aged 65
years and older, with one in three older adults reporting at least one functional limitation.
Among older adults participating in the 2005 American Community Survey, 30%
reported limitation in walking, climbing stairs, or carrying objects, (termed functional
disability) and 10% reported limitation in performing activities of daily living (ADL)
such as dressing, bathing, or getting around inside the home (Fuller-Thomson, Yu, Nuru-
Jeter, Guralnik, & Minkler, 2009). Similarly, among older adults enrolled in the
Cardiovascular Health Study, 30% developed mobility disability and 15% developed
ADL disability (Chaudhry et al., 2010). Based on an analysis of data from the National
Health Interview Survey, Newcomer, Kang, Laplante, and Kaye (2005) estimated that
15.1. million non-institutionalized adults require assistance with either ADL‘s or
instrumental activities of daily living (IADL‘s). In each of these studies, older women
were observed to have higher rates of ADL, functional, and mobility disability than older
men. Increased rates of disability and steeper declines in function among older women
have also been reported by Beckett et al. (1996) and Seeman, Merkin, Crimmins, &
Karlamangla (2010).
The development of disability is associated with increased risk of subsequent
institutionalization, morbidity, and mortality among adults aged 65 years and older
(Beswick et al., 2008; Greene, 1983; Guralnik, Fried, & Salive, 1996; Jette, Tennstedt, &
Crawford, 1995; Ostir et al., 1999). The cost of providing additional medical care and
2
long-term care services to newly disabled older adults is estimated to be $26-30 billion
dollars per year (Guralnik, Alecxih, Branch, & Wiener, 2002). Taylor and Hoenig (2006)
found that older adults with reported difficulty walking had higher rates of health care
utilization higher downstream Medicare costs after controlling for disease burden.
Furthermore, there is a well-documented association between functional independence
and self-reported quality of life among older adults (Cerniauskaite et al., 2012; Groessl et
al., 2007; Vest, Murphy, Araujo, & Pisani, 2011). Given the profound impact that
functional impairment and subsequent disability has on the health and well-being of older
adults, as well as the substantial costs associated with providing medical care and
supportive services to older adults with impaired physical function, identifying the
modifiable determinants of functional decline is a critical step in addressing the needs of
our aging population. It is particularly important to identify those factors associated with
pre-clinical changes in physical performance because timely intervention may minimize
or prevent the sequelae associated with functional impairment.
Objective Measures of Lower-Extremity Function Predict Future Disability
Measurement of physical function can be subjective, through self-reported level
of difficulty engaging in specific physical tasks (e.g., walking a city block or extending
the arms above the shoulders), or objective, by measuring predefined criteria during the
performance of standard physical task (e.g., the time it takes to walk 6 meters or upper
extremity active range of motion) (Simonsick et al., 2001). There is evidence, however,
that objective, performance-based measures of physical function, particularly lower-
extremity function, are more sensitive than subjective measures to the pre-clinical
changes in physical performance that have been observed to precede functional
3
impairment and future disability (Cooper et al., 2011). Performance-based measures of
lower extremity function are consistent predictors of future ADL disability (Guralnik et
al., 2000; Wennie Huang, Perera, VanSwearingen, & Studenski, 2010), mobility
disability (Cesari et al., 2009; Fried, Bandeen-Roche, Chaves, & Johnson, 2000;
Guralnik, Ferrucci, Simonsick, Salive, & Wallace, 1995), falls (Abellan van Kan et al.,
2009), hospitalization (Cesari et al., 2005), institutionalization (Giuliani et al., 2008;
Montero-Odasso et al., 2005), and mortality (Cooper et al., 2010; Studenski et al., 2011).
Guralnik et al. (1995), in a longitudinal study of older adults with no reported disability,
found that those who performed in the lowest tertile on three measures of lower extremity
function (timed walk, chair stand test, balance test) were 4.2 times more likely that the
highest performing tertile to report ADL disability and 4.9 times more likely to report
mobility disability at 4-year follow-up. Fried et al. (2000), in a study of 436 older
women, found that incident difficulty in walking one-half mile was predicted by reduced
gait speed and incident difficulty climbing 10 steps was predicted by reduced stair climb
speed. Performance-based measures of lower-extremity function are also reliable
indicators of present functional impairment, and can objectively measure the progression
of functional decline and disability occurring either through worsening of the
precipitating pathology or through the initiation of secondary impairments (Bohannon,
2009; Cesari, 2011; Lan, Melzer, Tom, & Guralnik, 2002; Ostir et al., 2012; Verghese,
Wang, & Holtzer, 2011). Thus, objective measures of lower-extremity function can be
used both to measure pre-clinical declines in physical performance in older adults who
are not experiencing functional limitation and quantify the degree of functional decline in
the context of established function impairment.
4
Physical Activity is a Modifiable Determinant of Function and Disability
Ecological models of both aging and disability suggest that the physical
environment is an important determinant of the health and function of older adults
(Satariano, 2006). Because the activity space of older adults is largely centered around
their local residential environments, the physical, or built, features of their neighborhood
environment may play a particularly important role in promoting functional ability or
hastening functional decline (Glass & Balfour, 2003). However, little is known about the
mechanisms through which neighborhood built environment influences functional health.
One potential pathway through which the built environment may influence functional
decline and subsequent disability is by facilitating or hindering physical activity
(Satariano & McAuley, 2003). Physical activity is one of the most important strategies to
preserve function and reduce disability among older adults. Regular engagement in
physical activity is associated with preservation of lower-extremity function and
decreased risk for the subsequent development of functional limitation (Seeman & Chen,
2002). Furthermore, there is evidence that engagement in physical activity can improve
lower-extremity function even among older adults with existing functional impairment
(Life Study Investigators et al., 2006; Peterson et al., 2009; Protas & Tissier, 2009).
While older adults may participate in a number of types of physical activity, walking is
by far the most common (Siegel, Brackbill, & Heath, 1995). According to data from the
Behavioral Risk Factor Surveillance System (BRFSS), 45% of women over the age of 65
reporting walking for leisure-time physical activity, and walking was the most frequently
reported leisure-time physical activity among older women who met current activity
recommendations (Simpson et al., 2003). However, the prevalence of older women who
5
reported engaging in walking for leisure-time physical activity increased only 4.8%
between the years of 1987-2000, despite a concerted national campaign to promote
leisure-time physical activity (Simpson et al., 2003). In regards to transit-related walking,
though it remains the second most popular means of travel among older adults, the
proportion of total household trips among older adults made by walking, roughly 9%,
was unchanged from 2000 to 2009 (Lynott & Figuerido, 2011). These statistics
underscore the potential to improve the functional health of older adults through
promoting both leisure time walking and walking for transit.
Neighborhood Built Environment is Associated with Physical Activity Level
A growing body of literature has documented the relationship between
neighborhood built environment and physical activity behavior, particularly walking
(Ewing & Cervero, 2010; Handy, 2005; Van Cauwenberg et al., 2011). Neighborhood
physical features which have been associated with increased levels of physical activity
include highly-connected local street networks (Li et al, 2005), diverse land-use mix
(Shigematsu et al., 2009; Wang & Lee, 2010), access to public transportation (Borst et
al., 2009 ; Su, Schmocker, & Bell, 2009), and distance to parks or green spaces (Michael,
Perdue, Orwoll, Stefanick, & Marshall, 2010). Of these, the first three characteristics are
considered by urban planners to be the primary influences on active travel, defined as the
choice of non-motorized forms of travel such as walking or cycling. The approach taken
in the current study was to combine measures of street connectivity, land-use mix, and
public transport access in a composite measure of neighborhood walkability, which is
generally defined in the urban planning literature as the degree to which neighborhood
design promotes or hinders active travel. Similar indices have been used in a number of
6
previous studies examining the relationship between neighborhood walkability and
physical activity (Brownson, Hoehner, Day, Forsyth, & Sallis, 2009; Leslie et al., 2007;
Van Dyck et al., 2010). Neighborhood distance to park/green space, on the other hand, is
largely associated with recreational physical activity, and so was not included in the
composite measure of walkability described above. Instead, this study included a single
measure of distance to park/green space in order to distinguish between neighborhood
influences on active travel and recreational physical activity.
Neighborhood Built Environment and Physical Function
Given the well-established relationship between physical activity and physical
function, one could reasonably expect that neighborhood characteristics which promote
active travel and/or recreational physical activity would have measurable effects on the
trajectory of functional decline among older residents. However, few studies to date have
explored the relationship between neighborhood physical environment and physical
function (Rosso, Auchincloss, & Michael, 2011). Of those, only four have examined the
relationship of neighborhood environment to change in functional ability over time, and
no study to date has modeled the association between change in neighborhood
environment and the trajectory of functional decline. Consequently, it is unclear whether
urban planning initiatives to promote more walkable neighborhoods will improve
functional outcomes among the older adults living in those neighborhoods.
During the past several decades, the city of Portland, Oregon, has become
nationally renowned for enacting and implementing urban planning policies aimed at
managing growth and limiting urban sprawl (Song & Knaap, 2004). Beginning in 1991,
7
the Portland regional government (known as Metro) began working on a comprehensive
urban planning strategy, aligned with New Urbanist principles, promoting pedestrian-
oriented, walkable neighborhoods. These policies included expanding public transit,
encouraging mixed-use development, rehabilitating brown field and industrial use areas,
and creating neighborhood park and green spaces (Metro, 2011). In addition, the city of
Portland is a national leader in the use of geographic information system (GIS)
technology to guide urban planning initiatives, and have been collecting extensive
neighborhood-level data since 1988. Thus, it is the ideal setting to examine the effects of
neighborhood environment on functional ability over time, particularly the degree to
which changes in the neighborhood environment are associated with changes in lower
extremity function.
Specific Aims
Therefore, the specific aims of this study are to:
1. Describe the relationship between baseline neighborhood walkability and baseline
lower-extremity function among older women.
Hypothesis: Baseline neighborhood walkability is significantly associated with
baseline lower-extremity function. Women who live in more walkable
neighborhoods will have higher baseline lower-extremity function.
2. Describe the relationship between baseline neighborhood walkability and change
in lower-extremity function among older women.
Hypothesis: Baseline neighborhood walkability is significantly associated with
the magnitude of decline in lower-extremity function over time. Women who live
8
in more walkable neighborhoods will have less decline in lower-extremity
function over time.
3. Describe the relationship between change in neighborhood walkability and
change in lower-extremity function among older women.
Hypothesis: The magnitude of change in neighborhood walkability is significantly
associated with the magnitude of decline in lower-extremity function over time.
Improvement in neighborhood walkability over time is associated with a reduced
rate of lower-extremity functional decline.
4. Describe the relationship between baseline distance to neighborhood parks/green
spaces and baseline lower-extremity function among older women.
Hypothesis: Baseline distance to neighborhood parks/green spaces is significantly
associated with baseline lower-extremity function. Women who live in
neighborhoods with greater distance to a park/green space will have higher
baseline lower-extremity function.
5. Describe the relationship between baseline distance to neighborhood parks/green
spaces and change in lower-extremity function among older women.
Hypothesis: Baseline distance to neighborhood parks/green spaces is significantly
associated with the magnitude of decline in lower-extremity function over time.
Women who live in neighborhoods with greater distance to a park/green space
will have less decline in lower-extremity function over time.
6. Describe the relationship between change in the distance to neighborhood
parks/green spaces and change in lower-extremity function among older women.
9
Hypothesis: The magnitude of change in the distance to neighborhood
parks/green spaces is significantly associated with the magnitude of decline in
lower-extremity function over time. A reduction in the distance to a park/green
space over time is associated with a reduced rate of lower-extremity functional
decline.
Significance to Nursing
Meeting the needs of our aging population is one of the greatest challenges facing
public health nursing in the coming decades. Our success in meeting this challenge
hinges on developing community-based approaches to reducing the sequelae of
institutionalization, morbidity, and mortality associated with functional decline among
older adults. Yet, despite the clear need to understand the environmental determinants of
functional health among older adults, few studies to date have explored the relationship
of neighborhood built environment to the trajectory of functional decline among older
adults, and no study to date has examined the effect of change in neighborhood built
environment on physical function among older adults. This study addresses that gap in
the current science, and the results of this study can inform future policy and planning
initiatives to promote healthy aging.
10
Chapter 2—Background and Significance
Introduction
Understanding the complex dynamics of the relationship between the health and
function of older adults and the environments in which they live requires a broad focus,
as contributions to this field of inquiry have been made by a variety of disciplines. In this
study, both the theoretical framework and the methodological approach draw heavily on
work done outside the nursing field. The theoretical framework developed for this study
merges classic ecological models of aging and disability with contemporary urban
planning theory in an attempt to articulate the mechanisms through which neighborhood
built environment influences long-term preservation of function by facilitating active
aging in the community. This chapter is divided into several sections. The first section is
an overview of the ecological perspective on health. This is followed by a discussion of
Lawton and Nahemow‘s (1973) theory of environmental press, which provides a general
framework for understanding how environmental characteristics influence the health and
function of older adults, and Verbrugge and Jette‘s (1994) disablement process model,
which articulates the progression of disability in an ecological context. Finally, the urban
planning perspective on how neighborhood built environment influences physical activity
behavior is reviewed. These approaches are then combined in a conceptual model of the
relationship between the neighborhood environment and disability. This chapter
concludes with a comprehensive synthesis of the literature to date on the relationship
between characteristics of the neighborhood built environment and functional outcomes
among older adults.
11
The Ecological Perspective
The ecological perspective, which emphasizes the interplay of biological,
psychological, and socioenvironmental influences on behavior, provides an overarching
framework for the study of environmental influences on health behaviors and outcomes.
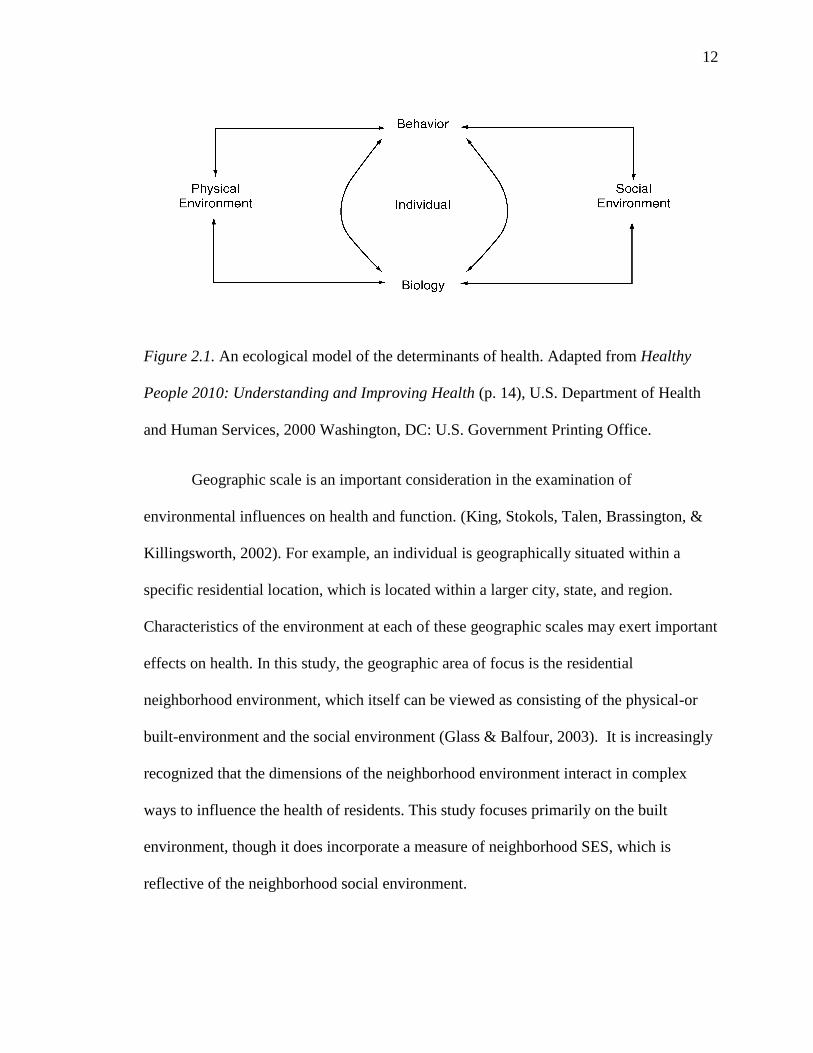
The ecological model of the determinants of health used in the Healthy People 2010
campaign is shown in Figure 2.1 (U.S. Department of Health and Human Services, 2010).
This simple model illustrates two key principles of the ecological perspective that inform
this study. First, that the health of individuals is influenced by both the physical and
social characteristics of their environments, as well as by biological and psychological
characteristics. In regards to health behavior, the ecological perspective posits that the
physical characteristics of the environment in which a given behavior takes place can
have a powerful an influence on that behavior (Sallis & Owen, 2002; van Sluijs et al.,
2007). Second, that the various individual and environmental factors which affect health
behavior and outcomes are interrelated, and can exert both direct and indirect effects on
health and function.
12
Figure 2.1. An ecological model of the determinants of health. Adapted from Healthy
People 2010: Understanding and Improving Health (p. 14), U.S. Department of Health
and Human Services, 2000 Washington, DC: U.S. Government Printing Office.
Geographic scale is an important consideration in the examination of
environmental influences on health and function. (King, Stokols, Talen, Brassington, &
Killingsworth, 2002). For example, an individual is geographically situated within a
specific residential location, which is located within a larger city, state, and region.
Characteristics of the environment at each of these geographic scales may exert important
effects on health. In this study, the geographic area of focus is the residential
neighborhood environment, which itself can be viewed as consisting of the physical-or
built-environment and the social environment (Glass & Balfour, 2003). It is increasingly
recognized that the dimensions of the neighborhood environment interact in complex
ways to influence the health of residents. This study focuses primarily on the built
environment, though it does incorporate a measure of neighborhood SES, which is
reflective of the neighborhood social environment.
13
It is important to note that as a general framework for understanding the
determinants of health and behavior, the ecological perspective only suggests a system of
relationships; it does not specify the causal mechanisms that are responsible for the effect
of a given environmental characteristic. For example, from an ecological perspective it is
clearly important to consider the proximity of recreational facilities in a model of
individual physical activity, though the ecological perspective provides no theoretical
guidance for predicting the direction or magnitude of the relationship between proximity
of recreational facilities and engagement in physical activity. Instead, the ecological
perspective offers an inclusive framework for synthesizing diverse theoretical models.
Three theoretical models that are central to this study are the theory of environmental
press, the disablement process model, and demand theory as applied in the field of urban
planning to travel behavior.
The Theory of Environmental Press
Lawton and Nahemow (1973) developed an ecological model of human behavior
and function known as the theory of environmental press or the press-competence model.
Its primary thesis is that behavior is contingent on the dynamic interplay between the
competence of the individual and the demands placed on the individual by their
environment. This theory defines individual competence broadly, as encompassing any
number of measurable characteristics in the domains of biological health, sensorimotor
functioning, cognitive skill and ego health. Similarly, environment is broadly
conceptualized as including both the social and physical environment. Figure 2.2
illustrates the relationship between individual competence and environmental demands.
14
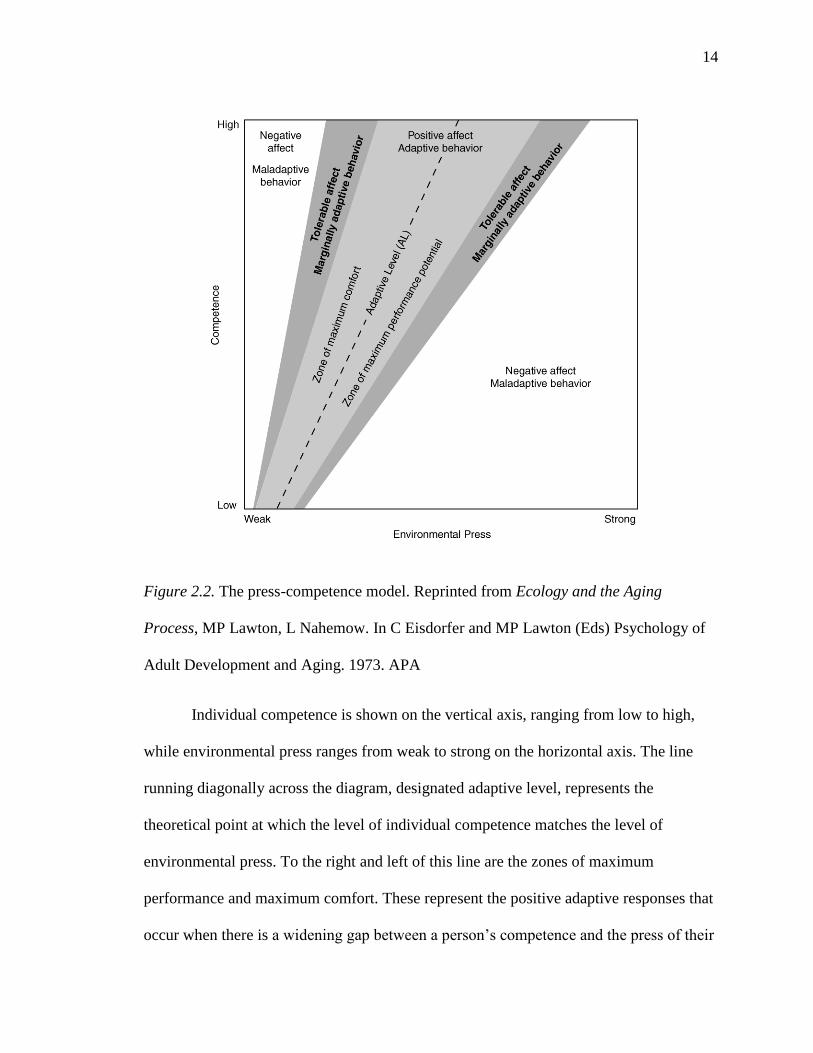
Figure 2.2. The press-competence model. Reprinted from Ecology and the Aging
Process, MP Lawton, L Nahemow. In C Eisdorfer and MP Lawton (Eds) Psychology of
Adult Development and Aging. 1973. APA
Individual competence is shown on the vertical axis, ranging from low to high,
while environmental press ranges from weak to strong on the horizontal axis. The line
running diagonally across the diagram, designated adaptive level, represents the
theoretical point at which the level of individual competence matches the level of
environmental press. To the right and left of this line are the zones of maximum
performance and maximum comfort. These represent the positive adaptive responses that
occur when there is a widening gap between a person‘s competence and the press of their
15
environment, as on the right of the figure, or a narrowing of that gap, as on the left. For
example, when a person is able to meet the challenges posed by either a mild decrease in
competence or an increase in environmental press, the result can be a maximization of
potential and positive adaptation. However, negative adaption occurs if the decrease in
competence is too great or the environmental press too significant, resulting in negative
affect and maladaptive behavior. It is the point where the demands of the environment
exceed the person‘s capacity. Conversely, on the left is the zone of maximum comfort,
where the person‘s capacity exceeds the demands of the environment, but not to a degree
that the lack of stimulation and challenge results in negative adaptation, which is depicted
on the far left where the lack of environmental challenge is so pronounced that boredom,
passivity, and apathy result.
A key feature of this model is that functional outcomes cannot be solely predicted
from either individual characteristics or from environmental features. Rather, they are
viewed as a function of the degree of ―fit‖ between the person and the environment;
positive adaptation and consequent optimum function result from the equilibrium
between capacity and environmental press (Lawton, 1983). For younger adults,
maintaining this equilibrium does not generally pose a significant or lasting challenge.
However, for older adults, the reduction in competence resulting from acute or chronic
health concerns can lead to disequilibrium, magnifying the press exerted by the
environment. Accordingly, older adults are regarded by Lawton to disproportionally
experience the impact of adverse conditions in the physical environment (Lawton, 1985).
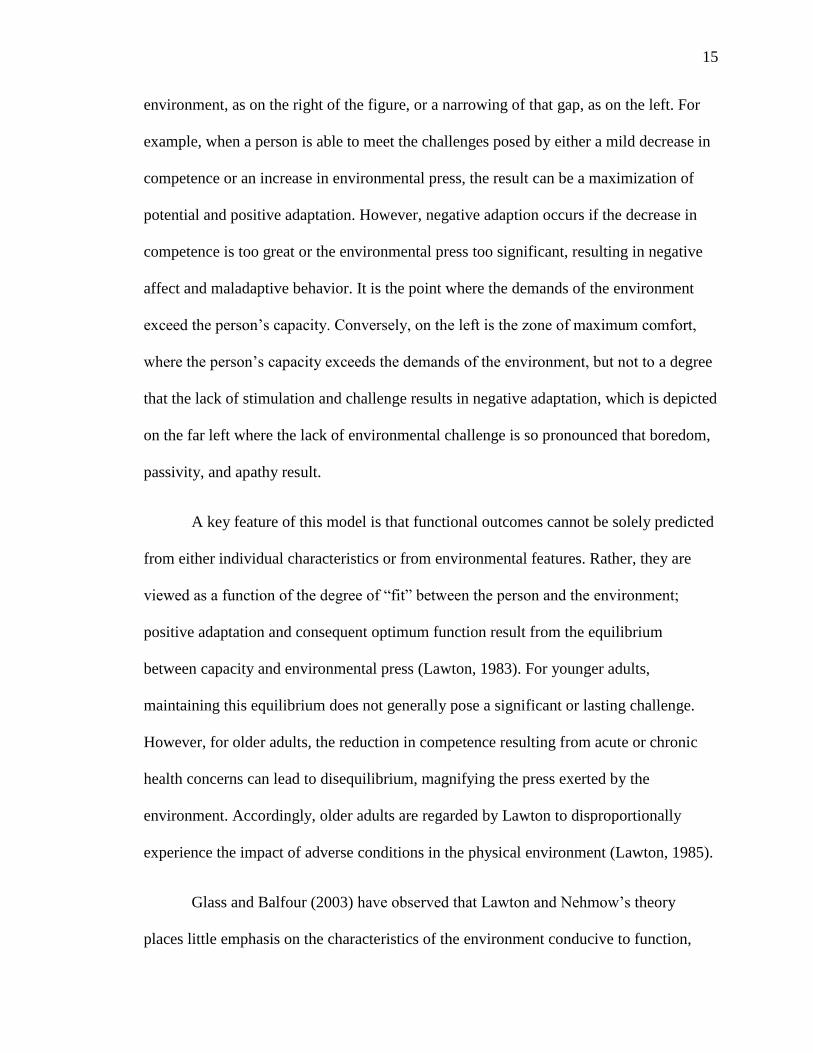
Glass and Balfour (2003) have observed that Lawton and Nehmow‘s theory
places little emphasis on the characteristics of the environment conducive to function,
16
features they term environmental buoys. They argue that environmental buoys are as
important in determining behavioral, functional, and health outcomes as negative
environmental pressures. Focusing explicitly on the residential environment, they
proposed a model of neighborhood effects on aging that extends Lawton‘s theory of
environmental press to incorporate the concept of environmental buoying (Glass &
Balfour, 2003). This model is depicted in Figure 2.3 below.
Figure 2.3. Causal model of neighborhood effects on aging. Reprinted from Glass, T., &
Balfour, J. L. (2003). Neighborhoods, aging and functional limitation. In I. Kawachi & L.
Berkman (Eds.), Neighborhoods and Health (pp. 303-334). New York: Oxford
University Press.
17
Balfour and Glass‘s model presents a theoretical pathway from characteristics of
the neighborhood environment to individual functional ability that is mediated by
behavioral responses to the level of person-environment fit. This model suggests that
modifications to the neighborhood environment can serve as environmental buoys,
potentially mitigating the impact of diminishing competence on functional ability. This
notion of environmental buoys enhancing the fit between the older adult and their
environment is echoed in the Disablement Process model.
The Disablement Process
In the seminal article entitled ―The Disablement Process,‖ Verbrugge and Jette
(1994), proposed a model of disability describing both ―how acute and chronic conditions
affect functioning in specific body systems, fundamental physical and mental actions, and
activities of daily living and the personal and environmental factors that speed or slow
disablement‖ (p. 1). Building on the work of the sociologist Saad Nagi (1965),
Verbrugge and Jette conceptualized disability as a process beginning with the presence of
an acute, chronic, or congenital pathology. This pathology can lead to impairment in a
specific body system or systems. For example, the development of diabetes can lead to
dysfunction of the renal and cardiovascular systems. This impairment can then lead to
functional limitation, which refers to a diminished capacity to perform basic functional
tasks or activities. These are conceptualized as generic actions which occur in multiple
contexts, such as walking, lifting an object, reading standard print, or hearing
conversation in a normal tone. Returning to the previous example, cardiovascular
impairment may result in a diminished capacity to engage in physical activity such as
walking. This stage has also been referred to as preclinical disability (Fried et al., 2000),
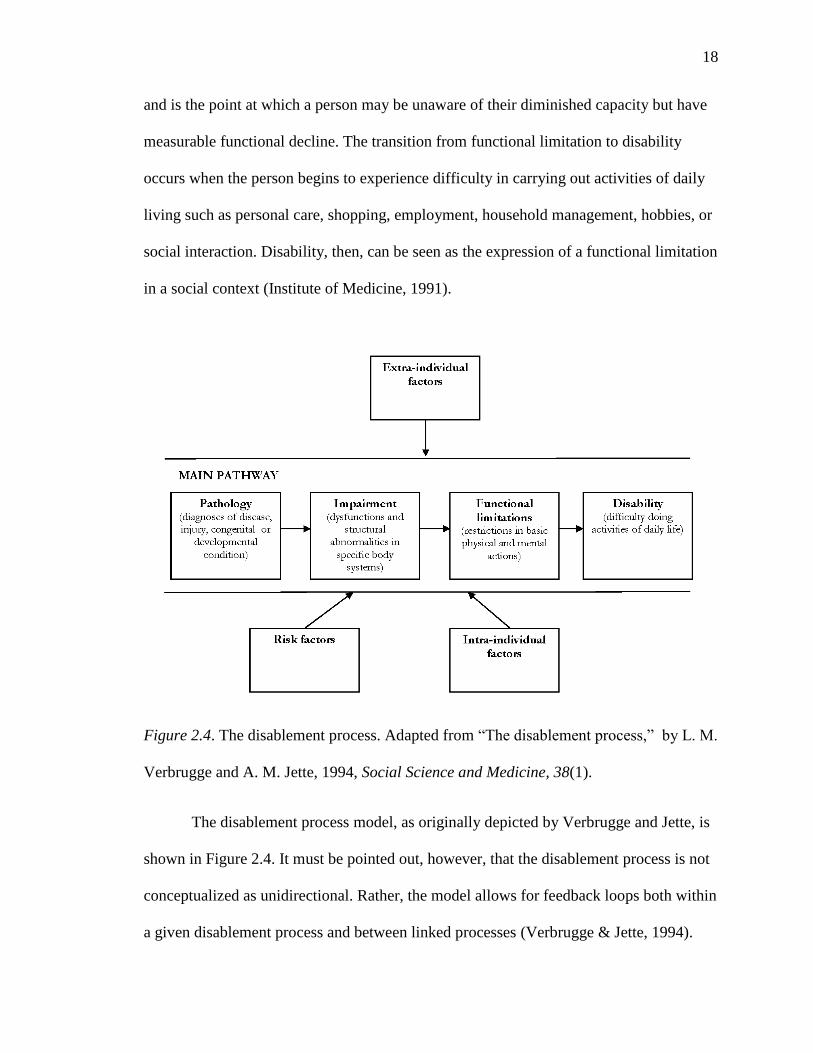
18
and is the point at which a person may be unaware of their diminished capacity but have
measurable functional decline. The transition from functional limitation to disability
occurs when the person begins to experience difficulty in carrying out activities of daily
living such as personal care, shopping, employment, household management, hobbies, or
social interaction. Disability, then, can be seen as the expression of a functional limitation
in a social context (Institute of Medicine, 1991).
Figure 2.4. The disablement process. Adapted from ―The disablement process,‖ by L. M.
Verbrugge and A. M. Jette, 1994, Social Science and Medicine, 38(1).
The disablement process model, as originally depicted by Verbrugge and Jette, is
shown in Figure 2.4. It must be pointed out, however, that the disablement process is not
conceptualized as unidirectional. Rather, the model allows for feedback loops both within
a given disablement process and between linked processes (Verbrugge & Jette, 1994).
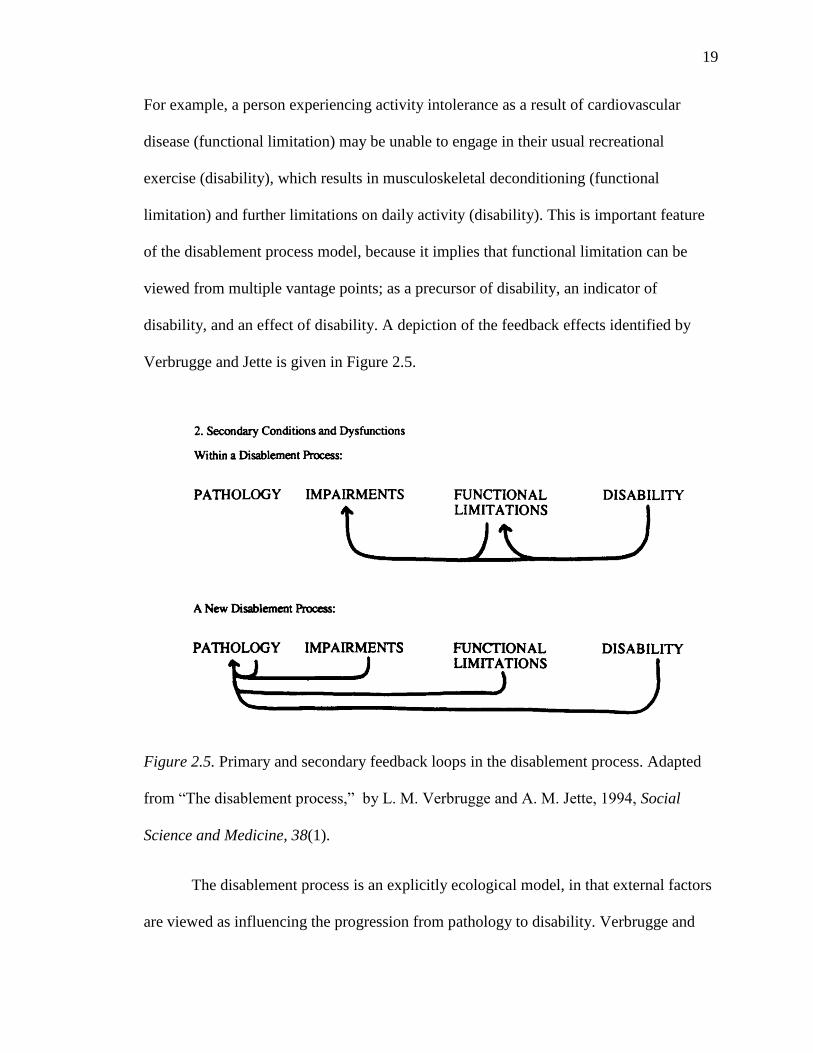
19
For example, a person experiencing activity intolerance as a result of cardiovascular
disease (functional limitation) may be unable to engage in their usual recreational
exercise (disability), which results in musculoskeletal deconditioning (functional
limitation) and further limitations on daily activity (disability). This is important feature
of the disablement process model, because it implies that functional limitation can be
viewed from multiple vantage points; as a precursor of disability, an indicator of
disability, and an effect of disability. A depiction of the feedback effects identified by
Verbrugge and Jette is given in Figure 2.5.
Figure 2.5. Primary and secondary feedback loops in the disablement process. Adapted
from ―The disablement process,‖ by L. M. Verbrugge and A. M. Jette, 1994, Social
Science and Medicine, 38(1).
The disablement process is an explicitly ecological model, in that external factors
are viewed as influencing the progression from pathology to disability. Verbrugge and
20
Jette (1994) hypothesized that extra-individual factors could serve as moderators of the
disablement process and identified a number of those potential factors, including medical
care and rehabilitation, external supports, and the built and social environment. In fact,
they acknowledged that although the model that they developed was ―person-centered‖,
the disablement process was best understood in the context of the relationship between a
person and his/her environment. In the following sections we will examine the empirical
evidence supporting the disablement process model, and explore the potential
determinants of disability among older adults.
Lower-Extremity Physical Performance Predicts Disability
The relationship between functional limitation and disability described in the
disablement process model has been well-established. Performance-based measures of
lower-extremity function have been shown across multiple studies to predict subsequent
mobility disability and ADL disability after controlling for a variety of potential
confounders. Guralnik et al. (1995), in a study of 1122 non-disabled adults aged 70 years
or greater participating in the Iowa cohort of the Established Populations for the
Epidemiological Study of the Elderly (EPESE), found that those older adults with the
lowest gait speed scores had a 4.8 increase in the relative risk of subsequent mobility
disability at 4 year follow up when compared to those with the highest gait speed scores.
A subsequent study pooling data from participants across the EPESE sites (N = 4,488)
and from the 1,946 participants in the Hispanic EPESE study reported a similar increase
in the relative risk for both mobility and ADL disability among those with the lowest gait
speed scores (Guralnik et al., 2000). Results from the 3047 participants in the Health,
Aging and Body Composition study found that baseline gait speed of less than 1
21
meter/sec was associated with a 2.2 increase in the relative risk of reporting persistent
lower extremity limitation at 5 year follow up (Cesari et al., 2005). Ostir, Markides,
Black, and Goodwin (1998), in a study of 1365 older adults (mean age=73.3), found that
those in the lowest quartile of walking speed at baseline had 5.4 increased odds of ADL
disability at 2 year follow up compared to those in the highest quartile. Among
participants in the Cardiovascular Health Study (N=3156), those with a baseline gait
speed of greater than 1.0 m/sec had a significantly reduced hazard (hazard ratio = .88) of
developing incident ADL disability during the 8.4 years of follow-up (Rosano, Newman,
Katz, Hirsch, & Kuller, 2008). Similarly, in the Women‘s Health and Aging Study, each
increase of .3 meters/sec in participant‘s gait speed was associated with a .72 relative risk
of incident ADL disability and a .57 relative risk of mobility disability at 3 year follow-
up (Onder et al., 2005). This significant relationship between gait speed and disability has
been replicated in a number of other studies (Abellan van Kan et al., 2009; Vermeulen,
Neyens, van Rossum, Spreeuwenberg, & de Witte, 2011).
Individual-Level Determinants of Lower Extremity Function and Disability
The individual-level determinants of functional limitation and disability have
been well established in the literature to date. Several demographic characteristics are
known to be associated with lower-extremity function and disability. Chronological age
is a strong predictor of lower-extremity functional decline (Gill, Allore, Hardy, & Guo,
2006). Guralnik et al. (1993) reported an estimated 2.0 increase in the relative risk of
decline for each 10-year increase in age. Similarly, in an analysis of participants in the
Health and Retirement Study, Dunlop, Song, Manheim, Daviglus, and Chang (2007)
observed that each decade of increased age was associated with double the hazard of
22
ADL disability. Females have been reported to have higher rates of disability and steeper
declines in lower-extremity function than males (Inzitari et al., 2006; Leveille, Penninx,
Melzer, Izmirlian, & Guralnik, 2000; Murray et al., 2011; Murtagh & Hubert, 2004) Both
income and educational attainment have consistently been found to be related to lower-
extremity function and disability (Berkman et al., 1993; Freedman, Martin, Schoeni, &
Cornman, 2008; Murray et al., 2011; Nusselder, Looman, & Mackenbach, 2005). Race
and ethnicity have been observed to be related to lower-extremity function (Ostchega,
Harris, Hirsch, Parsons, & Kington, 2000), although Dunlop et al. (2007) found this
relationship was attenuated by controlling for socioeconomic characteristics and health
behaviors.
As one would expect, both health status and health behaviors are associated with
functional decline. Guralnik et al. (1993) found that the presence of a single chronic
condition was a significant predictor of functional decline, and that risk increased with
each additional comorbid condition. Of course, the degree of risk associated with specific
conditions varies widely (Chaudhry et al., 2010; Freedman, Martin, et al., 2008; Inzitari
et al., 2006). In a systematic review by Stuck et al. (1999), cancer, hypertension, arthritis,
diabetes, stroke, hypertension, cardiovascular disease, and fracture were reported as the
diagnoses most consistently associated with functional decline. Cognitive impairment has
been shown to predict lower-extremity functional decline and ADL disability (Kuo,
Leveille, Yu, & Milberg, 2007; Mehta, Yaffe, & Covinsky, 2002), as has vision loss
(M. Y. Lin et al., 2004). Health behaviors that predict functional impairment include
smoking (Liao et al., 2011), overweight (Bruce, Fries, & Hubert, 2008; Chakravarty et
al., 2012) and physical inactivity (Reynolds & Silverstein, 2003; Stuck et al., 1999). Of
23
these, the relationship between physical activity and lower-extremity function is the focus
of this study and is discussed in detail in the following section.
Physical Activity is a Determinant of Functional Limitation and Disability
Regular engagement in physical activity is significantly associated with
functional health and reduced risk of disability, with a clear dose-response relationship
between activity intensity and maintenance or improvement in function (Hillsdon,
Brunner, Guralnik, & Marmot, 2005; Manini & Pahor, 2009; Peterson et al., 2009).
Although engaging in high intensity exercise has been shown to produce the greatest
functional and health benefits (Hrobonova, Breeze, & Fletcher, 2011; Paterson &
Warburton, 2010), maintaining a consistent regimen of high-intensity exercise can be
challenging for many older adults (American College of Sports Medicine et al., 2009).
Consequently, public health campaigns during the past decade have largely focused on
promoting more reasonable activity goals for older adults, such as the 2008
recommendation by the U.S. Department of Health and Human Services that older adults
engage in moderate-intensity aerobic activity for a minimum of 30 minutes per day on
five days of the week (U.S. Department of Health and Human Services, 2008). There is
consistent evidence that regular engagement in moderate levels of physical activity has
beneficial effects on health and function, including maintenance of lower extremity
function and reduced risk for lower-extremity functional impairment (Bruce et al., 2008;
Paterson & Warburton, 2010). Brach et al. (2003), in a 14-year study of 229 older
women, found that women with higher levels of physical activity at baseline had
significantly higher gait speed at follow-up than did women with lower baseline levels of
physical activity. Among older adults in the Cardiovascular Health Cohort, physical
24
activity, expressed in kilocalories was independently correlated with both gait speed and
time to complete 5 chair stands (Hirsch et al., 1997) .Among a cohort of 6398 adults aged
39-63 years old, meeting recommended levels of physical activity at baseline was
associated with a 1.63 greater odds of reporting no functional limitations at 8-year
follow-up (Hillsdon et al., 2005). The protective effects of moderate physical activity on
declines in lower-extremity function, as measured by a series of performance-based tests,
was demonstrated by Seeman and Chen (2002), who found that older adults who engaged
in regular moderate or strenuous physical activity had reduced odds of functional decline
at 3 year follow-up.
While the effects of low intensity physical activity, such as walking at a regular
pace, on lower extremity function and disability are not as well established as those of
moderate and high intensity physical activity, emerging evidence indicates that even low-
intensity activity has beneficial effects on physical function. Nusselder et al. (2008)
reported that older adults who engaged in the metabolic equivalent of walking at an
average pace for 4-6 hours per week (METS 12-17/wk) had a significant reduction in
hazard of mobility or ADL disability (HR = .66) when compared to those with low levels
(<12 METS/wk) of physical activity. Calculating the number of years free of disability,
they found that engaging in this level of physical activity would result in 4.0 additional
years free of disability for women and 3.1 for men, compared to those in the lowest
METS group.
Findings from several studies indicate that maintaining or increasing levels of
physical activity can slow or reverse established functional decline. Manini et al. (2010)
conducted a randomized controlled trial of the effects of a moderate intensity exercise
25
program among a sample of 424 older adults who were sedentary at baseline with low to
moderate lower-extremity function as measured by the SPPB. Both at six months and one
year, the intervention group had statistically significant increases in their SPPB score and
400-meter walk speed compared to the control group from baseline. In the study
previously described by Nusselder et al. (2008), older adults who engaged in the
metabolic equivalent of 4-6 hours of normal walking per week had a significantly
increased hazard of recovering from disability (HR =1.95). A pilot test of the effects of a
12-week, moderate intensity, function-focused exercise program on performance-based
measures of physical function among older adults with functional impairment was
conducted by Protas & Tissier (2009). After 12 weeks, participants gait speed improved
an average of .36 meters/sec and their SPPB score improved an average of 3.2 points.
Participants continued to demonstrate gains in gait speed and improved function at six-
moth follow up. These and other studies suggest that promoting physical activity among
older adults can result not only in preservation of lower extremity function but can
actually reverse functional decline.
Improving the health and function of older adults by increasing physical activity
engagement has been a major focus of both public health research and practice for the
past two decades. Until recently, this focus has largely been centered on individual-level
approaches to increasing leisure-time physical activity, such as educating people on the
benefits of physical activity, or developing, testing and piloting exercise interventions.
Despite these efforts, over the past ten years the prevalence of leisure-time physical
activity participation has not changed (Carlson, Fulton, Schoenborn, & Loustalot, 2010;
Troiano et al; 2008). Accordingly, there has been increasing awareness in the public
26
health field of the contribution of non-recreational physical activity to overall activity
levels, with the recognition that the long-term trend toward inactive or sedentary
lifestyles among US adults is, in part, attributable to declines in active travel (Brownson,
Boehmer, & Luke, 2005). For example, between the years of 1960 to 2000, the percent of
workers walking to work declined from 10.3% to 2.9% (Federal Highway
Administration, 2010). Similarly, the proportion of overall trips taken by waking declined
from 9.3% in 1970 to 5.3% in 1995 (Alfonzo, 2005). This is widely considered to be
attributable, at least partially, to the decentralized, suburban development patterns that
became increasingly common in the last half of the 20th
century (Ewing, Schmid,
Killingsworth, Zlot, & Raudenbush, 2003). Because individual‘s activity space tends to
constrict with age, older adults may be particularly vulnerable to the deleterious effects of
urban ―sprawl.‖ As Balfour and Glass (2003) note, the design of many residential
neighborhoods is not conducive to meeting the activity needs of older adults with
diminishing competence. They suggest that design features such the proximity and
concentration of resources and amenities, access to public transportation, and location of
parks and other neighborhood resources may promote activity and function among older
adults. A shared concern with identifying the features of the built environment that
promote an active lifestyle can be found in the field of urban planning, where a
significant body of work has examined how features of the neighborhood built
environment influence activity and travel decisions.
27
The Urban Planning Perspective
Demand theory. Demand theory is the most widely used theoretical approach
within the disciplines of urban planning and transportation science to explain how
characteristics of the built environment predict travel behavior. Broadly speaking, travel
can be simply defined as the ―movement through space‖ (Mokhtarian & Salomon, 2001)
and encompasses both motorized and non-motorized travel modes. Of the non-motorized
forms of travel, the two most common are walking and cycling, which together are
grouped under the umbrella of ―active travel.‖ From the transportation modeling
perspective, travel is generally assumed to be a derived demand, i.e., it is a disutility that
is endured for the purpose of arriving at a desired destination (Hoehner, Brennan,
Brownson, Handy, & Killingsworth, 2003). Travel occurs because people desire to
participate in an activity at their destination. A fundamental concept in the transportation
modeling conceptualization of travel behavior is that of utility maximization, which
posits that individuals select a particular mode of travel by considering the relative utility
of the transportation choices available to them in their environment and making a
decision based on a rational calculation of the utility of each potential choice (Handy,
2005). Therefore, urban form influences travel behavior through the range and
characteristics of transportation choices that are available within the environment, such as
the proximity of public transportation, the presence and condition of sidewalks, and the
interconnectedness of street networks (Handy, Boarnet, Ewing, & Killingsworth, 2002).
Early models typically focused on predicting travel behavior as a function of the relative
cost and duration of each mode, hypothesizing that minimization of travel time and cost
would dominate travel decisions. However, as evidence has emerged that other
28
characteristics, such as the ―attractiveness‖ of the destination or the pleasure of the mode,
influence persons to choose more distant destinations or to choose more time intensive
modes of travel, these early models are being supplanted by activity-based models which
also take into account the location and characteristics of travel routes and destinations
(Handy, 2005).
The “three d’s”: Density, diversity, and design. There is no an agreed upon
nomenclature for the aspects of the built environment thought to influence travel
behavior, though one that is commonly used is the ―3D‘s‖ of density, diversity and design
(Cervero & Kockelman, 1997). Density can refer to the number of people, dwelling units,
buildings, etc. within a given unit of area, though it is most commonly operationalized as
population density. Diversity is a measure of land use and refers to the spatial distribution
of activities and the physical structures that house those activities. Geographic areas
where one type of use (residential, commercial, industrial, etc.) predominates are referred
to as single-use. In contrast, mixed-use development is characterized by a diversity of
activities located in close geographic proximity. Design is a broad term that includes both
structural and aesthetic characteristics. The most widely measured structural
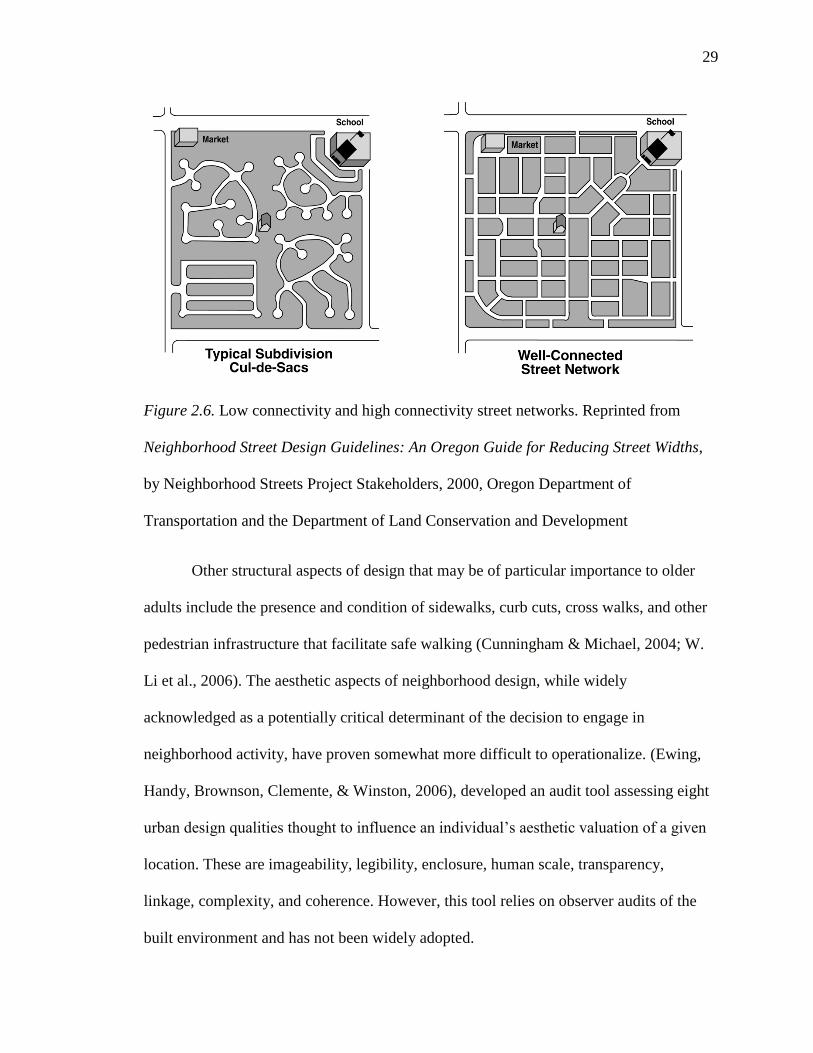
characteristic is the connectedness of the street grid. This is illustrated in Figure 2.6. The
image on the left side depicts a loosely connected suburban network, which would be
said to have low connectivity, while the image on the right depicts a tightly connected
urban grid network with high connectivity.
29
Figure 2.6. Low connectivity and high connectivity street networks. Reprinted from
Neighborhood Street Design Guidelines: An Oregon Guide for Reducing Street Widths,
by Neighborhood Streets Project Stakeholders, 2000, Oregon Department of
Transportation and the Department of Land Conservation and Development
Other structural aspects of design that may be of particular importance to older
adults include the presence and condition of sidewalks, curb cuts, cross walks, and other
pedestrian infrastructure that facilitate safe walking (Cunningham & Michael, 2004; W.
Li et al., 2006). The aesthetic aspects of neighborhood design, while widely
acknowledged as a potentially critical determinant of the decision to engage in
neighborhood activity, have proven somewhat more difficult to operationalize. (Ewing,
Handy, Brownson, Clemente, & Winston, 2006), developed an audit tool assessing eight
urban design qualities thought to influence an individual‘s aesthetic valuation of a given
location. These are imageability, legibility, enclosure, human scale, transparency,
linkage, complexity, and coherence. However, this tool relies on observer audits of the
built environment and has not been widely adopted.
30
Subsequent authors have employed two additional categories, distance to transit
and destination accessibility, which are helpful to further differentiate the aspects of the
built environment thought to influence activity (Ewing & Cervero, 2001; Ewing et al.,
2009). Destination accessibility is the degree to which given resources are locally
accessible. As may be evident, destination accessibility can be regarded as a function of
both the diversity of choices within a given area and the design of the street network that
permits travel between locations. However, it is a helpful category because it allows for
the operationalization of measures of accessibility to particular destinations that may be
of interest. The last category, Distance to transit is a measure of the accessibility of a
particular class of destinations, public transit resources. Because most public transit trips
begin and end with walking, this is seen as an important potential determinant of walking
activity. It is typically measured as the distance between the residence and the nearest
transit stop, though may also be measured and the number of stops within a defined
geographic space (Ewing & Cervero, 2010).
Neighborhood accessibility. The influence of demand theory and utility
maximization theory is evident in the assumption that factors such as proximity of
resources (e.g., parks, recreational facilities, grocery stores, transit stops) and
connectedness of street grids increase the likelihood of walking. This relationship
between characteristics off the street network and the availability and characteristics of
likely travel destinations has been conceptualized in the urban planning literature as
neighborhood accessibility. Handy (1996) defines neighborhood accessibility as ―the
pattern of activities; their quantity, quality, variety, and proximity; and the connectivity
between them as provided by the transportation system‖ (p. 184). This concept of
31
accessibility is closely related to ideas of neighborhood walkability. Thus, in the urban
planning literature, pedestrian-oriented neighborhoods are most commonly thought to be
characterized by high density of development; mixed land-use; highly connective,
human-scale street networks; and desirable aesthetic qualities (Agrawal, Schlossberg, &
Irvin, 2008; Handy et al., 2002; Pedestrian Transit Program, 1998). This
conceptualization of pedestrian-oriented neighborhoods, or ‗walkability‘, guided the
selection of neighborhood built environment variables chosen in the proposed study.
Empirical evidence. How features of the neighborhood environment influence
physical activity has been a subject of intense interest to public health researchers in the
past decade, as the failure to achieve substantial gains in population levels of physical
activity reveals the limitations of individual-level approaches to activity promotion
(Carlson et al., 2010). To date, over 200 studies, most conducted in the last decade, have
examined the relationship between various forms of physical activity, primarily walking,
and the social and physical characteristics of neighborhoods in which those activities
largely occur (Ewing & Cervero, 2010). The preponderance of evidence indicates that
physical activity, particularly walking, is associated with characteristics of the
neighborhood built environment (Sallis et al; 2009). For example, studies have found
associations between walking and measures of land-use mix (Frank, Kerr, Rosenberg, &
King, 2010; Berke, Koepsell, Moudon, Hoskins, & Larson 2007; Nagel, Carlson,
Bosworth, & Michael, 2008) intersection density (Li, Fisher, Brownson, and Bosworth,
2005) public transportation access (Su, Schmocker, & Bell, 2009), and proximity of
parks/green spaces (Michael et al., 2010; F. Li et al., 2005). However, within this
literature there is no clear consensus on precisely which characteristics of the built
32
environment are associated with physical activity. Largely, this is a result of the
methodological diversity, both in how neighborhood built environment and physical
activity are defined and measured, that characterizes this field of study. For example,
neighborhood environment may be measured objectively or subjectively, which is an
important distinction because residents‘ subjective perceptions of neighborhood
characteristics have generally been found to differ from objectively measured
characteristics (Ball, Crawford, Roberts, Salmon, & Timperio, 2008; Boehmer, Hoehner,
Wyrwich, Brennan Ramirez, & Brownson, 2006), and previous studies indicate that
perceived features of the neighborhood environment and objectively measured features
have differential effects on physical activity (Gebel, Bauman, & Petticrew, 2007;
Hoehner, Brennan Ramirez, Elliott, Handy, & Brownson, 2005; L. Lin & Moudon,
2010). Objective measures of the built environment, which are the focus of this study,
can be derived from aggregate-census data at the tract, or block levels; calculated using
GIS-based measures at various geographic scales; or collected during observer audits of
micro-scale design features (Brownson et al., 2009). Further, there are typically multiple
approaches to operationalizing and measuring the same underlying variable, such as land-
use mix (Handy, 2005). Similarly, the studies to date have focused on a number of
distinct types of physical activity, and they have employed a variety of measurement
approaches, further complicating cross-study comparison of findings. The result is that
there is no characteristic of the built environment which has been unambiguously
associated with physical activity--there are conflicting findings regarding the relationship
between neighborhood built environment and physical activity for every major
characteristic. Lastly, there have been relatively few studies which have examined the
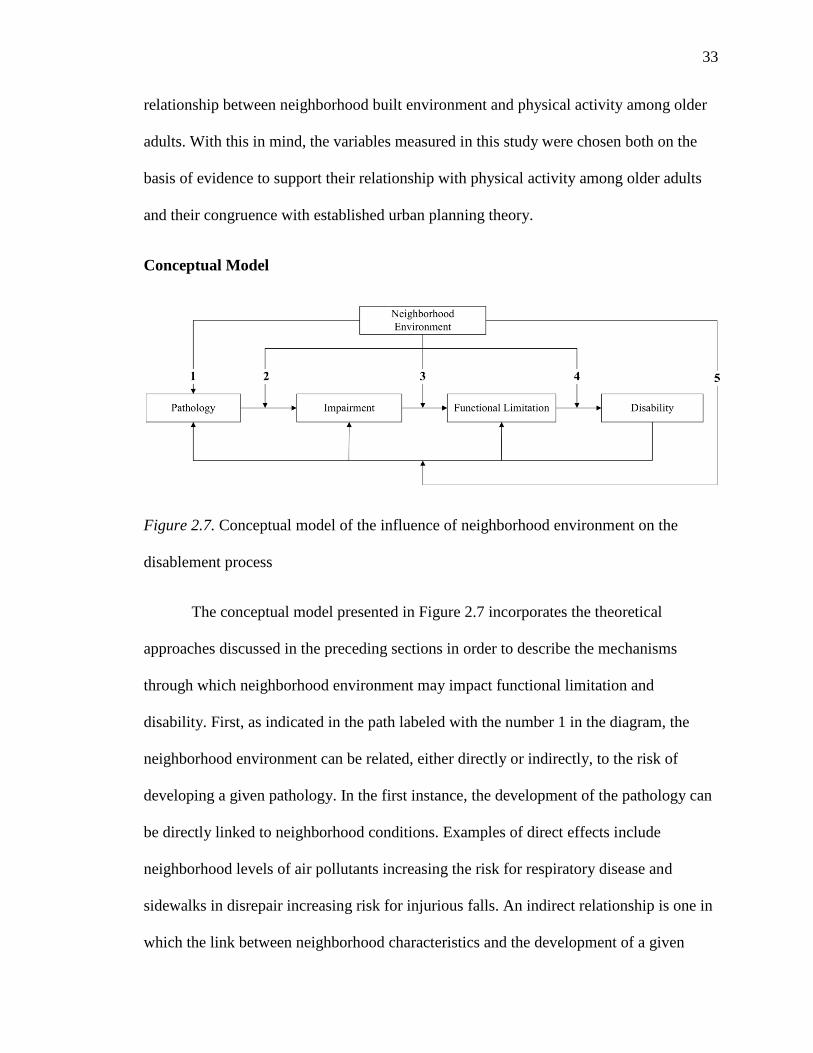
33
relationship between neighborhood built environment and physical activity among older
adults. With this in mind, the variables measured in this study were chosen both on the
basis of evidence to support their relationship with physical activity among older adults
and their congruence with established urban planning theory.
Conceptual Model
Figure 2.7. Conceptual model of the influence of neighborhood environment on the
disablement process
The conceptual model presented in Figure 2.7 incorporates the theoretical
approaches discussed in the preceding sections in order to describe the mechanisms
through which neighborhood environment may impact functional limitation and
disability. First, as indicated in the path labeled with the number 1 in the diagram, the
neighborhood environment can be related, either directly or indirectly, to the risk of
developing a given pathology. In the first instance, the development of the pathology can
be directly linked to neighborhood conditions. Examples of direct effects include
neighborhood levels of air pollutants increasing the risk for respiratory disease and
sidewalks in disrepair increasing risk for injurious falls. An indirect relationship is one in
which the link between neighborhood characteristics and the development of a given
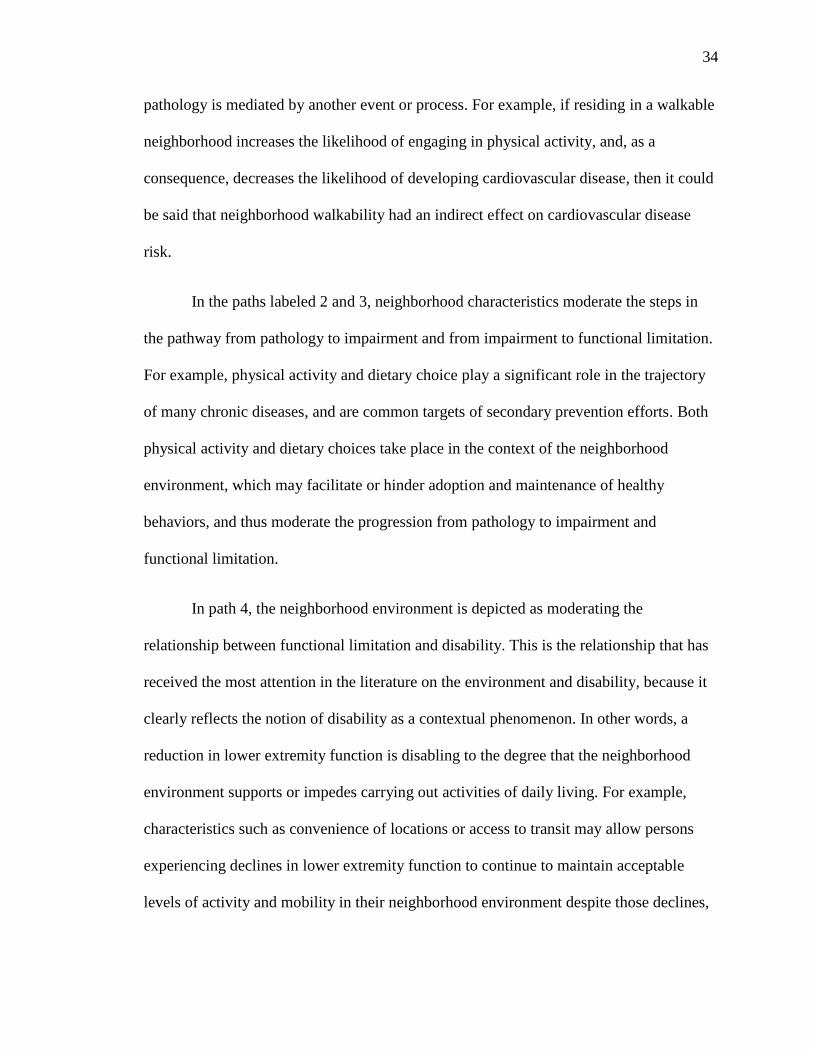
34
pathology is mediated by another event or process. For example, if residing in a walkable
neighborhood increases the likelihood of engaging in physical activity, and, as a
consequence, decreases the likelihood of developing cardiovascular disease, then it could
be said that neighborhood walkability had an indirect effect on cardiovascular disease
risk.
In the paths labeled 2 and 3, neighborhood characteristics moderate the steps in
the pathway from pathology to impairment and from impairment to functional limitation.
For example, physical activity and dietary choice play a significant role in the trajectory
of many chronic diseases, and are common targets of secondary prevention efforts. Both
physical activity and dietary choices take place in the context of the neighborhood
environment, which may facilitate or hinder adoption and maintenance of healthy
behaviors, and thus moderate the progression from pathology to impairment and
functional limitation.
In path 4, the neighborhood environment is depicted as moderating the
relationship between functional limitation and disability. This is the relationship that has
received the most attention in the literature on the environment and disability, because it
clearly reflects the notion of disability as a contextual phenomenon. In other words, a
reduction in lower extremity function is disabling to the degree that the neighborhood
environment supports or impedes carrying out activities of daily living. For example,
characteristics such as convenience of locations or access to transit may allow persons
experiencing declines in lower extremity function to continue to maintain acceptable
levels of activity and mobility in their neighborhood environment despite those declines,
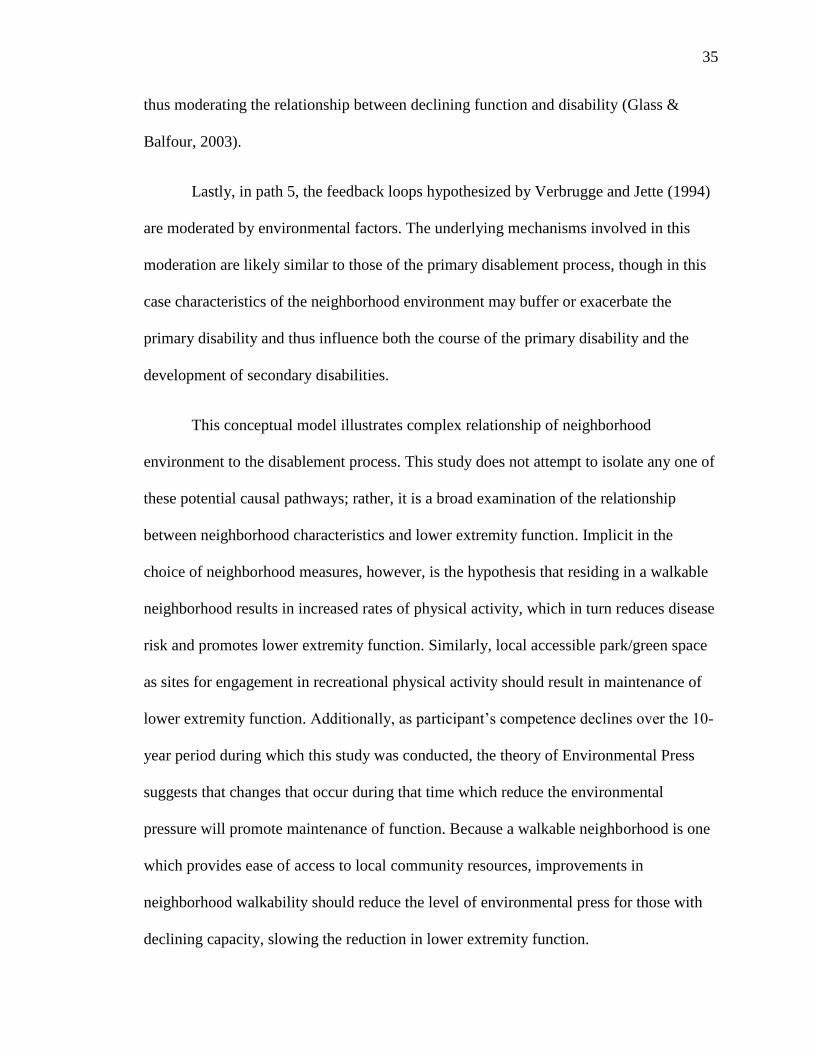
35
thus moderating the relationship between declining function and disability (Glass &
Balfour, 2003).
Lastly, in path 5, the feedback loops hypothesized by Verbrugge and Jette (1994)
are moderated by environmental factors. The underlying mechanisms involved in this
moderation are likely similar to those of the primary disablement process, though in this
case characteristics of the neighborhood environment may buffer or exacerbate the
primary disability and thus influence both the course of the primary disability and the
development of secondary disabilities.
This conceptual model illustrates complex relationship of neighborhood
environment to the disablement process. This study does not attempt to isolate any one of
these potential causal pathways; rather, it is a broad examination of the relationship
between neighborhood characteristics and lower extremity function. Implicit in the
choice of neighborhood measures, however, is the hypothesis that residing in a walkable
neighborhood results in increased rates of physical activity, which in turn reduces disease
risk and promotes lower extremity function. Similarly, local accessible park/green space
as sites for engagement in recreational physical activity should result in maintenance of
lower extremity function. Additionally, as participant‘s competence declines over the 10-
year period during which this study was conducted, the theory of Environmental Press
suggests that changes that occur during that time which reduce the environmental
pressure will promote maintenance of function. Because a walkable neighborhood is one
which provides ease of access to local community resources, improvements in
neighborhood walkability should reduce the level of environmental press for those with
declining capacity, slowing the reduction in lower extremity function.
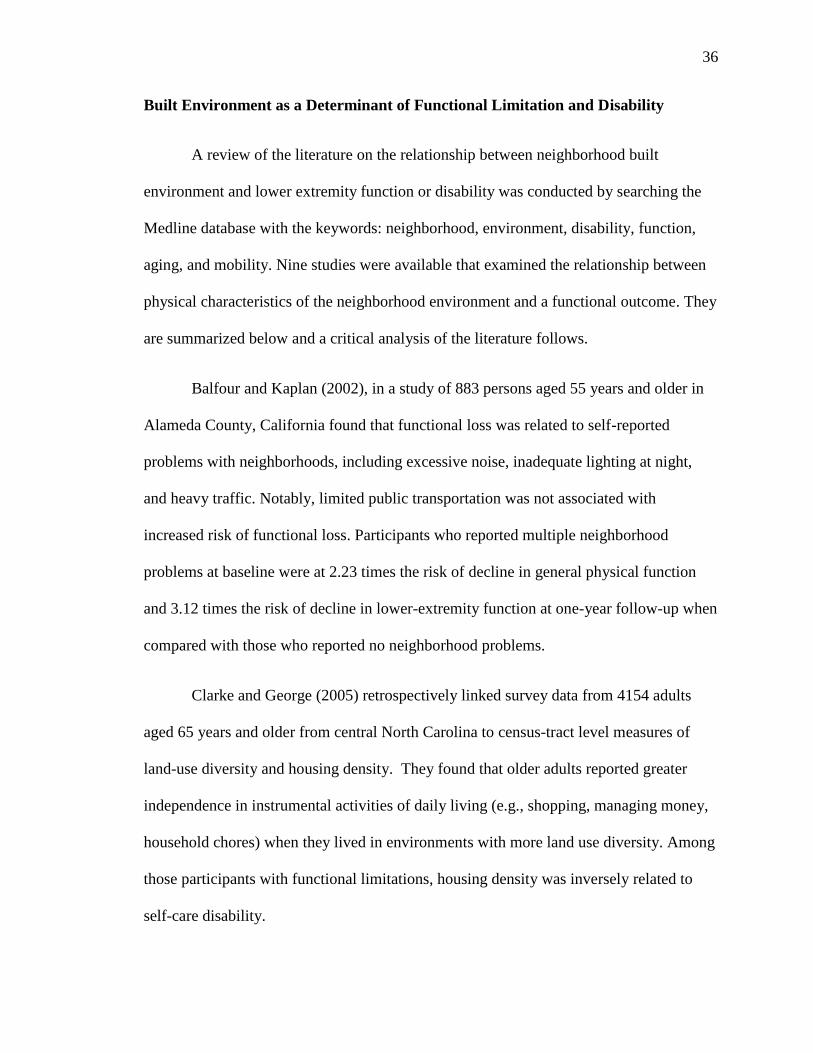
36
Built Environment as a Determinant of Functional Limitation and Disability
A review of the literature on the relationship between neighborhood built
environment and lower extremity function or disability was conducted by searching the
Medline database with the keywords: neighborhood, environment, disability, function,
aging, and mobility. Nine studies were available that examined the relationship between
physical characteristics of the neighborhood environment and a functional outcome. They
are summarized below and a critical analysis of the literature follows.
Balfour and Kaplan (2002), in a study of 883 persons aged 55 years and older in
Alameda County, California found that functional loss was related to self-reported
problems with neighborhoods, including excessive noise, inadequate lighting at night,
and heavy traffic. Notably, limited public transportation was not associated with
increased risk of functional loss. Participants who reported multiple neighborhood
problems at baseline were at 2.23 times the risk of decline in general physical function
and 3.12 times the risk of decline in lower-extremity function at one-year follow-up when
compared with those who reported no neighborhood problems.
Clarke and George (2005) retrospectively linked survey data from 4154 adults
aged 65 years and older from central North Carolina to census-tract level measures of
land-use diversity and housing density. They found that older adults reported greater
independence in instrumental activities of daily living (e.g., shopping, managing money,
household chores) when they lived in environments with more land use diversity. Among
those participants with functional limitations, housing density was inversely related to
self-care disability.
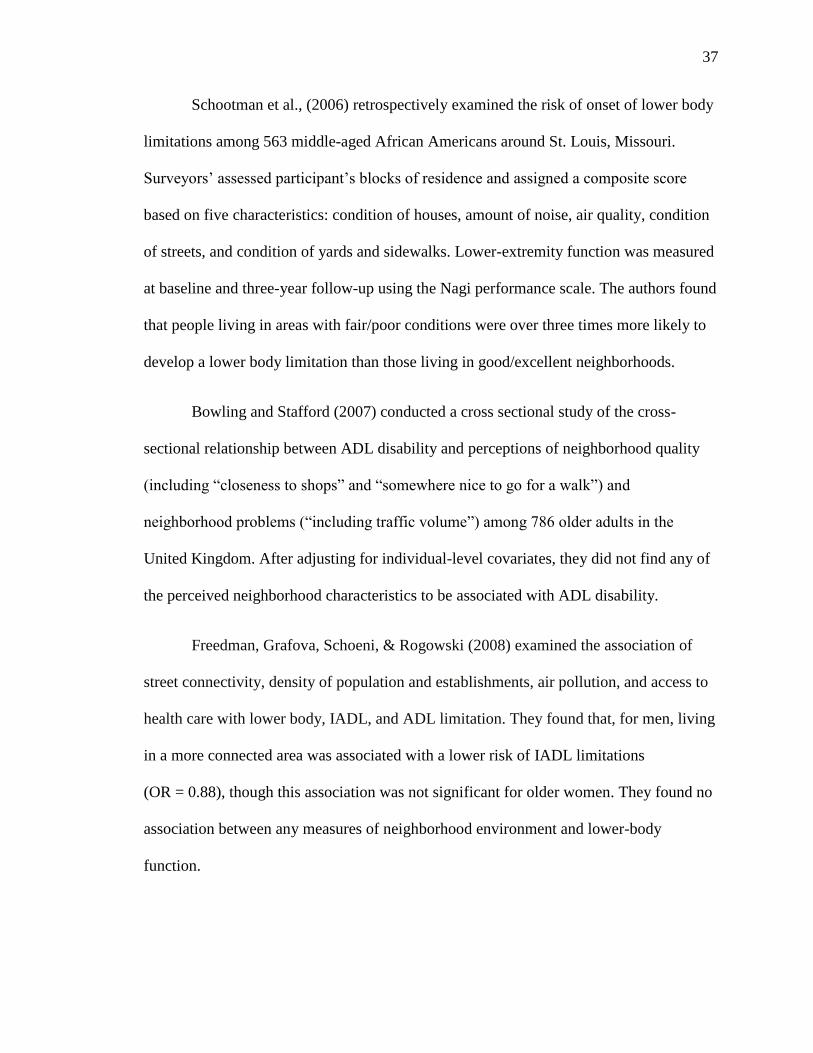
37
Schootman et al., (2006) retrospectively examined the risk of onset of lower body
limitations among 563 middle-aged African Americans around St. Louis, Missouri.
Surveyors‘ assessed participant‘s blocks of residence and assigned a composite score
based on five characteristics: condition of houses, amount of noise, air quality, condition
of streets, and condition of yards and sidewalks. Lower-extremity function was measured
at baseline and three-year follow-up using the Nagi performance scale. The authors found
that people living in areas with fair/poor conditions were over three times more likely to
develop a lower body limitation than those living in good/excellent neighborhoods.
Bowling and Stafford (2007) conducted a cross sectional study of the cross-
sectional relationship between ADL disability and perceptions of neighborhood quality
(including ―closeness to shops‖ and ―somewhere nice to go for a walk‖) and
neighborhood problems (―including traffic volume‖) among 786 older adults in the
United Kingdom. After adjusting for individual-level covariates, they did not find any of
the perceived neighborhood characteristics to be associated with ADL disability.
Freedman, Grafova, Schoeni, & Rogowski (2008) examined the association of
street connectivity, density of population and establishments, air pollution, and access to
health care with lower body, IADL, and ADL limitation. They found that, for men, living
in a more connected area was associated with a lower risk of IADL limitations
(OR = 0.88), though this association was not significant for older women. They found no
association between any measures of neighborhood environment and lower-body
function.
38
Using data from 1195 participants in the Chicago Community Adult Heath Study,
Clarke et al. (2008), examined the cross-sectional relationships between self-reported
mobility disability and observer-rated measures of sidewalk and street condition, physical
disorder, and residential security in a four block radius around each participant‘s
residence. None of the built environment measures were associated with the probability
of mobility disability among those participants without any physical impairment. They
did find that the condition of sidewalks and streets was significantly associated with the
degree of mobility disability among those participants with reported impairment,
indicating that the built environment modified the relationship between functional
limitation and impairment.
Clarke et al. (2009), in a sample of 1821 adults, examined the relationship of
trajectory of self-reported mobility disability over 15 years to census-tract measures of
population density and proportion of workers who commute by public transit or walking.
They found that older adults aged 75 or more who lived in a census tract with a low
proportion of commuters who walked or used public transit had 1.5 greater odds of
developing mobility disability than older adults who lived in a tract with a high
proportion of commuters who walked or used public transit. This association was not
significant for younger adults and they did not find a significant association between
population density and mobility disability.
Beard et al. (2009) performed a cross-sectional analysis linking census-level
disability data (―physical disability‖ and ―going outside the home disability‖) to census-
level measures of land-use mix, neighborhood decay, and street characteristics among the
937,857 respondents to the US Census in New York City. A composite measure of
39
―street characteristics‖ (specifically low density of intersections, low number of street
trees, and greater distance to a bus stop) was significantly associated with the prevalence
of both disability types. A measure of land-use mix was not associated with the
prevalence of disability in this study.
Michael, Gold, Perrin, and Hillier (2011) conducted a longitudinal study of the
associations between performance-based measures of lower-extremity function and
census-tract level measures of street connectivity and street density among older women
enrolled in the Portland, Oregon cohort of the Study of Osteoporotic Fractures. Among
women who reported walking at baseline, they found that both street connectivity and
street density were significantly associated with change in chair rise time but not with
baseline chair rise time. Women who lived in census tracts with greater street
connectivity or greater street density had less of an increase in chair rise time over the
study period. This association was not significant for the women who reported not
walking at baseline, and there were no significant associations observed between the built
environment measures and trajectory of gait speed.
Similar to the literature on the relationship between the built environment and
physical activity, there is little methodological consistency in the above studies. Aspects
of the physical environment assessed include street characteristics, connectivity, noise,
air quality, condition of houses, population density, land-use mix, and sidewalk
condition. One study used factor analysis to create composite measures of neighborhood
characteristics such as ‗neighborhood decay‘ (Beard et al., 2009). This strategy, however,
makes it difficult to understand the relationship of specific neighborhood characteristics
to the outcome, and it limits our ability to compare results across studies. Furthermore,
40
this wide array of characteristics results in there being very few which have more than a
single study to support observed associations.
These studies utilize several different geographic scales within which
neighborhood characteristics are measured. The majority used census tract measures,
although these are generally regarded as less robust than measures derived from GIS data
in geographic areas centered around participants residential addresses. To date, no study
of the relationship between neighborhood environment and functional decline has
employed GIS technology to construct measures of the objective features of the
neighborhood built environment around participants‘ residential addresses. This is
particularly salient among older adults with potential functional limitation or disability,
because both aging and disability are associated with a reduction in the spatial range of
one‘s daily functional activities (Guralnik et al., 1996). Studies of neighborhood effects
have increasingly favored objective measurement, though there are potential differences
between the objective neighborhood environment and the perceived neighborhood
environment that could have differential effects on health and behavior (L. Lin &
Moudon, 2010; Weden, Carpiano, & Robert, 2008; Wen, Hawkley, & Cacioppo, 2006).
Thus, while one study found that both objective characteristics and perceived
neighborhood problems were associated with functional difficulty (Balfour & Kaplan,
2002) another only found objective characteristics to be associated with functional
limitation (Schootman et al., 2006).
The studies cited utilized a variety of measures of function and disability, including
subjective measures of lower body function or mobility, self-reported ability to perform
ADLs and IADLs, and performance based measures of physical function. As with the
41
neighborhood environment measures, the diversity of outcome variables and the lack of
consistency in measurement across studies limits comparison. In regards to physical
environment, for example, Freedman et al. (2008) found that greater street connectivity
was associated with increased ability to perform IADLs among older men. However,
connectivity was not associated with the performance of ADLs or with lower body
limitations, a finding supported by Beard et al. (2009) who found no associations
between a measure of connectivity and either physical disability or ‗going outside the
home‘ disability. They also found that a composite measure of neighborhood decay was
not significantly associated with their measures of disability, a finding which conflicts
with that of Schootman et al. (2006), who reported a significant association between a
similar measure and lower-body functional limitation.
Generally speaking, however, these studies provide tentative support for the general
hypothesis that neighborhood characteristics play a role in the development and
progression of functional impairment and disability among older adults. All but one
found a significant association between at least one of the neighborhood characteristics
and the outcome being measured, though the specific results are mixed and difficult to
compare across studies due to their methodological variation. Both studies examining the
physical environment as a moderator of the relationship between physical impairment
and disability reported significant findings. Clarke and George (2005) report housing
density to be a modifier of ADL ability and land-use diversity to be a modifier of IADL
ability among those with reported lower extremity impairment. Similarly, condition of
streets was found to be a significant modifier of mobility disability among functionally
impaired adults (Clarke et al., 2008).
42
While these previous studies laid the groundwork for understanding the effects of
the neighborhood built environment on the disablement process, the review of literature
revealed significant gaps in our understanding that were addressed by this study. First,
the majority of studies were cross-sectional and thus unable to examine changes in
function or disability over time. Only four studies examined change in lower extremity
function or functional ability over time (Balfour et al., 2002; Clarke et al., 2009; Michael
et al., 2011; Schootman et al., 2006). Second, previous studies typically employed either
subjective measures of neighborhood environment which are subject to bias, or imprecise
objective measures of the built environment at the level of census tract or counties, which
may not accurately reflect the local neighborhood characteristics experienced by
participants (Flowerdew, Manley, & Sabel, 2008). Similarly, these studies largely relied
upon a variety of self-reported functional status measures, including measures of ADL
performance, IADL, performance, and lower-extremity function. Lastly, though all of the
samples in these studies contained older adults, only four consisted solely of adults aged
65 years or older (Beard et al., 2009; Bowling et al., 2007; Clarke & George, 2005;
Michael et al., 2011). This limits the degree to which the findings from these studies are
generalizable to older adults. Most importantly, no study to date has been designed to
examine concurrent change in neighborhood built environment and lower-extremity
function, an important first step in establishing the causal pathway between changes to
the built environment and trajectory of functional decline. This study addressed these
gaps in the literature by examining the association of objectively measured characteristics
of the neighborhood built environment to change in a performance-based measure of
lower extremity function over time.
43
Chapter 3—Research Design and Methods
Overview and Design
The purpose of this study was to determine whether the trajectory of lower
extremity function among older women is influenced by the physical characteristics of
the neighborhoods in which they live. As discussed in chapter 2, neighborhood
walkability is a dimension of the built environment that is both theoretically and
empirically related to lower-extremity function among older adults. Similarly, previous
studies have found that neighborhood distance to parks and green space is associated with
recreational physical activity. However, no previous studies have examined how change
in neighborhood walkability or neighborhood distance to park/green space impacts the
functional ability of the older adults living in those neighborhoods. Consequently, an area
of particular interest in this study was to examine whether living in a neighborhood that
became more walkable over time or had improved distance to park/green space was
associated with a less steep decline in lower extremity function.
Therefore, the specific aims of this study were to:
1. Describe the relationship between baseline neighborhood walkability and baseline
lower-extremity function among older women.
Hypothesis: Baseline neighborhood walkability is significantly associated with
baseline lower-extremity function. Women who live in more walkable
neighborhoods will have higher baseline lower-extremity function.
2. Describe the relationship between baseline neighborhood walkability and change
in lower-extremity function among older women.
44
Hypothesis: Baseline neighborhood walkability is significantly associated with
the magnitude of decline in lower-extremity function over time. Women who live
in more walkable neighborhoods will have less decline in lower-extremity
function over time.
3. Describe the relationship between change in neighborhood walkability and
change in lower-extremity function among older women.
Hypothesis: The magnitude of change in neighborhood walkability is significantly
associated with the magnitude of decline in lower-extremity function over time.
Improvement in neighborhood walkability over time is associated with a reduced
rate of lower-extremity functional decline.
4. Describe the relationship between baseline distance to neighborhood parks/green
spaces and baseline lower-extremity function among older women.
Hypothesis: Baseline distance to neighborhood parks/green spaces is significantly
associated with baseline lower-extremity function. Women who live in
neighborhoods with greater distance to a park/green space will have higher
baseline lower-extremity function.
5. Describe the relationship between baseline distance to neighborhood parks/green
spaces and change in lower-extremity function among older women.
Hypothesis: Baseline distance to neighborhood parks/green spaces is significantly
associated with the magnitude of decline in lower-extremity function over time.
Women who live in neighborhoods with greater distance to a park/green space
will have less decline in lower-extremity function over time.
45
6. Describe the relationship between change in the distance to neighborhood
parks/green spaces and change in lower-extremity function among older women.
Hypothesis: The magnitude of change in the distance to neighborhood
parks/green spaces is significantly associated with the magnitude of decline in
lower-extremity function over time. A reduction in the distance to a park/green
space over time is associated with a reduced rate of lower-extremity functional
decline.
To address these specific aims and test the above hypotheses, this study employed
a retrospective, cohort design examining concurrent change in gait speed and
neighborhood walkability over a twelve-year period among a sample of older women
living in Portland, Oregon. This study utilized a novel approach to the retrospective,
longitudinal design, using a geographic information system (GIS) to merge individual-
level and neighborhood data from several sources. Parallel-process growth curve models
of neighborhood walkability and gait speed were adjusted for age, education, complex
comorbidity, and neighborhood SES. These models were subsequently adjusted for
participant attrition using a pattern-mixture modeling approach. Because some of these
methods, notably the use of GIS to derive measures of the built environment and the
latent variable approach to modeling change, are not commonly employed in nursing
science and thus may be unfamiliar to readers, a significant portion of this chapter is
devoted to providing a requisite foundation in these areas to evaluate the current study.
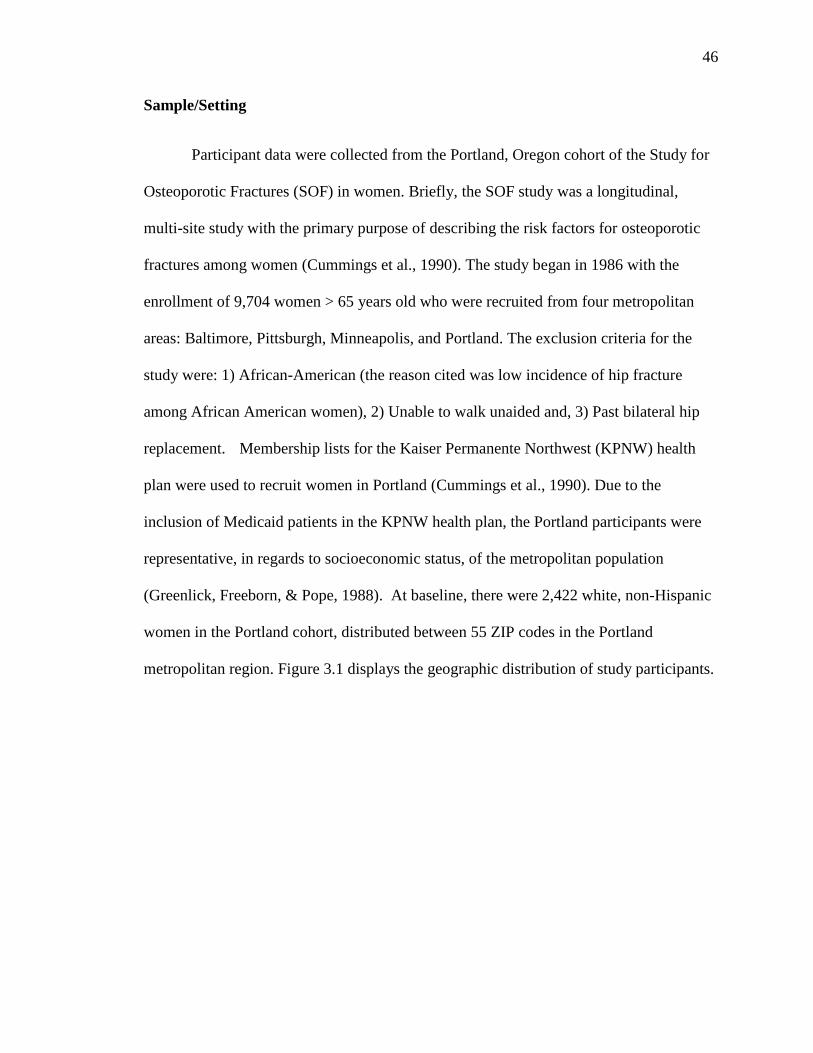
46
Sample/Setting
Participant data were collected from the Portland, Oregon cohort of the Study for
Osteoporotic Fractures (SOF) in women. Briefly, the SOF study was a longitudinal,
multi-site study with the primary purpose of describing the risk factors for osteoporotic
fractures among women (Cummings et al., 1990). The study began in 1986 with the
enrollment of 9,704 women > 65 years old who were recruited from four metropolitan
areas: Baltimore, Pittsburgh, Minneapolis, and Portland. The exclusion criteria for the
study were: 1) African-American (the reason cited was low incidence of hip fracture
among African American women), 2) Unable to walk unaided and, 3) Past bilateral hip
replacement. Membership lists for the Kaiser Permanente Northwest (KPNW) health
plan were used to recruit women in Portland (Cummings et al., 1990). Due to the
inclusion of Medicaid patients in the KPNW health plan, the Portland participants were
representative, in regards to socioeconomic status, of the metropolitan population
(Greenlick, Freeborn, & Pope, 1988). At baseline, there were 2,422 white, non-Hispanic
women in the Portland cohort, distributed between 55 ZIP codes in the Portland
metropolitan region. Figure 3.1 displays the geographic distribution of study participants.
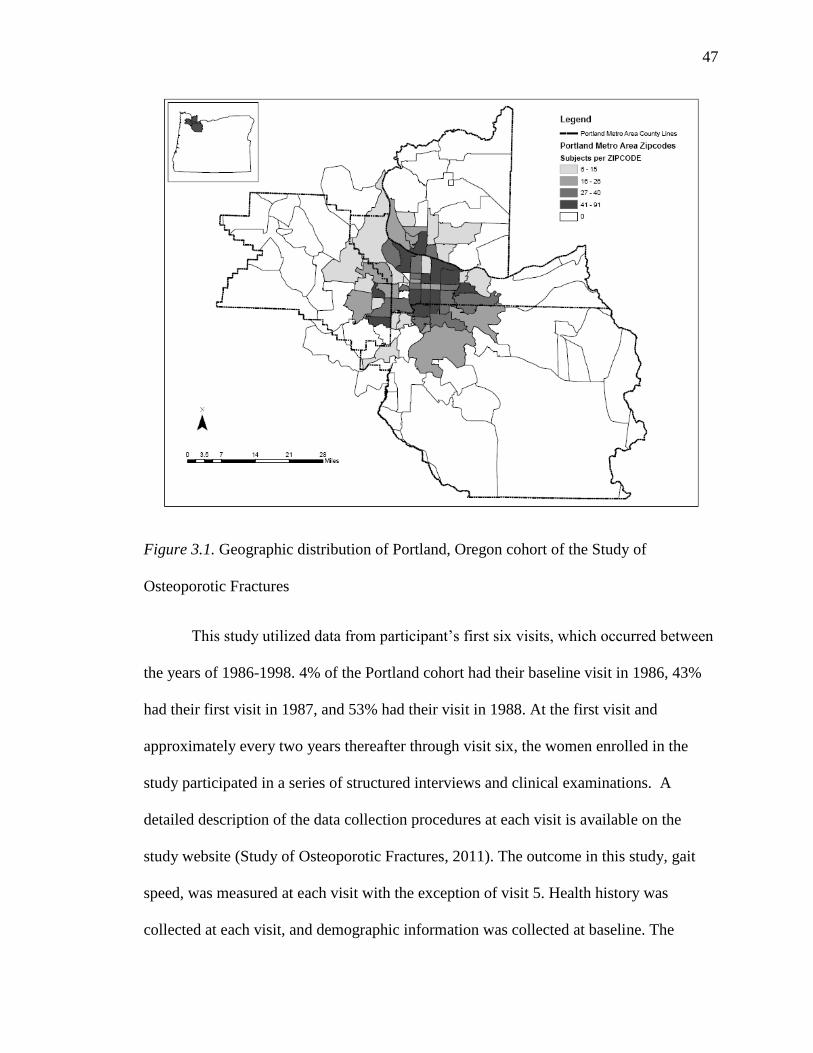
47
Figure 3.1. Geographic distribution of Portland, Oregon cohort of the Study of
Osteoporotic Fractures
This study utilized data from participant‘s first six visits, which occurred between
the years of 1986-1998. 4% of the Portland cohort had their baseline visit in 1986, 43%
had their first visit in 1987, and 53% had their visit in 1988. At the first visit and
approximately every two years thereafter through visit six, the women enrolled in the
study participated in a series of structured interviews and clinical examinations. A
detailed description of the data collection procedures at each visit is available on the
study website (Study of Osteoporotic Fractures, 2011). The outcome in this study, gait
speed, was measured at each visit with the exception of visit 5. Health history was
collected at each visit, and demographic information was collected at baseline. The
48
timeline for the collection of individual-level variables used in this study are presented in
Figure 3.2. On average, participants contributed 6.4 years of follow-up data on the
outcome measure. Although data from subsequent visits was available, the rate of
attrition from the study increased sharply after the sixth visit. Between the sixth and
seventh visit, 24% of the baseline sample were lost to attrition, leaving only 22% of the
baseline sample for analysis. Such a large proportion of missing data would have led to
considerable difficulty in estimating the statistical models, and given the long period of
follow-up data between visits one through six, the decision was made not to include
subsequent waves in the analysis.
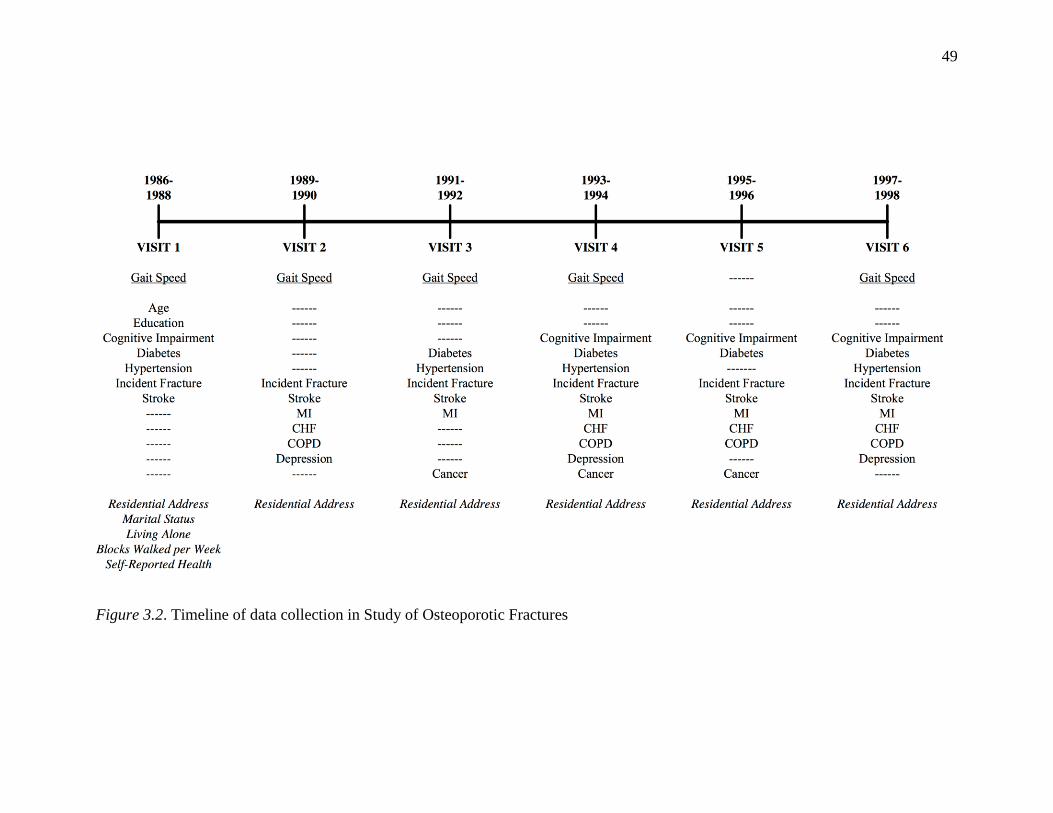
49
Figure 3.2. Timeline of data collection in Study of Osteoporotic Fractures
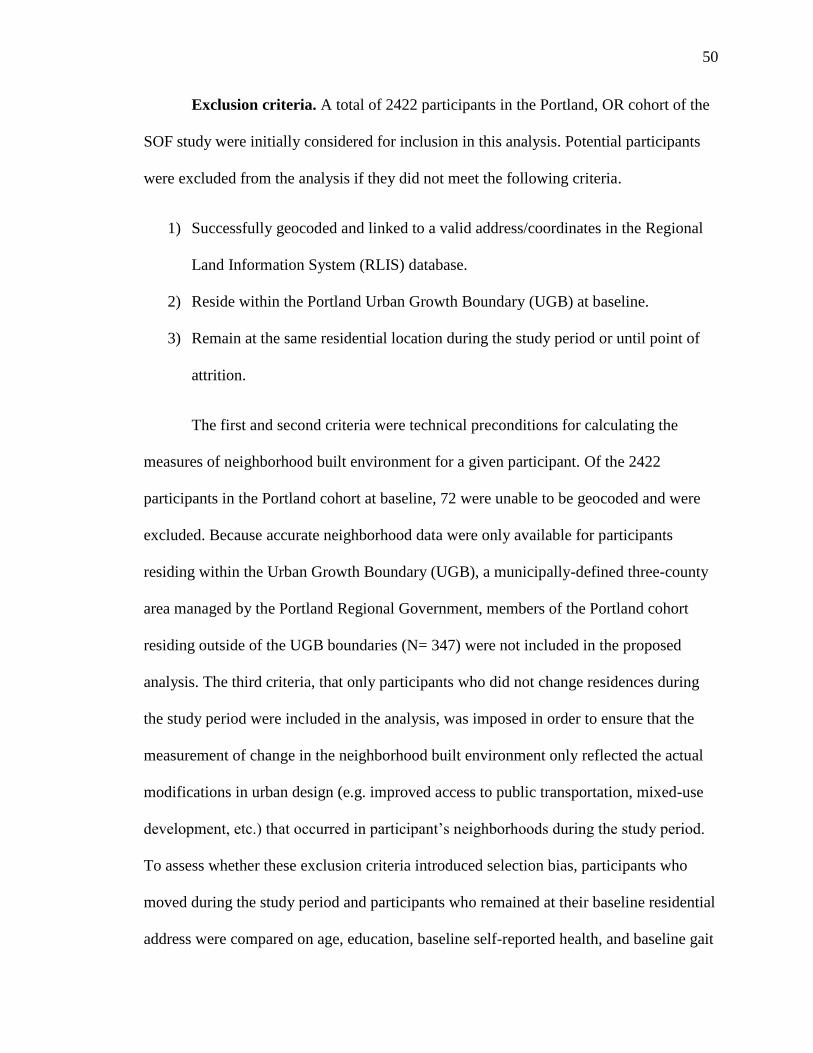
50
Exclusion criteria. A total of 2422 participants in the Portland, OR cohort of the
SOF study were initially considered for inclusion in this analysis. Potential participants
were excluded from the analysis if they did not meet the following criteria.
1) Successfully geocoded and linked to a valid address/coordinates in the Regional
Land Information System (RLIS) database.
2) Reside within the Portland Urban Growth Boundary (UGB) at baseline.
3) Remain at the same residential location during the study period or until point of
attrition.
The first and second criteria were technical preconditions for calculating the
measures of neighborhood built environment for a given participant. Of the 2422
participants in the Portland cohort at baseline, 72 were unable to be geocoded and were
excluded. Because accurate neighborhood data were only available for participants
residing within the Urban Growth Boundary (UGB), a municipally-defined three-county
area managed by the Portland Regional Government, members of the Portland cohort
residing outside of the UGB boundaries (N= 347) were not included in the proposed
analysis. The third criteria, that only participants who did not change residences during
the study period were included in the analysis, was imposed in order to ensure that the
measurement of change in the neighborhood built environment only reflected the actual
modifications in urban design (e.g. improved access to public transportation, mixed-use
development, etc.) that occurred in participant‘s neighborhoods during the study period.
To assess whether these exclusion criteria introduced selection bias, participants who
moved during the study period and participants who remained at their baseline residential
address were compared on age, education, baseline self-reported health, and baseline gait
51
speed. After imposition of all exclusion criteria, 1256 women remained in the baseline
sample and were included in the analysis. Although the precise calculation of statistical
power of latent growth curve models is exceedingly difficult, simulation studies indicate
that a sample this large was sufficient to avoid problems with model estimation and
convergence (Hertzog, von Oertzen, Ghisletta, & Lindenberger, 2008). A diagram
depicting the steps in sample selection is presented in Figure 3.3.
Figure 3.3. Steps in sample selection, SOF Neighborhood Study, 1986 -1998
52
Informed consent procedures. This study was part of a larger, ongoing R01 examining
the relationship of neighborhood built environment to changes in physical activity, BMI,
and function among older women. It received full IRB approval at both Oregon Health
and Science University (OHSU) and the Kaiser Permanente Center for Health Research
(KPCHR). Informed consent procedures for the proposed study were conducted as part of
the main SOF project. Before the study began, informed consent interviews were
conducted with each potential study participant in accord with study protocols. The SOF
written informed consent form indicated that investigators affiliated with SOF could be
given access to coded data and that the information collected during the study may be
used indefinitely. The OHSU and KPCHR IRB‘s have confirmed that the original
consents allow for the use of data collected from the SOF participants for the current
analysis. For purposes of linking participant address data to Metro GIS data, the OHSU
IRB and CHR IRB have verified that additional consent to create the neighborhood
design characteristics was not required, because the Metro government met the definition
of a business associate under HIPAA regulations.
Individual-Level Variables
As stated above, the measures of the individual-level variables used in this study
were collected from the Portland, Oregon cohort of the Study of Osteoporotic Fractures.
Table 3.1 provides the scale and coding of each individual-level measure included in the
analyses. They are discussed in detail below.
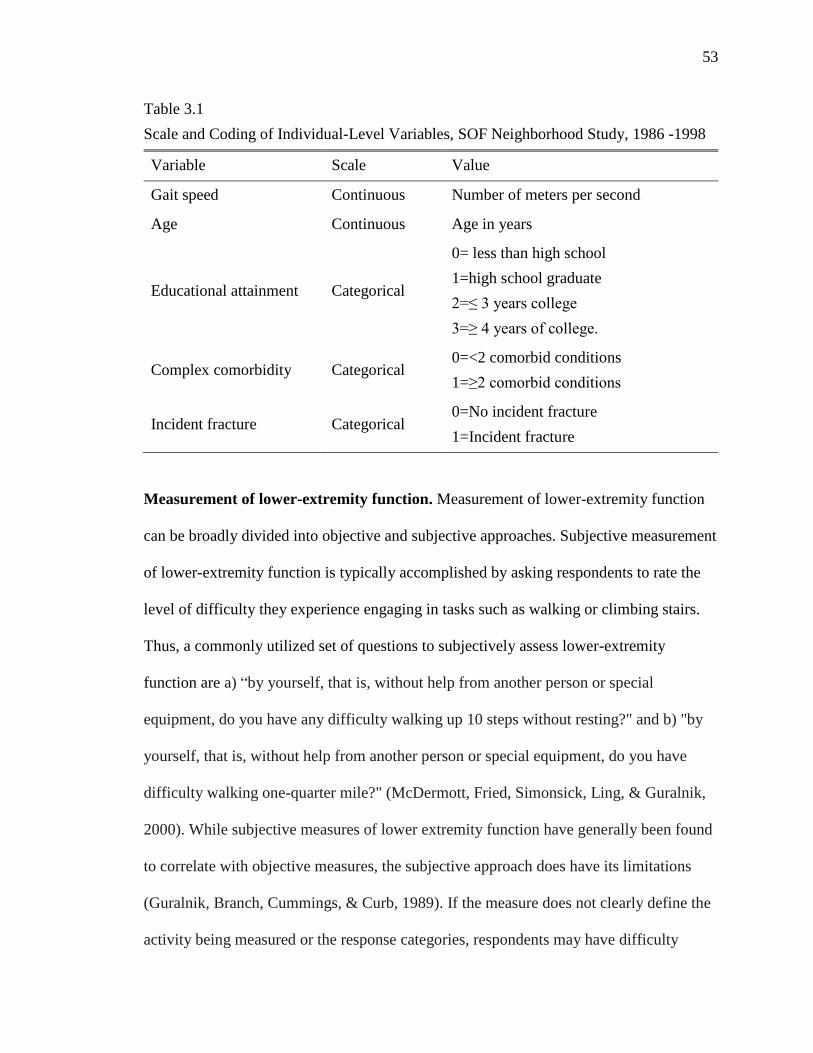
53
Table 3.1
Scale and Coding of Individual-Level Variables, SOF Neighborhood Study, 1986 -1998
Variable Scale Value
Gait speed Continuous Number of meters per second
Age Continuous Age in years
Educational attainment Categorical
0= less than high school
1=high school graduate
2=≤ 3 years college
3=≥ 4 years of college.
Complex comorbidity Categorical 0=<2 comorbid conditions
1=≥2 comorbid conditions
Incident fracture Categorical 0=No incident fracture
1=Incident fracture
Measurement of lower-extremity function. Measurement of lower-extremity function
can be broadly divided into objective and subjective approaches. Subjective measurement
of lower-extremity function is typically accomplished by asking respondents to rate the
level of difficulty they experience engaging in tasks such as walking or climbing stairs.
Thus, a commonly utilized set of questions to subjectively assess lower-extremity
function are a) ―by yourself, that is, without help from another person or special
equipment, do you have any difficulty walking up 10 steps without resting?" and b) "by
yourself, that is, without help from another person or special equipment, do you have
difficulty walking one-quarter mile?" (McDermott, Fried, Simonsick, Ling, & Guralnik,
2000). While subjective measures of lower extremity function have generally been found
to correlate with objective measures, the subjective approach does have its limitations
(Guralnik, Branch, Cummings, & Curb, 1989). If the measure does not clearly define the
activity being measured or the response categories, respondents may have difficulty
54
accurately or consistently reporting their level of difficulty, a source of measurement
error that is compounded in longitudinal studies (Bontempo, Frederick, & Hofer, 2012).
Similarly, because these measures ask respondents to rate their difficulty in performing
activities that occur in environmental contexts, they are sensitive to both intra-individual
and inter-individual environmental differences. For example, a given response to the
question ―do you have any difficulty walking up 10 steps without resting‖ is implicitly
related to characteristics of the stairs that the respondent typically climbs. This suggests
that subjective approaches may be better thought of as indicators of disability than of
functional ability. Lastly, responses to subjective measures of function are influenced by
language, culture, and education, and degree of cognitive function (Guralnik et al., 1989;
Linn, Hunter, & Linn, 1980).
Objective measures of lower-extremity function offer several advantages to
subjective approaches. They have clear face validity for the task they are assessing and
are relatively uninfluenced by environmental characteristics because they are conducted
in a standardized fashion (Guralnik et al., 1989) Thus, the score does not directly reflect
intra-individual and inter-individual differences in the environments where respondents
typically perform the task. Though training effects have been observed in some studies,
objective measures are a reliable approach to measuring change in lower extremity
function over time, as indicated by high inter-rater and test-reliability reported in
previous studies (Perera, Mody, Woodman, & Studenski, 2006; Steffen, Hacker, &
Mollinger, 2002) Lastly, they are likely to be less affected by language, culture,
education, and cognitive function than subjective measures (Guralnik et al., 1989).
55
Objective measurement of lower-extremity function is accomplished by asking
subjects to complete one or more standardized tasks and evaluating their performance
according to predetermined criteria. Most commonly these are tests of gait speed, chair
rising, and standing balance (Gill, 2010). Gait speed is measured by asking participants to
walk a short distance, 4-10 meters, typically at usual pace. The test is timed and results
are given as the number of meters per second. Often, two trials are conducted and the
average across trials is reported. Slower gait speed indicates impaired lower extremity
function (Gill, 2010). Chair rising is measured in the chair stand test, in which subjects
begin in a sitting position and, with arms folded across their chest, are asked to stand up
and sit down five times. The test is timed and the results reported as the total time in
seconds to complete the test (Gill, 2010). Standing balance can be assessed by asking
subjects to maintain side-by side, semi-tandem, and tandem standing positions for 10
seconds. Scoring is based on the duration for which subjects can maintain each position
(Gill, 2010). These three tests have been combined in the Short Performance Physical
Performance Battery (SPPB), one of the most widely used tools to assess lower extremity
function (Gill, 2010; Life Study Investigators et al., 2006). The SPPB has been
consistently found to be to be a strong predictor of the onset of both mobility and general
ADL disability (Cesari et al., 2009; Cooper et al., 2011; Guralnik et al., 1995; Wennie
Huang et al., 2010).
Results from chair stand and gait speed tests conducted at visits 1, 2, 3, 4, and 6
were available of each of the SOF participants, while results from tandem stand and
tandem walk tests were only available at visits 1, 2 and 3. This precluded combining
these measures in a manner similar to the SPPB. Furthermore, a preliminary examination
56
of the chair stand results revealed potential systematic error at wave 2, possibly reflecting
a change in the testing protocol. As a result, the decision was made to limit the current
analysis to the measure of gait speed, as previous studies have found that the gait speed
test alone performs nearly or as well as the full SPPB in predicting functional decline,
morbidity, and mortality (Studenski et al., 2003). A recent International Academy on
Nutrition and Aging (IANA) Task Force found gait speed to be as useful as composite
measures of physical performance in predicting adverse outcomes including future
mobility and ADL disability (Abellan van Kan et al., 2009).
Gait speed. The dependent variable in this study was lower extremity function,
which was operationalized as gait speed measured at usual walking pace. Specifically,
participants were asked to walk a six-meter course at their usual pace, using an assistive
device (e.g. cane or walker) if needed. The time from starting the course to when the first
foot crosses the six-meter line was measured to the nearest one-tenth second. This was
repeated and the results averaged to provide a gait speed value in meters per second.
Previous studies have reported both high test-retest reliability (ICC > .9) and inter-rater
reliability (ICC > 9) for the timed six-meter walk test (Steffen et al., 2002; Studenski et
al., 2003).
Age. Age in years was calculated at the baseline visit and included in the analysis
as a continuous variable.
Educational attainment. Educational attainment was assessed at baseline by
asking participants the highest year of education they had completed. This was recorded
as a continuous variable and subsequently categorized as less than high school, high
57
school graduate, ≤ 3 years college, and ≥ 4 years of college.
Complex comorbidity. Comorbid conditions were assessed with a combination of
self-report measures and screening tests. Participants were asked to report physician
diagnosis of cancer (categories: breast, cervix, colon, lung, ovary, rectum, skin, other),
chronic obstructive pulmonary disease, congestive heart failure, diabetes, hypertension,
myocardial infarction, or stroke. Unfortunately, there was variability both in how these
questions were asked and at which visits specific conditions were assessed. Cancer,
chronic obstructive pulmonary disease, congestive heart failure, and diabetes were
assessed by asking the question ―has your physician ever told you that you have . . .?‖ at
each visit. In contrast, myocardial infarction and stroke were assessed using this question
only the first time they were assessed, at subsequent visits participants were asked if they
had been told they had a stroke or a ―heart attack‖ since their last visit. The timing of
when each condition was assessed is presented in figure 3.2 above. Variability in
assessment of comorbid conditions at each wave limited the manner in which this
information could be incorporated into this analysis. For example, there was no consistent
way to distinguish comorbid conditions present at baseline from those which developed
during the study. With this in mind, a relatively simple approach was taken to collapse all
of the information available for these conditions into a single, binary indicator of
complex comorbidity, defined as self-reported diagnosis of two or more of the
abovementioned conditions at any point during the study period. In addition to these self-
reported comorbid conditions, cognitive impairment was assessed with the Mini-Mental
State Exam (MMSE) and depression was assessed with the Geriatric Depression Scale
(GDS). The MMSE was administered during visits 1, 4, 5 and 6. A score of less than 21,
58
indicating moderate to severe cognitive impairment, was used as the threshold for
cognitive impairment in this current study (Folstein, Folstein, & McHugh, 1975). The 15
item GDS-SF was administered during visits 2, 4, and 6. A score greater than 5 was used
as the threshold for depression in this study (Sheikh & Yesavage, 1986)
Incident fracture. The incidence of hip, spinal, and vertebral fractures was
assessed via self-report and confirmed by review of medical records and radiological
tests. In addition to these adjudicated fractures, participants were asked the question,
―since your last visit has a doctor told you that you have fractured or broken a bone.
Incident adjudicated and non-adjudicated fractures were collapsed into a binary indicator
of incident fracture during the study period.
Neighborhood-Level Variables
Objective measures of land-use mix, public transit access, street connectivity, and
park/green space access were derived from historical data sources and linked to
participants‘ addresses using a geographic information system (GIS). Geographic
information systems are computer systems capable of capturing, storing, analyzing, and
displaying geographically referenced information (Thornton, Pearce, & Kavanagh, 2011).
GIS systems allow the researcher to include multiple geographically referenced variables
as data layers on a single map, facilitating the analysis of complex spatial data (Harmon
& Anderson, 2003). In the process known as geocoding, a set of spatial coordinates-for
example, a residential address- is entered into a GIS database containing additional
geographically referenced data such as sidewalk coverage or location of recreation
facilities. These can then be linked with other data sources and the relationships between
59
these linked data can be statistically analyzed and graphically displayed in map form
(Parker & Asencio, 2008). Because GIS technology allows for the calculation of
disaggregated neighborhood measures centered on each participant‘s place of residence,
it avoids the potential bias resulting from the use of aggregate data sources (Brownson et
al., 2009).
Data sources. Neighborhood built environment data were provided by the Data
Resource Center of METRO, Portland‘s regional government. These data were primarily
collected from the Regional Land Information System (RLIS), a GIS database created by
the regional government in 1988 to support transportation modeling and regional
planning applications. RLIS data layers include: tax lots, aerial photography, developed
land, land use, zoning, transportation, parks and open space, tree canopy, steep slopes,
places (e.g., hospitals, city halls, etc.), building permit records, along with Census and
other demographic data. Because the RLIS data did not provide complete historical data
covering each time point in the study, it was supplemented with additional data sources,
including Metro Transportation Analysis Zones (TAZ) and data (households and
employment), Trimet (the regional transit agency) archives, Landsat TM data (used to
produce a 1991-based land cover map), and US Census TIGER/Line and block group
data from 1990. Drawing on multiple data sources allowed for the construction of built
environment measures for the years 1988, 1994, and 1998, corresponding to visits 1, 4,
and 6 of the SOF study.
The neighborhood built environment variables measured in this study were land-
use mix, public transit access, street connectivity, and park/green space access. Land-use
mix, public transit access, and street connectivity were combined into an index of
60
neighborhood walkability. Distance to park/green space was retained as a distinct
variable. The construction of each variable is discussed in detail below. A summary table
of the built environment measures used in the current analysis is presented in Table 3.2.
Land-use mix. Land-use mix was operationalized as the distance from a participant‘s
residential address to the nearest area zoned for commercial use. RLIS zoning data from
the years 1990, 1994, and 1998 were used to construct this variable. All areas designated
with the general commercial zoning class were included, with the exception of those
areas designated as industrial or institutional. The Euclidian (straight-line) distance from
the geocoded residential address to the nearest edge of the closest commercial area was
measured in feet. A graphical example of this is presented in figure 3.4. An alternative
approach to distance calculation is the network distance, which is a measure of the actual
distance from point to point when traveling over the street network. While this method of
calculating distance is generally regarded as more accurate (Oliver, Schuurman, & Hall,
2007), the computational demands are much greater. Due to the large sample size and
multiple time-points in this study, calculation of the variables using the network distance
was not done
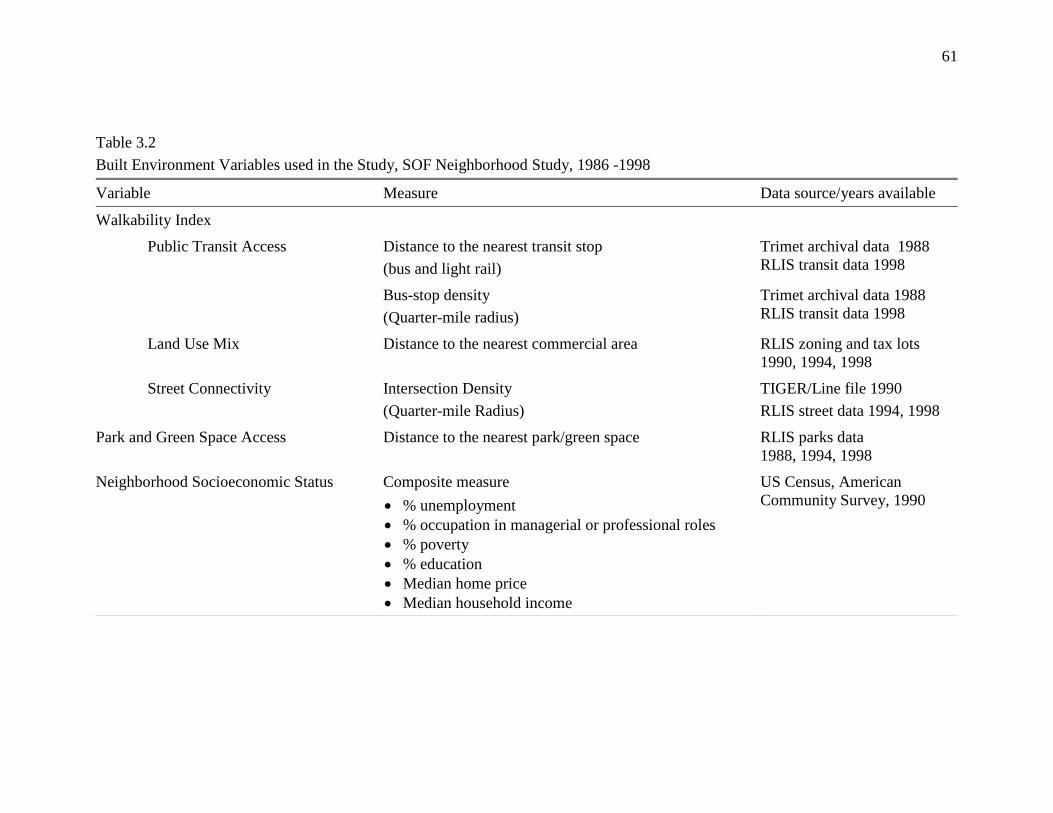
61
Table 3.2
Built Environment Variables used in the Study, SOF Neighborhood Study, 1986 -1998
Variable Measure Data source/years available
Walkability Index
Public Transit Access Distance to the nearest transit stop
(bus and light rail)
Trimet archival data 1988
RLIS transit data 1998
Bus-stop density
(Quarter-mile radius)
Trimet archival data 1988
RLIS transit data 1998
Land Use Mix Distance to the nearest commercial area RLIS zoning and tax lots
1990, 1994, 1998
Street Connectivity Intersection Density
(Quarter-mile Radius)
TIGER/Line file 1990
RLIS street data 1994, 1998
Park and Green Space Access Distance to the nearest park/green space RLIS parks data
1988, 1994, 1998
Neighborhood Socioeconomic Status Composite measure
% unemployment
% occupation in managerial or professional roles
% poverty
% education
Median home price
Median household income
US Census, American
Community Survey, 1990
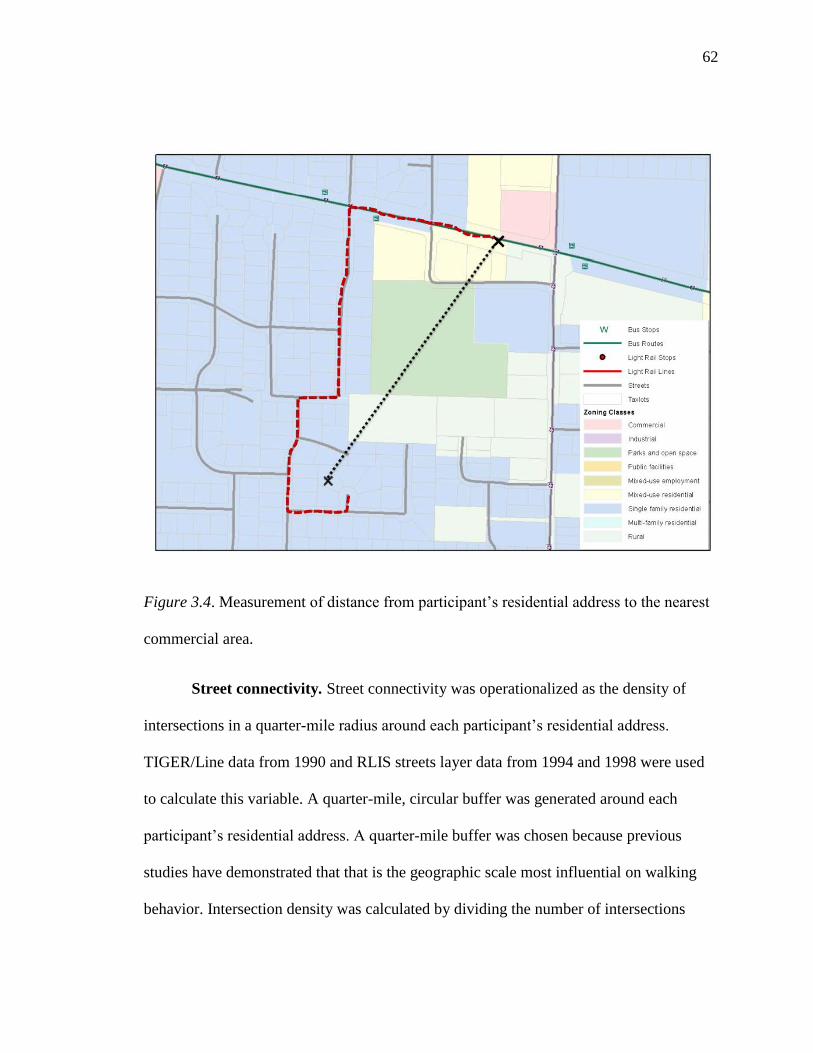
62
Figure 3.4. Measurement of distance from participant‘s residential address to the nearest
commercial area.
Street connectivity. Street connectivity was operationalized as the density of
intersections in a quarter-mile radius around each participant‘s residential address.
TIGER/Line data from 1990 and RLIS streets layer data from 1994 and 1998 were used
to calculate this variable. A quarter-mile, circular buffer was generated around each
participant‘s residential address. A quarter-mile buffer was chosen because previous
studies have demonstrated that that is the geographic scale most influential on walking
behavior. Intersection density was calculated by dividing the number of intersections
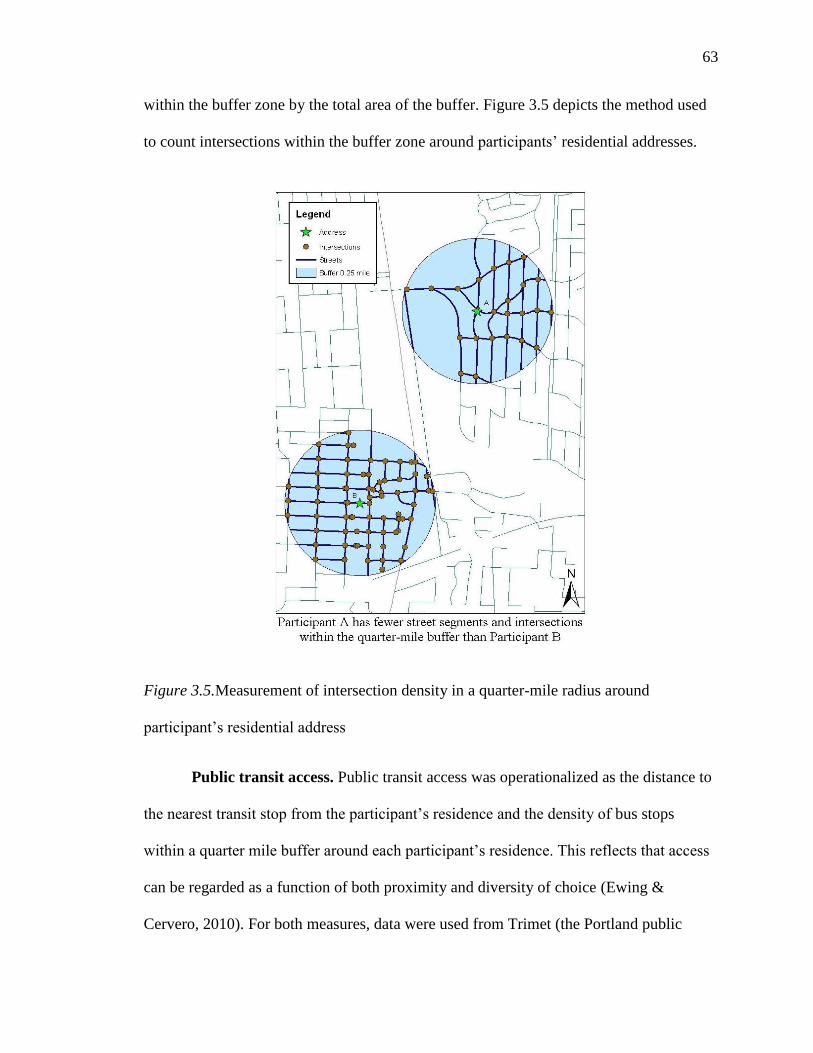
63
within the buffer zone by the total area of the buffer. Figure 3.5 depicts the method used
to count intersections within the buffer zone around participants‘ residential addresses.
Figure 3.5.Measurement of intersection density in a quarter-mile radius around
participant‘s residential address
Public transit access. Public transit access was operationalized as the distance to
the nearest transit stop from the participant‘s residence and the density of bus stops
within a quarter mile buffer around each participant‘s residence. This reflects that access
can be regarded as a function of both proximity and diversity of choice (Ewing &
Cervero, 2010). For both measures, data were used from Trimet (the Portland public
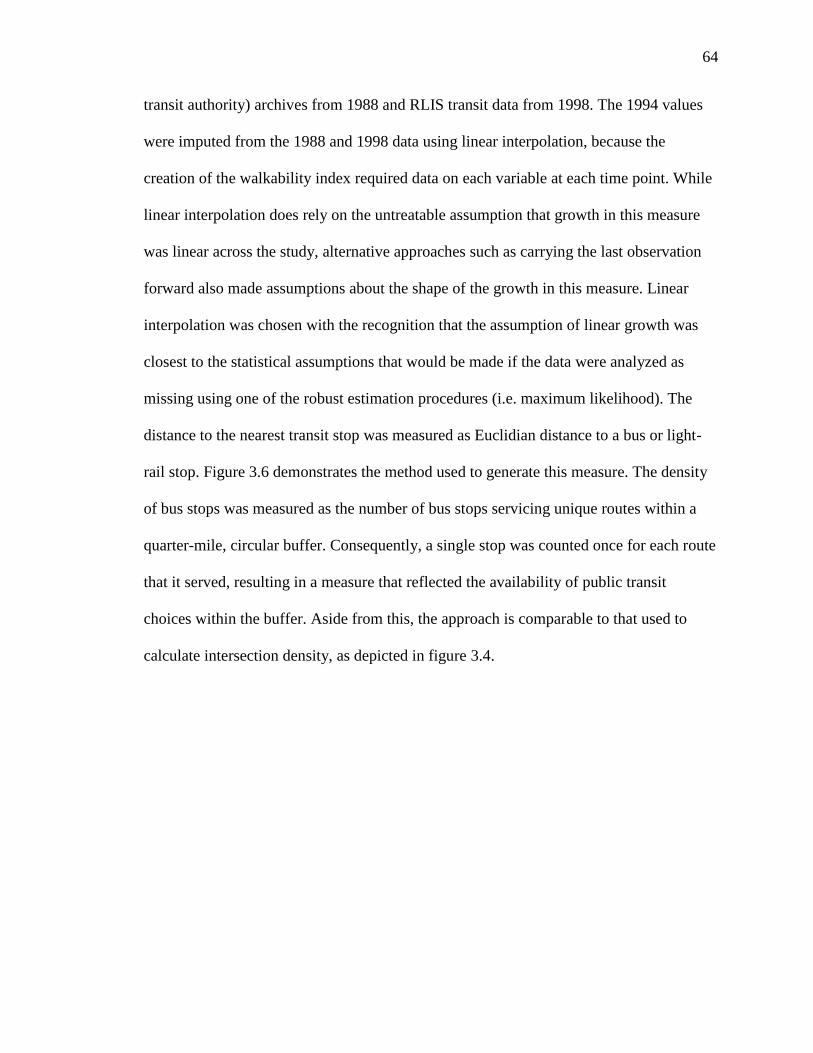
64
transit authority) archives from 1988 and RLIS transit data from 1998. The 1994 values
were imputed from the 1988 and 1998 data using linear interpolation, because the
creation of the walkability index required data on each variable at each time point. While
linear interpolation does rely on the untreatable assumption that growth in this measure
was linear across the study, alternative approaches such as carrying the last observation
forward also made assumptions about the shape of the growth in this measure. Linear
interpolation was chosen with the recognition that the assumption of linear growth was
closest to the statistical assumptions that would be made if the data were analyzed as
missing using one of the robust estimation procedures (i.e. maximum likelihood). The
distance to the nearest transit stop was measured as Euclidian distance to a bus or light-
rail stop. Figure 3.6 demonstrates the method used to generate this measure. The density
of bus stops was measured as the number of bus stops servicing unique routes within a
quarter-mile, circular buffer. Consequently, a single stop was counted once for each route
that it served, resulting in a measure that reflected the availability of public transit
choices within the buffer. Aside from this, the approach is comparable to that used to
calculate intersection density, as depicted in figure 3.4.
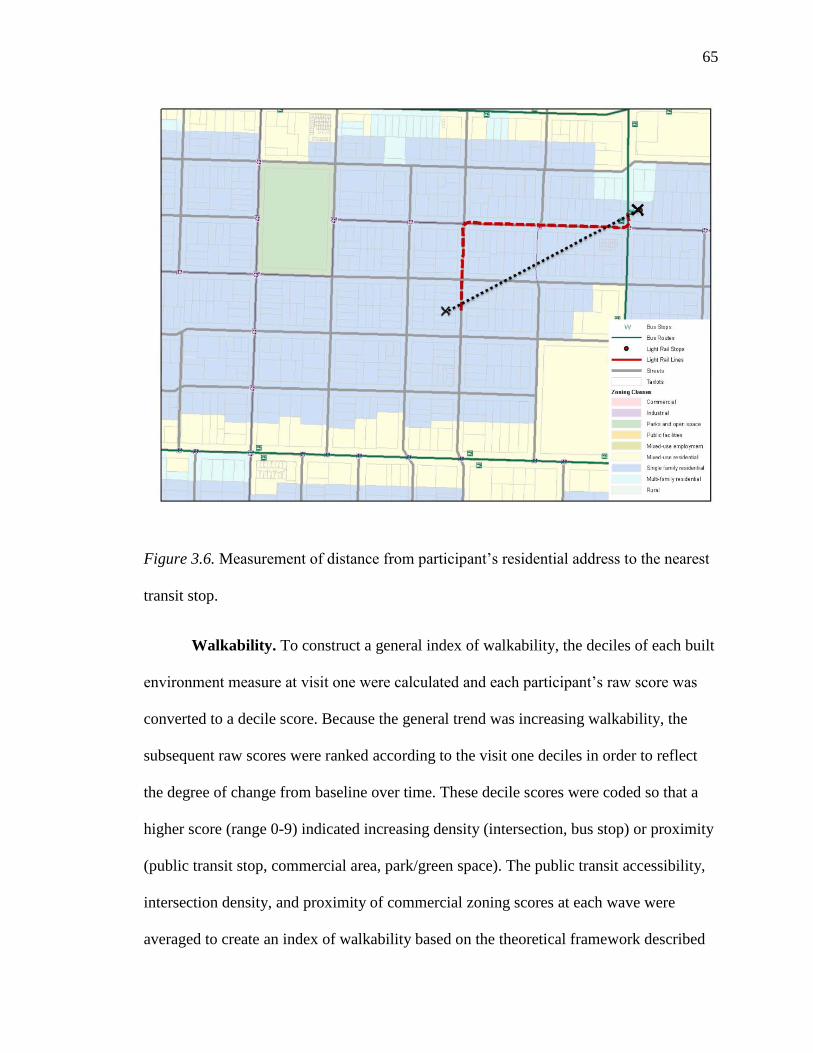
65
Figure 3.6. Measurement of distance from participant‘s residential address to the nearest
transit stop.
Walkability. To construct a general index of walkability, the deciles of each built
environment measure at visit one were calculated and each participant‘s raw score was
converted to a decile score. Because the general trend was increasing walkability, the
subsequent raw scores were ranked according to the visit one deciles in order to reflect
the degree of change from baseline over time. These decile scores were coded so that a
higher score (range 0-9) indicated increasing density (intersection, bus stop) or proximity
(public transit stop, commercial area, park/green space). The public transit accessibility,
intersection density, and proximity of commercial zoning scores at each wave were
averaged to create an index of walkability based on the theoretical framework described
66
in Chapter Two. Proximity to park/green space was not included in this index of
walkability but was included in subsequent analyses as a separate variable.
Park/green space access. Park or green space access was operationalized as the
Euclidian distance from a participant‘s residential address to the closest edge of the
nearest park or green space. RLIS parks data from 1988, 1994, and 1998 were used to
create this measure. This method was similar to the calculation of distance to the nearest
commercial area depicted in figure 3.4. Only publicly accessible areas categorized as
‗park‘, ‗open space‘, ‗greenway‘, or ‗trail‘ were included in this measure. Forest Park, the
largest urban forest reserve in the United States, covers roughly 6000 acres in the
Portland Metro area but has relatively few access points. To address this, only distances
to those access points were included in this measure. Lastly, areas smaller than 650
square feet were not included in this measure because they would not likely be useful for
exercise purposes and in order to filter out spaces inappropriately categorized as a park or
green space.
Neighborhood socioeconomic status. A summary measure of baseline
neighborhood socioeconomic status (NSES) was constructed by geocoding participants
residential address at visit one to the corresponding 1990 block group census measures of
unemployment, occupation in managerial or professional roles, poverty, education,
median home price, and median household income. These measures were combined into
a standardized z score as described by Krieger et al. (2002), with a higher score
indicating higher NSES.
67
Data Security
A unique, sequential identification number was assigned to each study participant
and this was used in the GIS linkage and to distinguish individual records. The SOF
participant addresses linked to the identification number and the records were stripped of
all additional identifying information. A dataset consisting of only a list of addresses and
corresponding identification numbers was transferred to Metro on password-protected
CD-ROM disks by SOF personnel. After Metro calculated the built environment
variables for each address, they linked those variables to the identification number and
destroyed the address file. This was then linked, via the identification number, to the de-
identified participant data. One dataset with identification numbers linked to residential
addresses has been retained as a password-protected file on an encrypted hard drive.
Data Analysis
After the initial data cleaning, merging, and recoding of variables described above,
data analysis occurred in several stages. First, basic statistical procedures were conducted
to describe the data, to assess whether participants who moved during the study period
differed systematically from those who did not, and to characterize patterns of missing
data. Next, a series of unconditional latent growth curve models were constructed to
describe the trajectory of neighborhood walkability, the trajectory of neighborhood
distance to park/green space, and the trajectory of gait speed over time. Parallel-process
latent growth curve models were then constructed to examine the relationship between
gait speed and neighborhood walkability and gait speed and neighborhood distance to
park/green space. Lastly, because there was significant mortality-related attrition during
68
the study period, growth curve models were adjusted for non-ignorable missing data by
using a pattern-mixture modeling approach. As recommended by Muthen (2010),
sensitivity analyses were conducted by comparing models estimated under full
information maximum likelihood (FIML) estimation procedures to pattern mixture-
models fit with varying identifying restrictions. Data cleaning and descriptive analyses
were performed with SAS version 9.2 and growth modeling was performed with MPlus
version 6. Below is a more detailed explanation of each stage in the data analysis.
Descriptive statistics. Descriptive statistics were calculated for each of the
variables included in the analysis. The distribution of gait speed at each time point and
the built environment variables at each time point were assessed by calculating the skew
and kurtosis statistics and visual examination of histograms. Correlation matrices of gait
speed at each time point, of the built environment variables at each time point, and
between the covariates were constructed both to inform specification of the residual
structures in subsequent growth models and to assess for the presence of
multicollinearity. T-tests for continuous variables and chi-square tests for categorical
variables were used to determine whether there were significant differences between
participants who moved and those who did not move in age, education, comorbidity,
average self-reported health, neighborhood SES, and gait speed. The frequency and
pattern of missing data was identified for each participant, with particular attention paid
to patterns of missing data indicative of attrition. In order to calculate the proportion of
attrition at each wave, a participant was classified as having dropped out of the study
from the time-point at which all of their subsequent outcome data was logged as missing.
Because attrition due to mortality was recorded during the SOF study, the proportion of
69
attrition at each wave due to mortality was also calculated. The high rate of mortality-
related attrition observed during the study period suggested that the drop-out mechanism
could be related to the outcome and should thus be modeled as non-ignorable attrition.
This will be discussed in more detail in a following section.
Overview of latent growth curve modeling. Latent growth curve modeling
(LGCM) is a special application of the broad class of latent variable models to the
analysis of longitudinal data (Jones, 2012). Similar to the multilevel approach to growth
curve analysis, LGCM treats the parameters in the growth curve model as random
coefficients, allowing for estimation of their means, variances, and covariances. Keeping
in mind that notation varies widely between authors, an unconditional linear growth
curve model can be expressed in the following series of regression equations (Singer &
Willett, 2003).
(3.1)
(3.2)
(3.3)
In multilevel terms, Equation 3.1, represents the level-one, or within-person, change in
the outcome, where =outcome, =individual participant, =time point, =baseline
(intercept) level of growth, =rate (linear slope) of growth over time, =time score, and
=residual error. From this equation we see that for a given individual, the estimated
value of the outcome variable at a specific point in time can be expressed as a function of
70
their individual growth parameters and some degree of residual variance. Individual
variability in the growth parameters is modeled in Equations 3.2 and 3.3, where is the
group mean of the intercept parameter and is the group mean of the slope parameter.
and represent the individual deviations from those means, which have residual
variances of and , respectively, and a covariance . There are several
important assumptions underlying this model. First, it is assumed that ,
COV , and COV
. Another common model assumption is that
the residual variance terms are uncorrelated over time, though this assumption can be
relaxed in the LGCM framework in order to test models with alternative residual
structures. Lastly, in the multilevel framework the residual variance is held equal across
time points, though in the LGCM framework this can be relaxed to allow for time-
specific variance estimates.
Because the LGCM approach and the multi-level approach are, in most respects,
functionally equivalent, the framework presented above is adequate to present most
features of LGCM modeling. Nevertheless, there are important differences between the
two approaches that warrant discussion. Strictly speaking, the LGCM is not a multi-level
model at all. Rather, it is a multivariate, single-level, model in which and are
viewed as latent variables rather than random parameters. In fact, as we see in Equations
3.4 and 3.5, the LGCM can be understood as a highly parameterized structural equation
model with the measurement model corresponding to level-1 and the structural model
corresponding to level-2 of the multilevel framework (Preacher, Wichman, MacCallum,
& Briggs, 2008).
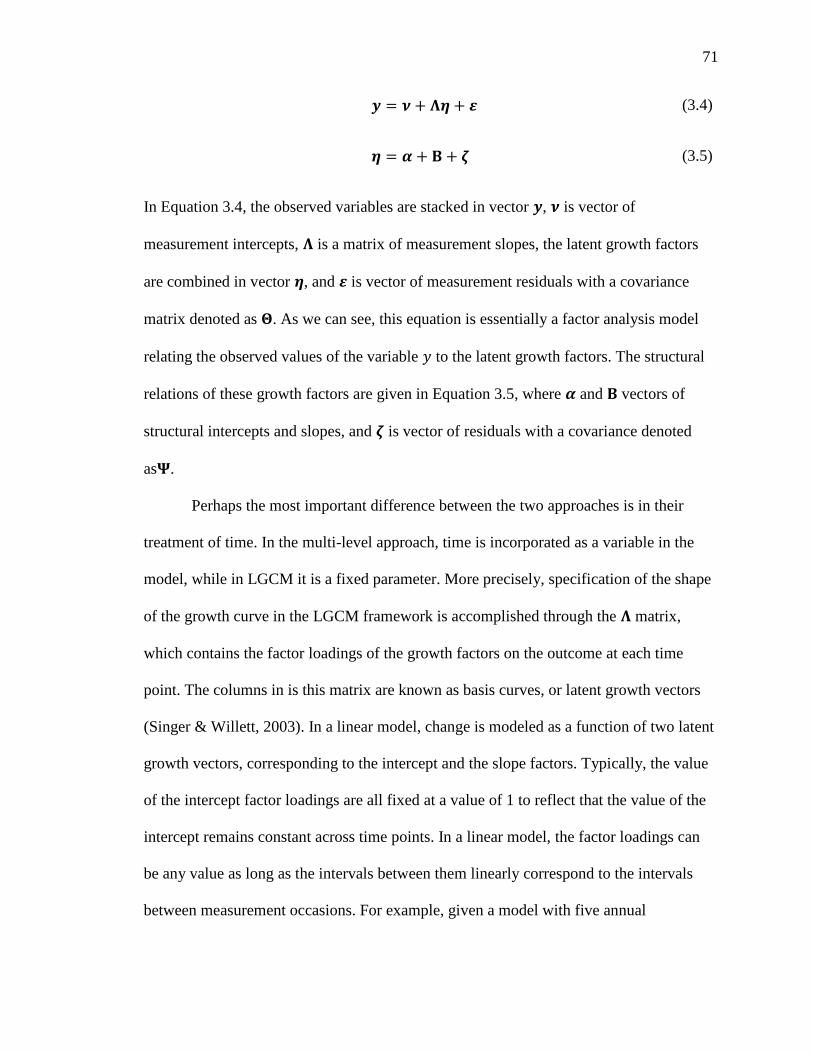
71
(3.4)
(3.5)
In Equation 3.4, the observed variables are stacked in vector , is vector of
measurement intercepts, is a matrix of measurement slopes, the latent growth factors
are combined in vector , and is vector of measurement residuals with a covariance
matrix denoted as . As we can see, this equation is essentially a factor analysis model
relating the observed values of the variable to the latent growth factors. The structural
relations of these growth factors are given in Equation 3.5, where and vectors of
structural intercepts and slopes, and is vector of residuals with a covariance denoted
as .
Perhaps the most important difference between the two approaches is in their
treatment of time. In the multi-level approach, time is incorporated as a variable in the
model, while in LGCM it is a fixed parameter. More precisely, specification of the shape
of the growth curve in the LGCM framework is accomplished through the matrix,
which contains the factor loadings of the growth factors on the outcome at each time
point. The columns in is this matrix are known as basis curves, or latent growth vectors
(Singer & Willett, 2003). In a linear model, change is modeled as a function of two latent
growth vectors, corresponding to the intercept and the slope factors. Typically, the value
of the intercept factor loadings are all fixed at a value of 1 to reflect that the value of the
intercept remains constant across time points. In a linear model, the factor loadings can
be any value as long as the intervals between them linearly correspond to the intervals
between measurement occasions. For example, given a model with five annual
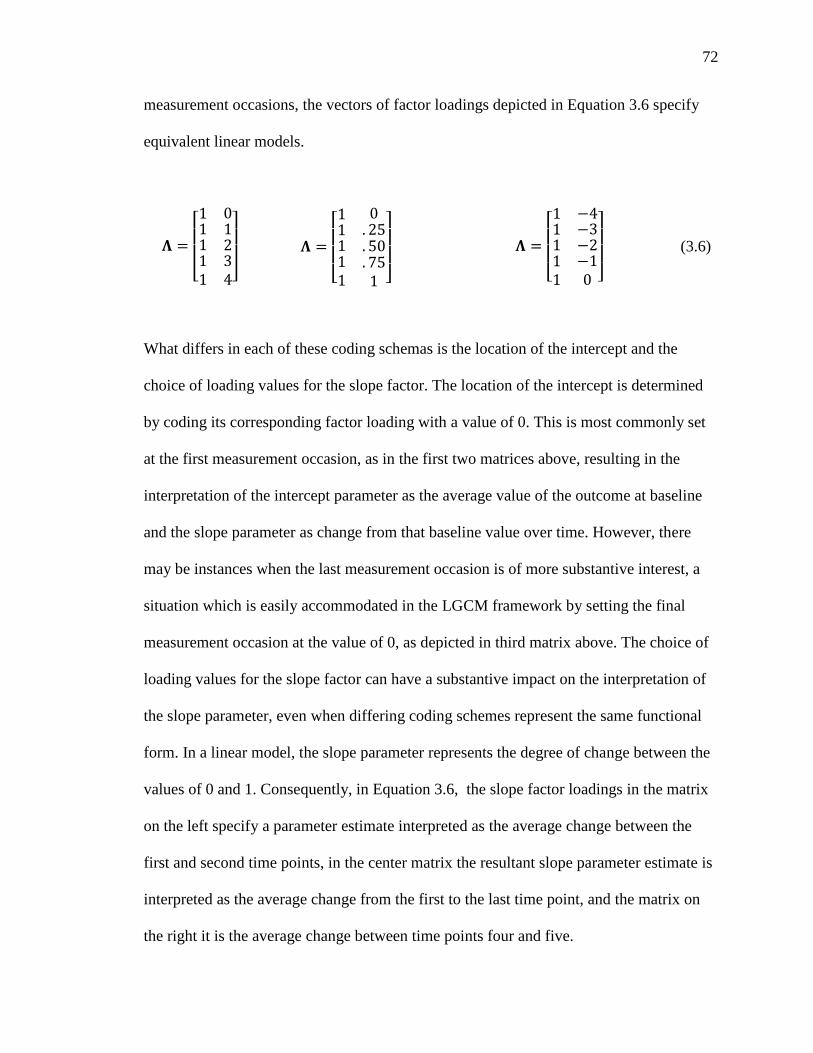
72
measurement occasions, the vectors of factor loadings depicted in Equation 3.6 specify
equivalent linear models.
[
]
[
]
[
]
(3.6)
What differs in each of these coding schemas is the location of the intercept and the
choice of loading values for the slope factor. The location of the intercept is determined
by coding its corresponding factor loading with a value of 0. This is most commonly set
at the first measurement occasion, as in the first two matrices above, resulting in the
interpretation of the intercept parameter as the average value of the outcome at baseline
and the slope parameter as change from that baseline value over time. However, there
may be instances when the last measurement occasion is of more substantive interest, a
situation which is easily accommodated in the LGCM framework by setting the final
measurement occasion at the value of 0, as depicted in third matrix above. The choice of
loading values for the slope factor can have a substantive impact on the interpretation of
the slope parameter, even when differing coding schemes represent the same functional
form. In a linear model, the slope parameter represents the degree of change between the
values of 0 and 1. Consequently, in Equation 3.6, the slope factor loadings in the matrix
on the left specify a parameter estimate interpreted as the average change between the
first and second time points, in the center matrix the resultant slope parameter estimate is
interpreted as the average change from the first to the last time point, and the matrix on
the right it is the average change between time points four and five.
73
We can specify the unconditional latent growth curve model described above
using standard SEM path diagrams. By convention, rectangles denote measured
variables, circles denote latent variables, triangles denote constants, single-headed arrows
denote regression paths with the arrow pointing toward the dependent variable, and
double-headed arrows denote variances or covariances. Figure 3.7 is a representation of
an unconditional, linear growth model with 5 time points. The factor loadings from the
latent intercept factor are all fixed at 1, as described above, and the slope loadings specify
a linear trajectory with the intercept set at baseline and equal intervals between
measurement occasions. The residuals are uncorrelated and constrained to be equal across
time points.
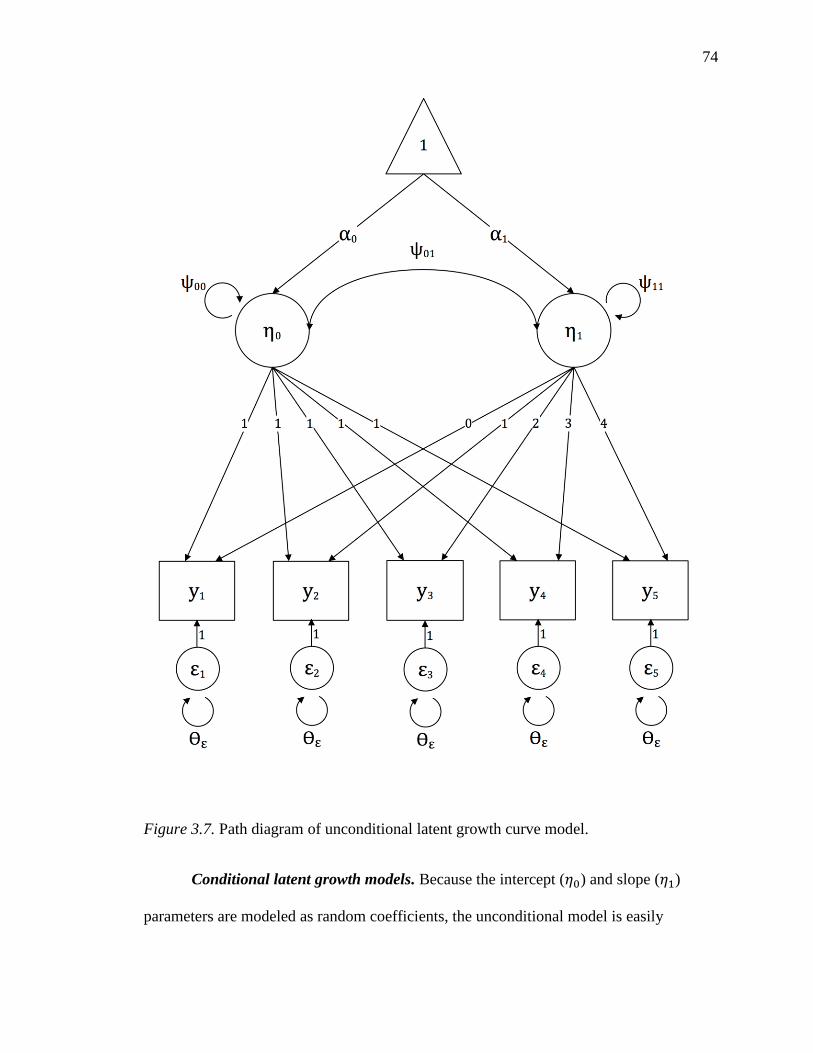
74
Figure 3.7. Path diagram of unconditional latent growth curve model.
Conditional latent growth models. Because the intercept ( ) and slope ( )
parameters are modeled as random coefficients, the unconditional model is easily
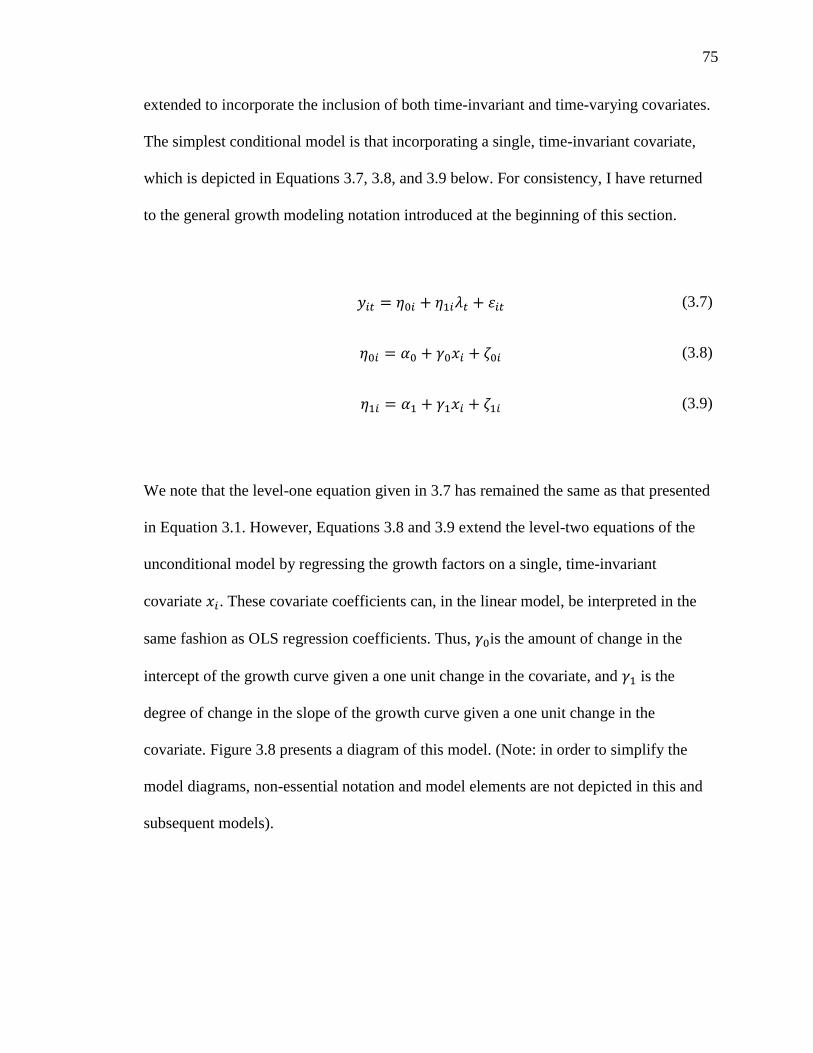
75
extended to incorporate the inclusion of both time-invariant and time-varying covariates.
The simplest conditional model is that incorporating a single, time-invariant covariate,
which is depicted in Equations 3.7, 3.8, and 3.9 below. For consistency, I have returned
to the general growth modeling notation introduced at the beginning of this section.
(3.7)
(3.8)
(3.9)
We note that the level-one equation given in 3.7 has remained the same as that presented
in Equation 3.1. However, Equations 3.8 and 3.9 extend the level-two equations of the
unconditional model by regressing the growth factors on a single, time-invariant
covariate . These covariate coefficients can, in the linear model, be interpreted in the
same fashion as OLS regression coefficients. Thus, is the amount of change in the
intercept of the growth curve given a one unit change in the covariate, and is the
degree of change in the slope of the growth curve given a one unit change in the
covariate. Figure 3.8 presents a diagram of this model. (Note: in order to simplify the
model diagrams, non-essential notation and model elements are not depicted in this and
subsequent models).
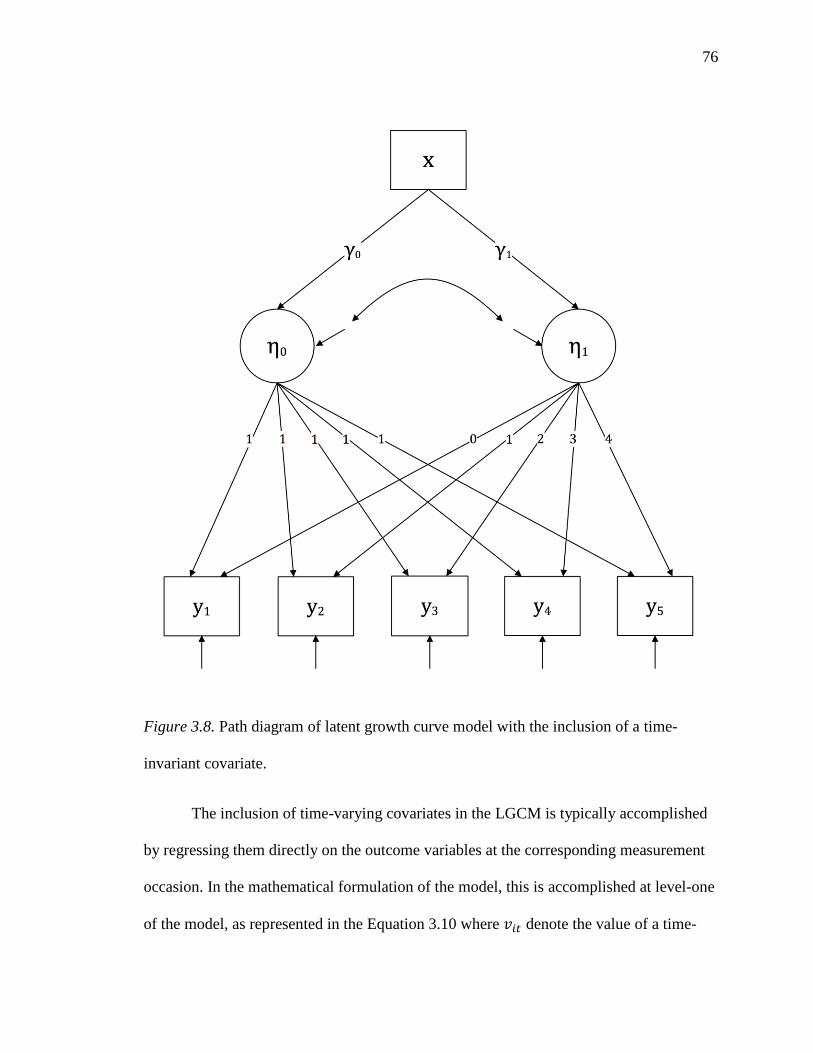
76
Figure 3.8. Path diagram of latent growth curve model with the inclusion of a time-
invariant covariate.
The inclusion of time-varying covariates in the LGCM is typically accomplished
by regressing them directly on the outcome variables at the corresponding measurement
occasion. In the mathematical formulation of the model, this is accomplished at level-one
of the model, as represented in the Equation 3.10 where denote the value of a time-
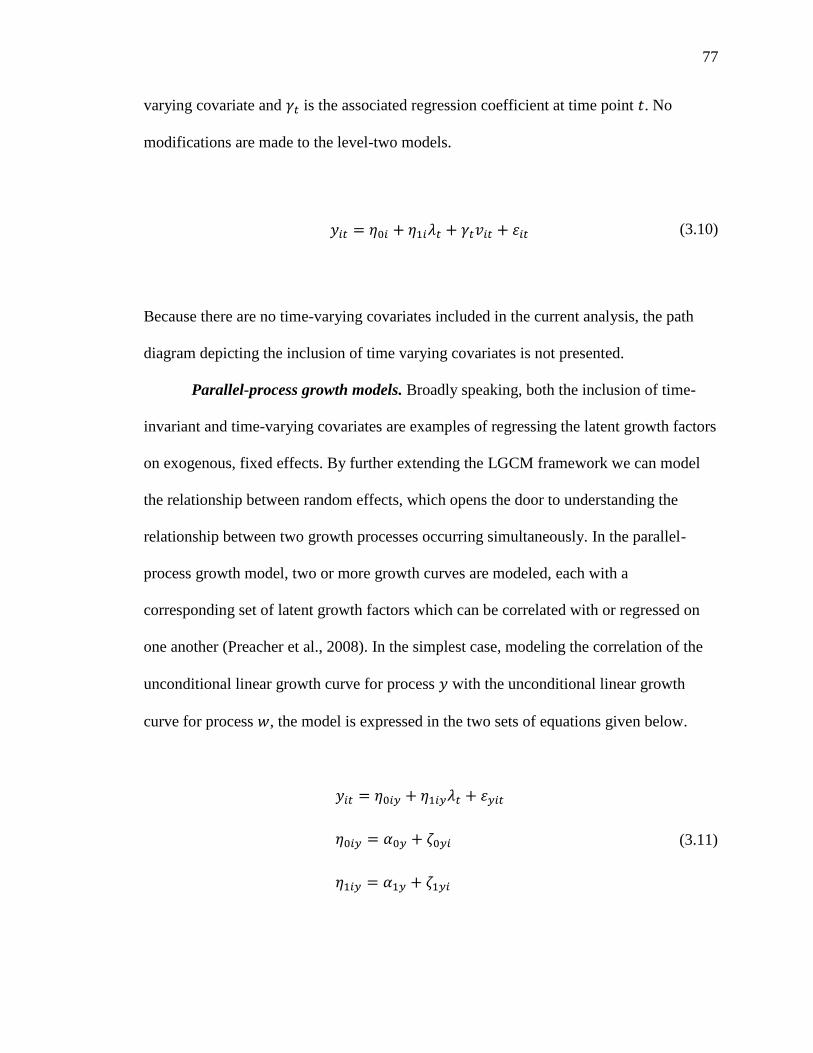
77
varying covariate and is the associated regression coefficient at time point . No
modifications are made to the level-two models.
(3.10)
Because there are no time-varying covariates included in the current analysis, the path
diagram depicting the inclusion of time varying covariates is not presented.
Parallel-process growth models. Broadly speaking, both the inclusion of time-
invariant and time-varying covariates are examples of regressing the latent growth factors
on exogenous, fixed effects. By further extending the LGCM framework we can model
the relationship between random effects, which opens the door to understanding the
relationship between two growth processes occurring simultaneously. In the parallel-
process growth model, two or more growth curves are modeled, each with a
corresponding set of latent growth factors which can be correlated with or regressed on
one another (Preacher et al., 2008). In the simplest case, modeling the correlation of the
unconditional linear growth curve for process with the unconditional linear growth
curve for process , the model is expressed in the two sets of equations given below.
(3.11)
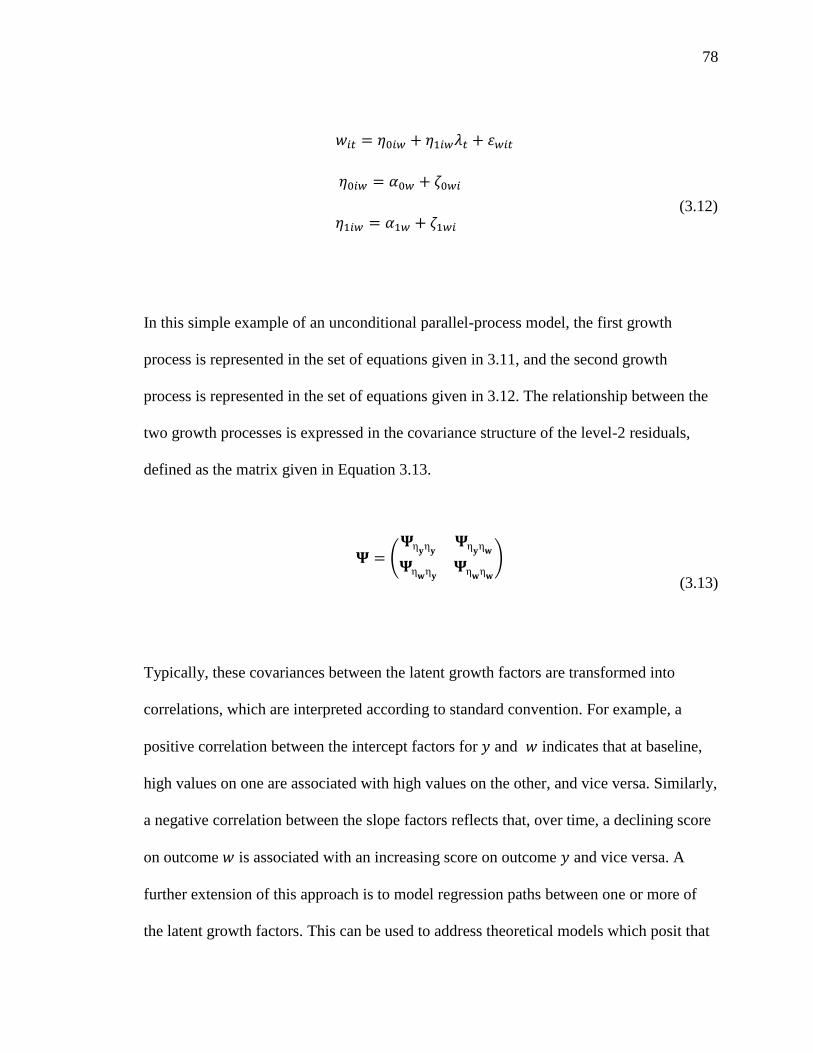
78
(3.12)
In this simple example of an unconditional parallel-process model, the first growth
process is represented in the set of equations given in 3.11, and the second growth
process is represented in the set of equations given in 3.12. The relationship between the
two growth processes is expressed in the covariance structure of the level-2 residuals,
defined as the matrix given in Equation 3.13.
(
)
(3.13)
Typically, these covariances between the latent growth factors are transformed into
correlations, which are interpreted according to standard convention. For example, a
positive correlation between the intercept factors for and indicates that at baseline,
high values on one are associated with high values on the other, and vice versa. Similarly,
a negative correlation between the slope factors reflects that, over time, a declining score
on outcome is associated with an increasing score on outcome and vice versa. A
further extension of this approach is to model regression paths between one or more of
the latent growth factors. This can be used to address theoretical models which posit that
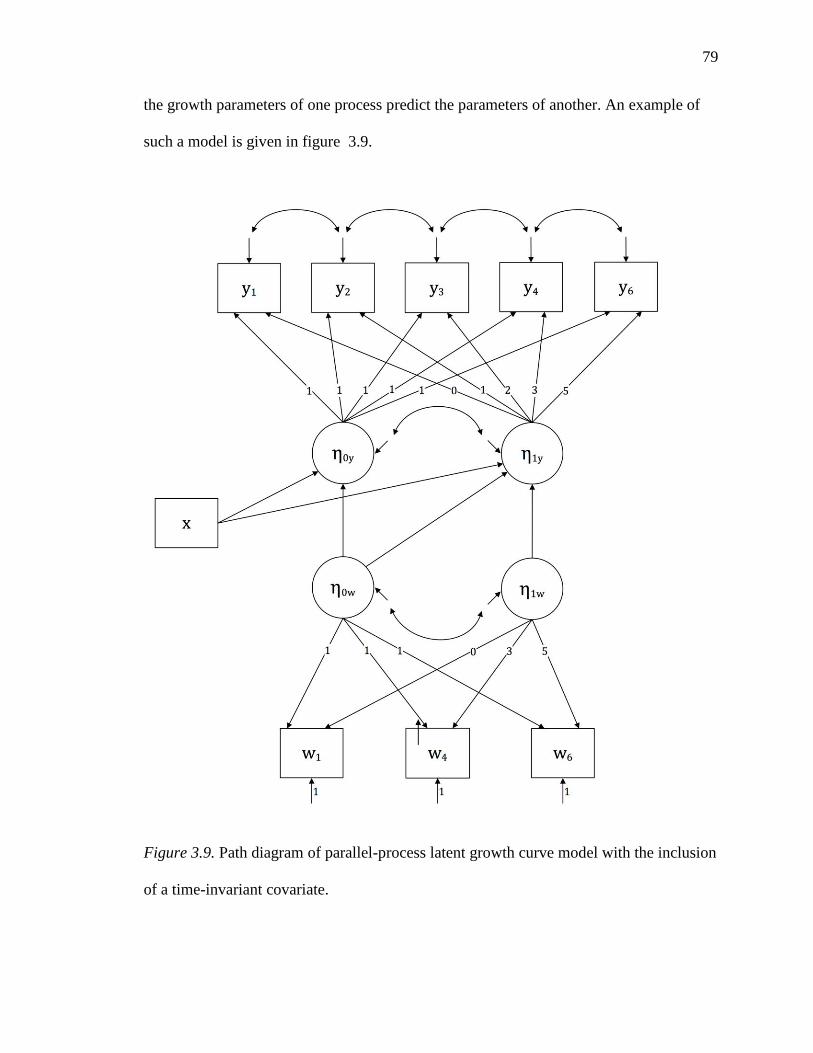
79
the growth parameters of one process predict the parameters of another. An example of
such a model is given in figure 3.9.
Figure 3.9. Path diagram of parallel-process latent growth curve model with the inclusion
of a time-invariant covariate.
80
The parallel-process model presented in Figure 3.9 is a close approximation of the
model tested in the current study, in which the growth parameters of the process w are
modeled as independent variables which predict, along with several time varying
covariates, the growth parameters of the process y. Specifically, the baseline value of is
predicted by the value of and is correlated with the baseline value of , while change in
is predicted by the value of , the baseline value of , and change in . There are two
important features of this model which should be pointed out. First, the number of
measurement occasions for each process is not equal, which is an acceptable condition,
though having only three measurement occasions for neighborhood walkability does
place significant constraints on the model due to identification issues. Second, the
measurement occasions for each process are not evenly spaced, which is accommodated
by changing the coding of the factor loadings to reflect the uneven intervals.
Non-linear growth models. While the preceding discussion has been limited to
modeling change as a linear process, there are many processes which are best modeled
using a non-linear function. The LGCM framework readily accommodates modeling non-
linear change, which is accomplished by recoding the factor loadings in the matrix and,
if necessary, adding additional latent growth parameters (Grimm & Ram, 2009). This
study tested two non-linear models, the quadratic model and the latent basis model. The
quadratic model is a fairly straightforward extension of the linear model, in which an
additional growth factor is added to the level-one equation to represent the curvature of
the trajectory, as shown in Equation 3.14, a third column of squared factor loadings is
added to the matrix, shown in Equation 3.15, and an additional equation describing the
latent quadratic factor is added to level-two of the model (not shown).
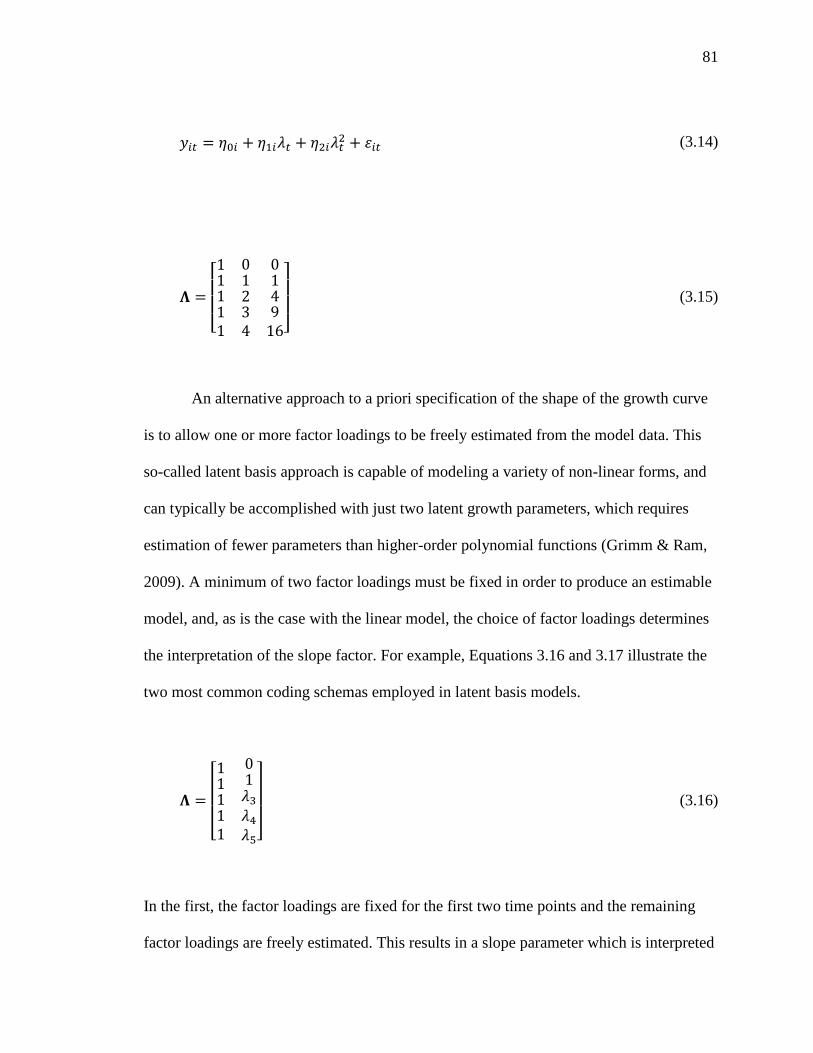
81
(3.14)
[
]
(3.15)
An alternative approach to a priori specification of the shape of the growth curve
is to allow one or more factor loadings to be freely estimated from the model data. This
so-called latent basis approach is capable of modeling a variety of non-linear forms, and
can typically be accomplished with just two latent growth parameters, which requires
estimation of fewer parameters than higher-order polynomial functions (Grimm & Ram,
2009). A minimum of two factor loadings must be fixed in order to produce an estimable
model, and, as is the case with the linear model, the choice of factor loadings determines
the interpretation of the slope factor. For example, Equations 3.16 and 3.17 illustrate the
two most common coding schemas employed in latent basis models.
[
]
(3.16)
In the first, the factor loadings are fixed for the first two time points and the remaining
factor loadings are freely estimated. This results in a slope parameter which is interpreted
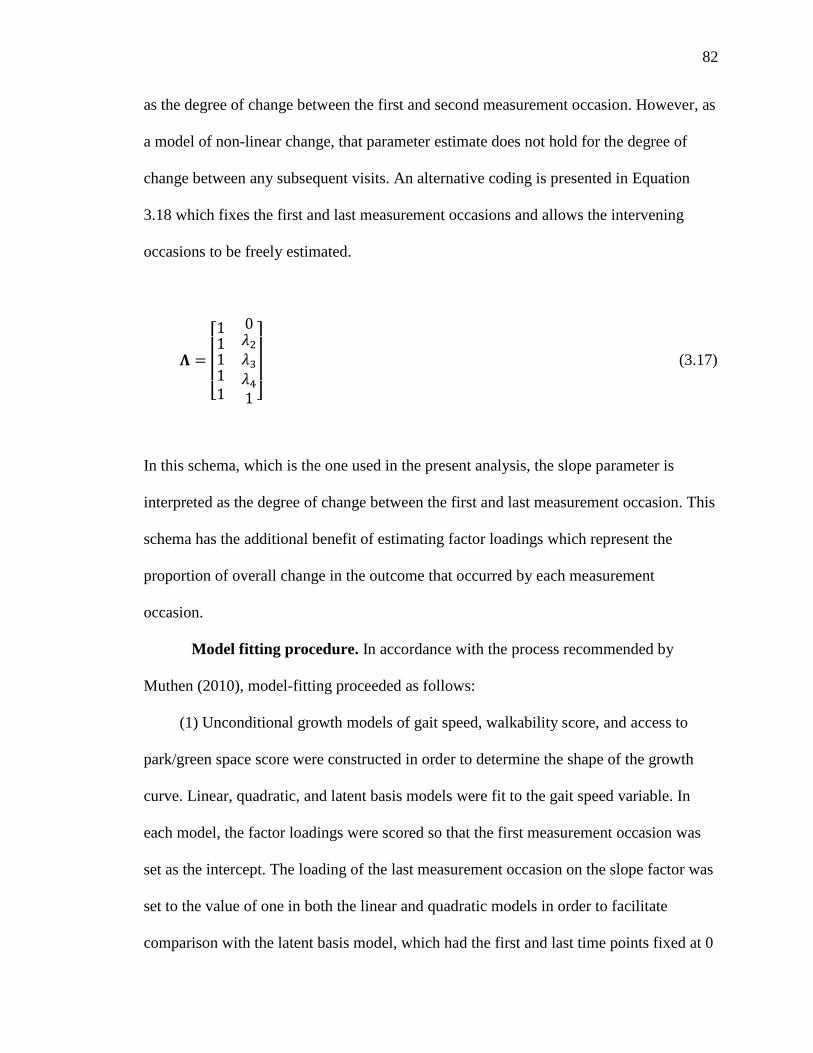
82
as the degree of change between the first and second measurement occasion. However, as
a model of non-linear change, that parameter estimate does not hold for the degree of
change between any subsequent visits. An alternative coding is presented in Equation
3.18 which fixes the first and last measurement occasions and allows the intervening
occasions to be freely estimated.
[
]
(3.17)
In this schema, which is the one used in the present analysis, the slope parameter is
interpreted as the degree of change between the first and last measurement occasion. This
schema has the additional benefit of estimating factor loadings which represent the
proportion of overall change in the outcome that occurred by each measurement
occasion.
Model fitting procedure. In accordance with the process recommended by
Muthen (2010), model-fitting proceeded as follows:
(1) Unconditional growth models of gait speed, walkability score, and access to
park/green space score were constructed in order to determine the shape of the growth
curve. Linear, quadratic, and latent basis models were fit to the gait speed variable. In
each model, the factor loadings were scored so that the first measurement occasion was
set as the intercept. The loading of the last measurement occasion on the slope factor was
set to the value of one in both the linear and quadratic models in order to facilitate
comparison with the latent basis model, which had the first and last time points fixed at 0
83
and 1, respectively. Initially, each of these models was fit with the residual variance
uncorrelated and freed to vary across time-points. The fit of these models was assessed
by visually examining plots of estimated vs. observed values and calculation and
comparison of relative and absolute fit statistics.
For gait speed, the final unconditional model with uncorrelated residuals was
compared to a model with the adjacent residual variances correlated. With only three
measurement occasions, fitting an appropriate model to the walkability score and park
score variables proved challenging. A quadratic model was not estimable, and the latent
basis model was just-identified (df=0), precluding evaluation of model fit and introducing
estimation difficulties (negative residual variance). To remedy this, the residual variance
was held equal across measurement occasions.
(2) After determining the appropriate shape of each growth curve in unconditional
models, parallel-process models of gait speed with walkability score and gait speed with
distance to park/green space score were constructed. Each model was specified
identically in accord with the specific aims of the study. The models were specified as
follows:
a. The intercept growth factor of gait speed was regressed on the intercept
growth factor of the built environment variable.
b. The slope growth factor of gait speed was regressed on the intercept
growth factor of the built environment variable.
c. The slope growth factor of gait speed was regressed on the slope growth
factor of the built environment variable.
.
84
(3) The model described in step 2 was adjusted for covariates. The intercept and slope
growth factors for gait speed were regressed on age, education, complex comorbidity,
and baseline neighborhood SES. Incident fracture was only regressed on the slope growth
factor. Because the covariates were selected for inclusion in the model based on a priori
theoretical concerns, they were retained in the final model whether or not they were
found to be statically significant. A path diagram of the final model is presented in Figure
3.10
Assessment of model fit and statistical significance. The fit of the latent growth
curve models was determined by evaluating several fit statistics. These include the chi-
square test of model fit, the Comparative Fit Index (CFI), the Tucker-Lewis Index (TLI),
the Root Mean Square Error of Approximation (RMSEA), and the Standardized Root
Mean Square Residual (SRMR). A significant chi-square test generally indicates poor-
model fit, though this test is sensitive to sample size and is nearly always significant
when sample size exceeds ~400 cases (Kenny & McCoach, 2003). Thus, it was not
viewed as a reliable indicator of model fit in the present analysis. For both the CFI and
TLI, a value 1.0 indicates perfect fit, with a value > .95 indicating good model fit.
Conversely, an RMSEA value of 0 indicates perfect model fit, with a value of ≤ .05
indicating good model fit and a value of ≤ .08 indicating acceptable model fit. Similarly,
an SRMR of 0 indicates perfect model fit, with a value ≤ .05 indicating good model fit
(Hu & Bentler, 1999; Iacobucci, 2010). The significance level for all statistical tests was
set at α=.05.
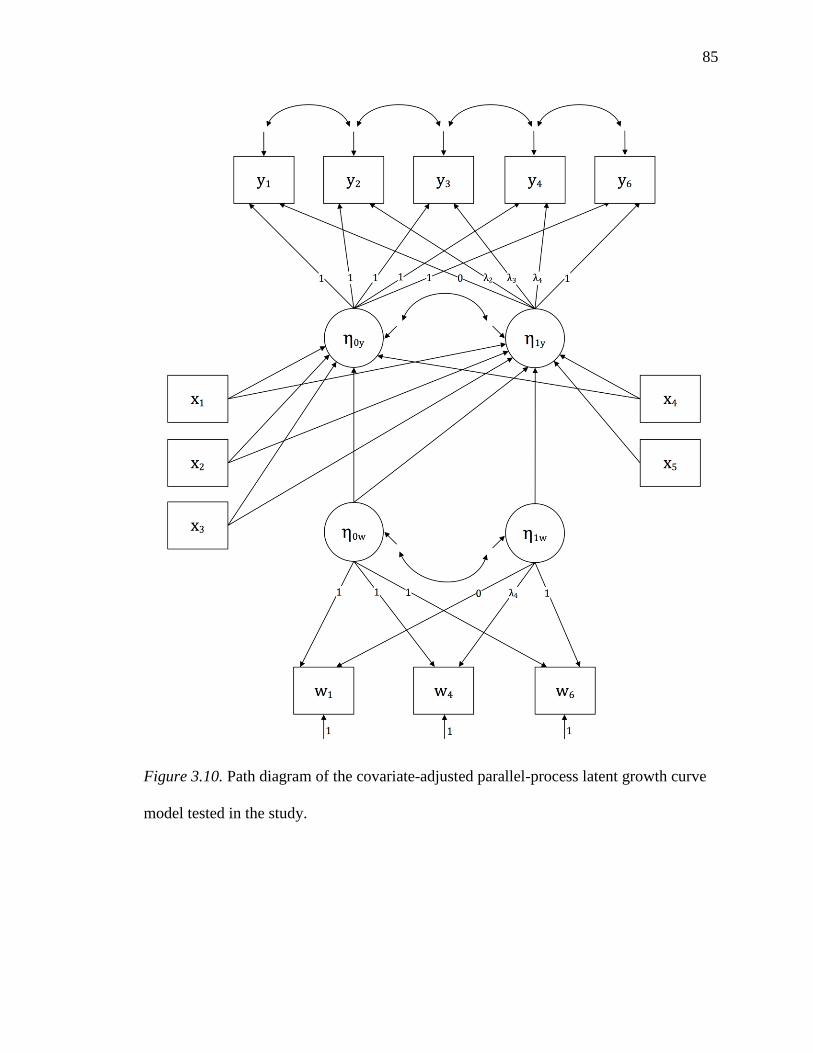
85
Figure 3.10. Path diagram of the covariate-adjusted parallel-process latent growth curve
model tested in the study.
86
Overview of missing data handling. As noted in the descriptive analysis section
above, the amount of missing data for each variable was calculated and the missing data
patterns tabulated prior to the LGCM analysis. Defining attrition as a consecutive pattern
of missingness from a given measurement occasion to the final measurement occasion,
patterns of missing data can be broadly grouped into the two categories of intermittent
missingness and attrition (Enders, 2010). It should be noted that the built environment
variables were defined as missing from the point that a participant was defined as having
dropped out of the study. As Yang, Li, and Shoptaw (2008) have observed, a
conservative assumption is that there are different missing data mechanisms underlying
these two categories, an assumption which has important implications for the choice of
analytic approach.
According to Rubin (1976), there are three mechanisms relating the probability of
missingness on a given variable to the observed and missing values in the dataset (a
missing value is considered, in Rubin‘s framework, to have some unknown unobserved
value). Missing completely at random (MCAR) refers the situation where the probability
of missingness is unrelated to either the observed or missing values in the data, as we see,
using notation from Enders (2011) in the following conditional probability distribution,
) (3.18)
where is a binary indicator of missingness and is a parameter that describes the
missing data process. When data are MCAR, incomplete cases may simply be removed
from the analysis , as in the practice of listwise deletion, without introducing bias because
they are a randomly distributed in the larger sample. The second category of missing data
mechanisms is termed missing at random (MAR), which is when
87
) (3.19)
where is the observed data. In other words, the probability of missing data is related
to the observed data via the parameter , but it is not related to the unobserved, missing
values. In the case of MAR, removal of incomplete cases may result in bias because these
cases differ systematically from the cases with complete data. However, maximum
likelihood estimation and Bayesian multiple imputation procedures are robust to data
missing under the MAR mechanism, particularly if the covariates that predict
missingness are incorporated in the analysis (Baraldi & Enders, 2010). Thus, these
mechanisms have together termed ―ignorable missingness‖ since they are generally well
handled with current modeling techniques. In this dissertation study, intermittently
missing data were assumed to be MAR or MCAR. Consequently, cases with
intermittently missing data were retained in the analysis, which was conducted using a
full-information maximum likelihood (FIML) estimation procedure that produces
unbiased estimates when data are MCAR or MAR.
The third category of missing data is known as missing not at random, or MNAR,
which has the probability distribution
(3.20)
where is the unobserved, missing data. Here, the probability of missingness is
related either to the observed or missing data in the data set. Put another way, the
probability of missingness and the variable with missing values have a joint distribution.
An alternative way of expressing this joint probability distribution is
(3.21)
88
where is the value of the outcome variable for individual , is the indicator of
missingness on for individual , is a set of parameters describing the distribution of
, and is a set of parameters predicting (Enders). Rubin demonstrated that when data
are MNAR, the missing data parameters hold important information about the outcome
parameters and not including that information in the model describing can result in
substantial bias. Thus, MNAR is sometimes referred to as non-ignorable missingness,
because it is necessary to incorporate a model of into the model of in order to
produce valid estimates. The two primary approaches to this are selection modeling and
pattern-mixture modeling (Michiels, Molenberghs, Bijnens, Vangeneugden, & Thijs,
2002; Muthen, Asparouhov, Hunter, & Leuchter, 2011).
Pattern-mixture modeling. The pattern-mixture approach, which is employed in
this study, factors the joint distribution presented in Equation 3.21 into the product of two
separate distributions (Enders, 2011; Pauler, McCoy, & Moinpour, 2003). Returning to
the notation above, the pattern-mixture model is specified as
(3.22)
where is the conditional distribution of given a particular value of and
is the marginal distribution of . In practical terms, is given as the
estimated parameters of for each missing data pattern and is the proportion of
participants with each missing data pattern. The mean parameter estimates for are thus
a mixture of parameter estimates specific to each pattern of missing data and are
generically calculated as
(3.23)
89
where is the mean parameter estimate, is the proportion of participants with missing
data pattern , is the pattern-specific parameter estimate for pattern , and N is the
number of patterns. The standard errors of the mean parameter estimates are calculated
using the so-called delta method (equations not shown).
An important consideration in the specification of pattern-mixture models is that
they are often under-identified, because some of the pattern-specific parameters are
inherently inestimable. For example, if some participants only contribute data on the first
measurement occasion, calculation of a slope parameter for that group is not possible.
Similarly, in a quadratic model the patterns corresponding to attrition at time two and
time three would contain inestimable parameters. Incorporating patterns with inestimable
parameters requires making explicit assumptions about the value of those parameters.
These assumptions are termed identifying restrictions, and are implemented by fixing the
inestimable parameter at some determined value. For example, in the neighboring-case
restriction, the inestimable parameter is held equal to the value of the nearest group for
which that parameter is identified. Because identifying restrictions are essentially
untestable assumptions, it is recommended that a sensitivity analyses be conducted by
comparing the results from models with different identifying restrictions (Enders, 2011;
Thijs, Molenberghs, Michiels, Verbeke, & Curran, 2002).
Determining the mechanism underlying attrition from a longitudinal study, and
thus the choice of analytic approach used to account for attrition is a subjective decision.
This is because the relationship between and is unknown and inestimable (ref).
Consequently, there is no way to test whether data are MAR or MCAR. There is,
however, growing discussion about how best to account for attrition in longitudinal
90
studies of older adults, as attrition in these studies is commonly attributable to declining
health or mortality, and the assumption of MAR is often not justified (Diehr & Johnson,
2005; Hardy, Allore, & Studenski, 2009). For example, in this study, 615 (48.9%)
participants were lost to follow-up due to attrition during the study, of those 356 (28.3%)
were lost due to death. It is plausible that, among those participants lost to attrition, the
probability of missingness was related to the unobserved value of gait speed. In order to
account for any potential bias resulting from misspecification of the mechanism
underlying participant attrition, a pattern-mixture modeling approach was employed to
adjust each model for attrition-related missing data. Figure 3.11 presents a path diagram
of an unconditional LGCM of gait speed incorporating a pattern-mixture model of
attrition analogous to the one used in this study.
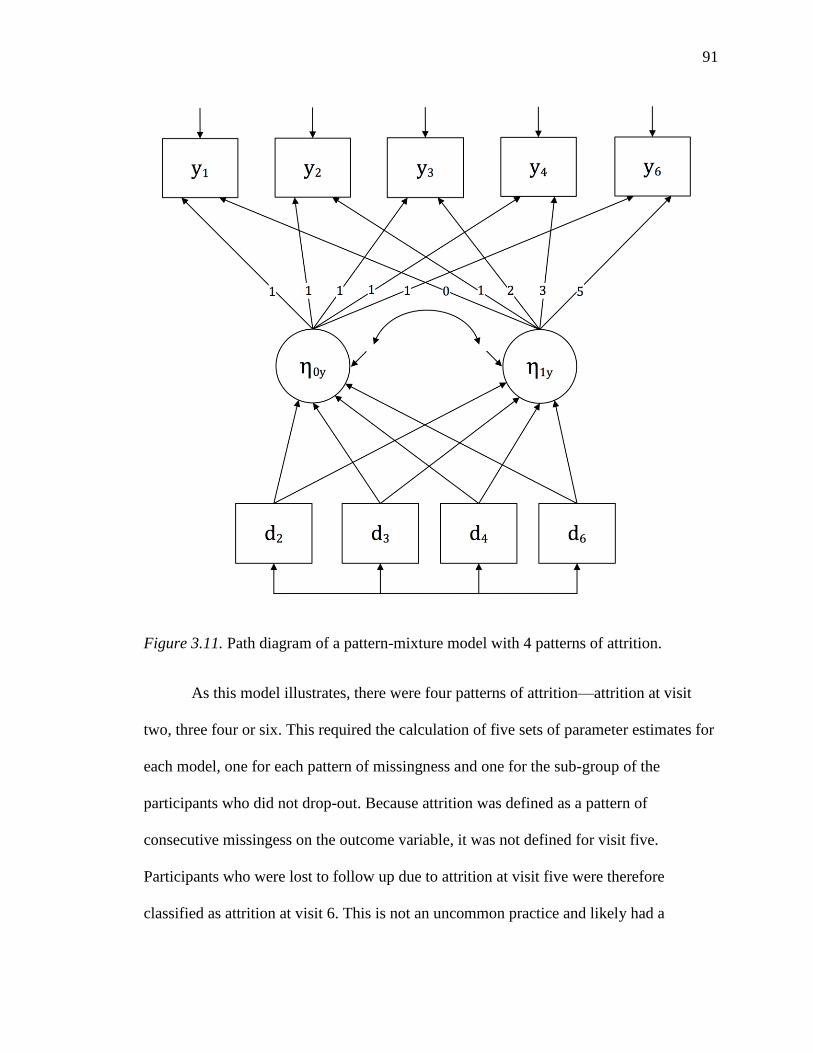
91
Figure 3.11. Path diagram of a pattern-mixture model with 4 patterns of attrition.
As this model illustrates, there were four patterns of attrition—attrition at visit
two, three four or six. This required the calculation of five sets of parameter estimates for
each model, one for each pattern of missingness and one for the sub-group of the
participants who did not drop-out. Because attrition was defined as a pattern of
consecutive missingess on the outcome variable, it was not defined for visit five.
Participants who were lost to follow up due to attrition at visit five were therefore
classified as attrition at visit 6. This is not an uncommon practice and likely had a
92
negligible impact on the estimation of the models (Muthen et al., 2011). For each model,
one pattern-mixture model was fit with a neighboring-case identifying restriction as
described above and one was fit with a complete-case identifying restriction, in which the
inestimable parameters are fixed at those of the complete cases. The mean intercept and
slope parameters of each model were calculated as specified in equation 3.23 and the
standard errors were calculated using the delta method. Sensitivity analyses were
conducted by comparing the parameter estimates, standard errors, and plots of the
estimated growth curves from models estimated using FIML under a MAR assumption to
pattern-mixture models with competing identifying restrictions.
Summary
This study employed a parallel-process LGCM approach to examine change in
gait speed and change in neighborhood built environment over a 12-year period. The
specific aims of the study are addressed by the statistical methods as follows.
1. Describe the relationship between baseline neighborhood walkability and baseline
lower-extremity function among older women.
This is accomplished by regressing the gait speed intercept factor on the
neighborhood walkability intercept factor.
2. Describe the relationship between baseline neighborhood walkability and change
in lower-extremity function among older women.
This is accomplished by regressing the gait speed slope factor on the
neighborhood walkability intercept factor.
3. Describe the relationship between change in neighborhood walkability and
change in lower-extremity function among older women.
93
This is accomplished by regressing the gait speed slope factor on the
neighborhood walkability slope factor.
4. Describe the relationship between baseline distance to neighborhood parks/green
spaces and baseline lower-extremity function among older women.
This is accomplished by regressing the gait speed intercept factor on the distance
to park/green space intercept factor.
5. Describe the relationship between baseline distance to neighborhood parks/green
spaces and change in lower-extremity function among older women.
This is accomplished by regressing the gait speed slope factor on the distance to
park/green space intercept factor.
6. Describe the relationship between change in distance to neighborhood parks/green
spaces and change in lower-extremity function among older women.
This is accomplished by regressing the gait speed slope factor on the distance to
park/green space slope factor.
94
Chapter 4—Results
Descriptive Statistics
Sample characteristics. Table 4.1 presents demographic and health
characteristics of the sample. The average age of participants at baseline was 72.3
(SD=5.21), with the youngest being 65 years of age and the oldest being 99 years of age.
The majority (53%) were married, living with a spouse or other person (63%), and had an
average of 12.6 years of education. Most of the participants reported themselves to be in
good or excellent health at baseline (82%), and only 21% reported a diagnosis of two or
more of the following medical conditions (diabetes, stroke, MI, CHF, COPD, cancer).
However, because some conditions were not assessed for until the second (MI, CHF) or
third visit (cancer), people who dropped out prior due to declining health would not be
included in the respondents. Thus, this is likely a slight underestimation of the true rate of
comorbid conditions in the sample. The frequency of the specific conditions is given in
the table below. At baseline, roughly 90% of the sample reporting walking some amount
in the past week, though only 57% reported walking for exercise. The average number of
blocks walked in a day for all purposes (exercise and travel) was 12.87.
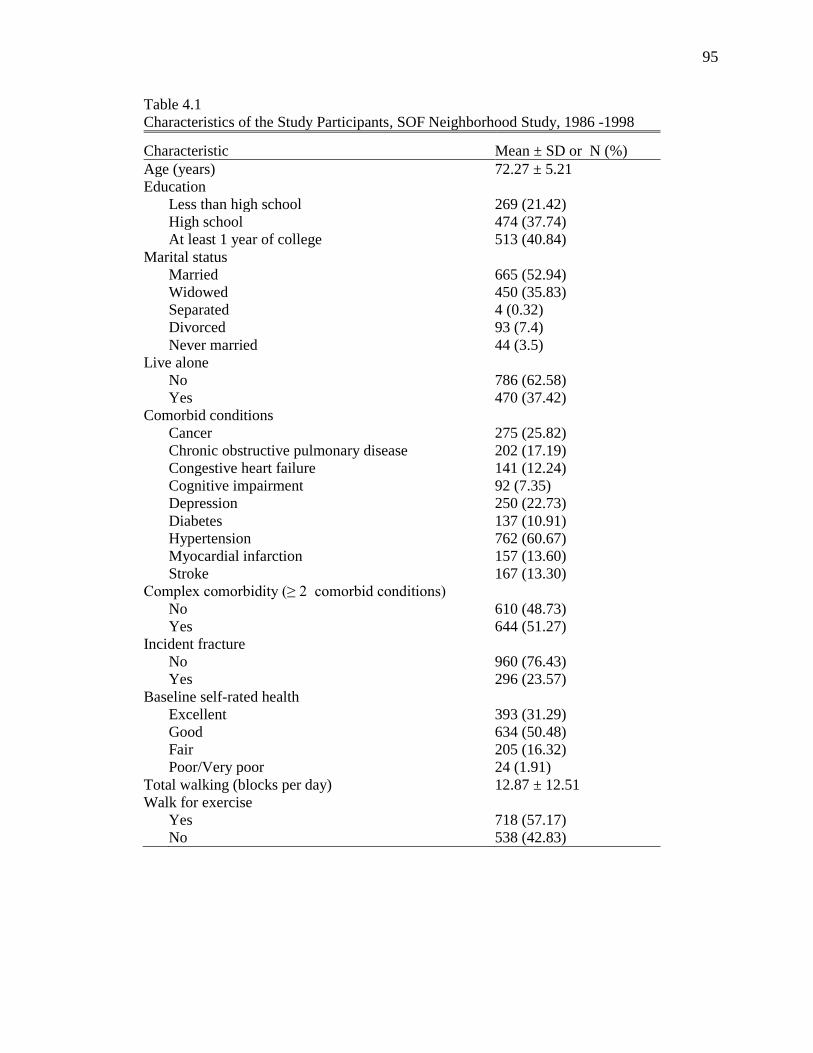
95
Table 4.1
Characteristics of the Study Participants, SOF Neighborhood Study, 1986 -1998
Characteristic Mean ± SD or N (%)
Age (years) 72.27 ± 5.21
Education
Less than high school 269 (21.42)
High school 474 (37.74)
At least 1 year of college 513 (40.84)
Marital status
Married 665 (52.94)
Widowed 450 (35.83)
Separated 4 (0.32)
Divorced 93 (7.4)
Never married 44 (3.5)
Live alone
No 786 (62.58)
Yes 470 (37.42)
Comorbid conditions
Cancer 275 (25.82)
Chronic obstructive pulmonary disease 202 (17.19)
Congestive heart failure 141 (12.24)
Cognitive impairment 92 (7.35)
Depression 250 (22.73)
Diabetes 137 (10.91)
Hypertension 762 (60.67)
Myocardial infarction 157 (13.60)
Stroke 167 (13.30)
Complex comorbidity (≥ 2 comorbid conditions)
No 610 (48.73)
Yes 644 (51.27)
Incident fracture
No 960 (76.43)
Yes 296 (23.57)
Baseline self-rated health
Excellent 393 (31.29)
Good 634 (50.48)
Fair 205 (16.32)
Poor/Very poor 24 (1.91)
Total walking (blocks per day) 12.87 ± 12.51
Walk for exercise
Yes 718 (57.17)
No 538 (42.83)
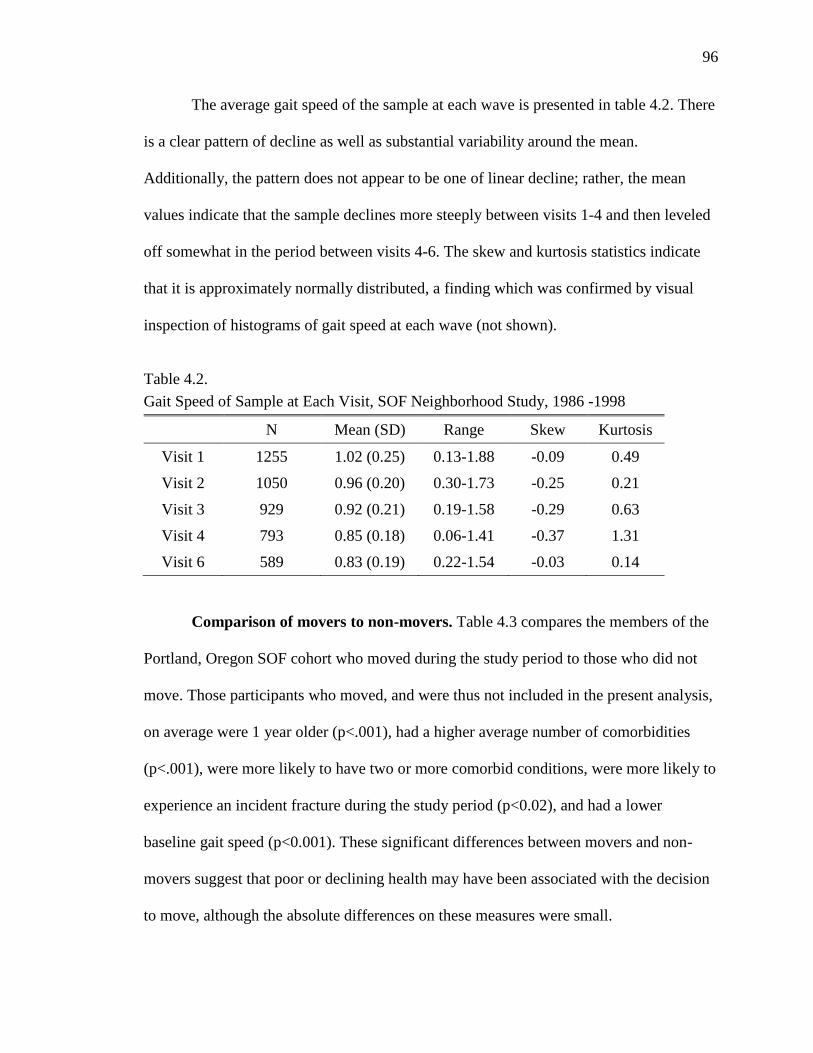
96
The average gait speed of the sample at each wave is presented in table 4.2. There
is a clear pattern of decline as well as substantial variability around the mean.
Additionally, the pattern does not appear to be one of linear decline; rather, the mean
values indicate that the sample declines more steeply between visits 1-4 and then leveled
off somewhat in the period between visits 4-6. The skew and kurtosis statistics indicate
that it is approximately normally distributed, a finding which was confirmed by visual
inspection of histograms of gait speed at each wave (not shown).
Table 4.2.
Gait Speed of Sample at Each Visit, SOF Neighborhood Study, 1986 -1998
N Mean (SD) Range Skew Kurtosis
Visit 1 1255 1.02 (0.25) 0.13-1.88 -0.09 0.49
Visit 2 1050 0.96 (0.20) 0.30-1.73 -0.25 0.21
Visit 3 929 0.92 (0.21) 0.19-1.58 -0.29 0.63
Visit 4 793 0.85 (0.18) 0.06-1.41 -0.37 1.31
Visit 6 589 0.83 (0.19) 0.22-1.54 -0.03 0.14
Comparison of movers to non-movers. Table 4.3 compares the members of the
Portland, Oregon SOF cohort who moved during the study period to those who did not
move. Those participants who moved, and were thus not included in the present analysis,
on average were 1 year older (p<.001), had a higher average number of comorbidities
(p<.001), were more likely to have two or more comorbid conditions, were more likely to
experience an incident fracture during the study period (p<0.02), and had a lower
baseline gait speed (p<0.001). These significant differences between movers and non-
movers suggest that poor or declining health may have been associated with the decision
to move, although the absolute differences on these measures were small.
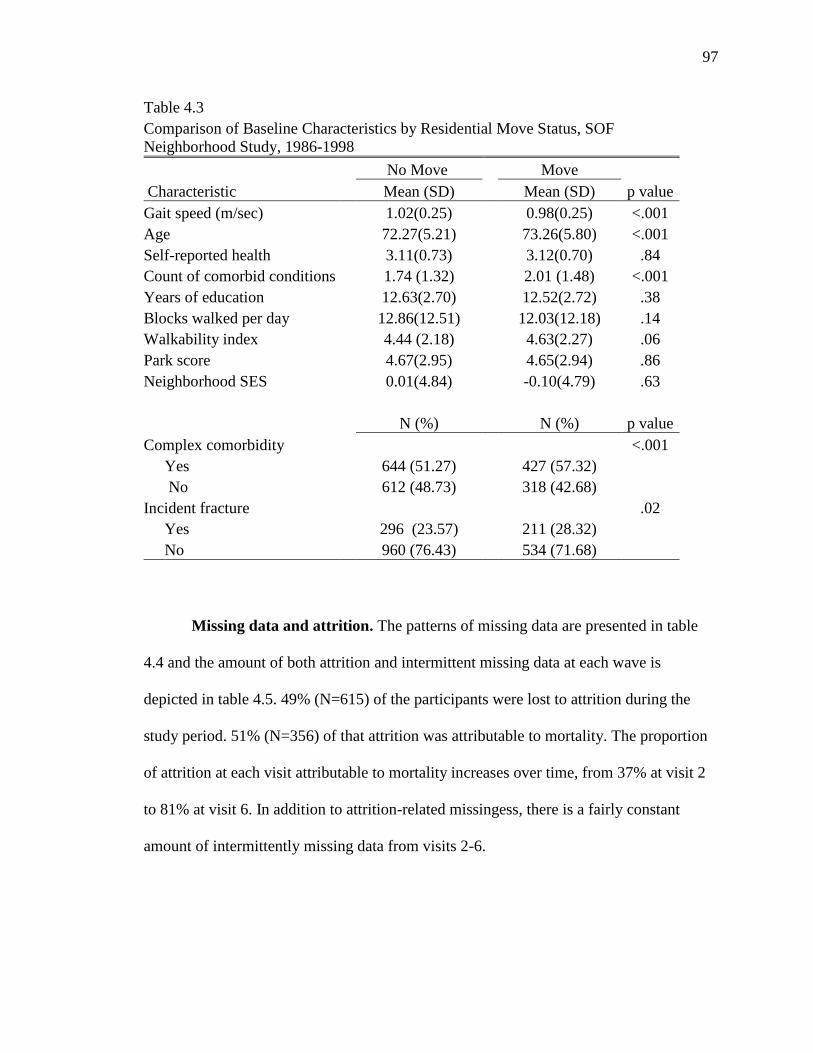
97
Table 4.3
Comparison of Baseline Characteristics by Residential Move Status, SOF
Neighborhood Study, 1986-1998
No Move Move
Characteristic Mean (SD) Mean (SD) p value
Gait speed (m/sec) 1.02(0.25) 0.98(0.25) <.001
Age 72.27(5.21) 73.26(5.80) <.001
Self-reported health 3.11(0.73) 3.12(0.70) .84
Count of comorbid conditions 1.74 (1.32) 2.01 (1.48) <.001
Years of education 12.63(2.70) 12.52(2.72) .38
Blocks walked per day
12.86(12.51)
12.03(12.18) .14
Walkability index 4.44 (2.18) 4.63(2.27) .06
Park score 4.67(2.95) 4.65(2.94) .86
Neighborhood SES 0.01(4.84) -0.10(4.79) .63
N (%)
N (%) p value
Complex comorbidity
<.001
Yes
644 (51.27)
427 (57.32)
No
612 (48.73)
318 (42.68)
Incident fracture
.02
Yes
296 (23.57)
211 (28.32)
No
960 (76.43)
534 (71.68)
Missing data and attrition. The patterns of missing data are presented in table
4.4 and the amount of both attrition and intermittent missing data at each wave is
depicted in table 4.5. 49% (N=615) of the participants were lost to attrition during the
study period. 51% (N=356) of that attrition was attributable to mortality. The proportion
of attrition at each visit attributable to mortality increases over time, from 37% at visit 2
to 81% at visit 6. In addition to attrition-related missingess, there is a fairly constant
amount of intermittently missing data from visits 2-6.
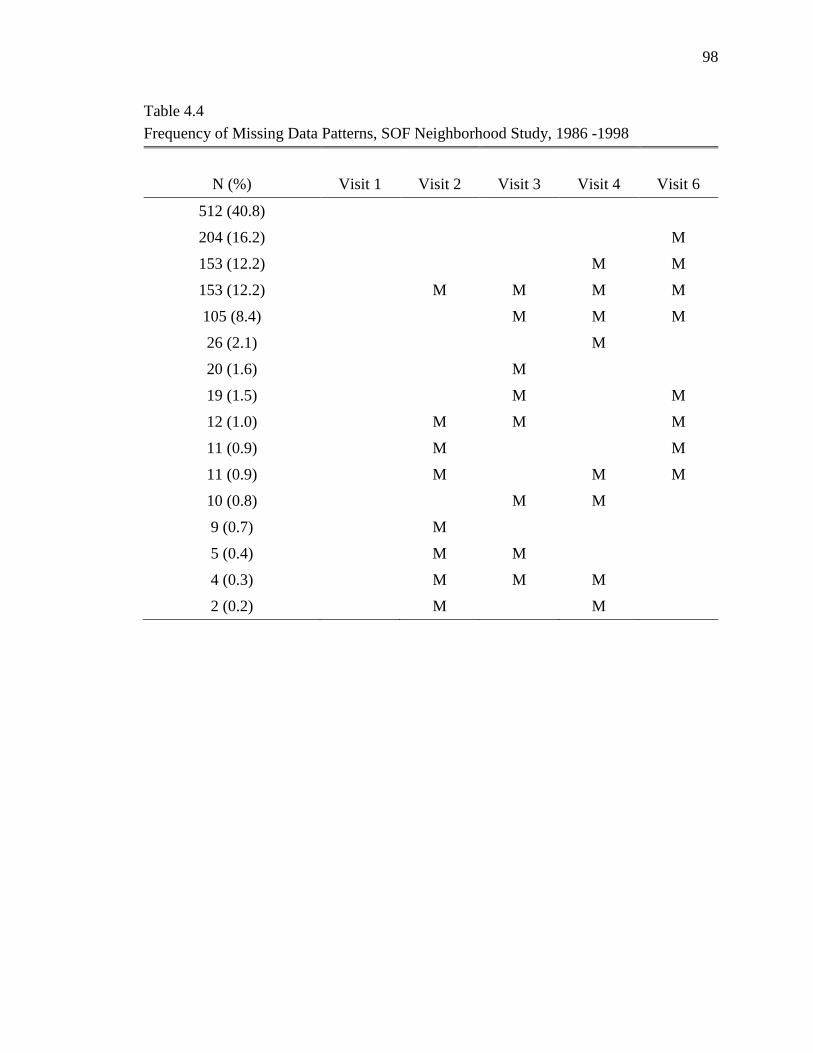
98
Table 4.4
Frequency of Missing Data Patterns, SOF Neighborhood Study, 1986 -1998
N (%) Visit 1 Visit 2 Visit 3 Visit 4 Visit 6
512 (40.8)
204 (16.2) M
153 (12.2) M M
153 (12.2) M M M M
105 (8.4) M M M
26 (2.1) M
20 (1.6) M
19 (1.5) M M
12 (1.0) M M M
11 (0.9) M M
11 (0.9) M M M
10 (0.8) M M
9 (0.7) M
5 (0.4) M M
4 (0.3) M M M
2 (0.2) M M
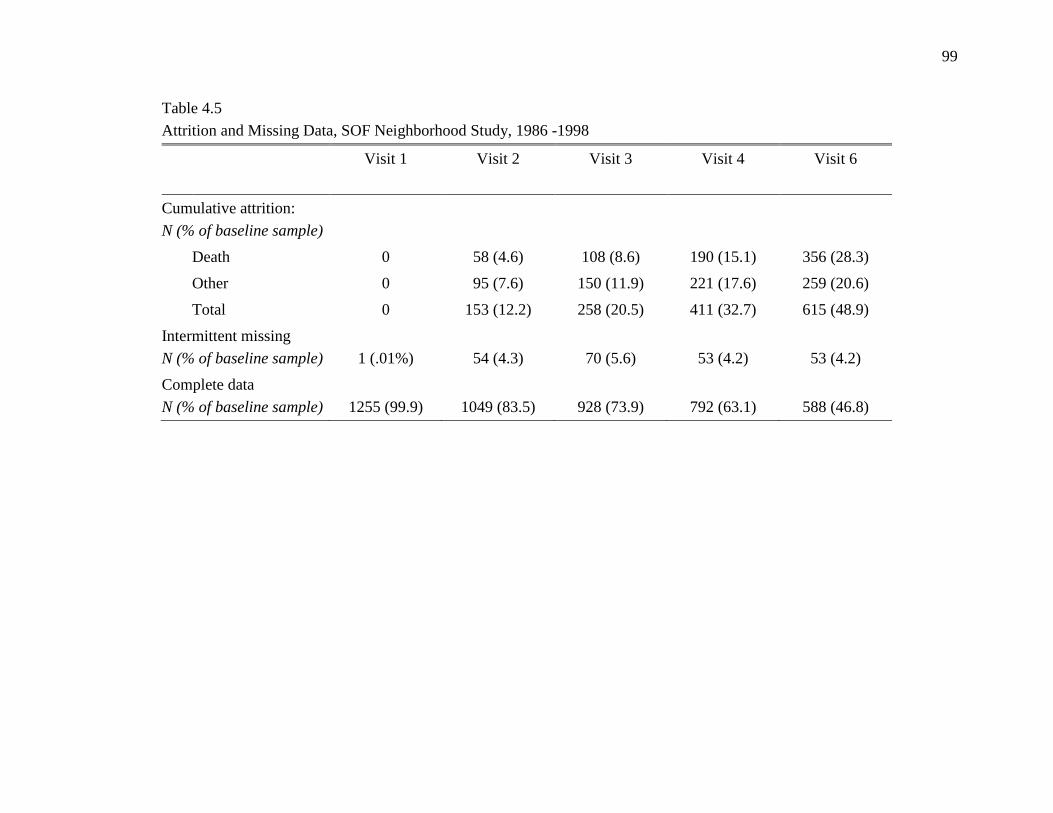
99
Table 4.5
Attrition and Missing Data, SOF Neighborhood Study, 1986 -1998
Visit 1
Visit 2 Visit 3 Visit 4 Visit 6
Cumulative attrition:
N (% of baseline sample)
Death 0 58 (4.6) 108 (8.6) 190 (15.1) 356 (28.3)
Other 0 95 (7.6) 150 (11.9) 221 (17.6) 259 (20.6)
Total 0 153 (12.2) 258 (20.5) 411 (32.7) 615 (48.9)
Intermittent missing
N (% of baseline sample)
1 (.01%)
54 (4.3)
70 (5.6)
53 (4.2)
53 (4.2)
Complete data
N (% of baseline sample)
1255 (99.9)
1049 (83.5)
928 (73.9)
792 (63.1)
588 (46.8)
100
Neighborhood characteristics. Table 4.6 presents descriptive statistics for the
neighborhood environment variables at each wave. On average, participants lived in
neighborhoods with moderately interconnected street grids and in fairly close proximity
to transit, commercial areas, and parks or green spaces. At baseline, participants had an
average of 32.9 bus stops within a quarter mile of their home, and the mean distance to
the nearest transit stop was .19 miles. The mean distance to the nearest commercial area
was .21 miles, and the mean distance to the nearest park or green spaces was .28 miles.
The average intersection density was 202.9. There was, however, a great deal of
individual variability in the neighborhood built environment measures. For example, the
distance to the nearest transit stop at baseline ranged from 40 feet to 3 miles, and the
distance to the nearest commercial area ranged from 0 (indicating the participant lived in
a mixed land-use development) to 1.5 miles. There were moderate correlations between
all of the measures of neighborhood walkability, such that increased walkability on any
one given measure was correlated with increased walkability on all of the other measures.
Weak negative correlations were observed between distance to park/green space,
intersection density, distance to commercial area, and bus stop density, and weak positive
correlations were observed between distance to park/green space and distance to transit.
Notably, there was a pattern of weak to moderate correlations between neighborhood
SES and neighborhood walkability, such that lower SES tended to score higher on every
measure of neighborhood walkability. This inverse relationship between neighborhood
walkability and SES has been observed in previous studies in Portland (Michael et al.
2010; Nagel et al., 2008).Table 4.7 presents the correlation matrix of neighborhood built
environment measures
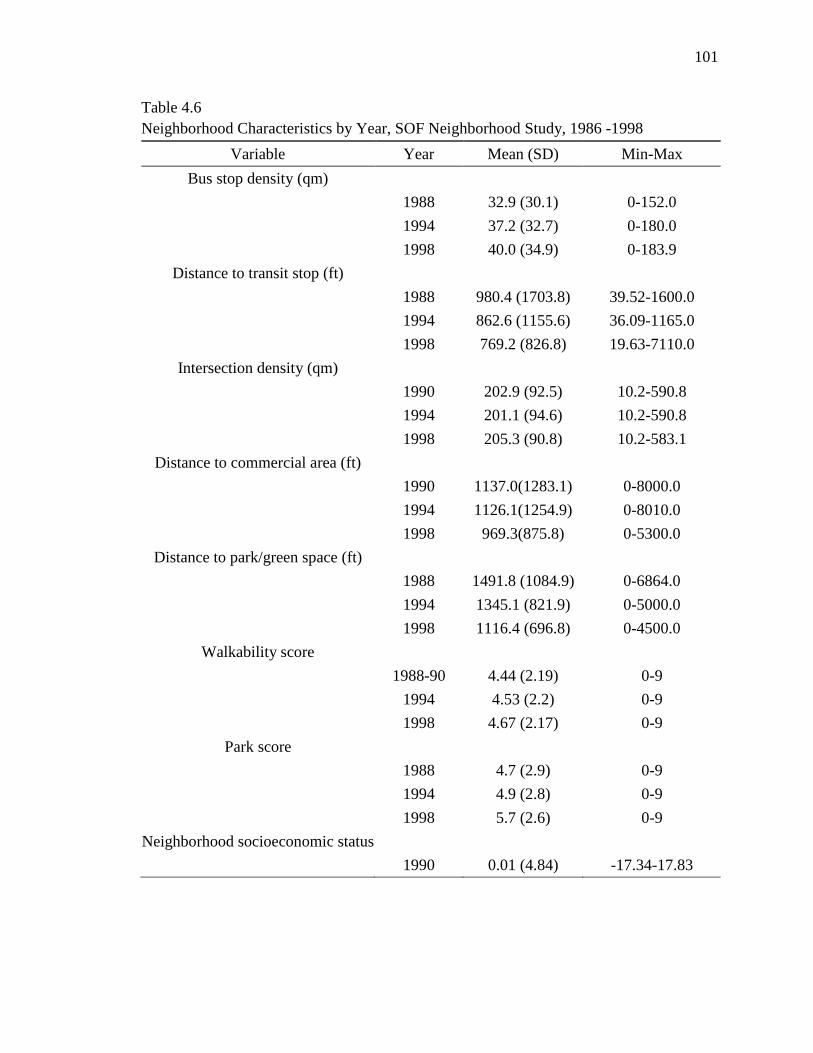
101
Table 4.6
Neighborhood Characteristics by Year, SOF Neighborhood Study, 1986 -1998
Variable Year Mean (SD) Min-Max
Bus stop density (qm)
1988 32.9 (30.1) 0-152.0
1994 37.2 (32.7) 0-180.0
1998 40.0 (34.9) 0-183.9
Distance to transit stop (ft)
1988 980.4 (1703.8) 39.52-1600.0
1994 862.6 (1155.6) 36.09-1165.0
1998 769.2 (826.8) 19.63-7110.0
Intersection density (qm)
1990 202.9 (92.5) 10.2-590.8
1994 201.1 (94.6) 10.2-590.8
1998 205.3 (90.8) 10.2-583.1
Distance to commercial area (ft)
1990 1137.0(1283.1) 0-8000.0
1994 1126.1(1254.9) 0-8010.0
1998 969.3(875.8) 0-5300.0
Distance to park/green space (ft)
1988 1491.8 (1084.9) 0-6864.0
1994 1345.1 (821.9) 0-5000.0
1998 1116.4 (696.8) 0-4500.0
Walkability score
1988-90 4.44 (2.19) 0-9
1994 4.53 (2.2) 0-9
1998 4.67 (2.17) 0-9
Park score
1988 4.7 (2.9) 0-9
1994 4.9 (2.8) 0-9
1998 5.7 (2.6) 0-9
Neighborhood socioeconomic status
1990 0.01 (4.84) -17.34-17.83
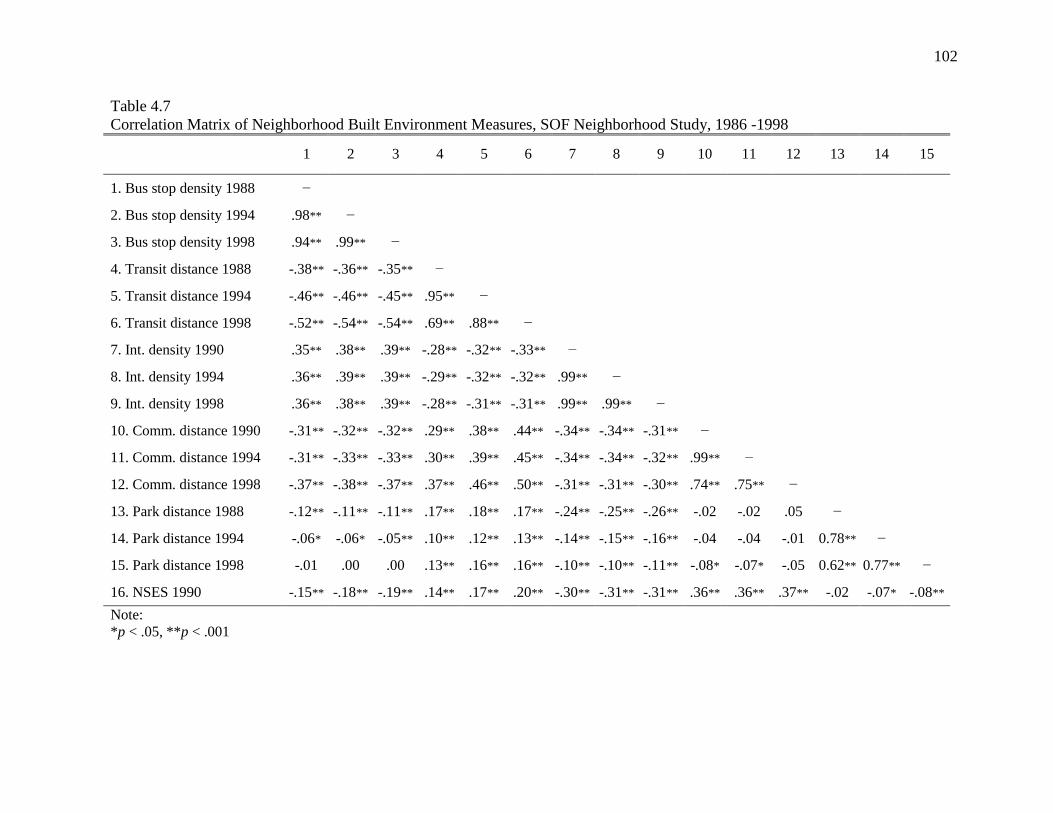
102
Table 4.7
Correlation Matrix of Neighborhood Built Environment Measures, SOF Neighborhood Study, 1986 -1998
1 2 3 4 5 6 7 8 9 10 11 12 13 14 15
1. Bus stop density 1988 −
2. Bus stop density 1994 .98** −
3. Bus stop density 1998 .94** .99** −
4. Transit distance 1988 -.38** -.36** -.35** −
5. Transit distance 1994 -.46** -.46** -.45** .95** −
6. Transit distance 1998 -.52** -.54** -.54** .69** .88** −
7. Int. density 1990 .35** .38** .39** -.28** -.32** -.33** −
8. Int. density 1994 .36** .39** .39** -.29** -.32** -.32** .99** −
9. Int. density 1998 .36** .38** .39** -.28** -.31** -.31** .99** .99** −
10. Comm. distance 1990 -.31** -.32** -.32** .29** .38** .44** -.34** -.34** -.31** −
11. Comm. distance 1994 -.31** -.33** -.33** .30** .39** .45** -.34** -.34** -.32** .99** −
12. Comm. distance 1998 -.37** -.38** -.37** .37** .46** .50** -.31** -.31** -.30** .74** .75** −
13. Park distance 1988 -.12** -.11** -.11** .17** .18** .17** -.24** -.25** -.26** -.02 -.02 .05 −
14. Park distance 1994 -.06* -.06* -.05** .10** .12** .13** -.14** -.15** -.16** -.04 -.04 -.01 0.78** −
15. Park distance 1998 -.01 .00 .00 .13** .16** .16** -.10** -.10** -.11** -.08* -.07* -.05 0.62** 0.77** −
16. NSES 1990 -.15** -.18** -.19** .14** .17** .20** -.30** -.31** -.31** .36** .36** .37** -.02 -.07* -.08**
Note:
*p < .05, **p < .001
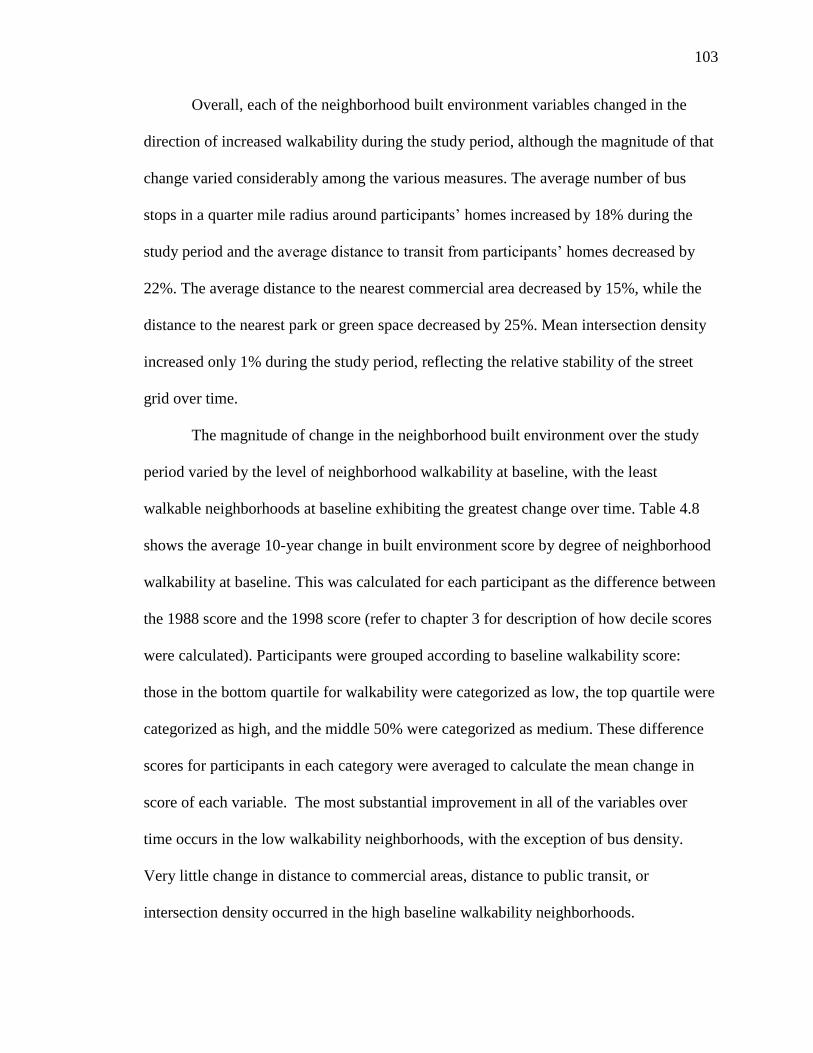
103
Overall, each of the neighborhood built environment variables changed in the
direction of increased walkability during the study period, although the magnitude of that
change varied considerably among the various measures. The average number of bus
stops in a quarter mile radius around participants‘ homes increased by 18% during the
study period and the average distance to transit from participants‘ homes decreased by
22%. The average distance to the nearest commercial area decreased by 15%, while the
distance to the nearest park or green space decreased by 25%. Mean intersection density
increased only 1% during the study period, reflecting the relative stability of the street
grid over time.
The magnitude of change in the neighborhood built environment over the study
period varied by the level of neighborhood walkability at baseline, with the least
walkable neighborhoods at baseline exhibiting the greatest change over time. Table 4.8
shows the average 10-year change in built environment score by degree of neighborhood
walkability at baseline. This was calculated for each participant as the difference between
the 1988 score and the 1998 score (refer to chapter 3 for description of how decile scores
were calculated). Participants were grouped according to baseline walkability score:
those in the bottom quartile for walkability were categorized as low, the top quartile were
categorized as high, and the middle 50% were categorized as medium. These difference
scores for participants in each category were averaged to calculate the mean change in
score of each variable. The most substantial improvement in all of the variables over
time occurs in the low walkability neighborhoods, with the exception of bus density.
Very little change in distance to commercial areas, distance to public transit, or
intersection density occurred in the high baseline walkability neighborhoods.
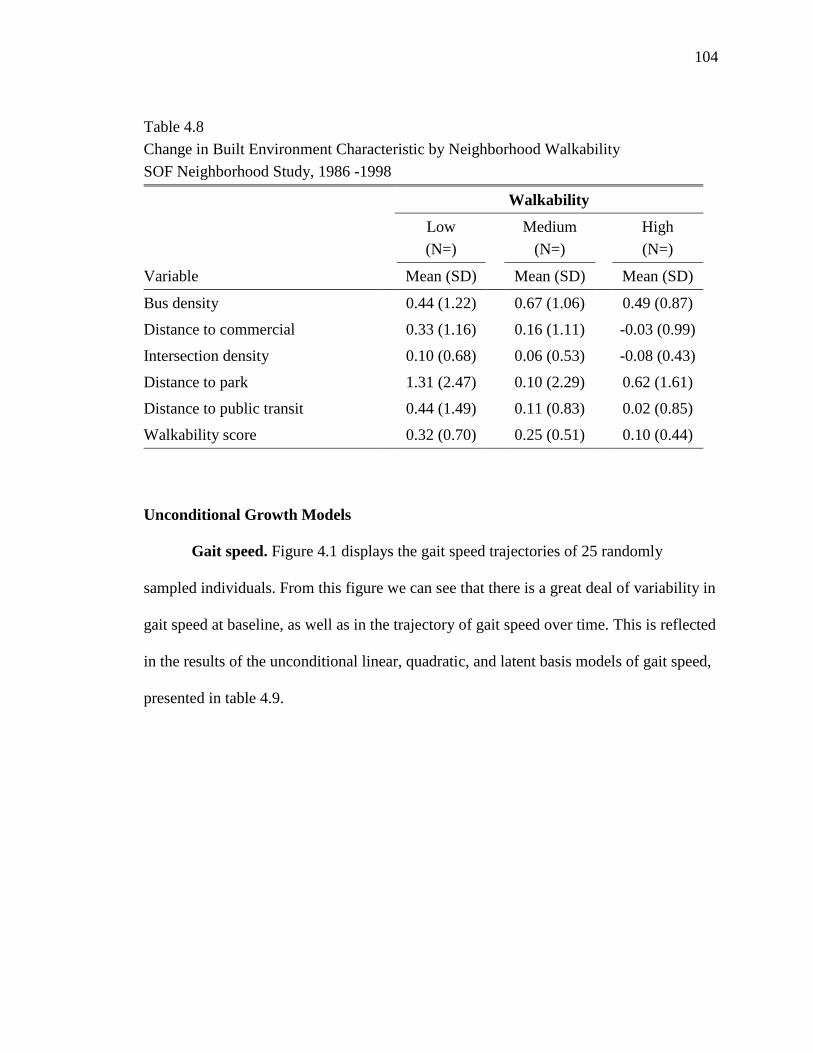
104
Unconditional Growth Models
Gait speed. Figure 4.1 displays the gait speed trajectories of 25 randomly
sampled individuals. From this figure we can see that there is a great deal of variability in
gait speed at baseline, as well as in the trajectory of gait speed over time. This is reflected
in the results of the unconditional linear, quadratic, and latent basis models of gait speed,
presented in table 4.9.
Table 4.8
Change in Built Environment Characteristic by Neighborhood Walkability
SOF Neighborhood Study, 1986 -1998
Walkability
Low
(N=)
Medium
(N=)
High
(N=)
Variable Mean (SD) Mean (SD) Mean (SD)
Bus density 0.44 (1.22) 0.67 (1.06) 0.49 (0.87)
Distance to commercial 0.33 (1.16) 0.16 (1.11) -0.03 (0.99)
Intersection density 0.10 (0.68) 0.06 (0.53) -0.08 (0.43)
Distance to park 1.31 (2.47) 0.10 (2.29) 0.62 (1.61)
Distance to public transit 0.44 (1.49) 0.11 (0.83) 0.02 (0.85)
Walkability score 0.32 (0.70) 0.25 (0.51) 0.10 (0.44)
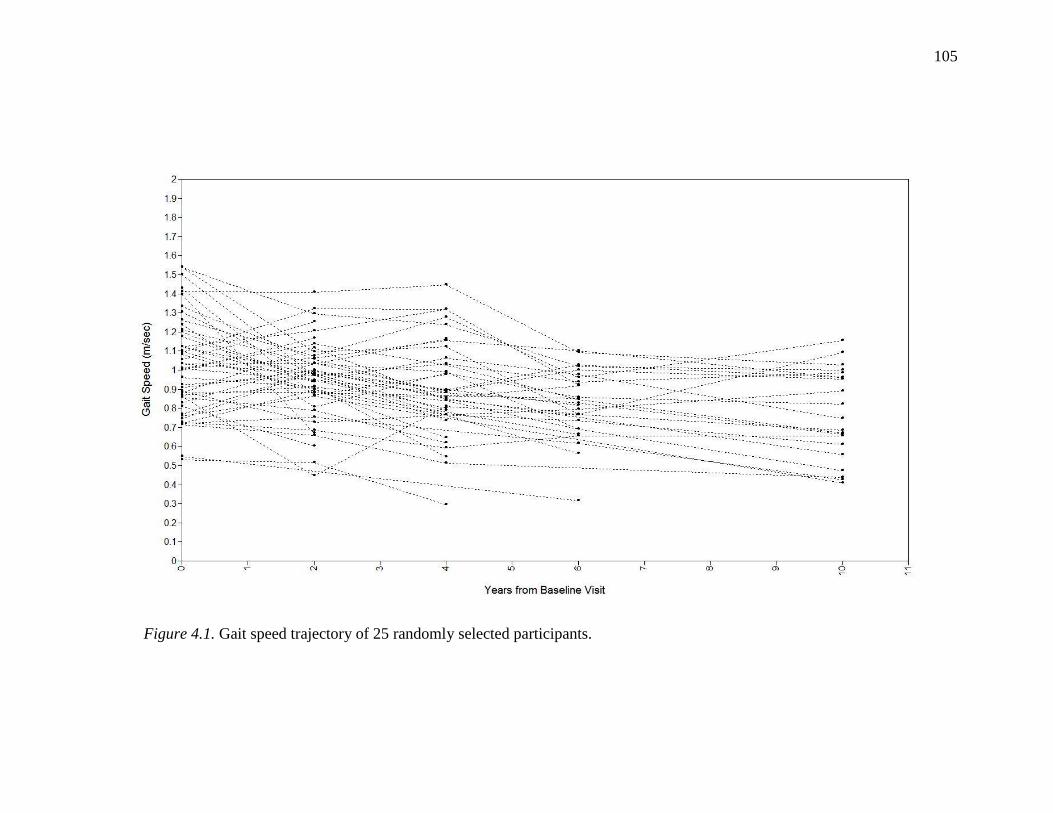
105
Figure 4.1. Gait speed trajectory of 25 randomly selected participants.
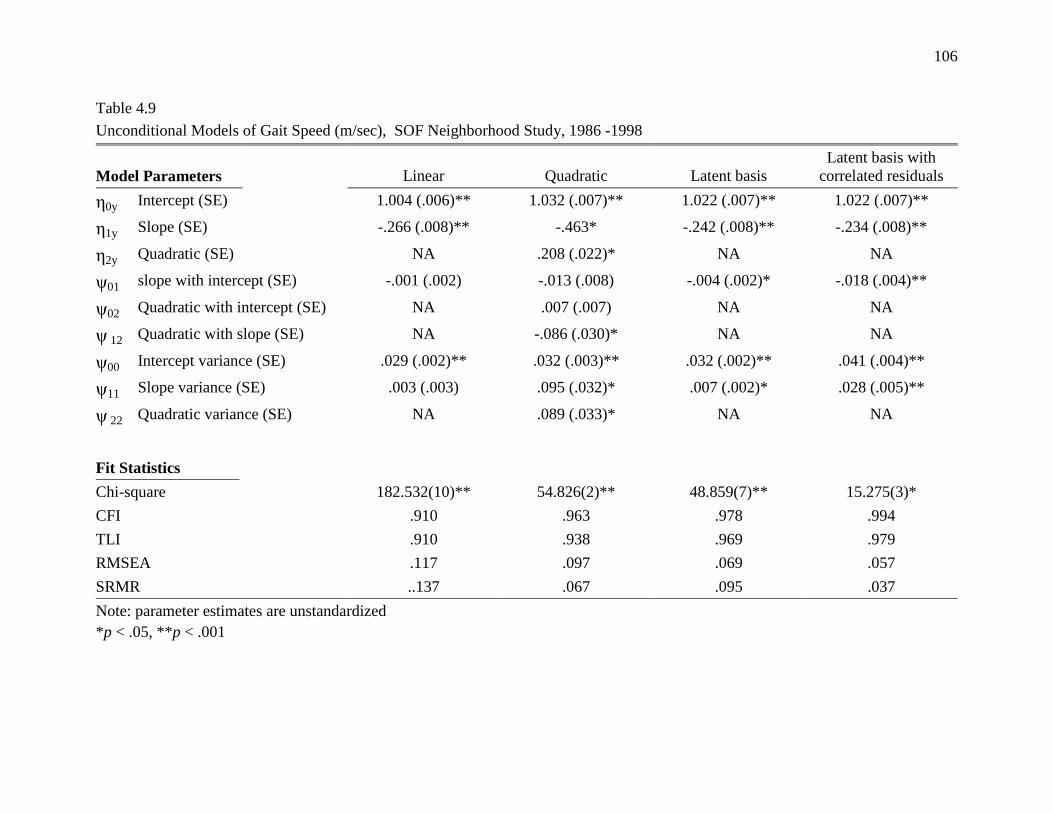
106
Table 4.9
Unconditional Models of Gait Speed (m/sec), SOF Neighborhood Study, 1986 -1998
Model Parameters Linear Quadratic Latent basis
Latent basis with
correlated residuals
0y Intercept (SE) 1.004 (.006)** 1.032 (.007)** 1.022 (.007)** 1.022 (.007)**
1y Slope (SE) -.266 (.008)** -.463* -.242 (.008)** -.234 (.008)**
2y Quadratic (SE) NA .208 (.022)* NA NA
ψ01 slope with intercept (SE) -.001 (.002) -.013 (.008) -.004 (.002)* -.018 (.004)**
ψ02 Quadratic with intercept (SE) NA .007 (.007) NA NA
ψ 12 Quadratic with slope (SE) NA -.086 (.030)* NA NA
ψ00 Intercept variance (SE) .029 (.002)** .032 (.003)** .032 (.002)** .041 (.004)**
ψ11 Slope variance (SE) .003 (.003) .095 (.032)* .007 (.002)* .028 (.005)**
ψ 22 Quadratic variance (SE) NA .089 (.033)* NA NA
Fit Statistics
Chi-square 182.532(10)** 54.826(2)** 48.859(7)** 15.275(3)*
CFI .910 .963 .978 .994
TLI .910 .938 .969 .979
RMSEA .117 .097 .069 .057
SRMR ..137 .067 .095 .037
Note: parameter estimates are unstandardized
*p < .05, **p < .001
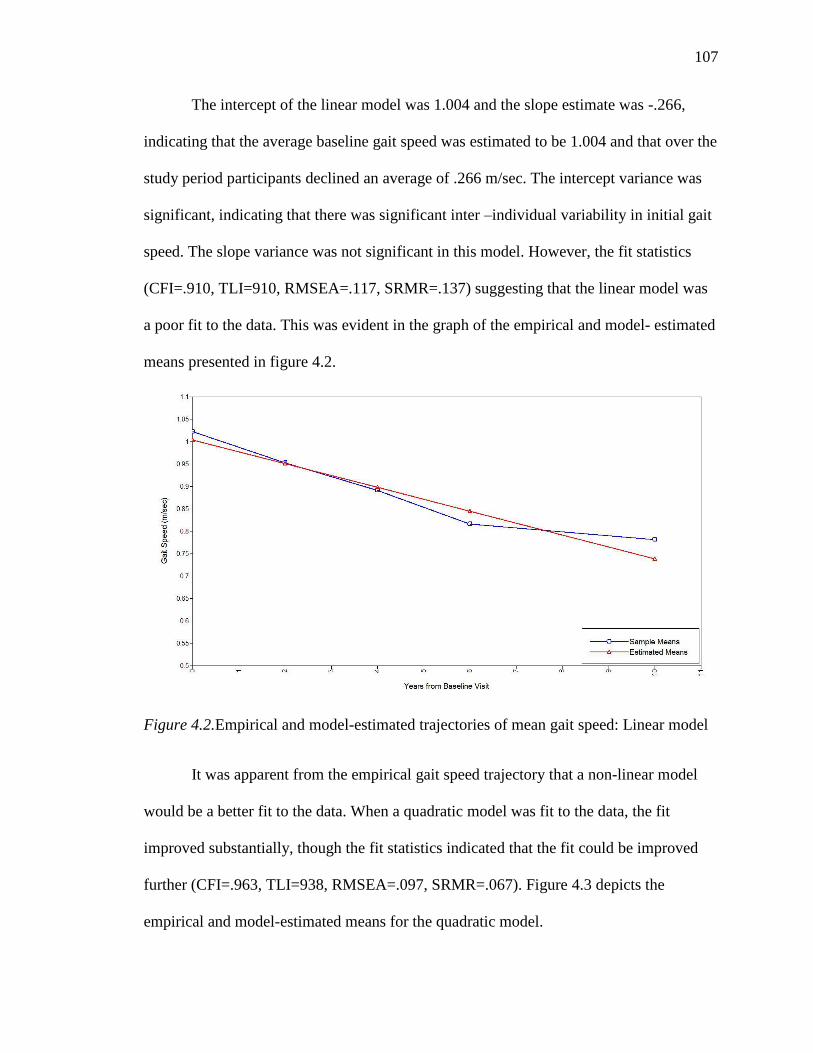
107
The intercept of the linear model was 1.004 and the slope estimate was -.266,
indicating that the average baseline gait speed was estimated to be 1.004 and that over the
study period participants declined an average of .266 m/sec. The intercept variance was
significant, indicating that there was significant inter –individual variability in initial gait
speed. The slope variance was not significant in this model. However, the fit statistics
(CFI=.910, TLI=910, RMSEA=.117, SRMR=.137) suggesting that the linear model was
a poor fit to the data. This was evident in the graph of the empirical and model- estimated
means presented in figure 4.2.
Figure 4.2.Empirical and model-estimated trajectories of mean gait speed: Linear model
It was apparent from the empirical gait speed trajectory that a non-linear model
would be a better fit to the data. When a quadratic model was fit to the data, the fit
improved substantially, though the fit statistics indicated that the fit could be improved
further (CFI=.963, TLI=938, RMSEA=.097, SRMR=.067). Figure 4.3 depicts the
empirical and model-estimated means for the quadratic model.
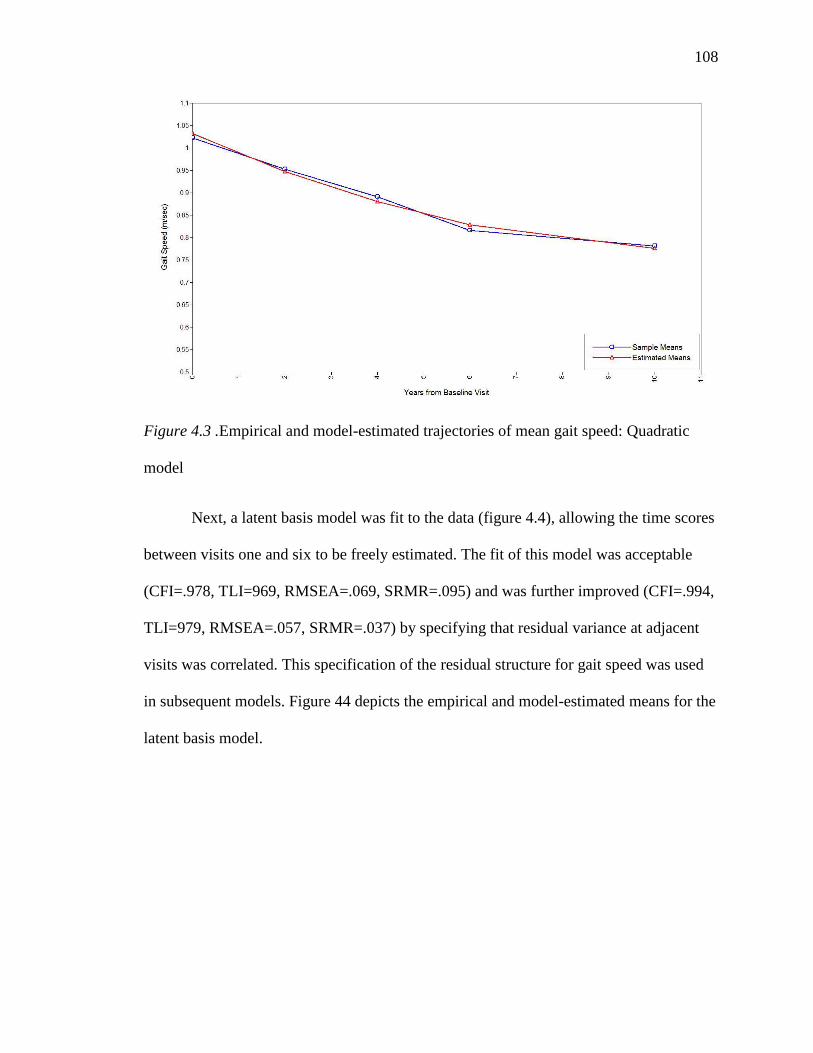
108
Figure 4.3 .Empirical and model-estimated trajectories of mean gait speed: Quadratic
model
Next, a latent basis model was fit to the data (figure 4.4), allowing the time scores
between visits one and six to be freely estimated. The fit of this model was acceptable
(CFI=.978, TLI=969, RMSEA=.069, SRMR=.095) and was further improved (CFI=.994,
TLI=979, RMSEA=.057, SRMR=.037) by specifying that residual variance at adjacent
visits was correlated. This specification of the residual structure for gait speed was used
in subsequent models. Figure 44 depicts the empirical and model-estimated means for the
latent basis model.
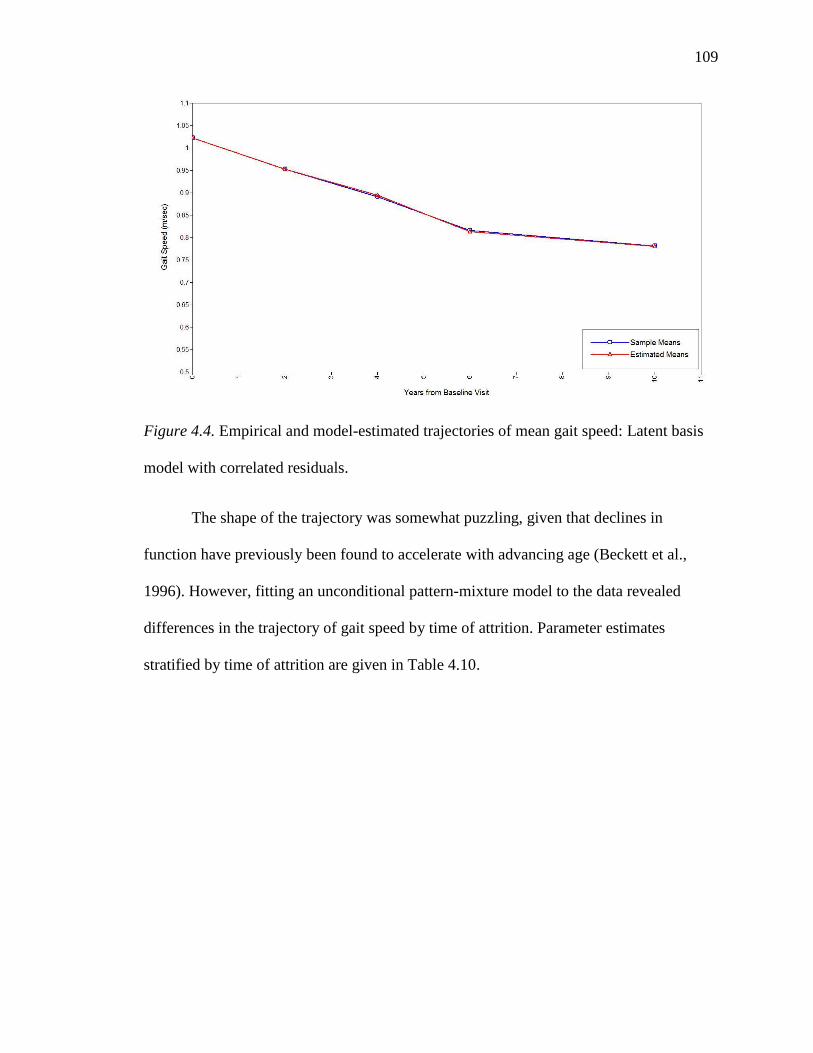
109
Figure 4.4. Empirical and model-estimated trajectories of mean gait speed: Latent basis
model with correlated residuals.
The shape of the trajectory was somewhat puzzling, given that declines in
function have previously been found to accelerate with advancing age (Beckett et al.,
1996). However, fitting an unconditional pattern-mixture model to the data revealed
differences in the trajectory of gait speed by time of attrition. Parameter estimates
stratified by time of attrition are given in Table 4.10.
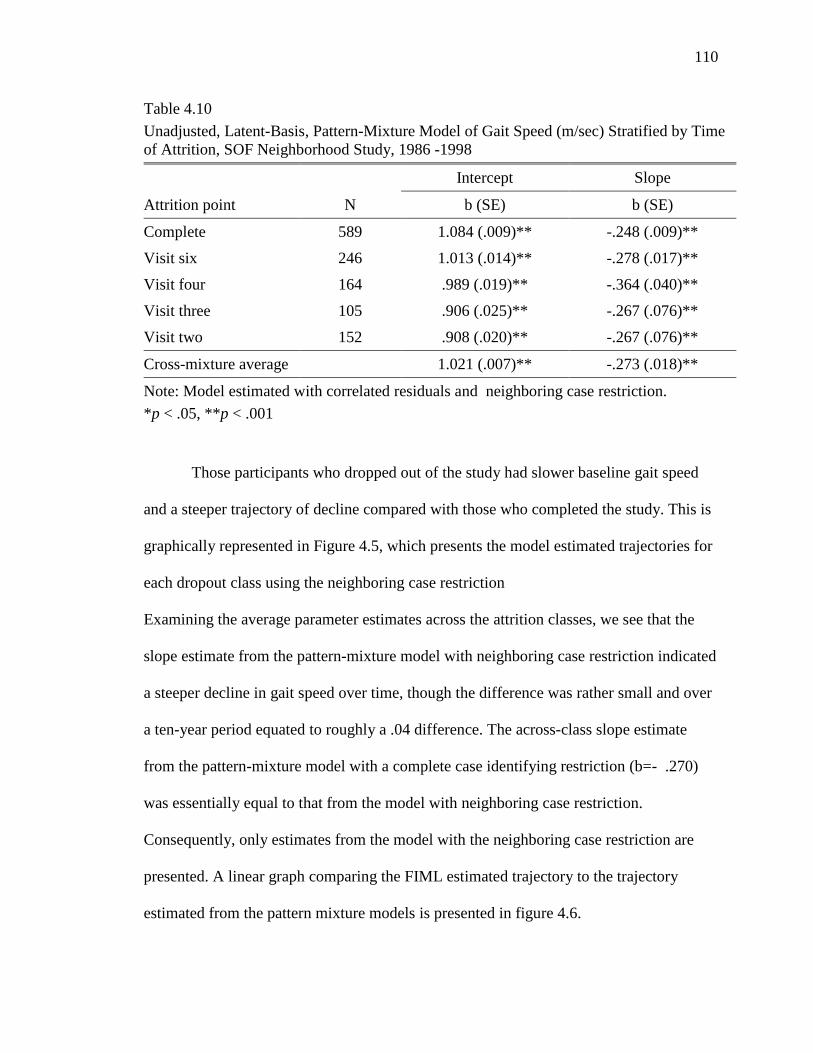
110
Table 4.10
Unadjusted, Latent-Basis, Pattern-Mixture Model of Gait Speed (m/sec) Stratified by Time
of Attrition, SOF Neighborhood Study, 1986 -1998
Intercept Slope
Attrition point N b (SE) b (SE)
Complete 589 1.084 (.009)** -.248 (.009)**
Visit six 246 1.013 (.014)** -.278 (.017)**
Visit four 164 .989 (.019)** -.364 (.040)**
Visit three 105 .906 (.025)** -.267 (.076)**
Visit two 152 .908 (.020)** -.267 (.076)**
Cross-mixture average 1.021 (.007)** -.273 (.018)**
Note: Model estimated with correlated residuals and neighboring case restriction.
*p < .05, **p < .001
Those participants who dropped out of the study had slower baseline gait speed
and a steeper trajectory of decline compared with those who completed the study. This is
graphically represented in Figure 4.5, which presents the model estimated trajectories for
each dropout class using the neighboring case restriction
Examining the average parameter estimates across the attrition classes, we see that the
slope estimate from the pattern-mixture model with neighboring case restriction indicated
a steeper decline in gait speed over time, though the difference was rather small and over
a ten-year period equated to roughly a .04 difference. The across-class slope estimate
from the pattern-mixture model with a complete case identifying restriction (b=- .270)
was essentially equal to that from the model with neighboring case restriction.
Consequently, only estimates from the model with the neighboring case restriction are
presented. A linear graph comparing the FIML estimated trajectory to the trajectory
estimated from the pattern mixture models is presented in figure 4.6.
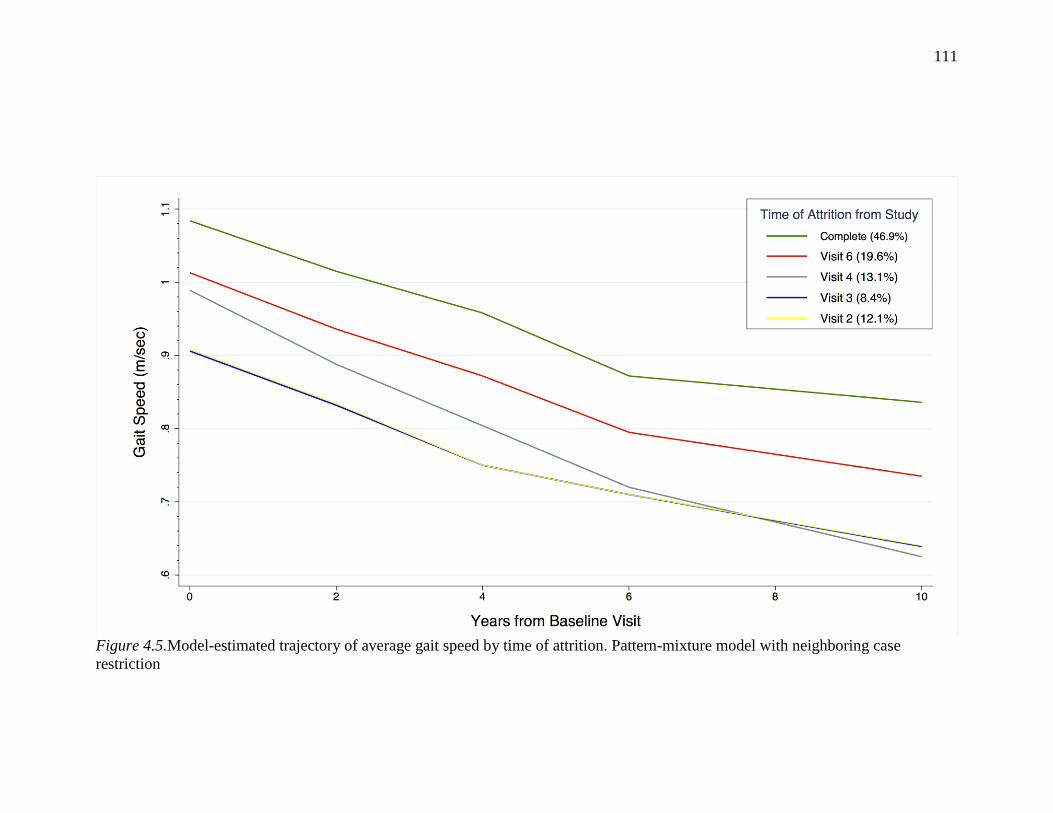
111
Figure 4.5.Model-estimated trajectory of average gait speed by time of attrition. Pattern-mixture model with neighboring case
restriction
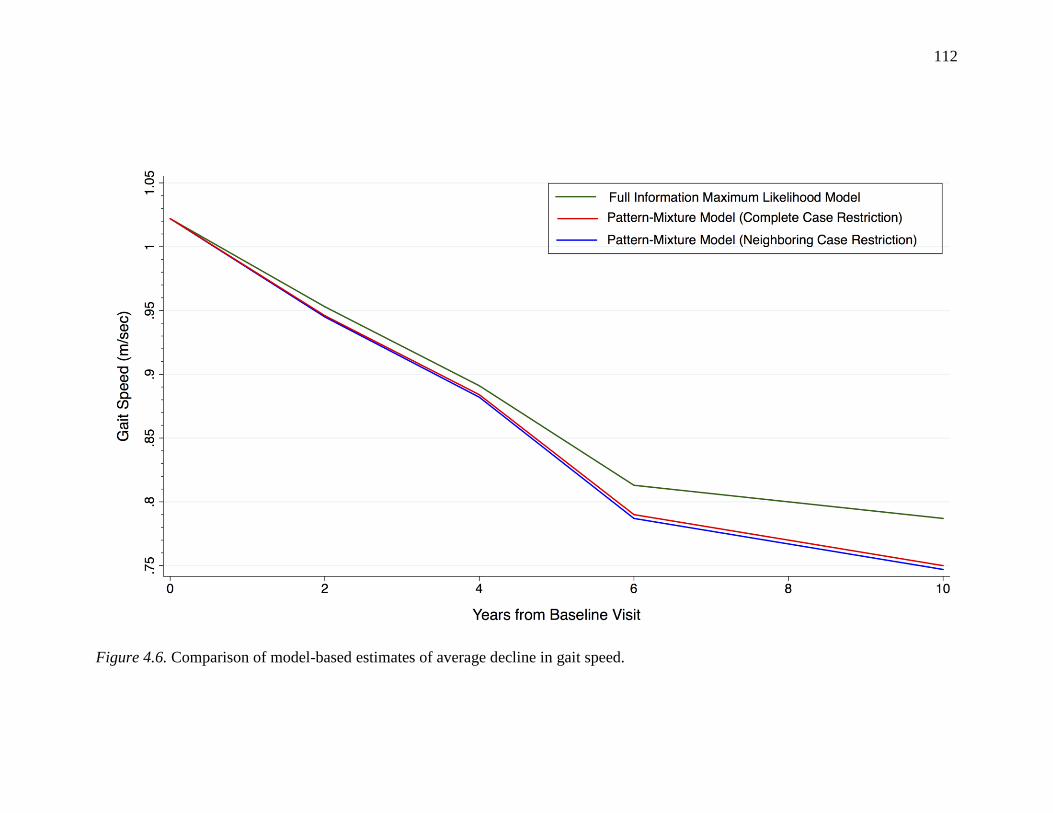
112
Figure 4.6. Comparison of model-based estimates of average decline in gait speed.
113
Neighborhood built environment. Figures 4.7 and 4.8 display the trajectories of
walkability and distance to park/green space in the neighborhoods of 50 randomly
sampled individuals. Figure 4.7 illustrates the substantial variability among participants
in the walkability score of their neighborhood at baseline, though there was relatively
little change in the slope of walkability over time. Figure 4.8 depicts the variability
among participants in their distance to the nearest park or green space, as well as the
significant change in that distance over time for a large number of participants. This
indicates that there was substantial development of park/green space in the Portland
Metro area during the study period.
The parameter estimates and fit statistics for walkability and distance to
park/green space are presented in table 4.11. As with gait speed, a linear model was a
poor fit to both of the variables. Because there were not enough time points to estimate a
quadratic model, a latent basis model was fit to the data and the residual variance was
constrained as equal across time points to reduce the number of estimated parameters in
the model.
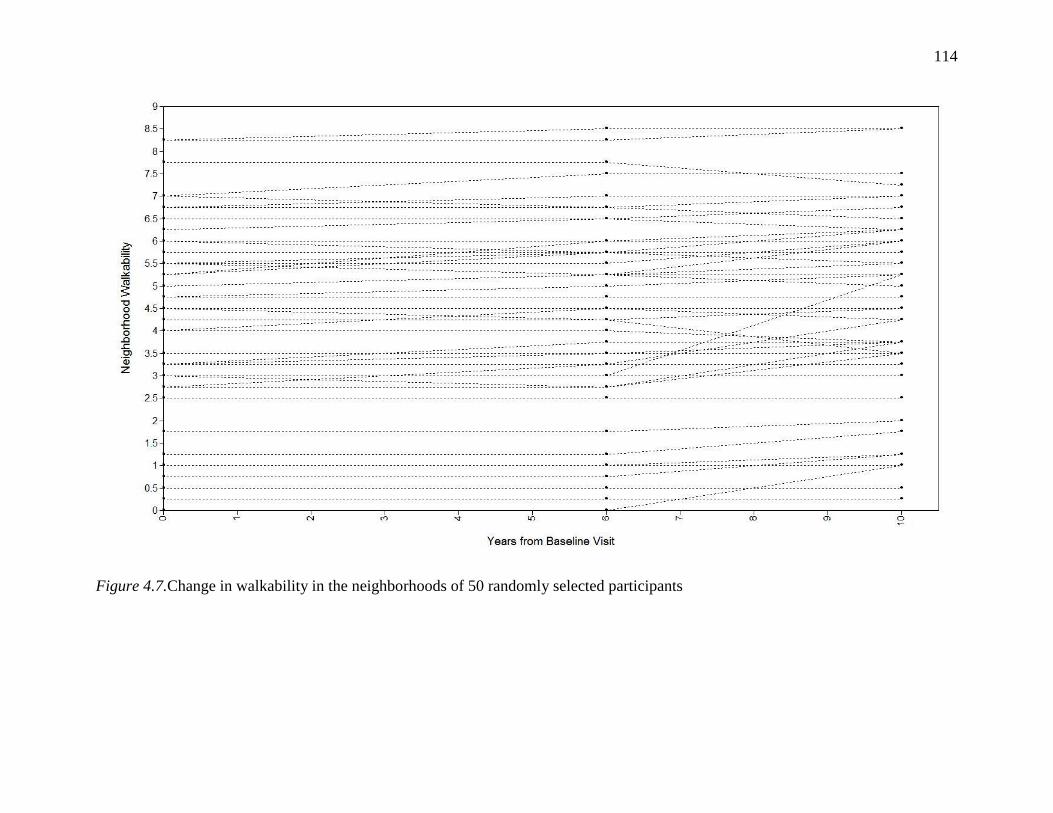
114
Figure 4.7.Change in walkability in the neighborhoods of 50 randomly selected participants
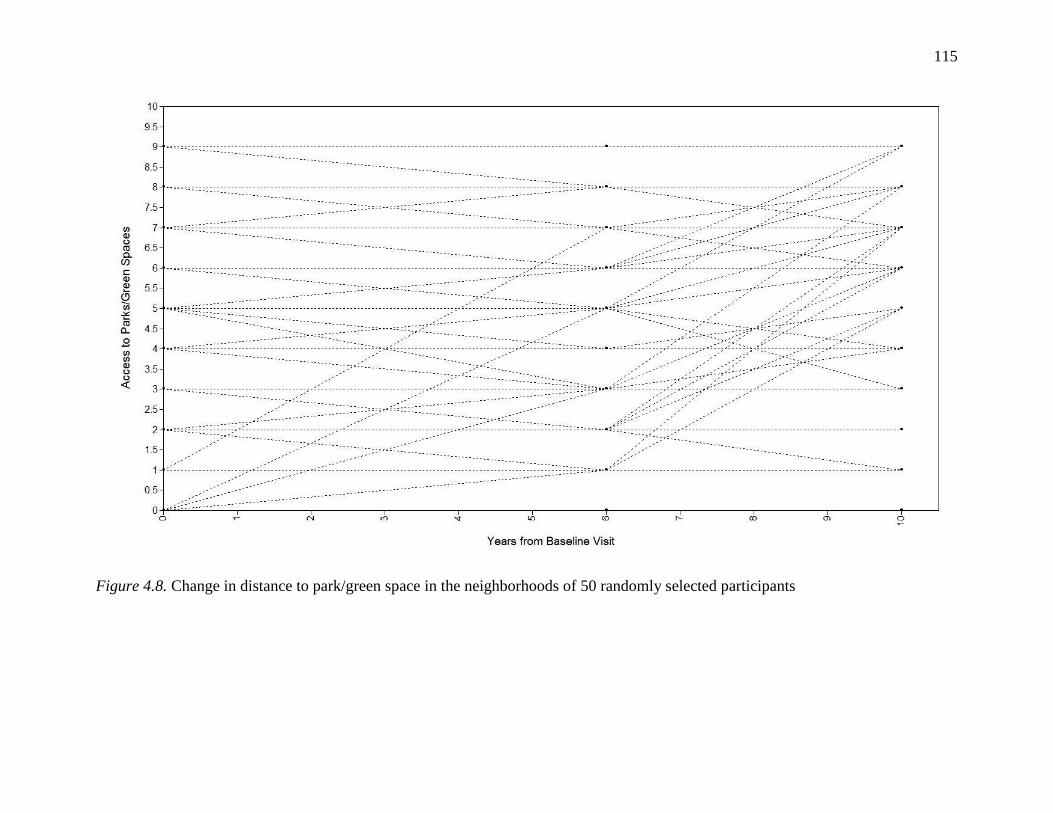
115
Figure 4.8. Change in distance to park/green space in the neighborhoods of 50 randomly selected participants
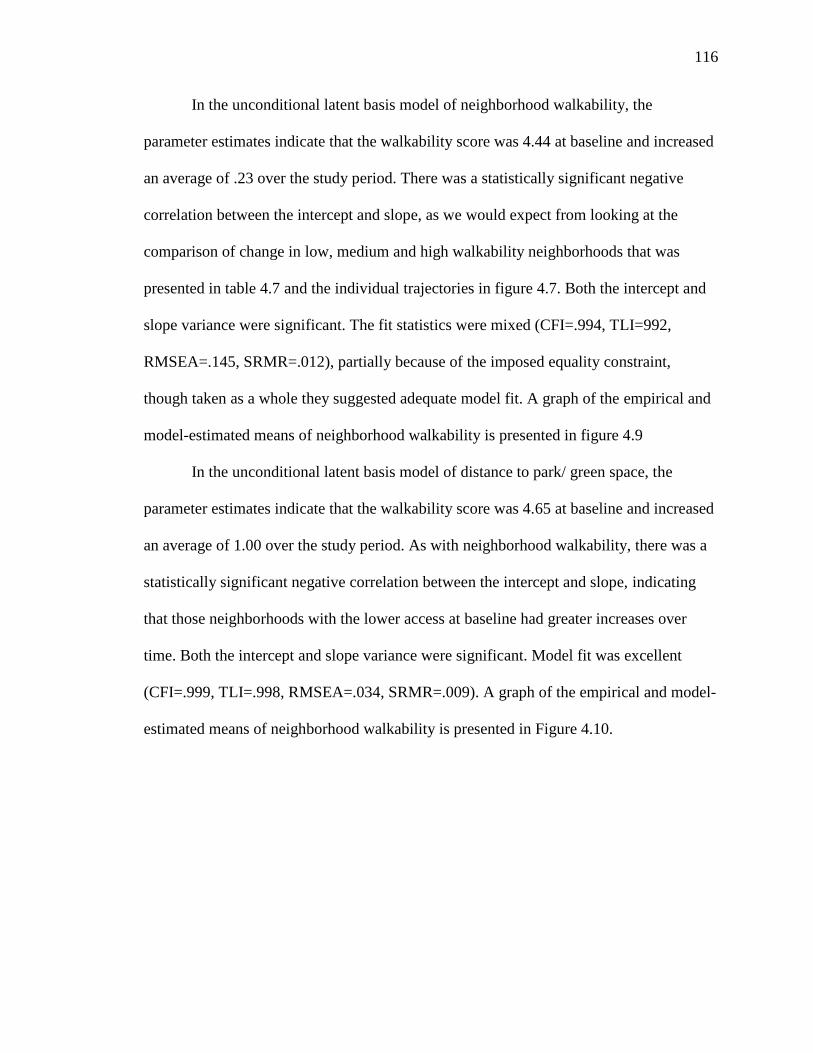
116
In the unconditional latent basis model of neighborhood walkability, the
parameter estimates indicate that the walkability score was 4.44 at baseline and increased
an average of .23 over the study period. There was a statistically significant negative
correlation between the intercept and slope, as we would expect from looking at the
comparison of change in low, medium and high walkability neighborhoods that was
presented in table 4.7 and the individual trajectories in figure 4.7. Both the intercept and
slope variance were significant. The fit statistics were mixed (CFI=.994, TLI=992,
RMSEA=.145, SRMR=.012), partially because of the imposed equality constraint,
though taken as a whole they suggested adequate model fit. A graph of the empirical and
model-estimated means of neighborhood walkability is presented in figure 4.9
In the unconditional latent basis model of distance to park/ green space, the
parameter estimates indicate that the walkability score was 4.65 at baseline and increased
an average of 1.00 over the study period. As with neighborhood walkability, there was a
statistically significant negative correlation between the intercept and slope, indicating
that those neighborhoods with the lower access at baseline had greater increases over
time. Both the intercept and slope variance were significant. Model fit was excellent
(CFI=.999, TLI=.998, RMSEA=.034, SRMR=.009). A graph of the empirical and model-
estimated means of neighborhood walkability is presented in Figure 4.10.
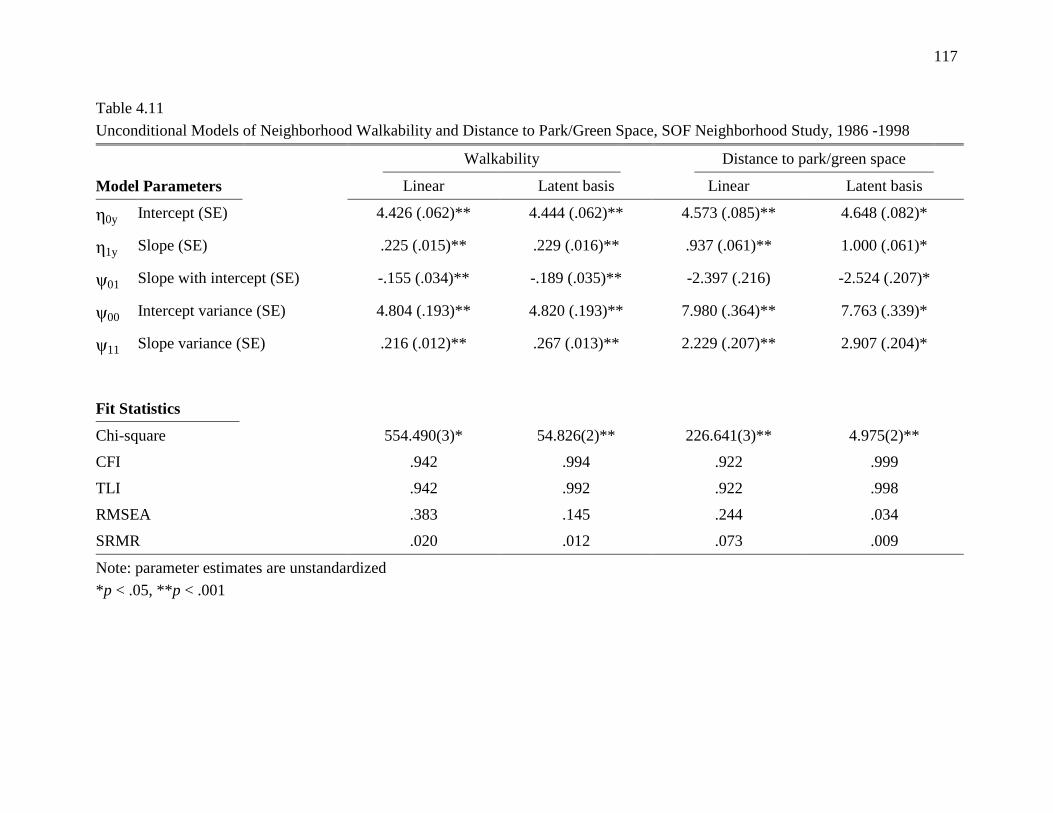
117
Table 4.11
Unconditional Models of Neighborhood Walkability and Distance to Park/Green Space, SOF Neighborhood Study, 1986 -1998
Walkability Distance to park/green space
Model Parameters Linear Latent basis Linear Latent basis
0y Intercept (SE) 4.426 (.062)** 4.444 (.062)** 4.573 (.085)** 4.648 (.082)*
1y Slope (SE) .225 (.015)** .229 (.016)** .937 (.061)** 1.000 (.061)*
ψ01 Slope with intercept (SE) -.155 (.034)** -.189 (.035)** -2.397 (.216) -2.524 (.207)*
ψ00 Intercept variance (SE) 4.804 (.193)** 4.820 (.193)** 7.980 (.364)** 7.763 (.339)*
ψ11 Slope variance (SE) .216 (.012)** .267 (.013)** 2.229 (.207)** 2.907 (.204)*
Fit Statistics
Chi-square 554.490(3)* 54.826(2)** 226.641(3)** 4.975(2)**
CFI .942 .994 .922 .999
TLI .942 .992 .922 .998
RMSEA .383 .145 .244 .034
SRMR .020 .012 .073 .009
Note: parameter estimates are unstandardized
*p < .05, **p < .001
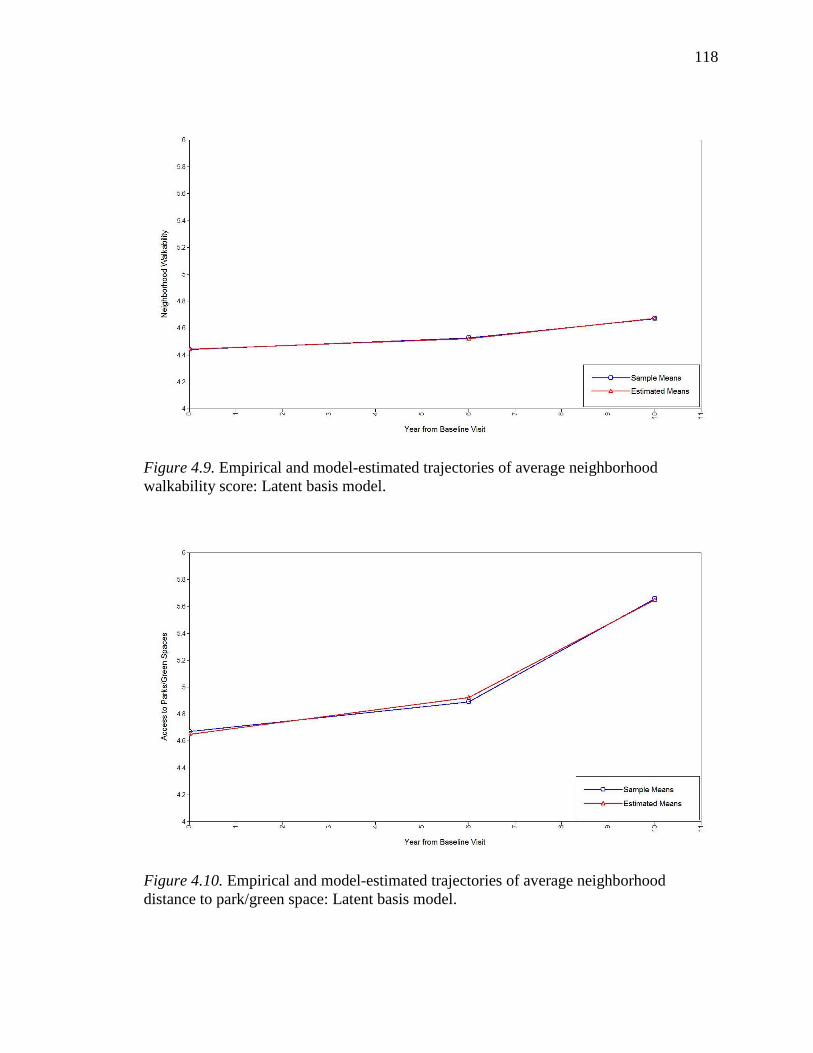
118
Figure 4.9. Empirical and model-estimated trajectories of average neighborhood
walkability score: Latent basis model.
Figure 4.10. Empirical and model-estimated trajectories of average neighborhood
distance to park/green space: Latent basis model.
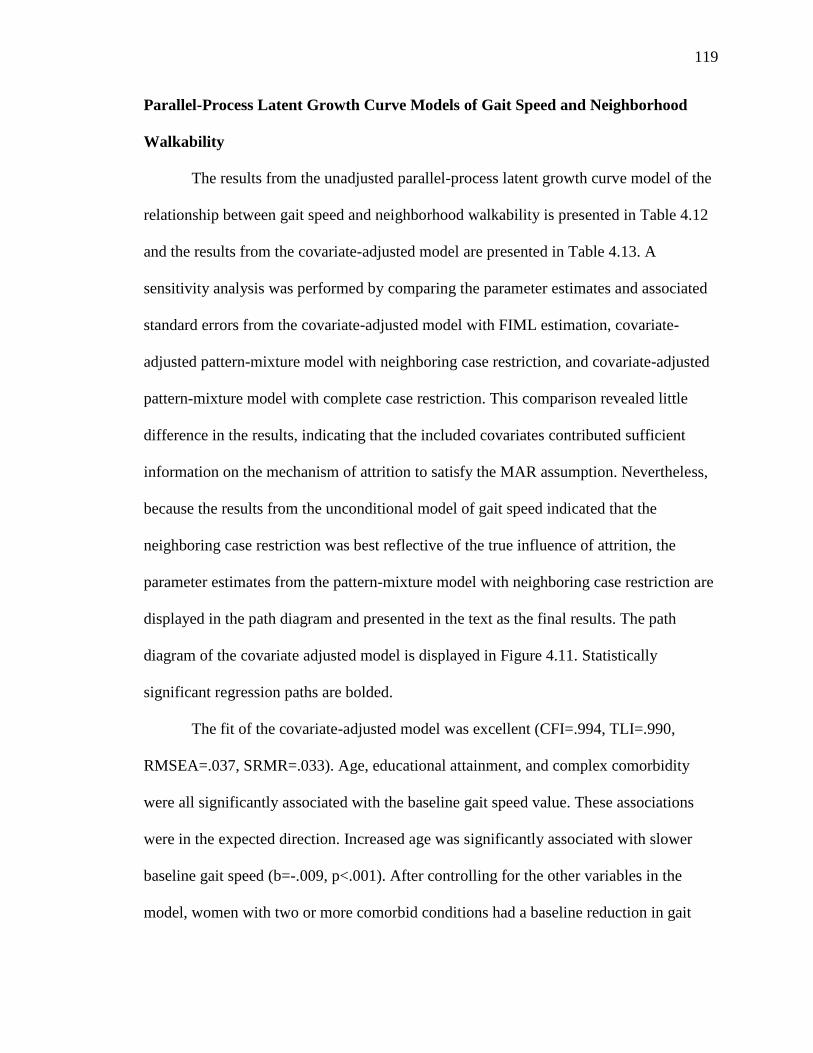
119
Parallel-Process Latent Growth Curve Models of Gait Speed and Neighborhood
Walkability
The results from the unadjusted parallel-process latent growth curve model of the
relationship between gait speed and neighborhood walkability is presented in Table 4.12
and the results from the covariate-adjusted model are presented in Table 4.13. A
sensitivity analysis was performed by comparing the parameter estimates and associated
standard errors from the covariate-adjusted model with FIML estimation, covariate-
adjusted pattern-mixture model with neighboring case restriction, and covariate-adjusted
pattern-mixture model with complete case restriction. This comparison revealed little
difference in the results, indicating that the included covariates contributed sufficient
information on the mechanism of attrition to satisfy the MAR assumption. Nevertheless,
because the results from the unconditional model of gait speed indicated that the
neighboring case restriction was best reflective of the true influence of attrition, the
parameter estimates from the pattern-mixture model with neighboring case restriction are
displayed in the path diagram and presented in the text as the final results. The path
diagram of the covariate adjusted model is displayed in Figure 4.11. Statistically
significant regression paths are bolded.
The fit of the covariate-adjusted model was excellent (CFI=.994, TLI=.990,
RMSEA=.037, SRMR=.033). Age, educational attainment, and complex comorbidity
were all significantly associated with the baseline gait speed value. These associations
were in the expected direction. Increased age was significantly associated with slower
baseline gait speed (b=-.009, p<.001). After controlling for the other variables in the
model, women with two or more comorbid conditions had a baseline reduction in gait
120
speed of .055 m/sec (p<.001) compared to women with less than two comorbid
conditions. Conversely, higher educational attainment was associated with faster gait
speed at baseline (b=.035, p<.001). Of the individual-level covariates included in the
model, only age was significantly associated with the magnitude of decline over time
(b=-.003, p=.029) Neighborhood SES was not significantly associated with the baseline
gait speed value but was negatively associated with the degree of change in gait speed
over time (b=.003, p=.046). The results of the regressions of the gait speed growth factors
on the neighborhood walkability factors are presented below in the context of the study
aims.
Specific aim 1: Describe the relationship between baseline neighborhood
walkability and baseline lower-extremity function among older women. There was
no association between the intercept of gait speed and the intercept of neighborhood
walkability in either the unadjusted or covariate-adjusted models. Neighborhood
walkability was not associated with baseline gait speed after controlling for age,
education, complex comorbidity, incident fractures, and neighborhood socioeconomic
status.
Specific aim 2: Describe the relationship between baseline neighborhood
walkability and change in lower-extremity function among older women.
In the unadjusted model, there was a significant negative association between the
intercept of neighborhood walkability and the slope of gait speed (b=-.007, p=.003),
indicating that living in a more walkable neighborhood at baseline was associated with a
steeper rate of decline in gait speed over time. This association was in the opposite
direction from that hypothesized. However, this association was not significant in the
121
covariate-adjusted model. Therefore, after controlling for age, education, complex
comorbidity, incident fractures, and neighborhood socioeconomic status, baseline
neighborhood walkability was not associated with the rate of decline in gait speed among
study participants.
Specific aim 3: Describe the relationship between change in neighborhood
walkability and change in lower-extremity function among older women.
In the unadjusted model, the slope of neighborhood walkability was positively associated
with the slope of gait speed (b=.018, p=.024). This association remained significant in the
covariate-adjusted model (b=.024, p=.020). Therefore, after controlling for age,
education, complex comorbidity, incident fractures, and neighborhood socioeconomic
status, participants residing in a neighborhood that became more walkable over time had
a reduced rate of decline in gait speed. A one decile increase in walkability over the study
period was associated with a .024 m/sec reduction in the overall rate of decline over the
study period.
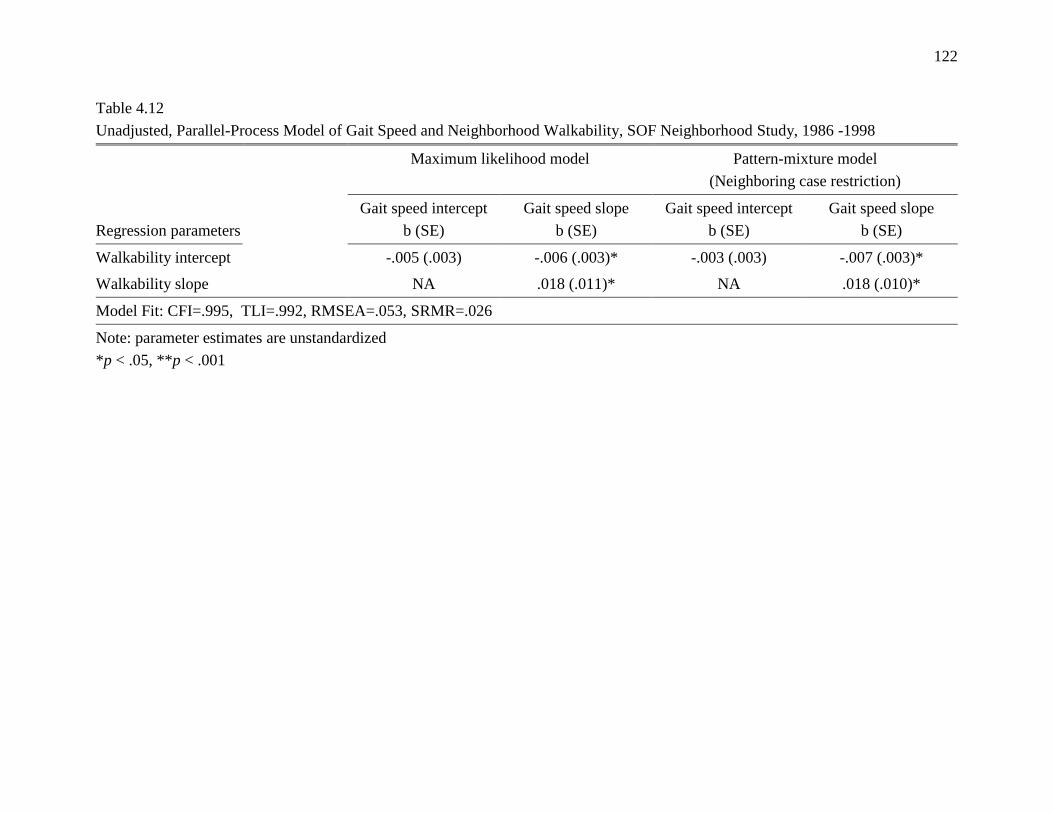
122
Table 4.12
Unadjusted, Parallel-Process Model of Gait Speed and Neighborhood Walkability, SOF Neighborhood Study, 1986 -1998
Maximum likelihood model Pattern-mixture model
(Neighboring case restriction)
Regression parameters
Gait speed intercept
b (SE)
Gait speed slope
b (SE)
Gait speed intercept
b (SE)
Gait speed slope
b (SE)
Walkability intercept -.005 (.003) -.006 (.003)* -.003 (.003) -.007 (.003)*
Walkability slope NA .018 (.011)* NA .018 (.010)*
Model Fit: CFI=.995, TLI=.992, RMSEA=.053, SRMR=.026
Note: parameter estimates are unstandardized
*p < .05, **p < .001
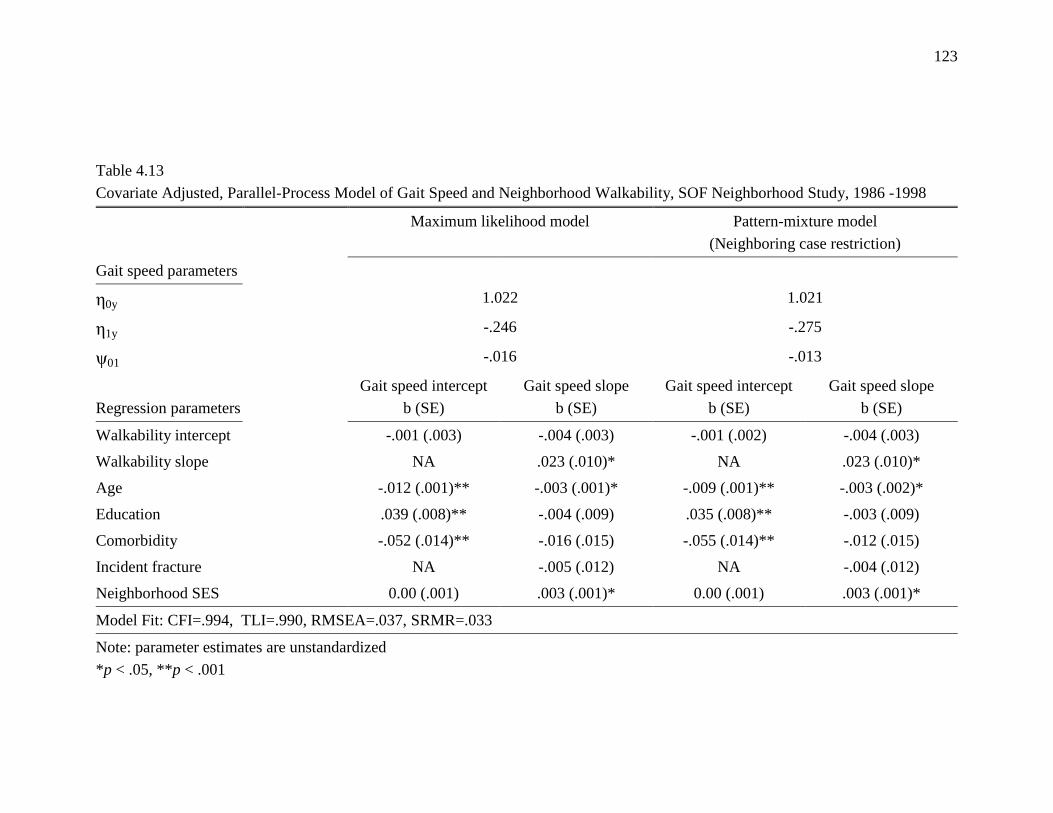
123
Table 4.13
Covariate Adjusted, Parallel-Process Model of Gait Speed and Neighborhood Walkability, SOF Neighborhood Study, 1986 -1998
Maximum likelihood model Pattern-mixture model
(Neighboring case restriction)
Gait speed parameters
0y 1.022 1.021
1y -.246 -.275
ψ01 -.016 -.013
Regression parameters
Gait speed intercept
b (SE)
Gait speed slope
b (SE)
Gait speed intercept
b (SE)
Gait speed slope
b (SE)
Walkability intercept -.001 (.003) -.004 (.003) -.001 (.002) -.004 (.003)
Walkability slope NA .023 (.010)* NA .023 (.010)*
Age -.012 (.001)** -.003 (.001)* -.009 (.001)** -.003 (.002)*
Education .039 (.008)** -.004 (.009) .035 (.008)** -.003 (.009)
Comorbidity -.052 (.014)** -.016 (.015) -.055 (.014)** -.012 (.015)
Incident fracture NA -.005 (.012) NA -.004 (.012)
Neighborhood SES 0.00 (.001) .003 (.001)* 0.00 (.001) .003 (.001)*
Model Fit: CFI=.994, TLI=.990, RMSEA=.037, SRMR=.033
Note: parameter estimates are unstandardized
*p < .05, **p < .001
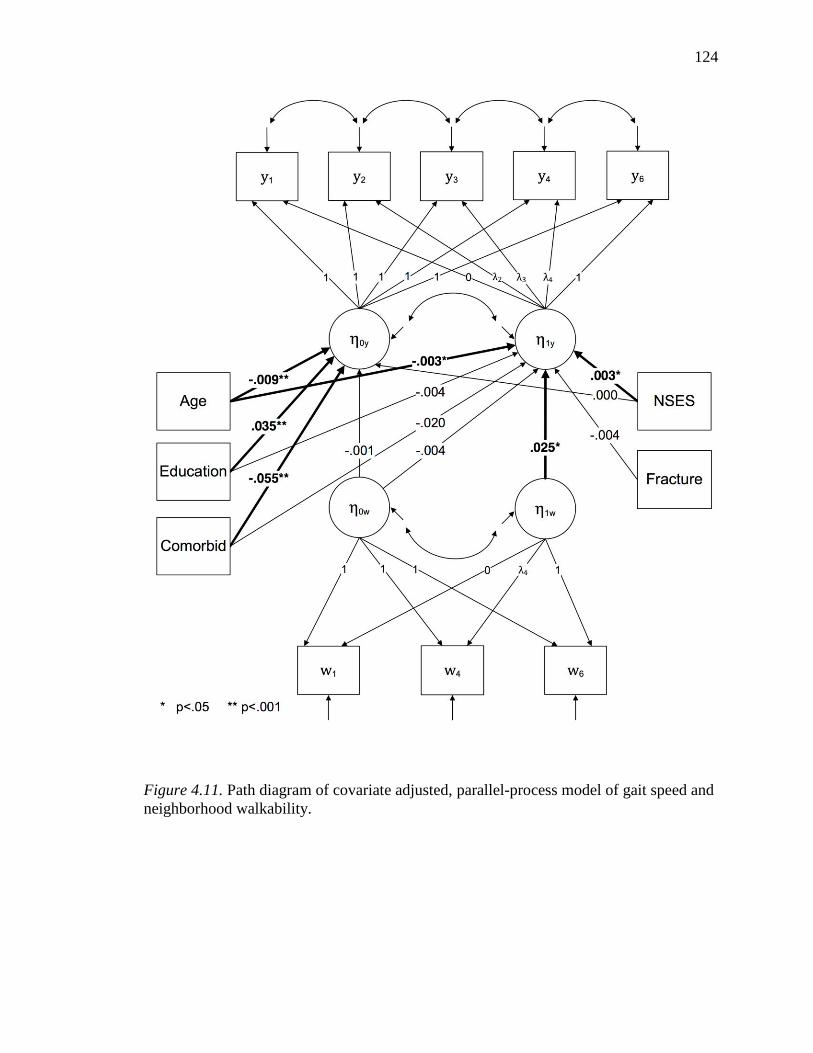
124
Figure 4.11. Path diagram of covariate adjusted, parallel-process model of gait speed and
neighborhood walkability.
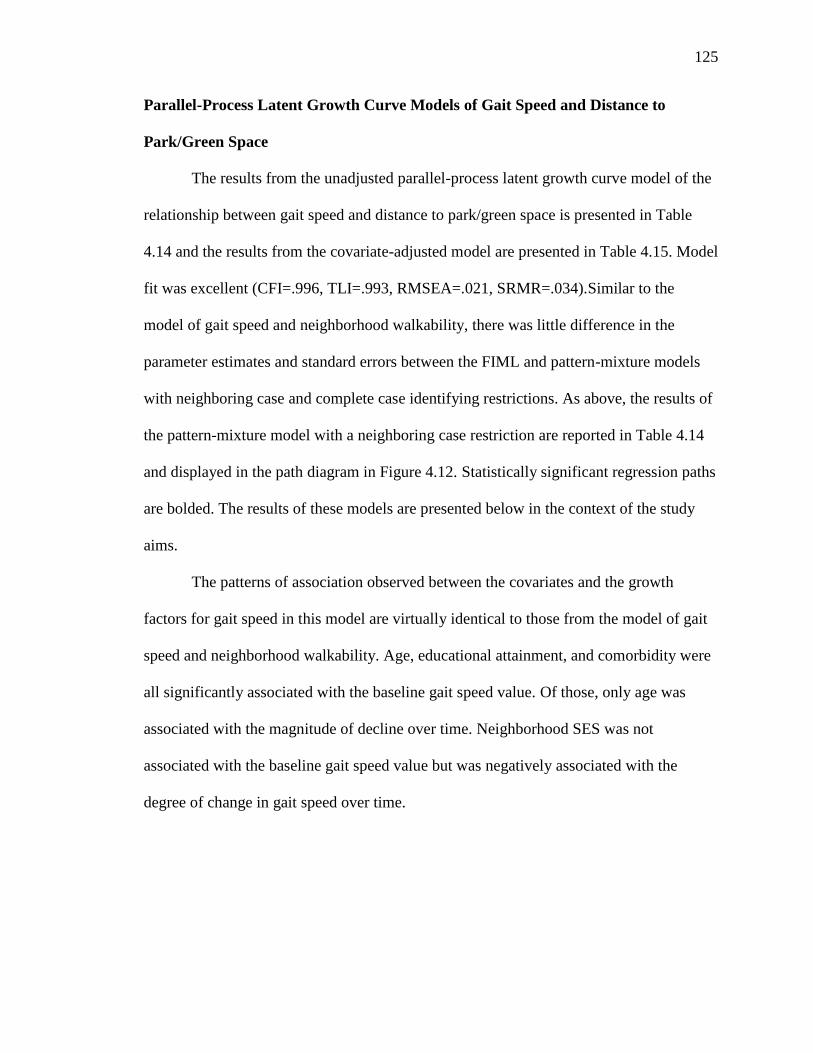
125
Parallel-Process Latent Growth Curve Models of Gait Speed and Distance to
Park/Green Space
The results from the unadjusted parallel-process latent growth curve model of the
relationship between gait speed and distance to park/green space is presented in Table
4.14 and the results from the covariate-adjusted model are presented in Table 4.15. Model
fit was excellent (CFI=.996, TLI=.993, RMSEA=.021, SRMR=.034).Similar to the
model of gait speed and neighborhood walkability, there was little difference in the
parameter estimates and standard errors between the FIML and pattern-mixture models
with neighboring case and complete case identifying restrictions. As above, the results of
the pattern-mixture model with a neighboring case restriction are reported in Table 4.14
and displayed in the path diagram in Figure 4.12. Statistically significant regression paths
are bolded. The results of these models are presented below in the context of the study
aims.
The patterns of association observed between the covariates and the growth
factors for gait speed in this model are virtually identical to those from the model of gait
speed and neighborhood walkability. Age, educational attainment, and comorbidity were
all significantly associated with the baseline gait speed value. Of those, only age was
associated with the magnitude of decline over time. Neighborhood SES was not
associated with the baseline gait speed value but was negatively associated with the
degree of change in gait speed over time.
126
Specific aim 4: Describe the relationship between baseline distance to
neighborhood parks/green spaces and baseline lower-extremity function among
older women. There was no association between the intercept of gait speed and the
intercept of distance to park/green space in either the unadjusted or covariate-adjusted
models. After controlling for age, education, complex comorbidity, incident fractures,
and neighborhood socioeconomic status, distance to park/green space was not associated
with differences in baseline gait speed among the study participants.
Specific aim 5: Describe the relationship between baseline distance to
neighborhood parks/green spaces and change in lower-extremity function among
older women. There was no association between the intercept of gait speed and the slope
of distance to park/green space in either the unadjusted or covariate-adjusted models.
After controlling for age, education, complex comorbidity, incident fractures, and
neighborhood socioeconomic status, distance to park/green space was not associated with
the rate of gait speed decline during the study period.
Specific aim 6: Describe the relationship between change in the distance to
neighborhood parks/green spaces and change in lower-extremity function among
older women. There was no association between the slope of gait speed and the slope of
distance to park/green space in either the unadjusted or covariate-adjusted models. After
controlling for age, education, complex comorbidity, incident fractures, and
neighborhood socioeconomic status, change in the distance the park/green space was not
associated with the rate of gait speed decline during the study period.
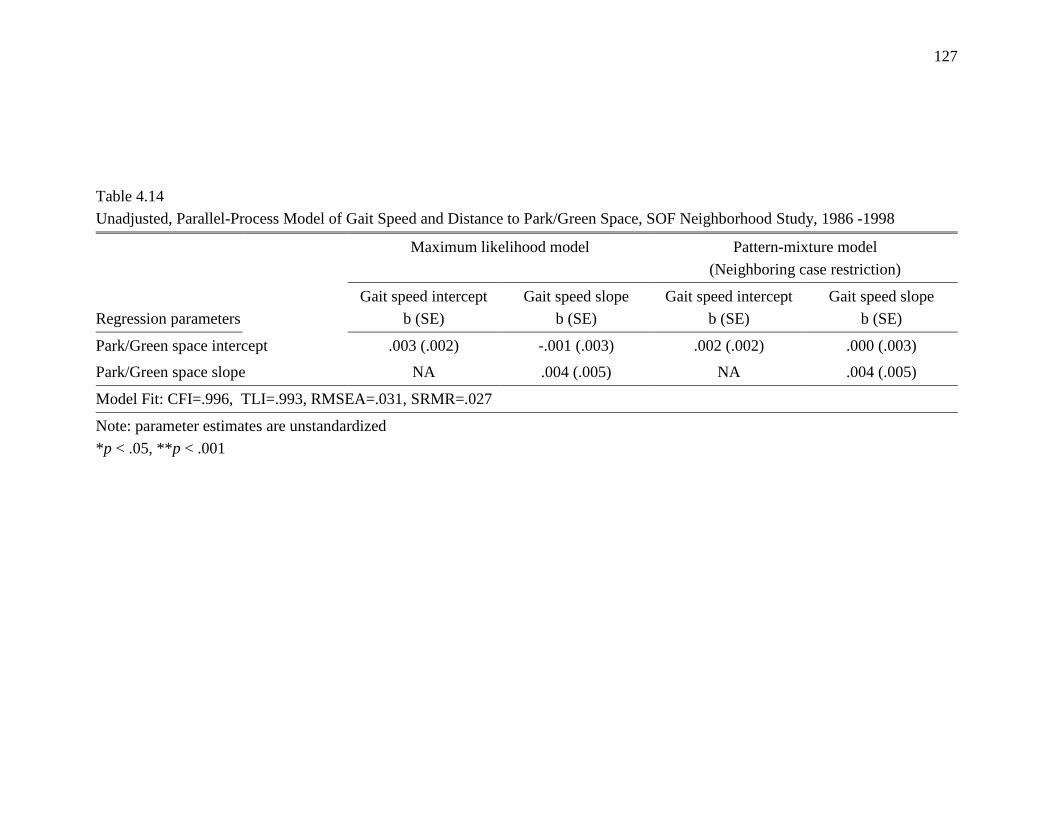
127
Table 4.14
Unadjusted, Parallel-Process Model of Gait Speed and Distance to Park/Green Space, SOF Neighborhood Study, 1986 -1998
Maximum likelihood model Pattern-mixture model
(Neighboring case restriction)
Regression parameters
Gait speed intercept
b (SE)
Gait speed slope
b (SE)
Gait speed intercept
b (SE)
Gait speed slope
b (SE)
Park/Green space intercept .003 (.002) -.001 (.003) .002 (.002) .000 (.003)
Park/Green space slope NA .004 (.005) NA .004 (.005)
Model Fit: CFI=.996, TLI=.993, RMSEA=.031, SRMR=.027
Note: parameter estimates are unstandardized
*p < .05, **p < .001
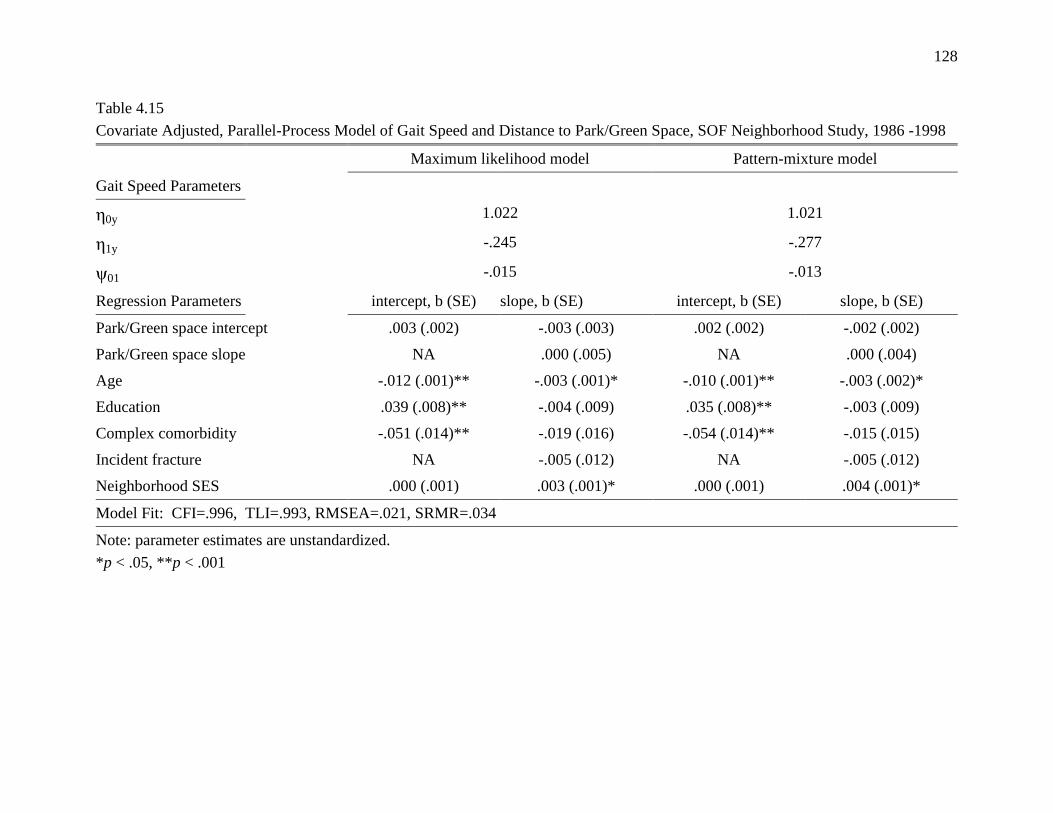
128
Table 4.15
Covariate Adjusted, Parallel-Process Model of Gait Speed and Distance to Park/Green Space, SOF Neighborhood Study, 1986 -1998
Maximum likelihood model Pattern-mixture model
Gait Speed Parameters
0y 1.022 1.021
1y -.245 -.277
ψ01 -.015 -.013
Regression Parameters intercept, b (SE) slope, b (SE) intercept, b (SE) slope, b (SE)
Park/Green space intercept .003 (.002) -.003 (.003) .002 (.002) -.002 (.002)
Park/Green space slope NA .000 (.005) NA .000 (.004)
Age -.012 (.001)** -.003 (.001)* -.010 (.001)** -.003 (.002)*
Education .039 (.008)** -.004 (.009) .035 (.008)** -.003 (.009)
Complex comorbidity -.051 (.014)** -.019 (.016) -.054 (.014)** -.015 (.015)
Incident fracture NA -.005 (.012) NA -.005 (.012)
Neighborhood SES .000 (.001) .003 (.001)* .000 (.001) .004 (.001)*
Model Fit: CFI=.996, TLI=.993, RMSEA=.021, SRMR=.034
Note: parameter estimates are unstandardized.
*p < .05, **p < .001
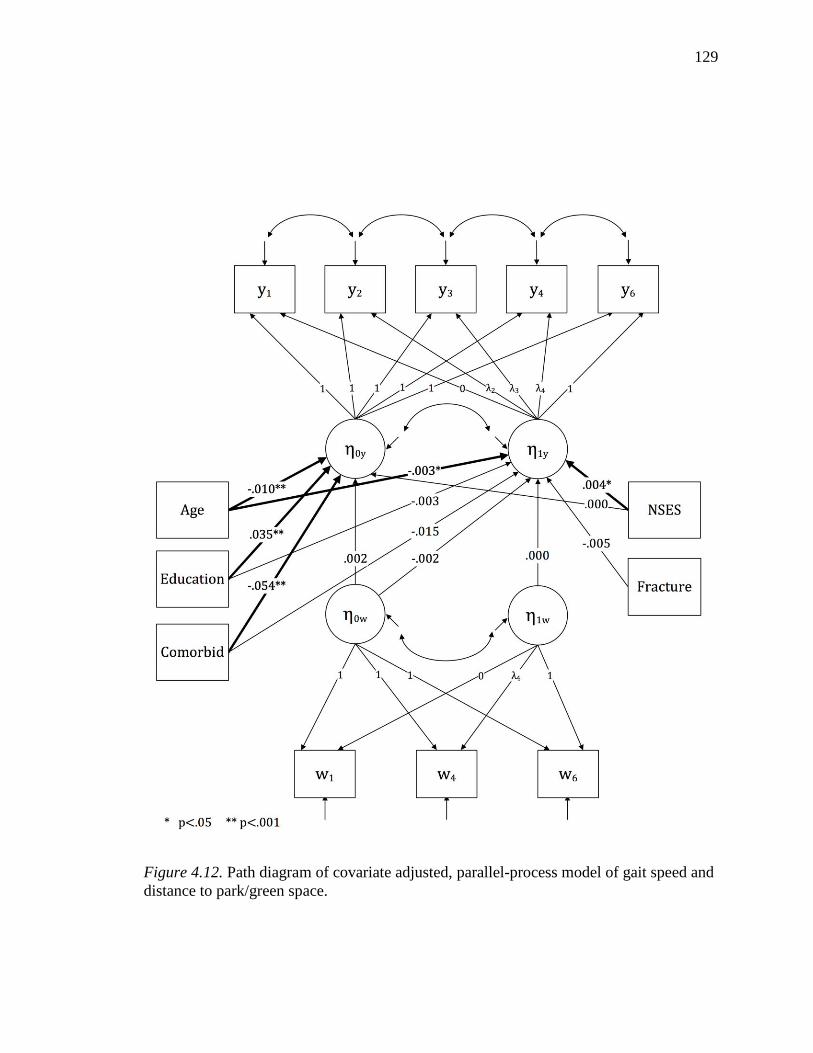
129
Figure 4.12. Path diagram of covariate adjusted, parallel-process model of gait speed and
distance to park/green space.
130
Chapter 5—Discussion
This study examined the association of neighborhood built environment lower-
extremity function among older women in Portland, Oregon over a 12-year period. A
parallel-process modeling approach was employed to describe the relationships between
the trajectory of neighborhood walkability and the trajectory of gait speed, and the
trajectory of neighborhood distance to parks or green spaces and the trajectory of gait
speed. The hypothesis underlying the study was that characteristics of the neighborhood
built environment demonstrated in previous studies to be associated with physical activity
among older adults would have a measurable effect on lower-extremity function, given
the well-established relationship between engagement in physical activity and risk of
lower-extremity functional decline.
Trajectory of Gait Speed
Few studies have examined long-term trajectories of gait speed decline among
older adults. In the Cardiovascular Health Study All Stars Study, gait speed decreased
between 0.2 and 0.3 m/sec over a 13 year period (Newman et al., 2009). A similar rate of
gait speed decline (b=-234, p<.001) was observed in this study. In this study, older
women had both slower gait speeds at baseline (b=-.009, p<.001) and an accelerated rate
of decline (p=-.003, p<.001). Educational attainment was found to be predictive of
baseline gait speed (b=.035, p<.001). Women with higher levels of educational
attainment had a faster gait speed at baseline after adjustment for age, comorbidity, and
neighborhood built environment. However, educational attainment was not associated
with the trajectory of gait speed decline over time. The presence of two or more comorbid
conditions was associated with a slower gait speed at baseline (b=-.055, p<.001), but not
131
with the rate of gait speed decline over time. These findings are congruent with previous
studies which have examined the individual-level determinants of functional decline
(Chaudhry et al., 2010; Inzitari et al., 2006; Murray et al., 2011; Nusselder et al., 2005).
This study was the first to employ a pattern-mixture modeling approach to stratify
gait speed trajectory by time of attrition. This approach revealed that participants who
dropped out of the study had lower baseline gait speed and steeper trajectories of decline
than those participants who completed the study. This observation is best explained by
the established association between gait speed and future morbidity and mortality,
particularly in light of the high proportion of mortality related attrition from the study.
Although the covariate-adjusted models with FIML estimation do appear to have been
robust to the attrition related missingess in this study, the observation of attrition-related
differences in gait speed serves as a cautionary example of the need to closely examine
missing data mechanisms in longitudinal studies.
Change in Neighborhood Built Environment
The univariate, latent growth model of neighborhood walkability revealed that,
although there was a statistically significant increase in walkability over time, the
magnitude of that change was empirically fairly small. Over a 10-year period, the average
increase in walkability score was .229 (p<.001). This indicates that most participants
were in the same decile of walkability at the end of the study that they were in at
baseline. Given the emphasis in Portland on pedestrian-friendly urban planning during
this time period, this was a somewhat surprising finding, although the observation that
the greatest change occurred in areas with low walkability suggests that urban planning
efforts to improve walkability targeted less walkable neighborhoods. Nevertheless, there
132
was only a modest level of improvement in the lowest quartile of neighborhood
walkability (mean=3.2, SD=.070). One possible explanation is that the neighborhood
measures available for this study did not adequately capture the pedestrian-friendly
improvements in the built environment that were made during the study period. In
contrast to the modest degree of change observed in neighborhood walkability, there was
both substantial overall change and between-neighborhood variability in the measure of
distance to park/green space. The degree to which this reflected true change in the
distribution of parks and green spaces in the Portland area during the study period, or
whether it was related to measurement error is unclear, though as previously mentioned
the data were checked for accuracy by the analysts in the mapping department at Metro.
Baseline Neighborhood Walkability and Trajectory of Gait Speed
This study did not find a significant association between baseline neighborhood
walkability and baseline gait speed. There was a significant association between baseline
neighborhood walkability and change in gait speed over time, though this association was
in the opposite direction from that hypothesized. However, this association was not
significant in the model adjusted for age, educational attainment, complex comorbidity,
incident fracture, and neighborhood SES. These findings differ somewhat from those of
previous studies which reported select neighborhood characteristics to be significantly
associated with functional limitation and disability risk among older adults, although
there are also notable similarities with previous studies as well. For example, Beard et al.
(2009) reported that a census-tract measure of ―street characteristics‖, consisting of
intersection density, density of street trees, and bus stop distance, was associated with
disability prevalence, although a composite measure of land-use mix was not. In findings
133
similar to this study, Freedman et al. (2008) found that a census-tract level measure of
street connectivity was not associated with risk of functional limitation among women
aged 55 years and older. Previous studies also found no association between functional
decline and self-reported access to public transport (Balfour et al., 2002), or between
ADL disability and nearness of likely walking destinations (Bowling et al., 2007). As
noted in Chapter Two, differences in study design and the measurement of neighborhood
characteristics and outcome measures limits the degree to which the findings of this study
can be compared to results from previous studies, particularly those which examined
micro-scale design features such as sidewalk condition or variables such as adequate
street lighting, perceived crime, and noise. Given the substantial differences in
measurement of neighborhood characteristics between previous studies and this one, the
findings of this study may be attributable to its relatively narrow focus on objectively
measured neighborhood built environment or to differences in the scale of the measures
employed in this study relative to previous studies. Of the prior studies examining the
relationship between neighborhood built environment and functional decline, the most
similar in design and measurement to this study was that of Michael et al. (2011).
Notably, that study also found no association between baseline gait speed or change in
gait speed and baseline measures of street connectivity. They did find that lower
connectivity was associated with steeper decline lower extremity function as measured by
chair stand time, though connectivity was not associated with baseline differences in
lower-extremity function.
The lack of a significant relationship between baseline neighborhood environment
and the trajectory of gait speed observed in this study should first be examined in the
134
context of the inconsistent findings regarding the association of the built environment to
physical activity. The potential association between neighborhood built environment and
lower-extremity function tested in this study was hypothesized to be mediated by
physical activity. However, while the general consensus is that the built environment is
related to physical activity, there is no clear consensus on precisely which characteristics
of the built environment are most influential for older adults (Rosso et al., 2011; Van
Cauwenberg et al., 2011; Wendel-Vos, Droomers, Kremers, Brug, & van Lenthe, 2007).
Furthermore, evidence from a number of studies suggests that there are significant
gender, race, and socioeconomic differences in the influence of specific neighborhood
characteristics on physical activity (Casagrande, Whitt-Glover, Lancaster, Odoms-
Young, & Gary, 2009; Hooker, Wilson, Griffin, & Ainsworth, 2005; Michael et al., 2010;
Zenk et al., 2009). Thus, given the relative homogeneity of the sample in this study, it is
possible that there was a mismatch between the neighborhood characteristics which
influence physical activity among this population and those that were measured in the
study
Another possibility is that the underlying hypothesized mechanism was present,
but the effect of the built environment on physical activity was not sufficient to result in
downstream functional benefit. Recently, a similar pattern of findings has been emerging
in regards to the association of the built environment to body mass index, where a
growing number of studies have failed to find consistent significant associations between
the walkability of the built environment and body mass index (BMI). A recent systematic
review of the literature by Feng, Glass, Curriero, Stewart, and Schwartz (2010) found that
over half of the studies examining the relationship between GIS measures of the built
135
environment and BMI reported a non-significant association. Interestingly, some studies
that have simultaneously examined levels of physical activity and BMI have reported that
characteristics of the built environment were significantly associated with walking but
not associated with BMI. For example, Berke et al. (2007) in a cross-sectional study of
986 older adults, found that a GIS-based composite walkability measure was significantly
associated with more blocks walked for exercise, but that it was not associated with
participant‘s BMI.
This lack of consistent findings regarding the effects of the built environment on
physical activity related health and functional outcomes may result from the small effect
sizes generally observed in the studies of neighborhood influences on physical activity.
This raises an important question, one that is directly relevant to this study of
neighborhood built environment and function. If neighborhood built environment is a
determinant of physical activity, is the effect large enough to produce measurable and,
more importantly, clinically meaningful changes in health and function? In regards to
lower-extremity function, this study suggests that it is not, particularly given that there
was no observed effect of baseline neighborhood environment on change in gait speed
over time. The effect of baseline neighborhood walkability on baseline gait speed is
analogous to a cross-sectional analysis, and small differences in function may not be
apparent at a single point in time. However, the cumulative impact of even small effects
should be more apparent in a longitudinal analysis, so the absence of an observable effect
on the trajectory of functional decline over a ten-year period is compelling.
In regards to neighborhood SES, this study did not find baseline neighborhood
SES to be significantly associated with baseline gait speed. There was, however, a
136
significant relationship between baseline neighborhood SES and the trajectory of gait
speed decline. Women who lived in a neighborhood with higher baseline SES had a
reduced rate of decline in gait speed over time, after controlling for age, educational
attainment, comorbidity, and neighborhood walkability. While the parameter estimate of
this change was fairly small (B=.003), the estimated difference between women living in
the top and bottom deciles of neighborhood SES is .09, which is a clinically meaningful
difference (Kwon et al., 2009). The pattern of association observed between
neighborhood SES and gait speed observed in this study may be an example of a small
effect not appearing significant on cross-sectional analysis but having a significant effect
over time.
Trajectory of Gait Speed and Change in Neighborhood Walkability
In contrast to the null findings for the relationship between baseline neighborhood
walkability and the trajectory of gait speed, this study did find a significant relationship
between the slope of neighborhood walkability and the slope of gait speed (B=.024, p=
.025). The parameter estimate indicates that women who lived in a neighborhood where
walkability improved over time had a reduced rate of gait speed decline. After adjusting
for age, educational attainment, comorbidity, neighborhood SES, and incident fracture, a
one decile increase in neighborhood walkability during the study period was associated
with a .024 reduction in the decline of gait speed over 12-years. A .05 m/sec change in
gait speed is regarded as clinically meaningful (Perera et al., 2006), indicating that a two
decile increase in neighborhood walkability over the study period was associated with a
clinically meaningful reduction in the magnitude of decline by year 10.
137
That change in gait speed over time was associated with change in neighborhood
walkability over time but not with baseline level of walkability is puzzling, though it is a
finding that can be understood in the context of the theory of environmental press. As
discussed in Chapter 2, the relationship between personal competence and environmental
press is generally held in equilibrium. In other words, individuals achieve a level of
adaptation to their environment. With advancing age and reduced personal competence,
this equilibrium grows increasingly unstable, resulting in impaired function if
environmental pressures remain constant (Lawton, 1985). However, the presence of
environmental buoys can, in Glass‘s addition to Lawton‘s theory, buffer the effects of
declining competence and reduce the sequelae of functional impairment (Glass &
Balfour, 2003). From this perspective, the value of neighborhood walkability was not in
its theoretical influence on activity behavior but as a measure of the general accessibility
of neighborhood resources. With declining competence and the resulting restriction in
life-space, those women whose environments provided greater access to local resources
may have been able to maintain a higher level of function, as reflected in a slower decline
in gait speed (Xue, Fried, Glass, Laffan, & Chaves, 2008). Simply put, some women
lived in neighborhoods that grew more accessible as they grew less competent; their
neighborhoods changed to meet them at their level of competence. Because of this
buffering effect, these women experienced a slower rate of functional decline. This
potential effect could be distinct from the hypothesized effect of physical activity
mediating the relationship between neighborhood walkability and trajectory of gait speed,
which would explain the observed pattern of associations. Several recent cohort studies,
for example, have found that gait speed and life-space diameter are significantly
138
correlated among older adults, and that life-space constriction is associated with
increased risk of cognitive impairment (Crowe et al., 2008; James, Boyle, Buchman,
Barnes, and Bennett, 2011) and mortality (Boyle, Buchman, Barnes, James, & Bennett,
2010) after controlling for physical activity level. The findings of this study are also
congruent with those of Clarke and George (2005), who reported that built environment
was not associated with the risk of disability among older adults without functional
limitation, but did serve to moderate, or buffer, the relationship between lower-extremity
functional decline and disability among older adults with existing functional impairment.
Trajectory of Gait Speed and Distance to Park/Green Space
No previous study has examined the relationship of distance to parks/green spaces
and trajectory of lower-extremity function. This study found no significant associations
between neighborhood distance to parks/green space and trajectory of gait speed. Neither
the degree of distance to park/green space at baseline or change in access over time was
related to gait speed in models adjusted for age, educational attainment, comorbidity,
incident fracture, and neighborhood SES. In light of the pattern of associations observed
between neighborhood walkability and gait speed, this is not surprising. These findings
indicate that either there was no relationship between neighborhood distance to
park/green space and physical activity, or that this effect was so small that it did not have
measurable downstream effects on functional ability. In regards to the significant
association observed between change in neighborhood walkability and change in gait
speed over time, it is likely that increasing distance to park/green space would not serve
to mitigate the effects of declining competence in the same fashion.
139
Limitations
There were several limitations of this study that warrant discussion. In regards to
the neighborhood-level data, differences in the data sources used to construct the
historical neighborhood measures at each time point introduced a potential source of
measurement error. Of particular concern was the variability observed in the measure of
distance to the nearest park or green space, if it resulted from changes in the manner in
which park/green space were defined in the RLIS at each time point rather than actual
change in neighborhood distance to park/green space. However, because the definition of
park/green space at any given time point would have been the same across the study area,
any potential misclassification would likely have been non-differential and not resulted in
bias. Further, the data were subject to a quality control procedure at Portland METRO to
ensure that any error was detected and erroneous measurements corrected. The
measurement of the distance-based built environment variables was conducted by
calculating the Euclidian distance, which has been shown to underestimate the actual
distance traveled across the street network (Oliver et al., 2007). A preferable approach is
to calculate the network distance, as discussed in Chapter 3. However, this is a labor-
intensive, computationally demanding procedure and was not feasible for this study given
the large sample size and measurements at multiple time points. Another important
limitation is that the built environment variables employed in the current study were
fairly macro-level urban design characteristics. Previous studies have found that
characteristics such as perceived safety, sidewalk condition, and the presence of adequate
street lighting are associated with increased risk of functional impairment (Balfour et al.,
2002; Clark et al, 2009; Clarke & George, 2005; Schootman et al., 2006) and it is
140
plausible that these features of the neighborhood built environment are more important
determinants of lower-extremity function than those measured in this study. Lastly,
Portland has a long history of progressive urban planning, which resulted in less variation
in many of the measures than one would expect to see in other urban areas. As a result,
this study was unable to describe the changes in gait speed that may occur across a wider
range of neighborhood exposures, and this may help explain the lack of association
between baseline neighborhood characteristics and trajectory of gait speed.
There were several limitations related to participant data as well. The most
significant limitation was the exclusion of women who moved during the study period, a
decision which was made to address both theoretical and methodological concerns with
retaining them in the sample. Theoretically, the decision to exclude them was in order to
have a neighborhood exposure measure that reflected the changes that were naturally
occurring in participants‘ neighborhoods during this period of pedestrian-friendly
development in Portland. Excluding those women who moved resulted in trajectories of
neighborhood change that were, excluding potential measurement error, accurate
representations of the changes in neighborhood walkability and distance to park/green
space that occurred in participants neighborhoods. Methodologically, the trajectories of
neighborhood change for participants who moved would potentially exhibit a degree of
non-linearity that would make the parallel-process models inestimable. However, the
exclusion of women who moved introduced the possibility of selection bias, which was
assessed for by comparing the gait speed, neighborhood built environment, health and
demographic characteristics of non-movers and movers. As noted in Chapter Four,
women who moved were in significantly poorer heath and had slower baseline gait speed
141
than women who did not move, although empirically these differences were small.
However, there was no significant difference in either neighborhood walkability or
distance to parks/green spaces between movers and non-movers, indicating that the
exclusion of women who moved did not result in differential bias (Szklo & Nieto, 2007).
Another limitation was that the sample was racially and ethnically homogenous, limiting
the degree to which these findings can be generalized to more diverse populations.
Similarly, given that Freedman et al. (2008) observed the effects of neighborhood built
environment to differ among older men and older women, the findings from this study
should not be generalized to older men. The lack of control for the length of time the
participants lived in their residents prior to the study period was a limitation because the
duration of their exposure to the neighborhood characteristics measured during the study
is unclear. This would have the greatest impact on the measurement of the relationship
between baseline neighborhood characteristics and baseline gait speed, though the
potential direction or magnitude of any potential bias resulting from prior unmeasured
neighborhood exposure is difficult to ascertain. Lastly, there were no data available on
participants‘ income, which, as previously noted, is an important determinant of
functional decline among older adults. Findings from previous studies suggest that low
income is positively correlated with measures of neighborhood walkability. Given the
hypothesized inverse relationship between neighborhood walkability and functional
decline, a direct association of low income with both living in a more walkable
neighborhood and greater functional decline among participants would result in negative
confounding, leading to an underestimation of the true strength of the effect of built
environment on gait speed (Szklo & Nieto). However, the statistical models were
142
adjusted for educational attainment and neighborhood socioeconomic status, which likely
reduced the degree of residual confounding related to differences in individual income.
Overall, while substantial efforts were taken to minimize potential bias and ensure
validity, the results of this study should nevertheless be interpreted cautiously in light of
the methodological limitations discussed above.
Strengths
This study had several notable strengths. First, it is the first study to examine
concurrent change in the neighborhood built environment and change in function among
older adults. It utilized a novel approach to modeling the relationships between these two
processes by merging historical neighborhood data with individual-level data from a
large cohort study. It employed GIS-based, objective measures of the built environment
centered on each participant‘s residence, rather than aggregate census-level data or other
proxy measures of the built environment. Further, it employed a reliable, performance-
based measure of lower-extremity function. The twelve-year study period was of a
sufficient duration to measure the proposed relationships, and the sample size was
adequate for the analysis. Lastly, the use of a parallel-process growth curve modeling
approach was appropriate for the aims of the study and the adjustment for MNAR
attrition adjusted for a potential source of significant bias.
Summary and Implications
This study examined the relationship between characteristics of the neighborhood
built environment and the trajectory of lower-extremity function among older women in
Portland, Oregon. It was notable in being the first study to describe the relationship
between change in neighborhood built environment and change in lower-extremity
143
function, and thus took a step toward addressing the question of whether community
efforts to promote pedestrian-friendly environments for older adults will result in
downstream health benefit. This study found that neither baseline gait speed nor change
in gait speed over time were associated with baseline neighborhood built environment.
However, this study did find that change in neighborhood walkability over time was
associated with the degree of change in gait speed over time. Women who lived in
neighborhoods that became more walkable over the 12 year study period (i.e. increased
access to public transit, more diverse land-use mix, and greater street connectivity) had a
reduced rate of gait speed decline. This is an intriguing finding, for it suggests that these
improvements in neighborhood design may have buffered the effects of declining
competence, facilitating continued engagement in usual activities and, as a result, slowing
the progression of functional decline. However, these findings must be regarded
cautiously, given both the methodological limitations discussed above and the dearth of
previous research in this area. Future research must address several key areas raised by
this study. First, no study has examined whether change in neighborhood built
environment results in increased physical activity among older adults. Answering this
question is an important step in understanding the relationship of neighborhood built
environment to health and functional outcomes. Second, it is unclear whether the
relationship between neighborhood built environment and physical activity, observed in
previous cross-sectional studies, is of sufficient magnitude to result in significant effects
on health. The relationship between neighborhood built environment, physical activity,
and downstream health effects among older adults should be addressed by future
longitudinal studies, which must examine this question among diverse populations while
144
adjusting for confounders identified in previous studies. Third, there is a strong
theoretical basis for hypothesizing a relationship between micro-scale features of the
neighborhood built environment and functional health among older adults. A promising
approach for future studies would be to design natural experiments in order to observe the
health and functional benefit resulting from improvement of neighborhood micro-scale
built environment features. Lastly, future studies should explore the relationship of
neighborhood built environment to life-space constriction among older adults, and how
this may impact the development of disability independent of previously hypothesized
mechanisms related to physical activity promotion.
145
References
Abellan van Kan, G., Rolland, Y., Andrieu, S., Bauer, J., Beauchet, O., Bonnefoy, M., . .
. Vellas, B. (2009). Gait speed at usual pace as a predictor of adverse outcomes in
community-dwelling older people an International Academy on Nutrition and
Aging (IANA) Task Force. The Journal of Nutrition, Health, and Aging, 13(10),
881-889.
Agrawal, A. W., Schlossberg, M., & Irvin, K. (2008). How far, by which route and why?
A spatial analysis of pedestrian preference. Journal of Urban Design, 13(1), 81-
98.
Alfonzo, M. A. (2005). To walk or not to walk? The hierarchy of walking needs.
Environment & Behavior, 37(6), 808-836.
American College of Sports Medicine, Chodzko-Zajko, W. J., Proctor, D. N., Fiatarone
Singh, M. A., Minson, C. T., Nigg, C. R., . . . Skinner, J. S. (2009). American
College of Sports Medicine position stand. Exercise and physical activity for
older adults. Medicine & Science in Sports & Exercise, 41(7), 1510-1530.
Balfour, J. L., & Kaplan, G. A. (2002). Neighborhood environment and loss of physical
function in older adults: evidence from the Alameda County Study. American
Journal of Epidemiology, 155(6), 507-515.
Ball, K., Jeffery, R. W., Crawford, D. A., Roberts, R. J., Salmon, J., & Timperio, A. F.
(2008). Mismatch between perceived and objective measures of physical activity
environments. Preventive Medicine, 47(3), 294-298.
Baraldi, A. N., & Enders, C. K. (2010). An introduction to modern missing data analyses.
Journal of School Psychology, 48(1), 5-37.
146
Beard, J. R., Blaney, S., Cerda, M., Frye, V., Lovasi, G. S., Ompad, D., . . . Vlahov, D.
(2009). Neighborhood characteristics and disability in older adults. The Journals
of Gerontology, Series B: Psychoogical Sciences and Social Sciences, 64(2), 252-
257.
Beckett, L. A., Brock, D. B., Lemke, J. H., Mendes de Leon, C. F., Guralnik, J. M.,
Fillenbaum, G. G., . . . Evans, D. A. (1996). Analysis of change in self-reported
physical function among older persons in four population studies. American
Journal of Epidemiology, 143(8), 766-778.
Berke, E. M., Koepsell, T. D., Moudon, A. V., Hoskins, R. E., & Larson, E. B. (2007).
Association of the built environment with physical activity and obesity in older
persons. American Journal of Public Health, 97(3), 486-49.
Berkman, L. F., Seeman, T. E., Albert, M., Blazer, D., Kahn, R., Mohs, R., . . . et al.
(1993). High, usual and impaired functioning in community-dwelling older men
and women: findings from the MacArthur Foundation Research Network on
Successful Aging. Journal of Clinical Epidemiology, 46(10), 1129-1140.
Beswick, A. D., Rees, K., Dieppe, P., Ayis, S., Gooberman-Hill, R., Horwood, J., &
Ebrahim, S. (2008). Complex interventions to improve physical function and
maintain independent living in elderly people: a systematic review and meta-
analysis. The Lancet, 371(9614), 725-735.
Boehmer, T. K., Hoehner, C. M., Wyrwich, K. W., Brennan Ramirez, L. K., &
Brownson, R. C. (2006). Correspondence between perceived and observed
measures of neighborhood environmental supports for physical activity. Journal
of Physical Activity and Health, 3(1), 22-36.
147
Bohannon, R. W. (2009). Measurement of gait speed of older adults is feasible and
informative in a home-care setting. Journal of Geriatric Physical Therapy, 32(1),
22-23.
Bontempo, D. E., Frederick, M. E., & Hofer, S. M. (2012). Measurement Issues in the
Analysis of Within-Person Change. In J. T. Newsom, R. N. Jones & S. M. Hofer
(Eds.), Longitudinal Data Analysis: A Practical Guide for Researchers in the
Aging, Health, and Social Sciences (pp. 97-142). New York, NY: Routledge.
Borst, H. C, de Vries, S. I., Graham, J. M. A., van Dongen, J. E. F., Bakker, I., &
Miedema, H.M.E. (2009). Influence of environmental street characteristics on
walking route choice of elderly people. Journal of Environmental Psychology, 29,
477–484.
Bowling, A., Stafford, M., Bowling, A., & Stafford, M. (2007). How do objective and
subjective assessments of neighbourhood influence social and physical
functioning in older age? Findings from a British survey of ageing. Social Science
& Medicine, 64(12), 2533-2549.
Boyle, P. A., Buchman, A. S., Barnes, L. L., James, B. D., & Bennett, D. A. (2010).
Association between life space and risk of mortality in advanced age. Journal of
the American Geriatrics Society, 58(10), 1925-1930.
Brach, J. S., FitzGerald, S., Newman, A. B., Kelsey, S., Kuller, L., VanSwearingen, J.
M., & Kriska, A. M. (2003). Physical activity and functional status in community-
dwelling older women: a 14-year prospective study. Archives of Internal
Medicine, 163(21), 2565-2571.
148
Brownson, R. C., Boehmer, T. K., & Luke, D. A. (2005). Declining rates of physical
activity in the United States: what are the contributors? Annual Review of Public
Health, 26, 421-443.
Brownson, R. C., Hoehner, C. M., Day, K., Forsyth, A., & Sallis, J. F. (2009). Measuring
the built environment for physical activity: state of the science. American Journal
of Preventive Medicine, 36(4 Suppl), S99-123 e112.
Bruce, B., Fries, J. F., & Hubert, H. (2008). Regular vigorous physical activity and
disability development in healthy overweight and normal-weight seniors: a 13-
year study. American Journal of Public Health, 98(7), 1294-1299.
Carlson, S. A., Fulton, J. E., Schoenborn, C. A., & Loustalot, F. (2010). Trend and
prevalence estimates based on the 2008 Physical Activity Guidelines for
Americans. American Journal of Preventive Medicine, 39(4), 305-313.
Casagrande, S. S., Whitt-Glover, M. C., Lancaster, K. J., Odoms-Young, A. M., & Gary,
T. L. (2009). Built environment and health behaviors among African Americans:
a systematic review. American Journal of Preventive Medicine, 36(2), 174-181.
Cerniauskaite, M., Quintas, R., Koutsogeorgou, E., Meucci, P., Sattin, D., Leonardi, M.,
& Raggi, A. (2012). Quality-of-life and disability in patients with stroke.
American Journal of Physical Medicine & Rehabilitation, 91(13 Suppl 1), S39-
S47.
Cervero, R., & Kockelman, K. (1997). Travel demand and the 3Ds: Density, diversity,
and design. Transportation Research Part D: Transport and Environment, 2(3),
199-219.
149
Cesari, M. (2011). Role of gait speed in the assessment of older patients JAMA.
305(1):93-4,
Cesari, M., Kritchevsky, S. B., Newman, A. B., Simonsick, E. M., Harris, T. B., Penninx,
B. W., . . . Health, Aging and Body Composition Study. (2009). Added value of
physical performance measures in predicting adverse health-related events: results
from the Health, Aging And Body Composition Study. Journal of the American
Geriatrics Society, 57(2), 251-259.
Cesari, M., Kritchevsky, S. B., Penninx, B. W., Nicklas, B. J., Simonsick, E. M.,
Newman, A. B., . . . Pahor, M. (2005). Prognostic value of usual gait speed in
well-functioning older people: Results from the Health, Aging and Body
Composition Study. Journal of the American Geriatric Society, 53(10), 1675-
1680.
Chakravarty, E. F., Hubert, H. B., Krishnan, E., Bruce, B. B., Lingala, V. B., & Fries, J.
F. (2012). Lifestyle risk factors predict disability and death in healthy aging
adults. American Journal of Medicine, 125(2), 190-197.
Chaudhry, S. I., McAvay, G., Ning, Y., Allore, H. G., Newman, A. B., & Gill, T. M.
(2010). Geriatric impairments and disability: The Cardiovascular Health Study.
Journal of the American Geriatrics Society, 58(9), 1686-1692.
Clark, C. R., Kawachi, I., Ryan, L., Ertel, K., Fay, M. E., & Berkman, L. F. (2009).
Perceived neighborhood safety and incident mobility disability among elders: the
hazards of poverty. BMC Public Health, 9, 162. doi:10.1186/1471-2458-9-162
150
Clarke, P., Ailshire, J. A., Bader, M., Morenoff, J. D., House, J. S., Clarke, P., . . . House,
J. S. (2008). Mobility disability and the urban built environment. American
Journal of Epidemiology, 168(5), 506-513.
Clarke, P., Ailshire, J. A., Lantz, P., Clarke, P., Ailshire, J. A., & Lantz, P. (2009). Urban
built environments and trajectories of mobility disability: findings from a national
sample of community-dwelling American adults (1986-2001). Social Science &
Medicine, 69(6), 964-970.
Clarke, P., & George, L. K. (2005). The role of the built environment in the disablement
process. American Journal of Public Health, 95(11), 1933-1939.
Cooper, R., Kuh, D., Cooper, C., Gale, C. R., Lawlor, D. A., Matthews, F., & Hardy, R.
(2011). Objective measures of physical capability and subsequent health: a
systematic review. Age and Ageing, 40(1), 14-23.
Cooper, R., Kuh, D., Hardy, R., Mortality Review Group, FALCon and HALCyon Study
Teams. (2010). Objectively measured physical capability levels and mortality:
systematic review and meta-analysis. BMJ, 341, c4467. doi: 10.1136/bmj.c4467
Crowe, M., Andel, R., Wadley, V. G., Okonkwo, O. C., Sawyer, P., & Allman, R. M.
(2008). Life-space and cognitive decline in a community-based sample of African
American and Caucasian older adults. Journals of Gerontology Series A-
Biological Sciences & Medical Sciences, 63(11):1241-1245.
Cummings, S. R., Black, D. M., Nevitt, M. C., Browner, W. S., Cauley, J. A., Genant, H.
K., . . . et al. (1990). Appendicular bone density and age predict hip fracture in
women. The Study of Osteoporotic Fractures Research Group. JAMA, 263(5),
665-668.
151
Cunningham, G. O., & Michael, Y. L. (2004). Concepts guiding the study of the impact
of the built environment on physical activity for older adults: a review of the
literature. American Journal of Health Promotion, 18(6), 435-443.
Diehr, P., & Johnson, L. L. (2005). Accounting for missing data in end-of-life research.
Journal of Palliative Medicine, 8(Suppl 1), S50-S57.
Dunlop, D. D., Song, J., Manheim, L. M., Daviglus, M. L., & Chang, R. W. (2007).
Racial/ethnic differences in the development of disability among older adults.
American Journal of Public Health, 97(12), 2209-2215.
Enders, C. K. (2010). Applied Missing Data Analysis. New York, NY: Guilford.
Enders, C. K. (2011). Missing not at random models for latent growth curve analyses.
Psychological Methods, 16(1), 1-16.
Ewing, R., & Cervero, R. (2001). Travel and the built environment: A synthesis.
Transportation Research Record: Journal of the Transportation Research Board,
1780(1), 87-114.
Ewing, R., & Cervero, R. (2010). Travel and the built environment: A meta-analysis.
Journal of the American Planning Association, 76(3), 265-294.
Ewing, R., Greenwald, M. J., Zhang, H., Walters, J., Feldman, M., Cervero, R., . . .
Thomas, J. (2009). Measuring the impact of urban form and transit access on
mixed use site trip generation rates, Portland pilot study. Washington DC: U.S.
Environmental Protection Agency.
Ewing, R., Handy, S., Brownson, R. C., Clemente, O., & Winston, E. (2006). Identifying
and measuring urban design qualities related to walkability. Journal of Physical
Activity & Health, 3, S223-S240.
152
Ewing, R., Schmid, T., Killingsworth, R., Zlot, A., & Raudenbush, S. (2003).
Relationship between urban sprawl and physical activity, obesity, and morbidity.
American Journal of Health Promotion, 18(1), 47-57.
Federal Highway Administration. (2010). Journey to Work Trends in the United States
and its Major Metropolitan Areas. (FHWA-EP-03-058). Washington DC: U.S.
Department of Transportation.
Feng, J., Glass, T. A., Curriero, F. C., Stewart, W. F., & Schwartz, B. S. (2010). The built
environment and obesity: a systematic review of the epidemiologic evidence.
Health & Place, 16(2), 175-190.
Flowerdew, R., Manley, D. J., & Sabel, C. E. (2008). Neighbourhood effects on health:
does it matter where you draw the boundaries? Social Science and Medicine,
66(6), 1241-1255.
Folstein, M. F., Folstein, S. E., & McHugh, P. R. (1975). "Mini-mental state": A practical
method for grading the cognitive state of patients for the clinician. Journal of
Psychiatric Research, 12(3), 189-198.
Frank, L., Kerr, J., Rosenberg, D., & King, A. (2010). Healthy aging and where you live:
Community design relationships with physical activity and body weight in older
Americans. Journal of Physical Activity & Health, 7(Suppl 1), S82-90.
Freedman, V. A., Grafova, I. B., Schoeni, R. F., & Rogowski, J. (2008). Neighborhoods
and disability in later life. Social Science and Medicine, 66(11), 2253-2267.
Freedman, V. A., Martin, L. G., Schoeni, R. F., & Cornman, J. C. (2008). Declines in
late-life disability: the role of early- and mid-life factors. Social Science &
Medicine, 66(7), 1588-1602.
153
Fried, L. P., Bandeen-Roche, K., Chaves, P. H., & Johnson, B. A. (2000). Preclinical
mobility disability predicts incident mobility disability in older women. The
Journals of Gerontology, Series A: Biological Sciences and Medical Sciences,
55(1), M43-M52.
Fuller-Thomson, E., Yu, B., Nuru-Jeter, A., Guralnik, J. M., & Minkler, M. (2009). Basic
ADL disability and functional limitation rates among older Americans from 2000-
2005: The end of the decline? Journals of Gerontology Series A: Biological
Sciences & Medical Sciences, 64A(12), 1333-1336.
Gebel, K., Bauman, A. E., & Petticrew, M. (2007). The physical environment and
physical activity: a critical appraisal of review articles. American Journal of
Preventive Medicine, 32(5), 361-369.
Gill, T. M. (2010). Assessment of function and disability in longitudinal studies. Journal
of the American Geriatrics Society, 58(Suppl 2), S308-312.
Gill, T. M., Allore, H. G., Hardy, S. E., & Guo, Z. (2006). The dynamic nature of
mobility disability in older persons. Journal of the American Geriatrics Society,
54(2), 248-254.
Giuliani, C. A., Gruber-Baldini, A. L., Park, N. S., Schrodt, L. A., Rokoske, F., Sloane, P.
D., & Zimmerman, S. (2008). Physical performance characteristics of assisted
living residents and risk for adverse health outcomes. Gerontologist, 48(2), 203-
212.
Glass, T., & Balfour, J. L. (2003). Neighborhoods, aging and functional limitation. In I.
Kawachi & L. Berkman (Eds.), Neighborhoods and Health (pp. 303-334). New
York: Oxford University Press.
154
Greene, V. L. (1983). Substitution between formally and informally provided care for the
impaired elderly in the community. Medical Care, 21(6), 609-619.
Greenlick, M. R., Freeborn, D. K., & Pope, C. R. (1988). Health Care Research in an
HMO: Two Decades of Discovery. Baltimore, MD: Johns Hopkins University
Press.
Grimm, K. J., & Ram, N. (2009). Nonlinear Growth Models in Mplus and SAS.
Structural Equation Modeling, 16(4), 676-701.
Groessl, E. J., Kaplan, R. M., Rejeski, W. J., Katula, J. A., King, A. C., Frierson, G., . . .
Pahor, M. (2007). Health-related quality of life in older adults at risk for
disability. American Journal of Preventive Medicine, 33(3), 214-218.
Guralnik, J. M., Alecxih, L., Branch, L. G., & Wiener, J. M. (2002). Medical and long-
term care costs when older persons become more dependent. American Journal of
Public Health, 92(8), 1244-1245.
Guralnik, J. M., Branch, L. G., Cummings, S. R., & Curb, J. D. (1989). Physical
performance measures in aging research. Journal of Gerontology, 44(5), M141-
146.
Guralnik, J. M., Ferrucci, L., Pieper, C. F., Leveille, S. G., Markides, K. S., Ostir, G. V., .
. . Wallace, R. B. (2000). Lower extremity function and subsequent disability:
consistency across studies, predictive models, and value of gait speed alone
compared with the short physical performance battery. The Journals of
Gerontology, Series A: Biological Sciences and Medical Sciences, 55(4), M221-
231.
155
Guralnik, J. M., Ferrucci, L., Simonsick, E. M., Salive, M. E., & Wallace, R. B. (1995).
Lower-extremity function in persons over the age of 70 years as a predictor of
subsequent disability. New England Journal of Medicine, 332(9), 556-561.
Guralnik, J. M., Fried, L. P., & Salive, M. E. (1996). Disability as a Public Health
Outcome in the Aging Population. Annual Review of Public Health, 17(1), 25-46.
Guralnik, J. M., LaCroix, A. Z., Abbott, R. D., Berkman, L. F., Satterfield, S., Evans, D.
A., & Wallace, R. B. (1993). Maintaining mobility in late life. I. Demographic
characteristics and chronic conditions. American Journal of Epidemiology,
137(8), 845-857.
Handy, S. L. (2005). Critical Assessment of the Literature on the Relationships Among
Transportation, Land Use, and Physical Activity TRB Special Report 282.
Washington DC: National Research Council.
Handy, S. L. (1996). Understanding the link between urban form and nonwork travel
behavior. Journal of Planning Education and Research, 15(3), 183-198.
Handy, S. L., Boarnet, M. G., Ewing, R., & Killingsworth, R. E. (2002). How the built
environment affects physical activity: Views from urban planning. American
Journal of Preventive Medicine, 23(2 Suppl. 1), 64-73.
Hardy, S. E., Allore, H., & Studenski, S. A. (2009). Missing data: a special challenge in
aging research. Journal of the American Geriatric Society, 57(4), 722-729.
Harmon, J. E., & Anderson, S. J. (2003). The Design and Implementation of Geographic
Information Systems. Hoboken, NJ: John Wiley & Sons.
Hertzog, C., von Oertzen, T., Ghisletta, P., & Lindenberger, U. (2008). Evaluating the
Power of Latent Growth Curve Models to Detect Individual Differences in
156
Change. Structural Equation Modeling: A Multidisciplinary Journal, 15(4), 541-
563.
Hillsdon, M. M., Brunner, E. J., Guralnik, J. M., & Marmot, M. G. (2005). Prospective
study of physical activity and physical function in early old age. American
Journal of Preventive Medicine, 28(3), 245-250.
Hirsch, C. H., Fried, L. P., Harris, T., Fitzpatrick, A., Enright, P., & Schulz, R. (1997).
Correlates of performance-based measures of muscle function in the elderly: the
Cardiovascular Health Study. Journals of Gerontology Series A-Biological
Sciences & Medical Sciences, 52(4), M192-200.
Hoehner, C. M., Brennan, L. K., Brownson, R. C., Handy, S. L., & Killingsworth, R.
(2003). Opportunities for integrating public health and urban planning approaches
to promote active community environments. American Journal of Health
Promotion, 18(1), 14-20.
Hoehner, C. M., Brennan Ramirez, L. K., Elliott, M. B., Handy, S. L., & Brownson, R. C.
(2005). Perceived and objective environmental measures and physical activity
among urban adults. American Journal of Preventive Medicine, 28(2 Suppl. 2),
105-116.
Hooker, S. P., Wilson, D. K., Griffin, S. F., & Ainsworth, B. E. (2005). Perceptions of
environmental supports for physical activity in African American and white adults
in a rural county in South Carolina. Preventing Chronic Disease, 2(4), 1-10.
Hrobonova, E., Breeze, E., & Fletcher, A. E. (2011). Higher levels and intensity of
physical activity are associated with reduced mortality among community
157
dwelling older people. Journal of Aging Research, 2011. doi:
10.4061/2011/651931.
Hu, L. T., & Bentler, P. M. (1999). Cutoff criteria for fit indexes in covariance structure
analysis: Conventional criteria versus new alternatives. Structural Equation
Modeling, 6(1), 1-55.
Iacobucci, D. (2010). Structural equations modeling: Fit Indices, sample size, and
advanced topics. Journal of Consumer Psychology, 20(1), 90-98.
Institute of Medicine. (1991). Disability in America: Toward a National Agenda for
Prevention. Washington DC: The National Academies Press.
Inzitari, M., Carlo, A., Baldereschi, M., Pracucci, G., Maggi, S., Gandolfo, C., . . . Group,
I. W. (2006). Risk and predictors of motor-performance decline in a normally
functioning population-based sample of elderly subjects: the Italian Longitudinal
Study on Aging. Journal of the American Geriatrics Society, 54(2), 318-324.
James, B. D., Boyle, P. A., Buchman, A. S., Barnes, L. L., & Bennett, D. A. (2011). Life
space and risk of Alzheimer disease, mild cognitive impairment, and cognitive
decline in old age. American Journal of Geriatric Psychiatry, 19(11), 961-969.
Jette, A. M., Tennstedt, S., & Crawford, S. (1995). How does formal and informal
community care affect nursing home use? Journals of Gerontology Series B-
Psychological Sciences & Social Sciences, 50(1), S4-S12.
Jones, R. (2012). Latent Growth Curve Models. In J. T. Newsom, R. Jones & S. M. Hofer
(Eds.), Longitudinal Data Analysis: A Practical Guide for Researchers in Aging,
Health, and Social Sciences. New York, NY: Routledge.
158
Kenny, D. A., & McCoach, D. B. (2003). Effect of the Number of Variables on Measures
of Fit in Structural Equation Modeling. Structural Equation Modeling: A
Multidisciplinary Journal, 10(3), 333-351.
King, A. C., Stokols, D., Talen, E., Brassington, G. S., & Killingsworth, R. (2002).
Theoretical approaches to the promotion of physical activity: forging a
transdisciplinary paradigm. American Journal of Preventive Medicine, 23(2
Suppl), 15-25.
Krieger, N., Chen, J. T., Waterman, P. D., Soobader, M. J., Subramanian, S. V., &
Carson, R. (2002). Geocoding and monitoring of US socioeconomic inequalities
in mortality and cancer incidence: does the choice of area-based measure and
geographic level matter?: the Public Health Disparities Geocoding Project.
American Journal of Epidemiology, 156(5), 471-482.
Kuo, H. K., Leveille, S. G., Yu, Y. H., & Milberg, W. P. (2007). Cognitive function,
habitual gait speed, and late-life disability in the National Health and Nutrition
Examination Survey (NHANES) 1999-2002. Gerontology, 53(2), 102-110.
Kwon, S., Perera, S., Pahor, M., Katula, J. A., King, A. C., Groessl, E. J., & Studenski, S.
A. (2009). What is a meaningful change in physical performance? Findings from
a clinical trial in older adults (the LIFE-P study). Journal of Nutrition, Health &
Aging, 13(6), 538-544.
Lan, T. Y., Melzer, D., Tom, B. D., & Guralnik, J. M. (2002). Performance tests and
disability: developing an objective index of mobility-related limitation in older
populations. The Journals of Gerontology, Series A: Biological Sciences and
Medical Sciences, 57(5), M294-301.
159
Lawton, M. P. (1983). Environment and other determinants of well-being in older people.
Gerontologist, 23(4), 349-357.
Lawton, M. P. (1985). The Elderly in Context. Environment and Behavior, 17(4), 501-
519.
Lawton, M. P., & Nahemow, L. (1973). Ecology and the aging process. In C. Eisdorfer &
M. P. Lawton (Eds.), Psychology of adult development and aging (pp. 657-668).
Washington DC: American Psychological Association.
Leslie, E., Coffee, N., Frank, L., Owen, N., Bauman, A., & Hugo, G. (2007). Walkability
of local communities: Using geographic information systems to objectively assess
relevant environmental attributes. Health & Place, 13(1), 111-122.
Leveille, S. G., Penninx, B. W., Melzer, D., Izmirlian, G., & Guralnik, J. M. (2000). Sex
differences in the prevalence of mobility disability in old age: the dynamics of
incidence, recovery, and mortality. The Journals of Gerontology, Series B:
Psychoogical Sciences and Social Sciences, 55(1), S41-S50.
Li, F., Fisher, K. J., Brownson, R. C., & Bosworth, M. (2005). Multilevel modeling of
built environment characteristics related to neighbourhood walking activity in
older adults. Journal of Epidemiology and Community Health, 59, 558–564.
Li, W., Keegan, T. H. M., Sternfeld, B., Sidney, S., Quesenberry, C. P., & Kelsey, J. L.
(2006). Outdoor Falls Among Middle-Aged and Older Adults: A Neglected
Public Health Problem. American Journal of Public Health, 96(7), 1192-1200.
Liao, W. C., Li, C. R., Lin, Y. C., Wang, C. C., Chen, Y. J., Yen, C. H., . . . Lee, M. C.
(2011). Healthy behaviors and onset of functional disability in older adults: results
160
of a national longitudinal study. Journal of the American Geriatrics Society,
59(2), 200-206.
Life Study Investigators, Pahor, M., Blair, S. N., Espeland, M., Fielding, R., Gill, T. M., .
. . Studenski, S. (2006). Effects of a physical activity intervention on measures of
physical performance: Results of the lifestyle interventions and independence for
Elders Pilot (LIFE-P) study. Journals of Gerontology Series A-Biological
Sciences & Medical Sciences, 61(11), 1157-1165.
Lin, L., & Moudon, A. V. (2010). Objective versus subjective measures of the built
environment, which are most effective in capturing associations with walking?
Health & Place, 16(2), 339-348.
Lin, M. Y., Gutierrez, P. R., Stone, K. L., Yaffe, K., Ensrud, K. E., Fink, H. A., . . .
Mangione, C. M. (2004). Vision impairment and combined vision and hearing
impairment predict cognitive and functional decline in older women. Journal of
the American Geriatrics Society, 52(12), 1996-2002.
Linn, M. W., Hunter, K. I., & Linn, B. S. (1980). Self-assessed health, impairment and
disability in anglo, black and cuban elderly. Medical Care, 18(3), 282-288.
Lynott, J., & Figueiredo, C. (2011). How the travel patterns of older adults are changing:
Highlights from the 2009 National Household Travel Survey. AARP Public Policy
Institute Fact Sheet. Washington, DC: AARP.
Manini, T. M., Newman, A. B., Fielding, R., Blair, S. N., Perri, M. G., Anton, S. D., . . .
Pahor, M. (2010). Effects of exercise on mobility in obese and nonobese older
adults. Obesity, 18(6), 1168-1175.
161
Manini, T. M., & Pahor, M. (2009). Physical activity and maintaining physical function
in older adults. [Review]. British Journal of Sports Medicine, 43(1), 28-31.
McDermott, M. M., Fried, L., Simonsick, E., Ling, S., & Guralnik, J. M. (2000).
Asymptomatic peripheral arterial disease is independently associated with
impaired lower extremity functioning: the women's health and aging study.
Circulation, 101(9), 1007-1012.
Mehta, K. M., Yaffe, K., & Covinsky, K. E. (2002). Cognitive impairment, depressive
symptoms, and functional decline in older people. Journal of the American
Geriatrics Society, 50(6), 1045-1050.
Metro. (2011). Summary of 2040 Growth Concept. Portland, OR: Metro.
Michael, Y. L., Gold, R., Perrin, N. A., & Hillier, T. A. (2011). Built Environment and
Lower Extremity Physical Performance: Prospective Findings From the Study of
Osteoporotic Fractures in Women. Journal of Aging & Health, 23(8), 1246-1262.
Michael, Y. L., Perdue, L. A., Orwoll, E. S., Stefanick, M. L., & Marshall, L. M. (2010).
Physical activity resources and changes in walking in a cohort of older men.
American Journal of Public Health, 100(4), 654-660.
Michiels, B., Molenberghs, G., Bijnens, L., Vangeneugden, T., & Thijs, H. (2002).
Selection models and pattern-mixture models to analyse longitudinal quality of
life data subject to drop-out. Statistics in Medicine, 21(8), 1023-1041.
Mokhtarian, P. L., & Salomon, I. (2001). How derived is the demand for travel? Some
conceptual and measurement considerations. Transportation Research Part A:
Policy and Practice, 35(8), 695-719.
162
Montero-Odasso, M., Schapira, M., Soriano, E. R., Varela, M., Kaplan, R., Camera, L.
A., & Mayorga, L. M. (2005). Gait velocity as a single predictor of adverse events
in healthy seniors aged 75 years and older. Journals of Gerontology Series A-
Biological Sciences & Medical Sciences, 60(10), 1304-1309.
Murray, E. T., Hardy, R., Strand, B. H., Cooper, R., Guralnik, J. M., & Kuh, D. (2011).
Gender and life course occupational social class differences in trajectories of
functional limitations in midlife: findings from the 1946 British birth cohort.
Journals of Gerontology Series A-Biological Sciences & Medical Sciences,
66(12), 1350-1359.
Murtagh, K. N., & Hubert, H. B. (2004). Gender differences in physical disability among
an elderly cohort. American Journal of Public Health, 94(8), 1406-1411.
Muthèn, B., Asparouhov, T., Hunter, A. M., & Leuchter, A. F. (2011). Growth modeling
with nonignorable dropout: alternative analyses of the STAR*D antidepressant
trial. Psychological Methods, 16, 117-133.
Muthèn, B. (2010). Introductory and intermediate growth modeling. Growth Modeling
With Latent Variables Using Mplus. Retrieved from
http://www.statmodel.com/course_materials.shtml
Nagel, C. L., Carlson, N. E., Bosworth, M., & Michael, Y. L. (2008). The relation
between neighborhood built environment and walking activity among older
adults. American Journal of Epidemiology, 168(4), 461-468.
Nagi, S. (1965). Some conceptual issues in disability and rehabilitation. In M. Sussman
(Ed.), Sociology and Rehabilitation (pp. 100-113). Washington DC: American
Sociological Association.
163
Newcomer, R., Kang, T., Laplante, M., & Kaye, S. (2005). Living quarters and unmet
need for personal care assistance among adults with disabilities. Journals of
Gerontology Series B-Psychological Sciences & Social Sciences, 60(4), S205-
S213.
Newman, A. B., Arnold, A. M., Sachs, M. C., Ives, D. G., Cushman, M., Strotmeyer, E.
S., . . . Robbins, J. (2009). Long-term function in an older cohort: The
Cardiovascular Health Study All Stars Study. Journal of the American Geriatrics
Society, 57(3), 432-440.
Nusselder, W. J., Looman, C. W., Franco, O. H., Peeters, A., Slingerland, A. S.,
Mackenbach, J. P., & Looman, C. W. N. (2008). The relation between non-
occupational physical activity and years lived with and without disability. Journal
of Epidemiology & Community Health, 62(9), 823-828.
Nusselder, W. J., Looman, C. W. N., & Mackenbach, J. P. (2005). Nondisease factors
affected trajectories of disability in a prospective study. Journal of Clinical
Epidemiology, 58(5), 484-494.
Oliver, L. N., Schuurman, N., & Hall, A. W. (2007). Comparing circular and network
buffers to examine the influence of land use on walking for leisure and errands.
International Journal of Health Geographics, 6, 41. doi:10.1186/1476-072X-6-41
Onder, G., Penninx, B. W. J. H., Ferrucci, L., Fried, L. P., Guralnik, J. M., & Pahor, M.
(2005). Measures of Physical Performance and Risk for Progressive and
Catastrophic Disability: Results From the Women's Health and Aging Study. The
Journals of Gerontology Series A: Biological Sciences and Medical Sciences,
60(1), 74-79.
164
Ostchega, Y., Harris, T. B., Hirsch, R., Parsons, V. L., & Kington, R. (2000). The
prevalence of functional limitations and disability in older persons in the US: data
from the National Health and Nutrition Examination Survey III. Journal of the
American Geriatrics Society, 48(9), 1132-1135.
Ostir, G. V., Berges, I., Kuo, Y.-F., Goodwin, J. S., Ottenbacher, K. J., & Guralnik, J. M.
(2012). Assessing gait speed in acutely ill older patients admitted to an acute care
for elders hospital unit. Archives of Internal Medicine, 172(4), 358-359.
Ostir, G. V., Carlson, J. E., Black, S. A., Rudkin, L., Goodwin, J. S., & Markides, K. S.
(1999). Disability in older adults. 1: Prevalence, causes, and consequences.
Behavioral Medicine, 24(4), 147-156.
Ostir, G. V., Markides, K. S., Black, S. A., & Goodwin, J. S. (1998). Lower body
functioning as a predictor of subsequent disability among older Mexican
Americans. Journals of Gerontology Series A-Biological Sciences & Medical
Sciences, 53(6), M491-M495.
Parker, R. N., & Asencio, E. K. (2008). GIS and Spatial Analysis for the Social Sciences:
Coding, Mapping and Modeling. New York, NY: Routledge.
Paterson, D. H., & Warburton, D. E. (2010). Physical activity and functional limitations
in older adults: a systematic review related to Canada's Physical Activity
Guidelines. International Journal of Behavioral Nutrition and Physical Activity,
7, 38. doi: 10.1186/1479-5868-7-38
Pauler, D. K., McCoy, S., & Moinpour, C. (2003). Pattern mixture models for
longitudinal quality of life studies in advanced stage disease. Statistics in
Medicine, 22(5), 795-809.
165
Perera, S., Mody, S. H., Woodman, R. C., & Studenski, S. A. (2006). Meaningful change
and responsiveness in common physical performance measures in older adults.
Journal of the American Geriatrics Society, 54(5), 743-749.
Peterson, M. J., Giuliani, C., Morey, M. C., Pieper, C. F., Evenson, K. R., Mercer, V., . . .
Simonsick, E. M. (2009). Physical activity as a preventative factor for frailty: the
health, aging, and body composition study. The Journals of Gerontology, Series
A: Biological Sciences and Medical Sciences, 64(1), 61-68.
Preacher, K. J., Wichman, A. L., MacCallum, R. C., & Briggs, N. E. (2008). Latent
Growth Curve Modeling. Thousand Oaks, CA: Sage.
Pedestrian Transit Program. (1998). Portland Pedestrian Design Guide. Portland, OR.
Office of Transportation, City of Portland.
Protas, E. J., & Tissier, S. (2009). Strength and speed training for elders with mobility
disability. Journal of Aging & Physical Activity, 17(3), 257-271.
Reynolds, S. L., & Silverstein, M. (2003). Observing the onset of disability in older
adults. Social Science & Medicine, 57(10), 1875-1889.
Rosano, C., Newman, A. B., Katz, R., Hirsch, C. H., & Kuller, L. H. (2008). Association
Between Lower Digit Symbol Substitution Test Score and Slower Gait and
Greater Risk of Mortality and of Developing Incident Disability in Well-
Functioning Older Adults. Journal of the American Geriatrics Society, 56(9),
1618-1625.
Rosso, A. L., Auchincloss, A. H., & Michael, Y. L. (2011). The urban built environment
and mobility in older adults: A comprehensive review. Journal of Aging
Research, 2011. doi:10.4061/2011/816106
166
Rubin, D. B. (1976). Inference and missing data. Biometrika, 63(3), 581-592.
Sallis, J. F., Bowles, H. R., Bauman, A., Ainsworth, B. E., Bull, F. C., Craig, C. L., . . .
Bergman, P. (2009). Neighborhood environments and physical activity among
adults in 11 countries. American Journal of Preventive Medicine, 36(6), 484-490.
Sallis, J. F., & Owen, N. (2002). Ecological models of health behavior. In K. Glanz, B. K.
Rimer & F. M. Lewis (Eds.), Health Behavior and Health Education: Theory,
Research, and Practice (Third ed., pp. 462-484). San Francisco: Jossey-Bass.
Satariano, W. A. (2006). Epidemiology of Aging: An Ecological Approach. Sudbury,
MA: Jone s and Bartlett.
Satariano, W. A., & McAuley, E. (2003). Promoting physical activity among older
adults: From ecology to the individual. American Journal of Preventive Medicine,
25(3 Suppl 2), 184-192.
Schootman, M., Andresen, E. M., Wolinsky, F. D., Malmstrom, T. K., Miller, J. P.,
Miller, D. K., . . . Miller, D. K. (2006). Neighborhood conditions and risk of
incident lower-body functional limitations among middle-aged African
Americans. American Journal of Epidemiology, 163(5), 450-458.
Seeman, T., & Chen, X. (2002). Risk and protective factors for physical functioning in
older adults with and without chronic conditions: MacArthur Studies of
Successful Aging. Journals of Gerontology Series B-Psychological Sciences &
Social Sciences, 57(3), S135-144.
Seeman, T. E., Merkin, S. S., Crimmins, E. M., & Karlamangla, A. S. (2010). Disability
trends among older Americans: National Health and Nutrition Examination
167
Surveys, 1988-1994 and 1999-2004. American Journal of Public Health, 100(1),
100-107.
Sheikh, J. I., & Yesavage, J. A. (1986). Geriatric Depression scale (GDS) : recent
evidence and development of a Shorter Version. Clinical Gerontologist, 5(1),
165-172.
Shigematsu, R., Sallis, J.F., Conway, T.L., Saelens, B.E., Frank, L.D., Cain, K.L.,
Chapman, J.E., King, A.C. (2009). Age differences in the relation of perceived
neighborhood environment to walking. Medicine and Science in Sports and
Exercise 41, 314–321.
Siegel, P. Z., Brackbill, R. M., & Heath, G. W. (1995). The epidemiology of walking for
exercise: implications for promoting activity among sedentary groups. American
Journal of Public Health, 85(5), 706-710.
Simonsick, E. M., Kasper, J. D., Guralnik, J. M., Bandeen-Roche, K., Ferrucci, L.,
Hirsch, R., . . . Fried, L. P. (2001). Severity of upper and lower extremity
functional limitation: Scale development and validation with self-report and
performance-based measures of physical function. WHAS Research Group.
Women's Health and Aging Study. Journals of Gerontology Series B-
Psychological Sciences & Social Sciences, 56(1), S10-S19,
Simpson, M. E., Serdula, M., Galuska, D. A., Gillespie, C., Donehoo, R., Macera, C., &
Mack, K. (2003). Walking trends among U.S. adults: The Behavioral Risk Factor
Surveillance System, 1987-2000. American Journal of Preventive Medicine,
25(2), 95-100.
168
Singer, J. D., & Willett, J. B. (2003). Applied longitudinal data analysis: Modeling
change and event occurrence. New York, NY: Oxford University Press.
Song, Y., & Knaap, G. J. (2004). Measuring Urban Form: Is Portland Winning the War
on Sprawl? Journal of the American Planning Association, 70(2), 210-225.
Steffen, T. M., Hacker, T. A., & Mollinger, L. (2002). Age- and Gender-Related Test
Performance in Community-Dwelling Elderly People: Six-Minute Walk Test,
Berg Balance Scale, Timed Up & Go Test, and Gait Speeds. Physical Therapy,
82(2), 128-137.
Steiner, P. M., Cook, T. D., Shadish, W. R., & Clark, M. H. (2010). The importance of
covariate selection in controlling for selection bias in observational studies,
Psychological Methods, 15(3), 250-267.
Stuck, A. E., Walthert, J. M., Nikolaus, T., Bula, C. J., Hohmann, C., & Beck, J. C.
(1999). Risk factors for functional status decline in community-living elderly
people: a systematic literature review. Social Science and Medicine, 48(4), 445-
469.
Studenski, S., Perera, S., Patel, K., Rosano, C., Faulkner, K., Inzitari, M., . . . Guralnik, J.
(2011). Gait Speed and Survival in Older Adults. JAMA: The Journal of the
American Medical Association, 305(1), 50-58.
Studenski, S., Perera, S., Wallace, D., Chandler, J. M., Duncan, P. W., Rooney, E., . . .
Guralnik, J. M. (2003). Physical performance measures in the clinical setting.
Journal of the American Geriatrics Society, 51(3), 314-322.
Study of Osteoporotic Fractures. (2011). SOF Detailed Measurement. Retrieved from
http://sof.ucsf.edu/interface/
169
Su, F., Schmocker, J. C., Bell, M. G. H. (2009). Mode choice of older adults before and
after shopping. Journal of Transport and Land Use, 2(1), 29–46.
Szklo, M., & Nieto, F. J. (2007). Epidemiology: Beyond the basics. Sudbury, MA: Jones
and Bartlett.
Taylor Jr, D. H., & Hoenig, H. (2006). Access to Health Care Services for the Disabled
Elderly. Health Services Research, 41(3), 743-758.
Thijs, H., Molenberghs, G., Michiels, B., Verbeke, G., & Curran, D. (2002). Strategies to
fit pattern-mixture models. Biostatistics, 3(2), 245-265.
Thornton, L. E., Pearce, J. R., & Kavanagh, A. M. (2011). Using Geographic Information
Systems (GIS) to assess the role of the built environment in influencing obesity:
A glossary. International Journal of Behavioral Nutrition and Physical Activity,
8, 71. doi:10.1186/1479-5868-8-71
Tripepi, G., Jager, K. J., Dekker, F. W., & Zoccali, C. (2010). Selection bias and
information bias in clinical research. Nephron, 115(2), c94-c99.
Troiano, R. P., Berrigan, D., Dodd, K. W., Masse, L. C., Tilert, T., & McDowell, M.
(2008). Physical activity in the United States measured by accelerometer.
Medicine & Science in Sports & Exercise, 40(1):181-188.
U.S. Department of Health and Human Services. (2010). Healthy People 2010:
Understanding and improving health and objectives for improving health.
Washington DC: U.S. Government Printing Office.
US Department of Health and Human Services. (2008). Physical activity guidelines for
Americans. Washington DC: U.S. Government Printing Office.
170
Van Cauwenberg, J., De Bourdeaudhuij, I., De Meester, F., Van Dyck, D., Salmon, J.,
Clarys, P., & Deforche, B. (2011). Relationship between the physical environment
and physical activity in older adults: a systematic review. Health & Place, 17(2),
458-469.
Van Dyck, D., Cerin, E., Cardon, G., Deforche, B., Sallis, J. F., Owen, N., & de
Bourdeaudhuij, I. (2010). Physical activity as a mediator of the associations
between neighborhood walkability and adiposity in Belgian adults. Health and
Place, 16(5), 952-960.
Van Sluijs, E. M., McMinn, A. M., Griffin, S. J., van Sluijs, E. M. F., McMinn, A. M., &
Griffin, S. J. (2007). Effectiveness of interventions to promote physical activity in
children and adolescents: systematic review of controlled trials. BMJ, 335(7622),
703. doi: 10.1136/bmj.39320.843947.BE
Verbrugge, L. M., & Jette, A. M. (1994). The disablement process. Social Science and
Medicine, 38(1), 1-14.
Verghese, J., Wang, C., & Holtzer, R. (2011). Relationship of clinic-based gait speed
measurement to limitations in community-based activities in older adults.
Archives of Physical Medicine & Rehabilitation, 92(5), 844-866.
Vermeulen, J., Neyens, J. C., van Rossum, E., Spreeuwenberg, M. D., & de Witte, L. P.
(2011). Predicting ADL disability in community-dwelling elderly people using
physical frailty indicators: a systematic review. BMC Geriatrics, 11, 33.
doi:10.1186/1471-2318-11-33
Vest, M. T., Murphy, T. E., Araujo, K. L. B., & Pisani, M. A. (2011). Disability in
activities of daily living, depression, and quality of life among older medical ICU
171
survivors: a prospective cohort study. Health & Quality of Life Outcomes, 9(9).
doi:10.1186/1477-7525-9-9
Wang, Z., & Lee, C. (2010). Site and neighborhood environments for walking among
older adults. Health and Place, 16(6), 1268-1279.
Weden, M. M., Carpiano, R. M., & Robert, S. A. (2008). Subjective and objective
neighborhood characteristics and adult health. Social Science & Medicine, 66(6),
1256-1270.
Wen, M., Hawkley, L. C., & Cacioppo, J. T. (2006). Objective and perceived
neighborhood environment, individual SES and psychosocial factors, and self-
rated health: An analysis of older adults in Cook County, Illinois. Social Science
& Medicine, 63(10),
Wendel-Vos, W., Droomers, M., Kremers, S., Brug, J., & van Lenthe, F. (2007).
Potential environmental determinants of physical activity in adults: a systematic
review. Obesity Review, 8(5), 425-440.
Wennie Huang, W.-N., Perera, S., VanSwearingen, J., & Studenski, S. (2010).
Performance measures predict onset of activity of daily living difficulty in
community-dwelling older adults. Journal of the American Geriatrics Society,
58(5), 844-852.
Westreich, D. (2012). Berkson's bias, selection bias, and missing data. Epidemiology,
23(1), 159-164.
Xue, Q.-L., Fried, L. P., Glass, T. A., Laffan, A., & Chaves, P. H. M. (2008). Life-space
constriction, development of frailty, and the competing risk of mortality: the
172
Women's Health And Aging Study. American Journal of Epidemiology, 167(2),
240-248.
Yang, X., Li, J., & Shoptaw, S. (2008). Imputation-based strategies for clinical trial
longitudinal data with nonignorable missing values. Statistics in Medicine, 27(15),
2826-2849.
Zenk, S. N., Wilbur, J., Wang, E., McDevitt, J., Oh, A., Block, R., . . . Savar, N. (2009).
Neighborhood environment and adherence to a walking intervention in African
American women. Health Education and Behavior, 36(1), 167-181.
Related Documents