Welcome message from author
This document is posted to help you gain knowledge. Please leave a comment to let me know what you think about it! Share it to your friends and learn new things together.
Transcript


NAGALANDSTATISTICAL HANDBOOK
2020
DIRECTORATE OF ECONOMICS & STATISTICS NAGALAND : KOHIMA
Published byDirectorate of Economics & Statistics
Nagaland : Kohima
website : www.statistics.nagaland.gov.inemail : [email protected]
Nagaland Statistical Handbook
2020

PREFACE
The Statistical Handbook of Nagaland is an annual publication of the Directorate of Economics & Statistics. The present publication pertains to the year 2020 and contains useful socio-economic information and State’s time series data for recent years.
Statistics has been playing an important role in shaping humanity. Since the flow of information is ever increasing across the globe, the Directorate of Economics & Statistics is garnering all efforts to improve the quality of input information for effective policy and decision-making. It is hoped that this publication will serve as a useful reference to administrators, planners, research scholars and others.
I acknowledge the co-operation extended by various departments and stakeholders in providing the required data. I also appreciate the sincere efforts rendered by Handbook section in the preparation and publication of this edition.
I hope that users shall continue to provide valuable feedback and suggestion for improvement of the publication in the upcoming version.
Sd/-(REWELHI KRONU)
Director, Economics & Statistics
Nagaland, Kohima
KohimaNovember, 2020

OFFICERS AND STAFF ASSOCIATED WITH THIS PUBLICATION
Smt. T. Belho, Deputy Director
Shri. K.Rhanbemo Kithan, Economics & Statistics Officer
Shri. Enyei Mokyung Phom,Sr. Inspector of Statistics
Smt. Moala Jamir,Inspector of Statistics
Shri. Longritoshi, Inspector of Statistics
Smt. Toshimongla, Field Investigator
Shri. Nungsang Imsong, Field Investigator
Smt.Tiasenla JamirField Investigator
Smt. Themshao. PField Investigator
Smt. Keleneinuo Joyline Natso, Field Investigator


CONVERSION TABLES
I. STANDARD OF WEIGHTS 1 Grain – 0.0648 Gram – 0.0000648 Kilogram 1 Ounce – 28.35 Grams – 0.02835 Kilograms 1 Pound – 0.4536 Kilograms 1 Stone – 6.35 Kilograms 1 CWT – 50.8 Kilograms 1 Ton – 1016.06 Kilograms – 1.01606 Metric Tons 1 Tola – 11.664 Grams – 0.011664 Kilogram 1 Chattak – 0.05832 Kilogram 1 Seer – 0.93441 Kilogram 1 Mound – 37.3242 Kilograms 1 Metric Ton – 0.9842 Ton 1 Metric Ton – 26.79227 Mounds 100 Kilograms – 1 Quintal 10 Quintals – 1 Metric Ton 1 Quintal – 220.45857 Pounds 1 Kilogram – 2.204587 Pounds
II. NUMBERS 1 Lakh – 1,00,000 10 Lakhs – 10,00,000 or 1 Million 1 Crore – 1,00,00,000 or 10 Millions 1 Arab – 1,00,00,00,000 or 1000 Millions 1 Kharab – 1,00,00,00,00,000 10 Kharabs – 10,00,00,00,00,000
III. STANDARD OF LENGTH & CAPACITY 1 Inch – 0.0254 Meter 1 Foot – 0.3048 Meter 1 Yard – 0.9144 Meter 1 Mile – 1.609344 Kilometers 1 Meter – 1.0936132 Yards 1 Kilometer – 0.62137 Mile 1 Imperial Gallon – 4.54596 Litres 1 Litre – 0.2199755 Imperial Gallon

IV. STANDARD OF AREA 1 Square inch – 6.4516 Sq.Centimeters 1 Square Foot – 0.092903 Sq. Meter 1 Square Yard – 0.8361274 Sq. Meter 1 Square Mile – 2.589988 Sq. Kilometers 1 Square Kilometer – 0.3861 Sq. Mile 1 Square Meter – 1.19599 Sq. Yards 1 Acre – 4840 Sq. Yards 1 Hectare – 2.4710516 Acres 1 Acre – 0.404686 Hectare
V. METRIC UNITS (A) Length 1 Kilometer – 1000 Meters 1 Meter – 1000 Millimeters (B) Area 1 Square Kilometer – 100 Hectares
1 Square Hectare – 10000 Sq. Meters (C) Weight 1 Metric Ton – 1000 Kilograms 1 Metric Ton – 10 Quintals 1 Kilogram – 1000 Grams
VI. TEMPERATURE C (Centigrade) 5/9 (F-32) F (Fahrenheit) 9/5 (C+32)

CONTENTS
1. GENERAL 1.1 Nagaland at a Glance 1 2. GEOGRAPHICAL & DEMOGRAPHIC PROFILE 3 2.1: District - wise Area, Population & Density of Population 4 according 2011 Census 2.2: Population Trend in Nagaland from 1901 to 2011 5 2.3: District-wise Literate Population and Literacy Rate in 6 Nagaland according to 2011 Census 2.4: Distribution of Workers and Non-Workers according to 7 2011 Census 2.5: District-wise Child Population 0-6 Age group and 8 Population of Age 7 and above according to 2011 Census 2.6: Population by District, Rural- Urban, and Sex-Ratio 9 according to 2011 Census 2.7: Distribution of Main Workers by Category-wise 10 according to 2011 Census 2.8: Distribution of Main Workers, Marginal Workers and 11 Non-Workers according to 2011 Census 2.9: Altitude of Important Places in Nagaland 12 2.10: Distance of Important Routes in Nagaland from 13 Kohima
3. ECONOMY OF THE STATE 15 3.1: Gross State added by economic activity at current price 16 (2011-12 to 2019-20) 3.2: Gross State Value added by economic activity at constant 18 (2011-12) prices ( 2011-12 to 2019-20) 3.3: Net State Value Added by economic activity at current prices 20 (2011-12 to 2019-20) 3.4: Net State Value Added by economic activity at constant 22 (2011-12) prices (2011-12 to 2019-20)

4. AGRICULTURE 25 4.1: Area & Production of Principal Crops for the year 2017-18 26 4.2: Area & Production of Principal Crops for the year 2017-18 27 4.3: Area & Production of Principal Crops for the year 2017-18 28 4.4: Area & Production of Principal Crops for the year 2017-18 29 4.5: Area & Production of Principal Crops for the year 2018-19 30 4.6: Area & Production of Principal Crops for the year 2018-19 31 4.7: Area & Production of Principal Crops for the year 2018-19 32 4.8: Area & Production of Principal Crops for the year 2018-19 33 4.9: Consumption of Fertilizer and Pesticide 34 4.10: Area & Production of Principal Crops for the year 2019-20 35 4.11: Area & Production of Principal Crops for the year 2019-20 36 4.12: Area & Production of Principal Crops for the year 2019-20 37 4.13: Consumption of Fertilizer and Pesticide 38 4.14: Land Use Statistics (LUS) Report in respect of 39 Nagaland State during the Year 2016-17 to 2019-20 5. HORTICULTURE 41 5.1: Area & Production of Major Vegetables during 2016-17 42 5.2: Area & Production of Major Plantation Crops during 2016-17 45 5.3: Area & Production of Major Spices during 2016-17 (A=area in 46 hectare,P=production in mt) 5.4: Area & Production of Flowers during 2016-17 47 5.5: Area & Production of Major Fruits during 2017-18 48 5.6: Horticulture Data (HAPIS=Horticulture Area 50 Production Information System) 2017-18 Final 5.7: Horticulture Data (HAPIS )2017-18 Final 52 5.8: Horticulture Data (HAPIS) 2017-18 Final 55 5.9: Horticulture Data (HAPIS) 2017-18 Final 58 5.10: Horticulture Data (HAPIS )2017-18 Final 59 5.11: Horticulture Data (HAPIS) 2017-18 Final 60 5.12: Horticulture Data (HAPIS) 2018-19 Final 61 5.13: Horticulture Data (HAPIS) 2018-19 Final 63 5.14: Horticulture Data (HAPIS) 2018-19 Final 66 5.15: Horticulture Data (HAPIS) 2018-19 Final 68 5.16: Horticulture Data (HAPIS) 2018-19 Final 69 5:17 Horticulture Data (HAPIS) 2018-19 Final 71
6. SERICULTURE 73 6.1: Sericulture Statistics during 2018-19 74 6.2: Sericulture Statistics during 2019-20 75

7.6: Number of Veterinary Farms, Hospitals, 82 Dispensaries etc. during 2019-20 7.7: Performance of Veterinary Hospitals and 84 Dispensaries during 2019-20 7.8: Meat Production in Nagaland (‘000 mt) 2017-2020 85 7.9: Number of Animals Slaughtered in Nagaland 2017-2020 85 7.10: Milk and Egg Production in Nagaland 2013-2020 86 7.11: Veterinary Health Institutions 2019-20 (in numbers) 87 8. FOREST 89 8.1: District-wise Forest Cover in the State (Area in Km) 90 2018-19 8.2: District-wise Forest Cover in the State (Area in Km) 2019-20 91 8.3: Classification of Forest Areas (In Sq.Km) 2019-20 92 9. CLIMATE & RAINFALL 93 9.1: Rainfall and Temperature at Kohima Centre 94 during 2018-19 9.2: Annual Rainfall of Kohima during 2007-2019 95 9.3: District-wise Annual Average Mean Temperature (in °C) 96 from 2019 9.4: District-wise Average Annual Rainfall (in mm) from 2019 96 9.5: Station-wise Monthly Mean Temperature (in °C) 97 during 2019
10. FISHERY 99 10.1: District-wise Achievement of Fisheries Department 100 during 2018-19 10.2: District-wise Achievement of Fisheries Department 101 during 2019-20 10.3: Statistics on Fish Production (by Species) during 2018-19 102 10.4: Statistics on Fish Production (by Species) during 2019-20 102 10.5: Statistics on other Aquatic Animals Production during 102 2018-19
7. LIVESTOCK (VETERINARY) 77 7.1: Number of Livestock and Poultry as per 78 20th Livestock Census 7.2: Number of Livestock and Poultry as per 79 20th Livestock Census 7.3: Number of Livestock and Poultry as per 80 20th Livestock Census 7.4: Number of Livestock and Poultry as per 80 20th Livestock Census 7.5: Number of Livestock and Poultry as per 81 20th Livestock Census

11.3: Industrial Office/ Boards/ Emporiums/ 108 Training Centre as on 31.03.2020 11.4: Number of Trade-wise Entrepreneurs Memorandum (EM) 109 Part-II Registered (MSME) during 2018-19 11.5: Number of Trade-wise EM Part-II Registered 111 ( MSME) during 2019-20 11.6: Number of Trade-wise EM Part-II Registered 113 ( MSME) during 2018-19 11.7: Number of EM Part-II Registered 114 (MSME) and Employment Generated 2019-20 11.8: Farm of Citronella & Medicinal/ Aromatic Plants, 115 under Industries & Commerce Department as on 31.3.2018 11.9: Farm of Citronella & Medicinal/ Aromatic Plants, 115 under Industries & Commerce Department as on 31.3.2019 11.10:Farm of Citronella & Medicinal/ Aromatic Plants, 116 under Industries & Commerce Department as on 31.3.2020 11.11:District-wise Number of Beneficiaries under Prime Minister 117 Employment Generation Programme(PMEGP)2018-19 11.12:District-wise Number of Beneficiaries under 117 Prime Minister Employment Generation Programme (PMEGP) 2019-20 11.13:International Border Trade Centre/Special Economic Zone 118 under Industries Commerce as on 31.03.2018 11.14:International Border Trade Centre/Special Economic 118 Zone under Industries & Commerce as on 31.03.2019 11.15:International Border Trade Centre/Special Economic Zone 118 under Industries & Commerce as on 31.03.2020 11.16 :Micro, Small & Medium Enterprises (MSMEs 119 in Nagaland during the year 2019-20
10.6: Statistics on other Aquatic Animals Production during 103 2019-20 10.7: Statistics on State Fisheries Resources during 2018-19 103 10.8: Statistics on State Fisheries Resources during 2019-20 103 11. INDUSTRIES & COMMERCE 105 11.1: State Government Industrial Offices 2019-20 106 11.2: Industrial Office/ Boards/ Emporiums/ 107 Training Centre as on 31.03. 2019

13.2: District-wise Total Length of Road in Nagaland PWD 129 (R&B) during 2019-20 13.3: Details of National Highway in the State of 130 Nagaland 2017-18 13.4: Details of National Highway in the State of 131 Nagaland 2018-19 13.5: Details of National Highway in the State of 132 Nagaland 2019-20 13.6: Number of Motor Vehicles Registered 2018-19 133 13.7: Number of Motor Vehicles Registered 2019-20 134 13.8: State Transport Service in Nagaland 135 during 2017-18 & 2018-19 14. POST OFFICE 137 14.1: Number of Post Offices during 2017-18 138 14.2: Number of Post Offices during 2018-19 139
15. TOURISM 141 15.1: Year-wise Inflow of Tourist 142 15.2: Number of Hotels and Restaurants in Nagaland in the year 2020 142 15.3: Tourist Villages in Nagaland during 2018 143 15.4: Tourist Spot in Nagaland during 2020 144 15.5: Paying Guest/Homestay Accomodation during 2020 145
16. BANKING 147 16.1: District-wise Business and Credit Deposit Ratio 148 of Nagaland(Rs. in lakh) 2018-19 16.2: Bankwise Business and Credit Deposit Ratio of Nagaland 2019-20 149 16.3: District-wise distribution of Number of Banks in Nagaland, 2018 150 16.4: District-wise distribution of Number of Banks in Nagaland, 2019 152 16.5: District-wise distribution of Number of Banks in Nagaland, 2020 154
12. POWER & ELECTRICITY 121 12.1: Installed Capacity and Generation of Electricity during 122 2018-19 12.2: Division-wise details of SPM managed by UEMB & VEMB 123 during 2018-19 12.3: Category-wise number of Consumers and the 124 Percentage Consumption of each Category during 2018-19 12.4:Revenue Receipts (Within the State) In the 125 three Quarters of 2017-18 & 2018-19
13. TRANSPORT & COMMUNICATION 127 13.1: District-wise Total Length of Road in Nagaland PWD 128 (R&B) during 2018-19
18. HEALTH 169 18.1: Number of Hospital/C.H.C/P.H.C/S.H.C/Dispensary 170 during 2017-18 18.2: Number of Hospital/C.H.C/P.H.C/S.H.C/Dispensary 171 during 2018-19 18.3: District- wise Number of Medical Personnel-I 172 during 2017-18 18.4: District- wise Number of Medical Personnel-I 173 during 2018-19 18.5: Number of Medical Personnel-II 2018-19 174 18.6: Number of Beds in Hospital, PHC, CHC, SHC, Dispensary, 175 Mental & T.B. Hospital during 2017-18 18.7:Number of Beds in Hospital, PHC, CHC, SHC, Dispensary, 176 Mental & T.B. Hospital during 2018-19 18.8:Patients Treated in Hospitals and Dispensaries during 2018-19 177 18.9:Doctors with Designation (District-wise) 2017-18 178 18.10:Doctors with Designation (District-wise) 2018-19 178 18.11:Progress of Family Welfare Programme 180 during 2016-17 & 2017-18 18.12: Progress of Family Welfare Programme 2018-19 181 18:13: Number of Births, Deaths and Infant by Sex, Maternal Death 182 and Still Birth Registered during 2018 18.14: Vital Rates (Registered) by District during 2018 182 18.15: Live Births by Type of Attention at Delivery during 2018 183 18.16: Live Birth and Death by Religion during 2018 183 19. SCHOOL EDUCATION 185 19.1: Goverment Schools by Category (District-wise) 186 during 2017-18
17. CO-OPERATIVE 157 17.1: Total Number of Co-operative Societies (As on 28.02.2019) 158 17.2: Total Number of Co-operative Societies (As on 28.02.2020) 162 17.3: Financial Assistance given to Co-operative Societies 166 during 2018-19 17.4: Financial Assistance given to Co-operative Societies 167 during 2019-20 17.5: Release of Financial Assistance to Co-operative 168 Societies Under Integrated Co-operative Development Project (ICDP) During 2018-19 (in lakhs) 17.6: Release of Financial Assistance to Co-operative 168 Societies Under Integrated Co-operative Development Project (ICDP) During 2019-20(in lakhs)

19.6: Enrolment in Private School during 2016-17 & 2017-18 191 19.7: Gender Parity Index based on Enrolment in Government 191 School during 2016-17 & 2017-18 19.8: Goverment Schools by Category (District-wise) 192 during 2018-19 19.9: District-wise Enrolment by School Category 193 (All Management) during 2018-19 19.10: District-wise enrolment by school category 194 (Govt. only) during 2018-19 19.11:District-wise Teachers by School Category 195 (All Management) during 2018-19 19.12: District-wise Teachers by School Category 196 (Govt. only) durin 2018-19 19.13:Enrolment in Private School and Gender Parity Index 197 during 2017-18 & 2018-19
20. HIGHER EDUCATION 199 20.1:Number of Degree Educational Institutions and Students 200 Enrollment during 2015-16 to 2017-18 20.2: Number of Teaching and Non-Teaching Staff in Government 200 Colleges during 2015-16 to 2017-18 20.3: Result of Different Examinations (Degree) during 2016-17 201 20.4: Result of Different Examinations (Degree) during 2017-18 201 20.5: Number of Educational Institutions (Degree) 202 2015-16 to 2017-18 20.6: Higher Education at a glance during 2018-19 203 20.7: Results of Degree Exams 2018-19 (Private Colleges) 205 20.8: Classification of Enrolment 2018-19 (GOVT) 205 20.9: Enrolment of Private Secular College 2017-18 206 20.10: Total number of beneficiaries and Amount Utilized in 207 Various Scholarship Schemes During 2017-18
19.2: District-wise Enrolment by School Category 187 (All Management) during 2017-18) 19.3: District-wise Enrolment by School Category 188 (Govt. only) during 2017-18 19.4: District-wise Teachers by School Category 189 (All Management) during 2017-18 19.5: District-wise Teachers by School Category (Govt. only) 190 during 2017-18

21. RURAL DEVELOPMENT 209 21.1: Statement showing Expenditures under various 210 Rural Development Programmes(R.D.P)(Rs. in Lakh) 2017-18, 2018-19 21.2: Physical & Financial Achievement Report under 211 Pradham Mantri Awaas Yojana-Gramin (PMAY-G) during 31.3. 2017-18 (Provisional) 21.3: Physical & Financial Achievement Report under 212 Pradham Mantri Awaas Yojana-Gramin (PMAY-G) during 31.3.2018-19 (Provisional) 21.4: Annual Performance Report under the Mahatma 213 Gandhi National Rural Employment Guarantee Scheme (MGNREGS) during 2017-18 (Provisional) 21.5: Annual Performance Report under the Mahatma 214 Gandhi National Rural Employment Guarantee Scheme (MGNREGS) during 2018-19 (Provisional) 21.6: Annual Performance Report under the Mahatma 215 Gandhi National Rural Employment Guarantee Scheme (MGNREGS) during 2017-18 21.7: Annual Performance Report under the Mahatma 216 Gandhi National Rural Employment Guarantee Scheme (MGNREGS) during 2018-19 21.8: Financial and Physical Achievement Report under 217 Nagaland State Rural Livelihood Mission (NSRLM) 2017-18 (Audited) Audit Requisition No. 3 Annexure - II 21.9: Financial and Physical Achievement Report under 218 Nagaland State Rural Livelihood Mission (NSRLM) 2018-19 (Unaudited) 21.10: District-wise Fund Allocation under Grant-In-Aid 219 (GIA) to VDBs during 2017-18 21.11: District-wise Fund Allocation under Grant-in-Aid 220 (GIA) to VDBs during 2018-19 22. EMPLOYMENT 221 22.1: Distribution of State Government Employees by Nature 222 of Employment (as on 31st March 2018) 22.2: Distribution of State Government Employees by Gender 223 (as on 31st March 2018) 22.3: District-wise Distribution of State Government Employees 223 (as on 31st March 2018) 22.4: Department-wise and Class-wise distribution of State 224 Government Employees (as on 31st March 2018)

22.5: Number of Applicants on the Live Register of 226 Employment Exchanges according to Educational Qualification (as on 31st December) 2019 22.6: Number of Applicants on the Live Register of 227 Employment Exchanges according to Educational Qualification (as on 31st March) 2020 22.7: Number of Persons Placed through Employment Exchanges 228 according to Educational Qualification during 2019-20 22.8: Number of Trainees under-going Training in Industrial 229 Training Institutes (ITIs) 2017-20 22.9: Number of Trainees Passed out under the Craftsmen 230 Training Scheme 2019` 22.10: Number of Trainees Passed out under the Craftsmen 231 Training Scheme 2020
22.11: Number of Physically Handicapped Applicants 232 remaining on the Live Register of Employment Exchange (as on 31st December)2018 22.12: Number of Physically Handicapped Applicants remaining 232 on the Live Register of Employment Exchange (as on 31st December) 2019 22.13: Number of Applicants (Job Seekers) remaining on live 233 register (as on 30th Nov 2019)
23. PUBLIC FINANCE 235 23.1: Receipt and Expenditure of the Government (Rs. in lakhs) 236 23.2: Financial Statement of Receipt (Consolidated Fund) (Rs. in lakhs) 237 23.3: Financial Statement of Receipt (Consolidated Fund) (Rs. in lakhs) 238 23.4: Financial Statement of Receipt (Consolidated Fund) (Rs. in lakhs) 239 23.5: Financial Statement of Receipt (Consolidated Fund) (Rs. in lakhs) 240 23.6: Financial Statement of Receipt (Consolidated Fund)(Rs. in lakhs) 241 24. TAXES 243 24.1: Number of Registered Dealers as on 31st March 2019 244 24.2: Number of Registered Dealers as on 31st March 2020 245 24.3: Collection of Revenue Under Different Acts during 246 2018-19 (Rs. in Lakh) 24.4: Collection of Revenue Under Different Acts during 247 2019-20 (Rs. in Lakh)

25. EXCISE 249 25.1: Excise and Prohibition Activities 2018-20 250 26. PRICE 251 26.1: Consumer Price Index (CPI) Number of Nagaland 252 Sub-Groups during 2018 26.2: District-wise Average Retail Price of Essential 252 Commodities for the Year 2018 27. POLICE 255 27.1: Number of Police Stations and Outpost during the year 2018 256 (till June 2018) 27.2: Number of Police Stations and Outpost during the year 2018-19 257 27.3: Incident of Crime during the year 2018 (till June 2018) 258 27.4: Incident of Crime during the year 2018-19 259
28. FIRE & EMERGENCY 261 28.1: Number of Fire Incidents during 2018-19 262 28.2: Number of Fire Incidents during 2019-20 263 28.3: Number of Fire Station 2018-20 264
29. MISCELLANEOUS 265 29.1: Name of the Trade Unions registered by the Registrar 266 of Trade Unions’ Nagaland as on 1st April 2018 to 31st March 2019 29.2: Name of the Trade Unions registered by the Registrar 268 of Trade Unions’ Nagaland as on 31st March 2020 29.3: The Minimum Rate of Wages (in Rs.) under 57 Schedule 270 of Employment (as on 01.06.2018-31st march 2019) 29.4: The Minimum Rate of Wages under 57 Schedule 273 of Employment (as on 1st April 2019 to 31st March 2020) 29.5: Compounding Fees (in Rs.) realized by the Legal 276 Metrology & Consumer Protection Department during 2018-19 29.6: Annual Fees (in Rs.) realised by the Legal 276 Metrology & Consumer Protection Department 2019-20 29.7: Prosecution made by the Legal Metrology and Consumer 277 Protection Department during 2017-18 & 2018-19 29.8: Verification Fees (in Rs.) realized by the Legal 277 Metrology & Consumer Protection Department 2017-18 & 2018-19

29.9: Number of Village/ Habitation covered by 278 Drinking Water Supply and Population Covered 2018-19 29.10:Number of Village/ Habitation covered by Drinking 278 Water Supply and Population Covered 2019-20 29.11:Newspapers in Nagaland (as on 30th November 2019) 279 29.12:Social Security and Welfare Services in Nagaland 2019-20 280 29.13:District-wise Fair Price Shop Report during 2018-19 281 29.14:District-wise Fair Price Shop Report during 2019-20 281 29.15: Report on Disaster in Nagaland during April 2017 to March 2018 282 (Number of Incidents reported) 29.16: Report on Disaster in Nagaland during April 2018 to March 2019 283 (Number of Incidents reported) 29.17: Report on Disaster in Nagaland during April 2017 to March 2018 284 (Number of affected family) 29.18: Report on Disaster in Nagaland during April 2018 to March 2019 285 (Number of affected family) 29.19: Number of Jails during 2020 286 29.20: Elected Members of 13th Nagaland Legislative Assembly 287


GENERAL
1


1
SN Item Particulars1 2 3
A. Geographical Area & Location
Geographical area (sq. km.) 16,579
Longitude 93º.20’ E to 95º.15’ E
Latitude 25º.6’ N to 27º.4’ N
B. Administrative unita. District HQs 11
b. Circles (as per 2011 Census) (ADCs, SDOs & EACs) 133
c. Statutory towns (as per 2011 Census) 19
d. Census towns (as per 2011 Census) 7
e. Police station (2012) 61
f. Police outpost (2012) 28
C. Population as per 2011 Censusa. i. Total population 19,78,502
ii. Male 10,24,649
iii. Female 9,53,853
iv. Percentage of Rural population 71.14
v. Percentage of Urban population 28.86
vi. Sex ratio (female per 1000 males) 931
vii. Density of population (per sq. km) 119
viii. Decadal percentage variation (2001-2011) -0.58
b. Population of age group (0-6 years)
i. Male 1,49,785
ii. Female 1,41,286
iii. Total 2,91,071
iv. Sex ratio 943
c. Literacy rate
i. Male 82.75
ii. Female 76.11
iii. Literacy rate of Nagaland 79.55
Table No. 1.1: Area, Administrative unit and Population
NAGALAND AT A GLANCE


GEOGRAPHICAL &DEMOGRAPHIC PROFILE
2
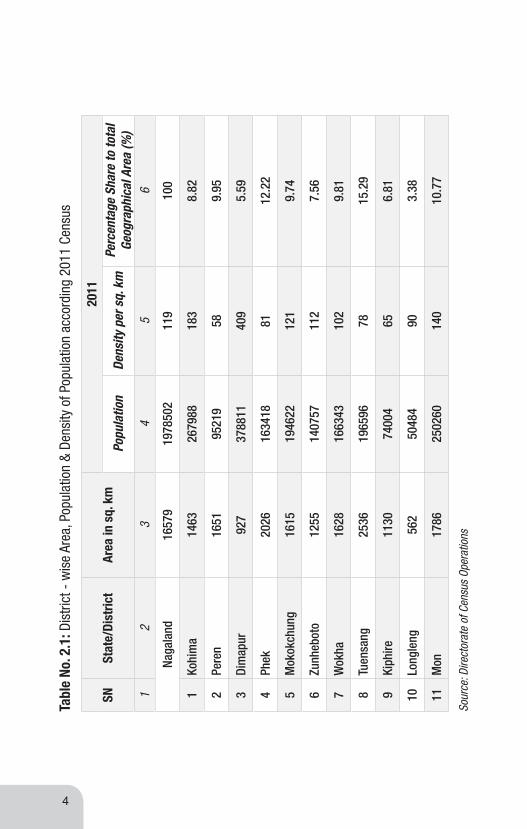
4
SNSt
ate/
Dist
rict
Area
in s
q. k
m20
11
Popu
latio
nDe
nsity
per
sq.
km
Perc
enta
ge S
hare
to to
tal
Geog
raph
ical
Are
a (%
)1
23
45
6
Naga
land
1657
919
7850
211
910
0
1Ko
him
a 14
6326
7988
183
8.82
2Pe
ren
1651
9521
958
9.95
3Di
map
ur
927
3788
1140
95.
59
4Ph
ek
2026
1634
1881
12.2
2
5M
okok
chun
g 16
1519
4622
121
9.74
6Zu
nheb
oto
1255
1407
5711
27.
56
7W
okha
16
2816
6343
102
9.81
8Tu
ensa
ng
2536
1965
9678
15.2
9
9Ki
phire
1130
7400
465
6.81
10Lo
ngle
ng56
250
484
903.
38
11M
on
1786
2502
6014
010
.77
Tabl
e No
. 2.1
: Dis
trict
- w
ise
Area
, Pop
ulat
ion
& De
nsity
of P
opul
atio
n ac
cord
ing
2011
Cen
sus
Sour
ce: D
irect
orat
e of
Cen
sus
Oper
atio
ns

5
Yea
r Pe
rson
De
cada
l Var
iatio
n %
Dec
adal
Var
iatio
n M
ale
Fem
ale
12
34
56
1901
1,01
,550
-
- 51
,473
50
,077
1911
1,49
,038
(+) 4
7488
(+) 4
6.76
74,7
96
74,2
42
1921
1,58
,801
(+) 9
763
(+) 6
.55
79,7
38
79,0
63
1931
1,78
,844
(+) 2
0043
(+) 1
2.62
89,5
36
89,3
08
1941
1,89
,641
(+) 1
0797
(+) 6
.04
93,8
31
95,8
10
1951
2,12
,975
(+) 2
3334
(+) 1
2.30
1,06
,551
1,06
,424
1961
3,69
,200
(+) 1
5622
5(+
) 73.
5519
1,02
7 1,
78,1
73
1971
5,16
,449
(+) 1
4724
9(+
) 39.
8827
6,08
4 2,
40,3
65
1981
7,74
,930
(+) 2
5848
1(+
) 50.
054,
15,9
103,
59,0
20
1991
12,0
9,54
6(+
) 434
616
(+) 5
6.08
6,41
,282
5,68
,264
2001
19,9
0,03
6(+
) 780
490
(+) 6
4.53
10,4
7,14
19,
42,8
95
2011
19,7
8,50
2(-
) 115
34(-
) 0.5
81,
024,
649
9,53
,853
Tabl
e No
. 2.2
: Pop
ulat
ion
Tren
d in
Nag
alan
d fro
m 1
901
to 2
011
Sour
ce: D
irect
orat
e of
Cen
sus
Oper
atio
ns

6
SNSt
ate/
Dis
tric
t To
tal
Popu
latio
nLi
tera
te P
opul
atio
nLi
tera
cy R
ate
(%)
Pers
onM
ale
Fem
ale
Pers
onM
ale
Fem
ale
Pers
onM
ale
Fem
ale
12
34
56
78
910
11
Naga
land
19
,78,
502
10,2
4,64
99,
53,8
5313
,42,
434
7,23
,957
6,18
,477
79.5
582
.75
76.1
1
1Ko
him
a 2,
67,9
881,
38,9
661,
29,0
221,
97,4
891,
07,0
3890
,451
85.2
388
.69
81.4
8
2Di
map
ur
3,78
,811
1,97
,394
1,81
,417
2,78
,037
1,50
,142
1,27
,895
84.7
987
.54
81.7
7
3Ph
ek
1,63
,418
83,7
4379
,675
1,05
,893
57,9
2647
,967
78.0
583
.66
72.2
1
4M
okok
chun
g1,
94,6
221,
01,0
9293
,530
1,59
,494
83,4
7976
,015
91.6
292
.18
91.0
1
5W
okha
1,
66,3
4384
,505
81,8
381,
28,2
0867
,385
60,8
2387
.69
90.8
184
.48
6Zu
nheb
oto
1,40
,757
71,2
1769
,540
1,02
,881
53,5
0449
,377
85.2
687
.85
82.6
2
7Tu
ensa
ng
1,96
,596
1,01
,933
94,6
631,
17,5
1163
,653
5385
873
.08
76.3
169
.59
8M
on2,
50,2
601,
31,7
531,
18,5
071,
19,6
2667
,432
52,1
9456
.99
60.9
452
.58
9Pe
ren
95,2
1949
,714
45,5
0562
,204
34,5
8427
,620
77.9
582
.84
72.5
8
10Ki
phire
74,0
0437
,830
36,1
7441
,232
22,6
7518
,557
69.5
474
.88
63.9
7
11Lo
ngle
ng50
,484
26,5
0223
,982
29,8
5916
,139
13,7
2072
.17
74.4
869
.63
Tabl
e No
. 2.3
: Dis
trict
-wis
e Li
tera
te P
opul
atio
n an
d Li
tera
cy R
ate
in N
agal
and
acco
rdin
g to
201
1 Ce
nsus
Sour
ce: D
irect
orat
e of
Cen
sus
Oper
atio
ns

7
Sour
ce: D
irect
orat
e of
Cen
sus
Oper
atio
ns
SNSt
ate/
Dis
tric
t To
tal P
opul
atio
nTo
tal W
orke
rsTo
tal N
on-W
orke
rs
Pers
onM
ale
Fem
ale
Pers
onM
ale
Fem
ale
Pers
onM
ale
Fem
ale
12
34
56
78
910
11
Naga
land
19
,78,
502
10,2
4,64
99,
53,8
539,
74,1
225,
47,3
574,
26,7
6510
,04,
380
4,77
,292
5,27
,088
1Ko
him
a 2,
67,9
881,
38,9
661,
29,0
221,
14,8
2568
,140
46,6
851,
53,1
6370
,826
82,3
37
2Di
map
ur
3,78
,811
1,97
,394
1,81
,417
1,51
,350
99,6
4551
,705
2,27
,461
97,7
491,
29,7
12
3Ph
ek
1,63
,418
83,7
4379
,675
80,2
7741
,556
38,7
2183
,141
42,1
8740
,954
4M
okok
chun
g1,
94,6
221,
01,0
9293
,530
1,00
,067
57,0
8442
,983
94,5
5544
,008
50,5
47
5W
okha
1,
66,3
4384
,505
81,8
3878
,412
42,0
9636
,316
87,9
3142
,409
45,5
22
6Zu
nheb
oto
1,40
,757
71,2
1769
,540
79,4
6641
,178
38,2
8861
,291
30,0
3931
,252
7Tu
ensa
ng
1,96
,596
1,01
,933
94,6
6398
,154
52,9
3145
,223
98,4
4249
,002
49,4
40
8M
on2,
50,2
601,
31,7
531,
18,5
071,
47,6
5479
,425
68,2
291,
02,6
0652
,328
50,2
78
9Pe
ren
95,2
1949
,714
45,5
0561
,390
32,2
4929
,141
33,8
2917
,465
16,3
64
10Ki
phire
74,0
0437
,830
36,1
7431
,959
16,7
8015
,179
42,0
4521
,050
20,9
95
11Lo
ngle
ng50
,484
26,5
0223
,982
30,5
6816
,273
14,2
9519
,916
10,2
299,
687
Tabl
e No
. 2.4
: Dis
tribu
tion
of W
orke
rs a
nd N
on-W
orke
rs a
ccor
ding
to 2
011
Cens
us

8
SNSt
ate/
Dis
tric
t To
tal
Popu
latio
nCh
ild P
opul
atio
n (A
ge G
roup
0-6
)Po
pula
tion
(Age
7 a
nd a
bove
)
Pers
onM
ale
Fem
ale
Pers
onM
ale
Fem
ale
Pers
onM
ale
Fem
ale
11
23
45
67
89
10
Naga
land
19
,78,
502
10,2
4,64
99,
53,8
532,
91,0
711,
49,7
851,
41,2
8616
,87,
431
8,74
,864
8,12
,567
1Ko
him
a 2,
67,9
881,
38,9
661,
29,0
2236
,286
18,2
7918
,007
2,31
,702
1,20
,687
1,11
,015
2Di
map
ur
3,78
,811
1,97
,394
1,81
,417
50,8
9825
,889
25,0
093,
27,9
131,
71,5
051,
56,4
08
3Ph
ek
1,63
,418
83,7
4379
,675
27,7
5214
,505
13,2
471,
35,6
6669
,238
66,4
28
4M
okok
chun
g1,
94,6
221,
01,0
9293
,530
20,5
3610
,534
10,0
021,
74,0
8690
,558
83,5
28
5W
okha
1,
66,3
4384
,505
81,8
3820
,138
10,2
989,
840
1,46
,205
74,
207
71,
998
6Zu
nheb
oto
1,40
,757
71,2
1769
,540
20,0
9310
,316
9,77
71,
20,6
64 6
0,90
1 5
9,76
3
7Tu
ensa
ng
1,96
,596
1,01
,933
94,6
6335
,790
18,5
1617
,274
1,6
0,80
6 8
3,41
7 7
7,38
9
8M
on2,
50,2
601,
31,7
531,
18,5
0740
,342
21,0
9919
,243
2,09
,918
1,1
0,65
4 9
9,26
4
9Pe
ren
95,2
1949
,714
45,5
0515
,415
7,96
77,
448
79,8
0441
,747
38,
057
10Ki
phire
74,0
0437
,830
36,1
7414
,711
7,55
07,
161
59,2
9330
,280
29,0
13
11Lo
ngle
ng50
,484
26,5
0223
,982
9,11
04,
832
4,27
841
,374
21,6
7019
,704
Tabl
e No
. 2.5
: Dis
trict
-wis
e Ch
ild P
opul
atio
n 0-
6 Ag
e Gr
oup
and
Popu
latio
n of
Age
7 a
nd a
bove
acc
ordi
ng to
201
1 Ce
nsus
Sour
ce: D
irect
orat
e of
Cen
sus
Oper
atio
ns
9
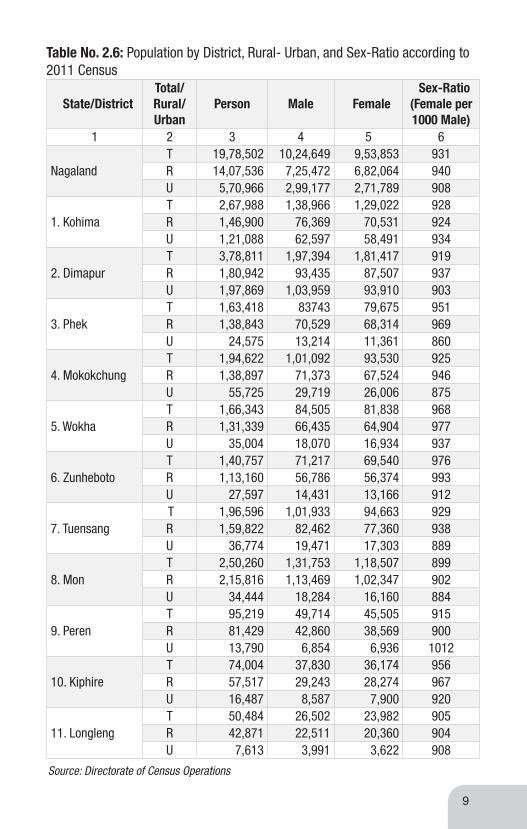
State/DistrictTotal/Rural/Urban
Person Male Female Sex-Ratio (Female per 1000 Male)
1 2 3 4 5 6
Nagaland T 19,78,502 10,24,649 9,53,853 931R 14,07,536 7,25,472 6,82,064 940U 5,70,966 2,99,177 2,71,789 908
1. Kohima T 2,67,988 1,38,966 1,29,022 928R 1,46,900 76,369 70,531 924U 1,21,088 62,597 58,491 934
2. DimapurT 3,78,811 1,97,394 1,81,417 919R 1,80,942 93,435 87,507 937U 1,97,869 1,03,959 93,910 903
3. Phek T 1,63,418 83743 79,675 951R 1,38,843 70,529 68,314 969U 24,575 13,214 11,361 860
4. Mokokchung T 1,94,622 1,01,092 93,530 925R 1,38,897 71,373 67,524 946U 55,725 29,719 26,006 875
5. Wokha T 1,66,343 84,505 81,838 968R 1,31,339 66,435 64,904 977U 35,004 18,070 16,934 937
6. ZunhebotoT 1,40,757 71,217 69,540 976R 1,13,160 56,786 56,374 993U 27,597 14,431 13,166 912
7. Tuensang T 1,96,596 1,01,933 94,663 929R 1,59,822 82,462 77,360 938U 36,774 19,471 17,303 889
8. Mon T 2,50,260 1,31,753 1,18,507 899R 2,15,816 1,13,469 1,02,347 902U 34,444 18,284 16,160 884
9. Peren T 95,219 49,714 45,505 915R 81,429 42,860 38,569 900U 13,790 6,854 6,936 1012
10. KiphireT 74,004 37,830 36,174 956R 57,517 29,243 28,274 967U 16,487 8,587 7,900 920
11. LonglengT 50,484 26,502 23,982 905R 42,871 22,511 20,360 904U 7,613 3,991 3,622 908
Table No. 2.6: Population by District, Rural- Urban, and Sex-Ratio according to 2011 Census
Source: Directorate of Census Operations

10
SNSt
ate/
Dist
rict
Culti
vato
rsAg
ricul
tura
l Lab
oure
rsW
orke
rs in
hou
seho
ld
Indu
strie
sOt
her w
orke
rsGr
and
Tota
l
Pers
onM
ale
Fem
ale
Pers
onM
ale
Fem
ale
Pers
onM
ale
Fem
ale
Pers
onM
ale
Fem
ale
Pers
onM
ale
Fem
ale
12
34
56
78
910
1112
1314
1516
17
Naga
land
4,
20,3
792,
08,2
212,
12,1
5822
,571
12,8
999,
672
9,52
54,
731
4,79
42,
88,7
042,
16,3
5372
,351
7,41
,179
4,42
,204
2,98
,975
1Ko
him
a 38
,017
16,5
2521
,492
911
507
404
1,13
162
250
959
,349
43,1
8516
,164
99,4
0860
,839
38,5
69
2Di
map
ur
20,5
9112
,140
8,45
14,
506
2,74
31,
763
2,33
81,
190
1,14
894
,923
71,9
8222
,941
1,22
,358
88,0
5534
,303
3Ph
ek
44,0
6919
,982
24,0
871,
311
692
619
609
303
306
17,6
5613
,405
4,25
163
,645
34,3
8229
,263
4M
okok
chun
g42
,236
21,9
4020
,296
4,86
33,
013
1,85
01,
939
777
w,1
6232
,008
22,6
259,
383
81,0
4648
,355
32,6
91
5W
okha
41
,862
20,2
3321
,629
2,37
51,
298
1,07
787
440
946
518
,401
13,7
524,
649
63,5
1235
,692
27,8
20
6Zu
nheb
oto
30,7
3814
,787
15,9
511,
763
858
905
613
308
305
16,2
6811
,923
4,34
549
,382
27,8
7621
,506
7Tu
ensa
ng
57,4
7928
,758
28,7
2194
555
738
854
131
322
814
,553
11,7
922,
761
73,5
1841
,420
32,0
98
8M
on84
,402
43,4
6340
,939
3,94
72,
111
1,83
660
937
023
916
,023
12,7
513,
272
1,04
,981
58,6
9546
,286
9Pe
ren
25,6
9813
,465
12,2
331,
232
745
487
349
175
174
9,27
66,
777
2,49
936
,555
21,1
6215
,393
10Ki
phire
18,4
508,
513
9,93
744
021
122
932
314
617
76,
617
5,31
11,
306
25,8
3014
,181
11,6
49
11Lo
ngle
ng16
,837
8,41
58,
422
278
164
114
199
118
813,
630
2,85
078
020
,944
11,5
479,
397
Tabl
e No
. 2.7
: Dis
tribu
tion
of M
ain
Wor
kers
by
Cate
gory
-wis
e ac
cord
ing
to 2
011
Cens
us
Sour
ce: D
irect
orat
e of
Cen
sus
Oper
atio
ns
11
Sour
ce: D
irect
orat
e of
Cen
sus
Oper
atio
ns
SNSt
ate/
Dis
tric
t M
ain
Wor
kers
Mar
gina
l Wor
kers
Non-
Wor
kers
Pers
onM
ale
Fem
ale
Pers
onM
ale
Fem
ale
Pers
onM
ale
Fem
ale
12
34
56
78
910
11
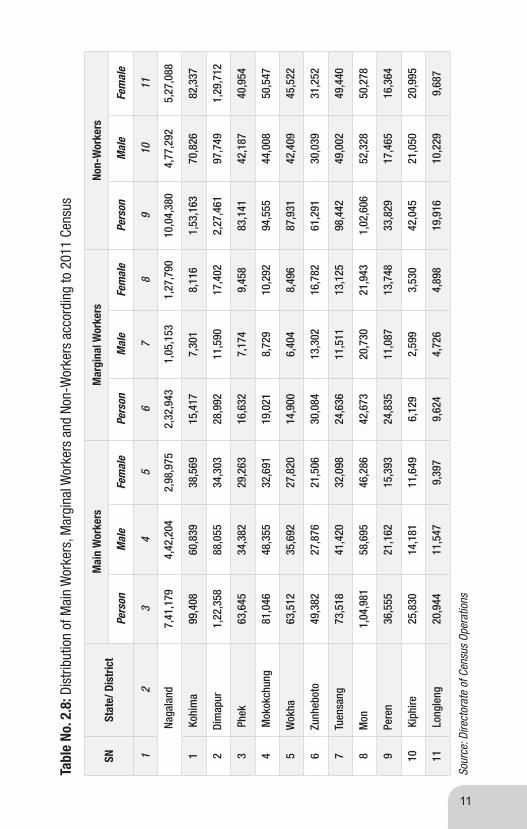
Nag
alan
d 7,
41,1
794,
42,2
042,
98,9
752,
32,9
431,
05,1
531,
27,7
9010
,04,
380
4,77
,292
5,27
,088
1 K
ohim
a 99
,408
60,8
3938
,569
15,4
177,
301
8,11
61,
53,1
6370
,826
82,3
37
2Di
map
ur
1,22
,358
88,0
5534
,303
28,9
9211
,590
17,4
022,
27,4
6197
,749
1,29
,712
3 P
hek
63,6
4534
,382
29,2
6316
,632
7,17
49,
458
83,1
4142
,187
40,9
54
4 M
okok
chun
g81
,046
48,3
5532
,691
19,0
218,
729
10,2
9294
,555
44,0
0850
,547
5W
okha
63
,512
35,6
9227
,820
14,9
006,
404
8,49
687
,931
42,4
0945
,522
6Zu
nheb
oto
49,3
8227
,876
21,5
0630
,084
13,3
0216
,782
61,2
9130
,039
31,2
52
7Tu
ensa
ng
73,5
1841
,420
32,0
9824
,636
11,5
1113
,125
98,4
4249
,002
49,4
40
8M
on1,
04,9
8158
,695
46,2
8642
,673
20,7
3021
,943
1,02
,606
52,3
2850
,278
9Pe
ren
36,5
5521
,162
15,3
9324
,835
11,0
8713
,748
33,8
2917
,465
16,3
64
10 K
iphi
re25
,830
14,1
8111
,649
6,12
92,
599
3,53
042
,045
21,0
5020
,995
11 L
ongl
eng
20,9
4411
,547
9,39
79,
624
4,72
64,
898
19,9
1610
,229
9,68
7
Tabl
e No
. 2.8
: Dis
tribu
tion
of M
ain
Wor
kers
, Mar
gina
l Wor
kers
and
Non
-Wor
kers
acc
ordi
ng to
201
1 Ce
nsus
12
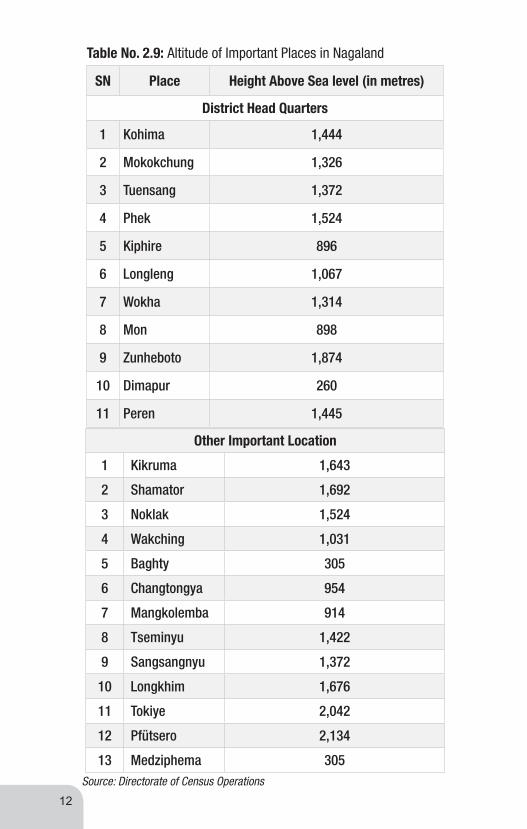
Table No. 2.9: Altitude of Important Places in Nagaland
SN Place Height Above Sea level (in metres)
District Head Quarters
1 Kohima 1,444
2 Mokokchung 1,326
3 Tuensang 1,372
4 Phek 1,524
5 Kiphire 896
6 Longleng 1,067
7 Wokha 1,314
8 Mon 898
9 Zunheboto 1,874
10 Dimapur 260
11 Peren 1,445
Other Important Location
1 Kikruma 1,643
2 Shamator 1,692
3 Noklak 1,524
4 Wakching 1,031
5 Baghty 305
6 Changtongya 954
7 Mangkolemba 914
8 Tseminyu 1,422
9 Sangsangnyu 1,372
10 Longkhim 1,676
11 Tokiye 2,042
12 Pfütsero 2,134
13 Medziphema 305Source: Directorate of Census Operations
13
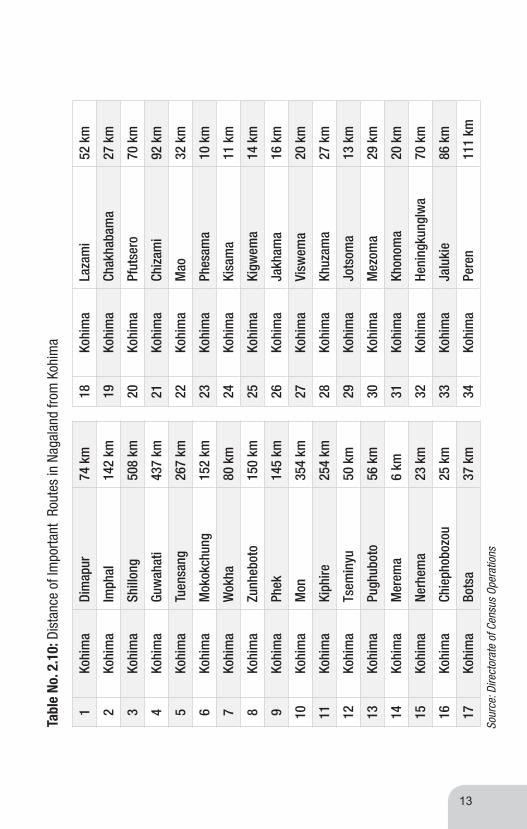
Tabl
e No
. 2.1
0: D
ista
nce
of Im
porta
nt R
oute
s in
Nag
alan
d fro
m K
ohim
a
1Ko
him
a Di
map
ur
74 k
m
2Ko
him
a Im
phal
14
2 km
3Ko
him
a Sh
illon
g 50
8 km
4Ko
him
a Gu
wah
ati
437
km
5Ko
him
a Tu
ensa
ng
267
km
6Ko
him
aM
okok
chun
g 15
2 km
7Ko
him
a W
okha
80
km
8Ko
him
a Zu
nheb
oto
150
km
9Ko
him
a Ph
ek
145
km
10Ko
him
a M
on
354
km
11Ko
him
a Ki
phire
25
4 km
12Ko
him
a Ts
emin
yu
50 k
m
13Ko
him
a Pu
ghub
oto
56 k
m
14Ko
him
a M
erem
a 6
km
15Ko
him
a Ne
rhem
a 23
km
16Ko
him
a Ch
ieph
oboz
ou
25 k
m
17Ko
him
a Bo
tsa
37 k
m
18Ko
him
a La
zam
i 52
km
19Ko
him
a Ch
akha
bam
a27
km
20Ko
him
a Pf
utse
ro
70 k
m
21Ko
him
a Ch
izam
i 92
km
22Ko
him
aM
ao32
km
23Ko
him
aPh
esam
a10
km
24Ko
him
aKi
sam
a11
km
25Ko
him
aKi
gwem
a14
km
26Ko
him
aJa
kham
a16
km
27Ko
him
aVi
swem
a20
km
28Ko
him
aKh
uzam
a27
km
29Ko
him
aJo
tsom
a13
km
30Ko
him
aM
ezom
a29
km
31Ko
him
aKh
onom
a20
km
32Ko
him
aHe
ning
kung
lwa
70 k
m
33Ko
him
aJa
luki
e86
km
34Ko
him
aPe
ren
111
km
Sour
ce: D
irect
orat
e of
Cen
sus
Oper
atio
ns


ECONOMY OF THE STATE
3

16
S.N
Item
2011
-12
2012
-13
2013
-14
2014
-15
2015
-16
2016
-17
2017
-18
2018
-19
(P)
2019
-20
(A.E
)1.
Agric
ultu
re, f
ores
try a
nd fi
shin
g37
3363
4553
2055
6609
6185
2559
6987
6942
8276
4499
8046
2685
9146
1.1
Crop
s20
4304
2624
7834
0577
3801
9540
5510
4398
1448
5886
4717
4348
6509
1.2
Live
stoc
k83
147
1023
6111
5312
1238
9671
416
7157
694
484
1143
4511
9673
1.3
Fore
stry
and
logg
ing
7956
983
502
9302
910
5964
1108
1317
2533
1730
2820
6886
2402
631.
4Fi
shin
g an
d aq
uacu
lture
6344
6978
7690
8470
9248
1036
011
102
1165
212
700
2.
Min
ing
and
quar
ryin
g56
6066
2180
0583
9815
900
4692
6007
1037
811
312
Prim
ary
3790
2246
1941
5646
1462
6923
6128
8869
8975
7705
0681
5004
8704
583.
M
anuf
actu
ring
1512
219
400
1683
124
062
2643
230
403
3185
934
526
4152
44
Elec
trici
ty, g
as, w
ater
sup
ply
& ot
her u
tility
ser
vice
s29
545
3379
534
633
3836
336
165
3950
551
649
5727
064
662
4.1
Elec
trici
ty, g
as &
oth
er u
tility
ser
vice
s19
024
2269
722
765
2558
922
933
2537
035
300
3650
743
348
4.2
wat
er s
uppl
y 10
521
1109
811
868
1277
413
232
1413
516
349
2076
321
314
5.
Cons
truct
ion
1051
3511
3744
1178
6213
5297
1578
6518
1176
2163
2329
5991
3285
50Se
cond
ary
1498
0316
6939
1693
2619
7722
2204
6225
1084
2998
3138
7786
4347
366.
Tr
ade,
repa
ir, h
otel
s an
d re
stau
rant
s10
5152
1245
0612
9374
1486
1517
6008
1994
3124
0987
2829
8232
4065
6.1
Trad
e &
repa
ir se
rvic
es10
0064
1187
9512
3498
1424
3916
9266
1918
9323
2646
2736
4931
4220
6.2
Hote
ls &
rest
aura
nts
5088
5711
5876
6176
6742
7537
8341
9333
9845
7.
Tran
spor
t, st
orag
e, c
omm
unic
atio
n &
serv
ices
rela
ted
to b
road
cast
ing
5781
863
550
7119
082
645
9298
810
1065
1084
0212
0246
1313
987.
1Ra
ilway
s37
845
228
536
242
135
436
339
941
97.
2Tr
ansp
ort b
y m
eans
oth
er th
an R
ailw
ay34
328
3888
136
398
4429
247
371
5570
362
474
7096
977
215
7.2.
1Ro
ad tr
ansp
ort
3207
236
447
3441
741
302
4574
950
464
5712
965
121
7072
27.
2.2
Wat
er tr
ansp
ort
1319
690
466
569
606
717
591
841
718
Tabl
e No
.3.1
: Gro
ss S
tate
Val
ue A
dded
by
econ
omic
act
ivity
at c
urre
nt p
rices
(201
1-12
to 2
019-
20)
As o
n 31
st A
ugus
t 202
0(R
s. in
lakh
)

17
7.2.
3Ai
r tra
nspo
rt93
717
4415
1524
2010
1612
1213
6595
714
467.
2.4
Serv
ices
inci
dent
al to
tran
spor
t33
1033
8840
5043
307.
3St
orag
e63
9780
9797
118
6926
929
47.
4Co
mm
unic
atio
n &
serv
ices
rela
ted
to b
road
cast
ing
2304
924
120
3442
737
894
4509
944
890
4549
648
609
5347
08.
Fi
nanc
ial s
ervi
ces
4770
153
134
5707
951
073
5436
953
975
6102
065
743
6982
69.
Re
al e
stat
e, o
wne
rshi
p of
dw
ellin
g &
prof
essi
onal
ser
vice
s12
9296
1391
4614
7986
1568
2415
5184
1606
0416
6222
1741
6518
1741
10.
Pu
blic
adm
inis
tratio
n18
2188
1955
7526
4724
3080
2135
2888
3763
9841
5226
5158
3060
2633
11.
Ot
her s
ervi
ces
1556
9619
6428
2377
6825
2571
2624
4528
3076
3137
8139
8776
4386
54Te
rtiar
y67
7851
7723
3990
8121
9997
4910
9388
311
7454
813
0563
715
5774
217
4831
712
.TO
TAL
GSVA
at b
asic
pric
es12
0667
614
0121
916
4206
218
2439
419
2723
321
2460
723
7597
427
6053
330
5351
213
.Pr
oduc
t tax
es38
290
4459
650
411
5304
960
279
7006
184
054
1010
9611
3228
14.
Prod
uct S
ubsi
dies
2729
033
688
3130
037
376
3511
722
423
2073
240
968
4326
115
.Gr
oss
Stat
e Do
mes
tic P
rodu
ct12
1767
614
1212
716
6117
318
4006
719
5239
521
7224
524
3929
628
2066
131
2347
816
.Po
pula
tion
(‘00)
1991
020
120
2034
020
550
2077
020
990
2122
021
440
2167
017
.Pe
r Cap
ita G
SDP
(Rs.
)61
159
7018
581
670
8954
194
001
1034
9011
4953
1315
6114
4138
Sour
ce: D
irect
orat
e of
Eco
nom
ics
and
Sta
tistic
s
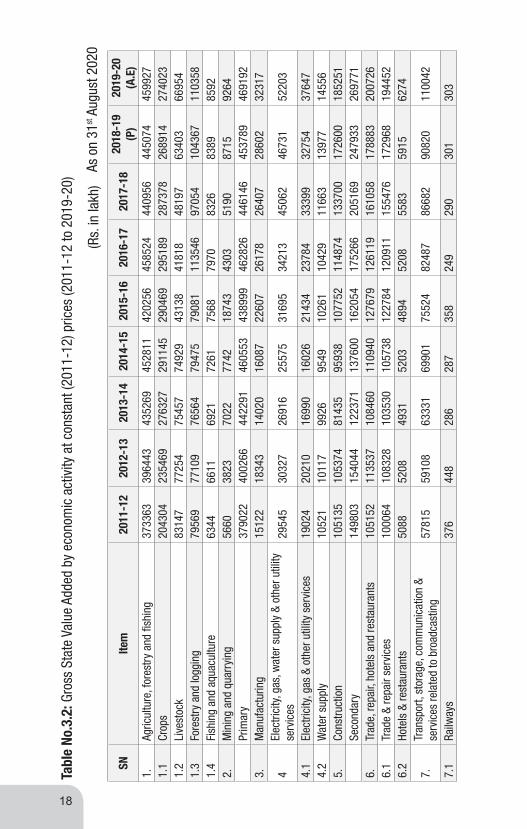
18
SNIte
m20
11-1
220
12-1
320
13-1
420
14-1
520
15-1
620
16-1
7 20
17-1
820
18-1
9 (P
)20
19-2
0 (A
.E)
1.Ag
ricul
ture
, for
estry
and
fish
ing
3733
6339
6443
4352
6945
2811
4202
5645
8524
4409
5644
5074
4599
271.
1Cr
ops
2043
0423
5469
2763
2729
1145
2904
6929
5189
2873
7826
8914
2740
231.
2Li
vest
ock
8314
777
254
7545
774
929
4313
841
818
4819
763
403
6695
41.
3Fo
rest
ry a
nd lo
ggin
g79
569
7710
976
564
7947
579
081
1135
4697
054
1043
6711
0358
1.4
Fish
ing
and
aqua
cultu
re63
4466
1169
2172
6175
6879
7083
2683
8985
922.
M
inin
g an
d qu
arry
ing
5660
3823
7022
7742
1874
343
0351
9087
1592
64Pr
imar
y37
9022
4002
6644
2291
4605
5343
8999
4628
2644
6146
4537
8946
9192
3.
Man
ufac
turin
g15
122
1834
314
020
1608
722
607
2617
826
407
2860
232
317
4El
ectri
city
, gas
, wat
er s
uppl
y &
othe
r util
ity
serv
ices
2954
530
327
2691
625
575
3169
534
213
4506
246
731
5220
3
4.1
Elec
trici
ty, g
as &
oth
er u
tility
ser
vice
s19
024
2021
016
990
1602
621
434
2378
433
399
3275
437
647
4.2
Wat
er s
uppl
y10
521
1011
799
2695
4910
261
1042
911
663
1397
714
556
5.
Cons
truct
ion
1051
3510
5374
8143
595
938
1077
5211
4874
1337
0017
2600
1852
51Se
cond
ary
1498
0315
4044
1223
7113
7600
1620
5417
5266
2051
6924
7933
2697
716.
Tr
ade,
repa
ir, h
otel
s an
d re
stau
rant
s10
5152
1135
3710
8460
1109
4012
7679
1261
1916
1058
1788
8320
0726
6.1
Trad
e &
repa
ir se
rvic
es10
0064
1083
2810
3530
1057
3812
2784
1209
1115
5476
1729
6819
4452
6.2
Hote
ls &
rest
aura
nts
5088
5208
4931
5203
4894
5208
5583
5915
6274
7.
Tran
spor
t, st
orag
e, c
omm
unic
atio
n &
serv
ices
rela
ted
to b
road
cast
ing
5781
559
108
6333
169
901
7552
482
487
8668
290
820
1100
42
7.1
Railw
ays
376
448
286
287
358
249
290
301
303
Tabl
e No
.3.2
: Gro
ss S
tate
Val
ue A
dded
by
econ
omic
act
ivity
at c
onst
ant (
2011
-12)
pric
es (2
011-
12 to
201
9-20
) As o
n 31
st A
ugus
t 202
0(R
s. in
lakh
)

19
7.2
Tran
spor
t by
mea
ns o
ther
than
Rai
lway
3432
836
071
3292
137
803
3658
545
674
4999
453
682
7039
87.
2.1
Road
tran
spor
t32
072
3381
331
198
3524
735
230
4134
345
718
4925
965
515
7.2.
2W
ater
tran
spor
t13
1964
040
648
750
658
947
363
657
37.
2.3
Air t
rans
port
937
1618
1317
2069
849
993
1092
723
1200
7.2.
4Se
rvic
es in
cide
ntal
to tr
ansp
ort
00
00
027
4927
1230
6331
117.
3St
orag
e63
9069
7681
9749
181
192
7.4
Com
mun
icat
ion
& se
rvic
es re
late
d to
br
oadc
astin
g23
049
2249
830
054
3173
538
500
3646
736
349
3665
639
149
8.
Fina
ncia
l ser
vice
s47
701
5207
852
249
5522
350
390
5015
352
731
5357
254
429
9.
Real
est
ate,
ow
ners
hip
of d
wel
ling
& pr
ofes
sion
al s
ervi
ces
1292
9613
9106
1319
5513
2884
1252
1312
2634
1222
6912
3271
1242
81
10.
Pu
blic
adm
inis
tratio
n18
2188
1782
8223
9851
2526
4226
8658
2849
3529
2805
3437
5139
1045
11.
Ot
her s
ervi
ces
1556
9618
0282
2022
3520
9979
1962
7222
0672
2239
2925
9332
2808
20Te
rtiar
y67
7849
7223
9279
8081
8315
6984
3736
8869
9993
9473
1049
629
1161
345
12.
TOTA
L GS
VA a
t bas
ic p
rices
1206
674
1276
703
1362
743
1429
722
1444
790
1525
091
1590
788
1751
351
1900
308
13.
Prod
uct t
axes
3829
041
238
4356
534
095
5092
958
683
7061
176
868
7828
914
.Pr
oduc
t Sub
sidi
es27
290
3115
127
049
2394
029
670
1878
217
416
3115
031
644
15.
Gros
s St
ate
Dom
estic
Pro
duct
1217
674
1286
790
1379
259
1439
877
1466
049
1564
992
1643
983
1797
069
1946
952
16.
Popu
latio
n (‘0
0)19
910
2012
020
340
2055
020
770
2099
021
220
2144
021
670
17.
Per C
apita
GSD
P (R
s.)
6115
963
956
6781
070
067
7058
574
559
7747
383
818
8984
6
Sour
ce: D
irect
orat
e of
Eco
nom
ics
and
Sta
tistic
s

20
S.No
.Ite
m20
11-1
220
12-1
320
13-1
420
14-1
520
15-1
620
16-1
7 20
17-1
820
18-1
9 (P
)20
19-2
0 (A
.E)
1.Ag
ricul
ture
, for
estry
and
fish
ing
3277
6940
2422
4939
0154
7887
5210
7961
1664
6756
8070
8937
7634
57
1.1
Crop
s16
1408
2126
0728
1237
3129
2533
2336
3602
2040
0530
3798
9739
4663
1.2
Live
stoc
k82
067
1010
5211
3790
1223
7070
546
7074
593
477
1131
7011
8498
1.3
Fore
stry
and
logg
ing
7869
682
568
9199
410
4919
1097
7717
1181
1713
8220
5077
2384
54
1.4
Fish
ing
and
aqua
cultu
re55
9861
9568
7976
7384
2095
1910
292
1079
311
841
2.
Min
ing
and
quar
ryin
g49
7758
0968
6857
6213
360
4038
5108
8817
9751
Prim
ary
3327
4540
8231
5007
6955
3649
5344
4061
5703
6807
8871
7754
7732
08
3.
Man
ufac
turin
g11
153
1476
611
997
1884
021
170
2528
526
501
2866
235
660
4.
Elec
trici
ty, g
as, w
ater
sup
ply
& ot
her u
tility
ser
vice
s21
463
2519
922
920
2507
824
354
2631
537
283
4136
148
753
5.
Cons
truct
ion
9994
810
7747
1107
3212
7347
1484
7217
0050
2050
2527
6746
3093
05
Seco
ndar
y13
2564
1477
1314
5649
1712
6519
3996
2216
5026
8809
3467
6839
3718
6.
Trad
e, re
pair,
hot
els
and
rest
aura
nts
1035
5812
2547
1270
6914
6053
1712
5519
4028
2347
1627
5645
3167
28
6.1
Trad
e &
repa
ir se
rvic
es98
933
1173
5612
1696
1404
1516
5398
1874
6622
7465
2675
2730
8098
6.2
Hote
ls &
rest
aura
nts
4625
5191
5373
5638
5857
6561
7251
8118
8630
7.
Tran
spor
t, st
orag
e, c
omm
unic
atio
n &
serv
ices
rela
ted
to b
road
cast
ing
4875
753
707
5708
567
860
7742
782
938
8655
794
398
1055
49
7.1
Railw
ays
233
286
160
191
209
116
101
9611
6
7.2
Tran
spor
t by
mea
ns o
ther
than
Rai
lway
2980
434
045
3074
638
456
4207
149
010
5465
661
358
6760
3
7.2.
1Ro
ad tr
ansp
ort
2869
932
652
2974
736
479
4086
644
615
5016
856
558
6215
9
Tabl
e No
.3.3
: Net
Sta
te V
alue
Add
ed b
y ec
onom
ic a
ctiv
ity a
t cur
rent
pric
es (2
011-
12 to
201
9-20
As o
n 31
st A
ugus
t 202
0(R
s. in
lakh
)

21
7.2.
2W
ater
tran
spor
t85
641
225
936
036
849
741
962
049
7
7.2.
3Ai
r tra
nspo
rt24
998
174
016
1683
710
2111
4774
212
31
7.2.
4Se
rvic
es in
cide
ntal
to tr
ansp
ort
00
00
028
7729
2134
3837
18
7.3
Stor
age
5484
6882
8199
5822
424
9
7.4
Com
mun
icat
ion
& se
rvic
es re
late
d to
bro
adca
stin
g18
666
1929
226
111
2913
135
066
3371
331
742
3272
037
581
8.
Fina
ncia
l ser
vice
s46
948
5219
356
126
5013
153
257
5278
459
703
6426
968
352
9.
Real
est
ate,
ow
ners
hip
of d
wel
ling
& pr
ofes
sion
al
serv
ices
1067
1611
2856
1178
5612
4439
1230
5012
6745
1293
7513
3791
1413
67
10.
Pu
blic
adm
inis
tratio
n12
8283
1396
2620
7143
2434
7728
2744
3045
5234
0470
4280
4351
4846
11.
Ot
her s
ervi
ces
1448
5918
4060
2237
1223
7895
2514
8027
1346
3007
7038
2994
4228
72
Terti
ary
5791
2266
4989
7889
9186
9855
9592
1410
3239
211
5159
013
7914
015
6971
4
12.
TOTA
L NS
VA a
t bas
ic p
rices
1044
431
1220
932
1435
410
1594
769
1687
650
1869
745
2101
187
2443
663
2736
641
13.
Prod
uct t
axes
3829
044
596
5041
153
049
6027
970
061
8405
410
1096
1132
28
14.
Prod
uct S
ubsi
dies
2729
033
688
3130
037
376
3511
722
423
2073
240
968
4326
1
15.
Net S
tate
Dom
estic
Pro
duct
1055
431
1231
840
1454
521
1610
442
1712
812
1917
383
2164
509
2503
791
2806
607
16.
Popu
latio
n (‘0
0)19
910
2012
020
340
2055
020
770
2099
021
220
2144
021
670
17.
Per C
apita
NSD
P (R
s.)
5301
061
225
7151
078
367
8246
691
347
1020
0311
6781
1295
16
Sour
ce: D
irect
orat
e of
Eco
nom
ics
and
Sta
tistic
s

22
S.N
Item
2011
-12
2012
-13
2013
-14
2014
-15
2015
-16
2016
-17
2017
-18
2018
-19
(P)
2019
-20
(A.E
)
1.Ag
ricul
ture
, for
estry
and
fish
ing
3277
6834
7359
3814
1339
4944
3605
6339
5745
3750
1337
6087
3909
40
1.1
Crop
s16
1408
1892
0422
5448
2361
9323
3195
2350
5422
4332
2029
8020
8089
1.2
Live
stoc
k82
067
7604
174
108
7361
642
358
4108
947
366
6249
266
043
1.3
Fore
stry
and
logg
ing
7869
676
242
7564
778
577
7816
611
2379
9571
010
2973
1089
64
1.4
Fish
ing
and
aqua
cultu
re55
9858
7262
1065
5768
4472
2276
0476
4178
44
2.
Min
ing
and
quar
ryin
g49
7730
5059
8154
7216
617
3765
4469
7501
8050
Prim
ary
3327
4435
0409
3873
9440
0416
3771
8039
9509
3794
8238
3588
3989
91
3.
Man
ufac
turin
g11
153
1390
695
3711
410
1787
621
585
2173
923
688
2740
3
4.
Elec
trici
ty, g
as, w
ater
sup
ply
& ot
her
utili
ty s
ervi
ces
2146
222
042
1592
913
699
2111
522
394
3250
033
265
3873
7
5.
Cons
truct
ion
9994
899
652
7472
688
565
9899
310
4259
1229
7315
4868
1675
19
Seco
ndar
y13
2564
1356
0010
0192
1136
7413
7984
1482
3917
7212
2118
2123
3659
6.
Trad
e, re
pair,
hot
els
and
rest
aura
nts
1035
5811
1689
1063
6010
8690
1234
2812
1334
1557
3917
2949
1947
92
6.1
Trad
e &
repa
ir se
rvic
es98
933
1069
7310
1891
1039
6111
9323
1169
8815
1079
1680
1118
9495
6.2
Hote
ls &
rest
aura
nts
4625
4715
4470
4730
4104
4346
4661
4938
5297
7.
Tran
spor
t, st
orag
e, c
omm
unic
atio
n &
serv
ices
rela
ted
to b
road
cast
ing
4875
449
591
4984
956
677
6188
366
607
6785
669
119
8834
1
7.1
Railw
ays
231
292
172
138
174
4573
6062
Tabl
e No
.3.4
: Net
Sta
te V
alue
Add
ed b
y ec
onom
ic a
ctiv
ity a
t con
stan
t (20
11-1
2) p
rices
(201
1-12
to 2
019-
20)
As o
n 31
st A
ugus
t 202
0(R
s. in
lakh
)

23
7.2
Tran
spor
t by
mea
ns o
ther
than
Rai
lway
2980
431
438
2768
832
366
3164
339
558
4301
845
263
6197
9
7.2.
1Ro
ad tr
ansp
ort
2869
930
180
2687
730
755
3067
535
980
3948
741
722
5797
8
7.2.
2W
ater
tran
spor
t85
637
321
429
228
438
731
944
237
9
7.2.
3Ai
r tra
nspo
rt24
988
559
713
1968
481
989
853
610
13
7.2.
4Se
rvic
es in
cide
ntal
to tr
ansp
ort
00
00
023
7223
1525
6226
10
7.3
Stor
age
5478
5863
6780
4014
615
7
7.4
Com
mun
icat
ion
& se
rvic
es re
late
d to
br
oadc
astin
g18
666
1778
221
930
2411
029
999
2692
424
725
2365
026
143
8.
Fina
ncia
l ser
vice
s46
948
5116
651
342
5438
849
425
4911
151
608
5236
453
221
9.
Real
est
ate,
ow
ners
hip
of d
wel
ling
& pr
ofes
sion
al s
ervi
ces
1067
1611
4732
1052
7610
5276
9745
594
111
9296
392
909
9391
9
10.
Pu
blic
adm
inis
tratio
n12
8283
1245
1818
6146
1942
6620
4788
2196
6722
6844
2691
0831
6402
11.
Ot
her s
ervi
ces
1448
5916
8510
1892
4319
7099
1865
6721
0311
2128
8124
6552
2680
40
Terti
ary
5791
1962
0205
6882
1671
6396
7235
4676
1140
8078
9090
3001
1014
717
12.
TOTA
L NS
VA a
t bas
ic p
rices
1044
427
1106
215
1175
802
1230
486
1238
711
1308
888
1364
584
1498
410
1647
367
13.
Prod
uct t
axes
3829
041
238
4356
534
095
5092
958
683
7061
176
868
7828
9
14.
Prod
uct S
ubsi
dies
2729
031
151
2704
923
940
2967
018
782
1741
631
150
3164
4
15.
Net S
tate
Dom
estic
Pro
duct
1055
427
1116
302
1192
318
1240
641
1259
970
1348
789
1417
779
1544
128
1694
011
16.
Popu
latio
n (‘0
0)19
910
2012
020
340
2055
020
770
2099
021
220
2144
021
670
17.
Per C
apita
NSD
P (R
s.)
5301
055
482
5861
960
372
6066
364
259
6681
372
021
7817
3
Sour
ce: D
irect
orat
e of
Eco
nom
ics
and
Sta
tistic
s


AGRICULTURE
4

26
SNCr
ops
Kohi
ma
Phek
Mok
okch
ung
Tuen
sang
Mon
Dim
apur
Wok
haZu
nheb
oto
Pere
nKi
phire
Long
leng
Naga
land
12
34
56
78
910
1112
1314
15A.
CER
EALS
1Jh
um
Padd
y
A
5170
1650
9330
1007
015
950
9120
1010
092
4063
5084
6058
1091
250
P10
290
3230
1857
020
040
3179
018
140
2012
018
380
1265
016
840
1152
018
1570
2W
TRC
Padd
y A
1104
015
090
7340
7100
6790
4033
096
7054
4011
650
3540
2760
1207
50P
3131
042
560
2087
020
180
1930
011
4760
2752
015
350
3312
010
040
7860
3428
70
3M
aize
A
4610
8840
3950
1015
056
2067
6052
7010
100
3100
7570
3040
6901
0P
9140
1753
078
3020
120
1114
013
420
1046
020
000
6140
1497
060
3013
6780
4Jo
war
A
6050
--
60-
5050
--
-27
0P
6050
--
60-
4050
--
-26
0
5Sm
all
Mill
et
A17
9021
0064
078
082
0-
1530
820
2013
019
088
20P
2030
2360
720
880
930
-17
2092
030
150
220
9960
6Jo
bste
ar
A 21
016
011
015
019
0-
130
120
-10
090
1260
P22
017
012
015
019
0-
130
120
-10
090
1290
7Ba
jra
A
9070
6010
010
060
4060
4030
5070
0P
9070
6011
011
060
3060
4030
5071
0
8Ra
gi
A-
-80
8040
5040
--
3020
340
P-
-80
7040
5040
--
3020
330
9W
heat
A
370
350
380
340
440
470
370
320
370
--
3410
P68
064
070
062
081
087
068
059
067
0-
-62
60
10Ba
rley
A50
6040
3040
100
7050
6020
3055
0P
6070
4030
4010
070
5060
2030
570
11Oa
ts
A30
3040
3030
8060
3060
3020
440
P30
3040
3030
9060
3060
3020
450
12To
tal
A23
420
2840
021
970
2883
030
080
5697
027
330
2623
021
650
1991
012
010
2968
00P
5391
066
710
4903
062
230
6444
014
7490
6087
055
550
5277
042
210
2584
068
1050
Tab
le N
o.4.
1: A
rea
& Pr
oduc
tion
of P
rinci
pal C
rops
for t
he y
ear 2
017-
18 (A
= A
rea
in H
ecta
re,P
=Pr
oduc
tion
in M
etric
Ton
nes
(mt)
Sour
ce: D
irect
orat
e of
Agr
icul
ture

27
SNCr
ops
A/P
Kohi
ma
Phek
Mok
okch
ung
Tuen
sang
Mon
Dim
apur
Wok
haZu
nheb
oto
Pere
nKi
phire
Long
leng
Naga
land
12
34
56
78
910
1112
1314
15B.
PUL
SES
1Tu
r /A
rhar
A
30
046
030
036
033
052
021
028
023
010
011
032
00
P28
042
027
032
030
048
019
026
021
090
100
2920
2Ur
d/
Moo
ng
A 30
3060
3050
140
5040
50-
-48
0
P30
3070
3050
150
5040
60-
-51
0
3Ri
cebe
an
/Nag
adal
A82
079
036
046
037
0-
460
470
430
390
370
4920
P94
091
041
053
043
0-
530
540
490
450
420
5650
4Co
wpe
aA
-13
0-
-18
023
0-
--
-54
0P
-19
0-
-26
034
0-
--
-79
0
5Be
ans
A
350
320
220
210
210
-29
019
022
017
015
023
30P
480
440
310
290
280
-40
026
030
023
020
031
90
6Ra
jma
/Kho
lar
A75
065
012
4059
8012
50-
880
900
-32
2018
8016
750
P94
083
015
9076
1016
00-
1130
1150
-41
1023
9021
350
7Ho
rseg
ram
A40
6040
3050
100
6040
6020
2052
0P
4070
4030
5012
070
4070
2020
570
8Pe
aA
650
710
650
830
990
920
680
600
480
350
380
7240
P71
079
072
092
010
8010
2075
066
053
038
042
079
80
9Le
ntil
A18
017
024
022
021
049
020
026
017
0-
-21
40P
150
140
200
180
170
400
170
210
140
--
1760
10Gr
amA
6080
7070
7011
090
6090
4040
780
P50
7060
6060
9080
5080
3030
660
11Bl
ack
gram
A60
8080
7060
170
8060
9040
4083
0P
5070
6050
5014
070
5080
3030
680
12To
tal
A32
4034
8032
6082
6037
7026
8030
0029
0018
2043
3029
9039
730
P36
7039
6037
3010
020
4330
2740
3440
3260
1960
5340
3610
4606
0
Tab
le N
o.4.
2: A
rea
& Pr
oduc
tion
of P
rinci
pal C
rops
for t
he y
ear 2
017-
18(A
=ar
ea in
hec
tare
,P=
prod
uctio
n in
mt)
Sour
ce: D
irect
orat
e of
Agr
icul
ture

28
Tab
le N
o.4.
3: A
rea
& Pr
oduc
tion
of P
rinci
pal C
rops
for t
he y
ear 2
017-
18(A
=ar
ea in
hec
tare
,P=
prod
uctio
n in
mt)
Sour
ce: D
irect
orat
e of
Agr
icul
ture
SNCr
ops
Kohi
ma
Phek
Mok
okch
ung
Tuen
sang
Mon
Dim
apur
Wok
haZu
nheb
oto
Pere
nKi
phir
eLo
ngle
ngNa
gala
nd
12
34
56
78
910
1112
1314
15
C. O
ILSE
EDS
1Gr
ound
nut
A
8070
140
9040
180
8012
080
4050
970
P80
8015
090
4019
080
130
8040
5010
10
2So
yabe
an
A 20
8021
3011
2021
4030
7020
6015
5076
5010
7010
9010
8025
040
P26
5027
0013
9026
5038
6025
6019
4097
7013
2013
5013
3031
520
3Pe
rilla
A
430
350
220
250
330
-26
022
0-
220
190
2470
P26
021
014
015
020
0-
160
130
-13
011
014
90
4Ca
stor
A
2020
8020
2090
3030
40-
-35
0
P10
1060
1010
7020
2030
--
240
5Se
sam
um
A
390
310
460
340
170
660
410
150
440
180
150
3660
P24
019
028
021
010
041
024
090
270
110
9022
30
6su
n-flo
wer
A
8032
040
080
4072
037
080
460
4030
2620
P70
200
250
7040
440
220
7028
030
3017
00
7Re
pese
ed
Mus
tard
A
2030
2900
3120
2120
3560
4310
2610
2120
2480
1210
990
2745
0
P20
5029
2031
4021
6036
2043
7026
4021
5025
1012
2010
1027
790
8Li
nsee
d A
470
660
770
360
560
1130
590
280
570
210
240
5840
P38
053
062
029
045
093
048
023
047
017
020
047
50
9To
tal
A 55
8067
6063
1054
0077
9091
5059
0010
650
5140
2990
2730
6840
0
P57
4068
4060
3056
3083
2089
7057
8012
590
4960
3050
2820
7073
0

29
Sour
ce: D
irect
orat
e of
Agr
icul
ture
Tab
le N
o.4.
4: A
rea
& Pr
oduc
tion
of P
rinci
pal C
rops
for t
he y
ear 2
017-
18 (A
=ar
ea in
hec
tare
,P=
prod
uctio
n in
mt)
SNCr
ops
Kohi
ma
Phek
Mok
okch
ung
Tuen
sang
Mon
Dim
apur
Wok
haZu
nheb
oto
Pere
nKi
phir
eLo
ngle
ngNa
gala
nd1
23
45
67
89
1011
1213
1415
D. C
OMM
ERCI
AL
1Su
garc
ane
A
220
260
340
370
510
1160
520
240
520
160
130
4430
P95
7011
310
1479
016
100
2219
050
480
2263
010
440
2263
069
6056
5019
2750
2Co
tton
A -
50-
--
80-
--
--
130
P-
30-
--
50-
--
--
80
3Ju
teA
--
720
-71
010
4061
0-
--
-30
80P
--
1370
-13
5019
9011
60-
--
-58
70
4Te
a Gr
een
A35
067
078
015
4010
8029
4015
080
-40
-76
30P
1560
3010
3480
6860
4820
1311
067
036
0-
140
-34
010
5Ra
mie
A
--
20-
1040
--
20-
-90
P-
-20
-10
30-
-20
--
80
6M
esta
A11
024
014
016
020
027
021
021
022
060
8019
00P
120
270
150
180
220
300
240
230
250
6080
2100
7Ta
pioc
aA
200
180
690
240
170
170
180
190
160
170
150
2500
P40
5036
5013
970
4870
3440
3450
3640
3850
3240
3450
3040
5065
0
8Co
loci
ssia
A 70
058
046
049
091
024
054
043
024
041
040
054
00P
6660
5520
4380
4680
8650
2290
5140
4110
2280
3910
3800
5142
0
9Ya
mA
260
160
190
240
190
120
180
180
9015
014
019
00P
1890
1170
1400
1750
1380
870
1310
1310
660
1090
1020
1385
0
10Gi
nger
A 46
038
032
034
044
059
036
030
029
021
023
039
20P
4210
3490
2940
3110
4030
5360
3300
2740
2650
1920
2110
3586
0
11Po
tato
A 16
4013
9076
0096
050
083
057
024
022
018
021
014
340
P16
420
1393
076
0096
0049
9083
1057
0024
0022
1018
0020
6075
020
12To
tal
A 39
4039
1044
2043
4047
2074
8033
2018
7017
6013
8013
4038
480
P44
480
4238
050
100
4715
051
080
8624
043
790
2544
033
940
1933
017
760
4616
90

30
SNCr
ops
A/P
Kohi
ma
Phek
Mok
okch
ung
Tuen
sang
Mon
Dim
apur
Wok
haZu
nheb
oto
Pere
nKi
phire
Long
leng
Naga
land
12
34
56
78
910
1112
1314
15
A. C
EREA
LS
1Jh
um
Padd
y
A
5150
1640
9320
1005
015
930
9070
1008
092
3063
2084
5058
0091
040
P10
240
3260
1855
019
980
3170
018
040
2006
018
370
1255
016
810
1152
018
1080
2W
TRC
Padd
yA
1127
015
410
7540
7350
7120
4040
010
200
5640
1193
036
4029
1012
3410
P32
300
4425
021
700
2113
020
350
1158
2029
280
1618
034
150
1046
083
4035
3960
3M
aize
A46
1088
5039
6010
150
5630
6760
5270
1010
031
0075
9030
5069
070
P91
4017
550
7860
2012
011
140
1344
010
460
2000
061
4015
010
6040
1369
00
4Jo
war
A60
6060
5050
280
P60
5060
5050
270
5Sm
all
Mill
et
A17
9021
0064
078
082
015
3082
020
130
190
8820
P20
3023
6072
088
093
017
2093
030
150
220
9970
6Jo
bste
arA
210
160
110
150
190
130
120
100
100
1270
P22
017
012
016
019
013
012
010
011
013
20
7Ba
jraA
90
7060
100
100
6040
6040
4050
710
P90
7060
110
110
6030
6040
4050
720
8Ra
giA
8080
4050
4030
3035
0P
8070
4050
4030
3034
0
9W
heat
A37
035
038
034
044
047
037
032
038
034
20
P68
064
069
062
081
087
068
058
069
062
60
10Ba
rley
A50
6040
3040
100
7050
6030
3056
0
P60
7040
3040
100
7050
6030
3058
0
11Oa
tsA
3030
4030
3080
6030
6030
3045
0P
3030
4030
3090
6030
6030
3046
0
12To
tal
A23
630
2873
022
170
2906
030
400
5699
027
840
2642
021
910
2004
012
190
2993
80
P54
850
6845
049
860
6313
065
400
1484
7062
580
5637
053
720
4266
026
370
6918
60
Tab
le N
o.4.
5: A
rea
& Pr
odut
ion
of P
rinci
pal C
rops
for t
he y
ear 2
018-
19 (A
= a
rea
in h
ecta
re/P
=pr
oduc
tion
in(m
t)
Sour
ce: D
irect
orat
e of
Agr
icul
ture

31
SNCr
ops
A/P
Kohi
ma
Phek
Mok
okch
ung
Tuen
sang
Mon
Dim
apur
Wok
haZu
nheb
oto
Pere
nKi
phire
Long
leng
Naga
land
12
34
56
78
910
1112
1314
15
B.
PUL
SES
1Tu
r/Ar
har
A
310
460
300
360
330
520
210
280
230
100
110
3210
P28
042
027
032
030
048
019
026
021
090
100
2920
2Ur
d/M
oong
A
3030
6030
5014
050
4050
480
P30
3070
3050
150
5040
5050
0
3Ri
cebe
an /
Naga
dal
A82
079
036
046
037
046
048
043
039
038
049
40
P94
091
041
053
043
053
055
049
045
044
056
80
4Co
wpe
a A
140
180
230
550
P21
026
034
081
0
5Be
ans
A
330
320
220
210
210
290
190
220
170
150
2310
P45
044
031
029
028
039
026
030
023
020
031
50
6Ra
jma/
Khol
ar
A75
065
012
4060
0012
7092
093
032
7019
3016
960
P96
083
015
9076
4016
3011
7011
8041
8024
6021
640
7Ho
rseg
ram
A
4060
4040
5010
060
4060
2030
540
P40
7040
3050
120
7040
7020
3058
0
8Pe
a A
650
710
650
830
990
930
690
600
490
350
380
7270
P71
079
072
092
010
8010
3076
066
054
038
042
080
10
9Le
ntil
A18
018
024
023
021
049
021
026
018
021
80P
150
150
200
190
170
400
170
210
150
1790
10Gr
am
A60
8070
7070
100
8060
9040
4076
0P
5070
6060
6090
7050
7030
3064
0
11Bl
ack
gram
A
6080
8070
6017
080
6090
4040
830
P50
7060
5050
140
7050
8030
3068
0
12To
tal
A32
3035
0032
6083
0037
9026
8030
5029
4018
4043
8030
6040
030
P36
6039
9037
3010
060
4360
2750
3470
3300
1960
5410
3710
4640
0
Tabl
e No
.4.6
: Are
a &
Prod
utio
n of
Prin
cipa
l Cro
ps fo
r the
yea
r 201
8-19
(A=
are
a in
hec
tare
/P=
prod
uctio
n in
(mt)
Sour
ce:D
irect
orat
e of
Agr
icul
ture
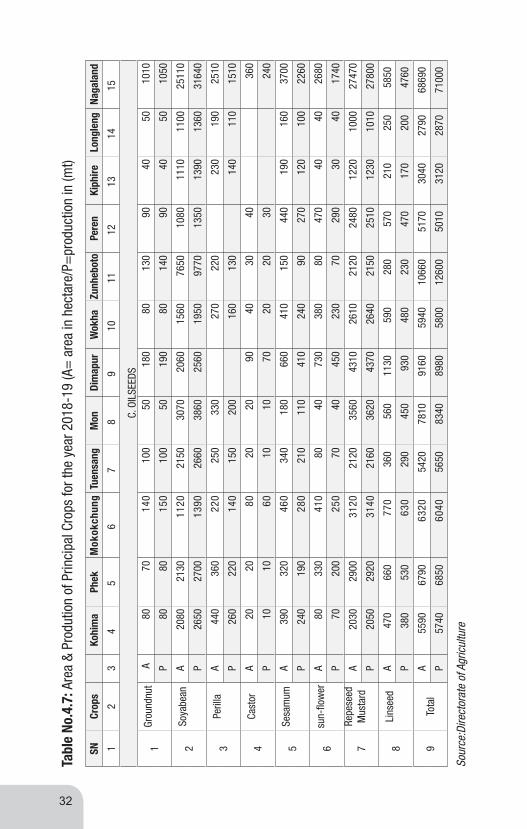
32
SNCr
ops
Kohi
ma
Phek
Mok
okch
ung
Tuen
sang
Mon
Dim
apur
Wok
haZu
nheb
oto
Pere
nKi
phire
Long
leng
Naga
land
12
34
56
78
910
1112
1314
15
C.
OIL
SEED
S
1Gr
ound
nut
A
8070
140
100
5018
080
130
9040
5010
10
P80
8015
010
050
190
8014
090
4050
1050
2So
yabe
an
A 20
8021
3011
2021
5030
7020
6015
6076
5010
8011
1011
0025
110
P26
5027
0013
9026
6038
6025
6019
5097
7013
5013
9013
6031
640
3Pe
rilla
A
440
360
220
250
330
270
220
230
190
2510
P26
022
014
015
020
016
013
014
011
015
10
4Ca
stor
A
2020
8020
2090
4030
4036
0
P10
1060
1010
7020
2030
240
5Se
sam
um
A
390
320
460
340
180
660
410
150
440
190
160
3700
P24
019
028
021
011
041
024
090
270
120
100
2260
6su
n-flo
wer
A
8033
041
080
4073
038
080
470
4040
2680
P70
200
250
7040
450
230
7029
030
4017
40
7Re
pese
ed
Mus
tard
A
2030
2900
3120
2120
3560
4310
2610
2120
2480
1220
1000
2747
0
P20
5029
2031
4021
6036
2043
7026
4021
5025
1012
3010
1027
800
8Li
nsee
d A
470
660
770
360
560
1130
590
280
570
210
250
5850
P38
053
063
029
045
093
048
023
047
017
020
047
60
9To
tal
A 55
9067
9063
2054
2078
1091
6059
4010
660
5170
3040
2790
6869
0
P57
4068
5060
4056
5083
4089
8058
0012
600
5010
3120
2870
7100
0
Tab
le N
o.4.
7: A
rea
& Pr
odut
ion
of P
rinci
pal C
rops
for t
he y
ear 2
018-
19 (A
= a
rea
in h
ecta
re/P
=pr
oduc
tion
in (m
t)
Sour
ce:D
irect
orat
e of
Agr
icul
ture

33
Tab
le N
o.4.
8:Ar
ea &
Pro
dutio
n of
Prin
cipa
l Cro
ps fo
r the
yea
r 20
18-1
9 (A
= a
rea
in h
ecta
re/P
=pr
oduc
tion
in (m
t)SN
Crop
sKo
him
aPh
ekM
okok
chun
gTu
ensa
ngM
onDi
map
urW
okha
Zunh
ebot
oPe
ren
Kiph
ireLo
ngle
ngNa
gala
nd1
23
45
67
89
1011
1213
1415
D. C
OMM
ERCI
AL
1Su
garc
ane
A
230
260
340
370
510
1160
520
240
520
160
130
4440
P10
000
1131
014
790
1610
022
190
5048
022
630
1044
022
630
6960
5650
1931
80
2Co
tton
A 50
8013
0P
3050
80
3Ju
te
A72
071
010
4061
030
80P
1370
1350
1990
1160
5870
4Te
a Gr
een
A35
067
078
015
4010
9029
4016
080
4076
50P
1560
3000
3480
6860
4860
1311
072
036
017
034
120
5Ra
mie
A
20
1040
2090
P20
1030
2080
6M
esta
A
120
240
140
160
200
270
220
210
220
7080
1930
P13
027
015
018
022
030
025
023
025
070
8021
30
7Ta
pioc
a A
210
190
700
250
180
180
190
200
170
180
170
2620
P42
5038
6014
170
5060
3640
3660
3850
4050
3450
3650
3440
5308
0
8Co
loci
ssia
A
700
590
460
500
910
240
550
430
240
410
400
5430
P66
6056
2043
8047
6086
5022
9052
4041
1022
9039
1038
1051
720
9Ya
m
A 26
017
020
025
020
012
019
018
090
160
140
1960
P19
0012
4014
6018
2014
6087
013
9013
1066
011
6010
2014
290
10sw
eet p
otat
oA
170
180
170
210
210
140
150
190
130
150
140
1840
P14
5015
3014
5018
0017
8011
9012
7016
1011
1012
8011
9015
660
11Oi
l pal
mA
390
800
430
440
270
2330
P0
12Gi
nger
A
460
390
320
340
440
590
370
300
300
220
230
3960
P42
1035
7029
4031
1040
3053
7033
9027
4027
5020
1021
1036
230
13Po
tato
A
1640
1400
760
960
500
840
570
240
220
180
210
7520
P16
420
1402
076
0096
0050
1084
1057
1024
0022
1018
0020
6075
240
14To
tal
A 41
4041
4050
0045
8049
6084
4039
6020
7023
5015
7017
7042
980
P46
580
4445
051
810
4929
053
200
8775
045
610
2725
035
370
2101
019
360
4816
80
Sour
ce:D
irect
orat
e of
Agr
icul
ture

34
SNCr
ops
A/P
Kohi
ma
Phek
Mok
okch
ung
Tuen
sang
Mon
Dim
apur
Wok
haZu
nheb
oto
Pere
nKi
phire
Long
leng
Naga
land
12
34
56
78
910
1112
1314
15
A.
CER
EALS
1Jh
um P
addy
A
51
4016
3093
0010
020
1589
090
5010
050
9210
6310
8430
5800
9083
0P
1022
132
5418
516
1994
431
642
1800
720
024
1833
712
527
1677
911
499
1807
50
2W
TRC
Padd
yA
1151
015
730
7700
7510
7300
4130
010
420
5760
1220
037
2029
7012
6120
P33
222
4551
222
318
2173
220
980
1192
0930
123
1664
135
147
1075
885
7836
4220
3M
aize
A46
1288
5739
6610
154
5638
6770
5277
1011
031
0075
9530
5169
130
P91
5417
584
7881
2015
011
167
1347
310
486
2003
061
4915
037
6049
1371
60
4Jo
war
A60
6060
5050
280
P60
5060
5050
270
5Sm
all M
illet
A17
9221
0264
178
182
215
3182
120
130
190
8830
P20
3223
6272
188
193
117
2293
130
150
220
9980
6Jo
bste
arA
212
161
111
151
191
131
121
101
101
1280
P22
117
212
116
119
113
112
110
111
113
3
7Ba
jraA
90
7060
100
100
6040
6040
4050
710
P90
7060
110
110
6030
6040
4050
720
8Ra
giA
8080
4050
4030
3035
0P
381
7040
5040
3030
340
9W
heat
A37
135
169
234
144
247
137
132
138
134
30P
682
641
4062
381
387
368
258
269
262
80
10Ba
rley
A50
6040
3040
100
7050
6030
3056
0P
6070
4030
4010
070
5060
3030
580
11Oa
ts
A30
3040
3030
8060
3060
3030
450
P30
3040
3030
9060
3060
3030
460
12To
tal
A23
867
2905
122
319
2919
730
553
5788
128
040
2653
322
171
2010
612
252
3019
70P
5577
269
745
5046
963
731
6600
415
1862
6341
856
832
5270
542
955
2659
770
2090
Tab
le N
o.4.
9: A
rea
& Pr
oduc
tion
of P
rinci
pal C
rops
for t
he y
ear 2
019-
20A=
are
a in
hec
tare
/P=
prod
uctio
n in
mt)
Sour
ce: D
irect
orat
e of
Agr
icul
ture

35
SNCr
ops
A/P
Kohi
ma
Phek
Mok
okch
ung
Tuen
sang
Mon
Dim
apur
Wok
haZu
nheb
oto
Pere
nKi
phire
Long
leng
Naga
land
12
34
56
78
910
1112
1314
15
B.
PUL
SES
1Tu
r/Arh
ar A
31
046
030
036
033
052
021
028
023
010
011
032
10
P28
042
027
032
030
048
019
026
021
090
100
2920
2Ur
d/M
oong
A 30
3060
3050
140
5040
5048
0P
3030
7030
5015
050
4050
500
3Ri
cebe
an/N
agad
alA
823
793
362
462
371
462
480
432
391
382
4960
P94
591
541
253
343
253
355
349
345
244
257
10
4Co
wpe
aA
143
183
234
560
P21
027
035
083
0
5Be
ans
A
320
320
220
210
210
290
190
220
170
150
2300
P44
943
930
928
927
938
925
929
922
919
931
40
6Ra
jma/
Khol
arA
757
657
1256
6081
1287
932
942
3310
1948
1717
0
P97
083
916
1277
5116
5411
8611
9642
3724
8521
930
7Ho
rseg
ram
A40
6040
4050
100
6040
6020
3054
0P
4070
4030
5012
070
4070
2030
580
8Pe
aA
652
712
652
832
993
932
692
601
492
351
381
7290
P71
279
272
292
210
8310
3276
266
254
138
142
180
30
9Le
ntil
A18
218
324
323
321
349
721
326
418
222
10P
150
150
200
190
180
400
180
220
150
1820
10Gr
amA
6080
7070
7010
080
6090
4040
760
P50
7060
6060
9070
5070
3030
640
11Bl
ack
gram
A60
8080
7060
170
8060
9040
4083
0P
5070
6050
5014
070
5080
3030
680
12To
tal
A32
3435
1832
8383
8838
1726
9330
6929
5918
4644
2230
8140
310
P36
7640
0537
5510
175
4408
2762
3500
3330
1963
5469
3737
4678
0
Tab
le N
o.4.
10: A
rea
& Pr
odut
ion
of P
rinci
pal C
rops
for t
he y
ear 2
019-
20 (A
= a
rea
in h
ecta
re/P
=pr
oduc
tion
in (
mt)
Sour
ce:D
irect
orat
e of
Agr
icul
ture

36
SNCr
ops
A/P
Kohi
ma
Phek
Mok
okch
ung
Tuen
sang
Mon
Dim
apur
Wok
haZu
nheb
oto
Pere
nKi
phire
Long
leng
Naga
land
12
34
56
78
910
1112
1314
15
C. O
ILSE
EDS
1Gr
ound
nut
A
8373
146
104
5118
783
135
9442
5210
50P
8484
152
105
5219
984
145
9644
5311
00
2So
yabe
anA
2085
2135
1123
2155
3077
2065
1564
7668
1083
1113
1102
2517
0
P26
6027
1113
9626
7138
7625
7019
5898
1013
5613
9613
6631
770
3Pe
rilla
A44
736
622
325
433
527
422
423
419
325
50P
268
221
140
153
204
163
133
143
115
1540
4Ca
stor
A20
2080
2020
9040
3040
360
P10
1060
1010
7020
2030
240
5Se
sam
um
A
394
323
465
344
182
667
414
152
445
192
162
3740
P24
319
528
421
311
141
224
592
274
120
101
2290
6su
n-flo
wer
A80
337
419
8040
746
388
8048
040
4027
30P
7020
525
570
4045
923
570
296
3040
1770
7Re
pese
ed M
usta
rdA
2031
2902
3122
2122
3563
4313
2612
2122
2482
1220
1001
2749
0P
2051
2922
3143
2162
3622
4373
2642
2151
2512
1231
1011
2782
0
8Li
nsee
dA
470
660
770
360
560
1130
590
280
570
220
250
5860
P38
053
063
029
045
093
048
023
047
018
020
047
70
9To
tal
A 56
1068
1663
4854
3978
2891
9859
6510
691
5914
3061
2800
6895
0P
5766
6878
6060
5674
8365
9013
5827
1265
150
3431
4428
8871
300
Tab
le N
o.4.
11: A
rea
& Pr
odut
ion
of P
rinci
pal C
rops
for t
he y
ear 2
019-
20 (A
= a
rea
in h
ecta
re, P
=pr
oduc
tion
in (m
t)
Sour
ce:D
irect
orat
e of
Agr
icul
ture

37
Tab
le N
o.4.
12: A
rea
& Pr
odut
ion
of P
rinci
pal C
rops
for t
he y
ear 2
019-
20 (A
= a
rea
in h
ecta
re, P
=pr
oduc
tion
in (m
t)SN
Crop
sA/
P Ko
him
aPh
ekM
okok
chun
gTu
ensa
ngM
onDi
map
urW
okha
Zunh
ebot
oPe
ren
Kiph
ireLo
ngle
ngNa
gala
nd1
23
45
67
89
1011
1213
1415
D. C
OMM
ERCI
AL
1Su
garc
ane
A
230
260
342
370
510
1160
523
241
522
162
130
4450
P10
023
1133
614
824
1613
522
241
5059
522
682
1046
422
681
6976
5663
1936
20
2Co
tton
A 2.
53.
25.
7P
1.5
23.
5
3Ju
teA
720
710
1040
610
3080
P13
7013
5019
9011
6058
70
4Te
a Gr
een
A35
167
278
215
4410
9329
4816
080
4076
70P
1564
3008
3489
6878
4873
1314
472
236
117
134
210
5Ra
mie
A
2010
4020
90P
2010
3020
80
6M
esta
A12
224
414
216
220
327
422
421
322
471
8119
60P
135
270
155
180
225
304
250
235
250
7383
2160
7Ta
pioc
aA
220
200
734
262
189
189
199
211
178
189
179
2750
P44
6140
5214
875
5312
3821
3842
4041
4251
3622
3832
3611
5572
0
8Co
loca
ssia
A 70
459
346
350
391
524
155
343
224
241
240
254
60P
6700
5651
4405
4787
8706
2301
5269
4125
2303
3932
3831
5201
0
9Ya
mA
268
175
206
258
206
124
196
185
9316
514
420
20P
1958
1278
1505
1884
1505
906
3214
3213
5267
911
9810
5314
750
10Sw
eet p
otat
oA
174
184
174
215
214
143
153
194
133
153
143
1880
P14
8215
6414
8218
4018
2012
1712
9816
4611
3513
0912
1716
010
11Oi
l pal
mA
474
972
522
534
328
2830
P
12Gi
nger
A 46
739
632
534
544
759
937
530
530
522
323
340
20P
4274
3624
2975
3157
4091
5461
3441
2782
2792
2041
2142
3678
0
13Po
tato
A 16
4414
0476
296
350
184
257
224
022
118
021
175
40P
1646
814
061
7622
9628
5025
8435
5727
2407
2216
1805
2066
7546
0
14To
tal
A 41
8041
30.5
5144
4622
4998
8575
.240
8721
0124
7215
9518
5143
755.
7P
4706
544
845.
552
722
4980
153
667
8822
746
2227
623
3569
821
337
1966
648
6673
.5
Sour
ce:D
irect
orat
e of
Agr
icul
ture

38
Tab
le N
o.4.
13: C
onsu
mpt
ion
of F
ertil
izer
and
Pes
ticid
e
SNYe
ar
Fert
ilize
r (In
M.T
.)To
tal
Fert
ilize
r (M
T)Pe
stic
ide
N
PK
Solid
(In
M.T
. )Li
quid
(In
litre
s)
220
12-1
310
95.4
869
4.76
376.
9221
67.1
614
.50
3200
.00
320
13-1
410
68.5
269
3.94
348.
6021
11.0
610
.32
3300
.00
420
14-1
512
98.8
481
4.60
427.
9225
41.3
610
.72
3428
.00
520
15-1
611
87.6
281
0.26
518.
8425
16.7
210
.83
3558
.50
620
16-1
712
55.6
084
4.04
557.
7626
57.4
010
.86
3458
.00
720
17-1
812
61.7
884
4.04
557.
7626
6.58
10.9
734
92.5
8
8.20
18-1
915
53.1
6687
8.13
858
0.18
630
11.4
911
.02
3560
.00
920
19-2
018
63.8
1097
.67
667.
2136
28.6
813
.99
5000
.02
Sour
ce: D
irect
orat
e of
Agr
icul
ture
N =
Nitro
gen,
P =
Pho
spha
te, K
= P
otas
sium
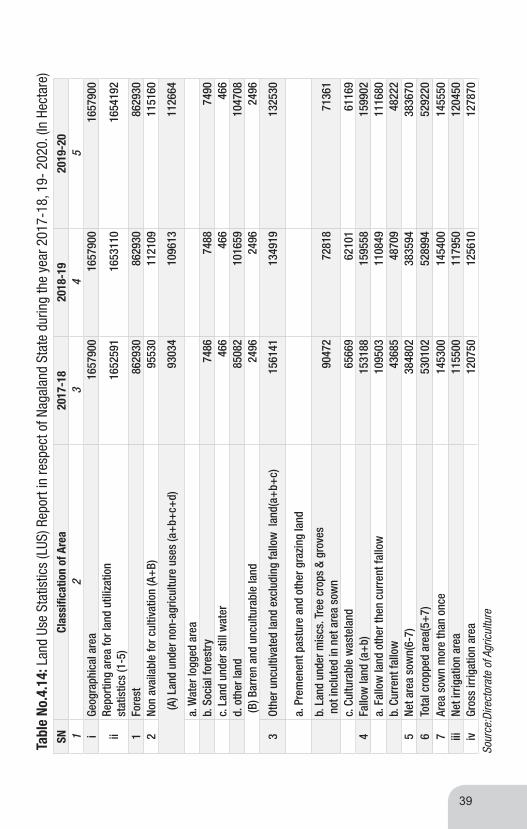
39
Sour
ce:D
irect
orat
e of
Agr
icul
ture
SNCl
assi
ficat
ion
of A
rea
2017
-18
2018
-19
2019
-20
12
34
5i
Geog
raph
ical
are
a16
5790
016
5790
016
5790
0
iiRe
port
ing
area
for l
and
utili
zatio
n
stat
istic
s (1
-5)
1652
591
1653
110
1654
192
1Fo
rest
8629
3086
2930
8629
302
Non
avai
labl
e fo
r cul
tivat
ion
(A+
B)95
530
1121
0911
5160
(A)
Lan
d un
der n
on-a
gric
ultu
re u
ses
(a+
b+c+
d)93
034
1096
1311
2664
a. W
ater
logg
ed a
rea
b. S
ocia
l for
estr
y74
8674
8874
90c.
Lan
d un
der s
till w
ater
466
466
466
d. o
ther
land
8508
210
1659
1047
08
(B
) Bar
ren
and
uncu
ltura
ble
land
2496
2496
2496
3Ot
her u
ncul
tivat
ed la
nd e
xclu
ding
fallo
w l
and(
a+b+
c)15
6141
1349
1913
2530
a. P
rem
enen
t pas
ture
and
oth
er g
razi
ng la
nd
b. L
and
unde
r mis
cs. T
ree
crop
s &
grov
es
not
incl
uted
in n
et a
rea
sow
n90
472
7281
871
361
c. C
ultu
rabl
e w
aste
land
6566
962
101
6116
94
Fallo
w la
nd (a
+b)
1531
8815
9558
1599
02a.
Fal
low
land
oth
er th
en c
urre
nt fa
llow
1095
0311
0849
1116
80b.
Cur
rent
fallo
w43
685
4870
948
222
5Ne
t are
a so
wn(
6-7)
3848
0238
3594
3836
706
Tota
l cro
pped
are
a(5+
7)53
0102
5289
9452
9220
7Ar
ea s
own
mor
e th
an o
nce
1453
0014
5400
1455
50iii
Net i
rrig
atio
n ar
ea11
5500
1179
5012
0450
ivGr
oss
irrig
atio
n ar
ea12
0750
1256
1012
7870
Tab
le N
o.4.
14: L
and
Use
Stat
istic
s (L
US) R
epor
t in
resp
ect o
f Nag
alan
d St
ate
durin
g th
e ye
ar 2
017-
18, 1
9- 2
020.
(In
Hect
are)


HORTICULTURE
5

42
SN V
eget
able
s A
rea
&
Prod
uctio
nKo
him
aW
okha
Mok
okch
ung
Zunh
ebot
oTu
ensa
ngPh
ek M
onDi
map
ur
Kiph
ireLo
ngle
ngPe
ren
Naga
land
12
34
56
78
910
1112
1314
15
1Sw
eet P
atat
oA
160.
0014
6.00
148.
0013
2.00
80.0
014
1.00
153.
0096
0.00
P 23
20.0
021
50.0
021
55.0
019
80.0
011
00.0
020
90.0
023
11.0
014
106.
00
2Ga
bbag
eA
785.
0076
9.00
740.
0061
5.00
682.
0013
12.0
060
0.00
480.
0063
3.00
623.
0073
6.00
7975
.00
P 15
248.
0015
150.
0014
800.
0012
59.0
014
204.
0020
640.
0013
870.
0015
500.
0010
761.
0013
790.
0014
940.
0015
0162
.00
3Ca
ulifl
ower
A 71
.00
57.0
060
.00
35.0
047
.00
63.0
065
.00
105.
0047
.00
29.0
087
.00
666.
00
P 51
3.00
456.
0051
0.00
332.
0039
3.00
472.
0058
5.00
650.
0042
3.00
309.
0065
3.00
5296
.00
4Br
inja
lA
52.0
051
.00
40.0
040
.00
32.0
040
.00
36.0
040
.00
23.0
034
.00
75.0
046
3.00
P 38
0.00
398.
2033
5.00
303.
0026
5.00
302.
0036
0.00
330.
0016
1.00
255.
0060
7.00
3696
.20
5Ch
illy
A 68
8.00
675.
0058
0.00
340.
0066
0.00
557.
0060
0.00
435.
0046
3.00
481.
0040
5.00
5884
.00
P 49
17.0
049
81.0
041
60.0
024
14.0
048
12.0
041
64.0
045
00.0
037
50.0
037
04.0
034
22.0
027
13.0
043
537.
00
6Pe
asA
135.
0013
5.00
115.
0012
5.00
98.0
013
1.00
95.0
033
0.00
92.0
091
.00
311.
0016
58.0
0
P 10
00.0
084
2.00
580.
0065
8.00
535.
0079
0.00
700.
0025
00.0
074
8.00
720.
0011
81.0
010
254.
00
7Be
ans
A 22
0.00
260.
0016
0.00
141.
0051
3.00
196.
0062
.00
200.
0035
2.00
177.
0014
5.00
2426
.00
P 20
80.0
018
78.4
014
00.0
011
84.0
041
22.0
016
54.0
085
0.00
1200
.00
2464
.00
1662
.00
1372
.00
1986
6.40
8Bh
indi
A21
.00
24.0
030
.00
12.0
013
.00
16.0
015
.00
25.0
015
.00
43.0
021
4.00
P17
8.00
200.
0031
2.00
61.0
010
3.00
60.0
045
.00
260.
0061
.00
427.
0017
07.0
0
9To
mat
oA
437.
0027
3.00
447.
0025
0.00
192.
0025
8.00
250.
0032
0.00
238.
0014
8.00
267.
0030
80.0
0
P 21
12.0
019
49.0
036
47.0
017
92.0
016
95.0
014
69.0
019
53.0
020
00.0
019
08.0
015
98.0
019
38.0
022
061.
00
Tabl
e No
.5.1
: Are
a &
Prod
uctio
n of
Maj
or V
eget
able
s du
ring
2016
-17
(A=
area
in h
ecta
re,P
=pr
oduc
tion
in m
t)
Sour
ce: D
irect
orat
e of
Hor
ticul
ture

43
SN V
eget
able
s A
rea
&
Prod
uctio
nKo
him
aW
okha
Mok
okch
ung
Zunh
ebot
oTu
ensa
ngPh
ek M
onDi
map
ur
Kiph
ireLo
ngle
ngPe
ren
Naga
land
12
34
56
78
910
1112
1314
15
10Gi
nger
A 28
1.00
310.
0022
0.00
350.
0037
3.00
386.
0045
0.00
195.
0015
68.0
029
5.00
434.
0048
62.0
0
P 48
00.0
051
18.0
035
00.0
048
96.0
052
03.0
053
8.00
6000
.00
3250
.00
392.
0043
88.0
055
20.0
043
605.
00
11Ga
rlic
A 39
.00
7.00
25.0
020
.00
19.0
055
.00
18.0
022
.00
26.0
023
.00
38.0
029
2.00
P 36
1.00
140.
0025
4.00
202.
0018
5.00
386.
0040
0.00
200.
0029
8.00
202.
0034
7.00
2975
.00
12Ra
dish
A 67
.00
68.0
072
.00
35.0
052
.00
81.0
032
.00
45.0
021
.00
49.0
045
.00
567.
00
P 66
2.00
612.
0062
5.00
380.
0048
4.00
854.
0041
0.00
700.
0026
7.00
356.
0033
5.00
5685
.00
13Co
laca
sia
A 53
0.00
558.
0042
0.00
210.
0027
3.00
480.
0025
8.00
225.
0022
5.00
3179
.00
P 64
06.0
066
08.0
050
41.0
024
80.0
033
74.0
045
40.0
022
30.0
024
00.0
036
05.0
036
684.
00
14Ta
ioca
A 55
0.00
550.
0010
65.0
052
0.00
570.
0067
0.00
450.
0036
9.00
482.
0052
26.0
0
P 97
82.0
077
05.0
099
97.0
093
36.0
071
06.0
010
150.
0082
00.0
079
70.0
067
86.0
077
032.
00
15Ch
owch
owA P
16Ca
rrot
A 50
.00
46.0
050
.00
45.0
044
.00
51.0
045
.00
45.0
041
.00
55.0
061
.00
533.
00
P 54
5.00
530.
0061
7.00
549.
0052
3.00
596.
0065
5.00
550.
0045
1.00
600.
0060
7.00
6223
.00
17Co
riand
erA
11.0
010
.00
-10
.00
10.0
020
.00
10.0
09.
008.
0088
.00
P20
.00
18.0
020
.00
15.0
031
.00
21.0
015
.00
140.
00
Cont
d.

44
18Xa
ntho
phyl
umA P
19On
ion
A70
.00
60.0
065
.00
57.0
054
.00
43.0
028
.00
200.
0022
.00
35.0
096
.00
730.
00
P63
2.00
655.
0067
0.00
514.
0065
5.00
424.
0045
0.00
2100
.00
341.
0030
.00
892.
0073
63.0
0
20 N
aga
Cucu
mbe
r
A 60
.00
45.0
028
0.00
32.0
034
.00
37.0
058
.00
35.0
034
.00
56.0
043
.00
714.
00
P 45
0.00
361.
0018
070.
0025
2.00
245.
0029
3.00
600.
0030
0.00
272.
0044
6.00
328.
0021
617.
00
21M
ushr
oom
A 67
.00
100.
0013
0.00
22.0
035
.00
47.0
055
0.00
-22
.00
60.0
010
33.0
0
P 35
7.00
648.
0080
0.00
198.
0023
9.00
263.
0036
00.0
0-
121.
0030
2.00
6528
.00
22Le
afy
Vege
tabl
es
A 55
0.00
535.
0052
7.00
522.
0051
6.00
531.
0042
0.00
-33
4.00
526.
0044
61.0
0
P 53
50.0
042
34.0
042
30.0
042
80.0
041
27.0
042
46.0
033
0.00
-29
17.0
042
26.0
033
940.
00
23Pu
mpk
inA
75.0
068
.00
70.0
070
.00
53.0
075
.00
60.0
020
.00
26.0
019
.00
32.0
056
8.00
P 70
3.00
738.
0053
0.00
763.
0044
3.00
576.
0029
0.00
200.
0020
8.00
1064
.00
291.
0058
06.0
0
24Tr
ee T
omat
oA
--
--
--
--
-
P -
--
--
--
-
25W
ater
mel
onA
--
15.0
018
.00
18.0
020
.00
-18
.00
22.0
011
.00
122.
00
P -
-18
8.00
121.
0010
1.00
230.
00-
170.
0018
6.00
195.
0011
91.0
0
26Ot
hers
A -
95.0
0-
-31
2.00
--
90.0
021
3.00
357.
0010
67.0
0
P 11
25.0
037
18.0
065
0.00
2765
.00
4542
.00
1280
0.00
Sour
ce: D
irect
orat
e of
Hor
ticul
ture
Cont
d.

45
Sour
ce: D
irect
orat
e of
Hor
ticul
ture
SNPl
anta
tion
Crop
s A
/PKo
him
aW
okha
Mok
okch
ung
Zunh
ebot
oTu
ensa
ngPh
ek M
onDi
map
urKi
phire
Long
leng
Pere
nNa
gala
nd
12
34
56
78
910
1112
1314
15
1Co
ffee
A -
107.
00-
--
--
--
--
107.
00
P -
22.0
0-
--
--
--
--
22.0
0
2Ca
shew
nut
A -
200.
00-
--
--
--
-39
9.00
599.
00
P -
41.0
0-
--
--
--
-14
8.00
189.
00
3Ar
ecan
ut
A -
_-
--
--
--
-39
.00
39.0
0
P -
_-
--
--
--
-49
1.00
491.
00
4Co
conu
t A
-10
7.00
--
--
--
--
-10
7.00
P -
22.0
0-
--
--
--
--
22.0
0
Tabl
e No
. 5.2
: Are
a &
Prod
uctio
n of
Maj
or P
lant
atio
n Cr
ops
durin
g 20
16-1
7 (A
=ar
ea in
hec
tare
,P=
prod
uctio
n in
mt)

46
SNM
ajor
Sp
ices
A/P
Kohi
ma
Wok
haM
okok
chun
gZu
nheb
oto
Tuen
sang
Phek
Mon
Dim
apur
Kiph
ireLo
ngle
ngPe
ren
Naga
land
12
34
56
78
910
1112
1314
15
1Ca
rdam
onA
625.
0046
5.00
290.
0068
5.00
275.
0062
4.00
650.
00-
184.
0023
4.00
176.
0042
08.0
0
P 30
0.00
156.
0012
0.00
436.
0010
8.00
264.
0050
0.00
-53
.00
74.0
023
.00
2034
.00
2Bl
ackp
eppe
rA
-20
.00
8.00
--
-15
.00
30.0
0-
26.0
015
.00
114.
00
P -
3.00
27.0
015
.00
17.0
018
.00
4.00
4.00
-6.
005.
0099
.00
3Tu
rmer
icA
25.0
040
.00
251.
0025
2.00
384.
0021
6.00
16.0
023
0.00
15.0
029
.00
267.
0017
25.0
0
P 36
0.00
525.
00-
--
-14
0.00
4700
.00
243.
0041
1.00
3236
.00
9615
.00
4Na
ga C
hilly
A -
--
--
--
--
--
-
P -
--
--
--
--
--
-
5Be
telv
ine
A -
--
--
-30
.00
--
77.0
0-
107.
00
P -
--
--
-45
.00
--
200.
00-
245.
00
6Ar
omat
ic &
M
edic
inal
A -
--
--
--
--
--
-
P -
--
--
--
--
--
-
Tabl
e No
. 5.3
: Are
a &
Prod
uctio
n of
Maj
or S
pice
s du
ring
2016
-17(
A=ar
ea in
hec
tare
,P=
prod
uctio
n in
mt)
Sour
ce: D
irect
orat
e of
Hor
ticul
ture
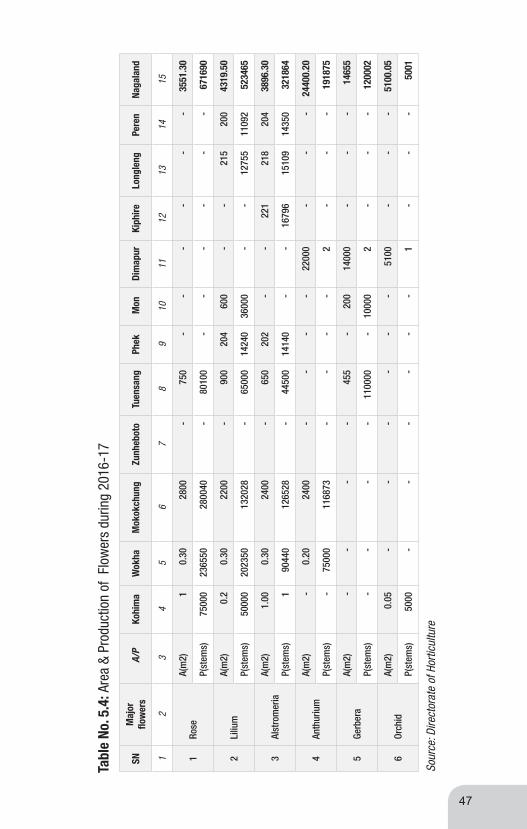
47
SNM
ajor
flo
wer
s A
/PKo
him
aW
okha
Mok
okch
ung
Zunh
ebot
oTu
ensa
ngPh
ek M
onDi
map
urKi
phire
Long
leng
Pere
nNa
gala
nd
12
34
56
78
910
1112
1314
15
1Ro
seA(
m2)
1
0.30
2800
-75
0-
--
--
-35
51.3
0
P(st
ems)
75
000
2365
5028
0040
-80
100
--
--
--
6716
90
2Li
lium
A(m
2)
0.2
0.30
2200
-90
020
460
0-
-21
520
043
19.5
0
P(st
ems)
50
000
2023
5013
2028
-65
000
1424
036
000
--
1275
511
092
5234
65
3Al
stro
mer
iaA(
m2)
1.
000.
3024
00-
650
202
--
221
218
204
3896
.30
P(st
ems)
1
9044
012
6528
-44
500
1414
0-
-16
796
1510
914
350
3218
64
4An
thur
ium
A(m
2)
-0.
2024
00-
--
-22
000
--
-24
400.
20
P(st
ems)
-
7500
011
6873
--
--
2-
--
1918
75
5Ge
rber
aA(
m2)
-
--
-45
5-
200
1400
0-
--
1465
5
P(st
ems)
-
--
-11
0000
-10
000
2-
--
1200
02
6Or
chid
A(m
2)
0.05
--
--
--
5100
--
-51
00.0
5
P(st
ems)
50
00-
--
--
-1
--
-50
01
Tabl
e No
. 5.4
: Are
a &
Prod
uctio
n of
Flo
wer
s du
ring
2016
-17
Sour
ce: D
irect
orat
e of
Hor
ticul
ture

48
SNFr
uits
A/P
Kohi
ma
Wok
haM
okok
chun
gZu
nheb
oto
Tuen
sang
Phek
Mon
Dim
apur
Ki
phire
Long
leng
Pere
nNa
gala
nd
12
34
56
78
910
1112
1314
15
1Ap
ple
A 36
1.00
60.0
010
40.0
036
0.00
1821
.00
P
2Pe
arA
3.00
25.5
030
.00
25.0
039
.00
26.0
040
.00
19.0
024
.00
231.
50
P 13
.50
198.
0025
0.00
260.
0033
0.00
204.
0033
6.00
230.
0029
9.00
2120
.50
3Pl
um
A 72
.00
38.0
070
.00
28.0
062
.00
88.0
031
.00
30.0
024
.00
30.0
047
3.00
P 51
5.00
300.
0042
0.00
220.
0041
5.00
502.
0077
.50
180.
0018
0.00
135.
0029
44.5
0
4Pe
ach
A 35
.00
22.5
030
.00
35.0
034
.00
27.0
024
.00
3.00
27.0
037
.00
274.
50
P 23
8.00
150.
0024
0.00
280.
0024
5.00
157.
0055
.20
8.10
265.
0029
6.00
1934
.30
5Or
ange
A
895.
0068
0.00
820.
0040
6.00
480.
0050
8.00
450.
0012
0.00
614.
0033
6.00
556.
0058
65.0
0
P 78
90.0
059
50.0
056
50.0
032
45.0
038
60.0
045
72.0
031
05.0
014
50.0
036
84.0
026
50.0
048
92.0
046
948.
00
6Le
mon
A
4.
5028
0.00
350.
0023
5.00
869.
50
P 32
.50
1580
.00
3000
.00
1856
.00
6468
.50
7Po
mel
o A P
8Po
meg
rana
te
A 4.
007.
515
.00
7.00
11.0
010
.00
13.0
012
.00
79.5
0
P 24
.00
5070
.00
52.0
076
.00
45.0
078
.00
76.0
047
1.00
9Pa
paya
A
190.
0025
0.00
170.
0010
7.00
84.0
012
0.00
100.
0070
.00
69.0
028
.00
135.
0013
23.0
0
P 16
84.0
018
07.5
0
1610
.00
573.
0082
5.00
1480
.00
1000
.00
1380
.00
165.
0018
76.0
012
400.
50
10Ba
nana
A
1000
.00
847.
5018
00.0
062
2.00
506.
0063
0.00
430.
0040
0.00
600.
0028
.00
580.
0074
43.5
0
P 12
30.0
011
107.
5011
600.
0088
75.0
074
80.0
094
50.0
089
50.0
090
00.0
090
00.0
060
50.0
088
74.0
091
616.
50
11Gu
ava
A 70
.00
41.2
550
.00
54.0
045
.00
45.0
060
.00
35.0
046
.00
48.0
059
.00
553.
25
P 49
5.00
415.
0035
0.00
440.
0041
7.00
361.
0050
0.00
380.
0027
6.00
400.
0048
6.00
4520
.00
Tabl
e No
.5.5
: Are
a &
Prod
uctio
n of
Maj
or F
ruits
dur
ing
201
7-18
(A=
area
in h
ecta
re,P
=Pr
oduc
tion
in m
t)

49
12M
ango
A
39.0
048
.75
75.0
038
.00
32.0
031
.00
45.0
075
.00
43.0
053
.00
106.
0058
5.75
P 27
0.00
341.
2548
0.00
109.
0012
0.00
273.
0026
5.50
580.
0025
8.00
300.
0076
8.00
3764
.75
13Li
tchi
A
48.7
565
.00
33.0
025
.00
29.0
052
.00
150.
0025
.00
53.0
010
2.00
582.
75
P 27
3.75
340.
0016
5.00
106.
0016
6.00
270.
6094
0.00
100.
0026
5.00
780.
0034
06.3
5
14Ja
ckfr
uit
A 12
.50
30.0
06.
0012
.00
13.0
06.
008.
0024
.00
111.
50
P 16
0.00
205.
0015
0.00
131.
0024
0.00
42.6
072
.00
219.
0012
19.6
0
15Pi
neap
ple
A 24
0.00
637.
5099
0.00
360.
0047
3.00
495.
0050
0.00
2800
.00
410.
0036
2.00
1628
.00
8895
.50
P 12
73.0
010
125.
0011
535.
0067
90.0
084
05.0
094
19.0
057
50.0
034
000.
0073
80.0
081
2.00
2197
1.00
1174
60.0
0
16Gr
apes
A
112.
0012
.00
15.0
014
.00
6.00
159.
00
P 80
.00
75.0
040
.00
80.0
025
.00
300.
00
17M
osam
biA P
18Pa
ssio
n fr
uit
A 11
85.0
098
0.00
570.
0089
8.00
705.
0060
0.00
480.
0041
5.00
950.
0067
83.0
0
P 17
10.0
018
60.0
012
95.0
021
20.0
017
63.0
017
00.0
021
60.0
014
50.0
023
75.0
016
433.
00
19Ki
wi
A 55
.00
3.00
92.0
010
6.00
256.
00
P 56
0.00
8.00
881.
0031
8.00
1767
.00
20W
ild A
pple
A P
21Go
ose
Berr
yA P
22Be
rA
8.00
10.0
018
.00
P 60
.00
62.0
012
2.00
23Ot
hers
A P
Sour
ce:D
irect
orat
e of
Hor
ticul
ture
Cont
d.

50
SNI.
SPIC
ESDi
stric
tsA/
PDi
map
urKo
him
aKi
phire
Mok
okch
ung
Mon
Long
leng
Phek
Pere
nTu
ensa
ngW
okha
Zunh
ebot
oNa
gala
nd
1Aj
wai
n/Ca
rom
A-
P-
2Be
telv
ine
in
Lakh
s Nu
mbe
rA
6.00
15.0
030
.00
72.0
03.
0012
6.00
P60
.00
1220
.00
45.0
017
9.00
30.0
015
34.0
0
3Bl
ack
Pepp
erA
25.0
030
.00
15.0
020
.00
14.0
013
.50
117.
50P
3.00
8.00
4.00
6.00
5.00
2.50
28.5
0
4Ca
rdam
om
Smal
lA
-P
-
5Ca
rdam
om
Larg
eA
-62
5.00
170.
0028
0.00
655.
0024
563
0.00
190.
0027
0.00
349.
0070
2.00
4116
.00
P-
300.
0051
.00
105.
0054
5.00
112.
0027
7.00
185.
0010
6.00
151.
0045
2.00
2284
.00
6Ci
nnam
on-
P-
7Cl
ove
A-
P-
8Co
riand
er S
eed
A7.
0011
.00
19.0
07.
0011
.00
55.0
0P
7.00
20.0
024
.00
12.0
022
.00
85.0
0
9Cu
min
A-
P-
10Fe
nnel
A-
P-
11Fe
nugr
eek
A-
P-
12Ga
rlic
A20
.00
39.0
026
.00
32.0
018
.00
1855
.00
37.0
019
.00
10.0
022
.00
296.
00P
180.
0036
1.00
234.
0021
0.00
88.2
017
4.00
386.
0034
2.00
98.0
075
.75
235.
0023
83.9
5
Tabl
e No
. 5.6
: Hor
ticul
ture
Dat
a (H
APIS
=Ho
rticu
lture
Are
a Pr
oduc
tion
Info
rmat
ion
Syst
em) 2
017-
18 F
inal
( A=
area
in h
ecta
re,
P=pr
oduc
tion
in m
t)

51
13Gi
nger
A20
0.00
281.
0014
98.0
020
5.00
452.
0027
5.00
390.
0043
9.00
369.
0035
0.00
352.
0048
11.0
0P
3000
.00
4800
.00
1198
.00
2150
.00
3840
.00
3450
.00
2340
.00
5535
.00
2126
.00
3122
.00
4922
.00
3648
3.00
14M
int
A-
--
--
--
--
--
-P
--
--
--
--
--
--
15Nu
tmeg
A-
--
--
--
--
--
-P
--
--
--
--
--
--
16Ce
lery
/Dill
Se
eds/
Popp
yA
--
--
--
--
--
--
P-
--
--
--
--
--
-
17Ta
mar
ind
A-
--
--
--
1.00
-3.
004.
00P
--
--
--
-10
.00
-6.
0016
.00
18
Othe
r Spi
ces
(Spe
cify
Cro
p in
Rem
arks
Co
lum
n)
A-
-10
575
.00
--
-24
7.00
--
-42
7.00
P-
-81
252
0.00
--
-16
28.0
0-
--
2960
.00
19Va
nilla
A-
--
--
--
--
--
-P
--
--
--
--
--
--
20Sa
ffron
A-
--
--
--
--
--
-P
--
--
--
--
--
--
21Re
d Ch
illy
A25
.00
670.
0065
.00
6060
300
5020
.00
110.
0013
60.0
0P
65.0
047
8.00
84.5
018
012
617
712
050
.00
445.
0017
25.5
0
22Tu
rmer
ic
A23
0.00
25.0
015
.00
35.0
016
.00
22.0
016
.00
268.
0017
.00
50.0
015
.00
709.
00P
4750
.00
360.
0030
.00
215.
0067
.20
18.5
019
2.00
3239
.00
75.0
037
5.00
252.
0095
73.7
0
23Cu
rry
Leaf
A P
24Ci
nnam
on/
Tejp
atA P
Sour
ce: D
irect
orat
e of
Hor
ticul
ture
Cont
d.

52
Dist
ricts
SNFr
uits
A/P
Dim
apur
Kohi
ma
Kiph
ireM
okok
chun
gM
onLo
ngle
ngPh
ekPe
ren
Tuen
sang
Wok
haZu
nheb
oto
Naga
land
1Al
mon
dA P
2Ao
nla/
Goos
eber
ryA
29.0
032
.00
30.0
010
.00
41.0
026
.00
28.0
026
.25
21.0
024
3.25
P36
0.00
281.
0031
0.00
75.0
039
9.00
289.
0026
0.00
292.
5026
1.00
2527
.50
3Ap
ple
A40
.00
130.
0048
.00
24.0
024
2.00
P36
1.00
1040
.00
360.
0060
.00
1821
.00
4Ba
elA P
5Ap
ricot
A P6
Ber
A8.
0010
.00
18.0
0P
60.0
062
.00
122.
007
Blue
berr
yA P
8Ch
erry
A P9
Cust
ard
Appl
eA P
10Da
te P
lam
A P11
Fig
A P12
Grap
eA
12.0
06.
0014
.00
15.0
011
2.00
159
P75
.00
25.0
080
.00
40.0
080
.00
300
13Ki
wi
A55
.00
106.
003.
0092
.00
256.
00P
560.
0031
8.00
8.00
881.
0017
67.0
0
Tabl
e No
. 5.7
: Hor
ticul
ture
Dat
a (H
APIS
)201
7-18
Fin
al (A
=Ar
ea in
Hec
tare
,P=
Prod
uctio
n in
mt).

53
14Pa
ssio
n Fr
uit
A48
0.00
980.
0060
0.00
415.
0070
5.00
950.
0089
8.00
1185
.00
570.
0067
83.0
0P
2160
.00
1860
.00
1700
.00
1450
.00
1763
.00
2375
.00
2120
.00
1710
.00
1295
.00
1643
3.00
15Pi
canu
tA P
16Pl
umA
72.0
030
.00
70.0
031
.00
24.0
088
.00
30.0
062
.00
38.0
028
.00
473.
00P
515.
0018
0.00
420.
0077
.50
180.
0050
2.00
135.
0041
5.00
300.
0022
0.00
2944
.50
17Po
meg
rana
teA
10.0
04.
0015
.00
13.0
011
.00
12.0
07.
007.
5079
.50
P45
.00
24.0
070
.00
78.0
076
.00
76.0
052
.00
50.0
047
1.00
18Sa
pota
A P19
Staw
berr
yA P
20W
alnu
tA P
21Ot
her F
ruits
(Spe
cify
Cro
p in
Rem
arks
Col
umn)
A90
.00
13.0
023
1.00
334.
00P
650.
0013
0.00
2043
.00
2823
.00
22Li
mes
and
Lem
onA
350.
0028
0.00
235.
004.
5086
9.50
P30
00.0
015
80.0
018
56.0
032
.50
6468
.50
23Ki
nnow
/Man
darin
Ora
nge
A12
0.00
895.
0061
4.00
820.
0045
0.00
336.
0050
8.00
556.
0048
0.00
680.
0040
6.00
5865
.00
P14
50.0
078
90.0
036
84.0
056
50.0
031
05.0
026
50.0
045
72.0
048
92.0
038
60.0
059
50.0
032
45.0
046
948.
0024
Othe
r Citu
s (s
peci
fy C
rop
In
Rem
arks
Col
umn)
A31
.00
100.
0026
.00
157
P62
0.00
550.
0045
6.00
1626
25M
uskm
elon
A P26
Wat
erm
elon
A18
.00
10.0
015
.00
1.5
5.00
10.0
017
.00
14.0
090
.50
P14
0.00
89.0
014
5.00
0.53
72.0
025
0.00
100.
0097
.00
893.
5327
Ches
tnut
A P
Cont
d.
Sour
ce: D
irect
orat
e of
Hor
ticul
ture
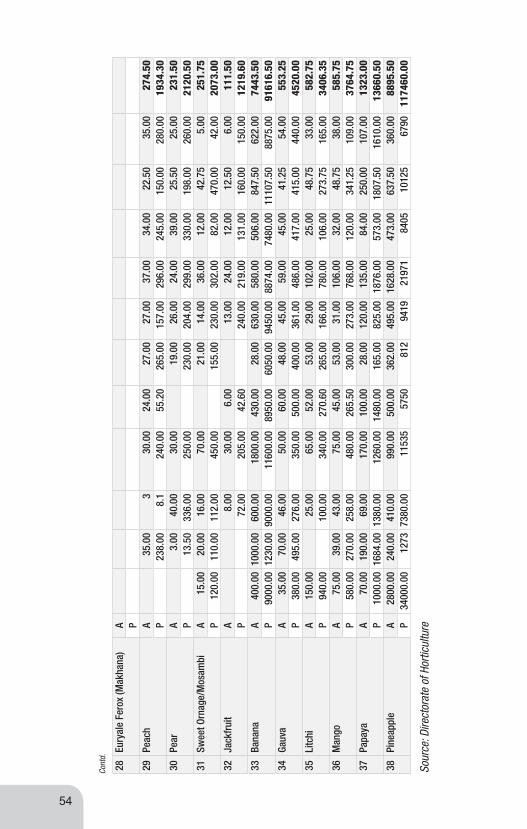
54
28Eu
ryal
e Fe
rox
(Mak
hana
)A P
29Pe
ach
A35
.00
330
.00
24.0
027
.00
27.0
037
.00
34.0
022
.50
35.0
027
4.50
P23
8.00
8.1
240.
0055
.20
265.
0015
7.00
296.
0024
5.00
150.
0028
0.00
1934
.30
30Pe
arA
3.00
40.0
030
.00
19.0
026
.00
24.0
039
.00
25.5
025
.00
231.
50P
13.5
033
6.00
250.
0023
0.00
204.
0029
9.00
330.
0019
8.00
260.
0021
20.5
031
Swee
t Orn
age/
Mos
ambi
A15
.00
20.0
016
.00
70.0
021
.00
14.0
036
.00
12.0
042
.75
5.00
251.
75P
120.
0011
0.00
112.
0045
0.00
155.
0023
0.00
302.
0082
.00
470.
0042
.00
2073
.00
32Ja
ckfr
uit
A8.
0030
.00
6.00
13.0
024
.00
12.0
012
.50
6.00
111.
50P
72.0
020
5.00
42.6
024
0.00
219.
0013
1.00
160.
0015
0.00
1219
.60
33Ba
nana
A40
0.00
1000
.00
600.
0018
00.0
043
0.00
28.0
063
0.00
580.
0050
6.00
847.
5062
2.00
7443
.50
P90
00.0
012
30.0
090
00.0
011
600.
0089
50.0
060
50.0
094
50.0
088
74.0
074
80.0
011
107.
5088
75.0
091
616.
5034
Gauv
aA
35.0
070
.00
46.0
050
.00
60.0
048
.00
45.0
059
.00
45.0
041
.25
54.0
055
3.25
P38
0.00
495.
0027
6.00
350.
0050
0.00
400.
0036
1.00
486.
0041
7.00
415.
0044
0.00
4520
.00
35Li
tchi
A15
0.00
25.0
065
.00
52.0
053
.00
29.0
010
2.00
25.0
048
.75
33.0
058
2.75
P94
0.00
100.
0034
0.00
270.
6026
5.00
166.
0078
0.00
106.
0027
3.75
165.
0034
06.3
536
Man
goA
75.0
039
.00
43.0
075
.00
45.0
053
.00
31.0
010
6.00
32.0
048
.75
38.0
058
5.75
P58
0.00
270.
0025
8.00
480.
0026
5.50
300.
0027
3.00
768.
0012
0.00
341.
2510
9.00
3764
.75
37Pa
paya
A70
.00
190.
0069
.00
170.
0010
0.00
28.0
012
0.00
135.
0084
.00
250.
0010
7.00
1323
.00
P10
00.0
016
84.0
013
80.0
012
60.0
014
80.0
016
5.00
825.
0018
76.0
057
3.00
1807
.50
1610
.00
1366
0.50
38Pi
neap
ple
A28
00.0
024
0.00
410.
0099
0.00
500.
0036
2.00
495.
0016
28.0
047
3.00
637.
5036
0.00
8895
.50
P34
000.
0012
7373
80.0
011
535
5750
812
9419
2197
184
0510
125
6790
1174
60.0
0
Sour
ce: D
irect
orat
e of
Hor
ticul
ture
Cont
d.

55
Dist
rict
SNVe
geta
bles
A/P
Dim
apur
Kohi
ma
Kiph
ireM
okok
chun
gM
onLo
ngle
ngPh
ekPe
ren
Tuen
sang
Wok
haZu
nheb
oto
Naga
land
1As
h Go
urd/
Peth
aA
4.00
12.0
02.
0020
.00
6.50
2.00
32.0
010
.00
15.0
010
3.50
P40
.00
35.0
012
.00
300.
0055
.25
5.50
590.
0015
0.00
225.
0014
12.7
5
2Be
ans
(All
Incl
udin
g La
b-la
b)
A18
0.00
220.
0035
2.00
150.
0062
.00
165.
0016
0.00
145.
0051
3.00
202.
5014
5.00
2294
.50
P11
00.0
020
80.0
021
12.0
012
00.0
043
4.00
1560
.00
1340
.00
1373
.00
3918
.00
1402
.50
1210
.00
1772
9.50
3Be
etro
otA P
4Bi
tter G
ourd
A4.
0015
.00
3.00
30.0
05.
502.
004.
0021
.00
84.5
0
P16
.00
50.0
09.
0032
0.00
25.8
518
.00
38.0
095
.00
571.
85
5Bo
ttle
gour
dA
8.00
15.0
05.
0010
.00
4.00
20.0
08.
0021
.00
91.0
0
P96
.00
50.0
012
.50
160.
0037
.60
140.
0011
5.00
178.
0078
9.10
6Br
inja
lA
40.0
052
.00
20.0
050
.00
36.0
028
.00
36.0
075
.00
32.0
037
.50
41.0
044
7.50
P32
0.00
380.
0012
0.00
420.
0036
0.00
230.
0027
1.00
604.
0024
6.00
285.
0030
5.00
3541
.00
7Br
occo
liA
5.00
1.00
5.00
0.50
2.00
55.
0023
.50
P50
.00
2.00
3.00
0.06
3.00
2.50
2.50
63.0
6
8Ca
bbag
eA
400.
0077
0.00
450.
0055
0.00
600.
0057
213
13.0
073
2.00
678.
0057
3.75
497.
0071
35.7
5
P12
700.
0014
956.
0054
00.0
074
50.0
075
00.0
010
890
2888
0.00
1493
2.00
6547
.00
1135
5.00
1010
.00
1216
20.0
0
9Ca
psic
umA
5.00
1.5
6.50
P35
.00
6.75
41.7
5
Tabl
e No
.5.8
: Hor
ticul
ture
Dat
a (H
APIS
) 201
7-18
Fin
al (A
=Ar
ea in
Hec
tare
,P=
Prod
uctio
n in
mt).
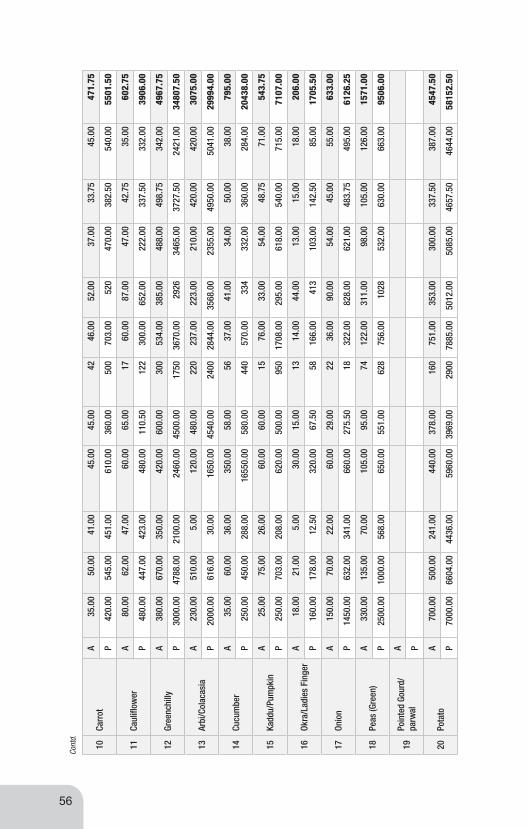
56
10Ca
rrot
A35
.00
50.0
041
.00
45.0
045
.00
4246
.00
52.0
037
.00
33.7
545
.00
471.
75
P42
0.00
545.
0045
1.00
610.
0036
0.00
500
703.
0052
047
0.00
382.
5054
0.00
5501
.50
11Ca
ulifl
ower
A80
.00
62.0
047
.00
60.0
065
.00
1760
.00
87.0
047
.00
42.7
535
.00
602.
75
P48
0.00
447.
0042
3.00
480.
0011
0.50
122
300.
0065
2.00
222.
0033
7.50
332.
0039
06.0
0
12Gr
eenc
hilly
A38
0.00
670.
0035
0.00
420.
0060
0.00
300
534.
0038
5.00
488.
0049
8.75
342.
0049
67.7
5
P30
00.0
047
88.0
021
00.0
024
60.0
045
00.0
017
5036
70.0
029
2634
65.0
037
27.5
024
21.0
034
807.
50
13Ar
bi/C
olac
asia
A23
0.00
510.
005.
0012
0.00
480.
0022
023
7.00
223.
0021
0.00
420.
0042
0.00
3075
.00
P20
00.0
061
6.00
30.0
016
50.0
045
40.0
024
0028
44.0
035
68.0
023
55.0
049
50.0
050
41.0
029
994.
00
14Cu
cum
ber
A35
.00
60.0
036
.00
350.
0058
.00
5637
.00
41.0
034
.00
50.0
038
.00
795.
00
P25
0.00
450.
0028
8.00
1655
0.00
580.
0044
057
0.00
334
332.
0036
0.00
284.
0020
438.
00
15Ka
ddu/
Pum
pkin
A25
.00
75.0
026
.00
60.0
060
.00
1576
.00
33.0
054
.00
48.7
571
.00
543.
75
P25
0.00
703.
0020
8.00
620.
0050
0.00
950
1708
.00
295.
0061
8.00
540.
0071
5.00
7107
.00
16Ok
ra/L
adie
s Fi
nger
A18
.00
21.0
05.
0030
.00
15.0
013
14.0
044
.00
13.0
015
.00
18.0
020
6.00
P16
0.00
178.
0012
.50
320.
0067
.50
5816
6.00
413
103.
0014
2.50
85.0
017
05.5
0
17On
ion
A15
0.00
70.0
022
.00
60.0
029
.00
2236
.00
90.0
054
.00
45.0
055
.00
633.
00
P14
50.0
063
2.00
341.
0066
0.00
275.
5018
322.
0082
8.00
621.
0048
3.75
495.
0061
26.2
5
18Pe
as (G
reen
)A
330.
0013
5.00
70.0
010
5.00
95.0
074
122.
0031
1.00
98.0
010
5.00
126.
0015
71.0
0
P25
00.0
010
00.0
056
8.00
650.
0055
1.00
628
756.
0010
2853
2.00
630.
0066
3.00
9506
.00
19Po
inte
d Go
urd/
parw
al
A P
20Po
tato
A70
0.00
500.
0024
1.00
440.
0037
8.00
160
751.
0035
3.00
300.
0033
7.50
387.
0045
47.5
0
P70
00.0
066
04.0
044
36.0
059
60.0
039
69.0
029
0078
85.0
050
12.0
050
85.0
046
57.5
046
44.0
058
152.
50
Cont
d.

57
21Ra
dish
A40
.00
67.0
021
.00
70.0
032
.00
2876
.00
43.0
052
.00
45.0
035
.00
509.
00
P55
0.00
662.
0026
7.00
620.
0023
3.60
280
780.
0032
5.00
459.
0044
2.50
380.
0049
99.1
0
22Ri
dge/
Spon
ge
Gour
d (T
orai
)
A1.
0030
.00
536
.00
P0.
1535
.00
4.50
39.6
5
23
Leaf
y Ve
geta
bles
(A
mar
anth
us,
Kash
miri
Sag
, Sp
inac
h, C
eler
y et
c.)
A40
0.00
550.
0020
.00
455.
0031
435
2.00
527.
0051
6.00
397.
5052
5.00
4056
.50
P32
0.00
535.
0050
.00
3800
.00
2685
3166
.00
4235
.00
3921
.00
3165
.00
4319
.00
2619
6.00
24Sw
eet P
otat
oA
60.0
016
5.00
2.00
140.
004
9513
0.00
154.
0014
8.00
112.
505
1015
.50
P75
0.00
265.
0011
.00
1640
.00
20.4
076
514
81.0
023
1120
48.0
017
25.0
06.
5011
022.
90
25Ta
pioc
aA
380.
0053
0.00
1200
.00
6.00
326
652.
0047
8.00
570.
0041
2.50
515.
0050
69.5
0
P71
00.0
094
26.0
012
560.
0067
.20
7680
9870
.00
6691
.00
6747
.00
5737
.50
9246
.00
7512
4.70
26To
mat
oA
300.
0042
0.00
190.
0042
0.00
250.
0012
619
3.00
268.
0019
2.00
206.
2525
2.00
2817
.25
P20
00.0
020
29.0
012
16.0
038
50.0
019
54.0
012
5086
5.00
1941
1600
.00
1462
.50
1807
.00
1997
4.50
27Tu
rnip
A3.
003.
00
P20
.00
20.0
0
28El
epha
nt fo
ot Y
am/
Amor
phop
hallu
s/Ji
mik
and
A P
29Ot
her v
eget
able
s Sp
ecify
Cro
p in
Re
mar
ks C
olum
n)
A70
.00
462.
0020
0.00
358.
0010
90.0
0
P50
0.00
5544
.00
2594
.00
4547
1318
5.00
30M
ushr
oom
A
450.
000.
250.
080.
210.
030.
100.
230.
217
.00
15.0
00.
0948
3.19
P30
00.0
012
.60
1.8
36.5
01.
355.
000.
3245
.14.
803.
004.
4031
14.8
7
Sour
ce: D
irect
orat
e of
Hor
ticul
ture
Cont
d.

58
Dist
rict
SNPl
anta
tion
Crop
sA/
PDi
map
urKo
him
aKi
phire
Mok
okch
ung
Mon
Long
leng
Phek
Pere
nTu
ensa
ngW
okha
Zunh
ebot
oNa
gala
nd
1Ar
ecan
utA
120.
008.
0012
4018
0.00
P60
0.00
12.0
09.
649
211
13.6
0
2Ca
shew
Nut
A40
0.00
390
150.
0094
0.00
P30
0.00
130
30.7
546
0.75
3Co
coa
A P
4Co
conu
t in
Lakh
nu
mbe
rsA
600.
005.
0015
330
112.
5010
62.5
0
P53
00.0
042
.00
nil
2648
1055
.00
9045
.00
5Oi
lpal
mA P
6Te
a A
15.0
026
.00
41.0
0
P25
.00
24.0
049
.00
7Co
ffee
A78
.75
78.7
5
P15
.00
15.0
0
8
Othe
r Pla
ntat
ion
Crop
s (
Spec
ify c
rops
in
Rem
arks
Co
lum
n)
A10
.00
10.0
0
P5.
005.
00
Tabl
e No
.5.9
: Hor
ticul
ture
Dat
a (H
APIS
)201
7-18
Fin
al (
A=Ar
ea in
Hec
tare
,P=
Prod
uctio
n in
mt)
Sour
ce: D
irect
orat
e of
Hor
ticul
ture

59
Dist
rict
SNAr
omat
ic &
M
edic
inal
pla
nts
A/P
Dim
apur
Kohi
ma
Kiph
ireM
okok
chun
gM
onLo
ngle
ngPh
ekPe
ren
Tuen
sang
Wok
haZu
nheb
oto
Naga
land
1Ch
amom
ileA P
2Da
vana
A P
3Eu
caly
ptus
Ci
trio
dora
A P
4Fr
ench
Jas
min
eA P
5In
dian
Bas
il/Tu
lsi
A P
6Ja
mar
osa
A P
7Ke
wda
A P
8Am
bret
te S
eed
A P
9Pa
lmar
osa
A P
10Pa
tcho
uli
A20
.00
20.0
0P
0.12
0.12
11Ro
se J
eran
uim
A P
12Ve
tiver
/Khu
sA P
13
Othe
r Aro
mat
ic
Plan
ts (S
peci
fy
crop
in re
mrk
s co
lum
n)
A P
14Le
mon
Gra
ssA
2525
.00
10.0
011
.00
32.0
010
3P
150
100.
0095
.00
60.0
020
3.00
608
15Al
oe v
era
A1.
40P
160.
00
16Ho
ney
A6.
00P
1.20
Tabl
e No
. 5.1
0: H
ortic
ultu
re D
ata
(HAP
IS )2
017-
18 F
inal
(A=
Area
in H
ecta
re,P
=Pr
oduc
tion
in m
t).
Sour
ce: D
irect
orat
e of
Hor
ticul
ture

60
Flow
er A
rea
(Sq
M) P
rodu
ctio
n (P
er S
tem
)SN
Item
A/P
Dim
apur
Kohi
ma
Kiph
ireM
okok
chun
gM
onLo
ngle
ngPh
ekPe
ren
Tuen
sang
Wok
haZu
nheb
oto
Naga
land
1Al
stro
emer
iaA
1000
0.00
800.
0020
000.
0020
060
030
000.
0050
00.0
040
00.0
035
00.0
040
074
500
p10
0000
1000
00.0
068
0000
1200
060
000
1776
2.00
1000
0030
000
9000
012
000
1201
762
2An
thur
ium
A20
000
2100
041
000.
00P
2000
0090
1500
1101
500.
00
3Ca
lla L
ilyA P
4Ca
rnat
ion
A40
040
0P
3200
032
000
5Ch
rysa
nthe
mum
A P
6Ge
rber
aA
1400
0.00
200.
0050
00.0
019
200.
00P
2000
0012
000
2000
00.0
041
2000
.00
7Gl
adio
lus
A P
8Ja
smin
eA P
9Li
lium
A28
13.0
020
000.
0060
0.00
3000
0.00
5000
.00
5000
.00
3500
.00
400.
0067
313.
00P
5000
060
5000
3600
017
875.
0010
0000
1000
00.0
011
2500
.00
1000
0.00
1031
375.
00
10M
arig
old
A P
11Or
chid
sA
5000
.00
500
5500
.00
P10
0000
1000
0020
0000
.00
12Ro
seA
1000
020
020
000.
0050
00.0
040
035
600
P10
0000
1680
096
0000
1000
0028
000
1204
800
13Tu
be R
ose
A P
14Tu
lipA P
15
Othe
r Flo
wer
s (S
peci
fy C
rop
In R
emar
ks
Colu
mn)
A
P
Tabl
e No
. 5.1
1: H
ortic
ultu
re D
ata
(HAP
IS )2
017-
18 F
inal
(A=
Area
in H
ecta
re,P
=Pr
oduc
tion
in m
t).
Sour
ce: D
irect
orat
e of
Hor
ticul
ture

61
Tabl
e No
. 5.1
2: H
ortic
ultu
re D
ata
(HAP
IS )2
018-
19 F
inal
Est
imat
e (A
=Ar
ea in
Hec
tare
, P=
Prod
uctio
n in
mt).
DIST
RICT
S
SNi.
Spic
esA/
PDI
MAP
URKO
HIM
AKI
PHIR
EM
OKOK
CHUN
GM
ONLO
NGLE
NGPH
EKPE
REN
TUEN
SANG
WOK
HAZU
NHEB
OTO
NAGA
LAND
1Aj
wai
n/Ca
rom
A P
2Be
telv
ine
in L
akhs
Num
ber
A6.
0013
.00
30.0
072
.00
4.00
125.
00
P60
.00
1400
.00
45.0
018
3.00
33.0
017
21.0
0
3Bl
ack
Pepp
erA
25.0
028
.00
15.0
020
.00
14.0
013
.50
115.
50
P3.
008.
004.
006.
004.
002.
5027
.50
4Ca
rdam
om L
arge
A62
5.00
175.
0022
5.00
655.
0024
563
0.00
210.
0028
0.00
346.
5070
2.00
4093
.50
P30
0.00
53.0
010
0.00
545.
0011
3.00
277.
0018
5.00
113.
0015
6.00
460.
0023
02.0
0
5Ca
rdam
om S
mal
lA P
6Ci
nnam
on6
6
P1.
501.
5
7Cl
ove
A P
8Co
riand
er S
eed
A7.
0011
.00
18.0
07.
0011
.00
54.0
0
P7.
0020
.00
22.0
012
.00
23.0
084
.00
9Cu
min
A P
10Fe
nnel
A P
11Fe
nugr
eek
A P

62
12Ga
rlic
A17
.00
39.0
026
.00
35.0
018
.00
1855
.00
37.0
018
.00
10.0
022
.00
295.
00
P15
0.00
361.
0023
4.00
245.
0087
.00
177.
0038
6.00
343.
0095
.00
75.7
523
5.00
2388
.75
13Gi
nger
A16
0.00
281.
0014
98.0
019
5.00
452.
0027
5.00
390.
0042
8.00
370.
0035
0.00
350.
0047
49.0
0
P26
00.0
048
00.0
011
98.4
019
00.0
038
35.0
033
90.0
023
40.0
053
96.0
021
28.0
031
22.0
049
21.0
035
630.
40
14M
int
A P
15Nu
tmeg
A P
16Ce
lery
/Dill
See
ds/P
oppy
A P
17Ta
mar
ind
A8.
001.
003.
0012
.00
P18
0.00
10.0
06.
0019
6.00
18Tu
rmer
ic
A21
0.00
25.0
015
.00
32.0
016
.00
22.0
016
.00
260.
0015
.00
50.0
015
.00
676.
00
P46
00.0
036
0.00
30.0
020
0.00
66.2
019
.00
192.
0031
41.0
065
.00
375.
0025
5.00
9303
.20
19Ot
her S
pice
s (S
peci
fy C
rop
in R
emar
ks C
olum
n)
A70
.00
282.
0035
2.00
P39
5.00
1698
.00
2093
.00
20Va
nilla
A P
21Sa
ffron
A P
22Re
d Ch
illy
A25
.00
670.
0067
.00
6560
300.
0055
20.0
011
0.00
1372
.00
P65
.00
470.
0087
.61
250
124
180.
0012
150
.00
450.
0017
97.6
1
23Cu
rry
Leaf
24Ci
nnam
on/ T
ejpa
t
Cont
d.
Sour
ce: D
irect
orat
e of
Hor
ticul
ture

63
Tabl
e No
. 5.1
3: H
ortic
ultu
re D
ata
(HAP
IS )2
018-
19 F
inal
Est
imat
e (A
=Ar
ea in
Hec
tare
, P=
Prod
uctio
n in
mt).
DI
STRI
CTS
SNii.
Fru
itsA/
PDi
map
urKo
him
aKi
phire
Mok
okch
ung
Mon
Long
leng
Phek
Pere
nTu
ensa
ngW
okha
Zunh
ebot
oNa
gala
nd
1Ao
nla/
Goos
eber
ryA
29.0
032
.00
32.0
010
.00
41.0
026
.00
25.0
025
.00
21.0
024
1.00
P36
0.00
280.
0028
0.00
73.0
039
9.00
289.
0025
0.00
291.
5026
5.00
2487
.50
2Ap
ple
A40
.00
130.
0048
.00
24.0
024
2.00
P36
1.00
1040
.00
360.
0061
.00
1822
.00
3Ba
elA P
4Ap
ricot
A P
5Ba
nana
A40
0.00
1000
.00
600.
0012
50.0
042
6.00
28.0
063
0.00
578.
0050
8.00
847.
5062
0.00
6887
.50
P89
50.0
012
30.0
090
00.0
071
00.0
088
80.0
062
00.0
094
50.0
086
84.0
074
75.0
011
107.
5088
80.0
086
956.
50
6Be
r A
7.50
10.0
017
.50
P60
.00
62.0
012
2.00
7Bl
uebe
rry
A P
8Ch
erry
A P
9Cu
star
d Ap
ple
A P
10Da
te P
lam
A P
11Fi
gA P
12Gr
ape
A14
.00
6.00
14.0
012
.00
112.
0015
8
P85
.00
20.0
080
.00
35.0
080
.00
300

64
13Ga
uva
A35
.00
70.0
046
.00
45.0
060
.00
48.0
045
.00
59.0
046
.00
40.2
555
.00
549.
25
P35
0.00
495.
0027
6.00
300.
0050
0.00
400.
0036
1.00
490.
0041
3.00
415.
0045
0.00
4450
.00
14Ja
ckfr
uit
A8.
0025
.00
6.00
13.0
022
.00
15.0
012
.50
7.00
108.
50
P72
.00
175.
0042
.60
240.
0020
2.00
133.
0016
0.00
153.
0011
77.6
0
15Ki
wi
A55
.00
106.
003.
0096
.00
260.
00
P56
0.00
318.
008.
0089
1.00
1777
.00
16Li
tchi
A15
0.00
25.0
052
.00
52.0
053
.00
29.0
010
1.00
26.0
048
.75
33.0
056
9.75
P93
0.00
95.0
027
6.00
267.
6026
8.00
166.
0076
9.00
106.
0027
3.75
165.
0033
16.3
5
17M
ango
A70
.00
39.0
040
.00
60.0
040
.00
53.0
031
.00
105.
0030
.00
48.7
538
.00
554.
75
P55
0.00
270.
0025
2.00
472.
0026
0.00
305.
0027
3.00
758.
0090
.00
341.
2510
5.00
3676
.25
18Pa
paya
A70
.00
190.
0065
.00
120.
0010
0.00
28.0
012
0.00
130.
0085
.00
250.
0010
5.00
1263
.00
P10
00.0
016
84.0
013
69.0
062
0.00
1477
.00
170.
0082
5.00
1872
.00
575.
0018
07.5
016
10.0
013
009.
50
19Pa
ssio
n Fr
uit
A47
0.00
550.
0060
0.00
415.
0070
5.00
887.
0090
0.00
1185
.00
570.
0062
82.0
0
P21
53.0
014
00.0
017
00.0
014
50.0
017
63.0
022
14.0
021
19.0
017
10.0
012
91.0
015
800.
00
20Pe
ach
A35
.00
323
.00
24.0
027
.00
27.0
035
.00
35.0
022
.50
35.0
026
6.50
P23
8.00
8.10
198.
0055
.20
265.
0015
7.00
285.
0024
5.00
150.
0028
0.00
1881
.30
21Pe
arA
40.0
024
.00
19.0
026
.00
23.0
037
.00
25.5
025
.00
219.
50
P33
6.00
228.
0023
2.00
204.
0028
8.00
325.
0019
8.00
260.
0020
71.0
0
22Pi
canu
tA P
23Pi
neap
ple
A30
00.0
024
0.00
410.
0059
0.00
500.
0036
2.00
495.
0016
28.0
047
5.00
637.
5036
0.00
8697
.50
P35
000.
0012
37.0
073
8082
0057
5080
094
19.0
021
981
8404
1012
567
9011
5086
.00
24Pl
umA
72.0
030
.00
52.0
030
.00
24.0
088
.00
28.0
060
.00
38.0
028
.00
450.
00
P51
5.00
180.
0029
8.00
73.5
018
2.00
502.
0012
9.00
412.
0030
0.00
220.
0028
11.5
0
25Po
meg
rana
teA
10.0
04.
0016
.00
13.0
012
.00
11.0
06.
007.
5079
.50
P45
.00
24.0
075
.00
78.0
076
.00
72.0
050
.00
50.0
047
0.00
26Sa
pota
A P
Cont
d.

65
Cont
d.27
Staw
berr
yA
2.00
P10
.00
28W
alnu
tA P
29Ot
her F
ruits
(S
peci
fy C
rop
in R
emar
ks
Colu
mn)
A10
0.00
13.0
02.
0024
5.00
360.
00
P70
0.00
130.
001.
0020
24.0
028
55.0
0
30Li
mes
and
Le
mon
A35
0.00
232.
0024
0.00
4.50
826.
50
P30
00.0
013
38.0
018
10.0
032
.50
6180
.50
31Ki
nnow
/M
anda
rin
Oran
ge
A12
0.00
895.
0061
4.00
620.
0044
8.00
336.
0050
8.00
520.
0048
2.00
510.
0040
9.00
5462
.00
P14
00.0
078
90.0
036
84.0
040
30.0
031
00.0
026
90.0
045
72.0
045
26.0
038
50.0
044
70.0
032
50.0
043
462.
00
32Sw
eet O
rnag
e/M
osam
biA
13.0
020
.00
20.0
055
.00
21.0
014
.00
34.0
012
.00
42.7
55.
0023
6.75
P11
0.00
110.
0011
2.00
470.
0015
5.00
230.
0028
4.00
84.0
047
0.00
43.0
020
68.0
0
33Ot
her C
itus
(spe
cify
Cro
p In
Rem
arks
Co
lum
n)
A31
.00
70.0
026
.00
127
P62
0.00
350.
0045
4.00
1424
34M
uskm
elon
A P
35W
ater
mel
onA
18.0
010
.00
12.0
01.
505.
0010
.00
15.0
015
.00
86.5
0
P14
0.00
89.0
012
0.00
0.53
75.0
025
0.00
99.0
097
.50
871.
03
36Ch
estn
utA P
37Eu
ryal
e Fe
rox
(Mak
hana
)A P
Cont
d.
Sour
ce: D
irect
orat
e of
Hor
ticul
ture

66
Tabl
e No
. 5.1
4: H
ortic
ultu
re D
ata
(HAP
IS )2
018-
19 F
inal
Est
imat
e (A
=Ar
ea in
Hec
tare
, P=
Prod
uctio
n in
mt).
Dist
ricts
SNiii
. Veg
etab
les
A/P
Dim
apur
Kohi
ma
Kiph
ire
Mok
okch
ung
Mon
Long
leng
Phek
Pere
nTu
ensa
ngW
okha
Zunh
ebot
oNa
gala
nd
1As
h Go
urd/
Peth
aA
4.00
12.0
02.
0024
.00
6.50
2.00
32.0
010
.00
15.0
010
7.50
P40
.00
35.0
012
.00
360.
0055
.25
6.00
587.
0015
0.00
225.
0014
70.2
5
2Be
ans
(All
Incl
udin
g La
b-la
b)A
200.
0022
0.00
350.
0016
0.00
62.0
016
5.00
158.
0013
8.00
515.
0020
3.00
147.
0023
18.0
0
P12
00.0
020
80.0
021
08.0
012
00.0
043
4.00
1570
.00
1322
.00
1249
.00
3919
.00
1402
.50
1215
.00
1769
9.50
3Be
etro
otA
5.00
5.00
P11
0.00
110.
00
4Bi
tter G
ourd
A4.
0015
.00
3.00
35.0
05.
503.
004.
0021
.00
90.5
0
P16
.00
50.0
09.
0035
0.00
25.8
519
.00
38.0
096
.00
603.
85
5Bo
ttle
gour
dA
10.0
015
.00
5.00
14.0
04.
0020
.00
8.00
22.0
098
.00
P10
0.00
50.0
012
.50
200.
0037
.60
140.
0011
5.00
179.
5083
4.60
6Br
inja
lA
45.0
052
.00
20.0
040
.00
36.0
028
.00
36.0
070
.00
30.0
037
.50
41.0
043
5.50
P33
0.00
380.
0012
0.00
410.
0036
0.00
228.
0027
1.00
594.
0024
3.00
285.
0030
1.00
3522
.00
7Br
occo
liA
5.00
1.00
6.00
0.50
2.00
5.00
5.00
24.5
0
P50
.00
2.00
3.80
0.06
3.00
2.50
3.00
64.3
6
8Ca
bbag
eA
380.
0077
0.00
451.
0041
0.00
590.
0057
2.00
1310
.00
705.
0068
0.00
573.
7550
0.00
6941
.75
P12
600.
0014
596.
0054
12.0
059
00.0
074
00.0
010
865.
0028
870.
0014
100.
0065
40.0
011
355.
0010
14.0
011
8652
.00
9Ca
psic
umA
5.00
1.59
6.59
P35
.00
6.75
41.7
5
10Ca
rrot
A35
.00
50.0
041
.00
40.0
045
.00
42.0
044
.00
50.0
035
.00
33.7
545
.00
460.
75
P42
0.00
545.
0045
1.00
555.
0036
0.00
495.
0067
0.00
503
459.
0038
2.50
540.
0053
80.5
0
11Ca
ulifl
ower
A70
.00
62.0
048
.00
45.0
065
.00
17.0
056
.00
85.0
046
.00
42.7
535
.00
571.
75
P45
0.00
447.
0043
2.00
354.
0011
0.50
118.
0028
0.00
668.
0021
5.00
337.
5033
5.00
3747
.00
12Gr
eenc
hilly
A36
0.00
670.
0035
0.00
296.
0060
0.00
300.
0053
0.00
360.
0049
1.00
498.
7534
2.00
4797
.75
P28
00.0
047
88.0
021
00.0
018
50.0
045
00.0
017
55.0
036
45.0
027
4134
60.0
037
27.5
024
21.0
033
787.
50
13Cu
cum
ber
A35
.00
60.0
036
.00
280.
0058
.00
56.0
037
.00
41.0
035
.00
50.0
039
.00
727.
00
P25
0.00
450.
0028
8.00
9550
.00
486.
0042
0.00
570.
0035
6.00
330.
0036
0.00
285.
0013
345.
00
14Ka
ddu/
Pum
pkin
A25
.00
75.0
026
.00
50.0
060
.00
15.0
075
.00
33.0
057
.00
48.7
571
.00
535.
75
P25
0.00
703.
0021
0.00
550.
0050
0.00
957.
0016
86.0
029
6.00
618.
0054
0.00
716.
0070
26.0
0
15Ok
ra/L
adie
s Fi
nger
A18
.00
21.0
05.
0032
.00
15.0
013
.00
14.0
044
.00
11.0
015
.00
18.0
020
6.00

67
P16
0.00
178.
0012
.50
340.
0067
.50
55.0
016
6.00
406
95.0
014
2.50
85.0
017
07.5
0
16On
ion
A15
0.00
70.0
022
.00
50.0
029
.00
22.0
035
.00
87.0
055
.00
45.0
055
.00
620.
00
P14
50.0
063
2.00
341.
0055
0.00
275.
5020
.00
313.
0079
9.00
618.
0048
3.75
495.
0059
77.2
5
17Pe
as (G
reen
)A
320.
0013
5.00
70.0
080
.00
95.0
074
.00
122.
0030
6.00
98.0
010
5.00
127.
0015
32.0
0
P23
00.0
010
00.0
056
8.00
480.
0055
1.00
625.
0075
6.00
1011
530.
0063
0.00
665.
0091
16.0
0
18Po
inte
d Go
urd/
parw
alA P
19Po
tato
A65
0.00
500.
0024
1.00
320.
0037
6.00
160.
0075
0.00
328.
0030
3.00
337.
5038
7.00
4352
.50
P68
00.0
066
04.0
044
36.0
041
60.0
039
65.0
028
70.0
078
74.0
046
20.0
050
83.0
046
57.5
046
45.0
055
714.
50
20Ra
dish
A45
.00
67.0
021
.00
50.0
032
.00
28.0
074
.00
42.0
051
.00
45.0
035
.00
490.
00
P55
0.00
662.
0026
7.00
440.
0023
3.60
278.
0076
0.00
318.
0045
0.00
442.
5038
0.00
4781
.10
21Ri
dge/
Spon
ge G
ourd
(Tor
ai)
A1.
0030
.00
5.00
.36
.00
P0.
1540
.00
4.50
44.6
5
22Le
afy
Vege
tabl
es (A
mar
anth
us, K
ashm
iri S
ag,
Spin
ach,
Cel
ery
etc.
)A
400.
0055
0.00
20.0
035
0.00
314.
0035
0.00
527.
0051
6.00
397.
5053
7.00
3961
.50
P32
0.00
535.
0050
.00
3520
.00
2695
.00
3148
.00
4234
.00
3923
.00
3165
.00
4320
.50
2591
0.50
23Sw
eet P
otat
oA
60.0
016
5.00
2.00
120.
004.
0095
.00
130.
0015
4.00
145.
0011
2.50
5.00
992.
50
P73
0.00
265.
0011
.00
1320
.00
20.4
077
0.00
1481
.00
2310
2043
.00
1725
.00
6.50
1068
1.90
24Ta
pioc
aA
350.
0053
0.00
950.
006.
0032
6.00
646.
0047
8.00
570.
0041
2.50
512.
0047
80.5
0
P68
00.0
094
26.0
095
00.0
067
.20
7650
.00
9780
.00
6690
.00
6738
.00
5737
.50
9247
.00
7163
5.70
25To
mat
oA
300.
0042
0.00
192.
0035
0.00
250.
0012
6.00
192.
0026
5.00
190.
0020
6.25
251.
0027
42.2
5
P20
00.0
020
29.0
012
28.0
036
00.0
019
54.0
012
50.0
086
0.00
1917
1589
.00
1462
.50
1806
.00
1969
5.50
26Tu
rnip
A3.
003.
00
P20
.00
20.0
0
27El
epha
nt fo
ot Y
am/ A
mor
phop
hallu
s/Ji
mik
and
A P
28Ot
her v
eget
able
s Sp
ecify
Cro
p in
Rem
arks
Co
lum
n)A
70.0
046
2.00
200.
0010
0.00
358.
0011
90.0
0
P50
0.00
5544
.00
2549
.00
100.
0045
4513
238.
00
29M
ushr
oom
A30
0.00
0.25
0.08
0.25
0.03
0.10
0.23
0.23
18.0
015
.00
0.09
334.
26
P15
00.0
012
.60
2.70
43.5
01.
355.
000.
3249
.27
7.00
3.00
4.40
1629
.14
30Ar
bi/C
olac
asia
A22
0.00
510.
005.
0012
5.00
480.
0022
0.00
237.
0022
3.00
211.
0042
0.00
420.
0030
71.0
0
P18
00.0
061
6.00
30.0
017
20.0
045
40.0
024
00.0
028
45.0
035
66.0
023
50.0
049
50.0
050
41.5
029
858.
50
Cont
d.
Sour
ce: D
irect
orat
e of
Hor
ticul
ture

68
Tabl
e No
. 5.1
5: H
ortic
ultu
re D
ata
(HAP
IS )2
018-
19 F
inal
Est
imat
e (A
=Ar
ea in
Hec
tare
, P=
Prod
uctio
n in
mt).
Sour
ce: D
irect
orat
e of
Hor
ticul
ture
Dist
ricts
SNiv.
Pla
ntat
ion
Crop
sA/
PDi
map
urKo
him
aKi
phire
Mok
okch
ung
Mon
Long
leng
Phek
Pere
nTu
ensa
ngW
okha
Zunh
ebot
oNa
gala
nd
1Ar
ecan
utA
130.
0011
.00
12.0
041
.00
194.
00
P65
0.00
16.0
09.
6049
4.00
1169
.60
2Ca
shew
Nut
A43
0.00
385.
0015
0.00
965.
00
P31
0.00
128.
0025
.00
463.
00
3Co
coa
A P
4Co
conu
t in
Lakh
num
bers
A60
0.00
6.00
1533
0.00
112.
5010
63.5
0
P53
00.0
040
.00
026
50.0
010
55.0
090
45.0
0
5Oi
lpal
mA P
6Te
a A
15.0
026
.00
41.0
0
P25
.00
24.0
049
.00
7Co
ffee
A78
.75
78.7
5
P15
.00
15.0
0
8Ot
her P
lant
atio
n Cr
ops
( Sp
ecify
cro
ps in
Rem
arks
Co
lum
n)A
12.0
012
.00
P6.
006.
00

69
Tabl
e No
.5.1
6: H
ortic
ultu
re D
ata
(HAP
IS )2
018-
19 F
inal
Est
imat
e (A
=Ar
ea in
Hec
tare
, P=
Prod
uctio
n in
mt).
Dist
ricts
SN“v
. Aro
mat
ic &
Med
icin
al
plan
ts”
A/P
Dim
apur
Kohi
ma
Kiph
ireM
okok
chun
gM
onLo
ngle
ngPh
ekPe
ren
Tuen
sang
Wok
haZu
nheb
oto
Naga
land
1Ch
amom
ileA P
2Da
vana
A P
3Eu
caly
ptus
Citr
iodo
raA P
4Fr
ench
Jas
min
eA P
5In
dian
Bas
il/Tu
lsi
A3.
503.
5
P35
.00
35
6Ja
mar
osa
A P
7Ke
wda
A P
pAm
bret
te S
eed
A P
9Pa
lmar
osa
A P

70
10Pa
tcho
uli
A20
.00
20.0
0
P0.
120.
12
11Ro
se J
eran
uim
A P
12Ve
tiver
/Khu
sA P
13Ot
her A
rom
atic
Pla
nts
(Spe
cify
cro
p in
rem
rks
colu
mn)
A P
14Le
mon
Gra
ssA
2525
.00
12.0
011
.00
32.0
010
5
P15
010
0.00
115.
0060
.00
200.
0062
5
15Al
oe v
era
A1.
801.
8
P22
0.00
220
16Ho
ney
A7.
007
P1.
401.
4
Sour
ce: D
irect
orat
e of
Hor
ticul
ture
Cont
d.
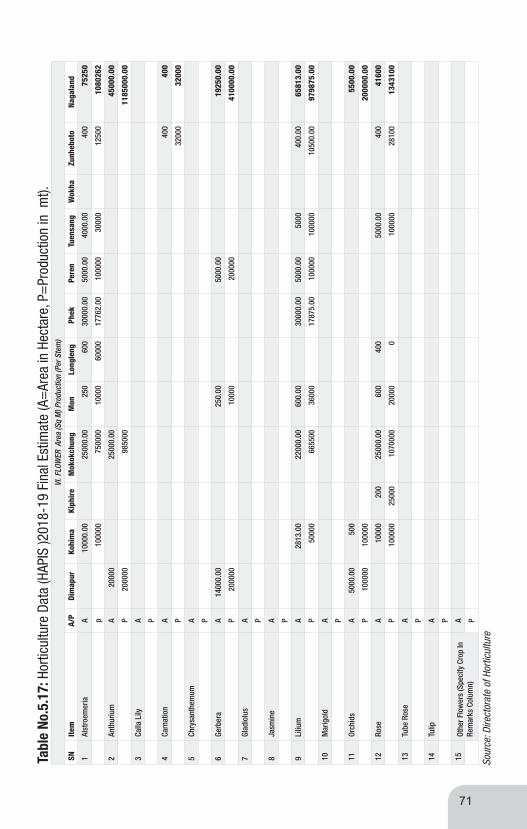
71
Tabl
e No
.5.1
7: H
ortic
ultu
re D
ata
(HAP
IS )2
018-
19 F
inal
Est
imat
e (A
=Ar
ea in
Hec
tare
, P=
Prod
uctio
n in
mt).
VI. F
LOW
ER A
rea
(Sq
M) P
rodu
ctio
n (P
er S
tem
)
SNIte
mA/
PDi
map
urKo
him
aKi
phir
eM
okok
chun
gM
onLo
ngle
ngPh
ekPe
ren
Tuen
sang
Wok
haZu
nheb
oto
Naga
land
1Al
stro
emer
iaA
1000
0.00
2500
0.00
250
600
3000
0.00
5000
.00
4000
.00
400
7525
0
p10
0000
7500
0010
000
6000
017
762.
0010
0000
3000
012
500
1080
262
2An
thur
ium
A20
000
2500
0.00
4500
0.00
P20
0000
9850
00
1185
000.
00
3Ca
lla L
ilyA P
4Ca
rnat
ion
A40
040
0
P32
000
3200
0
5Ch
rysa
nthe
mum
A P
6Ge
rber
aA
1400
0.00
250.
0050
00.0
019
250.
00
P20
0000
1000
020
0000
4100
00.0
0
7Gl
adio
lus
A P
8Ja
smin
eA P
9Li
lium
A28
13.0
022
000.
0060
0.00
3000
0.00
5000
.00
5000
400.
0065
813.
00
P50
000
6655
0036
000
1787
5.00
1000
0010
0000
1050
0.00
9798
75.0
0
10M
arig
old
A P
11Or
chid
sA
5000
.00
500
5500
.00
P10
0000
1000
0020
0000
.00
12Ro
seA
1000
020
025
000.
0060
040
050
00.0
040
041
600
P10
0000
2500
010
7000
020
000
010
0000
2810
013
4310
0
13Tu
be R
ose
A
P
14Tu
lipA P
15Ot
her F
low
ers
(Spe
cify
Cro
p In
Re
mar
ks C
olum
n)A
P
Sour
ce: D
irect
orat
e of
Hor
ticul
ture


SERICULTURE
6
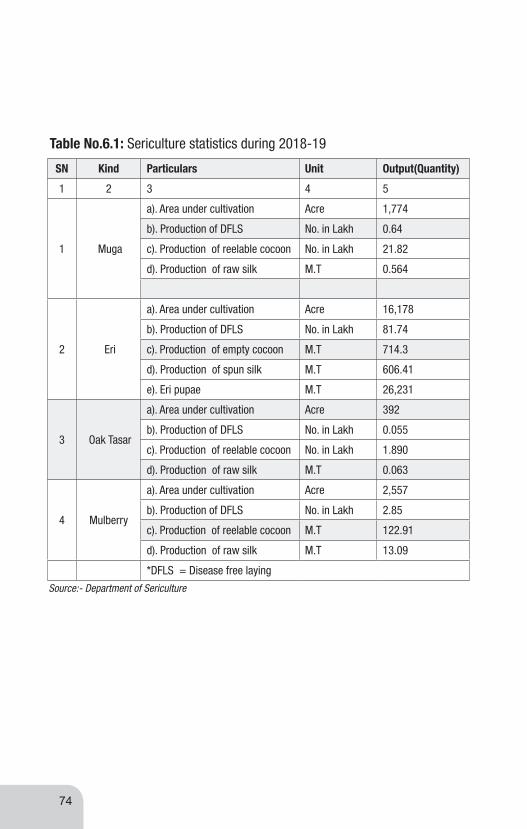
74
SN Kind Particulars Unit Output(Quantity)
1 2 3 4 5
1 Muga
a). Area under cultivation Acre 1,774
b). Production of DFLS No. in Lakh 0.64
c). Production of reelable cocoon No. in Lakh 21.82
d). Production of raw silk M.T 0.564
2 Eri
a). Area under cultivation Acre 16,178
b). Production of DFLS No. in Lakh 81.74
c). Production of empty cocoon M.T 714.3
d). Production of spun silk M.T 606.41
e). Eri pupae M.T 26,231
3 Oak Tasar
a). Area under cultivation Acre 392
b). Production of DFLS No. in Lakh 0.055
c). Production of reelable cocoon No. in Lakh 1.890
d). Production of raw silk M.T 0.063
4 Mulberry
a). Area under cultivation Acre 2,557
b). Production of DFLS No. in Lakh 2.85
c). Production of reelable cocoon M.T 122.91
d). Production of raw silk M.T 13.09
*DFLS = Disease free laying
Table No.6.1: Sericulture statistics during 2018-19
Source:- Department of Sericulture
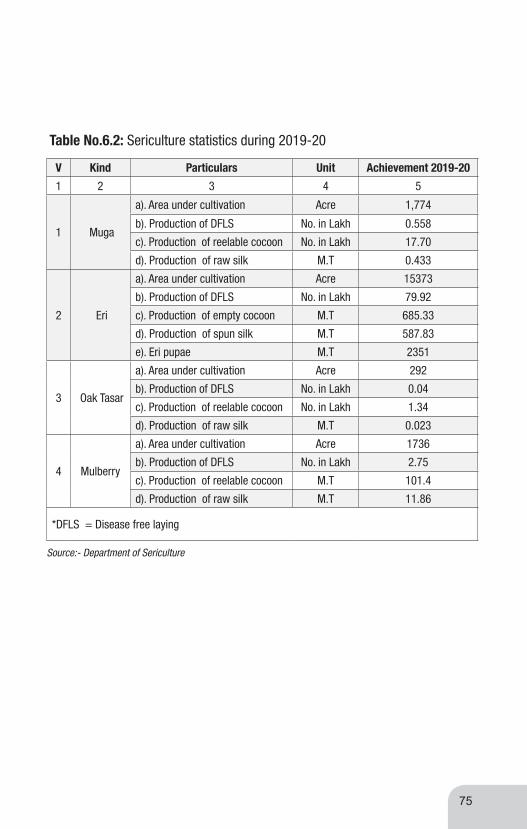
75
V Kind Particulars Unit Achievement 2019-20
1 2 3 4 5
1 Muga
a). Area under cultivation Acre 1,774
b). Production of DFLS No. in Lakh 0.558
c). Production of reelable cocoon No. in Lakh 17.70
d). Production of raw silk M.T 0.433
2 Eri
a). Area under cultivation Acre 15373
b). Production of DFLS No. in Lakh 79.92
c). Production of empty cocoon M.T 685.33
d). Production of spun silk M.T 587.83
e). Eri pupae M.T 2351
3 Oak Tasar
a). Area under cultivation Acre 292
b). Production of DFLS No. in Lakh 0.04
c). Production of reelable cocoon No. in Lakh 1.34
d). Production of raw silk M.T 0.023
4 Mulberry
a). Area under cultivation Acre 1736
b). Production of DFLS No. in Lakh 2.75
c). Production of reelable cocoon M.T 101.4
d). Production of raw silk M.T 11.86
*DFLS = Disease free laying
Table No.6.2: Sericulture statistics during 2019-20
Source:- Department of Sericulture


LIVESTOCK (VETERINARY)
7

78
Spec
ies/
Year
Kohi
ma
Dim
apur
Pere
nPh
ekM
okok
chun
gW
okha
Zunh
ebot
oTu
ensa
ngKi
phire
Long
leng
Mon
Tota
l1
23
45
67
89
1011
1213
C
attle
(Cro
ssbr
eed)
A. M
ales
i. Up
to 1
.5 y
ear
392
444
3964
699
131
372
418
113
1719
ii. O
ver 1
.5 y
ears
618
1091
4961
132
1543
158
125
352
3357
Tota
l 10
1015
3588
125
201
2456
395
329
535
1350
76B.
Fem
ales
i. un
der 1
yea
r 78
176
664
155
132
2015
328
04
457
428
16ii.
1 to
2.5
Yea
rs99
564
446
148
9525
115
379
225
36
2708
iii. O
ver 2
.5 y
ears
3280
1895
190
361
352
8737
456
372
06
7810
Tota
l50
5633
0530
066
455
213
264
212
222
614
3016
1332
5To
tal (
A+B)
6066
4840
388
789
753
156
1205
2175
3519
65`
2918
401
20th L
IVES
TOCK
CEN
SUS
Tabl
e No
.7.1
: Num
ber o
f Liv
esto
ck a
nd P
oultr
y as
Per
20th
Liv
esto
ck C
ensu
s
Sour
ce:D
irect
orat
e of
Ani
mal
Hus
band
ary
& Ve
terin
ary
serv
ices

79
Sour
ce:D
irect
orat
e of
Ani
mal
Hus
band
ary
& Ve
terin
ary
serv
ices
Spec
ies/
Year
Kohi
ma
Dim
apur
Pere
nPh
ekM
okok
chun
gW
okha
Zunh
ebot
oTu
ensa
ngKi
phire
Long
leng
Mon
Tota
l1
23
45
67
89
1011
1213
Cat
tle (i
ndig
enou
s)A.
Mal
esi.
Upto
2 y
ears
403
2096
1568
238
412
370
1949
538
187
546
2586
1089
3ii.
Ove
r 2 y
ears
375
7621
1987
415
571
788
3318
595
616
999
2735
2002
0To
tal
778
9717
3555
653
983
1158
5267
1133
803
1545
5321
3091
3B.
Fem
ales
i. un
der 1
yea
r 20
213
5312
3529
186
211
850
386
3615
9913
3475
83ii.
1 to
3 Y
ears
355
1412
1586
250
142
224
996
504
195
1008
1196
7768
iii. O
ver 3
yea
rs54
829
3322
5458
111
755
016
7838
036
121
2719
0213
631
Tota
l10
0556
9850
7513
2235
598
535
2412
7059
297
3444
3228
982
Tota
l (A+
B)17
8315
415
8630
1975
1324
2143
8791
2403
1395
6279
9754
5989
5To
tal (
Cr.+
In.)
7849
2025
590
1827
6420
8122
9999
9645
7814
3082
4497
8278
296
Cr. =
Cro
ssbr
eed
In. =
Indi
geno
us
Tabl
e No
.7.2
: Nu
mbe
r of L
ives
tock
and
Pou
ltry
as P
er 2
0th L
ives
tock
Cen
sus

80
Spec
ies/
Year
Kohi
ma
Dim
apur
Pere
nPh
ekM
okok
chun
gW
okha
Zunh
ebot
oTu
ensa
ngKi
phire
Long
leng
Mon
Tota
l1
23
45
67
89
1011
1213
Buf
falo
A. M
ales
i. Up
to 2
yea
r42
867
2297
160
93
116
646
4041
ii. O
ver 2
yea
rs12
417
1435
1143
162
3511
576
5969
Tota
l 16
615
8158
0859
171
353
2211
7210
010
B. F
emal
esi.
unde
r 1 y
ear
3627
081
917
22
26
317
614
89ii.
1 to
3 Y
ears
6132
295
215
32
64
95
8315
97iii
. Ove
r 3 y
ears
5756
214
2941
714
94
6625
58To
tal
154
115
3200
742
222
624
1232
856
44
Tabl
e No
.7.3
:Num
ber o
f Liv
esto
ck a
nd P
oultr
y as
Per
20th
Liv
esto
ck C
ensu
s
Tabl
e No
.7.4
: Nu
mbe
r of L
ives
tock
and
Pou
ltry
as p
er 2
0th L
IVES
TOCK
CEN
SUS
Spec
ies/
Year
Kohi
ma
Dim
apur
Pere
nPh
ekM
okok
chun
gW
okha
Zunh
ebot
oTu
ensa
ngKi
phire
Long
leng
Mon
Tota
l1
23
45
67
89
1011
1213
(1) P
ig (C
ross
bree
d)38
298
2560
671
1519
727
3970
796
727
067
3871
024
879
3717
0820
7090
(2) P
ig (I
ndig
enou
s)77
4139
709
2137
613
058
2025
2455
912
671
1064
327
548
7698
3057
719
7605
Tota
l46
039
6531
528
491
3278
541
732
2552
639
738
4935
327
796
1563
532
285
4046
95
Sour
ce:D
irect
orat
e of
Ani
mal
Hus
band
ary
& Ve
terin
ary
serv
ices

81
Dist
rict
Cat
tle
Buffa
lo
Mith
unPi
g Sh
eep
Goat
Ra
bbit
Hors
eDo
gsFo
wl
Duck
12
34
56
78
910
1112
1. K
ohim
a 78
5632
063
846
062
537
0017
493
026
088
2. D
imap
ur20
255
3735
142
6531
53
1122
782
365
3025
3
3. P
eren
90
1890
0917
0928
491
229
2076
2221
1662
63
4. P
hek
2764
1333
1835
3278
517
2987
1568
60
1343
0
5. M
okok
chun
g20
8173
041
898
399
452
10
1252
6
6. W
okha
2299
5712
225
526
879
837
660
7688
7. Z
unhe
boto
1022
09
4414
4057
63
3104
2229
016
481
8. T
uens
ang
4860
4677
2650
585
017
2015
900
1225
7
9. K
iphi
re
1430
2341
7227
867
040
660
60
7638
10. L
ongl
eng
8244
029
815
635
011
0930
320
7643
11. M
on
9782
1050
2280
3228
593
3794
2558
016
423
12.N
agal
and
7880
915
655
2333
640
7025
361
3191
557
938
2115
6690
Tabl
e No
.7.5
: Nu
mbe
r of L
ives
tock
and
Pou
ltrya
s Pe
r 20th
Liv
esto
ck C
ensu
s
Sour
ce:D
irect
orat
e of
Ani
mal
Hus
band
ary
& Ve
terin
ary
serv
ices

82
SNFa
rm/ D
ispe
nsar
y/Ce
ntre
..etc
Kohi
ma
Mok
okch
ung
Tuen
sang
Wok
haZu
nheb
oto
Phek
Mon
Dim
apur
Pere
nKi
phire
Long
leng
Tota
l1
23
45
67
89
1011
1213
141
Stat
e Po
ultry
Far
m/H
.U/C
.R.C
1
11
11
_1
21
92
Poul
try U
pgra
ding
Cen
tre3
Feed
Man
ufac
turin
g Ce
ntre
4St
ate
Cattl
e Br
eedi
ng F
arm
1
11
14
5Su
rti B
uffa
lo F
arm
11
6Da
iry U
pgra
ding
Cen
tre1
12
7Ru
ral D
airy
Pro
ject
8
Stat
e Pi
g Br
eedi
ng F
arm
1
11
11
21
11
11
109
Pigg
ery
Upgr
adin
g Ce
ntre
10Sh
eep
Rear
ing
Cent
re1
111
Artifi
cial
Inse
min
atio
n Ce
ntre
11
11
15
12Br
own
Swis
s Ca
ttle
Bree
ding
Far
m1
113
Regi
onal
A.I
Cent
res
11
14Ve
terin
ary
Heal
th C
entre
1715
58
1611
117
83
210
315
Feed
& F
odde
r Pro
duct
ion
1
11
14
16Ve
terin
ary
Disp
ensa
ry6
75
77
54
74
21
55
17Re
gion
al C
ross
-Bre
d Br
eedi
ng
Cent
re1
1
18De
v. of
Indi
geno
us C
attle
Bre
edin
g
Farm
( Red
Sin
dhi)
11
19De
v. of
Indi
geno
us B
uffa
lo(S
urti)
11
Tabl
e No
.7.6
: Nu
mbe
r of V
eter
inar
y Fa
rms,
Hos
pita
ls, D
ispe
nsar
ies
etc.
dur
ing
2019
-20
Sour
ce:D
irect
orat
e of
Ani
mal
Hus
band
ary
& Ve
terin
ary
serv
ices

83
20Ce
ntra
lised
Sem
en B
ank
11
21Qu
aran
tine
Chec
kpos
t 3
31
13
28
122
22Or
gani
sed
Slau
ghte
r Hou
se
23Di
seas
e In
vest
igat
ion
Cent
re1
124
V.F.A
Tra
inin
g In
stitu
te1
125
Vete
rinar
y Ho
spita
l1
11
11
11
11
11
11
26Re
gion
al B
roile
r Chi
ck P
rodu
ctio
n S
ub-
Inst
itutio
n27
Froz
en S
emen
Cum
-Bul
l Sta
tion
11
28Re
gion
al R
abbi
t Bre
edin
g Fa
rm1
129
Pony
Far
m1
130
Goat
Rea
ring
Farm
1
12
31Du
ck B
reed
ing
Farm
1
11
332
Quai
ls B
reed
ing
Farm
33Re
gion
al C
ross
bree
d Ca
ttle
Bree
ding
Far
m34
Mea
t Ins
pect
ion
Cent
re35
Feed
Anl
ytic
al L
abor
ator
y1
136
Bull
Rear
ing
Cent
re1
11
337
Capi
tal D
airy
Pla
nt (U
nder
NSD
CF)
11
38CV
O Of
fice
11
11
11
11
11
111
39Di
rect
orat
e Of
fice
11
40DD
I & D
IU1
11
341
Elis
a La
b1
142
FMD
Lab
11co
ntd
Sour
ce:D
irect
orat
e of
Ani
mal
Hus
band
ary
& Ve
terin
ary
serv
ices
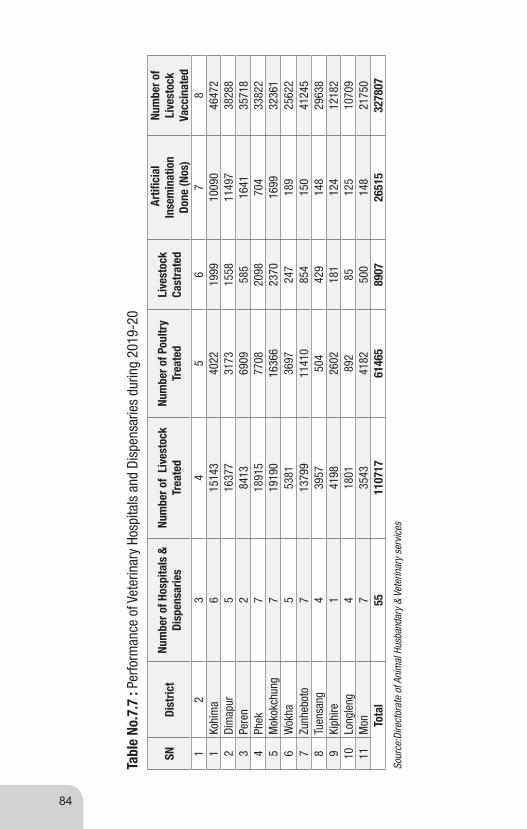
84
SNDi
stric
t Nu
mbe
r of H
ospi
tals
&
Disp
ensa
ries
Num
ber o
f Li
vest
ock
Trea
ted
Num
ber o
f Pou
ltry
Trea
ted
Live
stoc
k Ca
stra
ted
Art
ifici
al
Inse
min
atio
n
Done
(Nos
)
Num
ber o
f Li
vest
ock
Vacc
inat
ed1
23
45
67
81
Kohi
ma
615
143
4022
1999
1009
046
472
2Di
map
ur5
1637
731
7315
5811
497
3828
83
Pere
n2
8413
6909
585
1641
3571
84
Phek
718
915
7708
2098
704
3382
25
Mok
okch
ung
719
190
1636
623
7016
9932
361
6W
okha
553
8136
9724
718
925
622
7Zu
nheb
oto
713
799
1141
085
415
041
245
8Tu
ensa
ng4
3957
504
429
148
2963
89
Kiph
ire1
4198
2602
181
124
1218
210
Long
leng
418
0189
285
125
1070
911
Mon
735
4341
8250
014
821
750
Tota
l55
1107
1761
465
8907
2651
532
7807
Tabl
e No
.7.7
: Pe
rform
ance
of V
eter
inar
y Ho
spita
ls a
nd D
ispe
nsar
ies
durin
g 20
19-2
0
Sour
ce:D
irect
orat
e of
Ani
mal
Hus
band
ary
& Ve
terin
ary
serv
ices

85
SN Species 2017-18 2019-201 2 3 41 Cattle 9.73 9.80
2 Buffalo 4.56 3.97
3 Mithun NA
4 Sheep & Goat 0.66 0.65
5 Pig 16.81 16.93
6 Dog NA
7 Rabbit 31.76
Total 63.52 31.35
Table No.7.8 : Meat Production in Nagaland (‘000 mt)
SN Species 2017-18 2019-201 2 3 41 Cattle 87752 79824
2 Buffalo 28736 27446
3 Mithun -
4 Sheep & Goat 33969 42842
5 Pig 164004 212040
6 Dog -
7 Rabbit -
8 Others - 847619
TOTAL 314461 1209771
Table No.7.9: Number of Animals Slaughtered in Nagaland
Source:Directorate of Animal Husbandary & Veterinary services

86
SNYe
arM
ilk (
‘000
M.T
)Eg
g (In
Lak
h)
12
34
120
13-1
478
.35
758.
00
220
14-1
575
.92
352.
75
320
15-1
677
.69
454.
42
420
16-1
777
.83
396.
74
520
17-1
878
.45
398.
75
620
19-2
076
.50
39.0
8
Tabl
e No
.7.1
0 :M
ilk a
nd E
gg P
rodu
ctio
n in
Nag
alan
d
Sour
ce: D
irect
orat
e of
Ani
mal
Hus
band
ary
& Ve
terin
ary
Serv
ices
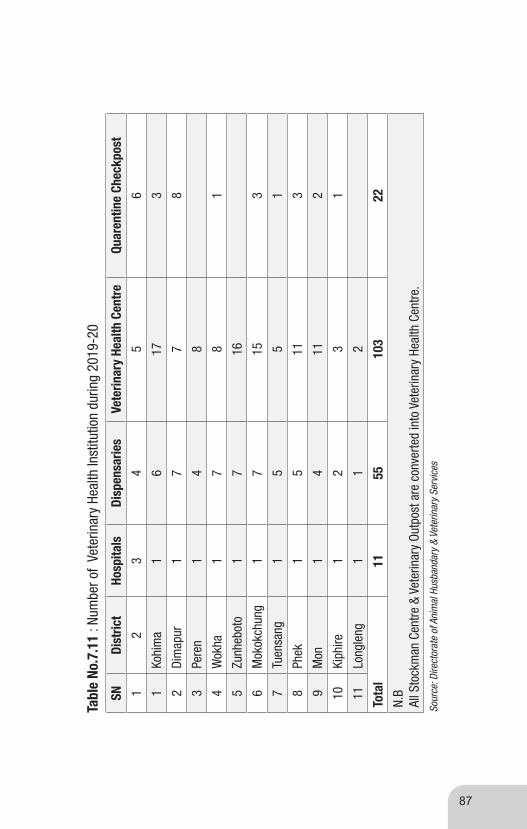
87
SNDi
stric
tHo
spita
lsDi
spen
sarie
sVe
terin
ary
Heal
th C
entr
eQu
aren
tine
Chec
kpos
t
12
34
56
1Ko
him
a1
617
3
2Di
map
ur1
77
8
3Pe
ren
14
8
4W
okha
17
81
5Zu
nheb
oto
17
16
6M
okok
chun
g1
715
3
7Tu
ensa
ng1
55
1
8Ph
ek1
511
3
9M
on1
411
2
10Ki
phire
12
31
11Lo
ngle
ng1
12
Tota
l11
5510
322
N.B
All S
tock
man
Cen
tre &
Vet
erin
ary
Outp
ost a
re c
onve
rted
into
Vet
erin
ary
Heal
th C
entre
.
Tabl
e No
.7.1
1 : N
umbe
r of
Vete
rinar
y He
alth
Inst
itutio
n du
ring
2019
-20
Sour
ce: D
irect
orat
e of
Ani
mal
Hus
band
ary
& Ve
terin
ary
Serv
ices


FOREST
8
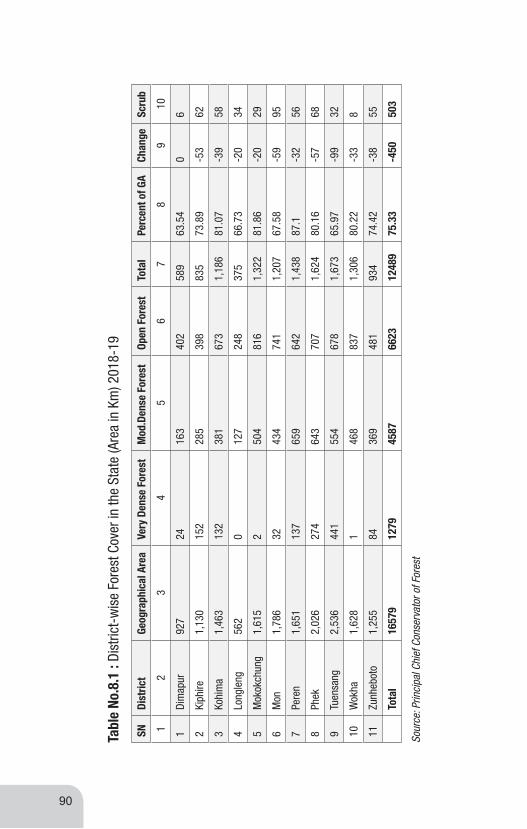
90
SNDi
stric
tGe
ogra
phic
al A
rea
Very
Den
se F
ores
tM
od.D
ense
For
est
Open
For
est
Tota
lPe
rcen
t of G
ACh
ange
Scru
b
12
34
56
78
910
1Di
map
ur92
724
163
402
589
63.5
40
6
2Ki
phire
1,13
015
228
539
883
573
.89
-53
62
3Ko
him
a1,
463
132
381
673
1,18
681
.07
-39
58
4Lo
ngle
ng56
20
127
248
375
66.7
3-2
034
5M
okok
chun
g1,
615
250
481
61,
322
81.8
6-2
029
6M
on1,
786
3243
474
11,
207
67.5
8-5
995
7Pe
ren
1,65
113
765
964
21,
438
87.1
-32
56
8Ph
ek2,
026
274
643
707
1,62
480
.16
-57
68
9Tu
ensa
ng
2,53
644
155
467
81,
673
65.9
7-9
932
10W
okha
1,62
81
468
837
1,30
680
.22
-33
8
11Zu
nheb
oto
1,25
584
369
481
934
74.4
2-3
855
Tota
l16
579
1279
4587
6623
1248
975
.33
-450
503
Sour
ce: P
rinci
pal C
hief
Con
serv
ator
of F
ores
t
Tabl
e No
.8.1
: Di
stric
t-w
ise
Fore
st C
over
in th
e St
ate
(Are
a in
Km
) 201
8-19

91
SNDi
stric
tGe
ogra
phic
al
Area
Very
Den
se F
ores
tM
od.D
ense
For
est
Open
For
est
Tota
lPe
rcen
t of G
ACh
ange
Scru
b
12
34
56
78
910
1Di
map
ur92
724
.00
161.
7140
6.38
592.
0963
.87
3.09
9.23
2Ki
phire
1130
151.
7227
7.8
405.
0683
4.58
73.8
6-0
.42
62.3
53
Kohi
ma
1463
131.
7037
7.68
673.
2811
82.6
680
.84
-3.3
457
.60
4Lo
ngle
ng56
20.
0012
5.45
246.
9537
2.4
66.2
6-2
.60
33.5
25
Mok
okch
ung
1615
1.89
501.
8982
3.83
1327
.61
82.2
05.
6122
.08
6M
on17
8632
.00
431.
3273
9.50
1202
.82
67.3
5-4
.18
127.
007
Pere
n16
5113
6.06
644.
4663
4.30
1414
.82
85.6
9-2
3.18
76.6
68
Phek
2026
272.
6163
7.83
705.
3716
15.8
179
.75
-8.1
985
.34
9Tu
ensa
ng
2536
438.
5754
7.10
713.
9916
99.6
667
.02
26.6
692
.35
10W
okha
1628
1.00
465.
1383
9.68
1305
.81
80.2
1-1
.19
10.4
711
Zunh
ebot
o12
5583
.64
363.
3549
1.15
938.
1474
.75
4.14
58.8
9To
tal
1657
912
73.1
945
33.7
266
79.4
912
486.
4075
.31
-2.6
063
5.49
Tabl
e No
.8.2
: Di
stric
t-w
ise
Fore
st C
over
in th
e St
ate
(Are
a in
Km
) 201
9-20
Sour
ce: P
rinci
pal C
hief
Con
serv
ator
of F
ores
t

Sour
ce: P
rinci
pal C
hief
Con
serv
ator
of F
ores
t
SNPa
rtic
ular
sFo
rest
Are
as (S
q.Km
s)%
of T
otal
For
est A
reas
12
34
Lega
l Sta
tus
a)Go
vern
men
t ow
ned
Fore
st
1Re
serv
ed F
ores
t and
Wild
life
Sanc
tuar
ies
264.
283.
06%
2Pr
otec
ted
Fore
st34
.69
0.40
%
3Pu
rcha
sed
Fore
st19
2.47
2.20
%
b)Go
vern
men
t Con
trolle
d (P
rivat
e ow
ned)
Fore
st
4Pr
otec
ted
Fore
st51
6.79
5.98
%
c)vi
llage
ow
ned
Fore
st
5Vi
rgin
For
est
4778
.27
55.9
0%
6De
grad
ed F
ores
t28
42.8
032
.90%
Tota
l (a+
b+c)
8629
.30
100.
00%
d)Ow
ners
hip
iSt
ate
Gove
rnm
ent
1008
.23
11.7
0%
iiPr
ivat
e Co
ntro
l76
21.0
788
.30%
Tota
l 86
29.3
010
0.00
%
Tabl
e No
.8.3
:Cla
ssifi
catio
n of
For
est A
reas
(In
Sq.K
m) 2
019-
20
92

CLIMATE & RAINFALL
9

94
SNM
onth
Ra
infa
ll in
mm
No. o
f Rai
ny D
ays
Tem
pera
ture
in O C
Max
.Tem
p.
Min
. Tem
p.
12
34
56
1Ja
nuar
y 80
.62
18.0
5.1
2Fe
brua
ry15
.41
20.9
6.5
3M
arch
58.2
522
.17.
9
4Ap
ril83
1024
.112
.4
5M
ay17
510
27.7
15.7
6Ju
ne20
8.1
1627
.017
.9
7Ju
ly28
6.4
2626
.017
.8
8Au
gust
355.
914
28.2
18.2
9Se
ptem
ber
266.
621
25.9
17.8
10Oc
tobe
r21
2.6
1222
.714
.5
11No
vem
ber
37.2
322
.311
.1
12De
cem
ber
0.0
017
.96.
2
Tabl
e No
.9.1
: Ra
infa
ll an
d Te
mpe
ratu
re a
t Koh
ima
Cent
re d
urin
g 2
019
Sour
ce:D
irect
orat
e of
Soi
l and
Wat
er C
onse
rvat
ion

95
Sour
ce:D
irect
orat
e of
Soi
l and
Wat
er C
onse
rvat
ion
SNYe
arAn
nual
Rai
nfal
l in
mm
120
0720
03.7
220
0819
99.1
320
0914
36.4
420
1026
75.1
520
1117
35.8
620
1213
70.7
720
1317
49.1
820
1413
83.3
920
1515
21.3
1020
1617
53.3
1120
1820
24.7
1220
1917
79
Tabl
e No
.9.2
: An
nual
Rai
nfal
l of K
ohim
a du
ring
2007
to 2
019

96
Year
of
Inst
alla
tion
Kohi
ma
Mon
Pere
n (J
aluk
ie)
Phek
Wok
haKi
phire
Zbto
Dmp
Mkg
Tsg
Long
leng
Man
gkol
emba
Mel
uri
Sham
ator
Bhan
dari
Sech
uTs
emin
yu
2019
16.8
922
.95
22.3
518
.11
17.7
915
.08
15.7
225
.50
13.0
915
.47
16.2
923
.51
31.7
516
.13
23.2
120
.36
18.8
5
Sour
ce:D
irect
orat
e of
Soi
l and
Wat
er C
onse
rvat
ion
Sour
ce:D
irect
orat
e of
Soi
l and
Wat
er C
onse
rvat
ion
Tabl
e No
.9.3
: St
atio
n-w
ise
Annu
al A
vera
ge M
ean
Tem
pera
ture
(°C)
Tabl
e No
.9.4
: Di
stric
t Wis
e Av
erag
e A
nnua
l Rai
nfal
l (In
Mm
)
Year
of
Inst
alla
tion
Kohi
ma
Mon
Pere
n (J
aluk
ie)
Phek
Wok
haKi
phire
Zbto
Dmp
Mkg
Tsg
Long
leng
Man
gkol
emba
Mel
uri
Sham
ator
Bhan
dari
Sech
uTs
emin
yu
2019
161.
1719
5.5
142.
0110
4.4
163.
384
.83
149.
8599
.14
173.
612
7.1
137.
4519
3.1
82.0
913
7.73
107.
816
0.94
209.
61
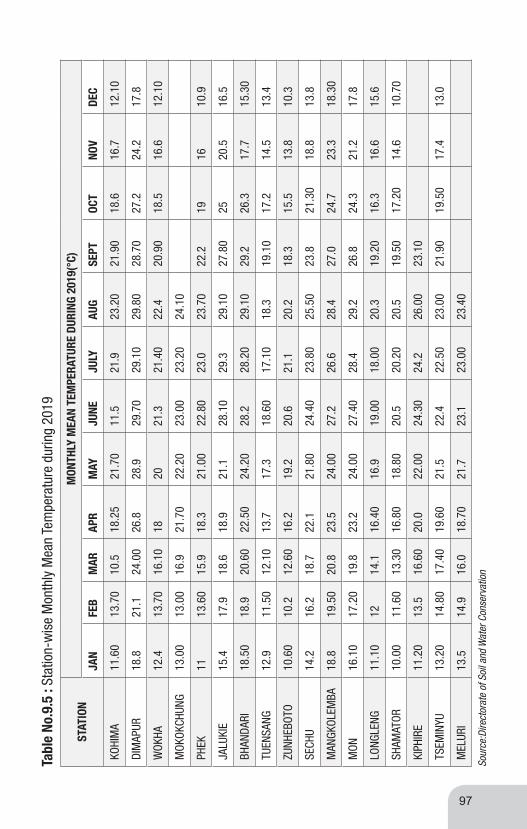
97
Tabl
e No
.9.5
: St
atio
n-w
ise
Mon
thly
Mea
n Te
mpe
ratu
re d
urin
g 20
19
STAT
ION
MON
THLY
MEA
N TE
MPE
RATU
RE D
URIN
G 20
19(°
C)
JAN
FEB
MAR
APR
MAY
JUNE
JULY
AUG
SEPT
OCT
NOV
DEC
KOHI
MA
11.6
013
.70
10.5
18.2
521
.70
11.5
21.9
23.2
021
.90
18.6
16.7
12.1
0
DIM
APUR
18.8
21.1
24.0
026
.828
.929
.70
29.1
029
.80
28.7
027
.224
.217
.8
WOK
HA12
.413
.70
16.1
018
2021
.321
.40
22.4
20.9
018
.516
.612
.10
MOK
OKCH
UNG
13.0
013
.00
16.9
21.7
022
.20
23.0
023
.20
24.1
0
PHEK
1113
.60
15.9
18.3
21.0
022
.80
23.0
23.7
022
.219
1610
.9
JALU
KIE
15.4
17.9
18.6
18.9
21.1
28.1
029
.329
.10
27.8
025
20.5
16.5
BHAN
DARI
18.5
018
.920
.60
22.5
024
.20
28.2
28.2
029
.10
29.2
26.3
17.7
15.3
0
TUEN
SANG
12.9
11.5
012
.10
13.7
17.3
18.6
017
.10
18.3
19.1
017
.214
.513
.4
ZUNH
EBOT
O10
.60
10.2
12.6
016
.219
.220
.621
.120
.218
.315
.513
.810
.3
SECH
U14
.216
.218
.722
.121
.80
24.4
023
.80
25.5
023
.821
.30
18.8
13.8
MAN
GKOL
EMBA
18.8
19.5
020
.823
.524
.00
27.2
26.6
28.4
27.0
24.7
23.3
18.3
0
MON
16.1
017
.20
19.8
23.2
24.0
027
.40
28.4
29.2
26.8
24.3
21.2
17.8
LONG
LENG
11.1
012
14.1
16.4
016
.919
.00
18.0
020
.319
.20
16.3
16.6
15.6
SHAM
ATOR
10.0
011
.60
13.3
016
.80
18.8
020
.520
.20
20.5
19.5
017
.20
14.6
10.7
0
KIPH
IRE
11.2
013
.516
.60
20.0
22.0
024
.30
24.2
26.0
023
.10
TSEM
INYU
13.2
014
.80
17.4
019
.60
21.5
22.4
22.5
023
.00
21.9
019
.50
17.4
13.0
MEL
URI
13.5
14.9
16.0
18.7
021
.723
.123
.00
23.4
0
Sour
ce:D
irect
orat
e of
Soi
l and
Wat
er C
onse
rvat
ion


FISHERY
10

100
SNPa
rtic
ular
sUn
itKo
him
aDi
map
urM
okok
chun
gTu
ensa
ngZu
nheb
oto
Mon
Wok
haPh
ekPe
ren
Kiph
ireLo
ngle
ngTo
tal
12
34
56
78
910
1112
1314
15
1Ne
w F
ishe
ry
Pond
s De
velo
ped
ha.
5.20
8.30
5.40
4.40
2.50
4.70
4.00
4.30
4.20
4.20
2.80
50.0
0
2No
. of
Bene
ficia
ries
(New
Pon
d)No
s18
2215
126
1216
1415
108
148
3Fi
sh S
eed
Supp
lied
Lakh
s8.
3012
.00
8.10
7.20
6.20
7.50
7.40
7.80
5.50
5.50
5.50
81.0
0
4No
. of
Bene
ficia
ries
(Fis
h Se
ed)
Nos
380
488
420
380
320
260
360
392
189
170
178
3537
5Pr
oduc
tion
of
Fish
(Cul
ture
&
Capt
ure)
M.T
362
4510
572
448
382
252
1132
412
478
300
210
9058
.00
6
Tota
l Wat
er
Area
(Pon
d &
Tank
s) in
cu
mm
ulat
ive
ha.
181.
2015
28.8
027
8.00
144.
4017
8.50
96.7
030
8.48
229.
4023
7.18
154.
4088
.44
3425
.50
7
Tota
l num
ber
of P
onds
&
Tank
s in
cu
mm
ulat
ive
Nos
1400
6690
1667
963
1399
706
1759
1383
1568
766
767
1909
8
Tabl
e No
.10
.1 :
Dist
rict-
wis
e Ac
hiev
emen
t of F
ishe
ries
Depa
rtmen
t 201
8-19
Sour
ce:D
irect
orat
e of
Fis
herie
s an
d Aq
uatic
Res
ourc
es

101
Sour
ce:D
irect
orat
e of
Fis
herie
s an
d Aq
uatic
Res
ourc
es
Tabl
e No
.10.
2 :
Dist
rict-
wis
e Ac
hiev
emen
to o
f Fis
herie
s De
partm
ent 2
019-
20
SNPa
rtic
ular
sUn
itKo
him
aDi
map
urM
okok
chun
gTu
ensa
ngZu
nheb
oto
Mon
Wok
haPh
ekPe
ren
Kiph
ireLo
ngle
ngTo
tal
12
34
56
78
910
1112
1314
15
1Ne
w F
ishe
ry
Pond
s De
velo
ped
ha.
6.00
8.50
5.00
5.00
3.00
4.50
4.70
4.80
4.40
4.00
3.50
53.4
0
2No
. of
Bene
ficia
ries
(New
Pon
d)No
s19
3315
188
1115
1913
1110
172
3Fi
sh S
eed
Supp
lied
Lakh
s9.
5013
.00
8.00
8.00
4.50
6.80
7.40
7.60
6.70
7.50
5.80
84.8
0
4No
. of
Bene
ficia
ries
(Fis
h Se
ed)
Nos
360
450
340
360
290
300
340
330
290
320
295
3675
5Pr
oduc
tion
of
Fish
(Cul
ture
&
Capt
ure)
M.T
398
4630
598
478
396.
628
611
7844
848
8.5
324
223.
0294
48.1
2
6
Tota
l Wat
er
Area
(Pon
d &
Tank
s) in
cu
mm
ulat
ive
ha.
186.
0015
52.3
028
3.00
148.
0018
0.00
99.3
031
1.00
232.
3023
9.00
157.
0086
.23
3474
.13
7
Tota
l num
ber
of P
onds
&
Tank
s in
cu
mm
ulat
ive
Nos
1415
6720
1674
973
1405
715
1765
1395
1574
774
807
1921
7
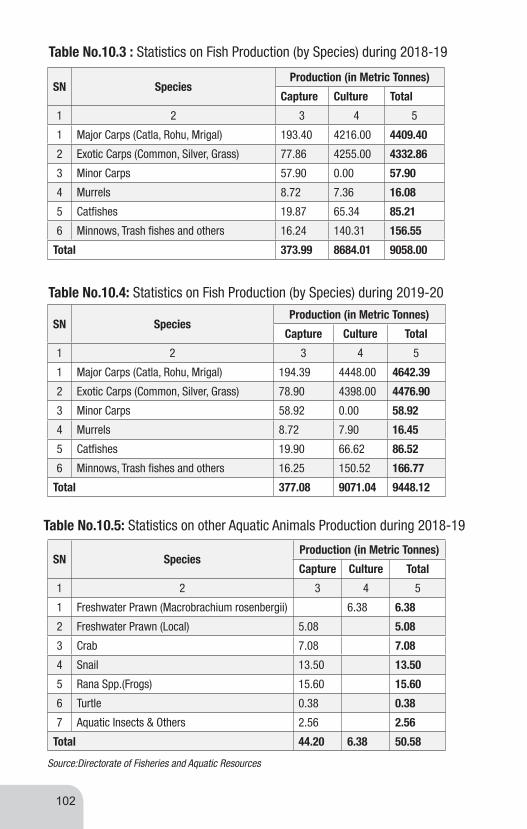
102
SN SpeciesProduction (in Metric Tonnes)
Capture Culture Total
1 2 3 4 5
1 Major Carps (Catla, Rohu, Mrigal) 193.40 4216.00 4409.40
2 Exotic Carps (Common, Silver, Grass) 77.86 4255.00 4332.86
3 Minor Carps 57.90 0.00 57.90
4 Murrels 8.72 7.36 16.08
5 Catfishes 19.87 65.34 85.21
6 Minnows, Trash fishes and others 16.24 140.31 156.55
Total 373.99 8684.01 9058.00
Table No.10.3 : Statistics on Fish Production (by Species) during 2018-19
SN SpeciesProduction (in Metric Tonnes)
Capture Culture Total
1 2 3 4 5
1 Major Carps (Catla, Rohu, Mrigal) 194.39 4448.00 4642.39
2 Exotic Carps (Common, Silver, Grass) 78.90 4398.00 4476.90
3 Minor Carps 58.92 0.00 58.92
4 Murrels 8.72 7.90 16.45
5 Catfishes 19.90 66.62 86.52
6 Minnows, Trash fishes and others 16.25 150.52 166.77
Total 377.08 9071.04 9448.12
Table No.10.4: Statistics on Fish Production (by Species) during 2019-20
Source:Directorate of Fisheries and Aquatic Resources
SN SpeciesProduction (in Metric Tonnes)
Capture Culture Total
1 2 3 4 5
1 Freshwater Prawn (Macrobrachium rosenbergii) 6.38 6.38
2 Freshwater Prawn (Local) 5.08 5.08
3 Crab 7.08 7.08
4 Snail 13.50 13.50
5 Rana Spp.(Frogs) 15.60 15.60
6 Turtle 0.38 0.38
7 Aquatic Insects & Others 2.56 2.56
Total 44.20 6.38 50.58
Table No.10.5: Statistics on other Aquatic Animals Production during 2018-19

103
Source:Directorate of Fisheries and Aquatic Resources
SN SpeciesProduction (in Metric Tonnes)
Capture Culture Total
1 2 3 4 5
1 Freshwater Prawn (Macrobrachium rosenbergii) 6.38 6.38
2 Freshwater Prawn (Local) 6.00 6.00
3 Crab 7.11 7.11
4 Snail 13.60 13.60
5 Rana Spp.(Frogs) 15.67 15.67
6 Turtle 0.40 0.40
7 Aquatic Insects & Others 2.58 2.58
Total 45.36 6.38 51.74
Table No.10.6: Statistics on other Aquatic Animals Production during 2019-20
SN ResourcesCulture and Capture
No. of Units Volume (M.T.) Water Area (ha)
1 2 3 4 5
1 Ponds and Tanks 19098 7433.33 3425.50
2 Rivers (1600 Kms) 3.17
3
Integrated Fish Farming
a) Earthen embankment (PFC) 10282 990.20 2930.00
b) Semi permanent embankment (PFC) 388 275.20 480.00
4 Reservoirs 1 350.00 2258.00
5 Lakes/Swamps etc. 1153 6.10 1070.00
Total 30922 9058.00 10173.50
Table No.10.7: Statistics on State’s Fisheries Resources during 2018-19
SN ResourcesCulture and Capture
No. of Units Volume (M.T.) Water Area (ha)
1 2 3 4 5
1 Ponds and Tanks 19217 7754.75 3474.13
2 Rivers (1600 Kms) 3.29
3
Integrated Fish Farming
a) Earthen embankment (PFC) 10285 1047.17 2999.14
b) Semi permanent embankment (PFC) 388 1015.20 553.94
4 Reservoirs 1 380.00 2258.00
5 Lakes/Swamps etc. 1153 6.05 1110.00
Total 31048 9448.12 10436.07
Table No.10.8: Statistics on State’s Fisheries Resources during 2019-20


INDUSTRIES &
COMMERCE
11

106
SNDi
stric
t 20
19-2
0
D.I.C
SUB-
DIC
12
34
1Ko
him
a 1
2
2Di
map
ur1
1
3Pe
ren
1
4Ph
ek1
2
5M
okok
chun
g1
3
6W
okha
1
1
7Zu
nheb
oto
13
8Tu
ensa
ng
1
9Ki
phire
1
10Lo
ngle
ng1
11M
on1
1
12No
klak
1
Naga
land
11
14
Sour
ce:D
irect
orat
e of
Indu
strie
s &
Com
mer
ce
Tabl
e No
.11.
1: S
tate
Gov
ernm
ent I
ndus
trial
Offi
ce

107
SNPa
rtic
ular
sKo
him
aDi
map
urPe
ren
Phek
Mok
okch
ung
Wok
haZu
nheb
oto
Tuen
sang
Kiph
ireLo
ngle
ngM
onNa
gala
nd
12
34
56
78
910
1112
1314
1Di
stric
t Ind
ustri
es C
entre
11
11
11
11
11
111
2Su
b- D
IC1
12
21
31
112
3Na
gala
nd In
dust
rial
Deve
lopm
ent C
orpo
ratio
n (N
IDC)
11
4Na
gala
nd H
andl
oom
&
Hand
icra
fts D
evel
opm
ent
Corp
orat
ion
(NHH
DC)
12
11
11
7
5Na
gala
nd In
dust
rial
Raw
Mat
eria
l & S
uppl
y Co
rpor
atio
n (N
IRM
SC)
11
6Na
gala
nd K
hadi
& V
illag
e In
dust
rial B
oard
(NKV
IB)
21
11
11
11
11
112
7*
Empo
rium
12
3
8W
eavi
ng T
rain
ing
Cent
re1
11
12
12
9
9RA
P Tr
aini
ng C
entre
(Rur
al
Artis
an P
rogr
amm
e)1
31
11
21
10
Sour
ce:D
irect
orat
e of
Indu
strie
s &
Com
mer
ce
Tabl
e No
.11.
2: In
dust
rial O
ffice
/ Boa
rds/
Em
poriu
ms/
Tra
inin
g Ce
ntre
as
on 3
1.03
.201
9

108
SNPa
rtic
ular
sKo
him
aDi
map
urPe
ren
Phek
Mok
okch
ung
Wok
haZu
nheb
oto
Tuen
sang
Kiph
ireLo
ngle
ngM
onNo
klak
Naga
land
23
45
67
89
1011
1213
1415
1Di
stric
t Ind
ustri
es
Cent
re1
11
11
11
11
11
11
2Su
b- D
IC2
12
31
31
114
3Na
gala
nd In
dust
rial
Deve
lopm
ent
Corp
orat
ion
(NID
C)1
1
4
Naga
land
Han
dloo
m
& Ha
ndic
rafts
De
velo
pmen
t Co
rpor
atio
n (N
HHDC
)
11
5
Naga
land
Indu
stria
l Ra
w M
ater
ial &
Su
pply
Cor
pora
tion
(NIR
MSC
)
11
6Na
gala
nd K
hadi
&
Villa
ge In
dust
rial
Boar
d (N
KVIB
)1
1
7*
Empo
rium
11
8W
eavi
ng T
rain
ing
Cent
re1
11
11
5
9RA
P Tr
aini
ng C
entre
(R
ural
Arti
san
Prog
ram
me)
13
11
11
7
Tabl
e No
.11.
3: In
dust
rial O
ffice
/ Boa
rds/
Em
poriu
ms/
Tra
inin
g Ce
ntre
as
on 3
1.03
.202
0
Sour
ce:D
irect
orat
e of
Indu
strie
s &
Com
mer
ce
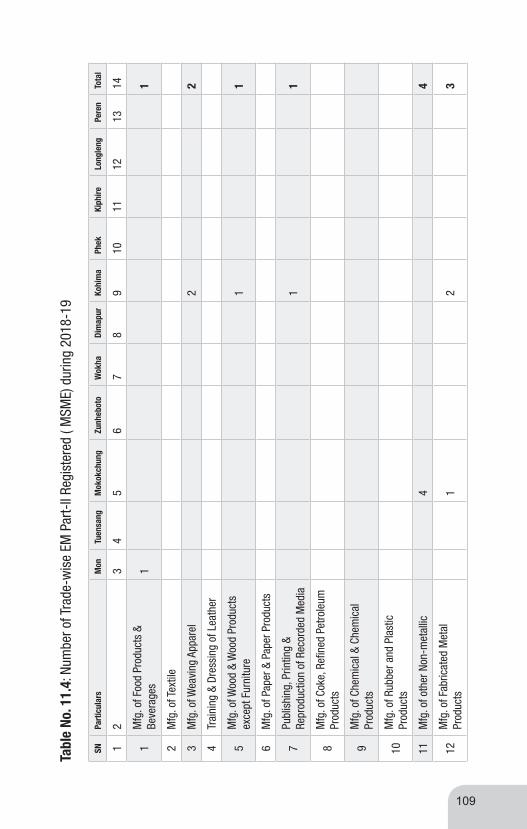
109
SNPa
rtic
ular
sM
onTu
ensa
ngM
okok
chun
gZu
nheb
oto
Wok
haDi
map
urKo
him
aPh
ekKi
phire
Long
leng
Pere
nTo
tal
12
34
56
78
910
1112
1314
1M
fg. o
f Foo
d Pr
oduc
ts &
Be
vera
ges
11
2M
fg. o
f Tex
tile
3M
fg. o
f Wea
ving
App
arel
22
4Tr
aini
ng &
Dre
ssin
g of
Lea
ther
5M
fg. o
f Woo
d &
Woo
d Pr
oduc
ts
exce
pt F
urni
ture
11
6M
fg. o
f Pap
er &
Pap
er P
rodu
cts
7Pu
blis
hing
, Prin
ting
& Re
prod
uctio
n of
Rec
orde
d M
edia
11
8M
fg. o
f Cok
e, R
efine
d Pe
trole
um
Prod
ucts
9M
fg. o
f Che
mic
al &
Che
mic
al
Prod
ucts
10M
fg. o
f Rub
ber a
nd P
last
ic
Prod
ucts
11M
fg. o
f oth
er N
on-m
etal
lic4
4
12M
fg. o
f Fab
ricat
ed M
etal
Pr
oduc
ts1
23
Tabl
e No
. 11.
4: N
umbe
r of T
rade
-wis
e EM
Par
t-II
Regi
ster
ed (
MSM
E) d
urin
g 20
18-1
9

110
13M
fg. o
f Mac
hine
ry &
Equ
ipm
ents
NE
C
14M
fg. o
f Ele
ctro
nic
Mac
hine
ry
NEC
15M
fg. o
f Mot
or V
ehic
le T
raile
rs &
Se
mi-
Trai
lers
16M
fg. o
f Fur
nitu
re1
1
17M
aint
enan
ce &
Rep
air o
f Mot
or
Vehi
cle
& M
otor
Cyc
les
18M
aint
enan
ce &
Rep
air o
f Pe
rson
al &
Hou
seho
ld G
oods
19Co
mpu
ter &
Rel
ated
Act
iviti
es
20Ot
her B
usin
ess
Activ
ities
21He
alth
& S
ocia
l Wor
k
22Re
crea
tion
Cultu
re &
Spo
rting
Ac
tiviti
es
23Ot
her S
ervi
ces
Activ
ities
22
Tot
al15
Cont
d.
Sour
ce:D
irect
orat
e of
Indu
strie
s &
Com
mer
ce

111
SNPa
rtic
ular
sM
onTu
ensa
ngM
okok
chun
gZu
nheb
oto
Wok
haDi
map
urKo
him
aPh
ekKi
phire
Long
leng
Pere
nTo
tal
12
34
56
78
910
1112
1314
1M
fg. o
f Foo
d Pr
oduc
ts &
Be
vera
ges
11
2M
fg. o
f Tex
tile
11
3M
fg. o
f Wea
ving
App
arel
11
4Tr
aini
ng &
Dre
ssin
g of
Le
athe
r
5M
fg. o
f Woo
d &
Woo
d Pr
oduc
ts e
xcep
t Fur
nitu
re1
1
6M
fg. o
f Pap
er &
Pap
er
Prod
ucts
7Pu
blis
hing
, Prin
ting
& Re
prod
uctio
n of
Rec
orde
d M
edia
11
8M
fg. o
f Cok
e, R
efine
d Pe
trole
um P
rodu
cts
9M
fg. o
f Che
mic
al &
Ch
emic
al P
rodu
cts
10M
fg. o
f Rub
ber a
nd P
last
ic
Prod
ucts
11M
fg. o
f oth
er N
on-m
etal
lic6
6
Tabl
e No
.11.
5: N
umbe
r of T
rade
-wis
e En
trepr
eneu
rs M
emor
andu
m (E
M) P
art-
II Re
gist
ered
( M
SME)
dur
ing
2019
-20

112
Sour
ce:D
irect
orat
e of
Indu
strie
s &
Com
mer
ce
12M
fg. o
f Fab
ricat
ed M
etal
Pr
oduc
ts2
24
13M
fg. o
f Mac
hine
ry &
Eq
uipm
ents
NEC
14M
fg. o
f Ele
ctro
nic
Mac
hine
ry N
EC
15M
fg. o
f Mot
or V
ehic
le
Trai
lers
& S
emi-
Trai
lers
16M
fg. o
f Fur
nitu
re1
1
17M
aint
enan
ce &
Rep
air
of M
otor
Veh
icle
& M
otor
Cy
cles
18M
aint
enan
ce &
Rep
air
of P
erso
nal &
Hou
seho
ld
Good
s
19Co
mpu
ter &
Rel
ated
Ac
tiviti
es
20Ot
her B
usin
ess
Activ
ities
21He
alth
& S
ocia
l Wor
k
22Re
crea
tion
Cultu
re &
Sp
ortin
g Ac
tiviti
es
23Ot
her S
ervi
ces
Activ
ities
22
Tot
al10
818co
ntd

113
Sl. N
oDi
stric
t20
18-1
9
Regd
.Em
ploy
men
t Gen
erat
ed
12
34
1Ko
him
a8
72
2Di
map
ur
3Ph
ek
4M
okok
chun
g7
144
5W
okha
6Zu
nheb
oto
7Tu
ensa
ng
8M
on
9Pe
ren
10Ki
phire
11Lo
ngle
ng
Tot
al15
216
Tabl
e No
. 11.
6 :
Num
ber o
f EM
Par
t-II
Regi
ster
ed. (
MSM
E) a
nd E
mpl
oym
ent G
ener
ated
201
8-19
Sour
ce:D
irect
orat
e of
Indu
strie
s &
Com
mer
ce
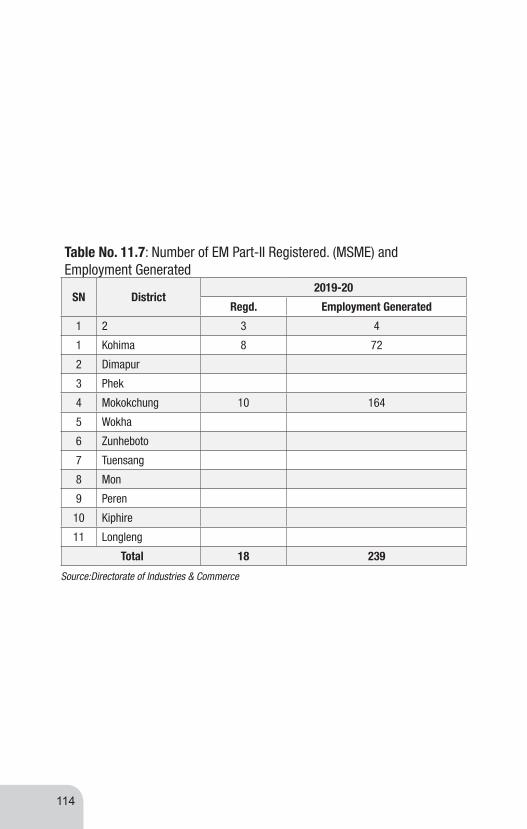
114
SN District2019-20
Regd. Employment Generated
1 2 3 4
1 Kohima 8 72
2 Dimapur
3 Phek
4 Mokokchung 10 164
5 Wokha
6 Zunheboto
7 Tuensang
8 Mon
9 Peren
10 Kiphire
11 Longleng
Total 18 239
Table No. 11.7: Number of EM Part-II Registered. (MSME) and Employment Generated
Source:Directorate of Industries & Commerce
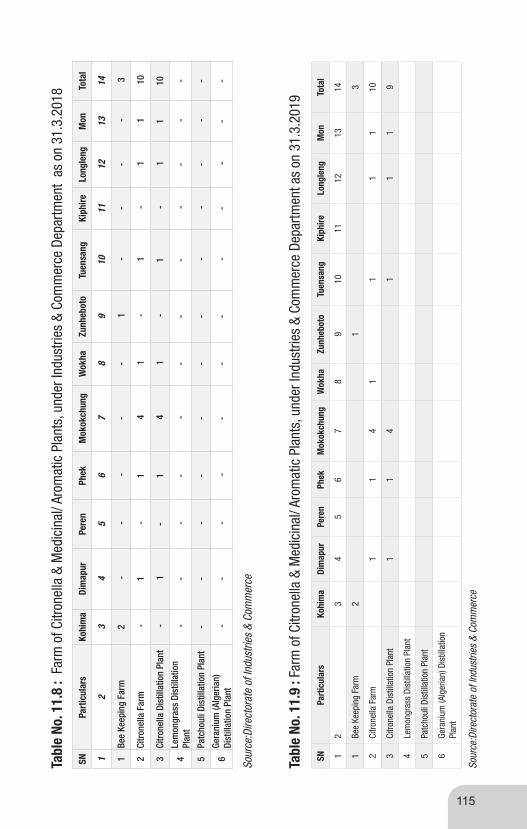
115
SNPa
rtic
ular
sKo
him
aDi
map
urPe
ren
Phek
Mok
okch
ung
Wok
haZu
nheb
oto
Tuen
sang
Kiph
ireLo
ngle
ngM
onTo
tal
12
34
56
78
910
1112
1314
1Be
e Ke
epin
g Fa
rm2
- -
--
- 1
--
- -
3
2Ci
tron
ella
Far
m -
1 -
1 4
1 -
1 -
1 1
10
3Ci
tron
ella
Dis
tilla
tion
Plan
t -
1-
1 4
1 -
1 -
11
10
4Le
mon
gras
s Di
still
atio
n Pl
ant
--
--
--
- -
--
--
5Pa
tcho
uli D
istil
latio
n Pl
ant
- -
--
- -
- -
--
--
6Ge
rani
um (A
lger
ian)
Di
still
atio
n Pl
ant
--
- -
- -
- -
- -
- -
Tabl
e No
. 11.
8 :
Farm
of C
itron
ella
& M
edic
inal
/ Aro
mat
ic P
lant
s, u
nder
Indu
strie
s &
Com
mer
ce D
epar
tmen
t as
on
31.3
.201
8
Sour
ce:D
irect
orat
e of
Indu
strie
s &
Com
mer
ce
SNPa
rtic
ular
sKo
him
aDi
map
urPe
ren
Phek
Mok
okch
ung
Wok
haZu
nheb
oto
Tuen
sang
Kiph
ireLo
ngle
ngM
onTo
tal
12
34
56
78
910
1112
1314
1Be
e Ke
epin
g Fa
rm2
13
2Ci
trone
lla F
arm
11
41
11
110
3Ci
trone
lla D
istil
latio
n Pl
ant
11
41
11
9
4Le
mon
gras
s Di
still
atio
n Pl
ant
5Pa
tcho
uli D
istil
latio
n Pl
ant
6Ge
rani
um (A
lger
ian)
Dis
tilla
tion
Plan
t
Sour
ce:D
irect
orat
e of
Indu
strie
s &
Com
mer
ce
Tabl
e No
. 11.
9 : F
arm
of C
itron
ella
& M
edic
inal
/ Aro
mat
ic P
lant
s, u
nder
Indu
strie
s &
Com
mer
ce D
epar
tmen
t as
on 3
1.3.
2019

116
SNPa
rtic
ular
sKo
him
aDi
map
urPe
ren
Phek
Mok
okch
ung
Wok
haZu
nheb
oto
Tuen
sang
Kiph
ireLo
ngle
ngM
onTo
tal
12
34
56
78
910
1112
1314
1Be
e Ke
epin
g Fa
rm1
12
2Ci
trone
lla F
arm
11
41
11
110
3Ci
trone
lla D
istil
latio
n Pl
ant
11
41
11
110
4Le
mon
gras
s Di
still
atio
n Pl
ant
5Pa
tcho
uli D
istil
latio
n Pl
ant
6Ge
rani
um (A
lger
ian)
Di
still
atio
n Pl
ant
Tabl
e No
. 11.
10 :
Farm
of C
itron
ella
& M
edic
inal
/ Aro
mat
ic P
lant
s, u
nder
Indu
strie
s &
Com
mer
ce D
epar
tmen
t as
on 3
1.3.
2020
Sour
ce:D
irect
orat
e of
Indu
strie
s &
Com
mer
ce

117
SNDistrict 2019-20
2 3
1 Kohima 58
2 Dimapur 80
3 Peren 30
4 Phek 47
5 Mokokchung 80
6 Wokha 40
7 Zunheboto 40
8 Tuensang 66
9 Kiphire 26
10 Longleng 30
11 Mon 60
Nagaland 557
Table No. 11.12 : District-wise Number of Beneficiaries Under Prime Minister Employment Generation Programme (PMEGP)
Source:Directorate of Industries & Commerce
Sl.No District 2018-19
1 2 3
1 Kohima 66
2 Dimapur 94
3 Peren 24
4 Phek 30
5 Mokokchung 90
6 Wokha 24
7 Zunheboto 30
8 Tuensang 32
9 Kiphire 6
10 Longleng 24
11 Mon 32
Nagaland 452
Table No. 11.11 : District-wise Number of Beneficiaries Under Prime Minister Employment Generation Programme (PMEGP) 2018-19

118
SNPa
rtic
ular
sKo
him
aDi
map
urPe
ren
Phek
Mok
okch
ung
Wok
haZu
nheb
oto
Tuen
sang
Kiph
ireLo
ngle
ngM
onTo
tal
12
34
56
78
910
1112
1314
1In
tern
atio
nal B
orde
r Tra
de
Cent
re-
- -
1 -
- -
1 -
- 1
3
2Sp
ecia
l Eco
nom
ic Z
one
- 1
- -
- -
--
- -
- 1
Tabl
e No
. 11.
13 :
Inte
rnat
iona
l Bor
der T
rade
Cen
tre/S
peci
al E
cono
mic
Zon
e un
der I
ndus
tries
& C
omm
erce
as
on
31.0
3.20
18
SNPa
rtic
ular
sKo
him
aDi
map
urPe
ren
Phek
Mok
okch
ung
Wok
haZu
nheb
oto
Tuen
sang
Kiph
ireLo
ngle
ngM
onTo
tal
12
34
56
78
910
1112
1314
1In
tern
atio
nal B
orde
r Tr
ade
Cent
re1
11
3
2Sp
ecia
l Eco
nom
ic
Zone
11
Sour
ce:D
irect
orat
e of
Indu
strie
s &
Com
mer
ce
Tabl
e No
. 11.
14 ;
Inte
rnat
iona
l Bor
der T
rade
Cen
tre/S
peci
al E
cono
mic
Zon
e Un
der I
ndus
tries
& C
omm
erce
as
on 3
1.03
.201
9
SNPa
rtic
ular
sKo
him
aDi
map
urPe
ren
Phek
Mok
okch
ung
Wok
haZu
nheb
oto
Tuen
sang
Kiph
ireLo
ngle
ngM
onTo
tal
23
45
67
89
1011
1213
14
1In
tern
atio
nal B
orde
r Tra
de
Cent
re2
11
4
2Sp
ecia
l Eco
nom
ic Z
one
11
Tabl
e No
. 11.
15 :
Inte
rnat
iona
l Bor
der T
rade
Cen
tre/S
peci
al E
cono
mic
Zon
e Un
der I
ndus
tries
& C
omm
erce
as
on 3
1.03
.202
0

119
SN CharacteresticsNagaland State
Regd. SSI Sector
Unregd.SSI Sector
1 2 3 4
1Total no. of Permanent Regd. SSI Units as on 31.03.2001 as per Frame
18
2 No. of Regd. Units for which Data was Collected
3 No. of Working Units 18
4 No. of Closed Units
5 No. of Women Enterprises 3
6 Total Employment 239
7 Per Unit Employment 13
8 Total Fixed Investment (Rs. in Lakhs) NA
9 Per Unit Fixed Investment( Rs. In Lakhs) NA
10 Total Original Value of Plant & Machinery (Rs. In Lakhs) 306
11 Per Unit Original Value of Plant & Machinery (Rs. In Lakhs) 17
12 Total Gross Output (Rs. In Lakhs) NA
13 Per Unit Gross Output (Rs. In Lakhs) NA
14No. of Units having Outstanding Loan with Institutional Sources as on 31.03.02
15 No. of Units having Outstanding Loan as on 31.03.02
16No. of Sick Units (with Erosion of net worth by more than 50% or delay in Repayment of Institutional Loan by more than 12 months)
17No. of Incipient Sick Units (Decline in Gross Output over three Consecutive Years)
18
Reason for Sickness/ Incipient Sickness:
Lack of Demand
Shortage of Working Capital/ Non-Availability of Raw Material
Power Shortage
Labour Problems
Marketing Problems
Equipment Problems
Management problems
Table No. 11.16 : Micro Small & Medium Enterprises (MSMEs)in Nagaland during the year 2019-20

19
No. of Units Managed by:
SC
ST
OBC
Others
20
Type of organisation:
Proprietory
Partnership
Private Company
Co-operatives
Others
21
Nature of activity:
Manufacturing/ Assembling/ Processing
Repairing & Maintenance
Services
22
Main Sources of Power:
No. Power Needed
Coal
Oil
LPG
Electricity
Non-Conventional Energy
Traditional Energy/ Firewood
Source:Directorate of Industries & Commerce
120
contd
POWER & ELECTRICITY
12

122
12
34
Gene
ratio
n S
ecto
rs
SNNa
me
of th
e Pr
ojec
tLo
catio
n/di
stric
tCa
paci
ty(M
W)
1Li
kim
ro H
EPKi
phire
24
2La
ng H
EPNo
klak
1
3Te
hok
HEP
Mon
1
Inst
alle
d Ca
paci
ty
SNNa
me
of th
e Pr
ojec
tLo
catio
n/di
stric
tCa
paci
ty(M
W)
1Li
kim
ro H
ydro
Ele
ctric
pro
ject
Kiph
ire24
2La
ng S
mal
l Hyd
ro P
roje
ctTu
ensa
ng1
3Te
hok
Smal
l Hyd
ro P
roje
ctM
on1
Sour
ce: A
AR 2
018-
19,
Depa
rtmen
t of P
ower
Tabl
e No
. 12.
1 :
Inst
alle
d Ca
paci
ty a
nd G
ener
atio
n Se
ctor
of E
lect
ricity
dur
ing
2018
-19

123
SNDi
visi
onVE
MB
UEM
B
No o
f SPM
No. o
f Con
sNo
of S
PMNo
. of C
ons
1Di
map
ur14
1575
474
5
2Ch
umuk
edim
a22
821
791
3Ko
him
a15
811
949
128
0
4Pe
ren
7752
75
5W
okha
102
6684
6Ph
ek11
510
104
7M
okok
chun
g12
715
207
1894
44
8Ch
angt
ongy
a67
8868
9Ki
phire
9743
84
10M
on12
810
951
11Tu
ensa
ng10
978
85
12Zu
nheb
oto
156
6553
Tota
l13
7811
1226
2310
469
SPM
- S
ingl
e Po
int M
eter
ing
VEM
P- V
illag
e El
ectr
icity
Man
agem
ent B
oard
UEM
B- U
rban
Ele
ctric
ity M
anag
emen
t Boa
rd
Tabl
e No
. 12.
2: D
ivis
ion-
wis
e de
tails
of S
PM m
anag
ed b
y UE
MB
& VE
MB
Durin
g 20
18-1
9
Sour
ce: C
hief
Eng
inee
r, Po
wer

124
SNCa
tego
ry
No.o
f Con
sum
ers
% o
f Con
sum
ptio
n
1Do
mes
tic13
6734
35.9
2
2Co
mm
erci
al22
071
11.8
7
3In
dust
rial
4690
7.07
4Bu
lk15
2214
.93
5PW
W38
0.06
6Irr
igat
ion
10.
00
7Pu
blic
Lig
ht62
10.
15
8VE
MB
1112
2625
.38
9UE
MB
1046
94.
62
Tota
l 28
7372
100
Tabl
e No
. 12.
3 : C
ateg
ory
wis
e Nu
mbe
r of C
onsu
mer
s an
d th
e Pe
rcen
tage
Con
sum
ptio
n of
eac
h Ca
tego
ry d
urin
g 20
18-1
9
Sour
ce: C
hief
Eng
inee
r, Po
wer

125
SNPe
riod
Reve
nue
Rece
ipts
(Rs.
Cr)
Inc/
Dcr(
Rs.C
r)In
c/Dc
r (%
)
120
16-1
7: u
pto
Dec
2016
74.2
3
220
17-1
8;up
to D
ec 2
017
84.7
9.94
13.3
9
320
18-1
9: u
pto
Dec
2018
89.9
55.
786.
87
Pow
er P
urch
ase
and
Reve
nue
Rece
ipts
for t
he th
ree
year
s
SNYe
arPo
wer
Pur
chas
ed (M
U)Po
wer
Pur
chas
ed
(Rs.
Cr)
Reve
nue
Rece
ipts
120
15-1
677
3.77
249.
0811
2.73
220
16-1
780
5.67
296.
8411
6.42
320
17-1
879
4.68
296.
9713
0.15
Sour
ce: C
hief
Eng
inee
r, Po
wer
Tabl
e No
. 12.
4 : R
even
ue R
ecei
pts
(With
in th
e St
ate)
In th
e th
ree
Quar
ters
of 2
017-
18 &
201
8-19


TRANSPORT & COMMUNICATION
13

128
SNDi
stric
t Na
tiona
l Hi
ghw
aySt
ate
High
way
Maj
or D
istr
ict R
oad
(MDR
)Ot
her D
istr
ict R
oad
(ODR
)Ur
ban
Road
Tow
n Ro
adRu
ral R
oad
TOTA
L
Surfa
ced
Unsu
rface
d Su
rface
dUn
surfa
ced
Surfa
ced
Unsu
rface
d Su
rface
dUn
surfa
ced
Surfa
ced
Unsu
rface
d
1Ko
him
a15
5.5
4218
9.6
56.6
257.
647
.588
.49.
352
.557
213.
541
4.9
1718
.6
2M
okok
chun
g 24
3.5
94.3
200.
3571
212.
631
3.5
98.7
41.5
40.5
46.8
277.
1725
1.89
1648
.31
3Tu
ensa
ng19
9.9
6846
124
40.5
660.
60
024
8069
529
1641
.1
4M
on19
7.4
184
127.
30
178
267.
50
056
.289
.814
2.5
211.
312
56.6
5Ph
ek27
8.3
165
177.
242
200.
510
8.8
00
25.7
2125
.123
3.23
998.
53
6Zu
nheb
oto
135
212.
755
4918
314
3.5
00
6694
.65
109.
554
1.4
1454
.75
7Di
map
ur13
1.88
4112
7.2
017
1.85
2921
2.4
944
.15
2626
4.4
131
1056
8Pe
ren
5018
76.
540
125
580
024
29.5
8512
968
4
9Lo
ngle
ng41
3514
8.5
017
330
027
425
6034
9.5
10Ki
phire
77.4
4011
20
078
.50
012
1114
.730
3.91
572.
11
11W
okha
3760
179
015
894
00
7436
150.
523
8.5
990
Tota
l 15
46.8
811
2913
68.6
538
2.6
1544
.05
1833
.939
9.5
59.8
446.
0549
5.75
1376
.37
3044
.13
1207
9.8
1546
.88
1129
1721
.25
3377
.95
459.
394
1.8
4420
.512
079.
8
Sour
ce:-
PW
D (R
&B)
Tabl
e No
. 13.
1 :
Dist
rict-
wis
e To
tal L
engt
h of
Roa
d in
Nag
alan
d PW
D (R
&B) d
urin
g 20
18-1
9

129
SNDi
stric
t Na
tiona
l Hi
ghw
aySt
ate
High
way
Maj
or D
istr
ict R
oad
(M
DR)
Othe
r Dis
tric
t Roa
d (O
DR)
Urba
n Ro
adTo
wn
Road
Rura
l Roa
dTO
TAL
Surfa
ced
Unsu
rface
d Su
rface
dUn
surfa
ced
Surfa
ced
Unsu
rface
d Su
rface
dUn
surfa
ced
Surfa
ced
Unsu
rface
d
1Ko
him
a0.
0018
9.00
56.0
025
7.60
47.5
088
.40
57.0
052
.50
5721
3.5
414.
9013
86.9
0
2M
okok
chun
g 0.
0020
0.00
71.0
021
2.60
313.
5098
.70
41.5
040
.50
46.8
277.
1725
1.89
1554
.01
3Tu
ensa
ng24
.50
46.0
012
4.00
40.5
066
0.60
0.00
0.00
24.0
080
69.0
052
9.00
1597
.60
4M
on69
.00
127.
300.
0017
8.00
267.
500.
000.
0056
.20
89.8
142.
5021
1.30
1141
.60
5Ph
ek13
5.00
177.
2042
.00
200.
5010
8.80
0.00
0.00
25.7
021
25.1
023
3.23
968.
53
6Zu
nheb
oto
0.00
55.0
049
.00
183.
0014
3.50
0.00
9.00
66.0
094
.65
109.
5054
1.40
1242
.05
7Di
map
ur30
.00
127.
200.
0017
1.85
29.0
021
2.40
0.00
44.1
526
264.
4013
1.00
1045
.00
8Pe
ren
199.
006.
5040
.00
125.
0058
.00
0.00
0.00
24.0
029
.585
.00
129.
0069
6.00
9Lo
ngle
ng26
.50
148.
500.
0017
.00
33.0
00.
000.
0027
.00
425
.00
60.0
034
1.00
10Ki
phire
106.
0011
2.00
0.00
0.00
78.5
00.
000.
0012
.00
1114
.70
303.
9163
8.11
11W
okha
60.0
017
9.00
0.00
158.
0094
.00
0.00
59.8
074
..00
3615
0.50
238.
5099
0.00
Tota
l 65
0.00
1368
.65
382.
6015
44.0
518
33.9
039
9.50
459.
394
1.8
495.
7513
76.3
730
44.1
311
600.
80
*A to
tal l
engt
h of
479
Km
(Out
of 1
129
Km) o
f the
sta
te h
ighw
ay w
as u
pgra
ded
to N
atio
nal H
ighw
ay re
duci
ng th
e le
ngth
of t
he s
tate
Hig
hway
to 6
50 K
m o
nly
Tabl
e No
. 13.
2 : D
istri
ct-w
ise
Tota
l Len
gth
of R
oad
in N
agal
and
PWD
(R&B
) dur
ing
2019
-20
Sour
ce:-
PW
D (R
&B)

130
SNNH
. No
Deta
ils o
f str
etch
Leng
th (k
m)
With
PW
DW
ith
NHID
CLW
ith
BRO
Tota
l Le
ngth
129
Assa
m B
orde
r-Di
map
ur (T
rago
pan
Jn)-
Koh
ima-
Chiz
ami-M
anip
ur B
orde
r29
.38
48.8
124.
720
2.88
22
Assa
m B
orde
r (Tu
li)-
Mer
angk
ong-
Chan
gton
gya-
Mok
okch
ung-
Wok
ha-
Tsem
inyu
-Koh
ima-
Man
ipur
Bor
der
245.
60
24.9
270.
5
320
2M
okok
chun
g-Tu
ensa
ng –
Sam
purr
e –
Mel
uri –
Man
ipur
Bor
der
326.
50
032
6.5
412
9As
sam
Bor
der –
Dim
apur
(Tra
gopa
n Jn
)1
00
1
512
9A N
ewM
anip
ur B
orde
r – P
eren
– J
aluk
ie –
Pim
la J
unct
ion
– Ra
zaph
e Ju
nctio
n -
Dim
apur
063
871
670
2 Ne
wCh
angt
ongy
a –
Long
ling
– Lo
nhch
ing
– M
on –
Lap
a –
Tizi
t – A
ssam
Bo
rder
132
045
177
770
2A N
ewM
okok
chun
g –
Zunh
ebot
o –
phek
– M
elur
i26
00
026
0
870
2B N
ewLo
nglin
g on
new
NH
No. 7
02 in
Ass
am a
nd te
rmin
atin
g at
its
junc
tion
with
new
NH
No.2
02 a
t Tue
nsan
g in
Nag
alan
d27
077
104
970
2D N
ewNe
ar M
okok
chun
g (N
H No
.2)-
Mar
iani
and
term
inat
ion
at N
H 71
5 ne
ar
Jorh
at A
ssam
022
85
1032
9 A
New
Junc
tion
with
Nh
329
near
Dip
hu in
the
stat
e As
sam
and
term
inat
ing
at
Pim
la J
unct
ion
on N
H No
.129
A in
the
stat
e of
Nag
alan
d30
00
30
1122
9 Ne
wJu
nctio
n w
ith N
H No
. 29
at S
ub ja
il co
nnec
ting
Thah
ekhu
, Chu
muk
edim
a an
d te
rmin
atin
g at
its
junc
tion
with
NH
No. 2
919
00
19
Sub
Tota
l11
33.4
811
1.8
301.
615
46.8
8
Tabl
e No
. 13.
3 :
Deta
ils o
f Nat
iona
l Hig
hway
in th
e St
ate
of N
agal
and
2017
-18
Sour
ce:-
PWD
(R&B
)
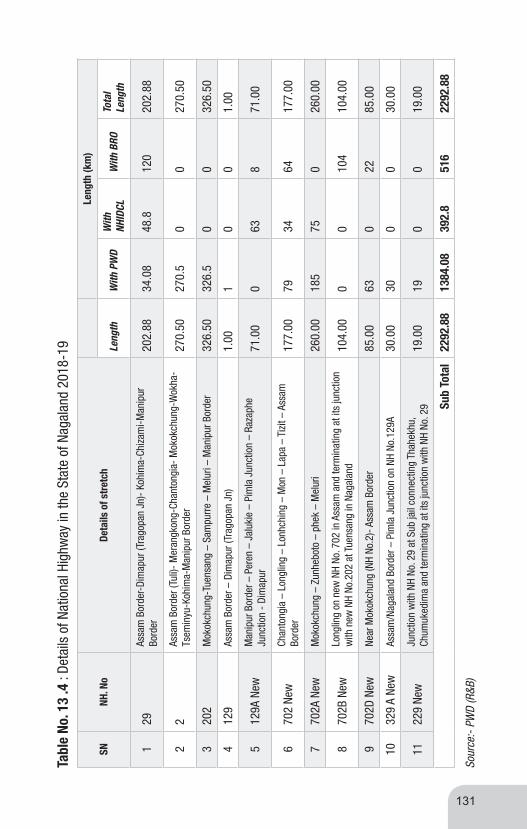
131
SNNH
. No
Deta
ils o
f str
etch
Leng
th (k
m)
Leng
thW
ith P
WD
With
NH
IDCL
With
BRO
Tota
l Le
ngth
129
Assa
m B
orde
r-Di
map
ur (T
rago
pan
Jn)-
Koh
ima-
Chiz
ami-M
anip
ur
Bord
er20
2.88
34.0
848
.812
020
2.88
22
Assa
m B
orde
r (Tu
li)-
Mer
angk
ong-
Chan
tong
ia-
Mok
okch
ung-
Wok
ha-
Tsem
inyu
-Koh
ima-
Man
ipur
Bor
der
270.
5027
0.5
00
270.
50
320
2M
okok
chun
g-Tu
ensa
ng –
Sam
purr
e –
Mel
uri –
Man
ipur
Bor
der
326.
5032
6.5
00
326.
50
412
9As
sam
Bor
der –
Dim
apur
(Tra
gopa
n Jn
)1.
001
00
1.00
512
9A N
ewM
anip
ur B
orde
r – P
eren
– J
aluk
ie –
Pim
la J
unct
ion
– Ra
zaph
e Ju
nctio
n -
Dim
apur
71.0
00
638
71.0
0
670
2 Ne
wCh
anto
ngia
– L
ongl
ing
– Lo
nhch
ing
– M
on –
Lap
a –
Tizi
t – A
ssam
Bo
rder
177.
0079
3464
177.
00
770
2A N
ewM
okok
chun
g –
Zunh
ebot
o –
phek
– M
elur
i26
0.00
185
750
260.
00
870
2B N
ewLo
nglin
g on
new
NH
No. 7
02 in
Ass
am a
nd te
rmin
atin
g at
its
junc
tion
with
new
NH
No.2
02 a
t Tue
nsan
g in
Nag
alan
d10
4.00
00
104
104.
00
970
2D N
ewNe
ar M
okok
chun
g (N
H No
.2)-
Ass
am B
orde
r85
.00
630
2285
.00
1032
9 A
New
Assa
m/N
agal
and
Bord
er –
Pim
la J
unct
ion
on N
H No
.129
A30
.00
300
030
.00
1122
9 Ne
wJu
nctio
n w
ith N
H No
. 29
at S
ub ja
il co
nnec
ting
Thah
ekhu
, Ch
umuk
edim
a an
d te
rmin
atin
g at
its
junc
tion
with
NH
No. 2
919
.00
190
019
.00
Sub
Tota
l22
92.8
813
84.0
839
2.8
516
2292
.88
Tabl
e No
. 13
.4 :
Deta
ils o
f Nat
iona
l Hig
hway
in th
e St
ate
of N
agal
and
2018
-19
Sour
ce:-
PWD
(R&B
)

132
SNNH
. No
Deta
ils o
f str
etch
Leng
th (k
m)
Leng
thW
ith P
WD
With
NHI
DCL
With
BRO
Tota
l Len
gth
129
Assa
m B
orde
r-Di
map
ur (T
rago
pan
Jn)-
Koh
ima-
Chiz
ami-M
anip
ur B
orde
r20
2.88
34.0
816
8.8
0.00
202.
88
22
Assa
m B
orde
r (Tu
li)-
Mer
angk
ong-
Chan
tong
ya-
Mok
okch
ung-
Wok
ha-
Tsem
inyu
-Koh
ima-
Man
ipur
Bor
der
270.
5027
0.50
0.00
0.00
270.
50
320
2M
okok
chun
g-Tu
ensa
ng –
Sam
purr
e –
Mel
uri –
Man
ipur
Bor
der
326.
5032
6.50
0.00
0.00
326.
50
412
9As
sam
Bor
der –
Dim
apur
(Tra
gopa
n Jn
)1.
001.
000.
000.
001.
00
512
9A N
ewM
anip
ur B
orde
r – P
eren
– J
aluk
ie –
Pim
la J
unct
ion
– Ra
zaph
e Ju
nctio
n -
Dim
apur
71.0
071
.00
0.00
0.00
71.0
0
670
2 Ne
wCh
anto
ngya
– L
ongl
ing
– Lo
nhch
ing
– M
on –
Lap
a –
Tizi
t – A
ssam
Bor
der
177.
0014
3.00
34.0
00.
0017
7.00
770
2A N
ewM
okok
chun
g –
Zunh
ebot
o –
phek
– M
elur
i22
1.00
146.
0075
.00
0.00
221.
00
870
2B N
ewLo
nglin
g on
new
NH
No. 7
02 in
Ass
am a
nd te
rmin
atin
g at
its
junc
tion
with
ne
w N
H No
.202
at T
uens
ang
in N
agal
and
104.
0010
4.00
0.00
0.00
104.
00
970
2D N
ewNe
ar M
okok
chun
g (N
H No
-2)-
Mar
iani
and
term
inat
ion
at N
H 71
5 ne
ar
Jorh
at A
ssam
85
.00
85.0
00.
000.
0085
.00
1032
9 A
New
Junc
tion
with
NH
329
near
Dip
hu in
the
Stat
e As
sam
and
term
inat
ing
at
Pim
la J
unct
ion
on N
H No
.129
A in
the
Stat
e of
Nag
alan
d30
.00
30.0
00.
000.
0030
.00
1122
9 Ne
wJu
nctio
n w
ith N
H No
. 29
at S
ub ja
il co
nnec
ting
Thah
ekhu
, Chu
muk
edim
a an
d te
rmin
atin
g at
its
junc
tion
with
NH
No. 2
919
.00
19.0
00.
000.
0019
.00
Sub
Tota
l15
07.8
812
30.0
822
7.80
0.00
1507
.88
Tabl
e No
. 13.
5 :
Det
ails
of N
atio
nal H
ighw
ay in
the
Stat
e of
Nag
alan
d 20
19-2
0
Sour
ce:-
PWD
(R&B
)

133
SN Types of VehicleRegistered
during the yearAt the end of
the year
1 2 3 4
1 Multiaxled & Articulated Vehicles 6698 55628
2 Truck/Lorries 13216 113323
3
Light Motor Vehicles (Goods)
(a) Four Wheelers 1508 17476
(b) Three Wheelers 56 8529
4 Buses 480 6583
5 Taxis 714 10151
6 Light Motor Vehicles (Passenger)
(a) Three Seaters 904 19446
(b) Four to Six Seaters 3 989
7 Two Wheelers 6646 99277
8 Cars/Jeeps 7401 123225
9 Omni Buses 498
10 Tractors 31 2987
11 Trailers 18 1092
12 Cranes 236 2066
13 Excavators & Bull Dozers 355
14 Road Rollers 16
15 Ambulance 6 78
16 Other Vehicles/Fort lift 1874 9402
17 Government Vehicles 695 18567
Source: Transport Commissioner, Kohima
Table No. 13.6 : Number of Motor Vehicles Registered 2018-19

134
SN Types of Vehicle Registered during the year
At the end of the year
1 2 3 4
1Multiaxled & Articulated Vehicles
5069 60697
2 Truck/Lorries 7465 120788
3
Light Motor Vehicles (Goods)
(a) Four Wheelers 1116 18592
(b) Three Wheelers 27 8556
4 Buses 712 7295
5 Taxis 575 10726
6
Light Motor Vehicles (Passenger)
(a) Three Seaters 1096 20542
(b) Four to Six Seaters 989
7 Two Wheelers 5514 104791
8 Cars/Jeeps 7413 130638
9 Omni Buses 25 523
10 Tractors 6 2993
11 Trailers 7 1099
12 Cranes 126 2192
13Excavators & Bull Dozers
3 358
14 Road Rollers 16
15 Ambulance 78
16 Other Vehicles/Fort lift 640 10042
17 Government Vehicles 811 19378
Source: Transport Commissioner, Kohima
Table No. 13.7 : Number of Motor Vehicles Registered 2019-20
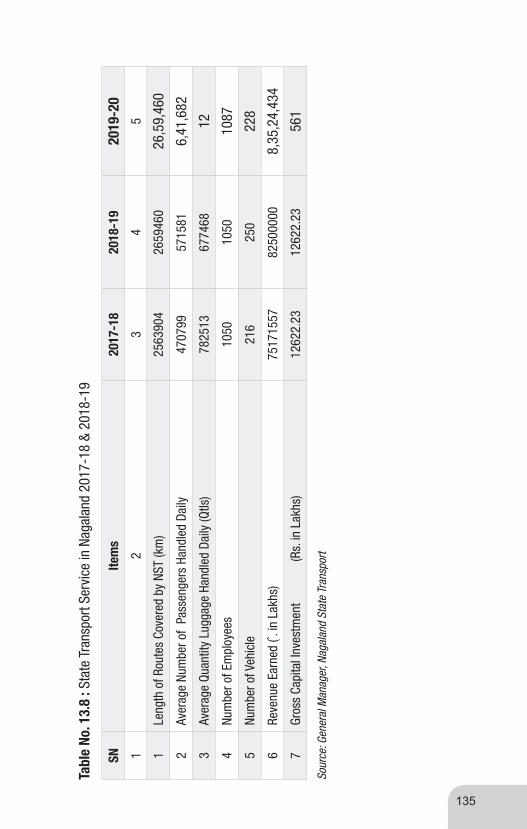
135
SNIte
ms
2017
-18
2018
-19
2019
-20
12
34
5
1Le
ngth
of R
oute
s Co
vere
d by
NST
(km
)25
6390
426
5946
026
,59,
460
2Av
erag
e Nu
mbe
r of
Pass
enge
rs H
andl
ed D
aily
4707
9957
1581
6,41
,682
3Av
erag
e Qu
antit
y Lu
ggag
e Ha
ndle
d Da
ily (Q
tls)
7825
1367
7468
12
4Nu
mbe
r of E
mpl
oyee
s10
5010
5010
87
5Nu
mbe
r of V
ehic
le21
625
022
8
6Re
venu
e Ea
rned
(`. i
n La
khs)
7517
1557
8250
0000
8,35
,24,
434
7Gr
oss
Capi
tal I
nves
tmen
t
(Rs
. in
Lakh
s)12
622.
2312
622.
2356
1
Sour
ce: G
ener
al M
anag
er, N
agal
and
Stat
e Tr
ansp
ort
Tabl
e No
. 13.
8 : S
tate
Tra
nspo
rt Se
rvic
e in
Nag
alan
d 20
17-1
8 &
2018
-19


POST OFFICE
14

138
SNDi
stric
t He
ad P
ost O
ffice
Sub-
Post
Offi
ceGr
amin
Dak
Sev
ak/
Bran
ch P
ost O
ffice
Tota
l
12
34
56
1Ko
him
a 1
839
48
2Di
map
ur0
848
56
3Pe
ren
02
1315
4Ph
ek0
432
36
5M
okok
chun
g0
844
52
6W
okha
02
2325
7Zu
nheb
oto
02
1719
8Tu
ensa
ng
02
2527
9Ki
phire
01
1314
10Lo
ngle
ng0
17
8
11M
on
04
2630
Tota
l1
4228
733
0
Sour
ce: D
irect
orat
e of
Pos
t Offi
ce, K
ohim
a
Tabl
e No
. 14.
1 N
umbe
r of P
ost O
ffice
s du
ring
2017
-18

139
SNDi
stric
t He
ad P
ost O
ffice
Sub-
Post
Offi
ceGr
amin
Dak
Sev
ak/
Bran
ch P
ost O
ffice
Tota
l
12
34
56
1Ko
him
a 1
839
48
2Di
map
ur0
848
56
3Pe
ren
02
1315
4Ph
ek0
432
36
5M
okok
chun
g0
844
52
6W
okha
02
2325
7Zu
nheb
oto
02
1719
8Tu
ensa
ng
02
1820
9Ki
phire
01
1314
10Lo
ngle
ng0
17
8
11M
on
04
2630
12No
klak
00
77
Tota
l1
4228
733
0
Sour
ce: D
irect
orat
e Of
Pos
t Offi
ce,K
ohim
a
Tabl
e No
. 14.
2 : N
umbe
r of P
ost O
ffice
s du
ring
2018
-19


TOURISM
15
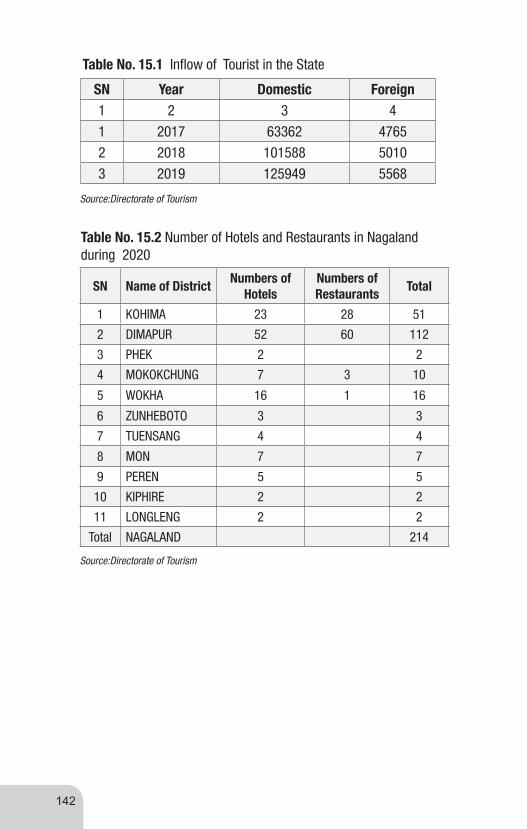
142
SN Year Domestic Foreign1 2 3 41 2017 63362 47652 2018 101588 50103 2019 125949 5568
Source:Directorate of Tourism
SN Name of District Numbers of Hotels
Numbers of Restaurants Total
1 KOHIMA 23 28 51
2 DIMAPUR 52 60 112
3 PHEK 2 2
4 MOKOKCHUNG 7 3 10
5 WOKHA 16 1 16
6 ZUNHEBOTO 3 3
7 TUENSANG 4 4
8 MON 7 7
9 PEREN 5 5
10 KIPHIRE 2 2
11 LONGLENG 2 2
Total NAGALAND 214
Table No. 15.2 Number of Hotels and Restaurants in Nagaland during 2020
Table No. 15.1 Inflow of Tourist in the State
Source:Directorate of Tourism

143
SN Name of Tourist Village District1 2 31 Khonoma Kohima2 Touphema Kohima3 Benreu New Peren4 Riphiym/Doyang Wokha5 Nlongidang Wokha6 Changtongya Mokokchung7 Chuchuyimlanng Mokokchung8 Mopungchukit Mokokchung9 Longjang Mokokchung10 Longsa Mokokchung11 Sungratsu Mokokchung12 Pilgrimage Village Molungyimsen Mokokchung13 Phek village Phek14 Leshemi Phek15 Thetsumi Phek16 Chesezu Phek17 Matikhru Phek18 Satoi Zunheboto19 Ghukhiye Zunheboto20 Aizuto Zunheboto21 Chui Mon22 Longwa Mon23 Ungma Mokokchung24 Khezhakeno Phek25 Phesachodu Phek26 Diezephe craft village Dimapur27 Thanamir Kiphire28 Longkhum Mokokchung29 Pangti village Wokha30 Yikhum Wokha
Source:Directorate of Tourism
Table No. 15.3 Tourist Villages in Nagaland during 2020

144
Source:Directorate of Tourism
Table No. 15.4 Tourist Spot in Nagaland during 2020
SN Name of Tourist SPOT District1 Dzukou Valley Kohima2 Mt.Japfu peak Kohima3 Kisama Kohima4 Governor’s camp Liphayan Wokha5 shiloi lake Phek6 Fakim wild life sanctuary Kiphire7 Shangnyu Mon8 Mt.Tiyi Wokha9 Intanki Forest Peren
10 Niathu Resort Dimapur11 Pulie Badze Kohima12 Dzulekie Kohima13 Sosu Rochu waterfalls Wokha14 Mt.Saramati Kiphire15 Ghoshu Bird Sanctuary Zunheboto16 Longkhum Mokokchung17 Dzudu lake Thuvopisu Phek18 Latuleba Lakhuni Mokokchung19 Wazeho Phek20 Zanibu peak Phek
21Community conservation area,Sukhai,Keviku,and Ghukhuyi
Zunheboto
22 Tiru Mon23 Noune Resort Dimapur24 Doyang Birding Destination Wokha25 Mt.Totsu Wokha26 2nd World War Cemetery Kohima27 Cathedral Kohima28 Glory Peak Phek29 Kachari Ruins Dimapur30 Suteplenden Waterfalls Mokokchung31 Veda Peak Mon32 Shalom Resort Peren33 Vinngoi Resort Mon

145
SN PAYING GUEST/HOME STAY DISTRICT1 Greenwood Villa Kigwema,Kohima
2 Sun view PG Accomodation Lower Lerie, kohima
3 Bethesda PG House Church Road,Midland4 South View Home Kigwema,Kohima5 Razhu Pru Mission Compound ,kohima6 Punyu paying guest Science college Road, Kohima
7 Visa’s Home stayAbove VIP Guest house,old Ministers hill, Kohima
8 Capital view Paying guest house Pezhu Hill near science collge kohima9 Dovipie inn Khonoma Village, Kohima10 The Morung Lodge Opp.APO Office,Upper Midland, Kohima11 Central guest house Daklane Kohima12 Sapu’s inn Aradura Kohima13 Weavers place Diezephe Village, Singrijan,Dimapur14 India paying guest house Burana bazaar Police Point Dimapur15 Longchen home stay Ao Yimti Village Dimapur16 Jungjung Home stay Darogapathar Dimapur17 Liangriwang guest house Tening Town Peren18 Adaubo paying guest accomodation Tening Town Peren19 H.K.Mbung Tourist and Accomodation Poilwa Vilage Peren20 Paramount guest house Near state Bank of India Mon21 Koza home Khezakeno Village phek22 Oriental home Pfutsero Town Phek23 Eco stay T.C.P Gate Kohima24 Lalhou’s Home stay Kigwema,Kohima25 Vale’s home stay Kigwema,Kohima26 Pine home stay Kigwema,Kohima27 Dawn home saty Kigwema,Kohima28 Vilano Home stay Kigwema,Kohima29 Japfu home stay Kigwema,Kohima30 Cedar Home stay Kigwema,Kohima31 Trinity villa Kuda C Khel Dimapur32 Hesso villa home stay Nepali Basti Dimapur33 Rezu residency guest house Nkozai colony peren34 Pienyu Home stay Dkhel Kohima Village
Table No. 15.5 Paying Guest/Homestay Accomodation during 2020
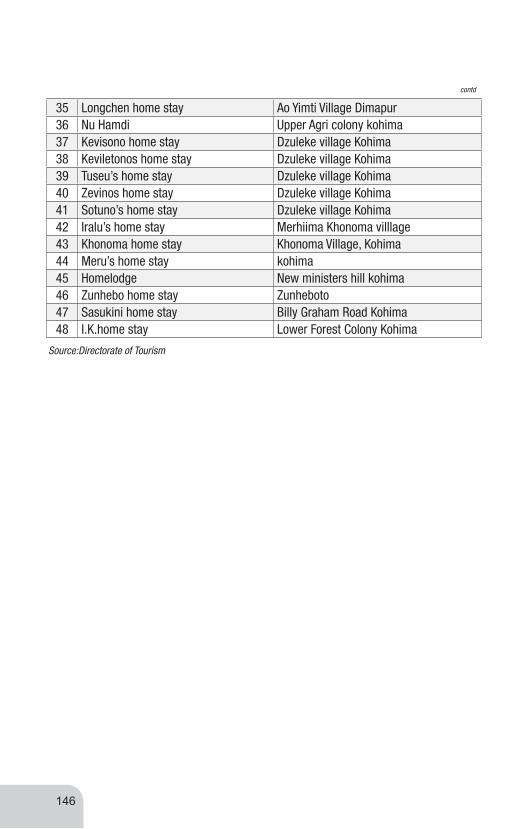
35 Longchen home stay Ao Yimti Village Dimapur36 Nu Hamdi Upper Agri colony kohima37 Kevisono home stay Dzuleke village Kohima38 Keviletonos home stay Dzuleke village Kohima39 Tuseu’s home stay Dzuleke village Kohima40 Zevinos home stay Dzuleke village Kohima41 Sotuno’s home stay Dzuleke village Kohima42 Iralu’s home stay Merhiima Khonoma villlage43 Khonoma home stay Khonoma Village, Kohima44 Meru’s home stay kohima 45 Homelodge New ministers hill kohima46 Zunhebo home stay Zunheboto47 Sasukini home stay Billy Graham Road Kohima48 I.K.home stay Lower Forest Colony Kohima
Source:Directorate of Tourism
contd
146

BANKING
16

148
SNDi
stric
tDe
posi
tsAd
vanc
eCD
Rat
io
As o
n 31
.3.2
018
As o
n 31
.3.2
019
As o
n 31
.3.2
018
As o
n 31
.3.2
019
As o
n 31
.3.2
018
As o
n 31
.3.2
019
12
45
67
89
1Ko
him
a43
3227
.46
4629
32.2
486
779.
9895
312.
3720
.03
21
2Di
map
ur47
5415
.87
5303
92.2
219
7705
.32
2346
14.7
241
.59
44
3Lo
ngle
ng
4785
.00
4700
.00
2398
.00
3537
.00
50.1
175
4M
on21
433.
3324
716.
4294
83.5
113
027.
5344
.25
53
5Ki
phire
6453
.16
8104
.16
4714
.62
5634
.63
73.0
670
6M
okok
chun
g50
228.
6958
646.
5842
010.
5348
153.
2683
.64
82
7W
okha
2117
2.71
2471
3.87
1450
4.85
3151
5.42
68.5
112
8
8Zu
nheb
oto
2414
2.32
2465
7.01
1302
3.39
1644
7.67
53.9
467
9Ph
ek14
870.
5924
383.
0410
763.
0813
512.
0472
.38
55
10Tu
ensa
ng19
255.
4220
008.
4816
350.
4021
263.
4584
.91
106
11Pe
ren
1116
3.14
9618
.29
8266
.32
1015
0.03
74.0
510
6
TOTA
L10
8214
7.69
1192
872.
3140
6000
.00
4931
68.1
237
.52
41.3
4
Sour
ce:L
ead
Bank
,Koh
ima
Tabl
e No
. 16.
1 : D
istri
ct-w
ise
Busi
ness
and
Cre
dit D
epos
it Ra
tio o
f Nag
alan
d (R
s. in
Lak
h)

149
SNDi
stric
tDe
posi
tsAd
vanc
eCD
Rat
io
As o
n 31
.3.2
019
As o
n 31
.3.2
020
As o
n 31
.3.2
019
As o
n 31
.3.2
020
As o
n 31
.3.2
019
As o
n 31
.3.2
020
12
34
56
78
1Ko
him
a46
2932
.24
5614
01.4
895
312.
3711
3203
.93
20.5
920
.16
2Di
map
ur53
0392
.22
5573
33.5
623
4614
.72
2676
21.8
344
.23
48.0
1
3Lo
ngle
ng47
00.0
052
48.9
735
37.0
046
38.2
175
.26
88
4M
on24
716.
4226
169.
7813
027.
5316
102.
9552
.71
61
5Ki
phire
8104
.16
9412
.73
5634
.63
7748
.02
69.5
382
6M
okok
chun
g58
646.
5867
266.
0448
153.
2653
897.
0182
.11
80
7W
okha
2471
3.87
2762
9.08
3151
5.42
2036
7.70
127.
5273
8Zu
nheb
oto
2465
7.01
2402
5.54
1644
7.67
2001
0.63
66.7
183
9Ph
ek24
383.
0422
159.
0613
512.
0416
469.
2655
.42
74
10Tu
ensa
ng20
008.
4821
773.
2321
263.
4522
666.
1410
6.27
104
11Pe
ren
9618
.29
1033
9.60
1015
0.03
1172
3.05
105.
5311
3
TO
TAL
1192
872.
3113
3287
0.03
4931
68.1
255
4448
.73
41.3
441
.00
Tabl
e No
. 16.
2 :
Dist
rict-
wis
e Bu
sine
ss a
nd C
redi
t Dep
osit
Ratio
of
Naga
land
(Rs.
in la
kh)
Sou
rce:
Lead
Ban
k,Ko
him
a

150
SNBa
nkKo
him
aDi
map
urPh
ekM
okok
chun
gW
okha
Zunh
ebot
oTu
ensa
ngM
onKi
phire
Pere
nLo
ngle
ngNa
gala
nd1
23
45
67
89
1011
1213
1 A
llaha
bad
Bank
12
36
2 A
xis
Bank
34
11
93
Ban
k of
Bar
oda
11
21
54
Ban
k of
Indi
a1
12
5Ba
nk o
f M
ahar
asth
ra1
1
6Ca
nara
Ban
k1
11
3
7Ce
ntra
l Ban
k of
In
dia
11
21
11
7
8Co
rpor
atio
n Ba
nk1
1
9Fe
dera
l Ban
k 1
12
10HD
FC B
ank
22
15
11IC
ICI B
ank
23
11
712
IDBI
Ban
k1
11
14
13In
dian
Ban
k1
114
Indu
sind
Ban
k1
12
1515
Indi
an
Over
seas
Ban
k1
1
16Pu
njab
Nat
iona
l Ba
nk1
1
17Pu
njab
& S
ind
Bank
11
2
Tabl
e No
. 16.
3 : D
istri
ct-w
ise
Dist
ribut
ion
of N
umbe
r of B
anks
in N
agal
and,
201
8

151
Sour
ce :
Rura
l Ban
k, N
agal
and
18St
ate
Bank
of
Indi
a12
155
85
67
42
31
68
19So
uth
Indi
an
Bank
11
20Sy
ndic
ate
Bank
11
21Un
ited
Bank
of
Indi
a1
45
22Un
ited
Com
erci
al B
ank
22
4
23Un
ion
Bank
of
Indi
a1
1
24Vi
jay
Bank
23
16
25Ye
s Ba
nk1
1
26Na
gala
nd R
ural
Ba
nk3
41
11
10
27Na
gala
nd S
tate
Co
-ope
rativ
e Ba
nk
46
33
11
11
11
22
28TO
TAL
4359
824
1110
87
34
117
8
Cont
d.

152
SNBA
NKKo
him
aDi
map
urPh
ekM
okok
chun
gW
okha
Zunh
ebot
oTu
ensa
ngM
onKi
phire
Pere
nLo
ngle
ngNa
gala
nd
12
34
56
78
910
1112
1314
1 A
llaha
bad
Bank
12
36
2 A
xis
Bank
35
11
10
3 B
ank
of B
arod
a1
12
15
4 B
ank
of In
dia
11
2
5Ba
ndha
n Ba
nk1
12
6 B
ank
of
Mah
aras
thra
11
7 C
anar
a Ba
nk1
11
3
8 C
entra
l Ban
k of
In
dia
11
21
11
7
9 C
orpo
ratio
n Ba
nk1
1
10E-
Dena
Ban
k1
1
11 F
eder
al B
ank
11
2
12 H
DFC
Bank
22
15
13IC
ICI B
ank
23
11
7
14 ID
BI B
ank
11
11
4
15 In
dian
Ban
k1
1
16 In
dusi
nd B
ank
11
2
Tabl
e No
. 16.
4 : D
istri
ct-w
ise
Dist
ribut
ion
of N
umbe
r of B
anks
in N
agal
and
durin
g 2
019

153
17In
dian
Ove
rsea
s Ba
nk1
1
18Pu
njab
Nat
iona
l Ba
nk1
1
19 P
unja
b &
Sind
Ba
nk1
12
20St
ate
Bank
of I
ndia
1215
58
56
74
23
168
21So
uth
Indi
an B
ank
11
22Sy
ndic
ate
Bank
11
23Un
ited
Bank
of I
ndia
12
3
24Un
ited
Com
erci
al
Bank
24
6
25Un
ion
Bank
of I
ndia
11
26E-
Vija
y Ba
nk3
21
6
27Ye
s Ba
nk1
1
28Na
gala
nd R
ural
Ba
nk3
41
11
10
29Na
gala
nd S
tate
Co-
op
erat
ive
Bank
45
33
11
11
11
21
TOTA
L42
638
2412
98
73
41
181
Cont
d.
sour
ce: R
ural
Ban
k. N
agal
and

154
SNBA
NK
KOHI
MA
DIPM
APUR
PHEK
MOK
OKCH
UNG
WOK
HAZU
NHEB
OTO
TUEN
SANG
MON
KIPH
IRE
PERE
NLO
NGLE
NGNA
GALN
D
12
34
56
78
910
1112
1314
1Al
laha
bad
Bank
12
36
2Ax
is B
ank
35
11
110
3Ba
nk o
f Bar
oda
44
21
4Ba
nk o
f Ind
ia1
1
5Ba
ndha
n Ba
nk1
1
6Ba
nk o
f Mah
aras
tra1
7Ca
nara
Ban
k1
11
8Ce
ntra
l Ban
k of
Indi
a1
12
11
1
9Co
rpor
atio
n Ba
nk1
10E-
Dena
Ban
k
11Fe
dera
l BAN
K 1
1
12HD
FC B
ank
22
13IC
ICI B
ank
23
1
14ID
BI B
ank
11
11
Tabl
e No
. 16.
5 : D
istri
ct-w
ise
Dist
ribut
ion
of n
umbe
r of B
anks
in N
agal
and
durin
g 20
20
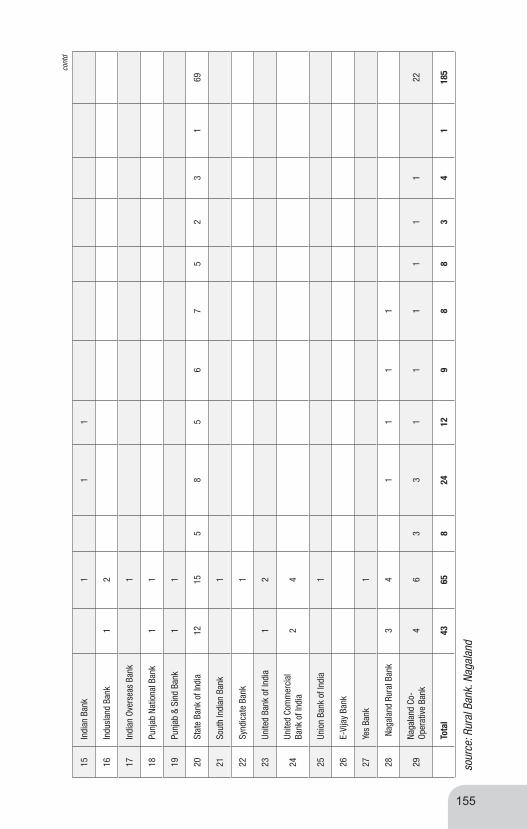
155
15In
dian
Ban
k1
11
16In
dusl
and
Bank
12
17In
dian
Ove
rsea
s Ba
nk1
18Pu
njab
Nat
iona
l Ban
k1
1
19Pu
njab
& S
ind
Bank
11
20St
ate
Bank
of I
ndia
1215
58
56
75
23
169
21So
uth
Indi
an B
ank
1
22Sy
ndic
ate
Bank
1
23Un
ited
Bank
of I
ndia
12
24Un
ited
Com
mer
cial
Ba
nk o
f Ind
ia2
4
25Un
ion
Bank
of I
ndia
1
26E-
Vija
y Ba
nk
27Ye
s Ba
nk1
28Na
gala
nd R
ural
Ban
k3
41
11
1
29Na
gala
nd C
o-
Oper
ativ
e Ba
nk4
63
31
11
11
122
Tota
l 43
658
2412
98
83
41
185
sour
ce: R
ural
Ban
k. N
agal
and
cont
d


CO-OPERATIVE
17
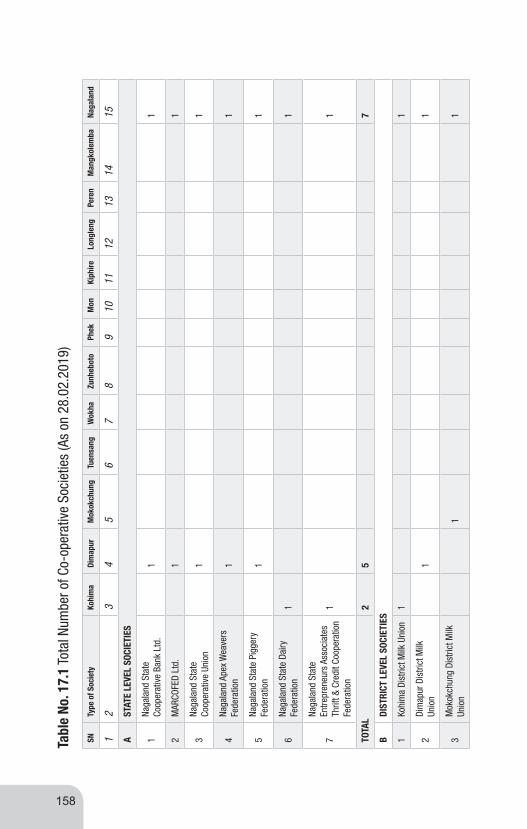
158
SNTy
pe o
f Soc
iety
Kohi
ma
Dim
apur
Mok
okch
ung
Tuen
sang
Wok
haZu
nheb
oto
Phek
Mon
Kiph
ireLo
ngle
ngPe
ren
Man
gkol
emba
Naga
land
12
34
56
78
910
1112
1314
15
AST
ATE
LEVE
L SO
CIET
IES
1Na
gala
nd S
tate
Co
oper
ativ
e Ba
nk L
td.
11
2M
ARCO
FED
Ltd.
11
3Na
gala
nd S
tate
Co
oper
ativ
e Un
ion
11
4Na
gala
nd A
pex
Wea
vers
Fe
dera
tion
11
5Na
gala
nd S
tate
Pig
gery
Fe
dera
tion
11
6Na
gala
nd S
tate
Dai
ry
Fede
ratio
n1
1
7
Naga
land
Sta
te
Entre
pren
eurs
Ass
ocia
tes
Thrif
t & C
redi
t Coo
pera
tion
Fede
ratio
n
11
TOTA
L2
57
BDI
STRI
CT L
EVEL
SOC
IETI
ES
1Ko
him
a Di
stric
t Milk
Uni
on1
1
2Di
map
ur D
istri
ct M
ilk
Unio
n1
1
3M
okok
chun
g Di
stric
t Milk
Un
ion
11
Tabl
e No
. 17.
1 To
tal N
umbe
r of C
o-op
erat
ive
Soci
etie
s (A
s on
28.
02.2
019)

159
4Di
stric
t Org
anic
Far
mer
11
11
11
11
11
1-
11
TOTA
L2
22
11
11
11
11
14
CPR
IMAR
Y CO
OPER
ATIV
E SO
CIET
IES
(DIS
TRIC
T W
ISE)
1La
mps
C.S
Ltd
.1
1
2Co
nsum
er C
.S L
td.
6524
2431
925
2012
611
27
236
1.
Pet
rol P
ump
C.S
Lt
d.,
1
1
3Se
rvic
e C.
S Lt
d.,
3616
94
21
64
78
1.
Ins
titut
ion
C.S
Ltd.
11
2
2.
Tra
nspo
rt C.
S Lt
d.2
12
5
3.
Can
teen
C.S
Ltd
.1
1
4.
Edu
catio
n &
train
ing
C.S
Ltd.
11
5.
Dry
Cle
aner
s1
1
4M
ultip
urpo
se C
.S L
td.
854
974
320
249
425
287
231
9610
415
935
118
3852
5M
arke
ting
C.S
Ltd.
928
1628
58
112
24
11
115
1.
T
radi
ng1
1
6W
eavi
ng &
Han
dloo
m
/ kni
tting
/ ha
ndic
raft
/ In
dust
rial C
.S L
td.
127
148
3343
4375
3340
2223
127
606Co
ntd.

160
7Da
iry C
.S L
td.
3657
1122
620
3017
78
12
217
1.
Cat
tle F
arm
ing
21
14
8In
dust
rial C
.S L
td.
2920
53
18
66
1.
Pha
rmac
eutic
al
11
2.
Car
pent
ry C
.S L
td.
21
3
3.
Bak
ery
C.S
Ltd.
33
9VD
B C.
S Lt
d.38
534
11
79
10Ag
ri &
Allie
d C.
S Lt
d.98
236
118
4617
165
7431
5036
2423
918
1.
Far
min
g 10
313
277
7733
7255
2929
2334
1567
9
2.
Sug
arca
ne1
1
3.
Pad
dy1
23
4.
Agr
i & F
ruit
Prod
uctio
n C.
S Lt
d.1
1
5.
Hor
ti &
Allie
d C.
S Lt
d.1
1
6.
Fru
its &
Veg
etab
le4
93
74
14
638
7.
Hor
ti1
16
8
8.
Col
d St
orag
e C.
S Lt
d.1
12
Cont
d.

161
9.
Med
ical
Pla
ntat
ion
C.S
Ltd.
11
10.
Fl
oric
ultu
re C
.S L
td.
22
11Fi
sher
y C.
S Lt
d.25
7726
8345
3040
3311
3613
1943
8
12Th
rift &
Cre
dit C
.S L
td.
3114
68
29
11
173
13Ag
ricul
ture
& A
llied
C.S
Lt
d.2
11
4
14Ho
usin
g C.
S Lt
d.8
181
134
12
148
15Se
ricul
ture
C.S
Ltd
.3
3
16Li
vest
ock/
Ani
mal
Hu
sban
dry
C.S
Ltd.
14
111
17
1.
Mith
un re
arin
g1
51
29
2.
Pou
ltry
1333
613
28
77
16
410
0
3.
Pig
gery
7111
539
5917
5034
2810
1510
645
4
4.
Goa
try
11
32
7
5.
Rab
bit R
earin
g1
1
17Fo
rest
ry &
Pla
ntat
ion
C.S
Ltd.
11
12
12
8
1.
T
ea G
row
ers
C.S
Ltd.
43
11
55
32
24
2.
R
ubbe
r Gro
wer
s C.
S Lt
d.1
1
TOTA
L14
8619
7271
570
162
079
758
530
425
732
414
720
681
14
Cont
d.
Sour
ce:R
egis
trar o
f Co-
oper
ativ
e So
ciet
ies
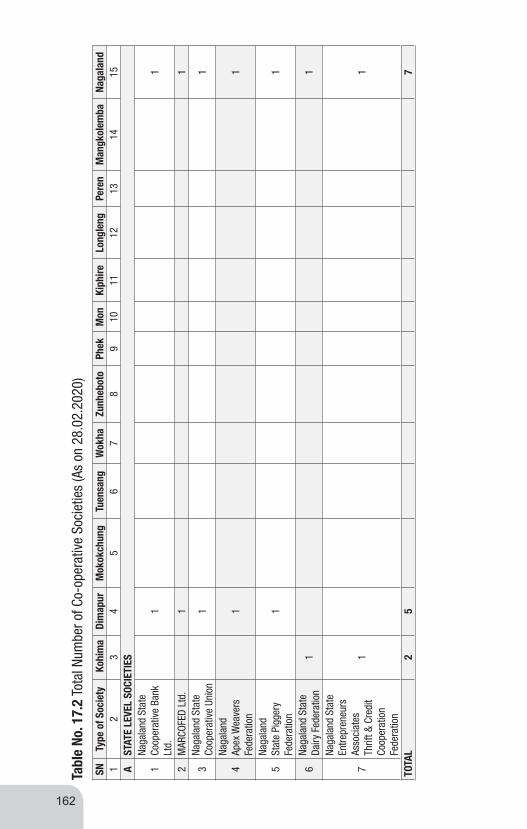
162
SNTy
pe o
f Soc
iety
Koh
ima
Dim
apur
Mok
okch
ung
Tuen
sang
Wok
haZu
nheb
oto
Phek
Mon
Kiph
ireLo
ngle
ngPe
ren
Man
gkol
emba
Naga
land
12
34
56
78
910
1112
1314
15A
STAT
E LE
VEL
SOCI
ETIE
S
1Na
gala
nd S
tate
Co
oper
ativ
e Ba
nk
Ltd.
11
2M
ARCO
FED
Ltd.
11
3Na
gala
nd S
tate
Co
oper
ativ
e Un
ion
11
4Na
gala
nd
Apex
Wea
vers
Fe
dera
tion
11
5Na
gala
nd
Stat
e Pi
gger
y Fe
dera
tion
11
6Na
gala
nd S
tate
Da
iry F
eder
atio
n1
1
7
Naga
land
Sta
te
Entre
pren
eurs
As
soci
ates
Th
rift &
Cre
dit
Coop
erat
ion
Fede
ratio
n
11
TOTA
L2
57
Tabl
e No
. 17.
2 To
tal N
umbe
r of C
o-op
erat
ive
Soci
etie
s (A
s on
28.
02.2
020)

163
BDI
STRI
CT L
EVEL
SOC
IETI
ES
1Ko
him
a Di
stric
t M
ilk U
nion
11
2Di
map
ur D
istri
ct
Milk
Uni
on1
1
3M
okok
chun
g Di
stric
t Milk
Uni
on
11
4Di
stric
t Org
anic
Fa
rmer
TOTA
L1
11
3C
PRIM
ARY
COOP
ERAT
IVE
SOCI
ETIE
S (D
ISTR
ICT
WIS
E)1
Lam
ps C
.S L
td.
11
2Co
nsum
er C
.S
Ltd.
6624
2431
925
2112
611
27
238
1.Pe
trol P
ump
C.S
Ltd.
,1
12
3Se
rvic
e C.
S Lt
d.,
3716
94
21
64
791.
Inst
itutio
n C.
S Lt
d.1
12
2. T
rans
port
C.S
Ltd.
21
25
3.Ca
ntee
n C.
S Lt
d.1
1
4.Ed
ucat
ion
& tra
inin
g C.
S Lt
d.1
1
5. D
ry C
lean
ers
11
4M
ultip
urpo
se
C.S
Ltd.
854
947
320
249
426
287
231
9710
416
035
118
3855
5M
arke
ting
C.S
Ltd.
928
1828
59
132
25
11
121
1.Tr
adin
g1
1

164
6
Wea
ving
&
Hand
loom
/ k
nitti
ng /
hand
icra
ft /
Indu
stria
l C.S
Ltd
.
127
152
3548
4375
3440
2225
127
620
7Da
iry C
.S L
td.
3758
1325
620
3017
79
12
225
1. C
attle
Far
min
g 2
11
48
Indu
stria
l C.S
Ltd
.30
205
31
867
1.Ph
arm
aceu
tical
1
12.
Carp
entry
C.S
Lt
d.2
13
3.Ba
kery
C.S
Ltd
.3
39
VDB
C.S
Ltd.
385
341
179
10Ag
ri &
Allie
d C.
S Lt
d.11
224
613
753
2018
275
3250
4825
2310
03
1. F
arm
ing
103
132
8380
3372
5629
2925
3515
692
2. S
ugar
cane
11
3. P
addy
12
34.
Agr
i & F
ruit
Prod
uctio
n C.
S Lt
d.1
1
5. H
orti
& Al
lied
C.S
Ltd.
11
6. F
ruits
&
Vege
tabl
e4
95
74
11
41
642
7. H
orti
11
68
8.Co
ld S
tora
ge
C.S
Ltd.
11
2
9. M
edic
al
Plan
tatio
n C.
S Lt
d.1
1
cont
d

165
Sour
ce:R
egis
trar o
f Co-
oper
ativ
e So
ciet
ies
10.F
loric
ultu
re
C.S
Ltd.
22
11Fi
sher
y C.
S Lt
d.26
7830
8546
3140
3411
3813
1945
1
12Th
rift &
Cre
dit
C.S
Ltd.
3215
89
29
11
178
13Ag
ricul
ture
&
Allie
d C.
S Lt
d.2
11
4
14Ho
usin
g C.
S Lt
d.9
191
134
12
150
15Se
ricul
ture
C.S
Lt
d.4
4
16Li
vest
ock/
Ani
mal
Hu
sban
dry
C.S
Ltd.
14
111
118
1.
Mith
un
rear
ing
15
12
9
2.
Pou
ltry
1435
715
28
79
17
410
93.
P
igge
ry72
115
4161
1852
3530
1016
106
466
4.
Goa
try1
13
27
5.
Rab
bit
Rear
ing
11
17Fo
rest
ry &
Pl
anta
tion
C.S
Ltd.
11
12
12
8
1. T
ea G
row
ers
C.S
Ltd.
43
11
59
32
28
2.Ru
bber
Gro
wer
s C.
S Lt
d.1
1
TOTA
L15
0819
9375
972
662
681
859
331
525
734
814
920
782
99
cont
d

166
SNTy
pe o
f Sch
eme
Kohi
ma
Dim
apur
Mok
okch
ung
Tuen
sang
Wok
haZu
nheb
oto
Phek
Mon
Kiph
ireLo
ngle
ngPe
ren
Man
gkol
emba
Naga
land
12
34
56
78
910
1112
1314
15
1Fi
nanc
ial
Assi
stan
ce to
Go
od W
orki
ng
Prim
ary
Coop
erai
ve
Soci
etie
s
0.80
2.40
0.80
0.40
1.20
1.20
1.80
0.80
0.20
0.00
0.00
0.40
10.0
0
2Fi
nanc
ial
Assi
stan
ce to
Da
iry C
oope
rativ
e So
ciet
ies
2.00
1.00
1.00
--
--
--
--
-4.
00
Tota
l2.
803.
401.
800.
401.
201.
201.
800.
800.
200.
000.
000.
4014
.00
Tabl
e No
. 17.
3 :F
inan
cial
Ass
ista
nce
give
n to
Co-
oper
ativ
e So
ciet
ies
durin
g 20
18-1
9 (in
Lak
hs)
Sour
ce:R
egis
trar o
f Co-
oper
ativ
e So
ciet
ies

167
SNTy
pe o
f Sc
hem
eKo
him
aDi
map
urM
okok
chun
gTu
ensa
ngW
okha
Zunh
ebot
oPh
ekM
onKi
phire
Long
leng
Pere
nM
angk
olem
baNa
gala
nd
12
34
56
78
910
1112
1314
15
1
Fina
ncia
l As
sist
ance
to
Goo
d W
orki
ng
Prim
ary
Coop
erai
ve
Soci
etie
s
5.00
5.00
4.00
4.00
4.00
4.00
4.00
4.00
3.00
3.00
3.00
2.00
45.0
0
2
Fina
ncia
l As
sist
ance
to
Dai
ry
Coop
erat
ive
Soci
etie
s
2.00
1.00
1.00
Tota
l7.
006.
005.
004.
004.
004.
004.
004.
003.
003.
003.
002.
0049
.00
Sour
ce:R
egis
trar o
f Co-
oper
ativ
e So
ciet
ies
Tabl
e No
. 17.
4 :F
inan
cial
Ass
ista
nce
give
n to
Co-
oper
ativ
e So
ciet
ies
durin
g 20
19-2
0 (in
Lak
hs)

SNDi
stric
tNo
of A
ssis
ted
Soci
ties
Loan
Shar
e Ca
pita
lSu
bsity
Tota
l
1Ko
him
a41
143.
110
0.17
42.9
332
7.2
2Pe
ren
1552
.557
.22
19.3
614
4.08
3Tu
ensa
ng57
149.
3712
5.8
46.5
737
8.74
4Ki
phire
4582
.24
61.2
925
.32
213.
85
5Lo
ngle
ng31
4237
.84
13.2
124.
04
Tota
l18
946
9.21
382.
3214
7.38
1187
.91
Tabl
e No
. 17.
5 :
Rele
ase
of F
inan
cial
Ass
ista
nce
to C
o-op
erat
ive
Soci
ties
Unde
r Int
egra
ted
Co-o
pera
tive
Deve
lopm
ent P
roje
ct (
IC
DP)
Durin
g 20
18-1
9 (in
lakh
s)
Sour
ce:R
egis
trar o
f Co-
oper
ativ
e So
ciet
ies
Tabl
e No
. 17.
6 : R
elea
se o
f Fin
anci
al A
ssis
tanc
e to
Co-
oper
ativ
e So
citie
s Un
der I
nteg
rate
d Co
-ope
rativ
e De
velo
pmen
t Pro
ject
(IC
DP)
Durin
g 20
19-2
0 (in
lakh
s)
SNDi
stric
tNo
of A
ssis
ted
Soci
ties
Loan
Shar
e Ca
pita
lSu
bsity
Tota
l1
Kohi
ma
3817
5.86
212
3.10
352
.759
351.
724
2Pe
ren
6273
.383
51.3
6822
.015
146.
765
3Tu
ensa
ng60
173.
6312
3.23
050
.402
347.
264
Kiph
ire21
124.
4587
.115
37.3
3524
8.90
05
Long
leng
1554
.600
38.2
2016
.365
109.
185
Tota
l19
660
1.92
342
3.03
617
8.87
612
03.8
34
168

HEALTH
18

170
Tabl
e No
. 18.
1: N
umbe
r of H
ospi
tal/C
.h.c
/P.h
.c/S
.h.c
/Dis
pens
ary
durin
g 20
17-1
8
SNPa
rtic
ular
sKo
him
aDi
map
urM
okok
chun
gTu
ensa
ngZu
nheb
oto
Wok
haPh
ekM
onPe
ren
Kiph
ireLo
ngle
ngTo
tal
12
34
56
78
910
1112
1314
1Di
stric
t Hos
pita
l1
11
11
11
11
11
11
2Co
mm
unity
Hea
lth C
entr
e3
24
32
23
32
1-
25
3Pr
imar
y He
alth
Cen
tre
179
1714
1312
2314
85
513
7
4Su
bsid
iary
Hea
lth C
entr
e-
--
1-
--
--
--
1
5Di
spen
sarie
s-
-2
--
--
--
--
2
6T.
B. H
ospi
tal
1-
1-
--
--
--
-2
7M
enta
l Hos
pita
l1
--
--
--
--
--
1
8Su
b-Ce
ntre
4482
5869
6148
5172
2931
1455
9
9S.
T.D.
Clin
ic1
11
11
11
11
11
11
10D.
T.C
11
11
11
11
11
111
11Po
st M
ortu
m C
entr
e1
-1
1-
--
--
--
3
12Pa
ra M
edic
al T
rain
ing
Inst
itute
1-
--
--
--
--
-1
13Sc
hool
of N
ursi
ng (G
NM)
11
1-
--
--
--
-3
14Sc
hool
of N
ursi
ng (A
NM)
--
-1
--
--
--
-1
15St
ate
Heal
th F
ood
Labo
rato
ry1
--
--
--
--
--
1
Sour
ce: D
irect
orat
e of
Hea
lth &
Fam
ily W
elfa
re

171
SNPa
rtic
ular
sKo
him
aDi
map
urM
okok
chun
gTu
ensa
ngZu
nheb
oto
Wok
haPh
ekM
onPe
ren
Kiph
ireLo
ngle
ngTo
tal
12
34
56
78
910
1112
1314
1Di
stric
t Hos
pita
l1
11
11
11
11
11
11
2Co
mm
unity
Hea
lth C
entre
32
32
22
32
11
-21
3Pr
imar
y He
alth
Cen
tre14
814
1213
1223
158
43
126
4Su
bsid
iary
Hea
lth C
entre
--
-1
--
--
--
-1
5Di
spen
sarie
s-
12
--
--
--
--
3
6T.
B. H
ospi
tal
1-
1-
--
--
--
-2
7M
enta
l Hos
pita
l1
--
--
--
--
--
1
8Su
b-Ce
ntre
4047
5138
4737
4350
1619
839
6
9S.
T.D.
Clin
ic-
--
--
--
--
--
10D.
T.C
1-
1-
--
--
--
-2
11Po
st M
ortu
m C
entre
--
--
--
--
--
-
12Pa
ra M
edic
al T
rain
ing
Inst
itute
1-
--
--
--
--
-1
13Sc
hool
of N
ursi
ng (G
NM)
11
1-
--
--
--
-3
14Sc
hool
of N
ursi
ng (A
NM)
--
-1
--
--
--
-1
15St
ate
Heal
th F
ood
Labo
rato
ry1
--
--
--
--
--
1
16Ur
ban
Publ
ic H
ealth
Cen
tre-
-1
1-
--
--
--
2
17He
alth
And
Wel
lnes
s Ce
ntre
12
--
--
--
-2
-5
18Ay
ush
Hosp
ital
-1
-1
--
--
--
-2
Sour
ce:-
Dire
ctor
ate
of H
ealth
& F
amily
wel
fare
Tabl
e No
. 18.
2: N
umbe
r of H
ospi
tal/C
.H.C
/P.H
.C/S
.H.C
/Dis
pens
ary
durin
g 20
18-1
9

172
SNPa
rtic
ular
sKo
him
aDi
map
urM
okok
chun
gTu
ensa
ngZu
nheb
oto
Wok
haPh
ekM
onPe
ren
Kiph
ireLo
ngle
ngTo
tal
12
34
56
78
910
1112
1314
1Do
ctor
s(Ge
nera
l)1
132
22
12
11
21
282
Doct
ors(
spec
ialis
t)30
1513
107
87
84
45
111
3De
ntal
Doc
tors
33
32
22
22
22
225
4Ay
ush
Doct
ors
22
-1
--
--
--
-5
5Ph
arm
acis
t74
4953
2831
4531
2216
137
369
6La
b te
chni
cian
177
115
63
22
11
156
7Nu
rse
Sist
er31
1922
133
24
22
1-
998
Staf
f Nur
se79
5162
3631
1629
189
76
344
9AN
M/F
HW13
098
118
8374
8388
7939
3023
845
10LH
V18
611
45
34
33
11
59To
tal
385
263
295
184
161
163
169
137
7761
4619
41
Sour
ce: D
irect
orat
e of
Hea
lth &
Fam
ily W
elfa
re
Tabl
e No
. 18.
3: D
istri
ct-
wis
e Nu
mbe
r of M
edic
al P
erso
nnel
-I du
ring
2017
-18

173
SNPa
rtic
ular
sKo
him
aDi
map
urM
okok
chun
gTu
ensa
ngZu
nheb
oto
Wok
haPh
ekM
onPe
ren
Kiph
ireLo
ngle
ngTo
tal
12
34
56
78
910
1112
1314
1Do
ctor
s(Ge
nera
l)48
1421
1415
2125
1811
143
204
2Do
ctor
s(sp
ecia
list)
5616
148
57
86
65
313
4
3De
ntal
Doc
tors
92
42
22
33
23
234
4Ay
ush
Doct
ors
1315
710
67
66
76
588
5Ph
arm
acis
t69
4953
2731
4532
2116
137
363
6La
b te
chni
cian
167
116
63
32
11
157
7Nu
rsin
g Si
ster
2617
1911
3-
31
11
-82
8St
aff N
urse
7951
6536
3116
2918
107
534
7
9AN
M/F
HW13
198
119
8374
8288
7939
3023
846
10LH
V19
611
45
34
23
11
59
Sour
ce:-
Dire
ctor
ate
of H
ealth
& F
amily
wel
fare
Tabl
e No
. 18.
4: D
istri
ct-
wis
e Nu
mbe
r of M
edic
al P
erso
nnel
-I du
ring
2018
-19

174
SNPa
rtic
ular
sKo
him
aDi
map
urM
okok
chun
gTu
engs
ang
Zunh
ebot
oW
okha
Phek
Mon
Long
leng
Pere
nKi
phire
Tota
l
12
34
56
78
910
1112
1314
1516
1718
1920
2122
2324
2526
Cont
ract
NHM
NSAC
SNH
MNS
ACS
NHM
NSAC
SNH
MNS
ACS
NHM
NSAC
SNH
MNS
ACS
NHM
NSAC
SNH
MNS
ACS
NHM
NSAC
SNH
MNS
ACS
NHM
NSAC
SNH
MNS
ACS
1Do
ctor
s (G
ener
al)
83
124
21
11
41
41
4-
7-
2-
31
21
4913
2Do
ctor
s (S
peci
alis
t)-
14
--
--
--
--
--
--
--
-1
--
-5
1
3De
ntal
Doc
tors
2-
2-
2-
1-
2-
2-
--
1-
--
1-
1-
14-
4Ay
ush
Doto
rs4
-9
-4
-2
-3
-3
-4
-3
-1
-4
-2
-39
-
5Ph
arm
acis
t1
12
11
11
--
11
--
-1
--
--
--
-7
4
6La
b Te
chni
cian
1313
1012
1113
311
19
48
17
-8
33
25
34
5193
7Nu
rsin
g si
ster
/St
aff N
urse
531
471
371
232
191
30-
511
211
12-
281
211
342
10
8AN
M/F
HW36
343
344
541
417
330
338
231
310
315
216
132
132
9LH
V-
--
--
--
--
--
--
--
--
--
--
--
-
Sour
ce:-
Dire
ctor
ate
of H
ealth
& F
amily
wel
fare
Tabl
e No
. 18.
5: N
unbe
r of M
edic
al P
erso
nnel
-II 2
018-
19
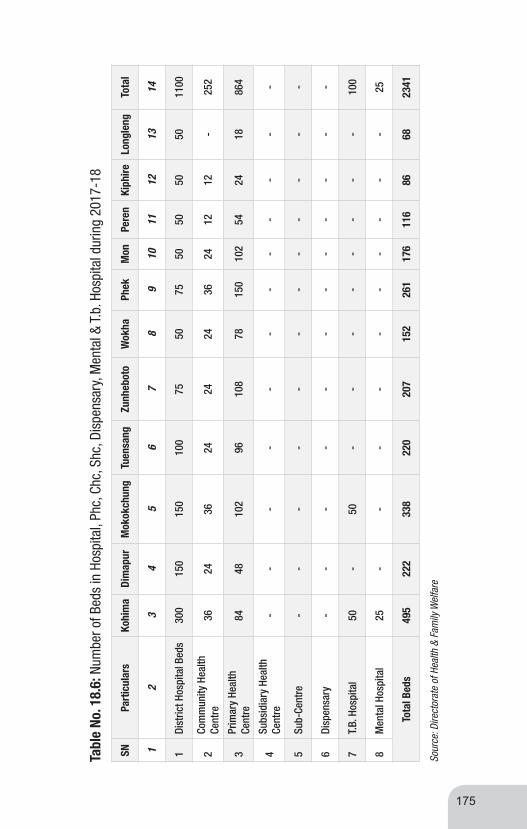
175
SNPa
rtic
ular
sKo
him
a Di
map
urM
okok
chun
gTu
ensa
ngZu
nheb
oto
Wok
ha
Phek
M
onPe
ren
Kiph
ireLo
ngle
ngTo
tal
12
34
56
78
910
1112
1314
1Di
stric
t Hos
pita
l Bed
s 30
015
015
010
075
5075
5050
5050
1100
2Co
mm
unity
Hea
lth
Cent
re36
2436
2424
2436
2412
12-
252
3Pr
imar
y He
alth
Ce
ntre
8448
102
9610
878
150
102
5424
1886
4
4Su
bsid
iary
Hea
lth
Cent
re-
--
--
--
--
--
-
5Su
b-Ce
ntre
--
--
--
--
--
--
6Di
spen
sary
-
--
--
--
--
--
-
7T.
B. H
ospi
tal
50-
50-
--
--
--
-10
0
8M
enta
l Hos
pita
l 25
--
--
--
--
--
25
Tota
l Bed
s49
522
233
822
020
715
226
117
611
686
6823
41
Tabl
e No
. 18.
6: N
umbe
r of B
eds
in H
ospi
tal,
Phc,
Chc
, Shc
, Dis
pens
ary,
Men
tal &
T.b.
Hos
pita
l dur
ing
2017
-18
Sour
ce: D
irect
orat
e of
Hea
lth &
Fam
ily W
elfa
re
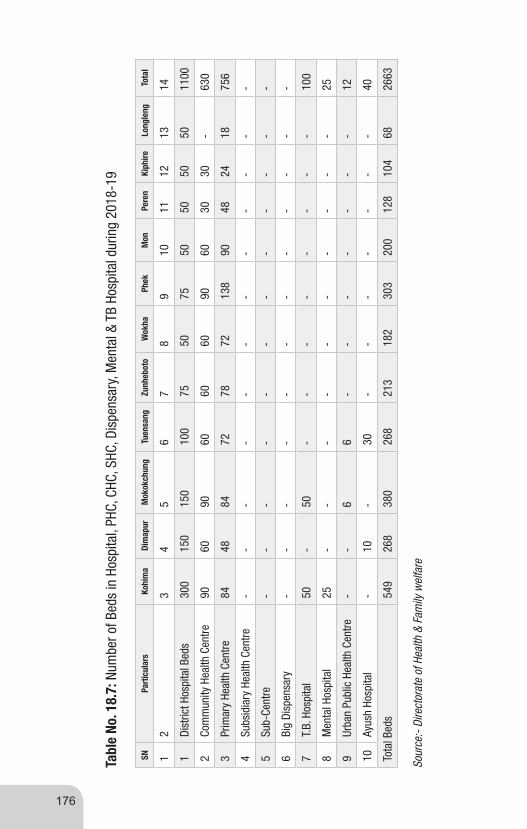
176
SNPa
rtic
ular
sKo
him
a Di
map
urM
okok
chun
gTu
ensa
ngZu
nheb
oto
Wok
ha
Phek
M
onPe
ren
Kiph
ireLo
ngle
ngTo
tal
12
34
56
78
910
1112
1314
1Di
stric
t Hos
pita
l Bed
s 30
015
015
010
075
5075
5050
5050
1100
2Co
mm
unity
Hea
lth C
entre
9060
9060
6060
9060
3030
-63
0
3Pr
imar
y He
alth
Cen
tre84
4884
7278
7213
890
4824
1875
6
4Su
bsid
iary
Hea
lth C
entre
--
--
--
--
--
--
5Su
b-Ce
ntre
--
--
--
--
--
--
6Bi
g Di
spen
sary
-
--
--
--
--
--
-
7T.
B. H
ospi
tal
50-
50-
--
--
--
-10
0
8M
enta
l Hos
pita
l 25
--
--
--
--
--
25
9Ur
ban
Publ
ic H
ealth
Cen
tre-
-6
6-
--
--
--
12
10Ay
ush
Hosp
ital
-10
-30
--
--
--
-40
Tota
l Bed
s54
926
838
026
821
318
230
320
012
810
468
2663
Sour
ce:-
Dire
ctor
ate
of H
ealth
& F
amily
wel
fare
Tabl
e No
. 18.
7: N
umbe
r of B
eds
in H
ospi
tal,
PHC,
CHC
, SHC
, Dis
pens
ary,
Men
tal &
TB
Hosp
ital d
urin
g 20
18-1
9

177
Year
Part
icul
ars
Kohi
ma
Dim
apur
Mok
okch
ung
Tuen
sang
Zunh
ebot
oW
okha
Ph
ek
Mon
Lo
ngle
ngPe
ren
Kiph
ireTo
tal
12
34
56
78
910
1112
1314
2018
-19
Indo
or P
atie
nts
1176
1733
821
1115
2437
1330
8770
2307
736
7245
5111
788
2081
78
Outd
oor P
atie
nts
1630
3651
681
1134
5243
2559
615
445
2494
913
295
6575
1211
031
9064
Sour
ce:-
Dire
ctor
ate
of H
ealth
& F
amily
wel
fare
Tabl
e No
. 18.
8: P
atie
nts
Trea
ted
in H
ospi
tals
and
Dis
pens
arie
s du
ring
201
8-19

178
SNPa
rtic
ular
s Ko
him
a Di
map
urM
okok
chun
gTu
ensa
ngZu
nheb
oto
Wok
ha
Phek
M
onPe
ren
Long
leng
Kiph
ireTo
tal
12
34
56
78
910
1112
1314
1M
edic
al S
uper
inte
nden
t 3
12
11
11
11
11
14
2Ch
ief M
edic
al O
ffice
r/Pr
inci
pal P
MTI
11
11
11
11
11
111
3De
puty
Chi
ef M
edic
al
Offic
er1
11
11
11
11
11
11
4Sr
.Spe
cial
ist
104
43
13
1-
-1
128
5Sr
.Den
tal S
urge
on1
21
11
11
11
11
12
6Sr
.Med
ical
Offi
cer
136
75
53
66
31
257
7Jr
.Spe
cial
ist
62
21
22
11
12
121
8Jr
.Den
tal S
urge
on3
13
11
12
21
11
17
9M
edic
al O
ffice
r29
1422
1815
1523
1810
47
175
10Zo
nal L
epro
sy O
ffice
r1
11
1-
1-
1-
--
6
11Di
stric
t T.B
Offi
cer
11
11
11
11
11
111
12Di
stric
t Mal
aria
Offi
cer
11
1-
-1
11
11
19
13Di
stric
t Im
mun
isat
ion
Offic
er1
11
11
11
11
11
11
14Pr
inci
pal(P
MTI
)1
--
--
--
--
--
1
15Vi
ce P
rinci
pal (
PMTI
)1
--
--
--
--
--
1
16Do
ctor
s in
Dire
ctor
ate
43-
--
--
--
--
-43
Tota
l 11
636
4735
3032
4035
2216
1942
8
Tabl
e No
. 18.
9: D
octo
rs w
ith D
esig
natio
n (D
istri
ct-w
ise)
201
7-18
Sour
ce: D
irect
orat
e of
Hea
lth &
Fam
ily W
elfa
re
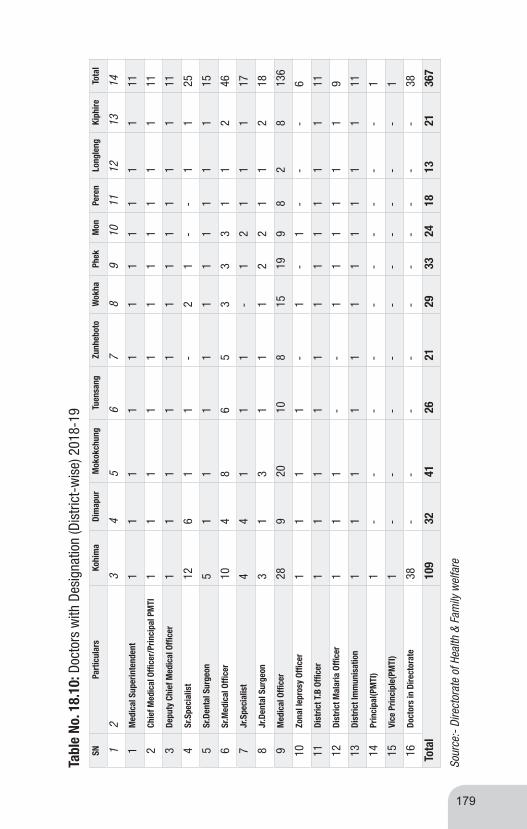
179
SNPa
rtic
ular
s Ko
him
a Di
map
urM
okok
chun
gTu
ensa
ngZu
nheb
oto
Wok
ha
Phek
M
onPe
ren
Long
leng
Kiph
ireTo
tal
12
34
56
78
910
1112
1314
1M
edic
al S
uper
inte
nden
t 1
11
11
11
11
11
11
2Ch
ief M
edic
al O
ffice
r/Pr
inci
pal P
MTI
11
11
11
11
11
111
3De
puty
Chi
ef M
edic
al O
ffice
r1
11
11
11
11
11
11
4Sr
.Spe
cial
ist
126
11
-2
1-
-1
125
5Sr
.Den
tal S
urge
on5
11
11
11
11
11
15
6Sr
.Med
ical
Offi
cer
104
86
53
33
11
246
7Jr
.Spe
cial
ist
44
11
1-
12
11
117
8Jr
.Den
tal S
urge
on3
13
11
12
21
12
18
9M
edic
al O
ffice
r28
920
108
1519
98
28
136
10Zo
nal l
epro
sy O
ffice
r1
11
1-
1-
1-
--
6
11Di
stric
t T.B
Offi
cer
11
11
11
11
11
111
12Di
stric
t Mal
aria
Offi
cer
11
1-
-1
11
11
19
13Di
stric
t Im
mun
isat
ion
11
11
11
11
11
111
14Pr
inci
pal(P
MTI
)1
--
--
--
--
--
1
15Vi
ce P
rinci
ple(
PMTI
)1
--
--
--
--
--
1
16Do
ctor
s in
Dire
ctor
ate
38-
--
--
--
--
-38
Tota
l 10
932
4126
2129
3324
1813
2136
7
Sour
ce:-
Dire
ctor
ate
of H
ealth
& F
amily
wel
fare
Tabl
e No
. 18.
10: D
octo
rs w
ith D
esig
natio
n (D
istri
ct-w
ise)
201
8-19
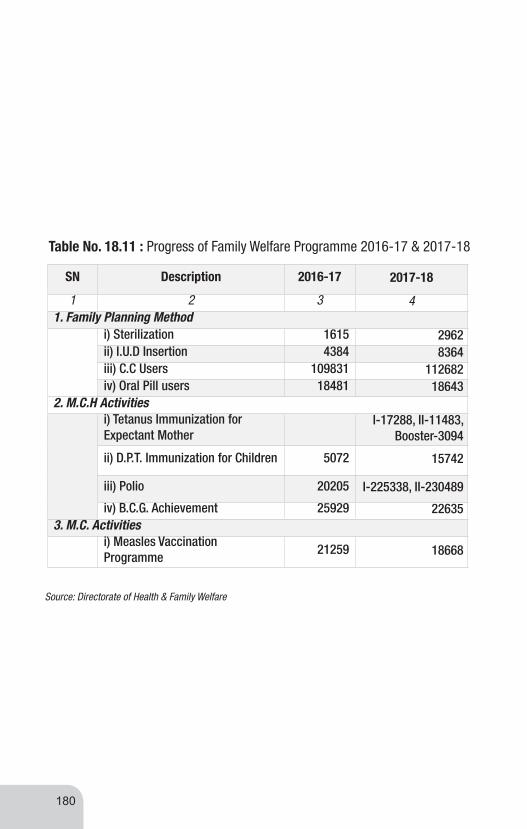
180
SN Description 2016-17 2017-18
1 2 3 41. Family Planning Method
i) Sterilization 1615 2962ii) I.U.D Insertion 4384 8364iii) C.C Users 109831 112682iv) Oral Pill users 18481 18643
2. M.C.H Activitiesi) Tetanus Immunization for Expectant Mother
I-17288, II-11483, Booster-3094
ii) D.P.T. Immunization for Children 5072 15742
iii) Polio 20205 I-225338, II-230489
iv) B.C.G. Achievement 25929 226353. M.C. Activities
i) Measles Vaccination Programme
21259 18668
Table No. 18.11 : Progress of Family Welfare Programme 2016-17 & 2017-18
Source: Directorate of Health & Family Welfare
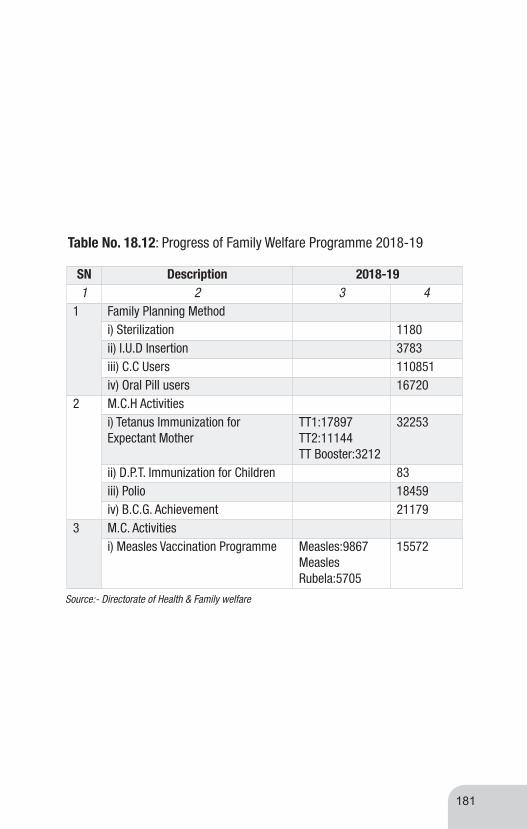
181
Table No. 18.12: Progress of Family Welfare Programme 2018-19
SN Description 2018-191 2 3 4
1 Family Planning Methodi) Sterilization 1180ii) I.U.D Insertion 3783iii) C.C Users 110851iv) Oral Pill users 16720
2 M.C.H Activitiesi) Tetanus Immunization for Expectant Mother
TT1:17897 TT2:11144 TT Booster:3212
32253
ii) D.P.T. Immunization for Children 83iii) Polio 18459iv) B.C.G. Achievement 21179
3 M.C. Activitiesi) Measles Vaccination Programme Measles:9867
Measles Rubela:5705
15572
Source:- Directorate of Health & Family welfare
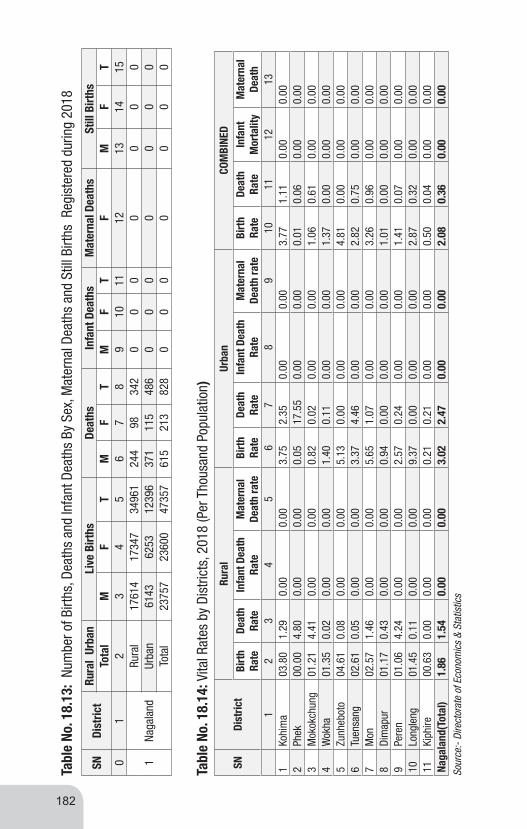
182
SNDi
stric
tRu
ral
Urba
nLi
ve B
irths
Deat
hsIn
fant
Dea
ths
Mat
erna
l Dea
ths
Still
Birt
hsTo
tal
MF
TM
FT
MF
TF
MF
T0
12
34
56
78
910
1112
1314
15
1Na
gala
ndRu
ral
1761
417
347
3496
124
498
342
00
00
00
0Ur
ban
6143
6253
1239
637
111
548
60
00
00
00
Tota
l23
757
2360
047
357
615
213
828
00
00
00
0
Tabl
e No
. 18.
13:
Num
ber o
f Birt
hs, D
eath
s an
d In
fant
Dea
ths
By S
ex, M
ater
nal D
eath
s an
d St
ill B
irths
Reg
iste
red
durin
g 20
18
SNDi
stric
tRu
ral
Urba
nCO
MBI
NED
Birt
h Ra
teDe
ath
Rate
Infa
nt D
eath
Ra
teM
ater
nal
Deat
h ra
te
Birt
h Ra
te
Deat
h Ra
te
Infa
nt D
eath
Ra
teM
ater
nal
Deat
h ra
te
Birt
h Ra
teDe
ath
Rate
Infa
nt
Mor
talit
yM
ater
nal
Deat
h1
23
45
67
89
1011
1213
1Ko
him
a03
.80
1.29
0.00
0.00
3.75
2.35
0.00
0.00
3.77
1.11
0.00
0.00
2Ph
ek00
.00
4.80
0.00
0.00
0.05
17.5
50.
000.
000.
010.
060.
000.
003
Mok
okch
ung
01.2
14.
410.
000.
000.
820.
020.
000.
001.
060.
610.
000.
004
Wok
ha01
.35
0.02
0.00
0.00
1.40
0.11
0.00
0.00
1.37
0.00
0.00
0.00
5Zu
nheb
oto
04.6
10.
080.
000.
005.
130.
000.
000.
004.
810.
000.
000.
006
Tuen
sang
02.6
10.
050.
000.
003.
374.
460.
000.
002.
820.
750.
000.
007
Mon
02.5
71.
460.
000.
005.
651.
070.
000.
003.
260.
960.
000.
008
Dim
apur
01.1
70.
430.
000.
000.
940.
000.
000.
001.
010.
000.
000.
009
Pere
n01
.06
4.24
0.00
0.00
2.57
0.24
0.00
0.00
1.41
0.07
0.00
0.00
10Lo
ngle
ng01
.45
0.11
0.00
0.00
9.37
0.00
0.00
0.00
2.87
0.32
0.00
0.00
11Ki
phire
00.6
30.
000.
000.
000.
210.
210.
000.
000.
500.
040.
000.
00Na
gala
nd(T
otal
)1.
861.
540.
000.
003.
022.
470.
000.
002.
080.
360.
000.
00
Tabl
e No
. 18.
14: V
ital R
ates
by
Dist
ricts
, 201
8 (P
er T
hous
and
Popu
latio
n)
Sour
ce:-
Dire
ctor
ate
of E
cono
mic
s &
Stat
istic
s
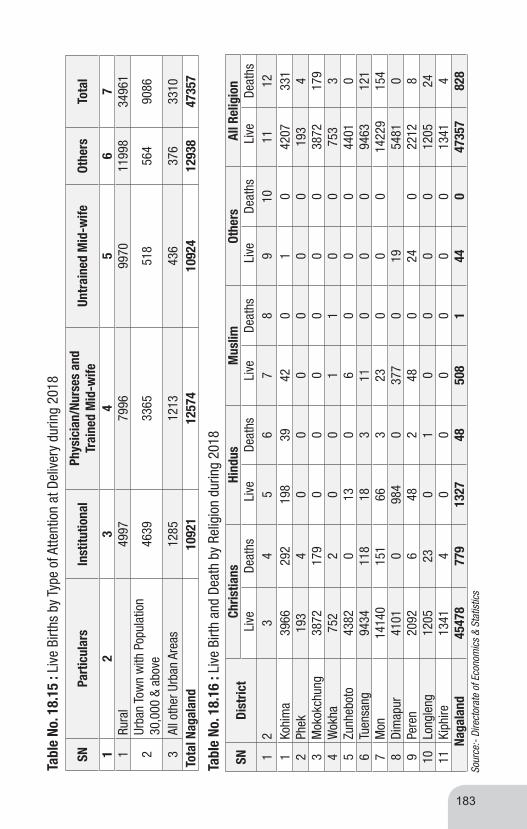
183
Sour
ce:-
Dire
ctor
ate
of E
cono
mic
s &
Stat
istic
s
SNPa
rtic
ular
sIn
stitu
tiona
lPh
ysic
ian/
Nurs
es a
nd
Trai
ned
Mid
-wife
Un
trai
ned
Mid
-wife
Ot
hers
To
tal
12
34
56
71
Rura
l 49
9779
9699
7011
998
3496
1
2Ur
ban
Tow
n w
ith P
opul
atio
n
30,0
00 &
abo
ve46
3933
6551
856
490
86
3Al
l oth
er U
rban
Are
as12
8512
1343
637
633
10To
tal N
agal
and
1092
112
574
1092
412
938
4735
7
Tabl
e No
. 18.
15 :
Live
Birt
hs b
y Ty
pe o
f Atte
ntio
n at
Del
iver
y du
ring
2018
Tabl
e No
. 18.
16 :
Live
Birt
h an
d De
ath
by R
elig
ion
durin
g 20
18
SNDi
stric
tCh
ristia
nsHi
ndus
Mus
limOt
hers
All R
elig
ion
Liv
e De
aths
Liv
e De
aths
Li
ve
Deat
hs L
ive
Deat
hs L
ive
Deat
hs1
23
45
67
89
1011
121
Kohi
ma
3966
292
198
3942
01
042
0733
12
Phek
193
40
00
00
019
34
3M
okok
chun
g38
7217
90
00
00
038
7217
94
Wok
ha75
22
00
11
00
753
35
Zunh
ebot
o43
820
130
60
00
4401
06
Tuen
sang
9434
118
183
110
00
9463
121
7M
on14
140
151
663
230
00
1422
915
48
Dim
apur
4101
098
40
377
019
5481
09
Pere
n20
926
482
480
240
2212
810
Long
leng
1205
230
10
00
012
0524
11Ki
phire
1341
40
00
00
013
414
Nag
alan
d45
478
779
1327
4850
81
440
4735
782
8


SCHOOL EDUCATION
19

186
SNDi
stric
t
Prim
ary
only
w
ith g
rade
s
Uppe
r Pr
imar
y on
ly w
ith
grad
es
Uppe
r Pr
imar
y w
ith
grad
es
Seco
ndar
y w
ith g
rade
s
High
er
Seco
ndar
y w
ith g
rade
s
Seco
ndar
y w
ith g
rade
s
High
er
Seco
ndar
y w
ith
grad
es
Seco
ndar
y on
ly w
ith
grad
es
High
er
Seco
ndar
y w
ith
grad
es
Tota
l Sch
ools
Clas
s 1
to 5
Clas
s 6
to 8
Clas
s 1
to 8
Clas
s 1
to 1
0Cl
ass
1 to
12
Clas
s 6
to 1
0Cl
ass
6 to
12
Clas
s 9
& 10
Clas
s 9
to 1
2
1Di
map
ur13
73
125
157
429
1
2Ki
phire
641
3411
51
111
7
3Ko
him
a10
75
449
112
53
118
7
4Lo
ngle
ng54
185
110
88
5M
okok
chun
g13
03
4916
215
224
6M
on13
64
672
145
228
7Pe
ren
712
407
92
131
8Ph
ek10
34
4210
254
188
9Tu
ensa
ng11
61
6010
165
208
10W
okha
931
4310
113
161
11Zu
nheb
oto
123
584
1210
323
7
Naga
land
Tot
al11
3429
606
107
214
037
32
2060
Tabl
e No
. 19.
1: G
over
men
t Sch
ools
by
Cate
gory
(Dis
trict
-wis
e) d
urin
g 2
017-
18
Sour
ce:
Unifi
ed D
istri
ct In
form
atio
n Sy
stem
for E
duca
tion
(UDI
SE)

187
SNDi
stric
tPr
imar
yUp
per P
rimar
ySe
cond
ary
High
er S
econ
dary
Tota
l(C
l. 1
- 5)
(Cl.
6 - 8
)(C
l. 9
- 10)
(Cl.
11 -
12)
1Di
map
ur57
975
3177
118
763
1449
312
3002
2Ki
phire
7875
3835
1831
212
1375
3
3Ko
him
a26
427
1404
992
6264
4556
183
4Lo
ngle
ng45
5122
2315
1712
484
15
5M
okok
chun
g13
756
6939
3897
2205
2679
7
6M
on26
134
1085
149
6216
6143
608
7Pe
ren
1186
151
6326
6195
320
638
8Ph
ek15
511
7326
4317
1349
2850
3
9Tu
ensa
ng16
717
8551
4111
1198
3057
7
10W
okha
7837
4085
2766
997
1568
5
11Zu
nheb
oto
1512
460
9934
7797
825
678
Naga
land
Tot
al20
3768
1008
9257
564
3061
539
2839
Tabl
e No
. 19.
2: D
istri
ct-w
ise
Enro
lmen
t by
Scho
ol C
ateg
ory
(All
Man
agem
ent)
durin
g 20
17-1
8
Sour
ce:
Unifi
ed D
istri
ct In
form
atio
n Sy
stem
for E
duca
tion
(UDI
SE)

188
SNDi
stric
tPr
imar
yUp
per P
rimar
ySe
cond
ary
High
er S
econ
dary
Tota
l(C
l. 1
- 5)
(Cl.
6 - 8
)(C
l. 9
- 10)
(Cl.
11 -
12)
1Di
map
ur21
134
9245
3237
1029
3464
5
2Ki
phire
3555
1440
600
212
5807
3Ko
him
a65
7836
4719
5610
7813
259
4Lo
ngle
ng23
2892
274
310
440
97
5M
okok
chun
g68
0633
2315
2095
412
603
6M
on13
494
5059
2139
1267
2195
9
7Pe
ren
6859
2464
1067
432
1082
2
8Ph
ek74
6834
8120
5683
613
841
9Tu
ensa
ng10
238
4140
2165
923
1746
6
10W
okha
2842
1227
836
562
5467
11Zu
nheb
oto
8359
2450
1451
323
1258
3
Naga
land
Tot
al89
661
3739
817
770
7720
1525
49
Tabl
e No
. 19.
3: D
istri
ct-w
ise
Enro
lmen
t by
Scho
ol C
ateg
ory
(Gov
t. on
ly) d
urin
g 20
17-1
8
Sour
ce:
Unifi
ed D
istri
ct In
form
atio
n Sy
stem
for E
duca
tion
(UDI
SE)
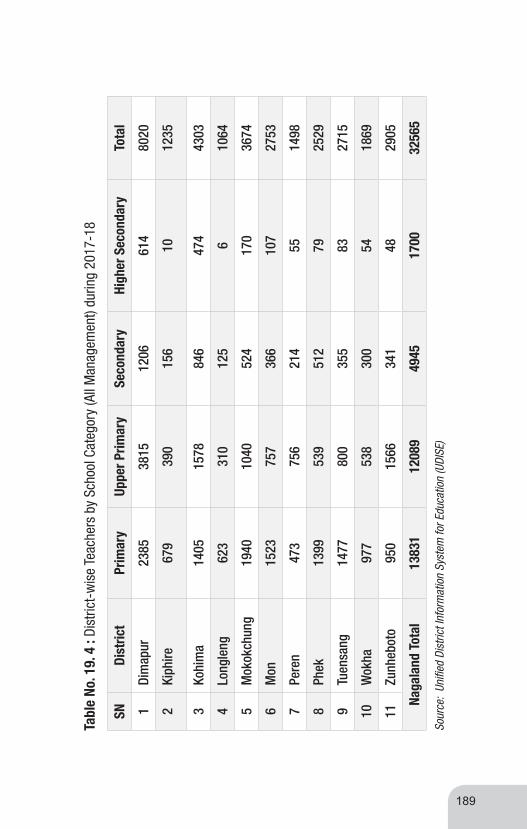
189
SNDi
stric
tPr
imar
yUp
per P
rimar
ySe
cond
ary
High
er S
econ
dary
Tota
l
1Di
map
ur23
8538
1512
0661
480
20
2Ki
phire
679
390
156
1012
35
3Ko
him
a14
0515
7884
647
443
03
4Lo
ngle
ng62
331
012
56
1064
5M
okok
chun
g19
4010
4052
417
036
74
6M
on15
2375
736
610
727
53
7Pe
ren
473
756
214
5514
98
8Ph
ek13
9953
951
279
2529
9Tu
ensa
ng14
7780
035
583
2715
10W
okha
977
538
300
5418
69
11Zu
nheb
oto
950
1566
341
4829
05
Naga
land
Tot
al13
831
1208
949
4517
0032
565
Tabl
e No
. 19.
4 :
Dist
rict-
wis
e Te
ache
rs b
y Sc
hool
Cat
egor
y (A
ll M
anag
emen
t) du
ring
2017
-18
Sour
ce:
Unifi
ed D
istri
ct In
form
atio
n Sy
stem
for E
duca
tion
(UDI
SE)

190
Tabl
e No
.19.
5: D
istri
ct-w
ise
Teac
hers
by
Scho
ol C
ateg
ory
(Gov
t. on
ly) d
urin
g 20
17-1
8
SNDi
stric
tPr
imar
yUp
per P
rimar
ySe
cond
ary
High
er S
econ
dary
Tota
l
1Di
map
ur12
0120
9227
660
3629
2Ki
phire
527
274
125
1093
6
3Ko
him
a66
789
931
011
319
89
4Lo
ngle
ng45
123
283
276
8
5M
okok
chun
g15
2777
934
682
2734
6M
on97
546
815
477
1674
7Pe
ren
322
516
110
2397
1
8Ph
ek82
247
035
152
1695
9Tu
ensa
ng11
4454
522
274
1985
10W
okha
726
355
188
2812
97
11Zu
nheb
oto
772
1151
212
3021
65
Naga
land
Tot
al91
3477
8123
7755
119
843
Sour
ce:
Unifi
ed D
istri
ct In
form
atio
n Sy
stem
for E
duca
tion
(UDI
SE)
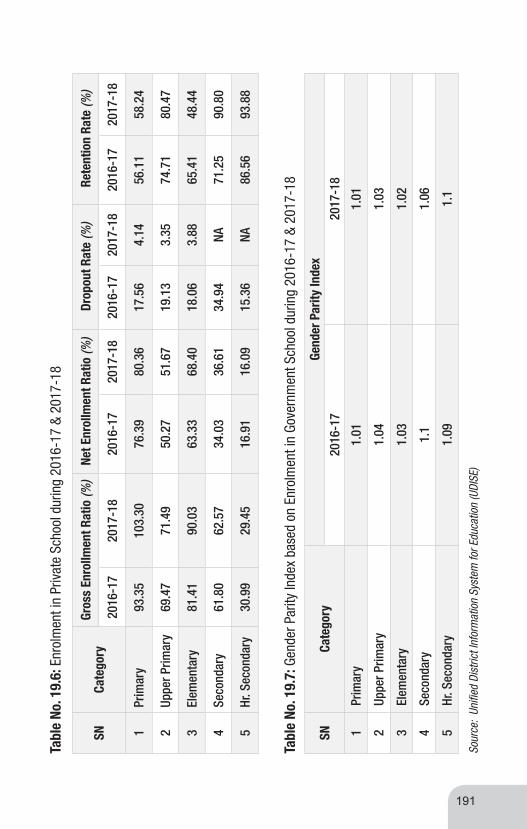
191
Tabl
e No
. 19.
6: E
nrol
men
t in
Priv
ate
Scho
ol d
urin
g 20
16-1
7 &
2017
-18
SNCa
tego
ryGr
oss
Enro
llmen
t Rat
io (%
)Ne
t Enr
ollm
ent R
atio
(%)
Drop
out R
ate
(%)
Rete
ntio
n Ra
te (%
)
2016
-17
2017
-18
2016
-17
2017
-18
2016
-17
2017
-18
2016
-17
2017
-18
1Pr
imar
y93
.35
103.
3076
.39
80.3
617
.56
4.14
56.1
158
.24
2Up
per P
rimar
y69
.47
71.4
950
.27
51.6
719
.13
3.35
74.7
180
.47
3El
emen
tary
81.4
190
.03
63.3
368
.40
18.0
63.
8865
.41
48.4
4
4Se
cond
ary
61.8
062
.57
34.0
336
.61
34.9
4NA
71.2
590
.80
5Hr
. Sec
onda
ry30
.99
29.4
516
.91
16.0
915
.36
NA86
.56
93.8
8
SNCa
tego
ryGe
nder
Par
ity In
dex
2016
-17
2017
-18
1Pr
imar
y1.
011.
01
2Up
per P
rimar
y1.
041.
03
3El
emen
tary
1.03
1.02
4Se
cond
ary
1.1
1.06
5Hr
. Sec
onda
ry1.
091.
1
Tabl
e No
. 19.
7: G
ende
r Par
ity In
dex
base
d on
Enr
olm
ent i
n Go
vern
men
t Sch
ool d
urin
g 20
16-1
7 &
2017
-18
Sour
ce:
Unifi
ed D
istri
ct In
form
atio
n Sy
stem
for E
duca
tion
(UDI
SE)

192
SNDi
stric
t
Prim
ary
on
ly w
ith
grad
es
Uppe
r Pr
imar
y on
ly w
ith
grad
es
Uppe
r Pr
imar
y w
ith g
rade
s
Seco
ndar
y w
ith g
rade
s
High
er
seco
ndar
y
with
gra
des
Seco
ndar
y
with
gra
des
High
er
Seco
ndar
y w
ith g
rade
s
Seco
ndar
y w
ith g
rade
s
High
er
Seco
ndar
y
with
gra
des
Tota
l Sc
hool
Clas
s 1
to 5
Clas
s 1-
8Cl
ass
6 to
8Cl
ass
1 to
10
Clas
s 1
to 1
2Cl
ass
6 to
10
Clas
s 6
to 1
2Cl
ass
9 &
10Cl
ass
9 to
12
1M
on13
764
53
012
51
022
7
2Tu
ensa
ng11
658
19
016
50
020
5
3M
okok
chun
g10
352
023
014
50
019
7
4Zu
nheb
oto
121
835
130
93
00
234
5W
okha
8143
18
013
30
014
9
6Di
map
ur13
712
42
161
56
00
291
7Ko
him
a87
501
131
85
31
169
8Ph
ek10
336
85
030
40
018
6
9Lo
ngle
ng54
181
51
90
00
88
10Ki
phire
5832
111
05
20
010
9
11Pe
ren
7241
18
08
20
013
2
Tota
l10
6960
126
114
312
940
41
1987
Tabl
e No
. 19.
8 :
Gove
rmen
t Sch
ools
by
Cate
gory
(Dis
trict
-wis
e) d
urin
g 2
018-
19
Sour
ce:
Unifi
ed D
istri
ct In
form
atio
n Sy
stem
for E
duca
tion
(UDI
SE)

193
SNDi
stric
tPr
imar
y
Uppe
r Prim
ary
Seco
ndar
y Hi
gher
sec
onda
ry
Tota
l
Clas
ses
1 to
5Cl
ass
6 to
8Cl
ass
9 &
10Cl
ass
11 &
12
Clas
s 1
to 1
2
1M
on25
707
1099
249
5415
0443
157
2Tu
ensa
ng18
126
8776
4158
1216
3227
6
3M
okok
chun
g10
744
6374
3885
2052
2305
5
4Zu
nheb
oto
1098
657
7429
0198
620
647
5W
okha
6791
4245
2613
1006
1465
5
6Di
map
ur59
507
3198
618
561
1468
012
4734
7Ko
him
a21
794
1403
490
4884
4053
316
8Ph
ek11
311
6789
4004
1418
2352
2
9Lo
ngle
ng49
3023
7111
6926
287
32
10Ki
phire
7848
3714
1935
382
1387
9
11Pe
ren
9597
5060
2718
953
1832
8
Tota
l18
7341
1001
1555
946
3289
937
6301
Sour
ce:
Unifi
ed D
istri
ct In
form
atio
n Sy
stem
for E
duca
tion
(UDI
SE)
Tabl
e No
. 19.
9 :
Dist
rict-
wis
e En
rolm
ent b
y Sc
hool
Cat
egor
y (A
ll M
anag
emen
t) du
ring
2018
-19

194
SNDi
stric
tPr
imar
y
Uppe
r Prim
ary
Seco
ndar
y Hi
gher
sec
onda
ry
Tota
l
Clas
ses
1-5
Clas
s 6-
8Cl
ass
9 &
10Cl
ass
11 &
12
Clas
s 1
to 1
2
1M
on12
805
5118
1900
1022
2084
5
2Tu
ensa
ng95
8240
7114
9893
416
085
3M
okok
chun
g49
0729
2216
6593
710
431
4Zu
nheb
oto
4434
1968
912
376
7690
5W
okha
1946
1306
762
626
4640
6Di
map
ur20
452
9213
3120
913
3369
8
7Ko
him
a51
6935
7217
5214
9811
991
8Ph
ek42
2931
0618
7510
2610
236
9Lo
ngle
ng20
5510
8053
526
239
32
10Ki
phire
3011
1304
556
223
5094
11Pe
ren
4672
2409
1059
480
8620
Tota
l73
262
3606
915
634
8297
1332
62
Tabl
e No
. 19.
10: D
istri
ct-w
ise
Enro
lmen
t by
Scho
ol C
ateg
ory
(Gov
t. on
ly) d
urin
g 20
18-1
9
Sour
ce:
Unifi
ed D
istri
ct In
form
atio
n Sy
stem
for E
duca
tion
(UDI
SE)

195
SNDi
stric
tPr
imar
y Up
per P
rimar
y Se
cond
ary
High
er s
econ
dary
To
tal
1Di
map
ur25
3636
8612
2161
080
53
2Ki
phire
642
416
153
1212
23
3Ko
him
a14
5115
7587
746
343
66
4Lo
ngle
ng57
232
914
05
1046
5M
okok
chun
g18
2410
9554
016
636
25
6M
on14
7476
734
910
226
92
7Pe
ren
465
633
217
4713
62
8Ph
ek10
6480
251
180
2457
9Tu
ensa
ng13
4985
639
683
2684
10W
okha
855
605
328
5718
45
11Zu
nheb
oto
915
1375
320
5226
62
Tota
l13
147
1213
950
5216
7732
015
Sour
ce:
Unifi
ed D
istri
ct In
form
atio
n Sy
stem
for E
duca
tion
(UDI
SE)
Tabl
e No
. 19.
11: D
istri
ct-w
ise
Teac
hers
by
Scho
ol C
ateg
ory
(All
Man
agem
ent)
durin
g 20
18-1
9

196
SNDi
stric
tPr
imar
y Up
per P
rimar
y Se
cond
ary
High
er
seco
ndar
y To
tal
1Di
map
ur14
4520
2627
880
3829
2Ki
phire
487
287
116
1290
2
3Ko
him
a71
589
529
411
820
22
4Lo
ngle
ng44
725
182
578
5
5M
okok
chun
g14
3879
935
484
2675
6M
on95
343
816
077
1628
7Pe
ren
328
420
115
2488
7
8Ph
ek75
750
135
651
1665
9Tu
ensa
ng10
9653
524
369
1943
10W
okha
634
399
202
3012
65
11Zu
nheb
oto
755
1042
192
3620
25
Tota
l90
5575
9323
9258
619
626
Tabl
e No
. 19.
12 :
Dist
rict-
wis
e Te
ache
rs b
y Sc
hool
Cat
egor
y (G
ovt.
only
) dur
ing
2018
-19
Sour
ce:
Unifi
ed D
istri
ct In
form
atio
n Sy
stem
for E
duca
tion
(UDI
SE)

197
SNCa
tego
ryGr
oss
Enro
llmen
t Ra
tio
Net
Enro
llmen
t Ra
tio
Drop
out
Rate
Rete
ntio
n Ra
te
Gend
er
Parit
y In
dex
2017
-18
2018
-19
2017
-18
2018
-19
2017
-18
2018
-19
2017
-18
2018
-19
2017
-18
2018
-19
1Pr
imar
y10
3.3
78.6
280
.36
65.3
34.
145.
3158
.24
NA1.
010.
94
2Up
per
Prim
ary
71.4
910
3.56
51.6
775
.13
3.35
3.88
80.4
7NA
1.03
0.99
3El
emen
tary
90.0
391
.09
68.4
70.2
33.
884.
8348
.44
NA1.
020.
95
4Se
cond
ary
62.5
772
.336
.61
45.3
3NA
NA90
.8NA
1.06
1.03
5Hi
gher
Se
cond
ary
29.4
539
.39
16.0
923
.13
NANA
93.8
8NA
1.1
1.05
Tabl
e No
.19.
13: E
nrol
men
t in
Priv
ate
Scho
ol a
nd G
ende
r Par
ity In
dex-
dur
ing
2017
-18
& 20
18-1
9
Sour
ce:
Unifi
ed D
istri
ct In
form
atio
n Sy
stem
for E
duca
tion
(UDI
SE)


HIGHER EDUCATION
20

200
Year
Num
ber
of In
stitu
tions
Tota
lN
umbe
r of
Deg
ree
Stud
ents
Tota
lPr
ivat
eGo
vern
men
tPr
ivat
eGo
vern
men
t
12
34
56
7
2015
-16
4815
6314
115
5945
2006
0
2016
-17
5015
6520
317
8267
2858
4
2017
-18
4915
6422
138
8257
3052
3
Tabl
e No
. 20.
1: N
umbe
r of D
egre
e Ed
ucat
iona
l Ins
titut
ions
and
Stu
dent
s En
rolm
ent d
urin
g 20
15-1
6, 2
016-
17 &
201
7-18
Year
Staf
f of G
over
nmen
t Col
lege
Teac
hing
sta
ffNo
n-Te
achi
ng s
taff
Tota
l
12
33
2015
-16
573
587
1160
2016
-17
438
321
759
2017
-18
429
323
752
Tabl
e No
. 20.
2: N
umbe
r of T
each
ing
and
Non-
Teac
hing
Sta
ff in
Gov
ernm
ent C
olle
ges
durin
g 20
15-1
6,
2016
-17
& 20
17-1
8
Sour
ce: D
irect
orat
e of
Hig
her E
duca
tion

201
Year
Type
s of
Exa
mNo
. of A
pplic
ant
No. o
f Stu
dent
s Pa
ssed
Pas
s Pe
rcen
tage
(% )
1Ar
ts48
3340
2083
.19
2Sc
ienc
e11
6896
682
.71
3Co
mm
erce
613
380
62.0
0
4LL
B67
3958
.20
5B.
Ed
301
270
89.7
1
6BB
A26
2610
0.00
7BC
A9
910
0.00
8M
CA2
210
0.00
9B.
Mus
ic26
1453
.80
Tabl
e No
. 20.
4: R
esul
t of D
iffer
ent E
xam
inat
ions
(Deg
ree)
dur
ing
2017
-18
Sour
ce: D
irect
orat
e of
Hig
her E
duca
tion
SNTy
pes
of E
xam
2016
No. o
f App
lican
tNo
.of S
tude
nts
Pass
ed P
ass
Perc
enta
ge (%
)1
23
45
1BA
4640
3456
74.4
8
2B.
SC54
340
875
.14
3B.
COM
685
503
73.4
3
4B.
ED41
431
977
.05
Tabl
e No
. 20.
3: R
esul
t of D
iffer
ent E
xam
inat
ions
(Deg
ree)
dur
ing
2016
-17

202
SNTy
pes
of In
stitu
tion
2014
-15
2015
-16
2016
-17
2017
-18
12
34
56
1. U
nive
rsity
44
44
2. C
olle
ge o
f Gen
eral
Edu
catio
n
(a) G
over
nmen
t13
1513
13
(b) P
rivat
e40
4861
61
3. H
ighe
r Pro
fess
iona
l Edu
catio
n
(i) N
agal
and
Colle
ge o
f Tea
cher
s Ed
ucat
ion
(a) G
over
nmen
t2
22
2
(b) P
rivat
e6
87
7
(ii) A
gric
ultu
re c
olle
ge1
1NR
NR
(iii)
Theo
logy
2629
NRNR
4. L
aw C
olle
ge3
33
3
5. M
anag
emen
t1
11
1
6. In
form
atio
n Te
chno
logy
11
11
Tabl
e No
. 20.
5: N
umbe
r of E
duca
tiona
l Ins
titut
ions
(Deg
ree)
201
4-15
to 2
017-
18
Sour
ce: D
irect
orat
e of
Hig
her E
duca
tion

203
a) N
o. o
f Hig
her E
duca
tiona
l Ins
titut
ions
SNIn
stitu
teNo
1Ce
ntra
l Uni
vers
ity1
2Pr
ivat
e Un
iver
sitie
s3
3In
stitu
te o
f Nat
iona
l Im
porta
nce
1
Tota
l5
Sl.N
oCo
llege
sNo
1Go
vern
men
t15
Priv
ate
50
Tota
l65
b) D
istri
ct w
ise
brea
k up
of C
olle
ges
SNDi
stric
tNo
of C
olle
ges
Tota
lGo
vern
men
tPr
ivat
e
Gene
ral
B.Ed
Gene
ral
B.Ed
1Ko
him
a2
114
320
2Di
map
ur1
Nil
214
26
3W
okha
1Ni
l1
Nil
2
4M
okok
chun
g1
14
Nil
6
5Tu
ensa
ng1
Nil
2Ni
l3
Tabl
e No
. 20.
6: H
ighe
r Edu
catio
n At
a G
lanc
e (2
018-
19)

204
6Zu
nheb
oto
1Ni
lNi
lNi
l1
7Ki
phire
1Ni
lNi
lNi
l1
8Lo
ngle
ng1
Nil
Nil
Nil
1
9Pe
ren
1Ni
l 1
Nil
2
10Ph
ek2
Nil
Nil
Nil
2
11M
on1
Nil
Nil
Nil
1
Tota
l13
243
765
Resu
lt of
Deg
ree
Exam
inat
ion
2018
-19(
Govt
)
Sl.N
oSt
ream
Tota
l App
eare
dTo
tal P
asse
dPe
rcen
tage
1Ar
ts23
3818
1078
%
2B.
Sc10
7395
687
%
3M
.Sc
134
124
93%
4B.
Com
8549
58%
5B.
Ed17
215
188
%
6M
.Ed
2017
85%
Sour
ce: D
irect
orat
e of
Hig
her E
duca
tion
Cont
.

205
Source: Directorate of Higher Education
SN Stream Total Appeared Total Passed Percentage
1 Arts 3355 2527 75%
2 Science 258 204 79%
3 Commerce 439 271 62%
4 LLB 86 28 33%
5 B.Ed 305 229 75%
6 BBA 34 34 100%
7 BCA 4 4 100%
8 MSW 36 35 97%
9 B. Music 11 8 73%
SN Classification No
1 M.Sc 172
2 M.Ed 37
3 B.Sc 1624
4 BA 5485
5 B.Ed 323
6 B.Com 303
Total 7944
Table No. 20.8: Results of Degree Exams 2018-19 (Private Colleges)
Table No. 20.7: Classification of Enrolment 2018-19 (Govt)

206
SN Stream Male Female Total
1 Arts 6802 8347 15149
2 Science 724 651 375
3 Commerce 1343 894 2237
4 B.Ed 272 619 891
5 LLB 111 92 203
6 BBA 138 86 224
7 BCA 26 13 39
Total 9416 10702 20118
8 Others Courses 928 781 1709
Grand Total 10344 11483 21827
Source: Directorate of Higher Education
Table No. 20.9 : Enrolment of Private Secular College 2017-18

207
SN Name of Scheme No. of Beneficiaries Amount Utilized
1 Post matric Scholarship 30413 Rs.32,41,12,685/-
2 Nagaland Merit Scholarship 1088 Rs.1,69,03,320/-
3 Nagaland Research Scholarship 76 Rs. 17,75,000/-
4 North-East Council 85 Rs.18,15,000/-
Total 31662 Rs. 34,46,06,005/-
Total Number of Hostels Registred (2017-18)
SN District No. of registered Hostels
1 Kohima 382
2 Dimapur 441
3 Mokokchung 43
4 Phek 9
5 Zunheboto 27
6 Tuensang 11
7 Wokha 11
8 Kiphire 1
9 Mon 8
10 Longleng Nil
11 Peren 2
Total 935
Source: Directorate of Higher Education
Table No. 20.10: Total number of beneficiaries and Amount Utilized in Various Scholarship Schemes During 2017-18


RURAL DEVELOPMENT
21

210
SNHe
ads/
Sch
emes
2017
-18
2018
-19
12
34
1Pr
adha
n M
antri
Aw
aas
Yoja
na-G
ram
in14
8.33
0.00
2Na
gala
nd S
tate
Rur
al L
ivel
ihoo
d M
issi
on (N
SRLM
)11
01.6
623
20
3In
dira
Aw
aas
Yoja
na (I
AY)
4M
ahat
ma
Gand
hi N
atio
nal R
ural
Em
ploy
men
t G
uara
ntee
Sch
eme
(MGN
REGS
)95
501.
1822
746.
85
5Gr
ant-
in-A
id (G
IA)
3200
.00
3200
.00
6Ba
ckw
ard
Regi
ons
Gran
t Fun
d (B
RGF)
Delin
ked
Delin
ked
Sour
ce: D
irect
orat
e of
Rur
al D
evel
opm
ent
Tabl
e No
. 21.
1 : S
tate
men
t Sho
win
g Ex
pend
iture
s Un
der V
ario
us R
ural
Dev
elop
men
t Pro
gram
mes

211
Tabl
e No
. 21.
2: P
hysi
cal &
Fin
anci
al A
chie
vem
ent R
epor
t und
er P
radh
am M
antri
Aw
aas
Yoja
na-G
ram
in (P
MAY
-G) d
urin
g 20
17-1
8 (P
rovi
sion
al)
SNNa
me
of
Dist
rict/
DRD
ABa
se o
n 01
-04-
2017
Fund
Ava
ilabl
eBa
nk
Inte
rest
/ M
isc.
Re
ceip
t
Tota
l Fun
d Av
aila
ble
(3+
6+7)
Expe
nditu
re
Phys
ical
Ach
ieve
men
t (in
Uni
ts)
Cent
reSt
ate
Tota
l (4
+5)
Targ
etAc
hiev
ed
12
34
56
1013
1416
17
1St
ate
4362
.953
998.
380
612.
127
1610
.51
152.
340
6125
.80
27.7
30-
-
2Di
map
ur0.
383
11.0
11-
11.0
11-
11.3
910
.25
--
3Ki
phire
0.01
128
.776
-28
.776
-28
.79
25.9
1-
-
4Ko
him
a0.
323
3.68
5-
3.68
5-
4.01
3.61
--
5Lo
ngle
ng1.
204
11.0
56-
11.0
56-
12.2
611
.03
--
6M
okok
chun
g1.
956
5.32
4-
5.32
4-
7.28
6.55
--
7M
on1.
633
25.0
00-
25.0
00-
26.6
323
.97
--
8Pe
ren
0.32
020
.790
-20
.790
-21
.11
19.0
0-
-
9Ph
ek0.
400
9.82
8-
9.82
8-
10.2
39.
21-
-
10Tu
ensa
ng1.
032
25.0
00-
25.0
00-
26.0
323
.43
--
11W
okha
7.96
76.
552
-6.
552
-14
.52
13.0
7-
-
12Zu
nheb
oto
0.09
62.
457
-2.
457
-2.
552.
30-
-
Tota
l43
78.2
7814
9.47
961
2.12
714
9.47
915
2.34
016
4.80
148.
33-
-
(Rs.
In L
akhs
)
Sour
ce:D
irect
orat
e of
Rur
al D
evel
opm
ent

212
(Rs.
In L
akhs
)
SNNa
me
of
Dist
rict/
DRD
AOB
as
on 0
1-04
-201
7Fu
nd A
vaila
ble
Bank
In
tere
st/
Mis
c. R
ecei
pt
Tota
l Fun
d Av
aila
ble
(3+6
+7)
Expe
nditu
re
Phys
ical
Ach
ieve
men
t (in
Uni
ts)
Cent
reSt
ate
Tota
l (4
+5)
Targ
etAc
hiev
ed
12
34
56
78
910
11
1St
ate
6098
.07
0.00
0.00
0.00
0.00
6098
.07
0.00
Nil
Nil
2Di
map
ur1.
140.
000.
000.
000.
001.
140.
00Ni
lNi
l
3Ki
phire
2.88
0.00
0.00
0.00
0.00
2.88
0.00
Nil
Nil
4Ko
him
a0.
400.
000.
000.
000.
000.
400.
00Ni
lNi
l
5Lo
ngle
ng1.
230.
000.
000.
000.
001.
230.
00Ni
lNi
l
6M
okok
chun
g0.
730.
000.
000.
000.
000.
730.
00Ni
lNi
l
7M
on2.
660.
000.
000.
000.
002.
660.
00Ni
lNi
l
8Pe
ren
2.11
0.00
0.00
0.00
0.00
2.11
0.00
Nil
Nil
9Ph
ek1.
020.
000.
000.
000.
001.
020.
00Ni
lNi
l
10Tu
ensa
ng2.
600.
000.
000.
000.
002.
600.
00Ni
lNi
l
11W
okha
1.45
0.00
0.00
0.00
0.00
1.45
0.00
Nil
Nil
12Zu
nheb
oto
0.25
0.00
0.00
0.00
0.00
0.25
0.00
Nil
Nil
Tota
l61
14.5
40.
000.
000.
000.
0061
14.5
40.
00Ni
lNi
l
Tabl
e No
. 21.
3 :
Phys
ical
& F
inan
cial
Ach
ieve
men
t Rep
ort u
nder
Pra
dham
Man
tri A
waa
s Yo
jana
-Gra
min
(PM
AY-G
) du
ring
2018
-19(
Prov
isio
nal)
Sour
ce:D
irect
orat
e of
Rur
al D
evel
opm
ent

213
SNNa
me
of th
e Di
stric
t
Cum
ulat
ive
No. o
f Ho
useh
old
issu
ed J
ob
Card
(till
the
repo
rtin
g m
onth
)
Cum
ulat
ive
No.
of H
ouse
hold
de
man
ded
empl
oym
ent
Cum
ulat
ive
No.
of H
ouse
hold
pr
ovid
ed
empl
oym
ent
Cum
ulat
ive
No.
of H
ouse
hold
w
orki
ng u
nder
M
GNRE
GS
Cum
ulat
ive
pers
onda
ys g
ener
ated
(in la
khs)
Cum
ulat
ive
No. o
f Ho
useh
old
com
plet
ed
100
days
No. o
f Hou
seho
ld
whi
ch a
re
bene
ficia
ry o
f La
nd R
efor
m/IA
Y
No. o
f Di
sabl
ed
Bene
ficia
ry
(indi
vidu
al)
SCST
Othe
rsSC
STOt
hers
Wom
en
12
34
56
78
910
1112
1314
15
1Di
map
ur36
0865
486
4004
6941
569
225
6933
020
8879
3845
540
2581
2710
6958
590
178
26
2Ki
phire
323
572
5423
610
2272
122
990
170
1282
544
3070
4003
230
193
3Ko
him
a0
5408
016
241
052
4055
940
929
012
2802
483
554
0350
02
10
4Lo
ngle
ng1
2133
491
2125
021
249
2125
061
1183
162
4989
2819
860
04
5M
okok
chun
g1
3520
735
239
145
3914
339
144
6426
8063
325
246
9106
430
52
6M
on9
3946
626
339
828
3925
439
828
608
2518
553
1848
690
4171
00
7
7Pe
ren
7026
871
115
2678
326
670
2678
329
3418
2950
856
7429
8977
01
31
8Ph
ek27
3091
931
9334
048
3404
634
048
1512
1177
114
1087
1943
1628
040
18
9Tu
ensa
ng7
4197
265
5248
555
4855
548
555
481
2579
748
4226
3173
9578
03
3
10W
okha
535
646
531
3557
934
836
3557
921
616
4803
521
887
5816
880
45
11Zu
nheb
oto
037
627
159
3455
534
073
3455
40
2663
695
918
6559
7413
213
10
Tota
l37
3141
2180
1547
641
3820
4103
3141
2990
2149
2522
6365
5687
0582
6814
903
222
265
119
Tabl
e No
. 21.
4 : A
nnua
l Per
form
ance
Rep
ort u
nder
the
Mah
atm
a Ga
ndhi
Nat
iona
l Rur
al E
mpl
oym
ent
Guar
ante
e Sc
hem
e (M
GNRE
GS) d
urin
g 20
17-1
8 (P
rovi
sion
al)
Empl
oym
ent G
ener
atio
n
Sour
ce:D
irect
orat
e of
Rur
al D
evel
opm
ent
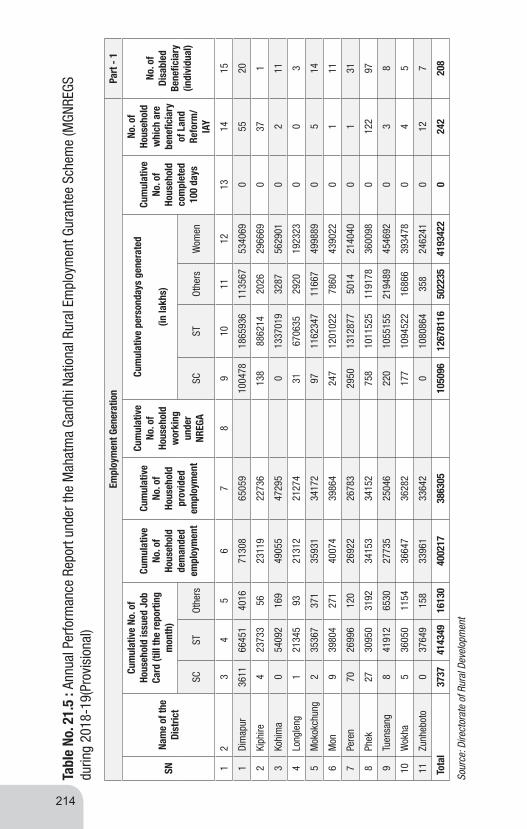
214
Empl
oym
ent G
ener
atio
nPa
rt -
1
SNNa
me
of th
e Di
stric
t
Cum
ulat
ive
No. o
f Ho
useh
old
issu
ed J
ob
Card
(till
the
repo
rtin
g m
onth
)
Cum
ulat
ive
No. o
f Ho
useh
old
dem
ande
d em
ploy
men
t
Cum
ulat
ive
No. o
f Ho
useh
old
prov
ided
em
ploy
men
t
Cum
ulat
ive
No. o
f Ho
useh
old
wor
king
un
der
NREG
A
Cum
ulat
ive
pers
onda
ys g
ener
ated
(in la
khs)
Cum
ulat
ive
No. o
f Ho
useh
old
com
plet
ed
100
days
No. o
f Ho
useh
old
whi
ch a
re
bene
ficia
ry
of L
and
Refo
rm/
IAY
No. o
f Di
sabl
ed
Bene
ficia
ry
(indi
vidu
al)
SCST
Othe
rsSC
STOt
hers
Wom
en
12
34
56
78
910
1112
1314
15
1Di
map
ur36
1166
451
4016
7130
865
059
1004
7818
6593
611
3567
5340
690
5520
2Ki
phire
423
733
5623
119
2273
613
888
6214
2026
2966
690
371
3Ko
him
a0
5409
216
949
055
4729
50
1337
019
3287
5629
010
211
4Lo
ngle
ng1
2134
593
2131
221
274
3167
0635
2920
1923
230
03
5M
okok
chun
g2
3536
737
135
931
3417
297
1162
347
1166
749
9889
05
14
6M
on9
3980
427
140
074
3986
424
712
0102
278
6043
9022
01
11
7Pe
ren
7026
996
120
2692
226
783
2950
1312
877
5014
2140
400
131
8Ph
ek27
3095
031
9234
153
3415
275
810
1152
511
9178
3600
980
122
97
9Tu
ensa
ng8
4191
265
3027
735
2504
622
010
5515
521
9489
4546
920
38
10W
okha
536
050
1154
3664
736
282
177
1094
522
1686
639
3478
04
5
11Zu
nheb
oto
037
649
158
3396
133
642
010
8086
435
824
6241
012
7
Tota
l37
3741
4349
1613
040
0217
3863
0510
5096
1267
8116
5022
3541
9342
20
242
208
Tabl
e No
. 21.
5 : A
nnua
l Per
form
ance
Rep
ort u
nder
the
Mah
atm
a Ga
ndhi
Nat
iona
l Rur
al E
mpl
oym
ent G
uran
tee
Sche
me
(MGN
REGS
du
ring
2018
-19(
Prov
isio
nal)
Sour
ce: D
irect
orat
e of
Rur
al D
evel
opm
ent
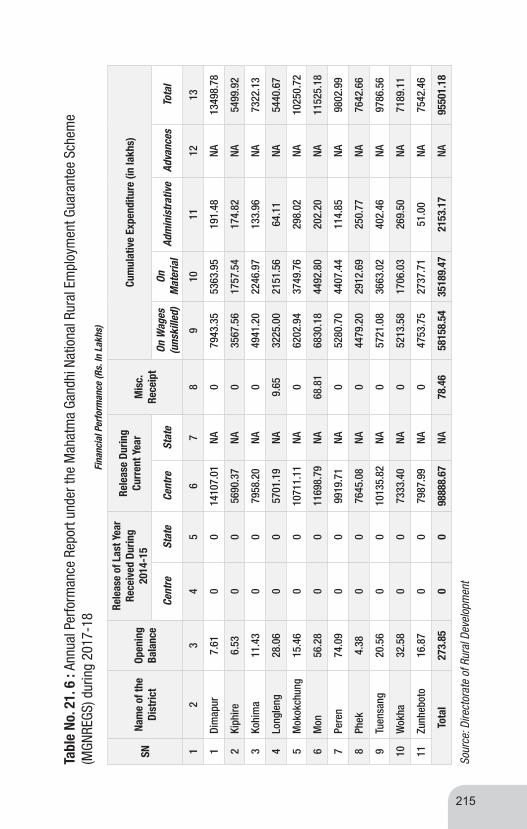
215
SNNa
me
of th
e Di
stric
tOp
enin
g Ba
lanc
e
Rele
ase
of L
ast Y
ear
Rece
ived
Dur
ing
2014
-15
Rele
ase
Durin
g Cu
rren
t Yea
rM
isc.
Re
ceip
t
Cum
ulat
ive
Expe
nditu
re (i
n la
khs)
Cent
reSt
ate
Cent
re
Stat
eOn
Wag
es
(uns
kille
d)On
M
ater
ial
Adm
inis
trat
ive
Adva
nces
Tota
l
12
34
56
78
910
1112
13
1Di
map
ur7.
610
014
107.
01NA
079
43.3
553
63.9
519
1.48
NA13
498.
78
2Ki
phire
6.53
00
5690
.37
NA0
3567
.56
1757
.54
174.
82NA
5499
.92
3Ko
him
a11
.43
00
7958
.20
NA0
4941
.20
2246
.97
133.
96NA
7322
.13
4Lo
ngle
ng28
.06
00
5701
.19
NA9.
6532
25.0
021
51.5
664
.11
NA54
40.6
7
5M
okok
chun
g15
.46
00
1071
1.11
NA0
6202
.94
3749
.76
298.
02NA
1025
0.72
6M
on56
.28
00
1169
8.79
NA68
.81
6830
.18
4492
.80
202.
20NA
1152
5.18
7Pe
ren
74.0
90
099
19.7
1NA
052
80.7
044
07.4
411
4.85
NA98
02.9
9
8Ph
ek4.
380
076
45.0
8NA
044
79.2
029
12.6
925
0.77
NA76
42.6
6
9Tu
ensa
ng20
.56
00
1013
5.82
NA0
5721
.08
3663
.02
402.
46NA
9786
.56
10W
okha
32.5
80
073
33.4
0NA
052
13.5
817
06.0
326
9.50
NA71
89.1
1
11Zu
nheb
oto
16.8
70
079
87.9
9NA
047
53.7
527
37.7
151
.00
NA75
42.4
6
Tota
l27
3.85
00
9888
8.67
NA78
.46
5815
8.54
3518
9.47
2153
.17
NA95
501.
18
Tabl
e No
. 21.
6 :
Annu
al P
erfo
rman
ce R
epor
t und
er th
e M
ahat
ma
Gand
hi N
atio
nal R
ural
Em
ploy
men
t Gua
rant
ee S
chem
e (M
GNRE
GS) d
urin
g 20
17-1
8Fi
nanc
ial P
erfo
rman
ce (R
s. In
Lak
hs)
Sour
ce: D
irect
orat
e of
Rur
al D
evel
opm
ent

216
Tabl
e No
. 21.
7 : A
nnua
l Per
form
ance
Rep
ort U
nder
the
Mah
atm
a Ga
ndhi
Nat
iona
l Rur
al E
mpl
oym
ent G
uara
ntee
Sch
eme
(MGN
REGS
) dur
ing
2018
-19
Fina
ncia
l Per
form
ance
(Rs.
In L
akhs
)
SNNa
me
of th
e Di
stric
tOp
enin
g Ba
lanc
e
Rele
ase
of L
ast Y
ear
Rece
ived
Dur
ing
2014
-15
Rele
ase
Durin
g Cu
rren
t Yea
rM
isc.
Re
ceip
t
Cum
ulat
ive
Expe
nditu
re (i
n la
khs)
Clos
ing
Bala
nce
Cent
reSt
ate
Cent
re
Stat
eOn
Wag
es
(uns
kille
d)On
M
ater
ial
Adm
inis
trativ
eAd
vanc
esTo
tal
12
34
56
78
910
1112
1314
1Di
map
ur29
.73
1932
2.98
2319
.30
5.89
2204
.36
1169
.10
155.
8260
.98
3590
.26
8.86
247
2Ki
phire
23.6
333
.10
1037
.41
584.
0091
.16
44.9
417
57.5
00.
03
3Ko
him
a19
4.57
45.5
984
2.87
858.
7913
0.69
63.7
618
96.1
15.
27
4Lo
ngle
ng23
.17
2.31
695.
1037
8.62
72.3
953
.57
1199
.67
1.71
5M
okok
chun
g5.
3611
.30
1900
.80
1071
.44
149.
6858
.17
3180
.09
5.37
6M
on74
.86
6.06
1540
.01
648.
8616
2.00
70.5
924
21.4
718
.73
7Pe
ren
47.8
124
.17
792.
5554
6.48
114.
5043
.58
1497
.11
9.85
8Ph
ek1.
603.
4186
8.81
563.
8410
0.53
56.5
515
89.7
31.
22
9Tu
ensa
ng4.
2120
.74
1059
.23
663.
9811
3.45
51.5
518
88.2
110
.50
10W
okha
8.17
8.43
987.
7823
2.08
102.
5243
.37
1367
.74
1.41
11Zu
nheb
oto
3.57
8.83
1156
.12
614.
0011
3.75
49.5
719
33.4
45.
71
Stat
e15
984.
2921
7.18
412.
2513
.27
425.
5215
624.
73
Tota
l16
410.
9719
322.
9823
19.3
038
7.00
1308
7.04
7331
.18
1718
.8.7
260
9.90
2274
6.85
1569
3.40
Sour
ce:D
irect
orat
e of
Rur
al D
evel
opm
ent

217
Tabl
e No
. 21.
8 :F
inan
cial
and
Phy
sica
l Ach
ieve
men
t Rep
ort u
nder
Nag
alan
d St
ate
Rura
l Liv
elih
ood
Mis
sion
(NSR
LM) 2
017-
18
(Una
udite
d)
SN
Nam
e of
Di
stric
t DM
MY
&
BMM
U
Open
ing
Bala
nce
Allo
catio
nRe
leas
esBa
nk
Inte
rest
Tota
l Fun
dTo
tal
Expe
nditu
reCl
osin
g Ba
lanc
eTo
tal S
HG a
ssis
ts 2
017-
18
Cent
reSt
ate
Cent
reSt
ate
Wom
enDi
sabl
edTo
tal
12
34
56
78
910
1112
1314
1Di
map
ur18
9323
--
1120
0911
1244
546
6478
112
6995
6112
3722
7432
7287
181
-18
1
2Ki
phire
1208
13-
-11
1080
1312
3422
448
600
1251
1650
1034
0882
2170
768
96-
96
3Ko
him
a13
6683
--
1191
7793
1324
199
6351
613
4421
9113
0088
2543
3366
170
-17
0
4Lo
ngle
ng14
6063
--
1022
1755
1135
751
6205
211
5656
2111
4230
1514
2606
82-
82
5M
okok
chun
g23
5610
--
1306
7927
1451
992
6675
814
8222
8714
5502
4527
2042
197
-19
7
6M
on12
7608
--
1071
8011
1190
890
6395
612
1004
6511
9275
8417
2881
147
-14
7
7Ph
ek12
0630
--
1104
2204
1226
912
6349
612
4532
4212
2824
2717
0815
173
-17
3
8W
okha
2369
77-
-11
7296
3613
0329
374
972
1334
4878
1270
3374
6415
0423
3-
233
9Zu
nheb
oto
9113
6-
-10
4656
7711
6285
356
362
1177
6028
1155
8245
2177
8318
1-
181
Tota
l14
0484
3-
-10
1471
927
1127
4660
5644
9311
4715
923
1101
6687
145
4905
21,
460
-1,
460
Sour
ce: D
irect
orat
e of
Rur
al D
evel
opm
ent
(In R
upee
s)

218
(In R
upee
s)
SN
Nam
e of
Di
stric
t DM
MY
& BM
MU
Open
ing
Bala
nce
Allo
catio
nRe
leas
esBa
nk
Inte
rest
Tota
l Fun
dTo
tal
Expe
nditu
reCl
osin
g Ba
lanc
e
Tota
l SHG
ass
ists
201
7-18
Cent
reSt
ate
Cent
reSt
ate
Wom
enDi
sabl
edTo
tal
12
34
56
78
910
1112
1314
1Di
map
ur55
6835
.20
2103
0976
8988
521
6776
96.2
2099
9228
.90
6784
67.3
212
212
2Ki
phire
2284
760.
7533
2572
2111
7006
3565
8987
.75
3035
8645
.60
5300
342.
1517
917
9
3Ko
him
a17
6083
0.65
3504
6406
7614
836
8833
84.6
525
5990
85.0
511
2842
99.6
255
255
4Lo
ngle
ng35
3604
.63
2246
2396
6352
622
8795
26.6
322
6634
82.9
021
6043
.73
44
5M
okok
chun
g27
3186
.81
2555
8718
9485
225
9267
56.8
122
2504
06.1
036
7635
0.71
205
205
6M
on24
6036
.75
2983
7182
1107
0030
1939
18.7
525
5191
42.5
046
7477
6.25
477
477
7Ph
ek44
2366
.00
3965
2262
1578
340
2104
1138
5575
24.7
016
5288
6.30
436
436
8W
okha
8230
04.3
026
7037
5011
8993
2764
5747
.30
2337
0731
.90
4275
015.
4012
512
5
9Zu
nheb
oto
4117
08.5
025
8866
3085
778
2638
4116
.50
2264
8850
3735
266.
5017
917
9
Tota
l71
5233
3.59
00
2594
3554
10
8726
7126
7460
545.
5923
1967
097.
6535
4934
47.9
42,
072
02,
072
Tabl
e No
. 21.
9 :
Fina
ncia
l and
Phy
sica
l Ach
ieve
men
t Rep
ort u
nder
Nag
alan
d St
ate
Rura
l Liv
elih
ood
Mis
sion
(NSR
LM)
2018
-19(
Unau
dite
d)
Sour
ce: D
irect
orat
e of
Rur
al D
evel
opm
ent

219
(In R
upee
s)
SNNa
me
of
Dis
tric
t To
tal N
o.
of B
lock
sTo
tal N
o.
of V
DBs
Prov
isio
nal
Fun
d A
lloca
ted
7% S
ervi
ce
Char
geVD
B Se
cret
arie
s Ho
nora
rium
Tota
l fun
d al
loca
tion
(5+
6+7)
12
34
56
78
1Ko
him
a7
9429
1462
0021
9380
011
2800
032
4680
00
2M
okok
chun
g9
8529
9673
9022
5561
010
2000
033
2430
00
3M
on8
114
3358
0440
2527
560
1368
000
3747
6000
4Tu
ensa
ng9
117
2822
4570
2124
430
1404
000
3175
3000
5Zu
nheb
oto
816
924
8793
6018
7264
020
2800
028
7800
00
6W
okha
713
322
8501
0017
1990
015
9600
026
1660
00
7Ph
ek8
9525
7126
4019
3536
011
4000
028
7880
00
8Di
map
ur6
213
3628
1160
2730
840
2556
000
4156
8000
9Ki
phire
593
1614
1080
1214
920
1116
000
1847
2000
10Lo
ngle
ng3
4017
7462
6013
3574
048
0000
1956
2000
11Pe
ren
485
1925
4720
1449
280
1020
000
2172
4000
Tota
l74
1238
2837
8392
021
3600
8014
8560
0032
0000
000
Tabl
e No
. 21.
10
: Dis
trict
-wis
e Fu
nd A
lloca
tion
unde
r Gra
nt-in
-Aid
(GIA
) to
VDBs
dur
ing
2017
-18
Sour
ce:D
irect
orat
e of
Rur
al D
evel
opm
ent
(In R
upee
s)

220
SNNa
me
of
Dis
tric
t To
tal N
o.
of B
lock
sTo
tal N
o. o
f VD
Bs
Prov
isio
nal
Fun
d A
lloca
ted
7% S
ervi
ce C
harg
eVD
B Se
cret
arie
s Ho
nora
rium
Tota
l fun
d al
loca
tion
(5+6
+7)
12
34
56
78
1Ko
him
a7
9429
1462
0021
9380
011
2800
032
4680
00
2M
okok
chun
g9
8529
9673
9022
5561
010
2000
033
2430
00
3M
on8
114
3358
0440
2527
560
1368
000
3747
6000
4Tu
ensa
ng9
117
2822
4570
2124
430
1404
000
3175
3000
5Zu
nheb
oto
816
924
8793
6018
7264
020
2800
028
7800
00
6W
okha
713
322
8501
0017
1990
015
9600
026
1660
00
7Ph
ek8
9525
7126
4019
3536
011
4000
028
7880
00
8Di
map
ur6
213
3628
1160
2730
840
2556
000
4156
8000
9Ki
phire
593
1614
1080
1214
920
1116
000
1847
2000
10Lo
ngle
ng3
4017
7462
6013
3574
048
0000
1956
2000
11Pe
ren
485
1925
4720
1449
280
1020
000
2172
4000
Tota
l74
1238
2837
8392
021
3600
8014
8560
0032
0000
000
Tabl
e No
. 21.
11
: Dis
trict
Wis
e Fu
nd A
lloca
tion
Unde
r Gra
nt-in
-Aid
(GIA
) to
VDBs
Dur
ing
2018
-19
Sour
ce: D
irect
orat
e of
Rur
al D
evel
opm
ent

EMPLOYMENT
22

222
Clas
s (S
tatu
s)Se
rvic
e Ca
tego
ryA
BC
DN/
AGr
and
Tota
lAd
hoc
4134
2163
1228
5135
17Ad
hoc
(Fix
ed)
5345
13
507
Casu
al1
156
057
71
1140
Cont
inge
ncy
413
1445
1718
75Co
ntra
ct10
235
623
4434
217
833
22Co
-ter
min
us16
547
876
Fixe
d65
1617
9721
3694
349
57Ho
nara
rium
349
8154
955
8447
670
39N/
A17
513
315
170
Perm
anen
t22
0191
328
408
4564
7136
157
Prov
isio
nal
412
1135
11
1567
Subs
titut
e3
176
26Te
mpo
rary
2138
1944
3567
912
307
249
5231
7Te
nure
11
13
Wag
es1
89
Wor
k Ch
arge
(Fix
ed)
5969
7970
38W
ork
Char
ge (S
cale
)1
414
8740
852
5579
Gran
d To
tal
4988
3363
7532
039
639
1989
1252
99
Tabl
e No
. 22.
1 :D
istri
butio
n of
Sta
te G
over
nmen
t Em
ploy
ees
by N
atur
e of
Em
ploy
men
t (as
on
31st
Mar
ch 2
018)
Sour
ce:D
irect
orat
e of
Eco
nom
ics
& St
atis
tics

223
Clas
s (S
tatu
s)Fe
mal
ePe
rcen
tage
(%)
Mal
ePe
rcen
tage
(%)
Gran
d To
tal
Perc
enta
ge (%
)
Clas
s-I
1456
29.1
935
3270
.81
4988
100
Clas
s-II
926
27.5
324
3772
.47
3363
100
Clas
s-III
2108
427
.99
5423
672
.01
7532
010
0
Clas
s-IV
1367
534
.525
964
65.5
3963
910
0
N/A
879
44.1
911
1055
.81
1989
100
Gran
d To
tal
3802
030
.34
8727
969
.66
1252
9910
0
Tabl
e No
. 22.
2: D
istri
butio
n of
Sta
te G
over
nmen
t Em
ploy
ees
by G
ende
r (as
on
31st
Mar
ch 2
018)
Sour
ce:D
irect
orat
e of
Eco
nom
ics
& St
atis
tics
SNDi
stric
tCl
ass-
ICl
ass-
IICl
ass-
IIICl
ass-
IV
N/A
Gran
d To
tal
1M
on27
118
851
4028
7983
8561
2Di
map
ur63
451
614
843
5731
521
2224
53
Kiph
ire13
372
2093
1547
1838
634
Kohi
ma
2093
1222
1705
090
9241
629
873
5Lo
ngle
ng13
063
1766
846
828
136
Mok
okch
ung
428
358
9392
4949
526
1565
37
Pere
n18
011
232
4214
8928
5051
8Ph
ek28
421
947
5328
1791
8164
9Tu
ensa
ng30
722
059
0037
8992
1030
810
Wok
ha22
518
446
9225
4916
478
1411
Zunh
ebot
o27
720
563
7938
7939
1077
9Gr
and
Tota
l49
6233
5975
250
3956
719
8612
5124
Tabl
e No
. 22.
3: D
istri
ct-w
ise
Dist
ribut
ion
of S
tate
Gov
ernm
ent E
mpl
oyee
s (a
s on
31s
t Mar
ch 2
018)
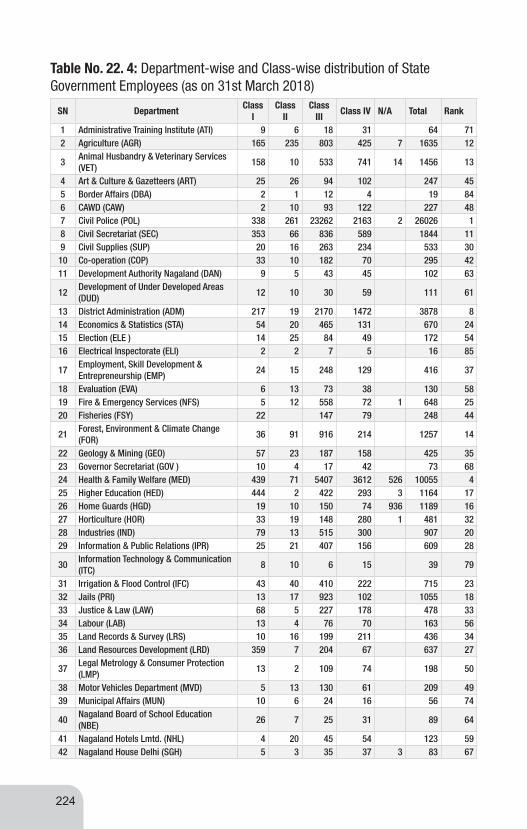
224
Table No. 22. 4: Department-wise and Class-wise distribution of State Government Employees (as on 31st March 2018)
SN DepartmentClass
IClass
IIClass
IIIClass IV N/A Total Rank
1 Administrative Training Institute (ATI) 9 6 18 31 64 712 Agriculture (AGR) 165 235 803 425 7 1635 12
3Animal Husbandry & Veterinary Services (VET)
158 10 533 741 14 1456 13
4 Art & Culture & Gazetteers (ART) 25 26 94 102 247 455 Border Affairs (DBA) 2 1 12 4 19 846 CAWD (CAW) 2 10 93 122 227 487 Civil Police (POL) 338 261 23262 2163 2 26026 18 Civil Secretariat (SEC) 353 66 836 589 1844 119 Civil Supplies (SUP) 20 16 263 234 533 30
10 Co-operation (COP) 33 10 182 70 295 4211 Development Authority Nagaland (DAN) 9 5 43 45 102 63
12Development of Under Developed Areas (DUD)
12 10 30 59 111 61
13 District Administration (ADM) 217 19 2170 1472 3878 814 Economics & Statistics (STA) 54 20 465 131 670 2415 Election (ELE ) 14 25 84 49 172 5416 Electrical Inspectorate (ELI) 2 2 7 5 16 85
17Employment, Skill Development & Entrepreneurship (EMP)
24 15 248 129 416 37
18 Evaluation (EVA) 6 13 73 38 130 5819 Fire & Emergency Services (NFS) 5 12 558 72 1 648 2520 Fisheries (FSY) 22 147 79 248 44
21Forest, Environment & Climate Change (FOR)
36 91 916 214 1257 14
22 Geology & Mining (GEO) 57 23 187 158 425 3523 Governor Secretariat (GOV ) 10 4 17 42 73 6824 Health & Family Welfare (MED) 439 71 5407 3612 526 10055 425 Higher Education (HED) 444 2 422 293 3 1164 1726 Home Guards (HGD) 19 10 150 74 936 1189 1627 Horticulture (HOR) 33 19 148 280 1 481 3228 Industries (IND) 79 13 515 300 907 2029 Information & Public Relations (IPR) 25 21 407 156 609 28
30Information Technology & Communication (ITC)
8 10 6 15 39 79
31 Irrigation & Flood Control (IFC) 43 40 410 222 715 2332 Jails (PRI) 13 17 923 102 1055 1833 Justice & Law (LAW) 68 5 227 178 478 3334 Labour (LAB) 13 4 76 70 163 5635 Land Records & Survey (LRS) 10 16 199 211 436 3436 Land Resources Development (LRD) 359 7 204 67 637 27
37Legal Metrology & Consumer Protection (LMP)
13 2 109 74 198 50
38 Motor Vehicles Department (MVD) 5 13 130 61 209 4939 Municipal Affairs (MUN) 10 6 24 16 56 74
40Nagaland Board of School Education (NBE)
26 7 25 31 89 64
41 Nagaland Hotels Lmtd. (NHL) 4 20 45 54 123 5942 Nagaland House Delhi (SGH) 5 3 35 37 3 83 67

225
Source:Directorate of Economics & Statistics
43 Nagaland House Guwahati (SGH) 2 19 24 45 7744 Nagaland House Kolkata (SGH) 2 2 20 45 69 6945 Nagaland House Shillong (SGH) 1 9 10 20 83
46Nagaland Industrial Development Corporation Ltd. (NID)
19 29 16 64 71
47Nagaland Industrial Raw Materials & Supplies Corporation (RMS)
2 2 14 13 31 80
48Nagaland Khadi & Village Industries Board (KVI)
20 9 123 30 182 53
49Nagaland Public Service Commission (PSC)
15 5 28 18 66 70
50 Nagaland State Transport (NST) 25 26 757 198 1006 19
51Nagaland Tool Room and Training Centre (NTT)
4 15 2 21 82
52 New & Renewable Energy (NRE) 7 17 24 38 86 6653 NSMDC (MIN) 15 1 56 125 197 5154 Planning & Co-ordination (PLG) 38 55 181 98 372 4055 Power (POW) 132 208 1413 2992 1 4746 656 Printing & Stationery (PST) 13 11 403 65 492 3157 Public Health Engineering(PHE) 79 194 970 2414 1 3658 958 PWD (Architect) 8 8 39 7 62 7359 PWD (Engineer-In-Chief) 9 11 51 35 106 6260 PWD (Housing) 41 80 1896 2642 4659 761 PWD (Mechanical Engineering) 22 40 559 578 1199 1562 PWD (National Highway) 38 52 251 298 639 2663 PWD (Roads & Bridges) 132 245 3629 6636 12 10654 364 Rajya Sainik Board (RSB) 2 31 19 52 7565 Rural Development (RDV) 169 123 1414 362 2068 1066 SCERT (SCE ) 157 22 124 105 408 3867 School Education (EDN) 392 779 19639 2578 23388 268 Science & Technology (SCT) 6 2 15 20 43 7869 Sericulture (SER) 22 9 200 171 402 3970 Social Welfare (SWL) 85 24 605 5806 480 7000 571 Soil & Water Conservation (SOL) 50 36 432 260 778 2172 State Excise (EXC) 14 30 318 61 423 3673 State Guest House, Kohima (SGH) 1 2 13 16 8574 State Information Commission (SIC) 4 1 7 11 23 8175 State Institute of Rural Development (SIR) 12 2 36 38 88 6576 State Legislature (NLA) 47 16 143 120 326 4177 State Lotteries (LOT) 5 2 29 12 48 7678 Taxes (TAX) 9 22 137 82 250 4379 Technical Education (TED) 57 4 78 102 241 4680 Tourism (TOU) 16 24 65 79 184 5281 Treasuries & Accounts (TRY) 43 75 497 136 2 753 2282 Urban Development (UDV) 21 11 116 80 228 4783 Vigilance Commission (VIG) 15 10 68 29 122 6084 Village Guards (VGD) 16 97 59 172 5485 Women Resource Development (WOM) 6 11 95 28 140 5786 Youth Resources & Sports (YRS) 27 27 183 357 594 29
Grand Total 4988 3363 75320 39639 1989 125299
Contd.

226
SNEd
ucat
ion
Leve
l20
19
Mal
eFe
mal
eTo
tal
12
34
5
1Po
st G
radu
ate
2652
3493
6145
2Gr
adua
te12
112
9945
2205
7
3P.
U77
1246
0512
317
4M
atric
ulat
e10
050
2847
1289
7
5Be
low
Mat
ric18
470
2640
2111
0
6De
gree
(Tec
h)11
2653
216
58
7Di
plom
a45
920
566
4
TOTA
L52
581
2426
776
848
(Sou
rce:
Dire
ctor
ate
of E
mpl
oym
ent,
Skill
Dev
elop
men
t & E
ntre
pren
eurs
hip
Tabl
e No
. 22.
5 :
Num
ber o
f App
lican
ts o
n th
e Li
ve R
egis
ter o
f Em
ploy
men
t Ex
chan
ges
acco
rdin
g to
Ed
ucat
iona
l Qua
lifica
tion
as o
n 31
.3.2
019

227
SNEd
ucat
ion
Leve
l20
20M
ale
Fem
ale
Tota
l1
23
45
1Po
st G
radu
ate
2979
4064
7043
2Gr
adua
te14
352
1201
026
362
3P.
U89
7154
3114
402
4M
atric
ulat
e12
097
3634
1573
15
Belo
w M
atric
2220
842
8926
497
6De
gree
(Tec
h)13
1060
419
14
7Di
plom
a48
921
170
0TO
TAL
6240
630
243
9264
9
Tabl
e No
. 22.
6 :
Num
ber o
f App
lican
ts o
n th
e Li
ve R
egis
ter o
f Em
ploy
men
t Ex
chan
ges
acc
ordi
ng to
Ed
ucat
iona
l Qua
lifica
tion
as o
n 31
.3.2
020
(Sou
rce:
Dire
ctor
ate
of E
mpl
oym
ent,
Skill
Dev
elop
men
t & E
ntre
pren
eurs
hip

228
SNEd
ucat
ion
Leve
l20
19-2
020
Mal
eFe
mal
eTo
tal
12
34
51
Belo
w M
atric
2M
atric
ulat
e3
Pre-
Univ
ersi
ty2
24
Grad
uate
71
85
Post
Gra
duat
e6
Degr
ee (T
ech)
7Di
plom
a Ho
lder
Tota
l9
110
Tabl
e No
. 22.
7: N
umbe
r of P
erso
ns P
lace
d th
roug
h E
mpl
oym
ent
Exch
ange
s ac
cord
ing
to
Educ
atio
nal Q
ualifi
catio
n du
ring
2019
-202
0
(Sou
rce:
Dire
ctor
ate
of E
mpl
oym
ent,
Skill
Dev
elop
men
t & E
ntre
pren
eurs
hip

229
Source: Directorate of Employment, Skill Development & Entrepreneurship
Table No. 22. 8: Number of Trainees under-going Training in Industrial Training Institutes (ITIs)
SN Name of Trade 2017 2018 2019 2020
1 2 3 4 5 6
1 Draughtsman 71 71 73 72
2 Electrician 91 91 95 89
3 Electronic Mechanic 9 9 18 11
4 Fitter 12 12 6 6
5 Mechanist - - 2 15
6 Motor Mechanic 50 50 51 57
7 Radio & T.V _ - -
8 Surveyor 26 26 20 24
9 Turner _ - -
10 Wireman _ - -
11 IT & ESM 9 9 9 9
12 Apparel _ - -
13 Automible _ - -
14 Carpentry 121 121 108 126
15 Cutting & Sewing 98 98 88 93
16 C.O.P.A 121 121 119 98
17 Dress Making 4 4 3 4
18 Diesel Mechanic 13 13 14 19
19 Hair & Skin Care 21 21 25 17
20 Knitting 73 73 67 44
21 Plumber 37 37 35 37
22 Secretarial Practise 17 17 23 19
23 Stenography 16 16 20 23
24 Welder 9 9 21 19
26 Swing Technology 798 11 15 8
27 Mason - 16 17 16
Total - 825 829 806

230
Source: Directorate of Employment, Skill Development & Entrepreneurship
Table No. 22.9: Number of Trainees Passed out under the Craftsmen Training Scheme 2019
SN Name of Trade 2019
1 2 3
1 Draughtsman 22
2 Electrician 40
3 Electronic Mechanic 7
4 Fitter 7
5 Mechanist -
6 Motor Mechanic 18
7 Radio & T.V -
8 Surveyor 16
9 Turner -
10 Wireman -
11 IT & ESM 1
12 Apparel -
13 Automible -
14 Carpentry 74
15 Cutting & Sewing 71
`16 C.O.P.A 78
17 Dress Making 2
18 Diesel Mechanic 6
19 Hair & Skin Care 11
20 Knitting 57
21 Plumber 18
22 Secretarial Practise 11
23 Stenography 16
24 Welder 3
Total 458
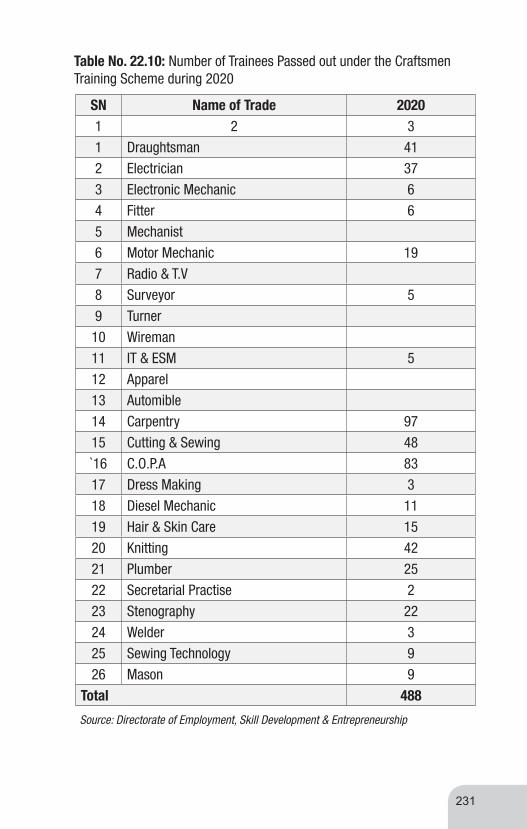
231
SN Name of Trade 20201 2 31 Draughtsman 412 Electrician 373 Electronic Mechanic 64 Fitter 65 Mechanist6 Motor Mechanic 197 Radio & T.V8 Surveyor 59 Turner10 Wireman11 IT & ESM 512 Apparel13 Automible14 Carpentry 9715 Cutting & Sewing 48`16 C.O.P.A 8317 Dress Making 318 Diesel Mechanic 1119 Hair & Skin Care 1520 Knitting 4221 Plumber 2522 Secretarial Practise 223 Stenography 2224 Welder 325 Sewing Technology 926 Mason 9
Total 488
Table No. 22.10: Number of Trainees Passed out under the Craftsmen Training Scheme during 2020
Source: Directorate of Employment, Skill Development & Entrepreneurship

SN Educational Level2018
Male Female Total
1 2 3 4 5
1 Graduate & above 27 5 32
2 Pre-University 24 4 28
3 Matriculate 48 24 72
4 Below Matric 672 313 985
Total 771 346 1117
Table No. 22.11: Number of Physically Handicapped Applicants Remaining on the Live Register of Employment Exchange as on 31St December 2018
SN Educational Level2019
Male Female Total1 2 3 4 51 Graduate & above 27 5 322 Pre-University 25 4 293 Matriculate 49 24 734 Below Matric 672 313 985
Total 773 346 1119
Table No. 22.12: Number of Physically Handicapped Applicants Remaining on the Live Register of Employment Exchange as on 31St December, 2019
Source: Directorate of Employment, Skill Development & Entrepreneurship
232
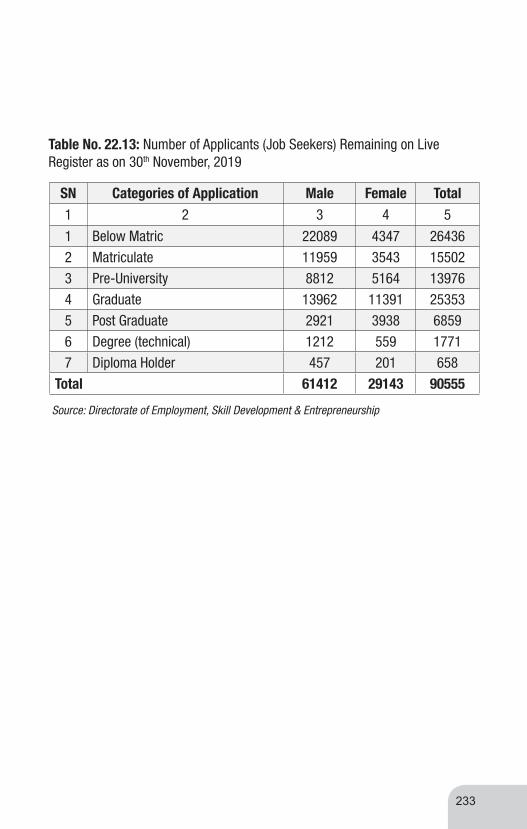
233
SN Categories of Application Male Female Total1 2 3 4 5
1 Below Matric 22089 4347 264362 Matriculate 11959 3543 155023 Pre-University 8812 5164 139764 Graduate 13962 11391 253535 Post Graduate 2921 3938 68596 Degree (technical) 1212 559 17717 Diploma Holder 457 201 658
Total 61412 29143 90555
Table No. 22.13: Number of Applicants (Job Seekers) Remaining on Live Register as on 30th November, 2019
Source: Directorate of Employment, Skill Development & Entrepreneurship


PUBLIC FINANCE
23

236
SNIte
ms
Actu
al 2
018-
19Bu
dget
201
9-20
Revi
sed
201
9-20
Budg
et 2
020-
21
12
34
56
I. Co
nsol
idat
ed F
und
Reve
nue
Rece
ipts
1143
741.
2113
1736
0.25
1204
142.
8914
6478
7.7
Expe
nditu
re m
et fr
om R
even
ue10
9199
8.35
1266
623.
2112
6153
0.08
1362
353.
96
Surp
lus/
Defic
it on
Rev
enue
a/c
5174
2.86
5073
7.04
-573
87.1
910
2433
.74
Capi
tal r
ecei
pts
2908
30.1
144
3088
.22
7131
49.3
061
7813
.66
Expe
nditu
re m
et fr
om C
apita
l In
clud
ing
loan
s &
Adva
nces
(Net
)
4198
711.
0153
4650
.34
8630
90.6
174
2632
.87
Surp
lus/
Defic
it (-
) on
Capi
tal A
ccou
nt-1
2888
.90
-915
62.1
2-1
4994
1.31
-124
819.
21
Tota
l- Co
nsol
idat
ed fu
nd (N
et)
-771
38.0
4-4
0825
.08
-207
328.
50-2
2385
.47
II.
Cont
inge
ncy
Fund
(Net
)-
-
III.
Publ
ic A
ccou
nt (N
et)
5958
4.76
4579
5.00
-203
16.0
099
89.0
0
Tota
l Net
tran
sact
ion
-175
53.2
849
69.9
2-2
2764
4.50
-123
96.4
7
Open
ing
Bala
nce
3390
1.30
-166
167.
6341
59.6
9-2
2348
4.81
Clos
ing
Bala
nce
1634
8.02
-161
197.
71-2
2348
4.81
-235
881.
28
Tabl
e No
. 23
.1: R
ecei
pt a
nd E
xpen
ditu
re o
f the
Gov
ernm
ent (
Rs. I
n la
khs)
Sour
ce: S
tate
Bud
get,
Fina
nce
Depa
rtmen
t, Na
gala
nd

237
SNIte
ms
Actu
al 2
018-
19Bu
dget
201
9-20
Revi
sed
201
9-20
Budg
et 2
020-
21
12
34
56
(A) H
ead
of R
even
ue &
Rec
eipt
1Ta
xes
on R
even
ue &
Rec
eipt
4638
84.2
749
7264
.00
4204
27.8
155
0449
.60
2La
nd R
even
ue11
3.30
80.8
011
0.00
120.
00
3St
ate
Exci
se d
utie
s46
4.92
510.
0050
0.00
550.
00
4Ta
xes
on V
ehic
le12
622.
2412
104.
0012
500.
0013
172.
00
5Go
ods
& Se
rvic
es T
ax46
963.
5934
036.
5949
136.
0054
124.
60
6Ot
her T
axes
& D
utie
s0.
0080
.00
25.0
025
.00
7Ta
xes
on G
oods
& P
asse
nger
s20
16.5
718
90.9
022
20.0
025
00.0
0
8St
amps
& R
egis
tratio
n25
2.75
264.
0028
0.00
310.
00
Tota
l (A)
52
6317
.64
5462
30 .2
948
5198
.81
6212
51.2
0
Tabl
e No
. 23
.2: F
inan
cial
Sta
tem
ent o
f Rec
eipt
(Con
solid
ated
Fun
d) (R
s. in
lakh
s)
Sour
ce: S
tate
Bud
get,
Fina
nce
Depa
rtmen
t, Na
gala
nd

238
SNIte
ms
Actu
al 2
018-
19Bu
dget
201
9-20
Revi
sed
2019
-20
Budg
et 2
020-
21
12
34
56
B. D
ebt.
Serv
ice
Rece
ipt
2903
24.0
244
0715
.00
7112
44.3
861
4885
.88
C. G
ener
al S
ervi
ce
1Pu
blic
Ser
vice
49.2
746
.75
50.0
053
.75
2Ja
ils2.
031.
501.
501.
50
3Po
lice
185.
7130
0.00
3620
.00
250.
00
4St
atio
nary
& P
rintin
g1.
771.
901.
901.
95
5Pu
blic
Wor
ks38
.78
54.5
050
.00
55.0
0
6Ot
her A
dmin
istra
tive
Serv
ice
652.
2367
.50
685.
0070
0.00
7Co
ntrib
utio
n &
Reco
verie
s To
war
ds
Pens
ion
and
Othe
r Re
tirem
ent B
enefi
ts48
.51
60.0
060
.00
65.0
0
8M
isc.
Gen
eral
Ser
vice
2414
.55
2350
.00
2000
.00
2100
.00
Tota
l C
3392
.85
3489
.65
6468
.40
3227
.20
Tabl
e No
. 23
.3: F
inan
cial
Sta
tem
ent o
f Rec
eipt
(Con
solid
ated
Fun
d) (R
s. in
lakh
s)
Sour
ce: S
tate
Bud
get,
Fina
nce
Depa
rtmen
t, Na
gala
nd

239
S N
Item
sAc
tual
201
8-19
Budg
et 2
019-
20Re
vise
d 20
19-2
0Bu
dget
202
0-21
12
34
56
D. S
ocia
l & C
omm
unity
Ser
vice
1Ed
ucat
ion,
Art
& Cu
lture
/Spo
rts43
3.25
8000
.00
9000
.00
500.
00
2M
edic
al &
Pub
lic H
ealth
76.4
774
.55
75.0
075
.5
3Sa
nita
tion
& W
ater
Sup
ply
288.
1735
5.00
350.
0036
0.00
4Fa
mily
& W
elfa
re0.
070.
100.
100.
10
5Ho
usin
g67
6.79
670.
0067
0.00
680.
00
6Ur
ban
Deve
lopm
ent
7.75
5.00
7.80
7.85
7In
form
atio
n &
Publ
icity
11.3
41.
001.
0010
.00
8La
bour
& E
mpl
oym
ent
28.1
320
.00
21.0
022
.00
9So
cial
Sec
urity
& W
elfa
re17
7.10
2.50
2.50
2.50
Tota
l16
99.0
791
28.1
510
127.
4097
7.85
Tabl
e No
. 23
.4: F
inan
cial
Sta
tem
ent o
f Rec
eipt
(Con
solid
ated
Fun
d) (R
s. in
lakh
s)
Sour
ce: S
tate
Bud
get,
Fina
nce
Depa
rtmen
t, Na
gala
nd

240
SNIte
ms
Actu
al 2
018-
19Bu
dget
201
9-20
Revi
sed
2019
-20
Budg
et 2
020-
21
12
34
56
E. E
cono
mic
s Se
rvic
es
1Co
-ope
ratio
n 77
7.43
10.0
020
0.00
225
2Ot
her G
ener
al E
co-S
ervi
ce52
.46
55.0
055
.00
58
3 A
gric
ultu
re (C
rop
Husb
anda
ry)
0.00
0.01
0.10
0.01
4M
inor
Irrig
atio
n6.
013.
002.
002
5An
imal
Hus
band
ary
83.3
475
.00
75.0
080
.00
6Fi
sher
ies
3.51
0.25
5.00
5.00
7Fo
rest
1261
.52
1100
.00
1150
.00
1250
.00
8Co
mm
unity
Dev
elop
men
t-
-
9Vi
llage
& S
mal
l Ind
ustri
es17
.49
17.0
010
.00
15.0
0
10M
ines
& M
iner
als
123.
2882
.50
80.0
082
.25
11Po
wer
pro
ject
1479
707.
0016
000.
0016
000.
0017
500.
00
12Ot
her A
gric
ultu
re P
rogr
amm
e0.
110.
1516
0.15
0.15
13Ro
ad T
rans
port
Serv
ice
874.
3185
0.00
880.
0089
0.00
14To
uris
m63
.89
60.0
050
.00
55.0
0
15No
rth E
aste
rn A
rea
0.00
1.00
0.01
0.01
Tota
l18
060.
4218
253.
9118
507.
2620
162.
41
Tabl
e No
. 23
.5: F
inan
cial
Sta
tem
ent o
f Rec
eipt
(Con
solid
ated
Fun
d) (R
s. in
lakh
s)
Sour
ce: S
tate
Bud
get,
Fina
nce
Depa
rtmen
t, Na
gala
nd
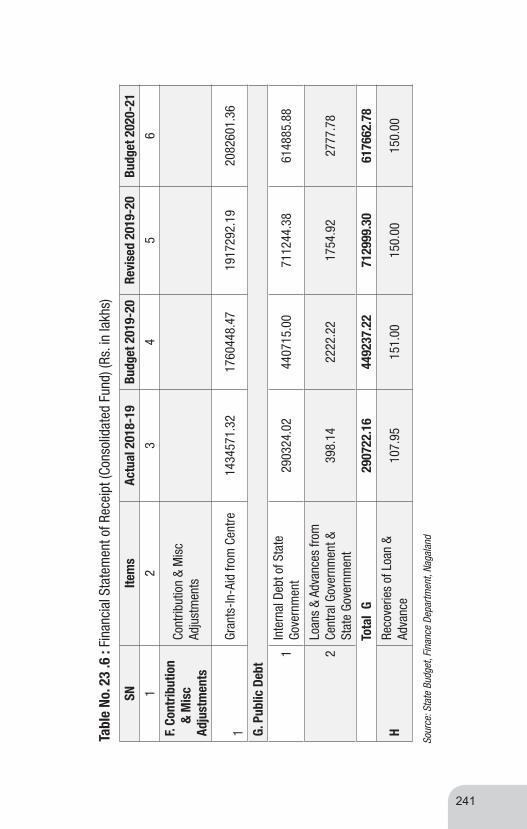
241
SNIte
ms
Actu
al 2
018-
19Bu
dget
201
9-20
Revi
sed
2019
-20
Budg
et 2
020-
21
12
34
56
F. Co
ntrib
utio
n
&
Mis
c
Adju
stm
ents
Cont
ribut
ion
& M
isc
Adju
stm
ents
1
Gran
ts-In
-Aid
from
Cen
tre14
3457
1.32
1760
448.
4719
1729
2.19
2082
601.
36
G. P
ublic
Deb
t
1
Inte
rnal
Deb
t of S
tate
Go
vern
men
t29
0324
.02
4407
15.0
071
1244
.38
6148
85.8
8
2Lo
ans
& Ad
vanc
es fr
om
Cent
ral G
over
nmen
t &
Stat
e Go
vern
men
t39
8.14
2222
.22
1754
.92
2777
.78
Tota
l G
2907
22.1
644
9237
.22
7129
99.3
061
7662
.78
H Re
cove
ries
of L
oan
& Ad
vanc
e 10
7.95
151.
0015
0.00
150.
00
Tabl
e No
. 23
.6 :
Fina
ncia
l Sta
tem
ent o
f Rec
eipt
(Con
solid
ated
Fun
d) (R
s. in
lakh
s)
Sour
ce: S
tate
Bud
get,
Fina
nce
Depa
rtmen
t, Na
gala
nd

TAXES
24

244
VAT-
VAL
UE A
DDED
TAX
CST-
CEN
TRAL
SAL
ES T
AX
PET-
PET
ROLE
UM T
AXPT
- P
ROFE
SSIO
NAL
TAX
Sour
ce :
Com
mis
sion
er o
f Sta
te Ta
xes
AT -
AM
USEM
ENT
TAX
Num
ber o
f Reg
iste
red
Deal
ers
SNDi
stric
tVA
TCS
TPE
TPT
ATTO
TAL
12
34
56
78
1Ko
him
a 12
7611
5618
1294
037
44
2Di
map
ur47
1840
0399
4828
1113
659
3Pe
ren
3325
033
091
4Ph
ek58
183
610
140
5M
okok
chun
g28
921
311
300
081
3
6W
okha
8456
892
024
0
7Zu
nheb
oto
8948
796
024
0
8Tu
ensa
ng91
496
970
243
9Ki
phire
516
152
011
0
10Lo
ngle
ng29
61
300
66
11M
on10
986
911
80
322
Naga
land
6827
5666
163
7001
1119
668
Tabl
e No
. 24.
1: N
umbe
r of R
egis
tere
d De
aler
s as
on
31st M
arch
201
9

245
Num
ber o
f Reg
iste
red
Deal
ers
SNDi
stric
tVA
TCS
TPE
TPT
ATTO
TAL
12
34
56
78
1Ko
him
a 12
7611
5619
1295
037
462
Dim
apur
4329
3628
101
4441
1112
510
3Pe
ren
3325
033
091
4Ph
ek58
183
00
795
Mok
okch
ung
289
213
1230
11
815
6W
okha
8456
892
024
07
Zunh
ebot
o89
487
960
240
8Tu
ensa
ng90
486
960
240
9Ki
phire
516
152
011
010
Long
leng
296
130
066
11M
on11
086
1012
00
326
Naga
land
6438
5290
168
6556
1118
463
Sour
ce :
Com
mis
sion
er o
f Sta
te T
axes
N.b
VAT-
Val
ue A
dded
Tax
, CS
T- C
entra
l Sal
es T
ax, P
ET-
Petro
leum
Tax
, PT-
Pro
fess
iona
l Tax
, AT-
Am
usem
ent T
ax
Tabl
e No
. 24.
2 : N
umbe
r of R
egis
tere
d De
aler
s as
on
29th F
eb 2
020

246
SNDi
stric
t A
cctt
No 0
040
Acct
t No
0028
Acct
t No
0045
Acct
t No
0042
Tota
lVA
TCS
TPE
TPT
ATEn
tey
Tax
12
34
56
78
11
1Ko
him
a15
73.6
40.
0015
5.20
819.
920.
000.
0025
48.7
6
2Di
map
ur14
08.6
256
9.06
1134
4.13
727.
300.
006.
0014
055.
11
3Pe
ren
5.74
0.00
0.00
77.5
00.
000.
0083
.24
4Ph
ek12
5.39
0.00
0.00
164.
430.
000.
0028
9.82
5M
okok
chun
g43
4.59
20.0
451
6.11
515.
190.
000.
0014
85.9
3
6W
okha
81.4
70.
0010
.50
145.
880.
000.
0023
7.85
7Zu
nheb
oto
180.
840.
000.
0020
4.75
0.00
0.00
385.
59
8Tu
ensa
ng33
.20
0.00
1.00
208.
820.
000.
0024
3.02
9Ki
pher
e8.
800.
002.
5073
.89
0.00
0.00
85.1
9
10Lo
ngle
ng28
6.13
0.00
0.00
55.0
80.
000.
0034
1.21
11M
on41
.56
1.37
5717
5.21
0.00
0.00
275.
14
12BT
from
A.G
Tota
l41
79.9
859
0.47
1208
6.44
3167
.97
0.00
6.00
2003
0.86
SGST
9644
.16
PAS
4177
.69
IFS
3314
1.02
BT28
63.5
6
Tabl
e No
. 24.
3: C
olle
ctio
n of
Rev
enue
und
er D
iffer
ent A
cts
durin
g 20
18-2
019
(Rs.
in L
akh)
Sour
ce :
Com
mis
sion
er o
f Sta
te T
axes

247
SNDi
stric
t A
cctt
No 0
040
Acct
t No
0028
Acct
t No
0045
Acct
t No
0042
Tota
lVA
TCS
TPE
TPT
ATEn
tey
Tax
12
34
56
78
91
Kohi
ma
952.
50.
0015
5.92
685.
360.
000.
0017
93.7
82
Dim
apur
1391
.79
382.
5110
208.
7261
8.63
4.51
1.66
1260
7.82
3Pe
ren
0.00
0.00
0.00
64.7
50.
000.
0064
.75
4Ph
ek0.
430.
000.
0014
0.35
0.00
0.00
140.
785
Mok
okch
ung
69.0
61.
2539
7.35
257.
470.
000.
0072
5.13
6W
okha
69.1
20.
0057
.00
115.
330.
000.
0024
1.45
7Zu
nheb
oto
26.2
90.
000.
0016
9.90
0.00
0.00
196.
198
Tuen
sang
1.32
0.00
1.00
178.
720.
000.
0018
1.04
9Ki
pher
e3.
900.
000.
0066
.06
0.00
0.00
69.9
610
Long
leng
0.00
0.00
0.00
44.7
50.
000.
0044
.75
11M
on32
.19
0.00
0.00
145.
440.
000.
0017
7.63
12BT
from
A.G
00
00
00
0To
tal
2546
.60
383.
7610
819.
1924
86.7
64.
511.
6616
243.
28SG
ST50
657.
98PA
SIF
SBT
Gran
t Tot
al66
901.
26
Tabl
e No
. 24.
4: C
olle
ctio
n of
Rev
enue
und
er D
iffer
ent A
cts
durin
g 20
19-2
0 (R
s. in
Lak
h)
Sour
ce :
Com
mis
sion
er o
f Sta
te T
axes


EXCISE
25
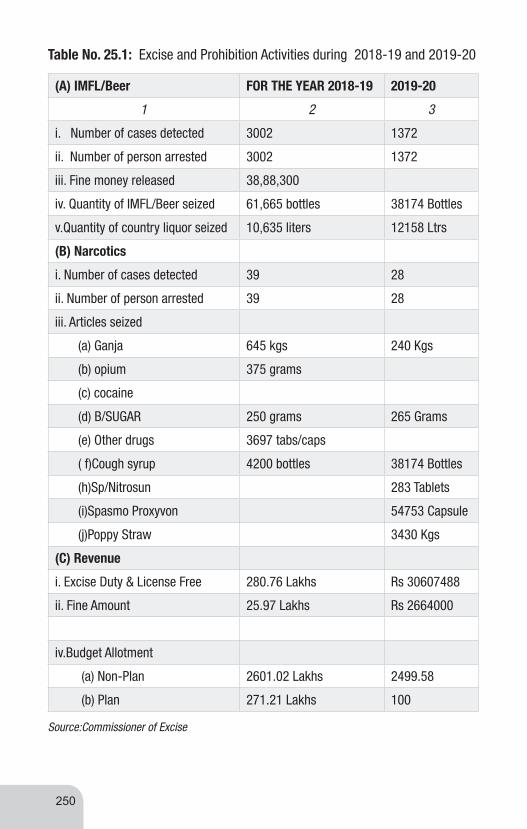
250
Source:Commissioner of Excise
(A) IMFL/Beer FOR THE YEAR 2018-19 2019-20
1 2 3
i. Number of cases detected 3002 1372
ii. Number of person arrested 3002 1372
iii. Fine money released 38,88,300
iv. Quantity of IMFL/Beer seized 61,665 bottles 38174 Bottles
v.Quantity of country liquor seized 10,635 liters 12158 Ltrs
(B) Narcotics
i. Number of cases detected 39 28
ii. Number of person arrested 39 28
iii. Articles seized
(a) Ganja 645 kgs 240 Kgs
(b) opium 375 grams
(c) cocaine
(d) B/SUGAR 250 grams 265 Grams
(e) Other drugs 3697 tabs/caps
( f)Cough syrup 4200 bottles 38174 Bottles
(h)Sp/Nitrosun 283 Tablets
(i)Spasmo Proxyvon 54753 Capsule
(j)Poppy Straw 3430 Kgs
(C) Revenue
i. Excise Duty & License Free 280.76 Lakhs Rs 30607488
ii. Fine Amount 25.97 Lakhs Rs 2664000
iv.Budget Allotment
(a) Non-Plan 2601.02 Lakhs 2499.58
(b) Plan 271.21 Lakhs 100
Table No. 25.1: Excise and Prohibition Activities during 2018-19 and 2019-20

PRICE
26

252
YEAR
FOOD
TOBA
CCO,
PAN
ETC
FUEL
& L
IGHT
ING
CLOT
HING
, FO
OTW
EAR
MIS
CELL
ANEO
USGE
NERA
L IN
DEX
12
34
56
78
2018
Urba
n12
0.82
129.
7613
2.92
135.
6811
9.33
123.
26
Rura
l12
1.81
138.
9313
0.28
131.
0512
4.75
124.
25
Com
bine
120.
6113
7.78
121.
0113
4.4
120.
3712
2.15
Tabl
e No
. 26.
1 : C
onsu
mer
Pric
e In
dex
Num
ber o
f Nag
alan
d Su
b-Gr
oups
dur
ing
2018
SNCo
mm
oditi
esSp
ecifi
catio
nUn
itDi
map
urKo
him
aPh
ekM
okok
chun
gZu
nhbo
toW
okha
Tuen
sang
Mon
Pere
nLo
ngle
ngKi
phire
Aver
age
1Ri
ce1.
And
hra
A
rham
*Kg
37.0
839
.71
41.0
837
.94
38.0
037
.04
38.1
339
.23
35.1
336
.46
39.5
438
.12
2W
heat
/atta
1.
Com
mon
“29
.04
31.4
638
.54
34.7
340
.63
33.3
836
.51
38.2
330
.00
42.8
337
.50
35.7
13
Mai
daCo
mm
on“
33.6
733
.63
38.5
437
.90
44.1
735
.00
39.5
041
.65
30.0
041
.83
39.3
837
.75
4Br
ead
“Pe
r pkt
26.4
628
.13
32.5
021
.08
30.0
032
.29
28.1
331
.08
29.3
820
.63
25.0
027
.70
5Ar
har d
alCo
mm
onKg
89.1
710
2.50
138.
0310
2.50
118.
1311
0.42
103.
3311
2.50
160.
0012
0.00
140.
8311
7.95
6M
asur
““
72.9
277
.71
100.
4292
.92
98.6
588
.33
93.7
596
.25
104.
5810
0.00
114.
5894
.55
7So
yabe
an“
“75
.08
69.3
870
.00
64.1
770
.52
84.1
774
.17
64.6
485
.00
100.
0063
.75
74.6
28
Naga
dal
““
74.5
864
.53
70.4
266
.11
61.6
767
.92
60.0
066
.50
70.0
053
.75
51.6
764
.29
9M
usta
rd o
ilCo
mm
on1
litre
95.8
310
7.50
115.
4210
3.75
100.
0098
.54
98.3
311
2.08
102.
9210
6.25
104.
5810
4.11
10Ed
ible
oil
(refin
ed)
Sund
rop/
saffo
la e
tc1l
itre
141.
2514
0.00
110.
0014
5.85
139.
7914
0.00
140.
6714
9.17
125.
0013
6.86
11Eg
gsCo
mm
onPe
rPl
ate
163.
3316
4.06
181.
6715
6.88
184.
1715
5.00
191.
2517
1.67
170.
8316
3.75
192.
9217
2.32
12Fi
shRa
huKg
168.
3317
0.54
185.
0017
7.58
190.
2118
5.42
180.
5020
2.30
182.
0018
1.00
210.
0018
4.81
Tabl
e No
. 26.
2 : D
istri
ct-w
ise
Aver
age
Reta
il Pr
ice
of E
ssen
tial C
omm
oditi
es fo
r the
yea
r 201
8(In
Rup
ees)

253
13M
utto
n*Co
mm
on“
450.
0041
8.75
325.
0038
2.92
428.
7548
1.25
239.
1735
0.00
337.
5037
5.00
378.
8314
Beef
““
175.
8318
8.75
187.
0819
1.81
181.
2516
4.17
187.
5018
1.67
172.
9218
0.00
180.
0018
1.00
15Po
rk“
“21
8.33
209.
3823
5.00
217.
9220
1.88
206.
6721
9.38
226.
2521
2.50
220.
0021
8.75
216.
9116
Salt
Tata
Kg20
.00
20.2
120
.00
20.0
020
.00
20.0
020
.00
20.0
020
.38
20.0
020
.06
17Gi
nger
““
50.8
345
.63
34.5
846
.88
42.2
939
.38
44.1
757
.08
26.4
633
.33
50.0
042
.78
18Dr
y ch
illie
s“
Kg14
6.67
186.
2525
8.33
199.
5819
9.79
187.
0814
6.67
266.
8813
9.58
160.
0019
8.33
189.
9219
Pota
toCo
mm
onKg
22.2
926
.50
25.6
324
.88
23.4
421
.46
24.3
822
.08
21.7
022
.50
26.2
523
.74
20On
ion
““
37.9
249
.27
59.1
744
.54
59.1
753
.33
45.0
079
.58
40.0
041
.33
51.4
650
.98
21Ca
bbag
e“
“25
.00
30.8
331
.25
31.2
548
.13
27.9
231
.25
34.9
032
.50
33.3
342
.22
33.5
122
Brin
jal
““
27.9
234
.06
49.1
733
.96
39.7
932
.50
34.1
723
.77
17.0
838
.48
46.6
734
.32
23To
mat
o“
“37
.08
50.8
371
.25
42.0
859
.17
38.3
340
.42
50.8
360
.21
52.6
977
.08
52.7
324
Chill
i(gre
en)
““
73.9
684
.69
76.2
968
.54
110.
4262
.77
74.1
797
.50
109.
5867
.92
78.3
382
.20
25Ba
nana
Loca
lPe
r Bu
nch
45.0
053
.60
35.0
043
.52
60.0
048
.54
50.8
341
.67
22.9
242
.08
28.1
342
.84
26Pi
neap
ple
Loca
lPe
r Pi
ece
31.8
540
.10
27.2
931
.86
38.1
330
.83
26.6
725
.83
28.5
015
.00
27.5
029
.41
27Or
ange
Com
mon
“10
8.33
98.3
565
.28
81.5
089
.00
97.0
010
1.67
109.
0065
.63
37.0
012
0.00
88.4
328
Appl
eCo
mm
onKg
110.
4213
7.00
177.
5015
8.61
187.
7116
7.92
163.
7513
6.67
109.
1718
5.45
200.
0015
7.65
29Su
gar
1.Co
mm
onKg
45.7
149
.38
52.7
152
.00
50.0
050
.00
50.0
052
.92
52.2
950
.00
52.0
850
.64
30Ho
ney
Loca
lPe
r bo
ttle
464.
5854
7.50
825.
0051
6.25
475.
0054
1.67
400.
0035
0.00
510.
4231
6.67
300.
0047
7.01
31Pr
epar
ed te
a Co
mm
onPe
r cup
10.0
010
.00
10.0
010
.00
10.0
010
.21
10.0
010
.00
10.0
010
.00
10.0
010
.02
32Pr
epar
ed
coffe
e*Co
mm
onPe
r cup
20.0
019
.79
20.0
020
.83
20.0
020
.00
25.8
326
.67
20.0
020
.00
20.0
021
.19
33Pu
riCo
mm
onPe
r pl
ate
20.0
025
.42
25.8
333
.33
20.4
221
.25
24.5
820
.00
20.0
020
.00
24.5
823
.22
34Pa
n Fi
nish
ed“
Per p
an9.
257.
008.
258.
138.
297.
927.
679.
009.
509.
758.
4835
Ciga
rette
s W
ills
flake
Per P
kt54
.38
69.5
856
.67
50.4
250
.00
55.0
457
.22
65.0
054
.17
55.4
260
.00
57.0
8
36El
ectri
city
(std
Un
it)25
0 kw
hPe
r m
eter
4.42
5.65
6.55
4.19
4.19
4.20
5.70
6.50
5.18
37M
atch
box
Cam
elPe
r box
1.00
1.00
2.00
1.42
1.27
1.75
1.00
1.50
2.00
2.00
1.00
1.45co
ntd
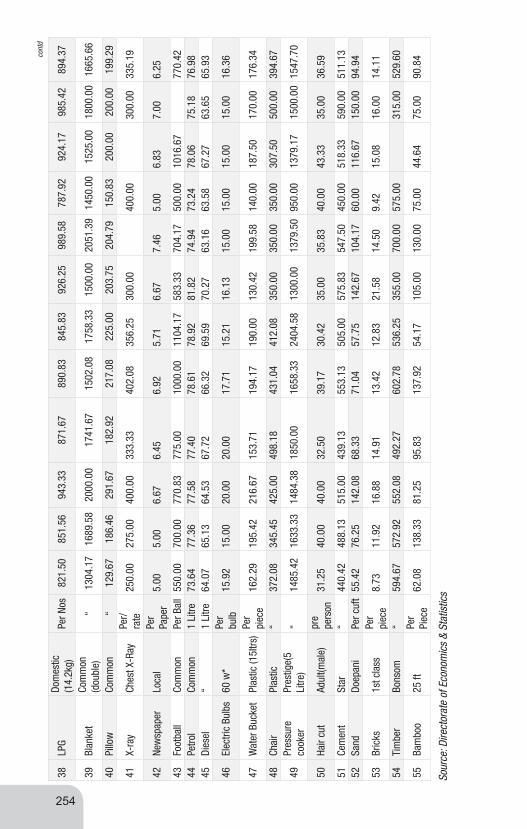
254
38LP
GDo
mes
tic
(14.
2kg)
Per N
os82
1.50
851.
5694
3.33
871.
6789
0.83
845.
8392
6.25
989.
5878
7.92
924.
1798
5.42
894.
37
39Bl
anke
t Co
mm
on(d
oubl
e)“
1304
.17
1689
.58
2000
.00
1741
.67
1502
.08
1758
.33
1500
.00
2051
.39
1450
.00
1525
.00
1800
.00
1665
.66
40Pi
llow
Com
mon
“12
9.67
186.
4629
1.67
182.
9221
7.08
225.
0020
3.75
204.
7915
0.83
200.
0020
0.00
199.
29
41X-
ray
Ches
t X-R
ayPe
r/ra
te25
0.00
275.
0040
0.00
333.
3340
2.08
356.
2530
0.00
400.
0030
0.00
335.
19
42Ne
wsp
aper
Loca
lPe
r Pa
per
5.00
5.00
6.67
6.45
6.92
5.71
6.67
7.46
5.00
6.83
7.00
6.25
43Fo
otba
llCo
mm
onPe
r Bal
l55
0.00
700.
0077
0.83
775.
0010
00.0
011
04.1
758
3.33
704.
1750
0.00
1016
.67
770.
4244
Petro
lCo
mm
on1
Litre
73.6
477
.36
77.5
877
.40
78.6
178
.92
81.8
274
.94
73.2
478
.06
75.1
876
.98
45Di
esel
“1
Litre
64.0
765
.13
64.5
367
.72
66.3
269
.59
70.2
763
.16
63.5
867
.27
63.6
565
.93
46El
ectri
c Bu
lbs
60 w
*Pe
r bu
lb15
.92
15.0
020
.00
20.0
017
.71
15.2
116
.13
15.0
015
.00
15.0
015
.00
16.3
6
47W
ater
Buc
ket
Plas
tic (1
5ltrs
)Pe
r pi
ece
162.
2919
5.42
216.
6715
3.71
194.
1719
0.00
130.
4219
9.58
140.
0018
7.50
170.
0017
6.34
48Ch
air
Plas
tic“
372.
0834
5.45
425.
0049
8.18
431.
0441
2.08
350.
0035
0.00
350.
0030
7.50
500.
0039
4.67
49Pr
essu
re
cook
erPr
estig
e(5
Litre
)“
1485
.42
1633
.33
1484
.38
1850
.00
1658
.33
2404
.58
1300
.00
1379
.50
950.
0013
79.1
715
00.0
015
47.7
0
50Ha
ir cu
tAd
ult(m
ale)
pre
pers
on31
.25
40.0
040
.00
32.5
039
.17
30.4
235
.00
35.8
340
.00
43.3
335
.00
36.5
9
51Ce
men
tSt
ar“
440.
4248
8.13
515.
0043
9.13
553.
1350
5.00
575.
8354
7.50
450.
0051
8.33
590.
0051
1.13
52Sa
ndDo
epan
iPe
r cuf
t55
.42
76.2
514
2.08
68.3
371
.04
57.7
514
2.67
104.
1760
.00
116.
6715
0.00
94.9
4
53Br
icks
1st c
lass
Per
piec
e8.
7311
.92
16.8
814
.91
13.4
212
.83
21.5
814
.50
9.42
15.0
816
.00
14.1
1
54Ti
mbe
rBo
nsom
“59
4.67
572.
9255
2.08
492.
2760
2.78
536.
2535
5.00
700.
0057
5.00
315.
0052
9.60
55Ba
mbo
o25
ftPe
r Pi
ece
62.0
813
8.33
81.2
595
.83
137.
9254
.17
105.
0013
0.00
75.0
044
.64
75.0
090
.84
Sour
ce: D
irect
orat
e of
Eco
nom
ics
& St
atis
tics
cont
d

POLICE
27

256
SNDi
stric
tPo
lice
Stat
ion
Polic
e ou
tpos
tPo
lice
Chec
k Po
stPo
lice
Beat
Pos
t
1.
K
ohim
a8
24
2
2.
D
imap
ur9
84
3
3.
P
eren
5
12
-
4.
P
hek
61
2-
5.
M
okok
chun
g9
42
-
6.
W
okha
54
21
7.
Z
unhe
boto
74
--
8.
T
uens
ang
81
1-
9.
K
iphi
re2
1-
-
10.
Lo
ngle
ng1
1-
-
11.
M
on5
22
-
Tota
l 65
2919
6
Tabl
e No
.27.
1: N
umbe
r of P
olic
e St
atio
ns a
nd O
utpo
st d
urin
g th
e ye
ar 2
018
(till
June
201
8)
Sour
ce:D
irect
orat
e Ge
nera
l of P
olic
e

257
SNDi
stric
tPo
lice
Stat
ion
Polic
e ou
tpos
tPo
lice
Chec
k Po
stPo
lice
Beat
Pos
t
1.
Ko
him
a8
33
1
2.
D
imap
ur9
84
3
3.
Pe
ren
41
11
4.
Ph
ek7
12
-
5.
M
okok
chun
g10
42
-
6.
W
okha
64
21
7.
Zu
nheb
oto
74
--
8.
Tu
ensa
ng9
11
-
9.
Ki
phire
22
--
10.
Lo
ngle
ng3
1-
-
11.
M
on8
42
-
Tota
l 73
3317
6
Sour
ce: D
irect
orat
e Ge
nera
l of P
olic
e
Tabl
e No
.27.
2: N
umbe
r of P
olic
e St
atio
ns a
nd O
utpo
st d
urin
g th
e ye
ar 2
018-
19
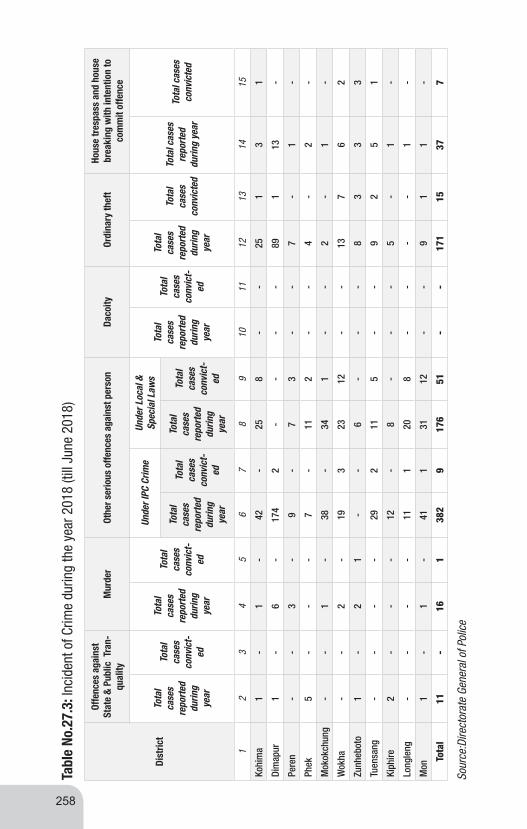
258
Dist
rict
Offe
nces
aga
inst
St
ate
& P
ublic
Tra
n-qu
ality
Mur
der
Othe
r ser
ious
offe
nces
aga
inst
per
son
Daco
ityOr
dina
ry th
eft
Hous
e tr
espa
ss a
nd h
ouse
br
eaki
ng w
ith in
tent
ion
to
com
mit
offe
nce
Tota
l ca
ses
repo
rted
du
ring
year
Tota
l ca
ses
conv
ict-
ed
Tota
l ca
ses
repo
rted
du
ring
year
Tota
l ca
ses
conv
ict-
ed
Unde
r IPC
Crim
eUn
der L
ocal
&
Spec
ial L
aws
Tota
l ca
ses
repo
rted
du
ring
year
Tota
l ca
ses
conv
ict-
ed
Tota
l ca
ses
repo
rted
du
ring
year
Tota
l ca
ses
conv
icte
d
Tota
l cas
es
repo
rted
du
ring
year
Tota
l cas
es
conv
icte
d To
tal
case
s re
port
ed
durin
g ye
ar
Tota
l ca
ses
conv
ict-
ed
Tota
l ca
ses
repo
rted
du
ring
year
Tota
l ca
ses
conv
ict-
ed
12
34
56
78
910
1112
1314
15
Kohi
ma
1-
1-
42-
258
--
251
31
Dim
apur
1-
6-
174
2-
--
-89
113
-
Pere
n -
-3
-9
-7
3-
-7
-1
-
Phek
5-
--
7-
112
--
4-
2-
Mok
okch
ung
--
1-
38-
341
--
2-
1-
Wok
ha-
-2
-19
323
12-
-13
76
2
Zunh
ebot
o1
-2
1-
-6
--
-8
33
3
Tuen
sang
--
--
292
115
--
92
51
Kiph
ire2
--
-12
-8
--
-5
-1
-
Long
leng
--
--
111
208
--
--
1-
Mon
1-
1-
411
3112
--
91
1-
Tota
l11
-16
138
29
176
51-
-17
115
377
Tabl
e No
.27.
3: In
cide
nt o
f Crim
e du
ring
the
year
201
8 (ti
ll Ju
ne 2
018)
Sour
ce:D
irect
orat
e Ge
nera
l of P
olic
e

259
SNDi
stric
t
Offe
nces
aga
inst
Sta
te
& P
ublic
Tra
nqua
lity
Mur
der
Othe
r ser
ious
offe
nces
aga
inst
per
son
Daco
ityOr
dina
ry th
eft
Hous
e tr
espa
ss a
nd h
ouse
br
eaki
ng w
ith in
tent
ion
to
com
mit
offe
nce
Tota
l ca
ses
repo
rted
du
ring
year
Tota
l ca
ses
conv
ictio
n
Tota
l ca
ses
repo
rted
du
ring
year
Tota
l cas
es
conv
icte
d
Unde
r IPC
Crim
eUn
der L
ocal
& S
peci
al
Law
sTo
tal
case
s re
port
ed
durin
g ye
ar
Tota
l ca
ses
conv
ictio
n
Tota
l ca
ses
repo
rted
du
ring
year
Tota
l cas
es
conv
ictio
n
Tota
l cas
es
repo
rted
du
ring
year
Tota
l cas
es
conv
ictio
n To
tal
case
s re
port
ed
durin
g ye
ar
Tota
l cas
es
conv
ictio
n
Tota
l ca
ses
repo
rted
du
ring
year
Tota
l cas
es
conv
ictio
n
12
34
56
78
910
1112
1314
1516
1Ko
him
a0
03
087
448
160
046
20
0
2Di
map
ur1
017
138
32
150
30
269
143
0
3Pe
ren
00
30
260
131
00
120
00
4Ph
ek5
00
015
114
20
04
03
0
5M
okok
chun
g0
04
050
058
10
08
04
0
6W
okha
00
00
417
5215
00
257
00
7Zu
nheb
oto
00
30
150
4223
00
102
116
8Tu
ensa
ng0
01
027
827
90
014
77
3
9Ki
phire
20
00
150
110
00
70
10
10Lo
ngle
ng0
00
014
424
110
04
10
0
11M
on2
11
037
61
00
021
54
0
Tota
l10
132
171
032
305
783
042
025
739
Sour
ce: D
irect
orat
e Ge
nera
l of P
olic
e
Tabl
e No
.27.
4: In
cide
nt o
f Crim
e du
ring
the
year
201
8-19


FIRE&
EMERGENCY
28

262
FORE
STLO
SS O
F
SNDI
STRI
CTM
AJOR
MIN
ORM
EDIU
MSE
RIOU
SFI
RETO
TAL
LIFE
LOS
TPR
OPER
TYPR
OPER
TY
SAVE
D
1KO
HIM
A(s)
97
28
2697
,11,
000
53,5
8,00
00
2KO
HIM
A(N)
32
57,
50,0
0045
,50,
000
3DI
MAP
UR31
84
431,
90,5
0,00
023
,90,
00,0
00
4CH
UMUK
EDIM
A8
22
113
1,04
,40,
000
1,07
,00,
000
5M
OKOK
CHUN
G7
29
1,49
,50,
000
11,8
3,00
,000
6TU
ENSA
NG6
624
,10,
845
7W
OKHA
42
61,
54,9
9,43
03,
00,0
0,00
0
8ZU
NHEB
OTO
9M
ON3
14
6,03
,300
10PH
EK1
23
11KI
PHIR
E1
1
12PE
REN
12
33,
00,0
00
13LO
NGLE
NG1
12
15,1
0,00
050
,00,
000
14TU
LI2
12
27
1,02
,00,
000
71,0
0,00
0
Tota
l74
2312
1912
88,
54,2
4,57
546
,82,
30,0
00
Sour
ce: F
ire &
em
erge
ncy
Serv
ices
Tabl
e No
. 28.
1 : N
umbe
r of F
ire In
cide
nts
durin
g 20
18-1
9
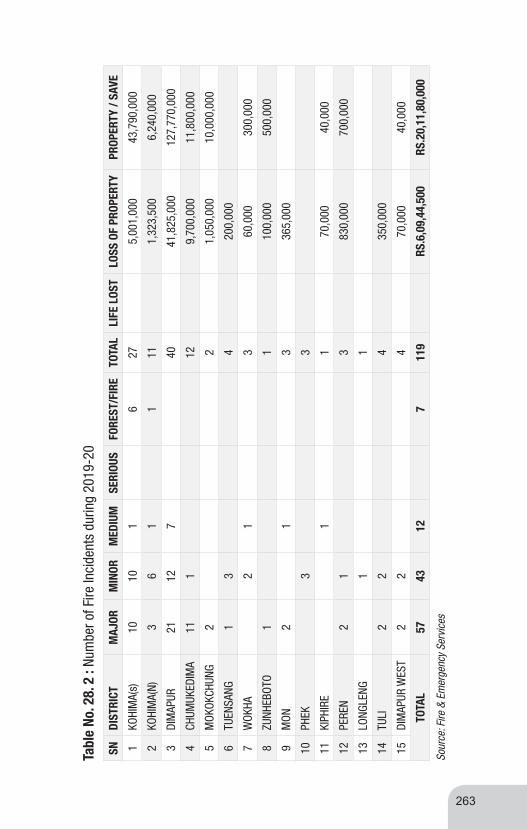
263
SNDI
STRI
CTM
AJOR
MIN
ORM
EDIU
MSE
RIOU
SFO
REST
/FIR
ETO
TAL
LIFE
LOS
TLO
SS O
F PR
OPER
TYPR
OPER
TY /
SAVE
1KO
HIM
A(s)
1010
16
275,
001,
000
43,7
90,0
00
2KO
HIM
A(N)
36
11
111,
323,
500
6,24
0,00
0
3DI
MAP
UR21
127
4041
,825
,000
127,
770,
000
4CH
UMUK
EDIM
A11
112
9,70
0,00
011
,800
,000
5M
OKOK
CHUN
G2
21,
050,
000
10,0
00,0
00
6TU
ENSA
NG1
34
200,
000
7W
OKHA
21
360
,000
300,
000
8ZU
NHEB
OTO
11
100,
000
500,
000
9M
ON2
13
365,
000
10PH
EK3
3
11KI
PHIR
E1
170
,000
40,0
00
12PE
REN
21
383
0,00
070
0,00
0
13LO
NGLE
NG1
1
14TU
LI2
24
350,
000
15DI
MAP
UR W
EST
22
470
,000
40,0
00
TOTA
L57
4312
711
9RS
.6,0
9,44
,500
RS.2
0,11
,80,
000
Sour
ce: F
ire &
Em
erge
ncy
Serv
ices
Tabl
e No
. 28.
2 :
Num
ber o
f Fire
Inci
dent
s du
ring
2019
-20

Table No. 28.3 : Number of Fire Station during 2018-19 & 2019-20
SN District 2018-19 2019-20
1 2 3 3
1 Kohima 2 2
2 Dimapur 3 3
3 Peren 2 1
4 Phek 1 1
5 Mokokchung 2 2
6 Wokha 1 1
7 Zunheboto 1 1
8 Kiphire 1 1
9 Tuensang 1 1
10 Longleng 1 1
11 Mon 1 1
Nagaland 16 16
Source: Fire & Emergency Services
264

MISCELLANEOUS
29

266
SNNa
me
of T
rade
Uni
onRe
gist
ratio
n Nu
mbe
r and
Dat
eDi
stric
t/
Juris
tric
tion
12
34
1Di
map
ur D
istri
ct A
uto-
Rick
shaw
Driv
ers
Unio
nLB
R/TE
CH-2
59/9
5 Dt
.05/
10/2
006
Dim
apur
2Di
map
ur M
otor
wor
kers
Tra
de U
nion
, Dim
apur
LBR-
22/8
6 D
t.05/
10/1
986
Dim
apur
3Di
map
ur T
ruck
Driv
er’s
Uni
onLB
R-38
/92
Dt.1
1/08
/199
2Di
map
ur
4Di
map
ur A
uto
Rick
shaw
Onw
ers
Unio
nLB
R-45
/96
Dt.0
8/02
/199
6Di
map
ur
5Di
map
ur T
hela
(Han
dcar
t) Pu
llers
Em
ploy
ees
Unio
nLB
R/TE
CH-4
7/96
Dt.1
8/09
/199
6Di
map
ur
6Di
map
ur D
istri
ct P
icku
p Va
n Ow
ners
& D
river
Uni
onLB
R/TE
CH D
t.28/
10/2
002
Dim
apur
7Di
map
ur L
and
Tran
spor
t wor
kers
Uni
onLB
R/TE
CH-3
4/05
Dt.1
1/04
/200
5Di
map
ur
8Po
rk B
utch
ers
Unio
n (D
imap
ur)
LBR/
TECH
-363
/200
5 dt
.08/
09/2
005
Dim
apur
9Ea
st D
imap
ur P
uran
a Ba
zar L
abou
r Tra
de U
nion
LBR/
TECH
-9/2
006
dt.0
4/04
/200
6Di
map
ur
10Di
map
ur T
axi D
river
s Un
ion
LBR/
TECH
-23/
09 d
t.30/
07/2
009
Dim
apur
11Di
map
ur D
istri
ct G
arag
e W
elfa
re T
rade
Uni
onLB
R/TE
CH-3
8/20
13 d
t.31/
08/2
010
Dim
apur
12Di
map
ur D
istri
ct T
ruck
Driv
ers
Wel
fare
Tra
de U
nion
LBR/
TECH
-61/
2013
dt.2
3/08
/201
3Di
map
ur
13Na
gala
nd H
andl
oom
and
Han
dicr
afts
Dev
elop
men
t Cor
pora
tion
Lim
ited
Staf
f Un
ion
(Dim
apur
)LB
R/TU
/DM
A-02
/201
406/
dt.0
6/20
14Di
map
ur
14Na
gala
nd S
tate
Co-
Oper
ativ
e Ba
nk E
mpl
oyee
s Un
ion
LBR/
TU/D
MA-
01/2
014
dt.0
4/02
/201
4Di
map
ur
15De
velo
pmen
t aut
horit
y Re
gula
r Sta
ff Un
ion
LBR/
TU/D
MA-
06/2
014
dt.2
9/10
/201
4Di
map
ur
Tabl
e No
. 29.
1: N
ame
of th
e Tr
ade
Unio
ns re
gist
ered
by
the
Regi
stra
r of T
rade
Uni
ons’
Nag
alan
d as
on
1st A
pril
2018
to
31st
Mar
ch 2
019.

267
16Di
map
ur M
unic
ipal
Cou
ncil
Empl
oyee
s W
elfa
re U
nion
LBR/
TU/D
MA-
05/2
014
dt.2
7/10
/201
4Di
map
ur
17Zu
nheb
oto
Cham
ber o
f Com
mer
ce a
nd In
dust
ries
LBR/
TU/Z
BTO-
04/2
014
dt.2
8.10
.201
4Zu
nheb
oto
18Ko
him
a Di
stric
t Lan
d Tr
ansp
ort T
rade
Uni
on, P
hesa
ma
LBR/
319/
99 d
t.199
9Ko
him
a
19M
ini C
emen
t Pla
nt W
orke
rs U
nion
Phe
kLB
R/TE
CH-2
59/9
4 dt
.11.
09.1
995
Phek
20Ph
ek D
istri
ct T
imbe
rs A
ssoc
iatio
nLB
R/23
/87
dt.1
7.03
.198
7Ph
ek
21W
orke
rs U
nion
Nag
alan
d Pu
lp a
nd P
aper
Co.
Ltd.
Tul
i Mok
okch
ung
LBR-
698
dt.0
2/05
/197
5M
okok
chun
g
22Na
gala
nd R
ural
Ban
k Em
ploy
ees
Asso
ciat
ion,
Koh
ima
LBR-
18/8
5 dt
. 13.
02.1
985
Kohi
ma
23Di
map
ur C
ycle
Ric
ksha
w P
ulle
rs u
nion
LBR/
TECH
-49/
96 d
t.05.
03.1
997
Dim
apur
24Na
gala
nd R
ural
Ban
k Of
ficer
s as
soci
atio
n, K
ohim
aLB
R-52
/98
dt.1
7/03
/199
8Ko
him
a
25Ko
him
a Ho
tel &
Res
taur
ant U
nion
LBR/
TU/K
MA-
03/2
014
dt.2
0108
/201
4Ko
him
a
26Se
lf Em
ploy
ed W
omen
’s A
ssoc
iatio
n (S
EWA)
Naga
land
LBR-
08/2
019
Dt.2
4.05
.201
9Ko
him
a
27Al
l Nag
alan
d Do
mes
tic W
orke
rs U
nion
(AND
WU)
LBR-
07/2
018
Dt.2
9.11
.201
8Di
map
ur
Cont
d.
Sour
ce: J
oint
Lab
our C
omm
issi
oner

268
SNNa
me
of T
rade
Uni
onRe
gist
ratio
n Nu
mbe
r and
Dat
eDi
stric
t/
Juris
tric
tion
12
34
1Di
map
ur D
istri
ct A
uto-
Rick
shaw
Driv
ers
Unio
nLB
R/TE
CH-2
59/9
5 D
t.05/
10/2
006
Dim
apur
2Di
map
ur M
otor
wor
kers
Tra
de U
nion
, Dim
apur
LBR/
22/8
6 D
t.05/
10/1
986
Dim
apur
3Di
map
ur T
ruck
Driv
er’s
Uni
onLB
R-38
/92
Dt.1
1/08
/199
2Di
map
ur
4Di
map
ur A
uto
Rick
shaw
Onw
ers
Unio
nLB
R-45
/96
Dt.0
8/02
/199
6Di
map
ur
5Di
map
ur T
hela
(Han
dcar
t) Pu
llers
Em
ploy
ees
Unio
nLB
R/TE
CH-4
7/96
Dt.1
8/09
/199
6Di
map
ur
6Di
map
ur D
istri
ct P
icku
p Va
n Ow
ners
& D
river
Uni
onLB
R/TE
CH-D
t.28/
10/2
002
Dim
apur
7Di
map
ur L
and
Tran
spor
t wor
kers
Uni
onLB
R/TE
CH-3
4/05
Dt.1
1/04
/200
5Di
map
ur
8Po
rk B
utch
ers
Unio
n (D
imap
ur)
LBR/
TECH
-363
/200
5 D
t.08/
09/2
005
Dim
apur
9Ea
st D
imap
ur P
uran
a Ba
zar L
abou
r Tra
de U
nion
LBR/
TECH
-9/2
006
Dt.0
4/04
/200
6Di
map
ur
10Di
map
ur T
axi D
river
s Un
ion
LBR/
TECH
-23/
09 D
t.30/
07/2
009
Dim
apur
11Di
map
ur D
istri
ct G
arag
e W
elfa
re T
rade
Uni
onLB
R/TE
CH-3
8/20
13 D
t.31/
08/2
010
Dim
apur
12Di
map
ur D
istri
ct T
ruck
Driv
ers
Wel
fare
Tra
de U
nion
LBR/
TECH
-61/
2013
Dt.2
3/08
/201
3Di
map
ur
13Na
gala
nd H
andl
oom
and
Han
dicr
afts
Dev
elop
men
t Cor
pora
tion
Lim
ited
Staf
f Uni
on
(Dim
apur
)LB
R/TU
/DM
A-02
/201
4 D
t.06/
06/2
014
Dim
apur
14Na
gala
nd S
tate
Co-
Oper
ativ
e Ba
nk E
mpl
oyee
s Un
ion
LBR/
TU/D
MA-
01/2
014
Dt.0
4/02
/201
4Di
map
ur
15De
velo
pmen
t aut
horit
y Re
gula
r Sta
ff Un
ion
LBR/
TU/D
MA-
06/2
014
Dt.2
9/10
/201
4Di
map
ur
16Di
map
ur M
unic
ipal
Cou
ncil
Empl
oyee
s W
elfa
re U
nion
LBR/
TU/D
MA-
05/2
014
DT.
27/1
0/20
14Di
map
ur
Tabl
e No
. 29.
2: N
ame
of th
e Tr
ade
Unio
ns re
gist
ered
by
the
Regi
stra
r of T
rade
Uni
ons’
Nag
alan
d as
on
31st M
arch
202
0.

269
Sour
ce: J
oint
Lab
our C
omm
issi
oner
17Zu
nheb
oto
Cham
ber o
f Com
mer
ce a
nd In
dust
ries
LBR/
TU/Z
BTO-
04/2
014
Dt.2
8/10
/201
4Zu
nheb
oto
18Ko
him
a Di
stric
t Lan
d Tr
ansp
ort T
rade
Uni
on, P
hesa
ma
LBR/
319/
99 D
t.199
9ko
him
a
19M
ini C
emen
t Pla
nt W
orke
rs U
nion
Phe
kLB
/94R
/TEC
H-25
9 D
t.11/
09/1
995
Phek
20Ph
ek D
istri
ct T
imbe
rs A
ssoc
iatio
nLB
R/23
/87
Dt.1
7/03
/198
7Ph
ek
21W
orke
rs U
nion
Nag
alan
d Pu
lp a
nd P
aper
Co.
Ltd.
Tul
i Mok
okch
ung
LBR-
698
Dt.0
2/05
/197
5M
okok
chun
g
22Na
gala
nd R
ural
Ban
k Em
ploy
ees
Asso
ciat
ion,
Koh
ima
LBR-
18/8
5 Dt
. 13/
02/1
985
kohi
ma
23Di
map
ur C
ycle
Ric
ksha
w P
ulle
rs u
nion
LBR/
TECH
-49/
96
Dt.0
5/03
/199
7Di
map
ur
24Na
gala
nd R
ural
Ban
k Of
ficer
s as
soci
atio
n, K
ohim
aLB
R-52
/98
Dt.1
7/03
/199
8ko
him
a
25Ko
him
a Ho
tel &
Res
taur
ant U
nion
LBR/
TU/K
MA-
03/2
014
Dt.2
0/08
/201
4ko
him
a
26Se
lf Em
ploy
ed W
omen
’s A
ssoc
iatio
n (S
EWA)
Naga
land
LBR-
08/2
019
Dt.2
4/05
/201
9ko
him
a
27Al
l Nag
alan
d Do
mes
tic W
orke
rs U
nion
(AND
WU)
LBR-
07/2
018
Dt.2
9/11
/201
8Di
map
ur
cont

270
SNTr
ade
Skill
edGr
ade-
1Sk
illed
Grad
e-11
Sem
iSk
illed
Unsk
illed
12
34
56
1Br
icks
Kiln
sRs
. 145
Rs. 1
35Rs
. 125
Rs. 1
15
2Au
tom
obile
s w
orks
hop
Rs. 1
45Rs
. 135
Rs. 1
25Rs
. 115
3Pr
intin
g Pr
ess
Rs. 1
45Rs
. 135
Rs. 1
25Rs
. 115
4Ho
tel &
Res
taur
ant
Rs. 1
45Rs
. 135
Rs. 1
25Rs
. 115
5Ba
mbo
o, P
ulp
& Pa
per &
For
est
Rs. 1
45Rs
. 135
Rs. 1
25Rs
. 115
6Al
umin
um In
dust
ryRs
. 145
Rs. 1
35Rs
. 125
Rs. 1
15
7Ha
ndlo
oms,
Wea
ving
& H
andi
craf
tsRs
. 145
Rs. 1
35Rs
. 125
Rs. 1
15
8Di
still
ery
Units
Rs. 1
45Rs
. 135
Rs. 1
25Rs
. 115
9W
oode
n Fu
rnitu
re W
orks
Rs. 1
45Rs
. 135
Rs. 1
25Rs
. 115
10Ci
nem
a Un
itsRs
. 145
Rs. 1
35Rs
. 125
Rs. 1
15
11Co
ffee,
Tea
, Rub
ber p
lant
atio
nRs
. 145
Rs. 1
35Rs
. 125
Rs. 1
15
12Pl
ywoo
d In
dust
ryRs
. 145
Rs. 1
35Rs
. 125
Rs. 1
15
13So
ap &
Can
dle
Units
Rs. 1
45Rs
. 130
Rs. 1
25Rs
. 115
14Lo
adin
g &
unlo
adin
g
15Ha
ir Cu
tting
& D
ress
ing
Rs.1
35Rs
. 125
Rs. 1
25-
16Ri
ce, O
il, F
lour
& D
al M
ills
Rs. 1
45Rs
. 135
Rs. 1
25Rs
. 115
17Ag
ricul
ture
Rs. 1
35Rs
. 125
Rs. 1
15-
18Bu
ildin
g &
Othe
r Con
stru
ctio
n &
Mai
nten
ance
of R
oad
Rs.1
45Rs
. 135
Rs. 1
25Rs
. 115
Tabl
e No
. 29.
3: T
he M
inim
um R
ate
of W
ages
(in
Rs.)
unde
r 57
Sche
dule
of E
mpl
oym
ent(a
s on
1st
Apr
il, 2
018
to \
31st M
arch
201
9)

271
19Pu
blic
Mot
or T
rans
port
Rs.1
45Rs
. 135
Rs. 1
25Rs
. 115
20Sa
w M
ills
& Ti
mbe
rs In
dust
ryRs
.145
Rs. 1
35Rs
. 125
Rs. 1
15
21Sh
ops
& Co
mm
erci
al
Esta
blis
hmen
ts, H
ospi
tals
& N
ursi
ng
Hom
eRs
.145
Rs. 1
35Rs
. 125
Rs. 1
15
22Sa
les
of A
utom
obile
s/ th
ree
whe
eler
s/ tw
o w
heel
ers
Rs.1
45Rs
. 135
Rs. 1
25Rs
. 115
23Ta
ilorin
g, S
titch
ing
& Em
broi
dery
Es
tabl
ishm
ent
Rs.1
45Rs
. 135
Rs. 1
25Rs
. 115
24Ch
emic
al In
dust
ryRs
.145
Rs. 1
35Rs
. 125
Rs. 1
15
25Pe
trol &
Die
sel O
il Pu
mp
Rs.1
45Rs
. 135
Rs. 1
25Rs
. 115
26Ce
men
t Con
cret
e Pi
pes
Rs.1
45Rs
. 135
Rs. 1
25Rs
. 115
27No
n-Fe
rrou
s M
etal
Rel
ling
& St
eel
Fabr
icat
ing
Indu
strie
sRs
.145
Rs. 1
35Rs
. 125
Rs. 1
15
28Ce
men
t Fac
torie
s &
Othe
r Cem
ent
Prod
ucts
Rs.1
45Rs
. 135
Rs. 1
25Rs
. 115
29M
otor
Bod
y Bu
ilder
sRs
.145
Rs. 1
35Rs
. 125
Rs. 1
15
30Ty
re S
ervi
ceRs
.145
Rs. 1
35Rs
. 125
Rs. 1
15
31Ic
e &
Milk
Pro
duct
sRs
.145
Rs. 1
35Rs
. 125
Rs. 1
15
32Ca
nvas
Indu
stry
Rs.1
45Rs
. 135
Rs. 1
25Rs
. 115
33Ba
kery
& B
iscu
it In
dust
ryRs
.145
Rs. 1
35Rs
. 125
Rs. 1
15
34La
undr
y &
Was
hing
Clo
thes
--
--
35Kh
ansa
ri Su
gar F
acto
ries
Rs.1
45Rs
. 135
Rs. 1
25Rs
. 115
36St
one
Brea
king
/ Sto
ne C
rush
ing
Rs.1
45Rs
. 135
Rs. 1
25Rs
. 115
Cont
d.

272
37Te
leco
mm
unic
atio
n Es
tabl
ishm
ents
Rs.1
45Rs
. 135
Rs. 1
25Rs
. 115
38Da
iry, P
igge
ry &
Pou
ltry
Farm
Rs.1
45Rs
.135
Rs. 1
25Rs
. 115
39Ho
rticu
lture
Ope
ratio
nRs
.145
Rs. 1
35Rs
. 125
Rs. 1
15
40Se
ricul
ture
Ope
ratio
nRs
.145
Rs.1
35Rs
. 125
Rs. 1
15
41M
anuf
actu
re o
f Bev
erag
es &
Min
eral
W
ater
Rs.1
45Rs
. 135
Rs. 1
25Rs
. 115
42Kh
adi &
Vill
age
Indu
strie
s Rs
.145
Rs. 1
35Rs
. 125
Rs. 1
15
43Pa
thol
ogic
al L
abor
ator
ies
Rs.1
45Rs
. 135
Rs. 1
25Rs
. 115
44LP
G Di
strib
utio
nRs
.145
Rs. 1
35Rs
. 125
Rs. 1
15
45Pr
ivat
e Tr
ansp
ort
Rs.1
45Rs
. 135
Rs. 1
25Rs
. 115
46Hy
dro
Elec
tric
Proj
ect
Rs.1
45Rs
. 135
Rs. 1
25Rs
. 115
47Tu
be W
ell S
ingk
ing
Rs.1
45Rs
. 135
Rs. 1
25Rs
. 115
48Pr
ivat
e Te
achi
ng/ C
oach
ing
Trai
ning
In
stitu
tion
Rs.1
45Rs
. 135
Rs.1
25Rs
.115
49Re
nted
Ser
vice
like
Ten
t, Ch
air e
tc.
Croc
kery
& H
ouse
Hol
d Go
ods
Rs.1
45Rs
. 135
Rs. 1
25Rs
. 115
50Re
pairi
ng o
f Ele
ctric
al &
Ele
ctro
n Go
ods
Rs.1
45Rs
. 135
Rs.1
25Rs
. 115
51Lo
cal A
utho
ritie
sRs
.145
Rs. 1
35Rs
. 125
Rs. 1
15
52Fa
ctor
ies
Not e
lsew
here
cla
ssifi
edRs
.145
Rs. 1
35Rs
. 125
Rs. 1
15
53Se
mi-G
ovt.
Auth
ority
Rs.1
45Rs
. 135
Rs. 1
25Rs
. 115
54Ca
sual
/ Mus
ter R
oll W
orke
rs in
all
Govt
. Dep
artm
ents
Rs.1
45Rs
. 135
Rs. 1
25Rs
. 115
Cont
d.
Sour
ce: J
oint
Lab
our C
omm
issi
oner

273
SNTr
ade
Skill
edSk
illed
Sem
iUn
skill
edGr
ade-
1Gr
ade-
11Sk
illed
12
34
56
1Br
icks
Kiln
sRs
.235
/--
Rs.2
10/-
Rs.1
76/-
2Au
tom
obile
s w
orks
hop
Rs.2
35/-
-Rs
.210
/-Rs
.176
/-3
Prin
ting
Pres
sRs
.235
/--
Rs.2
10/-
Rs.1
76/-
4Ho
tel &
Res
taur
ant
Rs.2
35/-
-Rs
.210
/-Rs
.176
/-5
Bam
boo,
Pul
p &
Pape
r & F
ores
tRs
.235
/--
Rs.2
10/-
Rs.1
76/-
6Al
umin
um In
dust
ryRs
.235
/--
Rs.2
10/-
Rs.1
76/-
7Ha
ndlo
oms,
Wea
ving
& H
andi
craf
tsRs
.235
/--
Rs.2
10/-
Rs.1
76/-
8Di
still
ery
Units
Rs.2
35/-
-Rs
.210
/-Rs
.176
/-9
Woo
den
Furn
iture
Wor
ksRs
.235
/--
Rs.2
10/-
Rs.1
76/-
10Ci
nem
a Un
itsRs
.235
/--
Rs.2
10/-
Rs.1
76/-
11Co
ffee,
Tea
, Rub
ber p
lant
atio
nRs
.235
/--
Rs.2
10/-
Rs.1
76/-
12Pl
ywoo
d In
dust
ryRs
.235
/--
Rs.2
10/-
Rs.1
76/-
13So
ap &
Can
dle
Units
Rs.2
35/-
-Rs
.210
/-Rs
.176
/-14
Load
ing
& un
load
ing
Rs.2
35/-
-Rs
.210
/-Rs
.176
/-15
Hair
Cutti
ng &
Dre
ssin
gRs
.235
/--
Rs.2
10/-
Rs.1
76/-
16Ri
ce, O
il, F
lour
& D
al M
ills
Rs.2
35/-
-Rs
.210
/-Rs
.176
/-17
Agric
ultu
reRs
.235
/--
Rs.2
10/-
Rs.1
76/-
Tabl
e No
. 29.
4 : T
he M
inim
um R
ate
of W
ages
Und
er 3
7 Sc
hedu
le o
f Em
ploy
men
t as
on 1
St A
pril
2019
to 3
1St M
arch
202
0
274
18Bu
ildin
g &
Othe
r Con
stru
ctio
n &
Mai
nten
ance
of R
oad
Rs.2
35/-
-Rs
.210
/-Rs
.176
/-19
Publ
ic M
otor
Tra
nspo
rtRs
.235
/--
Rs.2
10/-
Rs.1
76/-
20Sa
w M
ills
& Ti
mbe
rs In
dust
ryRs
.235
/--
Rs.2
10/-
Rs.1
76/-
21Sh
ops
& Co
mm
erci
al E
stab
lishm
ents
, Hos
pita
ls &
Nur
sing
Hom
eRs
.235
/--
Rs.2
10/-
Rs.1
76/-
22Sa
les
of A
utom
obile
s/ th
ree
whe
eler
s/ tw
o w
heel
ers
Rs.2
35/-
-Rs
.210
/-Rs
.176
/-23
Tailo
ring,
Stit
chin
g &
Embr
oide
ry E
stab
lishm
ent
Rs.2
35/-
-Rs
.210
/-Rs
.176
/-24
Chem
ical
Indu
stry
Rs.2
35/-
-Rs
.210
/-Rs
.176
/-25
Petro
l & D
iese
l Oil
Pum
pRs
.235
/--
Rs.2
10/-
Rs.1
76/-
26Ce
men
t Con
cret
e Pi
pes
Rs.2
35/-
-Rs
.210
/-Rs
.176
/-27
Non-
Ferr
ous
Met
al R
ellin
g &
Stee
l Fab
ricat
ing
Indu
strie
sRs
.235
/--
Rs.2
10/-
Rs.1
76/-
28Ce
men
t Fac
torie
s &
Othe
r Cem
ent P
rodu
cts
Rs.2
35/-
-Rs
.210
/-Rs
.176
/-29
Mot
or B
ody
Build
ers
Rs.2
35/-
-Rs
.210
/-Rs
.176
/-30
Tyre
Ser
vice
Rs.2
35/-
-Rs
.210
/-Rs
.176
/-31
Ice
& M
ilk P
rodu
cts
Rs.2
35/-
-Rs
.210
/-Rs
.176
/-32
Canv
as In
dust
ryRs
.235
/--
Rs.2
10/-
Rs.1
76/-
33Ba
kery
& B
iscu
it In
dust
ryRs
.235
/--
Rs.2
10/-
Rs.1
76/-
34La
undr
y &
Was
hing
Clo
thes
Rs.2
35/-
-Rs
.210
/-Rs
.176
/-35
Khan
sari
Suga
r Fac
torie
sRs
.235
/--
Rs.2
10/-
Rs.1
76/-
36St
one
Brea
king
/ Sto
ne C
rush
ing
Rs.2
35/-
-Rs
.210
/-Rs
.176
/-37
Tele
com
mun
icat
ion
Esta
blis
hmen
tsRs
.235
/--
Rs.2
10/-
Rs.1
76/-
38Da
iry, P
igge
ry &
Pou
ltry
Farm
Rs.2
35/-
-Rs
.210
/-Rs
.176
/-

275
Sour
ce: J
oint
Lab
our C
omm
issi
oner
39Ho
rticu
lture
Ope
ratio
nRs
.235
/--
Rs.2
10/-
Rs.1
76/-
40Se
ricul
ture
Ope
ratio
nRs
.235
/--
Rs.2
10/-
Rs.1
76/-
41M
anuf
actu
re o
f Bev
erag
es &
Min
eral
Wat
erRs
.235
/--
Rs.2
10/-
Rs.1
76/-
42Kh
adi &
Vill
age
Indu
strie
s Rs
.235
/--
Rs.2
10/-
Rs.1
76/-
43Pa
thol
ogic
al L
abor
ator
ies
Rs.2
35/-
-Rs
.210
/-Rs
.176
/-44
LPG
Dist
ribut
ion
Rs.2
35/-
-Rs
.210
/-Rs
.176
/-45
Priv
ate
Tran
spor
tRs
.235
/--
Rs.2
10/-
Rs.1
76/-
46Hy
dro
Elec
tric
Proj
ect
Rs.2
35/-
-Rs
.210
/-Rs
.176
/-47
Tube
Wel
l Sin
gkin
gRs
.235
/--
Rs.2
10/-
Rs.1
76/-
48Pr
ivat
e Te
achi
ng/ C
oach
ing
Trai
ning
Inst
itutio
nRs
.235
/--
Rs.2
10/-
Rs.1
76/-
49Re
nted
Ser
vice
like
Ten
t, Ch
air e
tc. C
rock
ery
& Ho
use
Hold
Goo
dsRs
.235
/--
Rs.2
10/-
Rs.1
76/-
50Re
pairi
ng o
f Ele
ctric
al &
Ele
ctro
n Go
ods
Rs.2
35/-
-Rs
.210
/-Rs
.176
/-51
Loca
l Aut
horit
ies
Rs.2
35/-
-Rs
.210
/-Rs
.176
/-52
Fact
orie
s No
t els
ewhe
re c
lass
ified
Rs.2
35/-
-Rs
.210
/-Rs
.176
/-53
Sem
i-Gov
t. Au
thor
ityRs
.235
/--
Rs.2
10/-
54Ca
sual
/ Mus
ter R
oll W
orke
rs in
all
Govt
. Dep
artm
ents
Rs.2
35/-
-Rs
.210
/-

276
SN District Amount realised from compounding
2018-191 2 31 Kohima 5,0002 Dimapur 1393003 Phek 5,0004 Mokokchung -5 Wokha 12,0006 Zunheboto 17,5007 Tuensang 40008 Mon 1,000
Total 183,800
SN Source 2019-201 2 31 Verification/ Stamping Fee 19017852 Compounding Fines 1838003 Dealership & Repairer Licence Fee 2,000
4Packers Registered Under(Packaged)Commodities Rules 1977
3,000
Total 2090585
Table No. 29.5: Compounding Fees (in Rs.) realized by the Legal Metrology & Consumer Protection Department
Table No. 29.6: Annual Fees (in Rs.) realised by the Legal Metrology & Consumer Protection Department
Source : Addl. Controller of Legal Metrology (W & M) & Consumer Protection
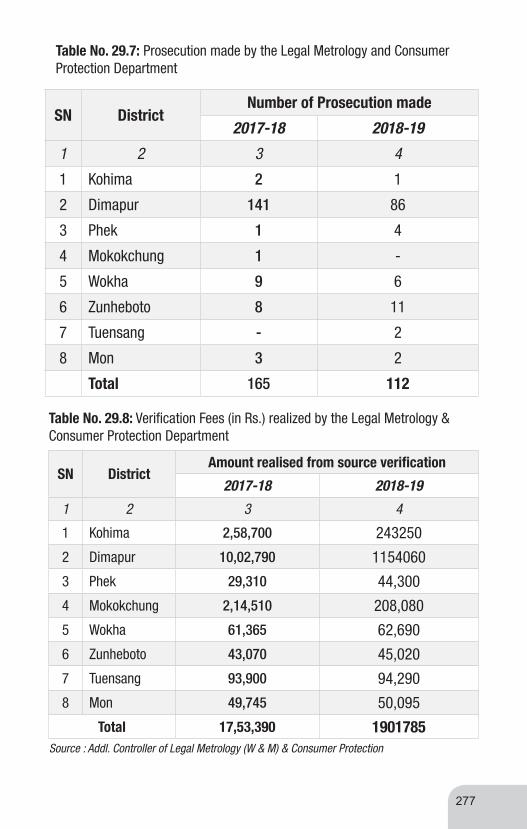
277
SN DistrictNumber of Prosecution made
2017-18 2018-19
1 2 3 4
1 Kohima 2 1
2 Dimapur 141 86
3 Phek 1 4
4 Mokokchung 1 -
5 Wokha 9 6
6 Zunheboto 8 11
7 Tuensang - 2
8 Mon 3 2
Total 165 112
Table No. 29.7: Prosecution made by the Legal Metrology and Consumer Protection Department
SN DistrictAmount realised from source verification
2017-18 2018-19
1 2 3 4
1 Kohima 2,58,700 243250
2 Dimapur 10,02,790 1154060
3 Phek 29,310 44,300
4 Mokokchung 2,14,510 208,080
5 Wokha 61,365 62,690
6 Zunheboto 43,070 45,020
7 Tuensang 93,900 94,290
8 Mon 49,745 50,095
Total 17,53,390 1901785
Table No. 29.8: Verification Fees (in Rs.) realized by the Legal Metrology & Consumer Protection Department
Source : Addl. Controller of Legal Metrology (W & M) & Consumer Protection

278
SN District
No. of Village having
PHED water Connection
No. of Village fully Covered
by PHED Water Connection
No. of Village Partially Covered by PHED Water
Connection1 Dimapur 241 128 113
2 Kiphire 98 35 633 Kohima 110 85 254 Longleng 50 26 245 Mokokchung 114 61 536 Mon 138 53 857 Peren 103 45 588 Phek 119 88 31
9 Tuensang 133 57 7610 Wokha 153 65 8811 Zunheboto 191 64 127Total 1450 707 743
Table No. 29.9 : Number of Village/ Habitation covered by Drinking Water Supply and Population Covered 2018-19
SN DistrictNo. of Village having PHED
water Connection
No. of Village fully Covered by PHED Water Connection
No. of Village Partially Covered by PHED Water
Connection
1 Dimapur 241 28 213
2 Kiphire 98 10 88
3 Kohima 110 22 88
4 Longleng 50 8 42
5 Mokokchung 114 11 103
6 Mon 138 20 118
7 Peren 103 24 79
8 Phek 119 48 71
9 Tuensang 133 15 118
10 Wokha 153 16 137
11 Zunheboto 191 17 174
Total 1450 219 1231
Table No. 29.10 : Numbers of Village/Habitation Covered by Drinking Water Supply and Papulation Covered During 2019-20
Source :Chief engener PHED, Kohima

279
SN Description Remarks
Newspaper Dailies FrequencyEnglish
1 Nagaland post Daily2 The Morung Express Daily3 Eastern Mirror Daily4 Nagaland Page Daily5 Nagaland Today Daily
VERNACULAR1 Capi (Tenyidie) Daily2 Tir Yimyim (Ao) Daily3 Ao Milen (Ao) Daily
4 Sumi Kukuputsa Kiyephi (Sumi) DailyNAGAMESE1 Nagamese Khobor Daily
Table No. 29.11 : Newspaper in Nagaland (as on 30th November 2019)
Source: Directorate of Information & Public Relation

280
Source: Social Security and Welfare Services
SN Name of Schemes 2019-20
1 2 4
Child Welfare Programme.
a) Integrated Child Development Services Scheme (ICDS)
(i) D.P.O 9
ii) No. of Integrated Child Development Project. 60
iii) State Children Library Closed
iv) Children’s Home -
v) No. of Angawadi Centres. 3980
1
vi) Angawadi Training Centre (AWTC)/(MTC). 1
b) Special Nutrition Programme.
i) Angawadi Centres. 3980
ii) No. of Beneficiaries.320045(6 months-6
years)45040 (Pregnant & Lactating mother)
c) Prevention & Control of Juvenile Social Mal-Adjustment.
i) Special Home & Observation Home. 13
ii) No. of Juvenile inmates (below 18 years). 8
2
Welfare Programme for Senior Citizens.
(1) DWO 8
ii) State Old Age Pension Scheme (SOAP).Converted into IGNOAPS
under (NSAP)
(iii) National Social Assistance Programme(NSAP) 63,140
(iv) Indira Gandhi Nation Old Age Pension Scheme 60-79 (IGNOAPS).
51,750
v) Indira Gandhi Nation Old Age Pension Scheme 80 years and above (IGNOAPS).
5,650
3
Welfare Programme for Persons with Disabilities.
i) Scholarship to disabled student. 208(Cl. A-8)
ii) No. of totally blind persons getting monthly financial assistance.
1625
iii) No. of disabled persons getting monthly financial assistance.
3166 (State non-Plan)
iv) Indra Gandhi National Disability Pension Scheme (IGNDPS)
1,276 (CSS - IGNDPS)
4 i) Eklavya Model Residential School (EMRS).Taken over by the
Planning Dept. since 2016
Table No. 29.12: Social Security and Welfare Services in Nagaland
N.BCU = Cummulative Unit., BN = Beneficiaries.

281
SN District Urban Rural Total
1 Dimapur 68 227 295
2 Kiphire 20 81 101
3 Kohima 38 100 138
4 Longleng 14 45 59
5 Mokokchung 31 101 132
6 Mon 21 122 143
7 Peren 2 98 100
8 Phek 27 103 130
9 Tuensang 35 115 150
10 Wokha 15 139 154
11 Zunheboto 24 192 216
Total 295 1323 1618
Table No. 29.13: District Wise Fair Price Shop Report during 2018-19
Source: Directorate of Food and Civil Supplies
SN District Urban Rural Total1 Dimapur 67 228 2952 Kiphire 20 81 1013 Kohima 38 100 1384 Longleng 14 45 595 Mokokchung 31 101 1326 Mon 21 122 1437 Peren 2 98 1008 Phek 30 103 1339 Tuensang 33 117 15010 Wokha 15 139 15411 Zunheboto 24 192 216
Total 295 1326 1621
Table No. 29.14: District Wise Fair Price Shop Report during 2019-20
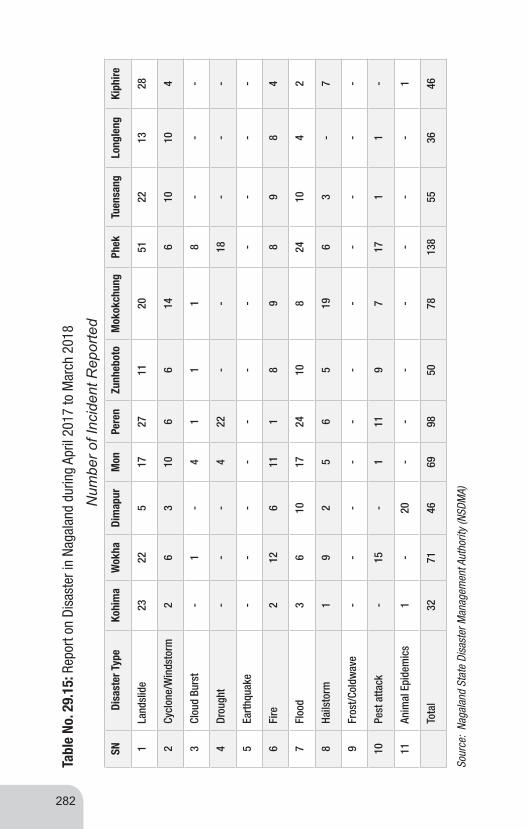
282
SNDi
sast
er T
ype
Kohi
ma
Wok
haDi
map
urM
onPe
ren
Zunh
ebot
oM
okok
chun
gPh
ekTu
ensa
ngLo
ngle
ngKi
phire
1La
ndsl
ide
2322
517
2711
2051
2213
28
2Cy
clon
e/W
inds
torm
26
310
66
146
1010
4
3Cl
oud
Burs
t-
1-
41
11
8-
--
4Dr
ough
t-
--
422
--
18-
--
5Ea
rthq
uake
--
--
--
--
--
-
6Fi
re2
126
111
89
89
84
7Fl
ood
36
1017
2410
824
104
2
8Ha
ilsto
rm1
92
56
519
63
-7
9Fr
ost/C
oldw
ave
--
--
--
--
--
-
10Pe
st a
ttack
-15
-1
119
717
11
-
11An
imal
Epi
dem
ics
1-
20-
--
--
--
1
Tota
l32
7146
6998
5078
138
5536
46
Sour
ce:
Naga
land
Sta
te D
isas
ter M
anag
emen
t Aut
horit
y (N
SDM
A)
Tabl
e No
. 29.
15: R
epor
t on
Disa
ster
in N
agal
and
durin
g Ap
ril 2
017
to M
arch
201
8
Num
ber o
f Inc
iden
t Rep
orte
d

283
Disa
ster
Typ
eKo
him
aW
okha
Dim
apur
Mon
Pere
nZu
nheb
oto
Mok
okch
ung
Phek
Tuen
sang
Long
leng
Kiph
ire
Clou
d Pu
rst
10
00
01
23
00
0
Cycl
one/
Win
dsto
rm1
173
95
2512
18
143
Drou
ght
10
110
30
21
03
0
Earth
quak
e0
00
00
00
00
00
Fire
716
1111
76
146
146
1
Floo
d / F
lash
Flo
od14
2216
79
2915
2817
173
Fros
t/Col
dwav
e0
00
51
10
00
00
Hails
torm
06
10
16
120
00
0
Land
slid
e28
276
1414
4721
3724
218
Pest
atta
ck1
150
1212
111
101
140
Soil
Eros
ion
01
00
00
00
00
0
Tota
l53
104
3868
5211
689
8664
7515
Sour
ce: N
agal
and
Stat
e Di
sast
er M
anag
emen
t Aut
horit
y (N
SDM
A)
Tabl
e No
. 29.
16: R
epor
t on
Disa
ster
in N
agal
and
Durin
g Ap
ril 2
018-
Mar
ch 2
019.
Num
ber o
f Inc
iden
t Rep
orte
d

284
Sour
ce:
Naga
land
Sta
te D
isas
ter M
anag
emen
t Aut
horit
y (N
SDM
A)
SNDi
sast
er T
ype
Kohi
ma
Wok
haDi
map
urM
onPe
ren
Zunh
ebot
oM
okok
chun
gPh
ekTu
ensa
ngLo
ngle
ngKi
phire
1La
ndsl
ide
182
8743
146
203
314
205
1228
287
8112
4
2Cy
clon
e/W
inds
torm
311
710
571
771
7915
5060
73
3Cl
oud
Burs
t-
3-
111
12
19-
--
4Dr
ough
t-
--
5215
3-
-81
--
-
5Ea
rthq
uake
--
--
--
--
--
-
6Fi
re4
4470
671
2720
1326
827
7Fl
ood
1719
210
211
182
9723
787
140
410
8Ha
ilsto
rm2
203
733
244
214
813
-36
7
9Fr
ost/C
oldw
ave
--
--
--
--
--
-
10Pe
st a
ttack
-53
-1
6622
4826
114
-
11An
imal
Epi
dem
ics
44-
37-
--
--
--
6
Tota
l25
234
346
856
664
677
659
121
7751
716
760
7
Tabl
e No
. 29.
17 :
Repo
rt on
Dis
aste
r in
Naga
land
dur
ing
April
201
7 to
Mar
ch 2
018
Num
ber o
f Fam
ily A
ffect
ed

285
Disa
ster
Typ
eKo
him
aW
okha
Dim
apur
Mon
Pere
nZu
nheb
oto
Mok
okch
ung
Phek
Tuen
sang
Long
leng
Kiph
ire
Clou
d Pu
rst
10
00
01
33
00
0
Cycl
one/
Win
dsto
rm1
9350
3515
6824
03
6346
14
Drou
ght
10
196
70
41
07
0
Earth
quak
e0
00
00
00
00
00
Fire
723
2441
236
377
3425
3
Floo
d / F
lash
Flo
od87
261
119
123
343
153
7117
3059
117
010
4
Fros
t/Col
dwav
e0
00
591
20
00
00
Hails
torm
013
40
174
117
00
00
Land
slid
e83
725
511
177
110
375
104
880
353
140
57
Pest
atta
ck1
620
276
891
3210
111
20
Soil
Eros
ion
01
00
00
00
00
0
Tota
l93
570
820
980
758
968
060
826
3410
4250
017
8
Sour
ce: N
agal
and
Stat
e Di
sast
er M
anag
emen
t Aut
horit
y (N
SDM
A)
Tabl
e No
. 29.
18: R
epor
t on
Disa
ster
in N
agal
and
Durin
g Ap
ril 2
018-
Mar
ch 2
019.
Num
ber o
f Affe
cted
Fam
ily

286
Source: Directorate of Prison
SN District Central Jail District Jail Sub-Jail Total1 2 3 4 5 61 Kohima 0 1 0 12 Dimapur 1 1 0 23 Peren 0 1 0 14 Phek 0 1 0 15 Mokokchung 0 1 0 16 Wokha 0 1 0 17 Zunheboto 0 1 0 18 Tuensang 0 1 0 19 Kiphire 0 1 0 110 Longleng 0 0 0 011 Mon 0 1 0 1Total 1 10 0 11
Table No. 29.19: Number of jails during 2020
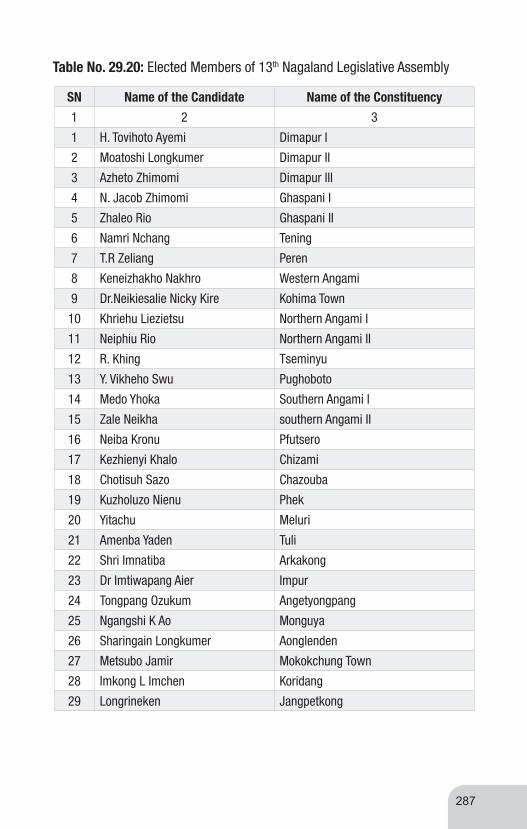
287
SN Name of the Candidate Name of the Constituency
1 2 3
1 H. Tovihoto Ayemi Dimapur I
2 Moatoshi Longkumer Dimapur II
3 Azheto Zhimomi Dimapur III
4 N. Jacob Zhimomi Ghaspani I
5 Zhaleo Rio Ghaspani II
6 Namri Nchang Tening
7 T.R Zeliang Peren
8 Keneizhakho Nakhro Western Angami
9 Dr.Neikiesalie Nicky Kire Kohima Town
10 Khriehu Liezietsu Northern Angami I
11 Neiphiu Rio Northern Angami II
12 R. Khing Tseminyu
13 Y. Vikheho Swu Pughoboto
14 Medo Yhoka Southern Angami I
15 Zale Neikha southern Angami II
16 Neiba Kronu Pfutsero
17 Kezhienyi Khalo Chizami
18 Chotisuh Sazo Chazouba
19 Kuzholuzo Nienu Phek
20 Yitachu Meluri
21 Amenba Yaden Tuli
22 Shri Imnatiba Arkakong
23 Dr Imtiwapang Aier Impur
24 Tongpang Ozukum Angetyongpang
25 Ngangshi K Ao Monguya
26 Sharingain Longkumer Aonglenden
27 Metsubo Jamir Mokokchung Town
28 Imkong L Imchen Koridang
29 Longrineken Jangpetkong
Table No. 29.20: Elected Members of 13th Nagaland Legislative Assembly

30 Temjen Imna Along Alongtaki
31 Kazheto Kinimi Akuluto
32 Picto Atoizu
33 H Khehovi Suruhoto
34 Pukhayi Aghunato
35 K. Tokugha Sukhalu Zunheboto
36 G. Kaito Aye Satakha
37 Yanthungo Patton Tyui
38 Dr. Chumben Murry Wokha
39 Mhathung Yanthan Sanis
40 Mmhonlumo Kikon Bhandari
41 P. Paiwang Konyak Tizit
42 Shri. Y.M.Yollow Konyak Wakching
43 Noke Tapi
44 Pohwang Konyak Phomching
45 C.L John Tehok
46 N. Thongwang Konyak Mon Town
47 Eshak Konyak Aboi
48 E. E. Pangteang Moka
49 B. S. Nganlang Phom Tamlu
50 S Pangnyu Phom Longleng
51 C.M. Chang Noksen
52 Muthingnyuba Sangtam Longkhim/Chare
53 Toyang Changkong Chang Tuensang I
54 Kejong Chang Tuensang II
55 N. Bongkhao Konyak Tobu
56 H. Haiying Noklak
57 L.Khumo Khiamniungan Thonoknyu
58 Toshi Wungtung Shamator/Chessore
59 V. Kashiho Sangtam Seyochung/Sitimi
60 T. Yangseo Sangtam Pungro/Kiphire
Source : Office of the Chief Electoral Officer, Nagaland, Kohima
288


Related Documents