Carbon Steel Corrosion in Anoxic Alkaline Solution Xihua (Shē-wă) He 1 and Tae Ahn 2 1 Center for Nuclear Waste Regulatory Analyses (CNWRA ® ) Southwest Research Institute ® San Antonio, Texas 2 U.S. Nuclear Regulatory Commission (NRC) Washington, DC NACE 2015, Dallas, Texas March 15–19, 2015

Welcome message from author
This document is posted to help you gain knowledge. Please leave a comment to let me know what you think about it! Share it to your friends and learn new things together.
Transcript
Carbon Steel Corrosion in Anoxic Alkaline Solution
Xihua (Shē-wă) He1 and Tae Ahn2
1Center for Nuclear Waste Regulatory Analyses (CNWRA ®)Southwest Research Institute®
San Antonio, Texas
2U.S. Nuclear Regulatory Commission (NRC)Washington, DC
NACE 2015, Dallas, TexasMarch 15–19, 2015
2
Outline
Background
Objectives
Experimental approaches
Results and discussion
Summary
Carbon Steel Considered as Candidate Waste Package Material
3
Considered as corrosion allowance materials in several countries, including Switzerland, France, Japan, and CanadaCarbon steel is reported to have low corrosion rates (several micrometers per year) under anoxic to reducing environments related to underground geologic disposal of high-level waste In the supercontainer concept in Belgium’s proposed Boom Clay repository, carbon steel is expected to remain passive in contact with concrete porewater for thousands of yearsHowever, carbon steel has been shown to exhibit active behavior in contact with compacted bentonite
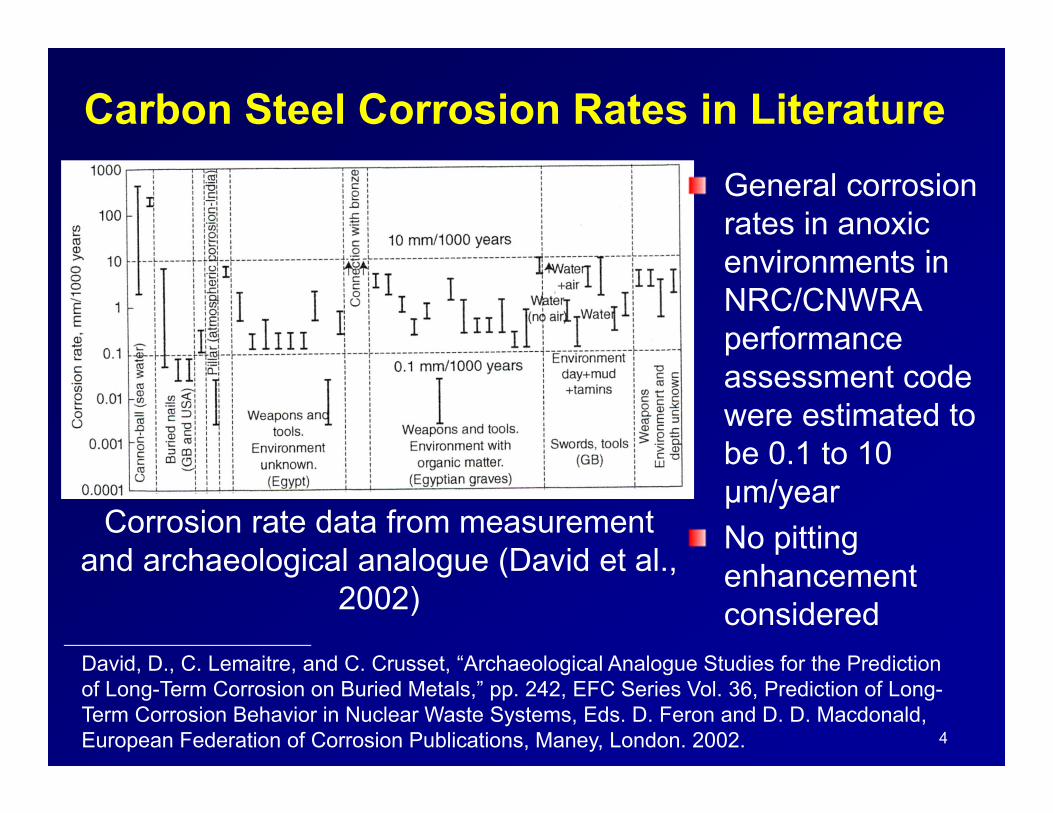
Carbon Steel Corrosion Rates in LiteratureGeneral corrosion rates in anoxic environments in NRC/CNWRA performance assessment code were estimated to be 0.1 to 10 μm/yearNo pitting enhancement considered
4
Corrosion rate data from measurement and archaeological analogue (David et al.,
2002)
David, D., C. Lemaitre, and C. Crusset, “Archaeological Analogue Studies for the Prediction of Long-Term Corrosion on Buried Metals,” pp. 242, EFC Series Vol. 36, Prediction of Long-Term Corrosion Behavior in Nuclear Waste Systems, Eds. D. Feron and D. D. Macdonald, European Federation of Corrosion Publications, Maney, London. 2002.
Objectives
Confirm the low uniform corrosion rates reported in the literature because corrosion rates affect waste package lifetimeEvaluate hydrogen generation and hydrogen absorption because hydrogen affects disposal environmentStudy the effects of chloride, sulfide, and thiosulfate on passive dissolution of carbon steel because they affect waste package material long term performance
5
Experimental Approaches
6
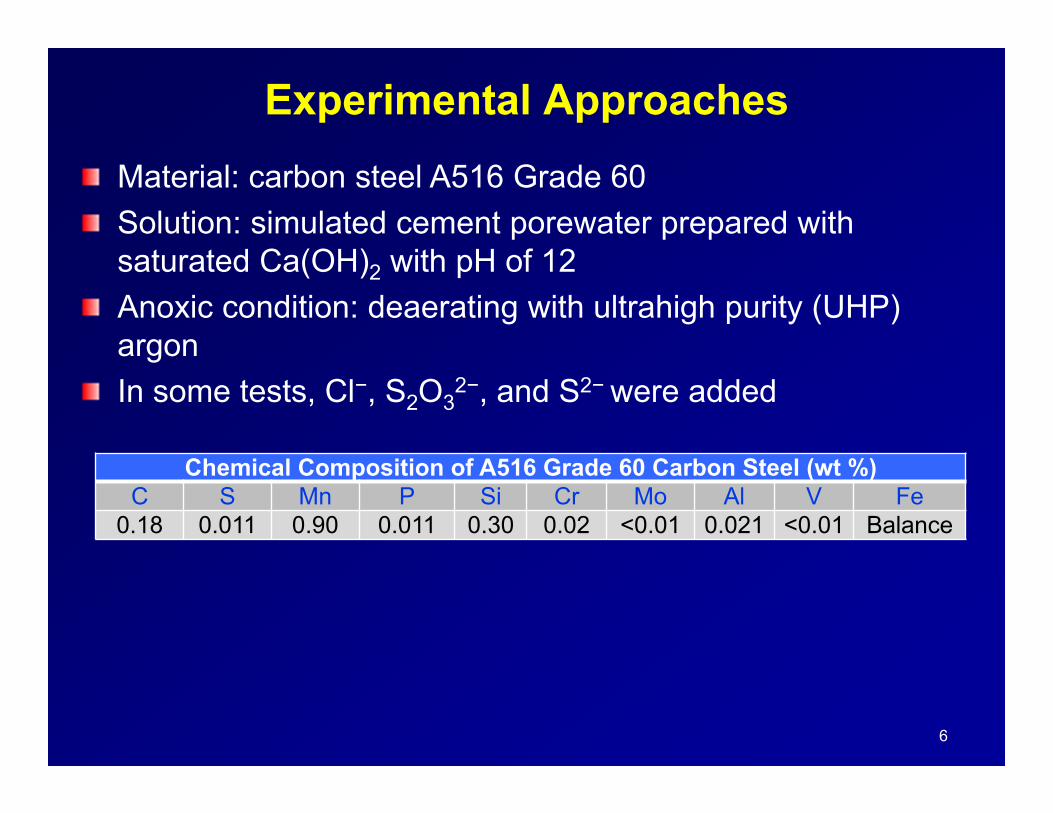
Material: carbon steel A516 Grade 60 Solution: simulated cement porewater prepared with saturated Ca(OH)2 with pH of 12 Anoxic condition: deaerating with ultrahigh purity (UHP) argon In some tests, Cl−, S2O3
2−, and S2− were added
Chemical Composition of A516 Grade 60 Carbon Steel (wt %)C S Mn P Si Cr Mo Al V Fe
0.18 0.011 0.90 0.011 0.30 0.02 <0.01 0.021 <0.01 Balance
Corrosion Rate and Hydrogen Generation Measurements
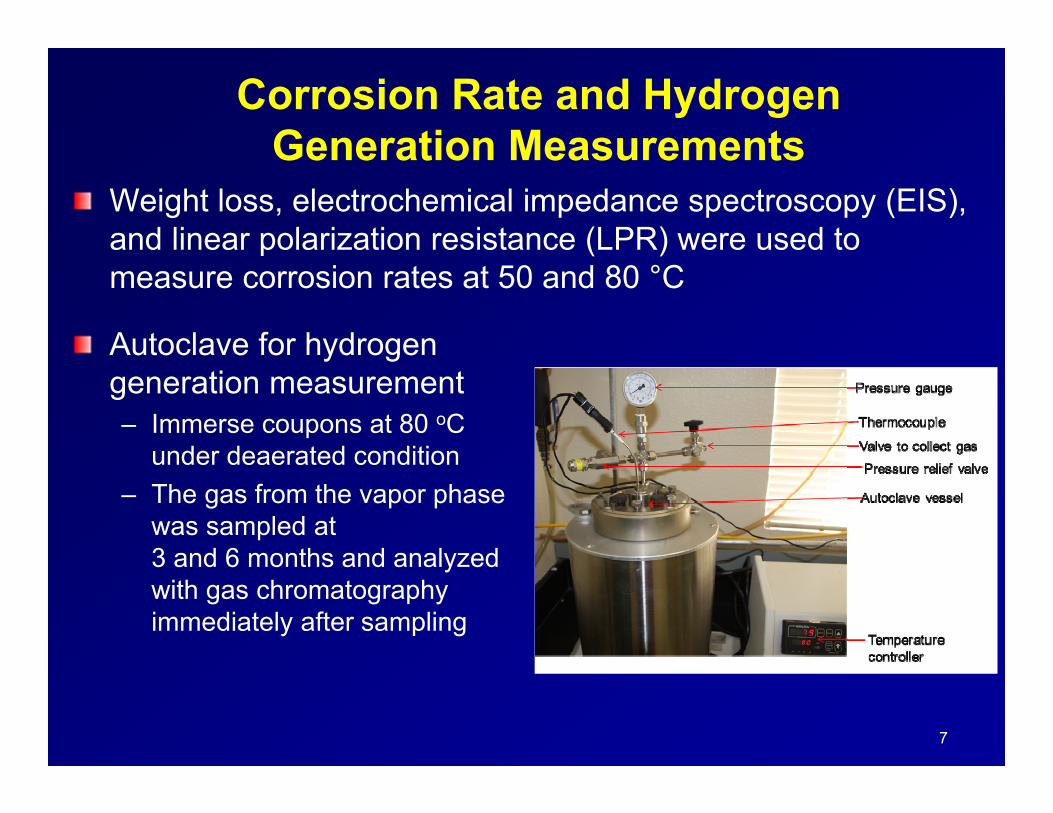
Weight loss, electrochemical impedance spectroscopy (EIS), and linear polarization resistance (LPR) were used to measure corrosion rates at 50 and 80 °C
7
Autoclave for hydrogen generation measurement– Immerse coupons at 80 oC
under deaerated condition– The gas from the vapor phase
was sampled at 3 and 6 months and analyzed with gas chromatography immediately after sampling
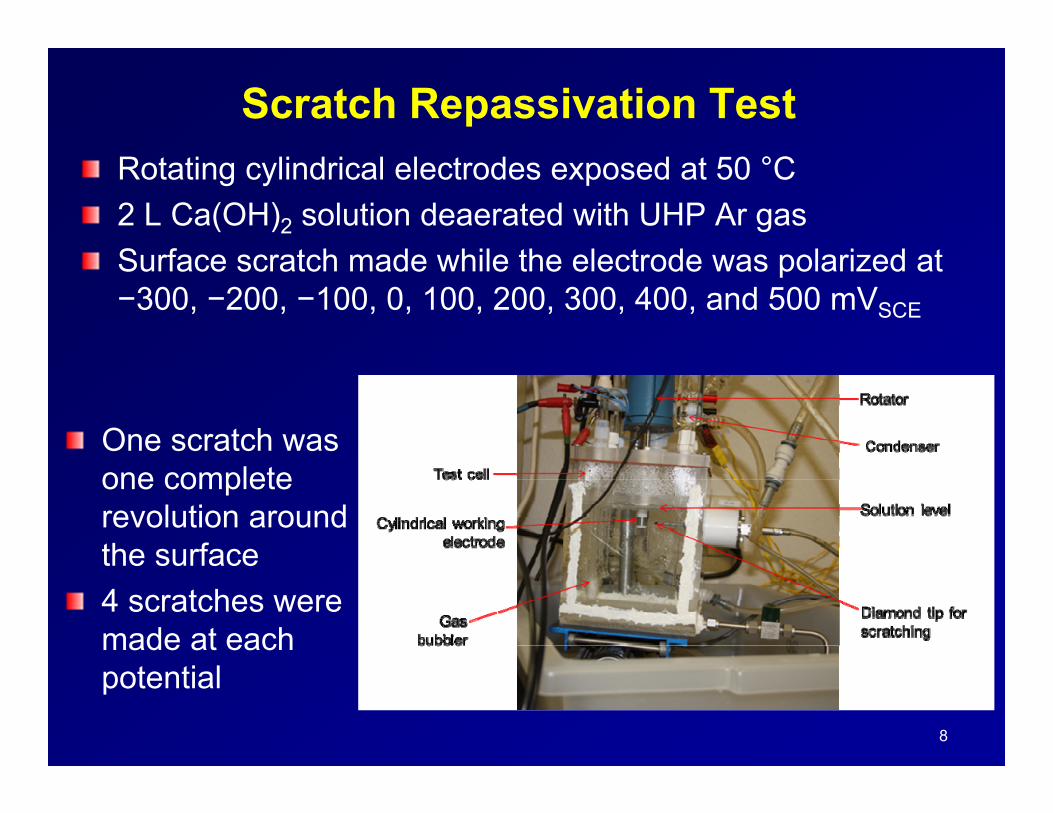
Scratch Repassivation TestRotating cylindrical electrodes exposed at 50 °C 2 L Ca(OH)2 solution deaerated with UHP Ar gasSurface scratch made while the electrode was polarized at −300, −200, −100, 0, 100, 200, 300, 400, and 500 mVSCE
8
One scratch was one complete revolution around the surface4 scratches were made at each potential
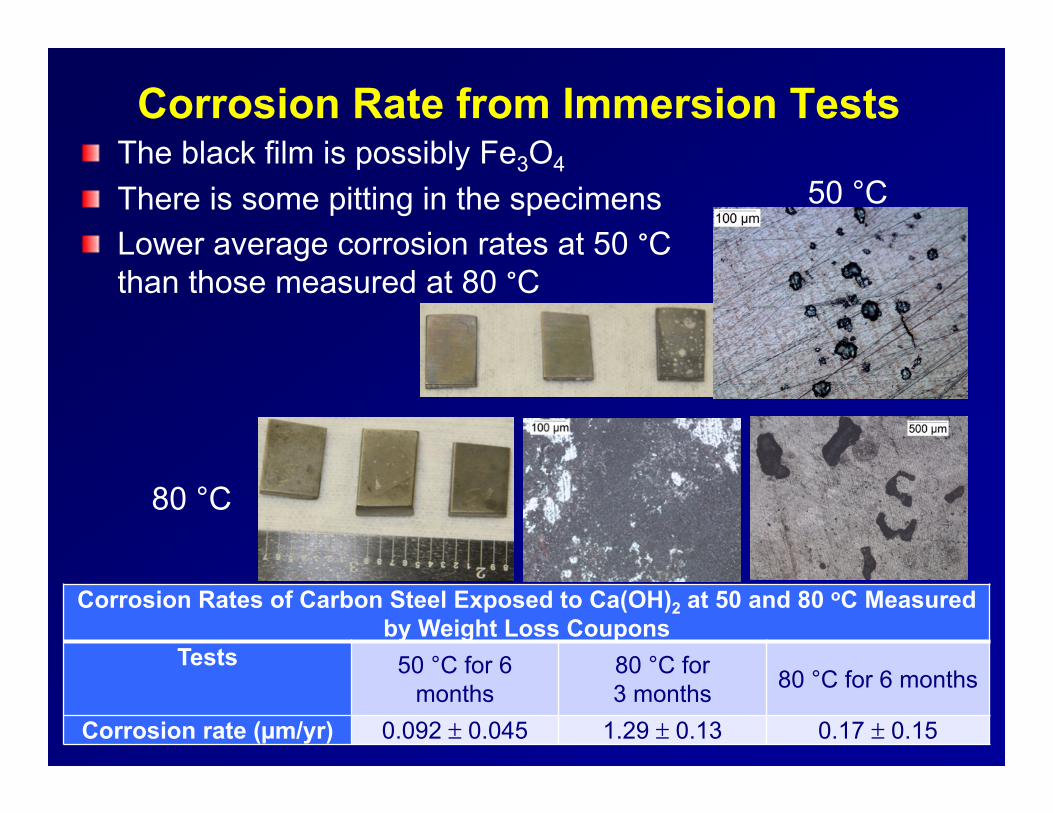
Corrosion Rate from Immersion TestsThe black film is possibly Fe3O4
There is some pitting in the specimensLower average corrosion rates at 50 °C than those measured at 80 °C
9
Corrosion Rates of Carbon Steel Exposed to Ca(OH)2 at 50 and 80 oC Measured by Weight Loss Coupons
Tests 50 °C for 6 months
80 °C for 3 months 80 °C for 6 months
Corrosion rate (µm/yr) 0.092 ± 0.045 1.29 ± 0.13 0.17 ± 0.15
50 °C
80 °C
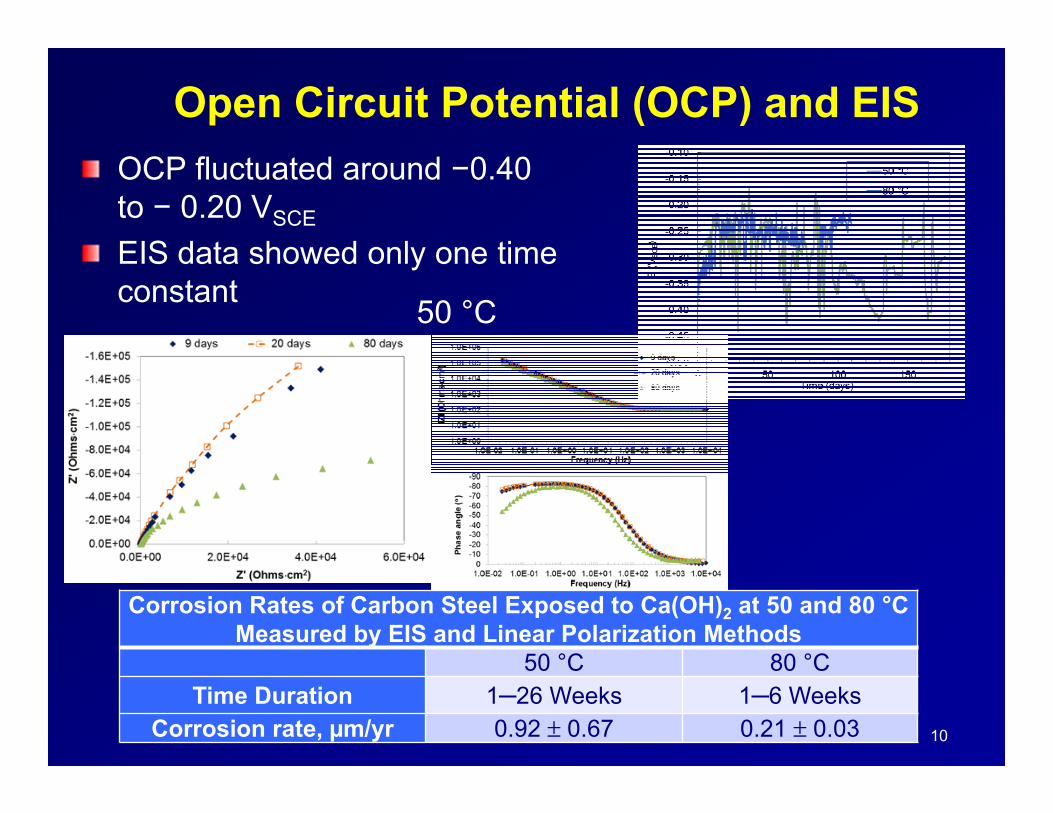
Open Circuit Potential (OCP) and EISOCP fluctuated around −0.40 to − 0.20 VSCE
EIS data showed only one time constant
10
50 °C
Corrosion Rates of Carbon Steel Exposed to Ca(OH)2 at 50 and 80 °C Measured by EIS and Linear Polarization Methods
50 °C 80 °CTime Duration 1─26 Weeks 1─6 Weeks
Corrosion rate, µm/yr 0.92 ± 0.67 0.21 ± 0.03
Hydrogen Generation Analysis
11
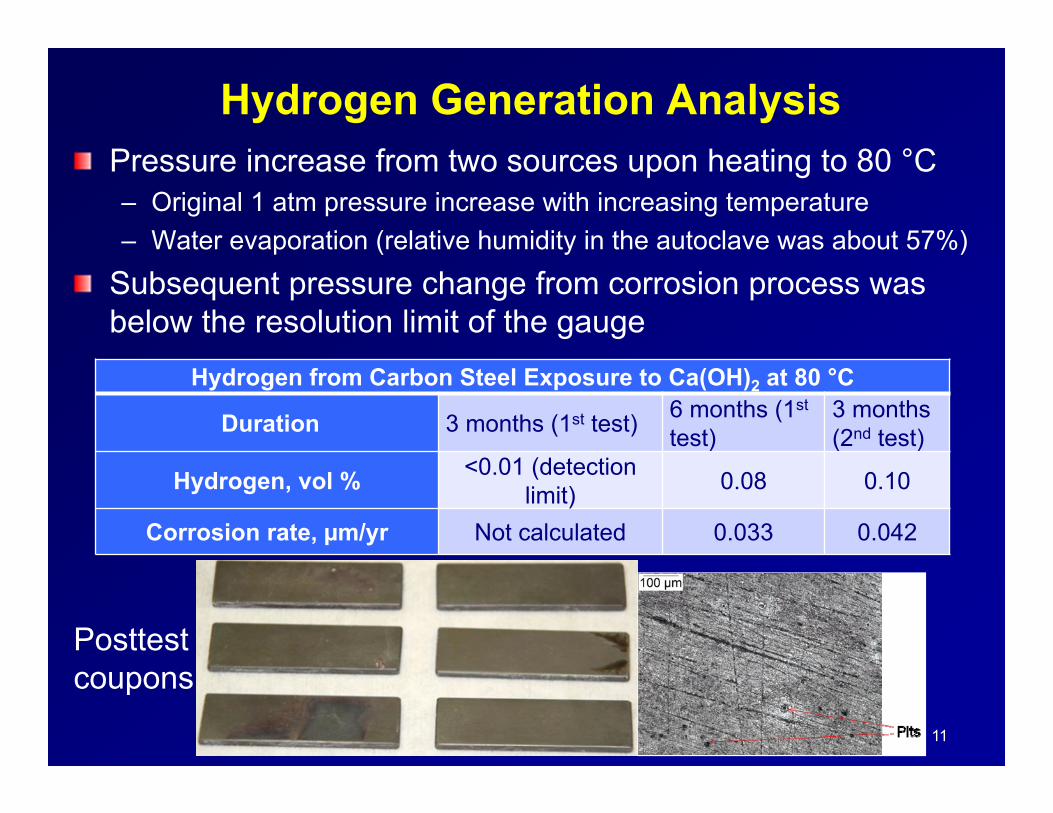
Pressure increase from two sources upon heating to 80 °C – Original 1 atm pressure increase with increasing temperature – Water evaporation (relative humidity in the autoclave was about 57%)
Subsequent pressure change from corrosion process was below the resolution limit of the gauge
Hydrogen from Carbon Steel Exposure to Ca(OH)2 at 80 °C
Duration 3 months (1st test) 6 months (1st
test)3 months (2nd test)
Hydrogen, vol % <0.01 (detection limit) 0.08 0.10
Corrosion rate, µm/yr Not calculated 0.033 0.042
Posttest coupons
Hydrogen Analysis of Posttest Coupons
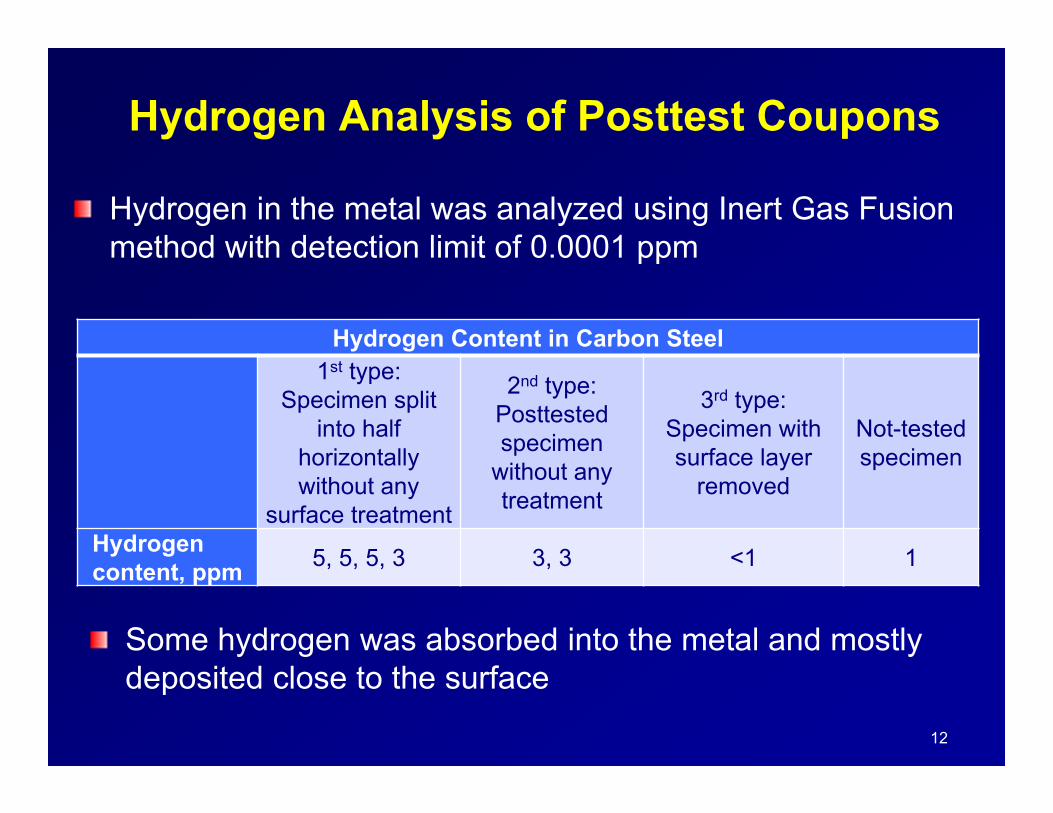
Hydrogen in the metal was analyzed using Inert Gas Fusion method with detection limit of 0.0001 ppm
12
Hydrogen Content in Carbon Steel1st type:
Specimen split into half
horizontally without any
surface treatment
2nd type: Posttested specimen
without any treatment
3rd type: Specimen with surface layer
removed
Not-tested specimen
Hydrogen content, ppm 5, 5, 5, 3 3, 3 <1 1
Some hydrogen was absorbed into the metal and mostly deposited close to the surface
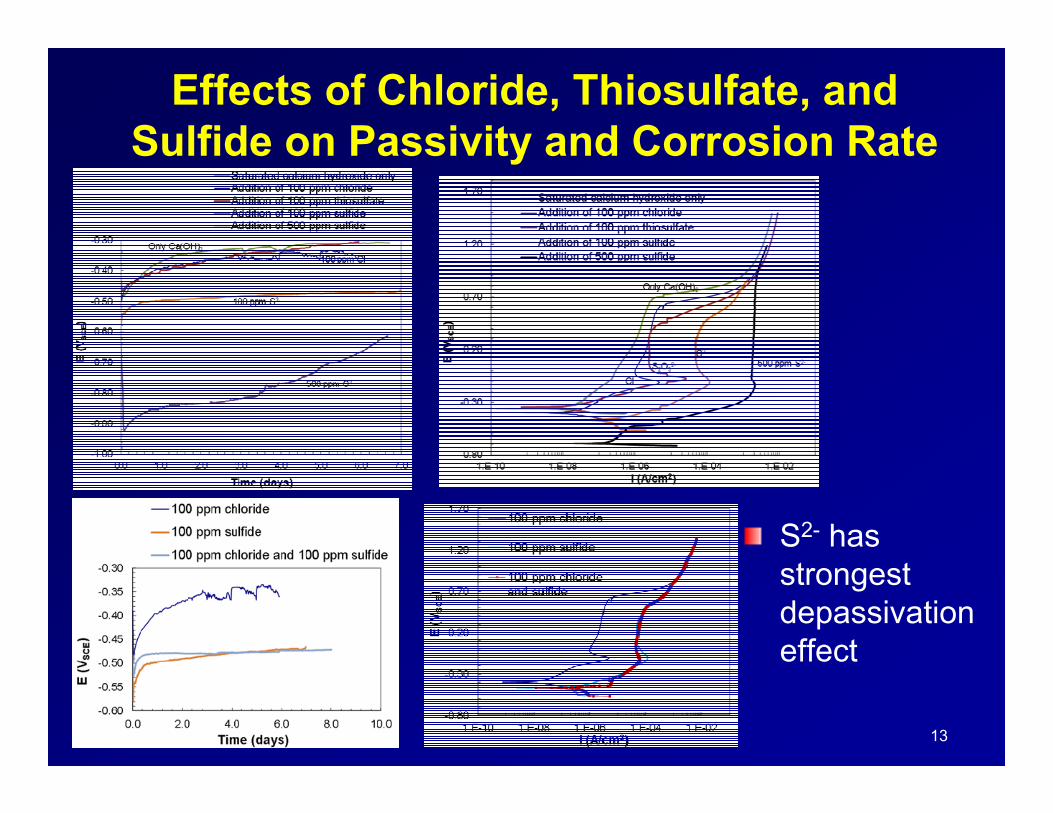
Effects of Chloride, Thiosulfate, and Sulfide on Passivity and Corrosion Rate
13
S2- has strongest depassivation effect
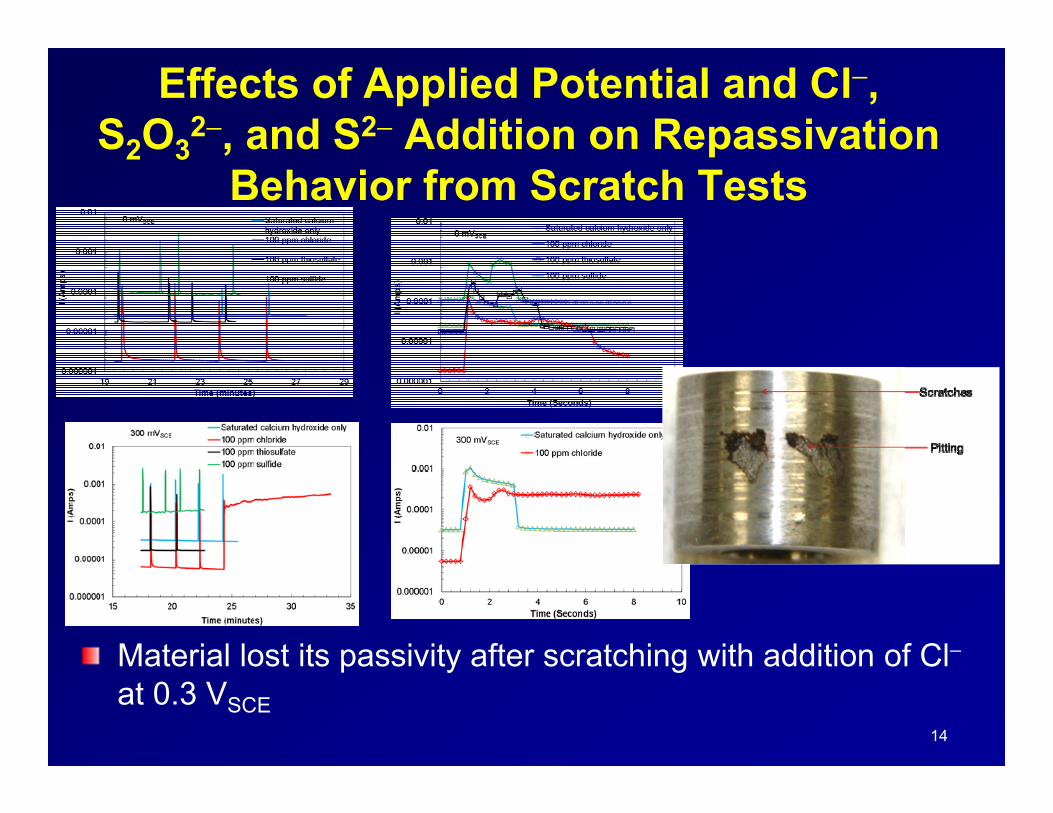
Effects of Applied Potential and Cl−, S2O3
2−, and S2− Addition on Repassivation Behavior from Scratch Tests
14
Material lost its passivity after scratching with addition of Cl−at 0.3 VSCE
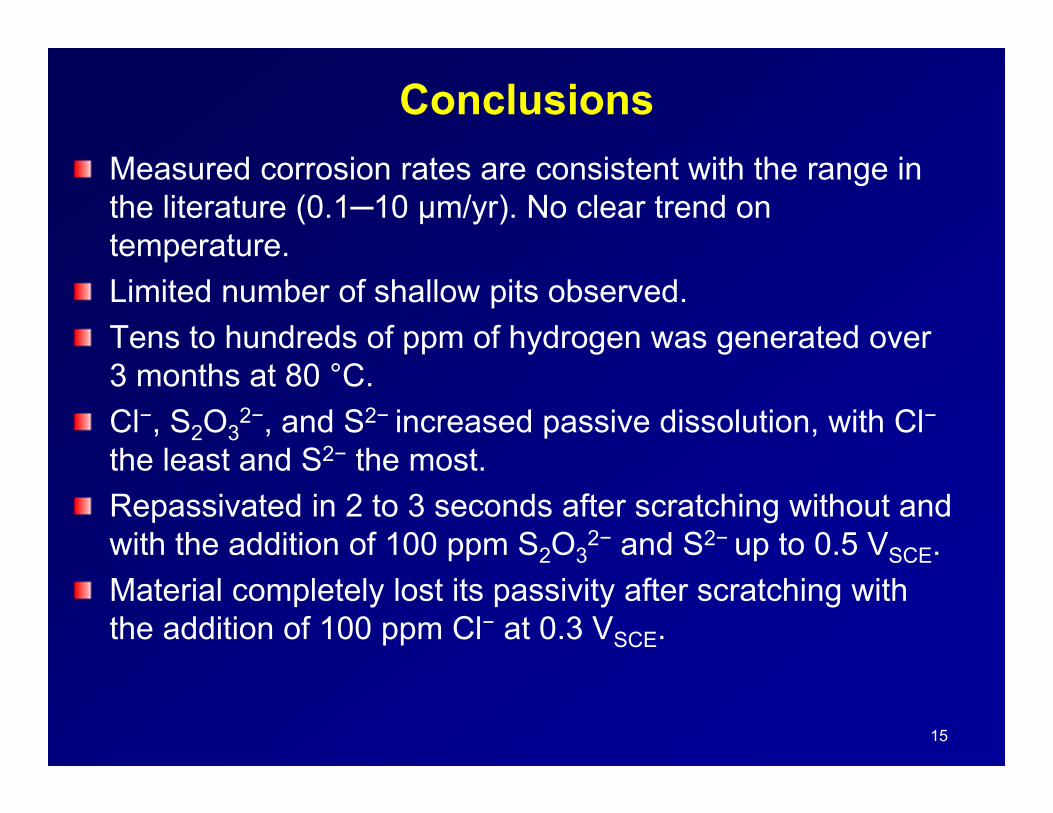
ConclusionsMeasured corrosion rates are consistent with the range in the literature (0.1─10 µm/yr). No clear trend on temperature.Limited number of shallow pits observed.Tens to hundreds of ppm of hydrogen was generated over 3 months at 80 °C.Cl−, S2O3
2−, and S2− increased passive dissolution, with Cl−
the least and S2− the most.Repassivated in 2 to 3 seconds after scratching without and with the addition of 100 ppm S2O3
2− and S2− up to 0.5 VSCE.Material completely lost its passivity after scratching with the addition of 100 ppm Cl− at 0.3 VSCE.
15
16
DisclaimerThis presentation describes work performed by the CNWRA and its contractors for the NRC under Contract No. NRC–HQ–C–02–0089. The activities reported here were performed on behalf of the NRC Office of Nuclear Material Safety and Safeguards. This presentation is an independent product of the CNWRA and does not necessarily reflect the view or regulatory position of the NRC. The NRC staff views expressed herein are preliminary and do not constitute a final judgment or determination of the matters addressed or of the acceptability of any licensing action that may be under consideration at NRC.
Related Documents