N990 Thermal Black in Natural Rubber isolation bushings for improved dynamic performance AEQ-QEG Technico-Commercial meeting November 8, 2017

Welcome message from author
This document is posted to help you gain knowledge. Please leave a comment to let me know what you think about it! Share it to your friends and learn new things together.
Transcript
N990 Thermal Black in Natural Rubber isolation bushings for improved dynamic performance
AEQ-QEG Technico-Commercial meetingNovember 8, 2017
2
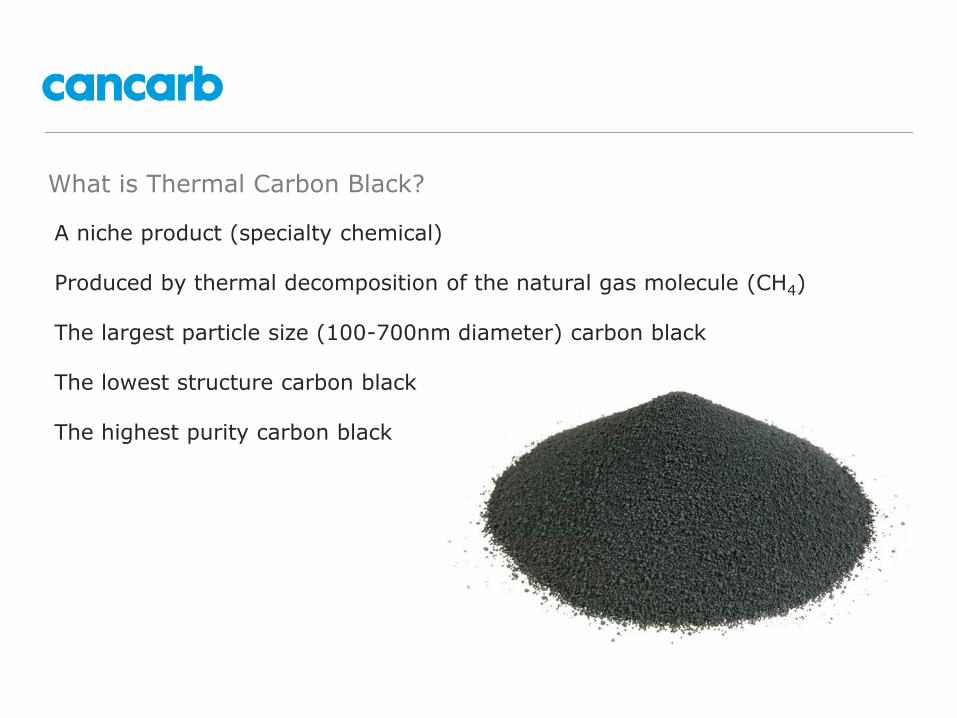
What is Thermal Carbon Black?
A niche product (specialty chemical)
Produced by thermal decomposition of the natural gas molecule (CH4)
The largest particle size (100-700nm diameter) carbon black
The lowest structure carbon black
The highest purity carbon black
0
20
40
60
80
100
120
140
0 20 40 60 80 100 120 140 160
OA
N (
DB
P) A
bsorp
tion
(m
l/1
00
g)
Nitrogen Surface Area (m2/g)
IN
CR
EA
SIN
GS
TU
CTU
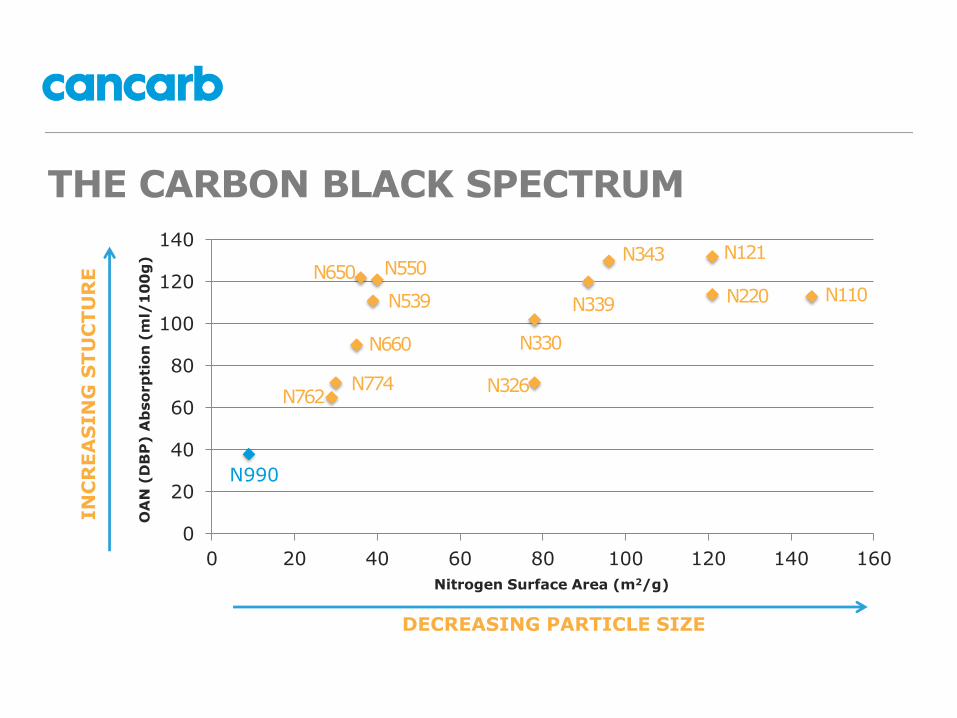
RE N650
N990
N550
N539
N660
N774N762
N343
N339
N330
N326
N121
N220 N110
THE CARBON BLACK SPECTRUM
DECREASING PARTICLE SIZE

THERMAX®
vs FURNACE BLACK GRADES
Particle size diameter
4
N660 (60nm)

THERMAX®
vs FURNACE BLACK GRADES
High Structure Moderate Structure Low Structure
N550 N762 N990
5
N660
6
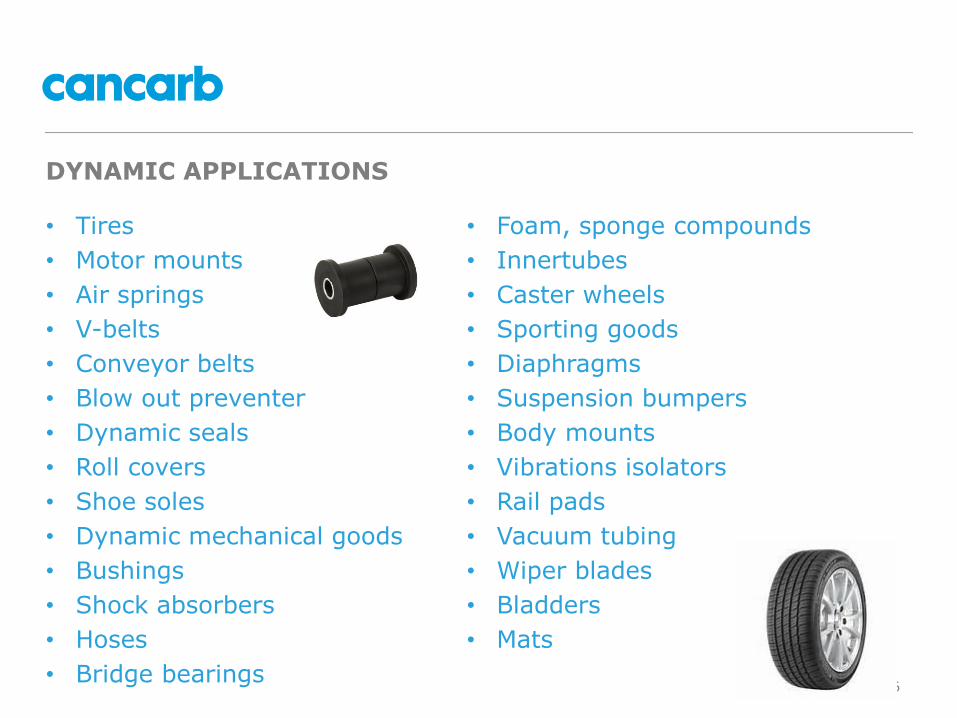
DYNAMIC APPLICATIONS
• Tires
• Motor mounts
• Air springs
• V-belts
• Conveyor belts
• Blow out preventer
• Dynamic seals
• Roll covers
• Shoe soles
• Dynamic mechanical goods
• Bushings
• Shock absorbers
• Hoses
• Bridge bearings
• Foam, sponge compounds
• Innertubes
• Caster wheels
• Sporting goods
• Diaphragms
• Suspension bumpers
• Body mounts
• Vibrations isolators
• Rail pads
• Vacuum tubing
• Wiper blades
• Bladders
• Mats
7
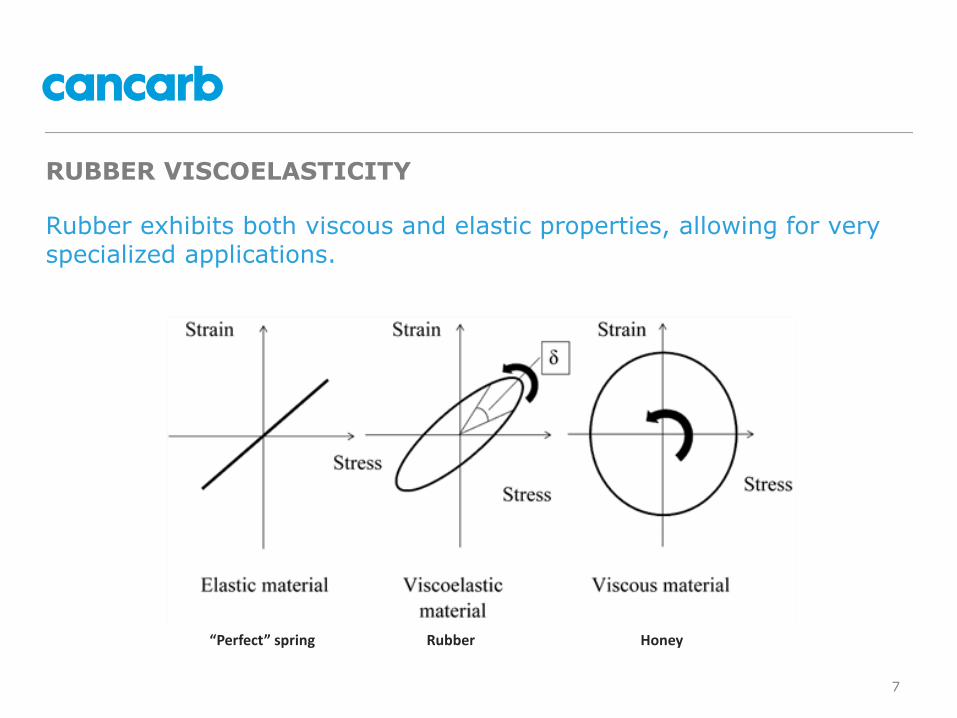
RUBBER VISCOELASTICITY
Rubber exhibits both viscous and elastic properties, allowing for very specialized applications.
“Perfect” spring Rubber Honey
8
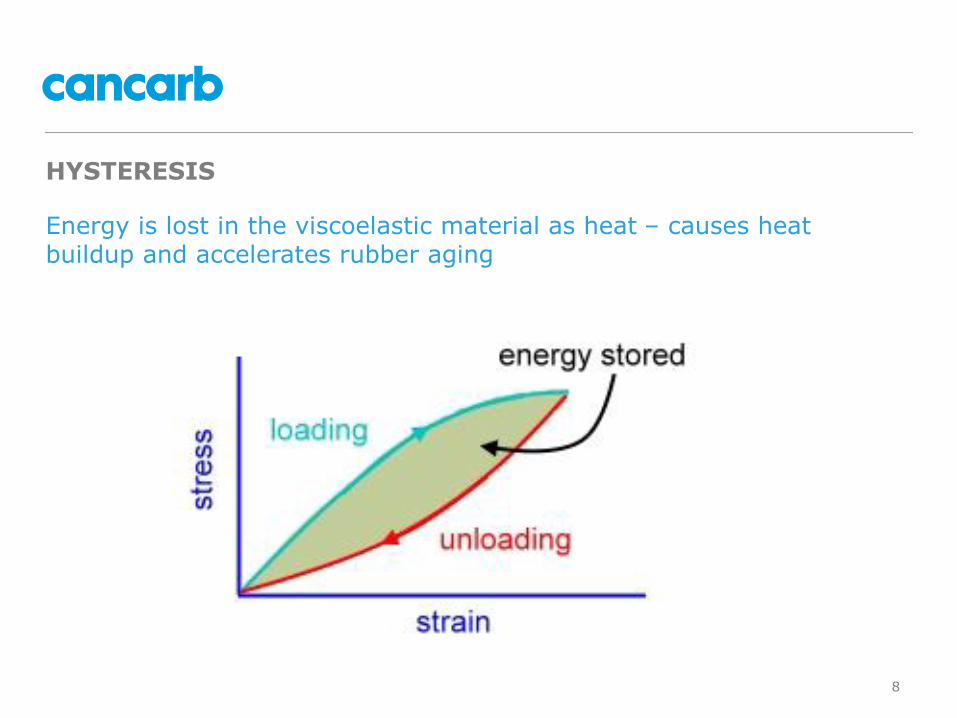
HYSTERESIS
Energy is lost in the viscoelastic material as heat – causes heat buildup and accelerates rubber aging
9
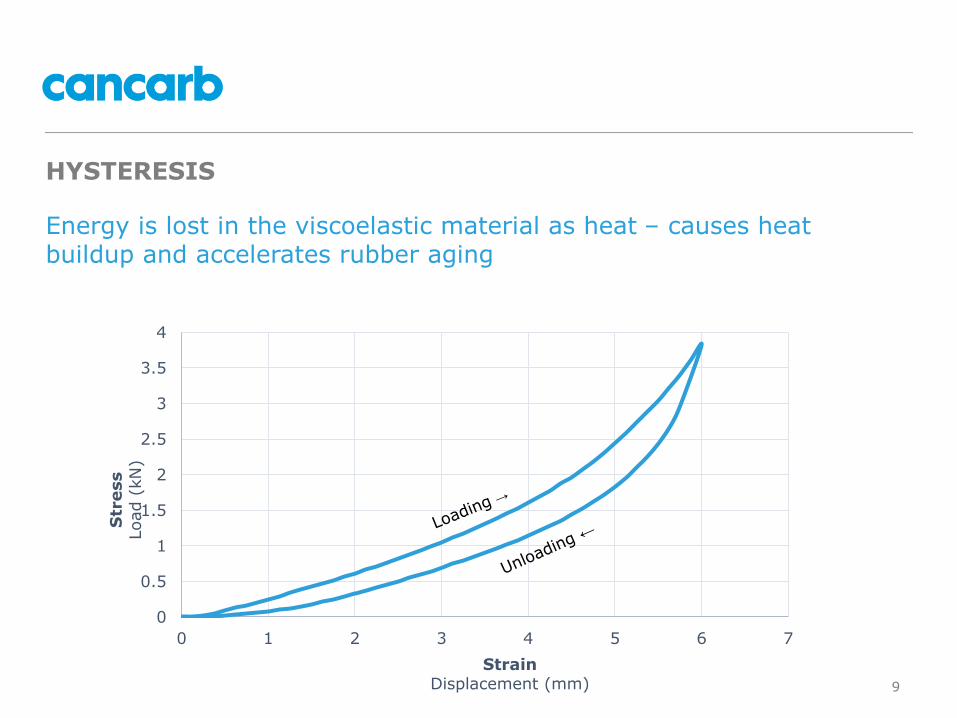
HYSTERESIS
Energy is lost in the viscoelastic material as heat – causes heat buildup and accelerates rubber aging
0
0.5
1
1.5
2
2.5
3
3.5
4
0 1 2 3 4 5 6 7
Str
ess
Load (
kN
)
StrainDisplacement (mm)

10
MEASURED DYNAMIC PROPERTIES – WHAT DO THEY MEAN
Tan delta is indicative of heat buildup, noise transmission, rolling resistance
tan 𝛿 =𝐺′′
𝐺′ =𝑣𝑖𝑠𝑐𝑜𝑢𝑠 𝑚𝑜𝑑𝑢𝑙𝑢𝑠
𝑒𝑙𝑎𝑠𝑡𝑖𝑐 𝑚𝑜𝑑𝑢𝑙𝑢𝑠
Viscous Response
Elastic Response
G’’
G’
δ

11
MEASURED DYNAMIC PROPERTIES – WHAT DO THEY MEAN
Want a low spring ratio
–low 𝐾𝑑 and high 𝐾𝑠
Low dynamic stiffness (𝐾𝑑) is a predictor of vibration isolation performance. Sufficient static stiffness (𝐾𝑠) is required to support a load
Dynamic stiffness and static stiffness
𝑠𝑝𝑟𝑖𝑛𝑔 𝑟𝑎𝑡𝑖𝑜 =𝐾𝑑𝐾𝑠
Surface area
Structure
Sunnicliffe, L. (2017). Carbon black reinforcement of rubber for vibration isolation applications. Presented at: Technical Meeting of Rubber Division, ACS.

12
OBJECTIVES FOR AN IDEAL RUBBER BUSHING
The compound must balance the requirements for static stiffness with minimized dynamic stiffness and hysteresis in order to suppress the frequency of resonance
Reduce tan delta (heat buildup, noise transmission)
Increase static stiffness (mechanical integrity)
Increase processability and cost effectiveness
1
2
3

13
TESTING MATERIAL AND FORMULATIONS
Objective:Evaluate the replacement of N660 with N990 in natural rubber isolation bushings for use in automobiles
Anticipated results:• Increased N990 loading to obtain same hardness• Decreased tensile strength• Increased adhesion between rubber and steel with N990 addition
14
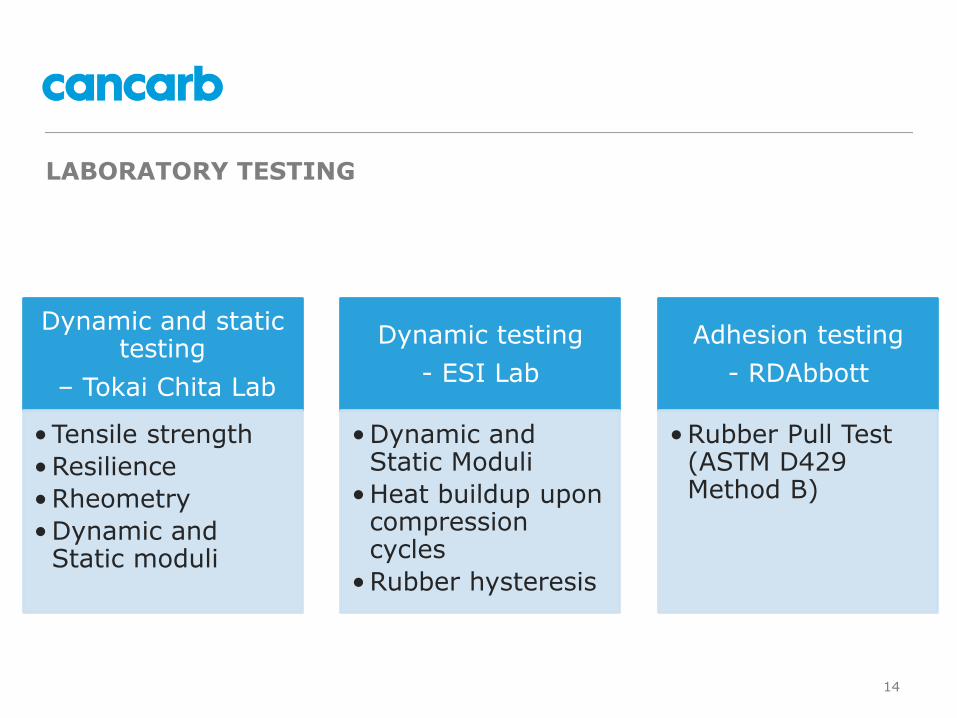
LABORATORY TESTING
Dynamic and static testing
– Tokai Chita Lab
•Tensile strength
•Resilience
•Rheometry
•Dynamic and Static moduli
Dynamic testing
- ESI Lab
•Dynamic and Static Moduli
•Heat buildup upon compression cycles
•Rubber hysteresis
Adhesion testing
- RDAbbott
•Rubber Pull Test (ASTM D429 Method B)
15
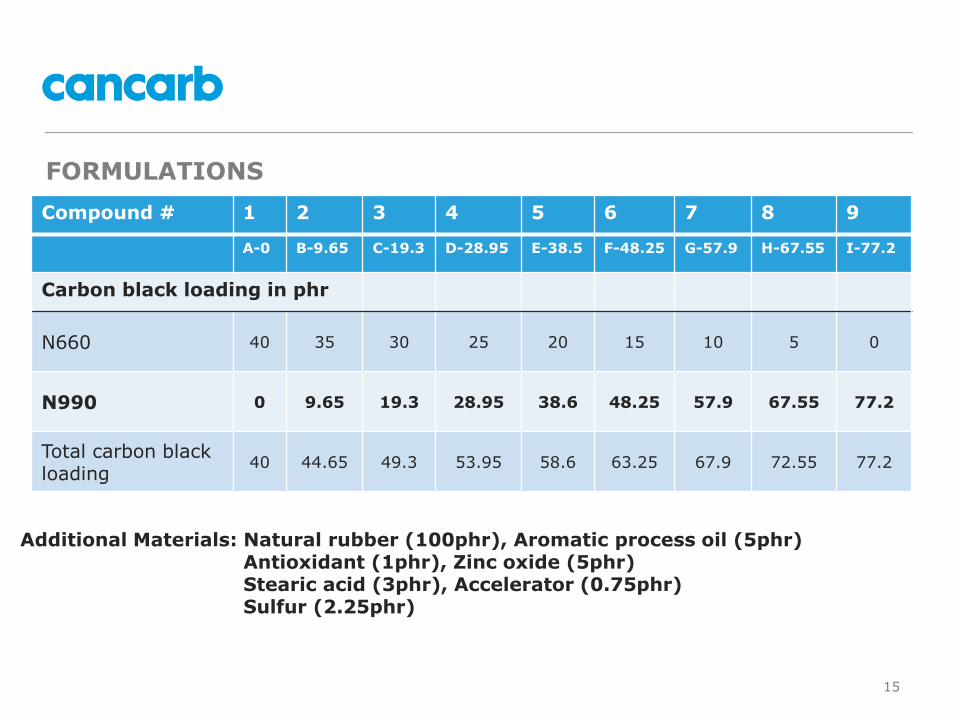
FORMULATIONS
Compound # 1 2 3 4 5 6 7 8 9
A-0 B-9.65 C-19.3 D-28.95 E-38.5 F-48.25 G-57.9 H-67.55 I-77.2
Carbon black loading in phr
N660 40 35 30 25 20 15 10 5 0
N990 0 9.65 19.3 28.95 38.6 48.25 57.9 67.55 77.2
Total carbon black loading
40 44.65 49.3 53.95 58.6 63.25 67.9 72.55 77.2
Additional Materials: Natural rubber (100phr), Aromatic process oil (5phr) Antioxidant (1phr), Zinc oxide (5phr)Stearic acid (3phr), Accelerator (0.75phr)Sulfur (2.25phr)

16
HARDNESS – MAINTAINED WITH ADDED N990 LOADING
Compound # 1 2 3 4 5 6 7 8 9
A-0 B-9.65 C-19.3 D-28.95 E-38.5 F-48.25 G-57.9 H-67.55 I-77.2
Carbon black loading in phr
N660 40 35 30 25 20 15 10 5 0
N990 0 9.65 19.3 28.95 38.6 48.25 57.9 67.55 77.2
Total carbon black loading
40 44.65 49.3 53.95 58.6 63.25 67.9 72.55 77.2
Hardness 57 57 57 58 57 58 59 58 58
Hardness after aging
62 62 62 62 63 63 64 63 63

17
TENSILE STRENGTH BEFORE AND AFTER AGING
0.0
5.0
10.0
15.0
20.0
25.0
30.0
0 9.65 19.3 28.95 38.6 48.25 57.9 67.55 77.2
Str
ength
(M
pa)
N990 loading (phr)
Before aging After aging at 100°C for 3 days
Tensile strength decreases with increasing N990 loading. Effects are less pronounced after aging. This is to be expected when replacing a furnace black with thermal black.

18
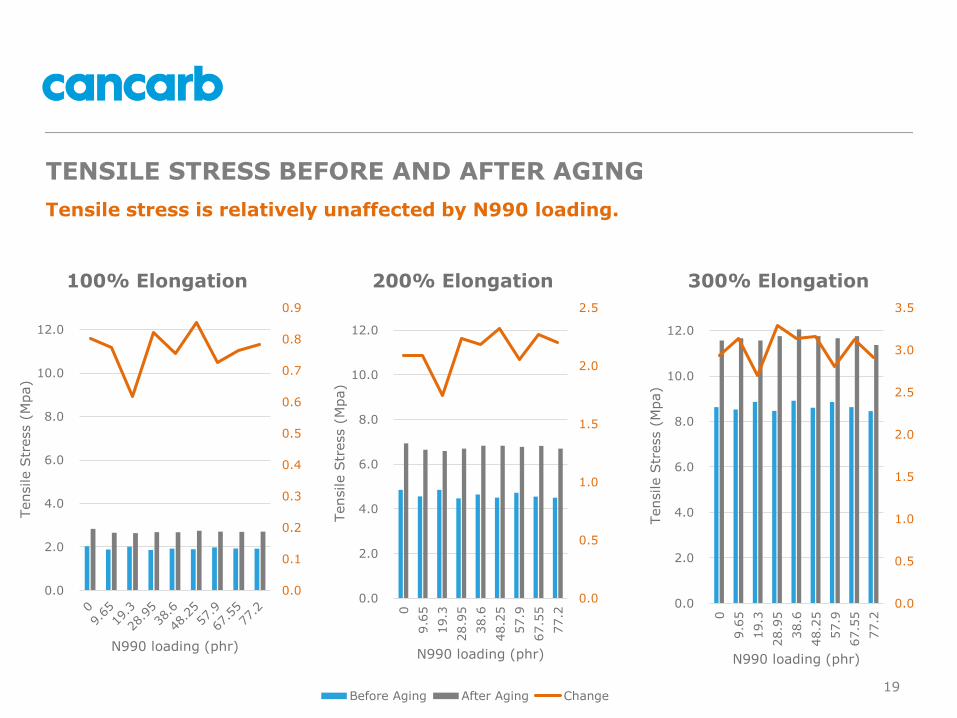
TENSILE STRESS BEFORE AND AFTER AGING
Tensile stress is relatively unaffected by N990 loading.
0.0
2.0
4.0
6.0
8.0
10.0
12.0
Tensile S
tress (
Mpa)
N990 loading (phr)
100% Elongation
0.0
2.0
4.0
6.0
8.0
10.0
12.0Tensile S
tress (
Mpa)
N990 loading (phr)
200% Elongation
Before Aging After Aging
0.0
2.0
4.0
6.0
8.0
10.0
12.0
Tensile S
tress (
Mpa)
N990 loading (phr)
300% Elongation
19
TENSILE STRESS BEFORE AND AFTER AGING
0.0
0.1
0.2
0.3
0.4
0.5
0.6
0.7
0.8
0.9
0.0
2.0
4.0
6.0
8.0
10.0
12.0
Tensile S
tress (
Mpa)
N990 loading (phr)
100% Elongation
0.0
0.5
1.0
1.5
2.0
2.5
0.0
2.0
4.0
6.0
8.0
10.0
12.0
0
9.6
5
19.3
28.9
5
38.6
48.2
5
57.9
67.5
5
77.2
Tensile S
tress (
Mpa)
N990 loading (phr)
200% Elongation
Before Aging After Aging Change
0.0
0.5
1.0
1.5
2.0
2.5
3.0
3.5
0.0
2.0
4.0
6.0
8.0
10.0
12.0
0
9.6
5
19.3
28.9
5
38.6
48.2
5
57.9
67.5
5
77.2
Tensile S
tress (
Mpa)
N990 loading (phr)
300% Elongation
Tensile stress is relatively unaffected by N990 loading.
20
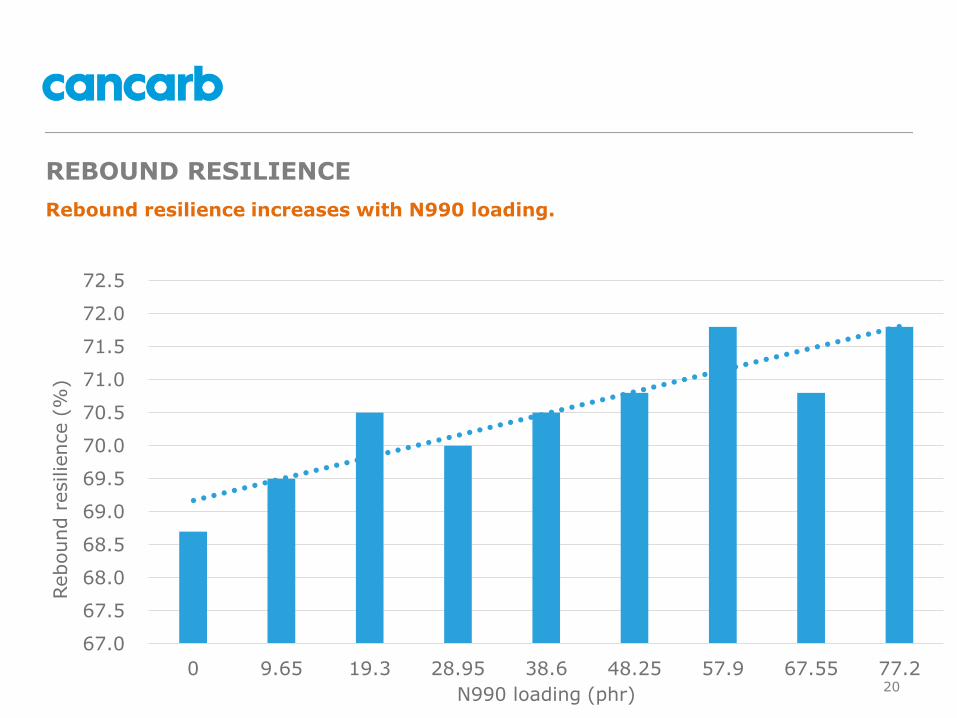
REBOUND RESILIENCE
67.0
67.5
68.0
68.5
69.0
69.5
70.0
70.5
71.0
71.5
72.0
72.5
0 9.65 19.3 28.95 38.6 48.25 57.9 67.55 77.2
Rebound r
esilie
nce (
%)
N990 loading (phr)
Rebound resilience increases with N990 loading.

21
COMPRESSION SET
20.0
25.0
30.0
35.0
40.0
45.0
50.0
55.0
60.0
0 10 20 30 40 50 60 70 80
Com
pre
ssio
n s
et
(%)
N990 loading (phr)
70℃×1day 100℃×1day
Slight decrease in compression set at elevated temperatures. Compression set does not increase with additional filler loading.
22
0.0
1.0
2.0
3.0
4.0
5.0
6.0
7.0
8.0
9.0
10.0
3 5 7 9 11 13 15
Torq
ue (
lbf)
Time (min)
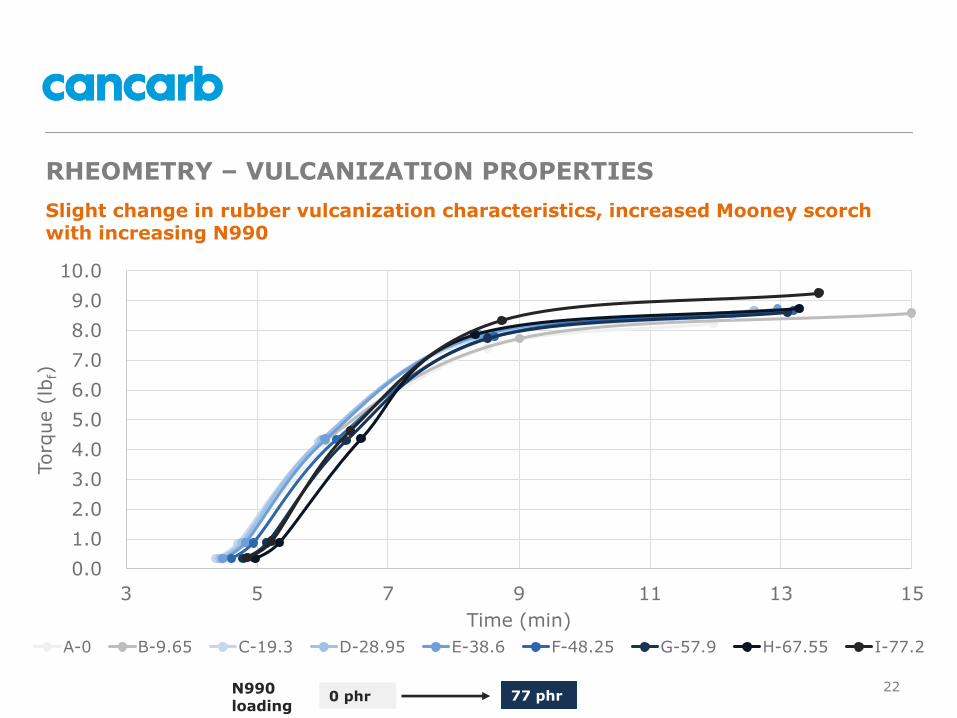
A-0 B-9.65 C-19.3 D-28.95 E-38.6 F-48.25 G-57.9 H-67.55 I-77.2
RHEOMETRY – VULCANIZATION PROPERTIES
Slight change in rubber vulcanization characteristics, increased Mooney scorch with increasing N990
N990loading
0 phr 77 phr
23
22.0
23.0
24.0
25.0
26.0
27.0
28.0
29.0
30.0
31.0
32.0
0 10 20 30 40 50 60 70 80
Mooney s
corc
h (
min
) M
ooney v
iscosity
N990 loading (phr)
Viscosity Scorch
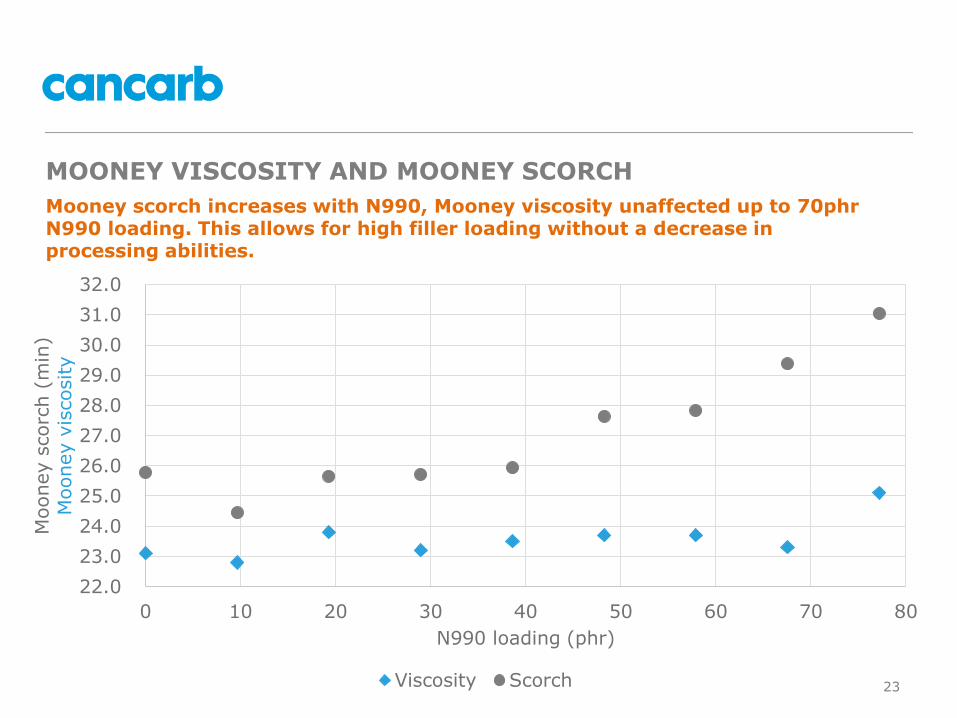
MOONEY VISCOSITY AND MOONEY SCORCH
Mooney scorch increases with N990, Mooney viscosity unaffected up to 70phr N990 loading. This allows for high filler loading without a decrease in processing abilities.

24
0.05
0.06
0.07
0.08
0.09
0.1
0.11
0.12
0 10 20 30 40 50 60 70 80 90 100
tan d
elta
Frequency (Hz)
A-0 B-9.65 C-19.3 D-28.95 E-38.6 F-48.25 G-57.9 H-67.55 I-77.2
IncreasingN990 loading
1% DYNAMIC STRAIN
N990loading
0 phr 77 phr
Tan delta decreases with increasing N990
25
0.05
0.06
0.07
0.08
0.09
0.1
0.11
0.12
0 10 20 30 40 50 60 70 80 90 100
tan d
elta
Frequency (Hz)
A-0 B-9.65 C-19.3 D-28.95 E-38.6 F-48.25 G-57.9 H-67.55 I-77.2
IncreasingN990 loading
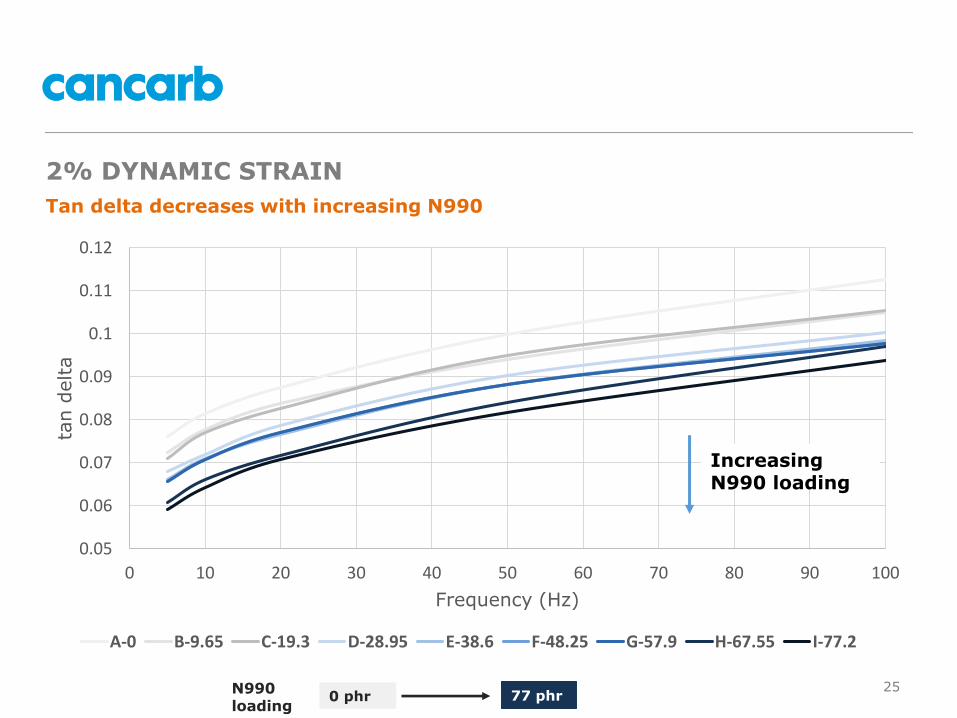
2% DYNAMIC STRAIN
N990loading
0 phr 77 phr
Tan delta decreases with increasing N990

26
5% DYNAMIC STRAIN
0.05
0.06
0.07
0.08
0.09
0.1
0.11
0.12
0 10 20 30 40 50 60 70 80 90 100
tan d
elta
Frequency (Hz)
A-0 B-9.65 C-19.3 D-28.95 E-38.6 F-48.25 G-57.9 H-67.55 I-77.2
IncreasingN990 loading
N990loading
0 phr 77 phr
Tan delta decreases with increasing N990

27
10% DYNAMIC STRAIN
0.05
0.06
0.07
0.08
0.09
0.1
0.11
0.12
0 10 20 30 40 50 60 70 80 90 100
tan d
elta
Frequency (Hz)
A-0 B-9.65 C-19.3 D-28.95 E-38.6 F-48.25 G-57.9 H-67.55 I-77.2
IncreasedIncreasingN990 loading
N990loading
0 phr 77 phr
Tan delta decreases with increasing N990
28
-0.2
-0.15
-0.1
-0.05
0
0.05
0.1
0.15
0.2
0.25
0.3
0 7.5 15 22.5 30 37.5 45 52.5
Tem
pera
ture
change (
°C)
Time (minutes)A-0 B-9.65 C-19.3 D-28.95 E-38.6 G-57.9 H-67.55 I-77.2
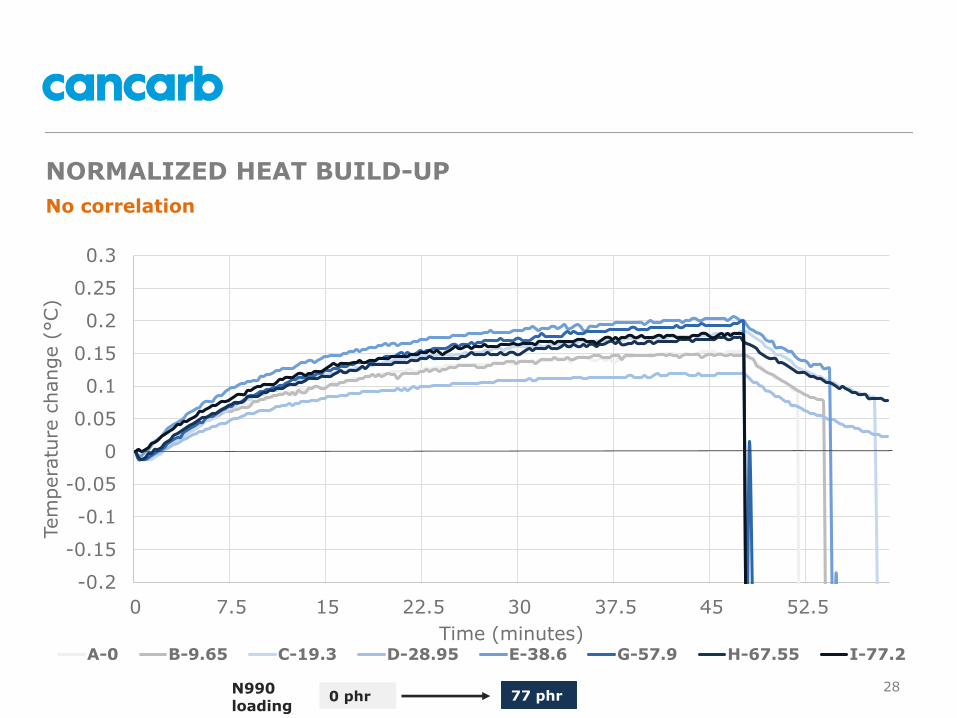
NORMALIZED HEAT BUILD-UP
No correlation
N990loading
0 phr 77 phr
29
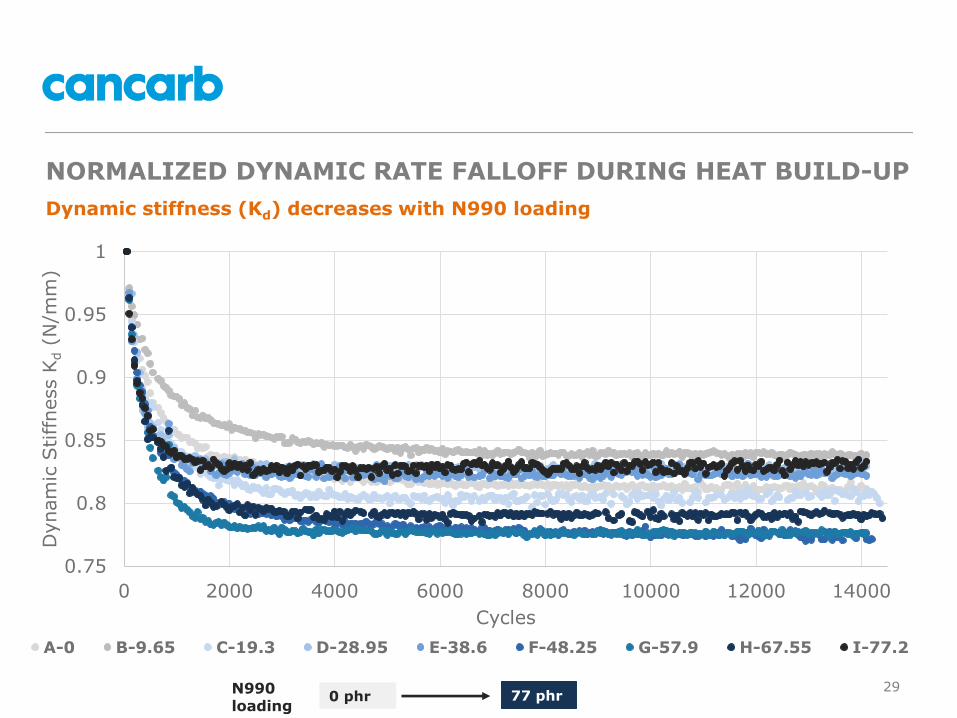
NORMALIZED DYNAMIC RATE FALLOFF DURING HEAT BUILD-UP
N990loading
0 phr 77 phr
0.75
0.8
0.85
0.9
0.95
1
0 2000 4000 6000 8000 10000 12000 14000
Dynam
ic S
tiffness K
d(N
/mm
)
Cycles
A-0 B-9.65 C-19.3 D-28.95 E-38.6 F-48.25 G-57.9 H-67.55 I-77.2
Dynamic stiffness (Kd) decreases with N990 loading
30
1
1.2
1.4
1.6
1.8
2
2.2
0 9.65 19.3 28.95 38.6 48.25 57.9 67.55 77.2Dynam
ic t
o S
tatic S
pri
ng R
atio
N990 Loading (phr)
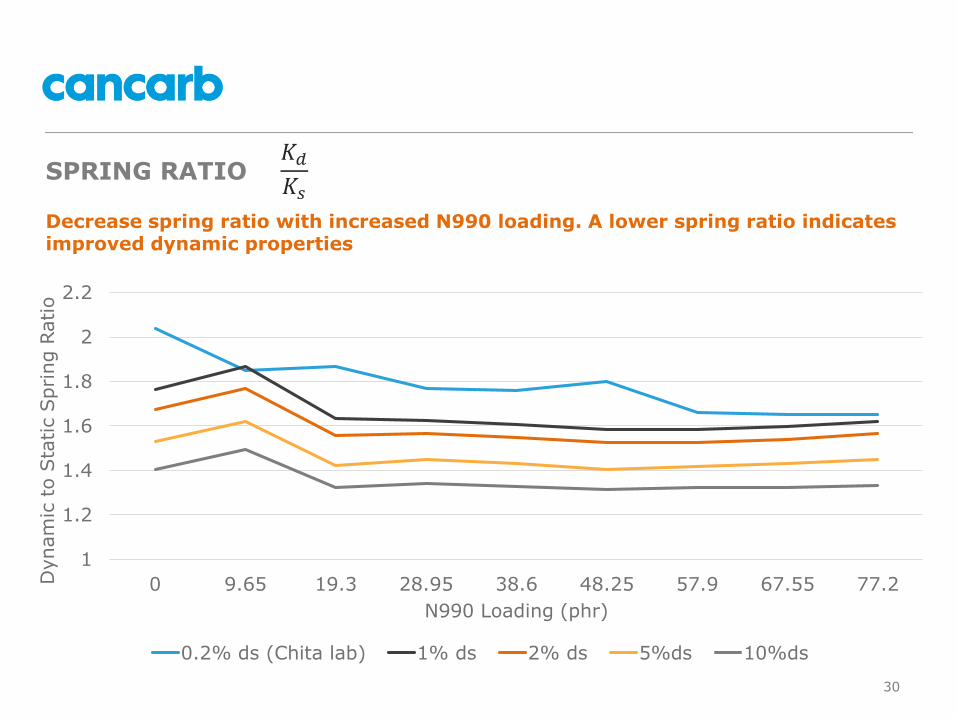
0.2% ds (Chita lab) 1% ds 2% ds 5%ds 10%ds
SPRING RATIO
Decrease spring ratio with increased N990 loading. A lower spring ratio indicates improved dynamic properties
𝐾𝑑𝐾𝑠

31
PEEL ADHESION
0
20
40
60
80
100
120
140
160
180
0 9.65 19.3 28.95 38.6 48.25 57.9 67.55 77.2
Maxim
um
load (
lbf)
N990 loading (phr)
All samples failed in the rubber substrate, not by the adhesion of rubber to metal.

32
OVERALL BENEFITS OF USING N990
Good static properties
• Higher rebound resilience
Better dynamic properties
• Lower tan delta
• Lower dynamic to static spring ratio
• Lower dynamic stiffness
Better adhesion
Potential Cost savings
• Higher filler loading of N990 at same hardness value vs smaller particle size carbon blacks

33

GLOBAL ADVANTAGE
34
Related Documents


