N, P, Si budgets for the Red River Delta (northern Vietnam): how the delta affects river nutrient delivery to the sea Thi Nguyet Minh Luu • Josette Garnier • Gilles Billen • Thi Phuong Quynh Le • Julien Nemery • Didier Orange • Lan Anh Le Received: 7 June 2010 / Accepted: 2 November 2010 / Published online: 30 November 2010 Ó The Author(s) 2010. This article is published with open access at Springerlink.com Abstract The Red River Delta (RRD) (Vietnam), a region experiencing rapid population growth, indus- trialization, and economic development, concentrates 54% of the population of the whole Red River watershed in less than 10% of the basin area. Our study aimed at understanding and quantifying the processes by which the delta affects the nutrient fluxes coming from the upstream watershed before they reach the sea. A comprehensive budget of nitrogen (N), phosphorus (P), and silica (Si) fluxes associated with natural and anthropogenic processes in the terrestrial and hydrological system of the delta was established for five sub-basins of the delta for the period 2000–2006, based on official statistical data, available measurements, and our own sampling campaigns and enquiries. The results show that anthropogenic inputs of N and P brought into the delta area are higher than the amounts delivered by the river from the upstream watershed. However, the amounts of these two elements ultimately delivered to the coastal zone from the delta are lower than the amounts carried by the upstream river, showing extremely efficient retention of both the soils and the delta’s drainage network. For Si (taking into account both dissolved and amorphous solid forms), the retention is much lower. High retention of N and P and low retention of Si in the delta area have up to now protected the coastal zone from severe eutrophication problems. Electronic supplementary material The online version of this article (doi:10.1007/s10533-010-9549-8) contains supplementary material, which is available to authorized users. T. N. M. Luu (&) J. Garnier G. Billen UMR 7619 Sisyphe, UPMC University Pierre & Marie Curie, Box 123, 4 place Jussieu, 75005 Paris, France e-mail: [email protected] T. N. M. Luu L. A. Le Institute of Chemistry, Vietnamese Academy of Sciences and Technology, 18 Hoang Quoc Viet, Cau Giay, Hanoi, Vietnam J. Garnier G. Billen CNRS, UMR 7619, UPMC Sisyphe Laboratory, Box 123, 4 place Jussieu, 75005 Paris, France T. P. Q. Le Institute of Natural Product Chemistry, Vietnamese Academy of Sciences and Technology, 18 Hoang Quoc Viet, Cau Giay, Hanoi, Vietnam J. Nemery Laboratoire d’e ´tude des Transferts en Hydrologie et Environnement LTHE, CNRS UMR 5564, UJF, INPG, IRD, BP53, 38041 Grenoble Cx09, France D. Orange UMR 7618, BIOEMCO, CNRS-IRD, UPMC, University Pierre & Marie Curie, 4 place Jussieu, 75005 Paris, France D. Orange IWMI-SEA Office, SFRI, Dong Ngac, Tu Liem, Hanoi, Vietnam 123 Biogeochemistry (2012) 107:241–259 DOI 10.1007/s10533-010-9549-8

Welcome message from author
This document is posted to help you gain knowledge. Please leave a comment to let me know what you think about it! Share it to your friends and learn new things together.
Transcript
N, P, Si budgets for the Red River Delta(northern Vietnam): how the delta affects rivernutrient delivery to the sea
Thi Nguyet Minh Luu • Josette Garnier •
Gilles Billen • Thi Phuong Quynh Le •
Julien Nemery • Didier Orange • Lan Anh Le
Received: 7 June 2010 / Accepted: 2 November 2010 / Published online: 30 November 2010
� The Author(s) 2010. This article is published with open access at Springerlink.com
Abstract The Red River Delta (RRD) (Vietnam), a
region experiencing rapid population growth, indus-
trialization, and economic development, concentrates
54% of the population of the whole Red River
watershed in less than 10% of the basin area. Our
study aimed at understanding and quantifying the
processes by which the delta affects the nutrient fluxes
coming from the upstream watershed before they reach
the sea. A comprehensive budget of nitrogen (N),
phosphorus (P), and silica (Si) fluxes associated with
natural and anthropogenic processes in the terrestrial
and hydrological system of the delta was established
for five sub-basins of the delta for the period
2000–2006, based on official statistical data, available
measurements, and our own sampling campaigns and
enquiries. The results show that anthropogenic inputs
of N and P brought into the delta area are higher than
the amounts delivered by the river from the upstream
watershed. However, the amounts of these two
elements ultimately delivered to the coastal zone from
the delta are lower than the amounts carried by the
upstream river, showing extremely efficient retention
of both the soils and the delta’s drainage network. For
Si (taking into account both dissolved and amorphous
solid forms), the retention is much lower. High
retention of N and P and low retention of Si in the
delta area have up to now protected the coastal zone
from severe eutrophication problems.
Electronic supplementary material The online versionof this article (doi:10.1007/s10533-010-9549-8) containssupplementary material, which is available to authorized users.
T. N. M. Luu (&) � J. Garnier � G. Billen
UMR 7619 Sisyphe, UPMC University Pierre & Marie
Curie, Box 123, 4 place Jussieu, 75005 Paris, France
e-mail: [email protected]
T. N. M. Luu � L. A. Le
Institute of Chemistry, Vietnamese Academy of Sciences
and Technology, 18 Hoang Quoc Viet, Cau Giay,
Hanoi, Vietnam
J. Garnier � G. Billen
CNRS, UMR 7619, UPMC Sisyphe Laboratory,
Box 123, 4 place Jussieu, 75005 Paris, France
T. P. Q. Le
Institute of Natural Product Chemistry, Vietnamese
Academy of Sciences and Technology, 18 Hoang Quoc
Viet, Cau Giay, Hanoi, Vietnam
J. Nemery
Laboratoire d’etude des Transferts en Hydrologie et
Environnement LTHE, CNRS UMR 5564, UJF, INPG,
IRD, BP53, 38041 Grenoble Cx09, France
D. Orange
UMR 7618, BIOEMCO, CNRS-IRD, UPMC,
University Pierre & Marie Curie, 4 place Jussieu,
75005 Paris, France
D. Orange
IWMI-SEA Office, SFRI, Dong Ngac,
Tu Liem, Hanoi, Vietnam
123
Biogeochemistry (2012) 107:241–259
DOI 10.1007/s10533-010-9549-8

Keywords Red river � Delta � Nutrient budget �Nitrogen � Phosphorus � Silica � Marine
eutrophication � ICEP indicator
Introduction
Nitrogen (N), phosphorus (P), and silica (Si) are key
elements in many biogeochemical processes and are
regarded as limiting elements of both aquatic (Wetzel
1983) and terrestrial ecosystem processes (Chapin
et al. 2002; Ramade 2009). Although they are basic
natural constituents in aquatic ecosystems, excessive
inputs of nutrients can significantly accelerate the
processes of eutrophication, e.g., the development
of algal blooms—sometimes harmful—and oxygen
depletion (Wassmann and Olli 2004; Cugier et al.
2005; Billen et al. 2007; Diaz and Rosenberg 2008;
Thieu et al. 2009). In terrestrial ecosystems, anthro-
pogenic N inputs, either deliberately brought through
cultivation of N-fixing crops and application of
industrial fertilizer or unintentionally coming through
atmospheric deposition of N oxides generated by
high-temperature combustion, are commonly reported
as responsible for elevated N export to the coastal
zone (Howarth et al. 1996; Boyer and Howarth
2008). The resulting increased nitrate contamination
enhances the global denitrification rate and N2O
emissions, which contribute to the greenhouse effect
and the destruction of the stratospheric ozone layer
(Crutzen and Ehhalt 1977; Bange 2000; Galloway and
Cowling 2002; Van Drecht et al. 2003). Similarly,
worldwide P mining and processing, mainly for
fertilizer production, has reached a level on the same
order of magnitude as natural weathering and erosion
processes (Cordell et al. 2009). Regarding P point
sources to surface water in European countries,
phosphates in washing powders have contributed to
doubling the per capita specific load, which increased
from 2 gP capita-1 day-1 in the 1960s to 4 gP capita-1
day-1 in the 1980s, leading to eutrophication in
stagnant and running water systems (see Vollenweider
1968; Billen et al. 2007). Si, essentially coming from
rock weathering, is brought at a rate that depends on
the hydrological and temperature regimes and is more
often reduced than increased by anthropogenic activ-
ity (Sferratore et al. 2006). However, Si, which is
often ignored in routine surveys, is a major component
in the eutrophication problem, as the molar N:P:Si
ratios need to be close to 16:1:16 to avoid the
proliferation of non-diatoms after exhaustion of Si by
the normal new-production diatom growth phase
(Turner et al. 2006; Billen and Garnier 2007). In
most eutrophied river systems, a decrease in Si (due to
damming or algal uptake) and an increase in N and P
have resulted in the development of undesirable non-
diatom algae, with adverse financial consequences on
fisheries and tourism (Justic et al. 2002; Turner et al.
2006—Mississippi; Li et al. 2007—Yangtze; Knowler
2007; Yunev et al. 2007—Danube; Cugier et al.
2005—the English Channel; etc.).
In view of the importance of N, P, and Si for the
functioning of terrestrial and aquatic environments,
calculation of their budget is a useful approach to
help maintain sustainable production, but also to
better manage several environmental issues, such as
acidification, hypoxia, eutrophication, and climate
change (FAO 2003; Wassmann and Olli 2004; Diaz
and Rosenberg 2008; Rabouille et al. 2008).
In Southeast Asia, the population concentrates
mostly in large deltas where anthropogenic pressure is
very high, leading to N and P pollution by agriculture,
industries, and domestic effluents, most often released
with no treatment (Le et al. 2005; Ngo et al. 2007).
Vietnam has two major deltas, the Red River Delta
(RRD) in the north and the Mekong Delta in the south.
The present study focuses on the former, which plays
an important role in the country’s agricultural,
industrial, and economic development. It is a good
example of a region with rapid population growth,
industrialization, and economic development leading
to increased resource consumption and environmental
degradation.
Numerous studies have dealt with the establish-
ment of the N and/or P budget in regional watersheds
in the northern United States and in Europe (Howarth
et al. 1996; Garnier et al. 1999, 2002; Faerge et al.
2001; Boyer et al. 2002; Nemery and Garnier 2007a,
b; Boyer and Howarth 2008), as well as, more
recently, in tropical hydrographic networks in Asia
and Africa (Buranapratheprat et al. 2002; Le et al.
2005; Baker et al. 2007). Budgets focusing on deltas
are still scarce, and even more so when including Si,
in addition to N and P. There have been only a few
attempts toward estimation of the Si budget in such
regions (Le et al. 2010; Moon et al. 2007).
The aim of this study is to inventory the sources
and sink of nutrients (N, P, Si) in the terrestrial and
242 Biogeochemistry (2012) 107:241–259
123

aquatic components of the RRD. This is a follow-up
to Le et al. (2005) budget of the upstream watershed
of the Red River, taking into account in greater detail
the specific processes occurring in the delta area at
the land–sea interface. As we did in a previous study
dealing with the hydrological budget (Luu et al.
2010), five sub-basins were distinguished within the
delta to take into account the contrasting dominant
land uses (i.e., paddy rice fields in the lower Red
River sub-basin and the Day estuary, or forest in the
Boi sub-basin) and the heterogeneous distribution of
the population (varying from 260 inhabitants km-2 in
the Boi sub-basin to 1,700 inhabitants km-2 in the
Bui sub-basin). Our purpose was to evaluate the role
of the delta as a source or sink for the nutrient fluxes
delivered by the upstream watershed before they
reach the sea, taking into account the landscape
heterogeneities in the delta.
Study site: the red river delta
Geomorphologic and hydrological characteristics
The RRD is located in the northern part of Vietnam in
the lower plain of the Red River catchments. The
RRD area extends over 14,300 km2 entirely situated
below 3 m above sea level and much of it does not
rise more than 1 m above sea level. It is limited
landwards by Son Tay city in the northwest (on the
Red River, 150 km from the sea), and seawards by
the coastline extending over 360 km from Hai Phong
province in the northeast to Ninh Binh province in the
south (Fig. 1a).
The RRD is rich in natural resources and plays an
important role in the socioeconomic development of
the two main cities in Vietnam (the capital Hanoi and
the industrial city of Hai Phong).
The hydrographical system in the RRD represents
a complex network not only in terms of morphology,
but also in terms of their hydrological regimes. The
fluvial network of the delta is quite dense (density
about 2–4 km km-2) (Tran 2007).
The total length of the main Red River course is
about 1,126 km from the source in China to the
mouth (Ba Lat estuary), of which the main branch of
the Red River in the delta accounts for 216 km (Tran
2007). The main Red River branch enters the delta at
Son Tay, and then divides into two distributaries: the
Day River on the right side and the Duong River on
the left. On the left side of the Red River (see
Fig. 1a), the Thai Binh River, about 100 km long,
starts at the confluence of three rivers: the Cau,
Thuong, and Luc Nam. The Thai Binh River (64 km)
is joined by the Red River through the Duong River
(upstream) and the Luoc River (downstream). The
Day River drains the right part of the RRD; it has a
length of 240 km and a total watershed area of
approximately 8,500 km2. The Nhue River is sup-
plied by water from the Red River through the Lien
Mac sluice and joins the Day River at Phu Ly town;
the river is approximately 75 km long. Two other
major interconnecting rivers between the Day River
and the Red River are the Chau and the Dao Rivers.
There are also several tributaries and streams in the
delta. Both the Red River and Thai Binh River
systems including the Day River deliver a total
volume of about 100 km3 year-1 (Luu et al. 2010).
Land use, social and economic conditions
It is estimated that in 2006, 16,600,000 people were
living in the RRD (General Statistic Office 2006)
(Table 1). The current annual growth rate of the
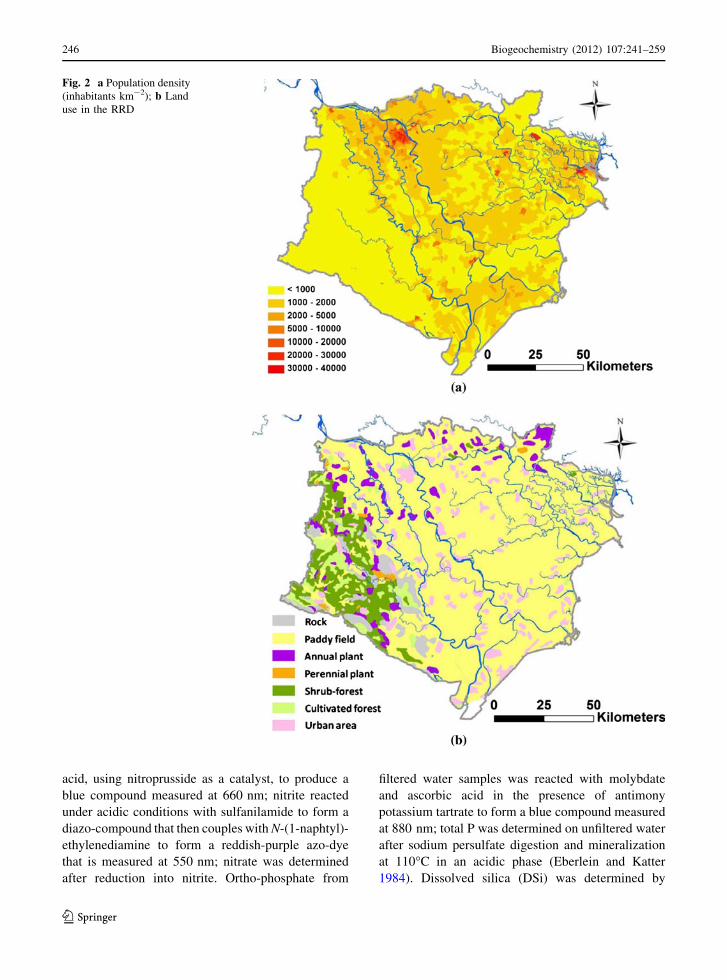
population is as high as 3%. The population density,
1,160 inhabitants km-2 (Fig. 2a), is five times
the national average (225 inhabitants km-2). Of the
entire population, 78% live in rural areas, but the
number of people living in urban areas is increasing
rapidly (from 3.3 million in 2000 to 3.6 million in
2006), especially in the Hanoi metropolitan area,
leading to a strong increase in consumption of natural
resources and energy and in production of wastes.
Figure 2b shows the present land use in RRD.
About 47% of the area is used as agricultural and
aquacultural land; of this, 90% (6,700 km2) is used
for annual crops, 6.6% for aquaculture and fisheries,
3.1% for perennial crops, and 0.6% as pasture area.
Only 13% (2,000 km2) is classified as forest area,
situated mostly in the western side of the RRD (Hoa
Binh province). Housing, industry, roads, and canals
occupy 21% of the RRD total area, while about 12%
are water surfaces (rivers, lakes, etc.) (Nguyen et al.
1995; General Statistic Office 2006), (Table 2).
The main income in most provinces within the
RRD is from agriculture. About 80% of the popula-
tion is still engaged in the agricultural sector. In
recent years, the economic structure in the basin has
Biogeochemistry (2012) 107:241–259 243
123

been changing significantly. Employment has gradu-
ally been reduced in the agricultural sector and
shifted to industry and service sectors, causing a large
migration from rural areas to urban ones.
Meteorological conditions
The RRD is located within a typical wet, hot, subtrop-
ical climate determined by monsoons. In winter,
Duong
Lower RedBui-Day
Boi
Day estuary
Upper Red River
Upper Cau River1.3
0.9
31.7
57.61.934.3
44.3
20.6
89.9
14.5
3.8
0.9
2006: Discharge in km3/yr
Hanoi
SonTay
Ba Lat
Nhu Tan
Van Uc
1.3
2.1
0.7
1.1
0.9
Duong
Lower RedBui-Day
Boi
Day estuary
Upper Red River
Upper Cau River1.3
0.9
31.7
57.61.934.3
44.3
20.6
89.9
14.5
3.8
0.9
2006: Discharge in km3/yr
Hanoi
SonTay
Ba Lat
Nhu Tan
Van Uc
1.3
2.1
0.7
1.1
0.9
Duong
Lower RedBui-Day
Boi
Day estuary
Upper Red River
Upper Cau River130
80
8390
15150703360
1680
750
23640
5340
70
80
2006: SS fluxes, 106 kg/yr
Hanoi
SonTay
Ba Lat
Nhu Tan
Van Uc
5160
8050
4740
80
Duong
Lower RedBui-Day
Boi
Day estuary
Upper Red River
Upper Cau River130
80
8390
15150703360
1680
750
23640
5340
70
80
2006: SS fluxes, 106 kg/yr
Hanoi
SonTay
Ba Lat
Nhu Tan
Van Uc
5160
8050
4740
80
(a)
(c)(b)
Fig. 1 a Hydrographic network of the RRD and situation of
the RRD in northern Vietnam. b Water fluxes in 2006 for the
five sub-basins considered in the RRD (Luu et al. 2010) used
for the calculation of SS, N, P, Si fluxes. c SS for the year 2006.
indicates the amount of SS retention in the sub-basins
244 Biogeochemistry (2012) 107:241–259
123
the weather is quite cold with little rain, and summer is
hot, sunny and rainy. The average annual rainfall is
approximately 1,600 mm. The highest rainy season
occurs from May to October, and most rainfalls are
heavy showers which characterize upstream catch-
ments of the rivers and the RRD as well. Summer
rainfall accounts for 80–85% of total annual precipi-
tation. Average temperatures range from 8�C in
December and January, the coolest months, to more
than 37�C in April, the hottest month. The daily average
of 3.1 sunshine hours falls to only 1.3 h in March and
maximum sunshine duration (up to 12 h per day) often
occurs in June. Mean humidity is greater than 80%
throughout the year (IMHE – MONRE 1996–2006).
Materials and methods
Chemical analysis
Water discharge at the outlet of the five sub-basins
was reported by Luu et al. (2010). In order to
investigate the water quality, routine surveys were
carried out at monthly intervals from 2006 to 2008 at
the outlet of each sub-basin. In this report, for the
Duong and lower Red River sub-basins, we consider
their estuarine branches as one outlet to the sea only.
Concerning waste water from industrial and agri-
cultural activities, several samples were taken from
various industrial sectors around Hanoi; water flow-
ing from paddy fields and from some of the mainly
dry crops was collected on several occasions from
April to June 2007 in order to evaluate the diffuse
source pollution from different types of land use.
During sampling campaigns, the physical–chemi-
cal parameters were measured by a Hydrolab 4a
multiparameter probe [temperature (�C), pH,
conductivity (lS cm-1), salinity (%), turbidity
(NTU), redox potential (mV) and DO (dissolved
oxygen, mg l-1)], but not reported here.
Each water sample was collected in a 1-l polyeth-
ylene recipient then was kept at 4�C in an icebox
during transportation to the laboratory where
water was filtered through GF/F membrane filters
(Whatman, 0.7 lm porosity) and frozen.
Particles
Suspended solid (SS) values were determined as the
weight of material retained on the Whatman GF/F
membrane per volume unit after drying the filter for
2 h at 120�C. Values correlate well with NTU (not
shown). Biogenic Si in riverine particulate matters
collected on Whatman cellulose nitrate membranes
was measured using wet alkaline extraction tech-
niques (Ragueneau and Treguer 1994; Conley et al.
1989; Conley 1998, 2002). Total P was analyzed
using unfiltered frozen water samples. The concen-
tration expressed in mg P–PO4 l-1 was determined
(see below) after persulfate digestion with sulfuric
acid (AFNOR 1982). Total particulate P (TP) was
also determined on concentrated suspended sedi-
ments (Nemery and Garnier 2007a) with a high
temperature/HCl extraction technique.
Dissolved elements
Nitrate, nitrite, and ammonium were determined
spectrophotometrically in the filtered water samples
with a Quaatro (Bran ? Luebbe) flow-through spec-
trophotometric apparatus using standard procedures
(Jones 1984; Slawyck and McIsaac 1972): ammo-
nium reacted with salicylate and dichloro-isocyanuric
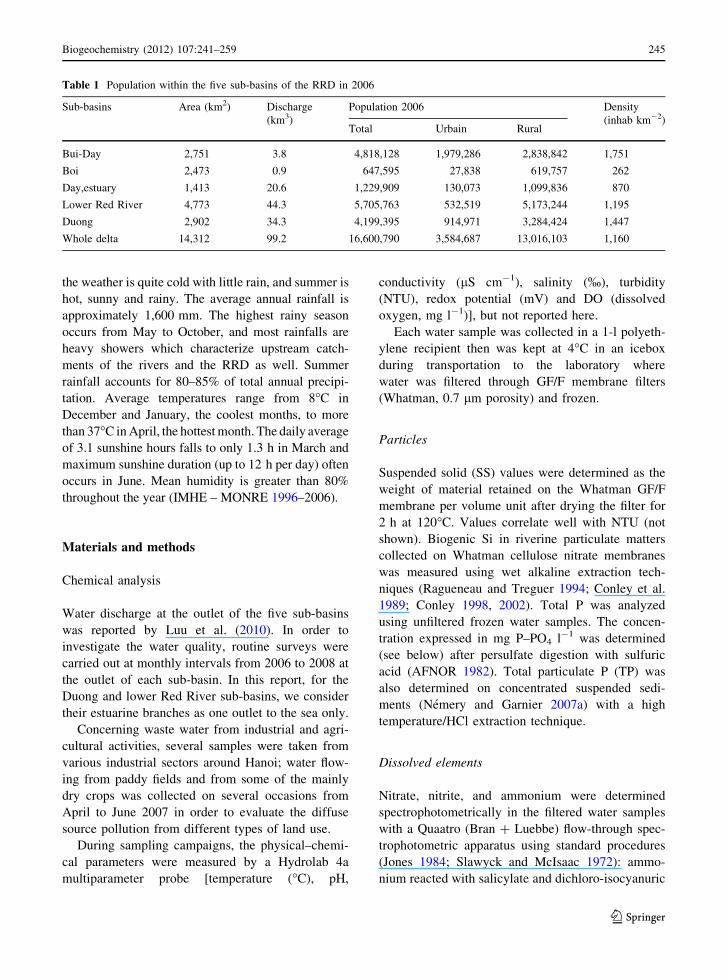
Table 1 Population within the five sub-basins of the RRD in 2006
Sub-basins Area (km2) Discharge
(km3)
Population 2006 Density
(inhab km-2)Total Urbain Rural
Bui-Day 2,751 3.8 4,818,128 1,979,286 2,838,842 1,751
Boi 2,473 0.9 647,595 27,838 619,757 262
Day,estuary 1,413 20.6 1,229,909 130,073 1,099,836 870
Lower Red River 4,773 44.3 5,705,763 532,519 5,173,244 1,195
Duong 2,902 34.3 4,199,395 914,971 3,284,424 1,447
Whole delta 14,312 99.2 16,600,790 3,584,687 13,016,103 1,160
Biogeochemistry (2012) 107:241–259 245
123
acid, using nitroprusside as a catalyst, to produce a
blue compound measured at 660 nm; nitrite reacted
under acidic conditions with sulfanilamide to form a
diazo-compound that then couples with N-(1-naphtyl)-
ethylenediamine to form a reddish-purple azo-dye
that is measured at 550 nm; nitrate was determined
after reduction into nitrite. Ortho-phosphate from
filtered water samples was reacted with molybdate
and ascorbic acid in the presence of antimony
potassium tartrate to form a blue compound measured
at 880 nm; total P was determined on unfiltered water
after sodium persulfate digestion and mineralization
at 110�C in an acidic phase (Eberlein and Katter
1984). Dissolved silica (DSi) was determined by
Fig. 2 a Population density
(inhabitants km-2); b Land
use in the RRD
246 Biogeochemistry (2012) 107:241–259
123

spectrophotometry and analyzed from filtered water
samples (Rodier 1984).
Questionnaire and statistics
When investigating the industrial wastewater, we
gathered information on representative enterprises
within the RRD concerning their production, dis-
charge of effluents, and water quality variables such
as pH, SS, dissolved oxygen (DO), biological oxygen
demand (BOD), chemical oxygen demand (COD),
and nutrients (NO3, NO2, NH4, total N, PO4, total P).
Our approach involved (i) the establishment of a
census of businesses using official inventories and
‘‘yellow pages’’ for the factory address, (ii) elabora-
tion of a questionnaire sent to all registered compa-
nies, (iii) sampling effluents from a number of
factories for which we performed the chemical
analyses mentioned above. Our efforts were limited
to the 11 provinces in the delta and to the most
significant sectors of activity in terms of organic and
nutrient pollution: the food and textile industries, the
chemical industry, the wood and paper industry, and
hospitals.
The questionnaire was constructed and sent to
about 600 businesses, with the request to tick an
appropriate box, (i) to document the size of the
companies (range of wastewater effluent in m3 s-1;
number of workers; range of production in tons
day-1); (ii) the quality of the wastewater discharged
(ranges of values for variables such as SS, BOD, total
N and total P); and (iii) how effluents were
discharged (into the river, into a canal, into a lake
or a pond, spread on land, or stored in a basin). We
received approximately 60 answers, which we con-
sider a reasonably good return rate.
Statistical data such as population, land use,
livestock, agricultural production, etc., were collected
from the General Statistic Office (2006) and then
analyzed in detail as presented in Supplementary
Information.
Daily SS was obtained from the IMHE (Institute of
Meteorology and Hydrology 1996–2006) at the
entrance of the delta at Son Tay and the entrance of
the lower Red River and Duong sub-basins (Fig. 1b, c).
At the other locations, our own measurements were
used.
Nutrient and suspended solid flux calculations
Dissolved nutrient fluxes, e.g., N (TNinog: RN–
NO2 ? N–NO3 ? N–NH4), P (P–PO4), and Si
(DSi), were calculated at the inlet and the outlet of
the five sub-basins on the basis of the water budget as
established by Luu et al. (2010), (see Fig. 1b, c), and
the mean annual concentrations of DSi and P–PO4,
measured in the field or taken from the literature
(Kurosawa et al. 2006; Le et al. 2005, 2010; IMHE –
MONRE 1996–2006; Nguyen et al. 2005; Trinh et al.
2006; Tran et al. 2006)
Flx ð106kg year�1Þ ¼ Qm� Cm� 3; 600� 24� 365
109
Where Flx is the nutrient flux of DSi, TNinog or
P–PO4 in 106 kg year-1, Qm, is the mean annual
discharge for the recorded period (m3 s-1) and Cm, is
the mean annual concentrations (mg l-1 or g m-3).
For SS, the annual flux (106 kg year-1) was
determined for the year 2006 by multiplying the
mean annual water fluxes (m3 year-1) by discharge
weighted mean concentration (g m-3) according to
Table 2 Distribution of land-use within the five sub-basins of RRD (in km2) in 2006
Sub-basins Agricultural soil Forest Urban area Water surface Unused
landPaddy
Land
Annual
plants
Perennial
plants
Grassland Aquaculture Rivers, lakes,
flooded area
Bui-Day 985 148 124 3 373 662 79 202 174
Boi 333 105 62 4 1,041 253 29 95 551
Day estuary 594 55 70 3 151 260 77 70 134
Lower Red River 2,397 179 219 0 143 1,046 288 409 92
Duong 1,137 81 127 1 209 812 177 309 51
Whole delta 5446 568 602 11 1,916 3,032 650 1,084 1,002
Biogeochemistry (2012) 107:241–259 247
123
the load estimation procedure described by Verhoff
et al. (1980)
Flx ð106kg year�1Þ ¼P
CiQi½ �P
Qi� Qm� 3; 600� 24
� 365� 10�9
Where Flx is the SS flux in 106 kg year-1, Ci is
the discrete instantaneous concentration (g SS m-3),
Qi is the corresponding instantaneous discharge
(m3 s-1) and Qm is the mean discharge for period of
record (m3 s-1).
Good-quality daily measurements of SS at Son
Tay station were available. Daily measurements were
also available at Hanoi station (main Red River
branch) and Thuong Cat (Duong entrance). However,
due to the location of these sampling stations close to
the bank, these SS data seem to be overestimated (as
has been confirmed by measurements along a trans-
versal profile of the river), so that we preferred to
calculate the entering SS fluxes on the basis of the SS
flux at Son Tay station and the water fluxes at the
entrance of the Duong and the Red River’s main
branch (Fig. 1c).
Particulate P and Si (ASi: amorphous silica) fluxes
were calculated from the SS fluxes and the P or Si
content of SS. Total P (TP) and total Si (TSi) fluxes
are the sum of the particulate and dissolved fraction.
The dissolved inorganic N fluxes (TNinorg) are
represented by the sum of the components N–NO2,
N–NO3, N–NH4, whereas the total organic N con-
centration (TON, mg N l-1) was calculated from the
linear relation with suspended solids (SS, mg l-1),
established by Le et al. (2005), TON = 0.4 ?
0.0013. SS (r2 = 0.91). TN is calculated as the sum
TNinorg and TON.
Nutrient and suspended solid budget for the five
sub-basins
To determine a semi-distributed SS and nutrient
budget as we did for water flow (Luu et al. 2010), the
RRD was subdivided into five sub-basins, distin-
guished by their population density (from 260
inhabitants km-2 in Boi sub-basin to 1,700 inhabit-
ants km-2 in Bui sub-basin), (Fig. 2a) or by their land
use (predominantly paddy soil in the lower Red River
sub-basin and Day estuary or forest in the Boi sub-
basin), (Fig. 2b). We distinguish the soil budgets
from the water budgets because the sources and the
nature of the data are different—statistical for the
former, experimental for the latter.
Budget of the soil system
All the data such as land use, livestock, agricultural
production, and industrial activities, are available at
the district level; the data for each sub-basin were
calculated from the district data as pro rata of the
surface area located within each sub-basin.
The soil nutrient balance is usually defined as the
difference between nutrient inputs (atmospheric
deposition, N fixation, fertilizer application, and
input of animal manure) and export (harvesting,
grazing by domestic animals, leaching/erosion, and
denitrification as far as N is concerned). The data
used for estimating each of these terms are described
in Supplementary Information. If the balance for a
particular nutrient is positive, that nutrient will
accumulate in the soil. In contrast, if the balance is
negative, depletion occurs, and the soil fertility status
may deteriorate. Internal nutrient cycling (microbial
uptake and decomposition) is not considered in the
budget (Akaselsson et al. 2007; FAO 2003, 2005;
Smil 1999).
Budget of the hydrological network
Suspended solids and nutrients are introduced to
surface waters from diffuse and point sources; they
may also be retained or eliminated through various
processes during their transfer to the sea. The
approach for assessing diffuse sources relies on the
total annual specific water flux (difference between
rainfall and evapotranspiration) for each sub-basin as
established by Luu et al. (2010) (see Fig. 1b).
Nutrient concentration in runoff from each land use
type was evaluated from direct measurements and
from the literature (Kurosawa et al. 2006; Wosten
et al. 2003). Point sources were estimated from
population data and industrial census. (See Supple-
mentary Information for details.)
Sources of error and uncertainty
Three sources of data (assembled from the literature,
derived from official statistics, and deduced from
direct measurement) as well as several assumptions
248 Biogeochemistry (2012) 107:241–259
123

were combined in the calculation of the nutrient
balances, which are therefore subject to a number of
possible biases. Several fluxes were not taken into
account in the balance. Nutrient losses by volatiliza-
tion, which are very difficult to estimate, have been
ignored at this stage (see Tables 4, 5, 6). Fluxes of
atmospheric deposition and N fixation which,
although site-specific, were estimated from the liter-
ature data for similar regions, due to the lack of direct
measurement data. Further, nutrient removal in the
harvested product is usually calculated from the
average nutrient content per ton of product, but
nutrient concentrations in the product tend to increase
with increasing yield (FAO 2006; Faerge et al. 2001).
This may result in a nutrient content not linearly
related to yield, and a nutrient removal being
overestimated when yields are low or vice versa.
Although we cannot assess the reliability of official
statistical data, it is clear that biases might have been
introduced in the budget calculation, when some data
provided at the district level were extrapolated from
the country level. Finally, in terms of our field
measurements, the frequency of investigation in
space and in time, water sampling, and chemical
analysis are all sources of variation.
While we acknowledge multiple sources of uncer-
tainty in our data, our approach is advantageous for
its ability to (i) test the coherence among the various
sources of data, (ii) compare the soil agricultural
budgets with the hydrological budgets, and (iii) better
understand the biogeochemical functioning of various
sectors of the delta differing according to their land
use and human activities, as we can expect that the
errors on each flux are of the same nature.
Table 3 Agricultural production and its destination (human and livestock consumption or exportation) in the RRD
2006 %N %P %Si Delta
Production
(Kt year-1)
Human consump.
(Kt year-1)
Animal cons.
(Kt year-1)
Export/import
(Kt year-1)
Rice
Grain 1.3 0.22 0.0200 5,852 2,806 1,127 1,919
Leaves 1.3 0.22 5,852 0 5,852 0
Maıze
Grain 1.4 0.35 0.0010 287 133 143 11
Leaves 1.4 0.35 574 0 574 0
Wheat 1.9 0.48 0.0150 0 166 0 -166
Soja 3.5 0.46 0.0010 85 17 63 6
Starchy roots 0.3 0.12 0.0010 372 249 107 16
Leaves 0.3 0.22 186 0 186 0
Vegetables 0.2 0.06 0.0010 347 1,378 0 -1031
Fruits 0.1 0.09 0.0050 245 531 0 -286
Sugar cane 0.2 0.08 0.0200 269 266 109 -106
Leaves 0.2 0.08 54 0 54 0
Peanuts 4.0 0.23 0.0010 66 17 0 50
Tea, coffee… 2.9 0.15 0.0002 0 8 0 -8
Grass 2.0 0.26 189 0 189 0
Other feed 2.0 0.3 170 0 670 -500
Meat and dairy pdcts 3.5 0.3 0.0010 684 498 0 186
Fish and sea food 3.5 0.3 0.0015 313 282 31
Total in 106kg N year-1 215.2 74.8 121.4 19
Total in 106kg P year-1 34.8 11.7 21.3 2
Total in 106kg Si year-1 1.3 0.7 0.3 0.3
Biogeochemistry (2012) 107:241–259 249
123

Results and discussion
Nutrient budgets
The nutrient budgets are summarized in Tables 3, 4,
5 and 6 for each of the five sub-basins and for the
whole delta, for each of the three elements (N, P, Si).
Since the surface areas of the Bui sub-basin and
the Boi sub-basin are similar, we have focused on
these two contrasted sub-basins in terms of land use
and population density to illustrate the processes
involved in the N cycle (Figs. 3a, b). In the Bui sub-
basin, agriculture soils (paddy fields) are prominent,
while in the Boi sub-basin, forest dominates, which
results in a clear difference in the quantity of fertilizer
applied (7.4 vs. 1.6 106 kg N year-1, respectively)
and to a much higher N retention or rather elimina-
tion by denitrification in the former than in the latter
basin. In the Boi sub-basin, with a rather small
population, agricultural production is slightly greater
than the local consumption of agricultural products
by humans and livestock (13.6 9 10 and 10.5 9
106 kg N year-1, respectively): this sub-basin can
therefore be considered as a net exporter of agricul-
tural products and their contained nutrients (Le et al.
2005; Billen et al. 2005 and 2007). On the contrary,
Table 4 Nitrogen budgets of the sub-basins of the RRD (units are 106 kg TN year-1)
TN, 106 kg year-1 Bui SB Boi SB Day
estuary SB
Lower Red
River SB
Duong SB Total
RRD
Area (km2) 2,751 2,473 1,413 4,773 2,902 14,312
Soil system
Atmosph. deposition
Forest 0.2 0.5 0.1 0.1 0.1 1
Agriculture 1.2 0.7 0.6 2.3 1.4 6.2
Nitrogen fixation
Forest 0.2 0.5 0.1 0.1 0.1 1
Grassland and cropland 7.4 1.6 3 13.2 6 31.1
Fertilizer application 24.4 9.7 13.7 56.6 27.6 132
Cattle farming and aqua-culture
Meat and dairy production 6.0 0.8 1.4 9.2 6.5 23.9
Excretion 20.4 8.9 7.5 35.1 22.4 94.3
Grazing and feed consumption 23.8 7.6 9.9 52.1 27.9 121.4
Agriculture and food balance
Agricultural production 40.4 13.6 21.6 94.1 45.5 215.2
Net commercial export -5.2 3.0 6.2 16.3 -1.3 18.9
Human consumption 21.7 2.9 5.6 25.7 18.9 74.9
Hydrosystem
Inputs to the hydrosystem
Domestic wastewater release 20.1 1.1 4.0 18.4 15.1 58.6
Industrial wastewater release 1.8 0.2 0.4 1.8 2.4 6.6
Leaching from forest soil 0.1 0.1 0.1 0 0 0.4
Leaching from agricutural soil 0.6 0.3 0.4 1.6 0.7 3.6
Input from upstream tributaries 4.7 0 32.7 100.3 56.5 160.5
R Inputs 27.3 1.7 37.6 122.1 74.7 229.8
Riverine delivery at the outlet
TN 10.0 1.3 21.6 71.2 59.2 129.5
Retention 17.3 0.4 16.0 51.0 15.5 100.3
Retention/input (%) 63.5 24.3 42.6 41.7 20.7 43.6
The budget is also indicated for the whole RRD
250 Biogeochemistry (2012) 107:241–259
123

the Bui sub-basin, with a high population density
(1,751 inhabitants km-2, the highest among all the
other sub-basins) and intensive livestock farming,
must import a large amount of agricultural products
(production is 40.4 9 106 kg N year-1 and con-
sumption is 45.5 9 106 kg N year-1, i.e., a differ-
ence of 5 9 106 kg N year-1) and is therefore a net
importer of agricultural products. The large amount
of wastewater produced in the Bui basin results in
low oxygenation of many rivers and their sediments,
which explains the rather high denitrification during
transfer in the drainage network, compared with that
in the Boi sub-basin (Fig. 4a, b). Finally, the riverine
export from the Bui sub-basin amounts to 10 9
106 kg N year-1 (about half coming from upstream
influent Red River water through the Nhue and Chau
rivers), while the corresponding figure is 1.3 9 106
kg N year-1 from the Boi sub-basin. From the total
nitrogen inputs to the basin, only 13 and 22% are
delivered at the outlet of the Boi and Bui respec-
tively. The budgets for the drainage network itself
show a retention ranging from 48% in the Boi to 63%
in the Bui (Table 4). These figures show the very
high N retention capacity of both the delta’s soils and
hydrosystems.
The SS budget in the delta also shows a strikingly
high retention (see Fig. 1c). Of the 23,630 9 106 kg
SS year-1 entering the delta, only 5,800 9 106 kg
SS year-1 is delivered to the coastal zone, i.e., a
retention of about 75% (from 51 to 86% in the Bui
and Lower RR estuary sub-basins, respectively).
Retention in the three major branches of the delta
Table 5 Phosphorus budgets of the sub-basins of the RRD (Units are 106 kg TP year-1)
TP, 106 kg year-1 Bui SB Boi SB Estuary SB Lower Red River SB Duong SB Total RRD
Area (km2) 2,751.0 2,473 1,413 4,773 2,902 14,312
Soil system
Atmospheric deposition
Forest 0.0 0.1 0.0 0.0 0.0 0.1
Agriculture 0.1 0.1 0.1 0.3 0.2 0.7
Fertilizer application 10.1 4.2 5.6 22.9 11.1 54.0
Cattle farming
Meat and dairy production 0.5 0.1 0.1 0.8 0.6 2.1
Excretion 3.4 1.6 1.3 5.7 3.7 15.8
Grazing and feed consumption 4.1 1.5 1.7 9.2 4.8 21.3
Agriculture and food balance
Agricultural production 6.5 2.5 3.5 15.2 7.1 34.8
Net commercial export -1.0 0.5 0.9 2.0 -0.6 1.8
Human consumption 3.4 0.5 0.9 4.0 3.0 11.7
Hydrosystem
Inputs to the hydrosystem
Domestic wastewater release 3.2 0.3 0.6 2.9 2.4 9.5
Industrial wastewater release 0.5 0.1 0.1 0.5 0.7 1.9
Leaching from forest soil 0.0 0.1 0.0 0.0 0.0 0.1
Leaching from agricutural soil 0.6 0.1 0.1 0.4 0.2 0.8
Input from upstream tributaries 1.4 0.0 13.0 36.1 20.1 57.1
R Inputs 5.7 0.6 13.8 39.9 23.4 69.4
Riverine delivery at the outlet
Particulate P 0.1 0.2 1.5 14.2 6.7 11.6
Total P 0.9 0.2 5.2 26.8 11.9 31.5
Retention 4.8 0.4 8.6 13.1 11.6 37.9
Retention/input (%) 84.1 60.4 62.3 32.9 49.4 54.6
The budget is also indicated for the whole RRD
Biogeochemistry (2012) 107:241–259 251
123
amounts to 61, 53, and 86% in the Duong, lower Red
River, and Day estuary sub-basins, respectively. This
retention of suspended solid is necessarily accompa-
nied by a corresponding retention of particulate
nutrients.
At the scale of the whole delta (Fig. 4a), the
striking feature is that although the total amount of N
brought into the delta area as fertilizers, N2 fixation,
atmospheric deposition and net import of food and
feed (i.e., a total of 189 9 106 kg N year-1) repre-
sents more than the load of the Red River at the outlet
of the upstream basin (i.e., 160 106 kg N year-1), the
amount discharged at the outlets of the delta (i.e., 130
106 kg N year-1) is approximately 20% lower.
Whatever the uncertainty on the different terms of
our budget can be, a robust conclusion is that more
than half the total amount of nitrogen brought into the
delta from the upstream catchment and human
activity is eliminated or retained before reaching
the sea. Waterlogged delta soils and the poorly
oxygenated water of a large part of the drainage
network both contribute to storing or eliminating the
total N loading, thus acting as a rather efficient filter
for anthropogenic N inputs.
The same appears true for the P budget (Fig. 4b).
In spite of a large input of P as fertilizers (estimated
to 55 9 106 kg P year-1 based on data on agricul-
tural practices) and manure (estimated to 21 9
106 kg P year-1 based on livestock census), largely
in excess over the crop requirements (estimated to
35 9 106 kg P year-1), export by leaching and
erosion from the delta area appears very low based
on our estimates of runoff (1 9 106 kg P year-1).
Even if the latter is rather imprecise, the conclusion
that a large fraction (41 9 106 kg P year-1) of P
brought in excess of crop uptake is stored in the soils
is robust. Such high rates of P accumulation, which
are equivalent to 28 kg P ha-1 year-1, are not
unusual in European intensive agricultural areas, like
in the Netherlands (Isermann 2007). Wastewater
discharge is the most significant P source for surface
water and amounts to 11 9 106 kg P year-1, which
adds to the 57 9 106 kg P year-1 coming from the
upstream Red River watershed. The total discharge at
the delta outlets is 32 9 106 kg P year-1, thus
showing retention of more than 50%. As P is
dominated by particulate forms and dissolved P is
known to be easily exchangeable from the dissolved
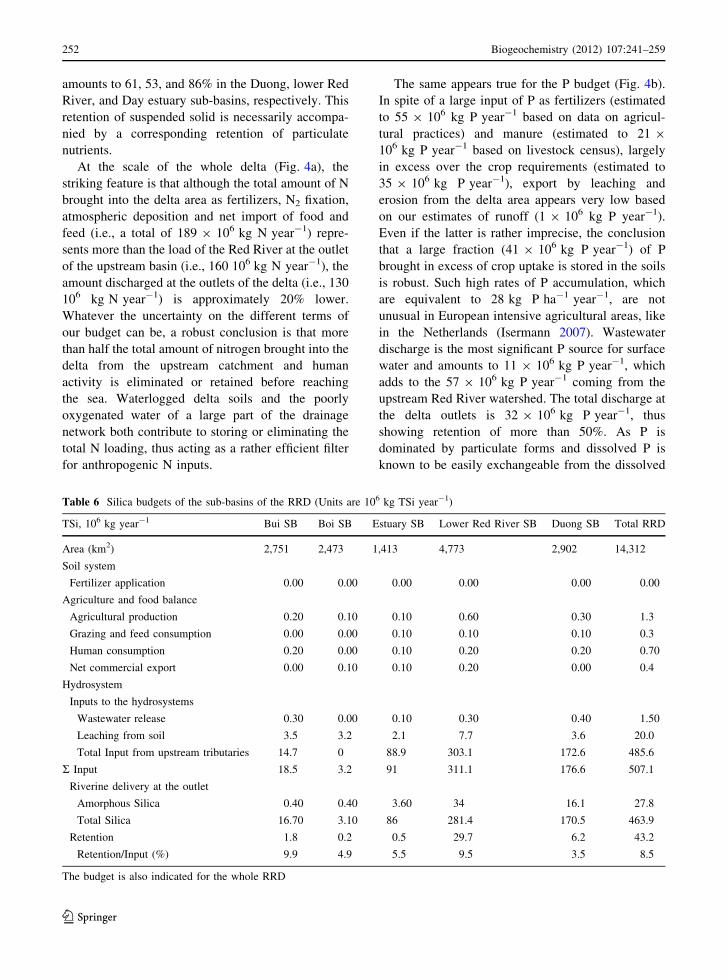
Table 6 Silica budgets of the sub-basins of the RRD (Units are 106 kg TSi year-1)
TSi, 106 kg year-1 Bui SB Boi SB Estuary SB Lower Red River SB Duong SB Total RRD
Area (km2) 2,751 2,473 1,413 4,773 2,902 14,312
Soil system
Fertilizer application 0.00 0.00 0.00 0.00 0.00 0.00
Agriculture and food balance
Agricultural production 0.20 0.10 0.10 0.60 0.30 1.3
Grazing and feed consumption 0.00 0.00 0.10 0.10 0.10 0.3
Human consumption 0.20 0.00 0.10 0.20 0.20 0.70
Net commercial export 0.00 0.10 0.10 0.20 0.00 0.4
Hydrosystem
Inputs to the hydrosystems
Wastewater release 0.30 0.00 0.10 0.30 0.40 1.50
Leaching from soil 3.5 3.2 2.1 7.7 3.6 20.0
Total Input from upstream tributaries 14.7 0 88.9 303.1 172.6 485.6
R Input 18.5 3.2 91 311.1 176.6 507.1
Riverine delivery at the outlet
Amorphous Silica 0.40 0.40 3.60 34 16.1 27.8
Total Silica 16.70 3.10 86 281.4 170.5 463.9
Retention 1.8 0.2 0.5 29.7 6.2 43.2
Retention/Input (%) 9.9 4.9 5.5 9.5 3.5 8.5
The budget is also indicated for the whole RRD
252 Biogeochemistry (2012) 107:241–259
123

(a)
(b)
Fig. 3 a Nitrogen budget for the Bui basin (2751 km2), dominated by agricultural soil for the year 2006 (unit: 106 kg year-1).
b Nitrogen budget for the Boi basin (2473 km2) dominated by forest for the year 2006 (unit: 106 kg year-1)
Biogeochemistry (2012) 107:241–259 253
123
to the particulate phase (Nemery and Garnier 2007a,
b; House 2003), sedimentation probably plays the
major role here, although uptake by algae and
macrophytes cannot be excluded. The highest reten-
tion is observed in the Bui ([80%). Thanks to this
high retention rate in the most populated sub-basin,
not all P brought from domestic effluents reaches the
coastal zone.
The budget of Si transformation (Fig. 4c) is
simpler than that of N and P, as the anthropogenic
contribution to the Si cycle is much less significant.
Human point inputs of Si are indeed small when
compared with N and P. For the hydrological system,
we have measured Si under its two major forms,
dissolved and particulate amorphous Si. It is worth
mentioning that on a global scale the ASi of only a
few rivers have been documented, except for some of
the rivers of the north Atlantic, the Seine (Garnier
et al. 2002; Sferratore et al. 2006) and the Scheldt
(Struyf et al. 2006) and those of the Baltic Sea, e.g.,
the Oder (Pastuszak et al. 2008). Since Si originates
essentially from phytoliths eroded from the watershed
soils, the RRD, with its flat topology and a low rate of
erosion (Mai 2007), represents a rather low source of
ASi (Table 6). ASi originates mainly from the
tributaries, upstream of the delta. The particulate Si
at the outlet of the RRD averages 6% of total Si,
while it averages 16% at the inlet of the delta,
implying that from the 113 9 106 kg ASi year-1
which enters the delta, only 28 9 106 kg ASi year-1
is delivered to the sea. This significant ASi retention
process through sedimentation is, however, partly
compensated by dissolution, as the estimated export
of DSi at the outlets of the delta (436 9 106 kg
DSi year-1) is higher than the import from the
upstream Red River basin (366 9 106 kg DSi
year-1) (Fig. 4c). In total, the overall Si retention
amounts to 36 9 106 kg DSi year-1, i.e. only 8.5%
of the total inputs to the delta area. Here again, the
conclusion of a low retention by the delta of the
upstream silica inputs is robust in spite of the 25%
uncertainty on the budget terms.
Eutrophication potential
It is now recognized that the basic cause of coastal zone
eutrophication is related not only to the general
nutrient enrichment of the marine system, but also to
the imbalance in the delivery of N and P with respect to
Si (Billen and Garnier 1997, 2007; Turner et al. 2006;
Conley 2002). Based on the ratios corresponding to the
physiological needs of the algae (Redfield et al. 1963),
Billen and Garnier (2007) have defined the ICEP
(indicator of coastal eutrophication potential) in order
to provide insight into the risk of eutrophication at the
coastal zone due to riverine nutrient delivery. Negative
ICEP corresponds to situations where Si is delivered in
excess over P or N, thus preventing Si limitation of
marine diatoms, which could result in the proliferation
of non siliceous, harmful bloom-forming algae.
The risk of eutrophication increases with increasing
positive ICEP (Billen and Garnier 2007). Both
N–ICEP and P–ICEP can be defined (Garnier et al.
2010a, b) according to whether N or P is supposed to
be the most limiting nutrient:N�ICEP ¼ NFlx=½14 � 16ð Þ�SiFlx= 28 � 20ð Þ� � 106 � 12 if N=P\16
N limitingð ÞP�ICEP ¼ PFlx=31� SiFlx=ð28 � 20Þ½ ��106 � 12 if N=P [ 16 Plimitingð Þwhere ICEP is
expressed in kg C km-2 day-1, NFlx, PFlx and SiFlx
are, respectively, the mean specific fluxes of total
nitrogen, phosphorus and dissolved silica (expressed
as kg km-2 day-1). As defined, ICEP does not take
into account the specific conditions determining the
response of the coastal zone into which the river is
discharging (see Rabouille et al. 2008; Diaz and
Rosenberg 2008), but simply represents the potential
impact of the riverine fluxes.
At the inlet of the RRD (Red River at SonTay),
negative values are calculated for the N–ICEP
(-3.1 kg C km-2 day-1) and positive for the
P–ICEP (21.9 kg C km-2 day-1) (Table 7). At the
outlet of the delta, both the N–ICEP and P–ICEP are
reduced, to -5.1 kg C km-2 day-1 for N–ICEP and
3.9 kg C km-2 day-1 for P–ICEP. This indicates that
the delta has quite a positive effect in counteracting
coastal zone eutrophication, owing to the above-
mentioned efficient filtering effect of the delta toward
N and P, while Si fluxes are minimally affected.
Without this effect, the risk of eutrophication of the
Tonkin Bay would have been significant as evidenced
by positive N–ICEP and P–ICEP values (Table 7).
Instead, the RRD coastal zone appears still N-limited
and shows a P level close to the physiological
equilibrium with regard to Si, thus not subject to
severe eutrophication. It could be however that the
protecting role of the delta might not be sufficient in
the future with growing population, further agricul-
ture intensification in the delta area, and a reduction
254 Biogeochemistry (2012) 107:241–259
123
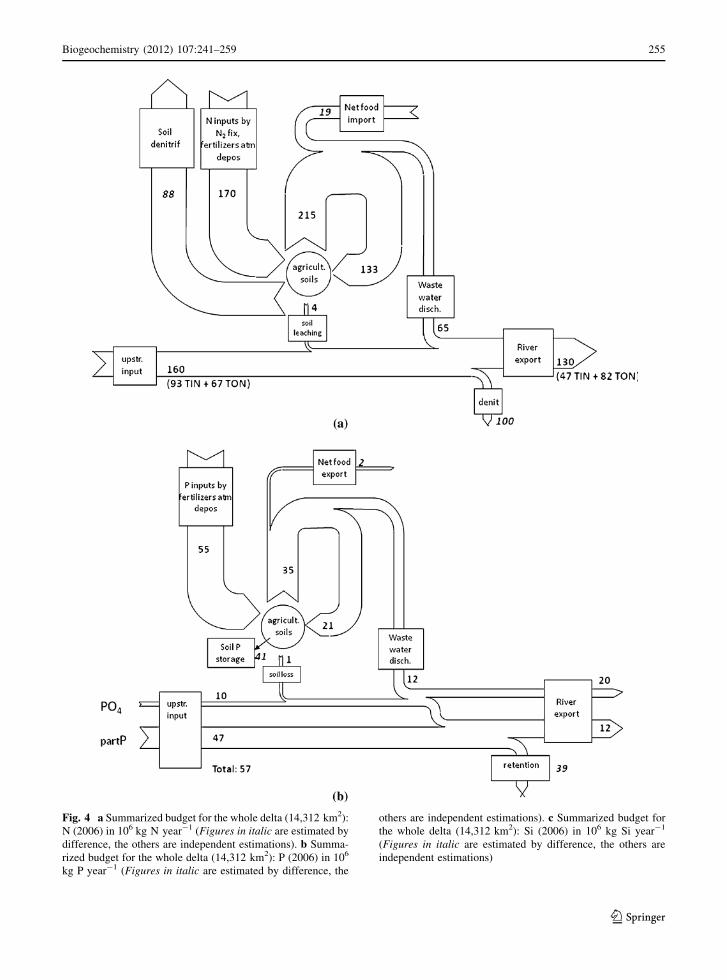
Fig. 4 a Summarized budget for the whole delta (14,312 km2):
N (2006) in 106 kg N year-1 (Figures in italic are estimated by
difference, the others are independent estimations). b Summa-
rized budget for the whole delta (14,312 km2): P (2006) in 106
kg P year-1 (Figures in italic are estimated by difference, the
others are independent estimations). c Summarized budget for
the whole delta (14,312 km2): Si (2006) in 106 kg Si year-1
(Figures in italic are estimated by difference, the others are
independent estimations)
Biogeochemistry (2012) 107:241–259 255
123

of the upstream Si inputs due to the planned
construction of two additional large dams on the
upper course of the Red River and one on its
tributaries (Li et al. 2007; Humborg et al. 2006, 2008;
Yunev et al. 2007). Also, the high amounts of P
accumulated in agricultural soils and river sediments
are a threat for the future water quality in this region
of the world (Sharpley et al. 2001; Ulen and Kalisky
2005, House 2003).
Comparison with other estuarine systems
There are only very few estimates of the retention
capacity of estuarine and deltaic systems on riverine N,
P and Si fluxes, allowing an assessment of their
buffering role with respect to eutrophication potential.
The Danube delta studied by Raducu (2002) offers an
interesting comparison. With a much lower population
density than the RRD (90 vs. 1,160 inhabitants km-2),
this system shows only respectively 7–10 and 6–8%
retention of the total inputs of N and P entering the
delta, while DSi retention is about 20–30%. In this
case, the nutrient processing in the delta, although of
relatively low extent, would tend to increase the risk of
eutrophication. The case of the Seine estuary, recently
studied from this respect by Garnier et al. (2010a, b)
show a similarly limited effect of this highly perturbed
micro-tidal estuarine system, with annual N, P and Si
retention of 7, 31 and 4% respectively. Compared with
these two systems, the RRD thus appears to have a
much higher capacity for N and P retention while being
less retentive towards silica fluxes. Further studies are
(c)
Fig. 4 continued
Table 7 Total riverine
delivery in TN, TP, TSi and
value of N- ICEP and P–
ICEP at the inlets and
outlets of the RRD
The calculated flux and
ICEP values as they would
be in the absence of the
delta drainage network
retention is also indicated
Total delta
inlets
Total delta
outlets
Total delta outlets
without retention
Riverine delivery at the outlet
TN, 106 kg N/year 160 129.5 230
TP, 106 kg P/year 57 31.5 69
TSi, 106 kg Si/year 479 463 507
N–ICEP, gC/km2/day -3.1 -5.1 2.5
P–ICEP, gC/km2/day 21.9 3.9 26.9
256 Biogeochemistry (2012) 107:241–259
123
required to allow generalization about the role of
deltaic and estuarine systems as buffer zones between
riverine and marine systems.
Acknowledgments The work was supported by the French
ANR program Day River, by the Vietnamese Academy of
Science and Technology (VAST, Vietnam), the Centre
National de la Recherche Scientifique (CNRS, France), the
Institute of Research for Development (IRD, France). Many
thanks are due to Prof. Georges Vachaud who coordinated the
ANR programme. The PhD thesis of Luu Thi Nguyet Minh is
supported by a scholarship from the French Embassy in
Vietnam and by a cooperation agreement between Pierre and
Marie Curie University (UPMC) and the Vietnamese Academy
of Science and Technology (VAST). The Federation Ile-de-
France for Research on the Environment (FIRE FR3020 CNRS
& UPMC) is greatly acknowledged for its interdisciplinary
research framework and its role in the signature of the
cooperation agreements between UPMC and VAST.
Open Access This article is distributed under the terms of the
Creative Commons Attribution Noncommercial License which
permits any noncommercial use, distribution, and reproduction
in any medium, provided the original author(s) and source are
credited.
References
Afnor (1982) Dosage des orthophosphates, des polyphosphates
et du phosphore total (methode spectrometrique) norme
AFNOR T90-023 de septembre 1982
Akaselsson C, Westling O, Sverdrup H, Gundersen P (2007)
Nutrient and carbon budgets in forest soils as decision
support in sustainable forest management. For Ecol
Manag 238:167–174
Baker AR, Weston K, Kelly SD, Voss M, Streu P, Cape JN
(2007) Dry and wet deposition of nutrients from the
tropical Atlantic atmosphere: links to primary productiv-
ity and nitrogen fixation. Deep-sea Res I 54:1704–1720
Bange WH (2000) It’s not a gas. Nature 408:301–302
Billen G, Garnier J (1997) The Phison River Plume: coastal
eutrophication in response to changes in land use and
water management in the watershed. Aquat Microb Ecol
13:3–17
Billen G, Garnier J (2007) River basin nutrient delivery to the
coastal sea: assessing its potential to sustain new pro-
duction of non-siliceous algae. Mar Chem 106:148–160
Billen G, Garnier J, Rousseau V (2005) Nutrient fluxes and
water quality in the drainage network of the Scheldt basin
over the last 50 years. Hydrobiologia 540:47–67
Billen G, Garnier J, Nemery J, Sebilo M, Sferratore A, Barles
S, Benoit P, Benoit M (2007) A long-term view of nutrient
transfers through the Seine river continuum. Sci Total
Environ 375:80–97
Boyer EW, Howarth RW (2008) Nitrogen Fluxes from Rivers
to the Coastal Oceans. Chapter 36, in: Nitrogen in the
marine environment, Elsevier, pp 1565–1584. doi:10.
1016/B978-0-12-372522-6.00036-0
Boyer EW, Goodale CL, Jaworski NA, Howarth RW (2002)
Anthropogenic nitrogen sources and relationships to riv-
erine nitrogen export in the northeastern USA. Biogeo-
chemistry 57(58):137–169
Buranapratheprat A, Testuo Y, Thanomsak B, Pichan S (2002)
Seasonal variations in Inorganic Nutrients Budgets of the
Bankapong Estuary, Thailand. J Oceanogr 58:557–564
Chapin F, Matson P, Mooney H (2002) Principles of terrestrial
ecosystem ecology. Springer, New York, 450 pp
Conley DJ (1998) An interlaboratory comparison for the
measurement of biogenic silica in sediments. Mar Chem
63:39–48
Conley DJ (2002) Terrestrial ecosystem and the global bio-
geochemical silica cycle. Glob Cycles 16:1121–1129
Conley DJ, Kilham SS, Theriot EC (1989) Differences in silica
content between marine and freshwater diatoms. Limnol
Oceanogr 34:205–213
Cordell D, Drangert J-O, White S (2009) The story of phos-
phorus: global food security. Glob Environ Change 19:
292–305
Crutzen PJ, Ehhalt DH (1977) Effects of nitrogen fertilizers
and combustion on the stratospheric ozone layer. Ambio
6:112–117
Cugier P, Billen G, Guillaud JF, Garnier J, Menesguen A
(2005) Modelling eutrophication of the Seine Bight under
present, historical and future Seine river nutrient loads.
J Hydrol 304:381–396
Diaz RJ, Rosenberg R (2008) Spreading dead zones and con-
sequences for marine ecosystems. Science 321:926–929.
doi:10.1126/science.1156401
Eberlein K, Katter G (1984) Automatic method for the deter-
mination of orthophosphate and dissolved phosphorus in
the marine environment. Fresenius Z Anal Chem 326:
354–357
Faerge J, Magid J, Penning de Vries FWT (2001) Urban
nutrient balance for Bankok. Ecol Model 139:63–74
FAO (2003) Assessment of soil nutrient balance: approaches
and methodologies. FAO Fertilizer and Plant Nutrition
Bulletin 14, Rome, 100 pp
FAO (2005) Bilan des elements nutritifs du sol a differentes
echelles. Application des methodes intermediaires aux
realites africaines. FAO Fertilizer and Plant Nutrition
Bulletin 15, Rome, 158 pp
FAO (2006) Fertilizer use by crop. FAO Fertilizer and Plant
Nutrition Bulletin 17, Rome, 124 pp
Galloway JN, Cowling EB (2002) Reactive nitrogen and the
world: 200 years of change. Ambio 31(2):64–71
Garnier J, Leporcq B, Sanchez N, Philippon X (1999) Bio-
geochemical budgets in three large reservoirs of the Seine
basin (Marne, Seine and Aube reservoirs). Biogeochem-
istry 47:119–146
Garnier J, Billen G, Hannon E, Fonbonne S, Videnina Y,
Soulie M (2002) Modelling the transfer and retention of
nutrients in the drainage network of the Danube river.
Estuar Coast Shelf Sci 54:285–308
Garnier J, Billen G, Nemery J, Sebilo M (2010a) Transfor-
mations of nutrients (N, P, Si) in the turbidity maximum
zone of the Seine estuary and export to the sea. Estuar
Coast Shelf Sci 90:129–141
Garnier J, Beusen A, Thieu V, Billen G, Bouwman L (2010)
N:P:Si nutrient export ratios and ecological consequences
Biogeochemistry (2012) 107:241–259 257
123
in coastal seas evaluated by the ICEP approach. Glob
Biogeochem Cycles 24. doi:10.1029/2009GB003583
General Statistic Office (2006) Statistical handbook of Viet-
nam. Statistical Publisher, Hanoi
House AW (2003) Geochemical cycling of phosphorus in
rivers. Appl Geochem 18:739–748
Howarth RW, Billen G, Swaney D et al (1996) Regional
nitrogen budgets and riverine N & P fluxes for the
drainages to the North Atlantic Ocean: natural and human
influences. Biogeochemistry 35:75–139
Humborg C, Pastuszak M, Aigars J, Siegmund H, Morth CM,
Ittekkot V (2006) Decreased silica land-sea fluxes through
damming in the Baltic Sea catchment—significance of
particle trapping and hydrological alterations. Biogeo-
chemistry 77:265–281
Humborg C, Smedberg E, Rodriguez Medina M, Morth CM
(2008) Changes in dissolved silicate loads to the Baltic
Sea—the effects of lakes and reservoirs. J Mar Syst
73:223–235
IMHE – MONRE (1996–2006) Vietnamese Ministry of Envi-
ronment and Natural Resources. Annual report on
hydrological observation in Vietnam
Isermann K (2007) Phosphorus balances in Europe and
implications for diffuse pollution policy. In: Heckrath G,
Rubæk GH, Kronvang B (eds) Diffuse phosphorus loss:
risk assessment, mitigation options and ecological effects
in river basins. 5th International phosphorus workshop
(IPW5) DJF Plant Science 130. Faculty of Agricultural
Sciences, Tjele, pp 91–94
Jones MN (1984) Nitrate reduction by shaking with cadmium,
alternative to cadmium columns. Water Res 18:643–646
Justic D, Rabalais NN, Turner RE (2002) Modeling the impacts
of decadal changes in riverine nutrient fluxes on coastal
eutrophication near the Mississippi River Delta. Ecol
Model 152:33–46
Knowler D (2007) Estimation of a stock–recruitment rela-
tionship for Black Sea anchovy (Engraulis encrasicolus)
under the influence of nutrient enrichment and the inva-
sive comb-jelly, Mnemiopsis leidyi. Fish Res 84(3):
275–281
Kurosawa K, Do NH, Nguyen HT, Ho TLT, Tran TLH,
Nguyen TC, Egashira K (2006) Temporal and spatial
variations of inorganic nitrogen levels in surface and
groundwater around Hanoi, Vietnam. Commun Soil Sci
Plant Anal 37:403–415
Le TPQ, Billen G, Garnier J, Thery S, Fezard C, Chau VM
(2005) Nutrient (N, P) budgets for the Red River basin
(Vietnam and China). Glob Biogeochem Cycles
19:GB2022. doi:10.1029/2004GB002405
Le TPQ, Billen G, Garnier J, Thery S, Ruelland D, Nghiem
XA, Chau VM (2010) Nutrient (N, P, Si) transfers in the
subtropical Red River system (China and Vietnam):
modelling and budget of nutrient sources and sinks. Asian
Earth Sci 37:259–274
Li M, Xu K, Watanabe M, Chen Z (2007) Long-term variations
in dissolved silicate, nitrogen, and phosphorus flux from
the Yangtze River into the East China Sea and impacts on
estuarine ecosystem Estuarine. Coast Shelf Sci 71:3–12
Luu TNM, Garnier J, Billen G, Orange D, Nemery J, Le TPQ,
Tran HT, Le LA (2010) Hydrological regime and water
budget of the Red River Delta (Northern Vietnam).
J Asian Earth Sci 37(3):219–228
Mai VT (2007) Soil erosion and nitrogen leaching in northern
Vietnam: experimentation and modelling. PhD thesis,
Wageningen University, Wageningen, The Netherlands,
182 pp
Moon S, Huh Y, Qin J, Nguyen VP (2007) Chemical weath-
ering in the Hong (Red) River basin: rates of silicate
weathering and their controlling factors. Geochim Cos-
mochim Acta 71(6):1411–1430
Nemery J, Garnier J (2007a) Origin and fate of phosphorus in
the Seine watershed (France): agricultural and hydro-
graphic P budgets. J Geophys Res 112:G03012. doi:
10.1029/2006JG000331
Nemery J, Garnier J (2007b) Dynamics of particulate phos-
phorus in the Seine estuary (France). Hydrobiologia
588:271–290
Ngo LL, Madsen H, Rosbjerg D (2007) Simulation and opti-
misation modelling approach for operation of the Hoa
Binh reservoir, Vietnam. J Hydrol 336:269–281
Nguyen NS, Hua CT, Nguyen CH, Nguyen VT, Lang VK,
Pham VN, Nguyen VT (1995) Case study report « Red
River Delta, Vietnam », Project on integrated manage-
ment of watersheds in relation to management and con-
servation of nearshore coastal and marine areas in East
Asia Region, 78 pp
Nguyen VC, Do XS, Nguyen QT et al (2005) Elaboration d’un
projet de preservation de l’environnement du bassin Nhue et
Day. Rapport d’un projet national, 400 pp (in Vietnamese)
Pastuszak M, Conley DJ, Humborg C, Witek Z, Sitek S (2008)
Silicon dynamics in the Oder estuary, Baltic Sea. J Mar
Syst 73:250–262
Rabouille C, Conley DJ, Dai MH et al (2008) Comparison of
hypoxia among four river-dominated ocean margins: the
Changjiang (Yangtze), Mississippi, Pearl, and Rhone
rivers. Cont Shelf Res 28(12):1527–1537
Raducu MC (2002) Transfert des nutriments dans le basin du
Danube et apports a la Mer Noire: modelisation et bilans.
These de doctorat de l’Universite Pierre et Marie Curie.
Ecole Doctorale Geosciences et Ressources Naturelles,
Paris
Ragueneau O, Treguer P (1994) Determination of biogenic
silica in coastal waters: applicability and limits of the
alkaline digestion method. Mar Chem 45:43–51
Ramade F (2009) Element d’Ecologie. Ecologie fondamentale,
Dunod, Paris, 690 pp
Redfield AC, Ketchum BH, Richard FA (1963) The influence
of organisms on the composition of sea-water. In: Hill
MN (ed) The sea. Wiley, New York, pp 12–37
Rodier J (1984) L’analyse de l’eau. 7eme edition. Dunot (ed),
Paris, France, 1365 pp
Sferratore A, Garnier J, Billen G, Conley D, Pinault S (2006)
Diffuse and point sources of Silica in the Seine River
Watershed. Environ Sci Technol 40:6630–6635
Sharpley AN, McDowell RW, Kleinman PJA (2001) Phos-
phorus loss from land to water: integrating agricultural
and environmental management. Plant Soil 237:287–307
Slawyck G, McIsaac JJ (1972) Comparison of two automated
ammonium methods in a region of coastal upwelling.
Deep-Sea Res 19:1–4
258 Biogeochemistry (2012) 107:241–259
123

Smil V (1999) Nitrogen in crop production: an account of
global flows. Glob Biogeochem Cycles 13(2):647–662
Struyf E, Dausse A, Van Damme S et al (2006) Tidal marshes
and biogenic silica recycling at the land–sea interface.
Limnol Oceanogr 51:838–846
Thieu V, Billen G, Garnier J (2009) Nutrient transfer in three
contrasting NW European watersheds: the Seine, Somme,
and Scheldt Rivers. A comparative application of the
Seneque/Riverstrahler model. Water Res 43(6):1740–1754
Tran TX (2007) Hydrological characteristic and water resour-
ces in Vietnam, Agricultural Editor Hanoi, 427 pp (in
Vietnamese)
Tran HT, Tran T, Duong HS et al (2006) Final report on water
quality modeling for the three river basins: Cau, Nhue—
Day, Sai Gon—Dong Nai. National Institute of Meteo-
rology, Hydrology and Environment, 240 pp
Trinh AD, Bonnet MP, Vachaud G, Chau VM, Prieur N, Vu
DL, Le LA (2006) Biogeochemical modelling of Nhue
River (Hanoi, Vietnam): practical identifiability analysis
and parameters estimations. Ecol Model 193:182–204
Turner RE, Rabalais NN, Justic D (2006) Predicting summer
hypoxia in the northern Gulf of Mexico: Riverine N, P and
Si loading. Mar Pollut Bull 52:139–148
Ulen BM, Kalisky T (2005) Water erosion and phosphorus
problems in an agricultural catchment—need for natural
research for implementation of the EU Water Framework
Directive. Environ Sci Policy 8:477–484
Van Drecht G, Bouwman, Knoop J, Beusen M, Meinardi CR
(2003) Global modelling of the fate of nitrogen from point
and nonpoint sources in soils, groundwater and surface
water. Glob Biogeochem Cycles 17(4):1115–1120. doi:
10.1029/2003GB002060
Verhoff FH, Yaksich SM, Melfi DA (1980) River nutrient and
chemical transport estimates. J Environ Eng Div ASCE
10:591–608
Vollenweider RA (1968) Scientific fundamentals of the
eutrophication of lakes and flowing waters with particular
reference to nitrogen and phosphorus as factors in eutro-
phication. Water Management Research. OECD, Paris.
Tech. Rpt. DA 5/SCI/68.27, 250 pp
Wassmann P, Olli K (2004). Drainage basin nutrient inputs and
eutrophication: an integrated approach. University of
Tromsø, Norway, 325 pp. www.ut.ee/olli/eutr/
Wetzel RG (1983) Limnology, 2nd edn. Saunders College
Publishing, Philadelphia, 860 pp
Wosten JHM, Willigen P, Tri NH, Lien TV, Smith SV (2003)
Nutrient dynamics in mangrove areas of the Red River
Estuary in Vietnam. Estuar Coastal Shelf Sci 57:65–72
Yunev OA, Carstensen J, Moncheva S, Khaliulin A, Ærtebjerg
G, Nixon S (2007) Nutrient and phytoplankton trends on
the western Black Sea shelf in response to cultural
eutrophication and climate changes. Estuar Coastal Shelf
Sci 74:63–76
Biogeochemistry (2012) 107:241–259 259
123
Related Documents