N O R T H E R N T R U S T G L O B A L E C O N O M I C R E S E A R C H Paul L. Kasriel, Chief Economist PH: 312.444.4145 [email protected] October 2009 © 2006 Northern Trust Corporation northerntrust.com The Shoals of Depression Have Been Avoided, but Strong Headwinds Remain

N O R T H E R N T R U S T G L O B A L E C O N O M I C R E S E A R C H Paul L. Kasriel, Chief Economist PH: 312.444.4145 [email protected] October 2009 © 2006.
Dec 16, 2015
Welcome message from author
This document is posted to help you gain knowledge. Please leave a comment to let me know what you think about it! Share it to your friends and learn new things together.
Transcript

N O R T H E R N T R U S T G L O B A L E C O N O M I C R E S E A R C H
Paul L. Kasriel, Chief EconomistPH: [email protected]
October 2009
© 2006 Northern Trust Corporation northerntrust.com
The Shoals of Depression Have Been Avoided, but Strong Headwinds Remain
2 Northern Trust Global Economic Research
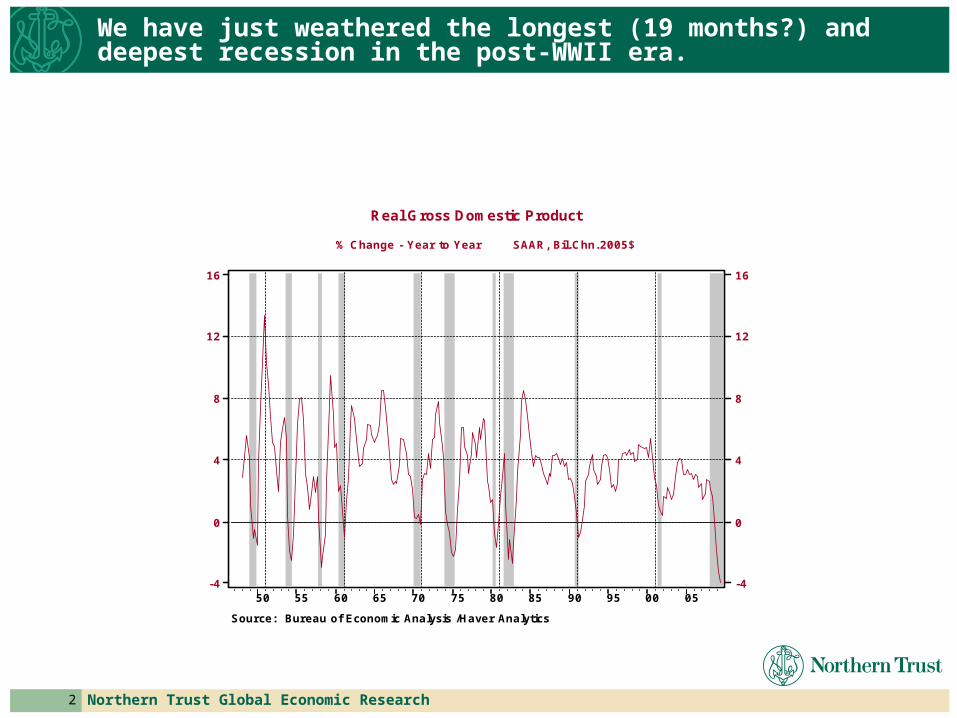
We have just weathered the longest (19 months?) and deepest recession in the post-WWII era.
Real Gross Domestic Product
% Change - Year to Year SAAR, Bil. Chn. 2005$
050095908580757065605550
Source: Bureau of Economic Analysis /Haver Analytics
16
12
8
4
0
-4
16
12
8
4
0
-4

3 Northern Trust Global Economic Research
In August, the ISM-Mfg. Composite Index popped above 50 for the first time since January 2008.
ISM Manufacturing: PMI Composite Index
SA, 50+=Increasing
SEPAUGJULJUN09
MAYAPRMARFEBJANDECNOVOCT
Source: Institute for Supply Management /Haver Analytics
56
52
48
44
40
36
32
56
52
48
44
40
36
32

4 Northern Trust Global Economic Research
The behavior of the ISM-Mfg. Index suggests that the recession ended in July 2009.
ISM Manufacturing: PMI Composite Index
SA, 50+=Increasing
050095908580757065605550
Source: Institute for Supply Management /Haver Analytics
80
70
60
50
40
30
20
80
70
60
50
40
30
20
It is not that any one sector is soaring …
…rather a number of sectors have either stopped descending or are descending at a much slower rate.

6 Northern Trust Global Economic Research
Thanks to the sharp decline in home prices and the low level of mortgage rates, house purchases are now much more affordable.
Composite Housing Affordability Index
Median Inc=Qualifying Inc=100
05009590858075
Source: National Association of Realtors /Haver Analytics
180
160
140
120
100
80
60
180
160
140
120
100
80
60

7 Northern Trust Global Economic Research
High housing affordability and the $8K first-time-homebuyer tax credit have resulted in increases in home sales in four of the past five months.
Home Sales: Sum of New and Existing
SAAR, Thous
0908070605040302
Source: Haver Analytics
9000
8250
7500
6750
6000
5250
4500
9000
8250
7500
6750
6000
5250
4500
8 Northern Trust Global Economic Research
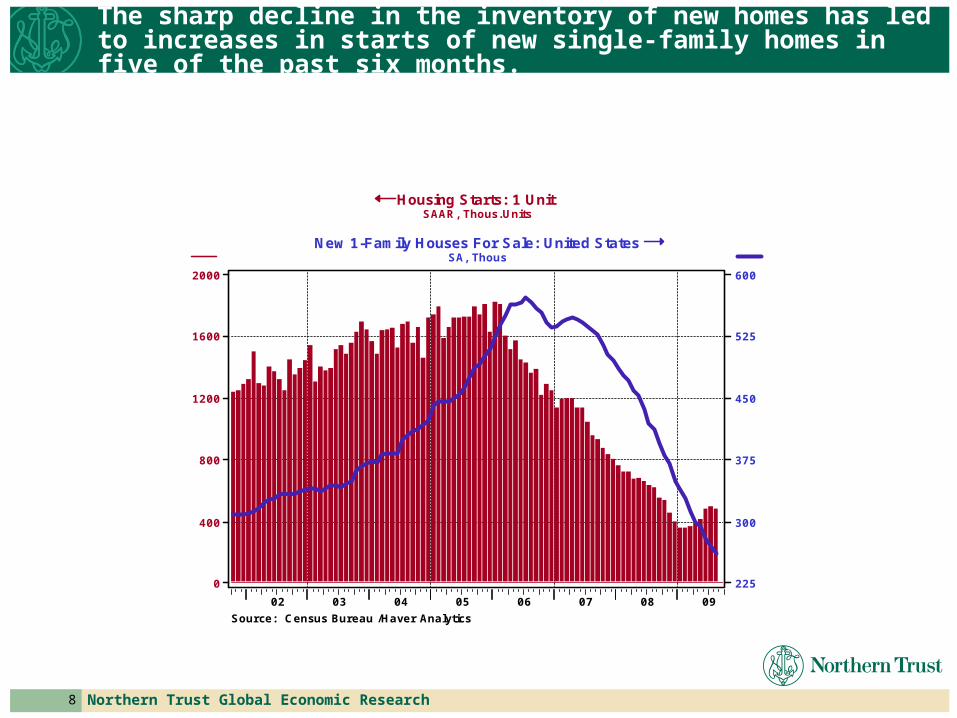
The sharp decline in the inventory of new homes has led to increases in starts of new single-family homes in five of the past six months.
Housing Starts: 1 UnitSAAR, Thous. Units
New 1-Family Houses For Sale: United StatesSA, Thous
0908070605040302
Source: Census Bureau /Haver Analytics
2000
1600
1200
800
400
0
600
525
450
375
300
225
9 Northern Trust Global Economic Research
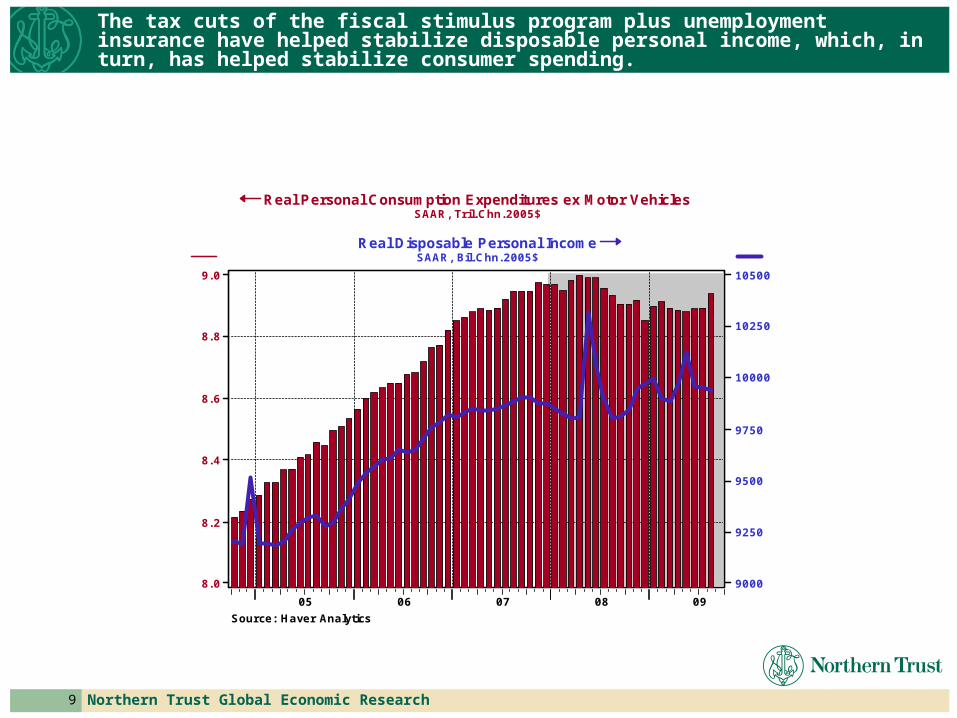
The tax cuts of the fiscal stimulus program plus unemployment insurance have helped stabilize disposable personal income, which, in turn, has helped stabilize consumer spending.
Real Personal Consumption Expenditures ex Motor VehiclesSAAR, Tr il. Chn. 2005$
Real Disposable Personal IncomeSAAR, Bil. Chn. 2005$
0908070605
Source: Haver Analytics
9. 0
8. 8
8. 6
8. 4
8. 2
8. 0
10500
10250
10000
9750
9500
9250
9000

10 Northern Trust Global Economic Research
Car and truck sales appeared to have bottomed even before “cash-for-clunkers.” There is natural replacement demand given that some of us are still driving 1995 Subarus!
Total Light Vehicle Retail Sales {Imported+Domestic}
SAAR, Mil. Units
09080706
Source: Autodata Corporation /Haver Analytics
18
16
14
12
10
8
18
16
14
12
10
8
11 Northern Trust Global Economic Research
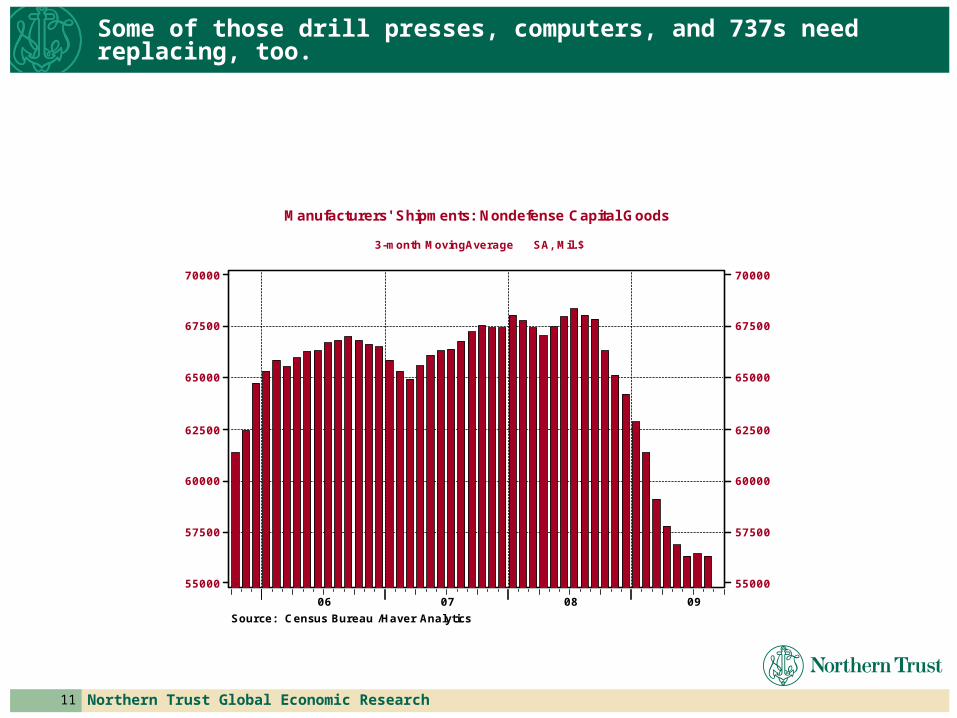
Some of those drill presses, computers, and 737s need replacing, too.
Manufacturers' Shipments: Nondefense Capital Goods
3-month MovingAverage SA, Mil. $
09080706
Source: Census Bureau /Haver Analytics
70000
67500
65000
62500
60000
57500
55000
70000
67500
65000
62500
60000
57500
55000

12 Northern Trust Global Economic Research
Economic activity is improving in the developed economies …
Euro Area16: Gross Domestic Product % Change - Annual Rate SA/WDA, Mil. Chn. 00. Euros
Japan: Gross Domestic Product % Change - Annual Rate SAAR, Bil. Chn. 2000. Yen
09080706
Sources: Eurostat, CAO /Haver
8
4
0
-4
-8
-12
-16
8
4
0
-4
-8
-12
-16
13 Northern Trust Global Economic Research
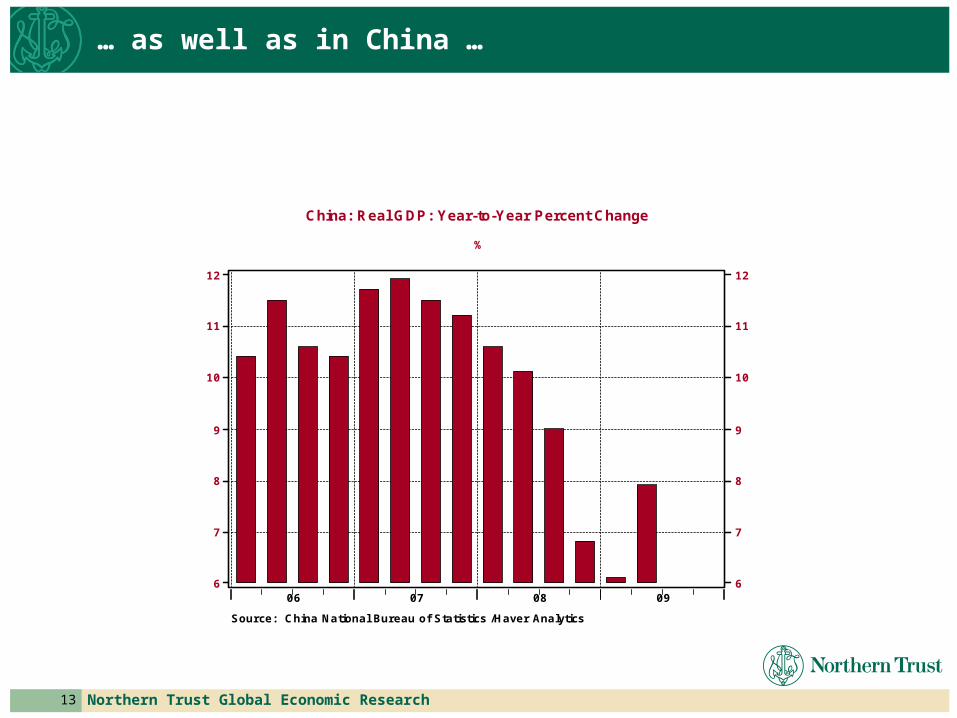
… as well as in China …
China: Real GDP: Year-to-Year Percent Change
%
09080706
Source: China National Bureau of Statistics /Haver Analytics
12
11
10
9
8
7
6
12
11
10
9
8
7
6
14 Northern Trust Global Economic Research
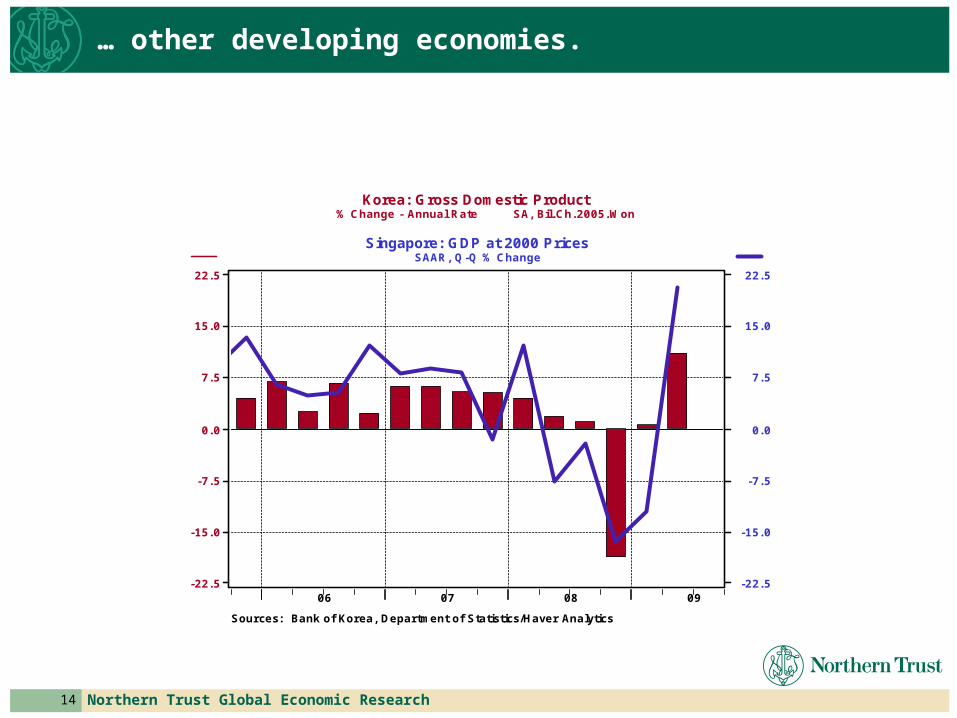
… other developing economies.
Korea: Gross Domestic Product % Change - Annual Rate SA, Bil. Ch. 2005. Won
Singapore: GDP at 2000 PricesSAAR, Q-Q % Change
09080706
Sources: Bank of Korea, Department of Statistics/Haver Analytics
22. 5
15. 0
7. 5
0. 0
-7. 5
-15. 0
-22. 5
22. 5
15. 0
7. 5
0. 0
-7. 5
-15. 0
-22. 5

15 Northern Trust Global Economic Research
The economic recovery underway in the rest of the world is boosting U.S. exports.
Exports, f.a.s.
SA, Mil. Chn. 2005$
090807Source: Bureau of the Census /Haver Analytics
105000
100000
95000
90000
85000
80000
75000
105000
100000
95000
90000
85000
80000
75000

16 Northern Trust Global Economic Research
State & local government infrastructure spending in Q2 grew at its fastest rate since 2001 due to the “Build America Bonds” program authorized by the fiscal stimulus program.
Real State & Local Govt Gross Investment
% Change - Annual Rate SAAR, Bil. Chn. 2005$
090807060504030201
Source: Bureau of Economic Analysis /Haver Analytics
30
20
10
0
-10
-20
-30
30
20
10
0
-10
-20
-30

17 Northern Trust Global Economic Research
Speaking of the stimulus program, for the most part, the federal spending portion of it has yet to kick in.
Real Federal Nondefense Gross Investment
% Change - Annual Rate SAAR, Bil. Chn. 2005$
0908
Source: Bureau of Economic Analysis /Haver Analytics
60
40
20
0
-20
-40
60
40
20
0
-20
-40

18 Northern Trust Global Economic Research
After the largest inventory liquidation in the post-WWII era, some businesses will have to begin restocking because their shelves are bare.
Change in Business Inventories as % of Final Sales of Domestic Product
SAAR, Chn. 2005$
050095908580757065605550
Source: Haver Analytics
2. 25
1. 50
0. 75
0. 00
-0. 75
-1. 50
2. 25
1. 50
0. 75
0. 00
-0. 75
-1. 50
19 Northern Trust Global Economic Research
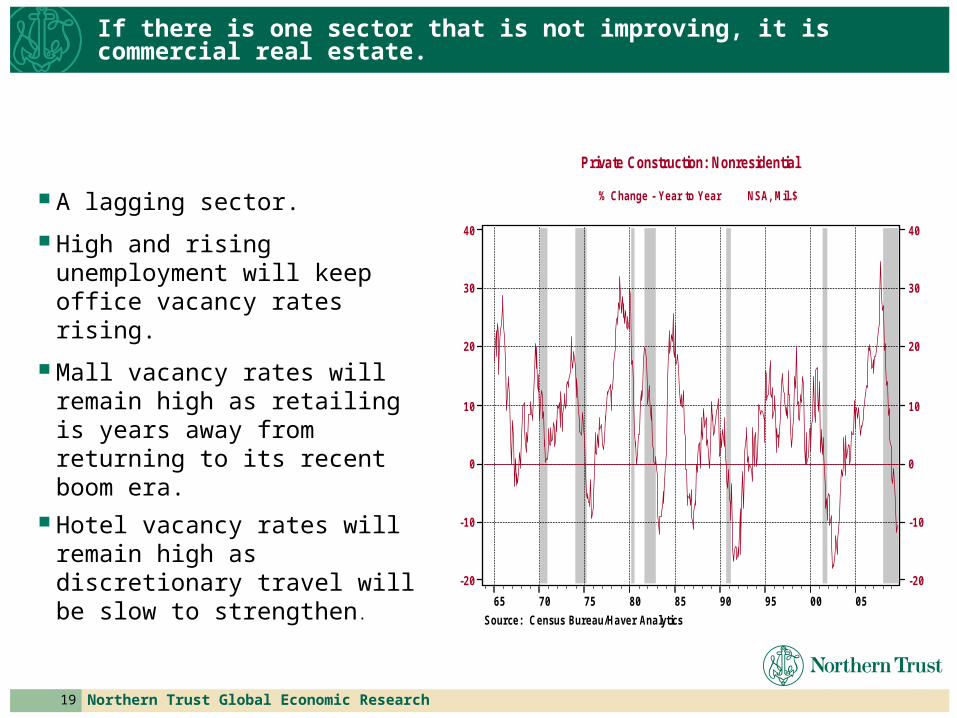
If there is one sector that is not improving, it is commercial real estate.
A lagging sector.
High and rising unemployment will keep office vacancy rates rising.
Mall vacancy rates will remain high as retailing is years away from returning to its recent boom era.
Hotel vacancy rates will remain high as discretionary travel will be slow to strengthen.
Private Construction: Nonresidential
% Change - Year to Year NSA, Mil. $
050095908580757065
Source: Census Bureau/Haver Analytics
40
30
20
10
0
-10
-20
40
30
20
10
0
-10
-20

20 Northern Trust Global Economic Research
This is likely to be another jobless recovery.
Growth will be too slow to quickly re-employ laid-off workers let alone employ new labor-market entrants.
The near-record low workweek means that production can be increased by extending the hours worked by current staff rather than having to hire additional employees.
There is going to be structural unemployment.
All Employees: Total Nonfarm Difference - Per iod to Per iod SA, Thous
Civilian Unemployment Rate: 16 yr +SA, %
05009590
Source: Bureau of Labor Statistics /Haver Analytics
750
500
250
0
-250
-500
-750
10
8
6
4
2

Financial market conditions are improving

22 Northern Trust Global Economic Research
After Lehman collapsed, the interbank loan market froze up. This market now is thawing as evidenced by the decline in Libor interest rates and the decline in discount-window borrowing from the Fed.
Interest Rate Spread: 3-Month Libor minus Fed Discount Rate percentage points
Reserve Bank Credit: Primary Credit to Depository InstitutionsAvg, Mil. $
0908Source: Haver Analytics
3. 00
2. 25
1. 50
0. 75
0. 00
-0. 75
120000
100000
80000
60000
40000
20000
0
23 Northern Trust Global Economic Research
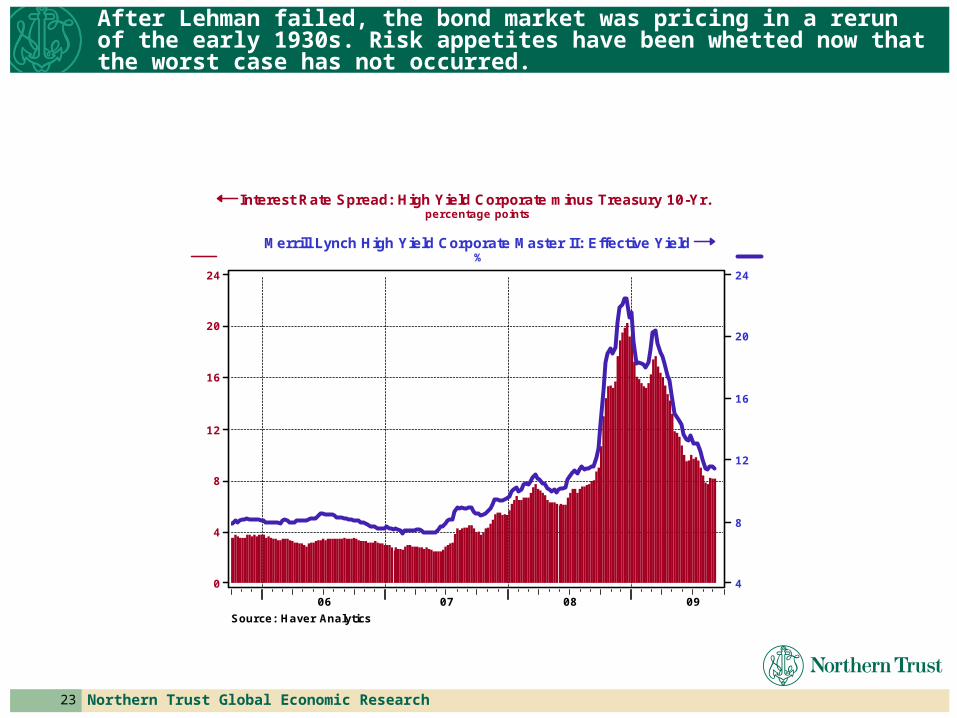
After Lehman failed, the bond market was pricing in a rerun of the early 1930s. Risk appetites have been whetted now that the worst case has not occurred.
Interest Rate Spread: High Yield Corporate minus Treasury 10-Yr.percentage points
Merrill Lynch High Yield Corporate Master II: Effective Yield%
09080706
Source: Haver Analytics
24
20
16
12
8
4
0
24
20
16
12
8
4
24 Northern Trust Global Economic Research
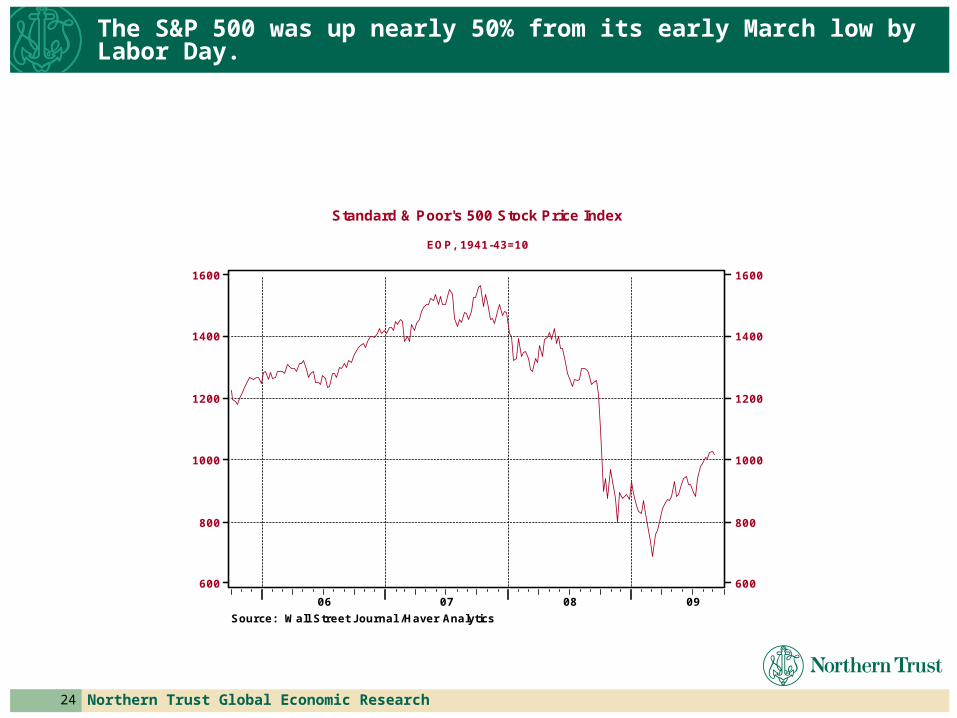
The S&P 500 was up nearly 50% from its early March low by Labor Day.
Standard & Poor's 500 Stock Price Index
EOP, 1941-43=10
09080706
Source: Wall Street Journal /Haver Analytics
1600
1400
1200
1000
800
600
1600
1400
1200
1000
800
600

The economy still faces strong headwinds

26 Northern Trust Global Economic Research
Commercial banks have experienced extremely high loan charge-off and delinquency rates.
Loan Charge-Off Rate: All Insured Commercial BanksSAAR,%
Loan Delinquency Rate: All Insured Commercial BanksSA,%
0500959085
Source: Federal Reserve Board /Haver Analytics
8
6
4
2
0
8
6
4
2
0

27 Northern Trust Global Economic Research
As a result, there has been an unprecedented decline in net lending by the private financial system.
Private Financial Sector Net Lending
SAAR, Bil. $
0500959085807570656055
Source: Haver Analytics
4000
3000
2000
1000
0
-1000
-2000
4000
3000
2000
1000
0
-1000
-2000

Financial institutions have acquired much-needed capital through the TARP program and new equity issuance in the market. But with a wave of commercial mortgage defaults expected, some institutions could become undercapitalized again.
Until financial institutions are confident of their longer-run capital adequacy, they will be unable and/or reluctant to create new credit, which will restrain the pace of the economic recovery.

It will take households some time to recover from their “overindulgence” in the past expansion.
30 Northern Trust Global Economic Research
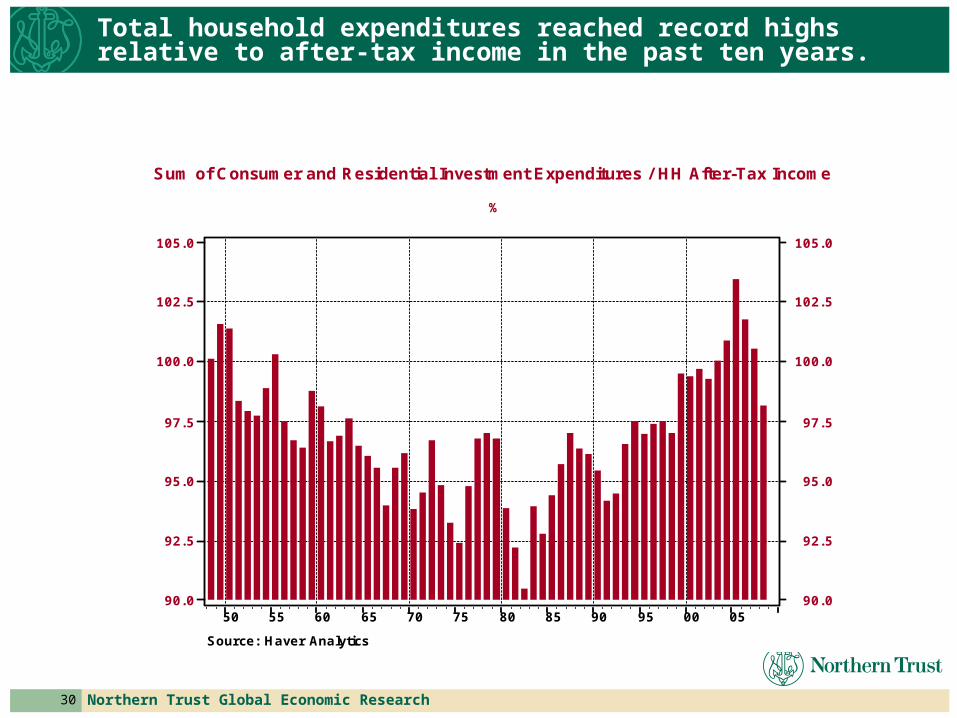
Total household expenditures reached record highs relative to after-tax income in the past ten years.
Sum of Consumer and Residential Investment Expenditures / HH After-Tax Income
%
050095908580757065605550
Source: Haver Analytics
105. 0
102. 5
100. 0
97. 5
95. 0
92. 5
90. 0
105. 0
102. 5
100. 0
97. 5
95. 0
92. 5
90. 0

31 Northern Trust Global Economic Research
In order to fund their increased spending, households stepped up their borrowing, largely against the equity in their houses, to record levels relative to their after-tax incomes.
Households: Borrowing as a % of After-Tax Income
0500959085807570656055
Source: Haver Analytics
16
12
8
4
0
-4
16
12
8
4
0
-4
32 Northern Trust Global Economic Research
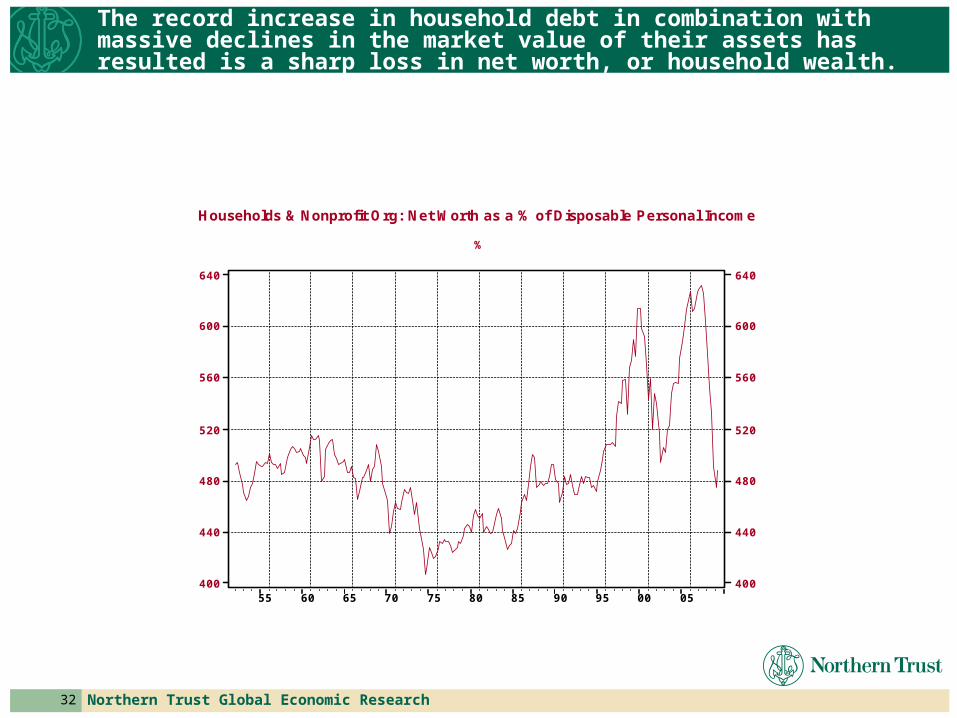
The record increase in household debt in combination with massive declines in the market value of their assets has resulted is a sharp loss in net worth, or household wealth.
Households & Nonprofit Org: Net Worth as a % of Disposable Personal Income
%
0500959085807570656055
640
600
560
520
480
440
400
640
600
560
520
480
440
400

33 Northern Trust Global Economic Research
Households are likely to rebuild their wealth through the purchases of stocks and bonds rather than the purchases of McMansions, SUVs and plasma TVs. All else the same, this would impart downward pressure on interest rates.
Households: Net Acquisition of Financial AssetsSAAR, Bil. $
Households & Nonprofit Orgs: Capital ExpendituresSAAR, Bil. $
0500959085807570656055
Source: Federal Reserve Board /Haver Analytics
2000
1600
1200
800
400
0
2000
1600
1200
800
400
0

Is the federal deficit a headwind?

35 Northern Trust Global Economic Research
Not right now. Although Treasury borrowing has soared in recent quarters, there has been an unprecedented net paydown of nonfederal debt.
Federal Government: Liabilities: Credit Market InstrumentsSAAR, Bil$
Nonfederal Sectors: Liabilities: Credit Market InstrumentsSAAR, Bil. $
0500959085807570656055
Sources: Federal Reserve Board, Haver Analytics
2500
2000
1500
1000
500
0
-500
2500
2000
1500
1000
500
0
-500

36 Northern Trust Global Economic Research
Thus, the pace of total nonfinancial sector borrowing has slowed, which has helped keep Treasury yields at relatively low levels.
Domestic Nonfinancial-Sector Borrowing as a % of GDP 4-qtr MovingAverage
Long-Term Treasury Composite, Over 10 Years% p. a.
0500959085807570656055
Source: Haver Analytics
24
20
16
12
8
4
0
24
20
16
12
8
4
0
37 Northern Trust Global Economic Research
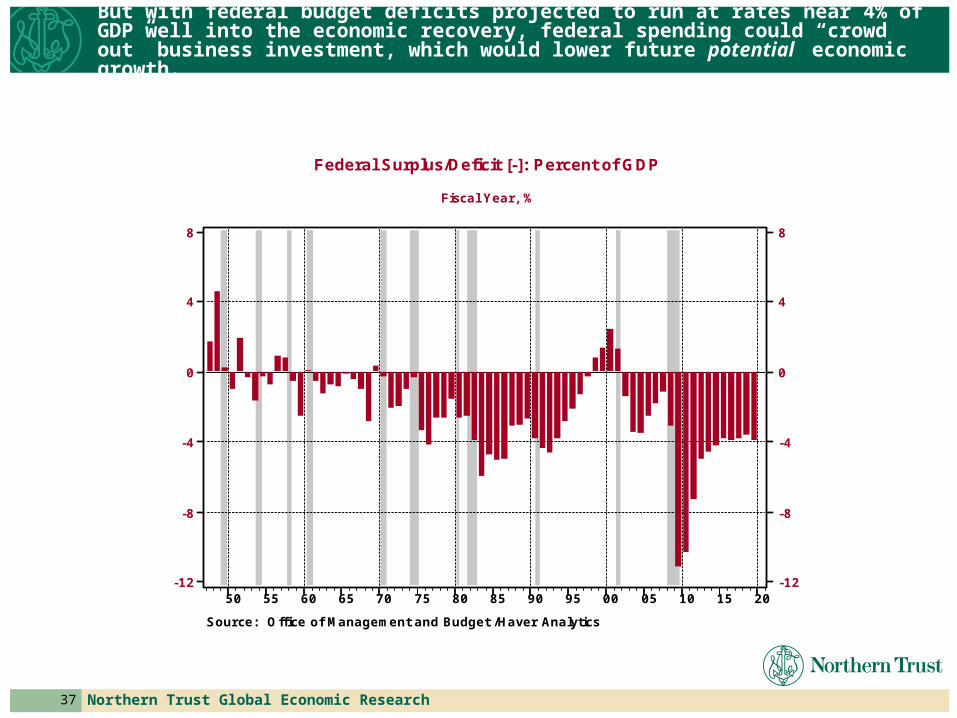
But with federal budget deficits projected to run at rates near 4% of GDP well into the economic recovery, federal spending could “crowd out” business investment, which would lower future potential economic growth.
Federal Surplus/Deficit [-]: Percent of GDP
Fiscal Year , %
201510050095908580757065605550
Source: Office of Management and Budget /Haver Analytics
8
4
0
-4
-8
-12
8
4
0
-4
-8
-12

Will the headwinds prevail, pushing the economy back into recession?
39 Northern Trust Global Economic Research
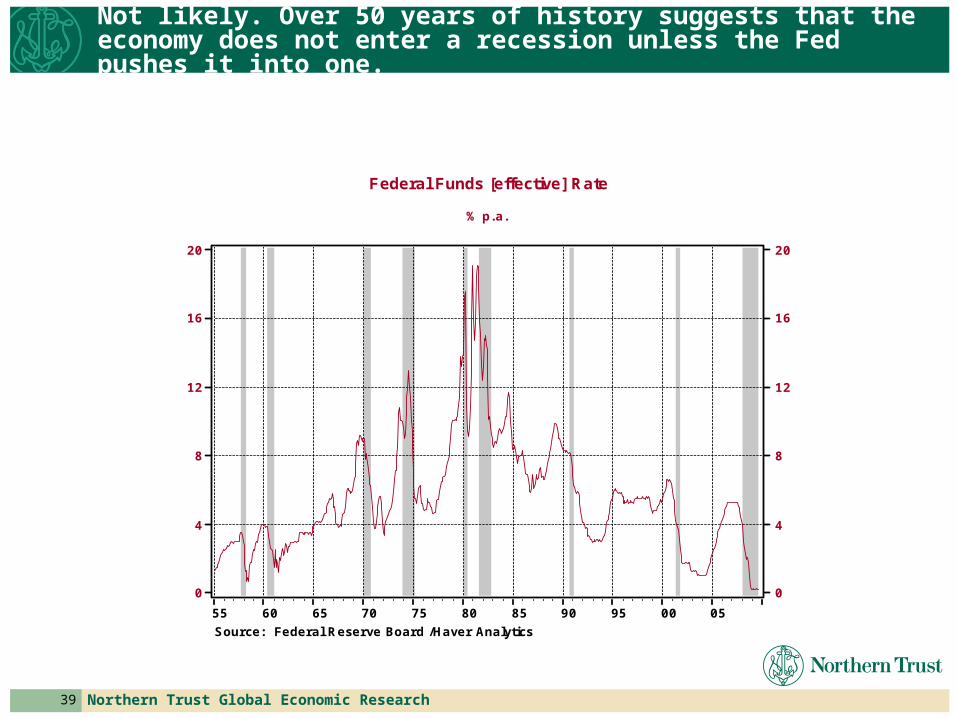
Not likely. Over 50 years of history suggests that the economy does not enter a recession unless the Fed pushes it into one.
Federal Funds [effective] Rate
% p. a.
0500959085807570656055
Source: Federal Reserve Board /Haver Analytics
20
16
12
8
4
0
20
16
12
8
4
0

What about inflation? Won’t all the credit the Fed has created in recent years guarantee rapid inflation?
41 Northern Trust Global Economic Research
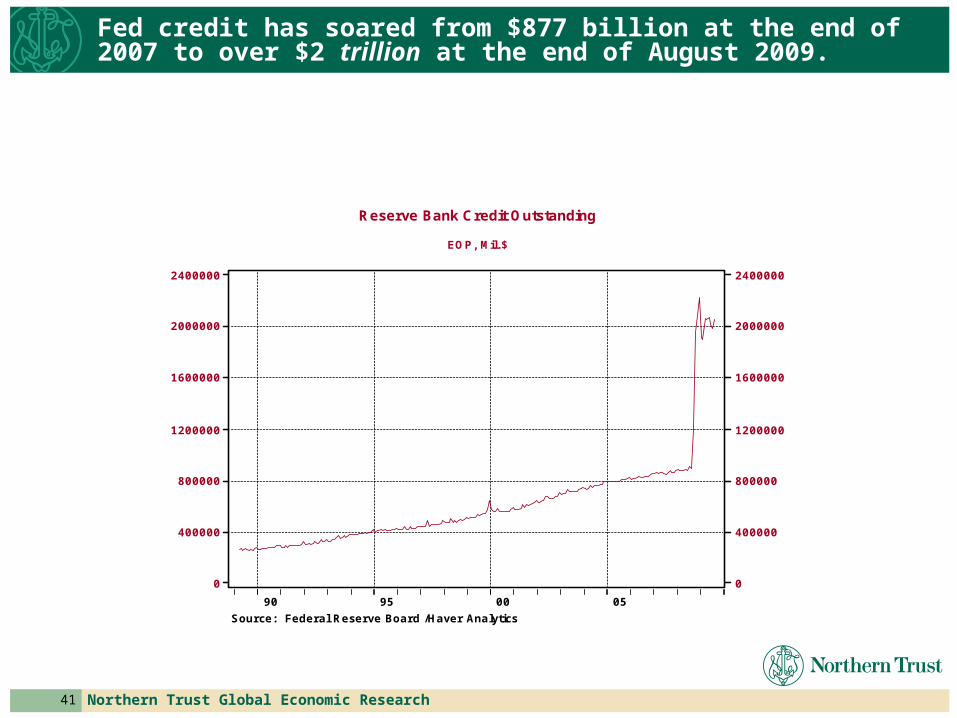
Fed credit has soared from $877 billion at the end of 2007 to over $2 trillion at the end of August 2009.
Reserve Bank Credit Outstanding
EOP, Mil. $
05009590
Source: Federal Reserve Board /Haver Analytics
2400000
2000000
1600000
1200000
800000
400000
0
2400000
2000000
1600000
1200000
800000
400000
0
42 Northern Trust Global Economic Research
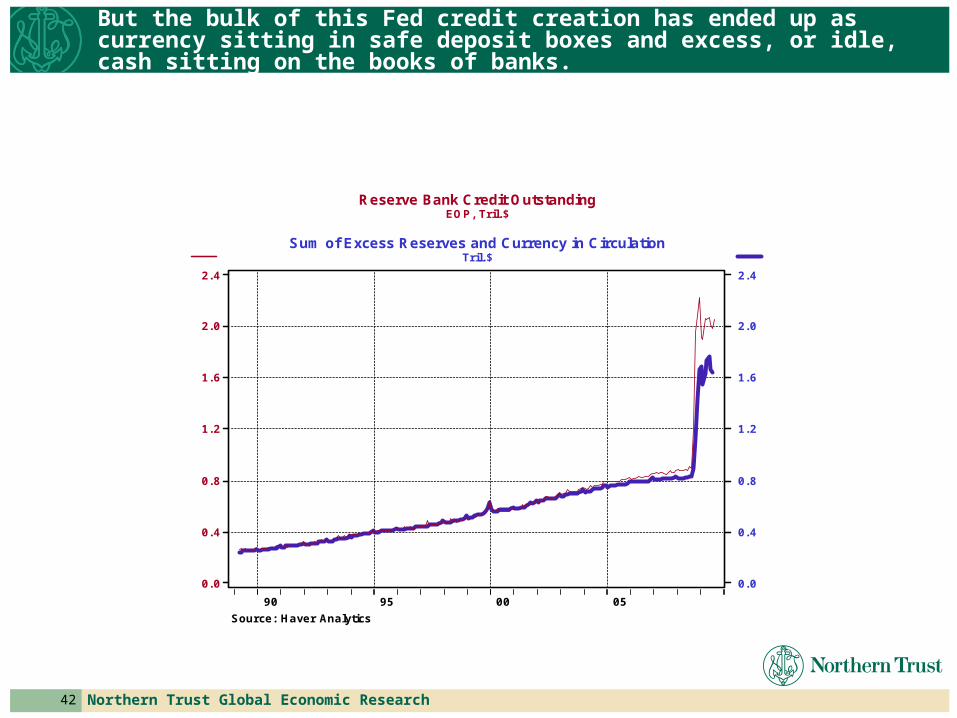
But the bulk of this Fed credit creation has ended up as currency sitting in safe deposit boxes and excess, or idle, cash sitting on the books of banks.
Reserve Bank Credit OutstandingEOP, Tr il. $
Sum of Excess Reserves and Currency in CirculationTril. $
05009590
Source: Haver Analytics
2. 4
2. 0
1. 6
1. 2
0. 8
0. 4
0. 0
2. 4
2. 0
1. 6
1. 2
0. 8
0. 4
0. 0

43 Northern Trust Global Economic Research
Although growth in the broad measure of money supply skyrocketed right after the Lehman failure, it has fallen back to Earth in recent months.
Money Stock: M2
6-month %Change-ann SA, Bil. $
0908070605040302010099989796
Source: Federal Reserve Board /Haver Analytics
16
12
8
4
0
16
12
8
4
0
44 Northern Trust Global Economic Research
To summarize:
The recovery has commenced.
Balance sheet repair by financial institutions and households will restrain the pace of the recovery through 2010.
Because the recovery will be muted initially, the unemployment rate is likely to continue rising through the first half of 2010, perhaps peaking out at a level over 10-1/2%.
The sharp increase in Fed credit is not currently inflationary, but has the potential to be if the Fed does not neutralize this credit at the appropriate time.
The earliest the Fed is likely to begin “neutralizing” the credit it has created is midyear 2010 and then, only tentatively.
Related Documents


![R G O PN O R F K Q O R F G L O G O N O ] T F R O N ^ F R S ...](https://static.cupdf.com/doc/110x72/617aae25fb20c8678c4c479e/r-g-o-pn-o-r-f-k-q-o-r-f-g-l-o-g-o-n-o-t-f-r-o-n-f-r-s-.jpg)

