New mauritius hotels Limited BEAchcOmBER hOTELs ANNUAL REPORT 2015

Welcome message from author
This document is posted to help you gain knowledge. Please leave a comment to let me know what you think about it! Share it to your friends and learn new things together.
Transcript
New mauritius hotels Limited
BEAchcOmBER hOTELs
ANNUAL REPORT 2015
Project3_Layout 1 1/20/16 3:36 PM Page 1

Project1_Layout 1 1/21/16 2:53 PM Page 1

AR_2015_16_210x280_1part_Annual report_2015 1/22/16 3:56 PM Page 1

2 a n n u a l r e p o r t 2 0 1 5
This Annual Report was approved by the
Board of Directors on December 22, 2015
AR_2015_16_210x280_1part_Annual report_2015 1/22/16 3:56 PM Page 2

Contents
AR_2015_16_210x280_1part_Annual report_2015 1/22/16 3:56 PM Page 3

Dear Shareholder,
The year to 30 September 2015 has been eventful for New Mauritius Hotels
Limited. Indeed, after some 40 years at the helm of the Group, Mr Herbert
Couacaud retired as CEO on the 30th of June 2015. Mr Couacaud built the
Group from the small hotel operator it was in the mid 70’s into what is
today the largest hotel Group in Mauritius. He has been one of the main
actors of the post-independence Mauritian tourism industry and has
contributed significantly in building the reputation of Mauritius as a highly
sought after destination. On the same date, Mr Robert de Speville also
retired as Commercial Director of the Company. Mr de Speville
spearheaded the marketing and sales strategies of the Group over the last
decades. He was instrumental in making Beachcomber the Brand it is
today. I use this opportunity to once again thank Messrs Couacaud and
de Speville for their dedication to the Group. The Board appointed Messrs
Gilbert Espitalier-Noël and François Venin as CEO and Commercial Director
respectively, with effect from the 1st of July 2015.
As this important change in management will no doubt entail significant
changes for our Group, I would like to use this opportunity to share with
you my analysis of the challenges and opportunities which NMH faces
at this important juncture. I will start with the challenges.
The geopolitical events of the last months are seriously affecting our
Moroccan operations. Indeed, whilst the Royal Palm Marrakech has been
widely acclaimed as one of the best hotels of Morocco and general
feedback from clients is excellent, the occupancy rate, whilst higher than
the previous year, remains low. At the time of writing, the reservations
at the hotel remain well below our budgets and it is probable that the
hotel’s performance will again negatively affect the Group’s profitability
for the 2015/16 financial year. Management is working actively to
minimise operating costs and reduce cash flow deficits whilst maintaining
the hotel standards. The pace of villa sales at Domaine Royal Palm has
also slowed over the last months, although a number of premium villas
have been sold over the last weeks. Here again, management has had
to review its sales forecasts for 2015/16 as it is becoming clear that the
initial targets will not be met. On a more positive note, we have made
good progress on increasing the level of financing of the Moroccan
operations locally and expect to be in a position to reimburse the
Mauritian parent company some Euros 15m during the second quarter
of the 2015/16 financial year.
The planned residential and hotel development at Les Salines, Black River,
has been stalled for years due to legal constraints. This situation
continues to affect the Group’s performance as the loans taken to finance
the acquisition of the land weigh on its cash flow. A number of initiatives
are presently under way to unlock the current situation and we are
confident that the Group will be in a position to implement
the residential development on these 400 acres of land in the next
few years.
The Group’s results for the year under review have also been negatively
affected by losses suffered at Beachcomber Tours France (BTF) and White
Palm Ltd (White Sand Tours). Changes to senior management have been
brought to these two entities over the last months. Whilst BTF is not
expected to show a profit in the 2015/16 financial year, operational
losses are expected to reduce significantly. The new management is in
the process of implementing a number of initiatives which will help in
bringing BTF results in line with our tour operating operations in the UK
and South Africa. White Palm is already back in positive territory
and is expected to contribute to Group profits in the coming year.
On the brighter side, the Mauritian tourism industry has witnessed a
major turnaround as from July 2015. Indeed, after more than six years
of very slow growth, the number of tourists visiting Mauritius has seen
a significant rise over the past months. This increase is mainly due to the
initiatives taken by the relevant authorities to increase the availability of
airline seats to Mauritius. The additional flights by Air Mauritius
and Emirates, together with the arrival of carriers such as Lufthansa,
Austrian Airlines and Turkish Airlines have all contributed to a better
balance between hotel room capacity and airline seats availability.
Additionally, the strength of the USD against the Euro has led
ChaIrMan’s address
4 a n n u a l r e p o r t 2 0 1 5
AR_2015_16_210x280_1part_Annual report_2015 1/22/16 3:56 PM Page 4

5n e w M a u r I t I u s h o t e l s l I M I t e d
to destinations mainly sold in Euros, such as Mauritius, becoming more
competitive vis-a-vis competing USD denominated destinations. Lastly,
amidst a world where several traditional touristic destinations have been
affected by terrorist attacks, Mauritius's well-deserved status as a safe
country has no doubt helped attract a greater number of visitors. As could
be expected, the eight Beachcomber hotels in Mauritius have seen their
occupancy rates increase significantly over the past months.
For the first quarter of the 2015/16 financial year, the average occupancy
in the ten Beachcomber hotels, including those in Seychelles and
Marrakech, has grown to 74% from 65% during the corresponding
quarter last year. Coupled with an increase in Guest Night Spending
(total spend per guest per night) of some 5% for the quarter, this rise in
occupancy has resulted in a major increase in operating profits and Profit
after tax (PAT) for the Group. As this trend is expected to continue in
the second quarter, the Group’s operating profits for the first semester
of 2015/16 should show a growth above 30% over that of the same
period last year.
The Group expects this momentum to continue for the second half of
the year leading to much improved results for the full year. This better
performance should be maintained over the next few years, allowing
reasonable dividend payments, adequate refurbishment and renovation
of existing hotels and contribute to reduce the Group’s indebtedness
by some Rs 2bn over the next four years. However, several strategic
initiatives will need to be taken to achieve the declared objective of
reducing the Group’s Rs 16bn debt by half by September 2019. In addition
to the sale of land at Les Salines and of villas in Marrakech which are
each expected to contribute some Rs 2bn towards this objective, the
Group is working on the setting up of a hospitality fund into which
investors, both local and foreign, will be invited to take up a minority
stake. NMH will thus retain more than 50% of the fund’s shareholding.
The intention is to transfer the assets of three of the Group’s eight
Mauritian hotels into the fund under the “sale and lease-back“ principle.
Even though it is premature to get into the details of this initiative, the
Board of Directors believes it could be an interesting tool to help reduce
the Group’s debt to a more comfortable level whilst keeping the operations
of all its hotels under the Beachcomber umbrella.
On a different note, the new management has embarked into an important
exercise “Beachcomber : Au cœur des valeurs“. The feedback received
during this exercise, which has seen the participation of more than
500 employees of the Group during the second half of 2015, will now be
used to launch a series of initiatives aiming at putting the employees at
the core of the Group’s activities. Additionally, the eight values which the
employees have defined as being those of Beachcomber, will serve as the
base for a rebranding and communication exercise aiming at galvanizing
the 5,000 employees of the Group towards shared objectives and goals.
I am very optimistic about Beachcomber’s future. The renewed dynamism
brought by the new management and the clear indications of a major
turnaround for the Mauritian tourism industry should no doubt contribute
to bringing the Group to profitability levels commensurate with its size
and reach. Although the next few years will remain challenging, the
successful implementation of the various initiatives recently launched by
management will see Beachcomber emerge stronger than ever, with
positive and stable operational cash flows and a healthy balance sheet,
enabling the implementation of an ambitious expansion plan in the
Indian Ocean region.
Hector ESpiTAliER-NoElcHAiRmAN
December 22, 2015
AR_2015_16_210x280_1part_Annual report_2015 1/22/16 3:56 PM Page 5

6 a n n u a l r e p o r t 2 0 1 5Standing from left to right: colin Taylor, Gilbert Espitalier-Noël, marcel masson, Jacques Silvant, Jean-pierre montocchio, Herbert couacaud
AR_2015_16_210x280_1part_Annual report_2015 1/22/16 3:56 PM Page 6

7n e w M a u r I t I u s h o t e l s l I M I t e d Seated from left to right: Sunil Banymandhub, louis Rivalland, François Venin, Francis montocchio, Hector Espitalier-Noël
AR_2015_16_210x280_1part_Annual report_2015 1/22/16 3:56 PM Page 7

8 a n n u a l r e p o r t 2 0 1 5
Key FIGuresseptember 30, 2015
Statements of Profit or Loss THE GRoUp2015 2014Rs'm Rs'm
Revenue 9,357 8,793 EBITDA 1,757 1,807 Profit before tax 268 489 Income tax (expense)/credit (60) 12 Profit for the year 208 501 Non-controlling interests (39) (43)Profit attributable to owners of the parent 169 458 Dividends * - (161)Retained profit for the year 169 297
Statements of financial position 2015 2014Rs'm Rs'm
Non-current assets ** 28,320 27,994Current assets 8,476 7,752Share capital 5,000 1,724Retained earnings 6,741 6,858Other reserves 1,906 4,610Shareholders funds 13,647 13,192Non-controlling interests 59 74Total equity 13,706 13,266Non-current liabilities 14,791 11,570Current liabilities 8,299 10,910
Key Financial ratios 2015 2014
Number of room keys available as at September 30, 2,199 2,063Room nights available 785,899 763,656Number of guests nights 1,088,766 1,053,670Occupancy (%) 66 67RevPar (Rs) 8,643 8,552Earnings per share (Rs) 0.35 0.95Dividends per share (Rs) - 0.33 Interest cover (x)*** 1.67 1.91Dividend cover (x) - 0.95 Dividend payout (%) - 35.21 Net Asset value per share (Rs) ** 28.30 27.39Return on equity (%) 1.52 3.78Return on assets (%) 0.57 1.40Gearing (%) ** 120 119
* Dividends declared after year end: Rs 161m in 2015 (2014: Rs 161m declared during the year).** Ratios above exclude leasehold land with an estimated value of Rs 7 billion.*** Interest cover calculated as follows: EBITDA/ Finance Costs (excluding interest capitalised and losses on exchange).
AR_2015_16_210x280_1part_Annual report_2015 1/22/16 3:56 PM Page 8

9n e w M a u r I t I u s h o t e l s l I M I t e d
THE GRoUpRevenue EBiTDA
2015 2014 2015) 2014)
Rs’m Rs’m Rs’m) Rs’m)Business:Hotel operations 6,939 6,531 1,329 1,349 Tour operating 1,263 1,345 85 131 Flight and inland catering 279 229 35 9 Property 876 688 308 318
9,357 8,793 1,757 1,807
Geographical:Mauritius 7,015 6,729 1,667 1,579 Morocco 1,184 806 71 141 Europe 535 656 (5) 26 Other countries 623 602 24 61
9,357 8,793 1,757 1,807
seGMental InForMatIonfor the year ended september 30, 2015
Business
Geographical
Revenue EBiTDA
Flight and inland catering 3% 2%
Property and others 9% 14%
Tour operating 13% 4%
Hotel operations 75% 80%
Revenue EBiTDA
Europe 6% 0%
Other countries 6% 1%
Morocco 13% 4%
Mauritius 75% 95%
AR_2015_16_210x280_1part_Annual report_2015 1/22/16 3:56 PM Page 9
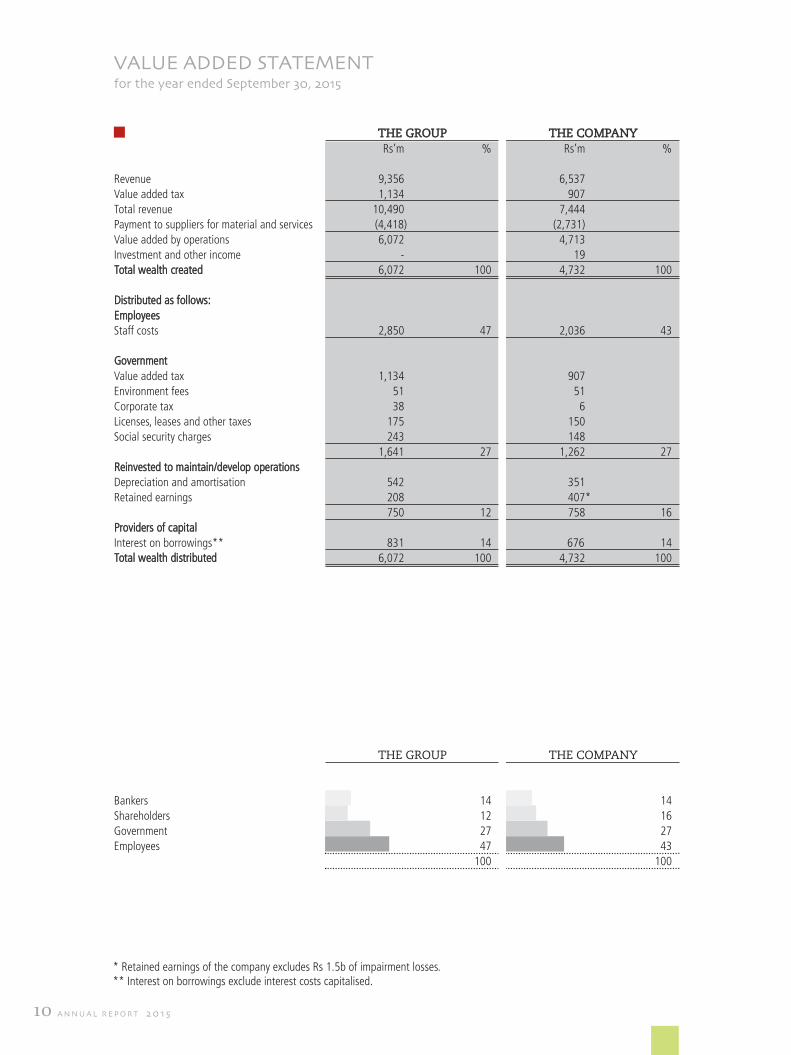
THE GRoUp THE compANyRs’m % Rs’m %
Revenue 9,356 6,537
Value added tax 1,134 907
Total revenue 10,490 7,444
Payment to suppliers for material and services (4,418) (2,731)
Value added by operations 6,072 4,713
Investment and other income - 19
Total wealth created 6,072 100 4,732 100
Distributed as follows:
Employees
Staff costs 2,850 47 2,036 43
Government
Value added tax 1,134 907
Environment fees 51 51
Corporate tax 38 6
Licenses, leases and other taxes 175 150
Social security charges 243 148
1,641 27 1,262 27
Reinvested to maintain/develop operations
Depreciation and amortisation 542 351
Retained earnings 208 407*
750 12 758 16
Providers of capital
Interest on borrowings** 831 14 676 14Total wealth distributed 6,072 100 4,732 100
THE GRoUp THE compANy
Bankers 14 14
Shareholders 12 16
Government 27 27
Employees 47 43
100 100
Value added stateMentfor the year ended september 30, 2015
10 a n n u a l r e p o r t 2 0 1 5
* Retained earnings of the company excludes Rs 1.5b of impairment losses.** Interest on borrowings exclude interest costs capitalised.
AR_2015_16_210x280_1part_Annual report_2015 1/22/16 3:56 PM Page 10

11n e w M a u r I t I u s h o t e l s l I M I t e d
AR_2015_16_210x280_1part_Annual report_2015 1/22/16 3:56 PM Page 11

Consolidation and internationalfinanCial reporting standards
The audited Financial Statements for the year ended September
30, 2015 have been prepared in accordance with International
Financial Reporting Standards. There has been no change in
the accounting policies and methods that were adopted in the
last Financial Statements. New financial reporting standards
and interpretations, which came into application, did not have
any material impact on the financial performance or position
of the Group.
Comments on results
revenue and eBitdaRevenue for the year increased by 6.4% on last year
to Rs9,357m. Except for Le Paradis hotel which was closed
during two months for the refurbishment of the public areas
and wellness centers, all hotels, including the Royal Palm
Marrakech, operated at full capacity accounting for the major
share of the additional revenue (Rs409m out of Rs563m).
Revenue from the sale of villas was also higher amounting
to Rs861m as compared to Rs761m the previous year.
The EBITDA of Rs 1,757m for the year was lower than
that of last year due to an exchange loss arising on the
retranslation of foreign currency loans and debentures as
compared to a profit last year. Whilst a higher EBITDA was
realised by the hotel segment this year, a lower EBITDA
was realised by the other segments due to a lower margin
recognized on the villas passed on to the owners this year
and the negative results achieved by Beachcomber Tours
France and White Palm Ltd. The Group’s hotels locally posted
higher average occupancy and guest night spending (GNS)
whereas Royal Palm Marrakech, still in a launching mode and
unfavorably impacted by the geopolitical conditions, as well
as Ste Anne, in Seychelles, registered higher occupancies but
lower GNS.
depreciation, finance revenue and finance costsThe depreciation charge was lower this year mainly because last
year’s figure included a fair value loss of Rs 40m on the land
at Les Salines forming part of property plant and equipment.
Finance revenue, which consists of realised gain on forward
currency contracts and interest income, was almost the same
as last year which included the exchange gain on retranslation
of loans in foreign currencies.
The increase in finance costs stems from the interest related
to the Royal Palm Marrakech which are now expensed,
the hotel having come into operation, and a loss of Rs 110m
arising from the retranslation of loans in foreign currencies.
12 a n n u a l r e p o r t 2 0 1 5
annual reportpresentation of the annual report by the directors for the year ended september 30, 2015
AR_2015_16_210x280_1part_Annual report_2015 1/22/16 3:56 PM Page 12
other incomeFair value gain on investment property in Marrakech amounted
to Rs 106m as compared to Rs 251m last year.
impairment of goodwillIn the light of recent events in Paris and the Middle East, the Board
of Directors has decided to adopt a very conservative approach in
its forecasts for the sale of villas and the future performance of the
hotel in Marrakech. The Board has therefore considered it prudent
to impair part of its investment in Domaine Palm Marrakech in the
Company’s financial statements and, consequently, the goodwill in
the Group financial statements to account for a potential downturn.
income taxFollowing the conservative approach to future performance of
Royal Palm Marrakech, the Board also limited the recognition of
the Deferred Tax asset resulting from its tax losses. As a
result, the Group suffered a tax charge of Rs 60m compared to
a tax credit of Rs 13m last year,
earnings In spite of the overall improvement in the Group’s operating results,
earnings for the year were down on last year’s on account of
significantly lesser fair value gain on investment property –
Rs 106m compared to Rs 251m last year, much higher finance costs –
Rs 940m compared to Rs 689m and a tax charge of Rs 60m
compared to a tax credit of Rs 13m. Consequently, earnings per
share fell from Rs 0.95 last year to Rs 0.35 this year.
Cash flow and capital expenditureWith the higher cash flow generated by operating activities
(Rs 1,376m compared to Rs 1,225m), the successful issue
of convertible preference shares for a total amount of Rs 1,755m
and a reduction in capital expenditure (Rs 739m compared
to Rs 1,584m), the cash flow was positive this year in spite
of a net loan refund of Rs 447m compared to a net borrowing
of Rs 625m last year.
inventoriesInventories include Rs 1,938m of cost of villas for sale under
development at Marrakech.
projeCts
marrakech The first phase of the villas project is still under way
but progressing at a slower pace mainly due to the adverse
geopolitical conditions in the region. Out of a target of 72, only
61 villas have been sold at year end of which 54 titles were
transferred to the owners. The project and the marketing
strategy are being revisited with the collaboration of property
development specialists to revitalise sales and engage the next
phase as soon as possible.
le VictoriaShould all clearances be obtained in time, forty rooms will be added
to the hotel between April and November 2016. The project cost
is estimated at Rs 255m and the payback period not more than
5 years.
le paradisIt is envisaged to refurbish some 60 of the 100 deluxe rooms will be
refurbished during the low season at a total estimated cost of
Rs 160m. Given the hotel’s configuration, the remaining rooms would
be kept into operation during the works. Once into operation, these
rooms should increase the operating profit significantly.
outlookDespite difficult operating conditions in Marrakech, much
improved results are expected for the Group for the financial
year to September 2016. For the quarter to December 2015, the
hotels’ average occupancy should increase by 10 percentage
points and Guest Night Spending by 5% compared to last year’s
corresponding period. Bookings in hand for the second quarter
to March 2016 are up 28% on last year’s. The non-hotel
operations, locally and overseas, should also perform better.
The financial restructuring scheme launched this year should
reach its final stage with the implementation of the strategic
initiatives currently in progress. The Group’s indebtedness and
finance costs should consequently be materially reduced.
note of appreCiation
The Directors wish to thank all General Managers and their
teams for their hard work and motivation and congratulate them
for the good operating results achieved.
Hector ESPITALIER-NOEL Sunil BANyMANDHUB
CHAIRMAN CHAIRMAN OF THE AUDIT
December 22, 2015 COMMITTEE
13n e w M a u r I t I u s h o t e l s l I M I t e d
AR_2015_16_210x280_1part_Annual report_2015 1/22/16 3:56 PM Page 13
Corporate GoVernanCe reportGroup structure as at september 30, 2015
AR_2015_16_210x280_1part_Annual report_2015 1/22/16 3:56 PM Page 14
15n e w M a u r I t I u s h o t e l s l I M I t e d
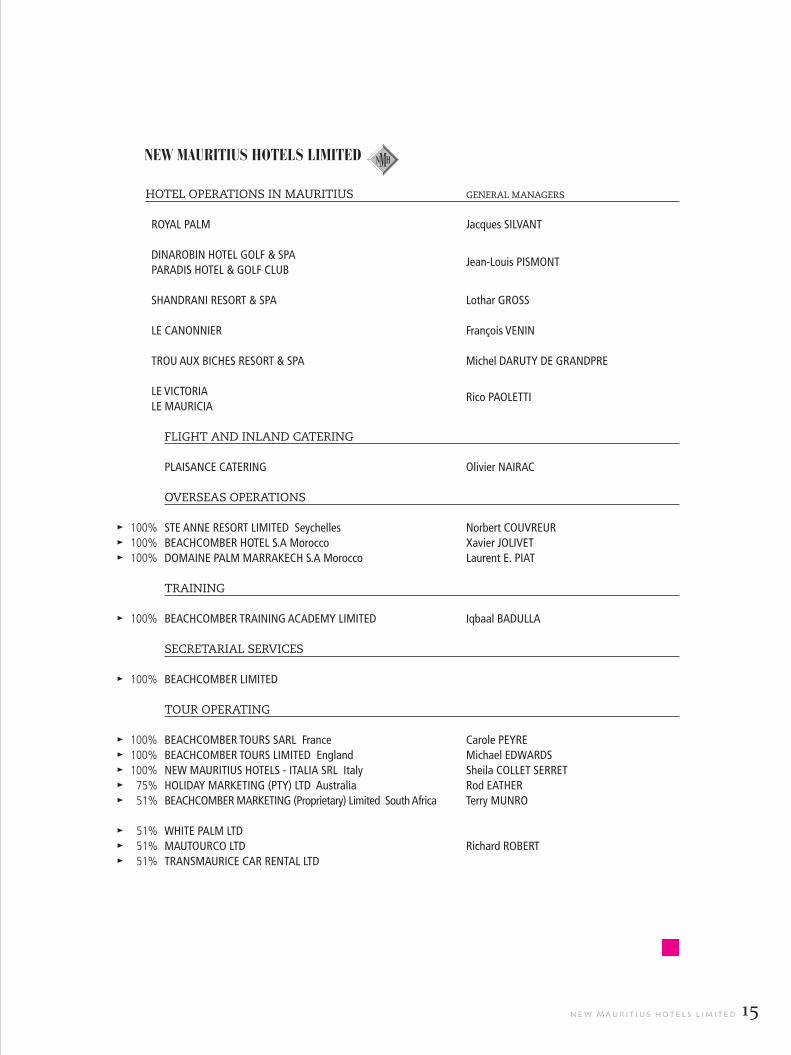
New Mauritius Hotels liMited
HoTEl opERATioNS iN mAURiTiUS GENERAl mANAGERS
Royal Palm Jacques SIlVaNT
DINaRobIN HoTEl GolF & SPa
PaRaDIS HoTEl & GolF ClUbJean-louis PISmoNT
SHaNDRaNI RESoRT & SPa lothar GRoSS
lE CaNoNNIER François VENIN
TRoU aUx bICHES RESoRT & SPa michel DaRUTy DE GRaNDPRE
lE VICToRIa
lE maURICIaRico PaolETTI
FliGHT AND iNlAND cATERiNG
PlaISaNCE CaTERING olivier NaIRaC
oVERSEAS opERATioNS
► 100% STE aNNE RESoRT lImITED Seychelles Norbert CoUVREUR
► 100% bEaCHCombER HoTEl S.a morocco xavier JolIVET
► 100% DomaINE Palm maRRakECH S.a morocco laurent E. PIaT
TRAiNiNG
► 100% bEaCHCombER TRaINING aCaDEmy lImITED Iqbaal baDUlla
SEcRETARiAl SERVicES
► 100% bEaCHCombER lImITED
ToUR opERATiNG
► 100% bEaCHCombER ToURS SaRl France Carole PEyRE
► 100% bEaCHCombER ToURS lImITED England michael EDWaRDS
► 100% NEW maURITIUS HoTElS - ITalIa SRl Italy Sheila CollET SERRET
► 75% HolIDay maRkETING (PTy) lTD australia Rod EaTHER
► 51% bEaCHCombER maRkETING (Proprietary) limited South africa Terry mUNRo
► 51% WHITE Palm lTD
► 51% maUToURCo lTD Richard RobERT
► 51% TRaNSmaURICE CaR RENTal lTD
AR_2015_16_210x280_1part_Annual report_2015 1/22/16 3:56 PM Page 15
16 a n n u a l r e p o r t 2 0 1 5
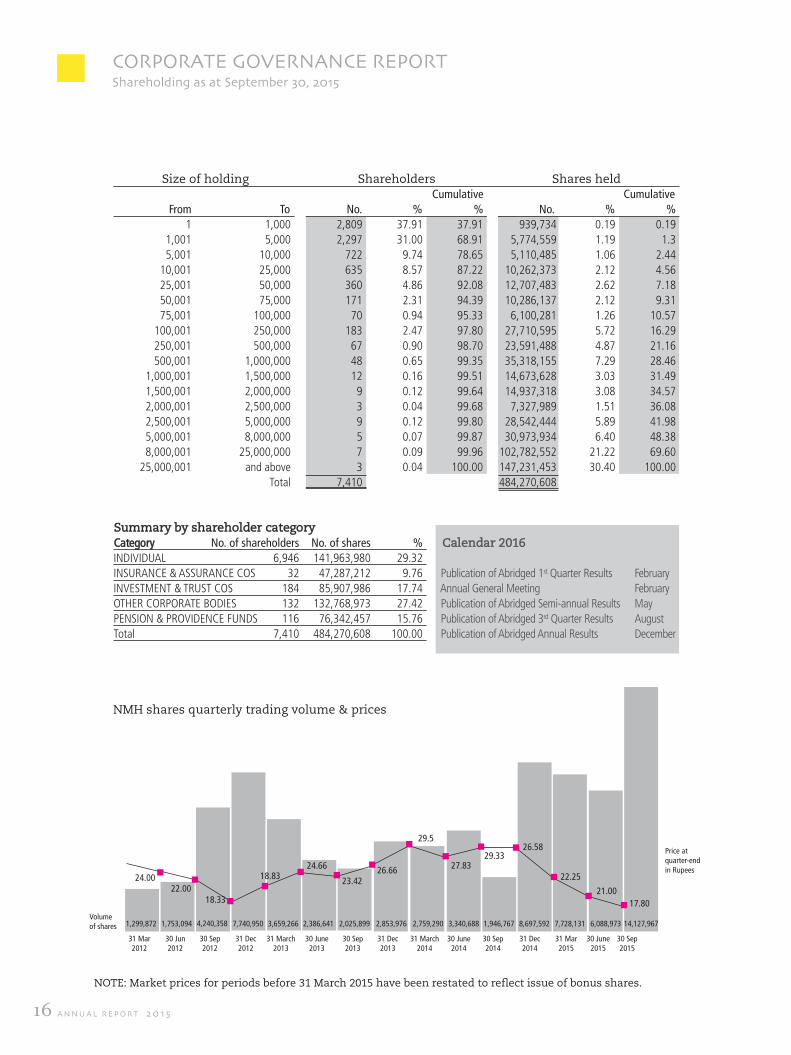
Corporate GoVernanCe reportshareholding as at september 30, 2015
Summary by shareholder categoryCategory No. of shareholders No. of shares %
INDIVIDUAL 6,946 141,963,980 29.32
INSURANCE & ASSURANCE COS 32 47,287,212 9.76
INVESTMENT & TRUST COS 184 85,907,986 17.74
OTHER CORPORATE BODIES 132 132,768,973 27.42
PENSION & PROVIDENCE FUNDS 116 76,342,457 15.76
Total 7,410 484,270,608 100.00
Size of holding Shareholders Shares heldCumulative Cumulative
From To No. % % No. % %
1 1,000 2,809 37.91 37.91 939,734 0.19 0.19
1,001 5,000 2,297 31.00 68.91 5,774,559 1.19 1.3
5,001 10,000 722 9.74 78.65 5,110,485 1.06 2.44
10,001 25,000 635 8.57 87.22 10,262,373 2.12 4.56
25,001 50,000 360 4.86 92.08 12,707,483 2.62 7.18
50,001 75,000 171 2.31 94.39 10,286,137 2.12 9.31
75,001 100,000 70 0.94 95.33 6,100,281 1.26 10.57
100,001 250,000 183 2.47 97.80 27,710,595 5.72 16.29
250,001 500,000 67 0.90 98.70 23,591,488 4.87 21.16
500,001 1,000,000 48 0.65 99.35 35,318,155 7.29 28.46
1,000,001 1,500,000 12 0.16 99.51 14,673,628 3.03 31.49
1,500,001 2,000,000 9 0.12 99.64 14,937,318 3.08 34.57
2,000,001 2,500,000 3 0.04 99.68 7,327,989 1.51 36.08
2,500,001 5,000,000 9 0.12 99.80 28,542,444 5.89 41.98
5,000,001 8,000,000 5 0.07 99.87 30,973,934 6.40 48.38
8,000,001 25,000,000 7 0.09 99.96 102,782,552 21.22 69.60
25,000,001 and above 3 0.04 100.00 147,231,453 30.40 100.00
Total 7,410 484,270,608
24.0022.00
18.33
18.8326.66
23.42
24.66
29.526.58
29.3327.83
31 mar 30 Jun 30 Sep 31 Dec 31 march 30 June 30 Sep 31 Dec 31 march 30 June 30 Sep 31 Dec 31 mar 30 June 30 Sep2012 2012 2012 2012 2013 2013 2013 2013 2014 2014 2014 2014 2015 2015 2015
Volume of shares
Price atquarter-end in Rupees
2,853,976 2,759,290 3,340,688 1,946,767 8,697,592 7,728,131 6,088,973 14,127,9671,299,872 1,753,094 4,240,358 2,025,8992,386,6413,659,2667,740,950
NmH shares quarterly trading volume & prices
NoTE: market prices for periods before 31 march 2015 have been restated to reflect issue of bonus shares.
calendar 2016
Publication of Abridged 1st Quarter Results February
Annual General Meeting February
Publication of Abridged Semi-annual Results May
Publication of Abridged 3rd Quarter Results August
Publication of Abridged Annual Results December
22.25
21.00
17.80
AR_2015_16_210x280_1part_Annual report_2015 1/22/16 3:56 PM Page 16
17n e w M a u r I t I u s h o t e l s l I M I t e d
Board of direCtors
NoN-ExEcUTiVE DiREcToRS
Hector ESPITALIER-NOEL
Chairman
Member of the Corporate Governance Committee
Jean Pierre MONTOCCHIO
Chairman of the Corporate Governance Committee
Herbert COUACAUD (Executive up to 30 June 2015)
Louis RIVALLAND
Member of the Audit Committee
iNDEpENDENT DiREcToRS
Sunil BANyMANDHUB
Chairman of the Audit Committee
Colin TAyLOR
Member of the Audit and Corporate Governance Committee
ExEcUTiVE DiREcToRS
Gilbert ESPITALIER-NOEL (Non-executive until 30 June 2015)
Chief Executive Officer (CEO)
Member of the Corporate Governance Committee
Marcel MASSON
Finance Director
Member of the Corporate Governance Committee
Jacques SILVANT
General Manager Royal Palm Hotel
François VENIN
Commercial Director
SEcRETARy
BEACHCOMBER LIMITED
Beachcomber House
Botanical Garden Street, Curepipe 74213, Mauritius.
auditors
ERNST & yOUNG
NeXTeracom Tower,
Ebene, Mauritius.
Bankers
The Mauritius Commercial Bank LimitedState Bank of Mauritius Limited
The Hong Kong and Shanghai Banking Corporation Limited
Banque des Mascareignes LimitéeAfrasia Bank Limited
Barclays Bank PLCBank One Limited
National Commercial Bank Limited
Habib Bank LtdSBI (Mauritius) Ltd
ABC Banking Corporation Limited
legal adVisers
loCal
Me Maxime SAUzIERMe yves HEIN
Me Michael KING FAT
international
Me Jean François COLIN
notary
Me. Jean-Hugues MAIGROT
Me. Didier MAIGROT
registered offiCe
Beachcomber House
Botanical Garden Street, Curepipe 74213, Mauritius.
Tel: + (230) 601 9000 - Fax: + (230) 601 9090
E-mail: [email protected]
WeBsite
www.beachcomber-hotels.com
Corporate GoVernanCe report
AR_2015_16_210x280_1part_Annual report_2015 1/22/16 3:56 PM Page 17

direCtorate
The Board of Directors’ primary objectives are to protect and enhance
shareholder value within an appropriate structure which safeguards the
rights and interests of shareholders and other stakeholders by
ensuring that the Company and its controlled entities are properly managed.
The Board, together with senior management, is responsible to shareholders
and other stakeholders for the Company’s business performance.
It is the responsibility of the Board of Directors to define general company
strategic policies and guidelines, to evaluate the plans and projects
submitted by management and to make sure that results are achieved.
The non-executive Chairman has the responsibility to lead the Board and
facilitate constructive contributions by all directors to ensure the Board
functions effectively as a whole in discharging its responsibilities. The management
of the business is carried out by a Chief Executive Officer to whom the
Board has delegated its powers in that respect. The CEO is responsible
for the execution of the business strategy defined by the Board of
Directors, the elaboration of plans and projects and the operational and
financial performance of the Company. The CEO is seconded in his task
by a management team which he is responsible to select.
The Board of Directors holds regularly scheduled meetings as well as
additional meetings when called by its Chairman and CEO. The annual
calendar of Board Meetings is agreed upon at the beginning of the year.
The Agenda is circulated in advance to the Board members and the items
therein backed by background information to enable the Board to take
appropriate decisions. Decisions of the Board of Directors require a
quorum of a majority of Directors and are taken by majority vote.
Two Members of the Board of Directors retire every year and are eligible
for re-election. At the Company’s AGM in March 2015, shareholders
re-elected Messrs Gilbert Espitalier-Noël and Jacques Silvant as members
of the Board of Directors.
The Board comprises four non-executive Directors including the Chairman,
two non-executive independent Directors and four executive Directors
including the Chief Executive Officer.
An appraisal of the Board and of its members is carried out once
a year with the aim of evaluating the Board’s effectiveness and
improving its workings. The result of this exercise, in the form of a series of
assertions to which are awarded a rating on a scale of 1 to 5 by individual
Directors, is reported to the Board. The most recent appraisal was carried
out in November 2015. The Board also encourages its members to keep
on enhancing their knowledge and competencies through personal
development programmes offered by local institutions and/or their
professional bodies.
The profiles of the Directors who served during the financial year are
outlined below:
non-exeCutiVeHector espitalier-noelHe has been the Chairman of the Company since his appointment as director
in 1997.
Member of the Institute of Chartered Accountants in England and Wales,
he worked for Coopers and Lybrand in London and De Chazal du Mée.
He is the Chief Executive Officer of Espitalier Noël Group.
Other directorship in listed companies: ENL Commercial Ltd, ENL Land Ltd
and Rogers & Co. Ltd
jean-pierre montoCCHioNotary public. Appointed in 2004, he is the Chairman of the Corporate
Governance Committee. He has participated in the National Committee
on Corporate Governance. Other directorship in listed companies:
Caudan Development Ltd, Fincorp Investment Ltd, MCB Group Ltd,
Promotion and Development Ltd, Rogers & Co. Ltd, ENL Land Ltd
and Les Moulins de la Concorde Ltée.
Herbert CouaCaud (Executive up to June 30, 2015)
Holder of a B.Sc in Economics and Mathematics, he has been the Chief
Executive Officer of the Company since 1974 until retired in June 2015.
Other directorship in listed companies:
Fincorp Investment Ltd, Rogers & Co. Ltd.
louis riVallandHe holds a Bachelor’s degree in Actuarial Science and Statistics, and is
a Fellow of the Institute of Actuaries of United Kingdom and a Fellow of
the Actuarial Society of South Africa. He was appointed Director in March
2002. He is currently the Group Chief Executive of Swan Insurance
Co Ltd and The Anglo-Mauritius Assurance Society Limited.
He is a past President of the Joint Economic Council, a Board member
of the Mauritius Revenue Authority and member of the Financial Services
Consultative Council. Other directorship in listed companies: Belle Mare
Holding Limited, ENL Commercial Limited, ENL Land Ltd, Ireland Blyth
Limited, Swan Insurance Company Limited and The Mauritius
Development Investment Trust Company Limited.
independent non-exeCutiVe
sunil BanymandHuBAppointed in April 2004, he is the Chairman of the Audit Committee.
Graduated from UMIST (UK) with a B.Sc. Honours First Class in Civil
Engineering, and completed his Master’s Degree in Business Studies at
London Business School. He is also an Associate of the Institute of
Chartered Accountants of England and Wales. He has occupied senior
positions with various major companies and institutions in Mauritius. Other
directorship in listed companies: Omnicane Ltd.
Colin taylor He has a Bsc (Hons) in Engineering and Business Studies and an MSC in
Management. He was appointed Director in February 2013. He joined the
Rogers Group in the Automotive Division in 1987. He was appointed Manager
of the Taylor Smith Engineering Division in 1991 and was promoted to
Managing Director three years later. He was appointed Executive Director
Corporate GoVernanCe report
18 a n n u a l r e p o r t 2 0 1 5
AR_2015_16_210x280_1part_Annual report_2015 1/22/16 3:56 PM Page 18
19n e w M a u r I t I u s h o t e l s l I M I t e d
of the Rogers Group Engineering Cluster in 1999 and has been CEO of
Taylor Smith Group since 2004. He also holds the post of Honorary Consul for
Sweden in Mauritius. He is also a director of Taylor Smith Investment Ltd.
Other directorship in listed companies: CIM Co Ltd.
exeCutiVegilbert espitalier noel (Non-executive until 30 June 2015)
He was the Chief Executive Officer of ENL Property Limited until
his appointment as Chief Executive Officer of the company in July 2015.
He holds a BSc (Hons) from Louisiana State University and a BSc from
the University of Cape Town as well as an MBA from INSEAD.
He has been the president of various private sector institutions including
the Joint Economic Council, the Mauritius Chamber of Commerce
and Industry and the Mauritius Sugar Producers Association.
Other directorship in listed companies: ENL Limited, ENL Land Ltd, ENL
Commercial Limited, ENL Investment Limited, Rogers & Co. Ltd
and Livestock Feed Limited.
marcel massonFellow member of the Association of Chartered Certified Accountants,
he joined the Company in 1985 and is currently the Finance Director.
Other directorship in listed companies: None.
jacques silVant He holds a Degree in Hospitality and Management, France. He was appointed
Director in February 2013. He joined the Company in 2001 and is currently
the General Manager of the Royal Palm Hotel.
Other directorship in listed companies: None.
françois VeninWorked overseas for Club Méditerranée and arrived in Mauritius in 1992
to manage Le Canonnier. He joined the Group when NMH acquired that hotel
in 1997. He has been appointed as Commercial Director in July 2015 and he
is also General Manager of Le Mauricia and Le Canonnier hotels since 2002
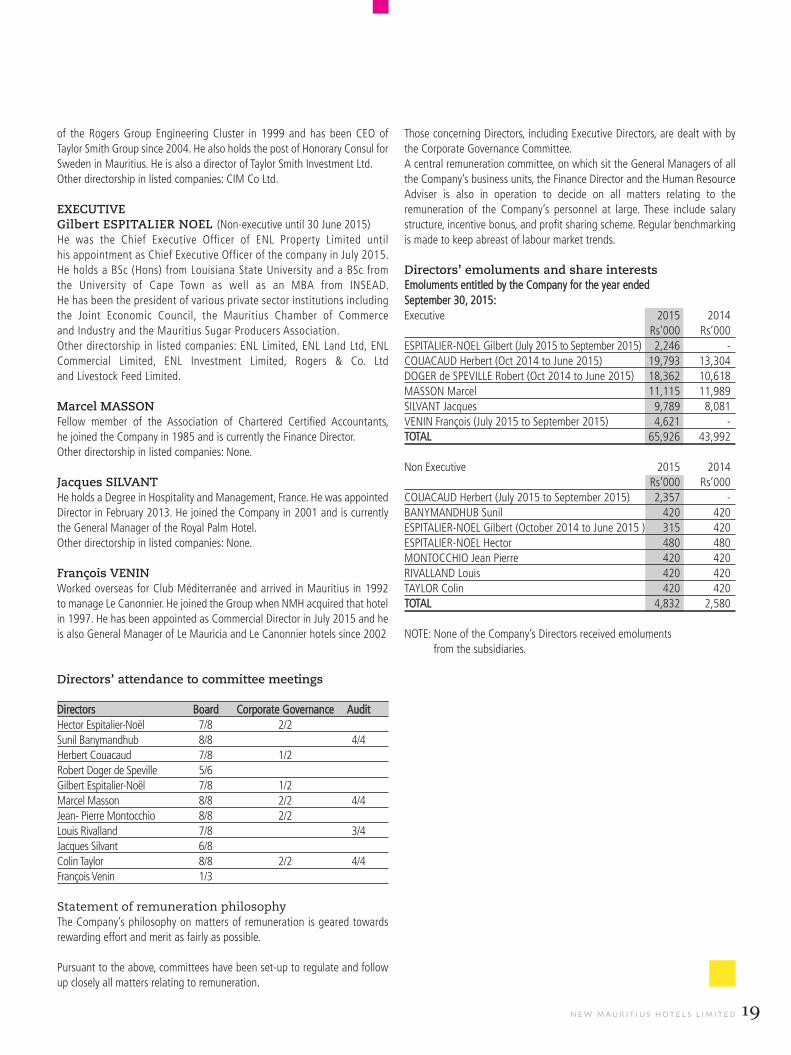
directors’ attendance to committee meetings
Directors Board Corporate Governance Audit
Hector Espitalier-Noël 7/8 2/2
Sunil Banymandhub 8/8 4/4
Herbert Couacaud 7/8 1/2
Robert Doger de Speville 5/6
Gilbert Espitalier-Noël 7/8 1/2
Marcel Masson 8/8 2/2 4/4
Jean- Pierre Montocchio 8/8 2/2
Louis Rivalland 7/8 3/4
Jacques Silvant 6/8
Colin Taylor 8/8 2/2 4/4
François Venin 1/3
Statement of remuneration philosophyThe Company’s philosophy on matters of remuneration is geared towards
rewarding effort and merit as fairly as possible.
Pursuant to the above, committees have been set-up to regulate and follow
up closely all matters relating to remuneration.
Those concerning Directors, including Executive Directors, are dealt with by
the Corporate Governance Committee.
A central remuneration committee, on which sit the General Managers of all
the Company’s business units, the Finance Director and the Human Resource
Adviser is also in operation to decide on all matters relating to the
remuneration of the Company’s personnel at large. These include salary
structure, incentive bonus, and profit sharing scheme. Regular benchmarking
is made to keep abreast of labour market trends.
directors’ emoluments and share interestsEmoluments entitled by the Company for the year ended
September 30, 2015:
Executive 2015 2014
Rs’000 Rs’000
ESPITALIER-NOEL Gilbert (July 2015 to September 2015) 2,246 -
COUACAUD Herbert (Oct 2014 to June 2015) 19,793 13,304
DOGER de SPEVILLE Robert (Oct 2014 to June 2015) 18,362 10,618
MASSON Marcel 11,115 11,989
SILVANT Jacques 9,789 8,081
VENIN François (July 2015 to September 2015) 4,621 -TOTAL 65,926 43,992
Non Executive 2015 2014
Rs’000 Rs’000
COUACAUD Herbert (July 2015 to September 2015) 2,357 -
BANyMANDHUB Sunil 420 420
ESPITALIER-NOEL Gilbert (October 2014 to June 2015 ) 315 420
ESPITALIER-NOEL Hector 480 480
MONTOCCHIO Jean Pierre 420 420
RIVALLAND Louis 420 420
TAyLOR Colin 420 420
TOTAL 4,832 2,580
NOTE: None of the Company’s Directors received emoluments
from the subsidiaries.
AR_2015_16_210x280_1part_Annual report_2015 1/22/16 3:56 PM Page 19
20 a n n u a l r e p o r t 2 0 1 5
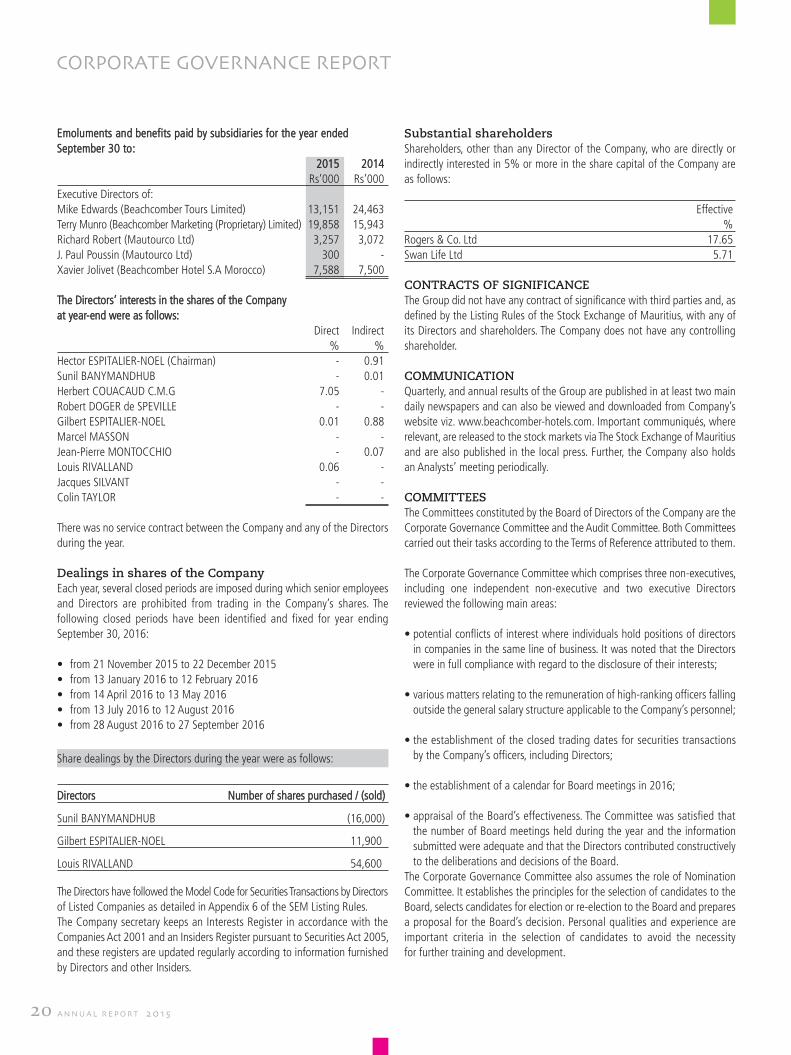
Emoluments and benefits paid by subsidiaries for the year ended
September 30 to:
2015 2014
Rs’000 Rs’000
Executive Directors of:
Mike Edwards (Beachcomber Tours Limited) 13,151 24,463
Terry Munro (Beachcomber Marketing (Proprietary) Limited) 19,858 15,943
Richard Robert (Mautourco Ltd) 3,257 3,072
J. Paul Poussin (Mautourco Ltd) 300 -
Xavier Jolivet (Beachcomber Hotel S.A Morocco) 7,588 7,500
The Directors’ interests in the shares of the Company
at year-end were as follows:
Direct Indirect
% %
Hector ESPITALIER-NOEL (Chairman) - 0.91
Sunil BANyMANDHUB - 0.01
Herbert COUACAUD C.M.G 7.05 -
Robert DOGER de SPEVILLE - -
Gilbert ESPITALIER-NOEL 0.01 0.88
Marcel MASSON - -
Jean-Pierre MONTOCCHIO - 0.07
Louis RIVALLAND 0.06 -
Jacques SILVANT - -
Colin TAyLOR - -
There was no service contract between the Company and any of the Directors
during the year.
dealings in shares of the CompanyEach year, several closed periods are imposed during which senior employees
and Directors are prohibited from trading in the Company’s shares. The
following closed periods have been identified and fixed for year ending
September 30, 2016:
• from 21 November 2015 to 22 December 2015
• from 13 January 2016 to 12 February 2016
• from 14 April 2016 to 13 May 2016
• from 13 July 2016 to 12 August 2016
• from 28 August 2016 to 27 September 2016
Share dealings by the Directors during the year were as follows:
Directors Number of shares purchased / (sold)
Sunil BANyMANDHUB (16,000)
Gilbert ESPITALIER-NOEL 11,900)
Louis RIVALLAND 54,600)
The Directors have followed the Model Code for Securities Transactions by Directors
of Listed Companies as detailed in Appendix 6 of the SEM Listing Rules.
The Company secretary keeps an Interests Register in accordance with the
Companies Act 2001 and an Insiders Register pursuant to Securities Act 2005,
and these registers are updated regularly according to information furnished
by Directors and other Insiders.
substantial shareholdersShareholders, other than any Director of the Company, who are directly or
indirectly interested in 5% or more in the share capital of the Company are
as follows:
Effective
%
Rogers & Co. Ltd 17.65
Swan Life Ltd 5.71
ContraCts of signifiCanCeThe Group did not have any contract of significance with third parties and, as
defined by the Listing Rules of the Stock Exchange of Mauritius, with any of
its Directors and shareholders. The Company does not have any controlling
shareholder.
CommuniCationQuarterly, and annual results of the Group are published in at least two main
daily newspapers and can also be viewed and downloaded from Company’s
website viz. www.beachcomber-hotels.com. Important communiqués, where
relevant, are released to the stock markets via The Stock Exchange of Mauritius
and are also published in the local press. Further, the Company also holds
an Analysts’ meeting periodically.
CommitteesThe Committees constituted by the Board of Directors of the Company are the
Corporate Governance Committee and the Audit Committee. Both Committees
carried out their tasks according to the Terms of Reference attributed to them.
The Corporate Governance Committee which comprises three non-executives,
including one independent non-executive and two executive Directors
reviewed the following main areas:
• potential conflicts of interest where individuals hold positions of directors
in companies in the same line of business. It was noted that the Directors
were in full compliance with regard to the disclosure of their interests;
• various matters relating to the remuneration of high-ranking officers falling
outside the general salary structure applicable to the Company’s personnel;
• the establishment of the closed trading dates for securities transactions
by the Company’s officers, including Directors;
• the establishment of a calendar for Board meetings in 2016;
• appraisal of the Board’s effectiveness. The Committee was satisfied that
the number of Board meetings held during the year and the information
submitted were adequate and that the Directors contributed constructively
to the deliberations and decisions of the Board.
The Corporate Governance Committee also assumes the role of Nomination
Committee. It establishes the principles for the selection of candidates to the
Board, selects candidates for election or re-election to the Board and prepares
a proposal for the Board’s decision. Personal qualities and experience are
important criteria in the selection of candidates to avoid the necessity
for further training and development.
Corporate GoVernanCe report
AR_2015_16_210x280_1part_Annual report_2015 1/22/16 3:56 PM Page 20
21n e w M a u r I t I u s h o t e l s l I M I t e d
The Company Secretary acts as secretary for the Committee.
The Audit Committee comprising three non-executive Directors met on a
quarterly basis mainly to:
• approve the internal annual audit plan ensuring that the audit scopes are
adequate and that the Internal Audit Division has sufficient resources to
carry out its duties effectively;
• review the internal audit reports and recommendations and ensure their
implementation by management;
• review the external audit engagement letter and the terms, nature and scope
of audit function;
• examine the financial statements and recommend their adoption to
the Board;
• assess and ensure the quality, integrity and reliability of the risk management
process.
The participants were the Audit Committee members, the Internal and External
Auditors, the Corporate Risk Management Officer, the Finance Director and
the Chief Accountant. The deputy chief internal auditor acts as secretary for
the Committee.
role and function of the Company secretaryThe Company Secretary serves as a focal point for communication with and
between the Board of Directors, senior management and the Company's
shareholders, and has a key role in the administration of the Board and critical
corporate matters.
He ensures that Board members have the proper advice and resources for
discharging their duties and he is also responsible for ensuring that the records
of the Board's actions reflect the proper exercise of those duties.
He provides advice on corporate governance issues, particularly related to the
re-election of Directors and other shareholder action taken at Annual Meetings.
He is responsible for the following:
1. Board and Committee Meetings
2. Minutes of Meetings
3. Annual Meeting of Shareholders including the Proxy Statement
4. Corporate Records
5. Share Transfers and Dividends
6. Compliance with Listing Standards
7. Compliance with the Company’s Constitution
profile of senior management team memBers
Hotel operations in mauritius
michel daruty de grandpreGraduated from “l’Ecole Hôtelière de Glion“ in Switzerland, he joined
the Group in April 1980. Worked in different departments before becoming
the General Manager of Le Chaland Hotel in 1983. He is, since 1985,
the General Manager of Trou aux Biches Resort & Spa.
lothar grossGraduated from Hotels and Restaurants Management in Germany, he also holds
a post graduate degree in Business Economics from Berlin Hotel Management
School. Before joining the Group in February 2009 as Manager of the Victoria
Hotel, he worked in different other hotels in Mauritius and Maldives. He is now
General Manager of Le Shandrani.
jean louis pismontGraduated from the hotel school of Granville, he also holds a Hotel
Management degree from Thonon-les-Bains in France. Before coming to Mauritius,
he worked in several countries rising through the ranks within reputable
international hotel chains. He joined the Group in 1996 and is currently the
General manager of Dinarobin Hotel Golf & Spa and Paradis Hotel & Golf Club.
rico paolettiGraduated in Switzerland. Before joining the Group as Hotel Manager of
Le Canonnier in 2008, he worked in various countries for reputable international
hotel chains. He is now the General Manager of Le Victoria and Le Mauricia.
fligHt and inland Catering
olivier nairaCHolds a degree in Business Management from Surrey University. He joined
NMH in January 2007 as Operations Manager at Plaisance Catering and is the
General Manager since April 2013.
Hotel and property operations oVerseas
norbert CouVreurHe worked for reputable hotel chains such as Sheraton hotels before joining
the group as Hotel Manager of Le Mauricia. He was appointed as General
Manager of Sainte Anne Island in 2011.
xavier joliVetWorked for reputable hotel chains in France, USA and Monaco before joining
the Group as Deputy Manager of the Royal Palm Mauritius in 2005.
He is currently the General Manager of the Royal Palm Marrakech.
laurent piat Studied Commerce in Montpellier, Paris and London and worked for one year
in an investment bank in New york before returning to Mauritius as Project
Manager for a local group. In 2007, he joined NMH as Project Coordinator
until he was appointed General Manager of the Marrakech project.
training
iqbaal BadullaHolder of a “Brevet Professionnel Hôtelier” and a Postgraduate in Business
Administration, he joined the group in 1995 and is currently the General
Manager of Beachcomber Training Academy.
tour operating and sales offiCes
sheila Collet serretJoined the Group as Sales Representative at Trou Aux Biches hotel in 1987.
Moved to Italy in 1989 to open and manage the Beachcomber office in Bergam
and has been in this role ever since.
rod eatHerAfter 10 years as an educator, he turned to travel, working with South African
companies. He holds the position of Managing Director of Beachcomber Tours
Australia since its inception in 1995.
AR_2015_16_210x280_1part_Annual report_2015 1/22/16 3:56 PM Page 21
22 a n n u a l r e p o r t 2 0 1 5
michael edWardsMichael Edwards joined Beachcomber Tours Limited in the UK as Managing
Director in 2001, having spent many years at International Travel Connections
Limited, another UK tour operator, in a similar role. In his early years he also served
in various capacities in the hotel industry in the UK and in the Caribbean.
terry munroQualified as a chartered accountant in 1975. Joined Beachcomber Marketing
(Pty) Ltd as Managing Director in 1986 and has been in this role ever since.
Carole peyreJoined the Group in 1986 as the first manager of the Beachcomber office in Paris.
She became the General Manager of Beachcomber Tours France when the
Company was founded in 1991 and has been in this role ever since.
richard roBertFellow Member of the Association of Certified Accountants (FCCA), he joined
the Rogers System & Audit Department in 1990 and in 2001, was transferred
to Mautourco Ltd, as Finance Manager and was promoted as Managing Director
in 2010. He was also recently appointed as Managing Director of White Palm Ltd.
rémi saBarrosWorked some ten years in luxury hotels before occupying senior positions in
the sales and marketing department of serviced residences and tour operating
companies successively. Joined the Group in 2001 to manage Beachcomber
office in Paris and has been in this role ever since.
elisabeth sulZenBaCHerHolds a master in business studies. She worked as Product Manager Indian Ocean
for an important German Tour Operator before joining the Group in 1989. She
has been managing the Beachcomber office in Munich ever since.
The senior management team also includes the four Executive Directors whose
profiles have been disclosed on page 13.
internal auditInternal Audit remains an independent and objective task force reporting to the
Audit Committee. The department consists of a team of professionally qualified
accountants and of staff with the relevant experience who adopt a rigorous and
methodical approach in their endeavour to ensure that appropriate procedures
and controls are in place to protect the Group’s income and assets.
All weaknesses identified are thoroughly investigated, formally discussed with
top management and corrective measures recommended for implementation
within a defined timeframe. Implementation review summaries together with
up to date progress status are presented to the Audit Committee.
risk managementExecutive Directors and General Managers are accountable to the Board for
the design, implementation and detailed monitoring of the risk management
process. General Managers submit periodical reports to the Corporate Risk
Management Officer highlighting, if any critical risks identified at operational
level and the way they are eliminated or at least reduced to a minimum. Critical
risks reported by all business units are consolidated and viewed at Group level.
A Risk Committee, comprising the Finance Director (Chairman), the Commercial
Director, the Group Human Resource Advisor, General Managers of hotels,
the Group Maintenance Engineer and the Risk Management Officer, deals
with: a) best practices in the field of food safety, b) health surveillance on the
personnel, c) requirements of Tour Operators, and d) safety objectives in boat
houses and diving centers.
Whereas the responsibility for setting risk management strategy remains with
the Board, the role of the Audit Committee encompasses the monitoring of
the risk management process with a view to assessing and assuring its quality,
integrity and reliability.
The list below shows the risks that could materially affect the Group’s business,
revenues and operating profits and the strategies employed by management
to reduce these risks to a minimum.
reputationTo maintain its reputation, the Group constantly upgrades its products and
adheres to high quality standards in all areas of operation. The Group has built
prestigious resorts and invests constantly to maximise its market share. Each
hotel has developed its own personality whilst holding to the Group’s
philosophy of providing the best of Mauritian hospitality.
At the operational level, the Group ensures that key management positions
are held by suitably qualified and trained staff with the required experience
in the hotel industry. Ongoing attention is given to environment, health and
safety issues and, in that respect, the Group thrives to adhere to the best
practices aimed at ensuring sustainable development.
events that impact international travel The hotels’ occupancy levels and the tariffs practiced by the Group could be
adversely impacted by events that discourage international travel. Factors such
as epidemics (e.g. H1N1 Ebola), threatened acts of terrorism, natural disasters
and continued effect of worldwide financial crisis could result in reduced
worldwide travel. A decrease in the demand for hotel rooms as a result
of such events has an adverse impact on the Group’s operations and
financial results.
The Group formulates plans which are reviewed and adjusted
to maximise its market share. Cost and expenditure are reviewed and
rationalised but not at the expense of security, safety and service quality.
Contingencies and business continuity plans are being revisited,
formalised and updated accordingly.
market and CompetitionThe Group is faced with local as well as global competition and has to reckon
with the seasonal nature of the hotel industry.
To remain competitive, the Group provides superior quality resorts and facilities
and adopts top edge marketing strategies to promote and sell its products.
It regularly participates in professional stands and promotional fairs. There is
Corporate GoVernanCe report
AR_2015_16_210x280_1part_Annual report_2015 1/22/16 3:56 PM Page 22
23n e w M a u r I t I u s h o t e l s l I M I t e d
an ongoing nurturing of long and well established relationship with its tour
operators and sales offices.
personnel and Quality serviceThe Group is reliant upon recruiting and retaining key personnel and
developing their skills to provide quality service to guests.
In order to develop, support and market its products, the Group hires, trains
and retains highly skilled employees with particular expertise. To that end,
a training structure within the group has been organised to consolidate
the promotion of service excellence. The training infrastructure in place in all
the business units together with the Beachcomber Training Academy enables
professional knowledge and skills to be constantly enhanced.
Moreover, to motivate employees a comprehensive structure has been
developed for their benefit, including high salary ranges, performance rewards,
profit sharing, retirement benefits, and medical assistance. Additionally,
to develop a spirit of unity social gatherings are regularly organised.
technology and information systemsThe Group relies on appropriate technology and information systems for the
running of its operations and disruption to such systems could adversely affect
the efficiency of its operation and business continuity.
To that end, the IT department has implemented procedures to safeguard
the computer installations of all hotels of the Group to ensure continuity
of operations.
Moreover, the Group always keeps pace with developments in technology and
aligns with business needs and responds to changes in business strategy
in order to maintain its competitiveness.
fraud and other irregularitiesThe Group may suffer financial losses due to breakdown in internal controls
at various levels. In each business unit, clearly defined systems and
procedures are in place to ensure compliance with internal controls thus
mitigating the risk of fraud. These systems are regularly monitored and
reviewed by the Internal Audit Team to ensure their continued efficiency
and effectiveness. The Group has formalised its ethical practices in order
to consolidate its culture of honesty and integrity. The Code of Ethics
and Business Conduct encourages all stakeholders to step up to their
responsibility to behave ethically and contributes towards the prevention
of frauds and irregularities.
litigation and insurance CoverThe Group is subject to risk of litigation from its guests, suppliers, employees
and regulatory authorities, for breach of its contractual obligations
or other duties.
Therefore, the Group has to ensure that its guests and employees are provided
with secured accommodation and related facilities and a safe workplace
respectively. Full time health and safety officers are employed to assist
management in that respect.
Management regularly seeks guidance from legal advisers and insurance
consultants to safeguard the Group against exposure to potential losses
in all respects.
As regards statutory returns in respect of taxes, these are regularly reviewed
and monitored by tax experts.
finanCialThe Group is exposed to a variety of financial risks which may impact on the
Group’s reported results and its business value. Financial risks and strategies
are described fully in note 32 to the Financial Statements.
Code of etHiCal ConduCtNMH is guided by a set of values that reflect high ethical and moral standards,
aimed at assuring credibility and preserving the company’s positive image
which is an asset that belongs to its shareholders, administrators and
employees and results directly from their behavior and commitment towards
the principles stated hereunder. All the administrators and employees must be
committed to the principles of honesty, trust and respect for others, and are
responsible for disseminating and practicing these values.
fundamental prinCiplesNMH and its subsidiaries commit to the following fundamental principles:
• Observing good corporate governance practices, good accounting and
management principles and practices, as well as clear, objective and timely
communication to their shareholders;
• Achieving their business objectives with corporate social responsibility,
valuing their employees, preserving the environment and contributing
towards the development of the communities where they are active; and
• Observing their legal obligations in the countries where they are active,
directly or indirectly.
CoVerage and sCopeAmongst the desirable ethical conducts that are expected to be observed
by the members of the Board of Directors, employees and trainees of the
Company and its subsidiaries are:
1. Performing their activities in conformity with the highest level of ethical
conduct and follow the Company’s policies and rules, stimulating and
guiding their colleagues in that respect;
2. Maintaining a positive, honorable, loyal, honest professional attitude
of mutual respect, trust and collaboration with other colleagues at work,
shareholders and investors;
3. Preserving the Company’s assets, including its image and reputation, facilities,
equipment and materials, using them only for their intended purposes;
4. Defending the Company’s interests in matters they are participating in,
according to predefined criteria;
5. Being diligent, responsible and respectful in relations with authorities,
clients, competitors, suppliers, members of the communities and all other
individuals, companies and organizations with which the company relates
in the exercise of its regular activities, always seeking to preserve the
company’s good reputation, image and relations;
6. Avoiding situations in which their own interests may come into conflict
with the company’s interests, and when this is not possible, refrain from
representing NMH in the issue under consideration, communicating
the fact immediately to their immediate superior;
7. Assuring that the communications and information are provided exclusively
by authorised employees, and that they are in compliance with NMH’s
policies, controls and procedures and with the applicable legislation;
8. Refraining from establishing commercial relations with companies that
knowingly do not follow ethical standards compatible with those followed
by the company;
AR_2015_16_210x280_1part_Annual report_2015 1/22/16 3:56 PM Page 23
24 a n n u a l r e p o r t 2 0 1 5
9. Preserving the secrecy of the Company’s confidential and strategic
information to which they have access, even if they no longer have any
bonds with the company, as well as act with due caution in relation
to privileged information; and
10. Being committed to preserving the environment and obeying the
environmental legislation, acting with social responsibility and respect
towards human dignity.
The following conducts are intolerable and subject to disciplinary penalties:
1. Taking advantage of their position aimed at obtaining conveniences or any
other form of illegitimate personal benefit, or for third parties they relate
with;
2. Discrimination based on ethnic background, sexual preference, religious
belief, union affiliation, political conviction, ideology, social class, special
handicap condition, marital status or age;
3. Harassment of any nature, including moral or sexual, provoking discomfort
to others;
4. Allowing or promoting political, religious or commercial propaganda in the
company’s quarters;
5. Preferential or privileged treatment towards any client or supplier that
disagrees with the company’s policies approved by the Board;
6. Offering payment or any other sort of personal benefit to any authority
or server from the public administration, directly or indirectly, in exchange
for advantages;
7. Establishing contact with the company’s competitors, violating the
applicable competition laws; and
8. Distorting the figures or accounting characterization of items that may
reflect on the company’s management reports or financial statements.
environment and social responsibilityNMH remains committed to reduce resource waste and save energy through
its continuous efforts to use modern technologies that limit negative impacts
on the environment. All necessary steps are taken to ensure that NMH
compares favourably when benchmarked against the best practices.
NMH did not have any obligation to pay CSR contribution due to tax losses arising
in the preceding year. However, the Company decided to maintain its support
to its solidarity fund (FED) with a voluntary contribution of Rs 6.5 million.
dividend policyDepending on the availability of funds, the Company’s policy is to distribute
around 50% of its earnings as dividends.
donationsThe Company has maintained its policy of channeling all requests for social
assistance through its solidarity fund, Fondation Espoir et Développement
(FED), created in March 1999. During the year, the Company contributed
Rs 6.5m (2014: Rs 5.8m) to the fund.
Political donations are dealt with by the Board. For the year under review,
an amount of Rs 7.5m has been donated to political parties (2014: Nil).
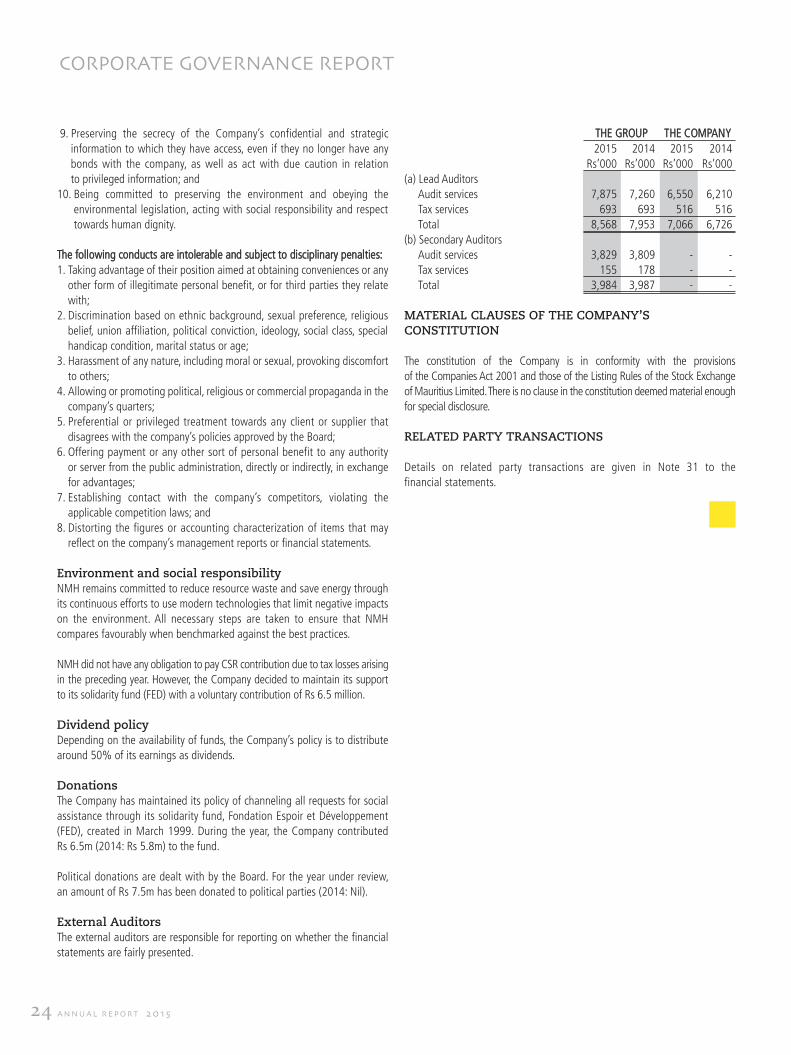
external auditorsThe external auditors are responsible for reporting on whether the financial
statements are fairly presented.
THE GROUP THE COMPANy
2015 2014 2015 2014
Rs’000 Rs’000 Rs’000 Rs’000
(a) Lead Auditors
Audit services 7,875 7,260 6,550 6,210
Tax services 693 693 516 516
Total 8,568 7,953 7,066 6,726
(b) Secondary Auditors
Audit services 3,829 3,809 - -
Tax services 155 178 - -
Total 3,984 3,987 - -
material Clauses of tHe Company’s Constitution
The constitution of the Company is in conformity with the provisions
of the Companies Act 2001 and those of the Listing Rules of the Stock Exchange
of Mauritius Limited. There is no clause in the constitution deemed material enough
for special disclosure.
related party transaCtions
Details on related party transactions are given in Note 31 to the
financial statements.
Corporate GoVernanCe report
AR_2015_16_210x280_1part_Annual report_2015 1/22/16 3:56 PM Page 24

25n e w M a u r I t I u s h o t e l s l I M I t e d
direCtors’ responsiBilities statement
The Company’s Directors are responsible for the preparation and fair presentation of the financial statements, comprising the Company’s and Group’s statements
of financial position at September 30, 2015 and the statements of profit or loss, statements of other comprehensive income, the statements of changes in equity and the
statements of cash flows for the year then ended, and the notes to the financial statements, which include a summary of significant accounting policies and other
explanatory notes, in accordance with International Financial Reporting Standards and Companies Act 2001. The Directors are also responsible to ensure that adequate
records have been maintained.
The Directors’ responsibility included designing, implementing and maintaining internal control relevant to the preparation and fair presentation of these financial statements
free from material misstatement, whether due to fraud or error; selecting and applying appropriate accounting policies, and making accounting estimates that were
reasonable in the circumstances.
The Directors have made an assessment of the Company as a going concern and have every reason to believe it will continue to operate for the foreseeable future.
The Company’s external auditors, Ernst & young, have full access to the Board of Directors and its committees to discuss the audit and matters arising therefrom,
such as their observations of the fairness of financial reporting and the adequacy of internal controls.
statement of ComplianCe(Section 75 (3) of the Financial Reporting Act)
We, the Directors of New Mauritius Hotels Limited, confirm that to the best of our knowledge, the Company has complied with all of its obligations and requirements
under the Code of Corporate Governance.
Hector ESPITALIER-NOEL Sunil BANyMANDHUB
CHAIRMAN CHAIRMAN OF THE AUDIT COMMITTEE
December 22, 2015
AR_2015_16_210x280_1part_Annual report_2015 1/22/16 3:56 PM Page 25

soCIal responsIbIlIty & sustaInabIlIty report
AR_2015_16_210x280_1part_Annual report_2015 1/22/16 3:56 PM Page 26
27n e w M a u r I t I u s h o t e l s l I M I t e d
BeaCHComBer Values and Corporate Culture
The hotel industry is a passionate service based sector in which men and
women play a predominant role: that of creating happiness and comfort to
visitors. Beachcomber has always been alive to that reality and has, by way of
recognition, attached the highest importance to the human element as part
of its philosophy and corporate culture.
Beachcomber is closely linked to the emergence of the local tourism industry
and is known for the determination displayed by its founders to associate its
personnel to the economic success and growth of the enterprise. It has, in the
course of time, introduced various measures aimed at improving the social
and financial situation of its personnel. Amongst these measures, it is worth
mentioning the salary structure which provides remuneration far above the
industry’s average and what is prescribed by law and, the profit sharing
scheme which in the worst year has brought at least a 14th month,
the excellent in-house pension fund, a comprehensive health scheme for the
employees and their family, the provision of free canteen facilities at work,
free transport to attend duties and continuous training which paves the way
for internal promotion and service excellence.
During the past few years and on account of unprecedented cash flow
constraints, it was difficult for Beachcomber to avoid its corporate culture being
somewhat overshadowed, leaving the perception of its relegation to the
middle ground. The complexities and difficulties of an expanding enterprise
at times generate such a situation, but what really matters is to remain alive
to the necessity of reasserting and consolidating the values which brought
the enterprise to be and remain in the forefront of the tourism industry.
This is precisely what Management commits itself to.
At the beginning of August, Management found that it had become necessary
to bring back faith and pride in what constituted the strengths and values of
Beachcomber. It launched the project ‘Beachcomber: au cœur des valeurs’which found its originality in promoting a collective in-depth analysis of
Beachcomber and of what its past achievements represented in the eyes of
the participants. The exercise spread over 3 months, entailed 36 sessions and
130 interviews to which actively participated some 600 employees of the
various enterprises operating in Mauritius, the Seychelles, South Africa, France
and Morocco. Eight values were identified by the participants, namely: the
distinctive Mauritian concept and style, service quality, savoir-faire, team spirit,
quest for innovation, caring management, confidence, and finally the Group’s
strength and resilience.
Well appreciated by the employees, the exercise also afforded them the
opportunity to express their perception of Beachcomber, and it was very
rewarding to note the reaffirmation of their pride to belong to an enterprise which
they overwhelmingly described as ‘caring’ and in which they have full confidence
and respect. In passing the floor to the employees, many aspirations also came
to light, the more important one being a strong need for continuous professional
improvement through training at all levels. This will be one of the priorities
for 2016 and a challenge for Beachcomber Training Academy.
The way forward is to build on the good perception expressed by the
employees, to strengthen the group’s communication and marketing strategies
and to develop further the Beachcomber Trade Name. Next year is expected
to be marked by enhanced dynamism, strong initiatives, renewed commitments
towards social responsibilities and continued implication in sustainable
developments, the four pillars that will continue to ensure and enhance
the Group’s notoriety and success.
Amongst the strong actions envisaged for 2016 it is worth mentioning the opening
of Trou-aux-Biches Training Centre which, in addition to providing courses in the
usual hotel trades, will constitute a breakthrough in the field of training of spa
therapists and technicians. Spa services in the local hotel industry have started
being offered some 15 years ago. Today, they cannot be dissociated from the
concept of luxury hospitality and is one of the criteria used by the authorities
for hotels’ classification. The 10 hotels operating under the Beachcomber label
do provide spa services and employ, to that effect, some 200 persons.
Up to now, most of the practising local therapists acquired their know-how
through on-the-job training. At Beachcomber, training was, to the greatest
part, conducted with the assistance and guidance of representatives of Clarins,
a renowned manufacturer of cosmetic products. The clientele is more and more
demanding and also conscious that insufficiently trained therapists could
constitute a health hazard to those using their services.
Beachcomber, in partnership with a French well known and highly recognized
institute, will launch a specialized school under the name of Santayarea Mauritiusby Beachcomber. The agreement between the parties has been signed on 16th
December 2015 and the school will start operating as from April next year.
The students will not only be taught the usual techniques but will also
be made to acquire the knowledge that will allow them to act as counsellors
in matters of health and well-being. The diploma that will be delivered upon
successful completion of the course will be recognized by the French
State (CNCP) and by the Mauritius Qualification Authority. Beachcomber hotels
will thus be able to offer a holistic package that would allow their clients to
combine leisure with physical well being.
BeaCHComBer’s soCial responsiBility
Beachcomber’s actions have not been limited to promoting the well-being of
its personnel. In 1999, conscious of its social responsibilities, the Group created
‘Fondation Espoir et Développement’ (FED) and committed itself to assist the
most vulnerable young citizens, primarily by giving them the opportunity to
find a means of living through basic literacy and training.
FED is composed of a team of permanent employees and has, since its
creation, initiated a number of interesting and sustainable programmes which
succeeded in bringing economic autonomy to many young persons who
otherwise would have remained on the fringe of society.
The first integration programme of FED was the ‘Projet Employabilité Jeunes’
(PEJ) opened to young persons aged between 16 and 23 years and having
experienced utter schooling failures. The basic objective was to turn them into
mature and responsible adults capable of entering the labour market after
having acquired some specific trade knowledge. The 2015-2016 promotion
is made up of 180 boys and girls who have been proposed apprenticeship
and on-the-job training in cooking, restaurant services and housekeeping
in the Group’s various hotels. They will also have the possibility to accede
to enhanced technical training by following courses either at Beachcomber
Training Academy or at the Mauritius Institute of Training and Development
AR_2015_16_210x280_1part_Annual report_2015 1/22/16 3:56 PM Page 27
28 a n n u a l r e p o r t 2 0 1 5
leading to the National Certificate 2 (NC2). At the end of their apprenticeship
and training they can thus obtain the NC2 in addition to the PEJ certification.
Since its inception in 2004, PEJ proved to be a very successful social project.
More than 1,600 young persons benefited from the programme, out of which
some 1,000 were offered permanent employment by Beachcomber. The remaining
500 are now working either for other hotel groups or in other sectors.
The project ‘Local Hands’ was launched in 2006. It now regroups some
70 small artisans of modest standing and has for objective to allow them
to attain autonomy by promoting and finding ways to develop the local
craftsmanship. With the cooperation of other institutions, the project proposes
training, production facilities and marketing assistance.
These artisans create unique local handicrafts and made-in-Mauritius
souvenirs, produced from simple materials such as coconut shell, tissues,
recycled materials and clay, mostly intended for tourists but also attractive to
the public at large. Thanks to the training and the various forms
of assistance extended to them, the said artisans have succeeded in selling a
large variety of quality products, essentially in hotels. In 2014, the overall
turnover amounted to some Rs 4m and year 2015 is expected to be still better.
FED is now envisaging to put in place appropriate arrangements that will allow
the artisans to self manage their sales in hotels. Necessary training will be
given in grooming as well as in French and English languages to afford them
maximum chances of success. By this new approach, FED wishes the artisans
to achieve complete autonomy as it is important for them to have direct
contacts with their clients so as to better understand their demand. In 2016
the ‘Local Hands’ association intends to launch sales on the web.
The Euro 1 Project was launched in November 2014 at Le Mauricia
and Canonnier hotels. The results were so encouraging that the project was
extended to the Victoria and Shandrani hotels and should be so at the Paradis
and Dinarobin hotels in the very near future.
The project aims at allowing consenting clients to contribute to FED’s activities
by giving a symbolic Euro at check out time. They may also contribute more or
use the special box kept at the reception counter for their donations.
In addition to the fund raising objective, the project is also a means of showing
Beachcomber’s commitments to social and environmental activities. One year
after its implementation, the project has proved to be a real success. Clients
are very keen to support social actions and the money so raised is used
to finance integration projects initiated by FED’s Regional Committees.
Apart from the projects which it itself initiates and operates, FED also finances a
number of interesting initiatives run by various ONGs engaged in education, health,
culture, sports and leisure. Recommendations come from the Regional Committees
on which sit hotel employees who can thus identify the needs in their respective
regions after consultation with ONGs and Government institutions.
The following main projects have been realised in 2015: Training offered to
Prevoc III boys of Triolet SSS, MCCI zEP of Pointe-aux-Piments school both
monitored by the Northern Regional Committee, the Ultra Trail RaidlightBeachcomber organized in collaboration with the South-East Regional
Committee which also monitored IT initiation programmes in three villages in
collaboration with the National Computer Board. The South-West Regional
Committee, on its part, collaborated to the Duke of Edinburgh Award Schemeto which participated some 100 young persons residing in the region
and to the adaptation of PEJ to the Prevoc IV of La Gaulette SSS. FED will
solicit increased participation in the Regional Committees so as to widen
the identification of the needs of inhabitants of the surrounding villages
concerned. It will also enlarge its collaboration with the ONGs, Government
Institutions and other relevant instances.
Sixteen years after its creation, FED is more than ever determined to fight
exclusion and strengthen its actions towards the social integration of the poor
and vulnerable citizens. The results achieved so far in that direction is a cause
of great satisfaction.
enVironment: an eCo sustainaBle CommitmentBy BeaCHComBer
The social action of Beachcomber would be meaningless if it were not
accompanied by a strong environmental action. Indeed, any action centred
around the human being cannot exclude consideration for the environment.
There can be no social responsibility without commitment to sustainable
eco-development. Similarly, there can be no sustainable eco-development
without the personal involvement of individuals.
This eco-citizen approach is all the more important given that the management
and optimum use of natural resources has become an unavoidable challenge
in the fight against global warming. Beachcomber has adopted this
eco-citizen approach since the eighties, at a time when such an issue was
neither relevant nor a priority. It was thus one of the pioneering Mauritian
groups to develop systems and technologies for promoting sustainable energy
saving practices with the installation of wastewater treatment plants and the
use of central water chillers for air conditioning. Economies that also allowed
significant operational cost reductions, since the hotels, as we know, are very
large consumers of water and electricity.
Today more than ever, the objective is to reduce the energy footprint as much
as possible, improve air quality and ultimately focus on renewable energy
sources rather than continuing with the inconsiderate use of fossil fuels.
To achieve these results, different strategies have been adopted over the years,
starting with the education and awareness of all employees and guests as
to the impact wrong behaviour can have on energy saving projects.
1. mastering energy ConsumptionHotels are by definition big energy users in terms of air conditioning
and lighting. Efforts must therefore be focussed on the control and reduction of
energy used for these purposes in order to reduce the impact on the environment
and on the operating costs. It is very encouraging to note that our hotels,
currently, have an average electrical energy intensity of 177.81 kWh / m2 /
year compared to an average of 261.74 kWh / m2 / year for comparable resort
hotels in the United States, according to a study by Cornell University.
In 2008, the Group launched a progressive replacement program for water
chillers used in our central air conditioning systems. This new generation
of equipment not only helps improve the overall energy efficiency, but also
reduce the electricity bill: for example, the installation of such new chillers
has generated annual savings of some Rs 10m in the Trou aux Biches Resort
& Spa alone.
The use of low energy lighting and LED bulbs has been gradually deployed in
all areas and has had for, direct effect, a reduction of over 80% in the specific
soCIal responsIbIlIty & sustaInabIlIty report
AR_2015_16_210x280_1part_Annual report_2015 1/22/16 3:56 PM Page 28

29n e w M a u r I t I u s h o t e l s l I M I t e d
power consumption associated with lighting and the indirect
effect of lesser air conditioning usage due to a huge reduction
in the heat emission of these new bulbs. LED bulbs have an
average life of 30,000 hours and produce 20 times less heat
than equivalent halogen or incandescent bulbs. Similarly, the
deployment of lighting and occupancy sensors in hotel rooms
since 2012 has allowed overall savings of 30% on cooling
costs which represent, on average, 45% of the total
energy cost of a hotel. This technology has been installed
at the new headquarters with the same efficiency.
Another system was put in place in most of our hotels with an
excellent return on investment and a considerable impact on carbon
dioxide emissions. This is a heat recovery system fitted on kitchen
central cold room compressors allowing the production of hot water.
This water is then used in kitchens thereby avoiding the consumption
of fossil fuel to produce it and making the kitchen completely
independent from the rest of the hotel for its hot water requirements.
We may also mention the micro load shedding system installed in
several of our hotels: a German system was chosen which
limits the use of electricity at any time according to a predetermined
set point, thus preventing it from overshooting the load demand
and being penalised by the electricity board. This very efficient
system was pioneered in 2005 in the main kitchen of Victoria,
then in the kitchens of Plaisance Catering and Trou aux Biches
Resort & Spa and is now deployed throughout the Shandrani.
Extensive use of the variable speed drives associated with more
and more advanced control systems have saved a lot of electricity
and water during recent years. Today, it is used in areas as diverse
as capacity control for cold room compressors, pressure control
on drinking water pumps and chilled water distribution pumps,
control of extraction fans in kitchen hoods and control of
dissolved oxygen in wastewater treatment plants.
Finally, the conversion of diesel to Liquid Petroleum Gas (LPG)
boilers, in partnership with Total, should ultimately have a positive
impact on the environment; LPG being much cleaner than diesel.
2. Water saving The need to preserve scarce water resources and the fact that hotels
are major consumers, prompted Beachcomber to take a number of
very tangible measures.
Each hotel has its own wastewater treatment plant. For example,
the Paradis Hotel & Golf Club and Dinarobin Hotel Golf & Spa
on the Morne Peninsula share a common wastewater
treatment plant which cleans up to 60% of the total volume of
wastewater produced per day, representing between 450 and
600 cubic meters of treated water. This water is used for irrigation
of the gardens and of the 18 holes golf course. The same
principle is applied in all the hotels of the Group.
Taps and showers of all hotels of the Group have been fitted with
flow regulators and aerators, which resulted in a 50% reduction of
water consumption without disrupting the customer’s comfort. The
Group also has in place a guest awareness program concerning
the scarcity of water and its proper use which includes explanatory
stickers and information sheets in the rooms.
AR_2015_16_210x280_1part_Annual report_2015 1/22/16 3:56 PM Page 29
soCIal responsIbIlIty & sustaInabIlIty report
Installation of computerised water quality controllers in pools has reduced the
volume of water used for washing the filters, but also to limit the consumption
of chlorine and acid. The pools are, therefore, much healthier for customers and
more economic in operation.
Since many years now, it became obvious that the availability of rainwater
in Mauritius was going down with the ever growing number of users whilst
storage capacity was lagging behind. Water stress will therefore still increase
in the coming years and will directly affect the hotels unless corrective actions
are taken. This forced Beachcomber to find alternative supply sources, mainly
through desalination of sea water, a technique increasingly used worldwide,
especially in coastal areas. Here too, Beachcomber has been a pioneer, having
installed a desalination unit to supply the Sainte Anne Resort & Spa,
in Seychelles, since 2002. This unit was supplemented in 2012 by a new plant
having a daily capacity of 300 cubic meters.
In Mauritius, a first desalination plant was built at the Morne Peninsula in
2007. With a production capacity of 800 cubic meters per day, it covers all
the water needs of the Dinarobin Hotel Golf & Spa and the Paradis Hotel &
Golf Club. About 650 cubic meters of water is used for hotel consumption,
whilst 150 cubic meters are devoted to irrigating gardens and golf courses.
The desalination capacity on the Morne Peninsula was subsequently increased
to 1,600 cubic meters per day, with a special focus on golf irrigation. Since
2011, Trou aux Biches Resort & Spa was also equipped with a desalination
plant covering 60% of its needs.
To reduce the incidence that hotels have on the supply of potable water to
the population, it is most probable that all hotels will have to be equipped
with their own desalination plant in the near future. These are big investments
but they allow a constant and high quality supply to hotels’ guests without
any negative impact on the local population.
3. invest in solar energyBeachcomber has a genuine will to invest in solar energy. Ultimately, the goal
is to replace all the hot water boilers fired with fossil fuels with solar thermal
systems to achieve substantial energy savings.
Le Mauricia was the first hotel in Mauritius to use such a system in 2008.
Today, Royal Palm, the Paradis Hotel & Golf Club, the Dinarobin Hotel Golf
& Spa, the Trou aux Biches Resort & Spa, the Ste Anne Resort & Spa and the
Royal Palm Marrakech are equipped with similar systems.
Beachcomber currently totals more than 6,500 square meters of panels,
making the Group, the owner of the largest field of thermal solar panels
in the Indian Ocean. These investments produce hot water for guests free
during summer months and at very low costs other months of the year. Studies
have been conducted for the installation of photovoltaic solar panels on some
sites. So far, these projects have not yet been implemented due to complicated
legal framework.
4. refurbishment of the royal palm: an example of an eco-friendly HotelThe refurbishment of the Royal Palm in 2014 incorporates several energy
saving features and a large focus on sustainable design. In this sense, it is quite
exemplary of what can be done today without affecting customer comfort.
Lighting is 100% LED in the rooms and public areas, resulting in a 70%
decrease in power consumption of the hotel lighting.
The installation of an energy management system based on movement
detection sensors in rooms, coupled with smart thermostats, have achieved
additional energy saving of 30%. The entire system is connected to the hotel
reservation system, to ensure that the air conditioning in the rooms is always
linked to the status of the room.
Water quality controllers were set up in all of the pools, with continuous
monitoring of some parameters such as the chlorine and pH, resulting in a
drastic reduction in the consumption of chlorine and ensuring an optimal and
comfortable water quality for the client. The system was deployed, with similar
success at Le Canonnier in 2015.
The solar water heating system was upgraded with the addition of 20 square
meters of additional panels bringing the total installed surface area to 200
square meters, which has greatly reduced dependence on fossil fuels for the
production of hot water.
The installation of a special highly reflective waterproofing membrane on the
roof led to an estimated decrease of 32% in the peak load of air conditioning
in the rooms. Similarly, plaster based false ceilings were included in each room
and bathroom. Besides their aesthetic and decorative appearance, they help to
reduce by 13% the annual cooling needs.
Finally, the installation of a decentralized energy management system which
controls the peak load n kitchens and the main machinery room helps reduce
the excess demand in kVA.
5. energy improvement projects realized in 2014/2015A. Replacement of chilled water production groups
The chilled water production units installed in 2001 at Paradis Hotel & Golf
Club and Dinarobin Hotel Golf & Spa, and working with HCFC R22 have been
replaced by new machines running on ozone friendly R410A. These machines
are much more efficient, especially at base load; a condition in which
themachines operate 80% of the time. At Le Canonnier the chillers, which
were installed in 1998, were also replaced with a new machine using R-134A
and incorporating all the latest technology for energy efficiency.
All chiller units installed in 2015 and those which will be installed in 2016
are equipped with variable speed fans on the condensers and with
micro-channels for air cooled condensers. The result is a much better efficiency
and machines that contain much less refrigerant load.
B. Refurbishments at Paradis Hotel & Golf Club
The common areas, Spa, Kid’s Club and the main restaurant have been
completely refurbished, and the Junior Suites have been relamped and
redecorated. This work, though mostly decorative, included a significant energy
component especially with the replacement of more than 3000 halogen
fixtures with an average of 50W rating by equivalent or better LED bulbs with
an average of 7W rating each, resulting in a direct saving of 129 kilowatts.
All the equipment in the main restaurant buffets, main kitchen pastry and
main bar have been replaced with much more efficient equipment, and for
the refrigerated equipment, filled with refrigerant respectful of the ozone layer.
C. Gradual Replacement of Thermostatic Expansion Valves
The thermostatic expansion valves used in the majority of cold rooms of our
hotels are gradually being replaced by electronic regulators and electric ex-
pansion valves which are much more accurate and generate great savings
when combined with a variable speed drive on the compressors.
30 a n n u a l r e p o r t 2 0 1 5
AR_2015_16_210x280_1part_Annual report_2015 1/22/16 3:56 PM Page 30
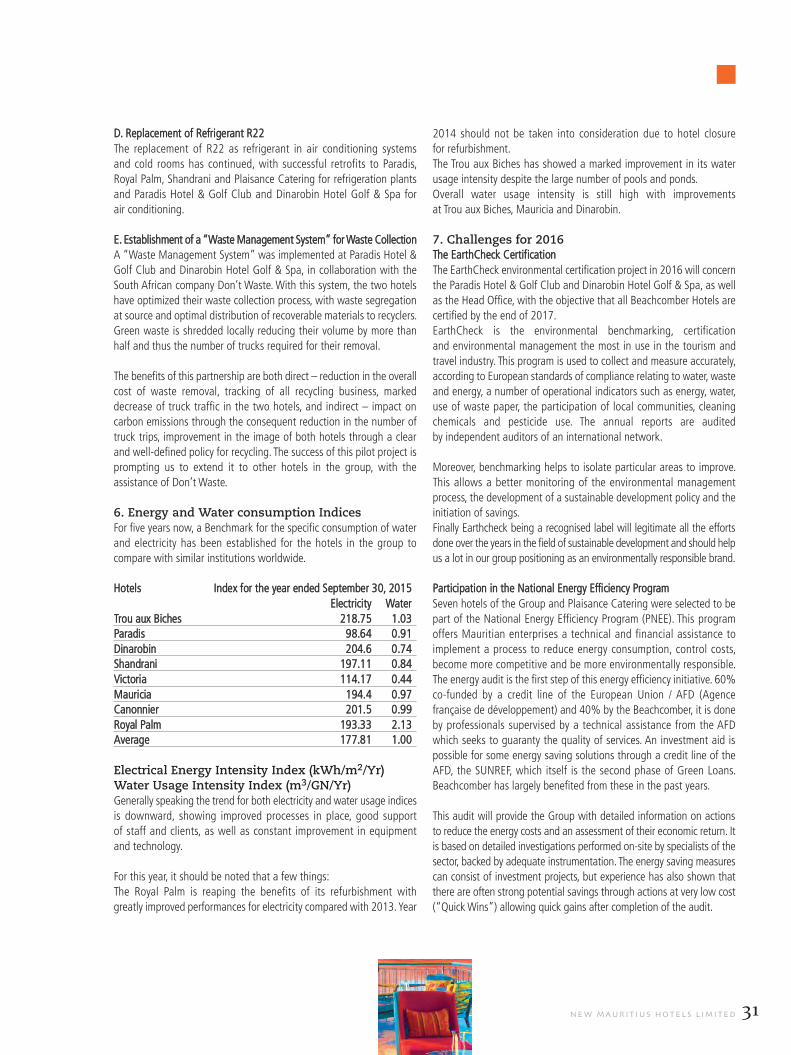
31n e w M a u r I t I u s h o t e l s l I M I t e d
soCIal responsIbIlIty & sustaInabIlIty report
D. Replacement of Refrigerant R22
The replacement of R22 as refrigerant in air conditioning systems
and cold rooms has continued, with successful retrofits to Paradis,
Royal Palm, Shandrani and Plaisance Catering for refrigeration plants
and Paradis Hotel & Golf Club and Dinarobin Hotel Golf & Spa for
air conditioning.
E. Establishment of a “Waste Management System” for Waste Collection
A “Waste Management System” was implemented at Paradis Hotel &
Golf Club and Dinarobin Hotel Golf & Spa, in collaboration with the
South African company Don’t Waste. With this system, the two hotels
have optimized their waste collection process, with waste segregation
at source and optimal distribution of recoverable materials to recyclers.
Green waste is shredded locally reducing their volume by more than
half and thus the number of trucks required for their removal.
The benefits of this partnership are both direct – reduction in the overall
cost of waste removal, tracking of all recycling business, marked
decrease of truck traffic in the two hotels, and indirect – impact on
carbon emissions through the consequent reduction in the number of
truck trips, improvement in the image of both hotels through a clear
and well-defined policy for recycling. The success of this pilot project is
prompting us to extend it to other hotels in the group, with the
assistance of Don’t Waste.
6. energy and Water consumption indices For five years now, a Benchmark for the specific consumption of water
and electricity has been established for the hotels in the group to
compare with similar institutions worldwide.
Hotels Index for the year ended September 30, 2015
Electricity Water
Trou aux Biches 218.75 1.03Paradis 98.64 0.91
Dinarobin 204.6 0.74Shandrani 197.11 0.84
Victoria 114.17 0.44
Mauricia 194.4 0.97Canonnier 201.5 0.99
Royal Palm 193.33 2.13Average 177.81 1.00
electrical energy intensity index (kWh/m2/yr)Water usage intensity index (m3/gn/yr)Generally speaking the trend for both electricity and water usage indices
is downward, showing improved processes in place, good support
of staff and clients, as well as constant improvement in equipment
and technology.
For this year, it should be noted that a few things:
The Royal Palm is reaping the benefits of its refurbishment with
greatly improved performances for electricity compared with 2013. year
2014 should not be taken into consideration due to hotel closure
for refurbishment.
The Trou aux Biches has showed a marked improvement in its water
usage intensity despite the large number of pools and ponds.
Overall water usage intensity is still high with improvements
at Trou aux Biches, Mauricia and Dinarobin.
7. Challenges for 2016 The EarthCheck Certification
The EarthCheck environmental certification project in 2016 will concern
the Paradis Hotel & Golf Club and Dinarobin Hotel Golf & Spa, as well
as the Head Office, with the objective that all Beachcomber Hotels are
certified by the end of 2017.
EarthCheck is the environmental benchmarking, certification
and environmental management the most in use in the tourism and
travel industry. This program is used to collect and measure accurately,
according to European standards of compliance relating to water, waste
and energy, a number of operational indicators such as energy, water,
use of waste paper, the participation of local communities, cleaning
chemicals and pesticide use. The annual reports are audited
by independent auditors of an international network.
Moreover, benchmarking helps to isolate particular areas to improve.
This allows a better monitoring of the environmental management
process, the development of a sustainable development policy and the
initiation of savings.
Finally Earthcheck being a recognised label will legitimate all the efforts
done over the years in the field of sustainable development and should help
us a lot in our group positioning as an environmentally responsible brand.
Participation in the National Energy Efficiency Program
Seven hotels of the Group and Plaisance Catering were selected to be
part of the National Energy Efficiency Program (PNEE). This program
offers Mauritian enterprises a technical and financial assistance to
implement a process to reduce energy consumption, control costs,
become more competitive and be more environmentally responsible.
The energy audit is the first step of this energy efficiency initiative. 60%
co-funded by a credit line of the European Union / AFD (Agence
française de développement) and 40% by the Beachcomber, it is done
by professionals supervised by a technical assistance from the AFD
which seeks to guaranty the quality of services. An investment aid is
possible for some energy saving solutions through a credit line of the
AFD, the SUNREF, which itself is the second phase of Green Loans.
Beachcomber has largely benefited from these in the past years.
This audit will provide the Group with detailed information on actions
to reduce the energy costs and an assessment of their economic return. It
is based on detailed investigations performed on-site by specialists of the
sector, backed by adequate instrumentation. The energy saving measures
can consist of investment projects, but experience has also shown that
there are often strong potential savings through actions at very low cost
(“Quick Wins”) allowing quick gains after completion of the audit.
AR_2015_16_210x280_1part_Annual report_2015 1/22/16 3:56 PM Page 31
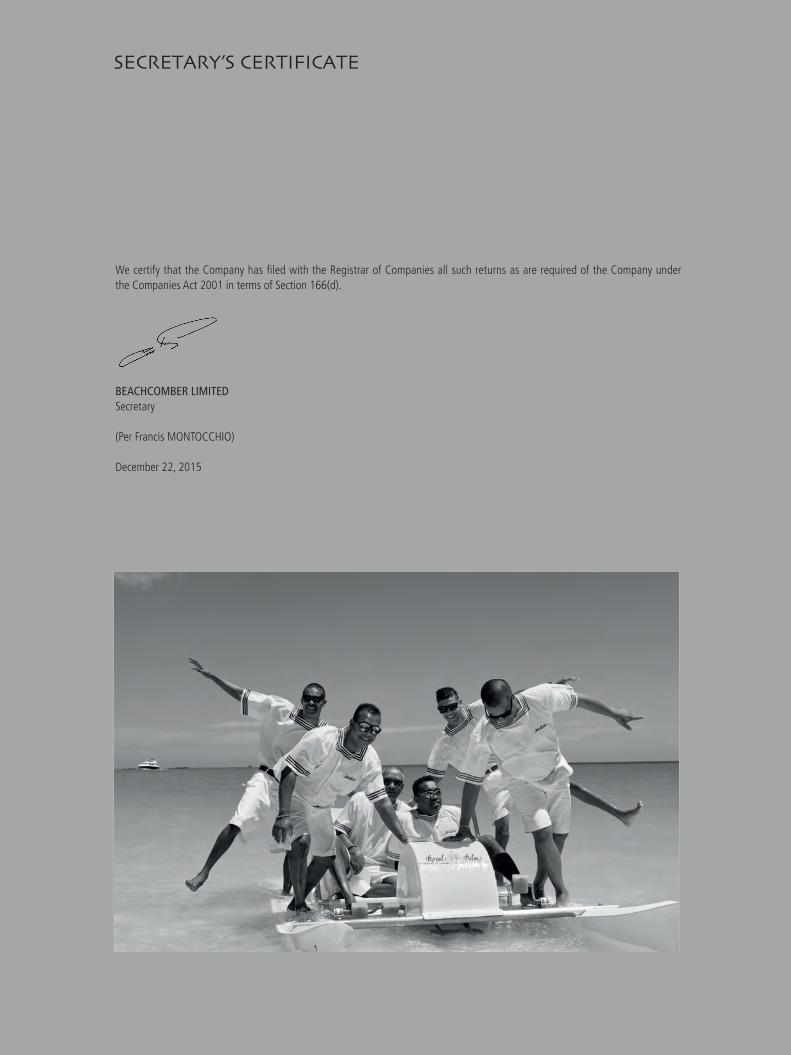
seCretary’s CertIFICate
SEcRETARy’S cERTiFicATEWe certify that the Company has filed with the Registrar of Companies all such returns as are required of the Company under
the Companies Act 2001 in terms of Section 166(d).
bEaCHCombER lImITED
Secretary
(Per Francis MONTOCCHIO)
December 22, 2015
AR_2015_16_210x280_1part_Annual report_2015 1/22/16 3:56 PM Page 32
report on the financial statements
We have audited the financial statements of New Mauritius
Hotels Limited (the “Company”) and its subsidiaries
(the “Group”) on pages 37 to 105 which comprise the statements
of financial position as at September 30, 2015 and the
statements of profit or loss and, statements of other
comprehensive income, statements of changes in equity and
statements of cash flows for the year then ended and a summary
of significant accounting policies and other explanatory notes.
Directors’ Responsibility for the Financial StatementsThe Directors are responsible for the preparation and fair
presentation of these financial statements in accordance with
International Financial Reporting Standards and in compliance
with the requirements of the Companies Act 2001 and Financial
Reporting Act 2004, and for such internal control as the Directors
determine is necessary to enable the preparation of financial
statements that are free from material misstatement, whether
due to fraud or error.
Auditors’ ResponsibilityOur responsibility is to express an opinion on these financial
statements based on our audit. We conducted our audit
in accordance with International Standards on Auditing. Those
Standards require that we comply with ethical requirements
and plan and perform the audit to obtain reasonable assurance
about whether the financial statements are free from
material misstatement.
An audit involves performing procedures to obtain audit evidence
about the amounts and disclosures in the financial statements.
The procedures selected depend on the auditors’ judgement,
including the assessment of the risks of material misstatement of
the financial statements, whether due to fraud or error. In making
those risk assessments, the auditors consider internal control
relevant to the company’s preparation and fair presentation of the
financial statements in order to design audit procedures that are
appropriate in the circumstances, but not for the purpose
of expressing an opinion on the effectiveness of the company’s
internal control. An audit also includes evaluating the
appropriateness of accounting policies used and the reasonableness
of accounting estimates made by the Directors, as well as evaluating
the overall presentation of the financial statements.
We believe that the audit evidence we have obtained is sufficient
and appropriate to provide a basis for our audit opinion.
Opinion
In our opinion, the financial statements on pages 37 to 105 give
a true and fair view of the financial position of the Group
and the Company as at September 30, 2015 and of their
financial performance and cash flows for the year then ended in
accordance with International Financial Reporting Standards and
comply with the Companies Act 2001 and Financial Reporting
Act 2004.
Other matterThis report has been prepared solely for the Company’s
members, as a body, in accordance with Section 205 of the
Companies Act 2001. Our audit work has been undertaken so
that we might state to the Company’s members those matters
we are required to state to them in an auditors’ report and for
no other purpose. To the fullest extent permitted by law, we do
not accept or assume responsibility to anyone other than the
Company and the Company’s members, as a body, for our audit
work, for this report, or for the opinions we have formed.
Report on Other Legal and Regulatory Requirements
Companies Act 2001
We have no relationship with or interests in the Group
and the Company other than in our capacities as auditors,
tax advisors, and dealings in the ordinary course of business.
We have obtained all the information and explanations we have
required.
In our opinion, proper accounting records have been kept
by the Company as far as it appears from our examination
of those records.
Financial Reporting Act 2004
The Directors are responsible for preparing the Corporate
Governance Report. Our responsibility is to report on the extent
of compliance with the Code of Corporate Governance
(the “Code”) as disclosed in the Annual Report and on whether
the disclosures are consistent with the requirements of the Code.
In our opinion, the disclosures in the annual report are consistent
with the requirements of the Code.
ERNST & yOUNG ROGER DE CHAzAL, A.C.A
Ebène, Mauritius Licensed by Financial Reporting Council
December 22, 2015
Independent audItors’ reportto the members of new MaurItIus hotels lIMIted
n e w M a u r I t I u s h o t e l s l I M I t e d 33
AR_2015_16_210x280_1part_Annual report_2015 1/22/16 3:56 PM Page 33

34 a n n u a l r e p o r t 2 0 1 5
AR_2015_16_210x280_1part_Annual report_2015 1/22/16 3:56 PM Page 34

35n e w M a u r I t I u s h o t e l s l I M I t e d
AR_2015_16_210x280_1part_Annual report_2015 1/22/16 3:56 PM Page 35
FInanCIal stateMentsfor the year ended september 30, 2015
SEcRETARy’S cERTiFicATE
AR_2015_16_210x280_1part_Annual report_2015 1/22/16 3:56 PM Page 36

37n e w M a u r I t I u s h o t e l s l I M I t e d
THE GROUP THE COMPANY
Notes 2015) 2014) 2015) 2014)
Rs.’000) Rs.’000) Rs.’000) Rs.’000)
Revenue 4 9,356,658 8,793,343 6,536,644 6,287,238
Direct costs (2,166,722) (1,899,652) (1,004,461) (997,637)
Staff costs 5 (3,092,693) (2,924,188) (2,184,162) (2,111,309)
Other expenses 6 (2,675,299) (2,638,115) (1,854,928) (1,822,084)
Earnings from operating activities 1,421,944 1,331,388 1,493,093 1,356,208
Other income 10 132,446 260,476 - 9,000
Finance revenue 7 196,661 211,651 69,204 191,022
Share of results of associates 17 13,956 1,423 - -
(Loss)/ profit on disposal of property, plant and equipment (8,174) 2,127 (11,956) (8,128)
EBITDA 1,756,833 1,807,065 1,550,341 1,548,102
Finance costs 8 (940,718) (688,640) (714,361) (938,616)
Depreciation and impairment of property, plant and equipment 13 (536,380) (563,282) (348,598) (434,080)
Amortisation of intangible assets 15 (5,881) (4,594) (2,343) (2,343)
Pre-operational expenses re Marrakech project 9 - (61,697) - -
Impairment losses 15 - - (1,500,000)
Impairment of goodwill 15 (5,883) - - -
Profit before tax 267,971 488,852 (1,014,961) 173,063
Income tax (expense)/ credit 11 (60,394) 12,782 (77,720) 6,839
Profit/(loss) for the year 207,577 501,634 (1,092,681) 179,902
Profit/(loss) attributable to:
Owners of the parent 168,978 458,494 (1,092,681) 179,902
Non-controlling interests 38,599 43,140 - -
207,577 501,634 (1,092,681) 179,902
Basic earnings per share (Rs) 12 0.35 0.95
THE GROUP THE COMPANY
2015) 2014) 2015) 2014)
Rs.’000) Rs.’000) Rs.’000) Rs.’000)Profit/(loss) for the year 207,577 501,634 (1,092,681) 179,902 Other comprehensive income/(loss):Other comprehensive income/ (loss) to be reclassified to profit or loss in subsequent periods:Exchange differences on translation of foreign operations 309,236 (416,973) - - Gain/(loss) on available-for-sale financial assets 686 (681) (383) 370 Disposal of available-for-sale financial assets (3,594) - - - Loss on cash flow hedges (22,739) (7,624) - - Net other comprehensive income/(loss) to be reclassified to profit or loss in subsequent periods: 283,589 (425,278) (383) 370 Other comprehensive (loss)/ income not to be reclassified to profit or loss in subsequent periods:Remeasurement of retirement benefit obligations (394,365) 28,068 (390,694) 26,277 Tax effect on gains on retirement benefit obligations 58,857 (4,210) 58,604 (3,942)Gains/ (losses) on revaluation of property 372,964 623,973 80,324 (11,024)Tax effect on gains/(losses) on property revaluation (38,983) (402) (11,909) 2,462 Net other comprehensive (loss)/ income not to be reclassified to profit or loss in subsequent periods: (1,527) 647,429 (263,675) 13,773 Other comprehensive income/ (loss) for the year, net of tax 282,062 222,151 (264,058) 14,143 Total comprehensive income/(loss) for the year 489,639 723,785 (1,356,739) 194,045 Total comprehensive income/(loss) attributable to:Owners of the parent 455,143 676,523 (1,356,739) 194,045 Non-controlling interests 34,496 47,262 - -
489,639 723,785 (1,356,739) 194,045
stateMents oF other CoMprehensIVe InCoMefor the year ended september 30, 2015
stateMents oF proFIt or lossfor the year ended september 30, 2015
AR_2015_16_210x280_1part_Annual report_2015 1/22/16 3:56 PM Page 37

38 a n n u a l r e p o r t 2 0 1 5
statements of financial positionas at september 30, 2015
THE GROUP THE COMPANYnotes 2015 2014 2015 2014
rs.’000 rs.’000 rs.’000 rs.’000aSSetS non-current assetsproperty, plant and equipment 13 25,508,538 24,826,796 17,440,839 17,958,601 investment properties 14 366,000 786,900 - 195,125 intangible assets 15 1,696,073 1,697,550 1,216,581 1,218,924 investment in subsidiaries 16 - - 7,057,733 7,798,406 investment in associates 17 535,395 526,863 19,062 19,062 available-for-sale financial assets 18 4,512 25,340 1,467 1,850 deferred tax asset 26 209,877 130,261 - -
total non-current assets 28,320,395 27,993,710 25,735,682 27,191,968current assetsinventories 20 4,752,530 3,882,196 2,488,203 1,501,377 trade and other receivables 21 2,890,986 3,032,387 2,959,184 3,223,822 other financial assets 34 10,408 20,257 10,408 20,257 income tax prepaid 11 12,815 15,737 12,578 12,382 cash in hand and at banks 22 809,367 801,277 273,062 58,084
total current assets 8,476,106 7,751,854 5,743,435 4,815,922
total assets 36,796,501 35,745,564 31,479,117 32,007,890
eQuity and liaBilitieS
equity attributable to owners of the parent Stated capital 23 5,000,000 1,724,361 5,000,000 1,724,361 retained earnings 6,741,204 6,857,400 3,730,970 5,129,194 other components of equity 24 1,905,733 4,610,033 1,215,403 4,449,557
13,646,937 13,191,794 9,946,373 11,303,112 non-controlling interests 59,067 74,257 - -total equity 13,706,004 13,266,051 9,946,373 11,303,112 non-current liabilitiesconvertible preference shares 25 1,755,115 - 1,755,115 - Borrowings 25 10,401,739 9,430,966 9,783,314 8,926,574 deferred tax liabilities 26 1,508,201 1,419,966 1,384,707 1,360,174 employee benefit liabilities 19 1,126,060 718,752 1,103,413 702,700
total non-current liabilities 14,791,115 11,569,684 14,026,549 10,989,448
current liabilitiestrade and other payables 27 3,189,614 3,779,879 2,726,566 2,875,407 Borrowings 25 5,106,639 7,086,795 4,779,629 6,799,414 other financial liabilities 34 - 40,509 - 40,509 income tax payable 11 3,129 2,646 - -
total current liabilities 8,299,382 10,909,829 7,506,195 9,715,330
total liabilities 23,090,497 22,479,513 21,532,744 20,704,778
total equity and liabilities 36,796,501 35,745,564 31,479,117 32,007,890
approved by the Board of directors on december 22, 2015 and signed on its behalf by:
hector eSpitalier-noel
chairman
december 22, 2015
Sunil BanymandhuB
chairman of the audit
committee
AR_2015_16_210x280_2part_Mise en page 1 1/22/16 4:19 PM Page 38

39n e w m a u r i t i u s h o t e l s l i m i t e d 39n e w m a u r i t i u s h o t e l s l i m i t e d
THE GROUP
Attributable to owners of the parent company
Foreign Available-for-
Exchange sale Financial Non-
Stated Retained Difference Assets Revaluation Other controlling Total
Capital Earnings Reserves Reserves Reserves Reserves Total Interests EquityRs.’000 Rs.’000 Rs.’000 Rs.’000 Rs.’000 Rs.’000 Rs.’000 Rs.’000 Rs.’000
At October 1, 2013 1,724,361 6,499,379) (1,047,815) 14,559) 4,861,628) 624,583) 12,676,695) 68,915) 12,745,610)
Changes in equity for the year
Profit for the year - 458,494) -) -) -) -) 458,494) 43,140) 501,634)
Other comprehensive income/(loss) for the year - 23,683) (424,328) (681) 619,355) - 218,029) 4,122) 222,151)
Total comprehensive income/(loss) for the year - 482,177) (424,328) (681) 619,355) - 676,523) 47,262) 723,785)
Depreciation transfer for buildings - 43,845) -) - (43,845) -) -) -) -)
Tax effect of depreciation transfer for buildings - (6,577) -) - 6,577) -) -) -) -)
Dividends (Note 28/Note 30) - (161,424) -) - -) -) (161,424) (41,920) (203,344)
At September 30, 2014 1,724,361 6,857,400) (1,472,143) 13,878) 5,443,715) 624,583) 13,191,794) 74,257) 13,266,051)
At October 1, 2014 1,724,361) 6,857,400) (1,472,143) 13,878) 5,443,715) 624,583) 13,191,794) 74,257) 13,266,051)
Changes in equity for the year
Profit for the year -) 168,978) -) -) -) -) 168,978) 38,599) 207,577)
Other comprehensive (loss)/income for the year -) (333,854) 288,410) (2,908) 334,517) -) 286,165) (4,103) 282,062)
Total comprehensive (loss)/income for the year -) (164,876) 288,410) (2,908) 334,517) -) 455,143) 34,496) 489,639)
Depreciation transfer for buildings -) 57,271) -) -) (57,271) -) -) -) -)
Tax effect of depreciation transfer for buildings -) (8,591) -) -) 8,591) -) -) -) -)
Bonus issue (Note 23) 3,275,639) -) -) -) (3,275,639) -) -) -) -)
Dividends (Note 30) -) -) -) -) -) -) -) (49,686) (49,686)
At September 30, 2015 5,000,000) 6,741,204) (1,183,733) 10,970) 2,453,913) 624,583) 13,646,937) 59,067) 13,706,004)
THE COMPANY
Available-for-
Stated Retained sale Financial Revaluation Total
Capital Earnings Assets Reserves Reserve Equity
Rs.’000 Rs.’000 Rs.’000 Rs.’000 Rs.’000
At October 01, 2013 1,724,361) 5,055,912) 569) 4,489,649) 11,270,491)
Changes in equity for the year
Profit for the year -) 179,902) -) -) 179,902)
Other comprehensive income/(loss) for the year -) 22,335) 370) (8,562) 14,143)
Total comprehensive income/(loss) for the year -) 202,237) 370) (8,562) 194,045)
Depreciation transfer for buildings -) 38,199) -) (38,199) -)
Tax effect of depreciation transfer for buildings -) (5,730) -) 5,730) -)
Dividends (Note 28) -) (161,424) -) -) (161,424)
At September 30, 2014 1,724,361) 5,129,194) 939) 4,448,618) 11,303,112)
At October 01, 2014 1,724,361) 5,129,194) 939) 4,448,618) 11,303,112)
Changes in equity for the year
Loss for the year -) (1,092,681) -) -) (1,092,681)
Other comprehensive (loss)/income for the year -) (332,090) (383) 68,415) (264,058)
Total comprehensive (loss)/income for the year -) (1,424,771) (383) 68,415) (1,356,739)
Depreciation transfer for buildings -) 31,232) -) (31,232) -)
Tax effect of depreciation transfer for buildings -) (4,685) -) 4,685) -)
Bonus issue (Note 23) 3,275,639) -) -) (3,275,639) -)
At September 30, 2015 5,000,000) 3,730,970) 556) 1,214,847) 9,946,373)
statements of changes in equityfor the year ended september 30, 2015
AR_2015_16_210x280_2part_Mise en page 1 1/25/16 3:14 PM Page 39

40 a n n u a l r e p o r t 2 0 1 540 a n n u a l r e p o r t 2 0 1 5
statements of cash flowsfor the year ended september 30, 2015
THE GROUP THE COMPANYnotes 2015) 2014) 2015) 2014)
rs.’000 rs.’000 rs.’000) rs.’000)
operating activitiesprofit/(loss) before tax 267,971) 488,852) (1,014,961) 173,063)
adjustments to reconcile profit/(loss) before tax to net cash flowsnon-cash:depreciation and impairment on property, plant and equipment 13 536,380) 571,277) 348,598) 434,079)amortisation of intangible assets 15 5,881) 4,594) 2,343) 2,343)impairment of goodwill 15 5,883) -) -) -)loss/(profit) on disposal of property, plant and equipment 8,174) (2,127) 11,956) 8,128)Gain on disposal of available-for-sale investment (2,871) -) -) -)impairment loss on investment and intercompany receivable16 & 21 -) -) 1,500,000) -)provision for bad debts 6,641) 52) 6,787) 3,295)fair value gain on investment properties 14 (106,063) (250,942) -) -)dividend income (32) (513) (19,006) (12,692)interest income (32,216) (35,196) (2,230) (1,915)interest expense 869,129) 648,131) 676,013) 573,223)(Gain)/loss on other financial assets 7 & 8 (30,660) 8,999) (30,660) 8,999)exchange loss/(gain) on retranslation of loans and current account 87,938) (143,279) 21,040) (144,905)exchange gain on retranslation of loans 7 (133,753) -) -) -)Share of profit of associates 17 (13,956) (1,423) -) -)decrease in employee benefit asset 19 12,943) 6,164) 10,019) 5,670)
Working capital adjustments:decrease/(increase) in inventories 182,964) 220,326) (4,615) (19,864)decrease/(increase) in trade and other receivables 341,689) (553,004) (285,446) (277,058)(decrease)/increase in trade and other payables (603,368) 285,032) (148,841) 204,742)income tax (paid)/ refund 11 (26,826) (21,561) (6,670) 29,118)net cash flows generated from operating activities 1,375,848) 1,225,382) 1,064,327) 986,226)
investing activitiespurchase of property, plant and equipment (739,129) (1,584,369) (348,411) (37,101)proceeds from sale of property, plant and equipment 19,825) 27,854) 5,896) 13,139)proceeds from disposal of available-for-sale financial assets 20,791) -) -) -)dividend received 6,256) 2,979) 19,006) 12,692)interest received 7 32,216) 35,196) 2,230) 1,915)net cash flows used in investing activities (660,041) (1,518,340) (321,279) (9,355)
financing activitiesproceeds from borrowings 4,774,523) 2,971,324) 4,394,237) 2,580,594)repayment of term loans (5,221,367) (2,346,066) (5,081,191) (2,319,766)proceeds from preference shares 1,755,115) -) 1,755,115) -)repayment of finance lease liabilities (108,396) (117,489) (81,876) (66,115)advances to subsidiaries -) -) (124,485) (1,024,095)interest paid (1,045,511) (945,587) (773,762) (681,689)dividends paid to equity holders of the parent -) (161,424) -) (161,424)dividends paid to non-controlling interests (49,686) (41,920) -) -)net cash flows from/(used in) financing activities 104,678) (641,162) 88,038) (1,672,495)
net decrease in cash and cash equivalents 820,485) (934,120) 831,086) (695,624)cash and cash equivalents at october 1, (2,195,886) (1,247,119) (2,690,733) (1,995,109)net foreign exchange difference (84,144) (14,647) -) -)cash and cash equivalents at September 30, 22 (1,459,545) (2,195,886) (1,859,647) (2,690,733)
AR_2015_16_210x280_2part_Mise en page 1 1/22/16 4:19 PM Page 40

41n e w m a u r i t i u s h o t e l s l i m i t e d 41n e w m a u r i t i u s h o t e l s l i m i t e d
AR_2015_16_210x280_2part_Mise en page 1 1/22/16 4:19 PM Page 41
42 a n n u a l r e p o r t 2 0 1 542 a n n u a l r e p o r t 2 0 1 5
notes to the financial statementsfor the year ended september 30, 2015
secretary’s certificate
AR_2015_16_210x280_2part_Mise en page 1 1/22/16 4:19 PM Page 42
43n e w m a u r i t i u s h o t e l s l i m i t e d
1. CORPORATE INFORMATION
the financial statements of new mauritius hotels limited (the
‘company’) and consolidated with its subsidiaries (the ‘Group’)
for the year ended September 30, 2015 were authorised for issue
in accordance with a resolution of the directors on december 22,
2015. new mauritius hotels limited is a public limited company
incorporated in mauritius and is listed on the Stock exchange of
mauritius. its registered office is situated at Beachcomber house,
Botanical Garden Street, curepipe, mauritius.
the principal activities of the Group consist of hotels operations,
tour operating and the provision of airline and inland catering
and development of property for sale.
2. BASIS OF PREPARATION
the financial statements have been prepared on a historical cost
basis as modified by the revaluation of land and buildings,
investment properties, available-for-sale investments and other
financial instruments which are stated at their fair values
as disclosed in the accounting policies hereafter. the consolidated
financial statements are presented in mauritian rupees and
all values are rounded to the nearest thousand (rs’000),
except when otherwise indicated.
Statement of Compliance
the consolidated financial statements of new mauritius hotels
limited (the ‘company’) and its subsidiaries (the ‘Group’)
have been prepared in accordance with international financial
reporting Standards (ifrS) as issued by the international
accounting Standard Board (iaSB).
Basis of consolidation
the consolidated financial statements comprise the financial statements
of the Group and its subsidiaries as at September 30, 2015.
control is achieved when the Group is exposed, or has rights,
to variable returns from its involvement with the investee
and has the ability to affect those returns through its power over
the investee. Specifically, the Group controls an investee if
and only if the Group has:
• power over the investee (i.e. existing rights that give it the
current ability to direct the relevant activities of the investee);
• exposure, or rights, to variable returns from its involvement
with the investee; and
• the ability to use its power over the investee to affect
its returns.
When the Group has less than a majority of the voting or similar
rights of an investee, the Group considers all relevant facts
and circumstances in assessing whether it has power over
an investee, including:
• the contractual arrangement with the other vote holders
of the investee;
• rights arising from other contractual arrangements;
• the Group’s voting rights and potential voting rights.
the Group re-assesses whether or not it controls an investee if
facts and circumstances indicate that there are changes to one
or more of the three elements of control. consolidation of a
subsidiary begins when the Group obtains control over the
subsidiary and ceases when the Group loses control of the
subsidiary. assets, liabilities, income and expenses of a subsidiary
acquired or disposed of during the year are included in the
consolidated financial statements from the date the Group gains
control until the date the Group ceases to control the subsidiary.
profit or loss and each component of other comprehensive
income (oci) are attributed to the equity holders of the parent
of the Group and to the non-controlling interests, even if this
results in the non-controlling interests having a deficit balance.
When necessary, adjustments are made to the financial
statements of subsidiaries to bring their accounting policies into
line with the Group’s accounting policies. all intra-group assets
and liabilities, equity, income, expenses and cash flows relating
to transactions between members of the Group are eliminated
in full on consolidation.
a change in the ownership interest of a subsidiary, without a loss
of control, is accounted for as an equity transaction. if the Group
loses control over a subsidiary, it:
• derecognises the assets (including goodwill) and liabilities
of the subsidiary;
• derecognises the carrying amount of any non-controlling interests;
• derecognises the cumulative translation differences recorded
in equity;
• recognises the fair value of the consideration received;
• recognises the fair value of any investment retained;
• recognises any surplus or deficit in profit or loss;
• reclassifies the parent’s share of components previously
recognised in oci to profit or loss or retained earnings,
as appropriate, as would be required if the Group had directly
disposed of the related assets or liabilities.
2.1 CHANGES IN ACCOUNTING POLICIES
AND DISCLOSURES
New and amended standards and interpretations:
the accounting policies adopted are consistent with those
of the previous financial year, except for the following
amendments to ifrS effective as of october 01, 2014:
Amendments to IAS 19 Defined Benefit Plans: Employee
Contributions – effective 1 July 2014
iaS 19 requires an entity to consider contributions from employees
or third parties when accounting for defined benefit plans. Where
the contributions are linked to service, they should be attributed
to periods of service as a negative benefit. these amendments
clarify that, if the amount of the contributions is independent of
the number of years of service, an entity is permitted to recognise
such contributions as a reduction in the service cost in the period
in which the service is rendered, instead of allocating the
contributions to the periods of service. this amendment is
effective for annual periods beginning on or after 1 July 2014.
this amendment had no impact on the financial position of the
Group and the company’s financial statements.
43n e w m a u r i t i u s h o t e l s l i m i t e d
AR_2015_16_210x280_2part_Mise en page 1 1/22/16 4:19 PM Page 43

44 a n n u a l r e p o r t 2 0 1 5
notes to the financial statementsfor the year ended september 30, 2015
Annual Improvements 2010-2012 Cycle and Annual
Improvements 2011-2013 Cycle
the Group and the company have applied these improvements
for the first time in these financial statements. they include:
Effective for accounting period beginning on or after
annual improvements 2010-2012 cycle
- ifrS 2 Share-based payment 1 July 2014
- ifrS 3 Business combinations 1 July 2014
- ifrS 8 operating Segments 1 July 2014
- iaS 16 property, plant and equipment 1 July 2014
- iaS 38 intangible assets 1 July 2014
- iaS 24 related party disclosures 1 July 2014
annual improvements 2011-2013 cycle 1 July 2014
- ifrS 3 Business combinations 1 July 2014
- ifrS 13 fair Value measurement 1 July 2014
- iaS 40 investment property 1 July 2014
Where the adoption of the standard or interpretation
or improvement is deemed to have an impact on the financial
statements or performance of the Group and the company, its
impact is described below:
IFRS 3 Business Combinations
the amendment is applied prospectively and clarifies that all
contingent consideration arrangements classified as liabilities
(or assets) arising from a business combination should be
subsequently measured at fair value through profit or loss
whether or not they fall within the scope of iaS 39. this is
consistent with the Group’s and the company’s current
accounting policy and, thus, this amendment did not impact
the Group’s accounting policy.
IFRS 8 Operating Segments
the amendments are applied retrospectively and clarify that:
• an entity must disclose the judgements made by management
in applying the aggregation criteria in paragraph 12 of ifrS 8,
including a brief description of operating segments that have
been aggregated and the economic characteristics (e.g., sales
and gross margins) used to assess whether the segments are
‘similar’; and
• the reconciliation of segment assets to total assets is only
required to be disclosed if the reconciliation is reported
to the chief operating decision maker, similar to the required
disclosure for segment liabilities.
the necessary disclosures have been made by the Group..
IAS 16 Property, Plant and Equipment and IAS 38
Intangible Assets
the amendment is applied retrospectively and clarifies in iaS 16
and iaS 38 that the asset may be revalued by reference
to observable data by either adjusting the gross carrying amount
of the asset to market value or by determining the market value of
the carrying value and adjusting the gross carrying amount
proportionately so that the resulting carrying amount equals the
market value. in addition, the accumulated depreciation or
amortisation is the difference between the gross and carrying
amounts of the asset.
this amendment did not have any impact to the revaluation
adjustments recorded by the Group and the company during
the current period.
IAS 24 Related Party Disclosures
the amendment is applied retrospectively and clarifies that a
management entity (an entity that provides key management
personnel services) is a related party subject to the related party
disclosures. in addition, an entity that uses a management
entity is required to disclose the expenses incurred for
management services.
this amendment is not relevant for the Group and the company.
Annual Improvements 2011-2013 Cycle
these improvements are effective from 1 July 2014 and the
Group and the company have applied these amendments:
IFRS 3 Business Combinations
the amendment is applied prospectively and clarifies for
the scope exceptions within ifrS 3 that:
• Joint arrangements, not just joint ventures, are outside
the scope of ifrS 3; and
• this scope exception applies only to the accounting in the
financial statements of the joint arrangement itself.
the company has not entered into a joint arrangement, and thus
this amendment is not relevant for the Group and its subsidiaries.
IFRS 13 Fair Value Measurement
the amendment is applied prospectively and clarifies that the
portfolio exception in ifrS 13 can be applied not only to financial
assets and financial liabilities, but also to other contracts within
the scope of iaS 39. the Group and the company do not apply
the portfolio exception in ifrS 13.
IAS 40 Investment Property
the description of ancillary services in iaS 40 differentiates
between investment property and owner-occupied property (i.e.,
property, plant and equipment). the amendment is applied
prospectively and clarifies that ifrS 3, and not the description of
ancillary services in iaS 40, is used to determine if the transaction
is the purchase of an asset or a business combination. in previous
periods, the Group has relied on ifrS 3, not iaS 40, in determining
whether an acquisition is of an asset or is a business acquisition.
thus, this amendment did not impact the accounting policy of
the Group and the company.
2.2 STANDARDS AND INTERPRETATIONS
ISSUED BUT NOT YET EFFECTIVE
the standards and interpretations that are issued, but not yet
effective, up to the date of issuance of the Group’s financial
statements are disclosed below. the Group intends to adopt
these standards, if applicable, when they become effective.
44 a n n u a l r e p o r t 2 0 1 5
AR_2015_16_210x280_2part_Mise en page 1 1/22/16 4:19 PM Page 44

45n e w m a u r i t i u s h o t e l s l i m i t e d
Effective for accounting period beginning on or after
- ifrS 9 financial instruments 1 January 2018
- Sale or contribution of assets between
an investor and its associate or joint venture
(amendments to ifrS 10 and iaS 28) 1 January 2016
- investment entities: applying the
consolidation exception (amendments
to ifrS 10, ifrS 12 and iaS 28) 1 January 2016
- ifrS 14 regulatory deferral accounts 1 January 2016
- ifrS 15 revenue from contracts
with customers 1 January 2018
- accounting for acquisitions of interests
in Joint operations (amendments
to ifrS 11) 1 January 2016
- clarification of acceptable methods
of depreciation and amortisation
(amendments to iaS 16 and iaS 38) 1 January 2016
- agriculture: Bearer plants
(amendments to iaS 16 and iaS 41) 1 January 2016
- amendments to iaS 27: equity method
in Separate financial Statement 1 January 2016
- annual improvements 2012 – 2014 cycle 1 July 2016
- disclosure initiative – amendments to iaS 1 1 January 2016
IFRS 9 Financial Instruments – Classification and
measurement of financial assets, Accounting for
financial liabilities and derecognition – 1 January 2018
in July 2014, the iaSB issued the final version of ifrS 9 financial
instruments that replaces iaS 39 financial instruments:
recognition and measurement and all previous versions of ifrS 9.
ifrS 9 brings together all three aspects of the accounting
for financial instruments project: classification and measurement,
impairment and hedge accounting. ifrS 9 is effective for annual
periods beginning on or after 1 January 2018, with early
application permitted. except for hedge accounting, retrospective
application is required but providing comparative information is
not compulsory. for hedge accounting, the requirements are
generally applied prospectively, with some limited exceptions.
ifrS 9 introduces new requirements for classifying and measuringfinancial assets, as follows:
Classification and measurement of financial assets
all financial assets are measured at fair value on initial
recognition, adjusted for transaction costs if the instrument is not
accounted for at fair value through profit or loss (fVtpl). debt
instruments are subsequently measured at fVtpl, amortised cost or
fair value through other comprehensive income (fVoci), on the basis
of their contractual cash flows and the business model under which
the debt instruments are held. there is a fair value option (fVo) that
allows financial assets on initial recognition to be designated as
fVtpl if that eliminates or significantly reduces an accounting
mismatch. equity instruments are generally measured at fVtpl.
however, entities have an irrevocable option on an instrument-by-
instrument basis to present changes in the fair value of non-trading
instruments in other comprehensive income (oci) (without
subsequent reclassification to profit or loss).
Classification and measurement of financial liabilities
for financial liabilities designated as fVtpl using the fVo, the
amount of change in the fair value of such financial liabilities that
is attributable to changes in credit risk must be presented in oci.
the remainder of the change in fair value is presented
in profit or loss, unless presentation of the fair value change in re-
spect of the liability’s credit risk in oci would create or enlarge an
accounting mismatch in profit or loss. all other iaS 39
financial instruments: recognition and measurement classification
and measurement requirements for financial liabilities have been
carried forward into ifrS 9, including the embedded derivative
separation rules and the criteria for using the fVo.
Impairment
the impairment requirements are based on an expected credit loss
(ecl) model that replaces the iaS 39 incurred loss model. the ecl
model applies to: debt instruments accounted for at amortised cost
or at fVoci; most loan commitments; financial guarantee contracts;
contract assets under ifrS 15; and lease receivables under iaS 17
leases. entities are generally required to recognise either
12-months’ or lifetime ecl, depending on whether there has been
a significant increase in credit risk since initial recognition (or when
the commitment or guarantee was entered into). for some trade
receivables, the simplified approach may be applied whereby the
lifetime expected credit losses are always recognised.
Hedge accounting
hedge effectiveness testing is prospective, without the 80% to
125% bright line test in iaS 39, and, depending on the hedge
complexity, can be qualitative. a risk component of a financial or
non-financial instrument may be designated as the hedged item
if the risk component is separately identifiable and reliably
measureable. the time value of an option, any forward element
of a forward contract and any foreign currency basis spread, can
be excluded from the designation as the hedging instrument and
accounted for as costs of hedging. more designations of groups
of items as the hedged item are possible, including layer
designations and some net positions.
the application of ifrS 9 may change the measurement and
presentation of many financial instruments, depending on their
contractual cash flows and business model under which they are
held. the impairment requirements will generally result in earlier
recognition of credit losses. the new hedging model may lead to
more economic hedging strategies meeting the requirements for
hedge accounting.
the impact of the new standard is currently being assessed.
Sale or contribution of assets between an investor and
its associate or joint venture (Amendments to IFRS 10
and IAS 28) - effective 1 January 2016
this amendment to ifrS 10 consolidated financial Statements
and iaS 28 investments in associates and Joint Ventures (2011)
was made to clarify the treatment of the sale or contribution
of assets from an investor to its associate or joint venture,
as follows:
45n e w m a u r i t i u s h o t e l s l i m i t e d
AR_2015_16_210x280_2part_Mise en page 1 1/22/16 4:19 PM Page 45

46 a n n u a l r e p o r t 2 0 1 5
notes to the financial statementsfor the year ended september 30, 2015
• it requires full recognition in the investor’s financial statements
of gains and losses arising on the sale or contribution of assets
that constitute a business (as defined in ifrS 3 Business
combinations); and
• it requires the partial recognition of gains and losses where
the assets do not constitute a business, i.e. a gain or loss
is recognised only to the extent of the unrelated investors’
interests in that associate or joint venture.
these requirements apply regardless of the legal form of
the transaction, e.g. whether the sale or contribution of assets
occurs by an investor transferring shares in a subsidiary that
holds the assets (resulting in loss of control of the subsidiary), or
by the direct sale of the assets themselves.
the directors will assess the impact of the amendments when
they become effective.
IFRS 14 Regulatory Deferral Accounts – effective
1 January 2016
ifrS 14 permits an entity which is a first-time adopter of international
financial reporting Standards to continue to account, with some
limited changes, for ‘regulatory deferral account balances’ in
accordance with its previous Gaap, both on initial adoption of
ifrS and in subsequent financial statements.
this new standard will not have an impact, as the Group and
the company are not first time adopters of ifrS.
IFRS 15 Revenue from Contracts with Customers –
effective 1 January 2018
ifrS 15 provides a single, principles based five-step model
to be applied to all contracts with customers.
the five steps in the model are as follows:
• identify the contract with the customer;
• identify the performance obligations in the contract;
• determine the transaction price;
• allocate the transaction price to the performance obligations
in the contracts; and
• recognise revenue when (or as) the entity satisfies
a performance obligation.
Guidance is provided on topics such as the point in which
revenue is recognised, accounting for variable consideration,
costs of fulfilling and obtaining a contract and various related
matters. new disclosures about revenue are also introduced.
the Group is still assessing the impact of this new standard, but it
is not expected to have a significant effect on financial performance.
there may be an impact on the level of disclosure provided.
Accounting for Acquisitions of Interests in Joint
Operations (Amendments to IFRS 11) – effective
1 January 2016
amends ifrS 11 Joint arrangements to require an acquirer of an
interest in a joint operation in which the activity constitutes a
business (as defined in ifrS 3 Business combinations) to:
• apply all of the business combinations accounting principles
in ifrS 3 and other ifrSs, except for those principles
that conflict with the guidance in ifrS 11
• disclose the information required by ifrS 3 and other ifrSs
for business combinations.
the amendments apply both to the initial acquisition of an
interest in joint operation, and the acquisition of an additional
interest in a joint operation (in the latter case, previously held
interests are not remeasured).
the amendment will not have an impact since the Group does
not have any interests in joint operations.
Clarification of Acceptable Methods of Depreciation
and Amortisation (Amendments to IAS 16 and IAS 38) –
effective January 1, 2016
amends iaS 16 property, plant and equipment and iaS 38
intangible assets to:
• clarify that a depreciation method that is based on revenue
that is generated by an activity that includes the use of an asset
is not appropriate for property, plant and equipment;
• introduce a rebuttable presumption that an amortisation method
that is based on the revenue generated by an activity
that includes the use of an intangible asset is inappropriate,
which can only be overcome in limited circumstances where the
intangible asset is expressed as a measure of revenue, or when
it can be demonstrated that revenue and the consumption
of the economic benefits of the intangible asset are highly
correlated; and
• add guidance that expected future reductions in the selling
price of an item that was produced using an asset could
indicate the expectation of technological or commercial
obsolescence of the asset, which, in turn, might reflect a reduction
of the future economic benefits embodied in the asset.
the amendment will not have an impact since the Group does
not use a depreciation method based on revenue for its plant
and equipment and intangible assets.
Agriculture: Bearer Plants (Amendments to IAS 16
and IAS 41) – effective January 1, 2016
amends iaS 16 – property, plant and equipment and iaS 41 –
agriculture to:
• include ‘bearer plants’ within the scope of iaS 16 rather
than iaS 41, allowing such assets to be accounted for a
property, plant and equipment and measured after initial
recognition on a cost or revaluation basis in accordance
with iaS 16;
• introduce a definition of ‘bearer plants’ as a living plant that
is used in the production or supply of agricultural produce,
is expected to bear produce for more than one period and
has a remote likelihood of being sold as agricultural produce,
except for incidental scrap sales; and
46 a n n u a l r e p o r t 2 0 1 5
AR_2015_16_210x280_2part_Mise en page 1 1/22/16 4:19 PM Page 46

47n e w m a u r i t i u s h o t e l s l i m i t e d 47n e w m a u r i t i u s h o t e l s l i m i t e d
AR_2015_16_210x280_2part_Mise en page 1 1/22/16 4:19 PM Page 47

48 a n n u a l r e p o r t 2 0 1 5
notes to the financial statementsfor the year ended september 30, 2015
• clarify that produce growing on bearer plants remains within
the scope of iaS 41.
the amendment will not have an impact as the Group does not
have ‘bearer plants’.
Amendments to IAS 27: Equity Method in Separate
Financial Statements – effective January 1, 2016
the amendments will allow entities to use the equity method to
account for investments in subsidiaries, joint ventures and
associates in their separate financial statements. entities already
applying ifrS and electing to change to the equity method in its
separate financial statements will have to apply that change
retrospectively.
for first-time adopters of ifrS electing to use the equity method
in its separate financial statements, they will be required to apply
this method from the date of transition to ifrS. the amendments
are effective for annual periods beginning on or after January 1,
2016, with early adoption permitted.
the amendment is not expected to have an impact, as the
company will continue to recognise investments in subsidiaries
and associates at cost in the separate financial statements.
Annual improvements 2012 – 2014 Cycle – effective
July 1, 2016
the annual improvements 2012-2014 cycle make amendments
to the following standards:
• ifrS 5 - adds specific guidance in ifrS 5 for cases in which an entity
reclassifies an asset from held for sale to held for distribution or vice
versa and cases in which held-for-distribution accounting
is discontinued;
• ifrS 7 – additional guidance given to clarify whether a servicing
contract is continuing involvement in a transferred assets,
and clarification made on offsetting disclosures in condensed
interim financial statements;
• iaS 19 – clarifies that the high quality corporate bonds used
in estimating the discount rate for post-employment benefits
should be denominated in the same currency as the benefits
to be paid; and
• iaS 34 – clarifies the meaning of ‘elsewhere in the interim
report’ and require a cross reference.
the directors will assess the impact of the amendments when
they become effective.
Disclosure Initiative (Amendments to IAS 1) – effective
January 1, 2016
amends iaS 1 presentation of financial Statements
to address perceived impediments to preparers exercising their
judgement in presenting their financial reports by making the
following changes:
• clarification that information should not be obscured by
aggregating or by providing immaterial information, materiality
considerations apply to the all parts of the financial statements,
and even when a standard requires a specific disclosure,
materiality considerations do apply;
• clarification that the list of line items to be presented in these
statements can be disaggregated and aggregated as relevant
and additional guidance on subtotals in these statements and
clarification that an entity’s share of oci of equity-accounted
associates and joint ventures should be presented in aggregate
as single line items based on whether or not it will
subsequently be reclassified to profit or loss; and
• additional examples of possible ways of ordering the notes
to clarify that understandability and comparability should
be considered when determining the order of the notes
and to demonstrate that the notes need not be presented
in the order so far listed in paragraph 114 of iaS 1.
no early adoption of these standards and interpretations
is intended by the Board of directors.
Investment Entities: Applying the Consolidation
Exception (Amendments to IFRS 10, IFRS 12 and IAS 28) –
effective 1 January 2016
this amendment to ifrS 10 consolidated financial Statements,
ifrS 12 disclosure of interests in other entities and iaS 28
investments in associates and Joint Ventures (2011) was made
to address issues that have arisen in the context of applying
the consolidation exception for investment entities by clarifying
the following points:
• the exemption from preparing consolidated financial statements
for an intermediate parent entity is available to a parent entity
that is a subsidiary of an investment entity, even if the investment
entity measures all of its subsidiaries at fair value.
• a subsidiary that provides services related to the parent’s
investment activities should not be consolidated if the subsidiary
itself is an investment entity.
• When applying the equity method to an associate or a joint
venture, a non-investment entity investor in an investment
entity may retain the fair value measurement applied by the
associate or joint venture to its interests in subsidiaries.
• an investment entity measuring all of its subsidiaries at fair
value provides the disclosures relating to investment entities
required by ifrS 12.
the amendment will not have an impact on the Group and
the company as they are not considered as investment entities.
2.3 SIGNIFICANT ACCOUNTING
JUDGEMENTS AND ESTIMATES
the preparation of the Group’s financial statements requires
management to make judgments, estimates and assumptions
that affect the reported amounts of revenues, expenses, assets
and liabilities, and the disclosure of contingent liabilities, at the
end of the reporting period. uncertainty about these assumptions
and estimates could result in outcomes that require a material
adjustment to the carrying amount of the assets or liabilities
affected in future periods.
Judgements
in the process of applying the Group’s accounting policies,
management has made the following judgments, which have
the most significant effect on the amounts recognised in the
consolidated financial statements:
48 a n n u a l r e p o r t 2 0 1 5
AR_2015_16_210x280_2part_Mise en page 1 1/22/16 4:19 PM Page 48

49n e w m a u r i t i u s h o t e l s l i m i t e d
Functional currency
the choice of the functional currency of the Group and each
of its foreign subsidiaries has been made based on factors such
as the primary economic environment in which each entity
operates, the currency that mainly influences sales prices
for goods and services, costs of providing goods and services
and labour costs.
Going concern
the Group’s management has made an assessment of the
Group’s ability to continue as a going concern. furthermore,
management is not aware of any material uncertainties that may
cast significant doubt upon the Group’s ability to continue as a
going concern and is satisfied that the Group has the resources
to continue in business for the foreseeable future.
at September 30, 2015, the company had net current liabilities
of rs 1,762,760 (2014: rs 4,899,408). on the other hand, there
is no shortfall in working capital at Group level as at September
30, 2015 as compared to a net current liability position
of rs 3,157,975 in the prior year.
the directors consider that there is no going concern issue at
company level given the availability of undrawn bank facilities
(refer to note 22) and certain elements such as guest deposits
recorded in current liabilities will not result in cash outflows in the
next year. the improvement in the working capital and reduction
in cash flow constraints for the Group and the company was due
to a financial restructuring scheme in three parts drawn up in
the current financial year. the first two parts consisted of issuance
of preference shares and corporate bonds and the rescheduling
of several loan repayments were re scheduled. the third part
which consists in taking strategic initiatives is in progress.
therefore, the financial statements continue to be prepared on
the going concern basis.
Estimates and assumptions
the key assumptions concerning the future and other key sources
of estimation uncertainty at the reporting date, that have
a significant risk of causing a material adjustment to the carrying
amounts of assets and liabilities within the next financial year
are discussed below. the Group based its assumptions
and estimates on parameters available when the consolidated
financial statements were prepared. existing circumstances
and assumptions about future developments, however, may
change due to market changes or circumstances arising beyond
the control of the Group. Such changes are reflected in the
assumptions when they occur.
Revaluation of freehold land, hotel buildings
and investment properties
the Group measures freehold land and hotel buildings at
revalued amounts with changes in fair value being recognised
in equity. in addition, it carries its investment properties at fair
value, with changes in fair value being recognised in profit
or loss. the Group engaged an independent valuation specialist
to determine fair value based on prevailing market data.
further details in respect of the freehold land and buildings
and investment properties are contained in notes 13 and
14 respectively.
Fair value measurements of financial instruments
When the fair values of financial instruments recorded on the
statement of financial position cannot be derived from active
markets, they are determined using a variety of valuation
techniques. the inputs to those models are derived from
observable market data where possible, but where observable
market data are not available, a degree of judgment is required
to establish fair values. the judgements include consideration of
inputs such as liquidity risk, credit risk and volatility. further
details in respect of the fair valuation of financial instruments
are included in note 33 of the financial statements.
Impairment of non-financial assets
an impairment exists when the carrying value of an asset or cash
generating unit exceeds its recoverable amount, which is the
higher of its fair value less costs to sell and its value in use. the
fair value less costs to sell calculation is based on available data
from binding sales transactions, conducted at arm’s length, for
similar assets or observable market prices less incremental costs
for disposing of the asset. the value in use calculation is based
on a discounted cash flow model. the cash flows are derived
from the budget for the next five years and do not include
restructuring activities that the Group is not yet committed to or
significant future investments that will enhance the asset’s
performance of the cGu being tested. the recoverable amount
is most sensitive to the discount rate used for the discounted
cash flow model as well as the expected future cash-inflows
and the growth rate used for extrapolation purposes. the key
assumptions used to determine the recoverable amount for the
different cGus are disclosed and further explained in note 15.
Employee benefit obligations
the cost of the defined benefit pension plan and other
post-employment medical benefits and the present value of the
pension obligation are determined using actuarial valuations.
an actuarial valuation involves making various assumptions that
may differ from actual developments in the future. these include
the determination of the discount rate, future salary increases,
mortality rates and future pension increases. due to the
complexity of the valuation and its long-term nature, a defined
benefit obligation is highly sensitive to changes in these
assumptions. all assumptions are reviewed at each reporting
date. further detail is provided in note 19.
Property, plant and equipment: Estimations of the useful
lives and residual value of the assets
the depreciation charge calculation requires an estimation of the
economic useful life of the property, plant and equipment of the
Group analysed by component as well as their residual values.
in estimating residual values, the Group has assessed the value
of the buildings at today’s rates assuming the buildings are in
49n e w m a u r i t i u s h o t e l s l i m i t e d
AR_2015_16_210x280_2part_Mise en page 1 1/22/16 4:19 PM Page 49
50 a n n u a l r e p o r t 2 0 1 5
notes to the financial statementsfor the year ended september 30, 2015
the condition in which they are expected to be at the end of their
useful lives.
other items of property, plant and equipment are depreciated
using the norms applicable in the industry. the carrying amount
of property, plant and equipment is disclosed in note 13.
Taxes
uncertainties exist with respect to the interpretation of
complex tax regulations, changes in tax laws, and the amount
and timing of future taxable income. Given the wide range of
international business relationships and the long-term nature
and complexity of existing contractual agreements, differences
arising between the actual results and the assumptions made,
or future changes to such assumptions, could necessitate
future adjustments to tax income and expense already
recorded. the Group establishes provisions, based on
reasonable estimates, for possible consequences of audits
by the tax authorities of the respective counties in which it
operates. the amount of such provisions is based on various
factors, such as experience of previous tax audits and differing
interpretations of tax regulations by the taxable entity and the
responsible tax authority.
Such differences of interpretation may arise on a wide variety of
issues depending on the conditions prevailing in the respective
domicile of the Group companies. deferred tax assets are
recognised for all unused tax losses to the extent that it is
probable that taxable profits will be available against which the
losses can be utilised. Significant management judgment
is required to determine the amount of deferred tax assets
that can be recognised, based upon the likely timing and
the level of future taxable profits together with future tax
planning strategies.
3. SUMMARY OF SIGNIFICANT
ACCOUNTING POLICIES
Business combinations and goodwill
Business combinations are accounted for using the acquisition
method. the cost of an acquisition is measured as the aggregate
of the consideration transferred, measured at acquisition date
fair value and the amount of any non-controlling interest in the
acquiree. for each business combination, the Group elects to
measure the non-controlling interest in the acquiree either at fair
value or at the proportionate share of the acquiree’s identifiable
net assets. acquisition-related costs are expensed as incurred.
When the Group acquires a business, it assesses the financial
assets and liabilities assumed for appropriate classification and
designation in accordance with the contractual terms, economic
circumstances and pertinent conditions as at the acquisition date.
this includes the separation of embedded derivatives in host
contracts by the acquiree.
if the business combination is achieved in stages, the previously
held equity interest is remeasured to fair value as its acquisition
date fair value and any resulting gain or loss is recognised
in profit or loss.
any contingent consideration to be transferred by the acquirer
will be recognised at fair value at the acquisition date. Subsequent
changes to the fair value of the contingent consideration which
is deemed to be an asset or a liability will be recognised in
accordance with iaS 39 either in profit or loss or as change
to other comprehensive income.
if the contingent consideration is classified as equity, it shall
not be remeasured until it is finally settled within equity.
Foreign currency translation
the Group’s financial statements are presented in mauritian
rupees, which is also the parent company’s functional currency.
each entity in the Group determines its own functional currency
and items included in the financial statements of each entity are
measured using that functional currency. the Group has elected
to recycle the gain or loss that arises from the direct method of
consolidation, which is the method the Group uses to complete
its consolidation.
Transactions and balances
transactions in foreign currencies are initially recorded
at their respective functional currency spot rates at the date the
transaction first qualifies for recognition.
monetary assets and liabilities denominated in foreign currencies
are retranslated at the functional currency spot rate of exchange
ruling at the reporting date.
differences arising on settlement or translation of monetary items
are recognised in profit or loss with the exception of monetary
items that are designated as part of the hedge of the Group’s
net investment of a foreign operation. these are recognised in
other comprehensive income until the net investment is disposed
of, at which time, the cumulative amount is reclassified to profit
or loss. tax charges and credits attributable to exchange
differences on those monetary items are also recorded in other
comprehensive income.
non-monetary items that are measured in terms of historical
cost in a foreign currency are translated using the exchange
rates as at the dates of the initial transactions. non-monetary
items measured at fair value in a foreign currency are translated
using the exchange rates at the date when the fair value is
determined. the gain or loss arising on translation of
non-monetary items measured at fair value is treated in line with
50 a n n u a l r e p o r t 2 0 1 5
AR_2015_16_210x280_2part_Mise en page 1 1/22/16 4:19 PM Page 50
51n e w m a u r i t i u s h o t e l s l i m i t e d
the recognition of gain or loss on change in fair value of the item
(i.e., translation differences on items whose fair value gain
or loss is recognised in other comprehensive income or profit
or loss are also recognised in other comprehensive income
or profit or loss, respectively).
Group companies
the assets and liabilities of foreign operations are translated into
mauritian rupees at the rate of exchange prevailing at the reporting
date and their profit or loss items are translated at exchange rates
prevailing at the date of the transactions. the exchange differences
arising on the translation are recognised in other comprehensive
income. on disposal of a foreign operation, the component of other
comprehensive income relating to that particular foreign operation
is recognised in profit or loss.
Property, plant and equipment
plant and equipment is stated at cost, net of accumulated
depreciation and accumulated impairment losses, if any. Such
cost includes the cost of replacing part of the plant and
equipment and borrowings costs for long-term construction
projects, if the recognition criteria are met. all other repair and
maintenance costs are recognised in profit or loss as incurred.
land and buildings are measured at fair value less accumulated
depreciation on buildings and impairment losses recognised after
the date of the revaluation. following initial recognition at cost,
freehold land and buildings of hotels are reviewed on an annual
basis effective as from this year; in prior years, revaluations were
performed each two years.
any revaluation surplus is recognised in other comprehensive
income and accumulated in the revaluation reserve included in
the equity section of the statement of financial position, except
to the extent that it reverses a revaluation decrease of the same
asset previously recognised in profit or loss, in which case the
increase in recognised in profit or loss. a revaluation deficit is
recognised in profit or loss, except to the extent that it offsets
an existing surplus on the same asset recognised in the asset
revaluation reserve.
the carrying values of property, plant and equipment are
reviewed for impairment at each reporting date or when events
or changes in circumstances indicate that the carrying value may
not be recoverable.
an annual transfer from the revaluation reserve to retained
earnings is made for the difference between depreciation based
on the revalued carrying amount of the assets and depreciation
based on the assets original cost. additionally, accumulated
depreciation as at the revaluation date is eliminated against the
gross carrying amount of the asset and the net amount is
restated to the revalued amount of the asset. upon disposal,
any revaluation reserve relating to the particular asset being sold
is transferred to retained earnings.
Depreciation is calculated on the straight-line basis over
the useful life as follows:
office buildings 50 years
hotel buildings 35 years
plant and equipment Between 6 to 8 years
furniture, fittings, office equipment
and electrical appliances Between 3 to 10 years
computers and electronic equipment Between 3 to 10 years
motor vehicles 5 years
other fixed assets include plant and equipment, furniture and
fittings, office equipment and electrical appliances and computer
equipment and software.
Work in progress pertains mainly to costs incurred in the
construction of assets. Such costs include costs of construction
and borrowing costs.
an item of property, plant and equipment is derecognised upon
disposal or when no future economic benefits are expected from
its use or disposal. any gain or loss arising on derecognition
of the asset (calculated as the difference between the net
disposal proceeds and the carrying amount of the asset) is
included in profit or loss in the year the asset is derecognised.
the residual values, useful lives and methods of depreciation
of property, plant and equipment are reviewed at each financial
year end, and adjusted prospectively if appropriate.
Investment properties
investment properties are measured initially at cost, including
transaction costs. the carrying amount includes the cost of
replacing part of an existing investment property at the time that
cost is incurred if the recognition criteria are met; and excludes
the costs of day-to-day servicing of an investment property.
Subsequent to initial recognition, investment properties are
stated at fair value, which reflects market conditions at the
reporting date. Gains and losses arising from changes in the fair
values of investment properties are included in profit or loss in
the year in which they arise. fair values are determined based
on an annual evaluation performed by an accredited external,
independent valuer, applying a valuation model recommended
by the international Valuation Standards committee.
investment properties are derecognised when either they have
been disposed of or when the investment property is permanently
withdrawn from use and no future economic benefit is expected
from its disposal. the difference between the net disposal
proceeds and the carrying amount of the asset is recognised
in profit or loss in the period of derecognition.
transfers are made to investment property only when there is a
change in use, evidenced by the end of owner occupation,
commencement of an operating lease to another party or
completion of construction or development. transfers are made
from investment property when, and only when, there is a change
in use, evidenced by commencement of owner occupation or
commencement of development with a view to sale.
51n e w m a u r i t i u s h o t e l s l i m i t e d
AR_2015_16_210x280_2part_Mise en page 1 1/22/16 4:19 PM Page 51

52 a n n u a l r e p o r t 2 0 1 5
notes to the financial statementsfor the year ended september 30, 2015
for a transfer from investment property to owner occupied
property, the deemed cost for subsequent accounting is its fair
value at the date of change in use. if owner occupied property
becomes an investment property, the Group accounts for such
property in accordance with the policy stated under property,
plant and equipment up to the date of change in use.
Investments in subsidiaries
Subsidiaries are those entities controlled by the company.
control is achieved when the company is exposed to, or has right
to, variable returns from its investment with the entity and has the
ability to affect those returns through its power over the entity.
Financial statements of the Company
investments in subsidiary companies are carried at cost which
is the aggregate of the fair values, at the date of exchange,
of assets given, liabilities incurred or assumed, and equity
instruments issued by the acquirer, in exchange for control of the
acquiree, plus any costs directly attributable to the business
combination. the carrying amount is reduced to recognise
any impairment in the value of individual investments.
the impairment loss is taken to profit or loss.
Investments in associates
an associate is an entity over which the Group has significant
influence. Significant influence is the power to participate in the
financial and operating policy decisions of the investors but does
not have control or joint control over its policies.
Financial statements of the Company
investments in associates are carried at cost. the carrying amount
is reduced to recognise any impairment in the value of individual
investments. the impairment loss is taken to profit or loss.
Consolidated financial statements
the Group’s investments in its associates are accounted using
the equity method.
under the equity method, the investment in the associate
is initially recognised at cost. the carrying amount of the
investment is adjusted to recognise changes in the Group’s share
of net assets of the associate since the acquisition date. Goodwill
relating to the associate is included in the carrying amount of
the investment and is neither amortised nor individually tested
for impairment.
the profit or loss reflects the Group’s share of the results of
operations of the associate. When there has been a change
recognised directly in the equity of the associate, the Group
recognises its share of any changes, when applicable, in the
statement of changes in equity. unrealised gains and losses
resulting from transactions between the Group and the associate
are eliminated to the extent of the interest in the associate.
the Group’s share of profit or loss of an associate is shown on
the face of profit or loss and represents profit or loss after tax
and non-controlling interests in the subsidiaries of the associate.
the financial statements of the associate are prepared for
the same reporting period as the Group. When necessary,
adjustments are made to bring the accounting policies in line
with those of the Group.
after application of the equity method, the Group determines
whether it is necessary to recognise an impairment loss on
its investment in its associate. at each reporting date, the Group
determines whether there is objective evidence that the
investment in the associate is impaired. if there is such evidence,
the Group calculates the amount of impairment as the difference
between the recoverable amount of the associate and its carrying
value; it then recognises the loss as ‘Share of losses of an
associate’ in profit or loss.
upon loss of significant influence over the associate, the Group
measures and recognises any retained investment at its fair value.
any difference between the carrying amount of the associate
upon loss of significant influence and the fair value of the
retained investment and proceeds from disposal is recognised
in profit or loss.
Intangible assets
Goodwill
Goodwill is initially measured at cost being the excess of the cost
of the business combination over the Group’s share in the net
fair value of the identifiable assets, liabilities and contingent
liabilities. if the cost of acquisition is less than the fair value of
the net assets of the subsidiary company acquired, the difference
is recognised directly in profit or loss.
after initial recognition, goodwill is measured at cost less any
accumulated impairment losses. for the purpose of impairment
testing, goodwill acquired in a business combination is,
from the acquisition date, allocated to each of the Group’s
cash-generating units that are expected to benefit from the
synergies of the combination, irrespective of whether other assets
or liabilities of the acquiree are assigned to those units.
Where goodwill forms part of a cash-generating unit and part
of the operation within that unit is disposed of, the goodwill
associated with the operation disposed of is included in the
carrying amount of the operation when determining the gain or
loss on disposal of the operation. Goodwill disposed of in this
circumstance is measured based on the relative values of the
operation disposed of and the portion of the cash-generating
unit retained.
When a subsidiary company is disposed of, the difference
between the disposal proceeds and the share of net assets
disposed of, as adjusted for translation differences and net
amount of goodwill is recognised in profit or loss.
Other intangible assets
intangible assets acquired separately are measured on initial
recognition at cost. the cost of intangible assets acquired in a
business combination is the fair value as at the date of
acquisition. following initial recognition, intangible assets are
carried at cost less any accumulated amortisation and any
accumulated impairment losses. internally generated intangible
assets, excluding capitalised development costs, are not
52 a n n u a l r e p o r t 2 0 1 5
AR_2015_16_210x280_2part_Mise en page 1 1/22/16 4:19 PM Page 52
53n e w m a u r i t i u s h o t e l s l i m i t e d
capitalised and expenditure is charged against profits in the year
in which the expenditure is incurred.
the useful lives of intangible assets are assessed to be either
finite or indefinite.
intangible assets with finite lives are amortised over the useful
economic life and assessed for impairment whenever there
is an indication that the intangible asset may be impaired.
the amortisation period and the amortisation method for an
intangible asset with a finite useful life are reviewed at least
at each financial year-end. changes in the expected useful life
or the expected pattern of consumption of future economic
benefits embodied in the asset is accounted for by changing
the amortisation period or method, as appropriate, and treated
as changes in accounting estimates. the amortisation expense
on intangible assets with finite lives is recognised in profit or
loss in the expense category consistent with the function of
the intangible asset.
intangible assets with indefinite useful lives are not amortised
but are tested for impairment annually either individually
or at the cash-generating unit level. the assessment of indefinite
life is reviewed annually to determine whether the indefinite life
continues to be supportable. if not, the change in the useful
life from indefinite to finite is made on a prospective basis.
Gains or losses arising from derecognition of an intangible asset
are measured as the difference between the net disposal
proceeds and the carrying amount of the asset are recognised
in profit or loss when the asset is derecognised.
Leasehold rights
expenditure incurred to acquire leasehold rights is capitalised
and amortised on a straight line basis over the period of the
respective lease.
Patents
the trademark, White Sand tours, was acquired in october 2010
by the subsidiary White palm limited. the trademark with indefinite
useful life has been allocated to the cash generating unit,
White palm limited, for the purpose of impairment testing.
Impairment of non-financial assets
the Group assesses, at each reporting date, whether there is
an indication that an asset may be impaired. if any such indication
exists, or when annual impairment testing for an asset
is required, the Group estimates the asset’s recoverable amount.
an asset’s recoverable amount is the higher of an asset’s or
cash-generating unit’s fair value less costs to sell and its value
in use and is determined for an individual asset, unless the asset
does not generate cash inflows that are largely independent
of those from other assets or Groups of assets.
Where the carrying amount of an asset exceeds its recoverable
amount, the asset is considered impaired and is written down to
its recoverable amount. in assessing value in use, the estimated
future cash flows are discounted to their present value using
a pre-tax discount rate that reflects current market assessments
of the time value of money and the risks specific to the asset.
in determining fair value less costs to sell, an appropriate
valuation model is used. these calculations are corroborated
by valuation multiples, quoted share prices or other available fair
value indicators.
impairment losses of continuing operations are recognised
in profit or loss in those expense categories consistent with
the function of the impaired asset, except for property previously
revalued where the revaluation was taken to equity. in this case
the impairment is also recognised in equity up to the amount
of any previous revaluation.
for assets excluding goodwill, an assessment is made at each
reporting date as to whether there is any indication that
previously recognised impairment losses may no longer exist or
may have decreased. if such indication exists, the Group makes
an estimate of recoverable amount of the cash generating unit.
a previously recognised impairment loss is reversed only if there
has been a change in the estimates used to determine the asset’s
recoverable amount since the last impairment loss was recognised.
the reversal is limited so that the carrying amount
of the asset does not exceed its recoverable amount, nor exceed
the carrying amount that would have been determined, net
of depreciation, had no impairment loss been recognised
for the asset in prior years. Such reversal is recognised in profit
or loss unless the asset is carried at a revalued amount, in which
case the reversal is treated as a revaluation increase.
the following criteria are also applied in assessing impairment
of specific assets:
Goodwill
Goodwill is reviewed for impairment annually or more frequently
if events or changes in circumstances indicate that the carrying
value may be impaired. impairment is determined for goodwill
by assessing the recoverable amount of the cash-generating units
to which the goodwill relates. Where the recoverable amount
of the cash-generating units is less than the carrying amount of
the cash generating unit to which goodwill has been allocated,
an impairment loss is recognised. impairment losses relating to
goodwill cannot be reversed in future periods. the Group
performs its annual impairment test of goodwill as at
September 30.
Intangible assets
intangible assets with indefinite useful lives are tested
for impairment annually as at 30 September, either individually
or at the cash generating unit level, as appropriate and
when circumstances indicate that the carrying value may
be impaired.
Financial assets
Initial recognition
financial assets are classified at initial recognition as financial
assets at fair value through profit or loss, loans and receivables,
held-to-maturity investments, or available-for-sale financial assets,
53n e w m a u r i t i u s h o t e l s l i m i t e d
AR_2015_16_210x280_2part_Mise en page 1 1/22/16 4:19 PM Page 53
54 a n n u a l r e p o r t 2 0 1 5
notes to the financial statementsfor the year ended september 30, 2015
as appropriate. the Group determines the classification of its
financial assets at initial recognition and, where allowed and
appropriate, re-evaluates this designation at each financial year end.
financial assets are recognised initially at fair value, plus, in the
case of investments not at fair value through profit or loss,
directly attributable transaction costs.
purchase or sale of financial assets that require delivery of assets
within a time frame established by regulation or convention in the
market place(regular way purchases) are recognized on the trade
date, i.e., the date the Group commits to purchase or sell the asset.
the Group’s financial assets include cash in hand and at banks,
trade and other receivables, quoted and unquoted financial
instruments and derivative financial instruments.
Subsequent measurement
the subsequent measurement of financial assets depends
on their classifications as follows:
Derivatives recorded at fair value through profit or loss
financial assets at fair value through profit or loss include
financial assets held for trading and financial assets designated
upon initial recognition at fair value through profit or loss.
financial assets are classified as held for trading if they are
acquired for the purpose of selling or repurchasing in the near
term. derivatives, including separated embedded derivatives are
also classified as held for trading unless they are designated
as effective hedging instruments as defined by iaS 39.
financial assets at fair value through profit or loss are carried
in the statement of financial position at fair value with net
changes in fair value presented as finance costs (negative net
changes in fair value) or finance income (positive net changes
in fair value) in profit or loss.
financial assets designated upon initial recognition at fair value
through profit or loss are designated at their initial recognition
date and only if the criteria under iaS 39 are satisfied.
the Group uses derivatives such as forward foreign exchange
contracts. derivatives are recorded at fair value and are carried
as assets when fair value is positive and as liabilities when their
fair value is negative. changes in the fair value of derivatives are
included in the profit or loss.
derivatives embedded in other financial instruments, such as the
conversion option in an acquired convertible bond, are treated
as separate derivatives and recorded at fair value if their
economic characteristics and risks are not closely related to those
of the host contract, and the host contract is not itself held-for-
trading or designated at their fair value through profit or loss.
Cash flow hedges
the effective portion of the gain or loss on the hedging
instrument is recognised in oci in the cash flow hedge reserve,
while any ineffective portion is recognised immediately in the
statement of profit or loss as other operating expenses.
Loan and receivables
loans and receivables are non-derivative financial assets with fixed
or determinable payments that are not quoted in an active market.
after initial measurement, such financial assets are subsequently
measured at amortised cost using the effective interest rate (eir)
method, less impairment. amortised cost is calculated by taking
into account any discount or premium on acquisition and fees or
costs that are an integral part of the eir. the eir amortisation is
included in finance income in the profit or loss. the losses arising
from impairment are recognised in the profit or loss.
Available-for-sale financial assets
available-for-sale financial assets include equity investments.
equity investments classified as available-for-sale are those,
which are neither classified as held for trading nor designated
at fair value through profit or loss.
after initial measurement, available-for-sale financial investments
are subsequently measured at fair value with unrealised gains
or losses recognised as other comprehensive income in the
available-for-sale reserve until the investment is derecognised,
at which time the cumulative gain or loss is recognised in other
income, or the investment is determined to be impaired, when
the cumulative loss is reclassified from the available-for-sale
reserve to profit or loss in finance costs. interest earned whilst
holding available-for-sale financial investments is reported
as interest income using the eir method.
the Group evaluates whether the ability and intention to sell
its available-for-sale financial assets in the near term is still
appropriate. When, in rare circumstances, the Group is unable
to trade these financial assets due to inactive markets
and management’s intention to do so significantly changes in
the foreseeable future, the Group may elect to reclassify these
financial assets. reclassification to loans and receivables
is permitted when the financial assets meet the definition
of loans and receivables and the Group has the intent and ability
to hold these assets for the foreseeable future or until maturity.
reclassification to the held to maturity category is permitted only
when the entity has the ability and intention to hold the financial
asset accordingly.
for a financial asset reclassified out of the available-for-sale
category, any previous gain or loss on that asset that has been
recognised in equity is amortised to profit or loss over
the remaining life of the investment using the eir. any difference
between the new amortised cost and the expected cash flows is
also amortised over the remaining life of the asset using the eir.
if the asset is subsequently determined to be impaired, then the
amount recorded in equity is reclassified to profit or loss.
Impairment of financial assets
the Group assesses at each reporting date whether a financial
asset or a group of financial assets is impaired. a financial asset
or a group of financial assets is deemed to be impaired if, and
only if, there is objective evidence of impairment as a result of
one or more events that has occurred after the initial recognition
of the asset (an incurred ‘loss event’) and that loss event has an
impact on the estimated future cash flows of the financial asset
or the group of financial assets that can be reliably estimated.
54 a n n u a l r e p o r t 2 0 1 5
AR_2015_16_210x280_2part_Mise en page 1 1/22/16 4:19 PM Page 54
55n e w m a u r i t i u s h o t e l s l i m i t e d
evidence of impairment may include indications that the debtors
or a group of debtors is experiencing significant financial
difficulty, default or delinquency in interest or principal payments,
the probability that they will enter bankruptcy or other financial
reorganisation and where observable data indicate that there
is a measurable decrease in the estimated future cash flows,
such as changes in arrears or economic conditions that correlate
with defaults.
Financial assets carried at amortised cost
if there is objective evidence that an impairment loss on loans
and receivables carried at amortised cost has been incurred, the
amount of the loss is measured as the difference between the
asset’s carrying amount and the present value of estimated future
cash flows (excluding future expected credit losses that have not
been incurred) discounted at the financial asset’s original
effective interest rate (i.e. the effective interest rate computed at
initial recognition). the carrying amount of the asset is reduced
through use of an allowance account. the amount of the loss
shall be recognised in profit or loss.
the Group first assesses whether objective evidence of impairment
exists individually for financial assets that are individually significant,
and individually or collectively for financial assets that are not
individually significant. if it is determined that no objective
evidence of impairment exists for an individually assessed financial
asset, whether significant or not, the asset is included in a group
of financial assets with similar credit risk characteristics and that
group of financial assets is collectively assessed for impairment.
assets that are individually assessed for impairment and for which
an impairment loss is or continues to be recognised are not
included in a collective assessment of impairment.
if, in a subsequent period, the amount of the impairment loss
decreases and the decrease can be related objectively to an event
occurring after the impairment was recognised, the previously
recognised impairment loss is reversed. any subsequent reversal
of an impairment loss is recognised in profit or loss, to the extent
that the carrying value of the asset does not exceed its amortised
cost at the reversal date.
in relation to trade receivables, a provision for impairment is
made when there is objective evidence (such as the probability
of insolvency or significant financial difficulties of the debtor)
that the Group will not be able to collect all of the amounts due
under the original terms of the invoice. the carrying amount of
the receivable is reduced through use of an allowance account.
impaired debts are derecognised when they are assessed
as uncollectible.
Available-for-sale financial investments
for available-for-sale financial investments, the Group assesses
at each reporting date whether there is objective evidence that
an investment or a group of investments is impaired.
in the case of equity investments classified as available-for-sale,
objective evidence would include a significant or prolonged
decline in the fair value of the investment below its cost.
‘Significant’ is evaluated against the original cost of the investment
and ‘prolonged’ against the period in which the fair value has
been below its original cost. Where there is evidence
of impairment, the cumulative loss – measured as the difference
between the acquisition cost and the current fair value, less any
impairment loss on that investment previously recognised
in profit or loss – is removed from other comprehensive income
and recognised in profit or loss. impairment losses on equity
investments are not reversed through profit or loss; increases
in their fair value after impairment are recognised directly in other
comprehensive income.
in the case of debt instruments classified as available-for-sale,
impairment is assessed based on the same criteria as financial
assets carried at amortised cost. however, the amount recorded
for impairment is the cumulative loss measured as the difference
between the amortised cost and the current fair value, less any
impairment loss on that investment previously recognised
in profit or loss.
Financial liabilities
Initial recognition
financial liabilities within the scope of iaS 39 are classified as
financial liabilities at fair value through profit or loss, loans and
borrowings, or as derivatives designated as hedging instruments
in an effective hedge, as appropriate. the Group determines the
classification of its financial liabilities at initial recognition.
financial liabilities are recognised initially at fair value and in the
case of borrowings, directly attributable transaction costs.
the Group’s financial liabilities include trade and other payables,
bank overdraft, borrowings, derivatives and preference shares.
Subsequent measurement
the measurement of financial liabilities depends on their
classification as follows:
Interest-bearing loans and borrowings
after initial recognition, borrowings are subsequently measured
at amortised cost using the effective interest rate method. Gains
and losses are recognised in profit or loss when the liabilities are
derecognised as well as through the amortisation process.
amortised cost is calculated by taking into account any discount
or premium on acquisition and fees or costs that are an integral
part of the eir. the eir amortisation is included as finance costs
in profit or loss.
Derecognition of financial assets and liabilities
Financial assets
a financial asset (or, where applicable a part of a financial asset
or part of a group of similar financial assets) is derecognised when:
• the rights to receive cash flows from the asset have expired; or
• the Group has transferred its rights to receive cash flows from
the asset or has assumed an obligation to pay them in full
without material delay to a third party under a ‘pass-through’
arrangement; and either (a) the Group has transferred
55n e w m a u r i t i u s h o t e l s l i m i t e d
AR_2015_16_210x280_2part_Mise en page 1 1/22/16 4:19 PM Page 55
56 a n n u a l r e p o r t 2 0 1 5
notes to the financial statementsfor the year ended september 30, 2015
substantially all the risks and rewards of the asset, or (b) has
neither transferred nor retained substantially all the risks and
rewards of the asset, but has transferred control of the asset.
Where Group has transferred its rights to receive cash flows from
an asset or has entered into a pass-through arrangement, and
has neither transferred nor retained substantially all the risks and
rewards of the asset nor is transferred control of the asset, the
asset is recognised to the extent of the Group’s continuing
involvement in the asset. in that case, the Group also recognises
an associated liability.
the transferred asset and the associated liability are measured
on a basis that reflects the rights and obligations that the Group
has retained.
continuing involvement that takes the form of a guarantee over
the transferred asset is measured at the lower of the original
carrying amount of the asset and the maximum amount of
consideration that the Group could be required to repay.
Where continuing involvement takes the form of a written and/or
purchased option (including a cash-settled option or similar
provision) on the transferred asset, the extent of the Group’s
continuing involvement is the amount of the transferred asset
that the Group may repurchase, except that in the case of a
written put option (including a cash-settled option or similar
provision) on an asset measured at fair value, the extent of the
Group’s continuing involvement.
Financial liabilities
a financial liability is derecognised when the obligation under
the liability is discharged or cancelled or expires.
Where an existing financial liability is replaced by another from
the same lender on substantially different terms, or the terms
of an existing liability are substantially modified, such an
exchange or modification is treated as a derecognition of the
original liability and the recognition of a new liability, and the
difference in the respective carrying amounts is recognised
in profit or loss.
Offsetting of financial instruments
financial assets and financial liabilities are offset and the net
amount reported in the consolidated statement of financial
position if, and only if, there is a currently enforceable legal
right to offset the recognised amounts and there is an
intention to settle on a net basis, or to realise the assets and
settle the liabilities simultaneously.
Fair value measurement
the Group measures its financial instruments and non-financial
assets such as investment properties and items of property
at fair value at each reporting date.
fair value is the price that would be received to sell an asset
or paid to transfer a liability in an orderly transaction between
market participants at the measurement date. the fair value
measurement is based on the presumption that the transaction
to sell the asset or transfer the liability takes place either:
• in the principal market for the asset or liability, or
• in the absence of a principal market, in the most advantageous
market for the asset or liability.
the principal or the most advantageous market must be
accessible to by the Group.
the fair value of an asset or a liability is measured using the
assumptions that market participants would use when pricing
the asset or liability, assuming that market participants act
in their economic best interest.
a fair value measurement of a non-financial asset takes into
account a market participant’s ability to generate economic
benefits by using the asset in its highest and best use or by selling
it to another market participant that would use the asset in
its highest and best use.
the Group uses valuation techniques that are appropriate in
the circumstances and for which sufficient data are available
to measure fair value, maximising the use of relevant observable
inputs and minimising the use of unobservable inputs.
all assets and liabilities for which fair value is measured or
disclosed in the financial statements are categorised within the
fair value hierarchy, described as follows, based on the lowest
level input that is significant to the fair value measurement
as a whole:
• level 1 - Quoted (unadjusted) market prices in active markets
for identical assets or liabilities;
• level 2 - Valuation techniques for which the lowest level input
that is significant to the fair value measurement is directly
or indirectly observable;
• level 3 - Valuation techniques for which the lowest level
input that is significant to the fair value measurement
is unobservable.
for assets and liabilities that are recognised in the financial
statements on a recurring basis, the Group determines whether
transfers have occurred between levels in the hierarchy
by re-assessing categorisation (based on the lowest level input
that is significant to the fair value measurement as a whole)
at the end of each reporting period.
the Group’s management determines the policies and
procedures for both recurring fair value measurement, such as
unquoted available-for-sale financial assets, and for
non-recurring measurement, such as assets held for sale.
the Group’s management determines the policies and procedures
for the measurement of both recurring and non-recurring fair
values. financial assets that are unquoted are fair valued
by management at least annually at the reporting date. the use of
external valuers is decided by the management when the situation
dictates it, taking into consideration the relevant factors.
involvement of external valuers for the valuation of its properties
is decided upon by management after discussion with and
approval of the audit committee. Selection criteria include market
AR_2015_16_210x280_2part_Mise en page 1 1/22/16 4:19 PM Page 56
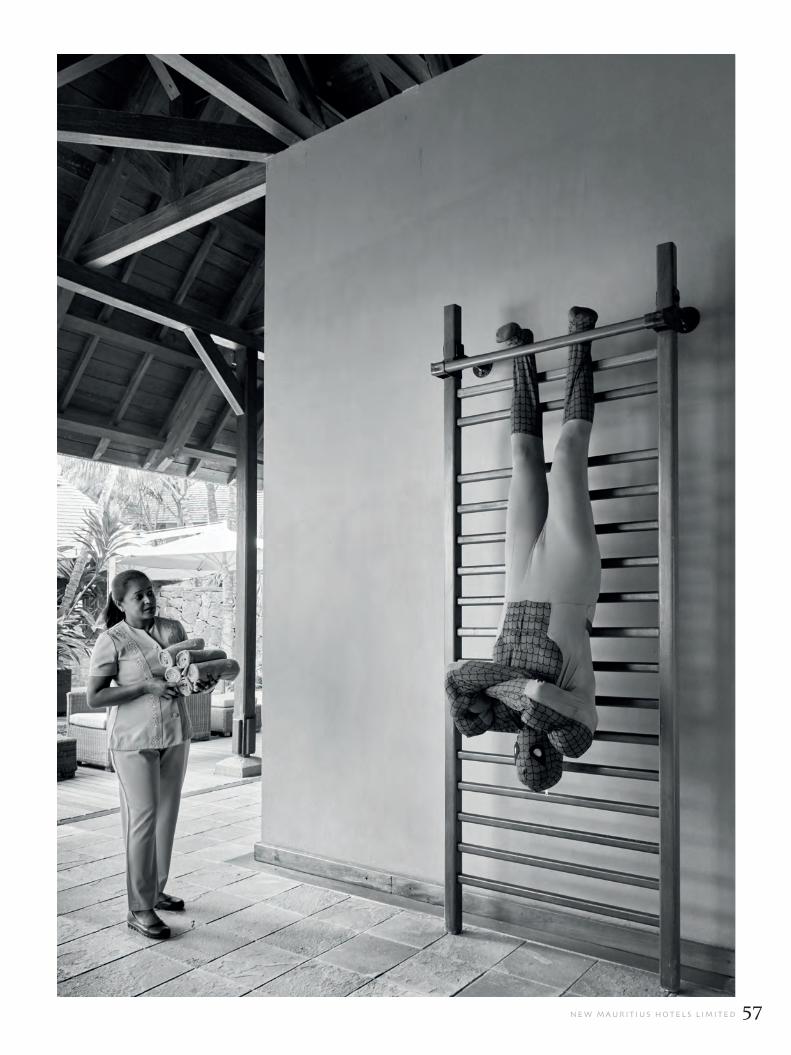
57n e w m a u r i t i u s h o t e l s l i m i t e d
AR_2015_16_210x280_2part_Mise en page 1 1/22/16 4:19 PM Page 57

58 a n n u a l r e p o r t 2 0 1 5
knowledge, reputation, independence and whether professional
standards are maintained. management decides, after
discussions with the Group’s external valuers, which valuation
techniques and inputs to use for each case. management
assesses the changes in the inputs, as well as those in the
environment, from both internal and external sources, that affect
the fair value of the property since the last valuation, and
thereafter decides on the involvement of external valuers.
at each reporting date, management analyses the movements
in the values of assets and liabilities which are required to be
re-measured or re-assessed as per the Group’s accounting
policies. for this analysis, management verifies the major inputs
applied in the latest valuation by agreeing the information in
the valuation computation to relevant documents. management,
in conjunction with the Group’s external valuers, also compares
each the changes in the fair value of each asset and liability
with relevant external sources to determine whether the change
is reasonable.
the fair values of the Group’s unquoted available for sales
investments are determined by management at least annually
at the reporting date through the income approach. inputs and
assumptions used in the determination of the fair value are
verified and validated to their respective sources and documents.
for the purpose of fair value disclosures, the Group has
determined classes of assets and liabilities on the basis of the
nature, characteristics and risks of the asset or liability and the
level of the fair value hierarchy as explained above.
Current versus non-current classification
the Group presents assets and liabilities in statement of financial
position based on current/non-current classification. an asset
is current when it is:
• expected to be realised or intended to be sold or consumed
in normal operating cycle;
• held primarily for the purpose of trading;
• expected to be realised within twelve months after the
reporting period; or
• cash or cash equivalent unless restricted from being
exchanged or used to settle a liability for at least twelve
months after the reporting period.
all other assets are classified as non-current. a liability
is current when:
• it is expected to be settled in normal operating cycle;
• it is held primarily for the purpose of trading;
• it is due to be settled within twelve months after the reporting
period; or
• there is no unconditional right to defer the settlement of the
liability for at least twelve months after the reporting period.
the Group classifies all other liabilities as non-current. deferred
tax assets and liabilities are classified as non-current assets
and liabilities.
Cash and cash equivalents
for the purpose of the statement of cash flows, cash and
cash equivalents consist of cash in hand and at bank, net
of outstanding bank overdrafts. cash and cash equivalents
are measured at amortised cost.
Inventories
inventories are valued at the lower of cost and net
realisable value.
costs incurred in bringing each product to its present location
and condition, are accounted for as follows:
• food and beverages are valued at purchase cost on a weighted
average basis.
• operating supplies and small equipment are recognised
at purchase cost and amortised on a straight line basis over
their estimated useful life which is between two to four years.
• Spare parts, fabrics and garments are valued at purchase cost
on a weighted average basis.
• Stock of villas is valued at cost which comprise of cost of land,
construction costs and borrowing costs.
Villas being constructed for sale in the ordinary course
of business, rather than to be held for rental or capital
appreciation, is held as inventory and is measured at the lower
of cost and net realisable value.
net realisable value is the estimated selling price in the ordinary
course of business less estimated costs necessary to make
the sale.
Provisions
provisions are recognised when the Group has a present
obligation (legal or constructive) as a result of a past event, it is
probable that an outflow of resources embodying economic
benefits will be required to settle the obligation and a reliable
estimate can be made of the amount of the obligation. When
the Group expects some or all of a provision to be reimbursed,
for example, under an insurance contract, the reimbursement is
recognised as a separate asset, but only when the reimbursement
is virtually certain. the expense relating to a provision
is presented in profit or loss net of any reimbursement.
Redeemable convertible non-voting preference shares
the company issued 161,423,536 redeemable convertible
non-voting preference shares at an issue price of mur 11 each,
totalling mur 1,775,658,896, during the year.
the preference shares have been classified as financial liabilities
as even though the shares are redeemable at the option of the
company; there is a contractual obligation to pay dividends
to the holder and this is non-discretionary as compared to
ordinary shares.
the preference shares was initially measured at fair value less
transaction costs and then subsequently measured at amortised
cost using the effective interest rate method.
the preference shares yield a cumulative preferred dividend of 6%
per financial year; preferred dividends will be declared twice per
financial year and will be paid in priority over ordinary dividends.
refer to note 25 (e) for more details on the redeemable
convertible non-voting preference shares.
notes to the financial statementsfor the year ended september 30, 2015
AR_2015_16_210x280_2part_Mise en page 1 1/22/16 4:19 PM Page 58
59n e w m a u r i t i u s h o t e l s l i m i t e d
Employee benefit assets
(i) Defined benefit plans
the Group operates a multi-employer defined benefit plan,
the assets of which are held in a separately administered fund.
the pension plan is funded by payments from employees and
by the employer, by taking into account the recommendations
of independent qualified actuaries who carry out a full valuation
of the plan every three years.
re-measurements, comprising of actuarial gains and losses,
the effect of the asset ceiling, excluding net interest and the return
on plan assets (excluding net interest), are recognised immediately
in the statement of financial position with a corresponding debit
or credit to retained earnings through the other comprehensive
income in the period in which they occur. re-measurements are
not reclassified to profit or loss in subsequent periods.
past service cost are recognised in profit or loss on the earlier of:
• the date of the plan amendment or curtailment, and
• the date that the company recognises restructuring related costs.
net interest is calculated by applying the discount rate to the net
defined benefit liability or asset. the Group recognises the
following changes in the net defined benefit obligation under
‘staff costs’ in profit or loss (by function):
• Service costs comprising current service costs, past service costs,
gains and losses on curtailments and non-routine settlements.
• net interest expense or income.
(ii) Defined contribution plans
the company operates a defined contribution scheme,
set up in october 2014, the assets of which are held and
administered by an independent fund administrator. all new
employees of the company from that date become members
of the defined contribution plan. payments by the company
to the defined contribution retirement plan are charged as an
expense as they fall due.
(iii) Severance allowance
the company is liable to pay severance allowance to employees
at the date of their retirements under the employment rights act
2008. these benefits are unfunded. the cost of providing these
benefits is determined using the projected unit credit method.
actuarial gains and losses in determining the present value of the
unfunded obligations are recognised in full in the period in which
they occur in other comprehensive income. Such actuarial gains
and losses are also immediately recognised in retained earnings
and are not reclassified to profit or loss in subsequent periods.
the past service costs are recognised as an expense on a straight
line basis over the average period until the benefits become
vested (that is when the employee retires). if the benefits have
already vested, immediately following changes in legislation, past
service costs are recognised immediately.
Taxes
Current income tax
current tax income assets and liabilities for the current and prior
periods are measured at the amount expected to be recovered
from or paid to the taxation authorities. the tax rates and tax
laws, used to compute the amount, are those that are enacted
or substantively enacted at the reporting date in the countries
where the Group operates and generates taxable income.
current income tax relating to items recognised directly in equity
is recognised in equity and not in profit or loss. management
periodically evaluates positions taken in the tax returns with respect
to situations in which applicable tax regulations are subject to
interpretation and establishes provisions where appropriate.
Deferred income tax
deferred income tax is provided using the liability method on
temporary differences at the reporting date between the tax
bases of assets and liabilities and their carrying amounts
for financial reporting purposes.
deferred income tax liabilities are recognised for all taxable
temporary differences, except:
• where the deferred income tax liability arises from
the initial recognition of goodwill or of an asset or liability in
a transaction that is not a business combination and, at the
time of the transaction, affects neither the accounting profit
nor taxable profit or loss; and• in respect of taxable temporary differences associated with
investments in subsidiary companies and associated companies
where the timing of the reversal of the temporary differences
can be controlled and it is probable that the temporary
differences will not reverse in the foreseeable future.
deferred income tax assets are recognised for all deductible
temporary differences, carry forward of unused tax credits and
unused tax losses, to the extent that it is probable that taxable
profit will be available against which the deductible temporary
differences, and the carry forward of unused tax credits and
unused tax losses can be utilised except:
• where the deferred income tax asset relating to the deductible
temporary difference arises from the initial recognition
of an asset or liability in a transaction that is not a business
combination and, at the time of the transaction, affects neither
the accounting profit nor taxable profit or loss; and• in respect of deductible temporary differences associated with
investments in subsidiary companies and associated companies,
deferred income tax assets are recognised only to the extent
that it is probable that the temporary differences will reverse in
the foreseeable future and taxable profit will be available
against which the temporary differences can be utilised.
the carrying amount of deferred income tax assets is reviewed
at each reporting date and reduced to the extent that it is no
longer probable that sufficient taxable profit will be available to
allow all or part of the deferred income tax asset to be utilised.
unrecognised deferred income tax assets are reassessed at each
reporting date and are recognised to the extent that it has
become probable that future taxable profit will allow the deferred
tax asset to be recovered.
AR_2015_16_210x280_2part_Mise en page 1 1/22/16 4:19 PM Page 59
60 a n n u a l r e p o r t 2 0 1 5
deferred income tax assets and liabilities are measured at the
tax rates that are expected to apply to the year when the asset
is realised or the liability is settled, based on tax rates (and tax
laws) that have been enacted or substantively enacted
at the reporting date.
deferred income tax relating to items recognised directly
in other comprehensive income or equity is recognised in other
comprehensive income or equity and not in profit or loss.
deferred income tax assets and deferred income tax liabilities
are offset, if a legally enforceable right exists to set off current
tax assets against current income tax liabilities and the deferred
income taxes relate to the same taxable entity and the same
taxation authority.
Value Added Tax
revenues, expenses and assets are recognised net of the amount
of value added tax except:
• where the value added tax incurred on a purchase of assets or
services is not recoverable from the taxation authority, in which
case the value added tax is recognised as part of the cost
of acquisition of the asset or as part of the expense item
as applicable; and
• receivables and payables that are stated with the amount
of value added tax included.
the net amount of value added tax recoverable from, or payable
to, the taxation authority is included as part of accounts
receivables or payables in the statement of financial position.
Environment fees and solidarity levy
environment fees and solidarity levy are calculated based on the
applicable regulations and are included in operating expenses.
Corporate Social Responsibility
in line with the definition within the income tax act 1995,
corporate Social responsibility (cSr) is regarded as a tax and is
therefore subsumed with the income tax shown within the
Statement of comprehensive income and the income tax liability
on the Statement of financial position.
the cSr charge for the current period is measured at the amount
expected to be paid to the mauritian tax authorities. the cSr
rate and laws used to compute the amount are those charged
or substantively enacted by the reporting date.
Leases
the determination of whether an arrangement is, or contains a
lease is based on the substance of the arrangement and requires
an assessment of whether the fulfilment of the arrangement is
dependent on the use of a specific asset or assets and the
arrangement conveys a right to use the asset or assets, even of
that right is not explicitly specified in the arrangement.
Group as a lessee
Finance leases
finance leases, which transfer to the Group substantially all the
risks and benefits incidental to ownership of the leased item,
are capitalised at the inception of the lease at the fair value of
the leased property or, if lower, at the present value of the
minimum lease payments. lease payments are apportioned
between the finance charges and reduction of the lease liability
so as to achieve a constant rate of interest on the remaining
balance of the liability. finance charges are recognised in the
profit or loss.
capitalised leased assets are depreciated over the shorter of the
estimated useful life of the asset and the lease term, if there is
no reasonable certainty that the Group will obtain ownership by
the end of the lease term.
Operating lease
operating lease payments are recognised as an expense in profit
or loss on a straight-line basis over the lease term.
Borrowing costs
Borrowing costs directly attributable to the acquisition, construction
or production of qualifying assets, which are assets that necessarily
take a substantial period of time to get ready for their intended use,
are added to the cost of those assets, until such time as the assets
are substantially ready for their intended use.
all other borrowing costs are recognised as an expense
when incurred.
Borrowing costs consist of interests and other costs that
the Group incurs in connection with borrowing of funds.
Revenue recognition
revenue is recognised to the extent that it is probable that the
economic benefits will flow to the Group and the revenue can
be reliably measured. revenue is measured at the fair value of
the consideration received, excluding discounts, rebates, and
value added taxes or other taxes.
the following specific criteria must also be met before revenue
is recognised:
(i) Revenue from hotel operations
revenue is recognised upon consumption and acceptance
by customers.
(ii) Revenue from airline and inland catering
revenue is recognised when the significant risks and rewards
of ownership of the goods have passed to the buyers, usually
on dispatch of the goods.
(iii) Revenue from tour operating
commissions are recognised on completion of the services
performed.
notes to the financial statementsfor the year ended september 30, 2015
AR_2015_16_210x280_2part_Mise en page 1 1/22/16 4:19 PM Page 60
61n e w m a u r i t i u s h o t e l s l i m i t e d
(iv) Revenue from sale of villas
Where property is under development and agreement has
been reached to sell such property when construction is
complete, the directors consider whether the contract
comprises a contract to construct a property or a contract for
the sale of a completed property. Where a contract is judged
to be for the construction of a property, revenue is recognised
using the percentage-of-completion method as construction
progresses.
in such situations, the percentage of work completed is
measured based on the costs incurred up until the end of the
reporting period as a proportion of total costs expected to be
incurred. Where the contract is judged to be for the sale of a
completed property, revenue is recognised when the significant
risks and rewards of ownership of the real estate have been
transferred to the buyer.
(v) Interest income
as it accrues (taking into account the effective yield on the asset)
unless collectability is in doubt.
(vi) Dividend revenue
When the shareholder’s right to receive payment is established.
cash dividend to equity holders
the company recognises a liability to make cash distributions to
equity holders when to distribution is authorised by the board.
4. SEGMENTAL REPORTING
the Group presents segmental information using business
segments and geographical segments. this is based on the internal
management and financial reporting systems and reflects the risks
and earnings structure of the Group. management monitors the
operating results of its business units separately for the purpose
of making decisions about resource allocation and performance
assessment. Segment performance is evaluated based on operating
profit or loss and is measured consistently with operating profit or
loss in the consolidated financial statements.
the Group is composed of four business segments, which are as
follows: hotel operations, tour operations, airline and inland
catering and property development and others as described
below. each business segment provides products and services
that are subject to risks and returns that are different from those
of other business segments.
- hotel operations – carried out in mauritius, Seychelles
and morocco.
- tour operating – carried out in france, united Kingdom, italy,
South africa and australia.
- airline and inland catering – carried out in mauritius.
- property development – construction of villas in morocco
and future property development in mauritius.
AR_2015_16_210x280_2part_Mise en page 1 1/22/16 4:19 PM Page 61
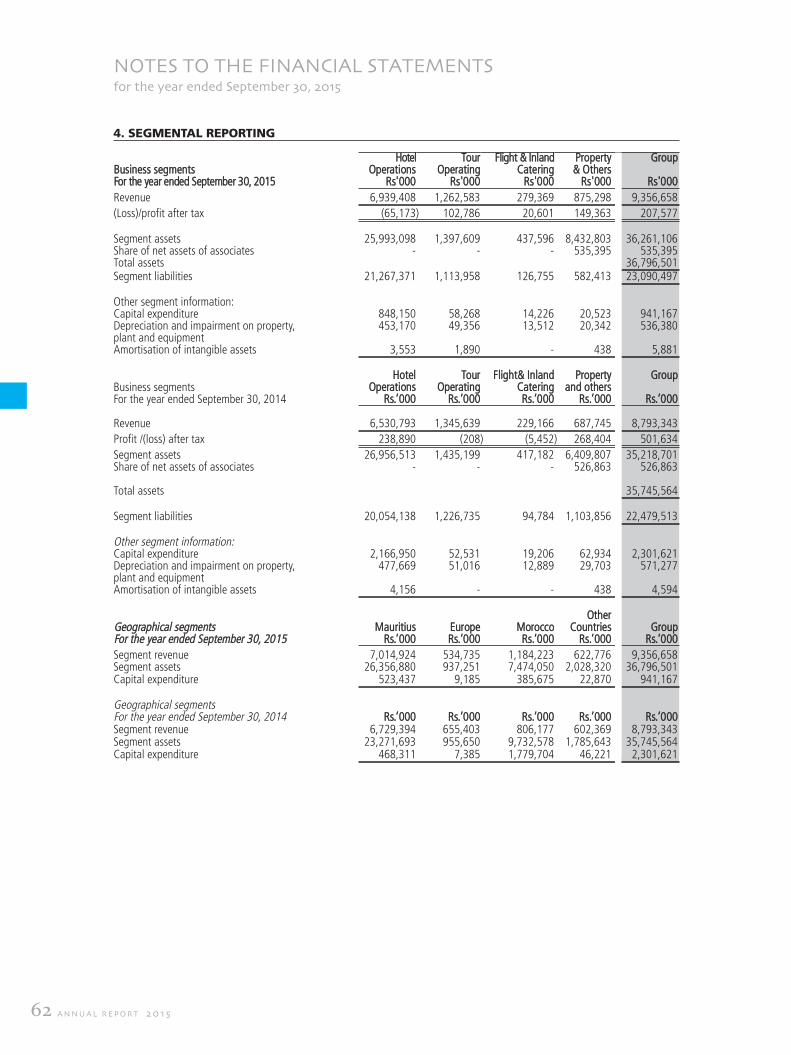
62 a n n u a l r e p o r t 2 0 1 5
notes to the financial statementsfor the year ended september 30, 2015
4. SEGMENTAL REPORTING
hotel) tour) flight & inland) property GroupBusiness segments operations) operating) catering) & othersfor the year ended September 30, 2015 rs'000) rs'000) rs'000) rs'000 rs'000
revenue 6,939,408) 1,262,583) 279,369) 875,298 9,356,658
(loss)/profit after tax (65,173) 102,786) 20,601) 149,363 207,577
Segment assets 25,993,098) 1,397,609) 437,596) 8,432,803 36,261,106 Share of net assets of associates -) -) -) 535,395 535,395 total assets 36,796,501 Segment liabilities 21,267,371) 1,113,958) 126,755) 582,413 23,090,497
other segment information:capital expenditure 848,150) 58,268) 14,226) 20,523 941,167 depreciation and impairment on property, 453,170) 49,356) 13,512) 20,342 536,380 plant and equipmentamortisation of intangible assets 3,553) 1,890) -) 438 5,881
hotel) tour) flight& inland) property GroupBusiness segments operations) operating) catering) and othersfor the year ended September 30, 2014 rs.’000) rs.’000) rs.’000) rs.’000 rs.’000
revenue 6,530,793) 1,345,639) 229,166) 687,745 8,793,343
profit /(loss) after tax 238,890) (208) (5,452) 268,404 501,634
Segment assets 26,956,513) 1,435,199) 417,182) 6,409,807 35,218,701Share of net assets of associates -) -) -) 526,863 526,863
total assets 35,745,564
Segment liabilities 20,054,138) 1,226,735) 94,784) 1,103,856 22,479,513
other segment information:capital expenditure 2,166,950) 52,531) 19,206) 62,934 2,301,621 depreciation and impairment on property, 477,669) 51,016) 12,889) 29,703 571,277 plant and equipmentamortisation of intangible assets 4,156) -) -) 438 4,594
otherGeographical segments mauritius) europe) morocco) countries Groupfor the year ended September 30, 2015 rs.’000) rs.’000) rs.’000) rs.’000 rs.’000
Segment revenue 7,014,924) 534,735) 1,184,223) 622,776 9,356,658 Segment assets 26,356,880) 937,251) 7,474,050) 2,028,320 36,796,501 capital expenditure 523,437) 9,185) 385,675) 22,870 941,167
Geographical segmentsfor the year ended September 30, 2014 rs.’000) rs.’000) rs.’000) rs.’000 rs.’000Segment revenue 6,729,394) 655,403) 806,177) 602,369 8,793,343 Segment assets 23,271,693) 955,650) 9,732,578) 1,785,643 35,745,564 capital expenditure 468,311) 7,385) 1,779,704) 46,221 2,301,621
AR_2015_16_210x280_2part_Mise en page 1 1/22/16 4:19 PM Page 62

63n e w m a u r i t i u s h o t e l s l i m i t e d
5. STAFF COSTS
THE GROUP THE COMPANY2015 2014 2015 2014
rs'000 rs'000 rs'000 rs'000
Wages, salaries, fees and bonuses 2,269,153 2,156,665 1,552,348 1,525,610 Social security costs 242,866 263,868 147,710 125,416 employee benefits and related expenses 580,674 503,655 484,104 460,283
3,092,693 2,924,188 2,184,162 2,111,309
6. OTHER EXPENSES
THE GROUP THE COMPANY2015 2014 2015 2014
rs.’000 rs.’000 rs.’000 rs.’000
operating supplies and cleaning expenses 389,066 393,283 312,080 309,461 repairs and maintenance 246,062 206,515 185,365 184,344 utility costs 535,504 524,555 398,020 403,131 marketing expenses 711,682 810,181 433,613 459,501 Guest entertainment 98,066 89,196 88,239 82,615 administrative expenses 389,802 305,499 182,624 139,909 operating lease rentals 162,489 177,114 135,403 131,484 licenses, patents, insurance and taxes 142,628 131,772 119,584 111,639
2,675,299 2,638,115 1,854,928 1,822,084
7. FINANCE REVENUE
THE GROUP THE COMPANY2015 2014 2015 2014
rs.’000 rs.’000 rs.’000 rs.’000
investment income: Quoted 9 14 9 14 unquoted 23 26 18,997 12,678
exchange gain on forward contracts 30,660 31,510 30,660 31,510 exchange gain on retranslation of loans and payables 133,753 144,905 - 144,905 exchange gain on retranslation of subsidiaries’ current accounts - - 17,308 - interest income 32,216 35,196 2,230 1,915
196,661 211,651 69,204 191,022
AR_2015_16_210x280_2part_Mise en page 1 1/22/16 4:19 PM Page 63

64 a n n u a l r e p o r t 2 0 1 5
notes to the financial statementsfor the year ended september 30, 2015
8. FINANCE COSTS
THE GROUP THE COMPANY2015) 2014) 2015) 2014)
rs.’000) rs.’000) rs.’000) rs.’000)
fair value loss on derivatives -) 40,509) -) 40,509)exchange loss on retranslation of loans and debentures 110,153) 1,626) 38,348) -)exchange loss on retranslation of subsidiaries’ current accounts -) -) -) 284,604)
interest costs on:Bank overdrafts 144,427) 117,262) 89,167) 94,743)loans 782,729) 730,934) 610,823) 581,862)debentures 65,474) 65,464) -) -)preference shares 19,201) -) 19,201) -)finance leases 28,037) 30,286) 21,859) 21,822)call account with subsidiaries (note 31) -) -) 27,233) 23,528)others 9,115) 15) 9,115) 15)
1,159,136) 986,096) 815,746) 1,047,083)less borrowing costs capitalised/expensed in cost of sales: (218,418) (297,456) (101,385) (108,467)
940,718) 688,640) 714,361) 938,616)
Borrowing costs capitalised/expensed in cost of sales can be analysed as follows:exchange loss on retranslation of loans and debentures included in: property, plant and equipment (note 13 (c)) (5,153) -) -) -)inventories (note 20 (c)) (17,062) -) -) -)cost of sales (3,924) -) -) -
(26,139) -) -) -)
interest cost on bank loans and overdrafts and debentures included in: property, plant and equipment (note 13 (c)) (28,076) (160,210) (3,636) (47,581)inventories (note 20 (c)) (151,778) (137,246) (97,749) (60,886)cost of sales (12,425) -)) -) -)
(192,279) (297,456) (101,385) (108,467)total borrowings capitalised/expensed in cost of sales* (218,418) (297,456) (101,385) (108,467)
9. PRE-OPERATIONAL EXPENSES
THE GROUP THE COMPANY2015) 2014) 2015) 2014)
rs.’000) rs.’000) rs.’000) rs.’000)
pre-operational costs incurred -) 61,697) -) -)
these related to all expenses incurred in relation to staff and administrative costs, and marketing expenses by Beachcombermarrakech S.a. where construction works were in progress.
10. OTHER INCOME
THE GROUP THE COMPANY2015) 2014) 2015) 2014)
rs.’000) rs.’000) rs.’000) rs.’000)
fair value gain on investment properties (note 14) 106,063) 250,942) -) -)Gain on disposal of available-for-sale financial assets 2,871) -) -) -)insurance refund -) 9,000) -) 9,000)other operating income 23,512) 534) -) -)
132,446) 260,476) -) 9,000)
* amount expensed in cost of sales following sale of villas by domaine palm marrakech S.a.
AR_2015_16_210x280_2part_Mise en page 1 1/22/16 4:19 PM Page 64
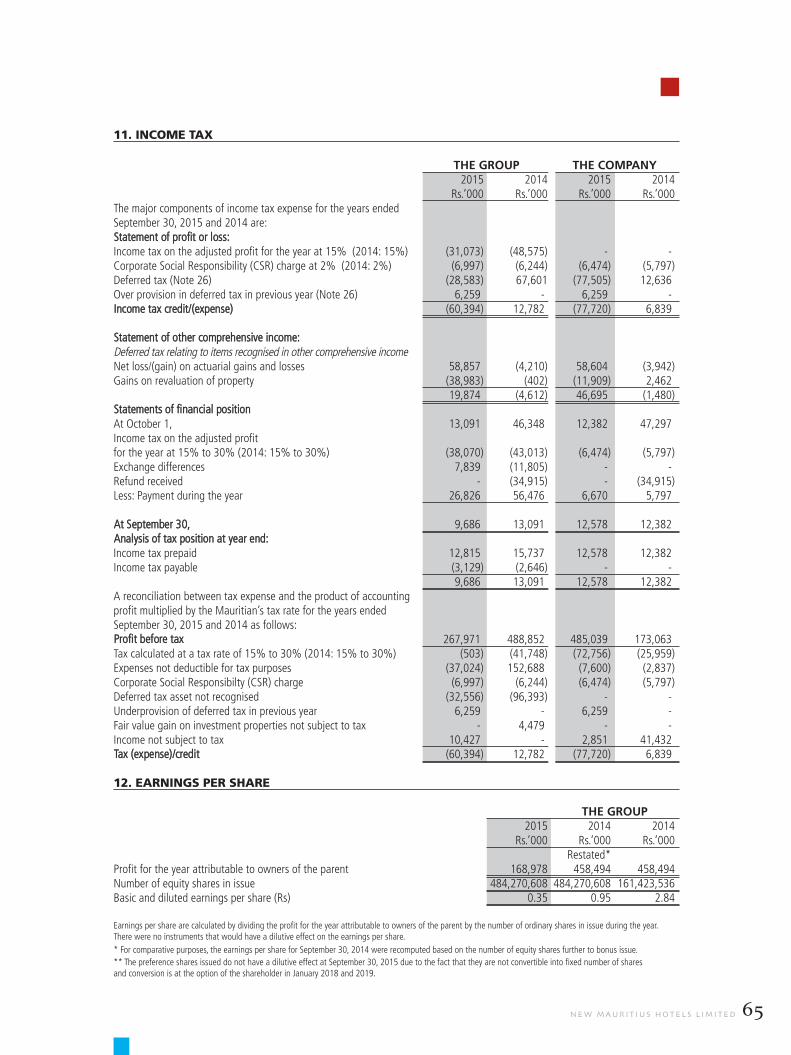
65n e w m a u r i t i u s h o t e l s l i m i t e d
11. INCOME TAX
THE GROUP THE COMPANY2015 2014 2015 2014
rs.’000 rs.’000 rs.’000 rs.’000the major components of income tax expense for the years ended September 30, 2015 and 2014 are:Statement of profit or loss:income tax on the adjusted profit for the year at 15% (2014: 15%) (31,073) (48,575) -) -)corporate Social responsibility (cSr) charge at 2% (2014: 2%) (6,997) (6,244) (6,474) (5,797)deferred tax (note 26) (28,583) 67,601 (77,505) 12,636)over provision in deferred tax in previous year (note 26) 6,259) -) 6,259) -)income tax credit/(expense) (60,394) 12,782) (77,720) 6,839)
Statement of other comprehensive income:deferred tax relating to items recognised in other comprehensive income net loss/(gain) on actuarial gains and losses 58,857) (4,210) 58,604) (3,942)Gains on revaluation of property (38,983) (402) (11,909) 2,462)
19,874) (4,612) 46,695) (1,480)Statements of financial positionat october 1, 13,091) 46,348) 12,382) 47,297)income tax on the adjusted profit for the year at 15% to 30% (2014: 15% to 30%) (38,070) (43,013) (6,474) (5,797)exchange differences 7,839) (11,805) -) -)refund received -) (34,915) -) (34,915)less: payment during the year 26,826) 56,476) 6,670) 5,797)
at September 30, 9,686) 13,091) 12,578) 12,382)analysis of tax position at year end:income tax prepaid 12,815) 15,737) 12,578) 12,382)income tax payable (3,129) (2,646) -) -)
9,686) 13,091) 12,578) 12,382)a reconciliation between tax expense and the product of accounting profit multiplied by the mauritian’s tax rate for the years ended September 30, 2015 and 2014 as follows:profit before tax 267,971) 488,852) 485,039) 173,063)tax calculated at a tax rate of 15% to 30% (2014: 15% to 30%) (503) (41,748) (72,756) (25,959)expenses not deductible for tax purposes (37,024) 152,688) (7,600) (2,837)corporate Social responsibilty (cSr) charge (6,997) (6,244) (6,474) (5,797)deferred tax asset not recognised (32,556) (96,393) -) -)underprovision of deferred tax in previous year 6,259) -) 6,259) -)fair value gain on investment properties not subject to tax -) 4,479) -) -)income not subject to tax 10,427) -) 2,851) 41,432)tax (expense)/credit (60,394) 12,782) (77,720) 6,839)
12. EARNINGS PER SHARE
THE GROUP2015 2014 2014
rs.’000 rs.’000 rs.’000restated*
profit for the year attributable to owners of the parent 168,978 458,494 458,494number of equity shares in issue 484,270,608 484,270,608 161,423,536Basic and diluted earnings per share (rs) 0.35 0.95 2.84
earnings per share are calculated by dividing the profit for the year attributable to owners of the parent by the number of ordinary shares in issue during the year. there were no instruments that would have a dilutive effect on the earnings per share.
* for comparative purposes, the earnings per share for September 30, 2014 were recomputed based on the number of equity shares further to bonus issue.
** the preference shares issued do not have a dilutive effect at September 30, 2015 due to the fact that they are not convertible into fixed number of shares and conversion is at the option of the shareholder in January 2018 and 2019.
AR_2015_16_210x280_2part_Mise en page 1 1/22/16 4:19 PM Page 65
66 a n n u a l r e p o r t 2 0 1 5
AR_2015_16_210x280_2part_Mise en page 1 1/22/16 4:19 PM Page 66

67n e w m a u r i t i u s h o t e l s l i m i t e d
AR_2015_16_210x280_2part_Mise en page 1 1/22/16 4:19 PM Page 67
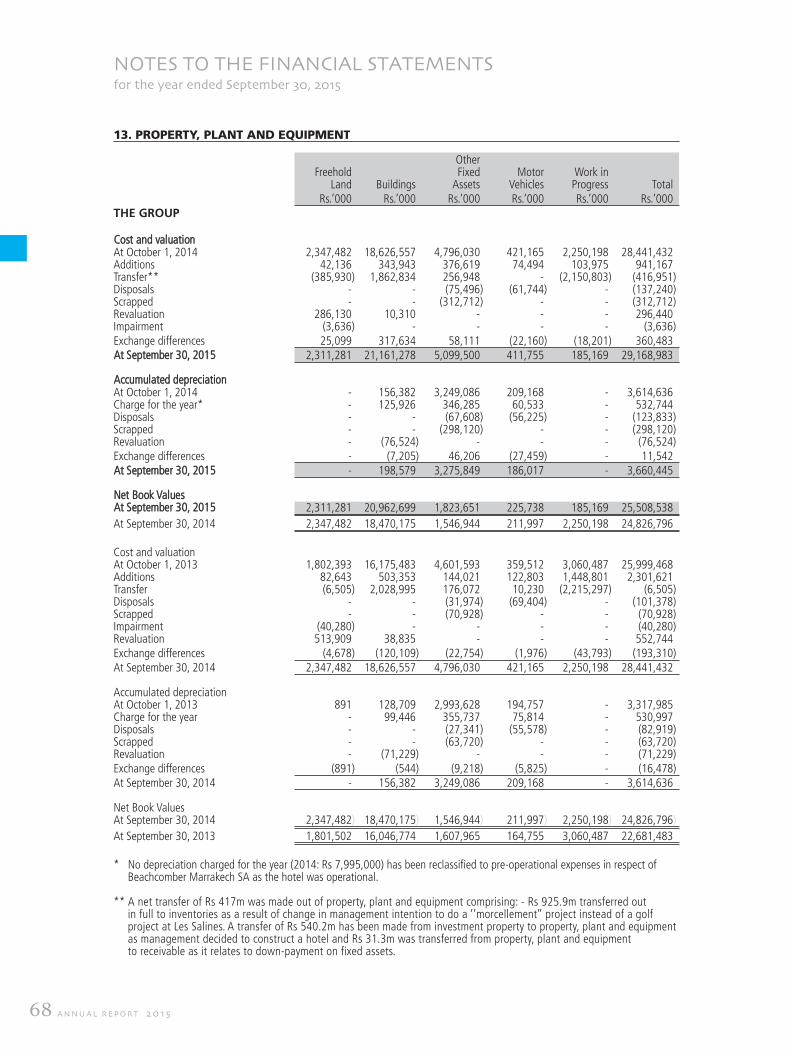
68 a n n u a l r e p o r t 2 0 1 5
13. PROPERTY, PLANT AND EQUIPMENT
other)freehold) fixed) motor) Work in)
land) Buildings) assets) Vehicles) progress) total)rs.’000) rs.’000) rs.’000) rs.’000) rs.’000) rs.’000)
THE GROUP
cost and valuationat october 1, 2014 2,347,482) 18,626,557) 4,796,030) 421,165) 2,250,198) 28,441,432)additions 42,136) 343,943) 376,619) 74,494) 103,975) 941,167)transfer** (385,930) 1,862,834) 256,948) -) (2,150,803) (416,951)disposals -) -) (75,496) (61,744) -) (137,240)Scrapped -) -) (312,712) -) -) (312,712)revaluation 286,130) 10,310) -) -) -) 296,440)impairment (3,636) -) -) -) -) (3,636)exchange differences 25,099) 317,634) 58,111) (22,160) (18,201) 360,483)at September 30, 2015 2,311,281) 21,161,278) 5,099,500) 411,755) 185,169) 29,168,983)
accumulated depreciation at october 1, 2014 -) 156,382) 3,249,086) 209,168) -) 3,614,636)charge for the year* -) 125,926) 346,285) 60,533) -) 532,744)disposals -) -) (67,608) (56,225) -) (123,833)Scrapped -) -) (298,120) -) -) (298,120)revaluation -) (76,524) -) -) -) (76,524)exchange differences -) (7,205) 46,206) (27,459) -) 11,542)at September 30, 2015 -) 198,579) 3,275,849) 186,017) -) 3,660,445)
net Book Valuesat September 30, 2015 2,311,281) 20,962,699) 1,823,651) 225,738) 185,169) 25,508,538)
at September 30, 2014 2,347,482) 18,470,175) 1,546,944) 211,997) 2,250,198) 24,826,796)
cost and valuationat october 1, 2013 1,802,393) 16,175,483) 4,601,593) 359,512) 3,060,487) 25,999,468)additions 82,643) 503,353) 144,021) 122,803) 1,448,801) 2,301,621)transfer (6,505) 2,028,995) 176,072) 10,230) (2,215,297) (6,505)disposals -) -) (31,974) (69,404) -) (101,378)Scrapped -) -) (70,928) -) -) (70,928)impairment (40,280) -) -) -) -) (40,280)revaluation 513,909) 38,835) -) -) -) 552,744)exchange differences (4,678) (120,109) (22,754) (1,976) (43,793) (193,310)at September 30, 2014 2,347,482) 18,626,557) 4,796,030) 421,165) 2,250,198) 28,441,432)
accumulated depreciation at october 1, 2013 891) 128,709) 2,993,628) 194,757) -) 3,317,985)charge for the year -) 99,446) 355,737) 75,814) -) 530,997)disposals -) -) (27,341) (55,578) -) (82,919)Scrapped -) -) (63,720) -) -) (63,720)revaluation -) (71,229) -) -) -) (71,229)exchange differences (891) (544) (9,218) (5,825) -) (16,478)at September 30, 2014 -) 156,382) 3,249,086) 209,168) -) 3,614,636)
net Book Valuesat September 30, 2014 2,347,482) 18,470,175) 1,546,944) 211,997) 2,250,198) 24,826,796)
at September 30, 2013 1,801,502) 16,046,774) 1,607,965) 164,755) 3,060,487) 22,681,483)
* no depreciation charged for the year (2014: rs 7,995,000) has been reclassified to pre-operational expenses in respect ofBeachcomber marrakech Sa as the hotel was operational.
** a net transfer of rs 417m was made out of property, plant and equipment comprising: - rs 925.9m transferred out in full to inventories as a result of change in management intention to do a ‘’morcellement’’ project instead of a golf project at les Salines. a transfer of rs 540.2m has been made from investment property to property, plant and equipment as management decided to construct a hotel and rs 31.3m was transferred from property, plant and equipment to receivable as it relates to down-payment on fixed assets.
notes to the financial statementsfor the year ended september 30, 2015
AR_2015_16_210x280_2part_Mise en page 1 1/22/16 4:19 PM Page 68

69n e w m a u r i t i u s h o t e l s l i m i t e d
13. PROPERTY, PLANT AND EQUIPMENT (CONT’D)
freehold) other fixed) motor) Work in)land) Buildings) assets) Vehicles) progress) total)
rs.’000) rs.’000) rs.’000) rs.’000) rs.’000) rs.’000)THE COMPANYcost and valuationat october 1, 2013 1,738,000) 14,813,290) 4,190,331) 195,986) 23,462) 20,961,069)additions 47,344) 269,942) 87,379) 57,925) 881) 463,471)disposals -) -) (25,035) (39,538) -) (64,573)Scrapped -) -) (70,927) -) -) (70,927)impairment (40,280) -) -) -) -) (40,280)revaluation 5,436) (79,257) -) -) -) (73,821)at September 30, 2014 1,750,500) 15,003,975) 4,181,748) 214,373) 24,343) 21,174,939)accumulated depreciationat october 1, 2013 -) 105,484) 2,769,600) 124,576) -) 2,999,660)charge for the year -) 71,519) 299,861) 22,420) -) 393,800)disposals -) -) (20,973) (29,600) -) (50,573)Scrapped -) -) (63,752) -) -) (63,752)revaluation -) (62,797) -) -) -) (62,797)at September 30, 2014 -) 114,206) 2,984,736) 117,396) -) 3,216,338)
net Book Valuesat September 30, 2014 1,750,500) 14,889,769) 1,197,012) 96,977) 24,343) 17,958,601)
at September 30, 2013 1,738,000) 14,707,806) 1,420,731) 71,410) 23,462) 17,961,409)
cost and valuationat october 1, 2014 1,750,500) 15,003,975) 4,181,748) 214,373) 24,343) 21,174,939)additions 41,492) 182,778) 242,861) 32,034) 24) 499,189)transfer (h) (730,731) 24,258) -) -) (24,352) (730,825)disposals -) -) (16,666) (21,784) -) (38,450)Scrapped -) -) (312,712) -) -) (312,712)impairment (3,636) -) -) -) -) (3,636)revaluation 1,000) 10,310) -) -) -) 11,310)at September 30, 2015 1,058,625) 15,221,321) 4,095,231) 224,623) 15) 20,599,815)accumulated depreciationat october 1, 2014 -) 114,206) 2,984,736) 117,396) -) 3,216,338)charge for the year -) 78,424) 244,473) 22,065) -) 344,962)disposals -) -) (15,918) (19,272) -) (35,190)Scrapped -) -) (298,120) -) -) (298,120)revaluation -) (69,014) -) -) - (69,014)at September 30, 2015 -) 123,616) 2,915,171) 120,189) -) 3,158,976)net Book Valuesat September 30, 2015 1,058,625) 15,097,705) 1,180,060) 104,434) 15) 17,440,839)
at September 30, 2014 1,750,500) 14,889,769) 1,197,012) 96,977) 24,343) 17,958,601)
(a) revaluation of freehold land and buildingsthe freehold land and buildings of the Group and the company were revalued on September 30, 2015 by mr. noor dilmohamed,Bsc (appl) Val, dip l.S. fapi, certified practising Valuer and Sofigex Sarl based on open market value. the company has a policyof revaluing its land and buildings on an annual basis.the Group has assessed that the highest and best use of its properties do not differ from their current use.the revalued land and buildings consist of hotel properties. fair value of the properties was determined by using open marketvalue. this means that valuations performed by the valuer are based on active market prices, significantly adjusted for difference inthe nature, location or condition of the specific property. the freehold land and buildings have been classified as level 2 as it isbased on sales comparison approach, except for the value of hotel building in morocco.
2015 2014Significant unobservable valuation input range rangeprice per square metre freehold land rs 1,653 - rs 3,591 rs 1,371 - rs 4,320
Building rs 34,525 - rs 63,776 rs 34,721 - rs 72,198Significant increases (decreases) in estimated price per square metre in isolation would result in a significantly higher (lower) fair value.
the fair value of the hotel building in morocco has been valued using the depreciated replacement cost. consequently a balance of rs3,501m was classified under level 3, as part of fair value hierarchy. for the year ended 30 September 2015, there has been no gain orloss recognised (2014: nil). the table below shows the valuation techniques used and the key inputs.
Valuation technique Significant unobservable inputs rangeBuildings cost approach price per square m2 rs 69,576- 70,106
AR_2015_16_210x280_2part_Mise en page 1 1/22/16 4:19 PM Page 69
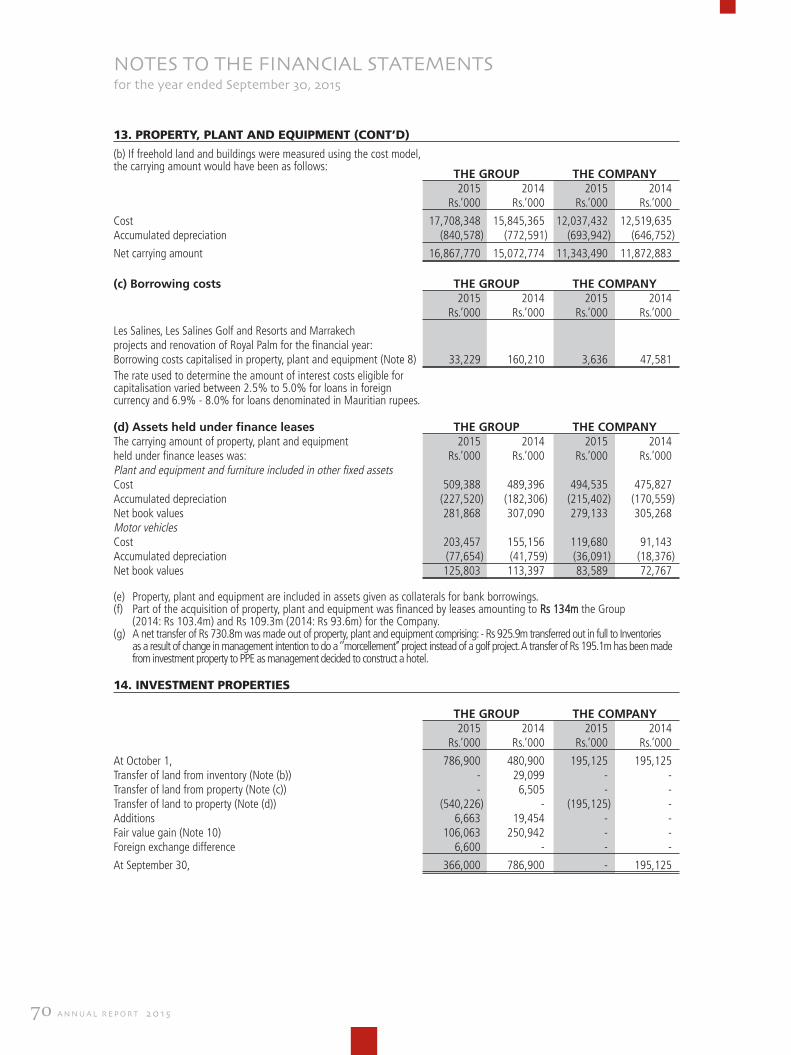
70 a n n u a l r e p o r t 2 0 1 5
13. PROPERTY, PLANT AND EQUIPMENT (CONT’D)
(b) if freehold land and buildings were measured using the cost model, the carrying amount would have been as follows:
THE GROUP THE COMPANY2015) 2014) 2015) 2014)
rs.’000) rs.’000) rs.’000) rs.’000)
cost 17,708,348) 15,845,365) 12,037,432) 12,519,635)accumulated depreciation (840,578) (772,591) (693,942) (646,752)
net carrying amount 16,867,770) 15,072,774) 11,343,490) 11,872,883)
(c) Borrowing costs THE GROUP THE COMPANY2015) 2014) 2015) 2014)
rs.’000) rs.’000) rs.’000) rs.’000)
les Salines, les Salines Golf and resorts and marrakech projects and renovation of royal palm for the financial year: Borrowing costs capitalised in property, plant and equipment (note 8) 33,229) 160,210) 3,636) 47,581)
the rate used to determine the amount of interest costs eligible for capitalisation varied between 2.5% to 5.0% for loans in foreign currency and 6.9% - 8.0% for loans denominated in mauritian rupees.
(d) Assets held under finance leases THE GROUP THE COMPANYthe carrying amount of property, plant and equipment 2015) 2014) 2015) 2014)held under finance leases was: rs.’000) rs.’000) rs.’000) rs.’000)plant and equipment and furniture included in other fixed assetscost 509,388) 489,396) 494,535) 475,827)accumulated depreciation (227,520) (182,306) (215,402) (170,559)net book values 281,868) 307,090) 279,133) 305,268)motor vehiclescost 203,457) 155,156) 119,680) 91,143)accumulated depreciation (77,654) (41,759) (36,091) (18,376)net book values 125,803) 113,397) 83,589) 72,767)
(e) property, plant and equipment are included in assets given as collaterals for bank borrowings.(f) part of the acquisition of property, plant and equipment was financed by leases amounting to rs 134m the Group
(2014: rs 103.4m) and rs 109.3m (2014: rs 93.6m) for the company.(g) a net transfer of rs 730.8m was made out of property, plant and equipment comprising: - rs 925.9m transferred out in full to inventories
as a result of change in management intention to do a ‘’morcellement’’ project instead of a golf project. a transfer of rs 195.1m has been madefrom investment property to ppe as management decided to construct a hotel.
14. INVESTMENT PROPERTIES
THE GROUP THE COMPANY2015) 2014) 2015) 2014)
rs.’000) rs.’000) rs.’000) rs.’000)
at october 1, 786,900) 480,900) 195,125) 195,125)transfer of land from inventory (note (b)) -) 29,099) -) -)transfer of land from property (note (c)) -) 6,505) -) -)transfer of land to property (note (d)) (540,226) -) (195,125) -)additions 6,663) 19,454) -) -)fair value gain (note 10) 106,063) 250,942) -) -)foreign exchange difference 6,600) -) -) -)
at September 30, 366,000) 786,900) -) 195,125)
notes to the financial statementsfor the year ended september 30, 2015
AR_2015_16_210x280_2part_Mise en page 1 1/22/16 4:19 PM Page 70

71n e w m a u r i t i u s h o t e l s l i m i t e d
14. INVESTMENT PROPERTIES (CONT’D)
(a) investment properties are stated at fair value, based on valuations performed by independent certified practising valuers, Sofigex Sarl.management determined that these constitute one class of asset under ifrS 13, based on the nature, characteristics and risks of the property. fair value of the properties was determined by using open market value. this means that valuations performed by the valuer are based on active market prices, significantly adjusted for difference in the nature, location or condition of the specificproperty. the investment properties have been classified as level 2 as it is based on sales comparison approach.
the Group has assessed that the highest and best use of its properties do not differ from their current use.Significant unobservable valuation input 2015 2014price per square metre rs. 4,575 rs. 2,749 - rs 4,320
(b) in the prior year, properties of 8.04 acres of land, previously identified for sale, was transferred from inventories to investmentproperties at its carrying amount as its use was yet to be determined.
(c ) in the prior year, properties of 1.53 acres of land previously identified for hotel construction, was transferred from property,plant and equipment to investment properties as its use was yet to be determined.
(d) during the year, properties of 11.15 acres (company) and 13.11 acres (Group) of land were transferred from investment property to property, plant and equipment as management intends to use this land to construct a 4 star hotel at les Salines.
THE GROUP THE COMPANY2015 2014 2015 2014
rs.’000 rs.’000 rs.’000 rs.’000
the amounts recognised in profit or loss were as follows in respect of :direct operating expenses arising from the investment properties:
- that did not generate rental income during the year - 13,165 - 11,566
15. INTANGIBLE ASSETS
Goodwill arising leasehold)the Group on acquisition rights) patents licences total)
rs.’000 rs.’000) rs.’000 rs.’000 rs.’000)costat october 1, 2013 1,259,000 443,658) 24,493 3,150 1,730,301)exchange differences - (5,720) - - (5,720)at September 30, 2014 1,259,000 437,938) 24,493 3,150 1,724,581)amortisationat october 1, 2013 22,773) - - 22,773)amortisation charge - 3,964) - 630 4,594)exchange differences - (966) - 630 (336)at September 30, 2014 - 25,771) - 1,260 27,031)net book valuesat September 30, 2014 1,259,000 412,167) 24,493 1,890 1,697,550)at September 30, 2013 1,259,000 420,885) 24,493 3,150 1,707,528)costat october 1, 2014 1,259,000 437,938) 24,493 3,150 1,724,581)exchange differences - 12,616) - - 12,616)at September 30, 2015 1,259,000 450,554) 24,493 3,150 1,737,197)amortisationat october 1, 2014 - 25,771) - 1,260 27,031)amortisation charge - 3,991) - 1,890 5,881)impairment 5,883 -) - - 5,883)exchange differences - 2,329) - - 2,329)at September 30, 2015 5,883 32,091) - 3,150 41,124)net book valuesat September 30, 2015 1,253,117 418,463) 24,493 - 1,696,073)at September 30, 2014 1,259,000 412,167) 24,493 1,890 1,697,550)
AR_2015_16_210x280_2part_Mise en page 1 1/22/16 4:19 PM Page 71
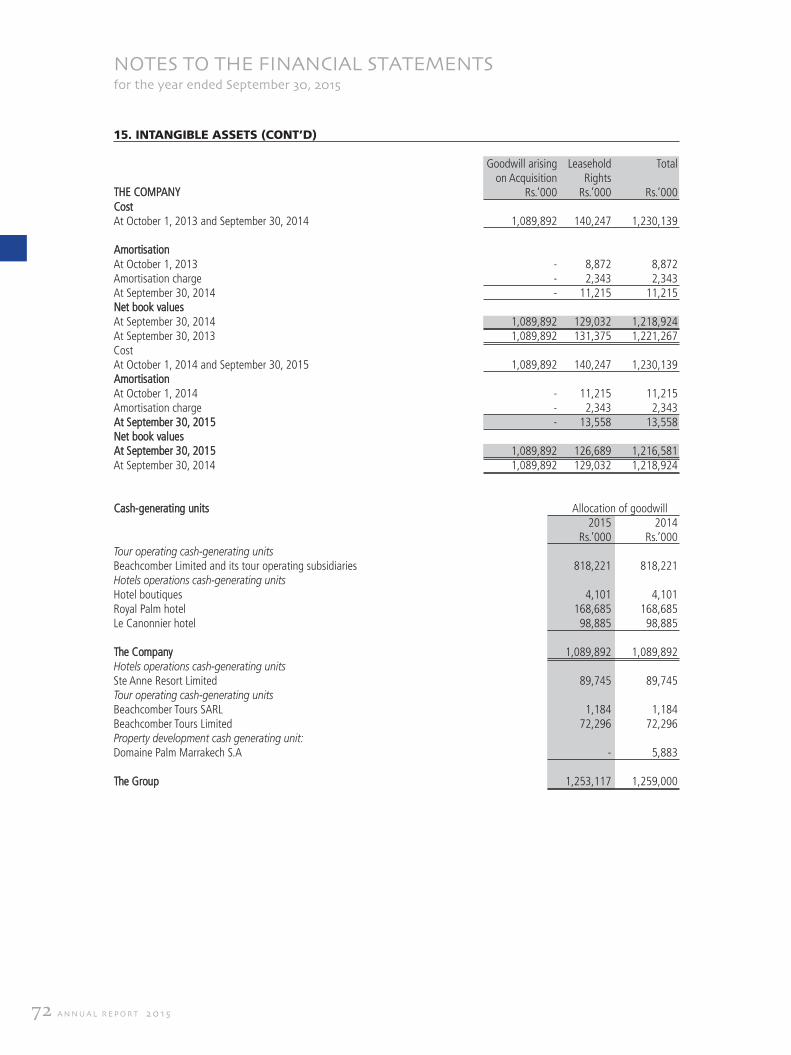
72 a n n u a l r e p o r t 2 0 1 5
notes to the financial statementsfor the year ended september 30, 2015
15. INTANGIBLE ASSETS (CONT’D)
Goodwill arising leasehold totalon acquisition rights
the company rs.’000 rs.’000 rs.’000cost at october 1, 2013 and September 30, 2014 1,089,892 140,247 1,230,139
amortisationat october 1, 2013 - 8,872 8,872 amortisation charge - 2,343 2,343 at September 30, 2014 - 11,215 11,215 net book valuesat September 30, 2014 1,089,892 129,032 1,218,924 at September 30, 2013 1,089,892 131,375 1,221,267 cost at october 1, 2014 and September 30, 2015 1,089,892 140,247 1,230,139 amortisationat october 1, 2014 - 11,215 11,215 amortisation charge - 2,343 2,343 at September 30, 2015 - 13,558 13,558 net book valuesat September 30, 2015 1,089,892 126,689 1,216,581 at September 30, 2014 1,089,892 129,032 1,218,924
cash-generating units allocation of goodwill 2015 2014
rs.’000 rs.’000Tour operating cash-generating unitsBeachcomber limited and its tour operating subsidiaries 818,221 818,221Hotels operations cash-generating unitshotel boutiques 4,101 4,101royal palm hotel 168,685 168,685le canonnier hotel 98,885 98,885
the company 1,089,892 1,089,892Hotels operations cash-generating unitsSte anne resort limited 89,745 89,745 Tour operating cash-generating unitsBeachcomber tours Sarl 1,184 1,184 Beachcomber tours limited 72,296 72,296 Property development cash generating unit:domaine palm marrakech S.a - 5,883
the Group 1,253,117 1,259,000
AR_2015_16_210x280_2part_Mise en page 1 1/22/16 4:19 PM Page 72

73n e w m a u r i t i u s h o t e l s l i m i t e d
15. INTANGIBLE ASSETS (CONT’D)
each cash-generating unit represents a business operation and is the lowest level within the Group at which the goodwill is monitoredfor internal management purposes.
domaine palm marrakech S.athe recoverable amount for domaine palm marrakech S.a has been determined using discounted cash flow techniques. this method usesapproved cash flow budgets by the Board of directors. in preparing the financial forecasts, the Board has taken into consideration theimpact of the global economic situation on the sale of villas, the opening of the royal palm marrakech hotel and existing market data.
Key assumptions used in recoverable amount calculationsthe recoverable amount of domaine palm marrakech S.a. is most sensitive to the following assumptions:
completion of phases 1, 2 and 3 of the sale of villas within timeframe:phase 1, consisting of the sale and delivery of 93 villas, is expected to be completed by 30 September 2018 while phase 2 is expected tobring an additional eur 31.5m approximately in the years ending 30 September 2015 to 2022 with the sale of 59 villas. phase 3 willconsist of the sale and delivery of 140 villas and is expected to be completed beyond 2025. marketing of villas for phase 2 has alreadystarted whilst for phase 3 is expected to begin in 2020.
maintaining selling price and gross margins on villas:average selling prices and gross margins for phase 1 villa sales are based on existing rack prices and average margins achieved in pastyears. Selling prices, margins and contribution on sales of villas in phase 2 and 3 are expected to increase compared to phase 1 so as tobring an additional eur 31.5m approximately and eur 46.2m net cash flows respectively to the project.
discount rates:discount rates represent the current market assessment of the risks specific to a cash generating unit, taking into consideration the timevalue of money and individual risks of the underlying assets that have not been incorporated in the cash flow estimates. the discount rate(15%) calculation is based on the specific circumstances of the Group and is derived from its weighted average cost of capital (Wacc).the Wacc takes into account both debt and equity. the cost of equity is derived from the expected return on investment by the Group’sinvestors. the cost of debt is based on the interest bearing borrowings the Group is obliged to service.
impairment and sensitivity of changes in assumptions:in the light of events in paris and in the middle east, low sales volume coupled with delays in villas construction, the Board of directorsdecided to adopt a very conservative approach in the forecasts for the sale of villas. the Board has therefore considered it prudent to impair goodwill in domaine palm marrakech at Group level, and part of its investment and inter company balance receivable from the moroccan subsidiary at company level to account for a potential downturn. the goodwill amount to rs 5.8m was fully impaired atGroup level. the impairment of investment and inter company balance receivables amounted to rs 740.7m and rs 759.3m respectively(refer to notes 16 and 31) at company level.the directors have used prudent assumptions in preparing the financial forecast but recognise that downward pressure on sales pricesand/or margins and delays in receiving revenue from sales of villas can have a further significant impact on the recoverable value of the project.
all other cash Generating unitsfor the other cGus apart from domaine palm marrakech S.a, the recoverable amount has been determined based on a enterprisevalue/revenue multiple basis using quoted prices of identical units in mauritius. Where necessary, discounts from 10% to 30% have beenapplied to adjust for difference in size, risks and geographical markets. the financial performance of the company was also used to assessthe recoverable amount.
(a) leasehold rightsthe leasehold rights comprise cost of leases acquired for part of Ste anne island in Seychelles, les Salines pilot in Black river, mauritiusand costs associated with the exchange of land with the Government of mauritius relating to road diversion at trou aux Biches. the leasehold rights are amortised over the respective lease period which ranges from 25 to 60 years.
(b) patentpatent represents cost of acquisition of "White Sand tours" trademark in 2011. it has an indefinite useful life. as at September 30, 2015,the patent were tested for impairment and no indication of impairment was noted.
(c) licenceslicences are amortised over a period of five years.
AR_2015_16_210x280_2part_Mise en page 1 1/22/16 4:19 PM Page 73

74 a n n u a l r e p o r t 2 0 1 5
AR_2015_16_210x280_2part_Mise en page 1 1/22/16 4:19 PM Page 74
75n e w m a u r i t i u s h o t e l s l i m i t e d
AR_2015_16_210x280_2part_Mise en page 1 1/22/16 4:19 PM Page 75

76 a n n u a l r e p o r t 2 0 1 5
notes to the financial statementsfor the year ended september 30, 2015
16. INVESTMENT IN SUBSIDIARIES
THE COMPANY2015) 2014
rs.’000) rs.’000(a) cost (unquoted)at october 1, 7,798,406) 2,542,247additions during the year -) 5,256,159 impairment for the year (note 15) (740,673) - at September 30, 7,057,733) 7,798,406
additions for the previous year pertained to capitalisation of intercompany receivable from subsidiaries (refer to note 31); thesewere non-cash items and were excluded in the statement of cash flows.the impairment charge relates to investment in domaine palm marrakech S.a (refer to note 15).
(b) list of Subsidiariesname of corporation main business country of effective % holding
activity incorporation 2015 2014% %
Beachcomber limited Secretarial mauritius 100 100Kingfisher ltd investment mauritius 100 100Beachcomber training academy limited hotel training mauritius 100 100les Salines development ltd investment mauritius 100 100les Salines Golf and resorts limited real estate mauritius 100 100Ste anne resort limited hotel operations Seychelles 100 100Beachcomber Gold coast resort limited dormant Seychelles 100 100Beachcomber marketing (pty) ltd tour operating South africa 51 51Beachcomber tours Sarl tour operating france 100 100holiday marketing (pty) ltd tour operating australia 75 75Beachcomber tours limited tour operating england 100 100new mauritius hotel - italia Srl tour operating italy 100 100Wild africa Safari ltd dormant england 100 100Beachcomber holidays limited dormant england 100 100Beachcomber hotel marrakech S.a. investment morocco 100 100Beachcomber hotel S.a. hotel operations morocco 100 100domaine palm marrakech S.a. property development morocco 100 100White palm ltd tour operating mauritius 51 51mautourco ltd tour operating mauritius 51 51transmaurice car rental ltd car rental mauritius 51 51Societe pur Blanca investment mauritius 51 51
the operations of the subsidiaries are carried out in the countries in which they are incorporated.
there is no restriction on the ability of the above subsidiaries to transfer funds to the parent in the form of cash dividends or torepay loans.
the company took a loan of eur 10m against which it pledged its shares in Kingfisher limited which, in turn, holds 100% of Steanne resort limited.
in the current financial year, Ste anne resorts limited took a loan of eur 7.5m and the company acted as a guarantor for theeur 7.5m and pledged shares owned in Kingfisher limited. the company also acted as guarantor and pledged its own assets foran eur 1.5m loan taken by Ste anne resorts limited.
AR_2015_16_210x280_2part_Mise en page 1 1/22/16 4:19 PM Page 76
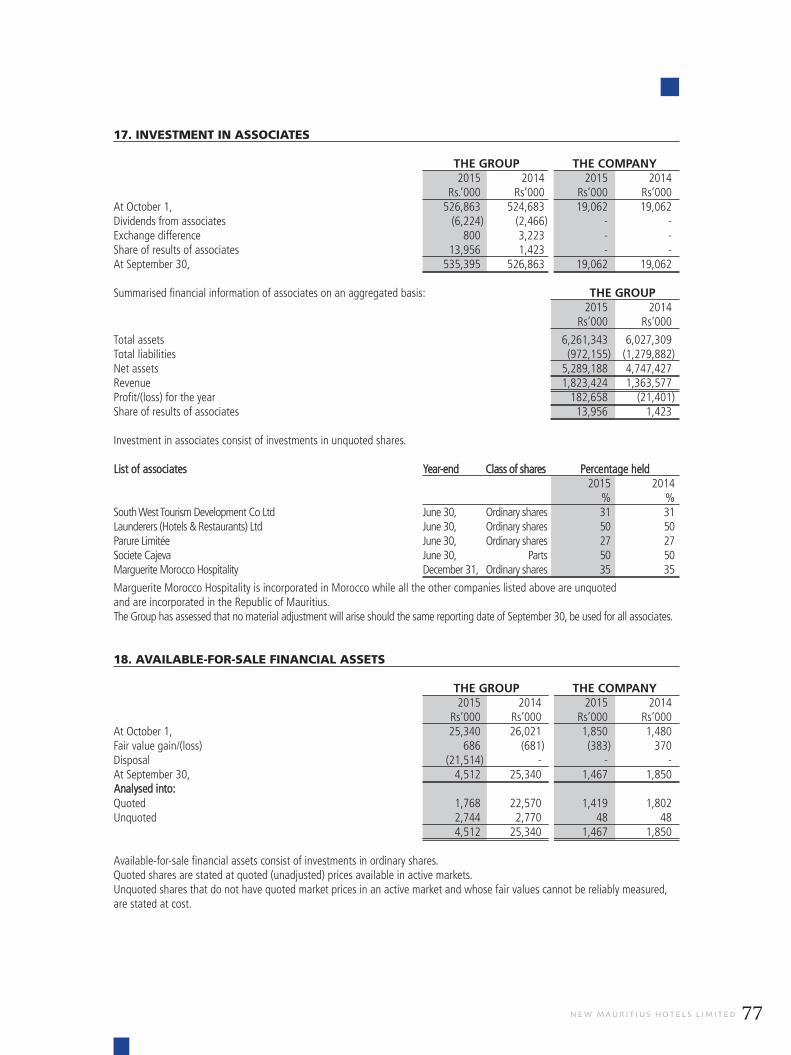
77n e w m a u r i t i u s h o t e l s l i m i t e d
17. INVESTMENT IN ASSOCIATES
THE GROUP THE COMPANY2015) 2014) 2015) 2014)
rs.’000) rs’000) rs’000) rs’000)at october 1, 526,863) 524,683) 19,062) 19,062)dividends from associates (6,224) (2,466) -) -)exchange difference 800) 3,223) -) -)Share of results of associates 13,956) 1,423) -) -)at September 30, 535,395) 526,863) 19,062) 19,062)
Summarised financial information of associates on an aggregated basis: THE GROUP2015) 2014)
rs’000) rs’000)
total assets 6,261,343) 6,027,309)total liabilities (972,155) (1,279,882)net assets 5,289,188) 4,747,427)revenue 1,823,424) 1,363,577)profit/(loss) for the year 182,658) (21,401)Share of results of associates 13,956) 1,423)
investment in associates consist of investments in unquoted shares.
list of associates year-end class of shares percentage held2015 2014
% %South West tourism development co ltd June 30, ordinary shares 31 31launderers (hotels & restaurants) ltd June 30, ordinary shares 50 50parure limitée June 30, ordinary shares 27 27Societe cajeva June 30, parts 50 50marguerite morocco hospitality december 31, ordinary shares 35 35
marguerite morocco hospitality is incorporated in morocco while all the other companies listed above are unquoted and are incorporated in the republic of mauritius. the Group has assessed that no material adjustment will arise should the same reporting date of September 30, be used for all associates.
18. AVAILABLE-FOR-SALE FINANCIAL ASSETS
THE GROUP THE COMPANY2015) 2014)) 2015) 2014)
rs’000) rs’000)) rs’000) rs’000)at october 1, 25,340) 26,021)) 1,850) 1,480)fair value gain/(loss) 686) (681)) (383) 370)disposal (21,514) -)) -) -)at September 30, 4,512) 25,340)) 1,467) 1,850)analysed into:Quoted 1,768) 22,570)) 1,419) 1,802)unquoted 2,744) 2,770)) 48) 48)
4,512) 25,340)) 1,467) 1,850)
available-for-sale financial assets consist of investments in ordinary shares. Quoted shares are stated at quoted (unadjusted) prices available in active markets.unquoted shares that do not have quoted market prices in an active market and whose fair values cannot be reliably measured,are stated at cost.
AR_2015_16_210x280_2part_Mise en page 1 1/22/16 4:19 PM Page 77
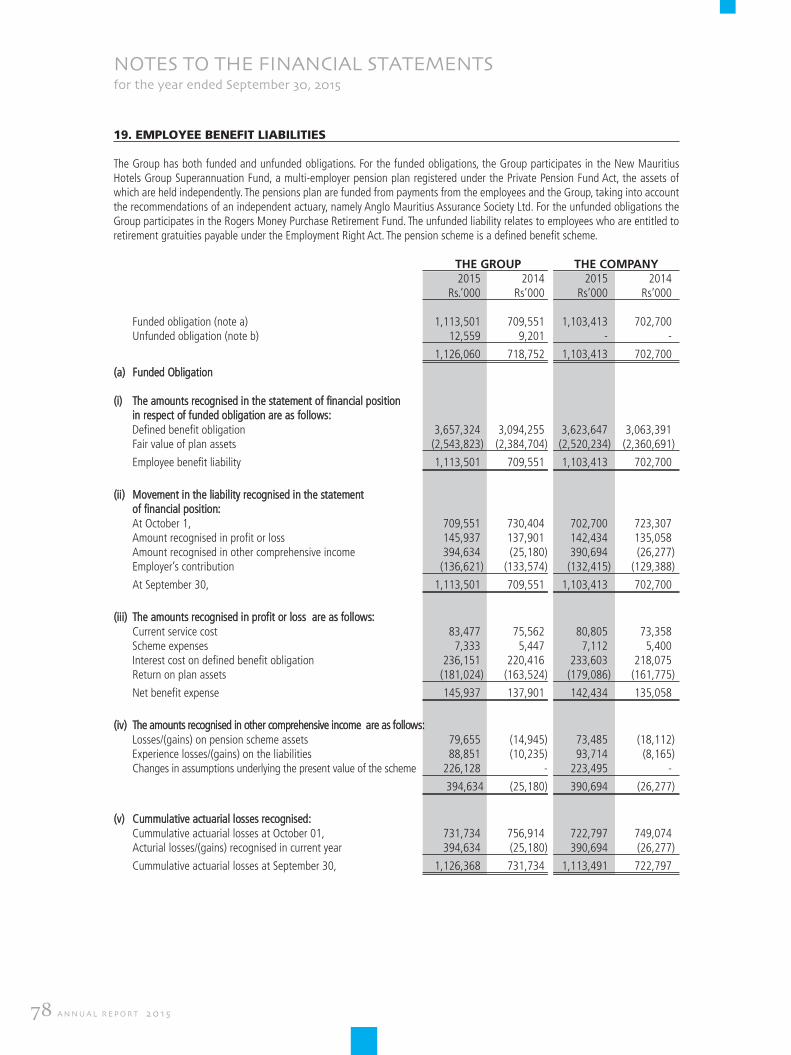
78 a n n u a l r e p o r t 2 0 1 5
notes to the financial statementsfor the year ended september 30, 2015
19. EMPLOYEE BENEFIT LIABILITIES
the Group has both funded and unfunded obligations. for the funded obligations, the Group participates in the new mauritiushotels Group Superannuation fund, a multi-employer pension plan registered under the private pension fund act, the assets ofwhich are held independently. the pensions plan are funded from payments from the employees and the Group, taking into accountthe recommendations of an independent actuary, namely anglo mauritius assurance Society ltd. for the unfunded obligations theGroup participates in the rogers money purchase retirement fund. the unfunded liability relates to employees who are entitled toretirement gratuities payable under the employment right act. the pension scheme is a defined benefit scheme.
THE GROUP THE COMPANY 2015) 2014) 2015) 2014)
rs.’000) rs’000) rs’000) rs’000)
funded obligation (note a) 1,113,501) 709,551) 1,103,413) 702,700)unfunded obligation (note b) 12,559) 9,201) -) -)
1,126,060) 718,752) 1,103,413) 702,700)
(a) funded obligation
(i) the amounts recognised in the statement of financial position in respect of funded obligation are as follows:defined benefit obligation 3,657,324) 3,094,255) 3,623,647) 3,063,391)fair value of plan assets (2,543,823) (2,384,704) (2,520,234) (2,360,691)
employee benefit liability 1,113,501) 709,551) 1,103,413) 702,700)
(ii) movement in the liability recognised in the statement of financial position:at october 1, 709,551) 730,404) 702,700) 723,307)amount recognised in profit or loss 145,937) 137,901) 142,434) 135,058)amount recognised in other comprehensive income 394,634) (25,180) 390,694) (26,277)employer’s contribution (136,621) (133,574) (132,415) (129,388)
at September 30, 1,113,501) 709,551) 1,103,413) 702,700)
(iii) the amounts recognised in profit or loss are as follows:current service cost 83,477) 75,562) 80,805) 73,358)Scheme expenses 7,333) 5,447) 7,112) 5,400)interest cost on defined benefit obligation 236,151) 220,416) 233,603) 218,075)return on plan assets (181,024) (163,524) (179,086) (161,775)
net benefit expense 145,937) 137,901) 142,434) 135,058)
(iv) the amounts recognised in other comprehensive income are as follows:losses/(gains) on pension scheme assets 79,655) (14,945) 73,485) (18,112)experience losses/(gains) on the liabilities 88,851) (10,235) 93,714) (8,165)changes in assumptions underlying the present value of the scheme 226,128) - 223,495) -)
394,634 (25,180) 390,694) (26,277)
(v) cummulative actuarial losses recognised:cummulative actuarial losses at october 01, 731,734) 756,914) 722,797) 749,074)acturial losses/(gains) recognised in current year 394,634) (25,180) 390,694) (26,277)
cummulative actuarial losses at September 30, 1,126,368) 731,734) 1,113,491) 722,797)
AR_2015_16_210x280_2part_Mise en page 1 1/22/16 4:19 PM Page 78
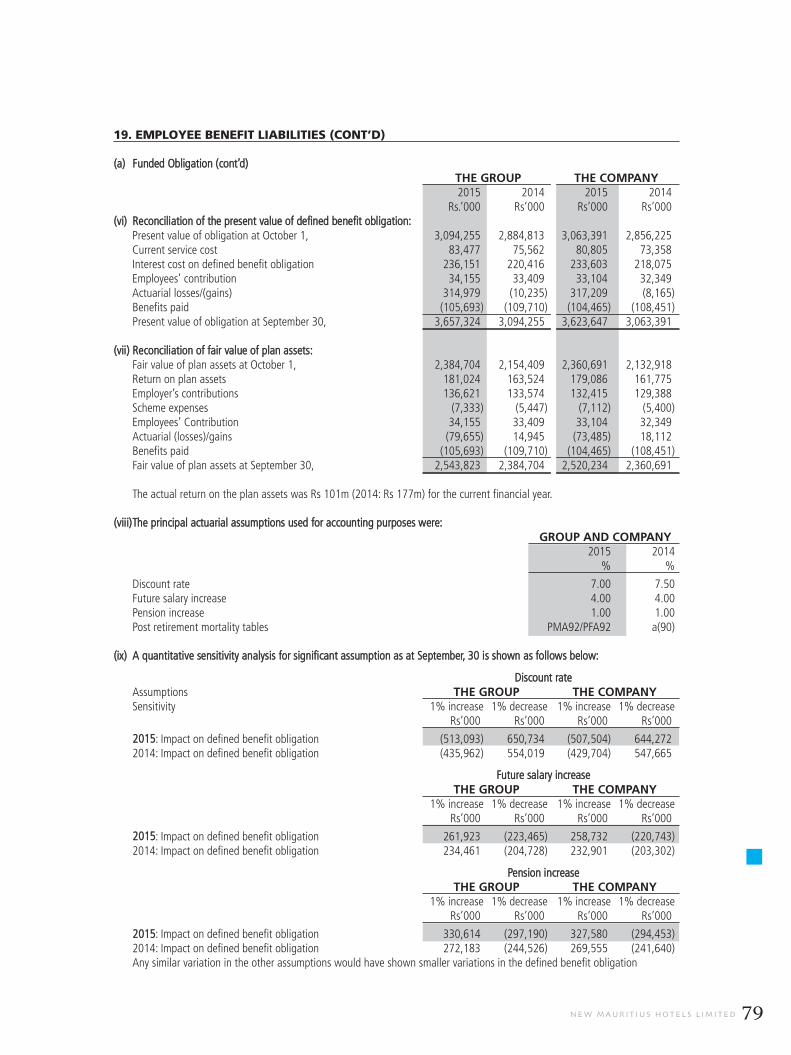
79n e w m a u r i t i u s h o t e l s l i m i t e d
19. EMPLOYEE BENEFIT LIABILITIES (CONT’D)
(a) funded obligation (cont’d)THE GROUP THE COMPANY 2015) 2014) 2015) 2014)
rs.’000) rs’000) rs’000) rs’000)(vi) reconciliation of the present value of defined benefit obligation:
present value of obligation at october 1, 3,094,255) 2,884,813) 3,063,391) 2,856,225)current service cost 83,477) 75,562) 80,805) 73,358)interest cost on defined benefit obligation 236,151) 220,416) 233,603) 218,075)employees’ contribution 34,155) 33,409) 33,104) 32,349)actuarial losses/(gains) 314,979) (10,235) 317,209) (8,165)Benefits paid (105,693) (109,710) (104,465) (108,451)present value of obligation at September 30, 3,657,324) 3,094,255) 3,623,647) 3,063,391)
(vii) reconciliation of fair value of plan assets:fair value of plan assets at october 1, 2,384,704) 2,154,409) 2,360,691) 2,132,918)return on plan assets 181,024) 163,524) 179,086) 161,775)employer’s contributions 136,621) 133,574) 132,415) 129,388)Scheme expenses (7,333) (5,447) (7,112) (5,400)employees’ contribution 34,155) 33,409) 33,104) 32,349)actuarial (losses)/gains (79,655) 14,945) (73,485) 18,112)Benefits paid (105,693) (109,710) (104,465) (108,451)fair value of plan assets at September 30, 2,543,823) 2,384,704) 2,520,234) 2,360,691)
the actual return on the plan assets was rs 101m (2014: rs 177m) for the current financial year.
(viii)the principal actuarial assumptions used for accounting purposes were:GROUP AND COMPANY
2015 2014 % %
discount rate 7.00 7.50future salary increase 4.00 4.00pension increase 1.00 1.00post retirement mortality tables pma92/pfa92 a(90)
(ix) a quantitative sensitivity analysis for significant assumption as at September, 30 is shown as follows below:
discount rateassumptions THE GROUP THE COMPANYSensitivity 1% increase 1% decrease 1% increase 1% decrease
rs’000) rs’000) rs’000) rs’000)
2015: impact on defined benefit obligation (513,093) 650,734) (507,504) 644,272)2014: impact on defined benefit obligation (435,962) 554,019) (429,704) 547,665)
future salary increaseTHE GROUP THE COMPANY
1% increase 1% decrease 1% increase 1% decreasers’000) rs’000) rs’000) rs’000)
2015: impact on defined benefit obligation 261,923) (223,465) 258,732) (220,743)2014: impact on defined benefit obligation 234,461) (204,728) 232,901) (203,302)
pension increaseTHE GROUP THE COMPANY
1% increase 1% decrease 1% increase 1% decreasers’000) rs’000) rs’000) rs’000)
2015: impact on defined benefit obligation 330,614) (297,190) 327,580) (294,453)2014: impact on defined benefit obligation 272,183) (244,526) 269,555) (241,640)any similar variation in the other assumptions would have shown smaller variations in the defined benefit obligation
AR_2015_16_210x280_2part_Mise en page 1 1/22/16 4:19 PM Page 79
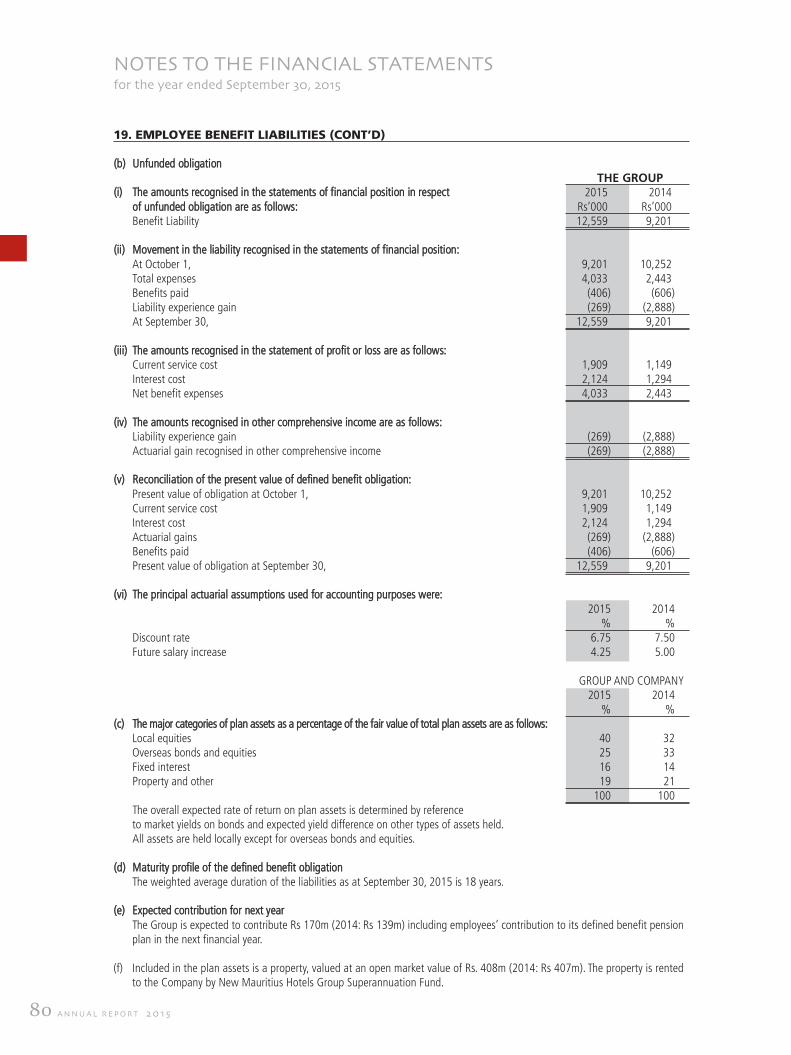
80 a n n u a l r e p o r t 2 0 1 5
notes to the financial statementsfor the year ended september 30, 2015
19. EMPLOYEE BENEFIT LIABILITIES (CONT’D)
(b) unfunded obligationTHE GROUP
(i) the amounts recognised in the statements of financial position in respect 2015) 2014)of unfunded obligation are as follows: rs’000) rs’000)Benefit liability 12,559) 9,201)
(ii) movement in the liability recognised in the statements of financial position:at october 1, 9,201) 10,252)total expenses 4,033) 2,443)Benefits paid (406) (606)liability experience gain (269) (2,888)at September 30, 12,559) 9,201)
(iii) the amounts recognised in the statement of profit or loss are as follows:current service cost 1,909) 1,149)interest cost 2,124) 1,294)net benefit expenses 4,033) 2,443)
(iv) the amounts recognised in other comprehensive income are as follows:liability experience gain (269) (2,888)actuarial gain recognised in other comprehensive income (269) (2,888)
(v) reconciliation of the present value of defined benefit obligation:present value of obligation at october 1, 9,201) 10,252)current service cost 1,909) 1,149)interest cost 2,124) 1,294)actuarial gains (269) (2,888)Benefits paid (406) (606)present value of obligation at September 30, 12,559) 9,201)
(vi) the principal actuarial assumptions used for accounting purposes were:2015 2014
% %discount rate 6.75 7.50 future salary increase 4.25 5.00
Group and company 2015 2014
% % (c) the major categories of plan assets as a percentage of the fair value of total plan assets are as follows:
local equities 40 32 overseas bonds and equities 25 33 fixed interest 16 14 property and other 19 21
100 100 the overall expected rate of return on plan assets is determined by reference to market yields on bonds and expected yield difference on other types of assets held.all assets are held locally except for overseas bonds and equities.
(d) maturity profile of the defined benefit obligationthe weighted average duration of the liabilities as at September 30, 2015 is 18 years.
(e) expected contribution for next yearthe Group is expected to contribute rs 170m (2014: rs 139m) including employees’ contribution to its defined benefit pensionplan in the next financial year.
(f) included in the plan assets is a property, valued at an open market value of rs. 408m (2014: rs 407m). the property is rentedto the company by new mauritius hotels Group Superannuation fund.
AR_2015_16_210x280_2part_Mise en page 1 1/22/16 4:19 PM Page 80
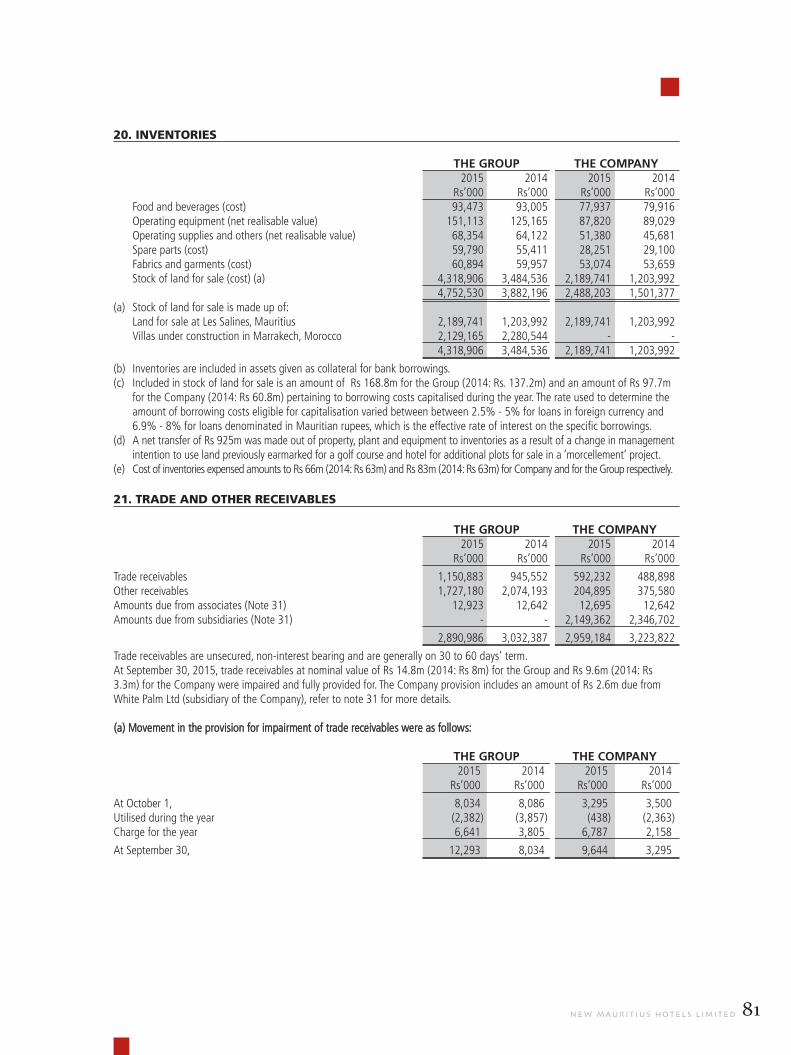
81n e w m a u r i t i u s h o t e l s l i m i t e d
20. INVENTORIES
THE GROUP THE COMPANY 2015 2014 2015 2014
rs’000 rs’000 rs’000 rs’000food and beverages (cost) 93,473 93,005 77,937 79,916 operating equipment (net realisable value) 151,113 125,165 87,820 89,029 operating supplies and others (net realisable value) 68,354 64,122 51,380 45,681 Spare parts (cost) 59,790 55,411 28,251 29,100 fabrics and garments (cost) 60,894 59,957 53,074 53,659 Stock of land for sale (cost) (a) 4,318,906 3,484,536 2,189,741 1,203,992
4,752,530 3,882,196 2,488,203 1,501,377(a) Stock of land for sale is made up of:
land for sale at les Salines, mauritius 2,189,741 1,203,992 2,189,741 1,203,992 Villas under construction in marrakech, morocco 2,129,165 2,280,544 - -
4,318,906 3,484,536 2,189,741 1,203,992
(b) inventories are included in assets given as collateral for bank borrowings.(c) included in stock of land for sale is an amount of rs 168.8m for the Group (2014: rs. 137.2m) and an amount of rs 97.7m
for the company (2014: rs 60.8m) pertaining to borrowing costs capitalised during the year. the rate used to determine theamount of borrowing costs eligible for capitalisation varied between between 2.5% - 5% for loans in foreign currency and6.9% - 8% for loans denominated in mauritian rupees, which is the effective rate of interest on the specific borrowings.
(d) a net transfer of rs 925m was made out of property, plant and equipment to inventories as a result of a change in managementintention to use land previously earmarked for a golf course and hotel for additional plots for sale in a ‘morcellement’ project.
(e) cost of inventories expensed amounts to rs 66m (2014: rs 63m) and rs 83m (2014: rs 63m) for company and for the Group respectively.
21. TRADE AND OTHER RECEIVABLES
THE GROUP THE COMPANY2015 2014 2015 2014
rs’000 rs’000 rs’000 rs’000
trade receivables 1,150,883 945,552 592,232 488,898 other receivables 1,727,180 2,074,193 204,895 375,580 amounts due from associates (note 31) 12,923 12,642 12,695 12,642 amounts due from subsidiaries (note 31) - - 2,149,362 2,346,702
2,890,986 3,032,387 2,959,184 3,223,822
trade receivables are unsecured, non-interest bearing and are generally on 30 to 60 days’ term.at September 30, 2015, trade receivables at nominal value of rs 14.8m (2014: rs 8m) for the Group and rs 9.6m (2014: rs3.3m) for the company were impaired and fully provided for. the company provision includes an amount of rs 2.6m due fromWhite palm ltd (subsidiary of the company), refer to note 31 for more details.
(a) movement in the provision for impairment of trade receivables were as follows:
THE GROUP THE COMPANY2015) 2014) 2015) 2014)
rs’000) rs’000) rs’000) rs’000)
at october 1, 8,034) 8,086) 3,295) 3,500)utilised during the year (2,382) (3,857) (438) (2,363)charge for the year 6,641) 3,805) 6,787) 2,158)
at September 30, 12,293) 8,034) 9,644) 3,295)
AR_2015_16_210x280_2part_Mise en page 1 1/22/16 4:19 PM Page 81

82 a n n u a l r e p o r t 2 0 1 5
AR_2015_16_210x280_2part_Mise en page 1 1/22/16 4:19 PM Page 82
83n e w m a u r i t i u s h o t e l s l i m i t e d
AR_2015_16_210x280_2part_Mise en page 1 1/22/16 4:19 PM Page 83

84 a n n u a l r e p o r t 2 0 1 5
notes to the financial statementsfor the year ended september 30, 2015
21. TRADE AND OTHER RECEIVABLES (CONT’D)
(b) at September 30, the ageing analysis of trade receivables were as follows:
neither pastdue nor past due but not impaired
total impaired < 30 days 30 - 60 days 61 - 90 days > 90 daysrs’000 rs’000 rs’000 rs’000 rs’000 rs’000
Group2015 1,150,883 718,793 258,106 78,519 32,130 63,335
2014 945,552 806,366 83,435 9,924 16,237 29,590
company2015 592,232 400,465 105,554 41,081 15,645 29,4872014 488,898 333,582 113,148 23,725 1,408 17,035
(c) other receivables are unsecured and are neither past due nor impaired. included in other receivables are mainly advancesmade to suppliers.
(d) as at September 30, 2015, amounts due from subsidiaries at a nominal value of rs 759.3m (2014: nil).for terms and conditions pertaining to related party receivables, refer to note 31.
22. CASH AND CASH EQUIVALENTS
(a) for the purposes of the statements of cash flows, the cash and cash equivalents comprise the following:THE GROUP THE COMPANY2015) 2014) 2015) 2014)
rs’000) rs’000) rs’000) rs’000)cash in hand and at banks 809,367) 801,277) 273,062) 58,084)Bank overdrafts (note 25) (2,268,912) (2,997,163) (2,132,709) (2,748,817)
(1,459,545) (2,195,886) (1,859,647) (2,690,733)
cash at bank earns interest at floating rates based on daily bank deposit rates. the fair value of cash is rs 809.3m (2014: rs 801m)for the Group and rs 273m (2014: rs 58m) for the company respectively.
(b) non-cash transactionsin the prior year, the principal non-cash transaction consisted of amount due for the renovation of royal palm hotel amounting to rs 249m (the Group and the company). this amount was excluded from ‘purchase of property, plant and equipment’ disclosedunder investing activities for the purpose of statement of cash flows. there were no such outstanding balances at year end.at September 30, 2015, the Group and company had available undrawn loan facilities of rs 500m (2014: nil) and rs 48m (2014: nil)respectively. undrawn overdraft facilities amounted to rs 836m (2014: nil) for both Group and company.
23. STATED CAPITAL
THE GROUP ANDTHE COMPANY
2015 2014rs’000 rs’000
authorised500,000,000 ordinary shares at no par value 5,000,000 5,000,000 issued and fully paid484,270,608 ordinary shares at no par value (2014: 161,423,536 ordinary shares) 5,000,000 1,724,361
the company made a bonus issue of two ordinary shares for each ordinary share of the company on 12 June 2015, totalling to 322,847,072 new ordinary shares. the primary purpose of the bonus issue was to improve the liquidity of the company’s shares on the Stock exchange of mauritius.an amount of rs 3,275,639,000 was capitalised out of revaluation reserve and used for distribution of the bonus issue, following which,the issued share capital of the company amounted to rs 5,000,000,000 consisting of 484,270,608 ordinary shares with no par value.
AR_2015_16_210x280_2part_Mise en page 1 1/22/16 4:19 PM Page 84

85n e w m a u r i t i u s h o t e l s l i m i t e d
24. OTHER COMPONENTS OF EQUITY
Nature and purpose of reserves THE GROUP THE COMPANY2015) 2014) 2015) 2014)
rs’000) rs’000) rs’000) rs’000)
Other reserves 624,583) 624,583) -) -)these reserves are principally used to record the fair value adjustments relating to shares issued by the company to acquire all non-controlling interests in local subsidiaries and the movement in the reserves of the associates.Available-for-sale financial assets reserve 10,970) 13,878) 556) 939)the fair value reserve is principally used to record the fair value adjustment relating to available-for-sale financial assets.Revaluation reserve 2,453,913) 5,443,715) 1,214,847) 4,448,618)the revaluation reserve is principally used to record changes in fair value of freehold land and buildings following revaluation exercises performed by an independent surveyor. it is also used to record impairment losses to the extent that such losses relate to increases on the same asset previously recognised in revaluation reserve.*Foreign exchange difference reserves (1,183,733) (1,472,143) -) -)these reserves include exchange differences arising on retranslation of the financial statements of foreign subsidiaries and loss or gain arising on cash flow hedges.total other components of equity 1,905,733) 4,610,033) 1,215,403) 4,449,557)
25. BORROWINGS
THE GROUP THE COMPANY 2015 2014 2015 2014
rs’000 rs’000 rs’000 rs’000
current portionBank overdrafts (note (a)) 2,268,912 2,997,163 2,132,709 2,748,817 term loans (note (b)) 2,253,171 3,374,130 2,084,199 3,355,804 obligations under finance leases (note (c)) 117,816 91,828 95,981 71,119 debentures (note (d)) 466,740 623,674 466,740 623,674
5,106,639 7,086,795 4,779,629 6,799,414
non-current portionterm loans (note (b)) 9,364,252 8,742,182 8,775,956 8,268,304 obligations under finance leases (note (c)) 228,584 226,447 198,455 195,933 debentures (note (d)) 808,903 462,337 808,903 462,337 convertible preference shares (e) 1,755,115 - 1,755,115 -
12,156,854 9,430,966 11,538,429 8,926,574
total borrowings 17,263,493 16,517,761 16,318,058 15,725,988
(a) Bank overdraftsthe bank overdrafts are secured by floating charges on the assets of the individual companies of the Group. the rates of interestvary between 5% and 8% per annum.(b) term loans THE GROUP THE COMPANY
2015 2014 2015 2014rs’000 rs’000 rs’000 rs’000
term loans can be analysed as follows:Current - Within one year 2,253,171 3,374,130 2,084,199 3,355,804 Non-current - after one year and before two years 814,103 1,863,254 725,487 1,799,251
- after two years and before five years 5,845,658 4,445,187 5,518,811 4,230,173 - after five years 2,704,491 2,433,741 2,531,658 2,238,880
9,364,252 8,742,182 8,775,956 8,268,304 11,617,423 12,116,312 10,860,155 11,624,108
* an amount of rs 3,275,639,000 was capitalised out of revaluation reserve and use for distribution of the bonus issue.
AR_2015_16_210x280_2part_Mise en page 1 1/22/16 4:19 PM Page 85

86 a n n u a l r e p o r t 2 0 1 5
notes to the financial statementsfor the year ended september 30, 2015
25. BORROWINGS (CONT’D)
(b) term loans (cont’d)
terms loans are denominated as follows:effective THE GROUP THE COMPANY
interest rate 2015 2014 2015 2014% maturity rs’000 rs’000 rs’000 rs’000
denominated in:mauritian rupees 6.50% - 7% on demand - 121,879 - 121,879 mauritian rupees 6.50% - 8.40% 2015-2025 8,285,151 8,588,525 8,285,151 8,588,525 euro euro liBor +2.50% on demand 319,280 631,840 319,280 631,840 euro euro liBor + (2.50% to 5%) 2016-2025 1,917,957 1,970,059 1,814,930 1,867,577 euro euriBor + (3.50% to 4.5%) 2017-2020 290,476 120,247 290,476 120,247 uSd 5.00% 2015 150,318 40,690 150,318 40,690 GBp 5.75% 2015 - 253,350 - 253,350 mad 6.5%-7.0% 2016-2024 654,241 389,722 - -
11,617,423 12,116,312 10,860,155 11,624,108
the term loans are secured by fixed and floating charges over the Group’s assets.the term loans include loans totalling eur 8.7m (2014: eur 1.5m) from Ste anne resorts limited and loans amounting tors 835.9m (2014:rs 729.7m) to Beachcomber limited. the loan from new mauritius hotels Group Superannuation fund wasfully repaid (see note 31).the company is still in breach of its covenants with one bank. it will honour the loan in the next financial year as per the repayment plan and has therefore classified it under current liability. the company has undergone a financial reengineering program which alleviated cash flow pressures. Several existing loans wererescheduled to longer terms to reduce the mismatch between the company’s cash inflows and the repayment profile of the loans.
(c) obligations under finance leases THE GROUP THE COMPANY2015) 2014) 2015) 2014)
rs’000) rs’000) rs’000) rs’000)minimum lease payments:- Within one year 140,428) 113,442) 114,871) 89,454)- after one year and before two years 111,480) 106,137) 92,067) 88,426)- after two years and before five years 141,454) 144,886) 128,505) 129,852)- after five years -) 1,734) -) -)
393,362) 366,199) 335,443) 307,732)less: future finance charges on obligations under finance leases (46,962) (47,924) (41,007) (40,680)present value of obligations under finance leases 346,400) 318,275) 294,436) 267,052)present value analysed as follows:Current - Within one year 117,816) 91,828) 95,981) 71,119)Non-current - after one year and before two years 97,953) 91,828) 80,047) 76,212)
- after two years and before five years 130,631) 133,010) 118,408) 119,721)- after five years -) 1,609) -) -)
228,584) 226,447) 198,455) 195,933)346,400) 318,275) 294,436) 267,052)
lease liabilities are effectively secured as the rights to the leased assets revert to the lessor in the event of default.
(d) debentures THE GROUP THE COMPANY2015 2014 2015 2014
rs’000 rs’000 rs’000 rs’000term debentures can be analysed as follows:Current - Within one year 466,740 623,674 466,740 623,674 Non-current - after one year and before two years 100,074 462,337 100,074 462,337
- after two years and before five years 708,829 - 708,829 - 808,903 462,337 808,903 462,337
1,275,643 1,086,011 1,275,643 1,086,011
AR_2015_16_210x280_2part_Mise en page 1 1/22/16 4:19 PM Page 86
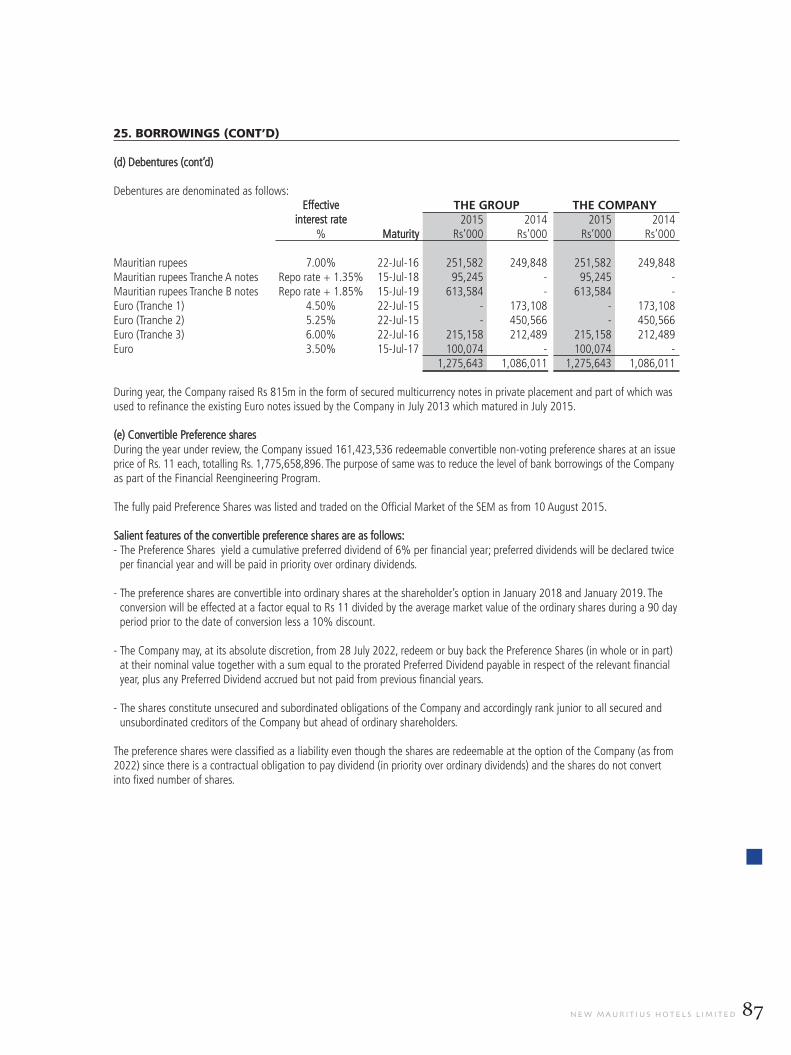
87n e w m a u r i t i u s h o t e l s l i m i t e d
25. BORROWINGS (CONT’D)
(d) debentures (cont’d)
debentures are denominated as follows:effective THE GROUP THE COMPANY
interest rate 2015 2014 2015 2014% maturity rs’000 rs’000 rs’000 rs’000
mauritian rupees 7.00% 22-Jul-16 251,582 249,848 251,582 249,848 mauritian rupees tranche a notes repo rate + 1.35% 15-Jul-18 95,245 - 95,245 - mauritian rupees tranche B notes repo rate + 1.85% 15-Jul-19 613,584 - 613,584 - euro (tranche 1) 4.50% 22-Jul-15 - 173,108 - 173,108 euro (tranche 2) 5.25% 22-Jul-15 - 450,566 - 450,566 euro (tranche 3) 6.00% 22-Jul-16 215,158 212,489 215,158 212,489 euro 3.50% 15-Jul-17 100,074 - 100,074 -
1,275,643 1,086,011 1,275,643 1,086,011
during year, the company raised rs 815m in the form of secured multicurrency notes in private placement and part of which wasused to refinance the existing euro notes issued by the company in July 2013 which matured in July 2015.
(e) convertible preference shares during the year under review, the company issued 161,423,536 redeemable convertible non-voting preference shares at an issueprice of rs. 11 each, totalling rs. 1,775,658,896. the purpose of same was to reduce the level of bank borrowings of the companyas part of the financial reengineering program.
the fully paid preference Shares was listed and traded on the official market of the Sem as from 10 august 2015.
Salient features of the convertible preference shares are as follows:- the preference Shares yield a cumulative preferred dividend of 6% per financial year; preferred dividends will be declared twice
per financial year and will be paid in priority over ordinary dividends.
- the preference shares are convertible into ordinary shares at the shareholder’s option in January 2018 and January 2019. theconversion will be effected at a factor equal to rs 11 divided by the average market value of the ordinary shares during a 90 dayperiod prior to the date of conversion less a 10% discount.
- the company may, at its absolute discretion, from 28 July 2022, redeem or buy back the preference Shares (in whole or in part)at their nominal value together with a sum equal to the prorated preferred dividend payable in respect of the relevant financialyear, plus any preferred dividend accrued but not paid from previous financial years.
- the shares constitute unsecured and subordinated obligations of the company and accordingly rank junior to all secured andunsubordinated creditors of the company but ahead of ordinary shareholders.
the preference shares were classified as a liability even though the shares are redeemable at the option of the company (as from2022) since there is a contractual obligation to pay dividend (in priority over ordinary dividends) and the shares do not convertinto fixed number of shares.
AR_2015_16_210x280_2part_Mise en page 1 1/22/16 4:19 PM Page 87
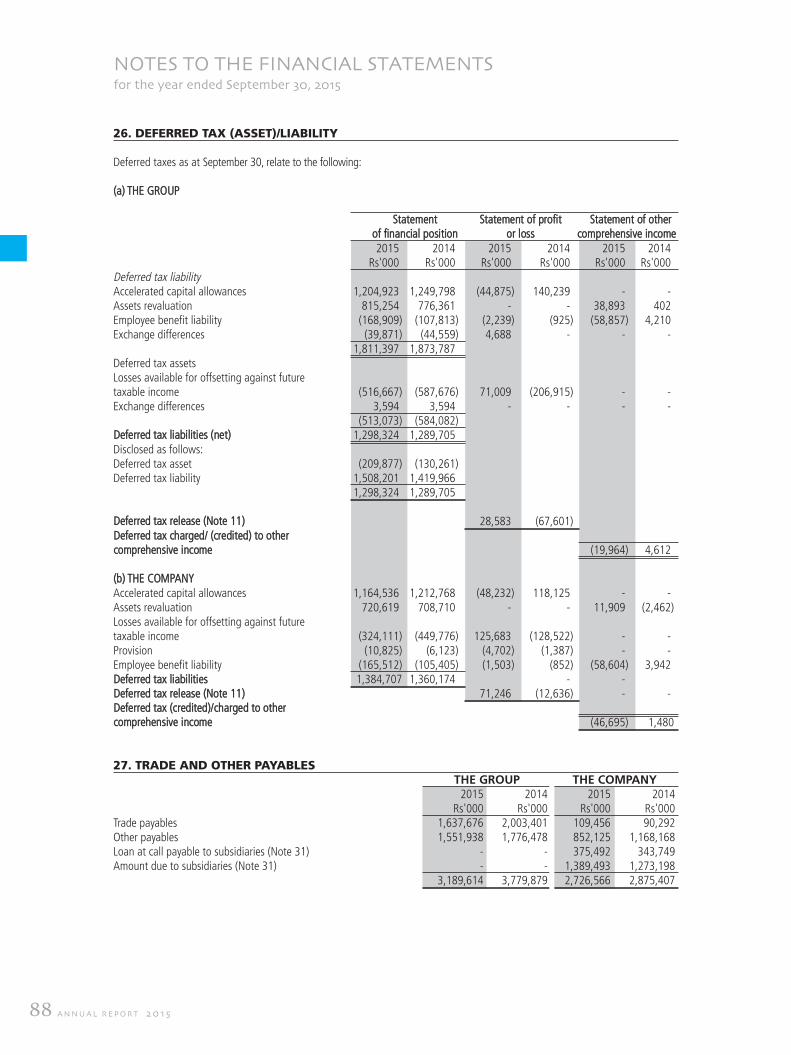
88 a n n u a l r e p o r t 2 0 1 5
notes to the financial statementsfor the year ended september 30, 2015
26. DEFERRED TAX (ASSET)/LIABILITY
deferred taxes as at September 30, relate to the following:
(a) the Group
Statement Statement of profit Statement of otherof financial position or loss comprehensive income2015) 2014) 2015) 2014) 2015) 2014)
rs'000) rs'000) rs'000) rs'000) rs'000) rs'000)deferred tax liabilityaccelerated capital allowances 1,204,923) 1,249,798) (44,875) 140,239) -) -)assets revaluation 815,254) 776,361) -) -) 38,893) 402)employee benefit liability (168,909) (107,813) (2,239) (925) (58,857) 4,210)exchange differences (39,871) (44,559) 4,688) -) -) -)
1,811,397) 1,873,787)deferred tax assetslosses available for offsetting against future taxable income (516,667) (587,676) 71,009) (206,915) -) -)exchange differences 3,594) 3,594) -) -) -) -)
(513,073) (584,082)deferred tax liabilities (net) 1,298,324) 1,289,705)disclosed as follows:deferred tax asset (209,877) (130,261)deferred tax liability 1,508,201) 1,419,966)
1,298,324) 1,289,705)
deferred tax release (note 11) 28,583) (67,601)deferred tax charged/ (credited) to other comprehensive income (19,964) 4,612)
(b) the companyaccelerated capital allowances 1,164,536) 1,212,768) (48,232) 118,125) -) -)assets revaluation 720,619) 708,710) -) -) 11,909) (2,462)losses available for offsetting against future taxable income (324,111) (449,776) 125,683) (128,522) -) -)provision (10,825) (6,123) (4,702) (1,387) -) -)employee benefit liability (165,512) (105,405) (1,503) (852) (58,604) 3,942)deferred tax liabilities 1,384,707 1,360,174) -) -)deferred tax release (note 11) 71,246) (12,636) -) -)deferred tax (credited)/charged to other comprehensive income (46,695) 1,480
27. TRADE AND OTHER PAYABLES
THE GROUP THE COMPANY2015 2014 2015 2014
rs'000 rs'000 rs'000 rs'000trade payables 1,637,676 2,003,401 109,456 90,292 other payables 1,551,938 1,776,478 852,125 1,168,168 loan at call payable to subsidiaries (note 31) - - 375,492 343,749 amount due to subsidiaries (note 31) - - 1,389,493 1,273,198
3,189,614 3,779,879 2,726,566 2,875,407
AR_2015_16_210x280_2part_Mise en page 1 1/22/16 4:19 PM Page 88

89n e w m a u r i t i u s h o t e l s l i m i t e d
27. TRADE AND OTHER PAYABLES (CONT’D)
(a) trade payables are non-interest bearing and are generally on 30 to 60 days' term.(b) the loan at call bears interest rate of 7.5% per annum.(c) for terms and conditions pertaining to related party payables, refer to note 31.
28. DIVIDENDS PAID AND PROPOSEDTHE GROUP ANDTHE COMPANY
2015 2014rs'000 rs'000
dividend expense (2014: re 1 per share) - 161,424
no dividend has been paid during the year compared to fully paid dividend for the year ended September 30, 2014.
29. COMMITMENTSTHE GROUP THE COMPANY2015 2014 2015 2014
rs'000 rs'000 rs'000 rs'000capital commitmentsles Salines project 4,050,000 1,000,000 4,050,000 1,000,000 marrakech hotel and villa project (morocco) 530,000 1,300,000 - - royal palm - 100,000 - 100,000
4,580,000 2,400,000 4,050,000 1,100,000
in prior year, les Salines project consisted of a property development of some 160 acres to be sold for residential purpose.in current year, following a change in management's intention, the project will consist of approximately 308 acres to be sold for residential purpose and for the construction of a 4 star hotel.the amount of rs 530m represents the estimated costs to complete phase 1 of marrakech project as at September 30, 2015. in prior year, the amount of rs 100m was used to complete the renovation of the royal palm in mauritius. the hotel started operation in october 2014.
operating lease commitmentsthe Group has various land leases on which the hotel buildings are constructed. future minimum rentals payable under operatingleases as at September 30, are as follows:
THE GROUP THE COMPANY2015 2014 2015 2014
rs'000 rs'000 rs'000 rs'000Within one year 89,961 89,425 77,546 77,546 after one year but not more than five years 358,686 356,381 310,184 310,184 more than five years 4,331,292 4,398,798 3,877,306 3,954,852
4,779,939 4,844,604 4,265,036 4,342,582
30.NON-CONTROLLING INTEREST
Material partly-owned subsidiaries
proportion of equity interest held by non-controlling interests:name country of incorporation 2015 2014
and operation % %mautourco ltd mauritius 49 49Beachcomber marketing (pty) ltd South africa 49 49
Accumulated balances of material non-controlling interest: rs 000 rs 000
mautourco ltd 34,578 44,902 Beachcomber marketing (pty) ltd 20,461 13,154
profit and other comprehensive income allocated to material non-controlling interest:mautourco ltd 12,812 16,732 Beachcomber marketing (pty) ltd 36,831 29,886the summarised financial information of these subsidiaries is provided below. this information is based on amounts before inter-company eliminations.
AR_2015_16_210x280_2part_Mise en page 1 1/22/16 4:19 PM Page 89

90 a n n u a l r e p o r t 2 0 1 5
AR_2015_16_210x280_2part_Mise en page 1 1/22/16 4:19 PM Page 90

91n e w m a u r i t i u s h o t e l s l i m i t e d
AR_2015_16_210x280_2part_Mise en page 1 1/22/16 4:20 PM Page 91

92 a n n u a l r e p o r t 2 0 1 5
notes to the financial statementsfor the year ended september 30, 2015
30.NON-CONTROLLING INTEREST (CONT'D)
Summarised statement of profit or loss for the year ended September 30, 2015: mautourco ltd Beachcomber marketing (pty) ltd
rs 000 rs 000revenue 381,933) 212,519)cost of sales (207,859) -)administrative expenses (157,428) (156,802)finance revenue -) 50,861)finance costs (2,306) (23)other income 15,372) -)profit before tax 29,712) 106,555)income tax (3,564) (31,389)profit for the year from continuing operations 26,148) 75,166)total comprehensive income 23,931) 71,312)attributable to non-controlling interests 12,812) 36,831)dividends paid to non-controlling interests (22,050) (27,636)
Summarised statement of profit or loss for the year ended September 30, 2014:rs 000) rs 000)
revenue 372,809) 207,383)cost of sales (193,713) -)administrative expenses (156,616) (147,641)finance revenue -) 26,325)finance costs (2,370) -)other income 7,576) -)profit before tax 27,686) 86,067)income tax (4,478) (22,535)profit for the year from continuing operations 23,208) 63,532)total comprehensive income 34,147) 60,991)
attributable to non-controlling interests 16,732) 29,886)dividends paid to non-controlling interests (9,800) (32,120)Summarised statement of financial position at September 30, 2015:property, plant and equipment and other non-current financial assets (non-current) 112,723) 5,760)trade, cash and bank balances and other current assets 89,868) 491,241)trade and other payables and current liabilities (100,213) (455,247)interest-bearing loans and borrowing and other non-current liabilities (28,070) -)total equity 74,308) 41,754)attributable to:equity holders of parent 39,730) 21,295)non-controlling interest 34,578) 20,460)
Summarised statement of financial position at September 30, 2014:property, plant and equipment and other non-current financial assets (non-current) 100,945) 6,074)trade, cash and bank balances and other current assets 118,004) 424,128)trade and other payables and current liabilities (101,033) (403,359)interest-bearing loans and borrowing and other non-current liabilities (22,539) -)total equity 95,377) 26,843)attributable to:equity holders of parent 50,475) 13,689)non-controlling interest 44,902) 13,154)Summarised cash flow information for year ending September 30, 2015cash flow generated from/(used in) rs 000) rs 000)operating activities 41,027) 154,380)investing activities (30,219) (64,243)financing activities (41,742) (51,200)net (decrease)/ increase in cash and cash equivalent (30,934) 38,937)Summarised cash flow information for year ending September 30, 2014cash flow generated from/(used in) rs 000) rs 000)operating activities 54,098) 85,680)investing activities 2,098) (88,923)financing activities (5,876) (65,550)net increase/(decrease) in cash and cash equivalent 50,320) (68,793)
AR_2015_16_210x280_2part_Mise en page 1 1/22/16 4:20 PM Page 92

93n e w m a u r i t i u s h o t e l s l i m i t e d
31. RELATED PARTY DISCLOSURES
THE GROUP THE COMPANY2015 2014 2015 2014
rs'000 rs'000 rs'000 rs'000the following transactions have been entered into with related parties:
(i) included in revenue are: nature of goods or services
Subsidiaries:Beachcomber marketing (proprietary) limited hotel packages - - 810,370 791,700 Beachcomber tours Sarl hotel packages - - 564,882 723,001 holiday marketing (pty) ltd hotel packages - - - 2,349 Beachcomber tours limited hotel packages - - 659,148 488,544 Ste anne resort limited management fees - - 11,776 11,221 mautourco ltd management fees - - 1,020 1,020 White palm ltd management fees - - 5,136 5,136 Beachcomber hotel marrakech S.a. promoter's fees - - 2,849 3,780 domaine palm marrakech S.a. promoter's fees - - 4,181 6,054 White palm ltd rental income - - 285 303
- - 2,059,647 2,033,108 associate:parure limitee Space rental 2,098 1,550 2,098 1,550
(ii) included in other expenses are:
Subsidiaries:Beachcomber tours Sa incentive commission - - 5,501 5,593 mautourco ltd incentive commission - - 275 192White palm ltd incentive commission - - 202 51Beachcomber training academy limited training courses - - 3,608 5,243
associate:launderers (hotels & restaurants) ltd laundry services 121,688 114,271 121,688 114,271
other related parties:new mauritius hotels Superannuation fund rent 26,842 25,563 26,842 25,663
(iii) included in finance costs are:
interest on call account with subsidiaries:Beachcomber marketing (proprietary) limited interest on call a/c - - 26,446 22,448 Beachcomber tours Sarl interest on call a/c - - 787 1,080
- - 27,233 23,528 included in interest on finance lease:Beachcomber limited - - 7,898 9,941
included in interest on loans:Subsidiaries:Beachcomber limited interest on loans - - 75,548 61,337 Ste anne resort limited interest on loans - - 13,173 2,842
- - 88,721 64,179
other related party:new mauritius hotels Superannuation fund interest on loan 6,605 3,223 6,605 3,223 enl investment limited interest on loan 1,553 - 1,553 -
AR_2015_16_210x280_2part_Mise en page 1 1/22/16 4:20 PM Page 93
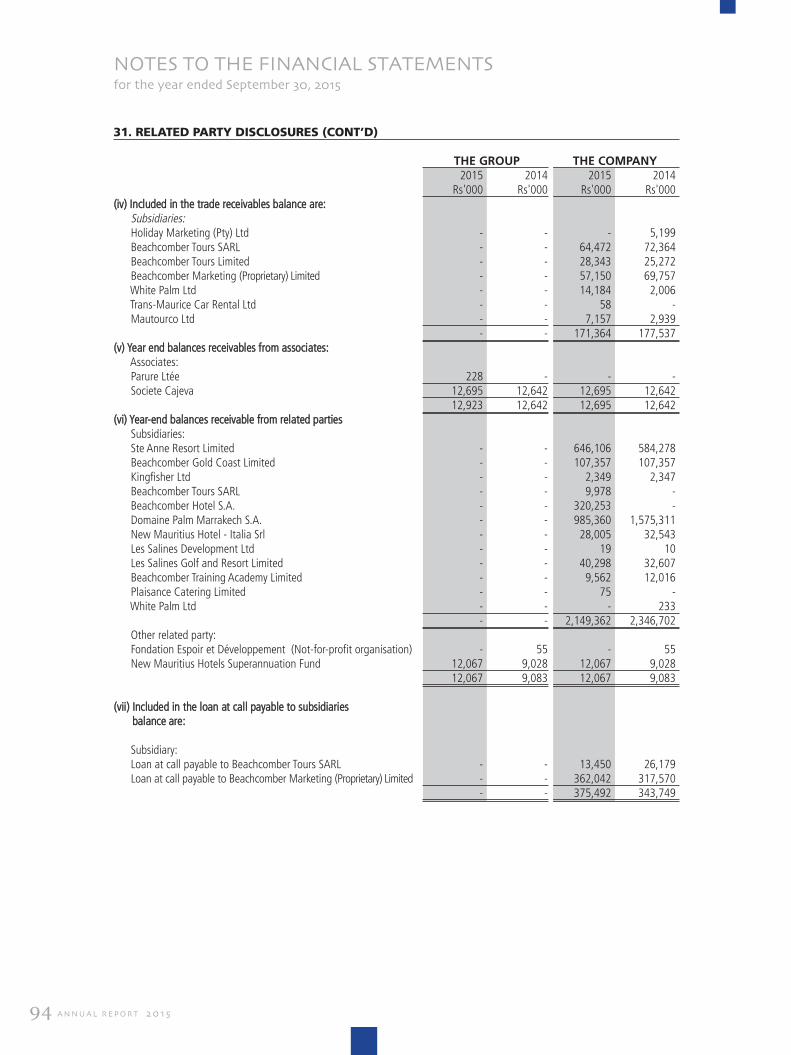
94 a n n u a l r e p o r t 2 0 1 5
31. RELATED PARTY DISCLOSURES (CONT’D)
THE GROUP THE COMPANY2015 2014 2015 2014
rs'000 rs'000 rs'000 rs'000(iv) included in the trade receivables balance are:
Subsidiaries:holiday marketing (pty) ltd - - - 5,199 Beachcomber tours Sarl - - 64,472 72,364 Beachcomber tours limited - - 28,343 25,272 Beachcomber marketing (proprietary) limited - - 57,150 69,757 White palm ltd - - 14,184 2,006 trans-maurice car rental ltd - - 58 - mautourco ltd - - 7,157 2,939
- - 171,364 177,537 (v) year end balances receivables from associates:
associates:parure ltée 228 - - -Societe cajeva 12,695 12,642 12,695 12,642
12,923 12,642 12,695 12,642 (vi) year-end balances receivable from related parties
Subsidiaries:Ste anne resort limited - - 646,106 584,278 Beachcomber Gold coast limited - - 107,357 107,357 Kingfisher ltd - - 2,349 2,347 Beachcomber tours Sarl - - 9,978 - Beachcomber hotel S.a. - - 320,253 - domaine palm marrakech S.a. - - 985,360 1,575,311 new mauritius hotel - italia Srl - - 28,005 32,543 les Salines development ltd - - 19 10 les Salines Golf and resort limited - - 40,298 32,607 Beachcomber training academy limited - - 9,562 12,016 plaisance catering limited - - 75 - White palm ltd - - - 233
- - 2,149,362 2,346,702 other related party:fondation espoir et développement (not-for-profit organisation) - 55 - 55 new mauritius hotels Superannuation fund 12,067 9,028 12,067 9,028
12,067 9,083 12,067 9,083
(vii) included in the loan at call payable to subsidiaries balance are:
Subsidiary:loan at call payable to Beachcomber tours Sarl - - 13,450 26,179 loan at call payable to Beachcomber marketing (proprietary) limited - - 362,042 317,570
- - 375,492 343,749
notes to the financial statementsfor the year ended september 30, 2015
AR_2015_16_210x280_2part_Mise en page 1 1/22/16 4:20 PM Page 94

95n e w m a u r i t i u s h o t e l s l i m i t e d
31. RELATED PARTY DISCLOSURES (CONT’D)
THE GROUP THE COMPANY2015 2014 2015 2014
rs'000 rs'000 rs'000 rs'000(viii) included in other payables balance are:
Subsidiaries:Ste anne resort limited - - - 204 Beachcomber tours Sarl - - 4,586 10,507 Beachcomber marketing (proprietary) limited - - 8,021 8,473 holiday marketing (pty) ltd - - 11 14 Beachcomber tours limited - - 8,128 4,726 mautourco ltd - - 3,637 6,127 White palm ltd - - 2,286 1,645 new mauritius hotel - italia Srl - - 596 - Beachcomber training academy limited - - 94 -
- - 27,359 31,696 associate:launderers (hotels & restaurants) ltd 10,042 9,554 10,042 9,554
other related parties:fondation espoir et developpement (not for profit organisation) 41 - 41 -
41 - 41 -
(ix) year-end balances payable to related parties
Subsidiaries:Beachcomber hotel S.a. - - - 4,528 Beachcomber limited - - 1,389,493 1,268,670
- - 1,389,493 1,273,198
(x) interest bearing loans and borrowings from related parties included in ''term loans'':
loans payable to Beachcomber limited - - 835,938 729,688 loan payable to new mauritius hotels Superannuation fund - 121,879 - 121,879 loans payable to Ste anne resort limited - - 348,104 59,235
- 121,879 1,184,042 910,802
(xi) Borrowings from related parties included in ''obligations under finance leases'':Beachcomber limited - - 79,108 106,274
AR_2015_16_210x280_2part_Mise en page 1 1/22/16 4:20 PM Page 95
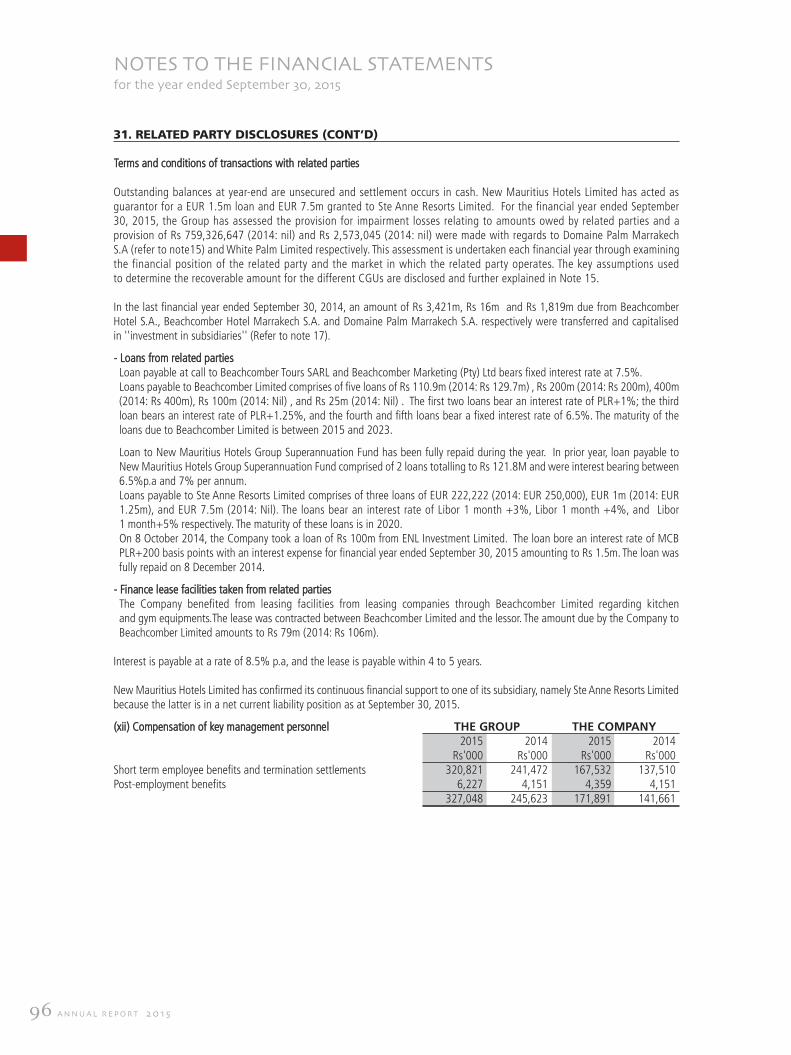
96 a n n u a l r e p o r t 2 0 1 5
notes to the financial statementsfor the year ended september 30, 2015
31. RELATED PARTY DISCLOSURES (CONT’D)
terms and conditions of transactions with related parties
outstanding balances at year-end are unsecured and settlement occurs in cash. new mauritius hotels limited has acted asguarantor for a eur 1.5m loan and eur 7.5m granted to Ste anne resorts limited. for the financial year ended September30, 2015, the Group has assessed the provision for impairment losses relating to amounts owed by related parties and a provision of rs 759,326,647 (2014: nil) and rs 2,573,045 (2014: nil) were made with regards to domaine palm marrakechS.a (refer to note15) and White palm limited respectively. this assessment is undertaken each financial year through examiningthe financial position of the related party and the market in which the related party operates. the key assumptions used to determine the recoverable amount for the different cGus are disclosed and further explained in note 15.
in the last financial year ended September 30, 2014, an amount of rs 3,421m, rs 16m and rs 1,819m due from Beachcomberhotel S.a., Beachcomber hotel marrakech S.a. and domaine palm marrakech S.a. respectively were transferred and capitalised in ''investment in subsidiaries'' (refer to note 17).
- loans from related partiesloan payable at call to Beachcomber tours Sarl and Beachcomber marketing (pty) ltd bears fixed interest rate at 7.5%.loans payable to Beachcomber limited comprises of five loans of rs 110.9m (2014: rs 129.7m) , rs 200m (2014: rs 200m), 400m(2014: rs 400m), rs 100m (2014: nil) , and rs 25m (2014: nil) . the first two loans bear an interest rate of plr+1%; the thirdloan bears an interest rate of plr+1.25%, and the fourth and fifth loans bear a fixed interest rate of 6.5%. the maturity of theloans due to Beachcomber limited is between 2015 and 2023.
loan to new mauritius hotels Group Superannuation fund has been fully repaid during the year. in prior year, loan payable tonew mauritius hotels Group Superannuation fund comprised of 2 loans totalling to rs 121.8m and were interest bearing between6.5%p.a and 7% per annum.loans payable to Ste anne resorts limited comprises of three loans of eur 222,222 (2014: eur 250,000), eur 1m (2014: eur1.25m), and eur 7.5m (2014: nil). the loans bear an interest rate of libor 1 month +3%, libor 1 month +4%, and libor 1 month+5% respectively. the maturity of these loans is in 2020.on 8 october 2014, the company took a loan of rs 100m from enl investment limited. the loan bore an interest rate of mcBplr+200 basis points with an interest expense for financial year ended September 30, 2015 amounting to rs 1.5m. the loan wasfully repaid on 8 december 2014.
- finance lease facilities taken from related parties the company benefited from leasing facilities from leasing companies through Beachcomber limited regarding kitchen and gym equipments.the lease was contracted between Beachcomber limited and the lessor. the amount due by the company toBeachcomber limited amounts to rs 79m (2014: rs 106m).
interest is payable at a rate of 8.5% p.a, and the lease is payable within 4 to 5 years.
new mauritius hotels limited has confirmed its continuous financial support to one of its subsidiary, namely Ste anne resorts limitedbecause the latter is in a net current liability position as at September 30, 2015.
(xii) compensation of key management personnel THE GROUP THE COMPANY2015 2014 2015 2014
rs'000 rs'000 rs'000 rs'000Short term employee benefits and termination settlements 320,821 241,472 167,532 137,510post-employment benefits 6,227 4,151 4,359 4,151
327,048 245,623 171,891 141,661
AR_2015_16_210x280_2part_Mise en page 1 1/22/16 4:20 PM Page 96
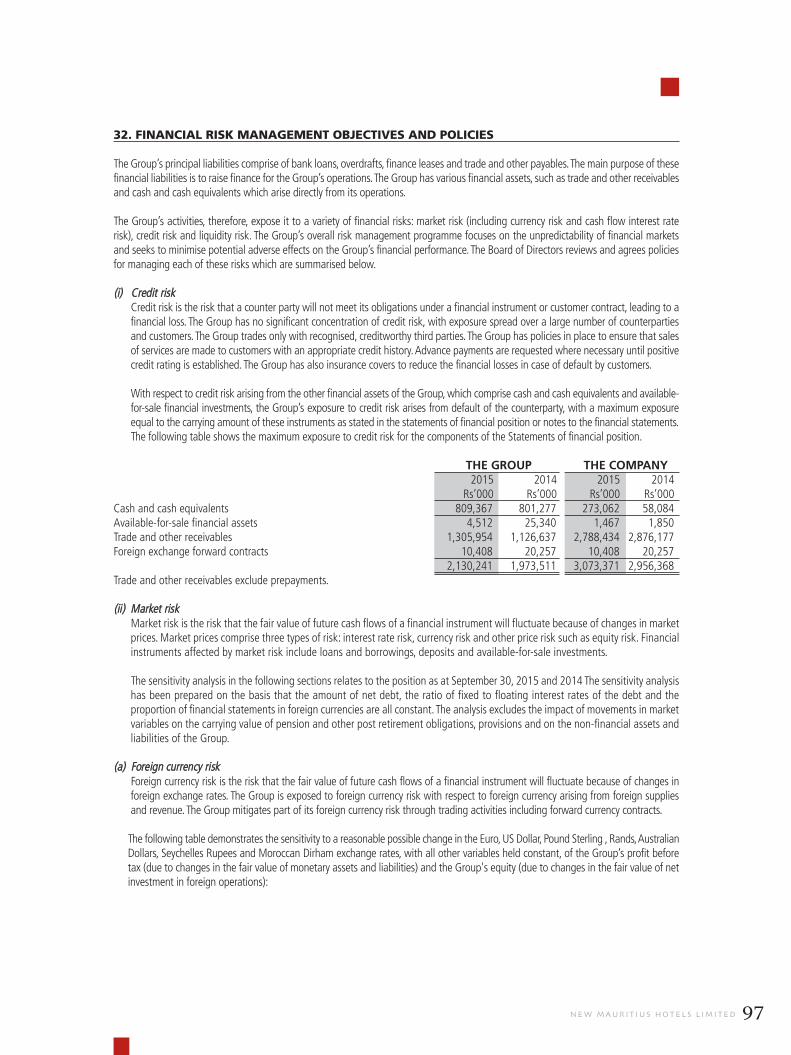
97n e w m a u r i t i u s h o t e l s l i m i t e d
32. FINANCIAL RISK MANAGEMENT OBJECTIVES AND POLICIES
the Group’s principal liabilities comprise of bank loans, overdrafts, finance leases and trade and other payables. the main purpose of thesefinancial liabilities is to raise finance for the Group’s operations. the Group has various financial assets, such as trade and other receivablesand cash and cash equivalents which arise directly from its operations.
the Group’s activities, therefore, expose it to a variety of financial risks: market risk (including currency risk and cash flow interest raterisk), credit risk and liquidity risk. the Group’s overall risk management programme focuses on the unpredictability of financial marketsand seeks to minimise potential adverse effects on the Group’s financial performance. the Board of directors reviews and agrees policiesfor managing each of these risks which are summarised below.
(i) credit riskcredit risk is the risk that a counter party will not meet its obligations under a financial instrument or customer contract, leading to afinancial loss. the Group has no significant concentration of credit risk, with exposure spread over a large number of counterpartiesand customers. the Group trades only with recognised, creditworthy third parties. the Group has policies in place to ensure that salesof services are made to customers with an appropriate credit history. advance payments are requested where necessary until positivecredit rating is established. the Group has also insurance covers to reduce the financial losses in case of default by customers.
With respect to credit risk arising from the other financial assets of the Group, which comprise cash and cash equivalents and available-for-sale financial investments, the Group’s exposure to credit risk arises from default of the counterparty, with a maximum exposureequal to the carrying amount of these instruments as stated in the statements of financial position or notes to the financial statements.the following table shows the maximum exposure to credit risk for the components of the Statements of financial position.
THE GROUP THE COMPANY2015 2014 2015 2014
rs’000 rs’000 rs’000 rs’000cash and cash equivalents 809,367 801,277 273,062 58,084 available-for-sale financial assets 4,512 25,340 1,467 1,850 trade and other receivables 1,305,954 1,126,637 2,788,434 2,876,177 foreign exchange forward contracts 10,408 20,257 10,408 20,257
2,130,241 1,973,511 3,073,371 2,956,368trade and other receivables exclude prepayments.
(ii) market riskmarket risk is the risk that the fair value of future cash flows of a financial instrument will fluctuate because of changes in marketprices. market prices comprise three types of risk: interest rate risk, currency risk and other price risk such as equity risk. financialinstruments affected by market risk include loans and borrowings, deposits and available-for-sale investments.
the sensitivity analysis in the following sections relates to the position as at September 30, 2015 and 2014 the sensitivity analysishas been prepared on the basis that the amount of net debt, the ratio of fixed to floating interest rates of the debt and the proportion of financial statements in foreign currencies are all constant. the analysis excludes the impact of movements in marketvariables on the carrying value of pension and other post retirement obligations, provisions and on the non-financial assets andliabilities of the Group.
(a) foreign currency riskforeign currency risk is the risk that the fair value of future cash flows of a financial instrument will fluctuate because of changes inforeign exchange rates. the Group is exposed to foreign currency risk with respect to foreign currency arising from foreign suppliesand revenue. the Group mitigates part of its foreign currency risk through trading activities including forward currency contracts.
the following table demonstrates the sensitivity to a reasonable possible change in the euro, uS dollar, pound Sterling , rands, australiandollars, Seychelles rupees and moroccan dirham exchange rates, with all other variables held constant, of the Group’s profit beforetax (due to changes in the fair value of monetary assets and liabilities) and the Group's equity (due to changes in the fair value of netinvestment in foreign operations):
AR_2015_16_210x280_2part_Mise en page 1 1/22/16 4:20 PM Page 97

98 a n n u a l r e p o r t 2 0 1 5
AR_2015_16_210x280_2part_Mise en page 1 1/22/16 4:20 PM Page 98
99n e w m a u r i t i u s h o t e l s l i m i t e d
AR_2015_16_210x280_2part_Mise en page 1 1/22/16 4:20 PM Page 99
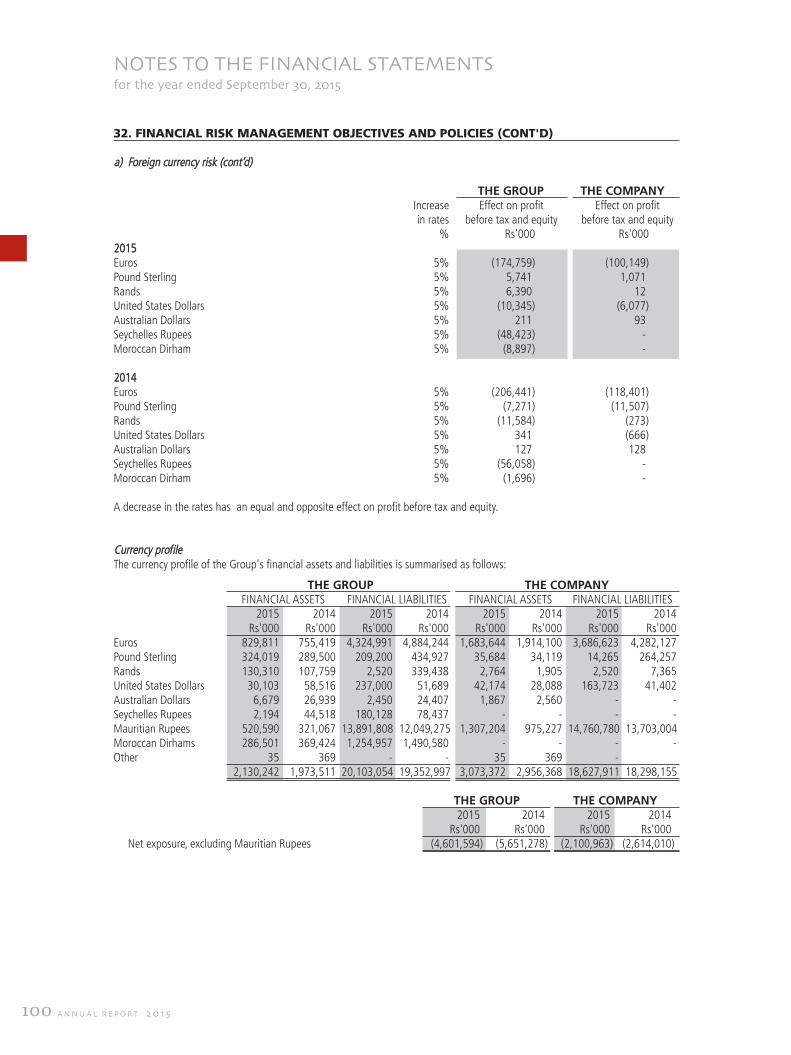
100 a n n u a l r e p o r t 2 0 1 5
32. FINANCIAL RISK MANAGEMENT OBJECTIVES AND POLICIES (CONT'D)
a) foreign currency risk (cont’d)
THE GROUP THE COMPANYincrease effect on profit effect on profitin rates before tax and equity before tax and equity
% rs'000 rs'0002015euros 5% (174,759) (100,149)pound Sterling 5% 5,741) 1,071)rands 5% 6,390) 12)united States dollars 5% (10,345) (6,077)australian dollars 5% 211) 93)Seychelles rupees 5% (48,423) -)moroccan dirham 5% (8,897) -)
2014euros 5% (206,441) (118,401)pound Sterling 5% (7,271) (11,507)rands 5% (11,584) (273)united States dollars 5% 341) (666)australian dollars 5% 127) 128)Seychelles rupees 5% (56,058) -)moroccan dirham 5% (1,696) -)
a decrease in the rates has an equal and opposite effect on profit before tax and equity.
currency profilethe currency profile of the Group's financial assets and liabilities is summarised as follows:
THE GROUP THE COMPANYfinancial aSSetS financial liaBilitieS financial aSSetS financial liaBilitieS
2015 2014 2015 2014 2015 2014 2015 2014rs'000 rs'000 rs'000 rs'000 rs'000 rs'000 rs'000 rs'000
euros 829,811 755,419 4,324,991 4,884,244 1,683,644 1,914,100 3,686,623 4,282,127 pound Sterling 324,019 289,500 209,200 434,927 35,684 34,119 14,265 264,257 rands 130,310 107,759 2,520 339,438 2,764 1,905 2,520 7,365 united States dollars 30,103 58,516 237,000 51,689 42,174 28,088 163,723 41,402 australian dollars 6,679 26,939 2,450 24,407 1,867 2,560 - - Seychelles rupees 2,194 44,518 180,128 78,437 - - - - mauritian rupees 520,590 321,067 13,891,808 12,049,275 1,307,204 975,227 14,760,780 13,703,004 moroccan dirhams 286,501 369,424 1,254,957 1,490,580 - - - - other 35 369 - - 35 369 -
2,130,242 1,973,511 20,103,054 19,352,997 3,073,372 2,956,368 18,627,911 18,298,155
THE GROUP THE COMPANY2015) 2014) 2015) 2014)
rs'000) rs'000) rs'000) rs'000)net exposure, excluding mauritian rupees (4,601,594) (5,651,278) (2,100,963) (2,614,010)
notes to the financial statementsfor the year ended september 30, 2015
AR_2015_16_210x280_2part_Mise en page 1 1/22/16 4:20 PM Page 100
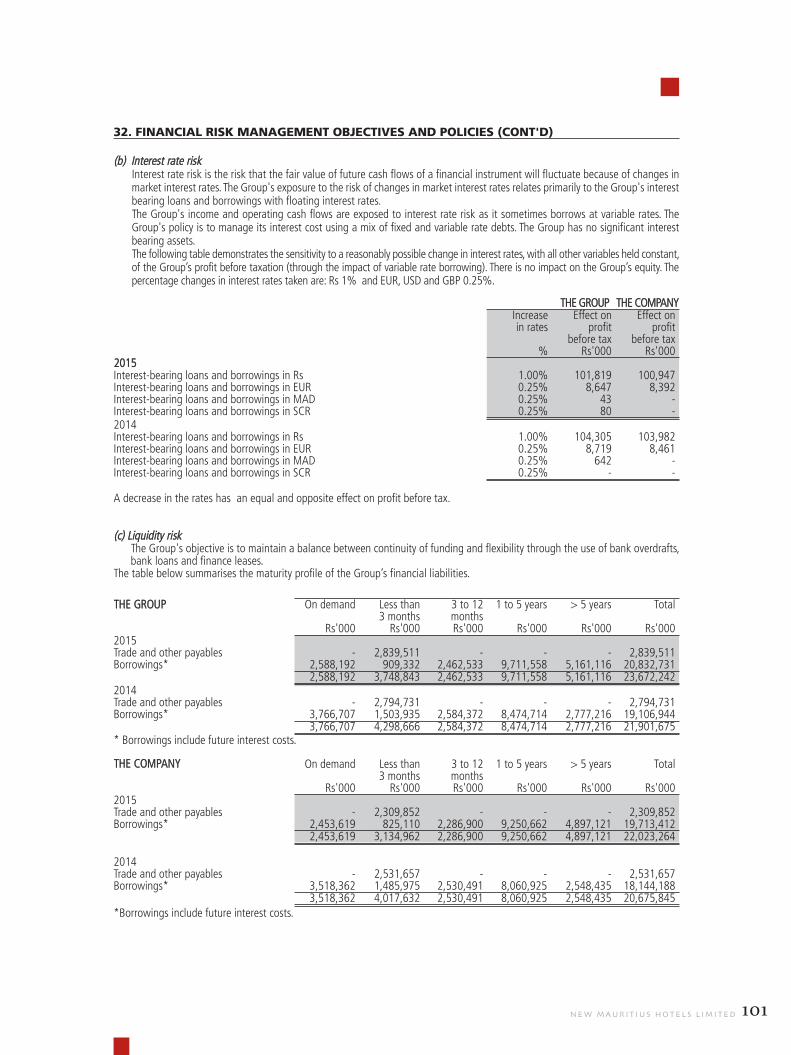
101n e w m a u r i t i u s h o t e l s l i m i t e d
32. FINANCIAL RISK MANAGEMENT OBJECTIVES AND POLICIES (CONT'D)
(b) interest rate risk interest rate risk is the risk that the fair value of future cash flows of a financial instrument will fluctuate because of changes inmarket interest rates. the Group's exposure to the risk of changes in market interest rates relates primarily to the Group's interestbearing loans and borrowings with floating interest rates.the Group's income and operating cash flows are exposed to interest rate risk as it sometimes borrows at variable rates. theGroup's policy is to manage its interest cost using a mix of fixed and variable rate debts. the Group has no significant interestbearing assets.the following table demonstrates the sensitivity to a reasonably possible change in interest rates, with all other variables held constant,of the Group’s profit before taxation (through the impact of variable rate borrowing). there is no impact on the Group’s equity. thepercentage changes in interest rates taken are: rs 1% and eur, uSd and GBp 0.25%.
the Group the companyincrease effect on effect onin rates profit profit
before tax before tax% rs'000 rs'000
2015interest-bearing loans and borrowings in rs 1.00% 101,819 100,947 interest-bearing loans and borrowings in eur 0.25% 8,647 8,392 interest-bearing loans and borrowings in mad 0.25% 43 - interest-bearing loans and borrowings in Scr 0.25% 80 - 2014interest-bearing loans and borrowings in rs 1.00% 104,305 103,982 interest-bearing loans and borrowings in eur 0.25% 8,719 8,461 interest-bearing loans and borrowings in mad 0.25% 642 - interest-bearing loans and borrowings in Scr 0.25% - -
a decrease in the rates has an equal and opposite effect on profit before tax.
(c) liquidity riskthe Group's objective is to maintain a balance between continuity of funding and flexibility through the use of bank overdrafts,bank loans and finance leases.
the table below summarises the maturity profile of the Group’s financial liabilities.
the Group on demand less than 3 to 12 1 to 5 years > 5 years total3 months months
rs'000 rs'000 rs'000 rs'000 rs'000 rs'0002015trade and other payables - 2,839,511 - - - 2,839,511 Borrowings* 2,588,192 909,332 2,462,533 9,711,558 5,161,116 20,832,731
2,588,192 3,748,843 2,462,533 9,711,558 5,161,116 23,672,242 2014trade and other payables - 2,794,731 - - - 2,794,731 Borrowings* 3,766,707 1,503,935 2,584,372 8,474,714 2,777,216 19,106,944
3,766,707 4,298,666 2,584,372 8,474,714 2,777,216 21,901,675 * Borrowings include future interest costs.
the company on demand less than 3 to 12 1 to 5 years > 5 years total3 months months
rs'000 rs'000 rs'000 rs'000 rs'000 rs'0002015trade and other payables - 2,309,852 - - - 2,309,852Borrowings* 2,453,619 825,110 2,286,900 9,250,662 4,897,121 19,713,412
2,453,619 3,134,962 2,286,900 9,250,662 4,897,121 22,023,264
2014trade and other payables - 2,531,657 - - - 2,531,657 Borrowings* 3,518,362 1,485,975 2,530,491 8,060,925 2,548,435 18,144,188
3,518,362 4,017,632 2,530,491 8,060,925 2,548,435 20,675,845*Borrowings include future interest costs.
AR_2015_16_210x280_2part_Mise en page 1 1/22/16 4:20 PM Page 101
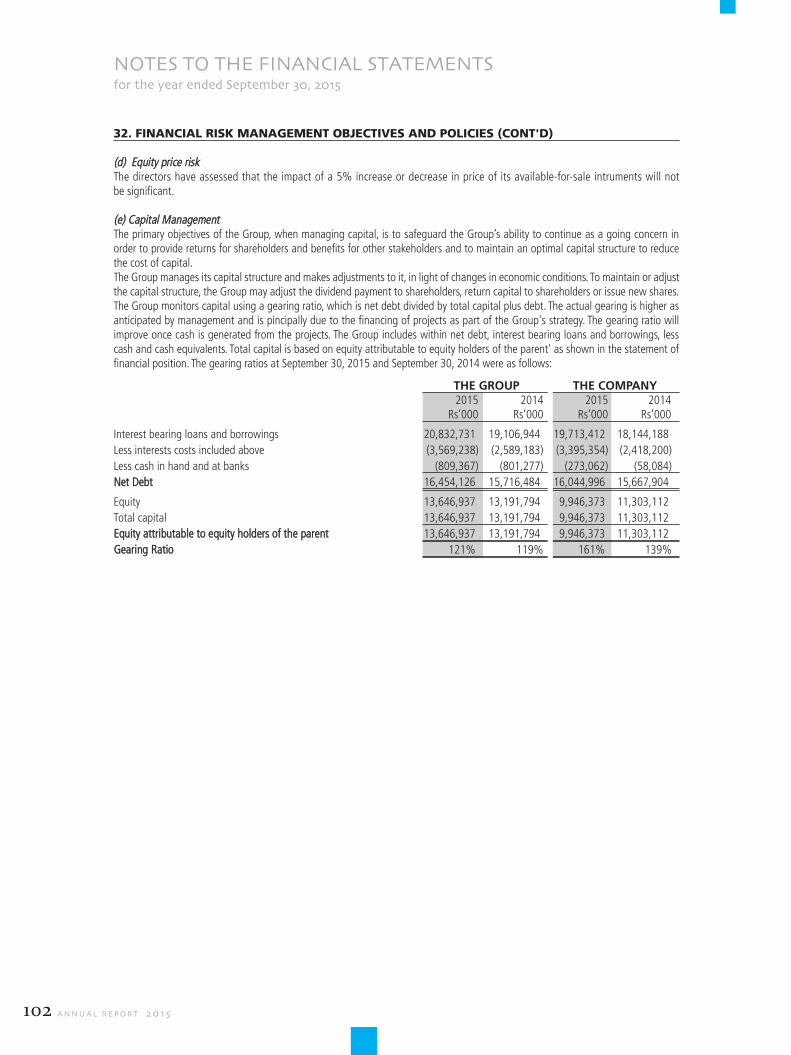
102 a n n u a l r e p o r t 2 0 1 5
notes to the financial statementsfor the year ended september 30, 2015
32. FINANCIAL RISK MANAGEMENT OBJECTIVES AND POLICIES (CONT'D)
(d) equity price riskthe directors have assessed that the impact of a 5% increase or decrease in price of its available-for-sale intruments will not be significant.
(e) capital managementthe primary objectives of the Group, when managing capital, is to safeguard the Group’s ability to continue as a going concern inorder to provide returns for shareholders and benefits for other stakeholders and to maintain an optimal capital structure to reducethe cost of capital.the Group manages its capital structure and makes adjustments to it, in light of changes in economic conditions. to maintain or adjustthe capital structure, the Group may adjust the dividend payment to shareholders, return capital to shareholders or issue new shares.the Group monitors capital using a gearing ratio, which is net debt divided by total capital plus debt. the actual gearing is higher asanticipated by management and is pincipally due to the financing of projects as part of the Group's strategy. the gearing ratio will improve once cash is generated from the projects. the Group includes within net debt, interest bearing loans and borrowings, lesscash and cash equivalents. total capital is based on equity attributable to equity holders of the parent' as shown in the statement offinancial position. the gearing ratios at September 30, 2015 and September 30, 2014 were as follows:
THE GROUP THE COMPANY2015) 2014) 2015) 2014)
rs’000) rs’000) rs’000) rs’000)
interest bearing loans and borrowings 20,832,731) 19,106,944) 19,713,412) 18,144,188)
less interests costs included above (3,569,238) (2,589,183) (3,395,354) (2,418,200)
less cash in hand and at banks (809,367) (801,277) (273,062) (58,084)
net debt 16,454,126) 15,716,484) 16,044,996) 15,667,904)
equity 13,646,937) 13,191,794) 9,946,373) 11,303,112)
total capital 13,646,937) 13,191,794) 9,946,373) 11,303,112)
equity attributable to equity holders of the parent 13,646,937) 13,191,794) 9,946,373) 11,303,112)
Gearing ratio 121%) 119% 161%) 139%
AR_2015_16_210x280_2part_Mise en page 1 1/22/16 4:20 PM Page 102
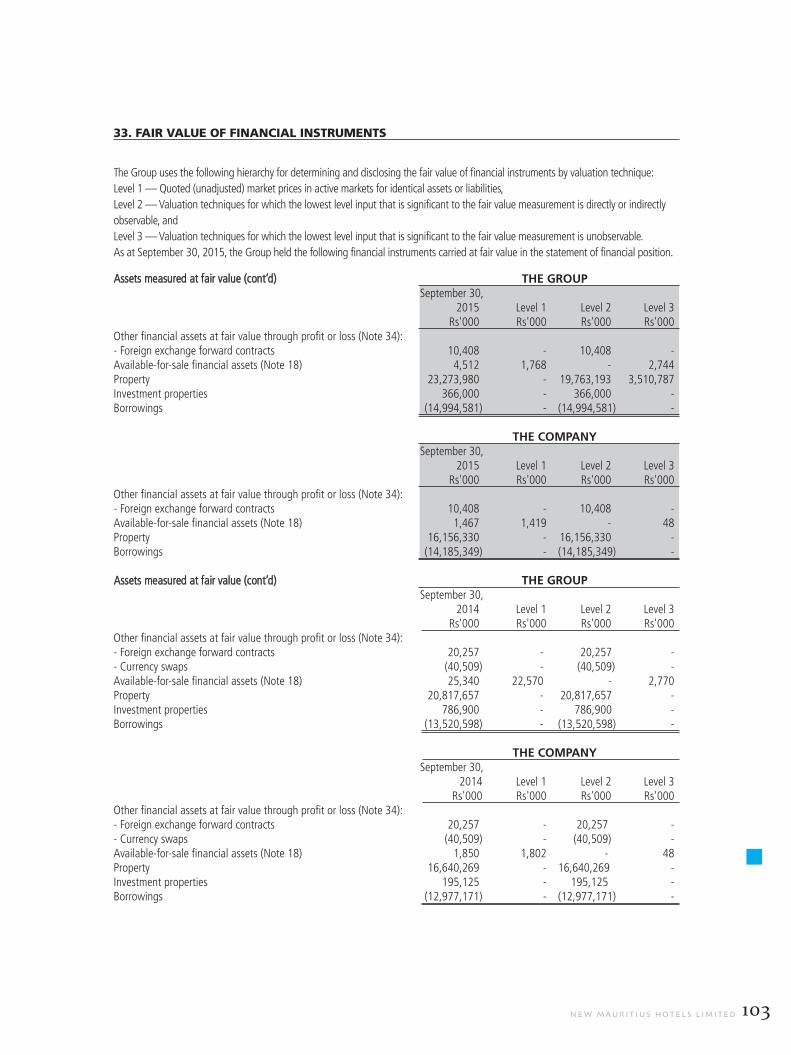
103n e w m a u r i t i u s h o t e l s l i m i t e d
assets measured at fair value (cont’d) THE GROUPSeptember 30,
2015) level 1 level 2 level 3rs'000) rs'000 rs'000 rs'000
other financial assets at fair value through profit or loss (note 34):- foreign exchange forward contracts 10,408) - 10,408 - available-for-sale financial assets (note 18) 4,512) 1,768 - 2,744 property 23,273,980) - 19,763,193 3,510,787 investment properties 366,000) - 366,000 - Borrowings (14,994,581) - (14,994,581) -
THE COMPANYSeptember 30,
2015) level 1 level 2 level 3rs'000) rs'000 rs'000 rs'000
other financial assets at fair value through profit or loss (note 34):- foreign exchange forward contracts 10,408) - 10,408 - available-for-sale financial assets (note 18) 1,467) 1,419 - 48 property 16,156,330) - 16,156,330 - Borrowings (14,185,349) - (14,185,349) -
assets measured at fair value (cont’d) THE GROUPSeptember 30,
2014) level 1 level 2 level 3rs'000) rs'000 rs'000 rs'000
other financial assets at fair value through profit or loss (note 34):- foreign exchange forward contracts 20,257) -) 20,257) - - currency swaps (40,509) -) (40,509) - available-for-sale financial assets (note 18) 25,340) 22,570) -) 2,770 property 20,817,657) -) 20,817,657) - investment properties 786,900) -) 786,900) - Borrowings (13,520,598) -) (13,520,598) -
THE COMPANYSeptember 30,
2014 level 1 level 2 level 3rs'000 rs'000 rs'000 rs'000
other financial assets at fair value through profit or loss (note 34):- foreign exchange forward contracts 20,257) - 20,257) - - currency swaps (40,509) - (40,509) - available-for-sale financial assets (note 18) 1,850) 1,802 -) 48 property 16,640,269) - 16,640,269) - investment properties 195,125) - 195,125) - Borrowings (12,977,171) - (12,977,171) -
33. FAIR VALUE OF FINANCIAL INSTRUMENTS
the Group uses the following hierarchy for determining and disclosing the fair value of financial instruments by valuation technique:
level 1 — Quoted (unadjusted) market prices in active markets for identical assets or liabilities,
level 2 — Valuation techniques for which the lowest level input that is significant to the fair value measurement is directly or indirectly
observable, and
level 3 — Valuation techniques for which the lowest level input that is significant to the fair value measurement is unobservable.
as at September 30, 2015, the Group held the following financial instruments carried at fair value in the statement of financial position.
AR_2015_16_210x280_2part_Mise en page 1 1/22/16 4:20 PM Page 103

104 a n n u a l r e p o r t 2 0 1 5
34. OTHER FINANCIAL (LIABILITIES)/ASSETS
THE GROUP ANDTHE COMPANY
2015 2014)rs'000 rs'000)
other financial (liabilities)/assets at fair value through profit or loss:derivatives not designated as hedges:foreign exchange forward contracts 10,408 20,257)
- currency options - (40,509)
10,408 (20,252)disclosed as follows:current assets 10,408 20,257)current liabilities - (40,509)total other financial (liabilities)/assets at fair value through profit or loss 10,408 (20,252)
other financial instruments through profit or loss represent foreign exchange forward contracts and currency options that are notdesignated in hedge relationships as they are intended to reduce the level of foreign currency risk arising over operations.
these foreign exchange forward contracts and currency options are not designated as cash flow, fair value or net investment hedgesand are entered into for periods consistent with currency transaction exposures, generally from one to 12 months.
the Group enters into derivative financial instruments with various counterparties, principally financial institution with investmentgrade credit ratings. derivatives valued using valuation techniques with market observable inputs are the foreign exchange forwardcontracts, currency options and currency swaps. the most frequently applied valuation techniques include forward pricing and swapmodels, using present value calculations. the models incorporates various inputs including foreign exchange spot and forward rates,interest rate curves and forward rate curves of the underlying commodity.
35. EVENTS AFTER THE REPORTING DATE
the events which occurred after the reporting date and which require disclosure in the financial statements for the year ended September 30, 2015 are as follows:
- the Board approved the listing of 717,373 fixed and floating rate secured multicurrency notes comprising of 96,140 mur tranchea notes, 618,703 mur tranche B notes of a nominal value of rs 1,000 each and 2,530 eur notes at a nominal value of eur 1,000each, by way of a private placement.
the listing executive committee of the Stock exchange of mauritius approved the listing of the notes on the official list of the Sem.the first day of the listing and trading was on the november 12, 2015.
- in december 2015, the board of directors has declared an ordinary interim dividend of rs 0.33 per share and a dividend of rs 0.33per preference shares.
36. FRAUD
a fraud was discovered in one of the subsidiary, namely White palm ltd. the estimated loss amounted to rs 10.5m and same hasbeen accounted under ‘’other expenses’’ in the statement of profit or loss.
the carrying amounts of financial assets and liabilities approximate their fair values.fair value of available-for-sale financial assets is derived from quoted market prices in active markets.unquoted available-for-sale financial assets represent investments in equity instruments that do not have a quoted market price in anactive market and whose fair values cannot be reliably measured. available-for-sale financial assets are therefore measured at cost.fair values of the Group's interest-bearing loans and borrowings and loans are determined by using dcf method using discount ratethat reflects the issuer's borrowings rate as at the end of the reporting date.the fair value of foreign exchange forward and swap contracts are determined by using the foreign exchange spot and forward rates,interest rate curves and forward rate curves of each currency.for valuation techniques regarding property classified under ''property, plant and equipment'' and''investment properties'', refer tonote 13 and 14 respectively.during the reporting period ended 30 September 2015, there were no transfers between level 1 and level 2 fair value measurements.
notes to the financial statementsfor the year ended september 30, 2015
AR_2015_16_210x280_2part_Mise en page 1 1/22/16 4:20 PM Page 104
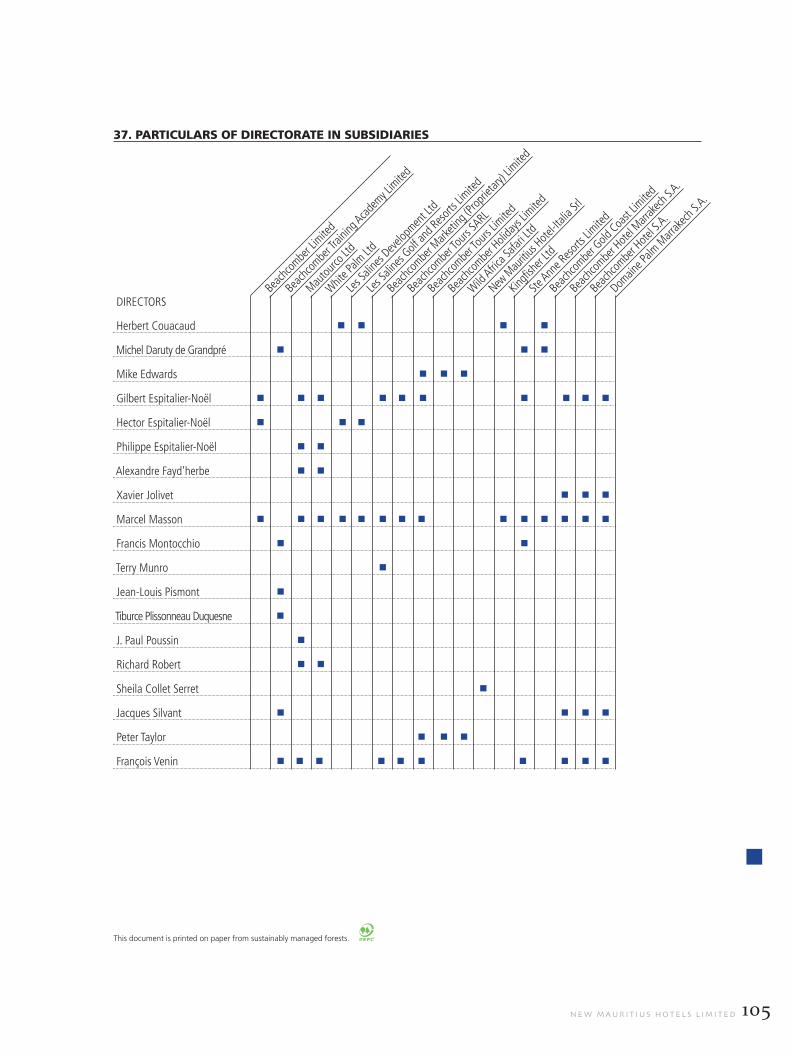
105n e w m a u r i t i u s h o t e l s l i m i t e d
Beac
hcom
ber l
imite
d
Beac
hcom
ber t
rainin
g aca
demy l
imite
d
mau
tour
co lt
d
Whit
e palm
ltd
les S
aline
s dev
elopm
ent l
td
les S
aline
s Golf
and r
esor
ts lim
ited
Beac
hcom
ber m
arke
ting (
prop
rieta
ry) li
mited
Beac
hcom
ber t
ours
Sarl
Beac
hcom
ber t
ours
limite
d
Beac
hcom
ber h
olida
ys li
mited
Wild
afri
ca Sa
fari l
td
new m
aurit
iushot
el-ita
lia Sr
l
Kingf
isher
ltd
Ste a
nne r
esor
ts lim
ited
Beac
hcom
ber G
old c
oast
limite
d
Beac
hcom
ber h
otel
marr
akec
h S.a
.
Beac
hcom
ber h
otel
S.a.
domain
e palm
mar
rakec
h S.a
.
37. PARTICULARS OF DIRECTORATE IN SUBSIDIARIES
directorS
herbert couacaud
michel daruty de Grandpré
mike edwards
Gilbert espitalier-noël
hector espitalier-noël
philippe espitalier-noël
alexandre fayd'herbe
Xavier Jolivet
marcel masson
francis montocchio
terry munro
Jean-louis pismont
tiburce plissonneau duquesne
J. paul poussin
richard robert
Sheila collet Serret
Jacques Silvant
peter taylor
françois Venin
This document is printed on paper from sustainably managed forests.
AR_2015_16_210x280_2part_Mise en page 1 1/22/16 4:20 PM Page 105

106 a n n u a l r e p o r t 2 0 1 5
notice is hereby given that the annual meeting of shareholders of new mauritius hotels limited will be held at labourdonnais
Waterfront hotel, caudan, port louis on friday 19 february 2016 at 10.30 a.m.
aGenda
1. to receive, consider, and approve the financial Statements for year ended 30 September 2015, to receive the independent
auditors’ report and consider the annual report..
2. to reappoint, in accordance with Section 23.6 of the company’s constitution, messrs. herbert couacaud and colin taylor
who are the two directors due for retirement as directors of the company.
3. to reappoint messrs. ernst and young as auditors for the financial year ending 30 September 2016 and authorize the Board
of directors to fix their emoluments.
4. Shareholders’ Question time.
a member of the company may appoint a proxy to attend and vote at the meeting on his behalf. the instrument appointing the
proxy must be deposited at the registered office of the company, Beachcomber house, Botanical Garden Street, curepipe 74213,
not less than twenty-four hours before the meeting.
By order of the Board
BeachcomBer limtied
Secretary
(per francis montocchio)
february 2, 2016
notice of annual meetingnew mauritius hotels limited
AR_2015_16_210x280_2part_Mise en page 1 1/22/16 4:20 PM Page 106
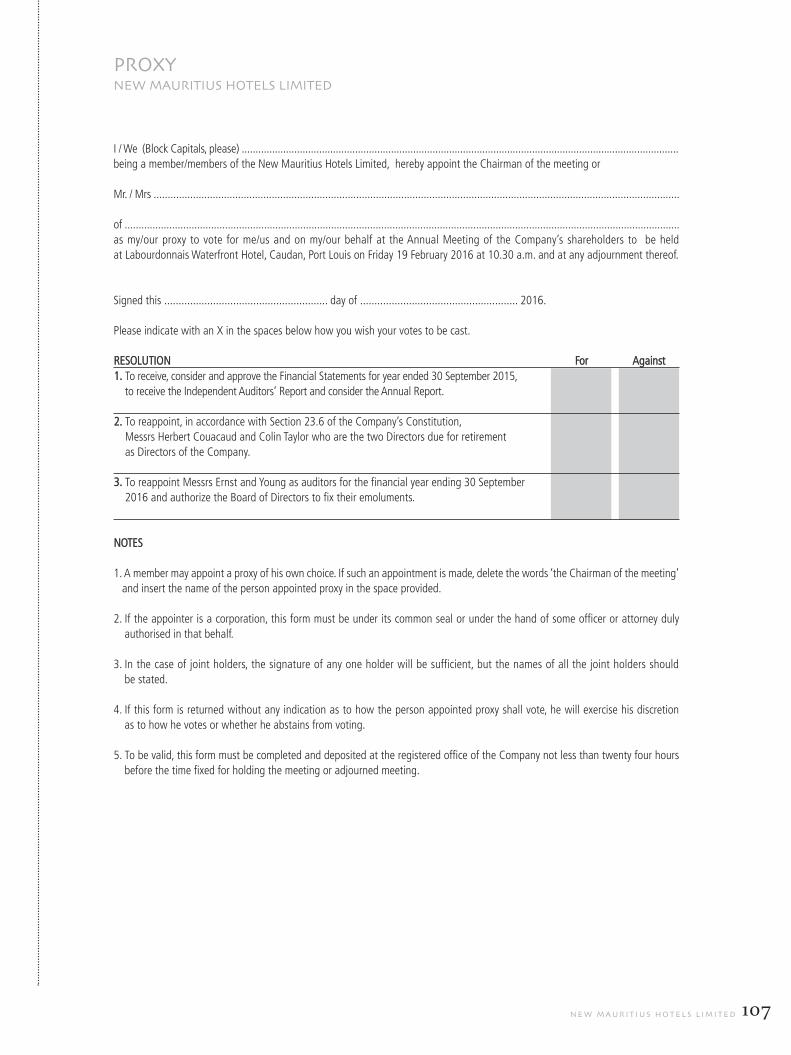
107n e w m a u r i t i u s h o t e l s l i m i t e d
i / We (Block capitals, please) ..............................................................................................................................................................
being a member/members of the new mauritius hotels limited, hereby appoint the chairman of the meeting or
mr. / mrs ...........................................................................................................................................................................................
of .......................................................................................................................................................................................................
as my/our proxy to vote for me/us and on my/our behalf at the annual meeting of the company’s shareholders to be held
at labourdonnais Waterfront hotel, caudan, port louis on friday 19 february 2016 at 10.30 a.m. and at any adjournment thereof.
Signed this ......................................................... day of ....................................................... 2016.
please indicate with an X in the spaces below how you wish your votes to be cast.
reSolution for against
1. to receive, consider and approve the financial Statements for year ended 30 September 2015,
to receive the independent auditors’ report and consider the annual report.
2. to reappoint, in accordance with Section 23.6 of the company’s constitution,
messrs herbert couacaud and colin taylor who are the two directors due for retirement
as directors of the company.
3. to reappoint messrs ernst and young as auditors for the financial year ending 30 September
2016 and authorize the Board of directors to fix their emoluments.
noteS
1. a member may appoint a proxy of his own choice. if such an appointment is made, delete the words ‘the chairman of the meeting’
and insert the name of the person appointed proxy in the space provided.
2. if the appointer is a corporation, this form must be under its common seal or under the hand of some officer or attorney duly
authorised in that behalf.
3. in the case of joint holders, the signature of any one holder will be sufficient, but the names of all the joint holders should
be stated.
4. if this form is returned without any indication as to how the person appointed proxy shall vote, he will exercise his discretion
as to how he votes or whether he abstains from voting.
5. to be valid, this form must be completed and deposited at the registered office of the company not less than twenty four hours
before the time fixed for holding the meeting or adjourned meeting.
proXynew mauritius hotels limited
AR_2015_16_210x280_2part_Mise en page 1 1/22/16 4:20 PM Page 107

108 a n n u a l r e p o r t 2 0 1 5
AR_2015_16_210x280_2part_Mise en page 1 1/22/16 4:20 PM Page 108

Project1_Layout 1 1/21/16 2:53 PM Page 1
A N N U A L R E P O R T 2 0 1 5
Project3_Layout 1 1/20/16 3:36 PM Page 2
Related Documents