N-glycosylation profile analysis of trastuzumab biosimilar candidates by normal phase liquid chromatography and maldi-tof ms approaches Ivan Sanchez-De Melo, Paola Grassi, Francisco Ochoa, Jorge Bolivar, Francisco J. Garc´ ıa-C´ ozar, M a . Carmen Dur´ an-Ruiz PII: S1874-3919(15)00193-1 DOI: doi: 10.1016/j.jprot.2015.04.012 Reference: JPROT 2122 To appear in: Journal of Proteomics Please cite this article as: Sanchez-De Melo Ivan, Grassi Paola, Ochoa Francisco, Bolivar Jorge, Garc´ ıa-C´ozarFranciscoJ., Dur´ an-Ruiz M a . Carmen, N-glycosylation profile anal- ysis of trastuzumab biosimilar candidates by normal phase liquid chromatography and maldi-tof ms approaches, Journal of Proteomics (2015), doi: 10.1016/j.jprot.2015.04.012 This is a PDF file of an unedited manuscript that has been accepted for publication. As a service to our customers we are providing this early version of the manuscript. The manuscript will undergo copyediting, typesetting, and review of the resulting proof before it is published in its final form. Please note that during the production process errors may be discovered which could affect the content, and all legal disclaimers that apply to the journal pertain.

Welcome message from author
This document is posted to help you gain knowledge. Please leave a comment to let me know what you think about it! Share it to your friends and learn new things together.
Transcript

�������� ����� ��
N-glycosylation profile analysis of trastuzumab biosimilar candidates bynormal phase liquid chromatography and maldi-tof ms approaches
Ivan Sanchez-De Melo, Paola Grassi, Francisco Ochoa, Jorge Bolivar,Francisco J. Garcıa-Cozar, Ma. Carmen Duran-Ruiz
PII: S1874-3919(15)00193-1DOI: doi: 10.1016/j.jprot.2015.04.012Reference: JPROT 2122
To appear in: Journal of Proteomics
Please cite this article as: Sanchez-De Melo Ivan, Grassi Paola, Ochoa Francisco, BolivarJorge, Garcıa-Cozar Francisco J., Duran-Ruiz Ma. Carmen, N-glycosylation profile anal-ysis of trastuzumab biosimilar candidates by normal phase liquid chromatography andmaldi-tof ms approaches, Journal of Proteomics (2015), doi: 10.1016/j.jprot.2015.04.012
This is a PDF file of an unedited manuscript that has been accepted for publication.As a service to our customers we are providing this early version of the manuscript.The manuscript will undergo copyediting, typesetting, and review of the resulting proofbefore it is published in its final form. Please note that during the production processerrors may be discovered which could affect the content, and all legal disclaimers thatapply to the journal pertain.

ACC
EPTE
D M
ANU
SCR
IPT
ACCEPTED MANUSCRIPT
1
TITLE:
N-GLYCOSYLATION PROFILE ANALYSIS OF TRASTUZUMAB BIOSIMILAR
CANDIDATES BY NORMAL PHASE LIQUID CHROMATOGRAPHY AND
MALDI-TOF MS APPROACHES
Ivan Sanchez-De Melo1, Paola Grassi
2, Francisco Ochoa
1, Jorge Bolivar
1, Francisco J.
García-Cózar1, Mª Carmen Durán-Ruiz
1
AFFILIATIONS:
1. Biotechnology, Biomedicine and Public Health Department, Cadiz University, Spain
Ivan Sánchez-De Melo, PhD [email protected]
Francisco Ochoa [email protected]
Prof. Jorge Bolivar, PhD [email protected]
Prof. Francisco J. García-Cózar, PhD, MD [email protected]
Mª Carmen Durán-Ruiz, phD [email protected]
2. Biopolymer Mass Spectrometry group, Imperial College, London UK
Paola Grassi, PhD [email protected]
Corresponding author:
Mª Carmen Duran-Ruiz, PhD
Non-tenured Lecturer at the Biomedicine, Biotechnology and Public Health Dpt.
Cadiz University, Spain.
e-mail: [email protected]
ACC
EPTE
D M
ANU
SCR
IPT
ACCEPTED MANUSCRIPT
2
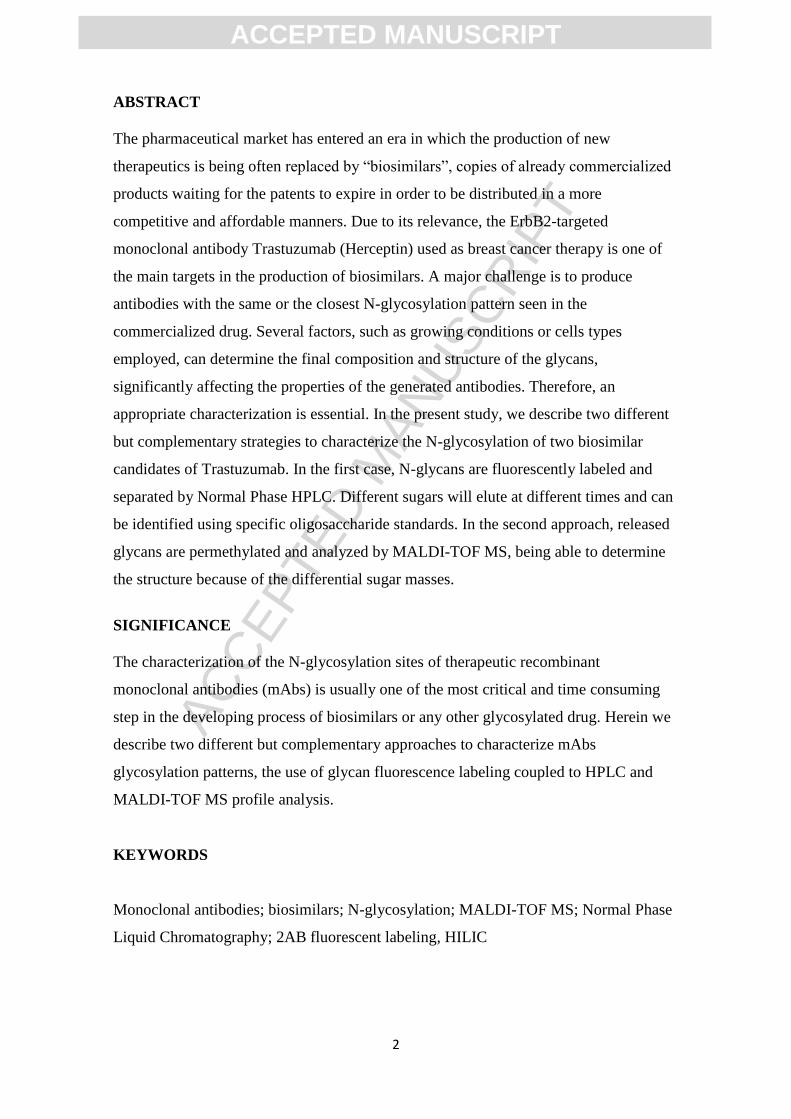
ABSTRACT
The pharmaceutical market has entered an era in which the production of new
therapeutics is being often replaced by “biosimilars”, copies of already commercialized
products waiting for the patents to expire in order to be distributed in a more
competitive and affordable manners. Due to its relevance, the ErbB2-targeted
monoclonal antibody Trastuzumab (Herceptin) used as breast cancer therapy is one of
the main targets in the production of biosimilars. A major challenge is to produce
antibodies with the same or the closest N-glycosylation pattern seen in the
commercialized drug. Several factors, such as growing conditions or cells types
employed, can determine the final composition and structure of the glycans,
significantly affecting the properties of the generated antibodies. Therefore, an
appropriate characterization is essential. In the present study, we describe two different
but complementary strategies to characterize the N-glycosylation of two biosimilar
candidates of Trastuzumab. In the first case, N-glycans are fluorescently labeled and
separated by Normal Phase HPLC. Different sugars will elute at different times and can
be identified using specific oligosaccharide standards. In the second approach, released
glycans are permethylated and analyzed by MALDI-TOF MS, being able to determine
the structure because of the differential sugar masses.
SIGNIFICANCE
The characterization of the N-glycosylation sites of therapeutic recombinant
monoclonal antibodies (mAbs) is usually one of the most critical and time consuming
step in the developing process of biosimilars or any other glycosylated drug. Herein we
describe two different but complementary approaches to characterize mAbs
glycosylation patterns, the use of glycan fluorescence labeling coupled to HPLC and
MALDI-TOF MS profile analysis.
KEYWORDS
Monoclonal antibodies; biosimilars; N-glycosylation; MALDI-TOF MS; Normal Phase
Liquid Chromatography; 2AB fluorescent labeling, HILIC
ACC
EPTE
D M
ANU
SCR
IPT
ACCEPTED MANUSCRIPT
3
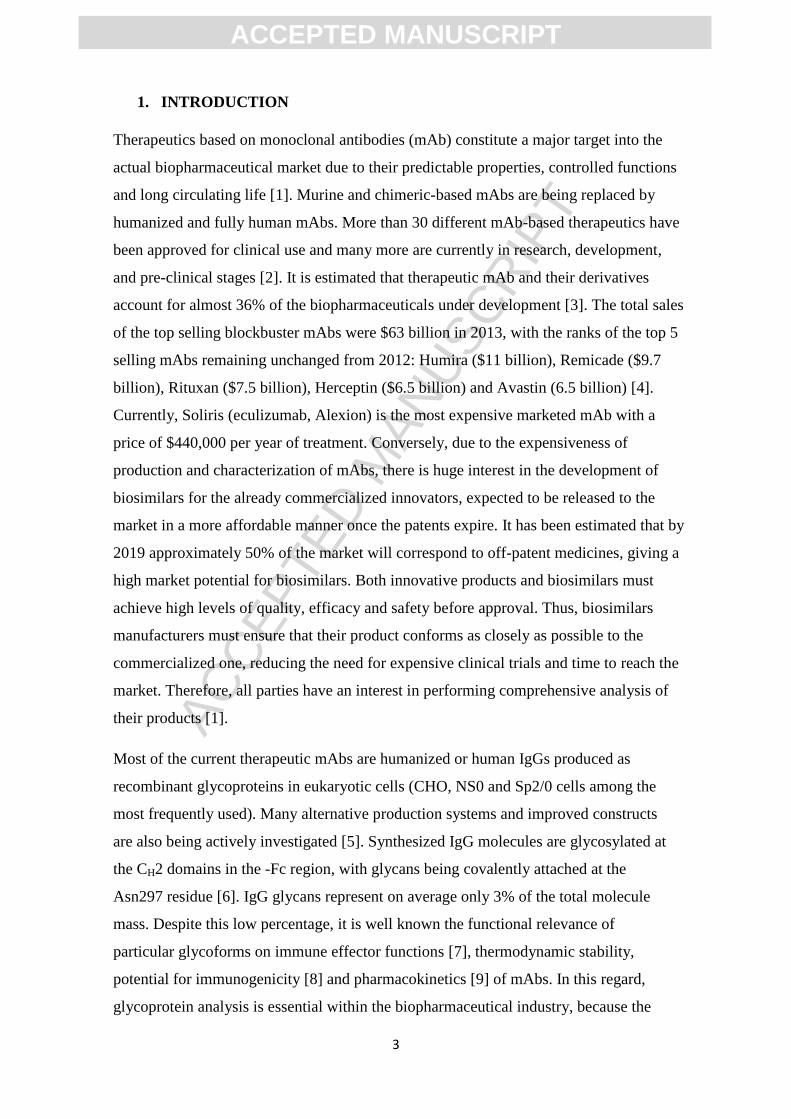
1. INTRODUCTION
Therapeutics based on monoclonal antibodies (mAb) constitute a major target into the
actual biopharmaceutical market due to their predictable properties, controlled functions
and long circulating life [1]. Murine and chimeric-based mAbs are being replaced by
humanized and fully human mAbs. More than 30 different mAb-based therapeutics have
been approved for clinical use and many more are currently in research, development,
and pre-clinical stages [2]. It is estimated that therapeutic mAb and their derivatives
account for almost 36% of the biopharmaceuticals under development [3]. The total sales
of the top selling blockbuster mAbs were $63 billion in 2013, with the ranks of the top 5
selling mAbs remaining unchanged from 2012: Humira ($11 billion), Remicade ($9.7
billion), Rituxan ($7.5 billion), Herceptin ($6.5 billion) and Avastin (6.5 billion) [4].
Currently, Soliris (eculizumab, Alexion) is the most expensive marketed mAb with a
price of $440,000 per year of treatment. Conversely, due to the expensiveness of
production and characterization of mAbs, there is huge interest in the development of
biosimilars for the already commercialized innovators, expected to be released to the
market in a more affordable manner once the patents expire. It has been estimated that by
2019 approximately 50% of the market will correspond to off-patent medicines, giving a
high market potential for biosimilars. Both innovative products and biosimilars must
achieve high levels of quality, efficacy and safety before approval. Thus, biosimilars
manufacturers must ensure that their product conforms as closely as possible to the
commercialized one, reducing the need for expensive clinical trials and time to reach the
market. Therefore, all parties have an interest in performing comprehensive analysis of
their products [1].
Most of the current therapeutic mAbs are humanized or human IgGs produced as
recombinant glycoproteins in eukaryotic cells (CHO, NS0 and Sp2/0 cells among the
most frequently used). Many alternative production systems and improved constructs
are also being actively investigated [5]. Synthesized IgG molecules are glycosylated at
the CH2 domains in the -Fc region, with glycans being covalently attached at the
Asn297 residue [6]. IgG glycans represent on average only 3% of the total molecule
mass. Despite this low percentage, it is well known the functional relevance of
particular glycoforms on immune effector functions [7], thermodynamic stability,
potential for immunogenicity [8] and pharmacokinetics [9] of mAbs. In this regard,
glycoprotein analysis is essential within the biopharmaceutical industry, because the

ACC
EPTE
D M
ANU
SCR
IPT
ACCEPTED MANUSCRIPT
4
glycan structure can affect the safety and efficacy of the final products [10]. The actual
development of either innovator or biosimilar mAbs considers the glycosylation profile
as a critical quality attribute (CQA), being a detailed characterization of mAb
glycosylation a key requirement at the early stages of development. Regulatory
authorities require the glycoform profile to be maintained within strict limits [6].
Glycosylation depends on multiple factors like the production system, selected clonal
population and manufacturing process, and may be either genetically or chemically
engineered [5]. The biopharmaceutical companies have achieved the establishment of
specific cell lines that can be expanded in serum- and protein-free media scaled-up to
manufacturing levels while maintaining appropriate glycosylation patterns and
minimizing immunogenic glycoforms [6]. Methods that allow the production of
recombinant mAbs bearing homogeneous oligosaccharides are now becoming available
[11]. In any case, an appropriate validation of the glycan structures synthesized is
crucial. Glycan analysis represents a major challenge, due to their inherited complexity,
lack of chromophore and the existence of various isoforms (both position and linkage)
[10]. According to the European Medicines Agency´s (EMA) guidelines
(EMA/CHMP/BMWP/403543/2010) several orthogonal techniques must be used to
identify and quantify glycoforms, glycosylation profiling and carbohydrate contents of
biosimilar mAbs. Biopharmaceutical glycosylation profiles are most commonly
determined on glycans released from the protein backbone either chemically or
enzymatically [10]. From this point, several techniques are applied to elucidate the
glycan structures found on mAbs. MS approaches such as MALDI-TOF MS or ESI-MS
can provide detailed structural information with short analysis times [12]. MALDI-TOF
MS is often used as a first step because its unique capacity to generate rapidly
information about the nature and diversity of glycans released from native, recombinant
glycoproteins or even more complex biological samples [13]. Glycan derivatization
prior to MS analysis, e.g. by permethylation, significantly improves the sensitivity of
detection of molecular ions, allows simultaneous analysis of neutral and sialylated
oligosaccharides in the positive ion mode, and provides predictable fragmentation that
gives characteristic “maps” of fragment ions at each amino sugar residue [13].
Structural assignments derived from the MALDI-TOF MS analysis is mainly based on
monosaccharide composition, fragmentation by MS/MS, enzymatic digest sequencing
and knowledge of the glycan.
ACC
EPTE
D M
ANU
SCR
IPT
ACCEPTED MANUSCRIPT
5
biosynthetic pathways [14]. As a drawback, MALDI-TOF MS analysis does not allow
distinguishing between isobaric glycans. Alternative strategies, like ion-mobility MS or
non-MS approaches such as Normal phase HPLC (NPLC) coupled to fluorescent
labelling can overcome this issue. Ideally a combination of both, MS and non-MS
approaches provide complete information regarding glycosylation profiles. NPLC of
fluorophore labelled glycans gives great sensitivity and can be performed with a range
of chromatography phases to give orthogonal separations [10]. For NPLC the
hydrophilic interaction liquid chromatography (HILIC) mode is predominantly used to
assign structures. Relative scales are produced by running purified glycan standards and
samples of interest are compared with standards’ chromatographic profiles. In addition,
glycan databases are available to compare and assign structures relative to retention
times (RT). The most common fluorescent tags used are 2-aminobenzamide (2AB), 2-
aminobenzoic acid (2AA) or 2-aminopyridine (2AP). Finally, capillary gel
electrophoresis with laser induced fluorescence (CGE-LIF) offers faster analysis times
than NPLC, though currently no databases are available to search mobility against
structures, and data need to be cross-correlated with either NPLC or MS approaches
when developing and validating methods [10]. In the current approach we have focused
on the application of NPLC and MALDI-TOF MS to determine the glycosylation
profile of two biosimilar mAbs of Trastuzumab.
2. MATERIALS AND METHODS
2.1. Reagents
Ammonium hydrogen carbonate, sodium chloride, iodoacetic acid (IAA), DTT, α-
cyano-4-hydroxycinnamic acid (HCCA), and hexanes were purchased from Sigma–
Aldrich. Glacial acetic acid, acetonitrile, ammonia, chloroform, DMSO, methanol,
propan-1-ol, sodium hydroxide pellets and TFA were from Romil. 2,5
dihydroxybenzoic acid (DHB) was from Fluka. Methyl iodide was obtained from Alpha
Aesar. Tris(hydroxymethyl)-aminomethane was from Fisher. 3,4-diaminobenzophenone
(DABP) was from Acros Organics. All aqueous solutions were prepared using ultrapure
(Milli-Q) water.

ACC
EPTE
D M
ANU
SCR
IPT
ACCEPTED MANUSCRIPT
6
2.2. Preparation of mAb samples
Both IgG1 mAbs biosimilars were obtained from two different clones of human-derived
cells and purified from the harvested medium using a Protein A column. The final
products were obtained in solution form as mAb1 and mAb2, both at 1 mg/ml in citrate-
Tris pH 8. Trastuzumab was obtained from providers (Herceptin®, Genentech, South
San Francisco, CA).
2.3. Oligosaccharide analysis by NPLC and fluorescence detection
2.3.1. Sample preparation
An amount of 200 g of mAbs were dissolved in 100 l of 0.1% Rapigest solution
(2mg/ml final solution), reduced with 45 mM DTT, 30 min at 60 °C, and alkylated with
10mM IAA, 20 min, room Tª in the darkness, in 100 mM ammonium bicarbonate
(Ambic). Glycosylated IgGs were digested with trypstin (Promega) (1:20) to reduce
proteins to the peptide level and finally N-linked glycans were released by digestion
with Peptide -N-Glycosidase F (PNGaseF, New England BioLabs) (1:25), 18 hours, 37
°C. Following digestion, acetonitrile was added up to 90% and N-glycans were purified
using HILIC microelution SPE in a 96-well format (Waters, Milford, MA, USA)
according to manufacturer´s guidelines. Briefly, samples were washed several times
with 90% acetonitrile and eluted with 1mM ammonium Tris citrate in 10% acetonitrile,
fractions were combined and speed-vac dried. Purified N-glycan samples were labelled
with 2AB using a GlycoProfile 2AB labelling Kit (Sigma, St. Louis, MO, USA) as
indicated by manufacturers. Finally, excess of fluorescent 2AB was removed using
HILIC microelution plates as described above.
2.3.2. HPLC fluorescence analysis
The 2AB labeled glycans (10 g per sample) were further analyzed by NPLC using a
HILIC column (XBridge Amide column, 2,5 m XP, 3x100 mm, Waters, Milford, MA,
USA) at 60°C and detected by an HPLC fluorescence detector (Hitachi LaChrom
Elite®), using excitation (330 nm) and emission (428 nm) wavelengths.
Separations were performed according to manufacturer´s recommendations, using 100
mM ammonium formate (pH 4.5) as mobile phase A and 100% acetonitrile as mobile
phase B. For glycan elution, the HPLC gradient was carried out as follows: after 45 min
ACC
EPTE
D M
ANU
SCR
IPT
ACCEPTED MANUSCRIPT
7
at 25% A and 75% B, flow rate 0.5 ml/min, the gradient went to 40% A and 60% B for
1.5 minutes and then to 100% A until minute 48, remaining at a flow rate of 0.2 ml/min
for two more minutes, returning to 25% A - 75% B for a further 12 minutes. N-linked
glycan structures were assigned to peaks based on comparison to reference structures
(2AB-labeled human IgG N-glycans, Prozyme, San Leandro, CA). G0, G1, and G2
refer to complex, neutral, biantennary structures with 0, 1, or 2 terminal galactose
residues, while G0F, G1F and G2F are the corresponding core with fucosylated
structures [15]. At least three run replicates were obtained for both biosimilars mAb1
and mAb2, and for Trastuzumab. The relative abundance (RA%) of each glycan in all
three samples is expressed as the average of the percentage of total peak area ± standard
deviations (RA±SD). Intra-assays CVs% were calculated between replicates for each
glycan in all three mAbs. The RA% of the glycans in the biosimilar mAbs were
compared with those annotated for Trastuzumab using two-tailed t-tests. In order to
compare the overall glycan profiles of the HPLC chromatograms, RA% data profiles
were compared using the Pearson product-moment correlation coefficient.
2.4. Oligosaccharide analysis by MALDI-TOF MS
2.4.1. Sample preparation.
100 μg of lyophilized and previously purified antibodies were reduced with 500 l DTT
(2mg/ml) in 0.6 M Tris buffer, pH 8.5, 1h, 37 °C and carboxymethylated with 500 l
Iodoacetic acid (12 mg/ml) in 0.6 MTris buffer, pH 8.5, 90 min, room temperature, in
the dark. Samples were then dialyzed 48 h at 4 ºC in 50 mM Ambic and lyophilized
prior to digestion with 0.3 mg of trypsin (1mg/ml) in 50 mM Ambic at 37°C, 16h.
Trypsin reaction was stopped by heating the samples at 100 ºC and finally with a few
drops of 5% acetic acid. Products were purified by SepPak C18 columns as described
[16], in order to separate glycopeptides from non-glycopeptides.
Glycopeptides were concentrated by speed vac, lyophilized and digested with 5 U of
PNGase F 37°C, 24h, for glycans release and separated from peptides by a SepPakC18
purification using sequential elution with 20% and 40% propanol. The glycan fraction
was concentrated by speed vac and lyophilized. Finally, N-glycans were permethylated
with NaOH as described [17]. Briefly, samples were dissolved in 500 l of a
NaOH/DMSO slurry and 500 l of methyl iodide, gently mixed for 20 min at room

ACC
EPTE
D M
ANU
SCR
IPT
ACCEPTED MANUSCRIPT
8
temperature. Permethylation was quenched by the addition of a few drops of ice-cold
water, followed by pH neutralization to approximately pH 6.5 with 5% acetic acid.
Glycans were then extracted with chloroform and purified with sequential fractions of
Acetonitrile by Sep-Pak C18. Samples were concentrated in a SpeedVac, lyophilized,
diluted in 10 μl methanol and mixed 1:1 with a DHB matrix solution (1mg/ml 80%
methanol) for further analysis by MALDI-TOF MS.
2.4.2. MALDI-TOF MS analysis.
MALDI-TOF MS analysis was performed on a Voyager-DE sSTR MALDI-TOF
(PerSeptive Biosystems, Framingham, MA, USA) in the reflectron mode with delayed
extraction. The instrument was calibrated externally using a standard mixture containing
des-Arg1-bradykinin (molecular mass 904.46 Da), angiotensin I (molecular mass
1296.68 Da), human [Glu1]-fibrinopeptide B (molecular mass 1570.67 Da),
adrenocorticotropic hormone (ACTH)-(1–17) (molecular mass 2093.08 Da), ACTH-
(18–39) (molecular mass 2465.19 Da) and ACTH-(7–38) (molecular mass 3657.92 Da).
Data were acquired using Voyager 5 Instrument Control Software and were processed
using Data Explorer MS processing software from Applied Biosystems. Final spectra
were obtained as an average of 500 shots at different laser irradiation positions. Two
replicates were obtained per sample. Further MS/MS analyses of peaks observed in the
MS spectra were carried out using a 4800 MALDI-TOF/TOF (Applied Biosystems)
mass spectrometer. The potential difference between the source acceleration voltage and
the collision cell was set to 1 kV, and argon was used as collision gas. The 4700
calibration standard kit, calmix (Applied Biosystems), was used as the external calibrant
for the MS mode, and [Glu1] fibrinopeptide B human (Sigma) was used as an external
calibrant for the MS/MS mode. MALDI spectra were further analyzed using the
Glycoworkbench software suite [18]] which allowed assigning glycan masses to the
corresponding oligosaccharide structures.
ACC
EPTE
D M
ANU
SCR
IPT
ACCEPTED MANUSCRIPT
9
3. RESULTS
3.1. N-Linked Glycosylation profile of mAb biosimilars by HPLC analysis coupled
to fluorescence detection
N-linked glycans from mAb1, mAb2 and Trastuzumab were released with PNGase F
and fluorescently labeled with 2AB prior to HILIC separation coupled to NPLC
analysis. Resultant N-glycan profiles are shown in Figure 1 whereas RT and abundance
(RA%) of each glycan isoform have been included in Table 1. Four major peaks were
observed in the chromatogram of the three mAbs: G0F, G1Fa, G1Fb and G2F,
representing 90% of the total glycan population. G1Fa and G1Fb, two isomeric glycans
with the same molecular weight but different oligosaccharide structural distribution,
appeared in the chromatogram at different RT (12.27±0.08 and 12.86±0.08 minutes
respectively). Relative quantification of glycan abundance was also carried out,
allowing us to compare between the tested mAbs (Table 1). Thus, while Trastuzumab
and mAb2 shared the same pattern of G0F>G1Fa>G1Fb>G2F, the profile seen for
mAb1 was different for the most abundant glycans: G1Fa>G0F>G2F>G1Fb. The rest of
the oligosaccharides seen represented less than 10% of the total glycan population.
Finally, although not abundant (<6.5% in total for all cases detected), some sialic
residues were found in the mAbs (indicated as sial in Table 1, i.e. G1Fa_sia), barely
detected in Trastuzumab (<1% in total). In general CV% values were lower than 10%
but for the less abundant glycans such as the syalylated ones, CV% could reach 35%.
When samples were compared between themselves, RA% were quite different between
those seen in the biosimilar mAbs and Trastuzumab, with p-values<0.01 in most cases
(table 1). Comparison of the glycan profiles of the three mAbs using the Pearson
product-moment correlation coefficient indicated that the overall glycan profile of the
mAb2 (0.995) was closer to Trastuzumab than mAb1 was to the later (0.965).
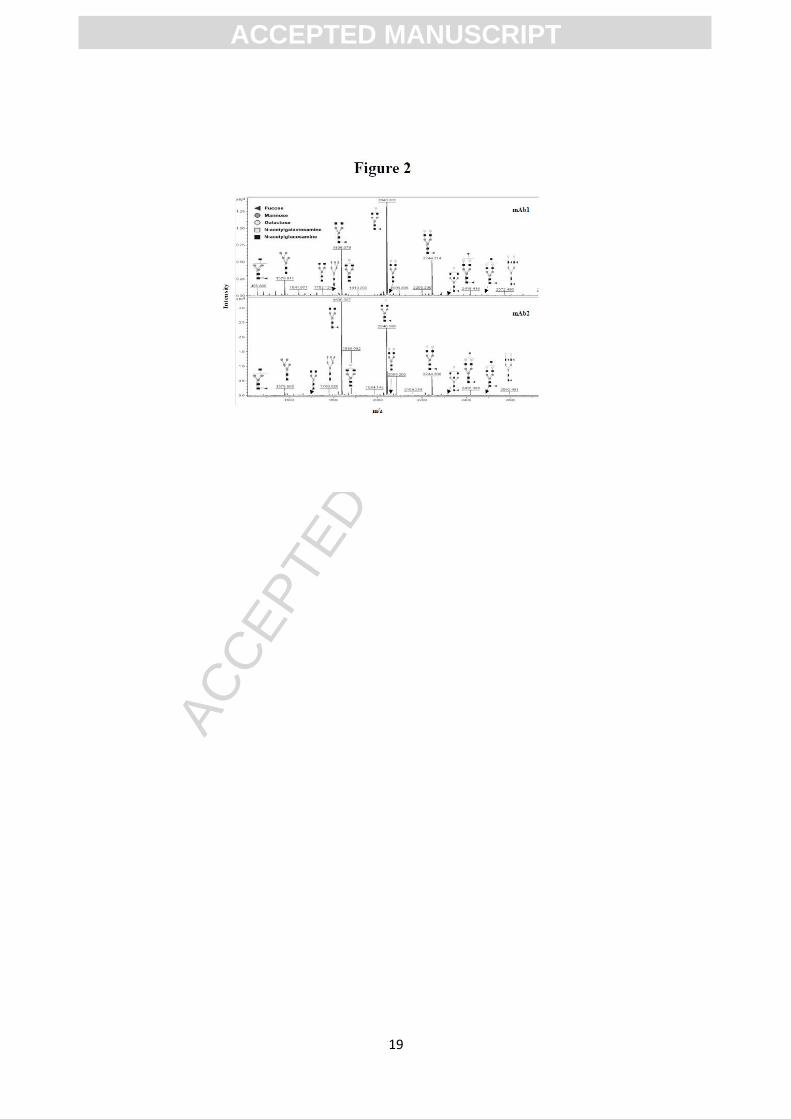
3.2. N-linked Glycosylation profile by MALDI-TOF MS analysis
MALDI-TOF MS analysis of derivatized glycans provided spectra for mAb1 and mAb2
(Figure 2), with masses correlating to G0F, G1F, and G2F as the most abundant
oligosaccharides (see Figure 3 for glycan nomenclature, molecular weight and
correlation with the biantennary structure). The MS spectrum of the glycans linked to
Trastuzumab has not being included for simplicity, but it presented the same peaks seen
ACC
EPTE
D M
ANU
SCR
IPT
ACCEPTED MANUSCRIPT
10
with both mAbs (data not shown). Although MALDI-TOF MS analysis was mostly
used to confirm the molecular structures detected by NPLC, the peak intensities from
the permethylated glycans indicated a relative abundance similar to the variations seen
by liquid chromatography, in agreement with previous reports [19]]. Thus, at least for
the most abundant glycans, the relative abundance in MALDI (considering peak
intensities) and in the NPLC approach (based on fluorescence intensities) appeared as
follows: G1F>G0F>G2F in the mAb1 and G0F>G1F>G2F in the mAb2. We could not
distinguish between different isoforms of G1F (G1Fa and G1Fb), sharing the same
molecular weight. Finally, small signals corresponding to bi- and tri-antennary
sialylated glycan residues of m/z: 2401 Da (G1F + sial), 2431 Da (G2 + sial), 2605 Da
(G2F + sial) and 3054 Da (triantennary fucosylated with one sialic acid) were detected
in the MALDI analysis of the sample mAb2 (not shown in the spectra), but not in the
mAb1. This is most likely due to loss of sialic acid during sample handling, as
permethylated sialylated glycans are very stable on MALDI and can be observed at very
high sensitivity as previously demonstrated [20].
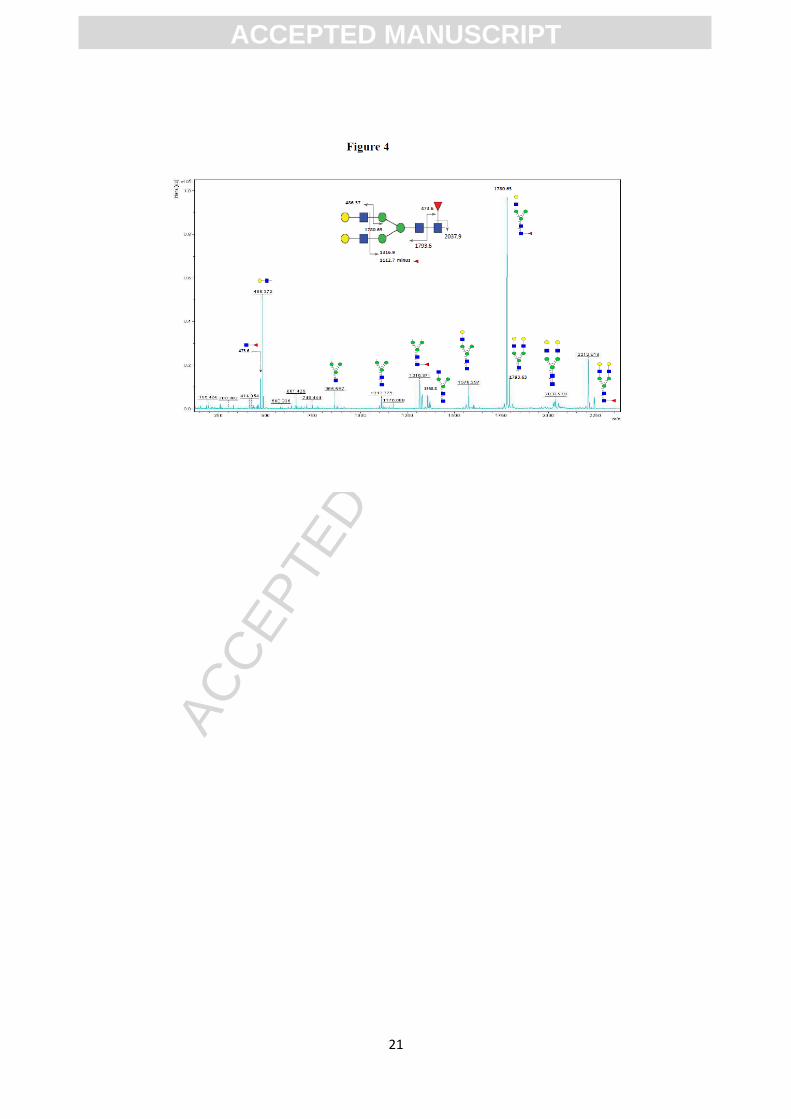
Tandem MS/MS spectra were acquired for some of the glycans detected (i.e. for m/z:
1386, 2040, or m/z: 2244 Da). Figure 4 includes an example of MS/MS fragmentation
for the glycan G2F (m/z: 2244,14 Da). Structural assignment in both, MS and tandem
MS/MS analysis was performed using the Glycoworkbench suite [18].
4. DISCUSSION
In the current work, we applied two alternative but complementary strategies to analyze
the N-glycomic profile of two purified mAbs tested as biosimilars candidates for
Trastuzumab: NPLC coupled to glycan fluorescent labeling and MALDI-TOF MS. Both
methodologies included a first step of enzymatic N-glycan releasing under non-
denaturing conditions [13,14] previous to tryptic digestion in order to reduce protein
complexity down to the peptide level. This reduction in complexity provides better
access for the PNGase F to cleave off the intact glycan from the protein side of the
antibodies.
Separation and detection of 2AB-labeled glycans by NPLC allowed identifying almost
100% of the glycan composition in both mAb candidates, including four major glycans
(G0, G1Fa, G1Fb and G2F) and 21 minor ones, but no less important oligosaccharides.
The identification was done by comparing the elution patterns of the analyzed mAbs
ACC
EPTE
D M
ANU
SCR
IPT
ACCEPTED MANUSCRIPT
11
glycans with commercially available glycan standards. We also distinguished between
different isobaric structures, such as G1Fa and G1Fb, due to the slight difference in
their respective RT. In the MALDI-TOF MS approach, the most intense peaks
correlated to the major glycans (G0, G1 and G2) and several less abundant
oligosaccharides were also identified, based purely on the mass of the different
carbohydrates, with no need for reference standards. Structural assignment was carried
out with the support of the GlycoWorkbench suite [18], a software that provides
appropriate tools to rapidly assemble and match structure models with MS data and
compared to diverse glycan databases to assess the best candidate for the m/z evaluated.
In contrast to the NPLC approach, the MALDI-TOF MS strategy did not discriminate
between isoforms sharing the same molecular weight, although other complementary
strategies could be employed in order to elucidate these structures, including further
enzymatic treatment and/or linkage analysis [13]. Finally, the use of 2AB standards in
the NPLC approach, and glycan derivatization by permethylation prior to MALDI-TOF
MS, significantly helped to detect the less abundant oligosaccharides, including
different sialylated forms (comprising less than 2% each one).
Sialylated glycans are usually difficult to analyze by MALDI-TOF MS and they can
easily lose a significant amount of sialic acid in the ion source or after the ion extraction
from the ion source. To reduce this loss, sialylated glycans can be analyzed in the linear
negative ion mode, which however means that neutral glycans cannot be detected at the
same time [13]. In the current approach we used permethylation as derivatization
strategy, which stabilizes the negative charge of sialic residues by converting them to
methyl esters, thus preventing sialic acid loss while significantly improving the
efficiency of positive ion formation [19], allowing us to simultaneously analyze neutral
and sialylated oligosaccharides in the ion positive mode.
Permethylation also prevents salt formation, which could complicate the mass spectrum
and impair the signal-to-noice ratio for the individual molecular ion species.
Furthermore, permethylated oligosaccharides become resistant to in-source
fragmentation because of the lack of hydroxyl groups which prevents the cleavage of
other glycosidic bonds [21]. Herein, small signals corresponding to bi- and tri-antennary
sialylated glycan residues were detected in both, NPLC and MALDI-TOF MS
approaches (G1F_sial, G2_sial, G2F_sial).
ACC
EPTE
D M
ANU
SCR
IPT
ACCEPTED MANUSCRIPT
12
Relative quantification in the NPLC 2AB-fluorescent approach was achieved by
comparing, once again, glycan intensities with already known glycan standards.
Chromatography of reductively aminated oligosaccharides is generally accepted as a
standard method of quantitation, in which the fluorescence correlates with the amounts
of individual components [19] The data presented in Table 1 correspond to the relative
abundances of each glycans presented as an average±sd of three independent runs per
sample, the mAb biosimilars candidates and Trastuzumab, confirming that the most
abundant glycans were the fucosylated species G0F, G1Fa, G1Fb and G2F. CV% values
of relative abundances for intra-assays were lower than 10% in most cases, only higher
than 20% in the less abundant glycans such as the sialylated ones. Comparison of both
mAb candidates with Trastuzumab indicated that the RA% were not similar to the
innovator (p<0.01), although the overall glycan profile of mAb2 was closer to the one
seen for Trastuzumab than the glycan profile of mAb1.
Although we initially used MALDI-TOF MS to confirm the molecular structure seen by
the NPLC approach by mass assignment, we found that relative peak intensities
detected in the glycan spectra were correlated, at least in the most abundant
oligosaccharides (G0F, G1F and G2F), with the relative abundances seen by 2AB-LC. It
is generally accepted that MS does not allow real quantitation for oligosaccharides
unless stable isotope-labeled analogs are incorporated as internal standards [19]. Despite
this assumption, several studies have demonstrated that MALDI-TOF MS analyses of
permethylated glycans provide reliable relative quantitation information based on signal
intensities, particularly when comparisons are made over a small mass range of single
ion peaks in the same spectrum [19]. Therefore, even though we decided to take the
quantitative data from the NPLC analysis, a more exhaustive processing of the MALDI
data could have been done with the permethylated glycans, by measuring the peak
height of the monoisotopic ions [M+Na]+ or the integrated peak area for the entire
isotopic cluster to obtain a more accurate relative quantitation.
Overall, comprehensive glycosylation profiling confirmed that the proportion of
individual glycans was different between the biosimilars and the innovator, although the
number and identity of glycans were the same. Our data indicated that at least in the
mAbs analysed, an optimization of the production parameters (i.e. cell growing
ACC
EPTE
D M
ANU
SCR
IPT
ACCEPTED MANUSCRIPT
13
conditions) appear to be necessary in order to deliver consistent and appropriate
glycosylation profiles closer to the innovative drug Trastuzumab. The next logical step,
which goes beyond the limits of this work, would be to understand the biological
consequences of the glycosylation profiles identified in both biosimilar candidates.
Nevertheless, in terms of glycan analysis, both methodological processes described here
provided an excellent performance in glycan separation from the protein antibody
fraction, delivering quite clean glycan profiles and no cross contamination with the Fc
region of the mAbs.
CONCLUSIONS
In this study, we have identified the most and the less abundant N-glycans in two mAbs
tested as biosimilars candidates for Trastuzumab. Both methods, NPLC coupled to
fluorescence detection and MALDI-TOF MS analysis of permethylated
oligosaccharides, have allowed us to identify and confirm the presence of individual
glycan molecules, by using standards or by specific mass assignment. In addition, an
estimation of the glycan percentage into these antibodies was seen in the NPLC method.
In summary, both strategies described herein have provided complementary and
supportive data of the N-glycan composition of the mAbs tested, and therefore could be
considered as routine methods for the characterization of glycan profiles of recombinant
mAbs.
ACKNOWLEDGEMENTS
Part of the work described herein was carried out during the GlycoTRIC training
session 2012 (Glycobiology Training, Research and Infrastructure Centre, Imperial
College London). Special thanks to Professor Anne Dell, for her critical comments and
support. The work has been partly funded by the Spanish National Health Institute
Carlos III (PI12-02680).
ACC
EPTE
D M
ANU
SCR
IPT
ACCEPTED MANUSCRIPT
14
FIGURE LEGENDS
Figure 1.
N-linked glycan profiles obtained by HPLC analysis from Trastuzumab, mAb1 and
mAb2. Glycan assignments were done by comparison with commercially available
standards.
Figure 2.
Full-scale MALDI-TOF MS spectra of mAb1 and mAb2 glycosylation sites. Structural
assignments were based on compositions assigned from molecular masses,
complemented by MS/MS information. All molecular ions are [M+Na]+. Structural
assignments are based on monosaccharide composition, fragmentation analyses and
knowledge of the glycan biosynthetic pathways.
Figure 3.
Biantennary oligosaccharide structure of the major glycans detected in the study. Sugar
symbols are those employed by the Consortium for Functional Glycomics
(http://www.functionalglycomics.org).
Figure 4.
MALDI TOF/TOF MS/MS spectrum of the permethylated N-glycan at m/z 2244.2 Da,
derived from the glycan spectrum of the mAb1. Assignments of the fragment ions
generated are shown.

ACC
EPTE
D M
ANU
SCR
IPT
ACCEPTED MANUSCRIPT
15
Table 1. Percentage of glycan composition from Trastuzumab and mAbs. The
retention times (RT) are given in minutes as an average of the RT seen in the three
samples, Trastuzumab, mAb1 and mAb2, with CV% values below 5% in both inter- and
intra-assays for the RT detected. The relative abundance (RA%) of each glycan isoform
is shown as the calculated area % ± SD. CV% are given for each isoform for all three
mAbs (calculared from the RA%). The p-values were calculated to compare between
the RA% of Trastuzumab and the biosimilar candidates (Trastuz vs mAb1 and Trast-
mAb2). Samples were run in triplicates. N-Acetylglucosamine (Nacg); sialic acid (sial);
Mannose (Man).
RT (min) Trastuzumab mAb1 mAb2 Trastuz vs.
mAb1
(p-value)
Trastuz vs.
mAb2
(p-value) (average±SD)
RA%
CV% RA% CV% RA% CV%
6.93±0.04 0,65±0.05 7.24 0.25±0.01 2.36 0.44±0.03 6.03 0.001 0.007
7.31±0.04 3.62±0.01 0.16 0.22±0.02 7.03 0.54±0.04 6.91 <0.001 <0.001
8.83±0.05 37.73±0.14 0.37 31.68±0.40 3.46 43.61±1.28 5.92 <0.001 0.012
9.89±0.05 1.02±0.02 1.95 3.73±0.11 2.89 1.10±0.05 4.62 <0.001 0.118
10.37±0.04 2.70±0.03 1.28 0.82±0.03 3.40 0.55±0.03 4.96 <0.001 <0.001
10.89±0.00 0.00 0.00 0.04±0.00 7.25 <0.001 0.220
11.23±0.65 0.76±0.01 1.21 0.00 0.13±0.01 5.38 <0.001 <0.001
11.48±0.09 0.19±0.00 0.37 0.19±0.01 3.34 0.00 0.975 <0.001
12.27±0.08 31.73±0.15 0.46 37.40±0.51 2.93 32.07±0.74 6.13 <0.001 0.581
12.86±0.08 10.90±0.09 0.79 10.68±0.17 3.08 10.95±0.29 5.94 0.044 0.823
13.84±0.13 0.11±0.00 0.63 0.50±0.03 6.51 0.33±0.02 4.65 <0.001 <0.001
14.48±0.21 0.25±0.00 0.85 0.24±0.01 5.83 0.21±0.01 6.44 0.529 0.023
15.21±0.45 0.65±0.00 0.22 0.03±0.00 4.00 0.00 <0.001 <0.001
16.22±0.02 0.00 0.47±0.02 4.22 0.48±0.02 4.52 <0.001 <0.001
17.12±0.11 6.36±0.00 0.04 12.30±0.30 3.18 6.46±0.28 6.33 <0.001 0.003
18.31±0.08 0.17±0.01 8.57 0.15±0.01 5.76 0.13±0.02 13.22 0.217 0.124
19.47±0.02 0.00 0.22±0.01 2.48 0.09±0.01 8.07 <0.001 <0.001
21.32±0.01 0.00 0.08±0.02 19.70 0.08±0.01 12.29 0.006 0.002
21.63±0.04 0.86±0.03 3.37 0.08±0.02 21.88 0.09±0.01 12.38 <0.001 <0.001
23.25±0.51 0.06±0.00 34.57 0.02±0.00 19.50 0.06±0.01 21.65 <0.001 0.919
24.51±1.05 0.05±0.01 2.57 0.01±0.00 28.47 0.03±0.03 82.66 0.002 0.425
25.87±0.04 0.00 0.14±0.03 23.58 0.26±0.03 11.83 0.011 <0.001
27.48±0.98 0.34±0.24 0.38 0.01±0.00 10.10 0.03±0.00 14.29 0.282 0.343
Total 100.13%
99.43%
97.68%
ACC
EPTE
D M
ANU
SCR
IPT
ACCEPTED MANUSCRIPT
16
REFERENCES
1. Xie H, Chakraborty A, Ahn J, Yu YQ, Dakshinamoorthy DP, Gilar M, et al.
Rapid comparison of a candidate biosimilar to an innovator monoclonal antibody with
advanced liquid chromatography and mass spectrometry technologies. MAbs. 2010 Jul-
Aug;2(4):379-94.
2. Thompson NJ, Rosati S, Heck AJ. Performing native mass spectrometry analysis
on therapeutic antibodies. Methods. 2014 Jan 1;65(1):11-7.
3. Sinclair A. A Practical guide to biopharmaceutical manufacturing2006. Report
No.: B-S1-32-6.
4. Maggo K. Best selling monoclonal antibody. 2013.
5. Beck A, Wagner-Rousset E, Bussat MC, Lokteff M, Klinguer-Hamour C,
Haeuw JF, et al. Trends in glycosylation, glycoanalysis and glycoengineering of
therapeutic antibodies and Fc-fusion proteins. Curr Pharm Biotechnol. 2008
Dec;9(6):482-501.
6. Walsh G, Jefferis R. Post-translational modifications in the context of
therapeutic proteins. Nat Biotechnol. 2006 Oct;24(10):1241-52.
7. Shields RL, Lai J, Keck R, O'Connell LY, Hong K, Meng YG, et al. Lack of
fucose on human IgG1 N-linked oligosaccharide improves binding to human Fcgamma
RIII and antibody-dependent cellular toxicity. J Biol Chem. 2002 Jul 26;277(30):26733-
40.
8. Kaneko Y, Nimmerjahn F, Ravetch JV. Anti-inflammatory activity of
immunoglobulin G resulting from Fc sialylation. Science. 2006 Aug 4;313(5787):670-3.
9. Jones AJ, Papac DI, Chin EH, Keck R, Baughman SA, Lin YS, et al. Selective
clearance of glycoforms of a complex glycoprotein pharmaceutical caused by terminal
N-acetylglucosamine is similar in humans and cynomolgus monkeys. Glycobiology.
2007 May;17(5):529-40.
10. Domann PJ, Pardos-Pardos AC, Fernandes DL, Spencer DI, Radcliffe CM,
Royle L, et al. Separation-based glycoprofiling approaches using fluorescent labels.
Proteomics. 2007 Sep;7 Suppl 1:70-6.
11. Jefferis R. Glycosylation as a strategy to improve antibody-based therapeutics.
Nat Rev Drug Discov. 2009 Mar;8(3):226-34.
ACC
EPTE
D M
ANU
SCR
IPT
ACCEPTED MANUSCRIPT
17
12. Dell A, Morris HR. Glycoprotein structure determination by mass spectrometry.
Science. 2001 Mar 23;291(5512):2351-6.
13. Morelle W, Michalski JC. Analysis of protein glycosylation by mass
spectrometry. Nat Protoc. 2007;2(7):1585-602.
14. Canis K, McKinnon TA, Nowak A, Haslam SM, Panico M, Morris HR, et al.
Mapping the N-glycome of human von Willebrand factor. Biochem J. 2012 Oct
15;447(2):217-28.
15. Jefferis R. Glycosylation of natural and recombinant antibody molecules. Adv
Exp Med Biol. 2005;564:143-8.
16. Dell A. Glycobiology: A practical approach. In: Fukuda M KA, editors. Oxford
University Press, editor.1993. p. 187-222.
17. Dell A, Reason AJ, Khoo KH, Panico M, McDowell RA, Morris HR. Mass
spectrometry of carbohydrate-containing biopolymers. Methods Enzymol.
1994;230:108-32.
18. Ceroni A, Maass K, Geyer H, Geyer R, Dell A, Haslam SM. GlycoWorkbench:
a tool for the computer-assisted annotation of mass spectra of glycans. J Proteome Res.
2008 Apr;7(4):1650-9.
19. Wada Y, Azadi P, Costello CE, Dell A, Dwek RA, Geyer H, et al. Comparison
of the methods for profiling glycoprotein glycans--HUPO Human Disease
Glycomics/Proteome Initiative multi-institutional study. Glycobiology. 2007
Apr;17(4):411-22.
20. Antonopoulos A, North SJ, Haslam SM, Dell A. Glycosylation of mouse and
human immune cells: insights emerging from N-glycomics analyses. Biochem Soc
Trans. 2011 Oct;39(5):1334-40.
21. Lemoine J, Chirat F, Domon B. Structural analysis of derivatized
oligosaccharides using post-source decay matrix-assisted laser desorption/ionization
mass spectrometry. J Mass Spectrom. 1996 Aug;31(8):908-12.

ACC
EPTE
D M
ANU
SCR
IPT
ACCEPTED MANUSCRIPT
18
ACC
EPTE
D M
ANU
SCR
IPT
ACCEPTED MANUSCRIPT
19

ACC
EPTE
D M
ANU
SCR
IPT
ACCEPTED MANUSCRIPT
20
ACC
EPTE
D M
ANU
SCR
IPT
ACCEPTED MANUSCRIPT
21

ACC
EPTE
D M
ANU
SCR
IPT
ACCEPTED MANUSCRIPT
22
Graphical abstract
Related Documents