Nº 3 - Diciembre 2013 INFORMAL JOBS AND TRADE LIBERALISATION IN ARGENTINA Pablo Acosta - Gabriel Montes-Rojas Serie Documentos de Trabajo del IIEP http://iiep-baires.econ.uba.ar/ ISSN 2451-5728

Welcome message from author
This document is posted to help you gain knowledge. Please leave a comment to let me know what you think about it! Share it to your friends and learn new things together.
Transcript

Nº 3 - Diciembre 2013
INFORMAL JOBS AND TRADE LIBERALISATION IN ARGENTINA
Pablo Acosta - Gabriel Montes-Rojas
Serie Documentos de Trabajo del IIEP
http://iiep-baires.econ.uba.ar/
ISSN 2451-5728
Esta es una obra bajo Licencia Creative CommonsSe distribuye bajo una Licencia Creative Commons Atribución-NoComercial-CompartirIgual 4.0 Internacional.
Instituto Interdisciplinario de Economía Política IIEP-BairesFacultad de Ciencias Económicas, Universidad de Buenos Aires
Av. Córdoba 2122 - 2º piso (C1120 AAQ)Ciudad Autónoma de Buenos Aires, Argentina
Tel +54 11 4370-6178
http://iiep-baires.econ.uba.ar/
Los Documentos de Trabajo del IIEP reflejan avances de investigación de sus integrantes y se publican con acuerdo de la Comisión de Publicaciones.
L@s autor@s son responsables de las opiniones expresadas en los documentos.
Consejo Nacional de Investigaciones Científicas y TécnicasMinisterio de Ciencia, Tecnología e Innovación Productiva
Av. Rivadavia 1917 (C1033AAJ)Ciudad Autónoma de Buenos Aires, Argentina
Tel +54 11 5983-1420
http://www.conicet.gov.ar/
ISSN 2451-5728
Desarrollo Editorial: Lic. María Fernanda Domínguez
INFORMAL JOBS AND TRADE LIBERALISATION IN ARGENTINA
PABLO ACOSTAThe World Bank - [email protected]
GABRIEL MONTES-ROJASInstituto Interdisciplinario de Economía Política IIEP-Baires CONICET- UDESA and City University London - [email protected]
ABSTRACT
Rapid trade liberalisation can exert profound effects on labour markets. Domestic firms, to sustain compe-titiveness for survival, could react through cutting labour benefits to achieve cost reductions. Alternatively, trade liberalisation may alter the industry composition of firms changing the aggregate formality rates. This paper studies the relationship between trade liberalisation and informality in Argentina. Using manufacturing industry-level data for 1992-2003, the results confirm the hypothesis that trade increases informality in in-dustries that experience sudden foreign competition. This explains about a third of the increase in informality. Sectors with higher investment ratios are able to neutralize and reverse this effect.
Acknowledgements: We would like to thank Sebastian Galiani and Guido Porto for kindly sharing the data on ad valorem import import tariffs by manufacturing sector. The data and codes are available upon request to the authors.
The opinions expressed are those of the authors.
Keywords: informality; trade liberalization; Argentina
JEL Codes: J31, F16, 033

I. Introduction
Informal activity is a common feature in developing countries. Informality refers to the
lack of compliance with taxation and regulation by employers, and the lack of protection
and services that the government can provide to workers. Informality is a complex
phenomenon: in the Harris and Todaro’s (1970) view, the informal self-employment sector
is a “parking lot” where aspirants to formal salaried employment bid time; however, recent
evidence challenge this view and instead suggests that workers and firms may voluntarily
choose to have “informal” contracts to avoid unwanted or undervalued benefits (Maloney,
1999, 2004).
Recent works studied the main determinants of labour informality, highlighting
government interventions as playing a major role, through taxation and labour market
regulations (Johnson, Kaufmann & Zoido-Lobaton, 1998; Friedman, Johnson, Kaufmann &
Zoido-Lobaton, 2000; Fugazza & Jacques, 2004), or bureaucracy and corruption (Busato &
Chiarini, 2004; Choi & Thum, 2005; Dabla-Norris, Gradstein & Inchauste, 2008), among
other institutional and enforcement conditions. Income inequality has also been signalled as
an important driver of informality (Chong & Gradstein, 2007). Other studies have argued
that firms’ heterogeneity and limited access to credit and capital markets are more relevant
to explain the emergence of informal activities (Dessy & Pallage, 2003; Gordon & Li, 2005;
Amaral & Quintin, 2006; Antunes & Cavalcanti, 2007).
Rapid trade liberalisation can exert profound effects on labour markets. Aside from the
abundantly documented effects on employment levels and compensations, this paper looks
1
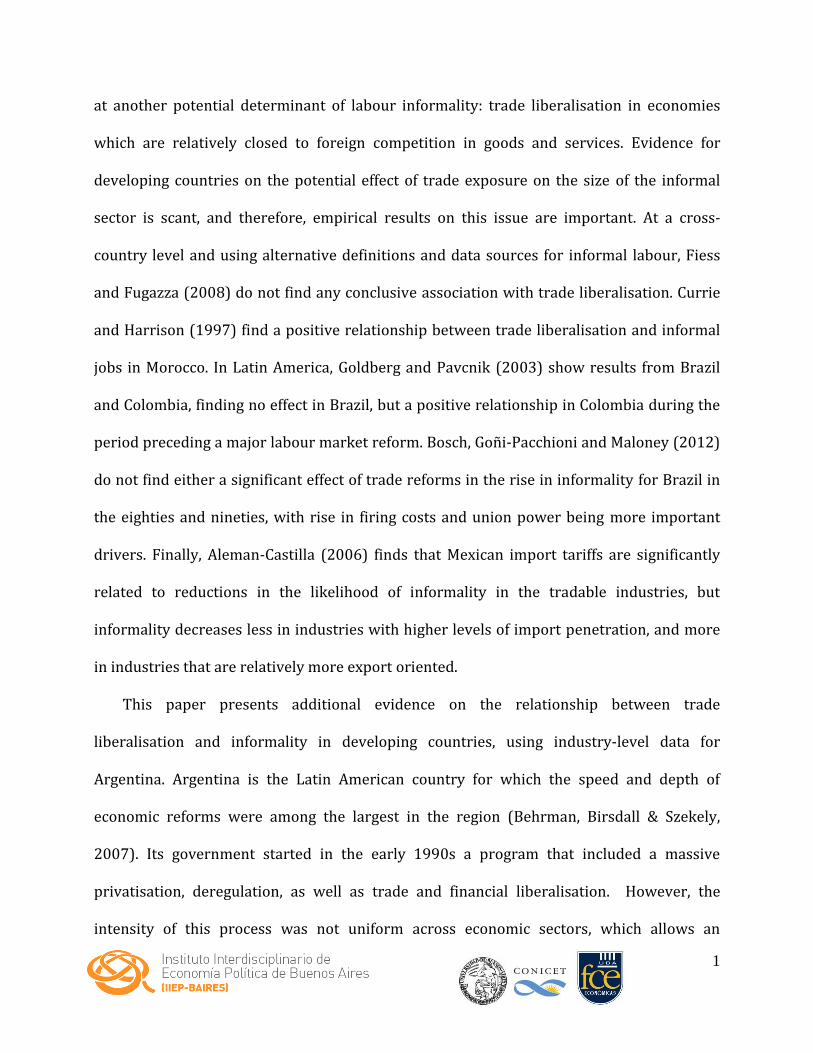
at another potential determinant of labour informality: trade liberalisation in economies
which are relatively closed to foreign competition in goods and services. Evidence for
developing countries on the potential effect of trade exposure on the size of the informal
sector is scant, and therefore, empirical results on this issue are important. At a cross-
country level and using alternative definitions and data sources for informal labour, Fiess
and Fugazza (2008) do not find any conclusive association with trade liberalisation. Currie
and Harrison (1997) find a positive relationship between trade liberalisation and informal
jobs in Morocco. In Latin America, Goldberg and Pavcnik (2003) show results from Brazil
and Colombia, finding no effect in Brazil, but a positive relationship in Colombia during the
period preceding a major labour market reform. Bosch, Goñi-Pacchioni and Maloney (2012)
do not find either a significant effect of trade reforms in the rise in informality for Brazil in
the eighties and nineties, with rise in firing costs and union power being more important
drivers. Finally, Aleman-Castilla (2006) finds that Mexican import tariffs are significantly
related to reductions in the likelihood of informality in the tradable industries, but
informality decreases less in industries with higher levels of import penetration, and more
in industries that are relatively more export oriented.
This paper presents additional evidence on the relationship between trade
liberalisation and informality in developing countries, using industry-level data for
Argentina. Argentina is the Latin American country for which the speed and depth of
economic reforms were among the largest in the region (Behrman, Birsdall & Szekely,
2007). Its government started in the early 1990s a program that included a massive
privatisation, deregulation, as well as trade and financial liberalisation. However, the
intensity of this process was not uniform across economic sectors, which allows an

2
identification strategy by taking advantage of the variability in time and extent of trade
exposure and tariff regimes across industries in Argentina’s manufacturing sector.
The results in this paper suggest that informality has significantly increased in
manufacturing Argentinean sectors in which trade liberalisation has been more intense,
explaining around a third of the increase in informality between 1993 and 2003. Given that
trade liberalisation had a significant effect on reducing the cost of acquiring new
technology, we also find that sectors with higher investment ratios were able to neutralize
and reverse this effect. These results hold after controlling for other sector characteristics,
such as the export/import orientation of the sector, size, and industry- and time-specific
fixed-effects, as well as general macroeconomic shocks.
The paper is organized as follows. Section II discusses the effect of trade on formality.
Section III presents recent trade exposure and informality trends in Argentina. Section IV
shows results at the industry level of the link between trade liberalisation and industry
informality differential. The paper concludes with some brief comments and interpretation
of the results in section V.
II. Informality and Trade
The effect of trade on formality can be decomposed into a within-industry effect, which
corresponds to the response of the firms in a given industry with respect to their workers’
formality, and between-industry effect, in which workers move to other industries with
more or less formality.

3
Regarding the between-industry effect, formal firms may respond to the intensified
competition from abroad by laying off workers who subsequently seek employment in the
informal sector. Depending on their qualifications, workers have different degree of
between-industry mobility.
Regarding the within-industry effect, in developing countries, low enforcement of
labour market regulations determines that firms have greater flexibility to adjust to trade
exposure by self-selecting into different degrees of formality. Goldberg and Pavcnik (2003)
argue that trade exposure increases pressure on firms “to try to reduce labour costs by
cutting worker benefits, replacing permanent workers with part-time labour, or
subcontracting with establishments in the informal sector, including home-based and self-
employed microentrepeneurs” (p. 464). In a similar vein, Revenga (1997) and Galiani and
Porto (2010) argue that trade protection produce rents that are partially absorbed by
workers in the form of wage premiums, namely unskilled unionized workers, and that the
removal of those rents can affect their wages negatively and presumably reduce their job
benefits.
There is also theoretical ground for the opposite effect, that is, trade liberalisation may
increase formality via a composition effect. Trade models predict that trade exposure have a
significant effect in the industry composition. Melitz (2003) argues that trade exposure
induces more productive firms to enter, less productive firms to reallocate towards the
domestic market and, simultaneously, force the least productive firms to exit. Thus, Aleman-
Castilla (2006) suggests that import tariff elimination could increase job quality by making
more profitable to some firms to enter the formal sector, forcing the less productive firms to
exit the industry, and inducing the most productive ones to engage in foreign trade.

4
Acosta and Gasparini (2007) argue that trade liberalisation also reduces the cost of
acquiring new technology through the reduction in the cost of imported capital goods. Using
an efficiency wage argument, if firms can upgrade to a better technology, they may be able
to offer better job conditions to its labour force in order to maintain the best workers, thus
increasing formality.
Between-industry analysis requires a longitudinal labour database that follows
individuals for subsequent waves. Unfortunately, Argentina’s household survey is a pooled
cross-section and not a panel. Thus, this paper only studies the within-industry effects by
analyzing the industry trends and by establishing potential causality with trade. We focus
on the manufacturing sector, where we can focus on the direct within-industry effect of
trade, in order to test for direction of the within effect. We evaluate the effect of trade using
the empirical model of Goldberg and Pavcnik (2003) described in detail in Section IV.a. This
model is extended to evaluate the potential effect of reducing the cost of acquiring capital
goods developed in Acosta and Gasparini (2007).
III. Trade Liberalisation and Informality Trends in Argentina
Argentina was a country relatively closed to international trade since the end of the
Second World War until the 1990s. This period was characterized by an import substitution
process, conceived for promoting industrialization based in national production. But the
country witnessed an important trade liberalisation process during the 1990s, mainly
through customs tariff reduction. Reforms included the end of sector-specific subsides with
protectionist goals, and a commercial agreement with neighbour countries (Brazil,

5
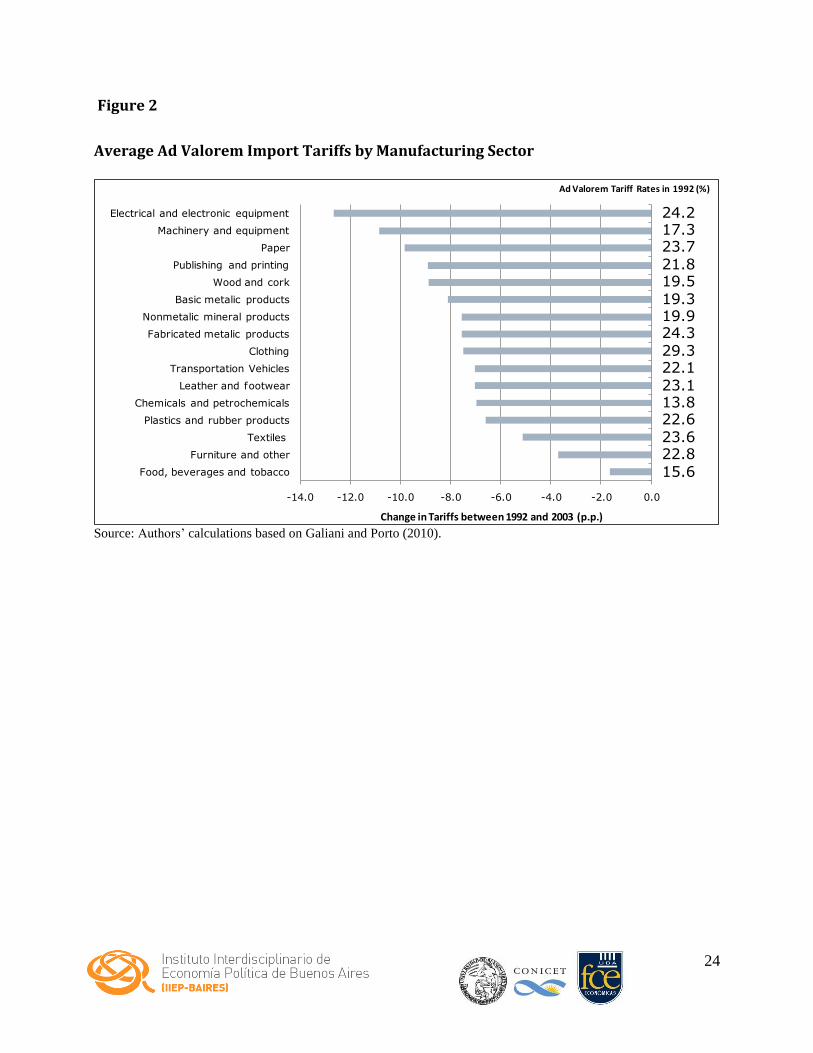
Paraguay, and Uruguay, called MERCOSUR). The largest import tariff reductions agreed at
the MERCOSUR level were implemented in wood, paper, printing, chemical and
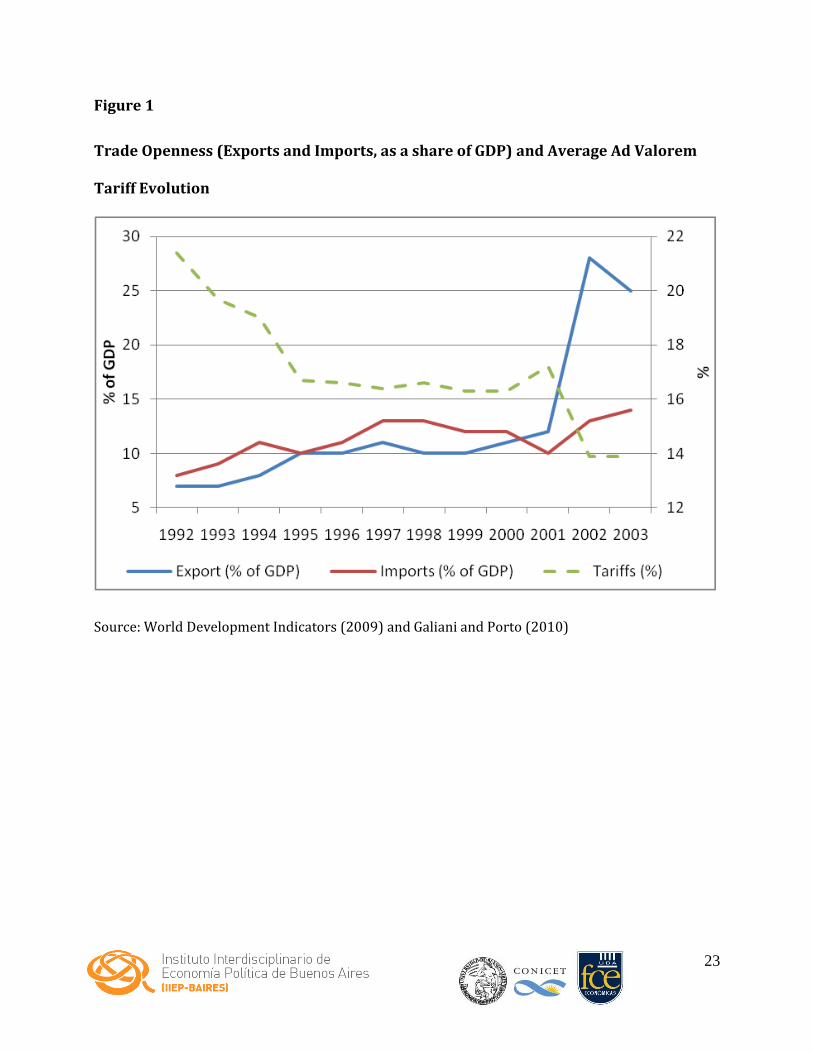
petrochemical, machinery, and electrical/electronic equipment. Average ad valorem
manufacturing import tariffs declined from an average of 21 per cent in 1992, to 17 per cent
in 1995, and 14 per cent in 2003 (Figure 1). As a result, trade openness (as measured by
imports plus exports as a share GDP) increased from 14 per cent in 1992, to 24 per cent in
1997, and to 39 per cent in 2003.
Contemporaneously with trade liberalisation, the 1990s was a period of economic
growth, deindustrialization, and labour market deregulation in Argentina. Macroeconomic
stability, an ambitious privatisation program, and reduction of state intervention, resulted
in a GDP growth of around 50 per cent during the decade until 2002, when Argentina
suffered a severe economic collapse.
1 Economic growth was not even across sectors: manufacturing industry, as a share of
value added, declined from 22 per cent in 1980, to 18 per cent in 1990, and to 15 per cent in
2002.
Although labour costs only decreased slightly in Argentina in the 1990s (Galiani, 2002),
there is evidence that government enforcement of labour regulations relaxed during this
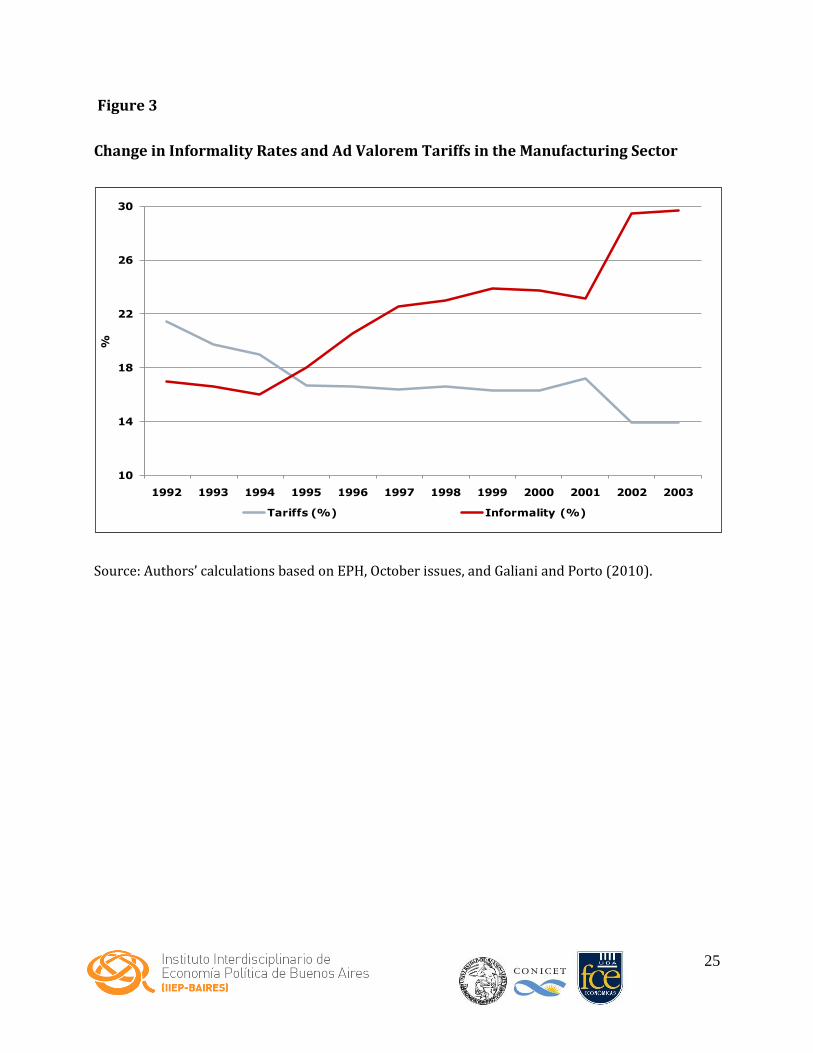
period (Ronconi, 2010). Informality rates, defined in this paper as “absence of social
security and other labour benefits,” increased considerably in the 1990s.2 While labour
informality in the manufacturing sector was in the order of 17 per cent in 1992, by 2003
this figure was around 30 per cent. Sectors where informality increased the most in this
period include food and beverages (34% of workers in the informal sector in 2003), textiles
(30%), clothing (52%), and leather and footwear (60%) (Table 1). These are typical
6
“unskilled” sectors in Argentina, with two-third of the workers without a secondary school
degree, when on average half of the workers in the manufacturing sector have completed
secondary education (Acosta & Montes-Rojas, 2008). These sectors experienced between
1992 and 2003 a tariff protection rate reduction of two to seven percentage points (Figure
2).
Other sectors experienced more drastic reductions in tariff protection: electrical and
electronic equipment, machinery and equipment, paper, wood and cork, and publishing and
printing. In these sectors, tariffs declined between 9 and 13 percentage points over the
period 1992-2003. But informality rates did not increase as much in comparison with other
sectors, and as of 2003 less than one-third of the workers in the sector were informal. With
the exception of wood and cork, these sectors are relatively “high-skilled”, with more than
half of the workers with completed secondary education. Wood and cork, and paper, are
also among the sectors that have been exposed to important technological change, through
the acquisition of foreign machinery and equipment (Acosta & Gasparini, 2007).
While previous evidence for Argentina has suggested that this trade liberalisation
episode had an effect in the labour market through an increase in the relative wages of high-
skilled workers with respect to less-skilled counterparts (Galiani & Sanguinetti, 2003;
Galiani & Porto, 2010), this paper explores instead a causal link between trade liberalisation
and informality, by exploiting variability in tariff reductions across sectors. A priori, simple
correlation of tariff reductions and informality surge seems to suggest a link among both
episodes (Figure 3). But since manufacturing sectors differ in terms of typical workers’
skills, size, as well as the exposure to technological change among other dimensions, it is
important to control for observed and unobserved characteristics of sectors to avoid

7
imputing spurious causality effects. The next section presents a two-step methodology to
isolate the effect of trade protection from other confounding effects that operate
simultaneously with trade liberalisation.
IV. Industry Informality Differentials and Trade Liberalisation
IV.a. Empirical Methodology
This paper follows a two-step methodology originally proposed in Goldberg and
Pavcnik (2003), which is the standard methodology in empirical trade a labour market
studies.3 In the first stage, industry level informality propensity indicators are estimated
using labour and household survey data.
Let Infijt be an indicator variable for whether the worker i is informal (see section III.b
for a definition of informality) in industry j = 1,..., J, and time t = 1,...,T. Arguably, Infijt is the
result of a bargaining process between the hiring firm, the worker, and (potentially) the
Government. The multidimensional nature of informality determines that several factors
may affect the probability of being a formal worker. Eventually, this outcome would depend
on the observable attributes of the individual, Hit, containing age, age squared, education,
gender, and geographic location, unobservable attributes ijt, and the industry Fjt. A
reduced-form relationship will imply:
T
t
J
j
ijtjtjttitijt FHInf1 1
(1).
The set of coefficients {βjt} captures the variation in the informal employment that cannot
be explained by worker characteristics, but rather is attached to industry affiliation. These
8
coefficients represent the industry-specific propensity to informality, which by construction
are orthogonal to individual characteristics.
To evaluate the effect of trade on the industry-specific propensities towards creating
informal jobs, a reduced-form specification at the industry level is proposed. Let Tariffjt, Mjt,
and Xjt be the average tariff level, imports and exports by industry, respectively, where the
latter two are normalized by the gross value of production (GVP) in each industry and year.
Each variable has a different interpretation and captures different potential effects of trade.
Tariff is a proxy for the actual level of protection; M measures the foreign penetration in a
particular industry, that is, it shows the actual effect of competition from abroad in a
particular industry; and X measures the industry competitiveness abroad. Note that Tariff
and M captures different effects. For instance, there could be an industry with low tariffs
but low imports penetration if the country has a clear comparative advantage in this
industry vis-à-vis the rest of the world; eventually this may or may not be reflected in Xjt.
Note that given that we use a fixed-effects specification, we are already controlling for
industry-specific comparative advantages.
Moreover, let Yt be year dummies and Fj industry dummies. The effect of trade on
informality can be measured by a regression of the industry-specific informality indicators
on tariffs levels, exports, imports and other controls:
J
j
T
t
jtttjjjtjtjtjt YFMXTariff1 1
11 (2).
Following this methodology, the coefficients on Tariff, X and M would not be capturing
industry differences in worker composition correlated with trade indicators because in
9
order to obtain the industry-specific informality indicators, equation (1) already controlled
for workers characteristics. Similarly, as suggested in Pavcnik et al. (2004), because worker
characteristics are allowed to differ year by year in the computation of the informality
industry indicators, all of the economy-wide changes in the propensity to become informal
associated with changes in labour supply over time are already taken into account.
Moreover, the time dummies also capture other important effects, such as changes in the
real exchange rate and changes in GDP. Note that the joint inclusion of time and industry
dummies made the latter redundant. Equation (2) is estimated by fixed-effects least-
squares accounting for general forms of heteroscedasticity in the error term using Huber-
White standard errors clustered by industry and year.
As argued in Section II, if trade liberalisation also has the effect of reducing the cost of
acquiring capital goods, sectors that update their technologies should be able to face foreign
competition in better shape. In this case, we expect that sectors that invest the most may
have smaller effects in terms of formality. Thus we also consider in some specifications the
addition of the ratio of imports of capital goods by sector standardized by GVP.
The exports variable intends to capture how foreign competition affects firms’
behaviour, since it may lead them to reduce the burden of non-wage benefits to remain
competitive. However, this should not be associated with firms’ productivity, which may
also be related with informality (less productive firms could only remain in the market by
becoming informal). To explore this productivity channel, the GVP of the industry of
reference divided by the number of workers employed (a proxy for labour productivity) is
also included.

10
IV.b. Data
Labour market data to calculate informality rates by sector come from Encuesta
Permanente de Hogares (EPH), the only nationally representative household survey of
Argentina. For the period 1992–2003, repeated cross-sectional data are available, covering
28 urban areas that account for nearly two-thirds of the total country’s population.4 We
employed the October round of each household survey. The analysis is restricted to 16
manufacturing sectors, grouped according with survey statistical representation with the
ISIC Rev. 3 classification (Table 1 shows the sector classification employed). Workers
considered are male and female between 18 and 65 years old with positive earnings.
Education is measured as completed years of schooling: workers are classified into those
with (i) no high school degree, (ii) at most a high school degree, and (iii) a university
degree.5
Workers are classified as “informal” if they lack social security (pension and health
insurance) and other labour benefits (paid holidays and yearly bonuses). In case the worker
receives any of these benefits, he/she is classified as “formal”. Unfortunately, we are not
able to identify individuals who become voluntary to avoid changes in the burden of
formality, from those who negotiate with their employers to avoid losing their jobs, and
from those who lose a formal job and find a new informal one. The interpretation of the
results below should then take into account that we are estimating the effect of trade on
both voluntary and involuntary informal workers without making this distinction.
Trade data is from the Institute for the Integration of Latin America and the
Caribbean’s database of the Inter-American Development Bank. Sectors originally classified
according to the two-digit International Standard Industrial Classification (ISIC)
11
classification were matched to correspond to the 16 sectors considered. Data on machinery
and equipment gross investment by manufacturing sector (at current prices) comes from
Centro de Estudios de la Producción, Ministry of Economy. Gross value added (at current
prices) by manufacturing sector is available at the National Institute for Statistics and
Census.
Finally, the average ad valorem import tariffs by manufacturing sector come from
Galiani and Porto (2010). These originally come from official tariff schedules, which specify
the tariff rate levied on each item of the Harmonized System (HS). Each heading in the HS is
matched with its closest equivalent in the ISIC. Galiani and Porto (2010) explains with
additional details this matching process. To aggregate at each industry sector level, the
median is taken from the item belonging to each sector.
IV.c. Results
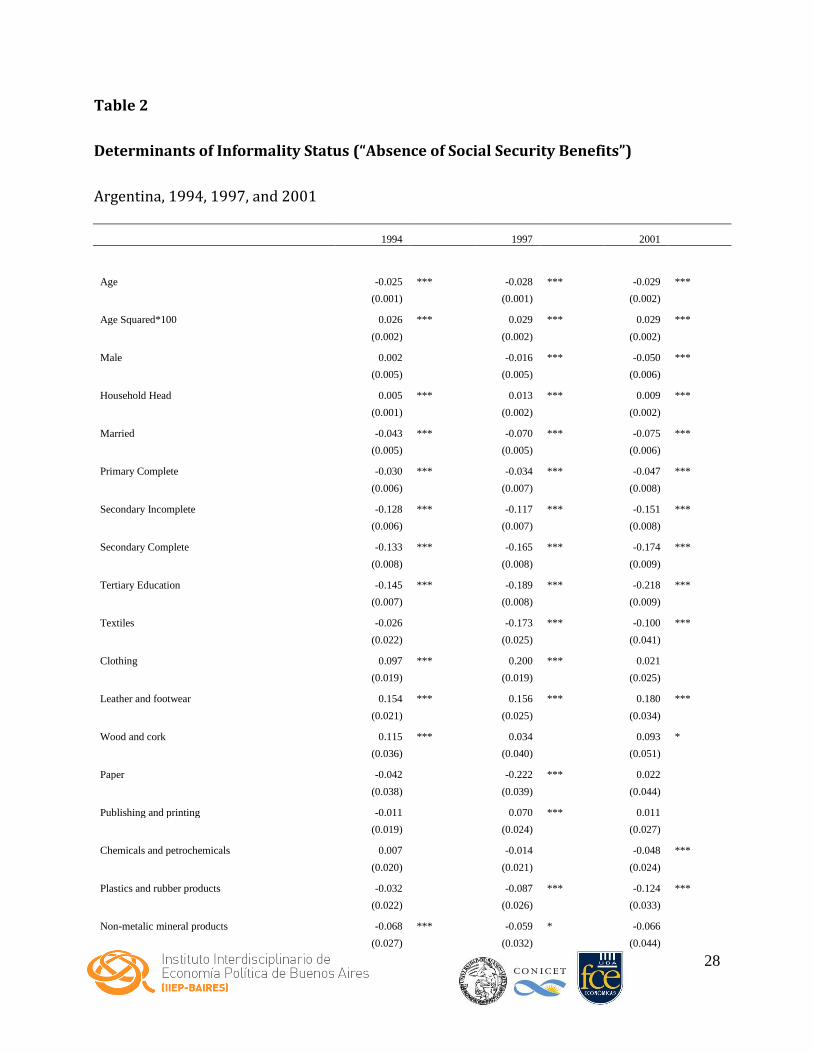
Table 2 shows for a subsample of the years considered (1994, 1997, and 2001) the
main results from equation (1) that correlates informality status with individual
characteristics, including sector of employment.6,7 As expected males, older, and more
educated workers have less likelihood to be informally employed. Also married individuals
have a lower propensity to work in the informal sector, while being the household head
increases it. In terms of sector of employment, the degree of significance varies from year to
year, though not the sign of the relationship with informality. Sectors such as metallic
products, machinery and equipment, and transportation vehicles are consistently
12
employing less informal workers with respect to food and beverages (the base category in
the regression), presumably due to higher unionization rates.
Table 3 in turn shows the set of industry-specific informality indicators (βjt) for the
period 1992-2003 as calculated following the regression specification in (1), but this time
setting the omitted industry category (food and beverages) to zero, and expressing all other
sectors as deviations from the employment-weighted average informality rate (Krueger &
Summers, 1988). As in Table 2, it confirms the existence of substantial differences in
informality levels and evolution across manufacturing sectors in Argentina, even after
accounting for differences in the composition of the workforce (age, gender, and education).
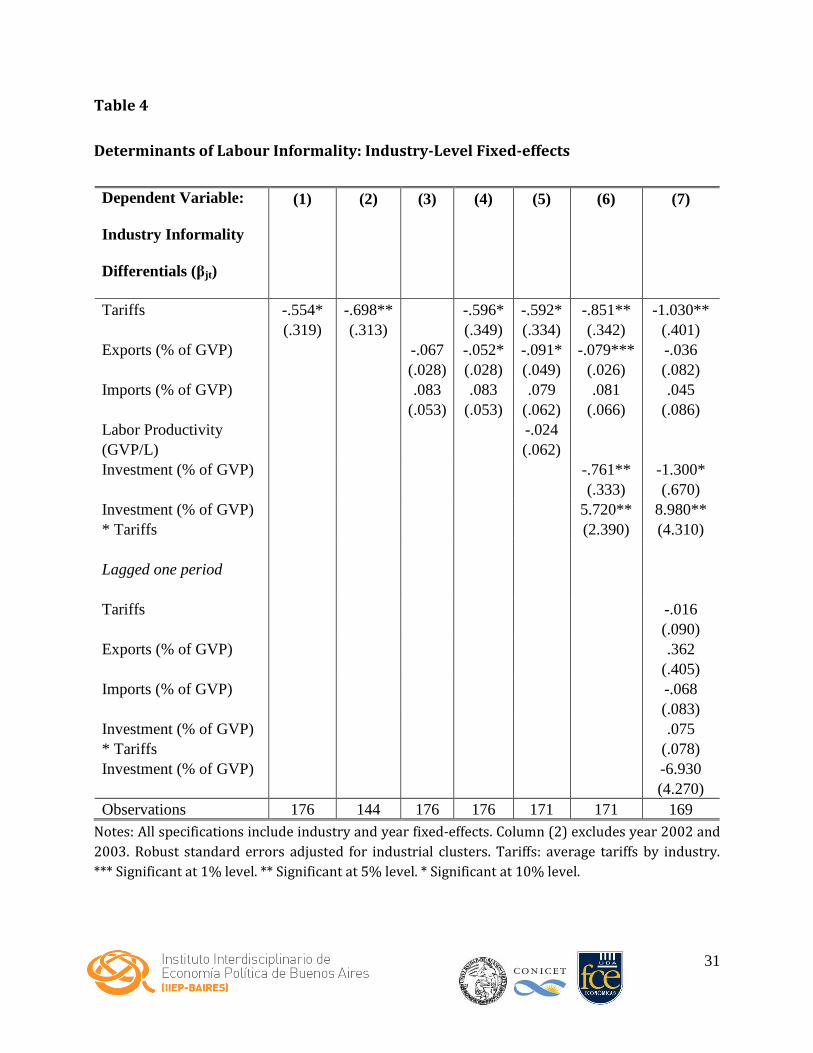
The main econometric results appear on Table 4. For comparison purposes when
using dynamic panel estimation (we lose one year of lag), the analysis is concentrated on
1993-2003 (1992 is the first period lag). We first consider a regression of the estimated
normalized industry-specific informality coefficients (βjt) on tariffs rates by industry,
controlling for industry and year fixed-effects (column 1). Tariffs induce a statistically
significant negative effect on informality, implying that a reduction of average tariffs by one
per cent produces an increment in informality rates by 0.55 per cent. Column 2 excludes
2002 and 2003 from the analysis for robustness given the inclusion of two severe crisis
years where informality grew substantially. The effect of tariffs increases in magnitude and
statistical significance. The rest of the analysis continues with those years included.
In columns 3 and 4 we add exports and imports (standardized by the value of
production) as additional covariates. While imports and exports per se are not statistically
significant, the effect of tariffs on informality is robust to the inclusion of these variables,
implying that a similar reduction in tariffs would produce an increment in informality of 0.6

13
per cent. Exports and imports show opposite signs, implying the manufacturing sectors
with high export ratios have less informality, while high import ratios increase informality.
This implies that the sector performance on international markets affects the formality
rates of its labour force. These results are consistent with the hypothesis that trade
openness make firms to reduce job formality in order to cope with international
competition. However, this can be seen as a partial equilibrium effect, which does not
account for the full (general or global) effect of trade openness and there might be potential
endogeneity bias in our estimates.
First, governments might reduce tariffs in those industries where organized labour
was weaker (and hence informality larger). This does not generate bias as long as the fixed-
effects by industry capture the nature of labour organization, which is the case in Argentina
where historical labour unions are attached to different industries. Moreover, these political
economy considerations for tariff settings are less of a concern since tariff levels in
Argentina are actually not determined at the sole discretion of the country, but at the
MERCOSUR level (in agreement with governments from neighbouring countries participant
in the trade bloc). Thus, we are confident that tariffs can be used to identify exogenous
changes to trade policy that are not affected by informality
Second, tariff reductions (and presumably other measures that affected labour
informality) might have been compensated by the government by increasing industry-
specific subsidies or non-tariff trade barriers. This would determine that the estimated
effect of tariffs on informality would be biased upwards, and therefore, tariffs might have
induced a larger (negative) effect. We were not able to construct a panel of government
subsidies and non-tariff barriers by industry, and therefore, our estimates should be
14
considered as a lower bound (in absolute value), with potentially larger effects.
Nevertheless it should be emphasized that much of the trade liberalisation policy in the
1990’s was accompanied with other policies of general liberalisation in the economy with
overall reduction in state subsidies across all sectors.
Third, tariff elimination could make more profitable to enter and less profitable
firms to exit the industry, and promote export oriented firms (Acosta & Montes-Rojas,
2008). Our own estimates on the effect of exports on informality (column 3) suggest this
hypothesis. Thus, the change in the industry composition after trade opening can exert an
effect on the sector’s informality levels. We test this hypothesis by including the ratio of GVP
to employment in each industry, a proxy for labour productivity, but we do not find
evidence that less productive firms are associated with higher informality levels (column 5).
Fourth, trade liberalisation also reduces the cost of acquiring new technology
through the reduction in the cost of imported capital goods, as argued for Argentina in
Acosta and Gasparini (2007). Using an efficiency wage argument, if firms can upgrade to a
better technology, they may be able to offer better job conditions to its labour force in order
to maintain the best workers. We test for this hypothesis by including the ratio of
investment to gross value of production in the regression, as well as its interaction with the
tariffs variable. This last variable is thus intended to identify simultaneous effects of trade
liberalisation on the industry, and in particular, changes in the technology. The results in
column 6 show that, as expected, sectors that invest more have a lower incidence of
informality. And that they also have a lower impact of tariffs reduction on informality. For
instance, a sector with no investment would have an increment of 0.85 percent in
informality after a 1 per cent reduction in tariffs. However, a sector with an average

15
investment rate of 10 per cent would have an impact of only 0.28 per cent (= 0.85 –
5.72×0.1). Further, a sector with an investment ratio above 15 per cent would have a
positive effect of tariff reduction on informality.
As a robustness check of the previous results, we also introduce the lags of the
considered covariates, together with the lag of the dependent variable. The results in
column 7 confirm that there is a negative relation between trade liberalisation and
informality, again with an average elasticity close to 0.6 in absolute terms. In fact, the
results show that only the contemporaneous effect is significant. This determines that the
sectors adjust relatively fast to trade openness. The lagged dependent variable appears as
non-statistically significant in both specifications and therefore, the fixed-effects model
does not require a dynamic specification (with the consequent use of instruments for
eliminating potential dynamic panel bias). Further analysis reveals that the inclusion of the
year dummies produces this lack of significance, which means that many sectors behave
similarly across periods and that they are affected by common shocks. The interaction of
investment and tariffs produces similar effects.
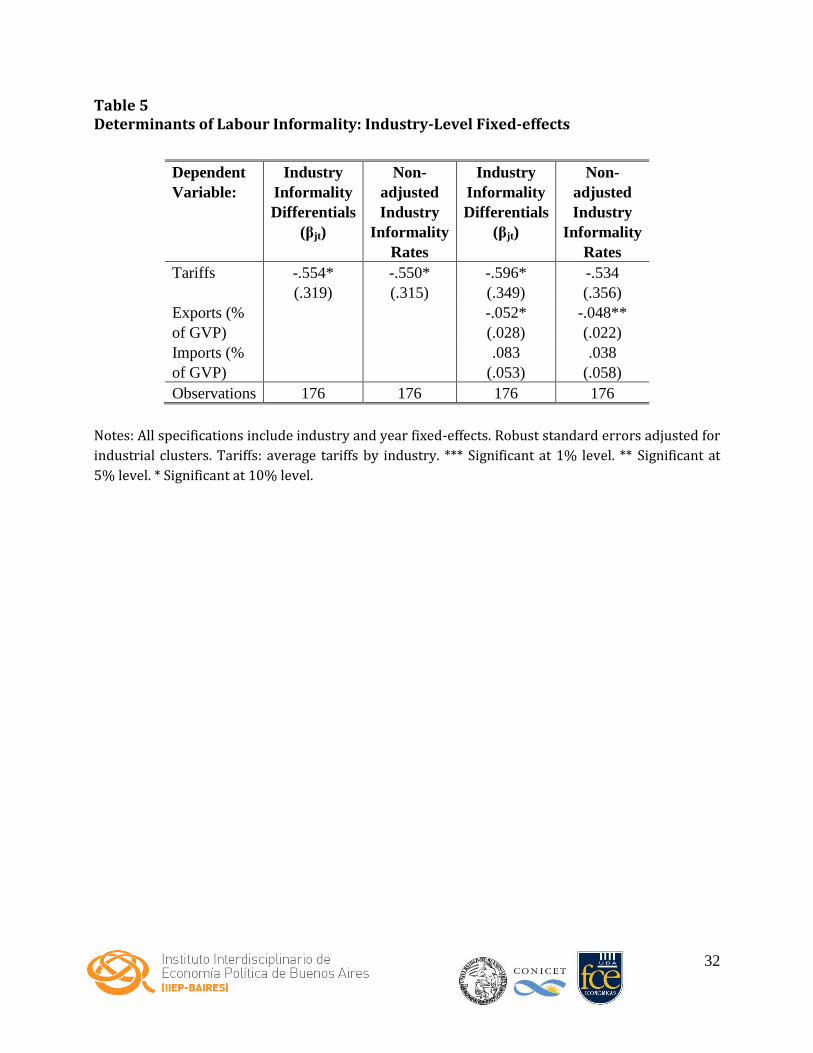
As mentioned before, the dependent variable in Table 4 corresponds to the set of
industry-specific informality indicators (βjt) that net out individual characteristics. But as an
additional robustness check, Table 5 reports estimates using as dependent variable the raw
(unadjusted) informality ratios by industry as the dependent variable, already presented in
Table 1. As seen, the main conclusions with respect to the role of tariffs, exports, and
imports in explaining informality are unaffected when we use informality rates (though
statistical significant levels vary). But given that this alternative variable omits individual
16
factors not related to industry effects, we prefer to use the corrected measure proposed by
Goldberg and Pavcnik (2003) for the rest of the analysis.
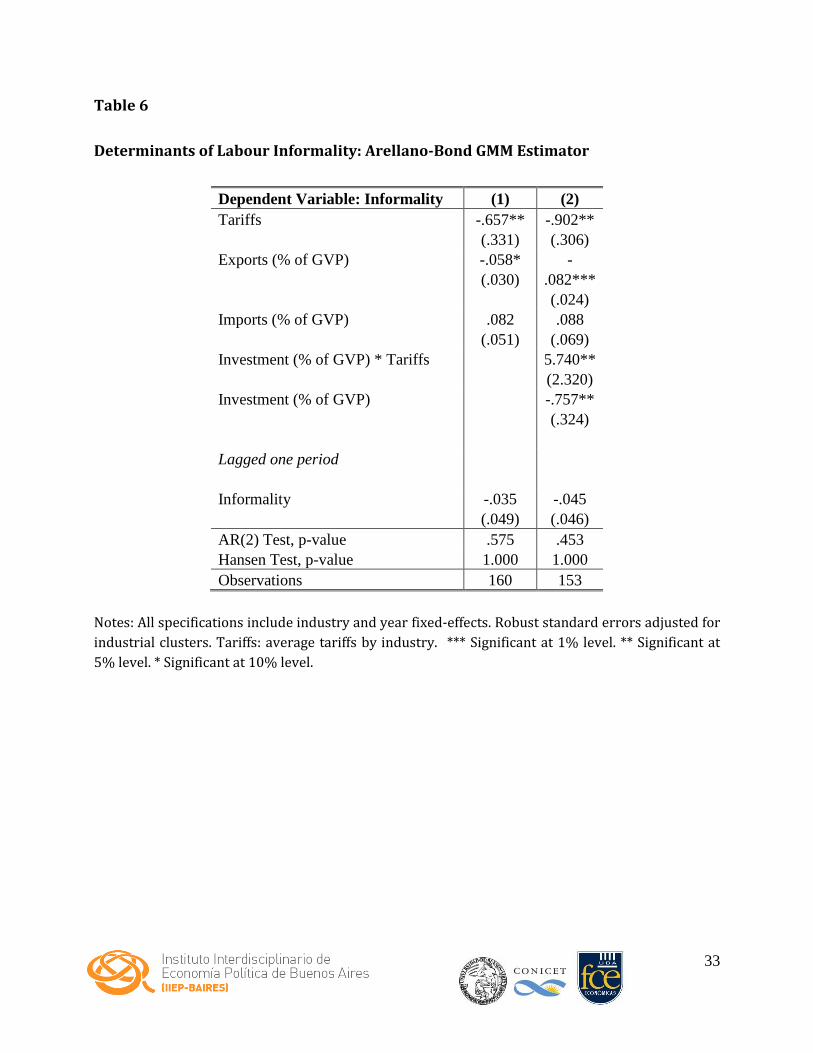
Finally, following Bosch et al. (2012), to overcome remaining concerns that tariffs
could be an endogenous variable for the impact of trade liberalisation on informality, we
also consider the dynamic panel GMM estimator model of Arellano and Bond (1991). We
use first differences and lags of the dependent variable, together with X and M, as
instruments for solving the potential dynamic panel data bias and endogeneity. All the
variables are treated as potentially endogenous, including Tariff, to which the same set of
instruments is applied. Results for this specification are presented in Table 6. Note that the
results are very close to those in Table 4, which we keep as the preferred specification.
Figure 4 shows the actual evolution of informality rates and its predicted evolution
using our preferred elasticity of 0.6 per cent, starting with the 1992 average tariff level. Our
results suggest that trade liberalisation in the form of tariff reductions can explain around a
third (32%) of the observed increase in informality in Argentina between 1992 and 2003.
This impact is large compared with those for Colombia reported in Goldberg and Pavcnik
(2003), of the order of 10-15 per cent. Moreover, they contrast to those for Brazil in
Goldberg and Pavcnik (2003) and Bosch et al. (2012) who both find no relationship
between informality and trade, as well as Aleman-Castilla (2006), who shows a negative
relationship for Mexico.
17
V. Conclusion
This paper tests for the effect of trade liberalisation on informality using industry-level
data for Argentina. The results in this paper suggest that informality has significantly
increased in those manufacturing sectors in which trade liberalisation has been more
intense. The econometric results show that a reduction of average tariffs by one per cent
produces an increment in informality rates by 0.6 per cent. However, sectors with higher
investment ratios were able to neutralize and reverse this effect. These results are robust to
trade variables capturing the export/import orientation of the sector.
These estimated impacts could actually be a lower bound of the full effect of trade
liberalisation on informality. This is because workers who lost their formal manufacturing
jobs due to trade liberalisation might end working in an informal job in the non-
manufacturing sector. During the 1990s in Argentina there was an increment in the number
of informal jobs in the service sector and a reduction in the number of formal jobs in the
manufacturing sector suggesting that this could have been an important channel of
adjustment of the labour market to trade liberalisation. Further research is needed to
understand the trade effects on overall labour markets that include the service sector.
Finally, because workers can move across sectors, a tariff reduction in manufacturing sector
j may not only affect the informality rate in j but can also affect the informality rate in other
manufacturing sectors. This problem is also likely to bias the estimates downwards.
1 A thorough description of the 2002 Argentinean crisis and its effects in labor markets can be found in McKenzie (2004). 2 We use this strict definition of labor informality because pension contributions, basic health insurance, paid vacations, and yearly bonuses are all legally-mandated social security benefits in Argentina, so non-compliance with any of them would entail a violation of the labor laws. As the literature has suggested, alternative definitions of labor informality may include the self-employed and workers in micro-firms.
18
3 To mention a few studies applying this procedure: Attanasio, Goldberg and Pavcnik (2004), Pavcnik et al. (2004), and Acosta and Gasparini (2007). 4 Urban areas considered are: Buenos Aires City, Gran Buenos Aires, Bahía Blanca, Catamarca, Comodoro Rivadavia, Córdoba, Corrientes, Formosa, Jujuy, La Plata, La Rioja, Mar del Plata, Mendoza, Neuquén, Paraná, Posadas, Resistencia, Rio Cuarto, Rio Gallegos, Rosario, Salta, San Juan, San Luis, Santa Fe, Santa Rosa, Santiago del Estero, Tierra del Fuego, and Tucumán. These areas account for nearly two-thirds of the country’s population. 5 Primary education in Argentina consists of 7 years of schooling, while secondary education comprises 5 years of schooling. 6 Results for other years do not differ much from those reported, and are available upon request. 7 Following the standard methodology in the literature we use a linear probability model. The range of predicted values shows that the linear model performs well for this sample. Results using logit or probit model are similar to those of the linear probability model.

19
References
Acosta, P., & Gasparini, L. (2007). Capital accumulation, trade liberalization, and rising wage
inequality: The case of Argentina. Economic Development and Cultural Change, 55, 793-
812.
Acosta, P., & Montes-Rojas, G. (2008). Trade reform and inequality: The case of Mexico and
Argentina in the 1990s. World Economy, 31, 763-780.
Aleman-Castilla, B. (2006). The effect of trade liberalization on informality and wages:
Evidence from Mexico. London School of Economics, CEP Discussion Paper 763,
London, UK.
Amaral, P., & Quintín, E. (2006). A competitive model of the informal sector. Journal of
Monetary Economics, 53, 1541-1553.
Antunes, A., & Cavalcanti, T. (2007). Start up costs, limited enforcement, and the hidden
economy. European Economic Review, 51, 203-224.
Arellano, M., & Bond, S. (1991). Some tests of specification for panel data: Monte Carlo
evidence and an application to employment equations. Review of Economics Studies, 58,
277-297.
Attanasio, O., Goldberg, P., & Pavcnik, N. (2004). Trade reforms and wage inequality in
Colombia. Journal of Development Economics, 74, 331-366.
Banerji, A., & Jain, S. (2007). Quality dualism. Journal of Development Economics, 84, 234-
250.

20
Behrman, J., Birsdall, N., & Szekely, M. (2007). Economic policy changes and wage
differentials in Latin America. Economic Development and Cultural Change, 56, 57-98.
Bosch, M., Goñi-Pacchioni, E. & Maloney, W. (2012). Trade liberalization, labor reforms and
formal-informal employment dynamics. Labour Economics, 19, 653-667.
Busato, F., & Chiarini, B. (2004). Market and underground activities in a two-sector dynamic
equilibrium model. Economic Theory, 23, 831-861.
Choi, J., & Thum, M. (2005). Corruption and the shadow economy. International Economic
Review, 46, 817-836.
Chong, A., & Gradstein, M. (2007). Inequality and informality. Journal of Public Economics,
91, 159-179.
Currie, J, & Harrison, A.E. (1997). Sharing the costs: The impact of trade reform on capital
and labor in Morocco. Journal of Labor Economics, 15(3), pp. 44-71.
Dabla-Norris, E., Gradstein, M.,& Inchauste, G. (2008). What causes firms to hide output?
The determinants of informality. Journal of Development Economics, 85, 1-27.
Dessy, S., & Pallage, S. (2003). Taxes, inequality and the size of the informal sector. Journal of
Development Economics, 70, 225-233.
Fiess, N., & Fugazza, M. (2008). Trade liberalisation and informality: New stylized facts.
University of Glasgow, Department of Economics, Working Paper 2008-34, Glasgow,
UK.

21
Friedman, E., Johnson, S., Kaufmann, D., & Zoido-Lobaton, P. (2000). Dodging the grabbing
hand: The determinants of unofficial activity in 69 countries. Journal of Public
Economics, 76, 459-493.
Fugazza, M., & Jacques, J. (2004). Labor market institutions, taxation and the underground
economy. Journal of Public Economics, 88, 395-418.
Galiani, S. (2002). Labor market reform in Argentina: Where do we stand? Stanford Center
for International Development Working Paper 133, Stanford, USA.
Galiani, S., & Porto, G. (2010). Trends in tariff reforms and in the structure of wages. Review
of Economics and Statistics, 92, 482-494.
Galiani, S., & Sanguinetti, P. (2003). The impact of trade liberalization on wage inequality:
Evidence from Argentina. Journal of Development Economics, 72, 497–513.
Goldberg, P., & Pavcnik, N. (2003). The response of the informal sector to trade
liberalization. Journal of Development Economics, 72, 463-496.
Harris, J., & Todaro, M. (1970). Migration, unemployment, and development: A two-sector
analysis. American Economic Review, 60, 126-142.
Johnson, S., Kaufmann, D., & Zoido-Lobaton, P. (1998). Regulatory discretion and the
unofficial economy. American Economic Review, 88, 387-392.
Krueger, A., & Summers, L. (1988). Efficiency wages and the interindustry wage structure.
Econometrica, 56, 259–293.
Maloney, W. (1999). Does informality imply segmentation in urban labor markets? Evidence
from sectoral transitions in Mexico. World Bank Economic Review, 13, 275-302.
22
Maloney, W. (2004). Informality revisited. World Development, 32, 1159-1178.
McKenzie, D. (2004). Aggregate shocks and urban labor market responses: Evidence from
Argentina's financial crisis. Economic Development and Cultural Change, 52, 719-758.
Melitz, M. (2003). The impact of trade on intra-industry reallocations and aggregate
industry productivity. Econometrica, 71, 1695-1725.
Pavcnik, N., Blom, A., Goldberg, P., & Schady, N. (2004). Trade liberalization and industry
wage structure: Evidence from Brazil. World Bank Economic Review, 18, 319-344.
Rauch, J. (1991). Modelling the informal sector formally. Journal of Development Economics,
35, 33-47.
Revenga, A. (1997). Employment and wage effects of trade liberalization: The case of
Mexican manufacturing. Journal of Labor Economics, 15, 520-543.
Ronconi, L. (2010). Enforcement and compliance with labor regulations. Industrial and
Labor Relations Review, 63, 719-736.
Straub, S. (2005). Informal sector: The credit market channel. Journal of Development
Economics, 78, 299-321.
23
Figure 1
Trade Openness (Exports and Imports, as a share of GDP) and Average Ad Valorem
Tariff Evolution
Source: World Development Indicators (2009) and Galiani and Porto (2010)
24
Figure 2
Average Ad Valorem Import Tariffs by Manufacturing Sector
Source: Authors’ calculations based on Galiani and Porto (2010).
-14.0 -12.0 -10.0 -8.0 -6.0 -4.0 -2.0 0.0
Food, beverages and tobacco
Furniture and other
Textiles
Plastics and rubber products
Chemicals and petrochemicals
Leather and footwear
Transportation Vehicles
Clothing
Fabricated metalic products
Nonmetalic mineral products
Basic metalic products
Wood and cork
Publishing and printing
Paper
Machinery and equipment
Electrical and electronic equipment 24.217.323.721.819.519.319.924.329.322.123.113.822.623.622.815.6
Change in Tariffs between 1992 and 2003 (p.p.)
Ad Valorem Tariff Rates in 1992 (%)
25
Figure 3
Change in Informality Rates and Ad Valorem Tariffs in the Manufacturing Sector
Source: Authors’ calculations based on EPH, October issues, and Galiani and Porto (2010).
10
14
18
22
26
30
1992 1993 1994 1995 1996 1997 1998 1999 2000 2001 2002 2003
%
Tariffs (%) Informality (%)

26
Figure 4
Actual and Predicted Changes in Informality Rates in the Manufacturing Sector
Source: Authors’ calculations based on the estimated 0.6 elasticity starting at the 1992 average tariff level.
15
18
21
24
27
30
33
1992 1993 1994 1995 1996 1997 1998 1999 2000 2001 2002 2003
%
Actual Predicted

27
Table 1
Informality Rates (“Absence of Social Security Benefits”) by Manufacturing Sector
Argentina, 1992-2003
Sector 1992 1993 1994 1995 1996 1997 1998 1999 2000 2001 2002 2003
Food, beverages and tobacco 12.5 16.0 14.7 18.2 19.7 23.1 23.3 22.1 26.5 22.0 27.1 33.5
Textiles 5.7 13.1 17.5 14.0 15.2 8.2 20.7 21.3 19.2 16.6 25.2 30.3
Clothing 21.5 37.3 29.4 32.1 42.6 48.8 41.3 39.0 39.1 28.8 51.1 51.5
Leather and footwear 41.1 38.3 38.7 31.5 30.9 43.5 38.7 32.7 29.7 52.3 47.9 60.3
Wood and cork 31.7 24.9 29.6 19.4 34.1 31.6 33.8 36.5 26.8 35.1 49.1 38.2
Paper 15.3 6.8 15.6 20.2 15.3 6.8 12.7 48.1 16.0 26.6 7.8 6.1
Publishing and printing 12.9 11.8 13.8 13.4 23.4 31.2 25.8 31.4 23.2 25.3 8.1 22.7
Chemicals and petrochemicals 10.0 10.2 14.7 11.7 11.2 18.8 14.8 16.2 10.0 15.0 19.9 17.6
Plastics and rubber products 18.2 12.4 16.3 16.4 12.4 13.1 19.4 11.5 5.5 12.1 22.4 5.1
Nonmetalic mineral products 21.0 19.6 11.4 13.8 17.0 20.9 24.1 27.3 17.0 17.6 40.6 27.5
Basic metalic products 7.6 9.4 2.2 6.1 3.8 9.1 6.0 4.9 9.3 7.1 9.1 4.0
Fabricated metalic products 15.8 11.6 14.3 16.4 15.8 14.9 25.8 18.7 17.9 18.7 24.7 26.5
Machinery and equipment 14.9 13.6 10.5 8.6 11.6 16.2 8.9 13.9 18.7 17.2 10.9 20.1
Electrical and electronic equipment 17.0 6.2 3.6 17.3 12.5 20.8 17.3 18.2 22.1 28.3 21.3 15.4
Transportation Vehicles 11.0 13.2 4.1 9.3 19.2 8.3 6.5 10.5 15.2 6.3 6.0 23.5
Furniture and other 26.7 25.6 23.5 17.4 35.6 29.7 33.9 30.5 34.5 19.1 31.4 29.8
Manufacturing Sector 17.3 17.2 16.2 17.1 20.7 22.8 23.2 22.8 22.6 21.6 26.8 30.3
All Sectors 17.0 16.6 16.0 18.0 20.6 22.6 23.0 23.9 23.7 23.1 29.5 29.7
Notes: Authors' calculations based on EPH, October issues. Sample considers full-time (more than
20 hours worked) paid workers, between 18 and 65 years old.
28
Table 2
Determinants of Informality Status (“Absence of Social Security Benefits”)
Argentina, 1994, 1997, and 2001
1994 1997 2001
Age -0.025 *** -0.028 *** -0.029 ***
(0.001)
(0.001)
(0.002)
Age Squared*100 0.026 *** 0.029 *** 0.029 ***
(0.002)
(0.002)
(0.002)
Male 0.002 -0.016 *** -0.050 ***
(0.005)
(0.005)
(0.006)
Household Head 0.005 *** 0.013 *** 0.009 ***
(0.001)
(0.002)
(0.002)
Married -0.043 *** -0.070 *** -0.075 ***
(0.005)
(0.005)
(0.006)
Primary Complete -0.030 *** -0.034 *** -0.047 ***
(0.006)
(0.007)
(0.008)
Secondary Incomplete -0.128 *** -0.117 *** -0.151 ***
(0.006)
(0.007)
(0.008)
Secondary Complete -0.133 *** -0.165 *** -0.174 ***
(0.008)
(0.008)
(0.009)
Tertiary Education -0.145 *** -0.189 *** -0.218 ***
(0.007)
(0.008)
(0.009)
Textiles -0.026 -0.173 *** -0.100 ***
(0.022)
(0.025)
(0.041)
Clothing 0.097 *** 0.200 *** 0.021
(0.019)
(0.019)
(0.025)
Leather and footwear 0.154 *** 0.156 *** 0.180 ***
(0.021)
(0.025)
(0.034)
Wood and cork 0.115 *** 0.034 0.093 *
(0.036)
(0.040)
(0.051)
Paper -0.042
-0.222 *** 0.022
(0.038)
(0.039)
(0.044)
Publishing and printing -0.011
0.070 *** 0.011
(0.019)
(0.024)
(0.027)
Chemicals and petrochemicals 0.007
-0.014 -0.048 ***
(0.020)
(0.021)
(0.024)
Plastics and rubber products -0.032 -0.087 *** -0.124 ***
(0.022)
(0.026)
(0.033)
Non-metalic mineral products -0.068 *** -0.059 * -0.066
(0.027)
(0.032)
(0.044)

29
Basic metalic products -0.126 *** -0.092 *** -0.174 ***
(0.037)
(0.045)
(0.052)
Fabricated metalic products -0.041 *** -0.092 *** -0.049 ***
(0.014)
(0.019)
(0.023)
Machinery and equipment -0.046 *** -0.044 *** -0.069 ***
(0.020)
(0.023)
(0.030)
Electrical and electronic equipment -0.101 *** -0.015 0.112 ***
(0.026)
(0.022)
(0.041)
Transportation vehicles -0.136 *** -0.138 *** -0.158 ***
(0.017)
(0.020)
(0.033)
Furniture and other 0.030 * 0.041 * -0.058 ***
(0.018) (0.023) (0.030)
Regional Indicators Yes Yes Yes
Observations (unweighted) 26,627 29,686 20,581
Adjusted R2 0.094 0.110 0.118
Notes: Author's calculations based on EPH, October issues. Sample considers full time (more
than 20 hours worked) paid workers, between 18 and 65 years old. Survey's population
weights considered. *** Significant at 1% level. ** Significant at 5% level. * Significant at
10% level.

30
Table 3
Normalized Industry Informality Differentials
Argentina, 1992-2003
Sector 1992 1993 1994 1995 1996 1997 1998 1999 2000 2001 2002 2003
Food, beverages and tobacco -0.057 -0.023 -0.028 -0.007 -0.020 -0.013 -0.011 -0.034 0.010 -0.024 -0.024 -0.003
Textiles -0.132 -0.056 -0.001 -0.035 -0.054 -0.137 -0.024 -0.045 -0.055 -0.053 -0.011 0.013
Clothing 0.021 0.179 0.103 0.108 0.195 0.233 0.124 0.112 0.137 0.062 0.217 0.124
Leather and footwear 0.208 0.188 0.180 0.137 0.049 0.194 0.135 0.088 0.041 0.237 0.159 0.246
Wood and cork 0.154 0.058 0.145 0.044 0.139 0.071 0.117 0.138 0.071 0.137 0.128 0.067
Paper -0.023 -0.093 -0.028 -0.023 -0.045 -0.184 -0.103 0.235 -0.085 0.066 -0.248 -0.334
Publishing and printing -0.036 -0.060 0.003 -0.067 0.037 0.074 0.012 0.094 0.024 0.031 -0.136 -0.020
Chemicals and petrochemicals -0.071 -0.035 0.028 -0.026 -0.071 -0.019 -0.050 -0.048 -0.077 -0.033 -0.016 -0.107
Plastics and rubber products 0.038 -0.035 -0.010 0.000 -0.106 -0.065 -0.029 -0.107 -0.163 -0.078 -0.024 -0.198
Nonmetalic mineral products 0.045 0.016 -0.046 -0.014 -0.030 -0.024 0.026 0.060 -0.026 -0.034 0.108 -0.048
Basic metalic products -0.046 -0.075 -0.104 -0.071 -0.162 -0.106 -0.136 -0.111 -0.125 -0.158 -0.093 -0.211
Fabricated metalic products 0.012 -0.044 -0.018 0.024 -0.045 -0.061 0.038 -0.028 -0.035 -0.010 -0.034 0.031
Machinery and equipment -0.019 -0.019 -0.019 -0.050 -0.059 -0.038 -0.143 -0.036 0.023 -0.031 -0.083 0.015
Electrical and electronic equipment 0.029 -0.093 -0.080 0.007 -0.040 -0.010 -0.010 0.000 0.039 0.146 0.013 -0.081
Transportation Vehicles -0.056 -0.026 -0.112 -0.039 0.011 -0.142 -0.131 -0.101 -0.036 -0.126 -0.170 -0.058
Furniture and other 0.085 0.063 0.052 -0.023 0.135 0.061 0.102 0.061 0.074 -0.017 0.026 -0.016
Notes: Author's calculations based on EPH (October issues). Survey's population weights
considered. Informality differentials by industry are calculated by regressing an informality
indicator on age, age squared, gender, household head indicator, education indicators,
marital status, geographic location, and a set of industry indicators. Reported industry
informality differentials are calculated as deviations of coefficients on industry indicators
with respect to the employment-weighted average industry differential.
31
Table 4
Determinants of Labour Informality: Industry-Level Fixed-effects
Dependent Variable:
Industry Informality
Differentials (βjt)
(1) (2) (3) (4) (5) (6) (7)
Tariffs -.554*
(.319)
-.698**
(.313)
-.596*
(.349)
-.592*
(.334)
-.851**
(.342)
-1.030**
(.401)
Exports (% of GVP) -.067
(.028)
-.052*
(.028)
-.091*
(.049)
-.079***
(.026)
-.036
(.082)
Imports (% of GVP) .083
(.053)
.083
(.053)
.079
(.062)
.081
(.066)
.045
(.086)
Labor Productivity
(GVP/L)
-.024
(.062)
Investment (% of GVP) -.761**
(.333)
-1.300*
(.670)
Investment (% of GVP)
* Tariffs
5.720**
(2.390)
8.980**
(4.310)
Lagged one period
Tariffs -.016
(.090)
Exports (% of GVP) .362
(.405)
Imports (% of GVP) -.068
(.083)
Investment (% of GVP)
* Tariffs
.075
(.078)
Investment (% of GVP) -6.930
(4.270)
Observations 176 144 176 176 171 171 169
Notes: All specifications include industry and year fixed-effects. Column (2) excludes year 2002 and
2003. Robust standard errors adjusted for industrial clusters. Tariffs: average tariffs by industry.
*** Significant at 1% level. ** Significant at 5% level. * Significant at 10% level.
32
Table 5 Determinants of Labour Informality: Industry-Level Fixed-effects
Dependent
Variable:
Industry
Informality
Differentials
(βjt)
Non-
adjusted
Industry
Informality
Rates
Industry
Informality
Differentials
(βjt)
Non-
adjusted
Industry
Informality
Rates
Tariffs -.554*
(.319)
-.550*
(.315)
-.596*
(.349)
-.534
(.356)
Exports (%
of GVP)
-.052*
(.028)
-.048**
(.022)
Imports (%
of GVP)
.083
(.053)
.038
(.058)
Observations 176 176 176 176
Notes: All specifications include industry and year fixed-effects. Robust standard errors adjusted for
industrial clusters. Tariffs: average tariffs by industry. *** Significant at 1% level. ** Significant at
5% level. * Significant at 10% level.
33
Table 6
Determinants of Labour Informality: Arellano-Bond GMM Estimator
Dependent Variable: Informality (1) (2)
Tariffs -.657**
(.331)
-.902**
(.306)
Exports (% of GVP) -.058*
(.030)
-
.082***
(.024)
Imports (% of GVP) .082
(.051)
.088
(.069)
Investment (% of GVP) * Tariffs 5.740**
(2.320)
Investment (% of GVP) -.757**
(.324)
Lagged one period
Informality -.035
(.049)
-.045
(.046)
AR(2) Test, p-value .575 .453
Hansen Test, p-value 1.000 1.000
Observations 160 153
Notes: All specifications include industry and year fixed-effects. Robust standard errors adjusted for
industrial clusters. Tariffs: average tariffs by industry. *** Significant at 1% level. ** Significant at
5% level. * Significant at 10% level.
Related Documents