Insert Picture Here MySQL Performance: Demystified Tuning & Best Practices Dimitri KRAVTCHUK MySQL Performance Architect @Oracle

Welcome message from author
This document is posted to help you gain knowledge. Please leave a comment to let me know what you think about it! Share it to your friends and learn new things together.
Transcript

Copyright © 2012, Oracle and/or its affiliates. All rights reserved. Insert Information Protection Policy Classification from Slide 12
Insert Picture Here
MySQL Performance: Demystified Tuning & Best Practices!!!!Dimitri KRAVTCHUK MySQL Performance Architect @Oracle

The following is intended to outline our general product direction. It is intended for information purposes only, and may not be incorporated into any contract. It is not a commitment to deliver any material, code, or functionality, and should not be relied upon in making purchasing decisions. The development, release, and timing of any features or functionality described for Oracle’s products remains at the sole discretion of Oracle.

Are you Dimitri?.. ;-)
• Yes, it's me :-) • Hello from Paris! ;-) • Passionated by Systems and Databases Performance • Previous 15 years @Sun Benchmark Center • Started working on MySQL Performance since v3.23 • But during all that time just for “fun” only ;-) • Since 2011 “officially” @MySQL Performance full time now • http://dimitrik.free.fr/blog / @dimitrik_fr

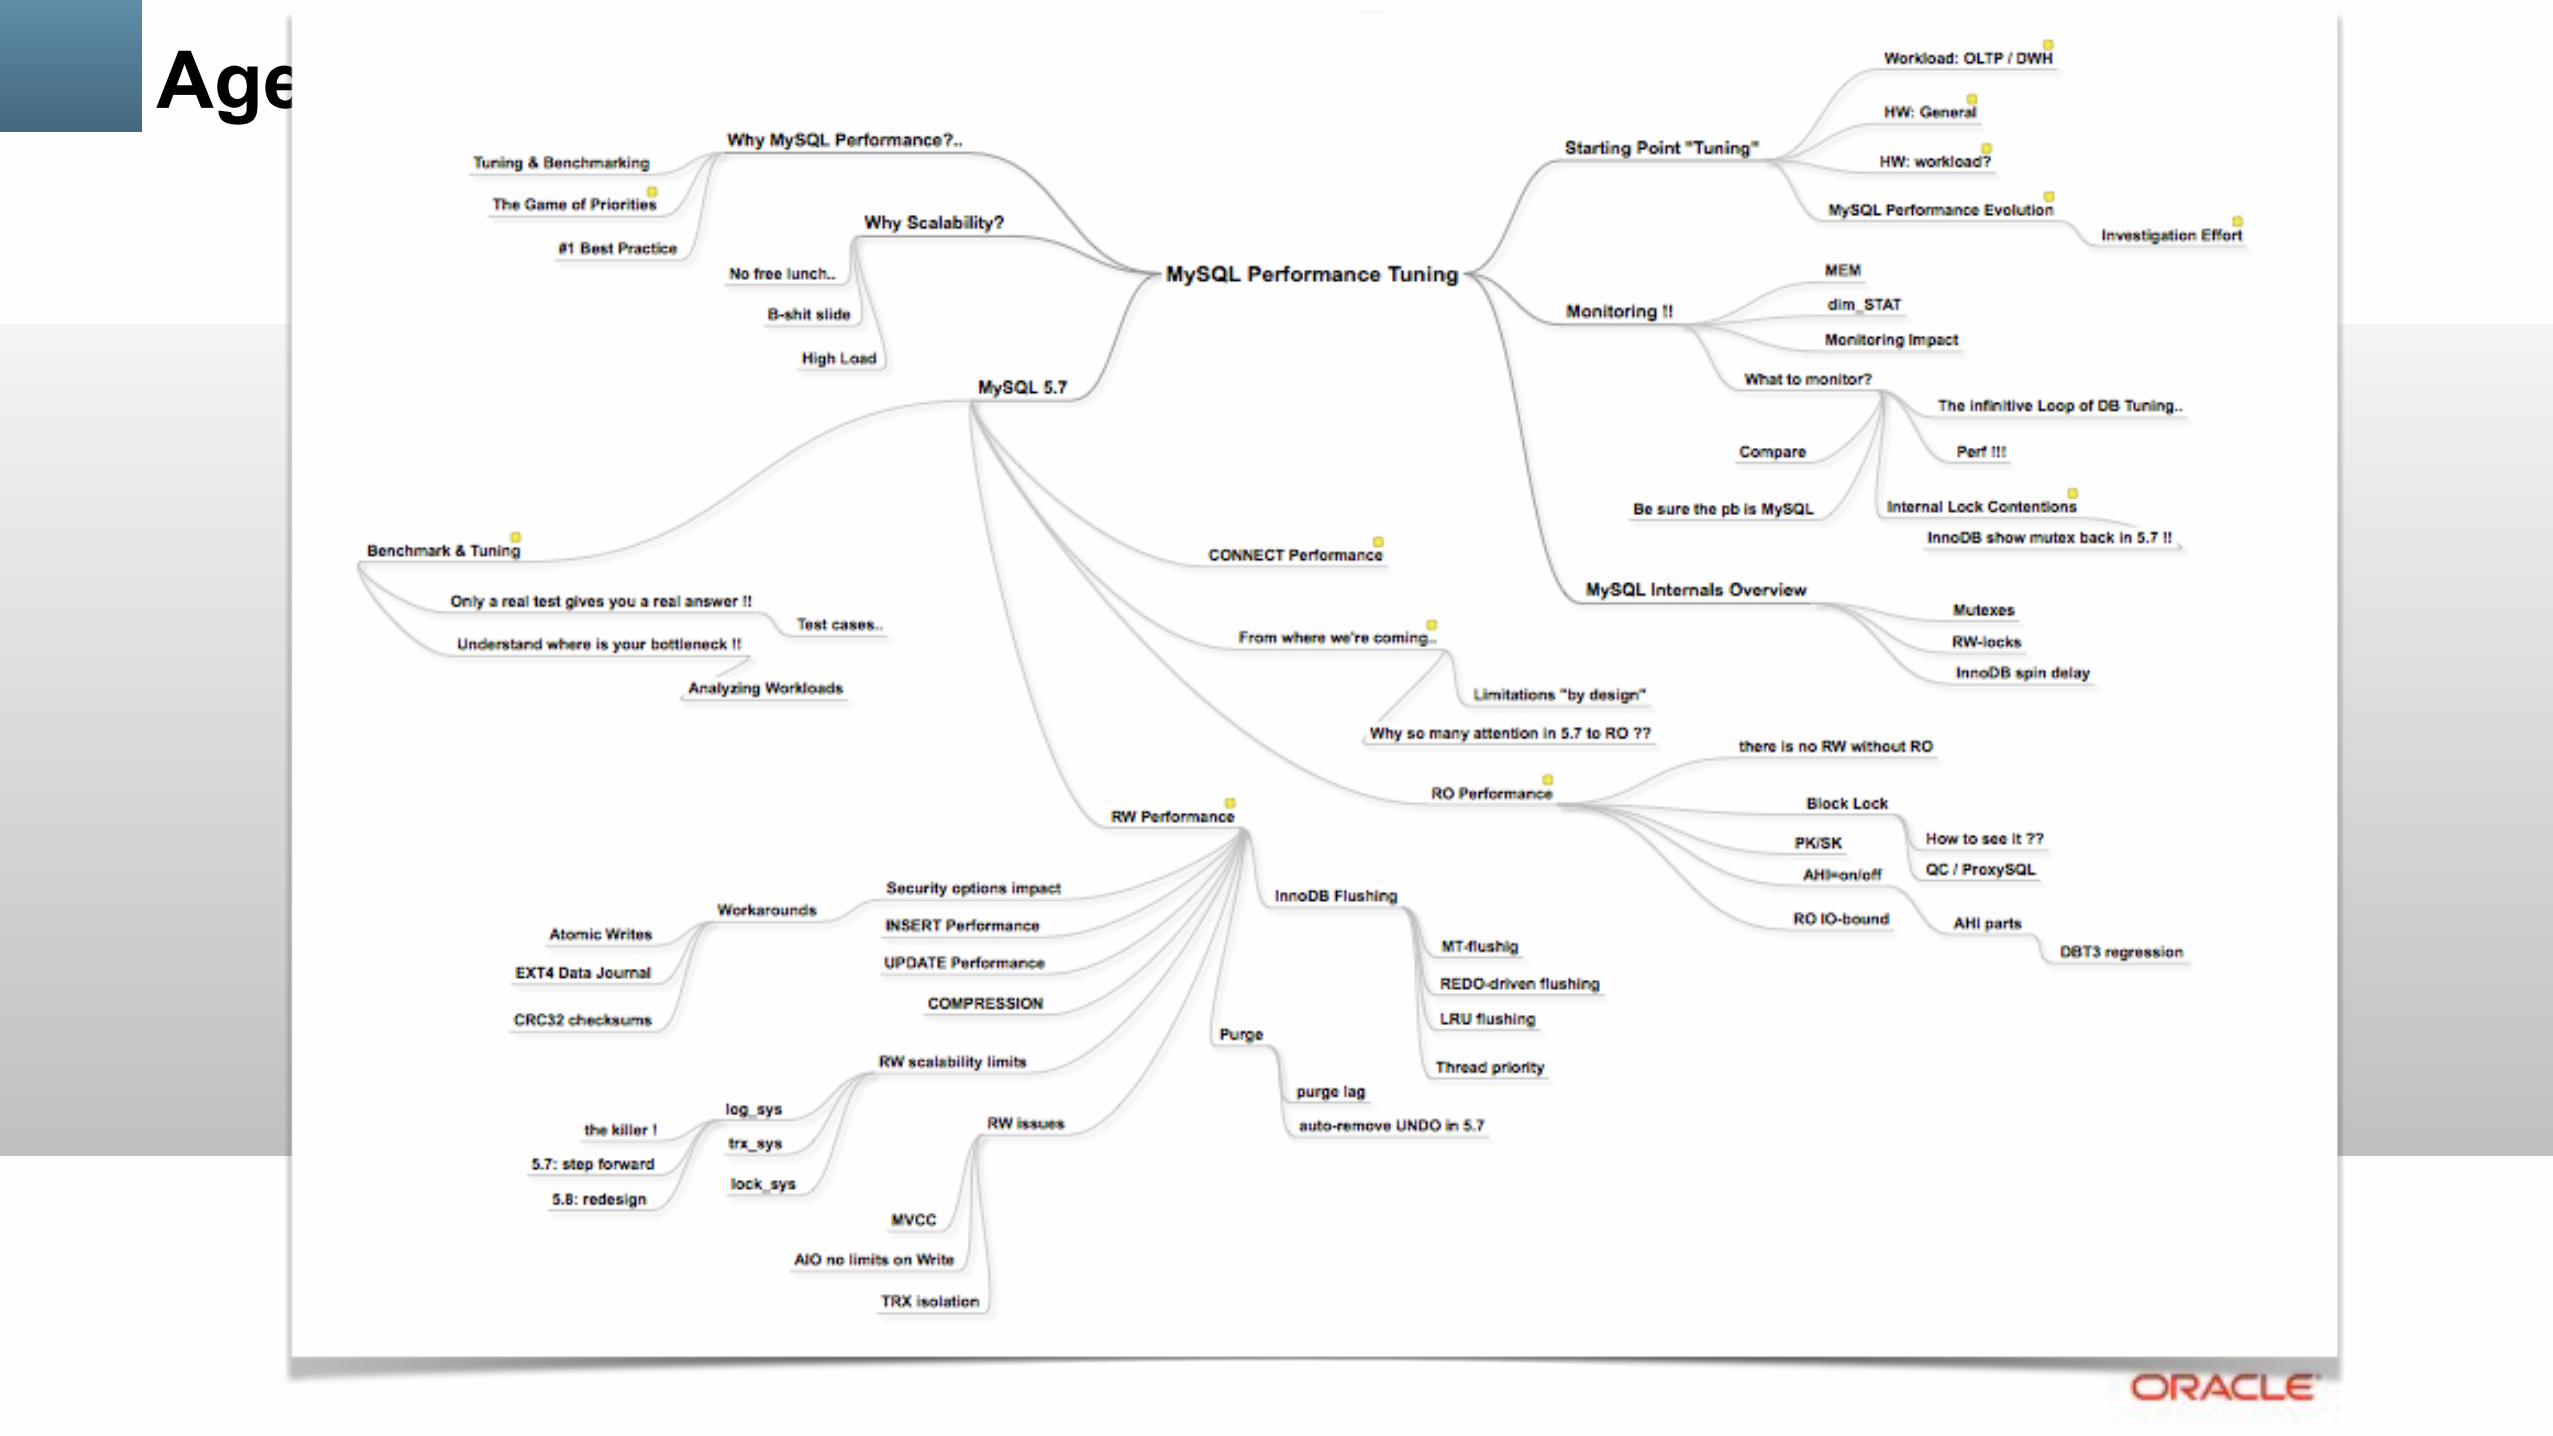
Agenda
• Overview of MySQL Performance • Performance improvements in MySQL 5.7 & Benchmark results • What can be Tuned / and what should be Avoided • Pending Issues and Workarounds.. • Q & A • As well may be not exactly in the proposed order ;-) • (and sorry in advance for many “smiles” in the slides ;-))
Tuning & Benchmarking…
• there is no Tuning without Benchmarking ;-) • you have to validate somehow your tuning, right ?
• as there is no Benchmarking without Tuning ;-) • it’s not a good idea to check various tuning on production systems, right ?

Why Benchmarking MySQL ?...

Why benchmarking MySQL?..
• Any solution may look “good enough”...

Why benchmarking MySQL?..
• Until it did not reach its limit..

Why benchmarking MySQL?..
• And even improved solution may not resist to increasing load..

Why benchmarking MySQL?..
• And reach a similar limit..

Why benchmarking MySQL?..
• A good benchmark testing may help you to understand ahead the resistance of your solution to incoming potential problems ;-)

Why benchmarking MySQL?..
• But keep it in mind: • Even a very powerful solution but
leaved in wrong hands may still be easily broken!... :-)
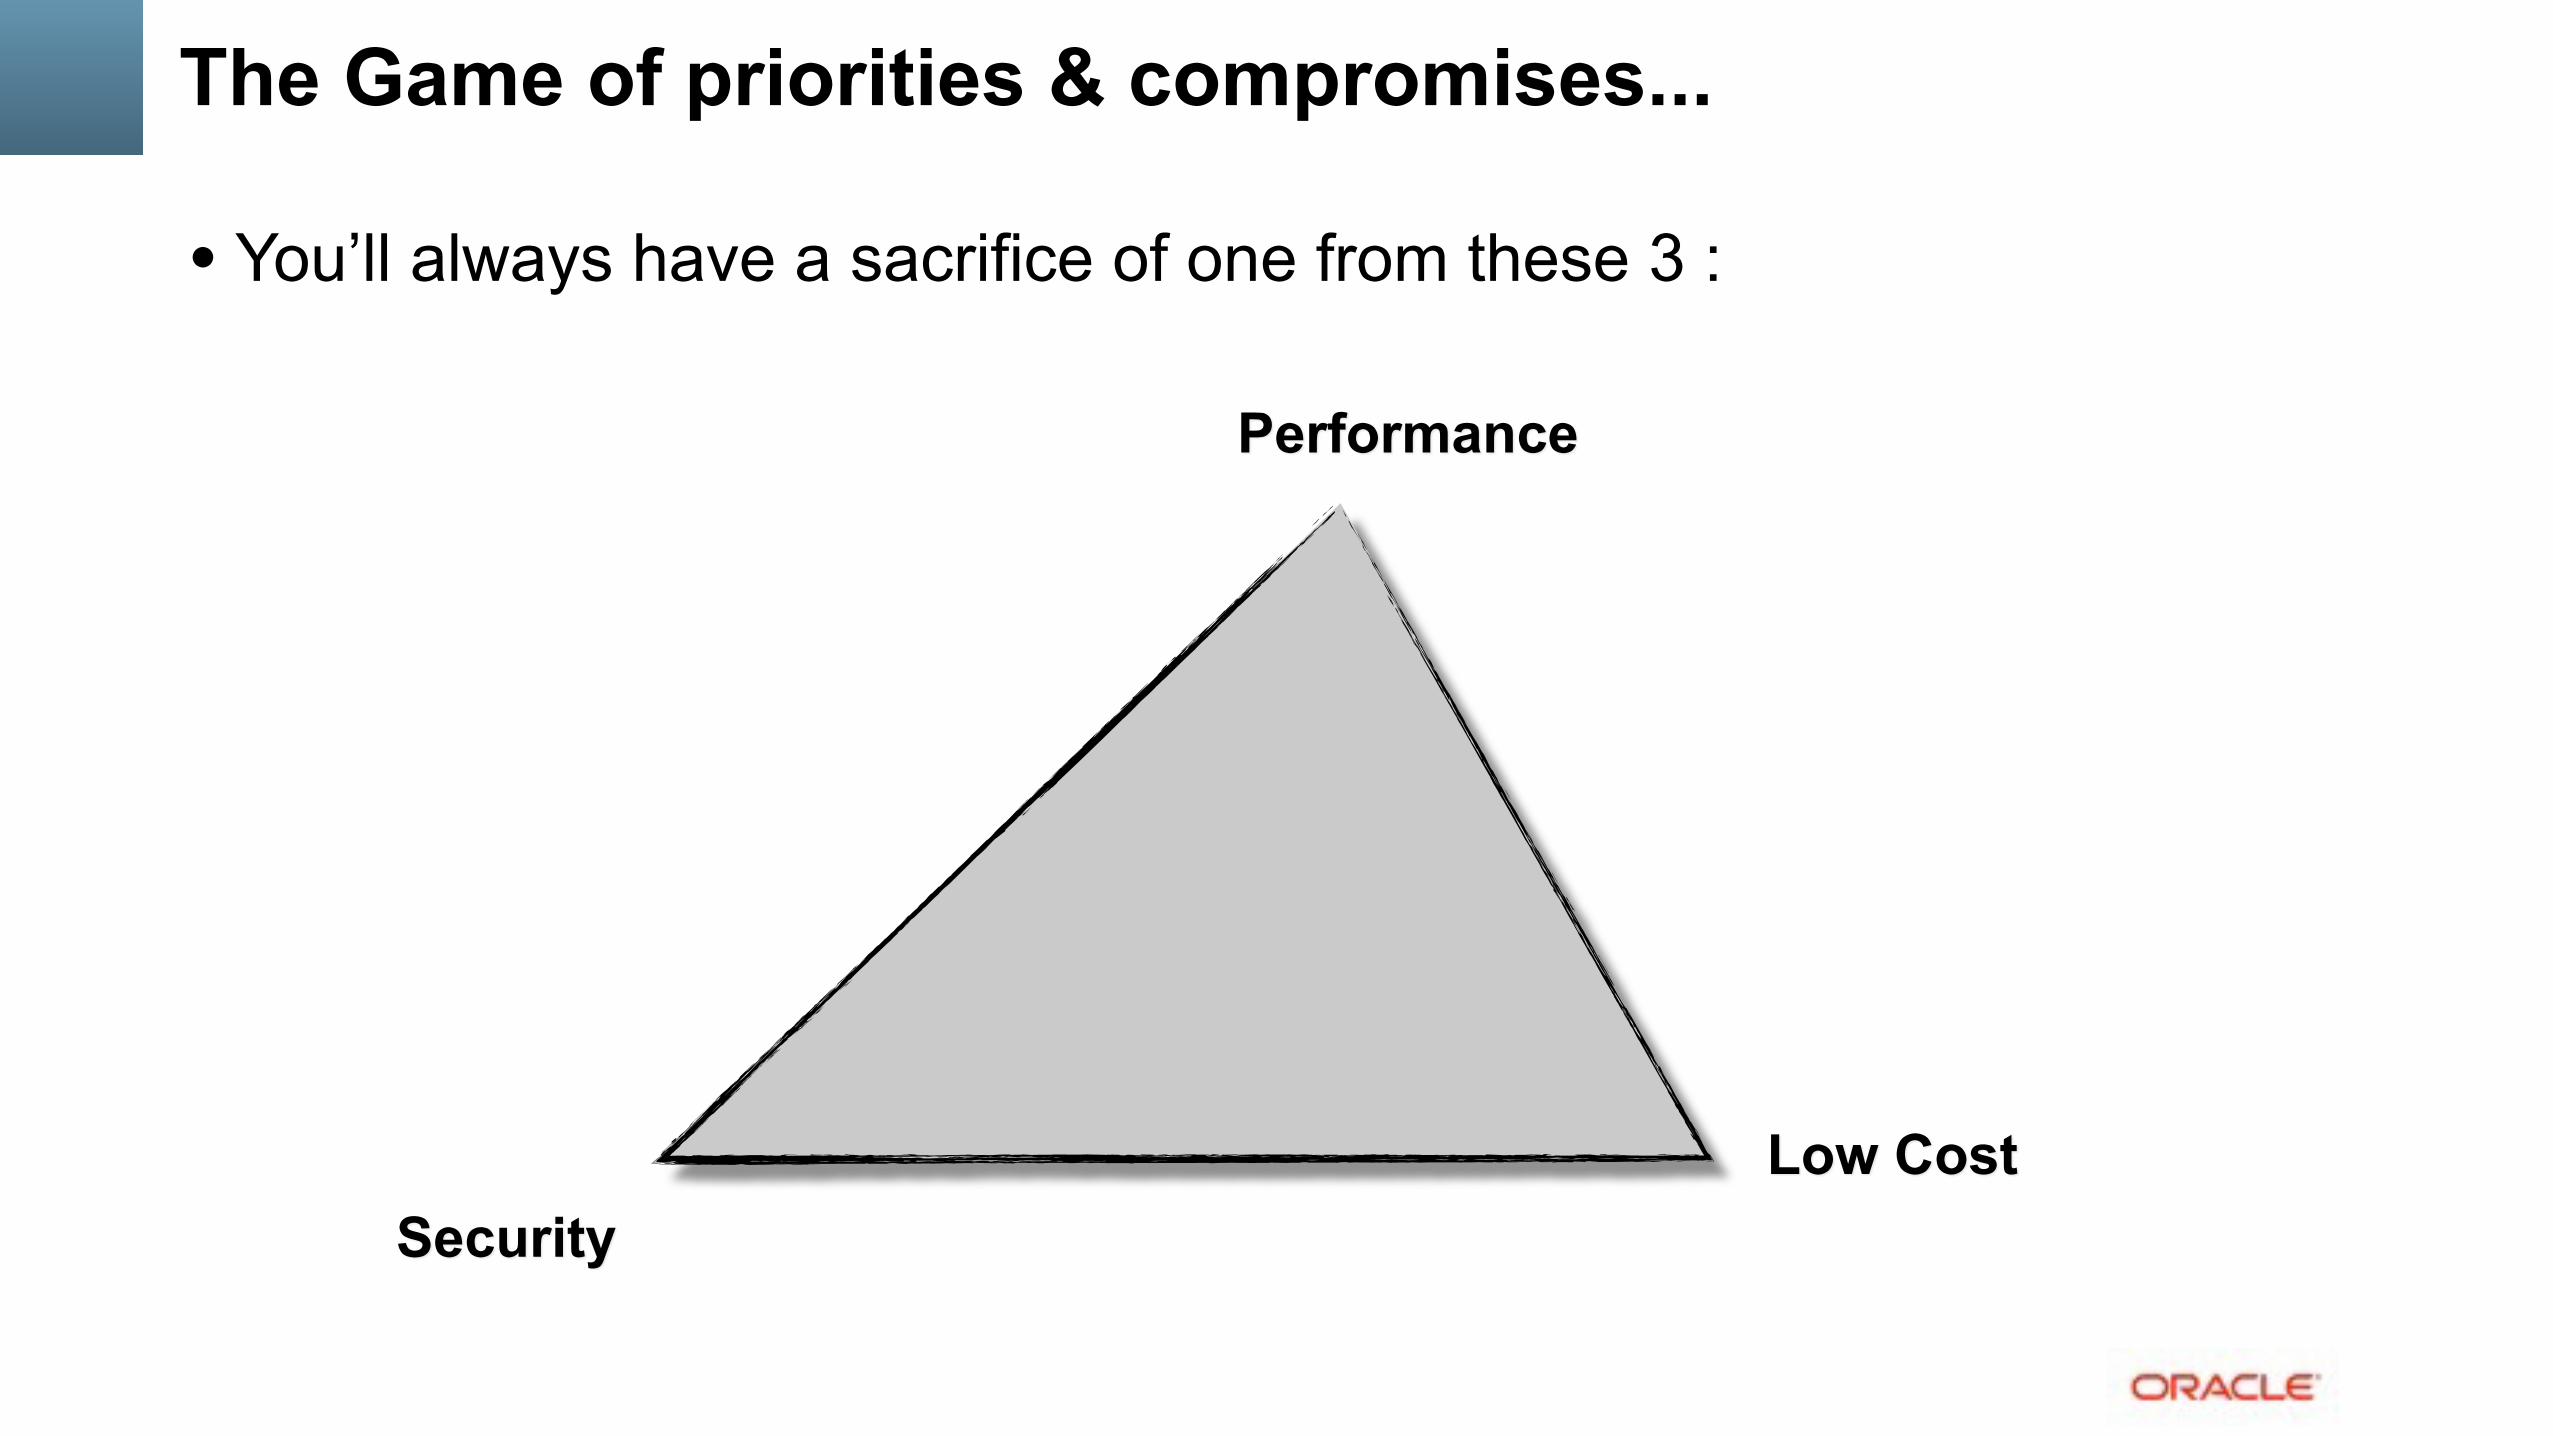
The Game of priorities & compromises...
• You’ll always have a sacrifice of one from these 3 :
SecurityLow Cost
Performance
The Main MySQL Performance Best Practice #1 is... ???..

The Main MySQL Performance Best Practice #1 is... ???..
!
USE YOUR BRAIN !!!... ;-)

The Main MySQL Performance Best Practice #1 is... ???..
!
USE YOUR BRAIN !!!... ;-)
THE MAIN SLIDE! ;-))

The following materials are about…
• Single MySQL Instance Performance Tuning & Scalability • single HW host • no replication • just to understand how far your single MySQL Server instance may scale.. • what are the limits • what to care about ahead • what can be tuned • which workaround to use • which situations are absolutely to avoid..

Why Scalability ?..
• CPU Speed : no more "free lunches" ;-) • will x2 times faster CPU increase your performance by x2 ?..
• CPU cores : more and more over year-to-year.. • Intel 2CPU : 8cores-HT • Intel 2CPU : 12cores-HT • Intel 2CPU : 16cores-HT • Intel 2CPU : 20cores-HT • Intel 2CPU : 36cores-HT (2015) • … • 2015: 4cores ==> “commodity HW” for a SmartWatch ;-)
• Scalability In Few Words : • your software is able to deliver a higher throughput if more HW resources are available.. • (then, scaling it well or not is another story ;-))

A B-shit Slide…
• Odd interpretation of Scalability…

A B-shit Slide… (2)
• Odd interpretation of Scalability…
Scale up to N connections
Then, keep the load…
Both are scaling up to 64 connections, but only one is able to keep a higher load..

MySQL on High Load
• Once you’ve reached your Max TPS on your system : • try to understand first what is limiting you? (I/O, CPU, Network, MySQL internals?) • the next goal then: to avoid a TPS “regression” on a higher load
• How to keep your Max TPS on a higher load too? • the dumb rule : avoid to have a higher load! ;-) • seriously :
• usually all you need is to find a way to do not let you workload concurrency out-pass the levels your reaching on the TPS Max, that’s all..
• InnoDB thread concurrency helps here (yet more improved in MySQL 5.7) • InnoDB spin wait delay tuning helps to lower mutexes / rw-locks waits impact • ThreadPool
• NOTE : there is no “magic” for response time : • if your Max TPS you’re reaching on N users • and able to keep the same Max TPS on N x2 users (or x3, x4, etc.) • your response time may only grow! (and be x2 times bigger (or x3, or x4, etc.))

Thread Pool in old MySQL 5.7 @Heavy OLTP_RW

MySQL & CPU Usage
• CPU chips progress: • CPU = 1 CPU (1 vcpu) • CPU = N cores (N vcpu) • CPU = N cores, M core threads (NxP vcpu) • …
• How many really parallel tasks your CPU is able to execute?? • as many as how many vcpu are really able to run in parallel! • for ex. you have 32cores-HT :
• only 32 concurrent MySQL threads may be executed on the same time • is HT helping? - yes • is HT makes 32cores be equal to 64cores? - no • if my system is reporting to have CPU 50% busy on my MySQL workload, does it mean I have a
50% marge in CPU usage? — NO!.. ;-) • my workload is pure CPU bound, I’m reaching N TPS on 64 users and I’m claiming I’m getting x5
higher (Nx5) TPS on 512 users! — well, you’re lying somewhere ;-))

Starting point : “Tuning” by expected activity
• Workload expectations : • OLTP : ok • DWH : not an easy life ;-) no parallelization, optimizer tips, mixed solutions, etc..
• HW according expected load : • low load : small box, few but fast CPU(s) • high load : big box, many CPU(s) vs faster CPU(s) • storage : always important when you do IO
• extremely important when you do random IO reads !!! • RAM : more you have => better you are doing ;-)
• cache, sort, heap, purge, etc.. • however, be sure you’re using it (don’t waste ;-))
• network: lower possible latency
• (think about priority & compromise slide)

Starting point : “Tuning” OS/FS related choices
• Linux : • LD_PRELOAD MT-oriented malloc: jemalloc, tcmalloc, etc. • right IO scheduler (not cfq) • right FS/ mount options/ AIO/ O_DIRECT/ etc..
• nobarriers,noatime,nodirtime,…
• Solaris : • LD_PRELOAD MT-oriented malloc: mtmalloc, umem • UFS/forcedirectio • ZFS
• ZFS Appliance

MySQL Performance Evolution
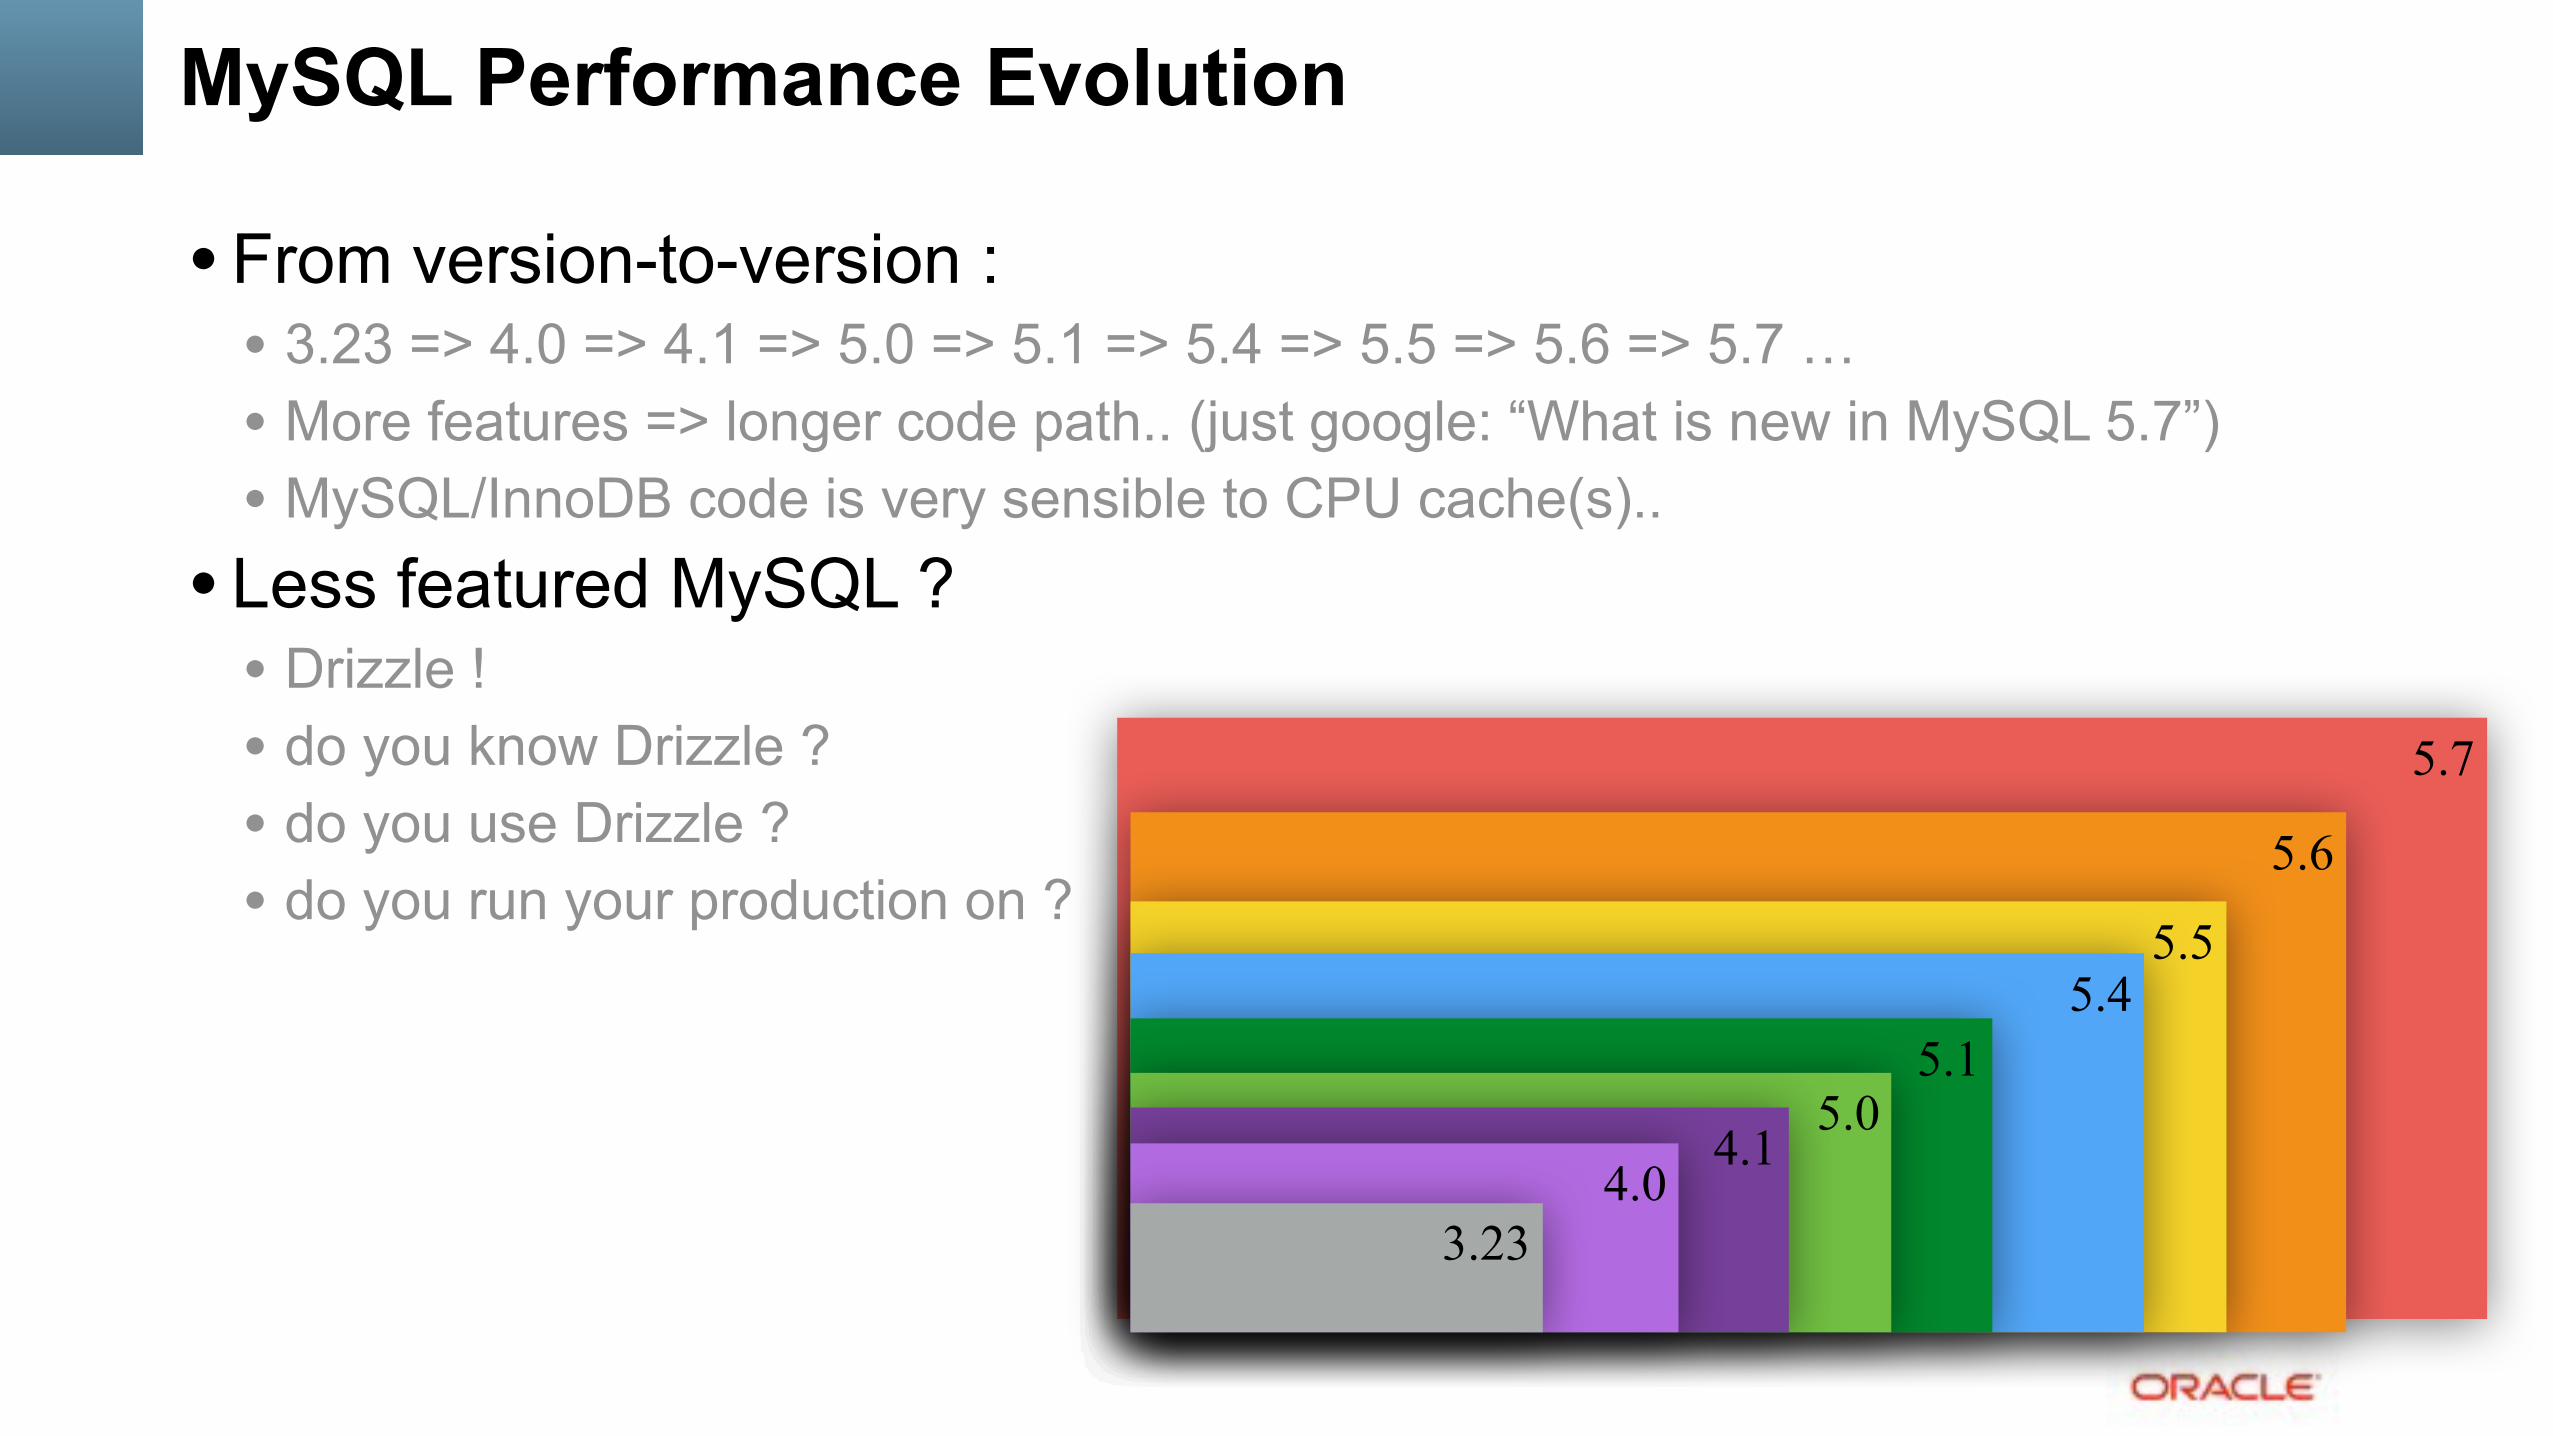
• From version-to-version : • 3.23 => 4.0 => 4.1 => 5.0 => 5.1 => 5.4 => 5.5 => 5.6 => 5.7 … • More features => longer code path.. (just google: “What is new in MySQL 5.7”) • MySQL/InnoDB code is very sensible to CPU cache(s).. • Going slower :
• single-user.. • low-load.. • small-HW..
• Going faster : • where scalability was improved • higher-load.. • newer/bigger-HW..
5.7
5.6
5.5 5.4
5.1 5.0
4.1 4.0
3.23
MySQL Performance Evolution
• From version-to-version : • 3.23 => 4.0 => 4.1 => 5.0 => 5.1 => 5.4 => 5.5 => 5.6 => 5.7 … • More features => longer code path.. (just google: “What is new in MySQL 5.7”) • MySQL/InnoDB code is very sensible to CPU cache(s)..
• Less featured MySQL ? • Drizzle ! • do you know Drizzle ? • do you use Drizzle ? • do you run your production on ?
5.7
5.6
5.5 5.4
5.1 5.0
4.1 4.0
3.23

Performance Investigation Efforts (relative)
• report a problem.. • point on the source of the problem.. • suggest what should be fixed.. • suggest how it should be fixed… • implement the final fix…

Benchmarking & Tuning…
• depending on the MySQL version : • some things you “may tune” • some things you “may just accept” ;-) • (e.g. you need 5.6 to have binlog group commit, etc.)
• so, you need to have a clear idea about : • which situation you can always solve by tuning, so no worry.. • which situation you may only avoid, so have to consider and take care about.. • which situation was fixed or can be tuned in a newer MySQL version • don’t create artificial limitations yourself (e.g. if 32GB REDO is allowed - use it!) • be sure what is really important for you!
• general advice : validate & move to MySQL 5.7 asap ;-)
Only a real test gives you a real answer...
• Avoid to tweak on production systems ;-) • Rather try to reproduce your load on a similar, but dedicated to test server • Collect test cases for all the most critical parts..
• Want to simulate your production workload?.. • Then just simulate it! (many SW available, not always OSS/free) • Hard to simulate? - adapt some generic tests
• Want to know capacity limits of a given platform? • Still try to focus on the test which are most significant for you!
• Want just to validate config settings impacts? • Focus on tests which are potentially depending on these settings
• Well, just keep thinking about what you're doing ;-)
Test Workload
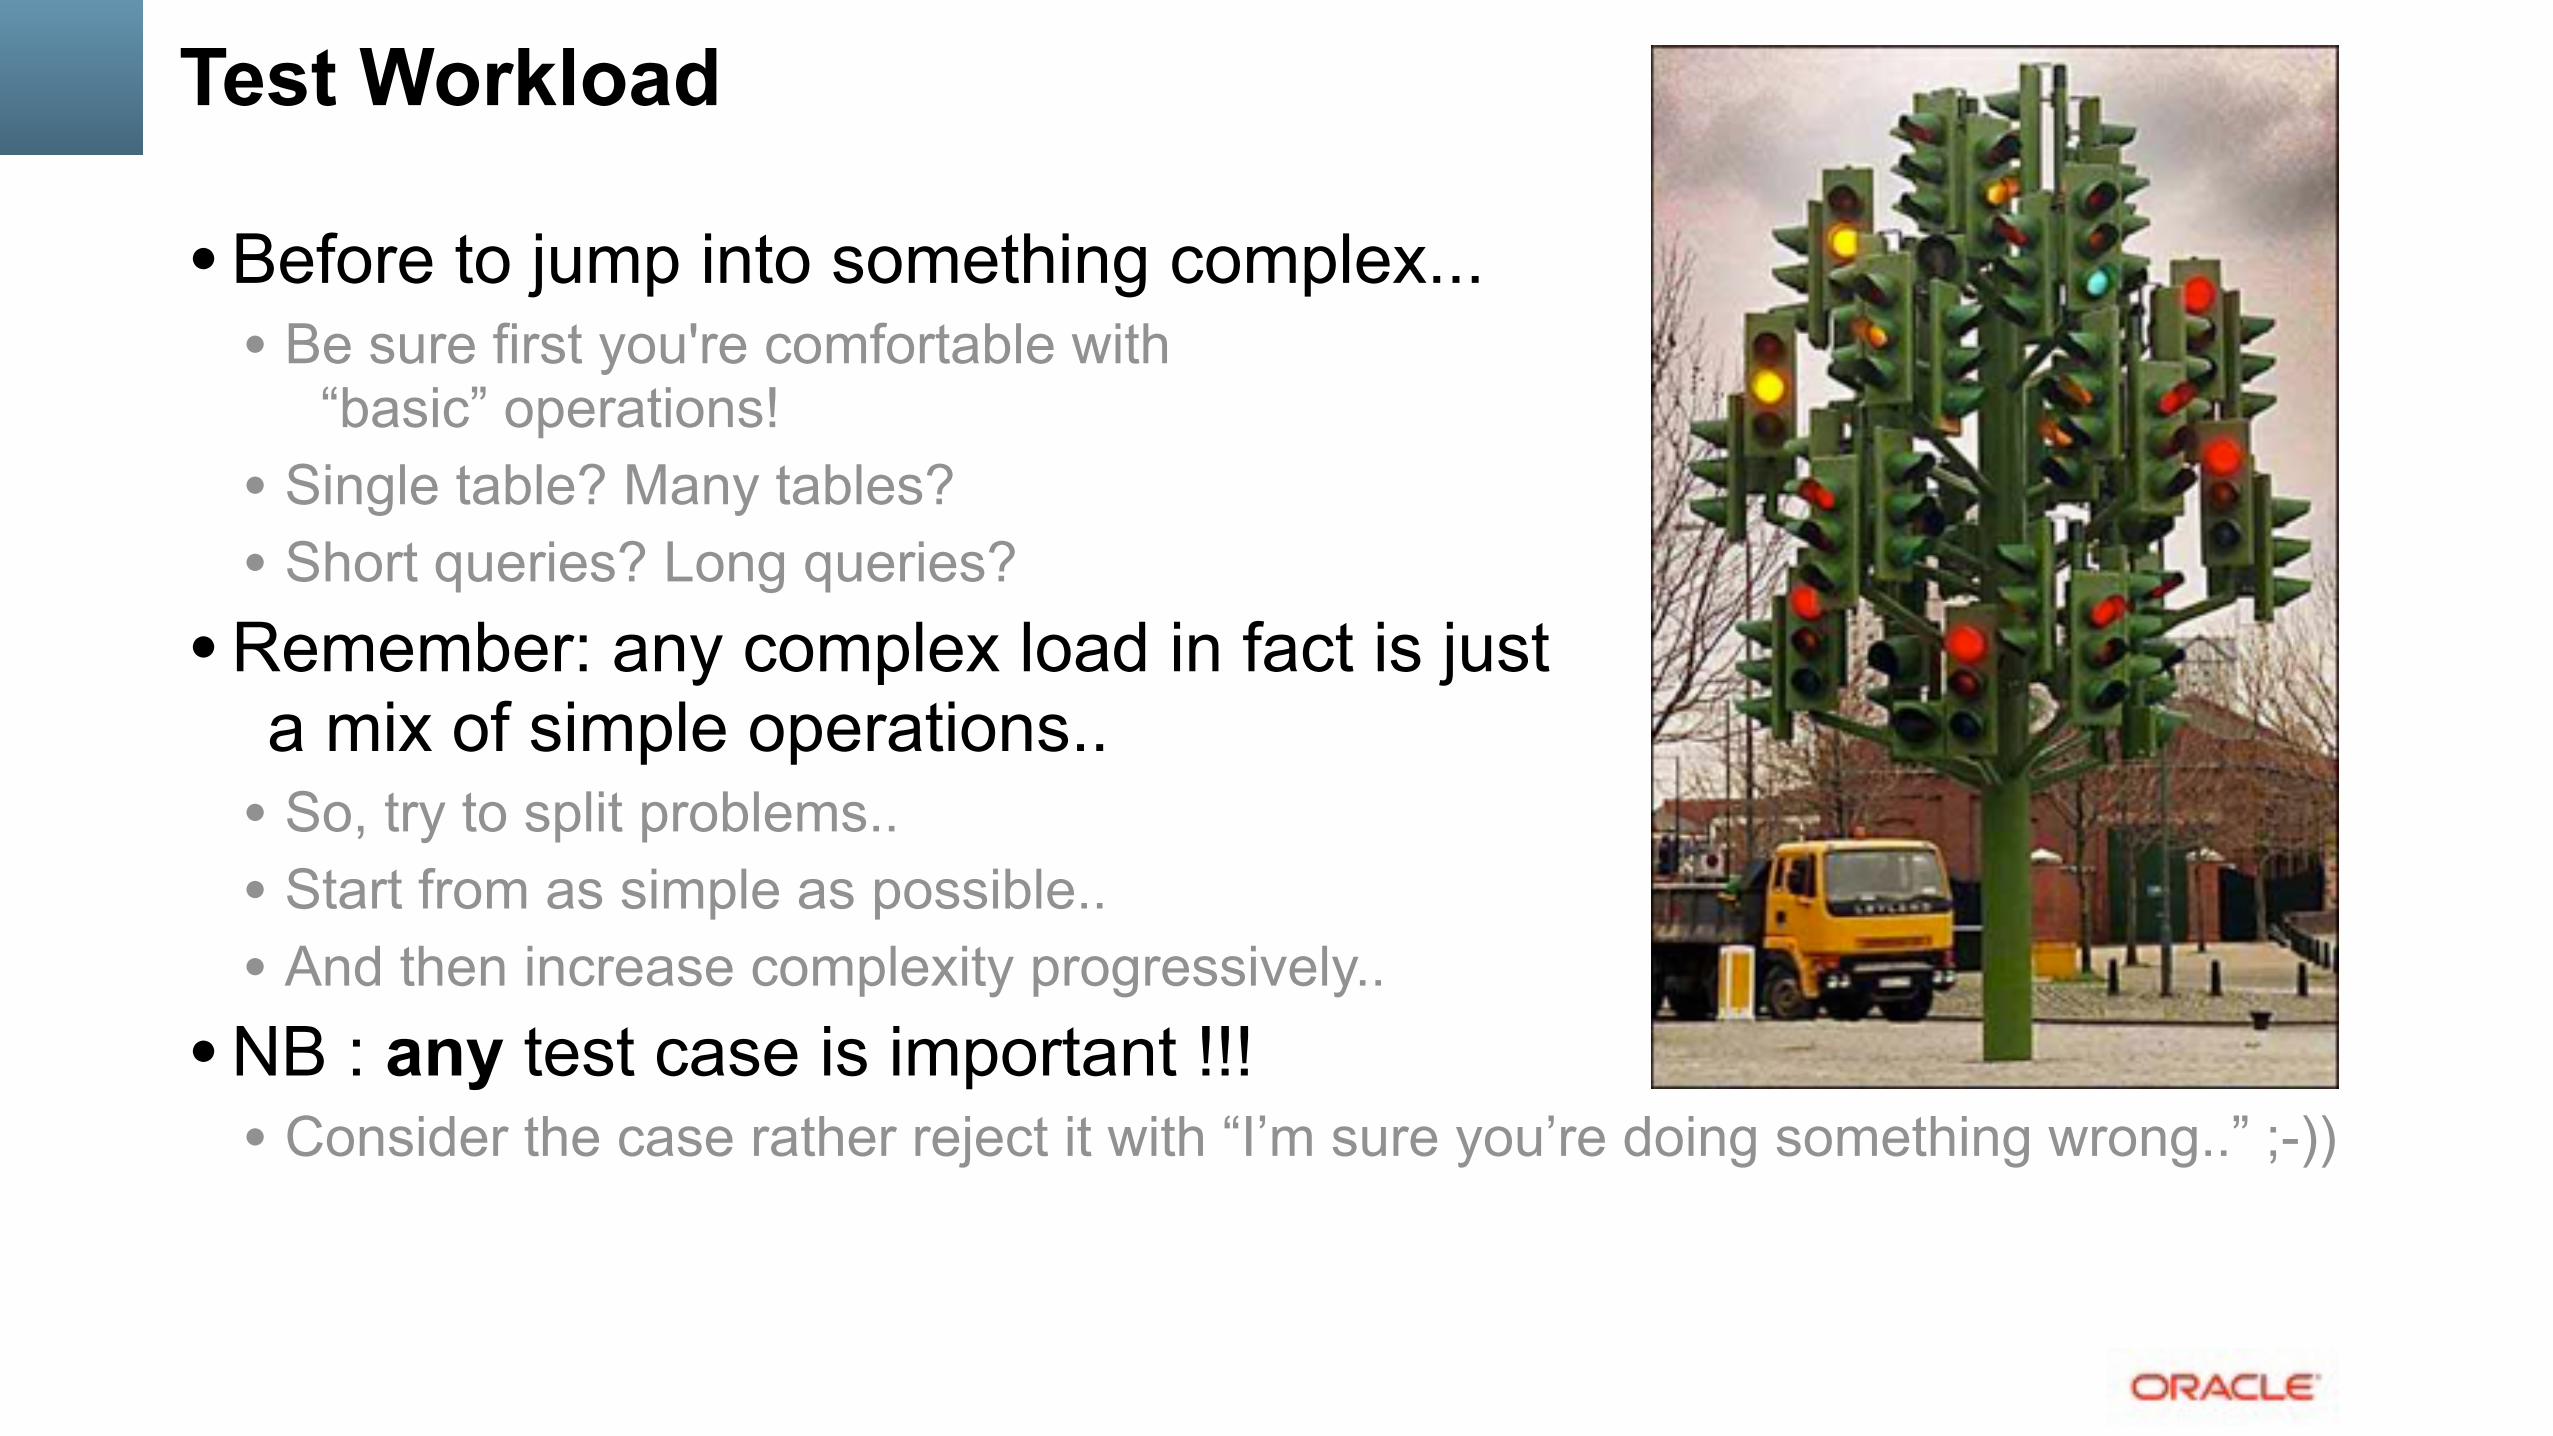
• Before to jump into something complex... • Be sure first you're comfortable with
“basic” operations! • Single table? Many tables? • Short queries? Long queries?
• Remember: any complex load in fact is just a mix of simple operations..
• So, try to split problems.. • Start from as simple as possible.. • And then increase complexity progressively..
• NB : any test case is important !!! • Consider the case rather reject it with “I’m sure you’re doing something wrong..” ;-))
“Generic” Test Workloads @MySQL
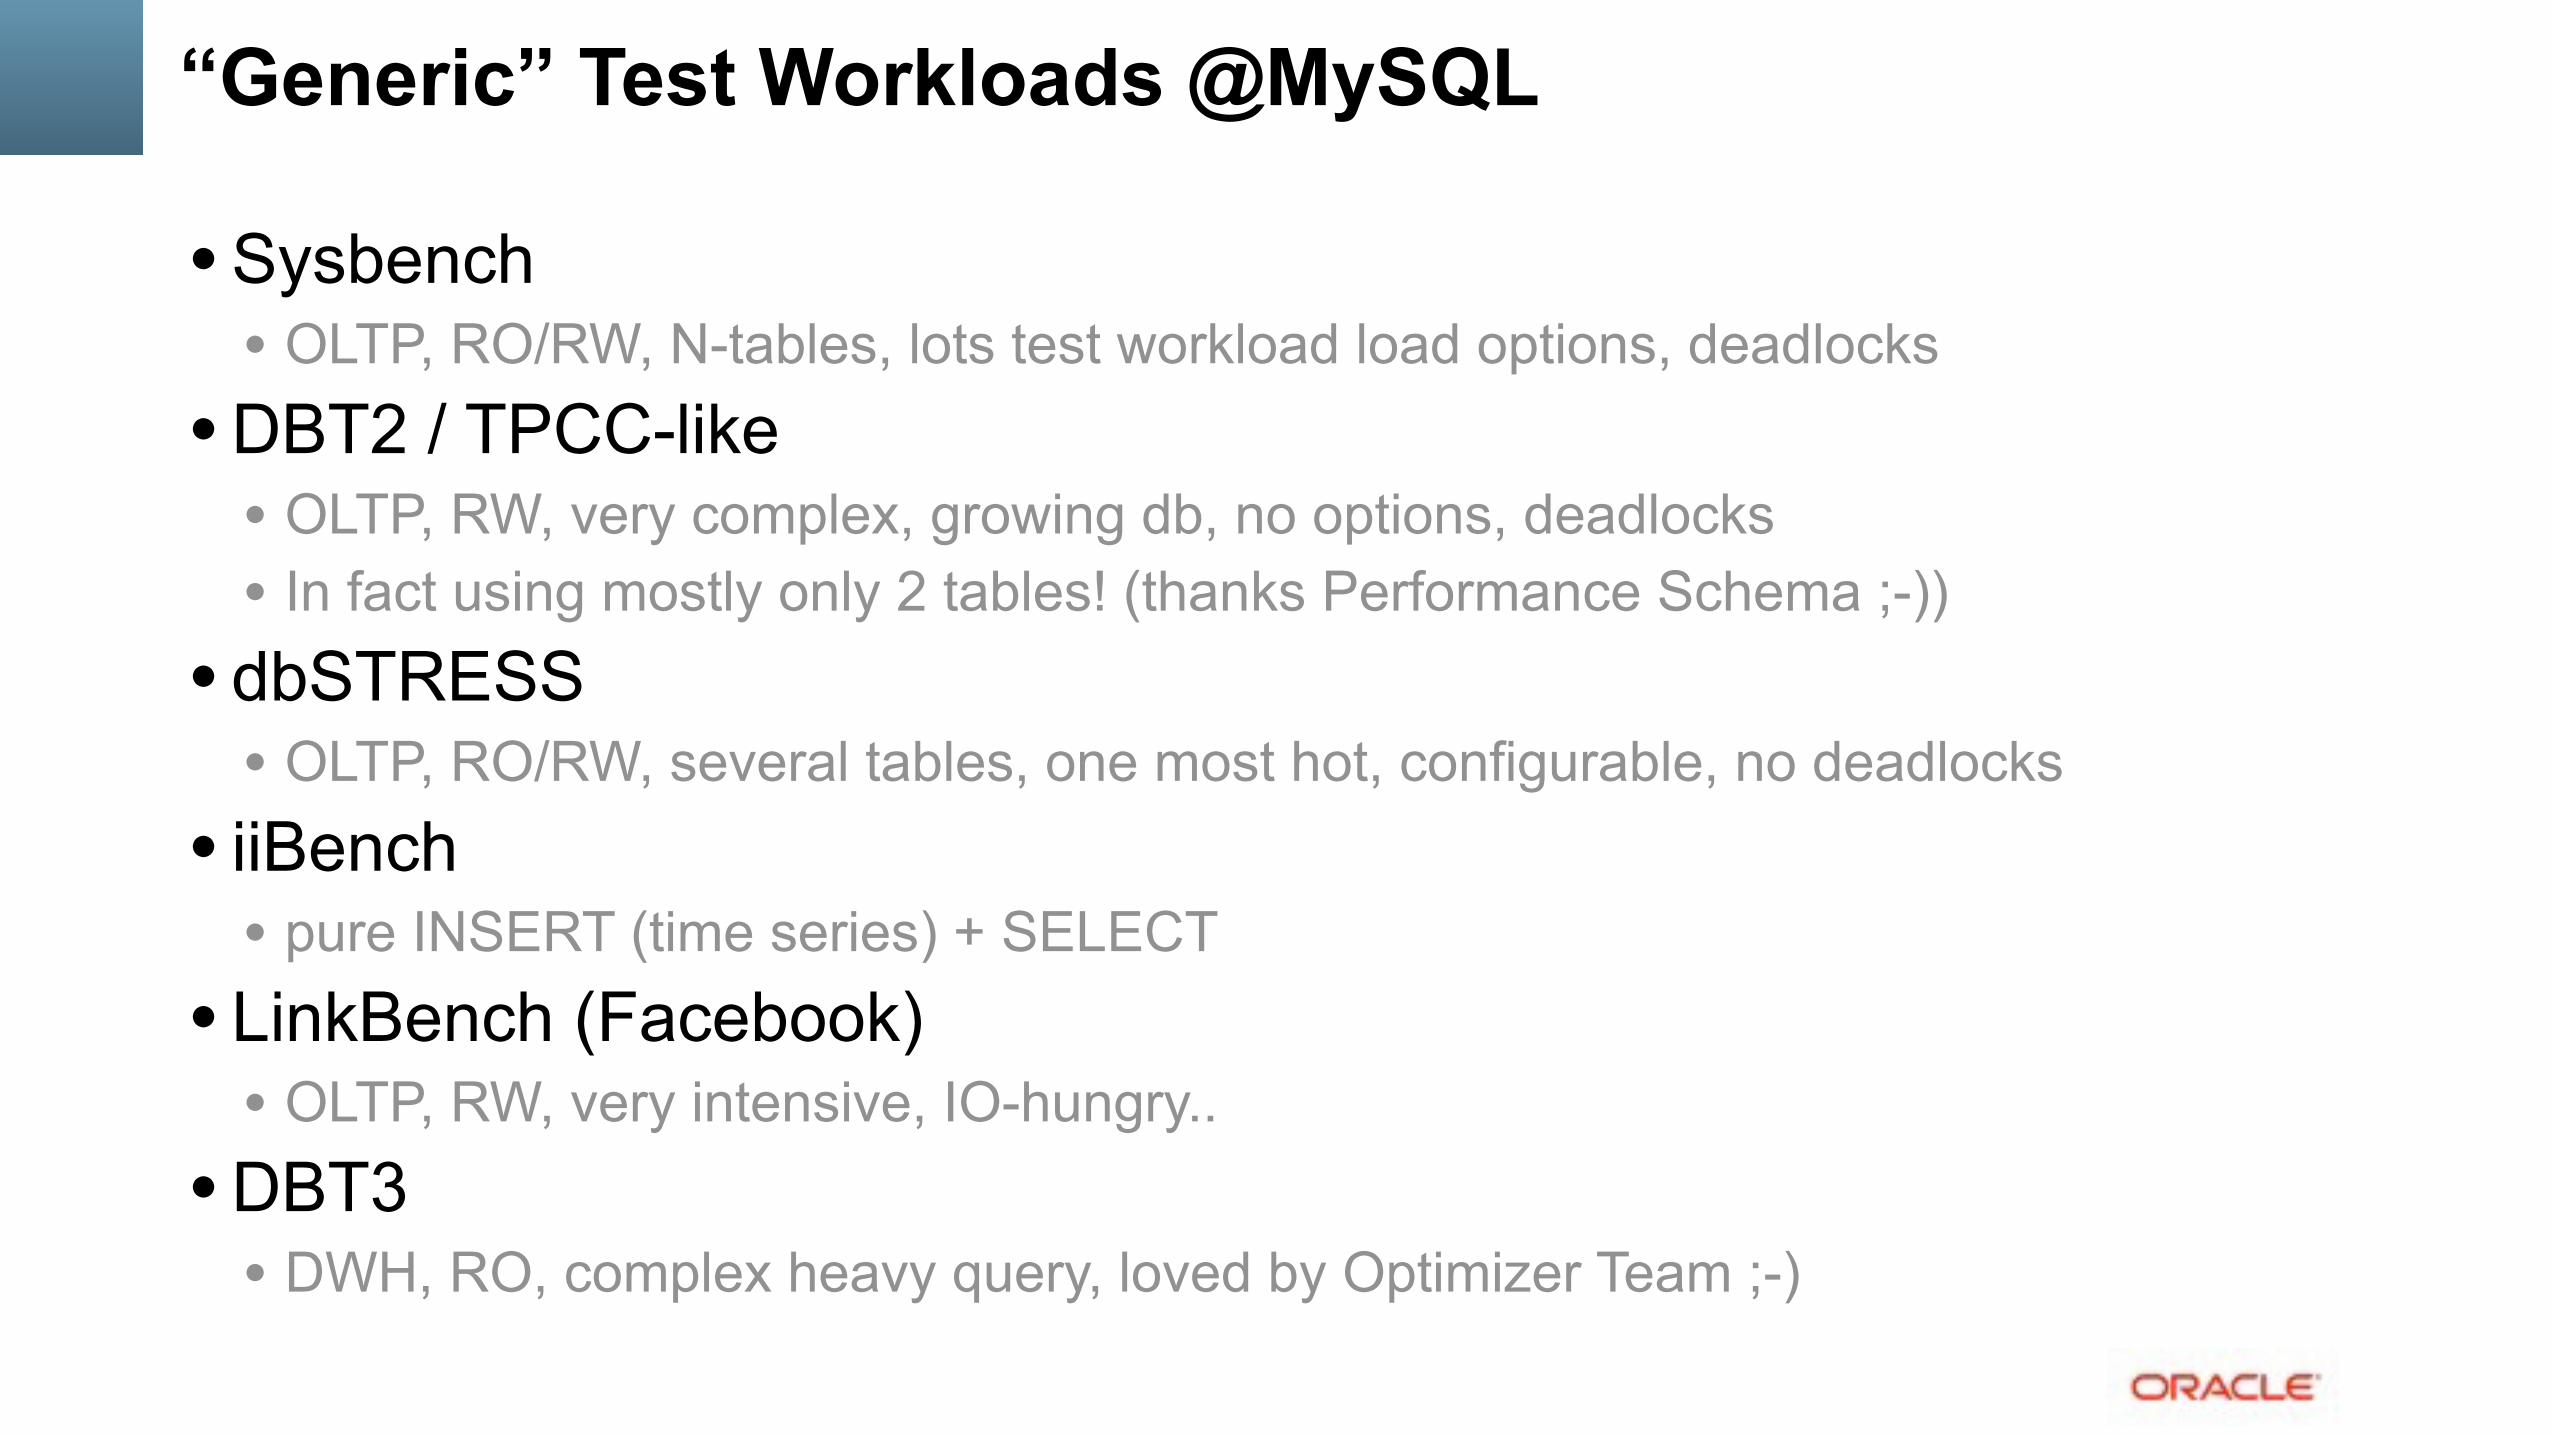
• Sysbench • OLTP, RO/RW, N-tables, lots test workload load options, deadlocks
• DBT2 / TPCC-like • OLTP, RW, very complex, growing db, no options, deadlocks • In fact using mostly only 2 tables! (thanks Performance Schema ;-))
• dbSTRESS • OLTP, RO/RW, several tables, one most hot, configurable, no deadlocks
• iiBench • pure INSERT (time series) + SELECT
• LinkBench (Facebook) • OLTP, RW, very intensive, IO-hungry..
• DBT3 • DWH, RO, complex heavy query, loved by Optimizer Team ;-)

Monitoring is THE MUST ! even don’t start to do anything
without monitoring.. ;-)
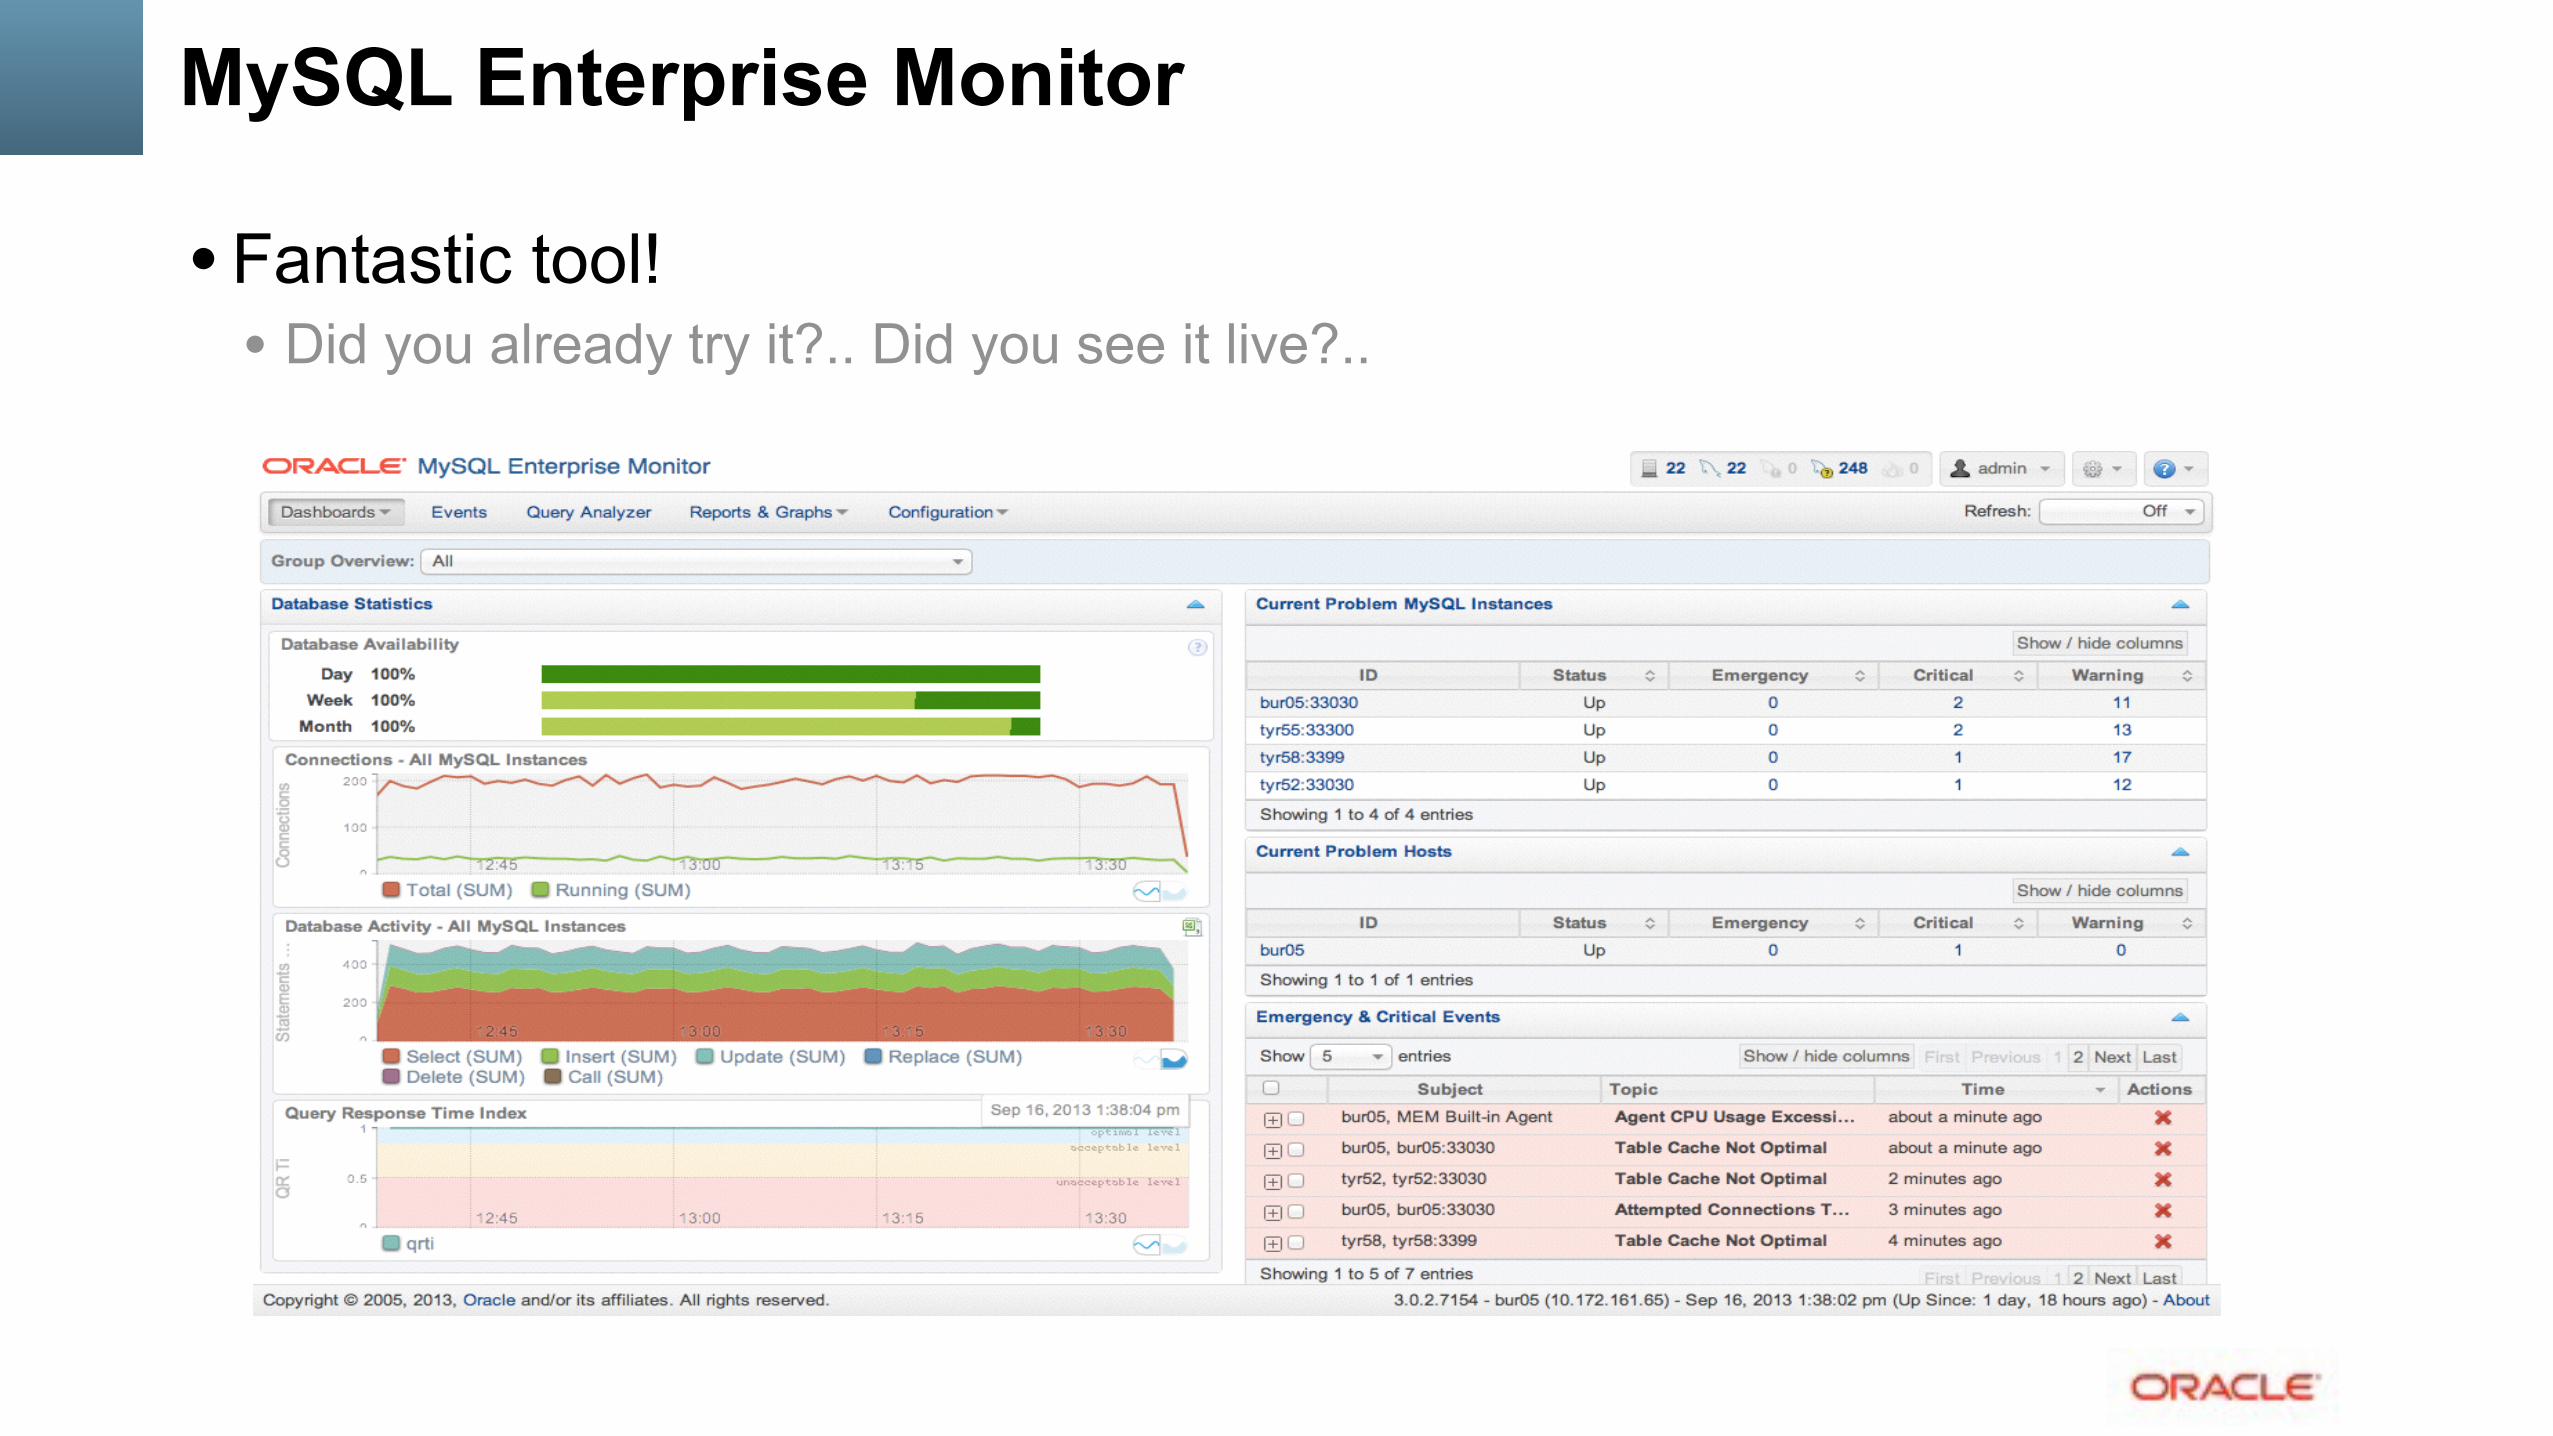
MySQL Enterprise Monitor
• Fantastic tool! • Did you already try it?.. Did you see it live?..

Other Monitoring Tools
• Cacti, Zabbix, Nagios, Solarwinds, etc….. • dim_STAT
• well, I'm using this one, sorry ;-) • all graphs within presentation were made with it • details are in the end of presentation..

A Word about Monitoring…
• always validate the impact of your Monitoring on your Production ;-) • taking 1sec measurements is fine, except :
• if it’s eating 100% CPU time on one or more CPU cores.. • reducing your network traffic / latency.. • eats your RAM, etc.
• avoid to be too much intrusive on MySQL/InnoDB internals.. • you may easily create an additional overhead • as well you may add artificial locks on your workflow
• ex: in 5.6 run in loop “show processlist”, etc..
• well, think about what you’re doing (#1 best practice once again ;-))

System Monitoring (Linux)
• Keep an eye on : • CPU Usage% • Run queue • RAM / swap • Top processes • I/O op/sec / MB/sec • Network traffic • etc..
Credits : Brendan GREGG (http://www.brendangregg.com)

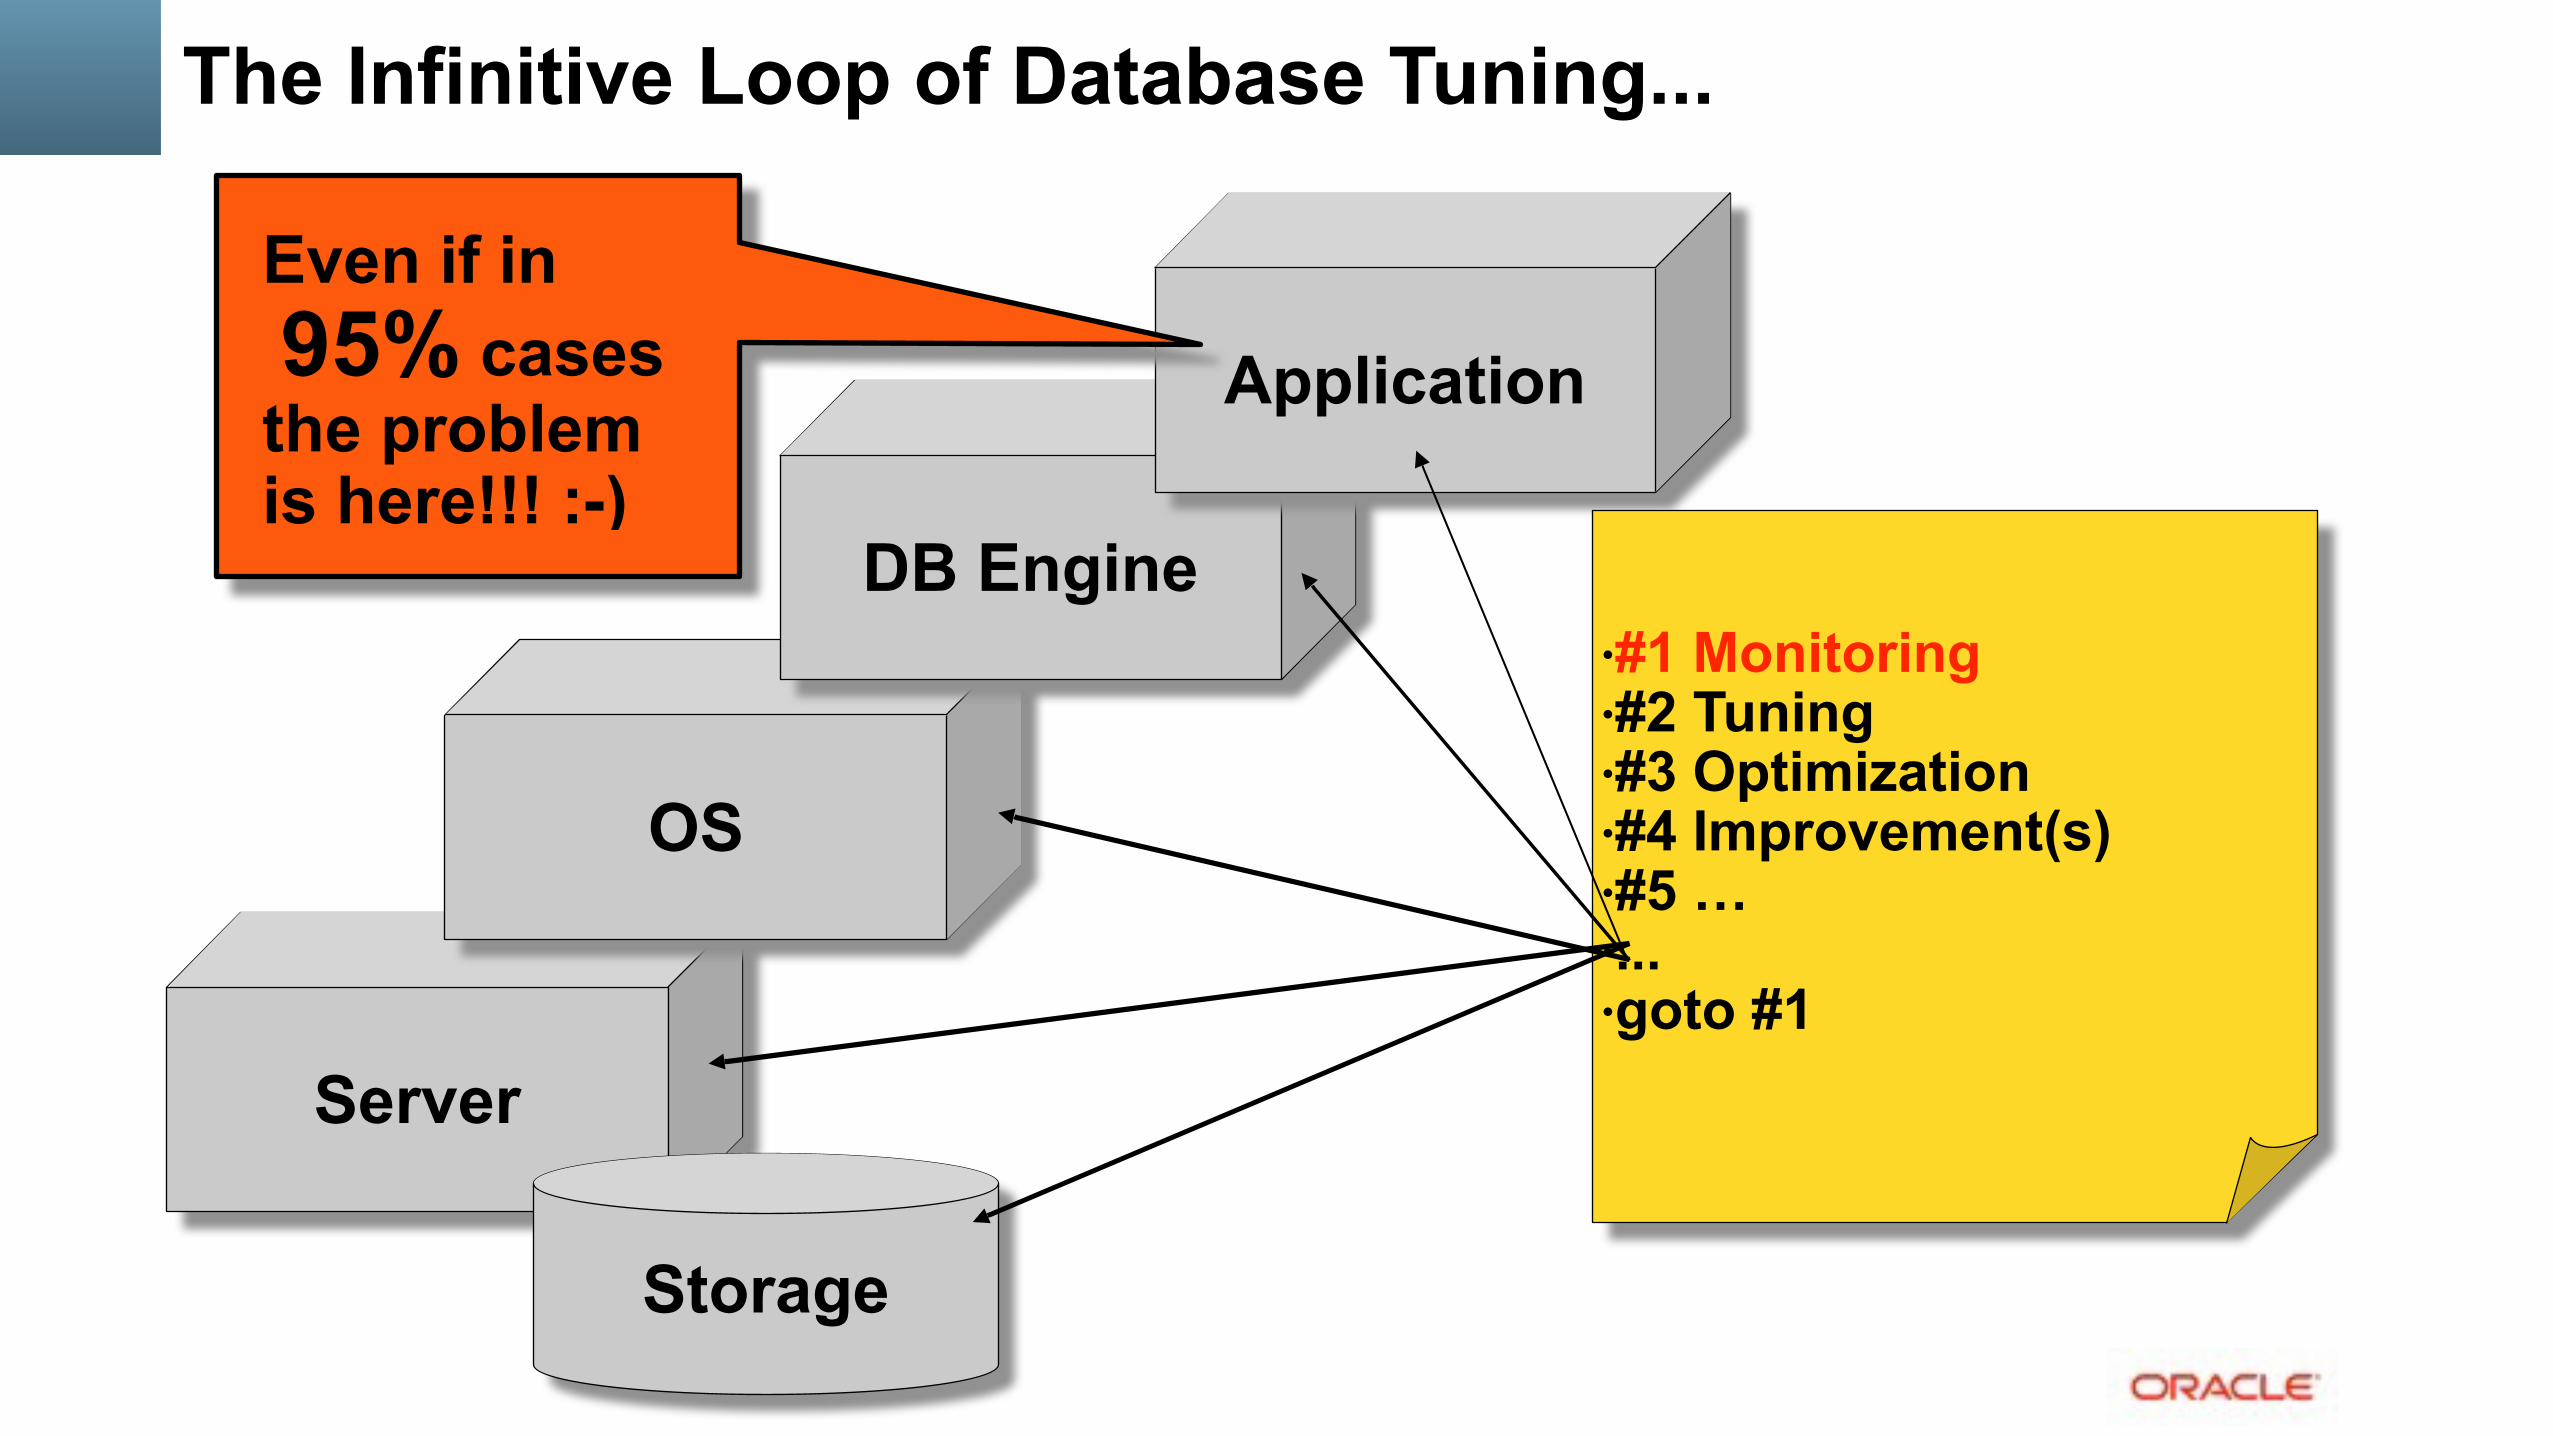
The Infinitive Loop of Database Tuning...
Server
Storage
OS
DB Engine
Application
•#1 Monitoring •#2 Tuning •#3 Optimization •#4 Improvement(s) •#5 … •... •goto #1
The Infinitive Loop of Database Tuning...
Server
Storage
OS
DB Engine
Application
•#1 Monitoring •#2 Tuning •#3 Optimization •#4 Improvement(s) •#5 … •... •goto #1
Even if in 95% cases the problem is here!!! :-)

What to Monitor ?..
• Everything ;-) • The main goal of Monitoring :
• to understand what is changed once you’re hitting a performance problem.. • (all the diff between “good” -vs- “bad”) • otherwise all this is useless ;-))
• Then : • be sure the problem is coming from MySQL.. • be sure you’re not hitting any system limits !! • be sure you’re not hitting MySQL internal limitations..

Using “perf” (Linux) — low impact profiler
• Use cases : • # perf top -z --stdio <== live monitoring • # perf record -a -g -f -F 99 -- sleep 20 <== record 20sec of data • # perf report | more <== report from collected data • # perf annotate <== jump to source code
• links : • https://perf.wiki.kernel.org <== main resource • http://www.brendangregg.com/perf.html <== the most fun stuff !!!
• Thanks Brendan! ;-))
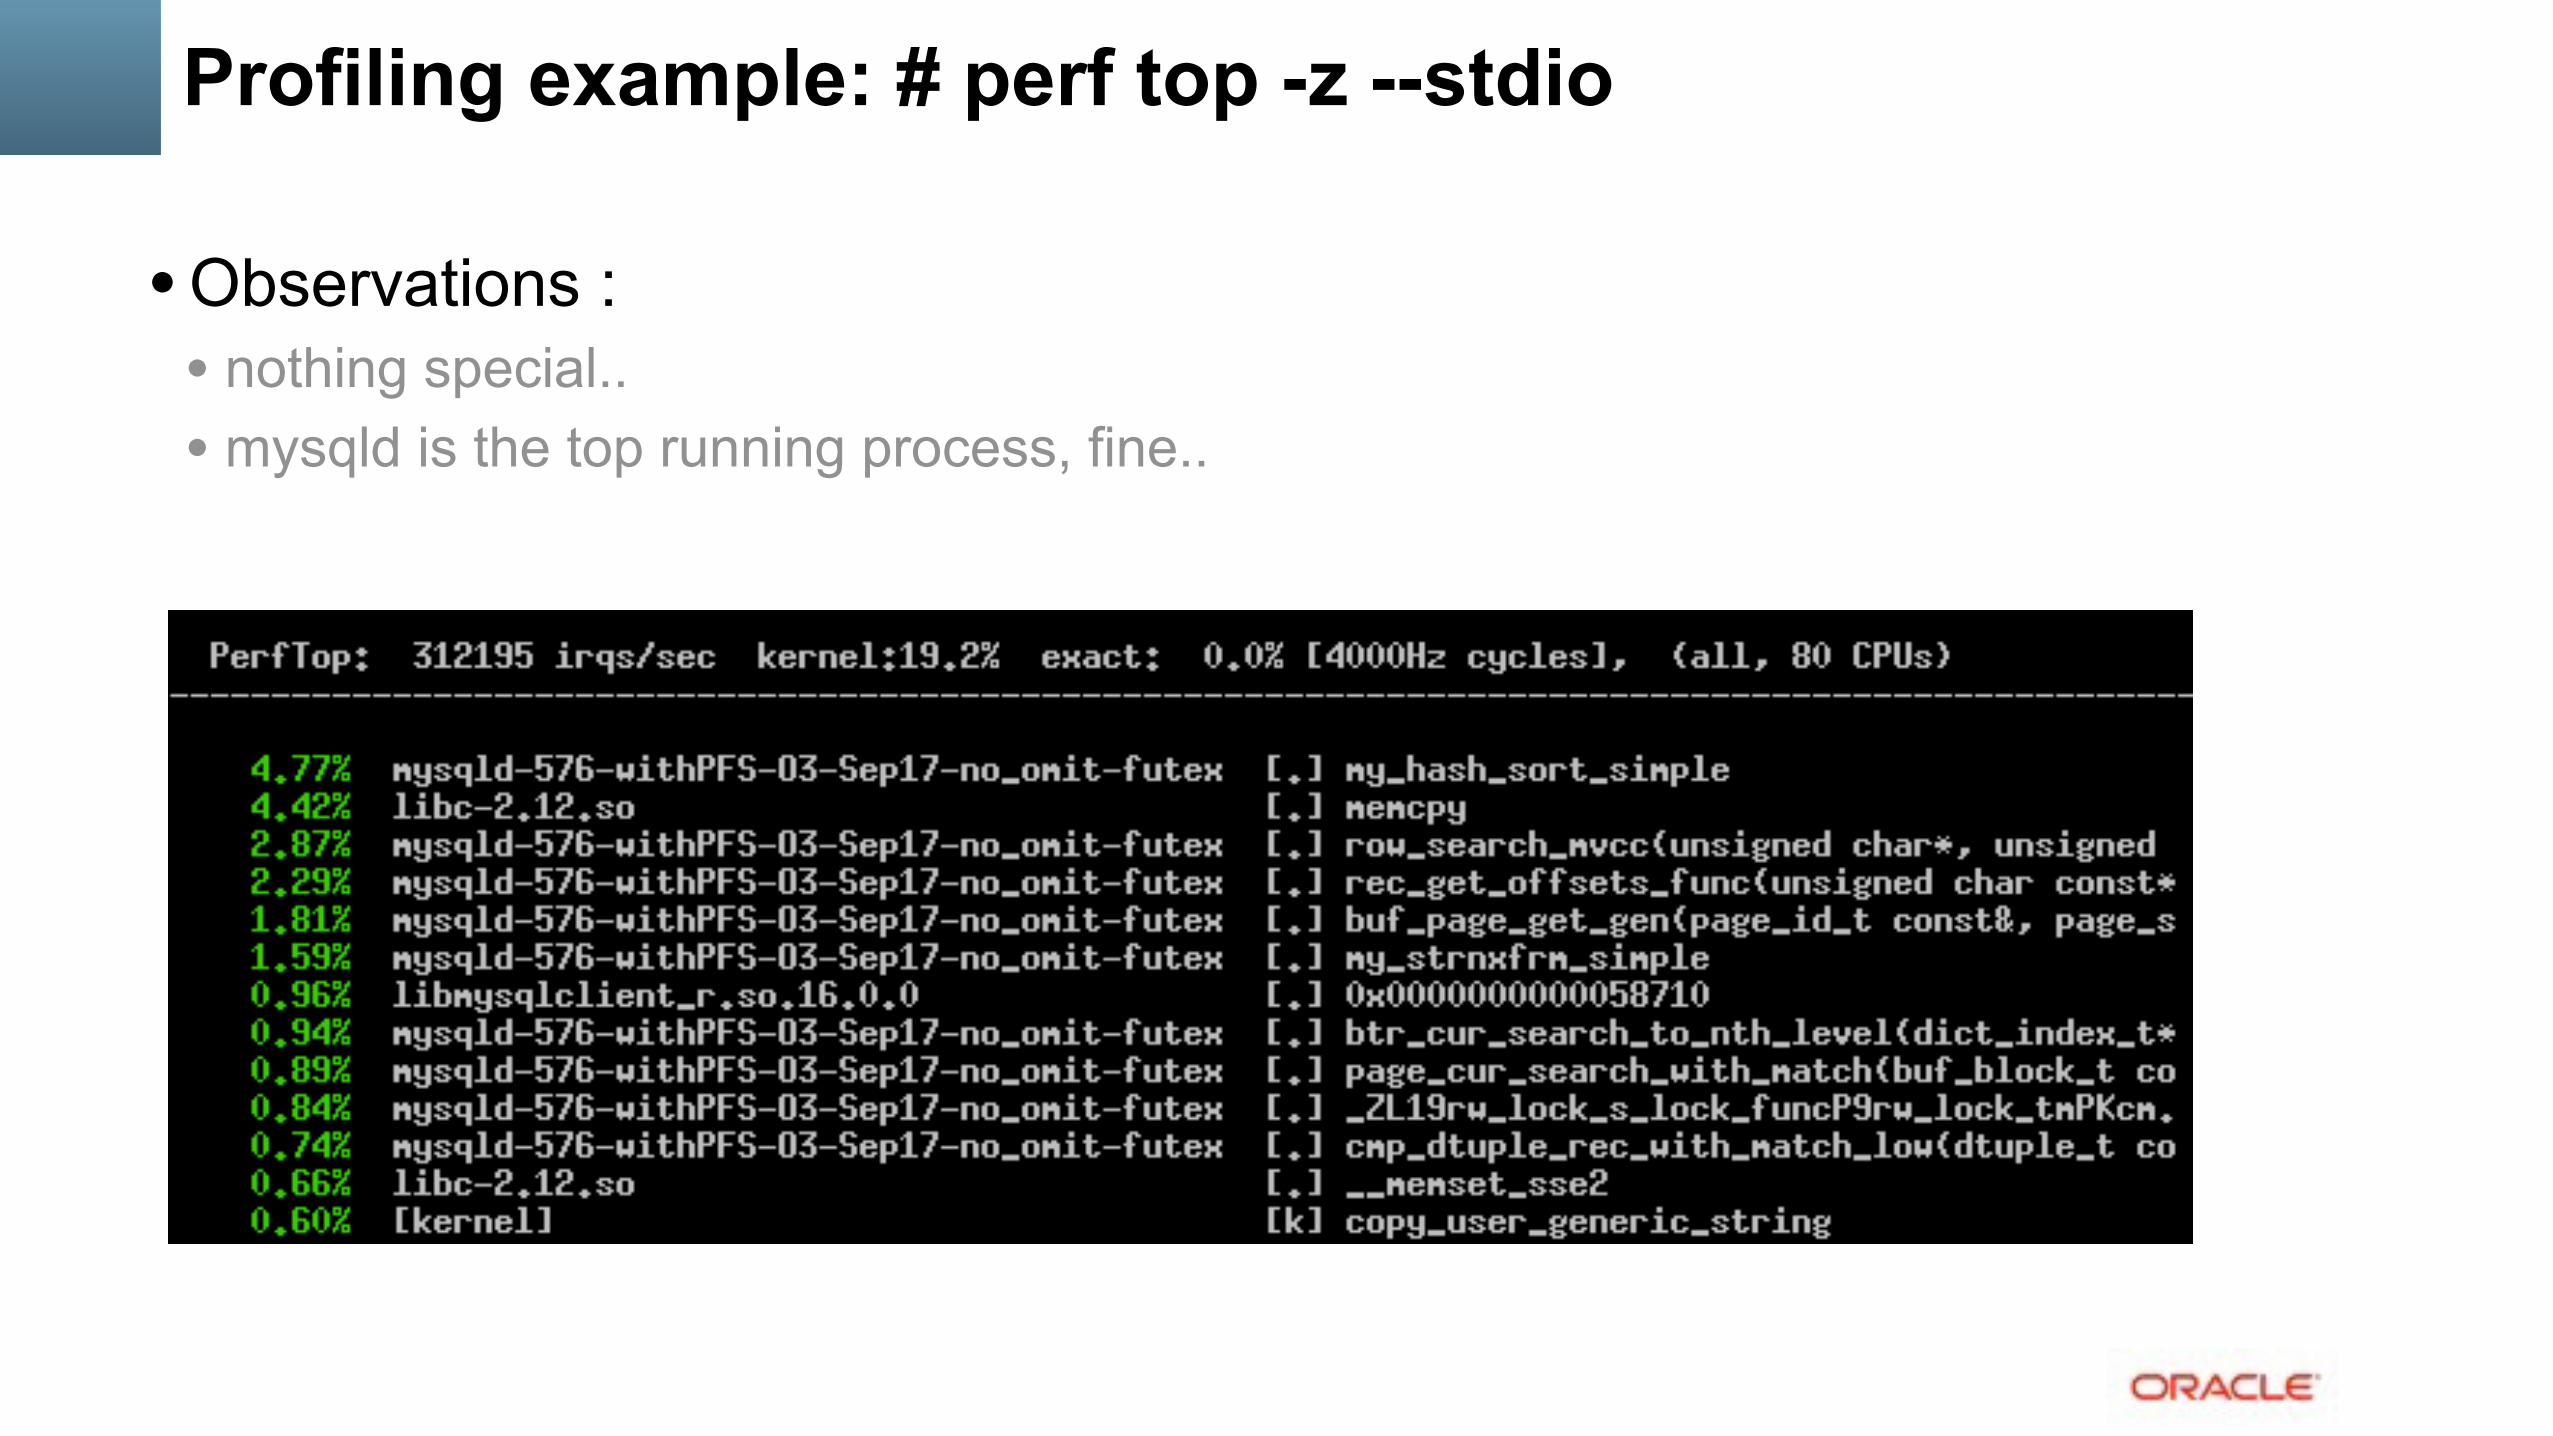
Profiling example: # perf top -z --stdio
• Observations : • nothing special.. • mysqld is the top running process, fine..

Profiling example (2)
• Observations : • memcpy() is the most hot, called by mysqld (check call-stack) • nothing to do.. (check apps, SELECT ranges, etc..)

Profiling example (3)
• Observations : • my_hash_sort_simple() is the most hot (mysqld) • nothing to do.. (check apps, memory temp tables usage, query plan, etc..)
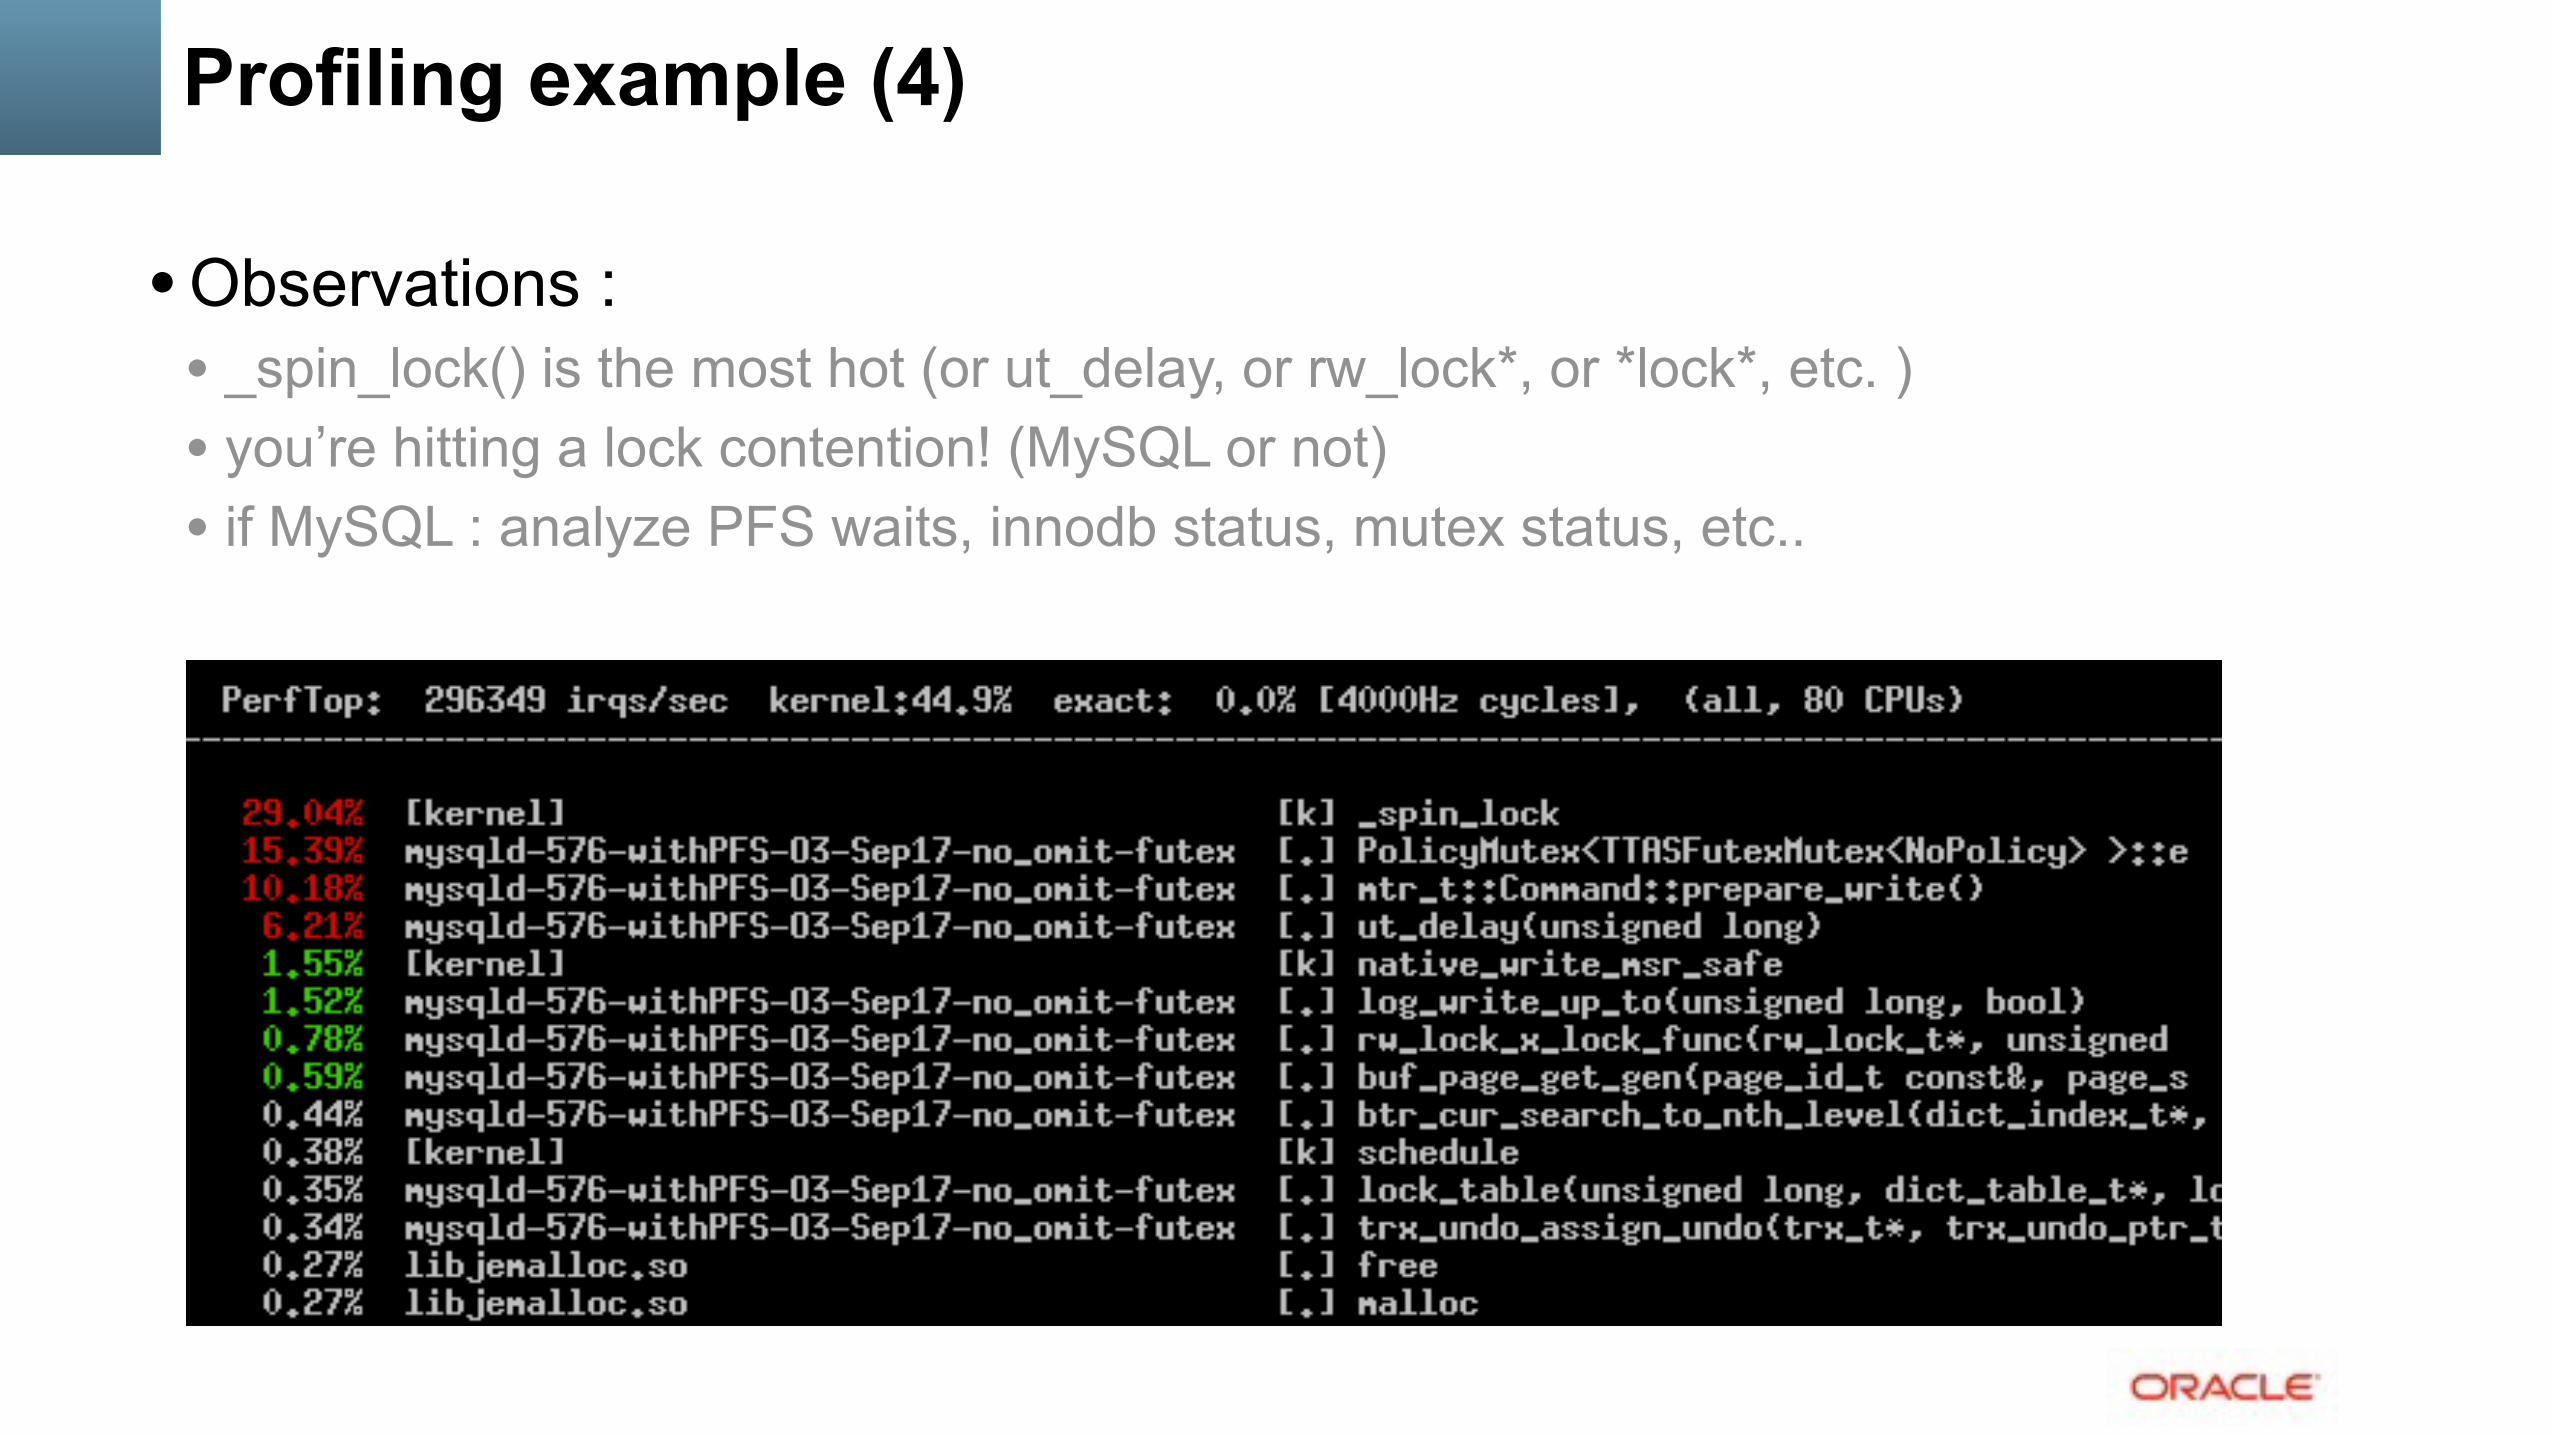
Profiling example (4)
• Observations : • _spin_lock() is the most hot (or ut_delay, or rw_lock*, or *lock*, etc. ) • you’re hitting a lock contention! (MySQL or not) • if MySQL : analyze PFS waits, innodb status, mutex status, etc..

MySQL Internals Overview
• Multi-Threaded • fast context switch • all threads see all data • so, data lock is needed • design is very important • MT malloc() !!!

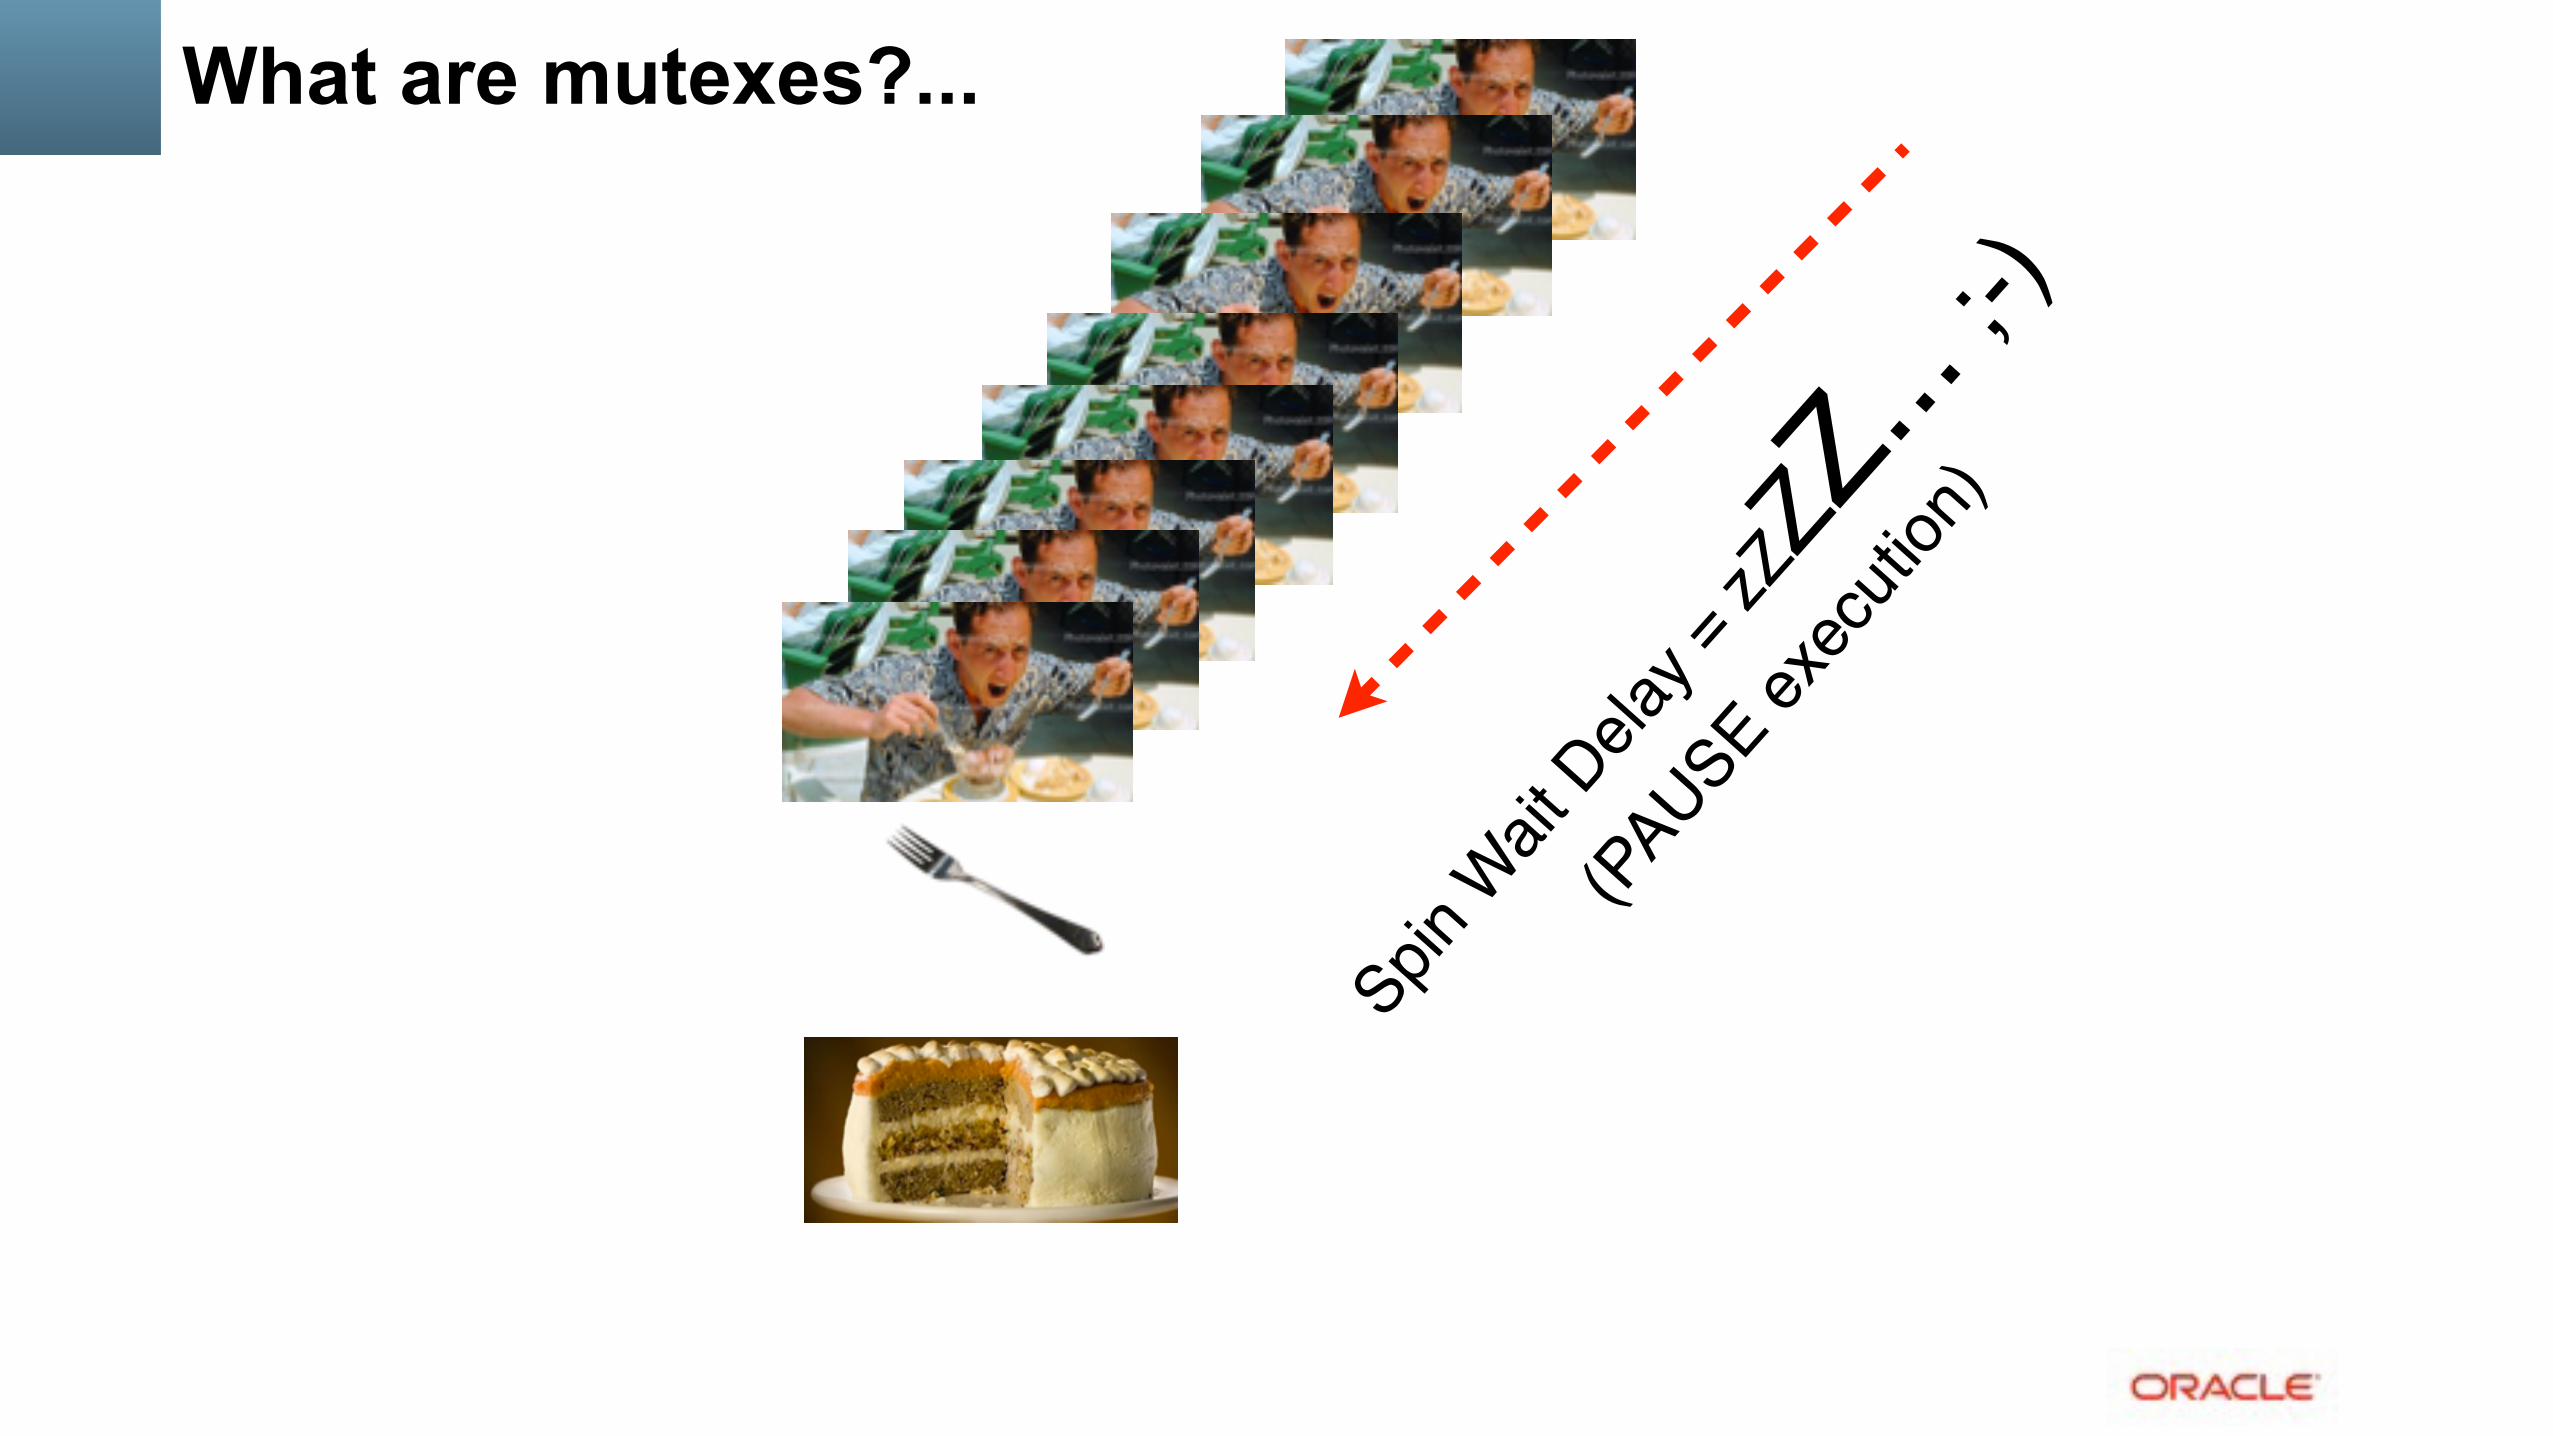
What are mutexes?...

What are mutexes?...

What are mutexes?...

What are mutexes?...
?

What are mutexes?...

What are mutexes?...

What are mutexes?...
What are mutexes?...
Spin W
ait D
elay =
zZZZ
... ;-)!
(PAUSE ex
ecuti
on)

What are mutexes?...

MySQL Internals RE-Overview ;-)
• Multi-Threaded • fast context switch • all threads see all data • so, data lock is needed • design is very important • MT malloc() !!!
InnoDB Internals Overview
• Also Multi-Threaded ;-) • user threads • “background” threads :
• Master thread • Cleaner thread(s) • Purge thread(s) • IO threads
• mutexes and RW-locks • NOTE : current RW-locks implementation is poorly scaling..
• most famous in the past : • MySQL : LOCK_open • InnoDB : kernel_mutex

Performance Schema: Gold Mine of Info!
• Just a point about how to analyze mutex lock contentionsmysql> select EVENT_NAME, max(SUM_TIMER_WAIT)/1000000000000 as WaitTM from events_waits_summary_global_by_event_name group by 1 order by 2 desc limit 5; +-------------------------------------------+------------+ | EVENT_NAME | WaitTM | +-------------------------------------------+------------+ | wait/io/file/innodb/innodb_data_file | 24404.2548 | | idle | 1830.1419 | | wait/synch/rwlock/innodb/hash_table_locks | 25.2959 | | wait/synch/mutex/innodb/fil_system_mutex | 24.9102 | | wait/io/file/innodb/innodb_log_file | 11.2126 | +-------------------------------------------+------------+ 5 rows in set (0.03 sec)
mysql> select EVENT_NAME, max(SUM_TIMER_WAIT)/1000000000000 as WaitTM from events_waits_summary_by_instance group by 1 order by 2 desc limit 5; +-------------------------------------------+----------+ | EVENT_NAME | WaitTM | +-------------------------------------------+----------+ | wait/io/file/innodb/innodb_data_file | 791.3204 | | wait/synch/mutex/innodb/fil_system_mutex | 25.8183 | | wait/synch/rwlock/innodb/btr_search_latch | 5.2865 | | wait/io/file/innodb/innodb_log_file | 4.6977 | | wait/synch/rwlock/sql/LOCK_grant | 4.4940 | +-------------------------------------------+----------+ 5 rows in set (0.06 sec)
+
Visual explanation : MyISAM -vs- InnoDB ;-)
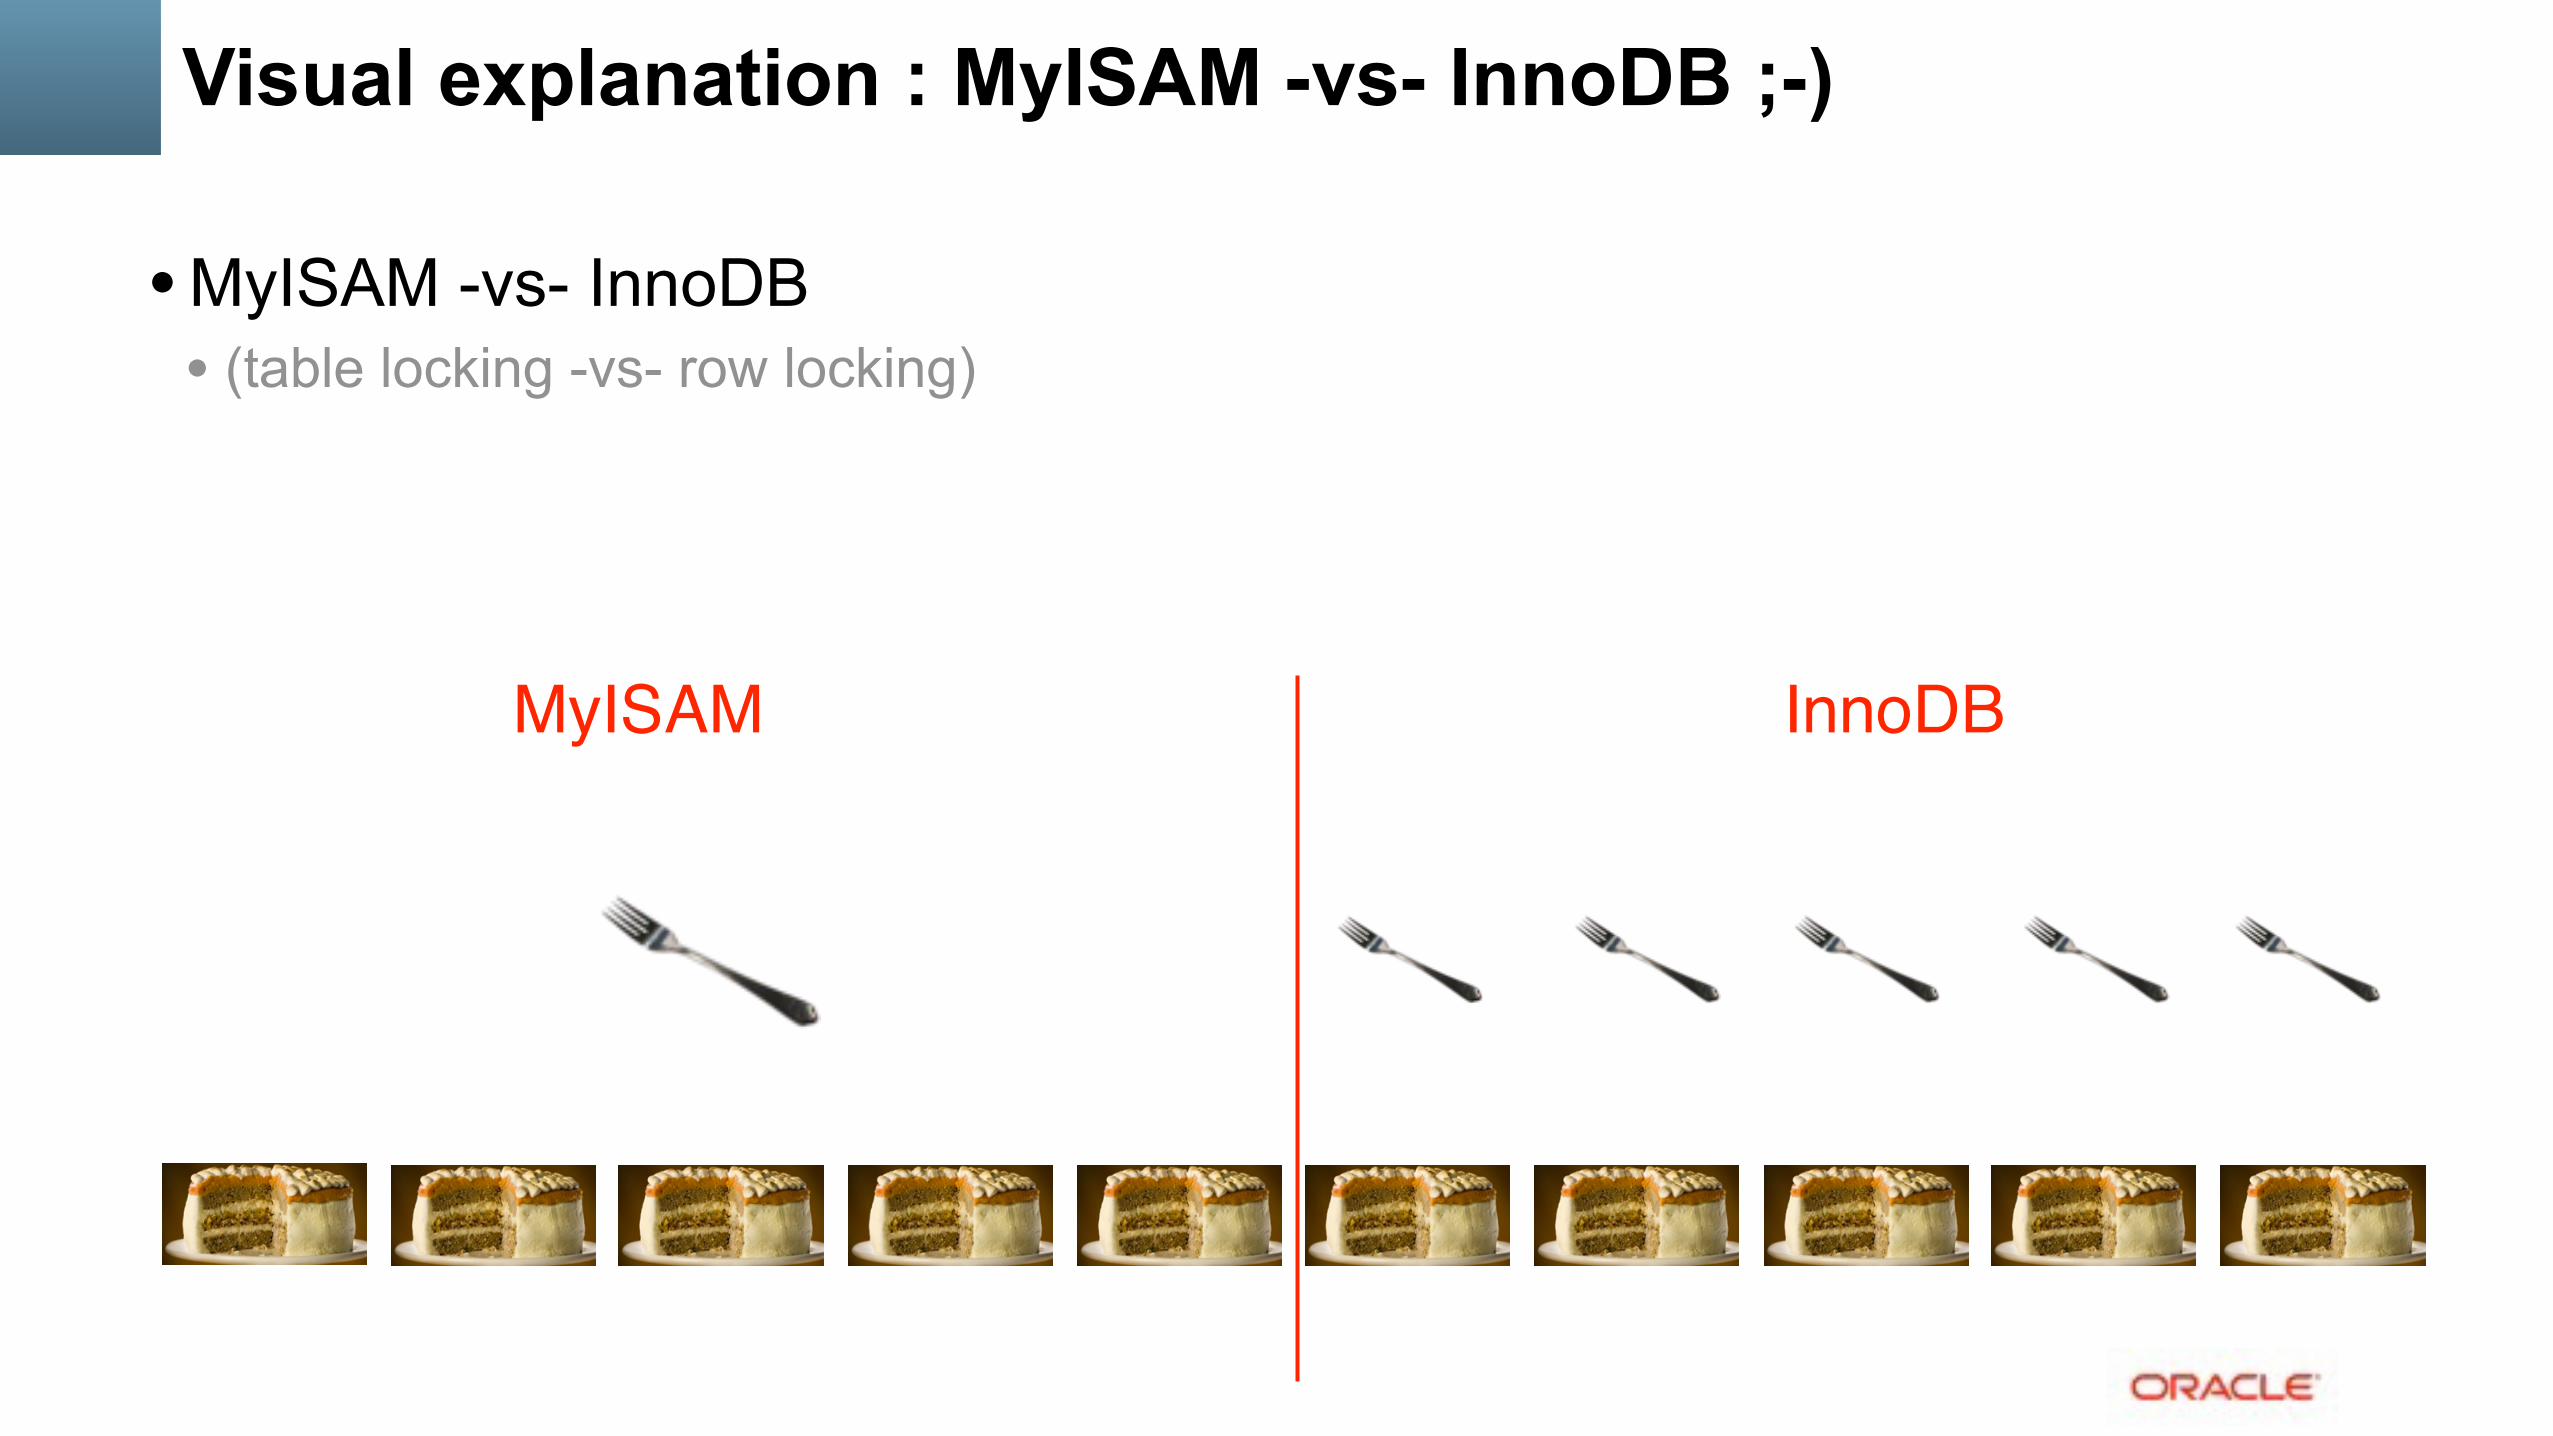
• MyISAM -vs- InnoDB • (table locking -vs- row locking)
MyISAM InnoDB
Analyzing Workloads: RO -vs- RW
• Read-Only (RO) : • Nothing more simple when comparing DB Engines, HW configs, etc.. • RO In-Memory : data set fit in memory / BP / cache • RO IO-bound : data set out-passing a given memory / BP / cache
• Read+Write (RW) : • I/O is ALWAYS present ! - storage performance matters a lot ! • may be considered as always IO-bound ;-) • RW In-Memory : same as RO, data set fit in memory, but :
• small data set => small writes • big dataset => big writes ;-)
• RW IO-bound : data set out-passing a memory • means there will be (a lot of?) reads !
• NOTE : Random Read (RR) operation is the main IO-bound killer !!!
From where we’re coming with MySQL 5.7 ?..
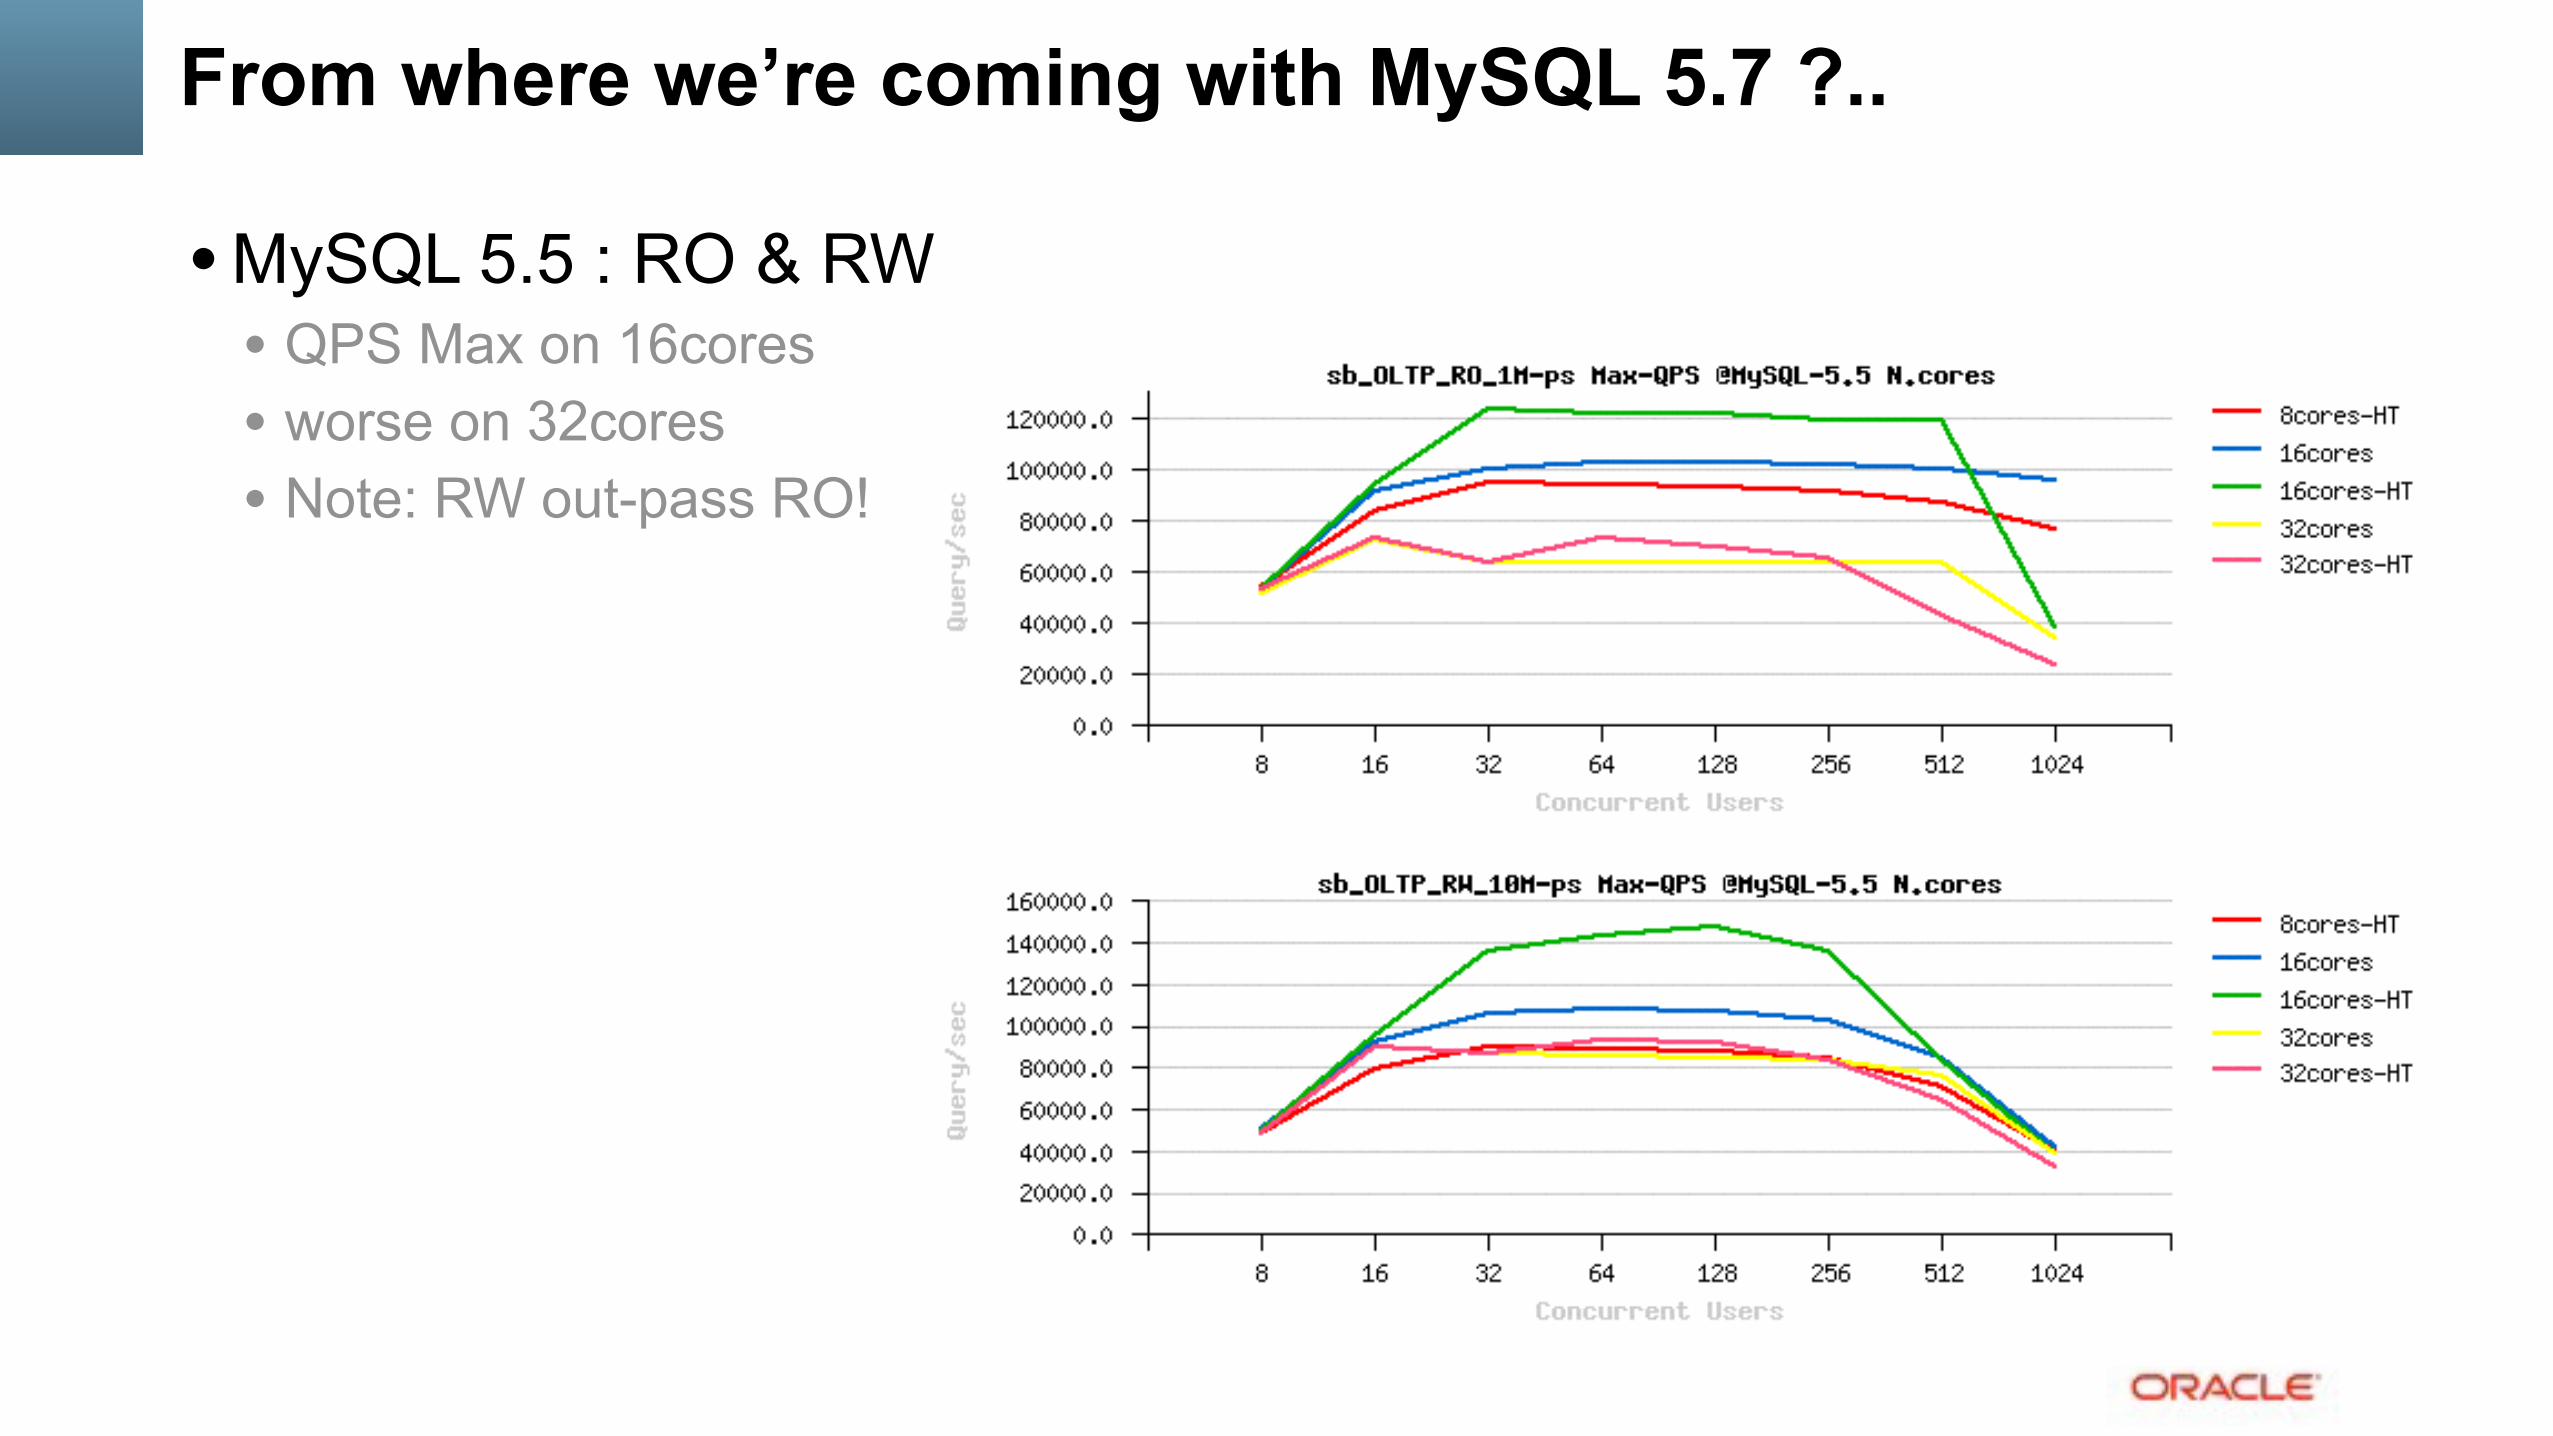
• MySQL 5.5 : RO & RW • QPS Max on 16cores • worse on 32cores • Note: RW out-pass RO!

From where we’re coming with MySQL 5.7 ?..
• MySQL 5.6 : RO & RW • not lower on 32cores!! ;-) • RW out-pass RO !!..??

From where we’re coming with MySQL 5.7 ?..
• MySQL 5.7.1 : RO & RW • more stable than 5.6 • RW out-pass RO !!..

Read-Only Scalability @MySQL / InnoDB
• Depends on a workload.. • sometimes the limit is only within your memcpy() rate ;-)
• But really started to scale only since MySQL 5.7 • due improved TRX list management, MDL, THR_lock, etc.. • scaling up to 64 CPU cores for sure, reported on more cores too.. • Note : remind my “scalability” notes ;-)) • Note : code path is growing with new features! (small HW may regress)
• IO-bound : • could be limited by storage (if you’re not using a fast flash) • or by internal contentions (InnoDB file_sys mutex)
• Limitations • there are still some limitations “by design” (block lock, file_sys, etc..) • all in TODO to be fixed, but some are needing a deep redesign

RO related starter configuration settings
• my.conf : ! join_buffer_size=32K sort_buffer_size=32K ! table_open_cache = 8000 table_open_cache_instances = 16 query_cache_type = 0 innodb_buffer_pool_size= 64000M (2/3 RAM ?) innodb_buffer_pool_instances = 32 innodb_thread_concurrency = 0 / 32 / 64 innodb_spin_wait_delay= 6 / 48 / 96 ! innodb_stats_persistent = 1 innodb_adaptive_hash_index= 0 / 1 innodb_monitor_enable = '%'
Sysbench OLTP_RO Workloads
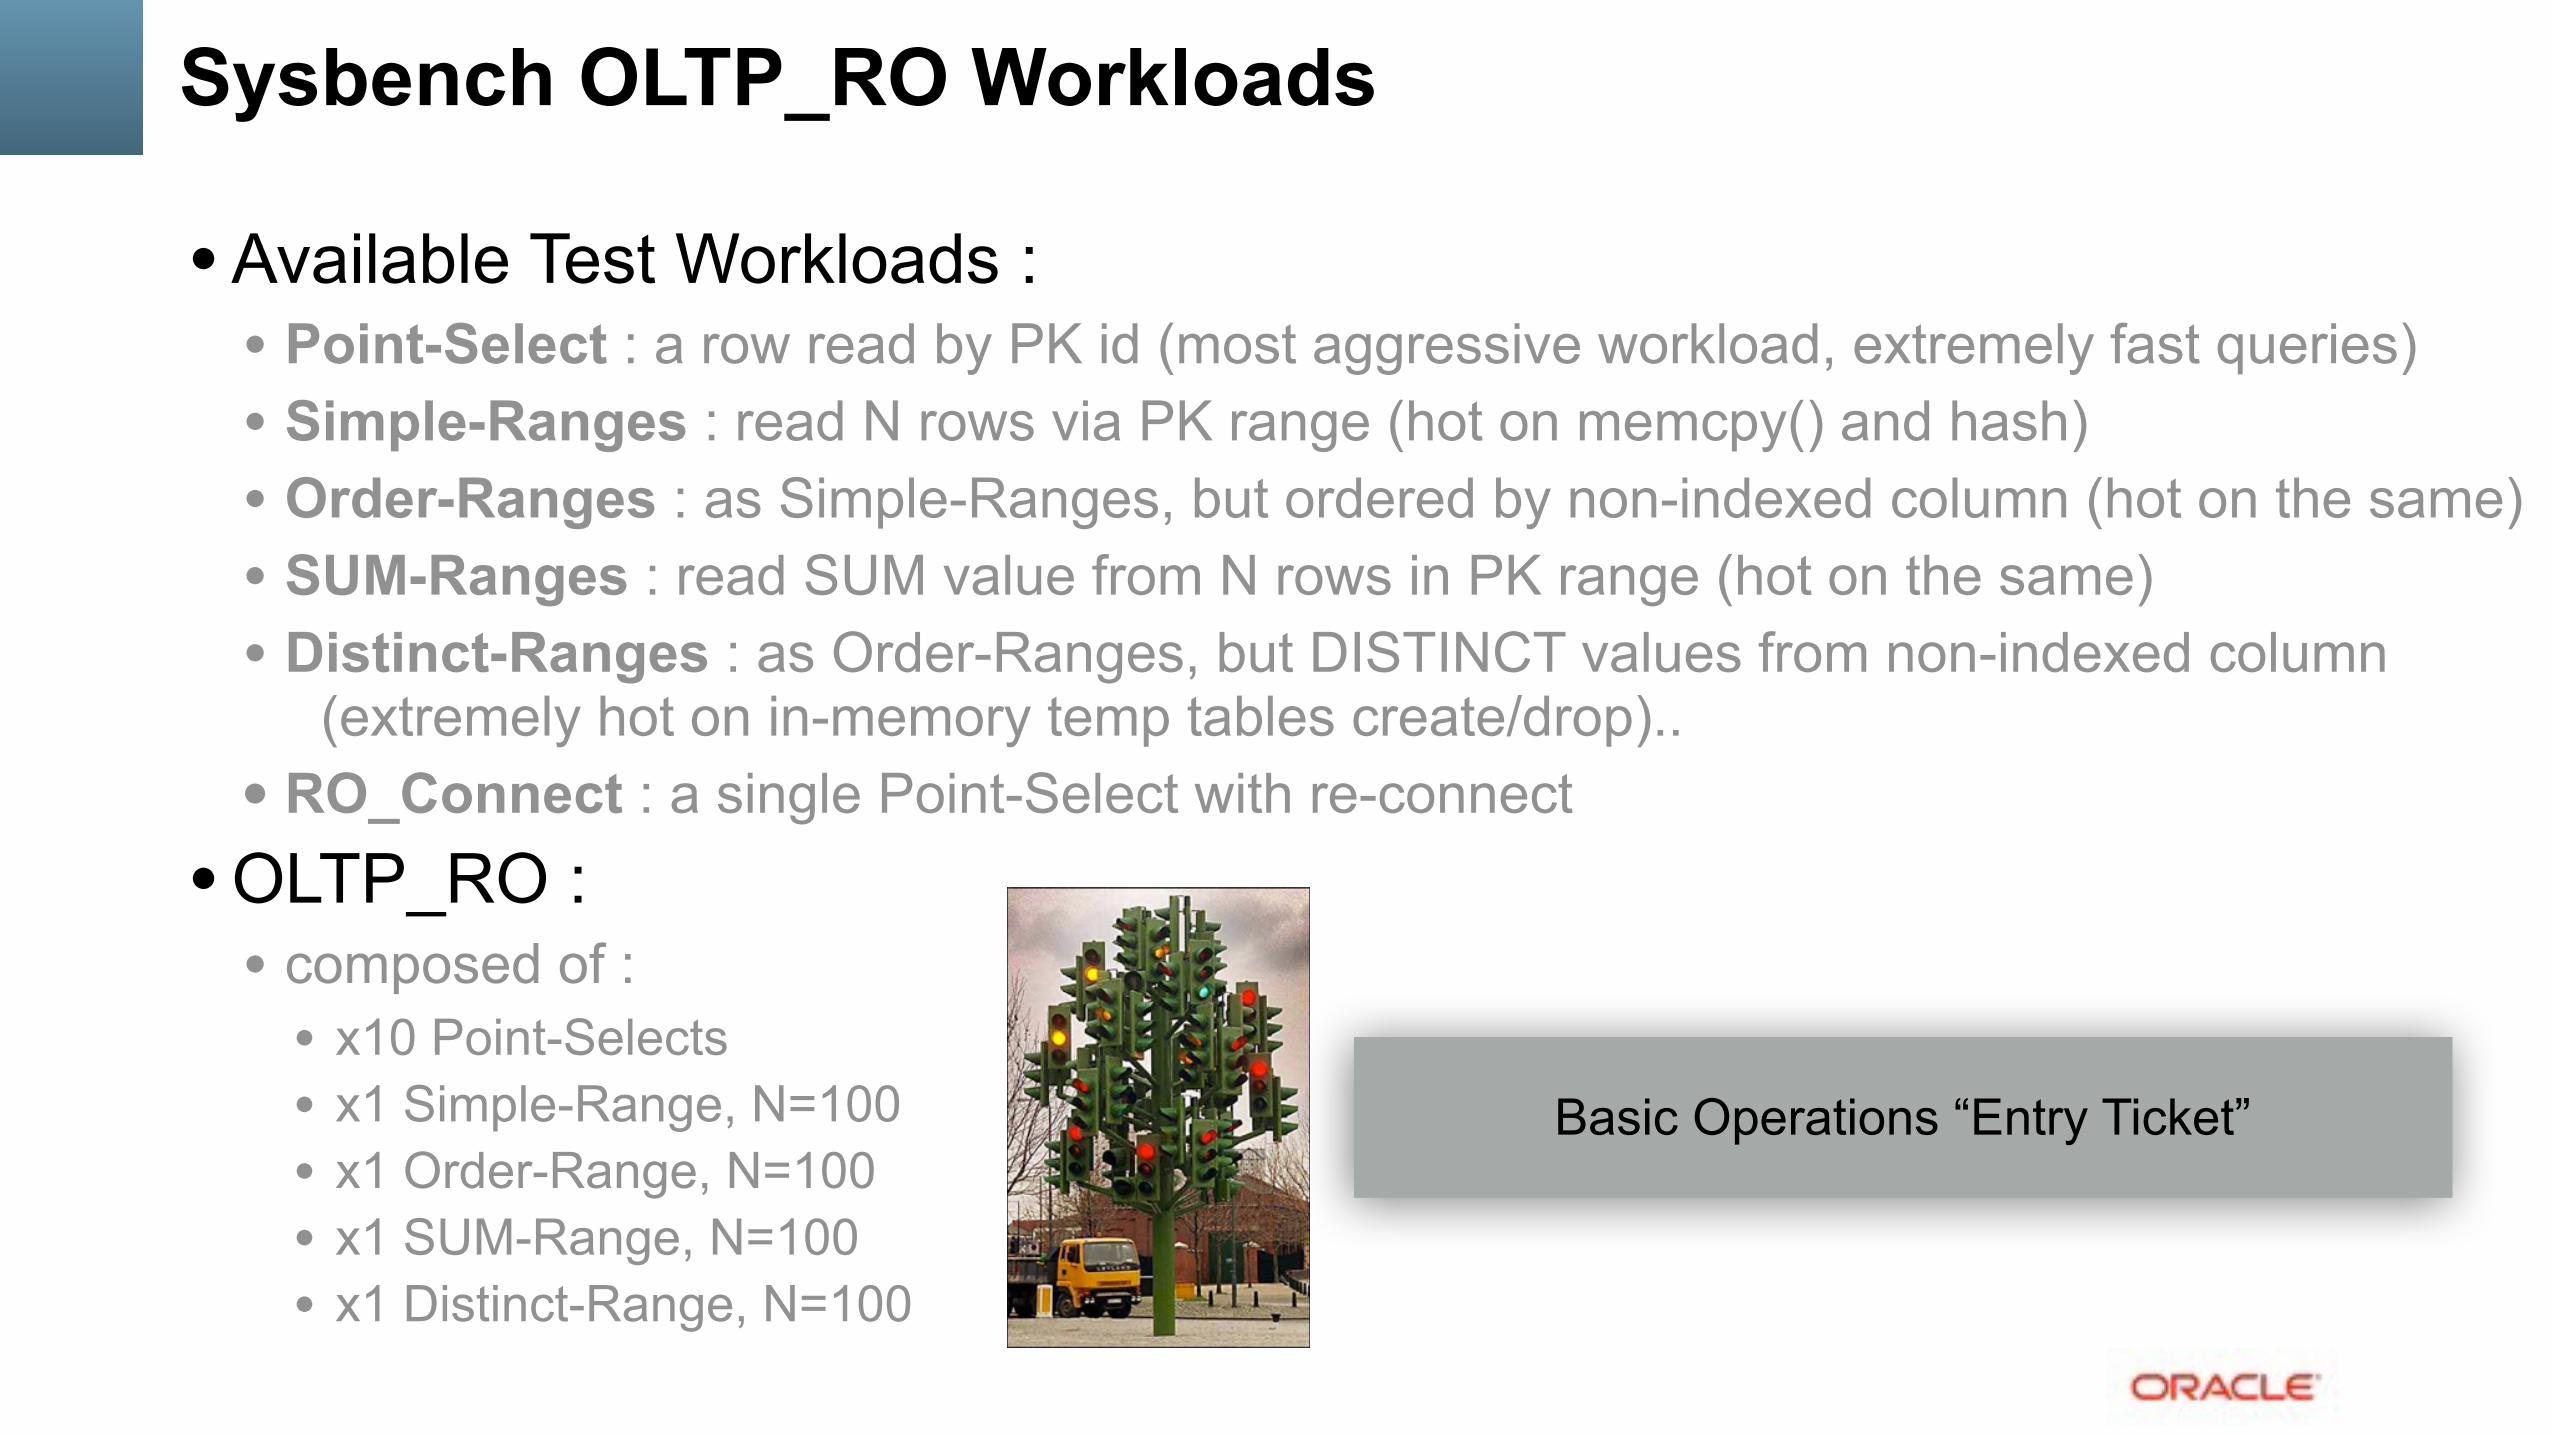
• Available Test Workloads : • Point-Select : a row read by PK id (most aggressive workload, extremely fast queries) • Simple-Ranges : read N rows via PK range (hot on memcpy() and hash) • Order-Ranges : as Simple-Ranges, but ordered by non-indexed column (hot on the same) • SUM-Ranges : read SUM value from N rows in PK range (hot on the same) • Distinct-Ranges : as Order-Ranges, but DISTINCT values from non-indexed column
(extremely hot on in-memory temp tables create/drop).. • RO_Connect : a single Point-Select with re-connect
• OLTP_RO : • composed of :
• x10 Point-Selects • x1 Simple-Range, N=100 • x1 Order-Range, N=100 • x1 SUM-Range, N=100 • x1 Distinct-Range, N=100
Basic Operations “Entry Ticket”

Entry Ticket : RO_Connect
• Many web apps cannot use persistent connections • connect => Query(s) => disconnect @40cores-HT
Entry Ticket : RO_Connect
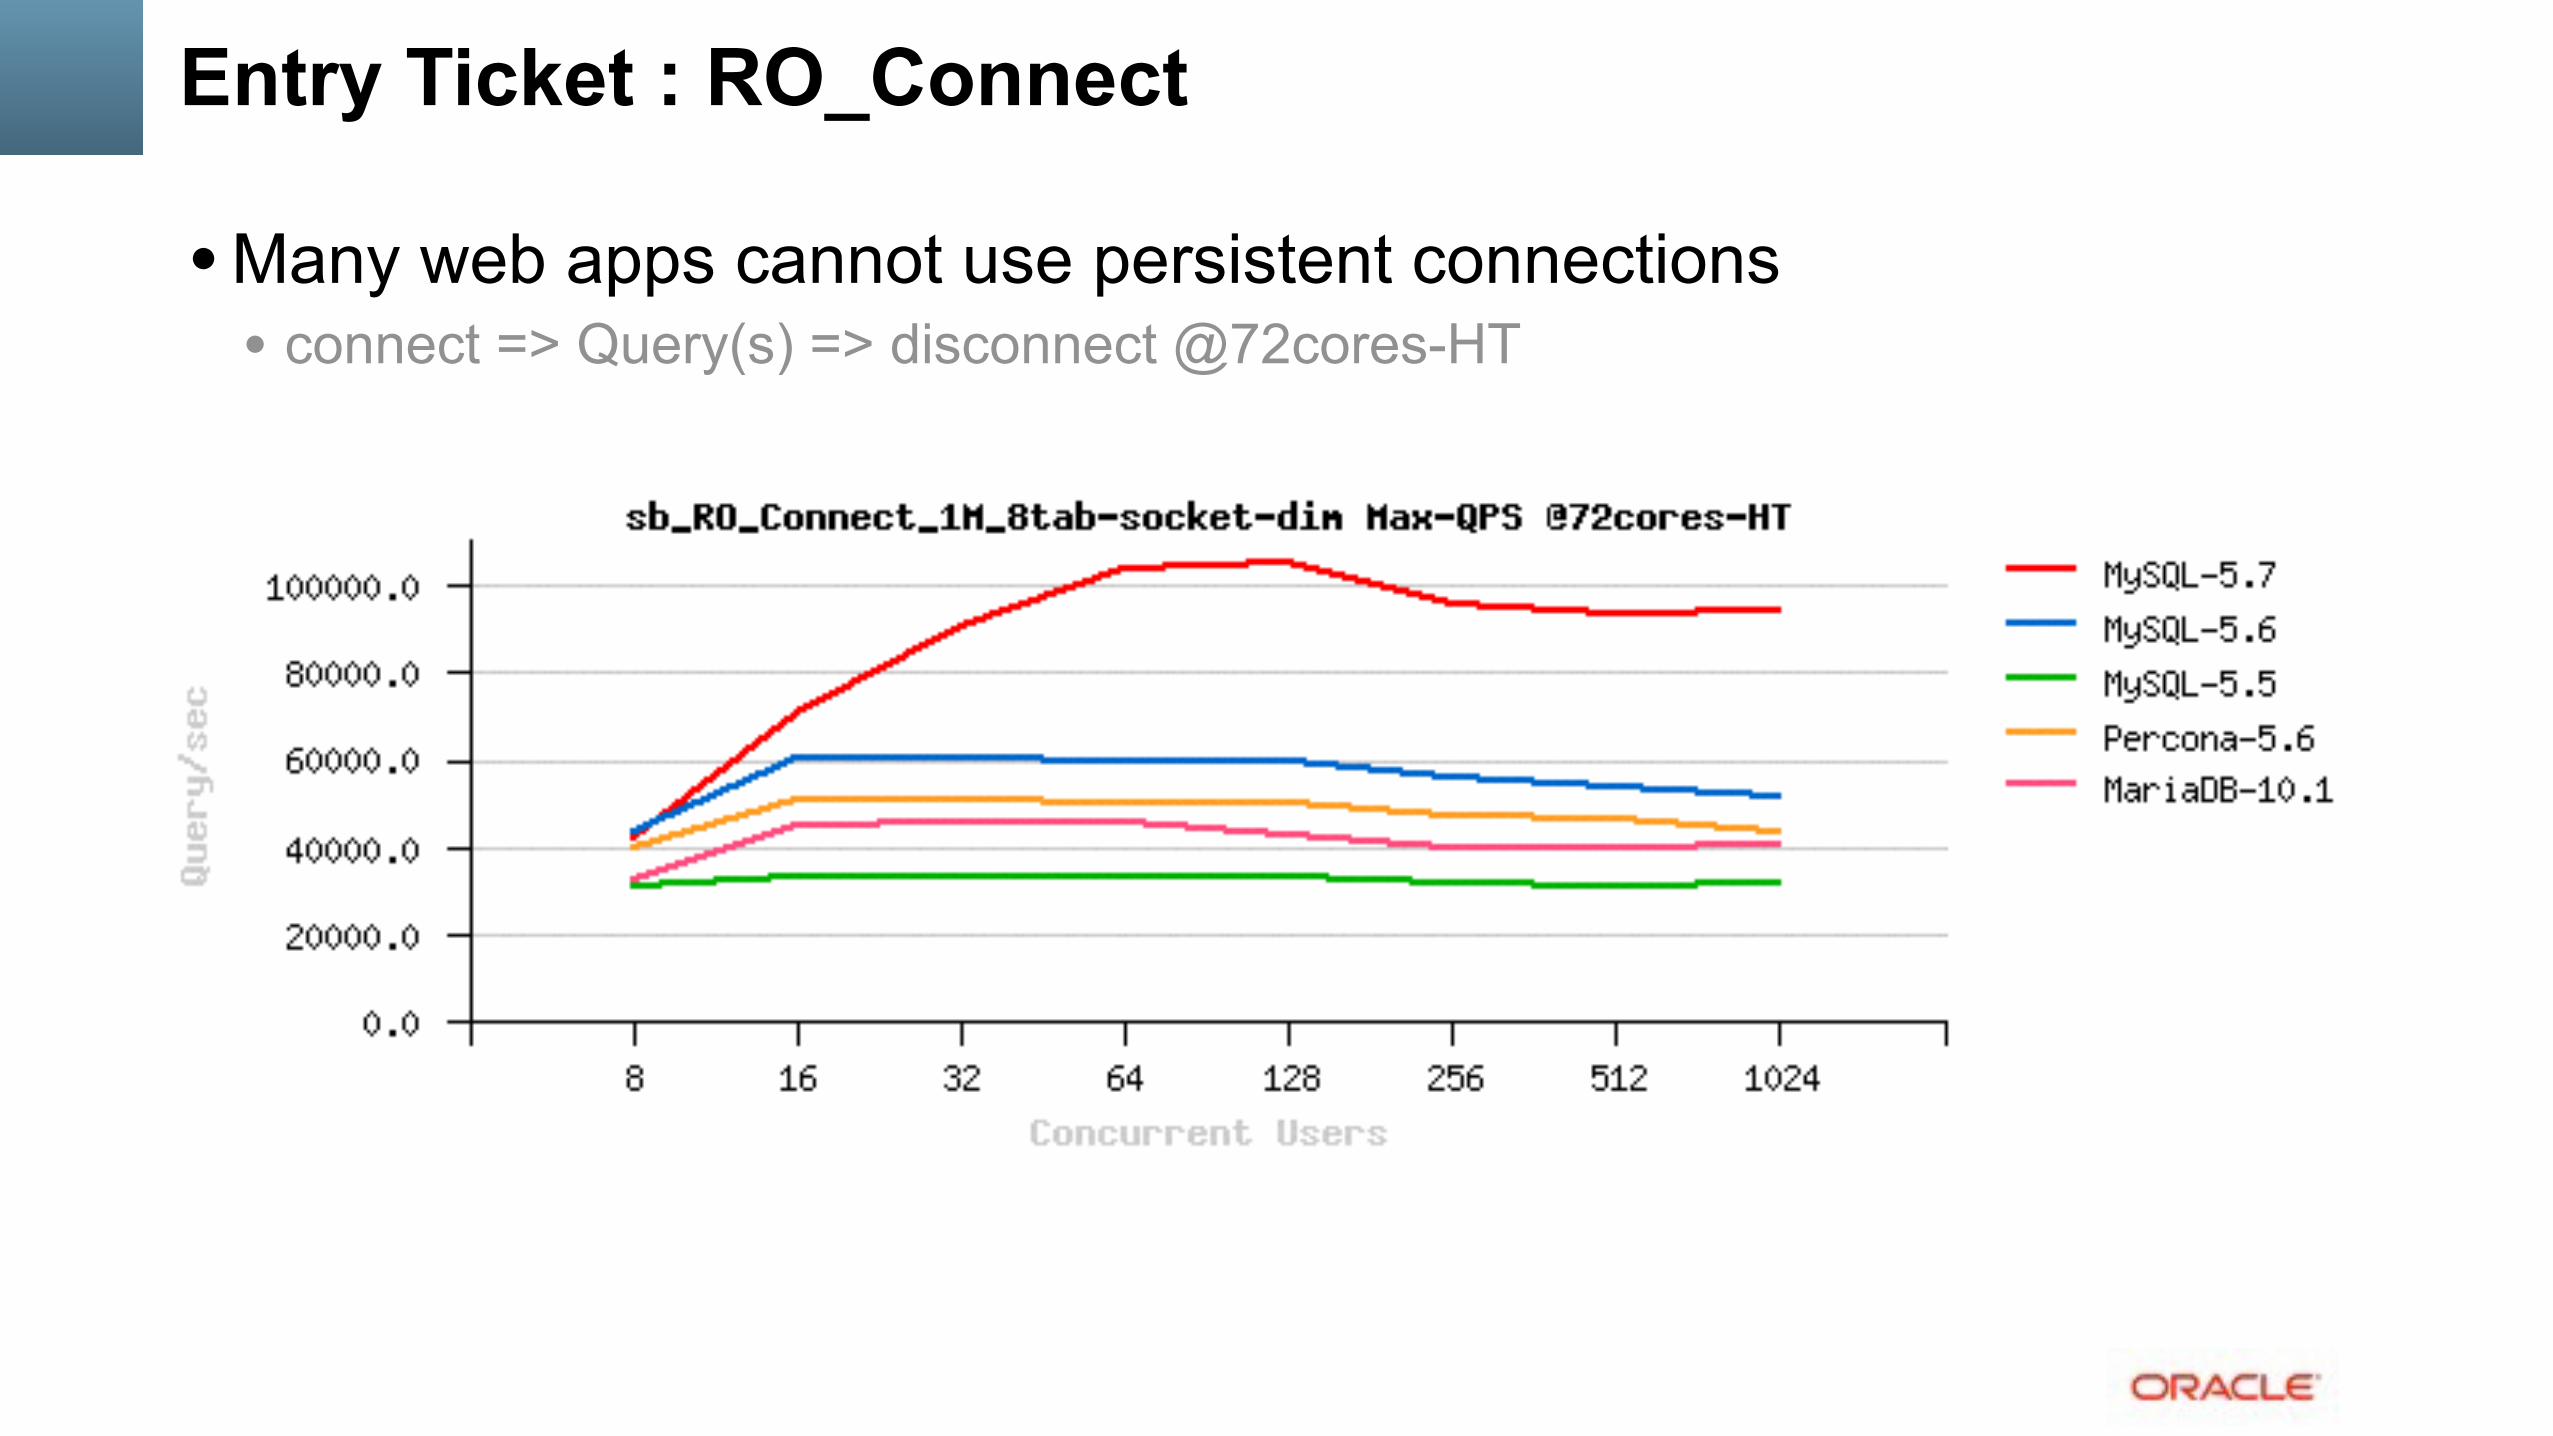
• Many web apps cannot use persistent connections • connect => Query(s) => disconnect @72cores-HT
Entry Ticket : RO_Connect
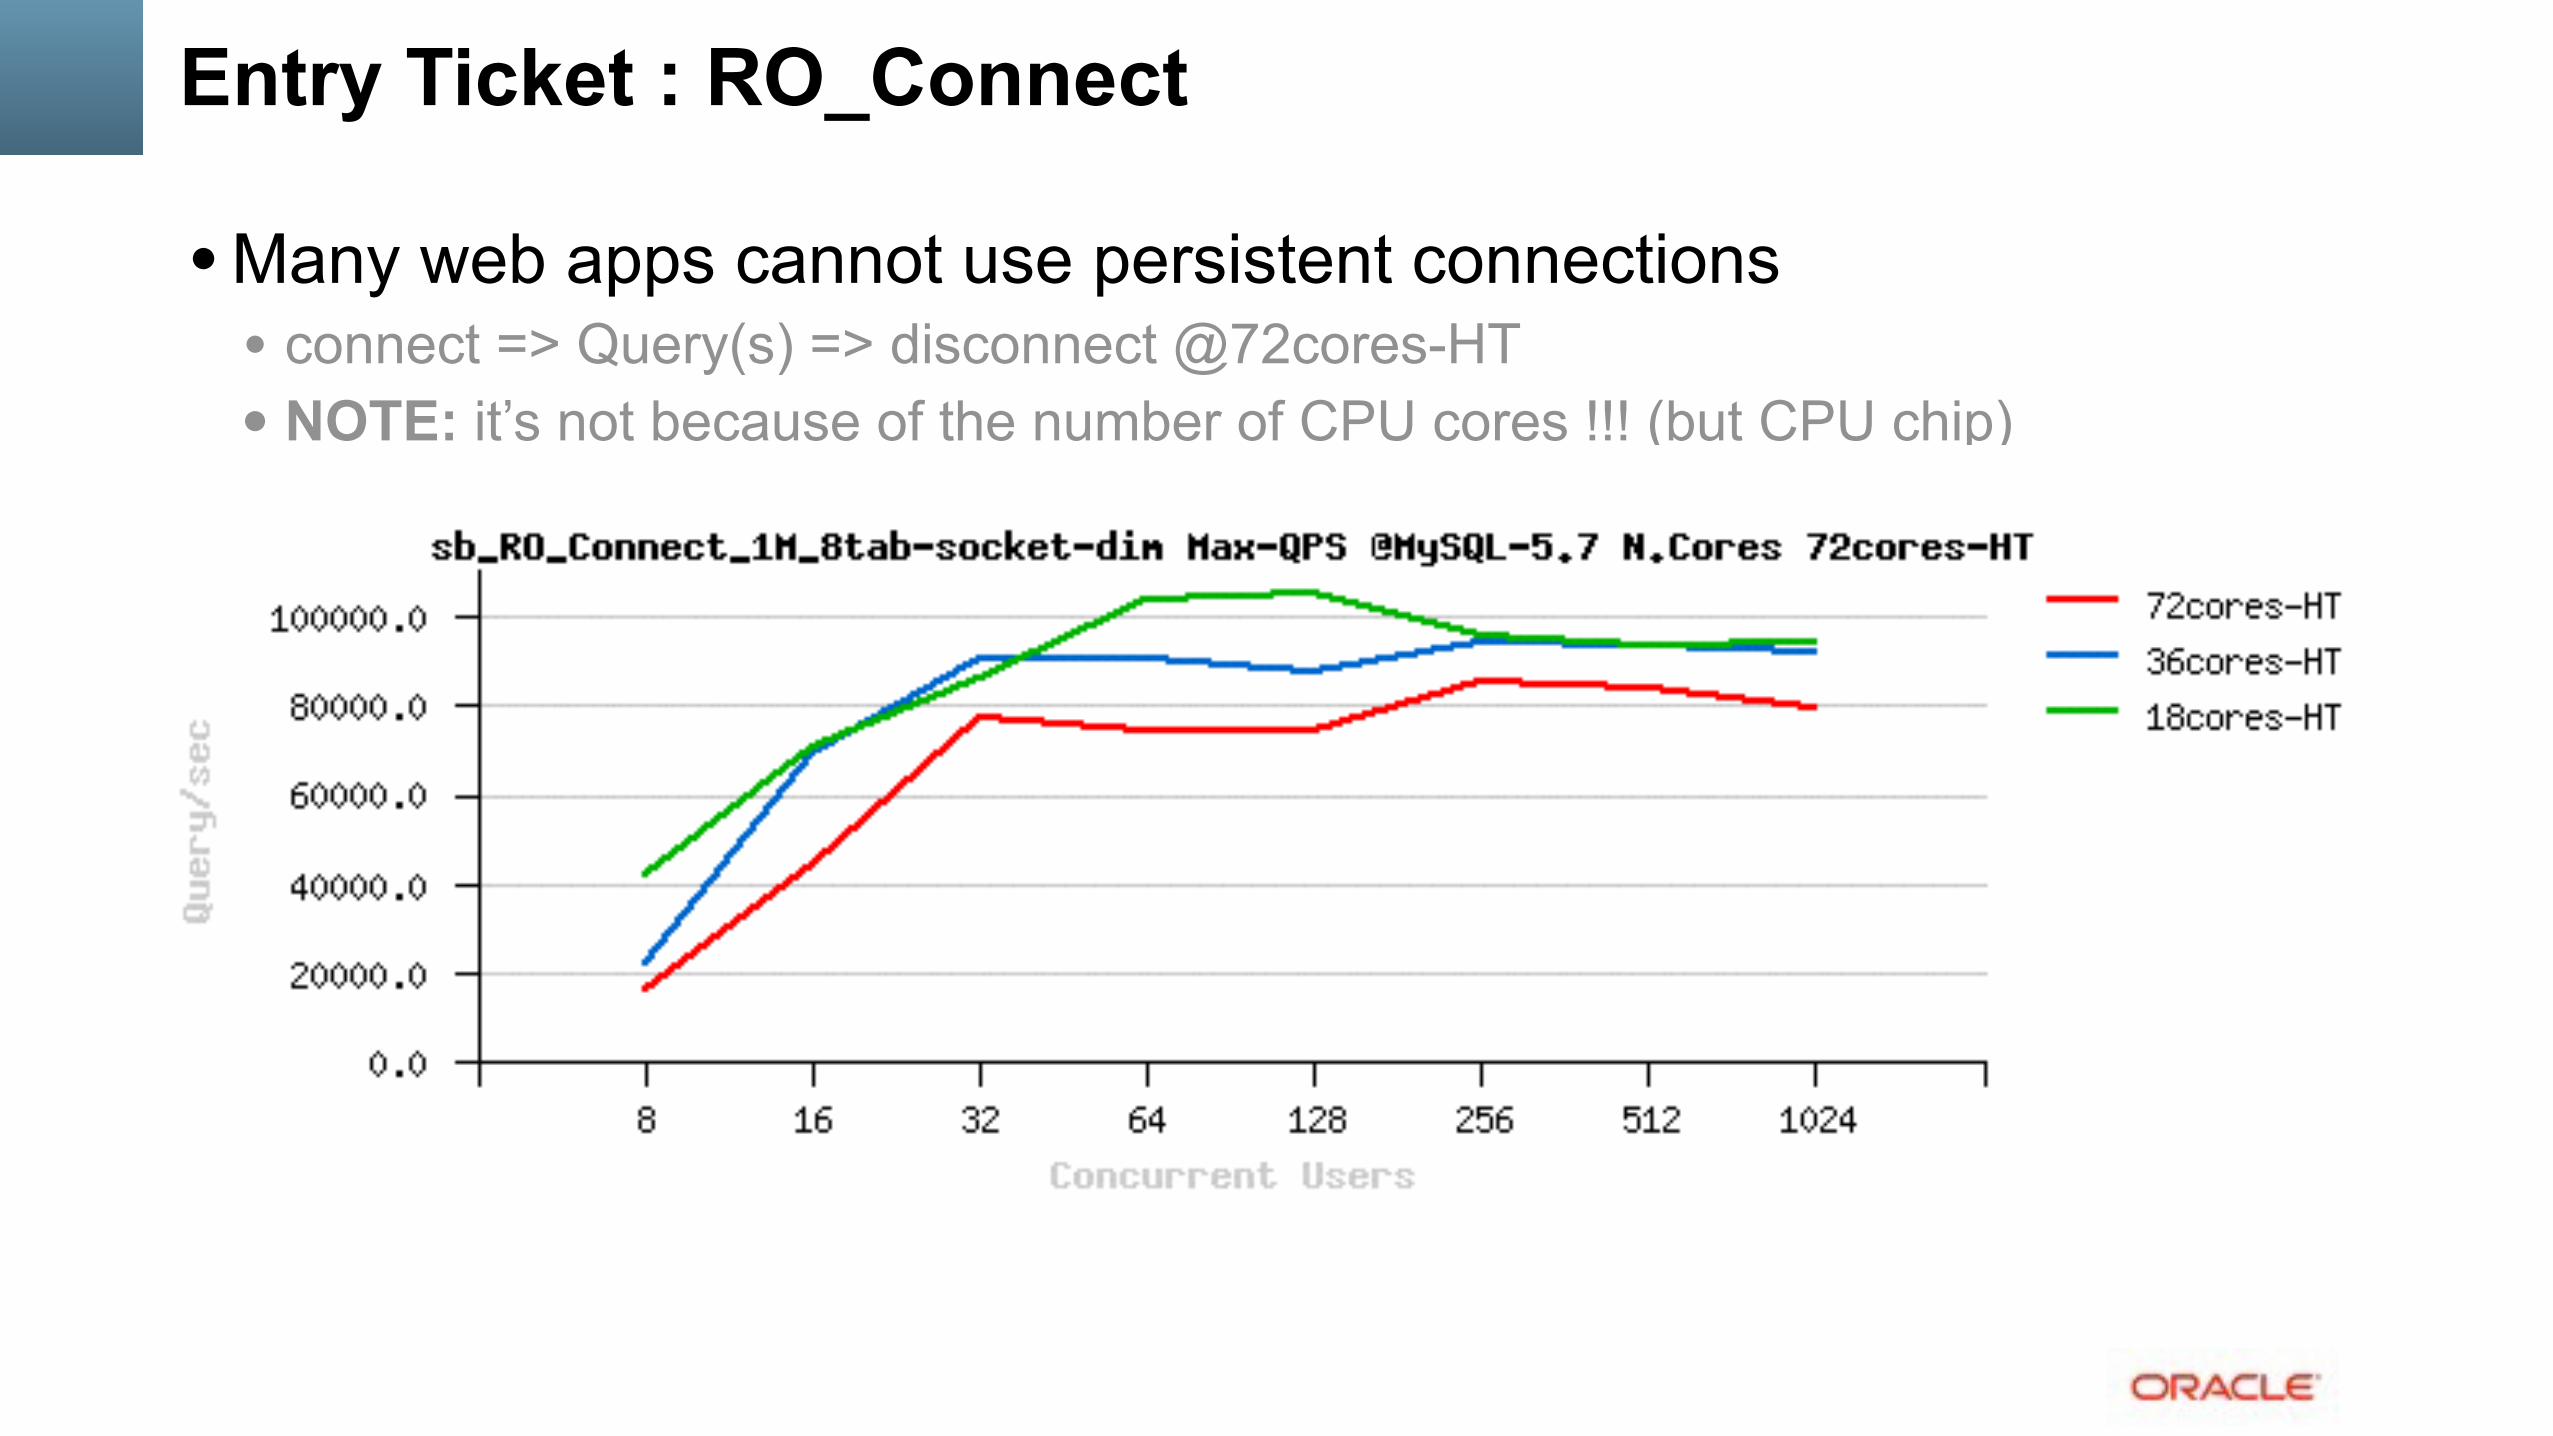
• Many web apps cannot use persistent connections • connect => Query(s) => disconnect @72cores-HT • NOTE: it’s not because of the number of CPU cores !!! (but CPU chip)

Entry Ticket : RO_Connect in 5.7
• Many web apps cannot use persistent connections • connect => Query(s) => disconnect • there was even 70K Connect/sec, but new features over 2 years.. • 5.8 expectations : to do much more than this ;-)

RO Point-Selects @MySQL 5.7 (Sep.2013)
• 500K QPS Sysbench Point-Selects 8-tab, 32cores-HT :

RO Point-Selects @MySQL 5.7 (Oct.2014)
• 645K QPS Sysbench Point-Selects 8-tab, 40cores-HT :

RO Point-Selects @MySQL 5.7 (Oct.2015)
• 1.6M (!!) QPS Sysbench Point-Selects 8-tab, 72cores-HT :
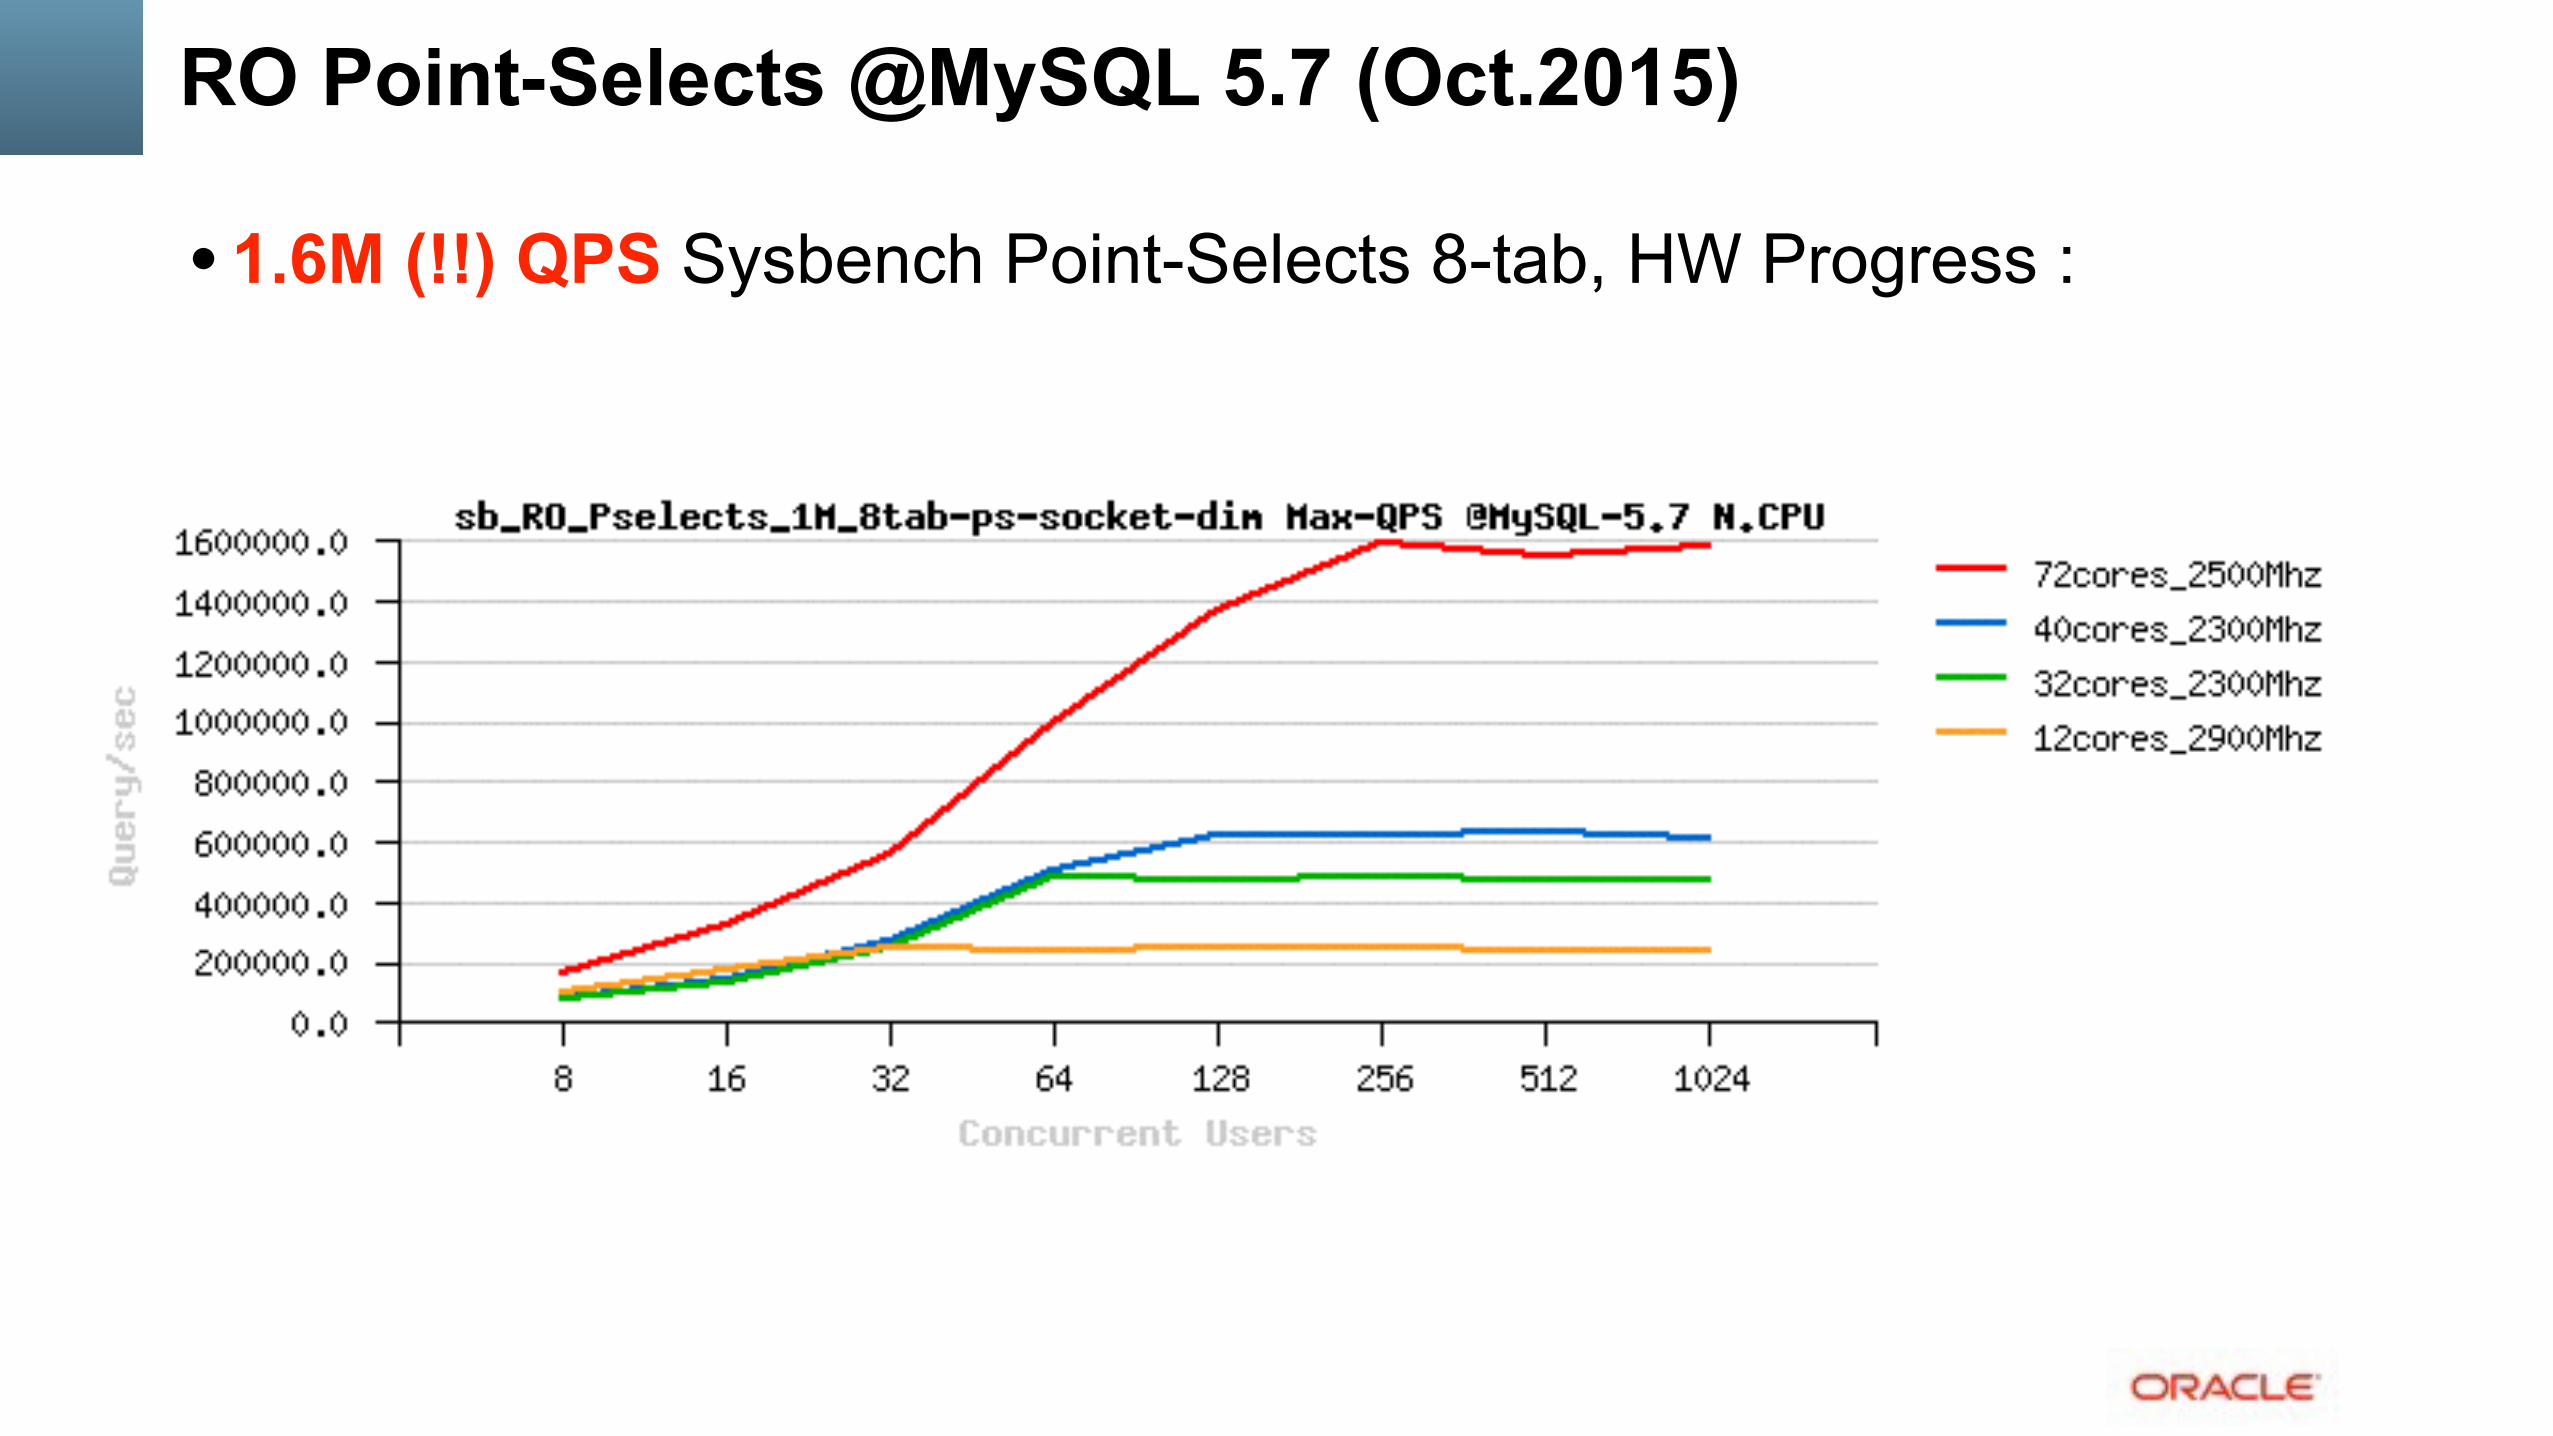
RO Point-Selects @MySQL 5.7 (Oct.2015)
• 1.6M (!!) QPS Sysbench Point-Selects 8-tab, HW Progress :

OLTP_RO : 8-tables
• Sysbench OLTP_RO 1Mx8-tables • 40cores-HT
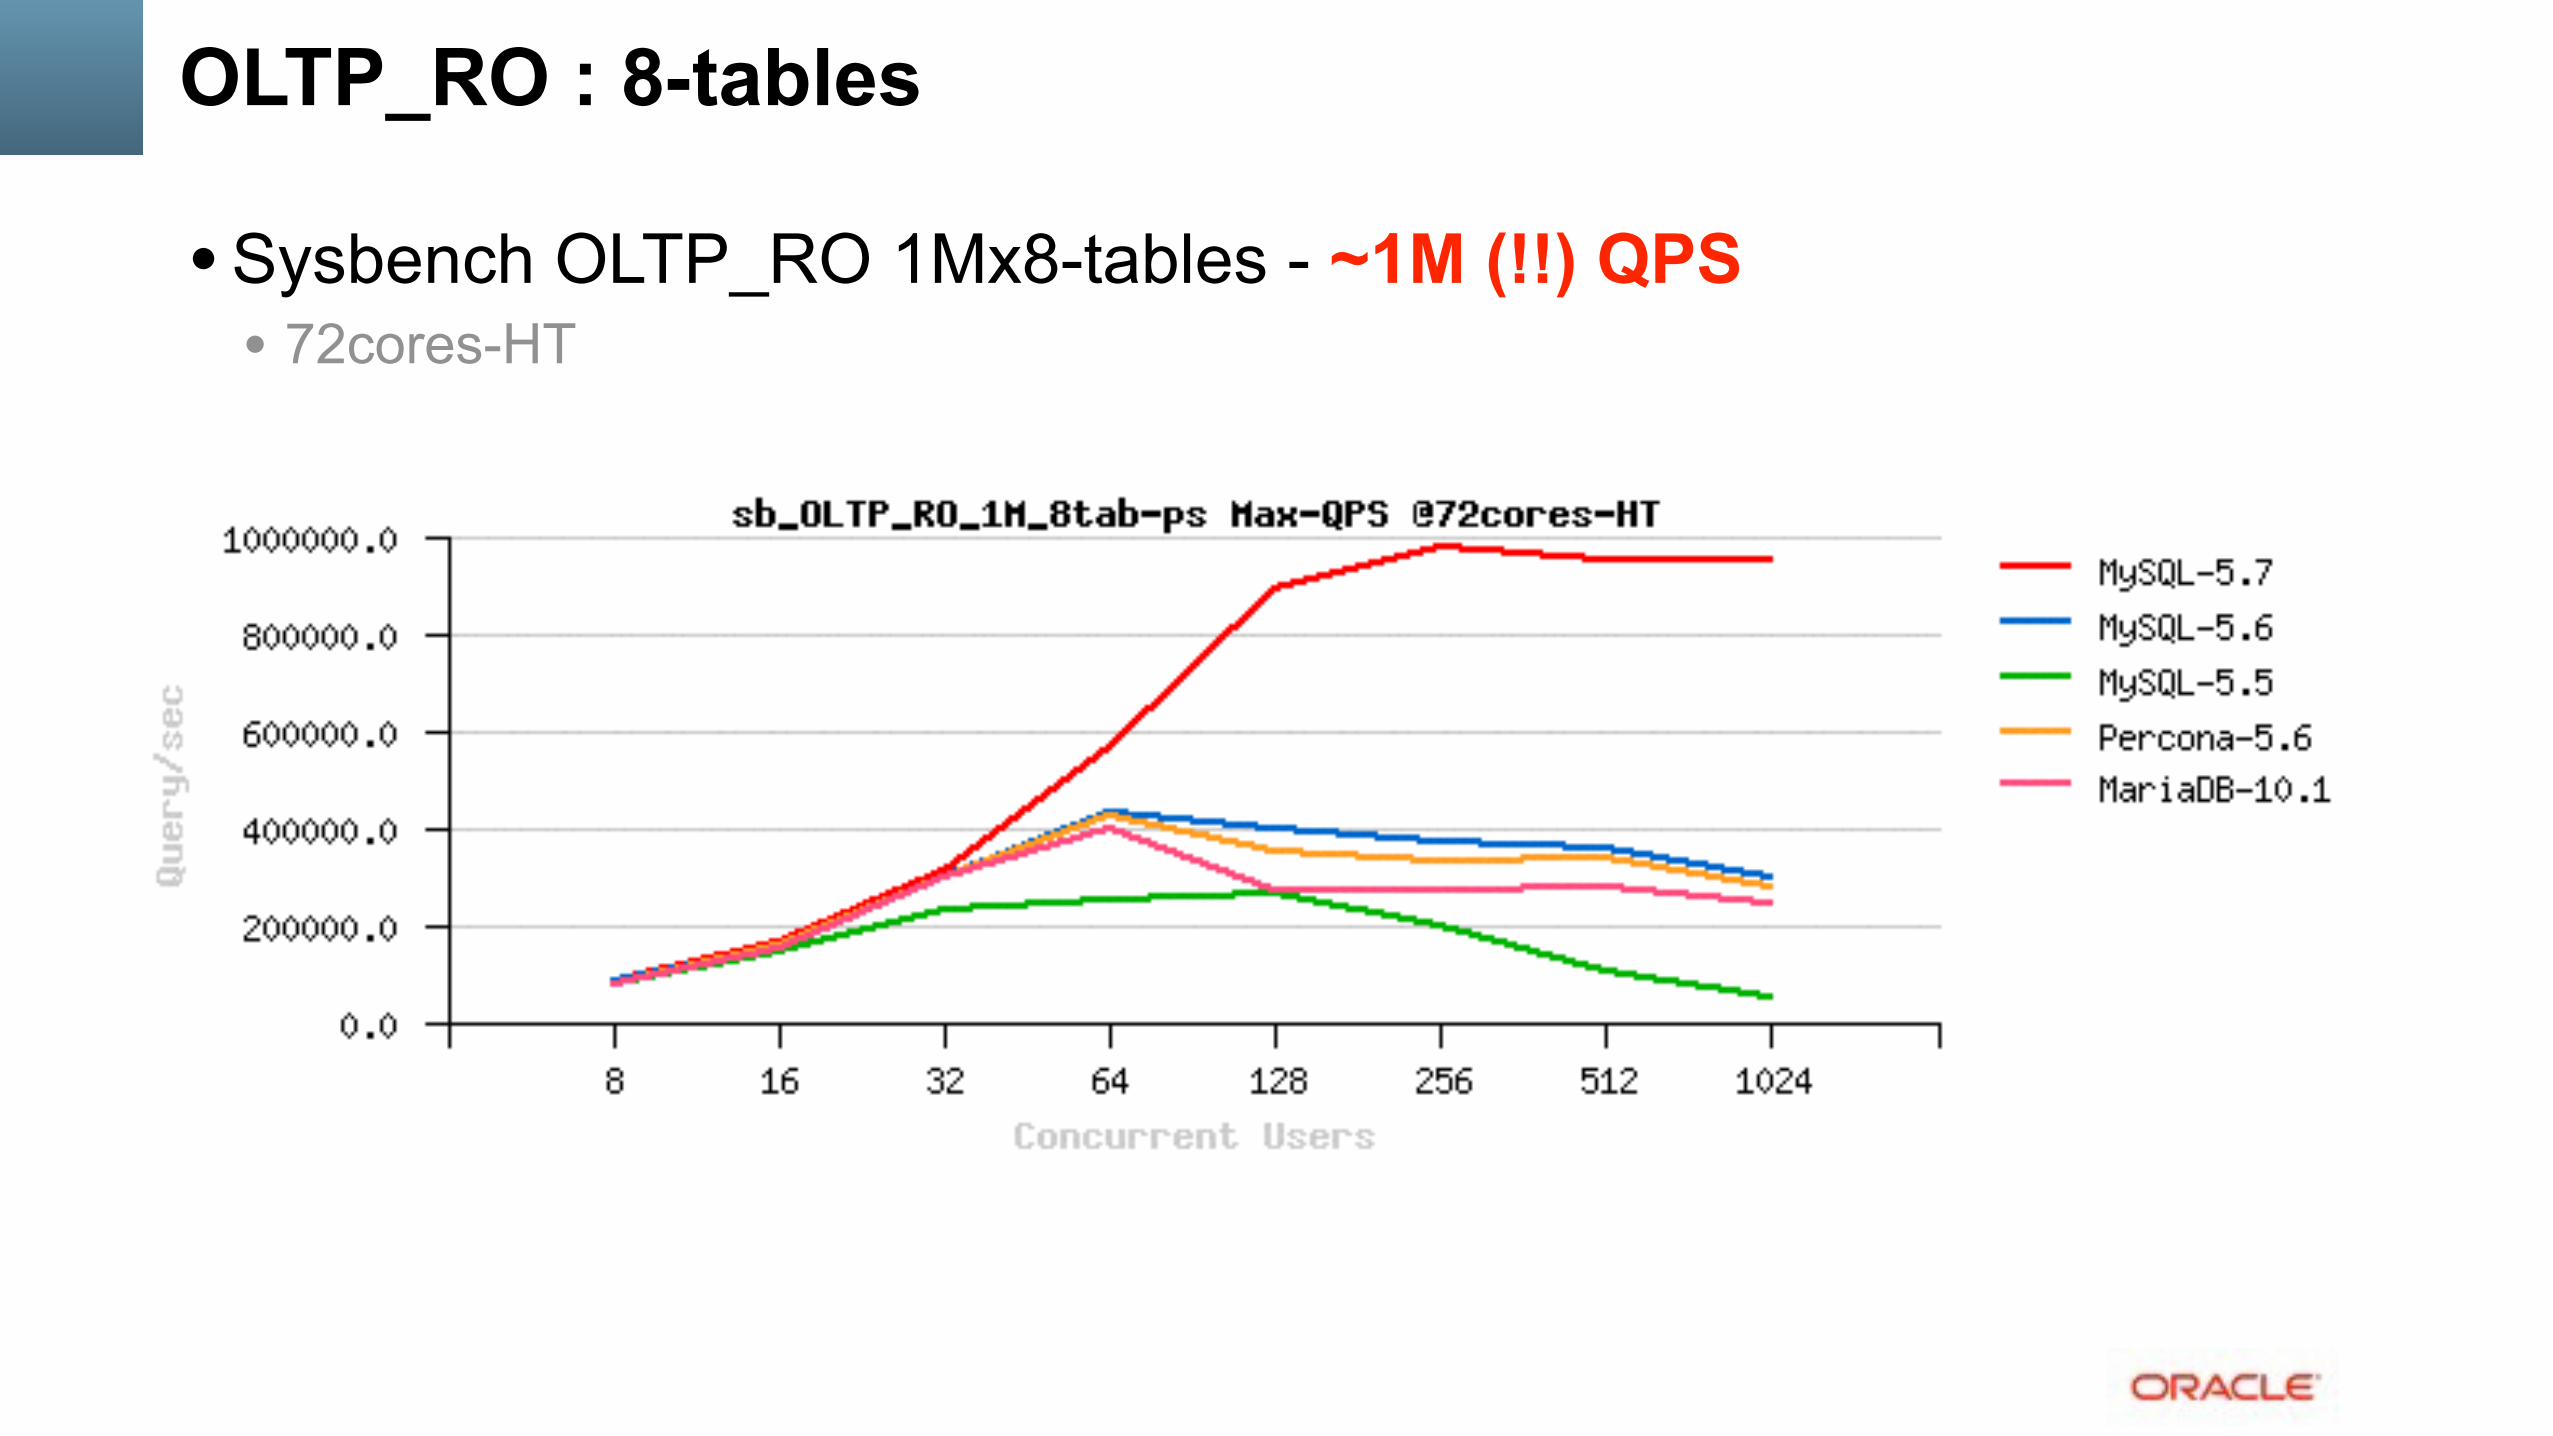
OLTP_RO : 8-tables
• Sysbench OLTP_RO 1Mx8-tables - ~1M (!!) QPS • 72cores-HT

OLTP_RO : 1-table
• Sysbench OLTP_RO 10M • 40cores-HT

OLTP_RO : 1-table
• Sysbench OLTP_RO 10M • 72cores-HT

RO Pending Issues…
• InnoDB Adaptive Hash Index (AHI) • implemented with a global RW-lock • InnoDB RW-locks are not scaling by design (CPU cache syncs) • using table partitions helps to split indexes • using AHI partitions (5.7) helps to split RW-locks (coop. with Percona)
• NOTE: and this is creating 20% regression on DBT3 benchmark (single-thread).. • just to mention how the code is sensible today ;-))
• yet far from fixed.. • 5.8 : AHI re-write / re-design

RO Pending Issues…
• PK vs Sec.IDX lookups • AHI helps • using covering indexes helps • reading less rows per query helps too.. (in ex: 10/20/40.. 320 rows) • PK Cov.IDX Sec.IDX PK Cov.IDX Sec.IDX AHI=off | AHI=on

RO Pending Issues…
• InnoDB Block Lock • seen when the same pages are accessed concurrently.. • how to see : “show mutex” is back ;-) • workarounds :
• avoid such an access pattern, don’t do this ;-) • use a smart query cache (like ProxySQL), or row cache (memcached, etc.)..
• expected to be fixed in 5.8 : page re-design • but nothing yet promised.. ;-)
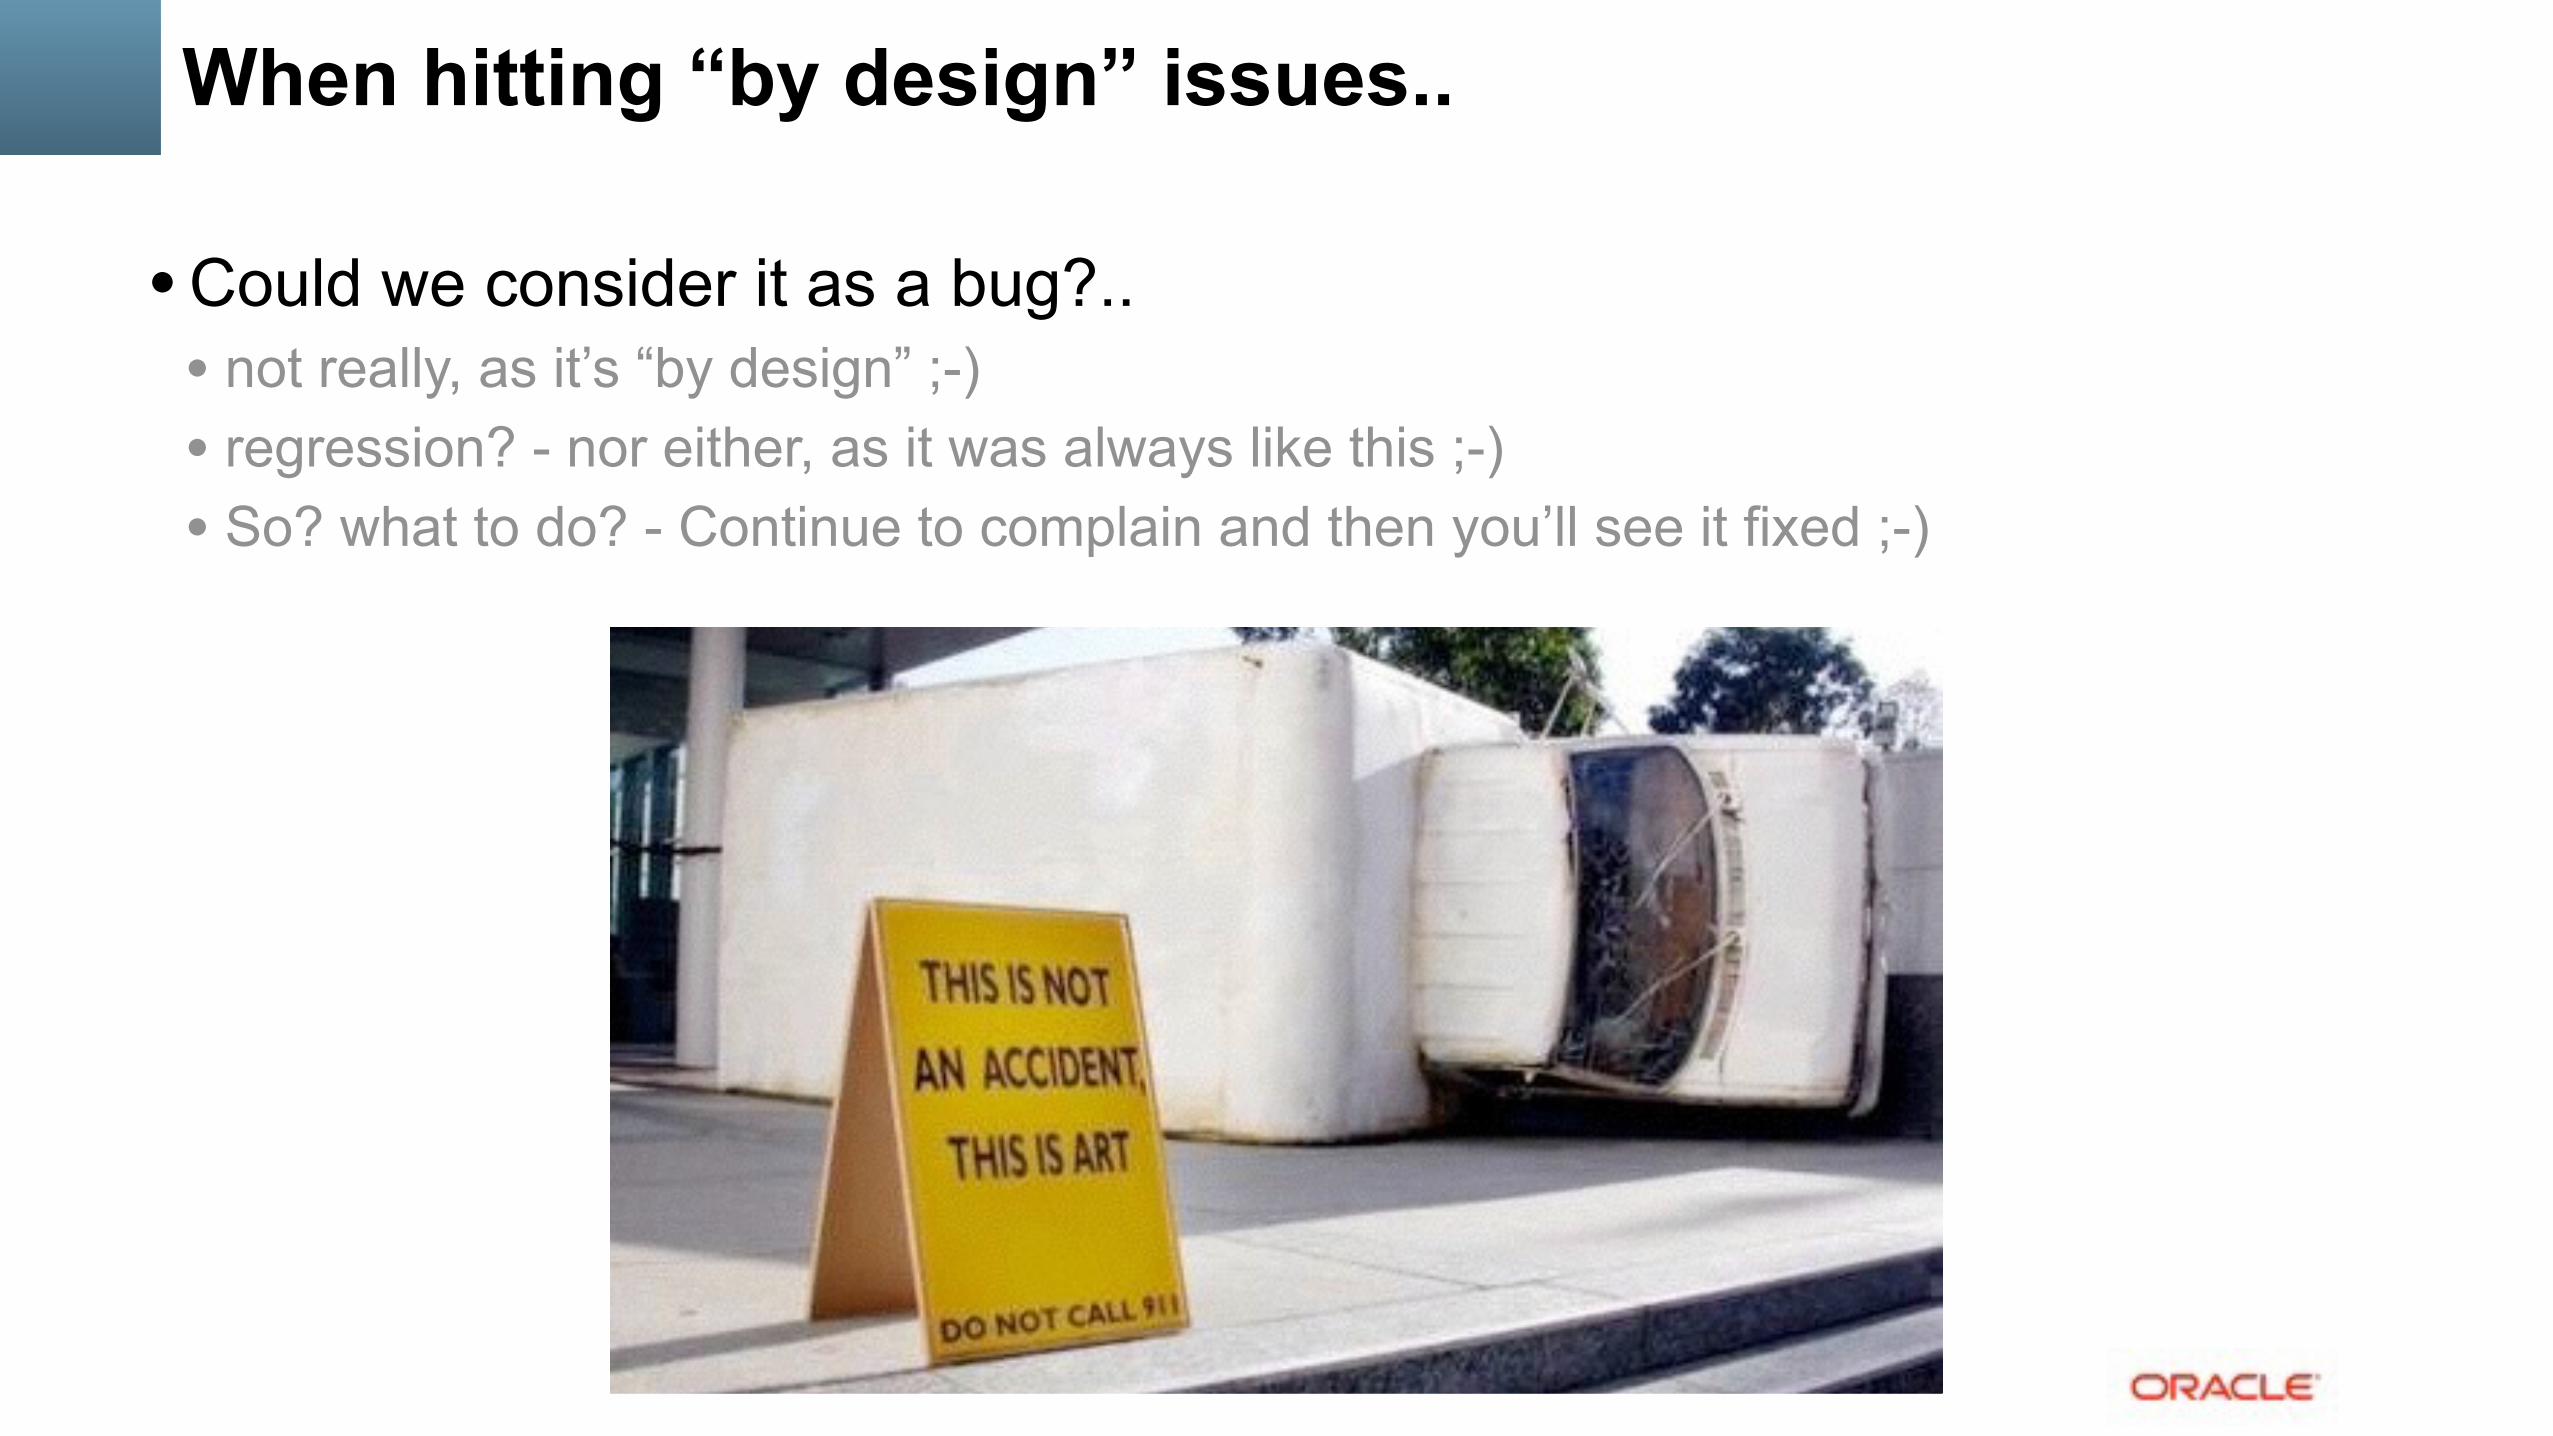
• Could we consider it as a bug?.. • not really, as it’s “by design” ;-) • regression? - nor either, as it was always like this ;-) • So? what to do? - Continue to complain and then you’ll see it fixed ;-)
When hitting “by design” issues..

Read-Only : IO-bound
• 5.5 : hmm.. • 5.6 / 5.7 : • LRU driven : just page eviction, see METRICS stats • HDD : limited by your I/O layer.. • SDD : limited by your I/O layer.. • Really Fast Flash (LSI, Fusion-io, etc.) :
• avg load : follow I/O performance • high load: fil_sys mutex contention + kernel FS lock!
• also consider : innodb_old_blocks_time & innodb_old_blocks_pct
• 5.7 : • excessive page scan is fixed
Read+Write (RW) Workloads Scalability @MySQL 5.7
• Huge progress is already here too! • improved index locking • reduced lock_sys mutex contention • parallel flushing + improved flushing design • much better observability of internals • etc..
• However, not yet as good as Read-Only.. • Performance continues to increase with more CPU cores • But on move from 16 to 32cores-HT you may gain only 50% better • Better performance on a faster storage as well • But cannot yet use a full power of fast flash for today.. • Work in progress ;-) • Internal contentions & Design limitations are the main issues here.. • still many things are in pipe & prototype..
Read+Write Performance @MySQL / InnoDB
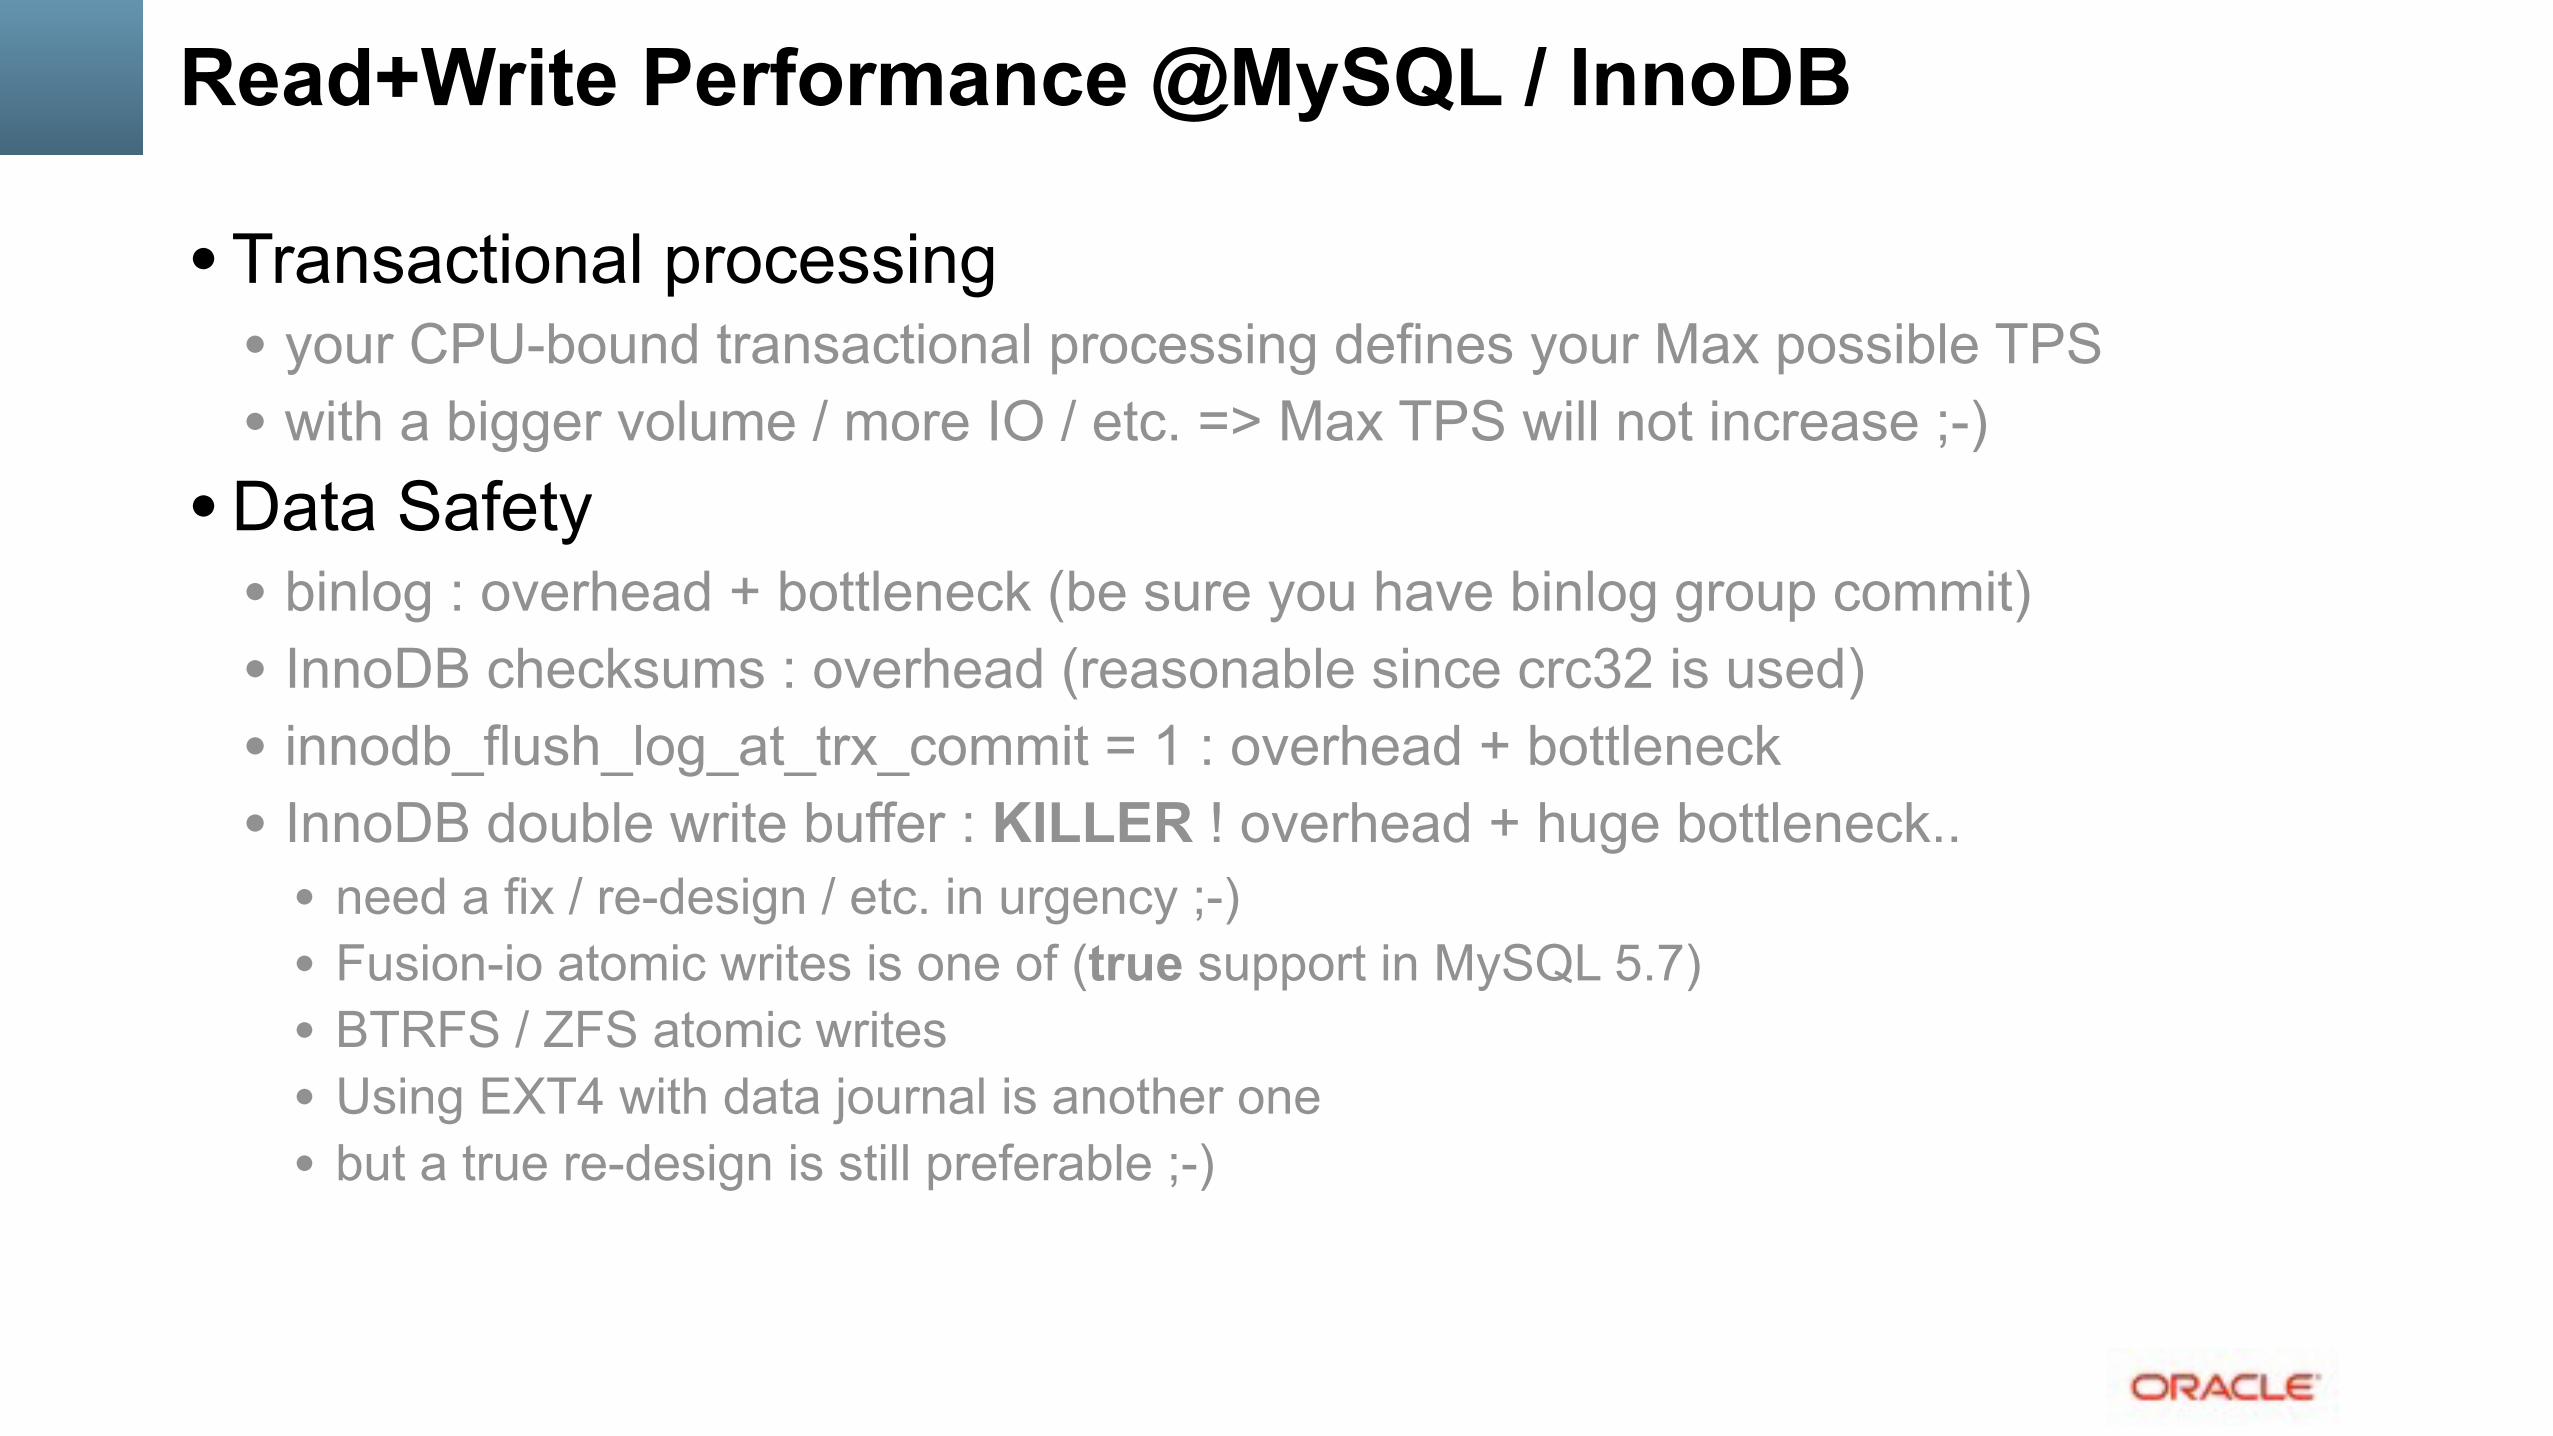
• Transactional processing • your CPU-bound transactional processing defines your Max possible TPS • with a bigger volume / more IO / etc. => Max TPS will not increase ;-)
• Data Safety • binlog : overhead + bottleneck (be sure you have binlog group commit) • InnoDB checksums : overhead (reasonable since crc32 is used) • innodb_flush_log_at_trx_commit = 1 : overhead + bottleneck • InnoDB double write buffer : KILLER ! overhead + huge bottleneck..
• need a fix / re-design / etc. in urgency ;-) • Fusion-io atomic writes is one of (true support in MySQL 5.7) • BTRFS / ZFS atomic writes • Using EXT4 with data journal is another one • but a true re-design is still preferable ;-)

Impact of “safety” options..
• OLTP_RW 32x10M-tables @Percona-5.6 • test cases: trx=2 | trx=1 + chksum=1 | dblwr=1 | trx=1 + chksum=1 + dblwr=1
TRX=2 TRX=1, cheksum=1 dblwr=1 TRX=1,checksum=1,dblwr=1

Read+Write Workloads : InnoDB Flushing
• InnoDB Flushing... • 5.5 : no comments.. ;-)
• io capacity !! • 5.6 :
• Improved Adaptive Flushing (step 1) • Cleaner Thread • io capacity max !! • LRU depth !!
• 5.7 : • multiple Cleaner Threads • improved LRU flushing • improved Adaptive Flushing Design (step 2)

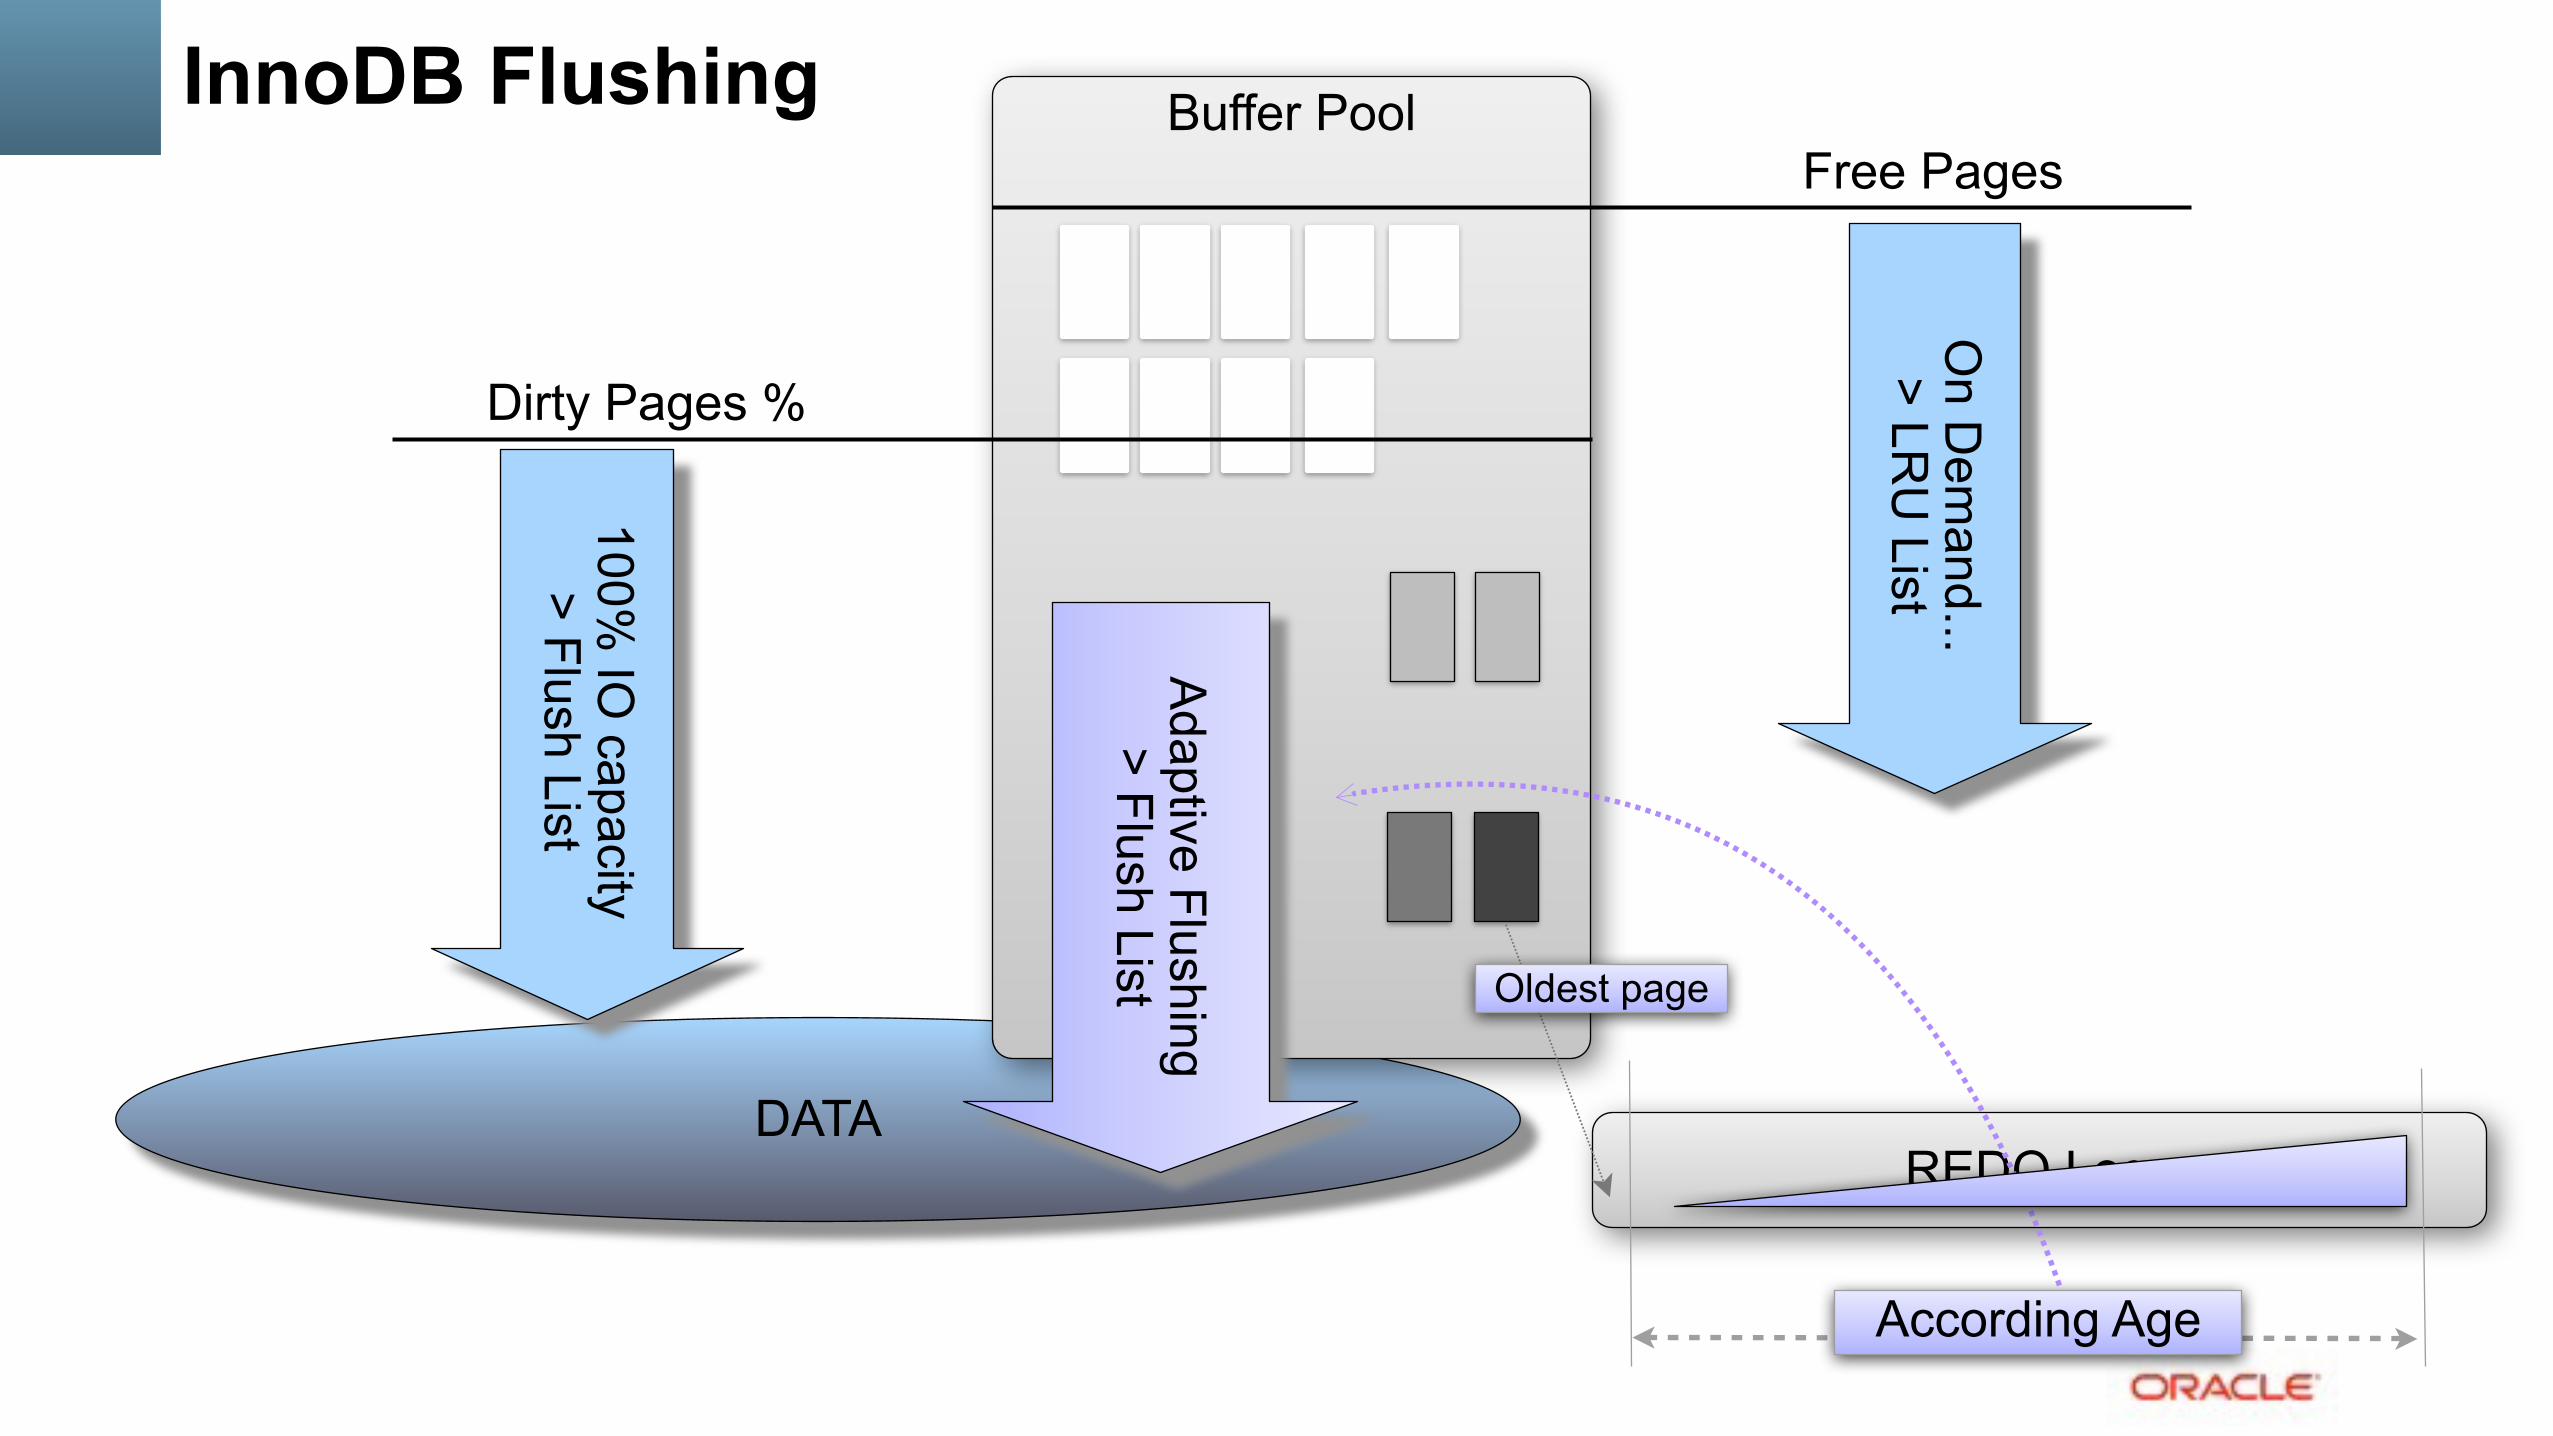
InnoDB Flushing
DATA
Buffer Pool
Dirty Pages %
100% IO
capacity > Flush List
Free Pages
On D
emand...
> LRU
List
REDO Logs
Max AgeFurious Flushing...
> Flush List Oldest page
InnoDB Flushing
DATA
Buffer Pool
Dirty Pages %
100% IO
capacity > Flush List
Free Pages
On D
emand...
> LRU
List
REDO Logs
According Age
Oldest page
Adaptive Flushing
> Flush List

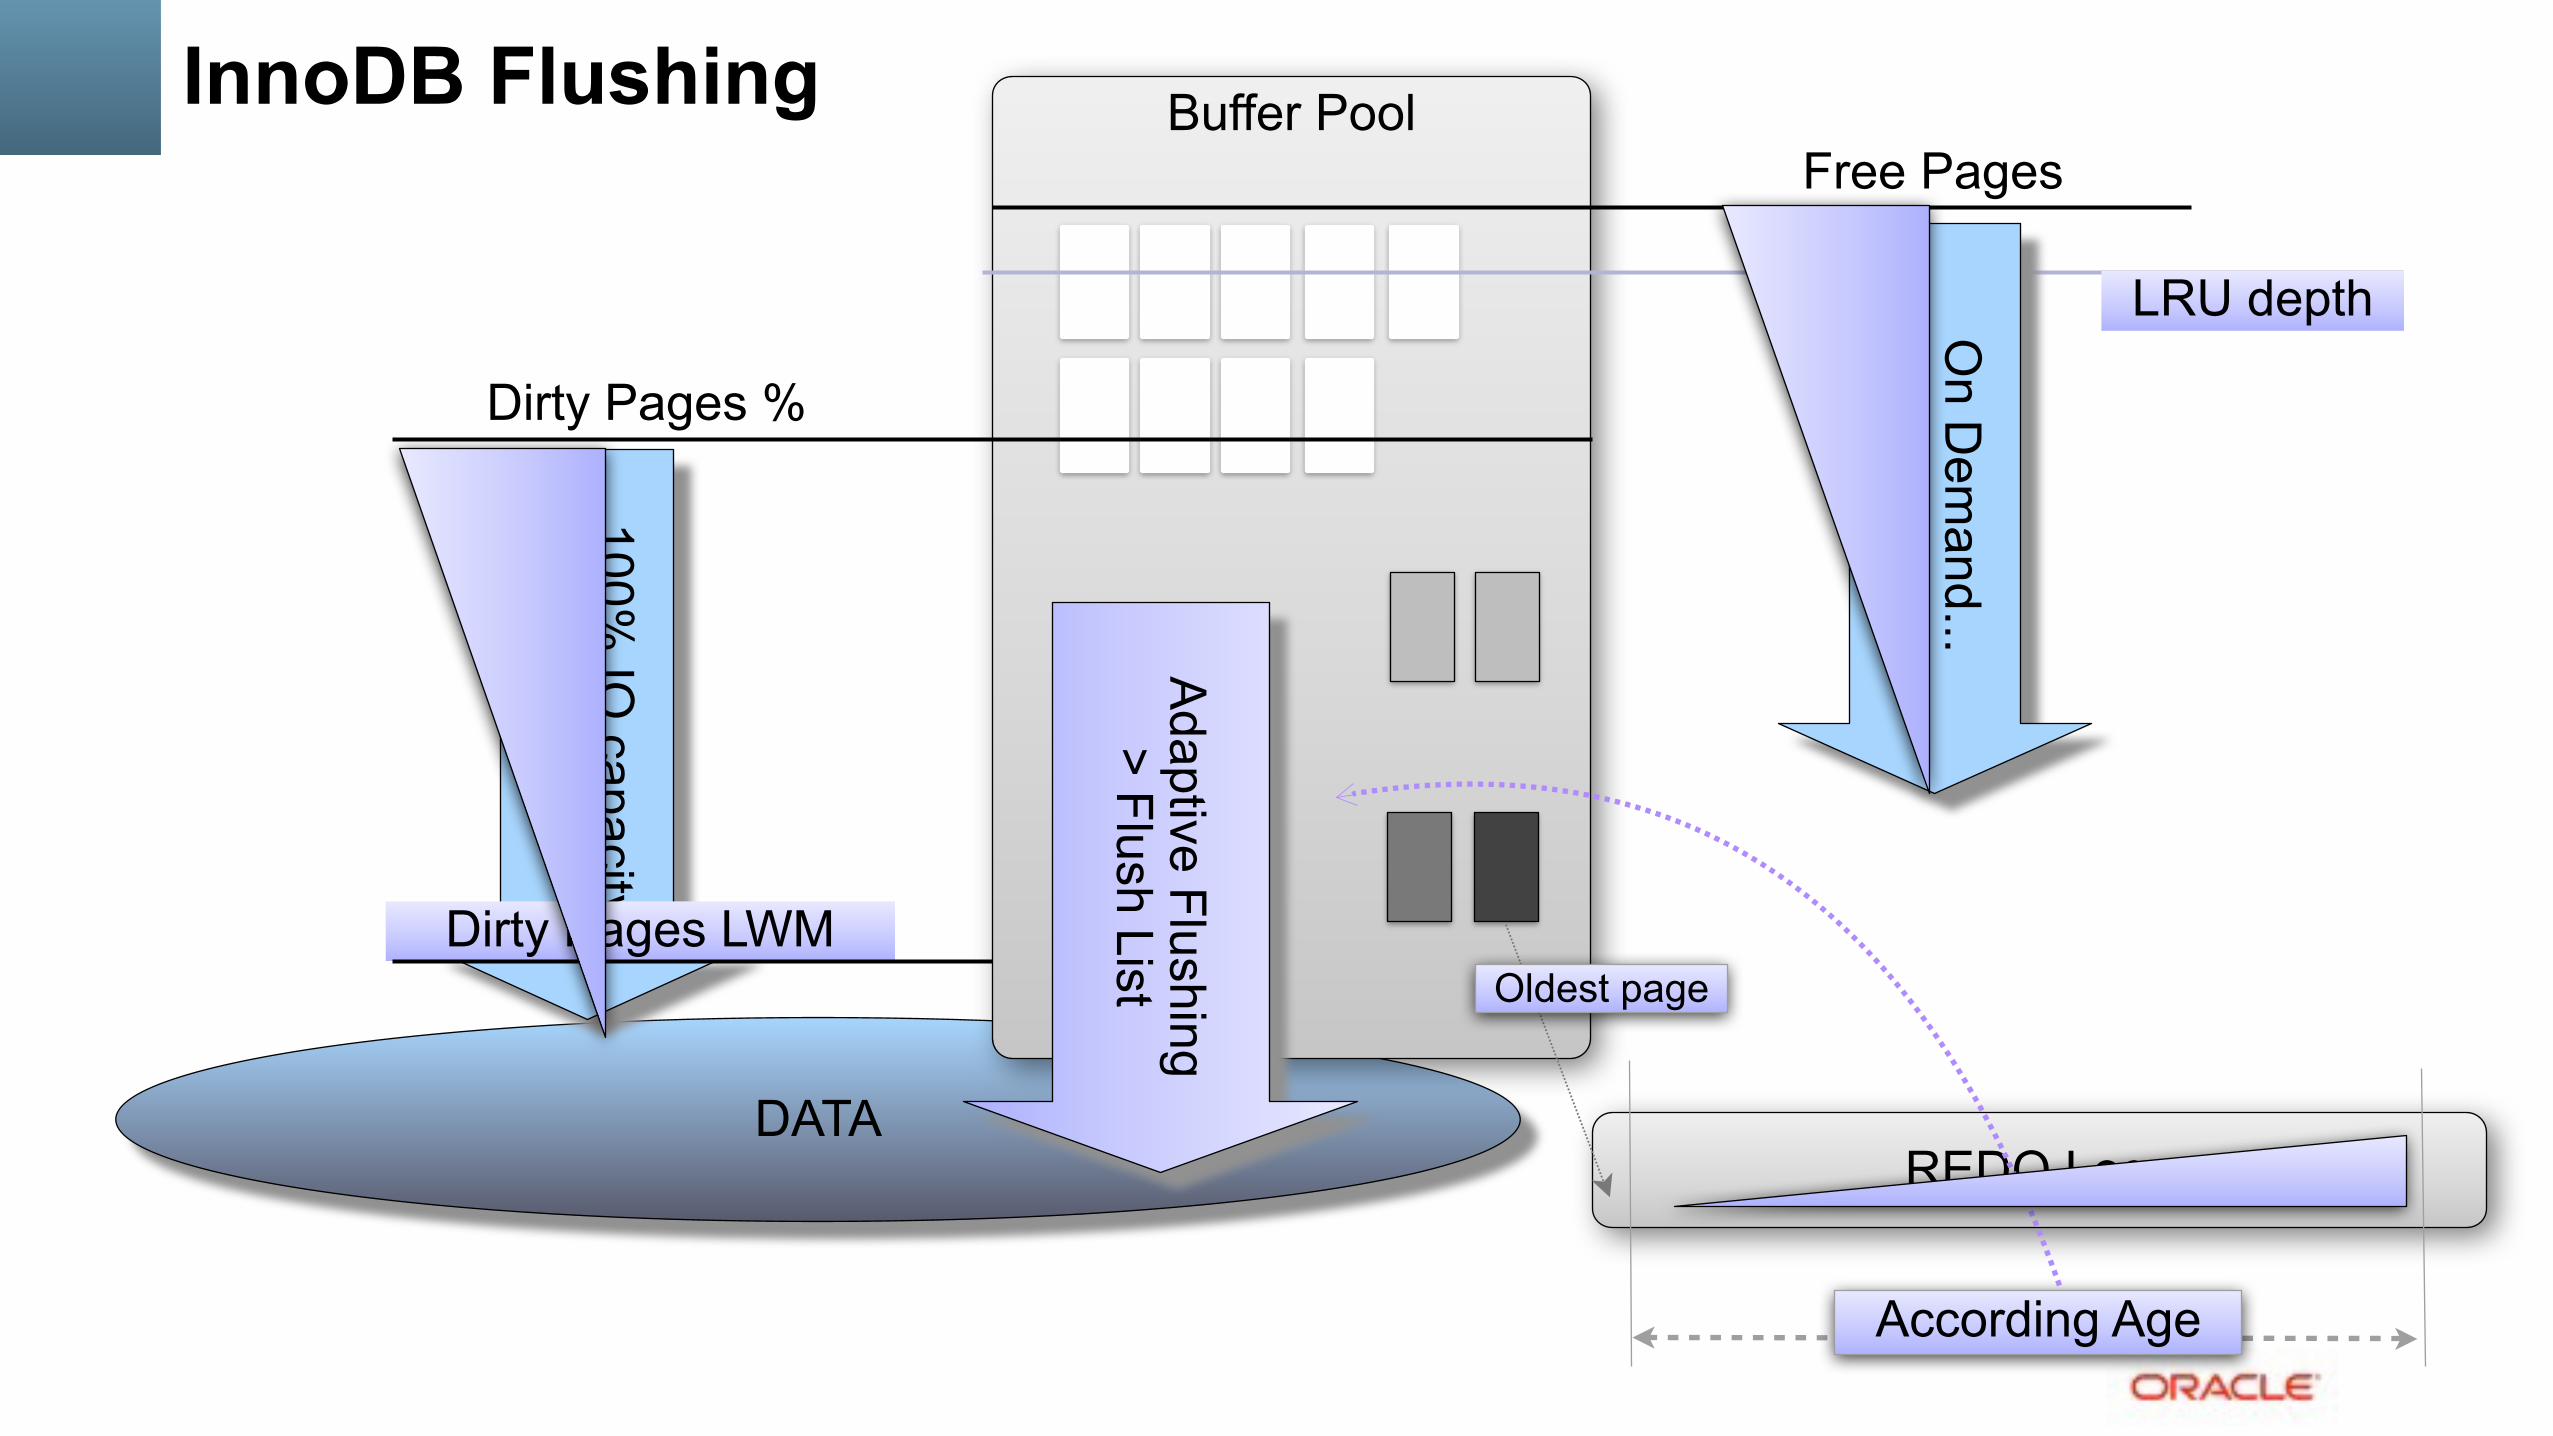
InnoDB Flushing
DATA
Buffer Pool
Dirty Pages %
100% IO
capacity > Flush List
Free Pages
On D
emand...
> LRU
List
REDO Logs
According Age
Oldest page
Adaptive Flushing
> Flush List
Dirty Pages LWM
InnoDB Flushing
DATA
Buffer Pool
Dirty Pages %
100% IO
capacity > Flush List
Free Pages
REDO Logs
According Age
Oldest page
Adaptive Flushing
> Flush List
Dirty Pages LWM
LRU depthOn D
emand...
> LRU
List

• REDO rate driven • LSN Age aware • the goal is not to flush
as much as possiblebut rather flush enough to keepa room in REDO..
InnoDB Flushing Buffer Pool
REDO
REDO rate

• OLTP_RW Workload: • Same IO capacity • Different logic..
Adaptive Flushing: MySQL 5.6 vs 5.5

• dbSTRESS RW with spikes • having a big enough Checkpoint Age marge allowing to resist to spikes
InnoDB : Resisting to activity spikes in 5.6
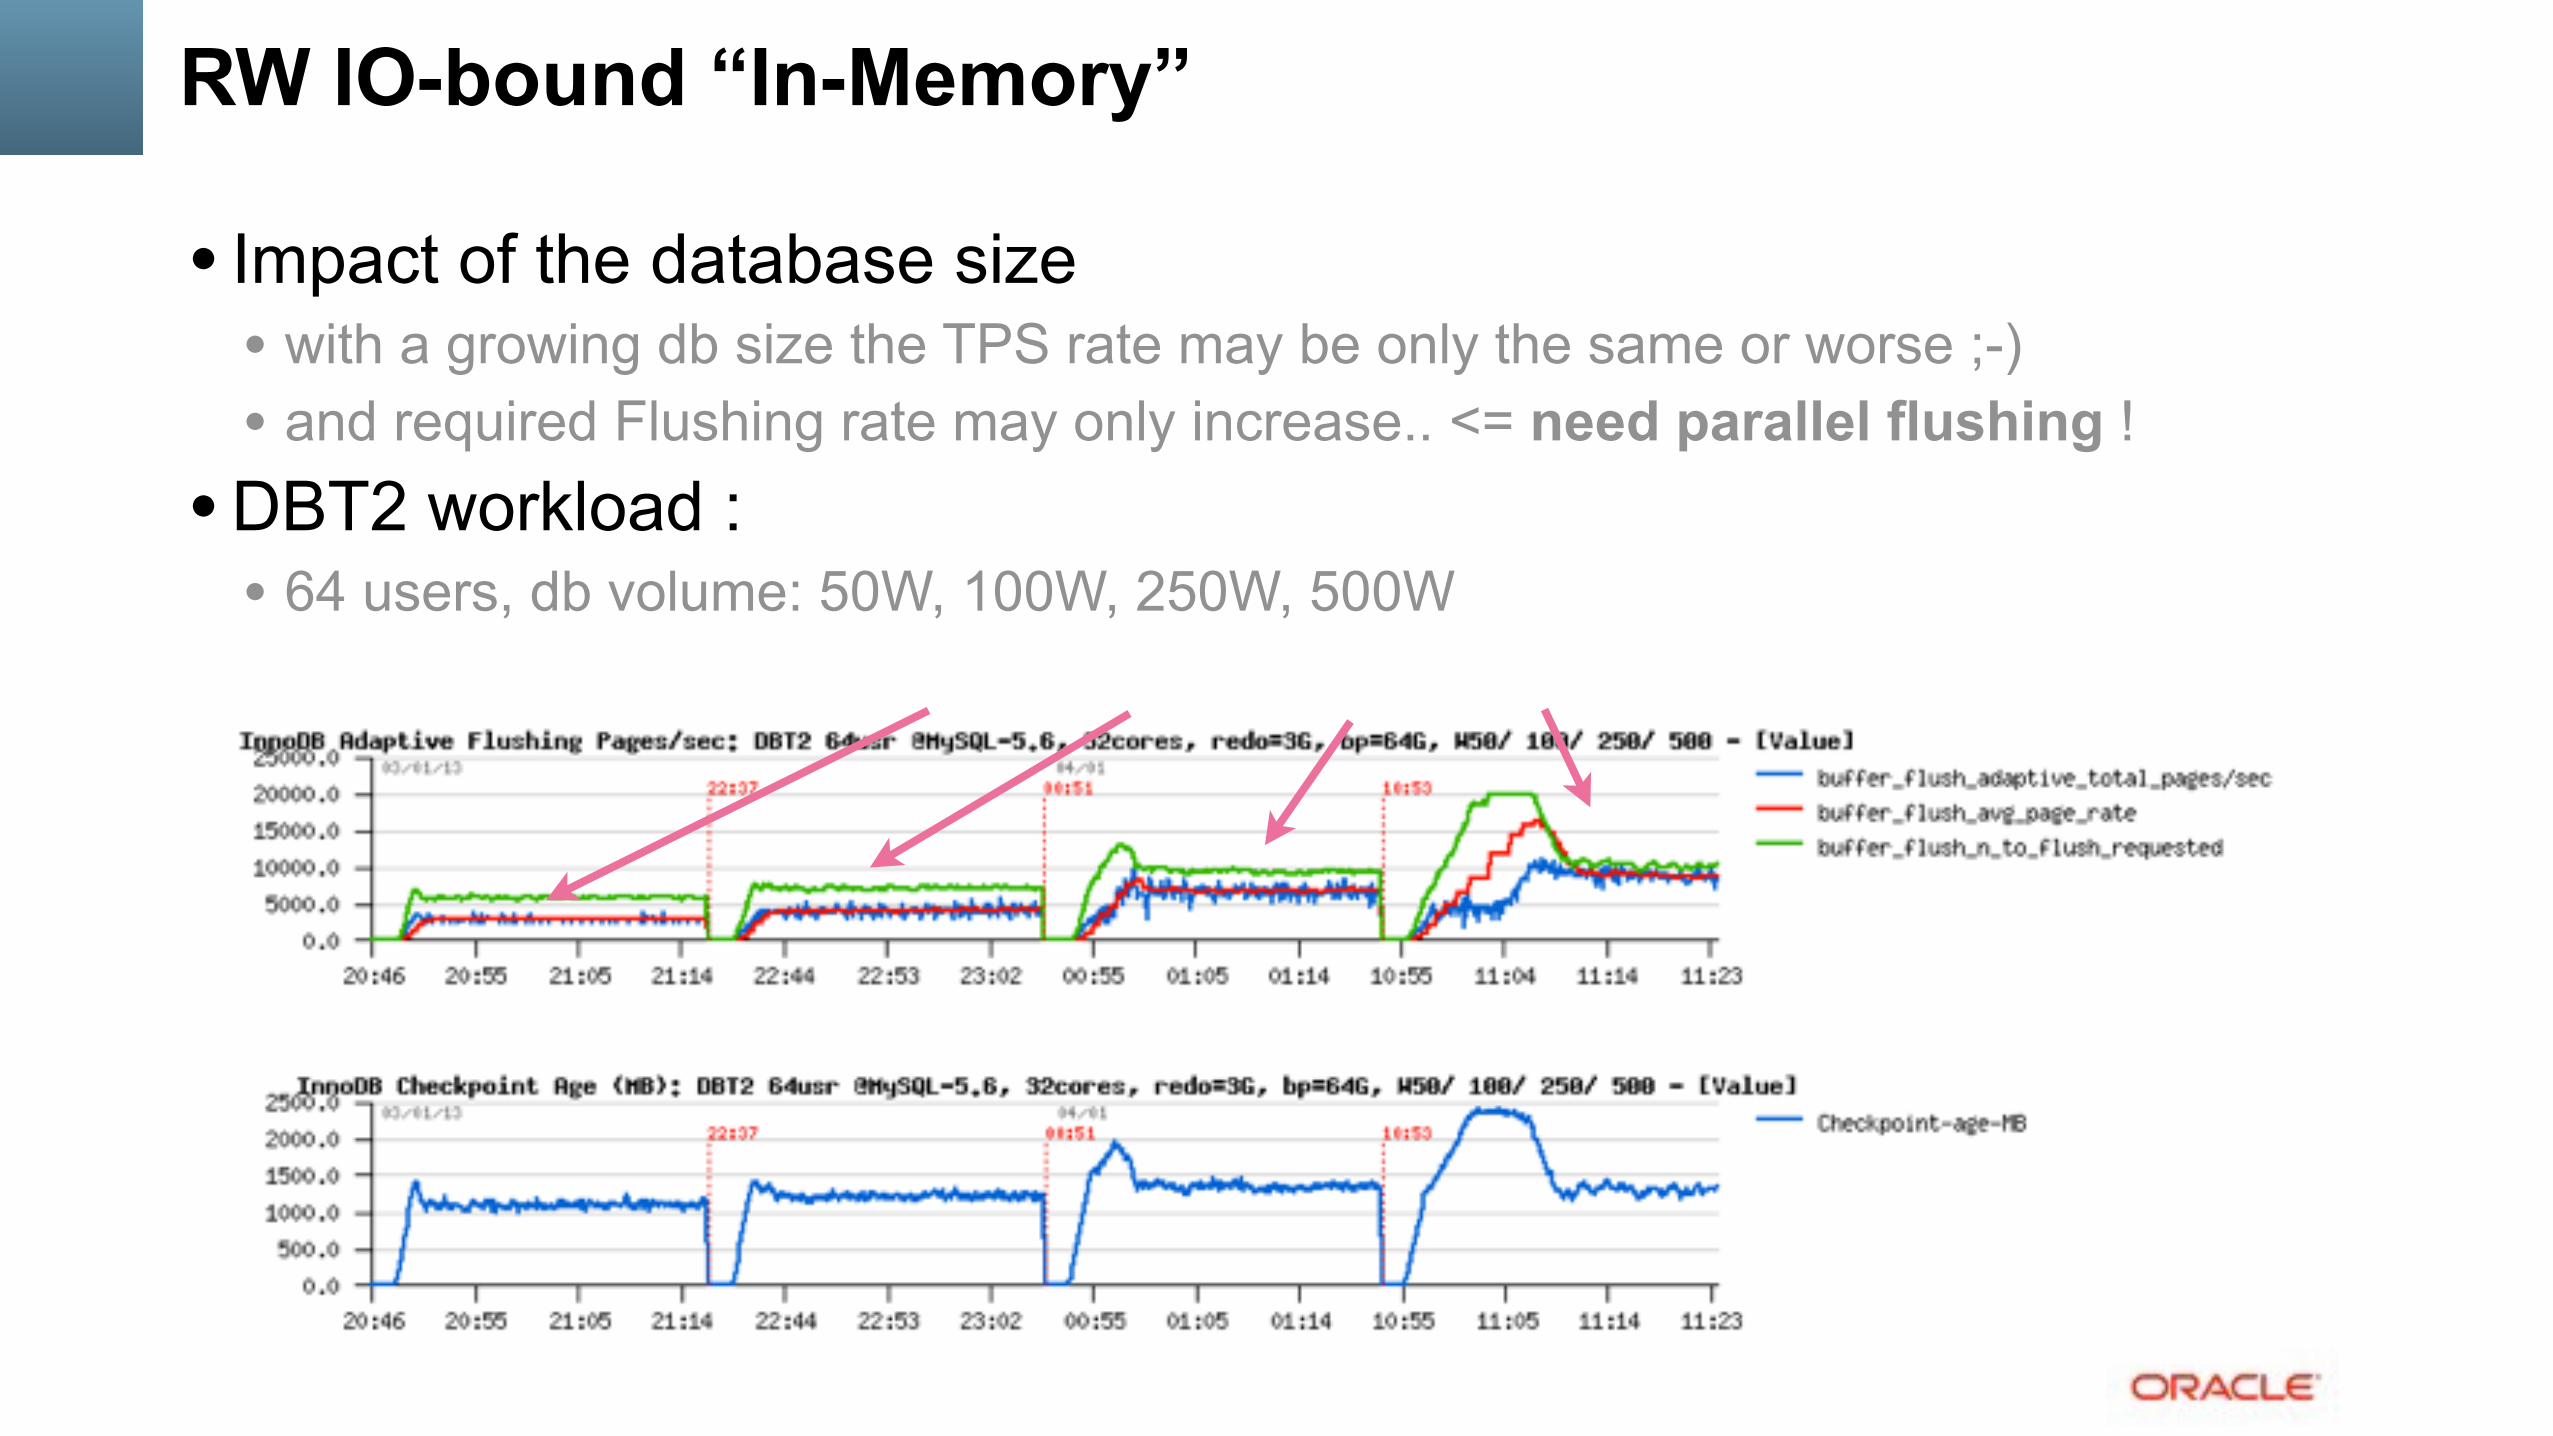
RW IO-bound “In-Memory”
• Impact of the database size • with a growing db size the TPS rate may be only the same or worse ;-) • and required Flushing rate may only increase.. <= need parallel flushing !
• DBT2 workload : • 64 users, db volume: 50W, 100W, 250W, 500W

• REDO rate driven • LSN Age aware • 5.6 : • BP Instances are flushed
sequentially.. • cannot follow high flushing
demand..
InnoDB Flushing 5.6 Buffer Pool
REDO
REDO rate Oldest page

• REDO rate driven • LSN Age aware • 5.7 : • BP Instances are
flushed in parallel !!!
InnoDB Flushing 5.7 Buffer Pool
REDO
REDO rate Oldest page
# Cleaners (configurable) Page Age is not uniform !!!
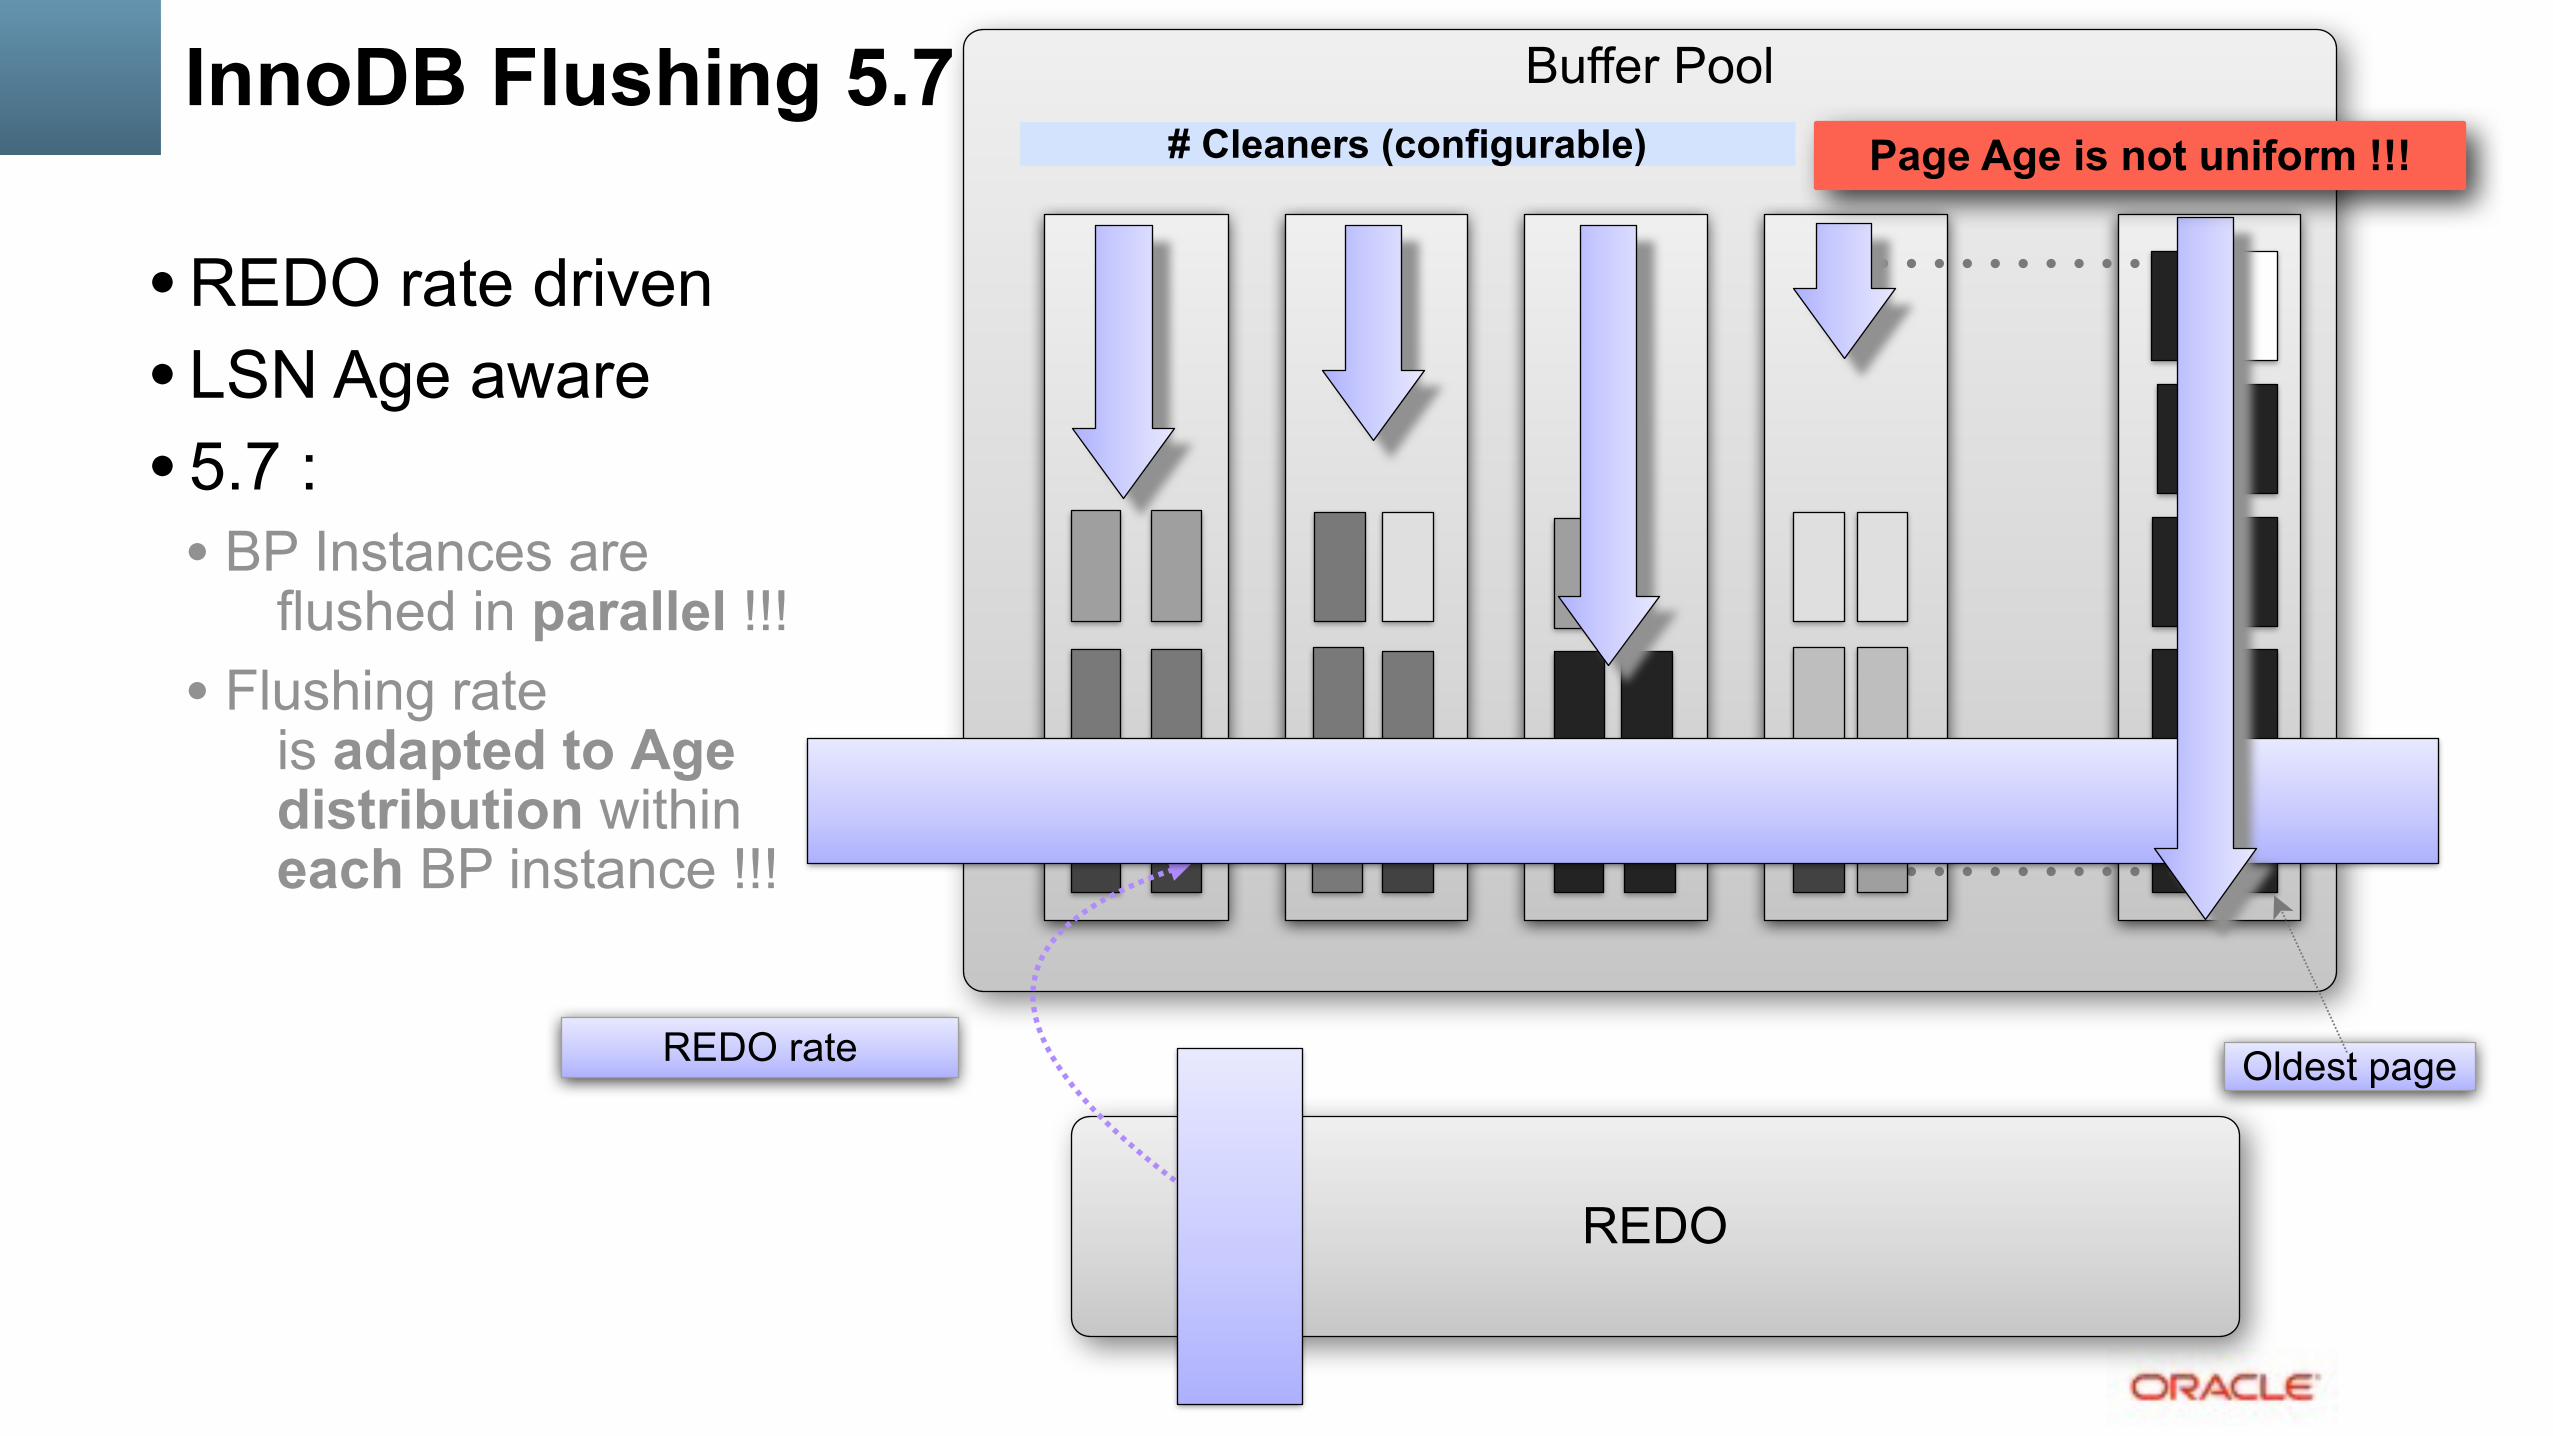
• REDO rate driven • LSN Age aware • 5.7 : • BP Instances are
flushed in parallel !!! • Flushing rate
is adapted to Agedistribution withineach BP instance !!!
InnoDB Flushing 5.7 Buffer Pool
REDO
REDO rate Oldest page
# Cleaners (configurable) Page Age is not uniform !!!
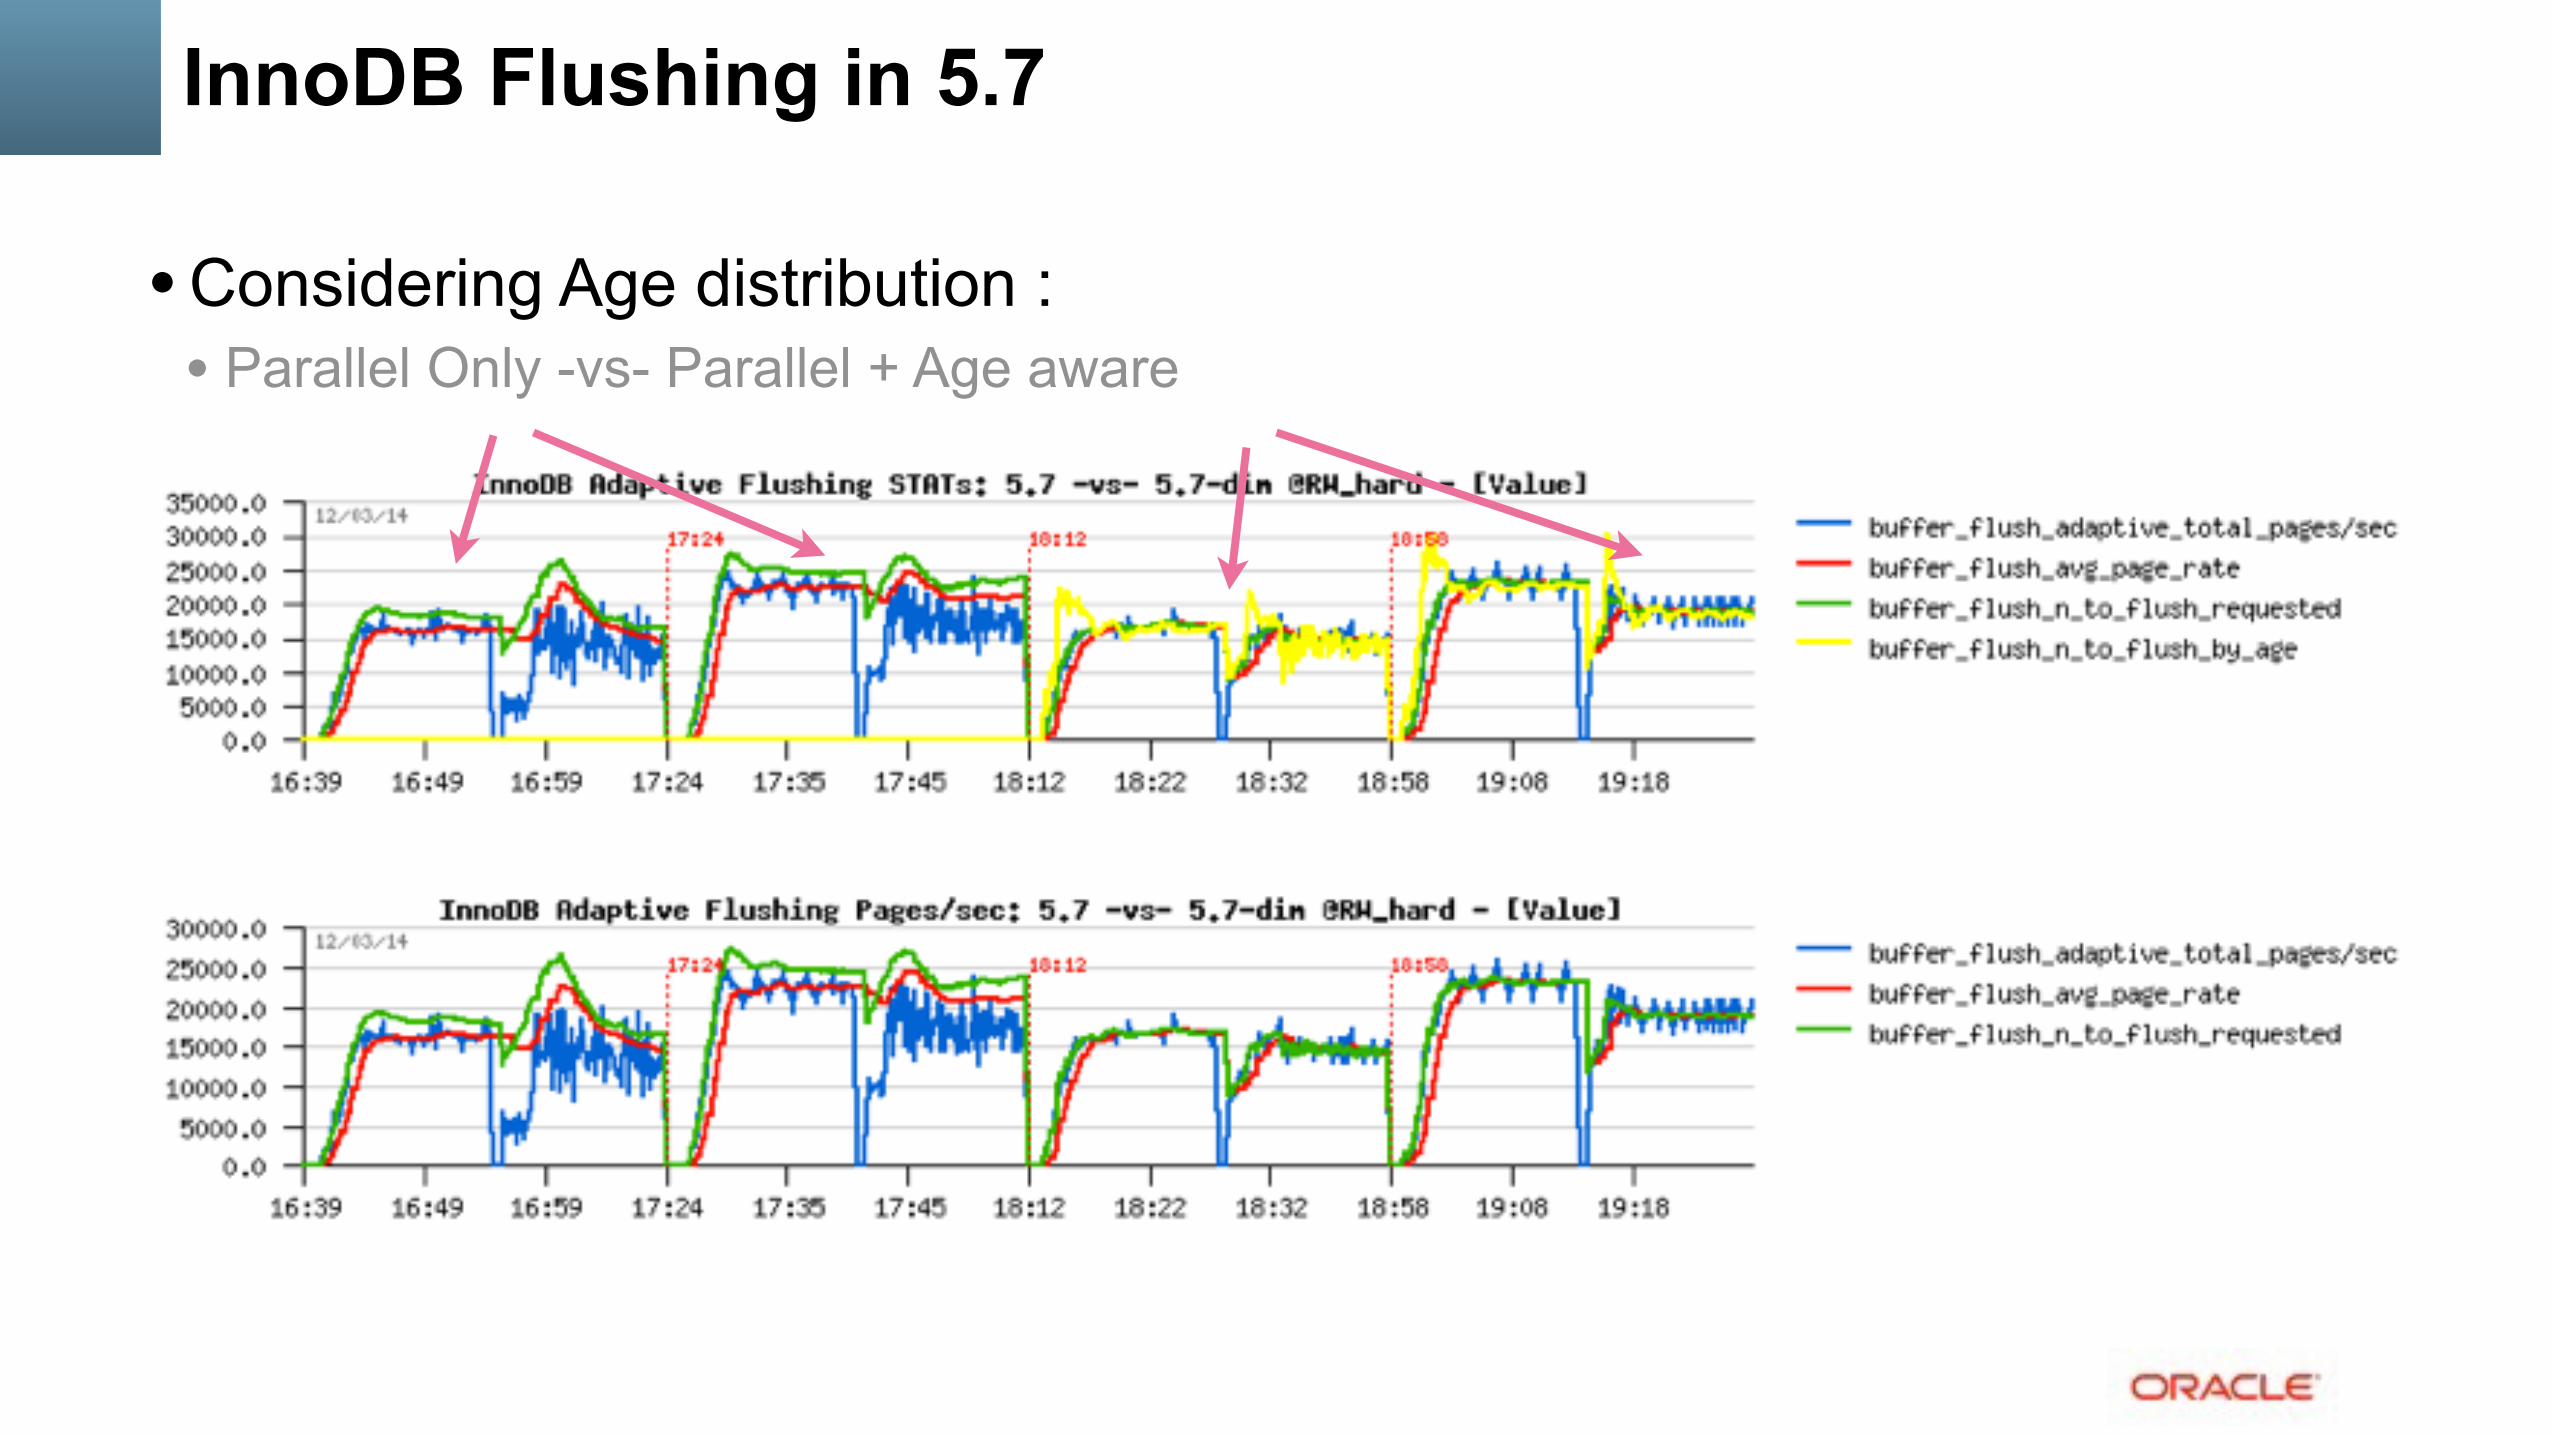
InnoDB Flushing in 5.7
• Considering Age distribution : • Parallel Only -vs- Parallel + Age aware
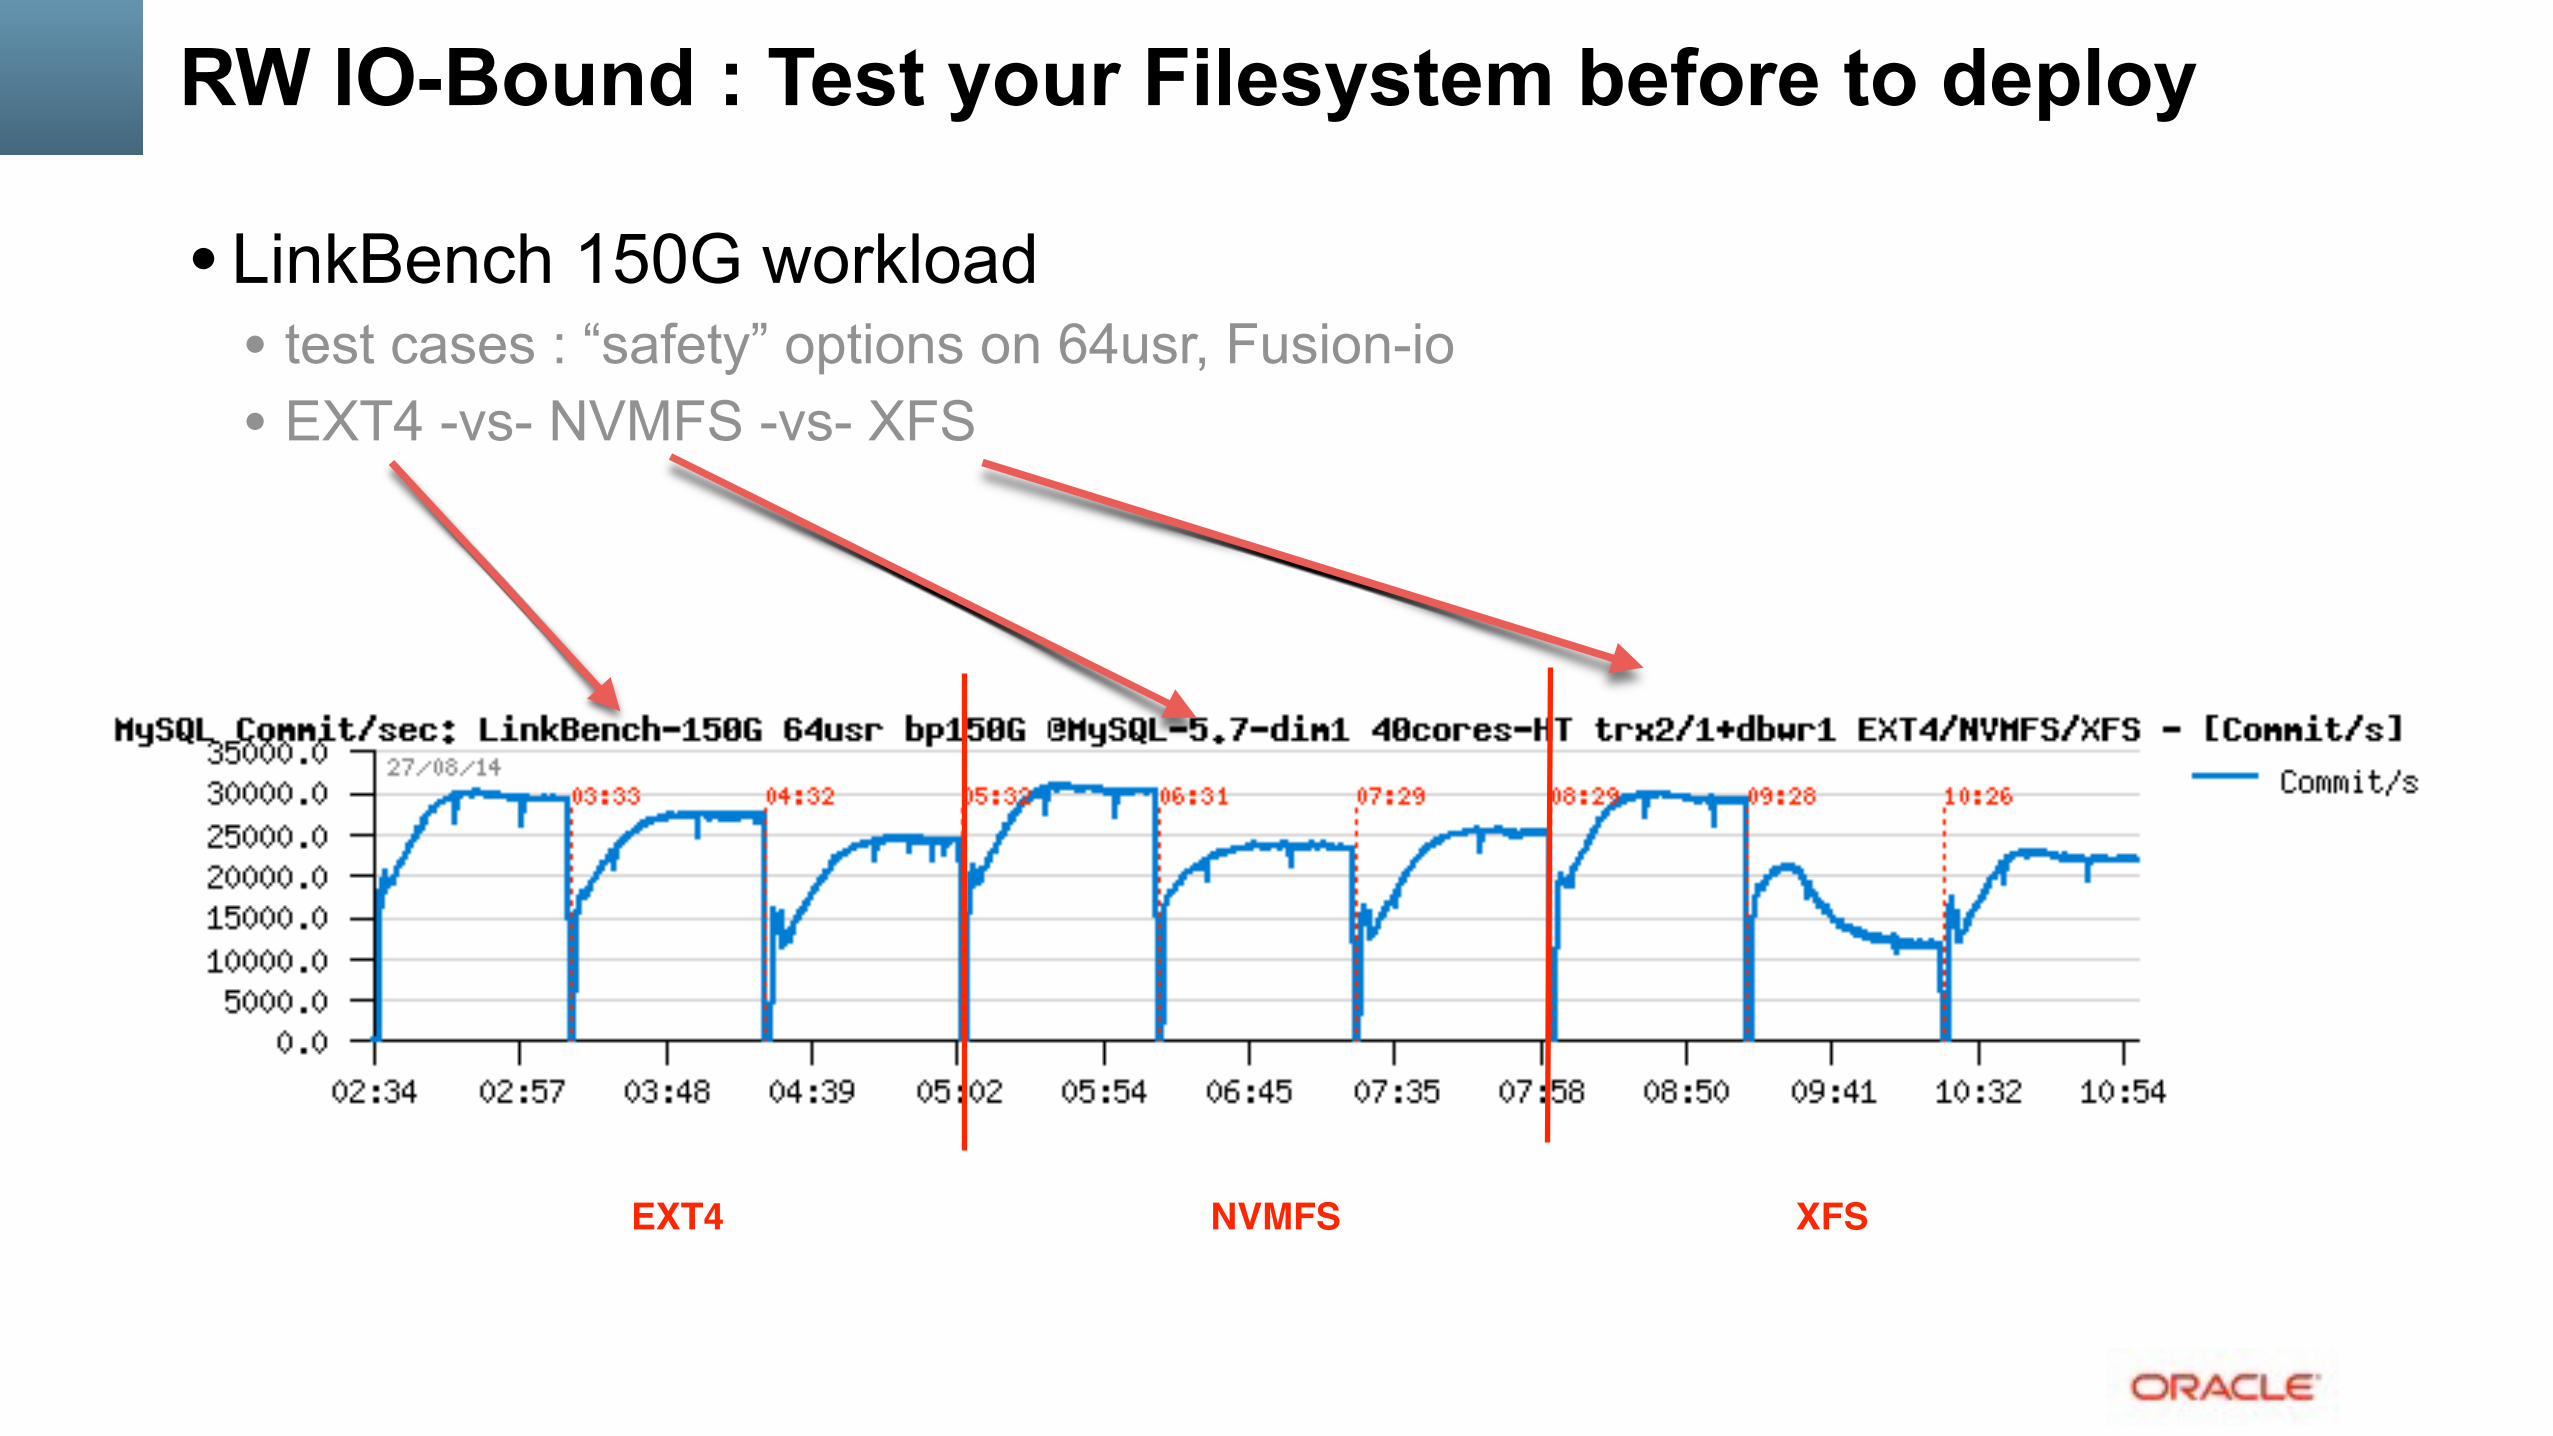
RW IO-Bound : Test your Filesystem before to deploy
• LinkBench 150G workload • test cases : “safety” options on 64usr, Fusion-io • EXT4 -vs- NVMFS -vs- XFS
EXT4 NVMFS XFS

RW IO-Bound : Consider a fast storage
• InnoDB Flushing in MySQL 5.7 & storage: • DBT2 512Wx8, 64usr, each test first with 1 then with 4 cleaners • XFS@SSD | EXT4@SSD | XFS@LSI-F80 | EXT4@LSI-F80
SSD LSI-F80 flash

Read+Write Workloads : InnoDB Purge
• InnoDB Purge... • 5.5 : Purge Thread !!! ;-) • 5.6 : Multi-Threaded Purge + fix for purge lag code ! • 5.7 : UNDO space can be auto-dropped !!
• monitor InnoDB History Length ALWAYS ! ;-) • if NO purge lagging : excellent! (& be happy! ;-)) • if purge is lagging : use a purge lag config setting.. (& wait for fix)
• example of config for 5.6 and 5.7 to avoid purge lagging: • innodb_max_purge_lag = 1000000 (1M max, ex.) • innodb_max_purge_lag_delay = 30000000 • innodb_purge_threads = 4
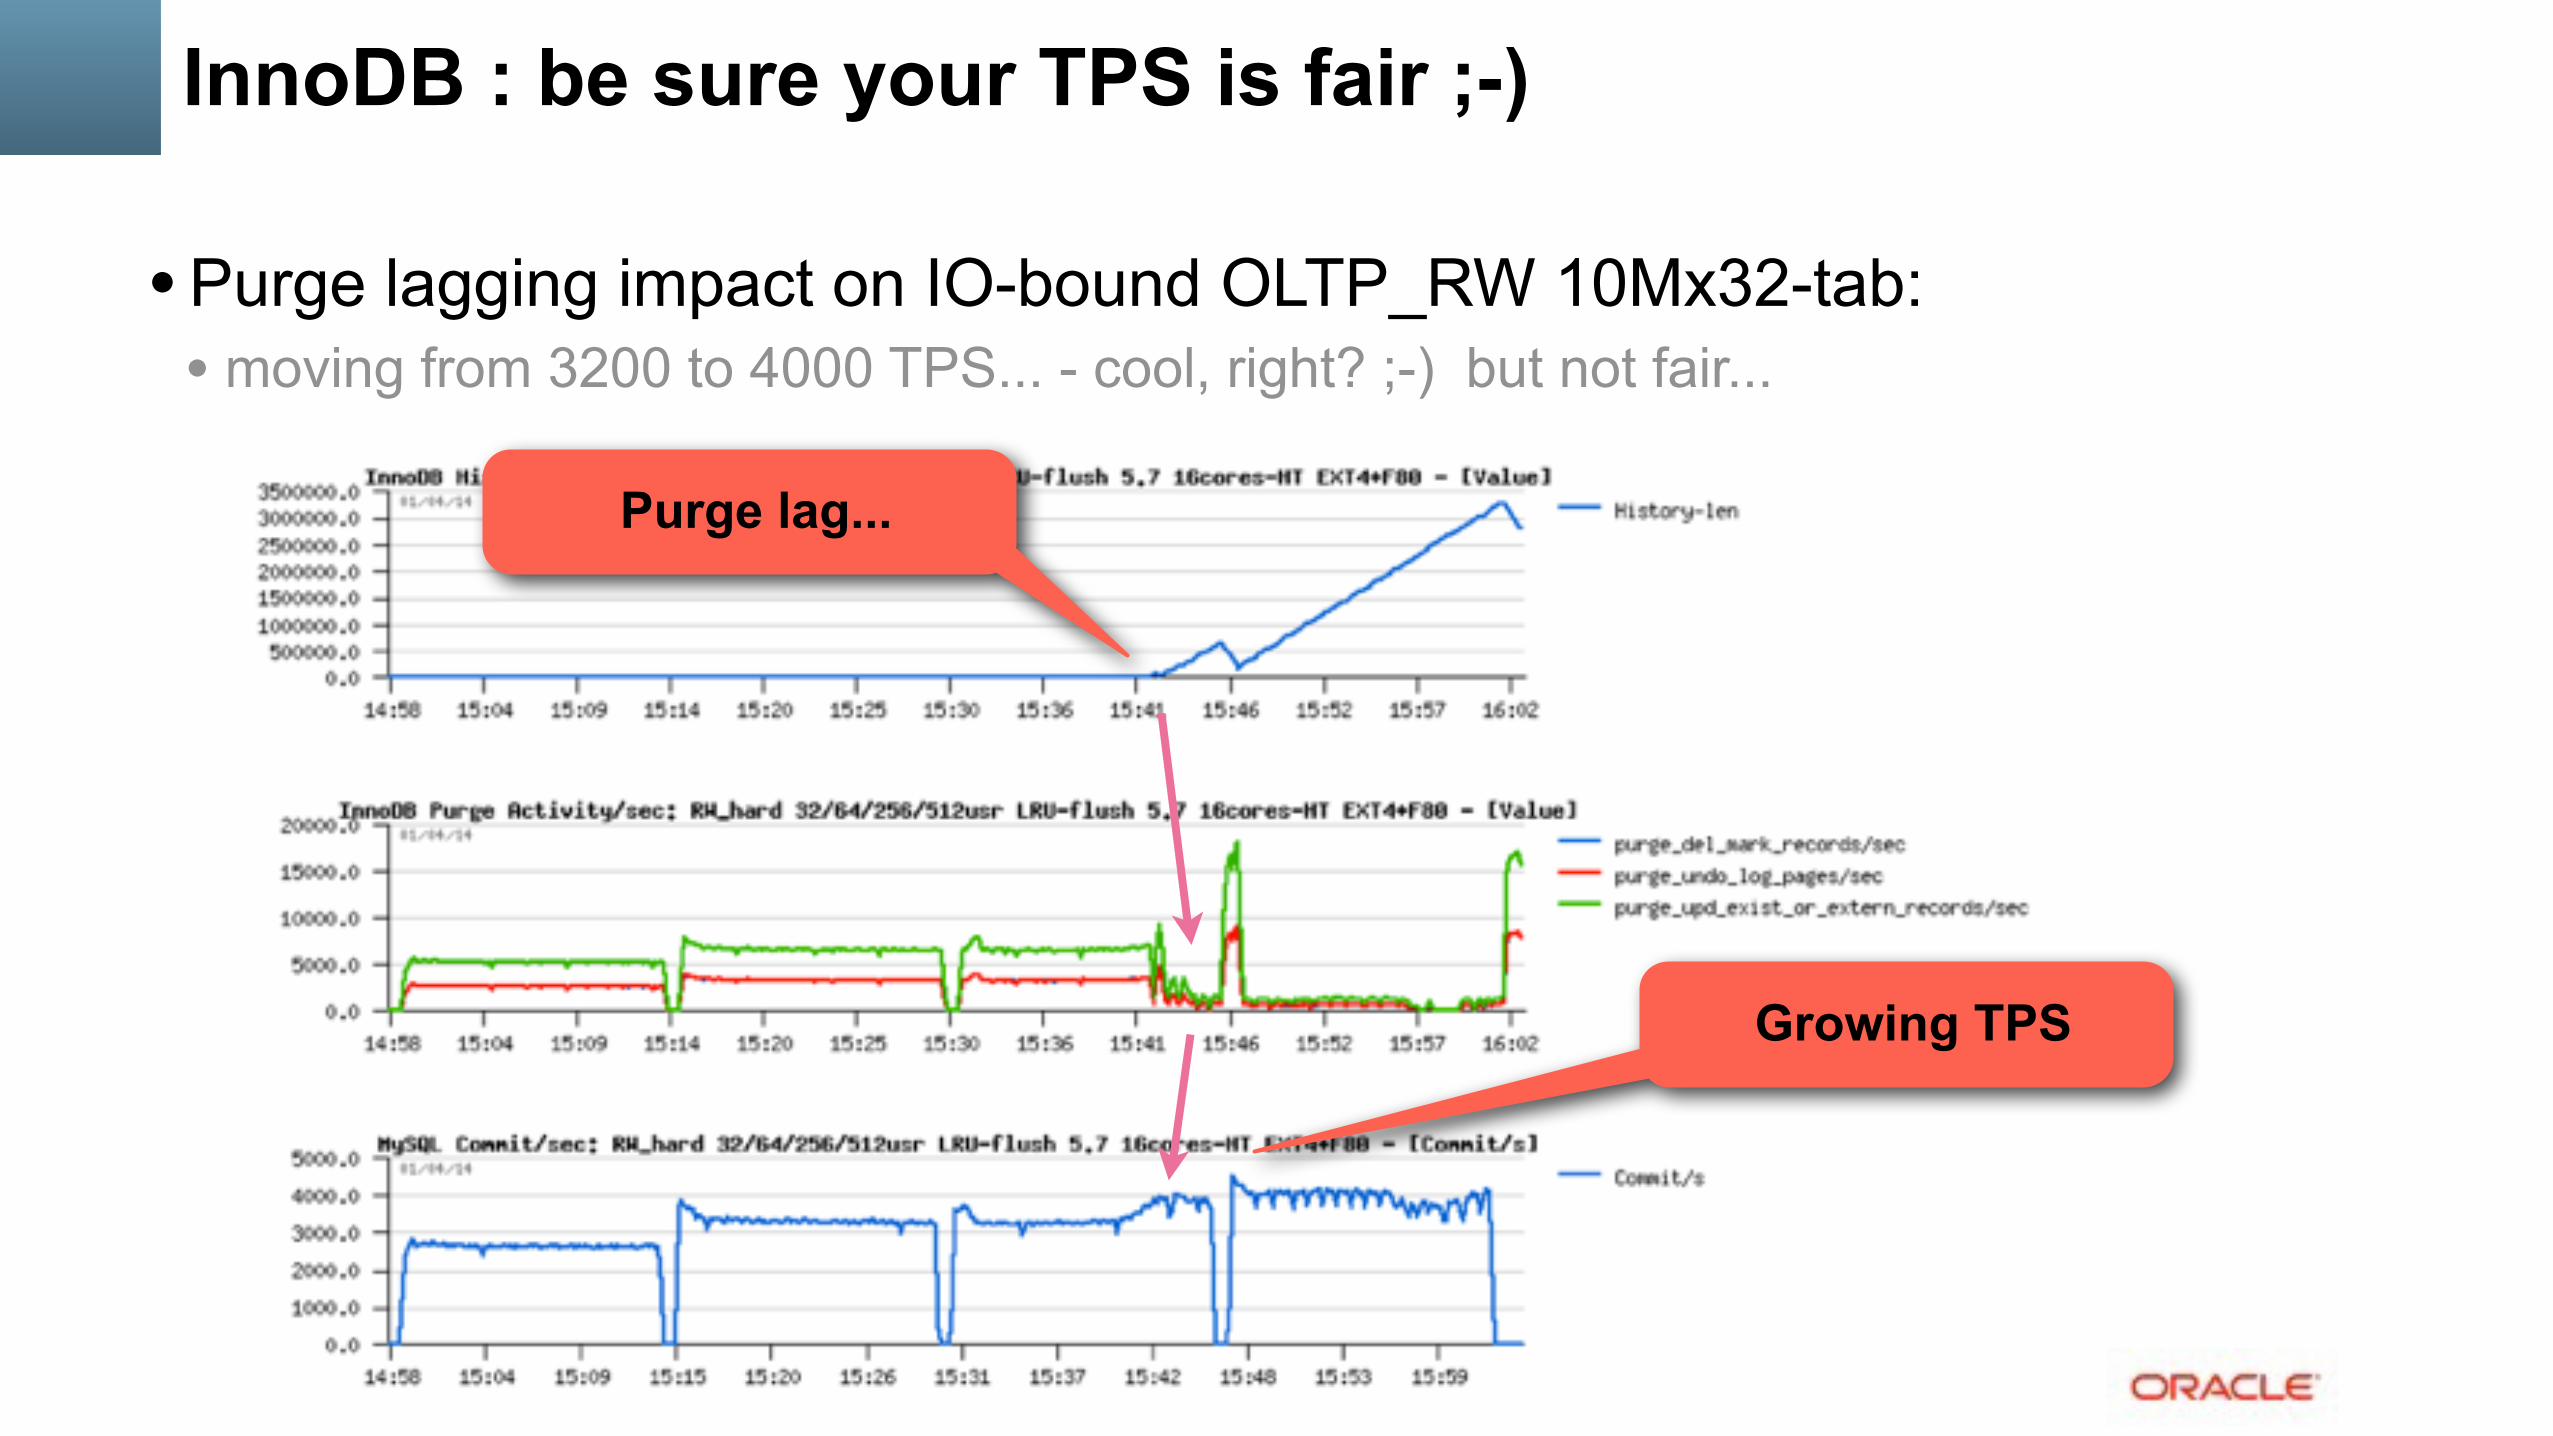
InnoDB : be sure your TPS is fair ;-)
• Purge lagging impact on IO-bound OLTP_RW 10Mx32-tab: • moving from 3200 to 4000 TPS... - cool, right? ;-) but not fair...
Purge lag...
Growing TPS
RW related starter configuration settings
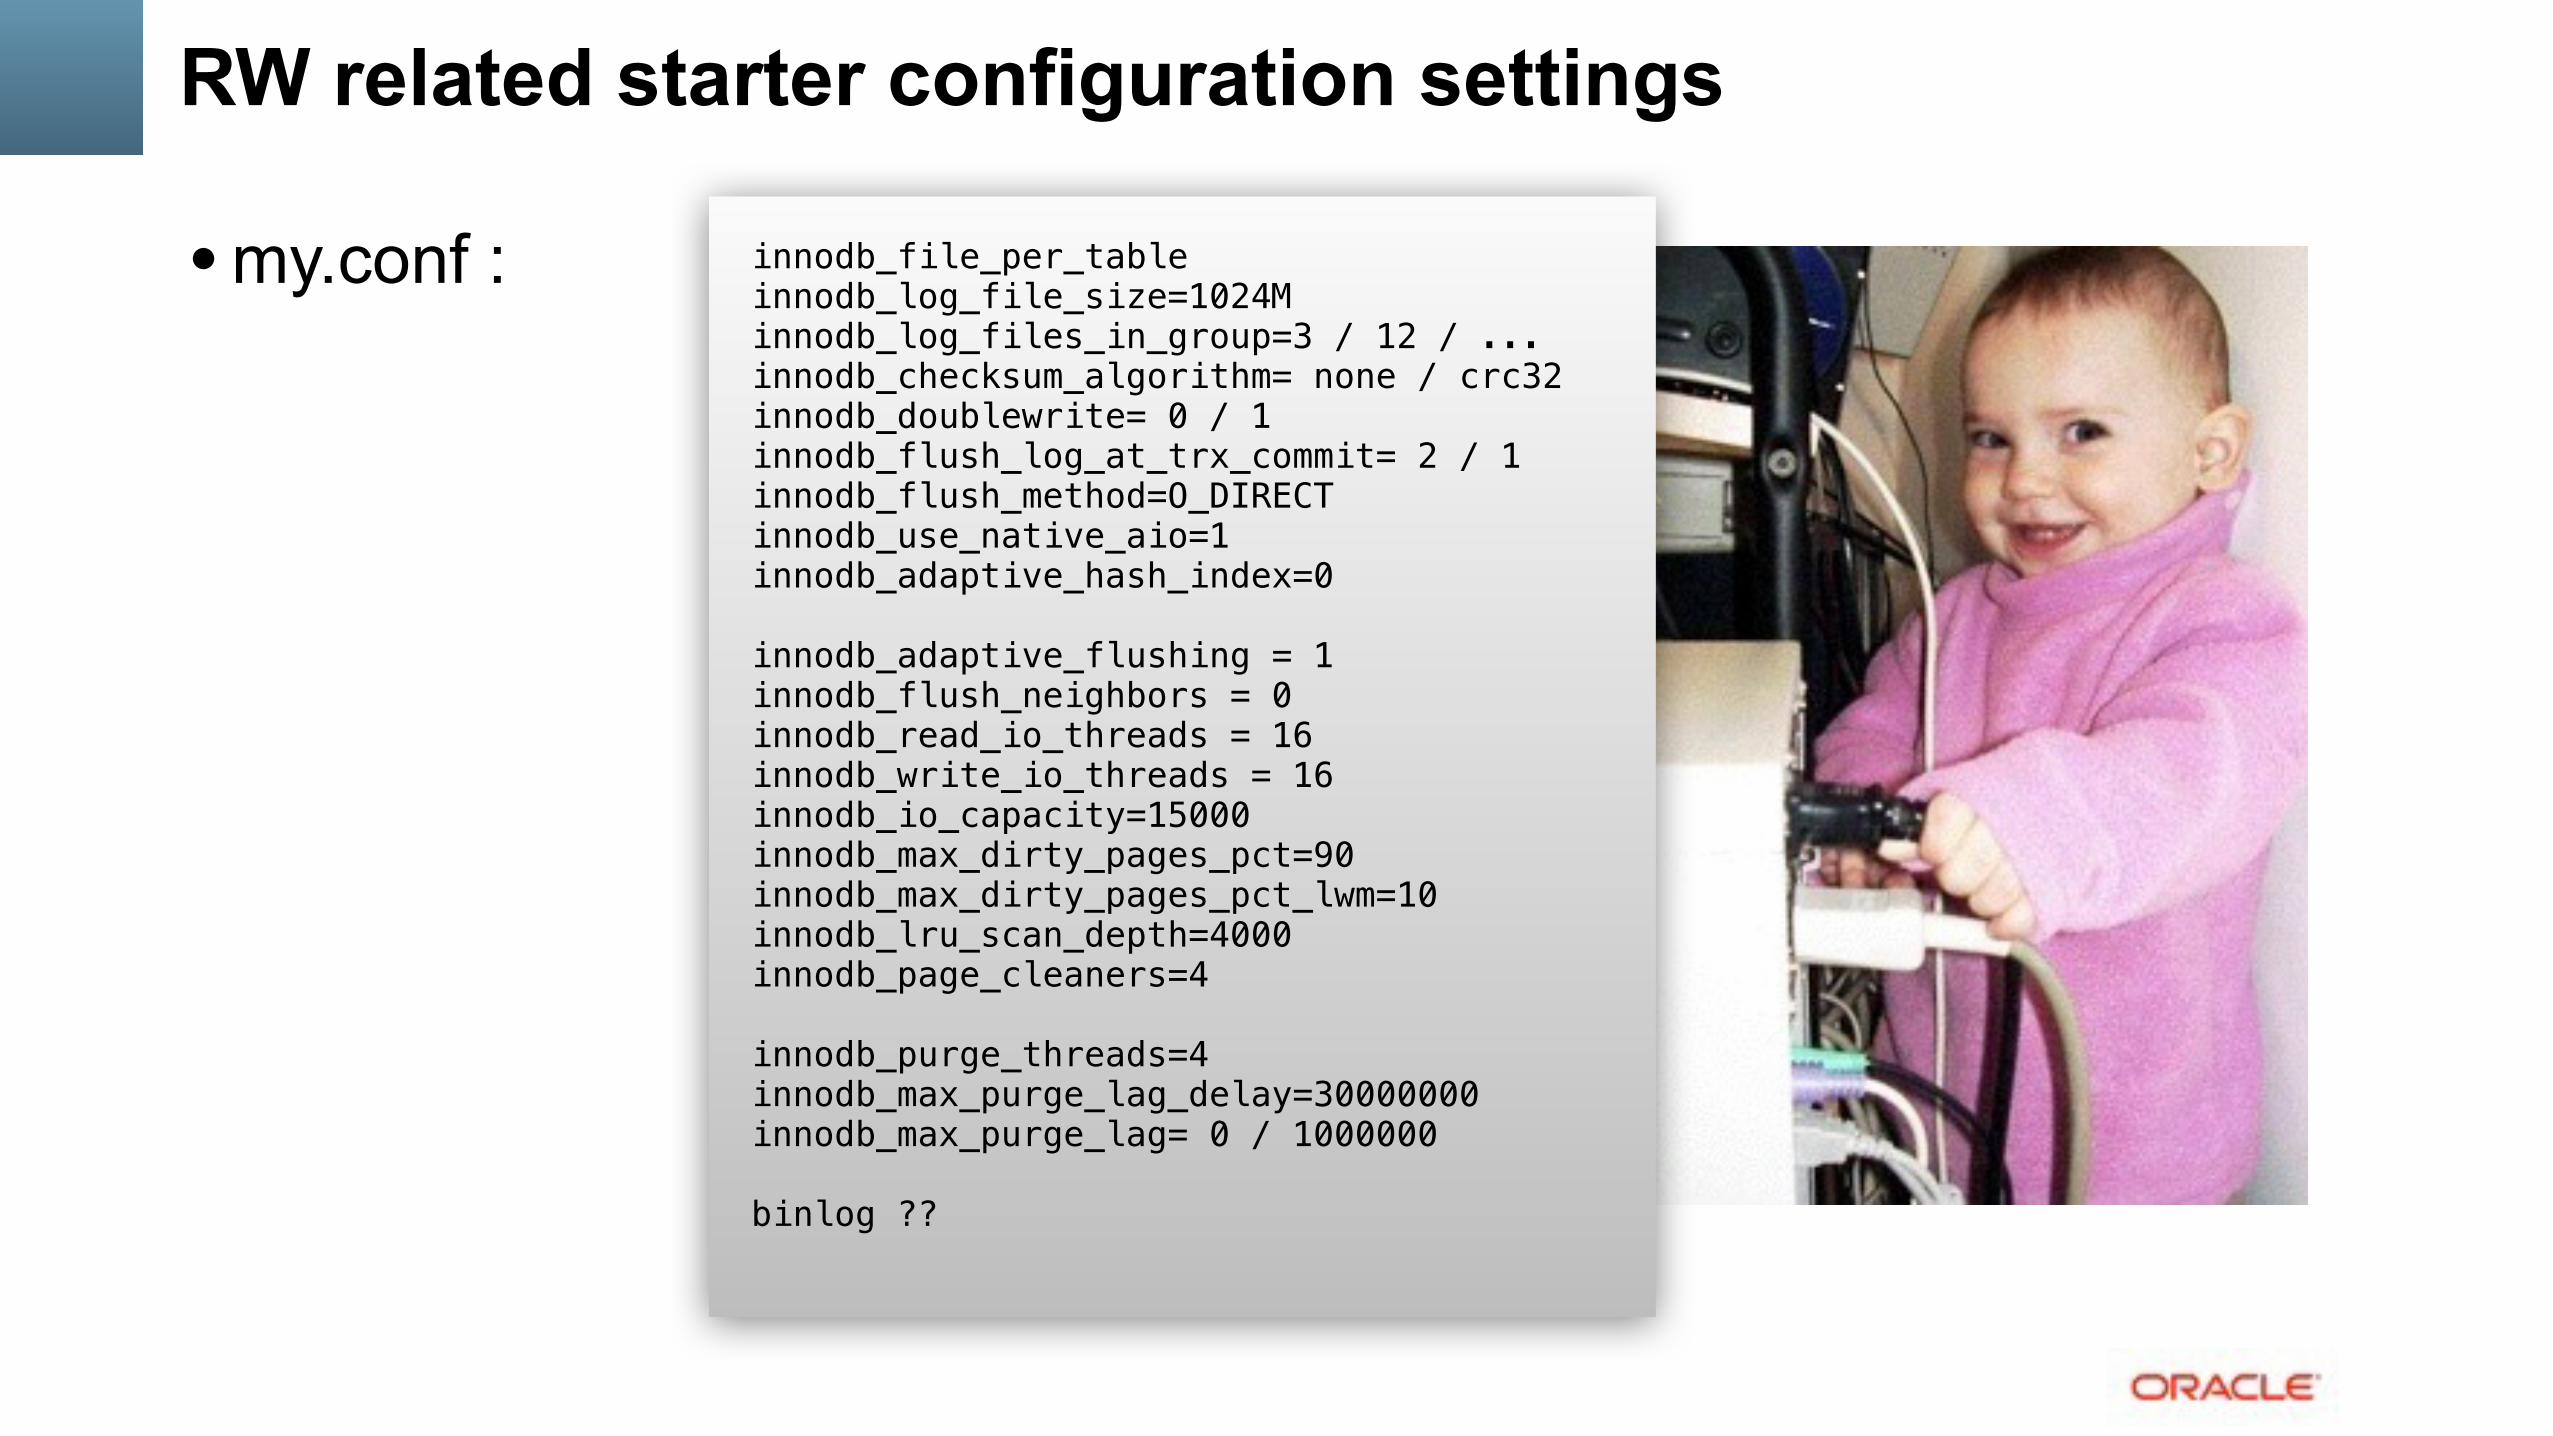
• my.conf :! innodb_file_per_table innodb_log_file_size=1024M innodb_log_files_in_group=3 / 12 / ... innodb_checksum_algorithm= none / crc32 innodb_doublewrite= 0 / 1 innodb_flush_log_at_trx_commit= 2 / 1 innodb_flush_method=O_DIRECT innodb_use_native_aio=1 innodb_adaptive_hash_index=0 ! innodb_adaptive_flushing = 1 innodb_flush_neighbors = 0 innodb_read_io_threads = 16 innodb_write_io_threads = 16 innodb_io_capacity=15000 innodb_max_dirty_pages_pct=90 innodb_max_dirty_pages_pct_lwm=10 innodb_lru_scan_depth=4000 innodb_page_cleaners=4 ! innodb_purge_threads=4 innodb_max_purge_lag_delay=30000000 innodb_max_purge_lag= 0 / 1000000 ! binlog ??

OLTP_RW : 8-tables
• Sysbench OLTP_RW 1Mx8-tables • 12cores-HT • and the winner is: MySQL 5.5 !! ;-))

OLTP_RW : 8-tables (Sep.2015)
• Sysbench OLTP_RW 1Mx8-tables • 32cores-HT • and the winner is: rather MySQL 5.7 !! ;-))

OLTP_RW : 8-tables (Oct.2015)
• Sysbench OLTP_RW 1Mx8-tables • 32cores-HT • and the winner is: clearly MySQL 5.7 !! ;-))

OLTP_RW : 8-tables (Sep.2015)
• Sysbench OLTP_RW 1Mx8-tables • 40cores-HT • and the winner is: rather MySQL 5.7 !! ;-))

OLTP_RW : 8-tables (Oct.2015)
• Sysbench OLTP_RW 1Mx8-tables • 40cores-HT • and the winner is: clearly MySQL 5.7 !! ;-))
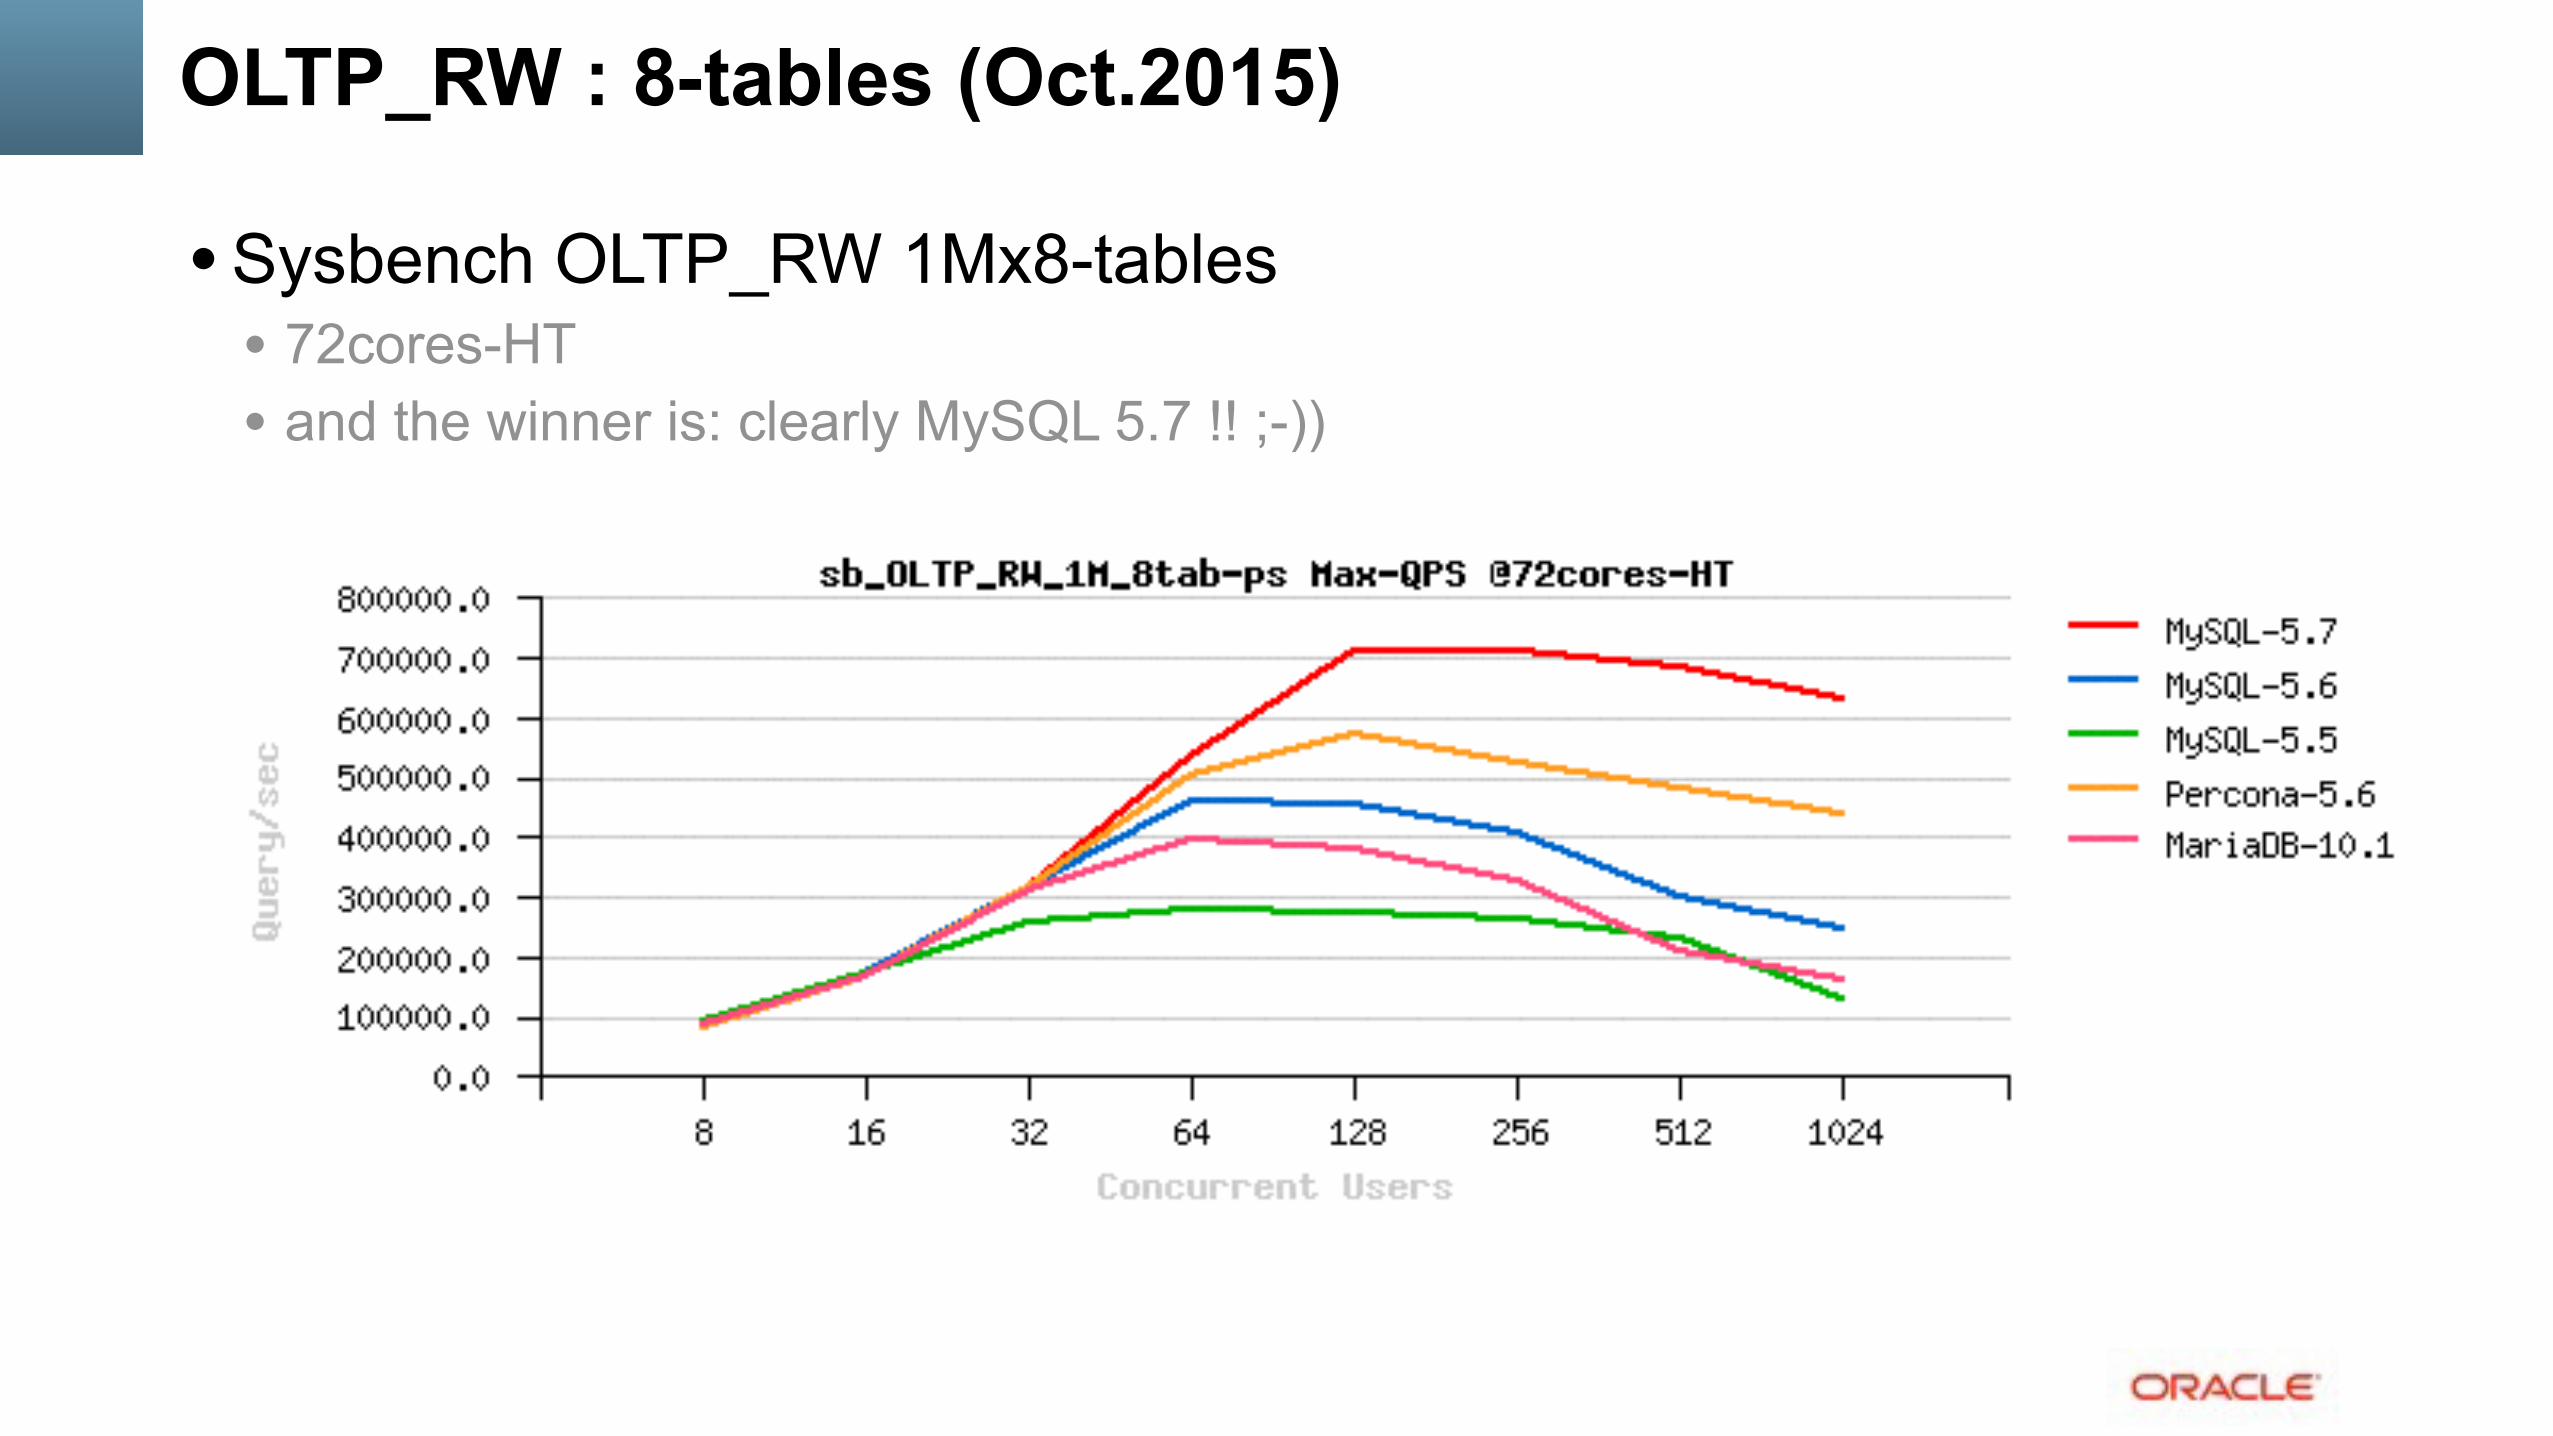
OLTP_RW : 8-tables (Oct.2015)
• Sysbench OLTP_RW 1Mx8-tables • 72cores-HT • and the winner is: clearly MySQL 5.7 !! ;-))
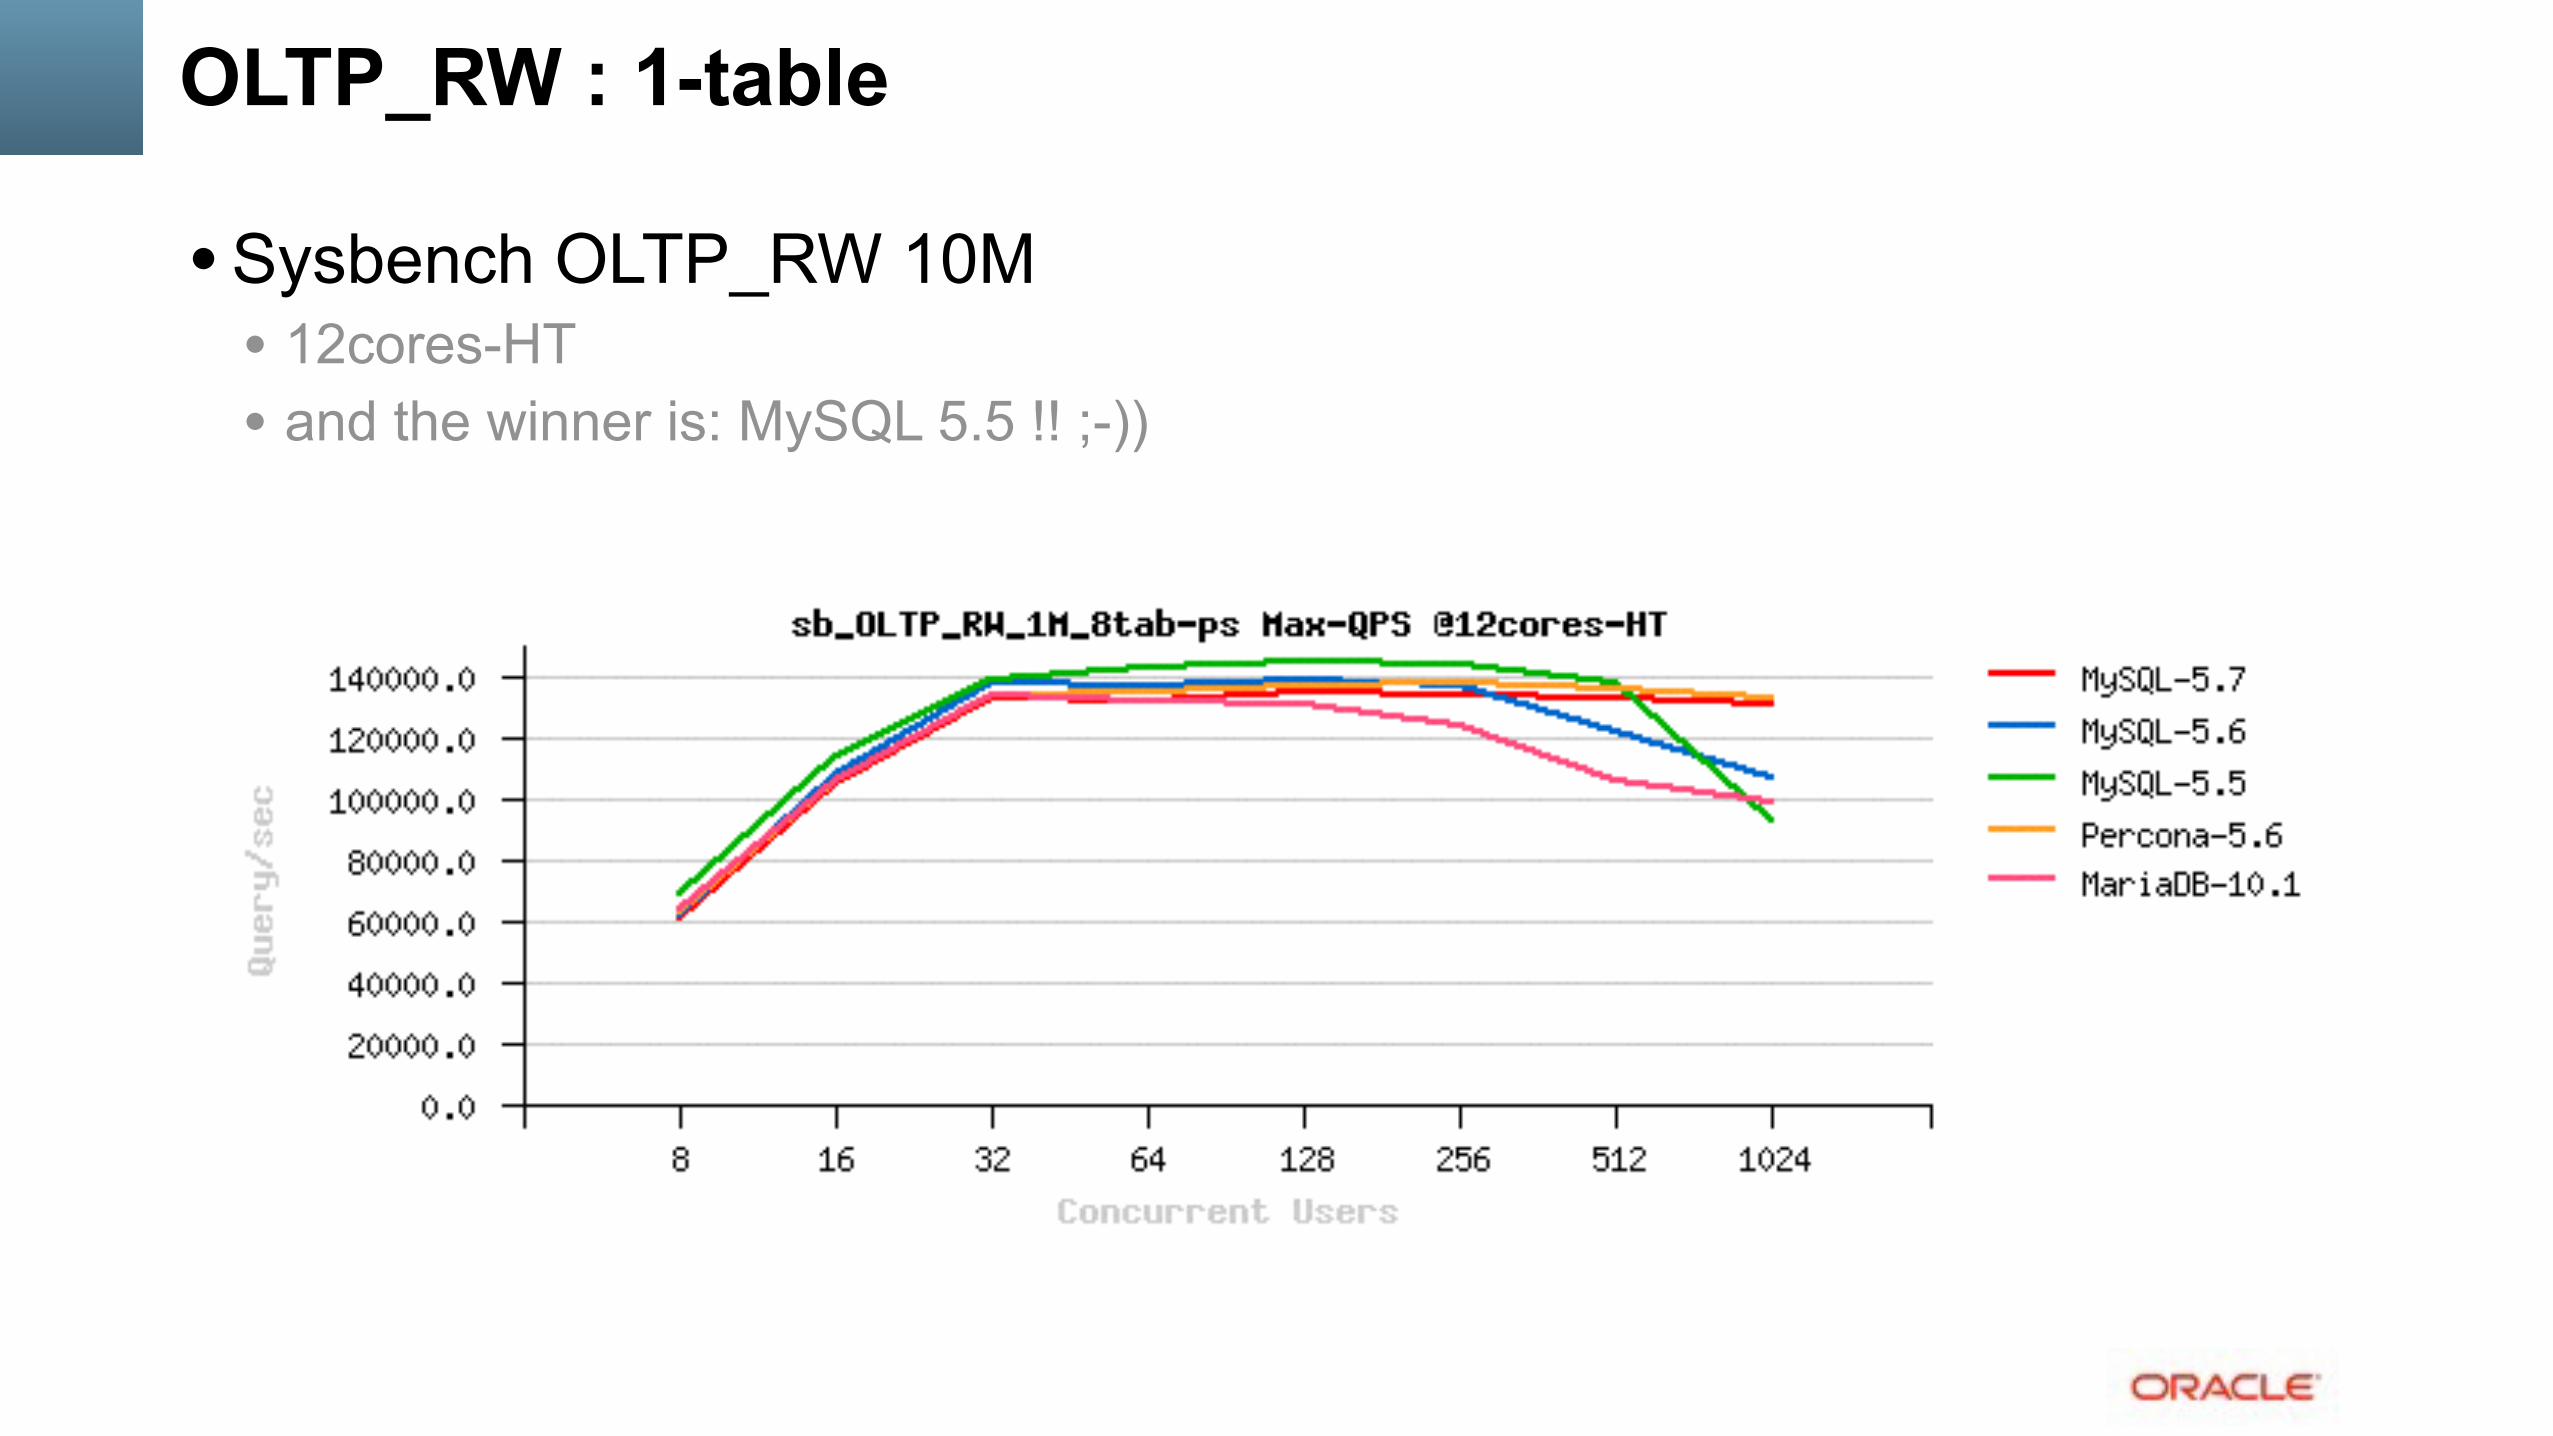
OLTP_RW : 1-table
• Sysbench OLTP_RW 10M • 12cores-HT • and the winner is: MySQL 5.5 !! ;-))

OLTP_RW : 1-table
• Sysbench OLTP_RW 10M • 32cores-HT • and the winner is: far MySQL 5.7 !! ;-))

OLTP_RW : 1-table
• Sysbench OLTP_RW 10M • 40cores-HT • and the winner is: far MySQL 5.7 !! ;-))
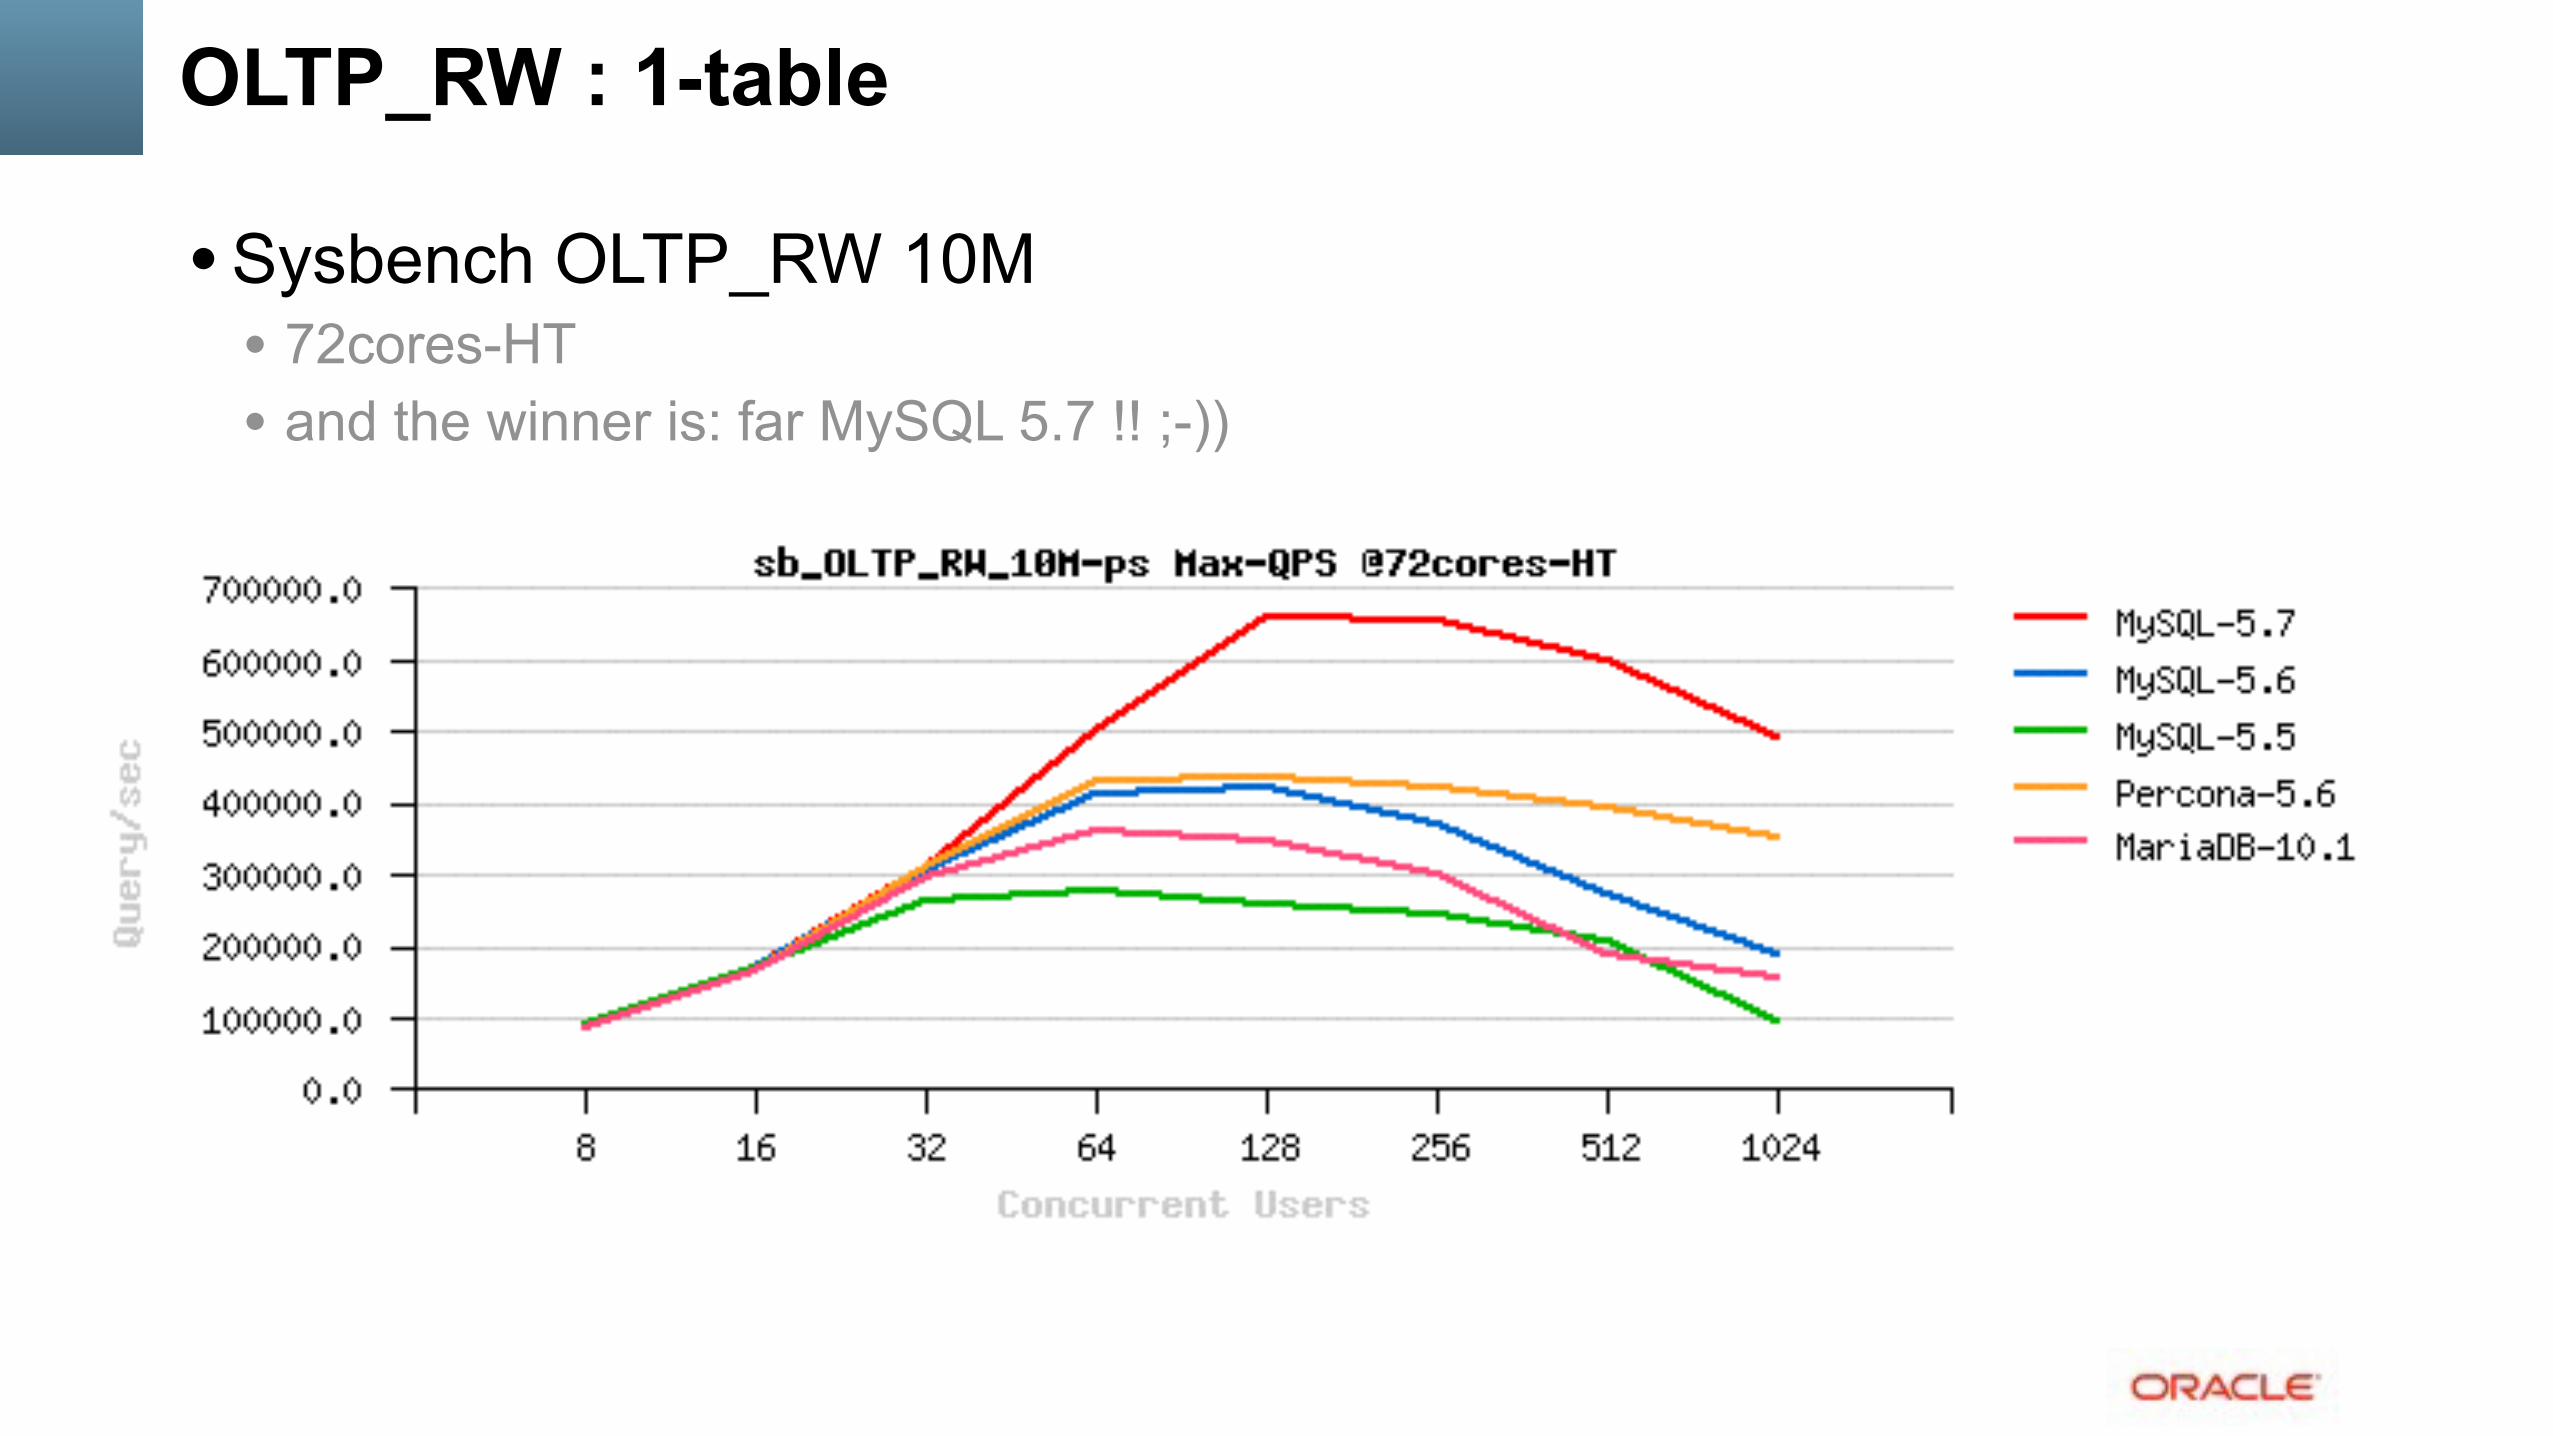
OLTP_RW : 1-table
• Sysbench OLTP_RW 10M • 72cores-HT • and the winner is: far MySQL 5.7 !! ;-))
RW Scalability Limits and Problems
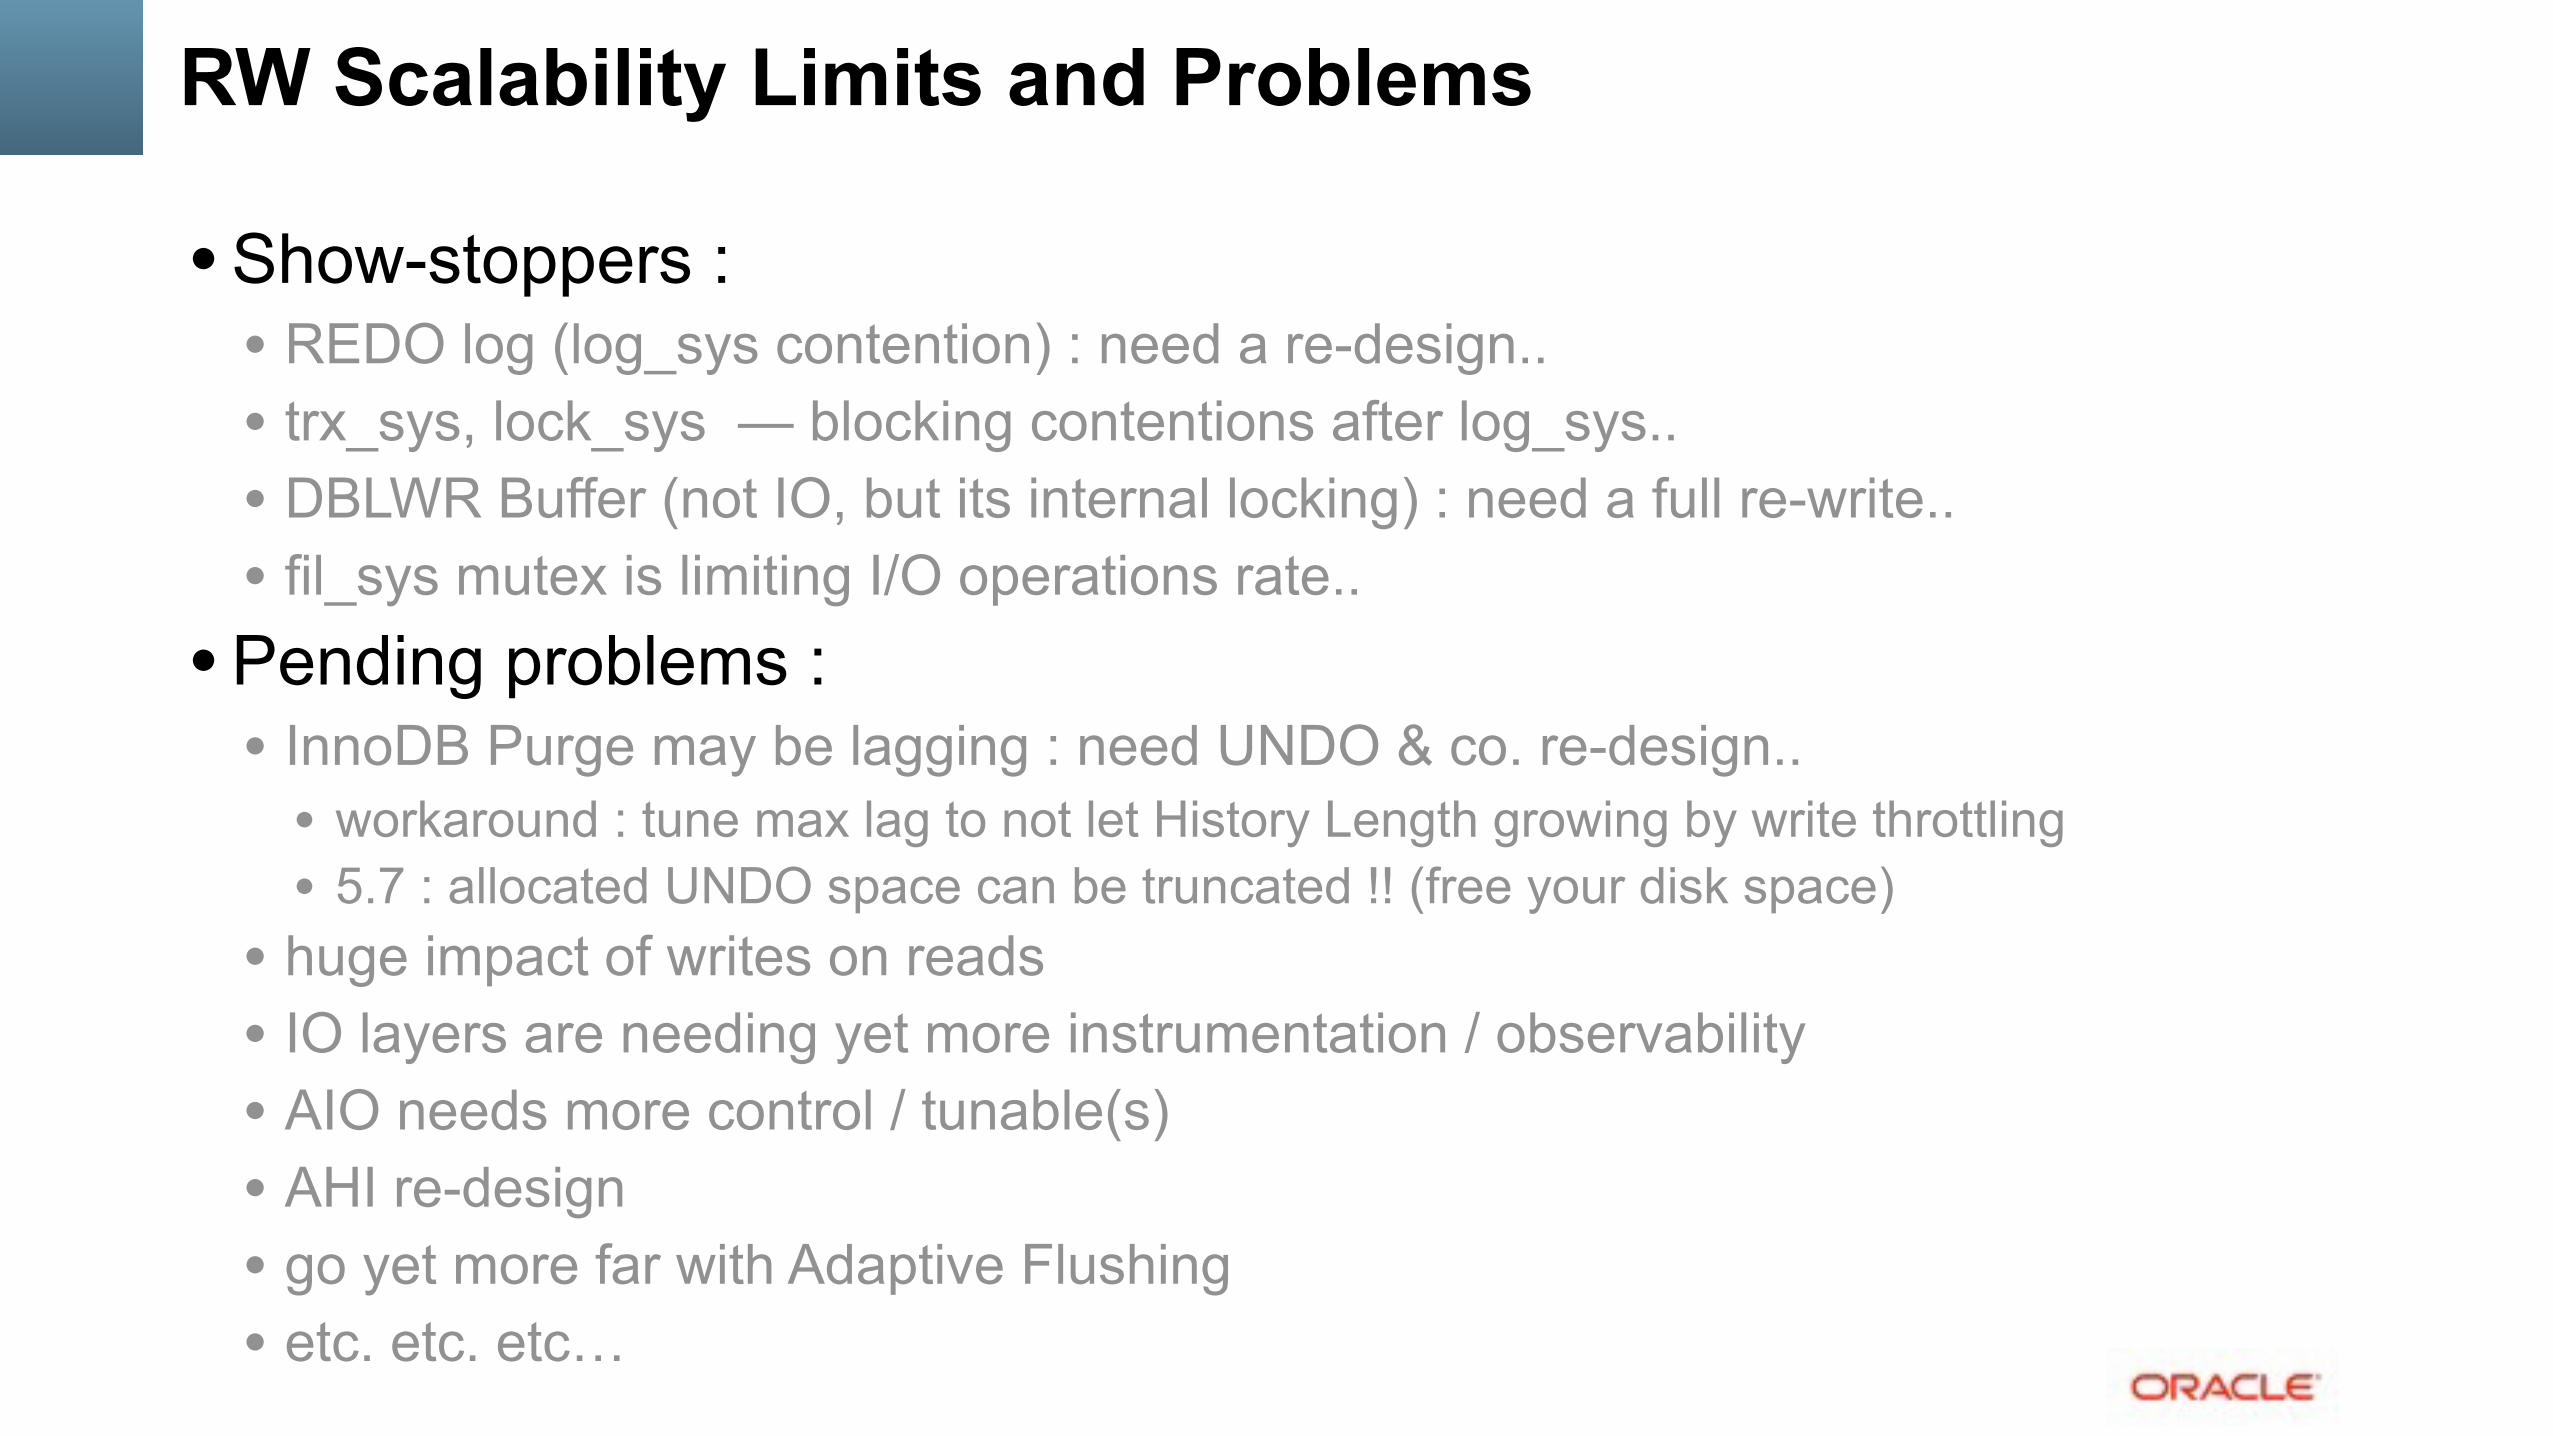
• Show-stoppers : • REDO log (log_sys contention) : need a re-design.. • trx_sys, lock_sys — blocking contentions after log_sys.. • DBLWR Buffer (not IO, but its internal locking) : need a full re-write.. • fil_sys mutex is limiting I/O operations rate..
• Pending problems : • InnoDB Purge may be lagging : need UNDO & co. re-design..
• workaround : tune max lag to not let History Length growing by write throttling • 5.7 : allocated UNDO space can be truncated !! (free your disk space)
• huge impact of writes on reads • IO layers are needing yet more instrumentation / observability • AIO needs more control / tunable(s) • AHI re-design • go yet more far with Adaptive Flushing • etc. etc. etc…

InnoDB Compression
• Old compression : • compressing / uncompressing too often in RAM (CPU time) • the code maintenance becomes a true headache.. • compressed and uncompressed page images are often living in memory much longer than
expected (so, using even more memory than “normal” pages)..
• New “punch holes” compression : • doing it inn better way (compression is going on the IO level only) • so, same or better compression • but way better performance !! ;-) • works really well on Fusion-io NVMFS • seems to work well on EXT4 • XFS seems to be buggy on punch holes support
• Side note : native FS compression comes in the game too

INSERT Performance
• B-Tree impact + InnoDB data compactness.. • over a time of INSERTS, B-Tree is growing & growing.. • at some moment it’ll be out of memory.. • this will involve IO re-reads (mostly IO RR !!) • which will slowdown an overall performance..
• Workaround(s) • size a bigger memory for InnoDB Buffer Pool (BP) • use partitions :
• this will keep an overall BTree(s) smaller • once you filled up a partition and switching INSERTs to the next one, the previous partition index
data are no more required during INSERT, and BP will cache index pages mostly from the active partition..
• MySQL 5.8 : stay tuned ;-)
UPDATE Performance
• Low load : slower than in MySQL 5.6 • pure overhead in many functions due code changes..
• Higher load : much better than in MySQL 5.6 • so, have to manage to do more and more stuff in parallel !! • and this is a general tendency…

Test Case: Tuning UPDATE Performance
• Test conditions : • Workload : Sysbench UPDATE • CPU config : 12cores-HT • IO subsystem : EXT4 on SSD • Users : 8, 16, 32 .. 256

Test Case: Tuning UPDATE Performance (2)
• Tuning : • starting with REDO size=3GB, io capacity max=3000 • Performance: looks poor..
8 users, 16.. 256 users..

Test Case: Tuning UPDATE Performance (3)
• Tuning : • moving to REDO size=8GB.. • Performance: looks better, but still poor on a higher load..

Test Case: Tuning UPDATE Performance (4)
• Tuning : • moving to REDO size=12GB.. • Performance: looks good, but Checkpoint Age continues to grow..
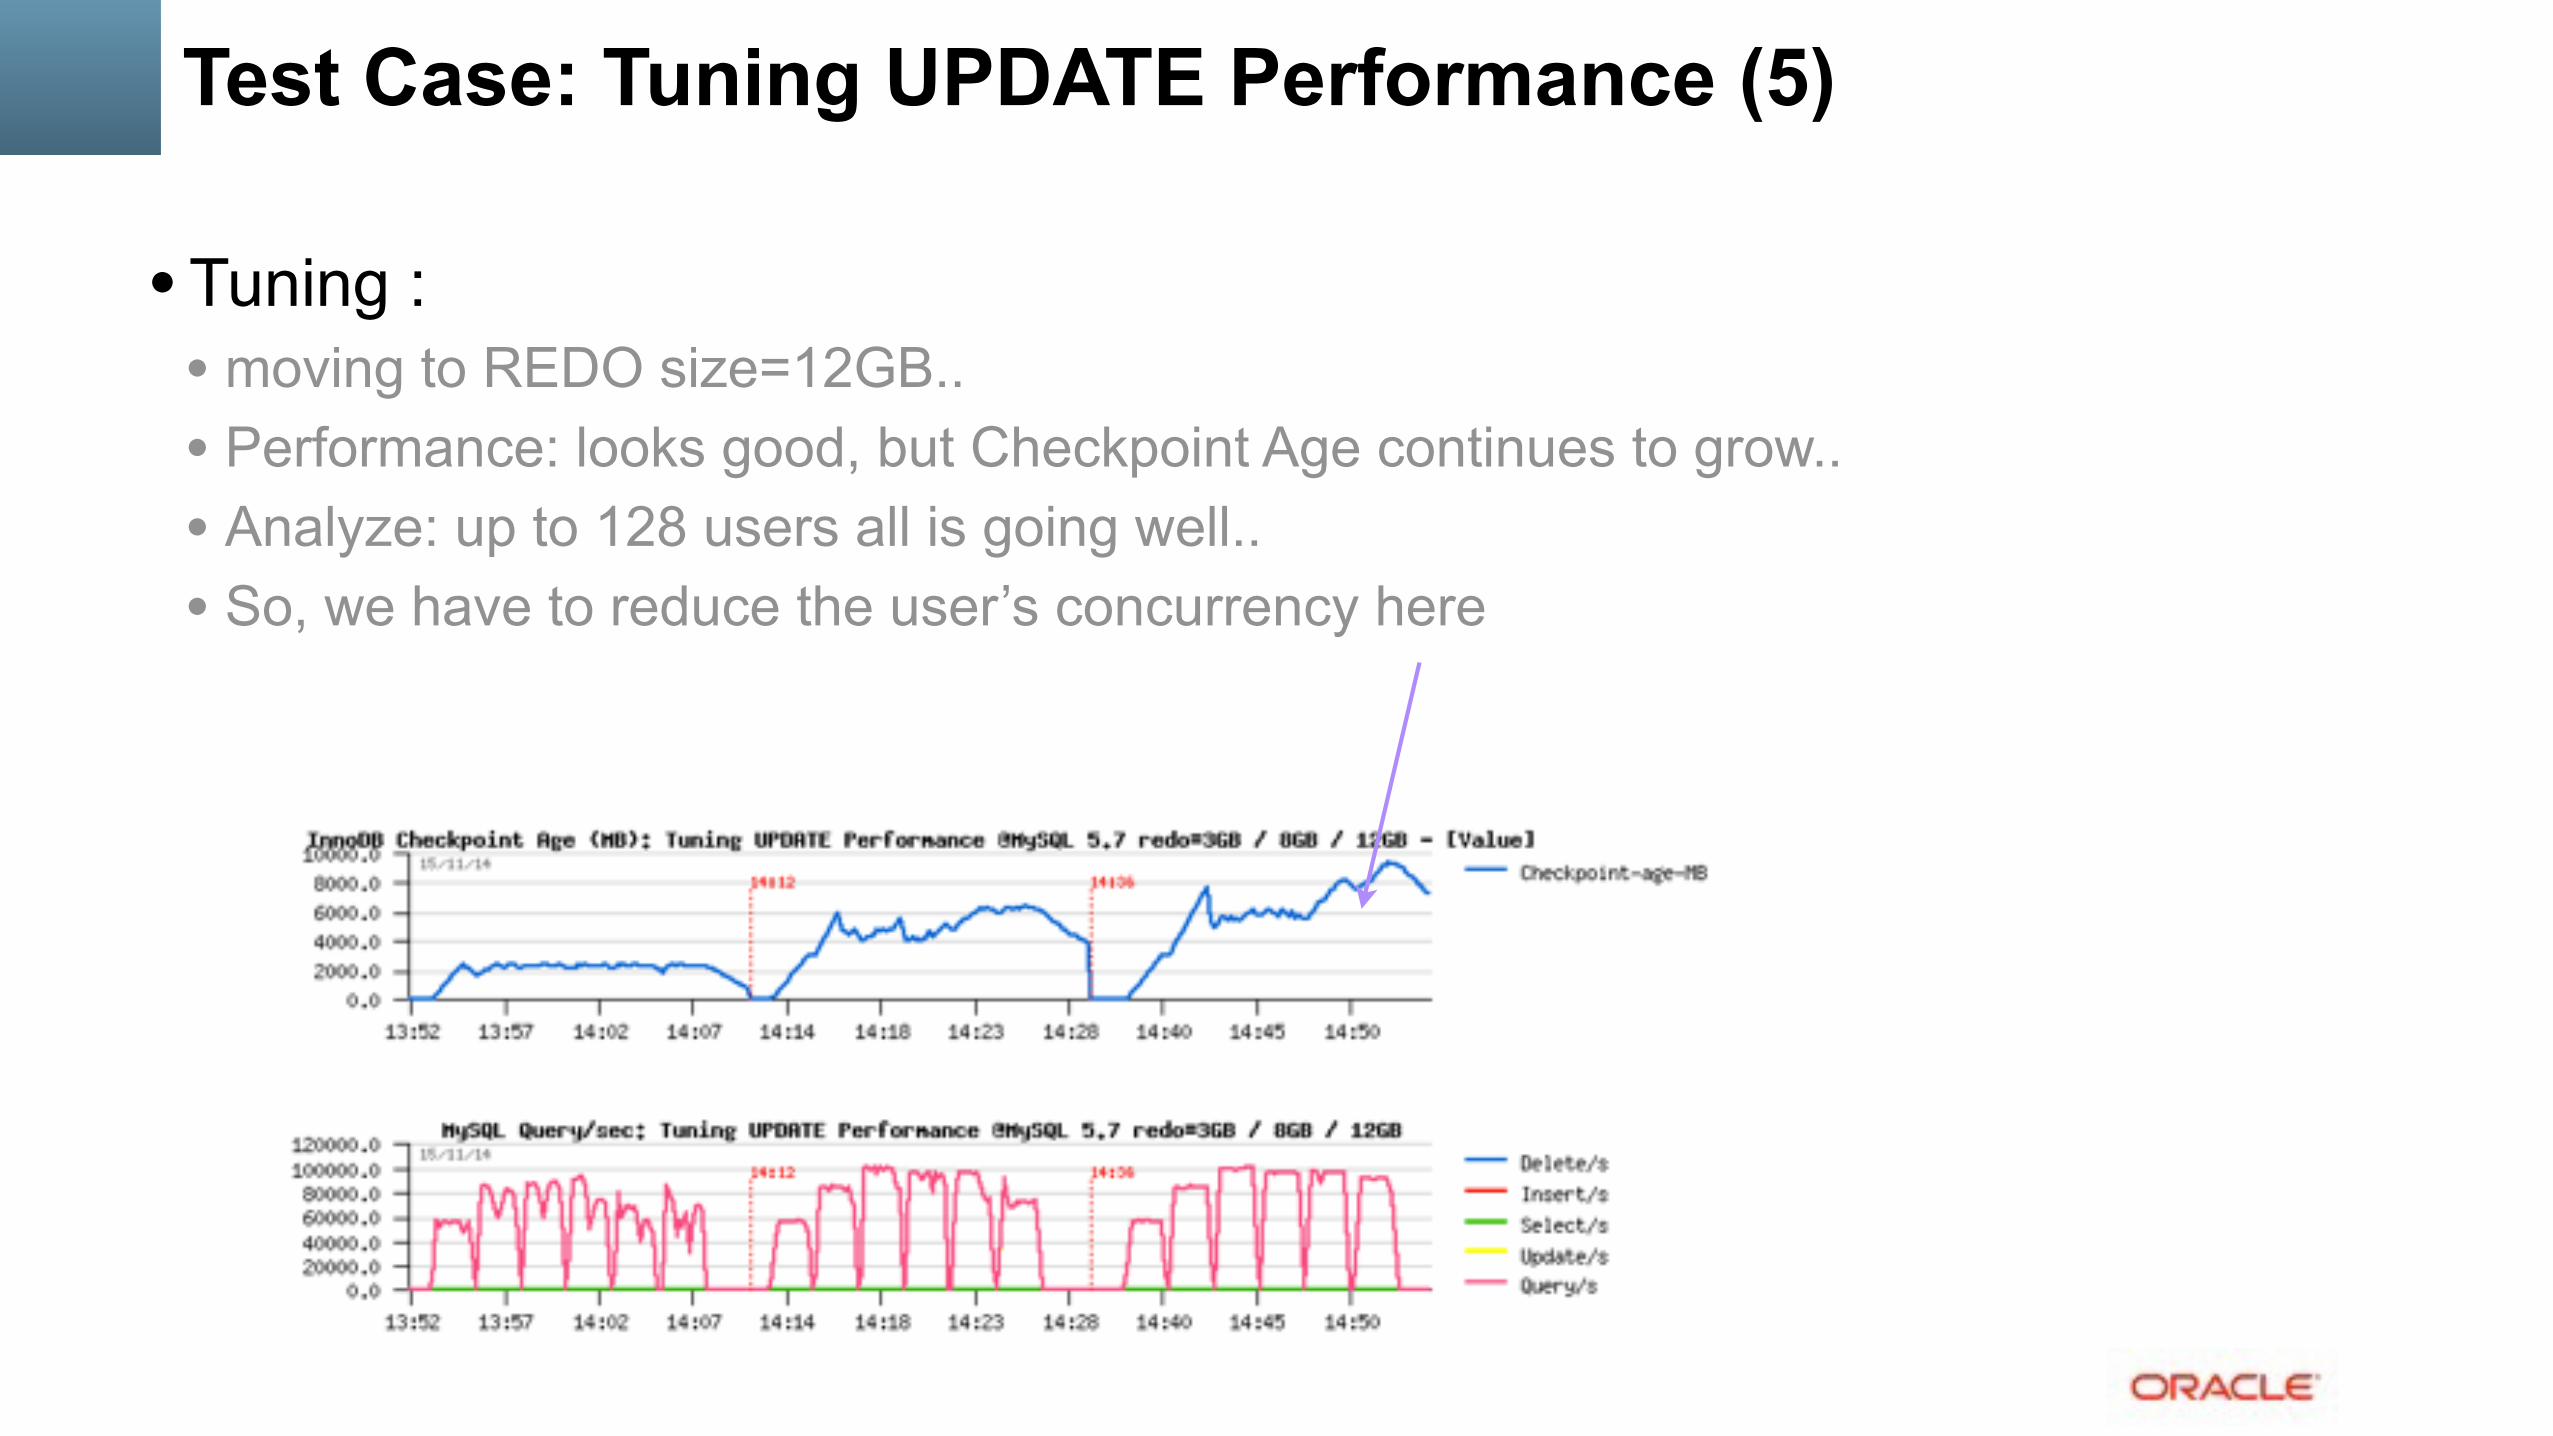
Test Case: Tuning UPDATE Performance (5)
• Tuning : • moving to REDO size=12GB.. • Performance: looks good, but Checkpoint Age continues to grow.. • Analyze: up to 128 users all is going well.. • So, we have to reduce the user’s concurrency here
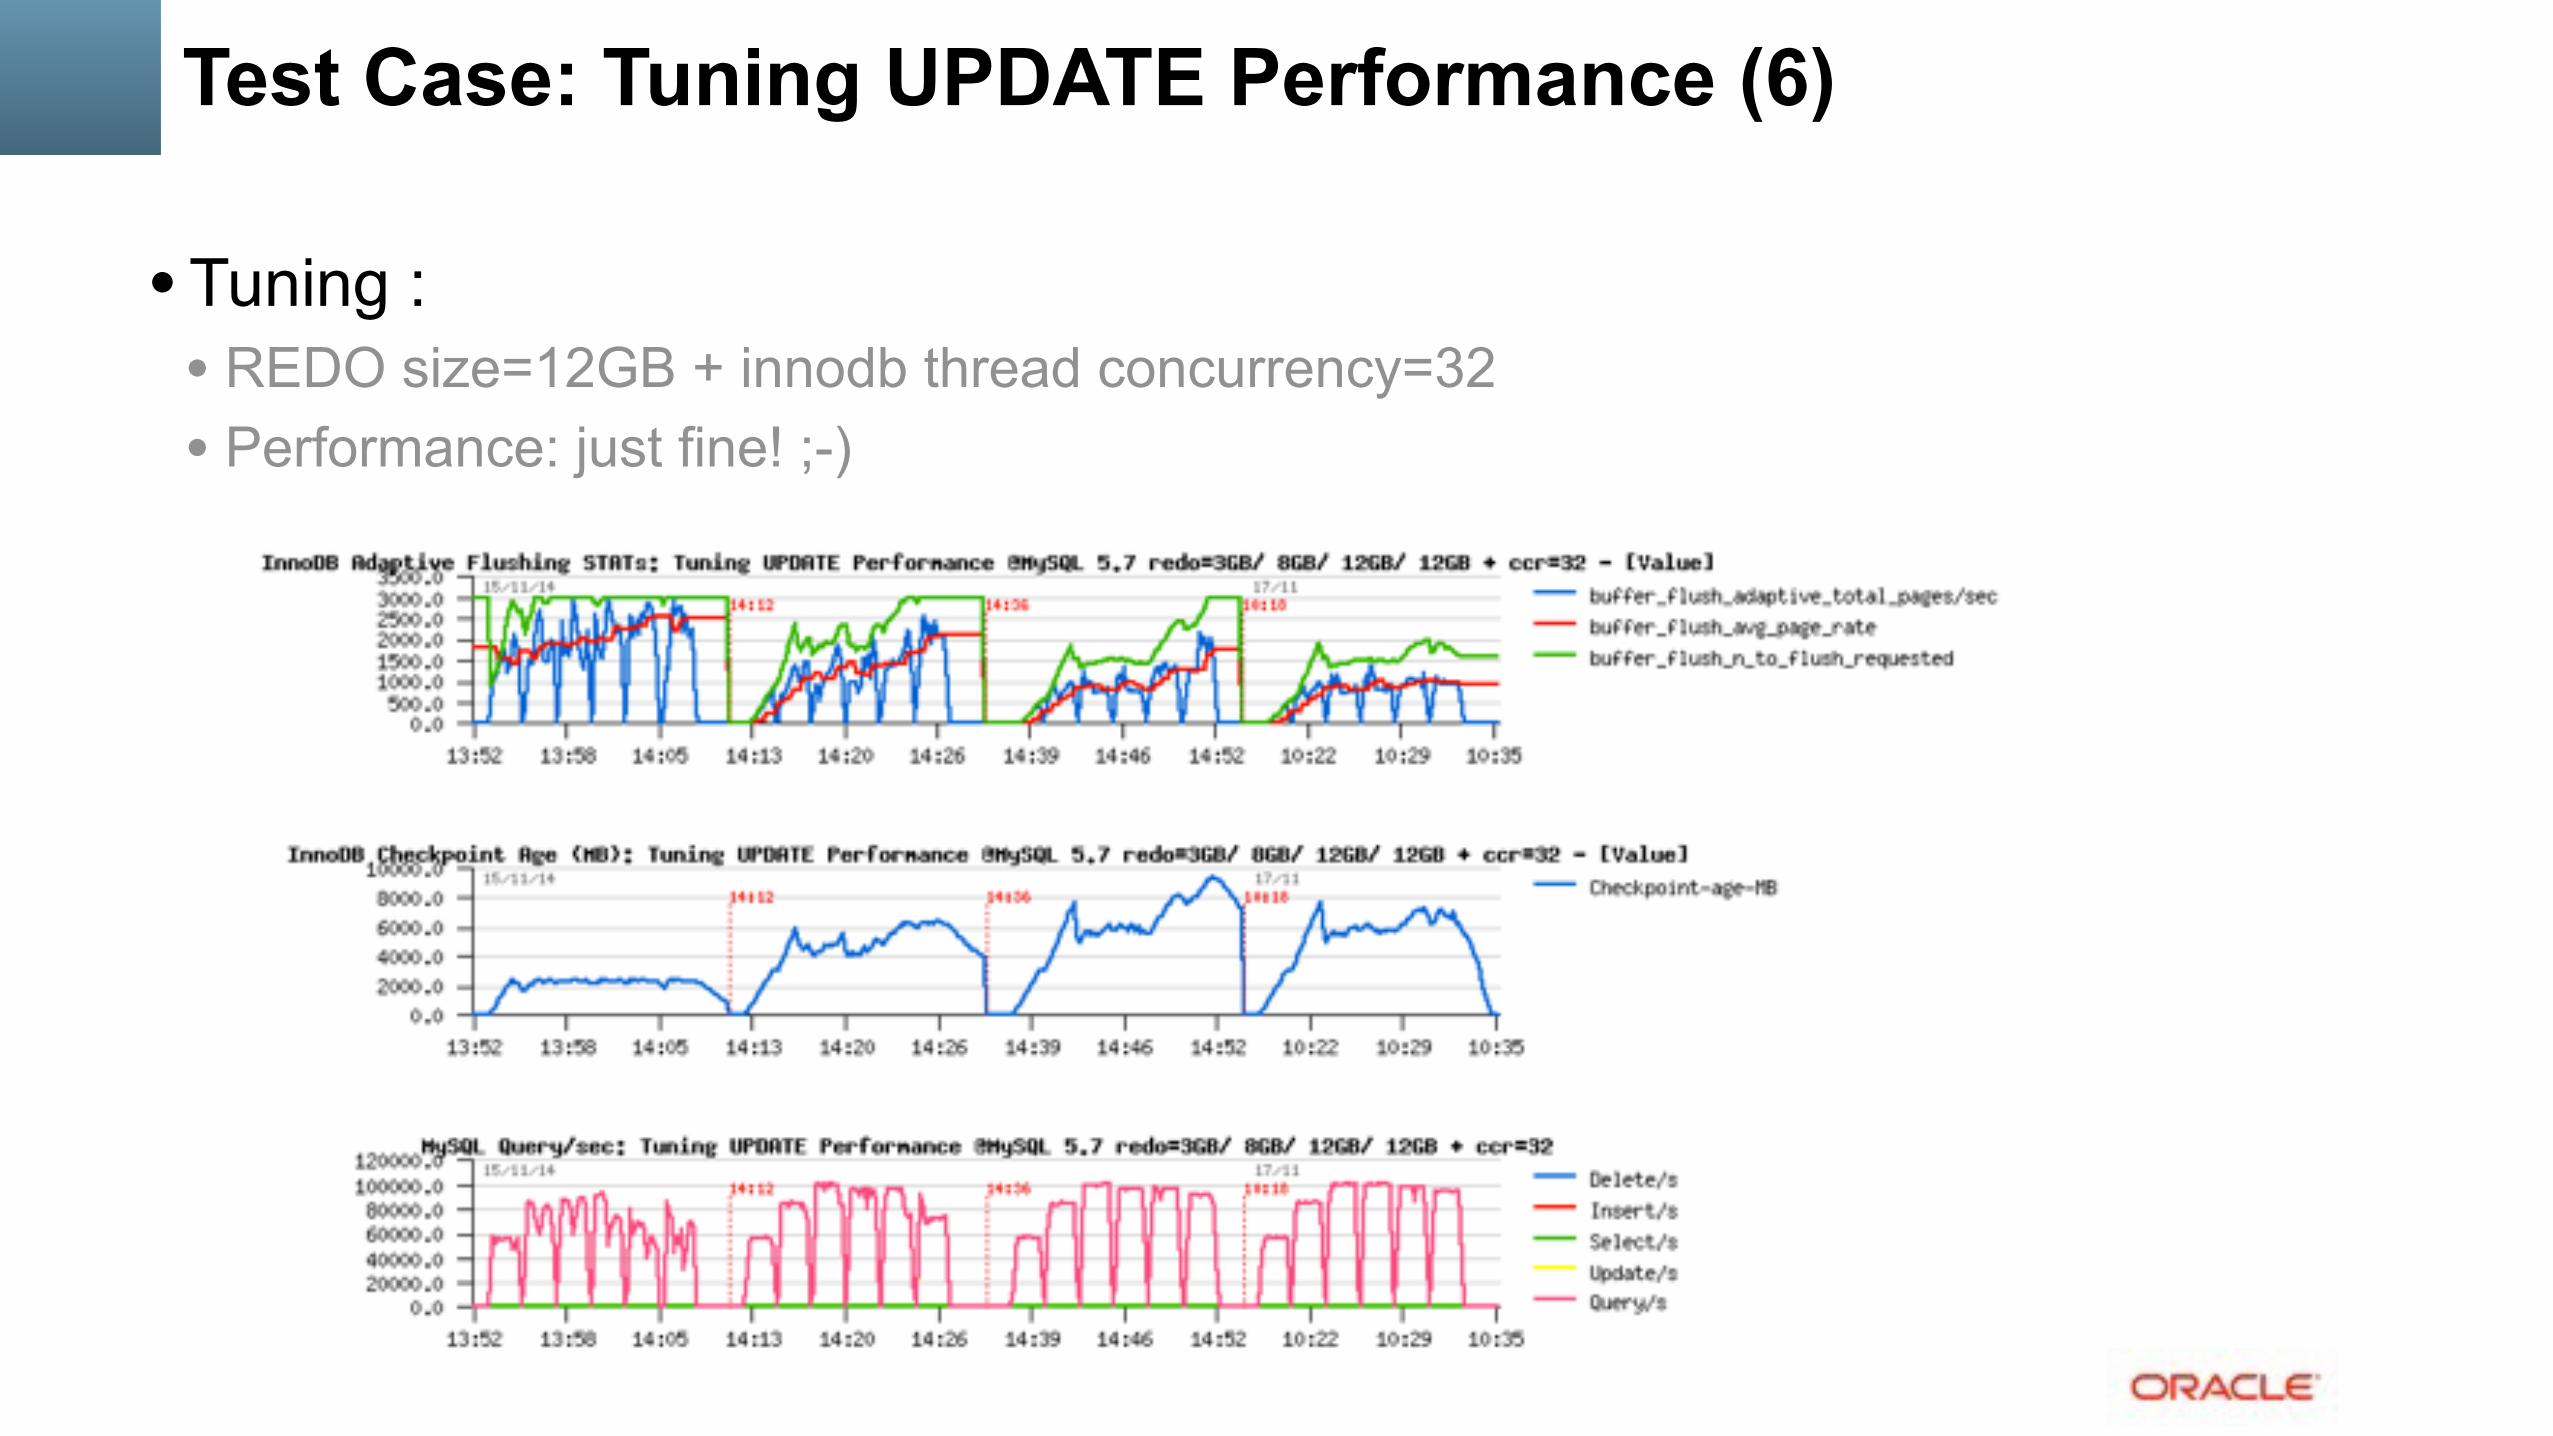
Test Case: Tuning UPDATE Performance (6)
• Tuning : • REDO size=12GB + innodb thread concurrency=32 • Performance: just fine! ;-)

RW IO-bound
• Still data In-Memory, but much bigger volume : • more pages to flush for the same TPS rate
• Data bigger or much bigger than Memory / cache / BP : • the amount of free pages becomes short very quickly.. • and instead of mostly IO writes only you’re starting to have IO reads too • these reads usually mostly random reads • if your storage is slow - reads will simply kill your TPS ;-) • if your storage can follow - once you’re hitting fil_sys mutex you’re done • as well LRU flushing may become very heavy..
• NOTE: • on Linux : using AIO + O_DIRECT seems to be the most optimal for RW IO-bound • but always check yourself ;-)

RW IO-bound “Out-of-Memory”
• The “entry” limit here is storage performance • as you’ll have a lot of IO reads..
• Once storage is no more an issue : • you may hit internal contentions (ex. InnoDB file_sys mutex) • or other engine design limitations.. • sometimes a more optimal config settings may help.. • but sometimes not ;-)
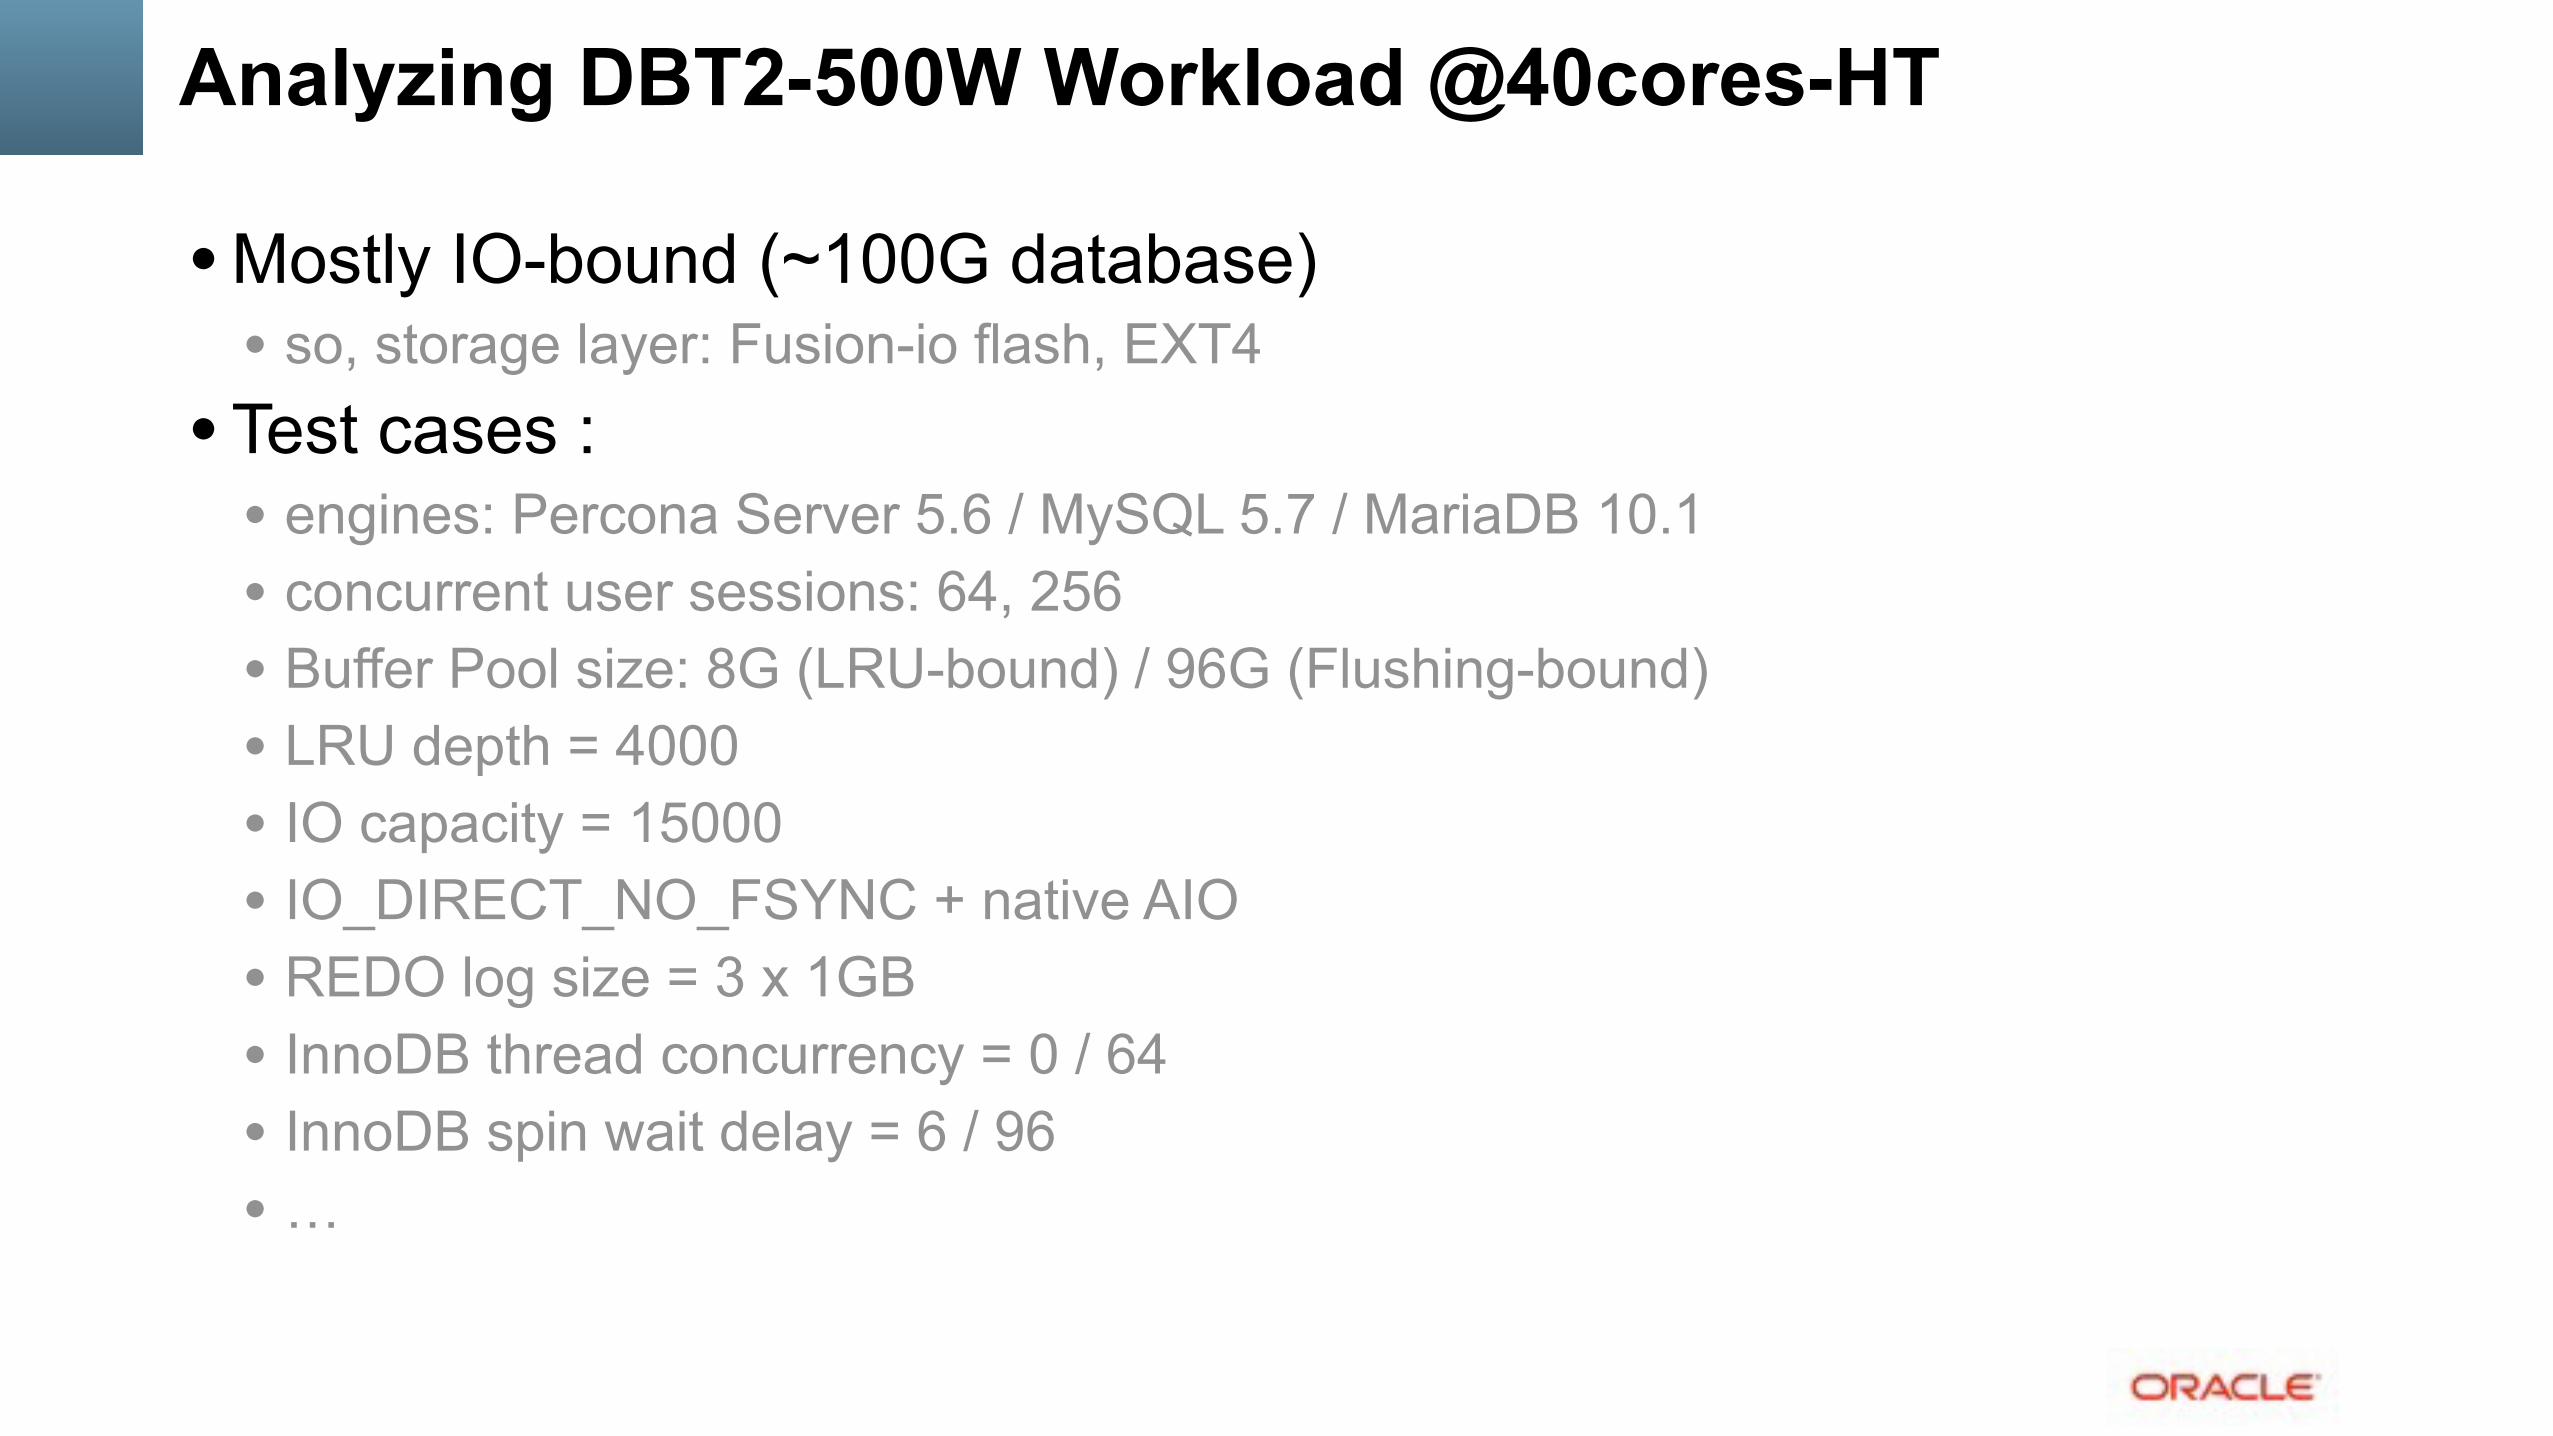
Analyzing DBT2-500W Workload @40cores-HT
• Mostly IO-bound (~100G database) • so, storage layer: Fusion-io flash, EXT4
• Test cases : • engines: Percona Server 5.6 / MySQL 5.7 / MariaDB 10.1 • concurrent user sessions: 64, 256 • Buffer Pool size: 8G (LRU-bound) / 96G (Flushing-bound) • LRU depth = 4000 • IO capacity = 15000 • IO_DIRECT_NO_FSYNC + native AIO • REDO log size = 3 x 1GB • InnoDB thread concurrency = 0 / 64 • InnoDB spin wait delay = 6 / 96 • …

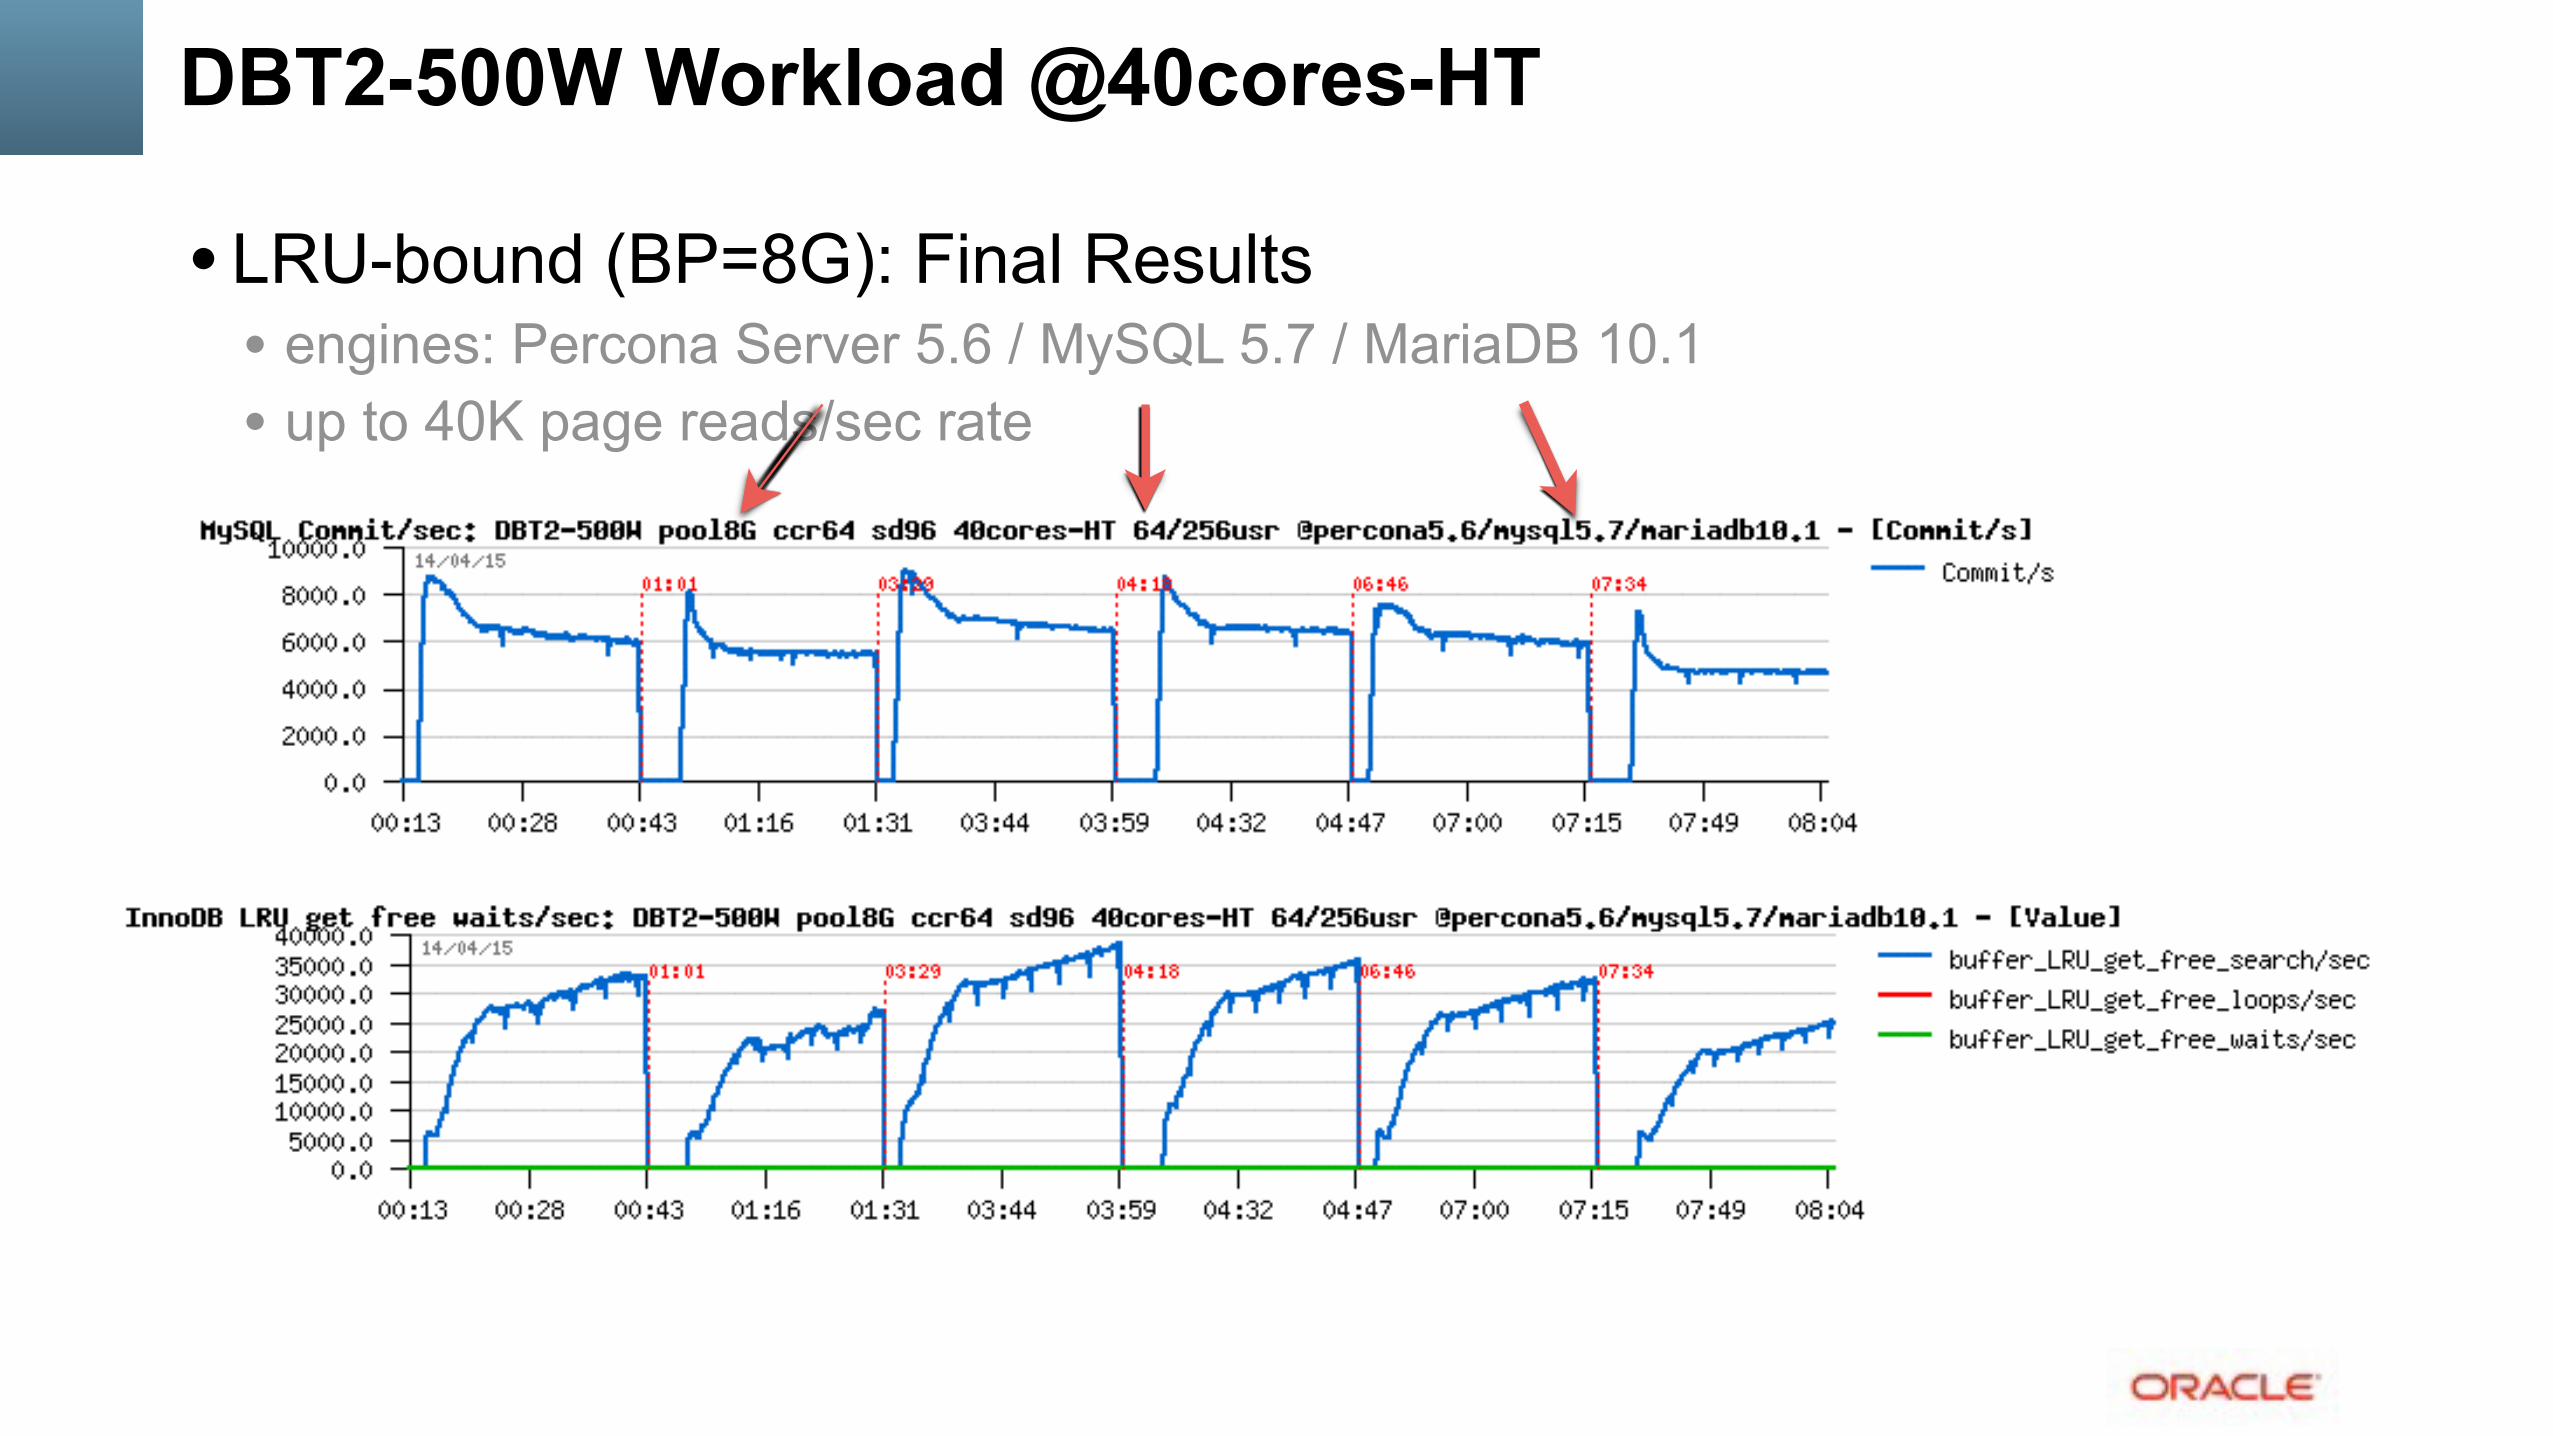
DBT2-500W Workload @40cores-HT
• LRU-bound (BP=8G): Final Results • engines: Percona Server 5.6 / MySQL 5.7 / MariaDB 10.1 • TPS: Commit/sec

DBT2-500W Workload @40cores-HT
• LRU-bound (BP=8G): Final Results • engines: Percona Server 5.6 / MySQL 5.7 / MariaDB 10.1 • QPS!

DBT2-500W Workload @40cores-HT
• LRU-bound (BP=8G): Final Results • engines: Percona Server 5.6 / MySQL 5.7 / MariaDB 10.1 • Lock waits: index lock impact…
DBT2-500W Workload @40cores-HT
• LRU-bound (BP=8G): Final Results • engines: Percona Server 5.6 / MySQL 5.7 / MariaDB 10.1 • up to 40K page reads/sec rate

DBT2-500W Workload @40cores-HT
• LRU-bound (BP=8G): Final Results • engines: Percona Server 5.6 / MySQL 5.7 / MariaDB 10.1 • 900MB/sec I/O traffic
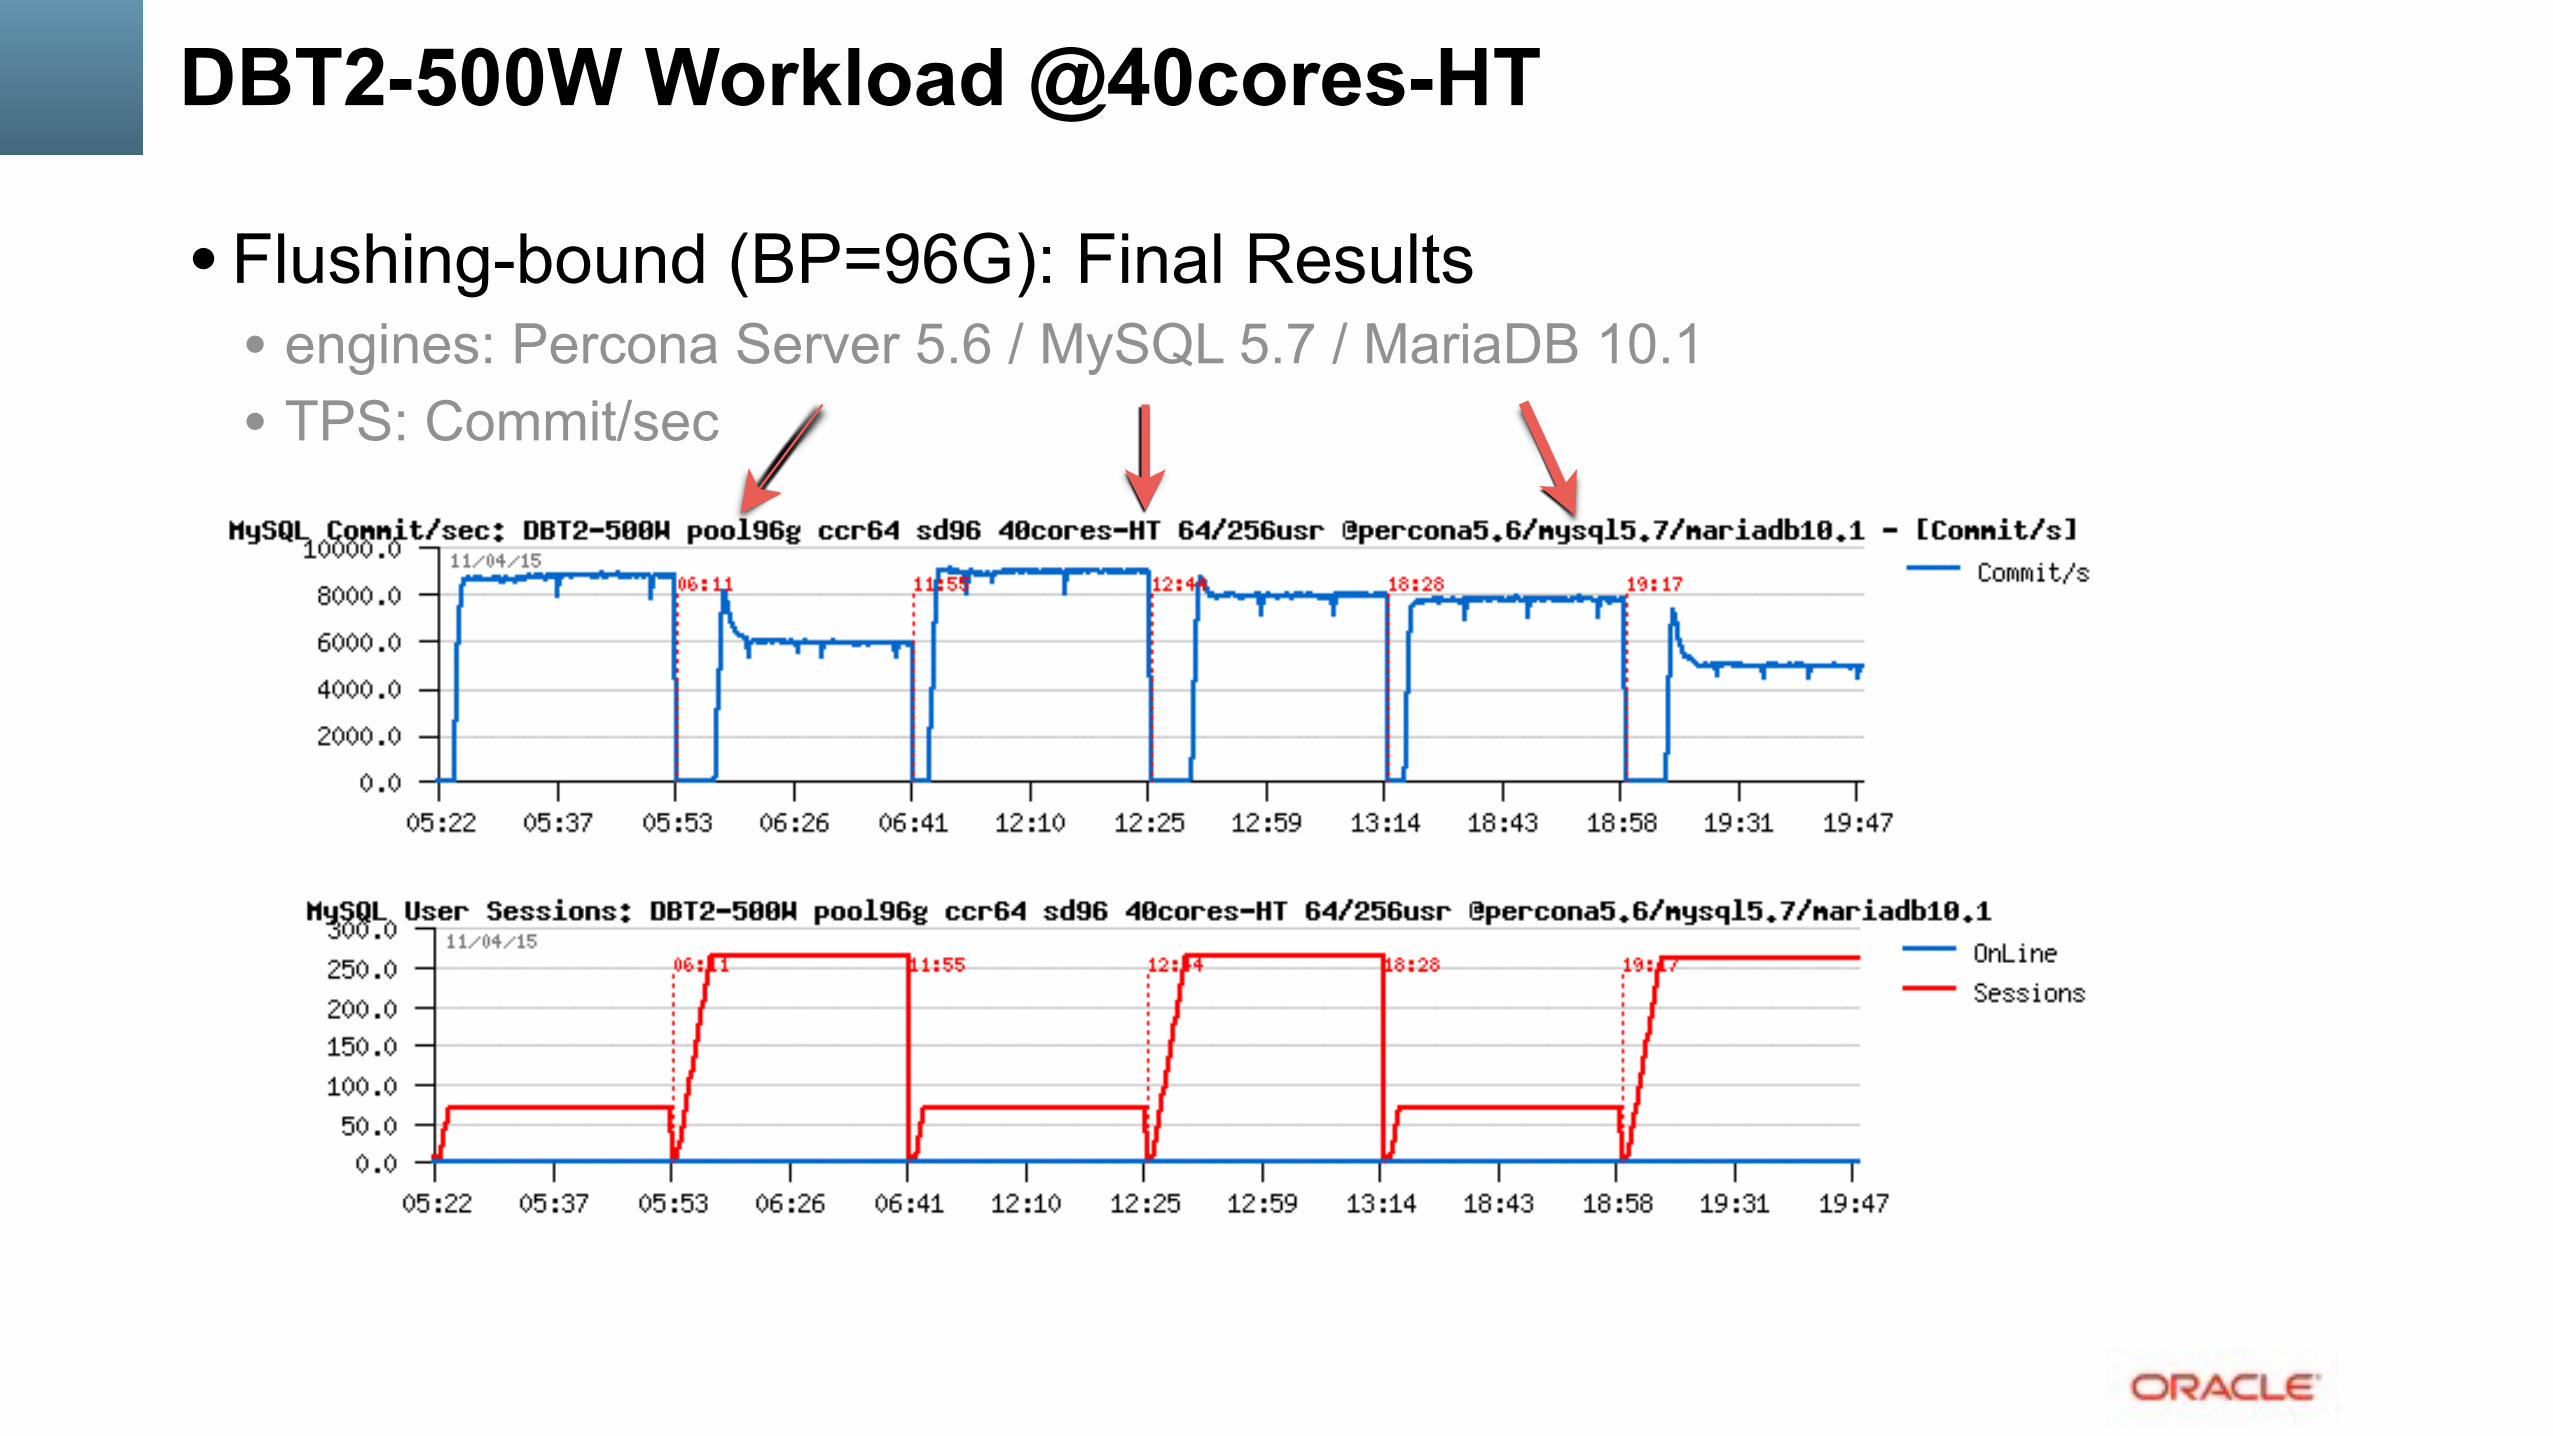
DBT2-500W Workload @40cores-HT
• Flushing-bound (BP=96G): Final Results • engines: Percona Server 5.6 / MySQL 5.7 / MariaDB 10.1 • TPS: Commit/sec

DBT2-500W Workload @40cores-HT
• Flushing-bound (BP=96G): Final Results • engines: Percona Server 5.6 / MySQL 5.7 / MariaDB 10.1 • QPS!
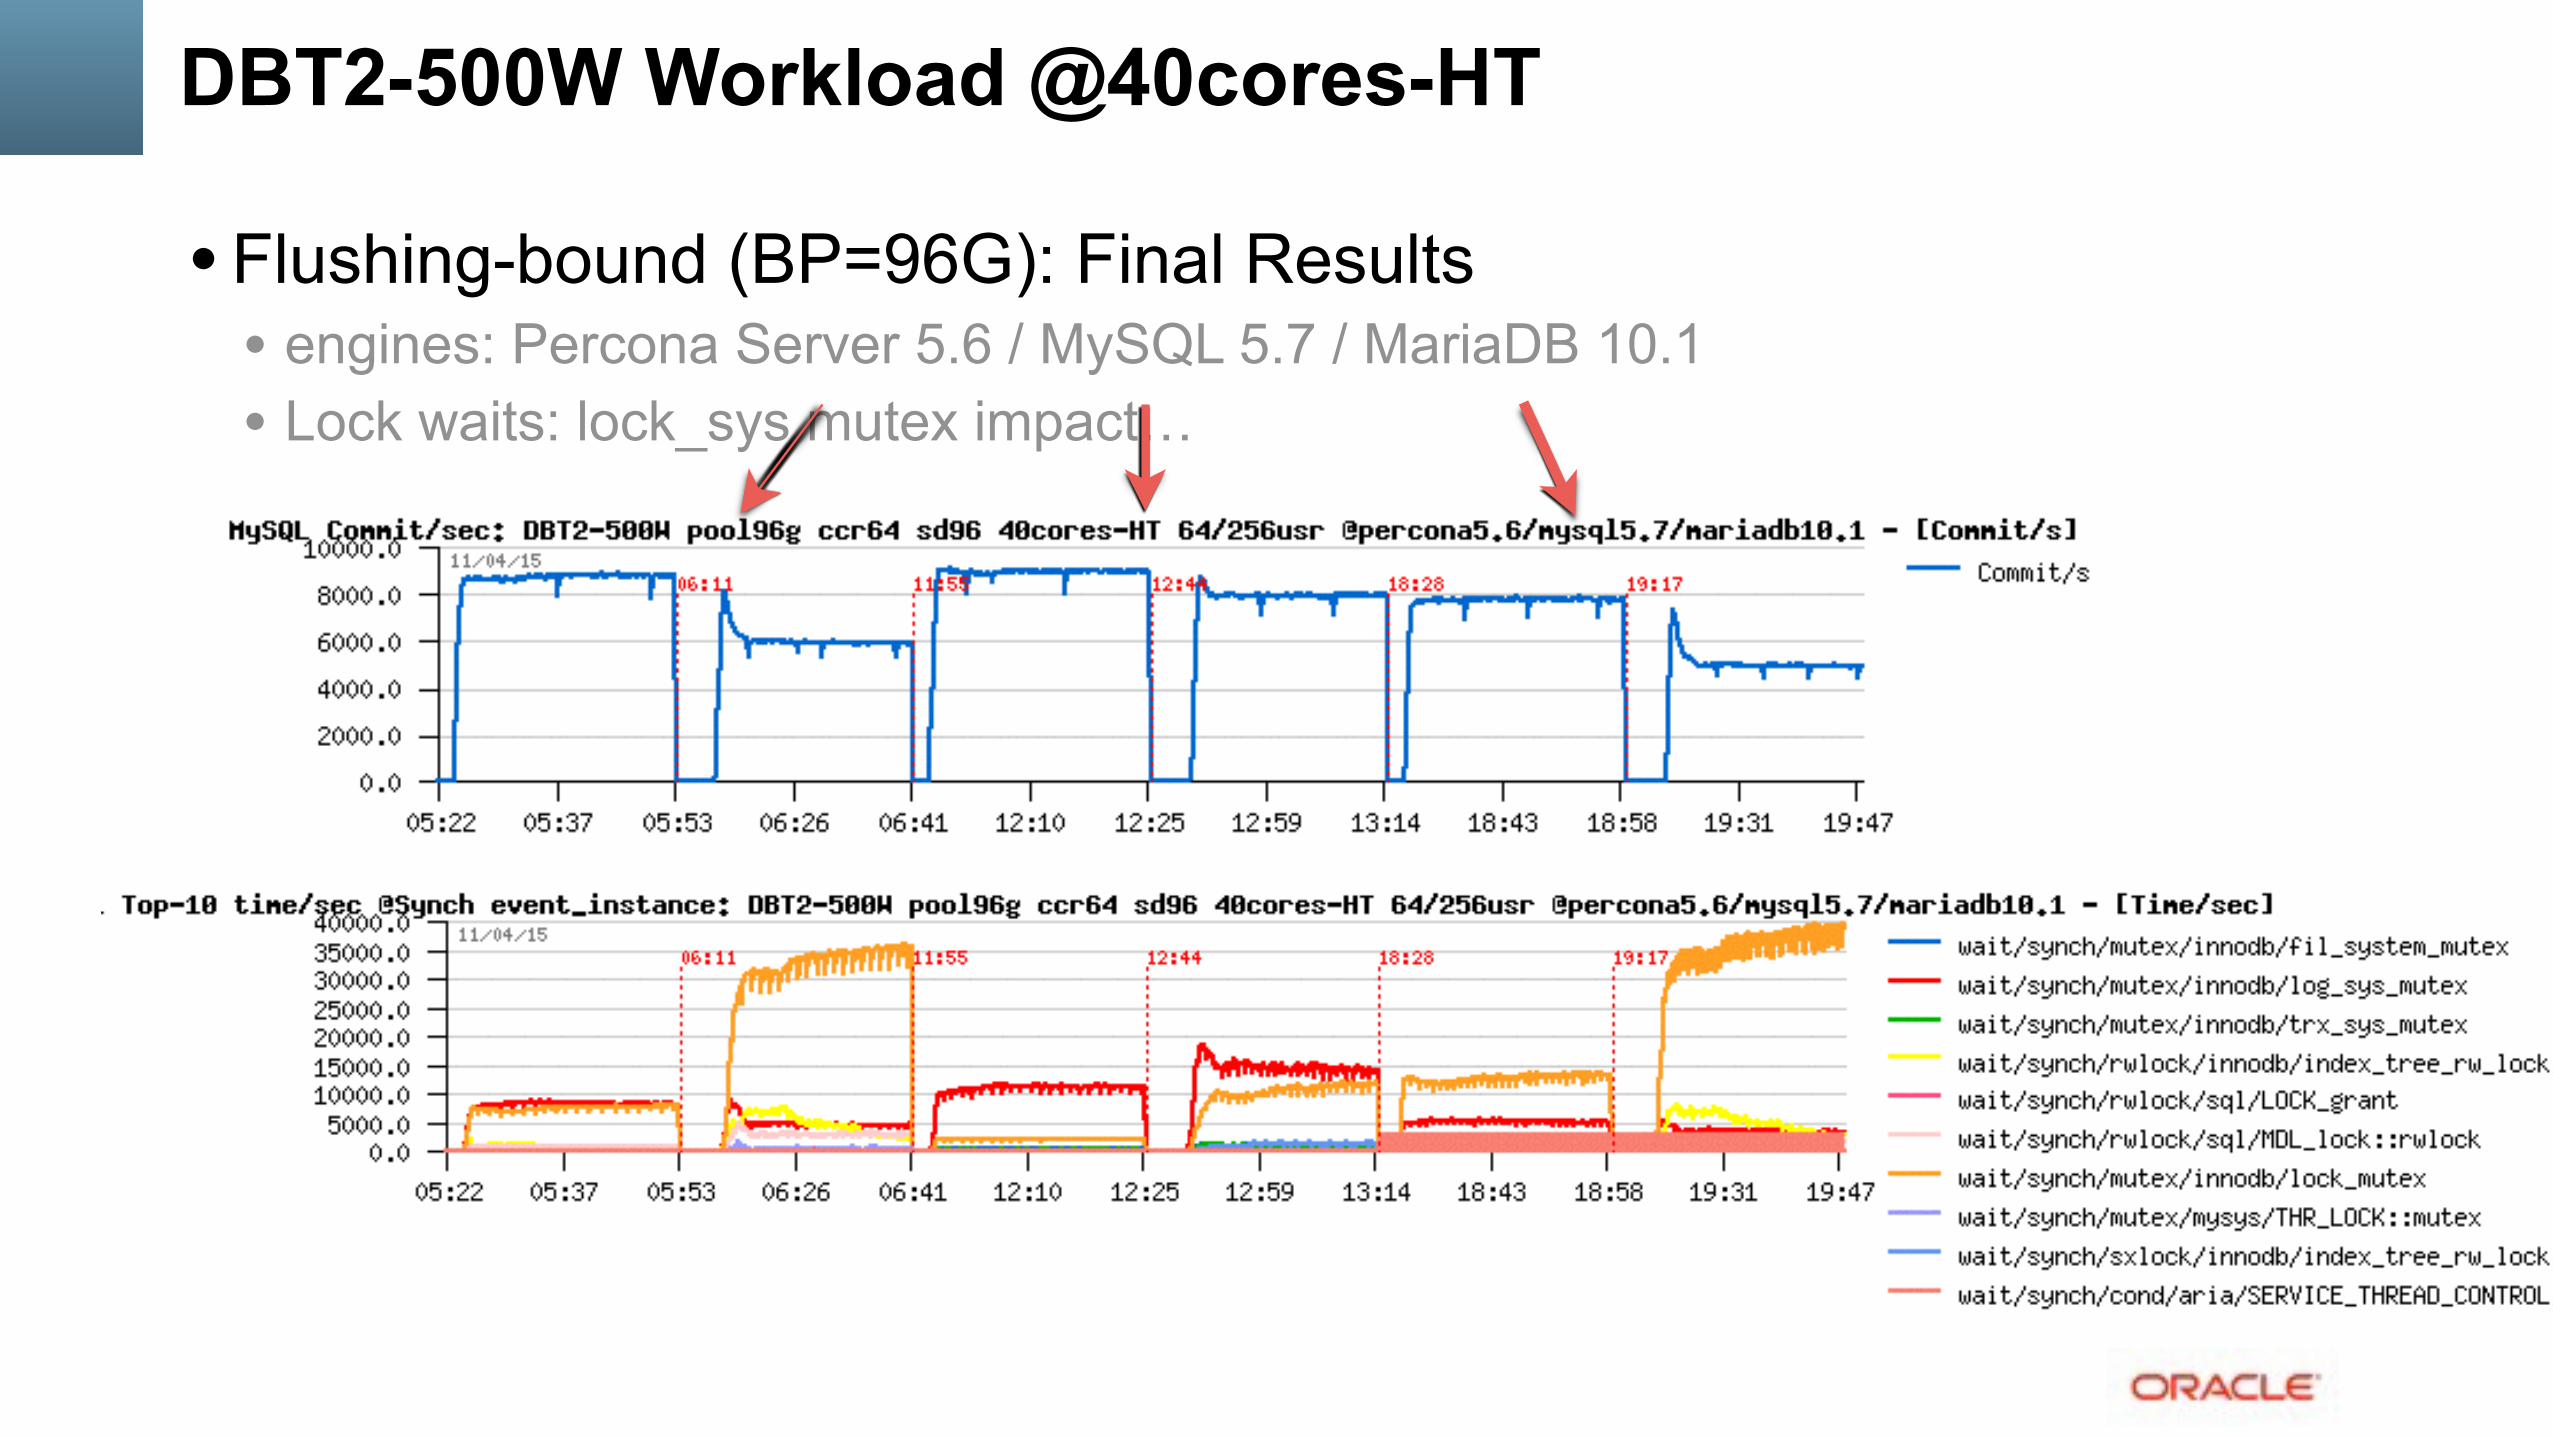
DBT2-500W Workload @40cores-HT
• Flushing-bound (BP=96G): Final Results • engines: Percona Server 5.6 / MySQL 5.7 / MariaDB 10.1 • Lock waits: lock_sys mutex impact…

The Main MySQL Performance Best Practice #1 is... ???..
!
USE YOUR BRAIN !!!... ;-)
THE MAIN SLIDE! ;-))

So, work continues.. stay tuned... ;-)
Don’t miss MySQL Community Reception tonight !!!

Few words about dim_STAT (if you’re asking ;-))
• All graphs are built with dim_STAT (http://dimitrik.free.fr) • All System load stats (CPU, I/O, Network, RAM, Processes,...) • Manly for Solaris & Linux, but any other UNIX too :-) • Add-Ons for Oracle, MySQL, PostgreSQL, Java, etc. • MySQL Add-Ons:
• mysqlSTAT : all available data from “show status” • mysqlLOAD : compact data, multi-host monitoring oriented • mysqlWAITS : top wait events from Performance SCHEMA • InnodbSTAT : most important data from “show innodb status” • innodbMUTEX : monitoring InnoDB mutex waits • innodbMETRICS : all counters from the METRICS table
• And any other you want to add! :-)

THANK YOU !!!
• All details about presented materials you may find on:
• http://dimitrik.free.fr - dim_STAT, dbSTRESS, Benchmark Reports, etc.
• http://dimitrik.free.fr/blog - Articles about MySQL Performance, etc.
Related Documents