REPORT MyPyramid Food Intake Pattern Modeling for the Dietary Guidelines Advisory Committee Patricia Britten, PhD 1 ; Joan Lyon, MS, RD 1 ; Connie M. Weaver, PhD 2 ; Penny M. Kris-Etherton, PhD 3 ; Theresa A. Nicklas, DrPH 4 ; Jennifer A. Weber, MPH, RD 5 ; Carole A. Davis, MS, RD 1 ABSTRACT Modeling analyses using the MyPyramid intake patterns were conducted in collaboration with the 2005 Dietary Guidelines Advisory Committee in response to their research questions and to determine likely effects of possible recommendations on overall dietary adequacy. Scenarios modeled included the feasibility of using the food patterns for lacto-ovo-vegetarian diets, of varying fat levels within the patterns, and of increasing dietary flexibility through food group substitutions. Food pattern modeling was a useful tool to identify possible impacts on diet quality of potential Dietary Guidelines recommendations. Modeling analyses can help researchers explore the overall effect of specific dietary recommendations on intake patterns. Key Words: MyPyramid, Dietary Guidelines for Americans, food intake patterns, dietary guidance ( J Nutr Educ Behav. 2006;38:S143-S152) INTRODUCTION In January 2005, the U.S. Departments of Agriculture (USDA) and Health and Human Services (HHS) jointly released the Dietary Guidelines for Americans (Dietary Guidelines), which form the basis of federal food and nu- trition policy. Shortly thereafter, USDA released the My- Pyramid Food Guidance System (MyPyramid). MyPyramid is a system of food patterns and interactive nutrition edu- cation tools and materials designed to help Americans implement the Dietary Guidelines. MyPyramid’s food in- take patterns were developed through an iterative process of modifying suggested intake levels from each food group to meet established nutritional goals for nutrient adequacy and moderation. The process has been described in detail in accompanying articles. 1,2 The Dietary Guidelines and MyPyramid development processes occurred simultaneously, with collaboration among the Dietary Guidelines Advisory Committee (DGAC) as a whole, individual subcommittees, and federal staff from USDA and HHS. Several collaborative sessions took place during the DGAC’s 5 formal meetings, which were open to the public. Table 1 shows a brief side-by-side timeline of the 2 development processes and key points of collaboration. The 2005 DGAC was charged to critically review sci- entific evidence relating diet and physical activity to health across the lifespan (excluding infancy) and make recom- mendations to the secretaries of USDA and HHS concern- ing the 2005 edition of the Dietary Guidelines for Americans. The DGAC’s evaluation extended beyond the dietary con- cerns of “strictly healthy persons” because increasing num- bers of Americans have chronic health problems such as obesity, high blood pressure, and abnormal blood lipid values. 3 To accomplish its mission, the DGAC developed and prioritized a large number of research questions and formed subcommittees to tackle key topic areas such as carbohydrates, energy, fats, fluid and electrolytes, ethanol, food safety, macronutrients, and nutrient adequacy. The subcommittees conducted extensive, systematic literature searches, prepared summary tables, analyzed national data sets, modeled food patterns, developed scientific rationales, and drafted conclusive statements. Their body of work was presented to the full DGAC for review and discussion. 3,4,5 Following extensive deliberations on each key topic area, the DGAC developed a report, which presented its findings as an integrated set of conclusions and dietary guidance recommendations for the general American pub- lic. 3 The DGAC report served as the basis for the 2005 1 USDA Center for Nutrition Policy and Promotion, Alexandria, VA 2 Purdue University, Department of Foods and Nutrition, West Lafayette, IN 3 The Pennsylvania State University, Department of Nutritional Sciences, University Park, PA 4 Children’s Nutrition Research Center, Department of Pediatrics, Baylor College of Medicine, Houston, TX 5 American Dietetic Association, formerly with HHS Office of Disease Prevention and Health Promotion, Rockville, MD Address for correspondence: Patricia Britten, PhD, USDA Center for Nutrition Policy and Promotion, 3101 Park Center Drive, Room 1034, Alexandria, VA 22302; Phone: (703) 305-7600; Fax: (703) 305-3300; E-mail: Patricia.Britten@cnpp. usda.gov. PUBLISHED BY ELSEVIER INC. ON BEHALF OF THE SOCIETY FOR NUTRITION EDUCATION doi: 10.1016/j.jneb.2006.08.004

Welcome message from author
This document is posted to help you gain knowledge. Please leave a comment to let me know what you think about it! Share it to your friends and learn new things together.
Transcript

R
MD
PPJ
A
I
I(rGtPicitotaa
p
1
2
3
P4
M5
a
APPuPNd
EPORT
yPyramid Food Intake Pattern Modeling for theietary Guidelines Advisory Committee
atricia Britten, PhD1; Joan Lyon, MS, RD1; Connie M. Weaver, PhD2;enny M. Kris-Etherton, PhD3; Theresa A. Nicklas, DrPH4;ennifer A. Weber, MPH, RD5; Carole A. Davis, MS, RD1
BSTRACT
Modeling analyses using the MyPyramid intake patterns were conducted in collaboration withthe 2005 Dietary Guidelines Advisory Committee in response to their research questions and todetermine likely effects of possible recommendations on overall dietary adequacy. Scenarios modeledincluded the feasibility of using the food patterns for lacto-ovo-vegetarian diets, of varying fat levelswithin the patterns, and of increasing dietary flexibility through food group substitutions. Foodpattern modeling was a useful tool to identify possible impacts on diet quality of potential DietaryGuidelines recommendations. Modeling analyses can help researchers explore the overall effect ofspecific dietary recommendations on intake patterns.
Key Words: MyPyramid, Dietary Guidelines for Americans, food intake patterns, dietary guidance
(J Nutr Educ Behav. 2006;38:S143-S152)
a(stwtc
eamiTcbovafcfsssap
afig
NTRODUCTION
n January 2005, the U.S. Departments of AgricultureUSDA) and Health and Human Services (HHS) jointlyeleased the Dietary Guidelines for Americans (Dietaryuidelines), which form the basis of federal food and nu-
rition policy. Shortly thereafter, USDA released the My-yramid Food Guidance System (MyPyramid). MyPyramid
s a system of food patterns and interactive nutrition edu-ation tools and materials designed to help Americansmplement the Dietary Guidelines. MyPyramid’s food in-ake patterns were developed through an iterative processf modifying suggested intake levels from each food groupo meet established nutritional goals for nutrient adequacynd moderation. The process has been described in detail inccompanying articles.1,2
The Dietary Guidelines and MyPyramid developmentrocesses occurred simultaneously, with collaboration
USDA Center for Nutrition Policy and Promotion, Alexandria, VAPurdue University, Department of Foods and Nutrition, West Lafayette, INThe Pennsylvania State University, Department of Nutritional Sciences, Universityark, PAChildren’s Nutrition Research Center, Department of Pediatrics, Baylor College ofedicine, Houston, TX
American Dietetic Association, formerly with HHS Office of Disease Preventionnd Health Promotion, Rockville, MD
ddress for correspondence: Patricia Britten, PhD, USDA Center for Nutritionolicy and Promotion, 3101 Park Center Drive, Room 1034, Alexandria, VA 22302;hone: (703) 305-7600; Fax: (703) 305-3300; E-mail: [email protected] BY ELSEVIER INC. ON BEHALF OF THE SOCIETY FOR
lUTRITION EDUCATION
oi: 10.1016/j.jneb.2006.08.004
mong the Dietary Guidelines Advisory CommitteeDGAC) as a whole, individual subcommittees, and federaltaff from USDA and HHS. Several collaborative sessionsook place during the DGAC’s 5 formal meetings, whichere open to the public. Table 1 shows a brief side-by-side
imeline of the 2 development processes and key points ofollaboration.
The 2005 DGAC was charged to critically review sci-ntific evidence relating diet and physical activity to healthcross the lifespan (excluding infancy) and make recom-endations to the secretaries of USDA and HHS concern-
ng the 2005 edition of the Dietary Guidelines for Americans.he DGAC’s evaluation extended beyond the dietary con-erns of “strictly healthy persons” because increasing num-ers of Americans have chronic health problems such asbesity, high blood pressure, and abnormal blood lipidalues.3 To accomplish its mission, the DGAC developednd prioritized a large number of research questions andormed subcommittees to tackle key topic areas such asarbohydrates, energy, fats, fluid and electrolytes, ethanol,ood safety, macronutrients, and nutrient adequacy. Theubcommittees conducted extensive, systematic literatureearches, prepared summary tables, analyzed national dataets, modeled food patterns, developed scientific rationales,nd drafted conclusive statements. Their body of work wasresented to the full DGAC for review and discussion.3,4,5
Following extensive deliberations on each key topicrea, the DGAC developed a report, which presented itsndings as an integrated set of conclusions and dietaryuidance recommendations for the general American pub-
ic.3 The DGAC report served as the basis for the 2005
Do
attbptFpntmT
mnqaditttiotwi
T
S
J
M
A
S
O
O
J
A
S144 Britten et al/MYPYRAMID FOOD INTAKE PATTERN MODELING FOR THE DIETARY GUIDELINES ADVISORY COMMITTEE
ietary Guidelines for Americans, which was jointly devel-ped and published by USDA and HHS in January 2005.6
One of the DGAC’s overarching goals was to evaluatend synthesize the science regarding many individual nu-rients and food components and develop recommenda-ions for an overall pattern of eating that could be adoptedy the public.3 The food intake patterns that were in therocess of being developed by the USDA Center for Nu-rition Policy and Promotion (CNPP) for the MyPyramidood Guidance System7 provided one such solution. Theseatterns, designed to integrate Institute of Medicine (IOM)utrient recommendations into food-based recommenda-ions, included nutritional goals consistent with the recom-endations under consideration for the Dietary Guidelines.
able 1. Side-by-side Timelines for Development of 2005 Dietary Guidelin
Dietary Guidelines forAmericans 2005Date
ep 03 First Dietary GuidelinesAdvisory Committee (DGAC)meeting in Washington, DC
Federal Regisintake pattpublic com
an 04 Second DGAC meetingincluded oral testimonyfrom the public andpresentations from invitedexperts
Proposed foocomments(USDA and
ar – May 04 Third and fourth DGACmeetings
Food patternimpacts ofrecommen
ug 04 Fifth and final DGAC meeting Finalized foo
ep 04 DGAC presented its advisoryreport to the secretaries ofUSDA and DHHS, withrecommendations for the2005 Dietary Guidelines
Food intakemodeling a
ct 04 Federal Register noticesolicited public commenton the DGAC report
ct – Dec 04 Departments drafted DGpolicy document based onthe DGAC report
Updated finaUSDA’s SR1NHANES da
an 05 USDA and HHS jointlypublished and released thesixth edition of the DietaryGuidelines for Americans
Food intakeDG policy d
pr 05
he patterns also had a structure that allowed for their r
odification to test various dietary recommendation sce-arios. Early in their deliberations, DGAC members re-uested that CNPP staff undertake food pattern modelingnd analyses to evaluate the impact of potential recommen-ations on diet quality. Subcommittees’ specific requestsncluded developing a lacto-ovo-vegetarian food patternhat met nutrient goals; comparing the nutrient contribu-ions of whole fruit with those of 100% fruit juices; assessinghe adequacy of patterns with varying levels of fat; anddentifying the impact of recommending a specified amountf fish per week. The subcommittees also sought to increasehe flexibility of some aspects of the food intake patterns,hile achieving recommended nutrient intakes.4,5 Enhanc-
ng flexibility was considered important for a variety of
Americans and MyPyramid Food Guidance System
MyPyramid Food Guidance System
nical Update Consumer Presentationtice of proposed food
requested peer review and7
ake patterns and publicssed with Federal partnersand with 2005 DGAC
eling to analyze thential DGAC subcommitteens on overall diet quality
Developed concept for a newsystem approach to theconsumer presentation offood guide
ake patterns Federal Register noticerequested publiccomments on theproposed “Food GuidanceSystem” consumerpresentation
rns and reports of eachis included in DGAC report
Developed prototypeconsumer awareness,motivational andeducational materials
d intake patterns usingrient database and ’99-00
Tested and revised prototypeconsumer materials
rns included in appendix toent
USDA released MyPyramidFood Guidance System
es for
Techter noernsmentd intdiscuHHS)
modpote
datio
d int
pattenalys
l foo7 nutta
patteocum
easons, such as accommodating cultural food choices, in-
dopc
pGAwTGacdTaplcsouttp
FL
TpP
(spfapsearp
ilapIigq
gdpvbcgbtsp
TP
M
PFEN
p
Journal of Nutrition Education and Behavior ● Volume 38, Number 6S, November/December 2006 S145
ividual preferences, food cost, and availability. Iterationsf food pattern analyses and modeling exercises built on therevious ones; and all of the analyses were considered in theontext of the total diet.1
The complete set of food pattern modeling analyses isublished in Appendix G-2 of the Report of the Dietaryuidelines Advisory Committee on the Dietary Guidelines formericans, 2005.3 The MyPyramid Food Guidance Systemas finalized after the release of the Dietary Guidelines.his finalization allowed CNPP to incorporate the Dietaryuidelines recommendations into the education materials
nd to refine the food intake patterns using the mosturrent food composition and national food consumptionata. This work is presented in accompanying articles.1,2
he final refinements and updates to the nutrient profilesnd food patterns resulted in minor differences in therecise amounts from those used in the analyses and pub-ished in the DGAC report. The general results and con-lusions from all of the analyses, however, remain valid andupport Dietary Guidelines recommendations. The purposef this article is to describe the analytical approach that wassed and the conclusions that were drawn from several ofhese analyses, and to identify the impact of this work onhe DGAC’s deliberations and on the final food intakeatterns.
OOD PATTERN MODELING ANALYSESacto-ovo-vegetarian Food Intake Patterns
he MyPyramid food intake patterns group animal andlant protein sources into a single food group: the Meat,oultry, Fish, Dry Beans, Eggs, and Nuts (MPFEN) group.
able 2. Proportionate Meat, Poultry, Fish, Egg, and Nut (MPFEN) Consumptatternsa
Components of MPFENNutrient Profileb
Percent ofTotal Food
GroupConsumptionc
eats (beef, ground beef,pork, lamb, ham,luncheon meats, andliver)e
53.0%
oultry (chicken and turkey)e 23.2%ish (finfish and shellfish)e 8.0%ggse 7.4%uts and seedse 8.3%
aTable adapted from DGAC report, appendix G2.3bConsumption of specific amounts of cooked dry beans are recommend
rofiles, dry beans are included as a subgroup of vegetables rather than wcBased on food intake from the NHANES 1999-2000 survey. See accompadAssuming that intakes of these foods are in the proportions eaten on a
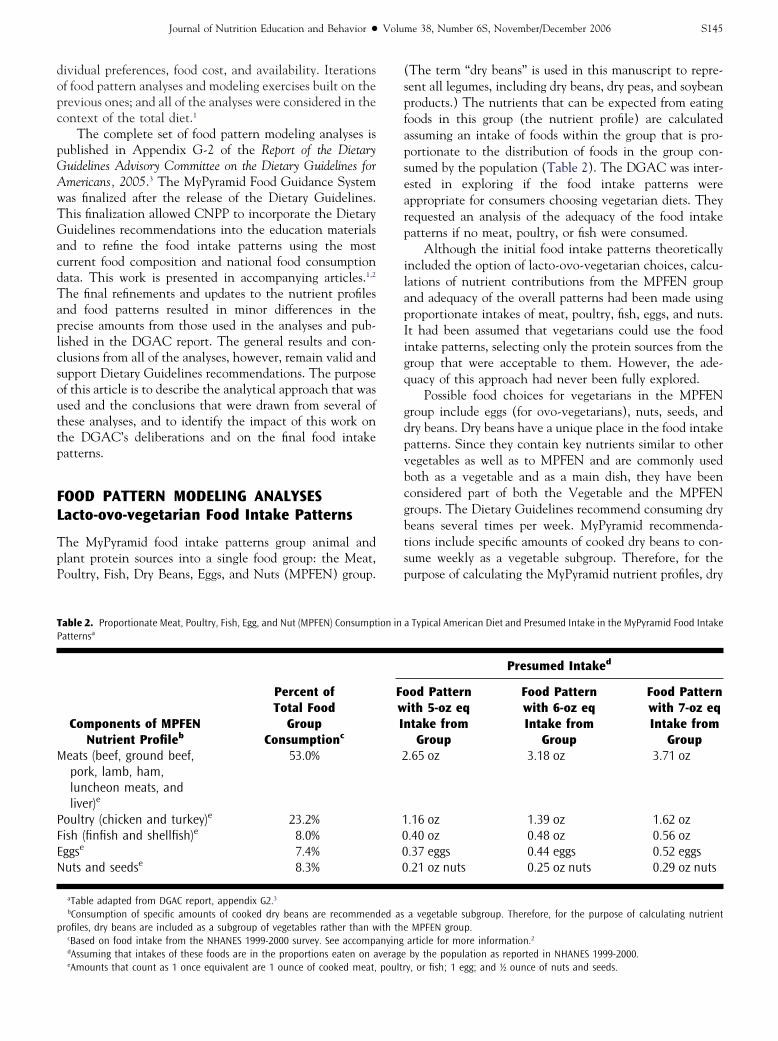
eAmounts that count as 1 once equivalent are 1 ounce of cooked meat, poultrThe term “dry beans” is used in this manuscript to repre-ent all legumes, including dry beans, dry peas, and soybeanroducts.) The nutrients that can be expected from eatingoods in this group (the nutrient profile) are calculatedssuming an intake of foods within the group that is pro-ortionate to the distribution of foods in the group con-umed by the population (Table 2). The DGAC was inter-sted in exploring if the food intake patterns wereppropriate for consumers choosing vegetarian diets. Theyequested an analysis of the adequacy of the food intakeatterns if no meat, poultry, or fish were consumed.
Although the initial food intake patterns theoreticallyncluded the option of lacto-ovo-vegetarian choices, calcu-ations of nutrient contributions from the MPFEN groupnd adequacy of the overall patterns had been made usingroportionate intakes of meat, poultry, fish, eggs, and nuts.t had been assumed that vegetarians could use the foodntake patterns, selecting only the protein sources from theroup that were acceptable to them. However, the ade-uacy of this approach had never been fully explored.
Possible food choices for vegetarians in the MPFENroup include eggs (for ovo-vegetarians), nuts, seeds, andry beans. Dry beans have a unique place in the food intakeatterns. Since they contain key nutrients similar to otheregetables as well as to MPFEN and are commonly usedoth as a vegetable and as a main dish, they have beenonsidered part of both the Vegetable and the MPFENroups. The Dietary Guidelines recommend consuming dryeans several times per week. MyPyramid recommenda-ions include specific amounts of cooked dry beans to con-ume weekly as a vegetable subgroup. Therefore, for theurpose of calculating the MyPyramid nutrient profiles, dry
Typical American Diet and Presumed Intake in the MyPyramid Food Intake
Presumed Intaked
od Patternith 5-oz eqtake fromGroup
Food Patternwith 6-oz eqIntake from
Group
Food Patternwith 7-oz eqIntake from
Group.65 oz 3.18 oz 3.71 oz
.16 oz 1.39 oz 1.62 oz
.40 oz 0.48 oz 0.56 oz
.37 eggs 0.44 eggs 0.52 eggs
.21 oz nuts 0.25 oz nuts 0.29 oz nuts
a vegetable subgroup. Therefore, for the purpose of calculating nutrientMPFEN group.
article for more information.2
by the population as reported in NHANES 1999-2000.
ion in a
FowIn
2
1000
ed asith thenyingverage
y, or fish; 1 egg; and ½ ounce of nuts and seeds.
bwfwa
oabd
AcenfnsTpt
attvmpiqtncvrti
Fd(
wltiTt
ttcDpH9g
tadLlefouw
IbfiHnbttcmlote
TN
END
&
S146 Britten et al/MYPYRAMID FOOD INTAKE PATTERN MODELING FOR THE DIETARY GUIDELINES ADVISORY COMMITTEE
eans were included as a subgroup of vegetables rather thanith the MPFEN group. To determine the adequacy of the
ood patterns including only vegetarian choices, dry beansere included in the nutrient profile for the MPFEN group,s well.
This analysis served 2 purposes: to determine if lacto-vo-vegetarians could use the food intake patterns to selectn adequate diet and to identify appropriate ratios of dryeans, nuts, and eggs that would meet nutrient recommen-ations for various age–gender groups.
pproach. We conducted the analysis by modifying theomposition of the MPFEN nutrient profile to include onlyggs, nuts, and dry beans and determined the changes inutrient and calorie levels with varying proportions of these
oods in the new profile. The modified profile included theutrient profile developed for dry beans as a vegetableubgroup along with nutrient profiles for eggs and nuts.2
hen we used the new nutrient profile in the food intakeatterns and compared the nutrient content of each patterno the nutritional goals that had been established for it.1
No attempt was made to base proportions of eggs, nuts,nd dry beans on actual intakes by vegetarians, because athe time there were not sufficient data available from na-ional food consumption surveys for individuals choosing aegetarian diet to do such an analysis. We did, however,ake a qualitative assessment of the “reasonableness” of the
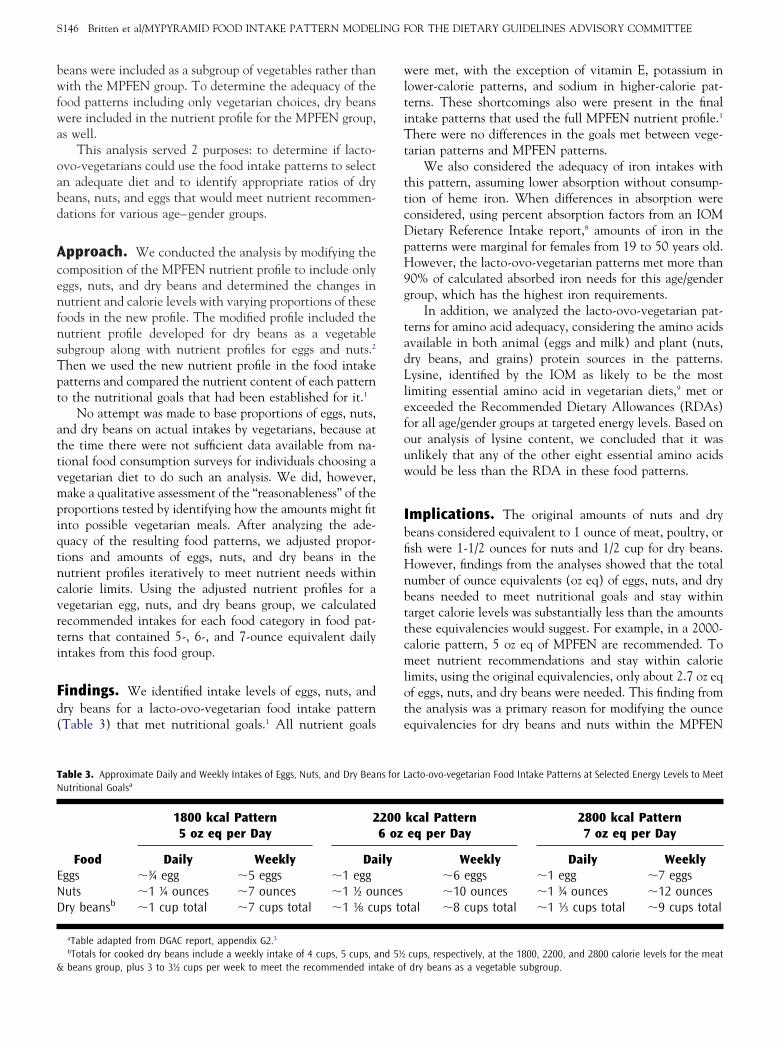
roportions tested by identifying how the amounts might fitnto possible vegetarian meals. After analyzing the ade-uacy of the resulting food patterns, we adjusted propor-ions and amounts of eggs, nuts, and dry beans in theutrient profiles iteratively to meet nutrient needs withinalorie limits. Using the adjusted nutrient profiles for aegetarian egg, nuts, and dry beans group, we calculatedecommended intakes for each food category in food pat-erns that contained 5-, 6-, and 7-ounce equivalent dailyntakes from this food group.
indings. We identified intake levels of eggs, nuts, andry beans for a lacto-ovo-vegetarian food intake patternTable 3) that met nutritional goals.1 All nutrient goals
able 3. Approximate Daily and Weekly Intakes of Eggs, Nuts, and Dry Beanutritional Goalsa
Food
1800 kcal Pattern5 oz eq per Day
2
Daily Weekly Daggs �¾ egg �5 eggs �1 egguts �1 ¼ ounces �7 ounces �1 ½ oury beansb �1 cup total �7 cups total �1 1⁄8 cu
aTable adapted from DGAC report, appendix G2.3bTotals for cooked dry beans include a weekly intake of 4 cups, 5 cups, a
beans group, plus 3 to 3½ cups per week to meet the recommended intake ofere met, with the exception of vitamin E, potassium inower-calorie patterns, and sodium in higher-calorie pat-erns. These shortcomings also were present in the finalntake patterns that used the full MPFEN nutrient profile.1
here were no differences in the goals met between vege-arian patterns and MPFEN patterns.
We also considered the adequacy of iron intakes withhis pattern, assuming lower absorption without consump-ion of heme iron. When differences in absorption wereonsidered, using percent absorption factors from an IOMietary Reference Intake report,8 amounts of iron in theatterns were marginal for females from 19 to 50 years old.owever, the lacto-ovo-vegetarian patterns met more than
0% of calculated absorbed iron needs for this age/genderroup, which has the highest iron requirements.
In addition, we analyzed the lacto-ovo-vegetarian pat-erns for amino acid adequacy, considering the amino acidsvailable in both animal (eggs and milk) and plant (nuts,ry beans, and grains) protein sources in the patterns.ysine, identified by the IOM as likely to be the most
imiting essential amino acid in vegetarian diets,9 met orxceeded the Recommended Dietary Allowances (RDAs)or all age/gender groups at targeted energy levels. Based onur analysis of lysine content, we concluded that it wasnlikely that any of the other eight essential amino acidsould be less than the RDA in these food patterns.
mplications. The original amounts of nuts and dryeans considered equivalent to 1 ounce of meat, poultry, orsh were 1-1/2 ounces for nuts and 1/2 cup for dry beans.owever, findings from the analyses showed that the totalumber of ounce equivalents (oz eq) of eggs, nuts, and dryeans needed to meet nutritional goals and stay withinarget calorie levels was substantially less than the amountshese equivalencies would suggest. For example, in a 2000-alorie pattern, 5 oz eq of MPFEN are recommended. Toeet nutrient recommendations and stay within calorie
imits, using the original equivalencies, only about 2.7 oz eqf eggs, nuts, and dry beans were needed. This finding fromhe analysis was a primary reason for modifying the ouncequivalencies for dry beans and nuts within the MPFEN
acto-ovo-vegetarian Food Intake Patterns at Selected Energy Levels to Meet
kcal Patterneq per Day
2800 kcal Pattern7 oz eq per Day
Weekly Daily Weekly�6 eggs �1 egg �7 eggs�10 ounces �1 ¾ ounces �12 ounces
tal �8 cups total �1 1⁄3 cups total �9 cups total
cups, respectively, at the 1800, 2200, and 2800 calorie levels for the meat
s for L
2006 oz
ily
ncesps to
nd 5½
dry beans as a vegetable subgroup.
gnbwepipitbpeo
VP
Tt3aqiart
letacmb(taphaaaws
c4a
AftecbTedew6twttawiWaf
Fpsncatp
3thwEtaoi5v
wphwRwo
TF
MEND
Journal of Nutrition Education and Behavior ● Volume 38, Number 6S, November/December 2006 S147
roup before release of the final food intake patterns. Theew ounce equivalents, shown in Table 4, provide a morealanced approach to the nutrient content of various foodsithin the group, and they allow substitution by ouncequivalent without exceeding the caloric limits of eachattern. Final nutrient profiles for the food intake patterns2
ncorporate these equivalents into calculations of the ex-ected nutrients from each food group. The suggested dailyntake amounts for eggs, nuts, and dry beans calculatedhrough this analysis (Table 3) now approximate the num-er of ounce equivalents recommended in the food intakeatterns. Therefore, the final patterns and revised ouncequivalencies can be used as the basis for selecting a lacto-vo-vegetarian pattern without modification.
arying Amounts of Fat in Food Intakeatterns
he IOM Dietary Reference Intakes Report on macronu-rients suggested a possible range of fat intake from 20% to5% of calories.9 The final food intake patterns containbout 29% to 31% of calories from fat.1 The DGAC re-uested a food pattern modeling analysis to determine thempact on meeting established goals for nutrient adequacynd moderation if the food intake patterns were modified toesult in a differing percentage of calories from fat withinhe range recommended by the IOM.
Within each food group and subgroup, food items inow-fat or fat-free forms are used in determining the nutri-nt profile of the group.2 However, some fat is contained inhese foods and is considered the minimum “intrinsic”mount of fat in each pattern. For example, in the 2000-alorie pattern, 23.8 grams of total fat comes from recom-ended amounts of low-fat or fat-free forms of meats and
eans (14.5 g of fat), grain (6.5 g), milk (0.6 g), vegetables1.6 g), and fruits (0.6 g).2 To bring the amounts of essen-ial fatty acids to recommended levels, to help account fordditional calories needed to meet energy needs, and torovide for flexibility in food choices by allowing someigher-fat selections, we had originally added a specificmount of additional solid fats and oils, termed “discretion-ry” fats, to each food intake pattern. (Solid fats includenimal fats such as beef, pork, chicken, and dairy fats, asell as hydrogenated vegetable fats such as shortening and
tick margarine.) In determining amounts to add, we de-
able 4. Amounts that Count as 1 Ounce Equivalent in the Meat, Poultry,ish, Dry Beans, Eggs, and Nuts (MPFEN) Group
FoodAmount to Equal 1 Ounce-
equivalent of MPFENeat, poultry, fish 1 ounce cooked
ggs 1 egguts and seeds ½ ounce, or 1 Tbsp. peanut butterry beans and peas ¼ cup cooked
w
reased the ratio of solid fats to oils from the 58% solid to2% oils ratio that is typically consumed10,11 to 40% solidnd 60% oils in the patterns.
pproach. To change the overall percentage of caloriesrom fat in the patterns, we altered the amounts of “discre-ionary” fat in the food patterns at all calorie levels. Forach level of fat modeled (20%, 25%, 30%, and 35% ofalories), we determined the total grams of fat that woulde needed to reach the appropriate percentage of calories.hen, we subtracted the intrinsic fat already present withinach food group from the total to determine the amount ofiscretionary fat allowed in each food intake pattern atach percentage of calories from fat. The discretionary fatas divided into solid fat and oil in a ratio of 40% solid to0% oil. These amounts of fats and oils were inserted intohe food patterns. At the level of 20% of calories from fat,e also created patterns containing only oil and no solid fat
o determine if this modification would help lower-fat pat-erns meet the nutritional goals. For all patterns, after theppropriate levels of fat were included, the caloric deficitas calculated, and sufficient amounts of added sugars were
nserted to bring the total calories up to the target levels.e calculated the amount of all nutrients in each pattern
nd the percentage of goal for each nutrient at each level ofat, from 20% to 35% of calories.
indings. In addition to the nutrients that are fat com-onents (essential fatty acids), solid fats and oils containmall amounts of many nutrients. However, levels of mostutrients in the patterns were not substantively affected byhanging the amounts of fat. Only vitamin E, linoleic acid,lpha-linolenic acid, and cholesterol were changed substan-ially by manipulating the fat content of the food intakeatterns.
Few of the food patterns at any level of fat, from 20% to5% of calories, met 100% of the RDA for vitamin E. Onlyhe highest calorie patterns (3000 and 3200 calories) atigher percentage of calories from fat met the RDA. Asould be expected, the percentage of the RDA for vitaminin an intake pattern increased consistently with addi-
ional discretionary fat in the pattern, as well as withdditional calories in the pattern. In the pattern with 20%f calories from fat, using oils for all of the discretionary fatsncreased the amount of vitamin E in the pattern by about% to 10% of the RDA, but overall levels of E were stillery low.
Levels of linoleic acid and alpha-linolenic acid (ALA)ere highly sensitive to the overall fat content of theattern. At 20% of calories from fat, only patterns at theighest calorie levels met the Adequate Intakes (AI) orere within the Acceptable Macronutrient Distributionanges (AMDR) for these fatty acids. When the patternsith 20% of calories from fat were modified to contain onlyils (no solid fats), the amounts of linoleic acid and ALA
ere higher, but they still did not meet the goals at many
ctlctaes3c
IDTsnDicahvmatrodvc
mclstodhcp
H
Iwgaesitisp
AbTird
uMocpea8pws(pfiwt
uiniDof
Facooipgowocc
gaofifMwTi
S148 Britten et al/MYPYRAMID FOOD INTAKE PATTERN MODELING FOR THE DIETARY GUIDELINES ADVISORY COMMITTEE
alorie levels. At 25% calories from fat, most patterns methe AIs, and all patterns were within the AMDRs forinoleic acid and ALA. The patterns at 30% and 35%alories from fat all met the AI and AMDR recommenda-ions. However, in the highest calorie patterns (2800, 3000,nd 3200) at 35% calories from fat, levels of cholesterolxceeded the recommended limit. The amounts of addedugars that could be accommodated in the patterns with5% calories from fat were also quite restricted, and at somealorie levels they were zero.
mplications. This analysis was completed before theGAC developed the concept of discretionary calories.1,3
he calories in each pattern that had been allocated toolid fats as well as added sugars are now assigned to theew category of discretionary calories, as shown in theietary Guidelines Appendices A-2 and A-3.6 Oils, includ-
ng trans fat-free soft margarines, were retained as a separateategory because they are the major source of essential fattycids and vitamin E in the patterns. This modeling exerciseelped to document the importance of oils in supplyingitamin E and provided justification for including a recom-endation for oils separate from the discretionary calorie
llowance. Even without a specific category for solid fats inhe final food intake patterns, the findings from this analysisemain valid and can provide guidance on appropriate usesf the discretionary calorie allowance. The allowance foriscretionary calories in the final food intake patterns pro-ides consumers with the flexibility to make choices thatould result in more varied solid fat levels in their diets.
The analysis also suggested that the inclusion of vita-in E-rich food sources is an effective strategy for signifi-
antly increasing dietary vitamin E for a food pattern at anyevel of fat (from 20% to 35% of calories). Selecting oilsuch as sunflower, cottonseed, and safflower oils that con-ain higher amounts of vitamin E compared with soybeanil, the most widely consumed vegetable oil, would increaseietary vitamin E. Likewise, selecting nuts such as almonds,azelnuts, and walnuts that are relatively rich in vitamin Eompared to the more commonly consumed peanuts andeanut butter, also would increase dietary vitamin E.
igh Omega-3 Fish Analysis
n developing the food intake patterns, fish were groupedith meats, poultry, eggs, nuts, and seeds into a single foodroup. The nutrient profile of this group was calculated byssuming a proportionate intake of each category of foodqual to the proportion consumed by the population, ashown in Table 2. The DGAC requested an analysis of thempact on the patterns’ nutrient adequacy if recommenda-ions for all fish and/or high omega-3 fish consumption werencreased to 8 ounces per week. This amount would repre-ent about 2 servings of fish per week based on the typical
ortion of fish consumed in the United States. spproach. We created 2 separate subgroups for fish,ased on the level of omega-3 fatty acids in each fish type.o create these subgroups, we identified new item clusters
ncluding more types of fish, so that fish could be catego-ized and placed into these new subgroups. The process isescribed in an accompanying article.2
The new nutrient profiles for the fish subgroups weresed to calculate 2 new overall nutrient profiles for thePFEN group that included 8 ounces per week of all fish or
f fish high in omega-3 fatty acids (HI�3) in food patternsontaining 5 ounce equivalents per day from the group. Theercentage of total MPFEN group consumption assigned toach food category (meat, poultry, etc.) was adjusted toccommodate intake of 8 ounces of fish per week and thenounces of HI�3 fish per week. For this analysis, meat and
oultry intakes were decreased, whereas egg and nut intakesere held constant. For the 8 ounces of all fish per week
cenario, the ratio between fish low in omega-3 fatty acidsLO�3) and HI�3 fish was maintained at current intakeroportions of about 20% HI�3 fish and about 80% LO�3sh. For the 8 ounces of HI�3 fish per week, all fish intakeas assumed to be HI�3 fish, and LO�3 fish intake was set
o zero.These new nutrient profiles for the MPFEN group were
sed in the food intake pattern to assess nutrient outcomes,ncluding eicosapentaenoic acid (EPA) and docosahexae-oic acid (DHA) intakes. For this analysis, EPA and DHA
ntakes from foods other than fish were assumed to be zero.ata are not readily available for many foods, and amountsf these fatty acids were assumed to be negligible for otheroods included in the food intake pattern.
indings. Based on National Health and Nutrition Ex-mination Survey (NHANES) 1999-2000 data, current fishonsumption is about 8% of all MPFEN consumption, andnly about 20% of the fish consumed is from species high inmega-3 fatty acids.2 These data translate to a presumedntake of about 0.4 ounces per day of all fish in a foodattern that contains 5 ounce equivalents from the MPFENroup (Table 5). Including either 8 ounces of all fish or 8unces of HI�3 fish per week in the food intake patternsould result in an average intake of approximately 1.1unces of fish per day (Table 5), almost triple current fishonsumption, or more than 10 times current HI�3 fishonsumption.
Combined amounts of EPA and DHA in the fish sub-roups were 0.4 grams per ounce in the HI�3 fish subgroup,nd 0.1 gram per ounce in the LO�3 fish subgroup, basedn weighted averages of the EPA and DHA content of eachsh in the group. The total amounts of DHA and EPA inood intake patterns containing 5 ounce equivalents of
PFEN per day were 0.2 grams (with 8 ounces of all fish pereek) and 0.5 grams (with 8 ounces of HI�3 fish per week).wo servings of HI�3 fish per week would provide approx-
mately 0.5 grams per day of EPA and DHA, in total. Two
ervings of all fish per week in proportions currently eaten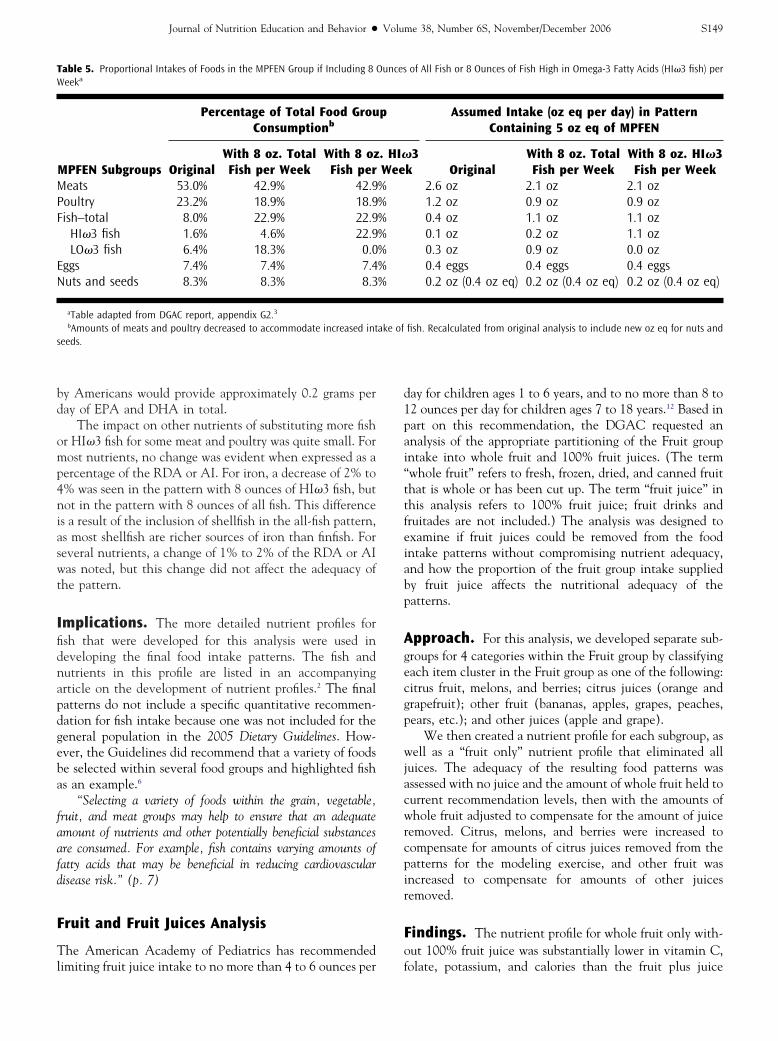
bd
omp4niaswt
Ifidnapdgeba
faafd
F
Tl
d1pai“ttfeiabp
Agecgp
wjacwrcpir
Fo
TW
MPF
EN
s
Journal of Nutrition Education and Behavior ● Volume 38, Number 6S, November/December 2006 S149
y Americans would provide approximately 0.2 grams peray of EPA and DHA in total.
The impact on other nutrients of substituting more fishr HI�3 fish for some meat and poultry was quite small. Forost nutrients, no change was evident when expressed as a
ercentage of the RDA or AI. For iron, a decrease of 2% to% was seen in the pattern with 8 ounces of HI�3 fish, butot in the pattern with 8 ounces of all fish. This difference
s a result of the inclusion of shellfish in the all-fish pattern,s most shellfish are richer sources of iron than finfish. Foreveral nutrients, a change of 1% to 2% of the RDA or AIas noted, but this change did not affect the adequacy of
he pattern.
mplications. The more detailed nutrient profiles forsh that were developed for this analysis were used ineveloping the final food intake patterns. The fish andutrients in this profile are listed in an accompanyingrticle on the development of nutrient profiles.2 The finalatterns do not include a specific quantitative recommen-ation for fish intake because one was not included for theeneral population in the 2005 Dietary Guidelines. How-ver, the Guidelines did recommend that a variety of foodse selected within several food groups and highlighted fishs an example.6
“Selecting a variety of foods within the grain, vegetable,ruit, and meat groups may help to ensure that an adequatemount of nutrients and other potentially beneficial substancesre consumed. For example, fish contains varying amounts ofatty acids that may be beneficial in reducing cardiovascularisease risk.” (p. 7)
ruit and Fruit Juices Analysis
he American Academy of Pediatrics has recommended
able 5. Proportional Intakes of Foods in the MPFEN Group if Including 8 Oeeka
MPFEN Subgroups
Percentage of Total Food GrouConsumptionb
OriginalWith 8 oz. TotalFish per Week
With 8 ozFish per
eats 53.0% 42.9% 42.9oultry 23.2% 18.9% 18.9ish–total 8.0% 22.9% 22.9
HI�3 fish 1.6% 4.6% 22.9LO�3 fish 6.4% 18.3% 0.0
ggs 7.4% 7.4% 7.4uts and seeds 8.3% 8.3% 8.3
aTable adapted from DGAC report, appendix G2.3bAmounts of meats and poultry decreased to accommodate increased int
eeds.
imiting fruit juice intake to no more than 4 to 6 ounces per f
ay for children ages 1 to 6 years, and to no more than 8 to2 ounces per day for children ages 7 to 18 years.12 Based inart on this recommendation, the DGAC requested annalysis of the appropriate partitioning of the Fruit groupntake into whole fruit and 100% fruit juices. (The termwhole fruit” refers to fresh, frozen, dried, and canned fruithat is whole or has been cut up. The term “fruit juice” inhis analysis refers to 100% fruit juice; fruit drinks andruitades are not included.) The analysis was designed toxamine if fruit juices could be removed from the foodntake patterns without compromising nutrient adequacy,nd how the proportion of the fruit group intake suppliedy fruit juice affects the nutritional adequacy of theatterns.
pproach. For this analysis, we developed separate sub-roups for 4 categories within the Fruit group by classifyingach item cluster in the Fruit group as one of the following:itrus fruit, melons, and berries; citrus juices (orange andrapefruit); other fruit (bananas, apples, grapes, peaches,ears, etc.); and other juices (apple and grape).
We then created a nutrient profile for each subgroup, asell as a “fruit only” nutrient profile that eliminated all
uices. The adequacy of the resulting food patterns wasssessed with no juice and the amount of whole fruit held tourrent recommendation levels, then with the amounts ofhole fruit adjusted to compensate for the amount of juice
emoved. Citrus, melons, and berries were increased toompensate for amounts of citrus juices removed from theatterns for the modeling exercise, and other fruit wasncreased to compensate for amounts of other juicesemoved.
indings. The nutrient profile for whole fruit only with-ut 100% fruit juice was substantially lower in vitamin C,
of All Fish or 8 Ounces of Fish High in Omega-3 Fatty Acids (HI�3 fish) per
Assumed Intake (oz eq per day) in PatternContaining 5 oz eq of MPFEN
3k Original
With 8 oz. TotalFish per Week
With 8 oz. HI�3Fish per Week
2.6 oz 2.1 oz 2.1 oz1.2 oz 0.9 oz 0.9 oz0.4 oz 1.1 oz 1.1 oz0.1 oz 0.2 oz 1.1 oz0.3 oz 0.9 oz 0.0 oz0.4 eggs 0.4 eggs 0.4 eggs0.2 oz (0.4 oz eq) 0.2 oz (0.4 oz eq) 0.2 oz (0.4 oz eq)
fish. Recalculated from original analysis to include new oz eq for nuts and
unces
p
. HI�Wee%%%%%%%
ake of
olate, potassium, and calories than the fruit plus juice

nAlFofWpc
jo23lw3
Idt1cefiactc
tStsecti
F
Shtwbcownrfa
eT
icnfiteeriirtat
fwnTifavec1tb
mnsawpspfcgostalucnssiG
D
T
S150 Britten et al/MYPYRAMID FOOD INTAKE PATTERN MODELING FOR THE DIETARY GUIDELINES ADVISORY COMMITTEE
utrient profile. It was notably higher in fiber and vitamin. With fruit juices removed from the intake patterns,
evels of vitamin C and potassium were the most affected.or example, amounts of vitamin C fell from 141% to 92%f the RDA for females 31-50, and amounts of potassiumell from 66% to 61% of the RDA3 (Appendix G-2, p. 303).
hen additional amounts of whole fruit were added to theatterns to compensate for the removal of juices, thesehanges were lessened but not eliminated.
When this analysis was undertaken, 3/4 cup of fruituice was counted as 1 serving, or the equivalent of 1/2 cupf fruit. Using these equivalencies and NHANES 1999-000 consumption data, total fruit juice intake was about7% of all fruit servings, across all ages 2 and over. Theower levels of calories, vitamin C, potassium, and folate inhole fruit in comparison to juices was due, in large part, to/4 cup of juice being considered equal to 1/2 cup of fruit.
mplications. The results from this analysis helped torive a decision to change the equivalency for fruit juices sohat 1/2 cup of 100% fruit juice is considered equivalent to/2 cup of whole fruit in the final intake patterns. Thishange makes the nutrition contribution of juices morequivalent to that of fruit, with the exception of dietaryber. With this new equivalency, fruit juice representsbout 47% of all fruit intake in cup equivalents.2 To in-rease fiber intake, the Dietary Guidelines recommend thathe majority of fruit intake be whole fruit (fresh, frozen,anned, or dried) rather than juice.
In addition, this analysis helped to identify the varia-ion in potassium content among different types of fruit.ince potassium is low in almost all food patterns, sugges-ions for selecting at least some fruit or juice rich in potas-ium could help to increase overall intakes. Of the subcat-gories created for this analysis of juice and fruit intake,itrus juices and other fruit have the highest level of po-assium. A table of rich sources of potassium was includedn the 2005 Dietary Guidelines.6
lexibility Analyses
everal analyses were requested by the DGAC to exploreow much flexibility was feasible in the food intake pat-erns. DGAC members were interested in identifyinghether alternative sources of the same nutrients providedy some food categories were available within foods typi-ally consumed by Americans. The nutrient contributionsf enriched grains, dry beans, and milk to overall intakeere identified, and potential alternative sources for theseutrients were investigated. Appendix G-2 of the DGACeport provides a detailed description of each analysis.3 Theollowing paragraphs give a general picture of the flexibilitynalyses undertaken and their results.
In the Grain group, a mix of half whole grains and halfnriched grains was proposed in the food intake patterns.
he DGAC asked for an analysis of the nutrient shortfalls pf no enriched grains were consumed, and what other foodsould provide these nutrients. For enriched grains, theutrients provided included folate, iron, copper, dietaryber, calcium, and magnesium. We found that shortfalls ofhese nutrients if enriched grains were not eaten could bentirely compensated for by substituting whole grains fornriched grains. Since some commonly eaten whole-grain,eady-to-eat breakfast cereals are fortified with folate, folatentake was not compromised if a variety of whole grains,ncluding folate-fortified products, were substituted for en-iched grains. Based in part on this analysis, the DGAC andhe food intake patterns recommended that at least half ofll grains be whole grains, with the implication that morehan half whole grains was acceptable.
Regular intake of dry beans and peas is suggested by theood intake patterns. The DGAC requested an analysis ofhat other combinations of foods could provide the sameutrients for individuals who do not consume dry beans.he nutrient shortfalls if dry beans were not consumed
ncluded dietary fiber, magnesium, calcium, and iron. Weound that these nutrients could be provided by additionalmounts of whole grains, dark-green vegetables, and otheregetables. However, the amounts needed were large. Forxample, about 1-1/2 cups of dark-green vegetables or 3ups of other vegetables would be needed to substitute for/2 cup of dry beans. These amounts would be in additiono the amounts for dark-green vegetables or other vegeta-les in the food pattern.
Although milk and milk products contribute the vastajority of calcium, as well as a substantial amount of otherutrients, in American diets, questions often arise aboutubstitutions for milk products. The DGAC requested annalysis of the nutrient shortfalls if milk or milk productsere not consumed and not replaced by another foodroduct. We found that calcium and potassium intakes wereeverely compromised without milk products in the foodatterns, but magnesium and vitamin A also became short-alls for some groups. Since about 60% to 70% of thealcium in the food intake patterns comes from the Milkroup, no scenarios for replacement of milk products withther foods were developed, as this would have necessitatedubstantial deviations from typical food choices for most ofhe population. The DGAC concluded that the most viablelternatives for many individuals may be lactose-reduced orow-lactose foods within the Milk group for many individ-als who avoid milk because of its lactose content. Theommittee also identified other options for those who doot consume any dairy products, including fortified foodsuch as calcium-fortified orange juice or calcium-fortifiedoy products. A table of nondairy calcium sources wasncluded in the DGAC report and in the 2005 Dietaryuidelines.3,6
ISCUSSION
he food pattern modeling analyses undertaken by CNPP
rovided a valuable tool for the DGAC in determining how
acdhdniDniatfuTtcwtgrpr
snfttamwfsffw
umtntemvapvv
weclon
ntvbEfSlf((
vtdtpwwdDc
IP
FrcManmactpgtborucdfop
R
Journal of Nutrition Education and Behavior ● Volume 38, Number 6S, November/December 2006 S151
food pattern could be developed to meet science-basedriteria for a healthful diet.3 Data on the effects of wholeiets on body mass index, cardiovascular disease, and otherealth conditions are limited. The majority of research oniet and disease relationships examines the effect of specificutrients, food components, single categories of food, or
ndividual food groups. Food pattern modeling allowed theGAC to assess the impact of converting a full set ofutrient recommendations based on that body of research
nto food-based recommendations. The findings from eachnalysis provided information that was useful in developinghe DGAC’s conclusive statements and recommendationsor the 2005 Dietary Guidelines for Americans. Advantages ofsing the food intake patterns were noted by the DGAC.hese advantages included the continuity of the food in-
ake patterns with previous food guidance, which allowsonsumers to build new nutrition knowledge on the base ofhat they already know. In addition, the DGAC noted that
he patterns provide an educational tool that integrates theamut of IOM nutrient recommendations into food-basedecommendations. The modeling analyses showed that foodatterns can be developed to meet all of the current dietaryecommendations.
The modeling also demonstrated that very careful foodelections are needed in order to meet all food group andutrient recommendations. Additional advice may be help-
ul to consumers in applying these dietary patterns to ensurehey are implemented appropriately. For example, the nu-rient profiles for each food group reflect low-fat and no-dded-sugars choices, which are not the typical choices ofany Americans. Therefore, consumers who select foodsith higher fat levels and/or added sugars need to account
or them as discretionary calories. Guidance may help con-umers recognize and account for discretionary caloriesrom the fat contained in milk products or meats, and theats and added sugars that are a part of processed foods, asell as those added when preparing or serving food.
The findings from these modeling exercises were also ofse to CNPP in finalizing the intake patterns for MyPyra-id. For example, results from the vegetarian analysis iden-
ified that modifications were needed in the amounts ofuts, seeds, and dry beans that were considered equivalento other foods in the meat and beans group. (The modifiedquivalencies are shown in Table 4.) This adjustment willake it easier to promote intake of these foods to increase
ariety within the group. The results from other analyseslso helped to shape final decisions about the food intakeatterns, such as establishing the equivalency for fruit andegetable juices at 1 cup equal to 1 cup of fruits oregetables.
Limitations in using the food intake pattern modelingere noted by the DGAC.3 Since the nutrient profiles forach food group are developed from Americans’ currentonsumption of foods within that group, the profiles may beow in a nutrient if typical diets do not include rich sourcesf it. For example, the nuts that Americans tend to eat are
ot especially rich in vitamin E, and they eat relatively fewuts in comparison to meat and poultry. In addition, rela-ively few individuals use oils that are especially rich initamin E. Therefore, the nutrient profile for the meat andeans group and the oils group are relatively low in vitamin. Using these nutrient profiles, it is difficult to develop a
ood intake pattern that meets the RDA for vitamin E.ources of vitamin E for consumers choosing a diet at the
ower range of fat recommendations include fortified break-ast cereals and other fortified foods, oils high in vitamin Ee.g., sunflower and safflower), and nuts high in vitamin Ee.g., almonds and hazelnuts).
With adequate data on food consumption patterns ofarious population groups and on the nutrient content ofhe foods eaten, food pattern modeling can be applied toiverse population groups whose food choices differ fromhose typical in the general U.S. population. The modelingrocess can also be used to focus on subpopulation groupsith specific needs, such as children, pregnant and lactatingomen, and older adults. In addition, improvements in theata available on food content of some nutrients, such asHA and EPA, will allow analysis of how the food patterns
an meet additional nutritional needs.
MPLICATIONS FOR RESEARCH ANDRACTICE
ood intake pattern modeling can be a useful tool foresearchers to assess possible impacts of recommendedhanges in food selection for various groups of people.odeling exercises can show the overall impact on nutrient
dequacy and energy intake of proposed food intakes. Sce-arios for potential new nutrient recommendations can beodeled to determine what other compensating changes
re needed in overall dietary recommendations. Throughareful planning that considers the relative nutrient con-ent of different foods, professionals can adapt food intakeatterns for different cultural food choices or populationroups and continue to meet recommended nutrient in-akes. There is room for flexibility within the food groups,ut elimination of entire food categories such as dry beansr milk products can greatly reduce the ability to meetecommended nutrient intakes if nutritionally similar prod-cts are not consumed. This work shows that food patternsan be implemented to achieve current dietary recommen-ations. Professionals can help individuals implement theood-based recommendations within calorie needs by usingr adapting the food intake patterns for personal needs andreferences.
EFERENCES
1. Britten P, Marcoe K, Yamini S, Davis C. Development of Food IntakePatterns for the MyPyramid Food Guidance System. J Nutr EducBehav. 2006;38:S78-S92.
2. Marcoe K, Juan WY, Yamini S, Carlson A, Britten P. Development offood group composites and nutrient profiles for the MyPyramid Food
Guidance System, J Nutr Educ Behav. 2006;38:S93-S107.
1
1
1
S152 Britten et al/MYPYRAMID FOOD INTAKE PATTERN MODELING FOR THE DIETARY GUIDELINES ADVISORY COMMITTEE
3. Dietary Guidelines Advisory Committee. Report of the Dietary Guide-lines Advisory Committee on the Dietary Guidelines for Americans, 2005.Washington, DC: U.S. Department of Agriculture, Agricultural Re-search Service, August 2004.
4. Weaver C, Nicklas T, Britten P. The 2005 Dietary Guidelines Advi-sory Committee Report: Achieving nutrition recommendationsthrough food-based guidance. Nutr Today. 2005;40:102-107.
5. Nicklas TA, Weaver C, Britten P, Stitzel KF. The 2005 DietaryGuidelines Advisory Committee: Developing a Key Message. J AmDiet Assoc. 2005;105:1418-1424.
6. U.S. Department of Health and Human Services and U.S. Depart-ment of Agriculture. Dietary Guidelines for Americans, 2005. Wash-ington, DC: U.S. Department of Health and Human Services andU.S. Department of Agriculture; January 2005.
7. Notice of availability of proposed Food Guide Pyramid daily food
intake patterns and technical support data and announcement ofpublic comment period. Fed Regist. September 11, 2003;68:53536-53539.
8. Institute of Medicine. Dietary Reference Intakes for Vitamin A,Vitamin K, Arsenic, Boron, Chromium, Copper, Iodine, Iron, Man-ganese, Molybdenum, Nickel, Silicon, Vanadium, and Zinc. Wash-ington, DC: National Academies Press; 2001.
9. Institute of Medicine. Dietary Reference Intakes for Energy, Carbo-hydrate, Fiber, Fat, Fatty Acids, Cholesterol, Protein, and AminoAcids. Washington, DC: National Academies Press; 2002.
0. Nutrient Content of the U.S. Food Supply, 1909-97. Washington, DC:U.S. Department of Agriculture, Center for Nutrition Policy and Pro-motion. Pages 80-81. 2001. Home Economics Research Report No. 54.
1. U.S. Department of Agriculture, Center for Nutrition Policy andPromotion. U.S. Food Supply Series 1909-2001. In-house database.Accessed December 3, 2001.
2. American Academy of Pediatrics. The use and misuse of fruit juice in
pediatrics. Pediatrics. 2001;107(5):1210-1213.
Related Documents


