Chemical and Biological Engineering Publications Chemical and Biological Engineering 3-2017 Myosin phosphorylation on stress fibers predicts contact guidance behavior across diverse breast cancer cells Juan Wang Iowa State University Ian C. Schneider Iowa State University, [email protected] Follow this and additional works at: hp://lib.dr.iastate.edu/cbe_pubs Part of the Biological Engineering Commons , Biology and Biomimetic Materials Commons , Biomaterials Commons , and the Molecular, Cellular, and Tissue Engineering Commons e complete bibliographic information for this item can be found at hp://lib.dr.iastate.edu/ cbe_pubs/318. For information on how to cite this item, please visit hp://lib.dr.iastate.edu/ howtocite.html. is Article is brought to you for free and open access by the Chemical and Biological Engineering at Iowa State University Digital Repository. It has been accepted for inclusion in Chemical and Biological Engineering Publications by an authorized administrator of Iowa State University Digital Repository. For more information, please contact [email protected]. brought to you by CORE View metadata, citation and similar papers at core.ac.uk provided by Digital Repository @ Iowa State University

Welcome message from author
This document is posted to help you gain knowledge. Please leave a comment to let me know what you think about it! Share it to your friends and learn new things together.
Transcript
Chemical and Biological Engineering Publications Chemical and Biological Engineering
3-2017
Myosin phosphorylation on stress fibers predictscontact guidance behavior across diverse breastcancer cellsJuan WangIowa State University
Ian C. SchneiderIowa State University, [email protected]
Follow this and additional works at: http://lib.dr.iastate.edu/cbe_pubs
Part of the Biological Engineering Commons, Biology and Biomimetic Materials Commons,Biomaterials Commons, and the Molecular, Cellular, and Tissue Engineering Commons
The complete bibliographic information for this item can be found at http://lib.dr.iastate.edu/cbe_pubs/318. For information on how to cite this item, please visit http://lib.dr.iastate.edu/howtocite.html.
This Article is brought to you for free and open access by the Chemical and Biological Engineering at Iowa State University Digital Repository. It hasbeen accepted for inclusion in Chemical and Biological Engineering Publications by an authorized administrator of Iowa State University DigitalRepository. For more information, please contact [email protected].
brought to you by COREView metadata, citation and similar papers at core.ac.uk
provided by Digital Repository @ Iowa State University
Myosin phosphorylation on stress fibers predicts contact guidancebehavior across diverse breast cancer cells
AbstractDuring cancer progression the extracellular matrix is remodeled, forming aligned collagen fibers that proceedradially from the tumor, resulting in invasion. We have recently shown that different invasive breast cancercells respond to epitaxially grown, aligned collagen fibrils differently. This article develops insight into whythese cells differ in their contact guidance fidelity. Small changes in contractility or adhesion dramatically alterdirectional persistence on aligned collagen fibrils, while migration speed remains constant. The directionalityof highly contractile and adhesive MDA-MB-231 cells can be diminished by inhibiting Rho kinase or β1integrin binding. Inversely, the directionality of less contractile and adhesive MTLn3 cells can be enhanced byactivating contractility or integrins. Subtle, but quantifiable alterations in myosin II regulatory light chainphosphorylation on stress fibers explain the tuning of contact guidance fidelity, separate from migration per seindicating that the contractile and adhesive state of the cell in combination with collagen organization in thetumor microenvironment determine the efficiency of migration. Understanding how distinct cells respond tocontact guidance cues will not only illuminate mechanisms for cancer invasion, but will also allow for thedesign of environments to separate specific subpopulations of cells from patient-derived tissues by leveragingdifferences in responses to directional migration cues.
KeywordsTopography, Epitaxial growth, Mica, Collagen, Contractility, Paxillin
DisciplinesBiological Engineering | Biology and Biomimetic Materials | Biomaterials | Molecular, Cellular, and TissueEngineering
CommentsThis is a manuscript of an article published as Wang, Juan, and Ian C. Schneider. "Myosin phosphorylation onstress fibers predicts contact guidance behavior across diverse breast cancer cells." Biomaterials 120 (2017):81-93. DOI: 10.1016/j.biomaterials.2016.11.035. Copyright 2016. Elsevier Ltd. Posted with permission.
This article is available at Iowa State University Digital Repository: http://lib.dr.iastate.edu/cbe_pubs/318
1
Myosin Phosphorylation on Stress Fibers Predicts Contact Guidance
Behavior across Diverse Breast Cancer Cells
Juan Wang1 and Ian C. Schneider
1,2*‡
1Department of Chemical and Biological Engineering, Iowa State University
2Department of Genetics, Development and Cell Biology, Iowa State University
*Present address: Iowa State University, Department of Chemical and Biological Engineering, 2114
Sweeney Hall, Ames, IA, 50011-2230
‡Author for correspondence (phone: (515) 294-0450, fax: (515) 294-2689, e-mail: [email protected])
2
Abstract:
During cancer progression the extracellular matrix is remodeled, forming aligned collagen fibers
that proceed radially from the tumor, resulting in invasion. We have recently shown that different
invasive breast cancer cells respond to epitaxially grown, aligned collagen fibrils differently.
This article develops insight into why these cells differ in their contact guidance fidelity. Small
changes in contractility or adhesion dramatically alter directional persistence on aligned collagen
fibrils, while migration speed remains constant. The directionality of highly contractile and
adhesive MDA-MB-231 cells can be diminished by inhibiting Rho kinase or 1 integrin binding.
Inversely, the directionality of less contractile and adhesive MTLn3 cells can be enhanced by
activating contractility or integrins. Subtle, but quantifiable alterations in myosin II regulatory
light chain phosphorylation on stress fibers explain the tuning of contact guidance fidelity,
separate from migration per se indicating that the contractile and adhesive state of the cell in
combination with collagen organization in the tumor microenvironment determine the efficiency
of migration. Understanding how distinct cells respond to contact guidance cues will not only
illuminate mechanisms for cancer invasion, but will also allow for the design of environments to
separate specific subpopulations of cells from patient-derived tissues by leveraging differences in
responses to directional migration cues.
Key Words:
Topography; epitaxial growth; mica; collagen; contractility; paxillin
3
Introduction:
Migration is an important cell behavior that occurs during many pathological and physiological
processes. For instance, during cancer invasion and metastasis, faster migration occurs through
altered signaling pathways, cytoskeletal dynamics and adhesive structures. In addition to faster
migration, it is well known that the tumor microenvironment (TME) presents directional cues for
cancer cells, allowing for more efficient cell migration towards blood vessels, lymph vessels and
along nerve fibers. Directed migration comes in various flavors, one of which is contact guidance,
or directed cell migration along aligned fibers or fiber-like structures. Contact guidance has been
shown to be a powerful modulator of breast cancer metastasis, due to the robustly aligned
collagen emanating radially from the TME [1], but other cancers likely share similar signatures
[2]. Furthermore, this aligned fiber structure likely enhances stromal and immune cell migration
towards the tumor [3, 4]. Understanding how contact guidance operates across different cells is a
critical aspect of understanding the biology of tumor invasion and metastasis. In addition,
fabricating tumor mimicking environments that allow for the separation and expansion of
patient-derived cells for drug screening applications will require both the ability to make
complex structures as well as the understanding of how cells respond to those structures.
There have been numerous approaches for fabricating contact guidance cues in 2D and
3D environments [5-8]. Controlling 3D contact guidance cues is more difficult and imaging cells
embedded within these environments can pose challenges, so most of the work has been
conducted in 2D environments. Most contact guidance work has been carried out on gratings [9-
12] that present either micro- or nano- sized grooves and ridges from 50 nm to 50 m in width
with depths ranging from 30 nm to 3 m. In addition to gratings, lines of extracellular matrix
(ECM) have been printed such that cells occupy one line and move randomly in 1D [13, 14] or
span several lines [15-18]. Finally, aligned collagen fibrils have been epitaxially grown on mica
[19]. Epitaxial growth of aligned collagen has several advantages. This contact guidance cue is
formed using a native ECM protein and certain in vivo structural characteristics of collagen
fibrils like D-banding are retained [20]. These substrates have been used to assess contact
guidance in fibroblasts [21]. In addition, we recently used these substrates to show that cancer
cells that migrate with similar speed, but different migration mode, sense contact guidance cues
with vastly different directional fidelity [22].
4
While all cells share basic migration steps including adhesion and contractility
that results in traction generation or tail retraction, these steps are regulated differently
among cells. Migration phenotypes have begun to be more rigorously defined and are
commonly referred to as migration modes. Different signaling pathways are required for
each migrational mode and blocking or enhancing certain pathways can allow a cell to
switch between modes. Adhesion is regulated by integrin binding to ECM proteins like
collagen. Integrins are activated either by intracellular focal adhesion (FA) molecules or
manganese ions (Mn2+
), resulting in higher affinity interactions with the ECM [23]. In
particular, 1 integrin activation seems to increase traction force [24]. Attenuating
integrin interactions with the ECM switches cells from a mesenchymal to amoeboid
mode of migration [25]. Integrins initiate the assembly of FAs and recruitment of FA
proteins such as paxillin. Paxillin is phosphorylated on several sites including pY118 that
leads to FA turnover and maturation [26, 27]. Paxillin phosphorylation and the
accompanying FA turnover and maturation are brought on by myosin-mediated
contractility that is controlled by the phosphorylation of myosin II regulatory light chain
(MRLC) by myosin light chain kinase (MLCK) and Rho kinase (ROCK) [26-28]. In the
context of migration modes, the amoeboid mode depends on Rho/ROCK signaling to
generate cortical contractility and blocking ROCK activity can switch cells from
amoeboid to mesenchymal migration [29, 30]. However, much of the work outlining the
differences in migration modes has been carried out in randomly migrating cells with no
external directional cue.
Both adhesion and contractility are important during contact guidance. Work on
gratings has shown that directional fidelity is dependent on FA maturation [31, 32],
however the role of paxillin phosphorylation in contact guidance is not clear. Cells
spreading on gratings requires myosin contractility through the Rho/ROCK pathway for
directional alignment [33, 34], but other Rho GTPases like Cdc42 and Rac [35, 36] and
MLCK [37] are dispensable. In addition, contact guidance in 3D systems depends on
ROCK, but not MLCK phosphorylation of MRLC [6]. However, no study has examined
the role of MRLC phosphorylation on stress fibers or paxillin phosphorylation in FAs
during contact guidance. Furthermore, no study has examined contact guidance fidelity in
5
response to adhesion and contractility perturbations across cell lines that migrate with different
migration modes.
In this paper, we benchmark contact guidance on epitaxially grown collagen fibrils with
two other common contact guidance cues (CP lines and gratings) in MDA-MB-231
(mesenchymal) and MTLn3 (amoeboid) cells. We show that both cell lines migrate similarly on
CP collagen and gratings. However, epitaxial grown, aligned collagen fibrils generated distinct
migration behavior as we have demonstrated before [22]. MDA-MB-231 cells sense contact
guidance with high fidelity, but MTLn3 cells, sense contact guidance cues with low fidelity. We
then perturb ROCK-mediated contractility and 1 integrin-mediated adhesion and show that
directionality can be tuned up or down in cells roughly independent of cell speed. MDA-MB-231
cells can be made to be less directional after contractility or adhesion inhibition, whereas MTLn3
cells can be made to be more directional after contractility or adhesion enhancement. The
perturbations that generate these dramatic changes in directionality alter MRLC and paxillin
phosphorylation when localized to stress fibers and in FAs. Additionally, while dual
perturbations of contraction and adhesion yield synergistic migration speed responses, additive
or saturated directionality responses are observed, suggesting that contraction and adhesion have
overlapping roles in modulating cell directionality. Finally, while MRLC phosphorylation on
stress fibers is poorly predictive of cell migration speed on contact guidance cues, directionality
is directly proportional to MRLC phosphorylation on stress fibers across numerous conditions
and cell lines.
6
Materials and methods:
Cell culture and reagents
A human mammary basal/claudin low carcinoma cell line (MDA-MB-231, ATCC, Manassas,
VA, USA) was cultured in Dulbecco’s Modified Eagles Medium (DMEM) (Sigma Aldrich, St.
Louis, MO, USA) containing 10% fetal bovine serum (FBS) (Gibco, Grand Island, New York,
USA) and 1% penicillin-streptomycin (pen-strep) (Gibco) at 37°C in 5% CO2. A rat mammary
basal adenocarcinoma cell line (MTLn3, Jeffrey E. Segall, Albert Einstein College of Medicine)
was authenticated using IDEXX BioResearch (Westbrook, Maine, USA) and cultured in MEMα
(Gibco) supplemented with 5% FBS (Gibco) and 1% pen-strep (Gibco) at 37°C in 5% CO2.
Imaging media for MDA-MB-231 and MTLn3 cells was the same as the subculturing media,
with the exception that no phenol red was included and that 12 mM HEPES (Sigma Aldrich) was
included.
Collagen substrate treatment
High concentration non pepsin treated rat tail collagen type I (Corning, Corning, NY, USA) was
used for the contact guidance cues. Four different types of contact guidance cues were made. The
first two substrates involved depositing heterotrimeric collagen onto functionalized glass.
Collagen was adsorbed (3 g ml-1
in solution for 1 hr) or microcontact printed onto no. 1 1/2-22
mm square coverslips (Corning). Cover slips were cleaned [38] and functionalized with 1%
aminopropyltriethylsilane (Fisher Scientific, Hampton, New Hampshire, USA) in 10 mM acetic
acid (Alfa Aesar, Ward Hill, MA, USA) and 6% glutaraldehyde (Electron Microscopy Sciences,
Hatfield, PA, USA) in phosphate buffered saline (PBS) without calcium and magnesium (Gibco).
Polydimethylsiloxane (PDMS) stamps were made by mixing 184 Silicone Elastomer Base (Dow
Corning, Midland, MI, USA) with its curing agent in a 10:1 weight ratio and then allowing it to
spread on top of a silicon master fabricated at the Minnesota Nanocenter (University of
Minnesota, Minneapolis, MN, USA). The master coated with PDMS was exposed to a vacuum to
remove any air bubbles and then cured for 1 hr at 60°C. PDMS stamps were sonicated in double
distilled water and in 100% ethanol. A 200 µl collagen solution of 60 µg ml-1
collagen I in 0.5 M
acetic acid was applied to each stamp. After 40 min incubation, the collagen solution was
removed and then the stamp was placed on the functionalized coverslip and allowed to incubate
for 15 min. Later, the stamp was removed generating lines 3 m in width spaced 3 m apart (Fig.
1C) [15].
7
The third substrate involved generating a grating. Shallow and deep gratings containing
ridges and grooves (shallow: 0.1 m deep with 1.5 m pitch and deep: 3 m deep with 6 m
pitch, Fig. 1D-H) were prepared from CD-Rs and the masters used for CP mentioned above.
Commercial CD-Rs consist of layers including polycarbonate, dye, gold, lacquer and polymer
coatings. A thin layer (50-100 nm) of gold is coated on the dye and polycarbonate layers which
have a spiraling pregroove. To expose the pregroove, the lacquer and polymer coatings on the
CD-Rs were removed [39]. The CD-Rs were cut to size first and then immersed in concentrated
nitric acid (Sigma) for 4 min. The lacquer and polymer coatings delaminated spontaneously,
exposing the gold grating. Then the CD-R pieces were washed with deionized water and ethanol
several times and dried with nitrogen gas. The prepared grating topography was transferred to
PDMS as was done for the CP and cells were plated on the PDMS generated grating. Gratings
were inverted on a 150 µl collagen solution of 3 µg ml-1
collagen I in 0.5 M acetic acid.
The final substrate involved assembling aligned collagen fibrils on atomically smooth
mica. Collagen fibrils were epitaxially grown on 15 mm x 15 mm pieces of muscovite mica
(highest grade VI, Ted Pella, Redding, CA, USA) that were freshly cleaved using tape [22].
Collagen type I was diluted (10 g ml-1
) in the buffer solution consisted of 50 mM Tris-HCl
(Fisher Scientific) and 200 mM KCl (Fisher Scientific) at pH 9.2. After incubation of 6-18 hrs
the collagen solution was washed with deionized water, the mica was laid against the edge of a
tissue culture dish and the mica was allowed to dry overnight and was used the next day. This
protocol generated aligned collagen fibrils over the entire mica substrate (Fig. 1A&B).
Characterizing substrates
A Dimension 3100 scanning probe microscope with Nanoscope IV controller (Veeco Metrology,
LLC, Santa Barbara, CA) was used to obtain height images of collagen fibrils on mica. Imaging
was conducted in tapping mode using silicon TESP7 AFM tips (Veeco Metrology, LLC, Santa
Barbara, CA) with a spring constant of ~79 N/m and resonance frequency of ~ 269 kHz.
Collagen fibrils were marked through attachment of 40 nm carboxylate-functionalized
polystyrene spheres with embedded fluorophore (580/605) (Molecular Probes, Eugene, OR,
USA) diluted into PBS. Aligned fibrils on a mica substrate were incubated with the fluorescent
spheres for 1 hr. After the sample was dried at room temperature, the fluorescent spheres were
imaged by epifluorescence using at 10× (NA 0.5, Nikon, Tokyo, Japan) with a charge-coupled
device (CoolSNAP HQ2, Photometrics, Tucson, AZ, USA) attached to an inverted microscope
8
(Ti-E, Nikon) that was driven by Manager [40]. A P-7 Stylus Profiler (KLA Tencor corperation,
Milpitas, California, USA) was utilized to perpendicularly scan the line of shallow and deep
gratings.
Live cell imaging
Cells were plated at 40,000-50,000 cells ml-1
in 2 ml of media in 35 mm dishes. MDA-MB-231
cells were incubated for 2 hrs supplemented with blebbistatin (Sigma Aldrich), ML-7 (Sigma
Aldrich), Y-27632 (Calbiochem, Billerica, MA, USA), P5D2 1 integrin blocking antibody
(mouse mAb, ascites, from Mark Ginsberg, University of California, San Diego) [41], calyculin
A (Santa Cruz Biotechnology, Dallas, TX, USA) and MnCl2 (Fisher) and MTLn3 cells were
incubated for 12 hrs with supplemented with calyculin A, MnCl2, Y-27632, and P5D2 on contact
guidance cues in imaging media. Substrates with attached cells were inverted onto two strips of
double sided tape attached to a microscope slide to generate a flow chamber. The chamber was
filled with imaging media and sealed with a 1:1:1 mixture of vasoline, lanolin and paraffin wax.
Chambers were imaged by phase contrast microscopy on a heated stage at 37°C every 2 min for
12 hrs. Images were captured at 10× (NA 0.50, Nikon) as described above.
Cell centroids were identified and tracked manually using the MTrackJ plugins of
ImageJ (National Institutes of Health, Bethesda, MD, USA). Cell speed and directionality
were calculated over a time lag of 2 min averaged over 12 hrs as described in a previous
paper [15].
Fluorescence imaging
Cells were plated at 40,000-50,000 cells ml-1
in 2 ml of media in 35 mm dishes. MDA-MB-231
cells with 1µM Y-27632 were incubated for 5 hours, MDA-MB-231 cells with 0.1 µl ml-1
P5D2
antibody were incubated for 12 hrs and MTLn3 cells with 0.01 nM calyculin A and 0.1 mM
MnCl2 were incubated for 12 hours on highly aligned type I collagen fibrils, fixed with 4%
paraformaldehyde (Fisher), permeabolized with 0.5% triton-X (Fisher) and stained for F-actin,
pS19-myosin regulatory light chain (pS19-MRLC), and pY118-paxillin (pY118-Pax), a FA
protein. F-actin was stained using alexa 488-phalloidin (Molecular Probes) and pS19-MRLC
(mouse mAb, 1:50, 3675, Cell Signaling Technology, Danvers, Massachusetts, USA) and
pY118-Pax (rabbit pAb, 1:100, 2541, Cell Signaling Technology, Danvers, Massachusetts, USA)
were stained using antibodies [42]. The secondary antibodies were donkey anti-mouse Cy3 and
anti-rabbit Cy5 antibody (715-165-150 & 711-175-152, 1:400, Jackson Immuno Research, West
9
Grove, PA, USA). Fixed and stained cells were imaged by epifluorescence using a 20× air
objective (NA 0.45, Nikon) and a 60× oil objective (NA 1.49, Nikon) on the same microscope as
described above.
Fluorescence intensity was calculated using home build macros in ImageJ (National
Institutes of Health). Whole cell raw fluorescence intensity was calculated by adjusting the
threshold of a population of cells in one image (20×) or one cell (60×), outlining them and
logging the average thresholded intensity. The local background was calculated from the average
grey value of bands around each thresholded cell. Fluorescence was calculated as the difference
between whole cell raw fluorescence and background fluorescence. Stress fiber and FA raw
fluorescence intensity was calculated by first generating a stress fiber or FA mask using the F-
actin or pY118-Pax images, respectively. Images were background subtracted using a rolling ball
radius method (2 pixels) and a threshold was adjusted to clearly visualize stress fibers or FAs,
which were logged as regions of interest (ROIs). These ROIs were used to make a mask that
defined regions in the pS19-MRLC image to compute the stress fiber or FA raw fluorescence
intensity. The average length to width ratio of stress fibers was computed by fitting ellipses to
each stress fiber and computing the average for each condition. Background fluorescence was
calculated around the cell as described above and fluorescence was calculated as the difference
between whole cell raw fluorescence and background fluorescence.
Confocal imaging was carried out using 63× (NA 1.40, Leica Microsystems, Exton, PA,
USA) on a SP5X MP confocal microscope (Leica Microsystems). Z-slices were taken at 0.42 μm
steps. Stacks of F-actin and pMRLC images were analyzed in Image J. They were first filtered
using a mean filter. Contrast was adjusted to scale F-actin and pMRLC intensity similarly and
the F-actin and pMRLC channels were merged. Voxel depths in image properties were changed
to the slice distance and orthogonal views were produced in the xz- and yz-planes.
Statistics
The number of experiments and cells were stated in all the figure legends. At least three
independent experiments were conducted. In general, means were calculated with error bars
representing 95% confidence intervals. Differences between control and perturbation
experiments were determined using a two-tailed student’s t-test and significance was assigned
when p < 0.05. Predicted dual perturbation 95% confidence intervals were calculated by

10
summing the standard deviations of each perturbation and calculating a t-value with a weighted
average of the total number of experiments.
11
Results:
Diverse contact guidance cues elicit distinct migration responses
It has been shown that contact guidance drives cell migration along the long axis of aligned ECM
fibers or fiber mimics. While several methods have been used to present contact guidance cues, a
direct comparison between methods is lacking. Consequently, we compared a topographical cue
(gratings) and a chemical cue (CP lines of collagen) to highly aligned epitaxially grown
collagen fibrils (Fig. 1). We chose to examine two breast cancer cell lines (MDA-MB-231 and
MTLn3 cells) (Fig. 2). These cells have distinct migration modes in 3D (Fig. 2B) [30, 43] and
engage in contact guidance on aligned collagen fibrils with dramatically different fidelity [22].
MDA-MB-231 and MTLn3 cells are highly invasive [44, 45] and they both metastasize to the lung in
vivo [45-47]. MDA-MB-231 cells have been shown to be quantitatively more invasive than MTLn3
cells [44]. MDA-MB-231 cells elongate on most contact guidance cues and often times exhibit
bifurcated extensions (Fig. 2A). MTLn3 cells on the other hand only elongate on CP lines of
collagen and usually exhibit a much more spread phenotype with one broad protrusion (Fig. 2A).
We quantified both the contact guidance fidelity by calculating the directionality of movement
(Fig. 2C), which is the projection of movement in the direction of the contact guidance cue and
the migration speed (Fig. 2D). Migration on uniform surfaces of collagen result in low values of
directionality and approximately equal speeds in both cell lines. The strength of each contact
guidance cue differs. Shallow gratings induce weak contact guidance, whereas deep gratings
induce high contact guidance. Both grating conditions resulted in relatively high cell speed. CP
lines of collagen induce strong contact guidance in a similar fashion to deep gratings. Neither
gratings nor CP result in large differences in directionality between MDA-MB-231 and MTLn3
cells. On highly aligned collagen fibrils, the contact guidance response was intermediate.
Interestingly, MDA-MB-231 cells had almost a three-fold higher directionality than MTLn3 cells
on highly aligned collagen fibrils (p < 0.05), while at the same time migrating at roughly the
same speed (Figs. 1C and D). Given these differences between MDA-MB-231 and MTLn3 cells
in contact guidance on highly aligned collagen fibrils, we were interested in determining why
these cells respond uniquely to one particular directional cue.
Contractility and adhesion are regulators of migration mode-dependent contact guidance
efficiency
12
Several studies have shown that modulating contractility and adhesion through Rho-family
GTPases and integrin activation engenders plasticity to cells, allowing them to switch between
migrational modes [25, 29, 48]. In addition, MDA-MB-231 and MTLn3 cells exert different
traction forces on their surroundings [30, 49, 50]. Traction force is intimately tied to both
contraction and adhesion. Consequently, contractility and adhesion likely play roles in
determining contact guidance efficiency between cells of different migration modes. Because
MDA-MB-231 cells exert more traction force, we sought to decrease either the contractility or
adhesion. Conversely, MTLn3 cells exert less traction force, so we sought to increase either the
contractility or adhesion. Therefore, MDA-MB-231 cells on highly aligned collagen fibrils were
treated with blebbistatin (myosin II inhibitor, [51]), ML-7 (myosin light chain kinase inhibitor,
[52]), Y-27632 (Rho kinase inhibitor, [53]) or P5D2 antibody (β1-integrin adhesion inhibitor,
[41]) (Fig. 3 & 4). MTLn3 cells on the same substrates were treated with calyculin A (myosin
phosphatase inhibitor, [54]) or MnCl2 (integrin activator, [55]) (Fig. 5 & 6). We examined
contact guidance behavior as well as the spatial distribution and abundance of actomyosin
cytoskeletal and FA markers, namely F-actin, MRLC S19 phosphorylation (pS19-MRLC) and
paxillin pY118 phosphorylation (pY118-Pax). F-actin and pS19-MRLC tended to localize on
stress fiber structures in both MDA-MB-231 and MTLn3 cells, although there was some areas
where F-actin showed brighter staining than pS19-MRLC (lamellipodial extensions) or where
pS19-MRLC showed brighter staining than F-actin (lamella regions) (Fig. S1).
We first examined MDA-MB-231 cells with decreased contractility. Our
approach was to use sub-maximal inhibitor concentrations, allowing us to tune the
contractility in small increments, but also to limit off target effects. ROCK seems to be
unique in its effect on contact guidance (Fig. 3C). The only perturbation that affects cell
speed was blocking myosin II activity using blebbistatin (Fig. 3D). Doses of blebbistatin
above 30 M completely inhibit cell migration (data not shown), precluding our ability to
calculate directionality. Blocking MLCK or myosin II activity diminishes directionality
only slightly (Fig. 3C). On the other hand, blocking ROCK with sub-maximal doses of
Y-27632 dramatically diminishes the directionality, while not affecting speed to a great
extent (Fig. 3C and D), demonstrating that directionality and speed have different dose
responses. In addition, we tested whether adhesion modulation regulates migration
directionality. Submaximal doses of P5D2, a 1 integrin blocking antibody, decreases
13
cell directionality, but not cell speed. This mimics what is seen with ROCK inhibition. Both
ROCK inhibition and 1 integrin blocking result in lower whole cell F-actin content, pS19-
MRLC and pY118-Pax (Fig. 3E-G). These perturbations also result in shorter and less dense F-
actin bundles (Fig. 4C and D) and less pS19-MRLC localized to stress fibers and FAs (Fig. 4E
and G). Finally, pY118-Pax at FAs is also decreased (Fig. 4F). Given that decreases in ROCK-
mediated contractility and 1 integrin-mediated adhesion result in decreased directionality in
mesenchymal mode MDA-MB-231 cells, we decided to increase contractility and adhesion in
amoeboid cells to see if a mirrored result could be generated.
MTLn3 cells were treated with a contractility enhancer, calyculin A, a myosin
phosphatase inhibitor that enhances MRLC phosphorylation. High doses of calyculin A are toxic
and arrest migration (Fig. 8B and data not shown), but lower doses increase directionality by
almost two-fold (Fig. 5C). Migration speed is only decreased by ~20% (Fig. 5D). Similar to
MDA-MB-231 cells the dose response of directionality in response to contractility is different
than that for speed in MTLn3 cells. Additionally, when adhesion is enhanced by adding MnCl2,
which activates integrins and increases their affinity towards their ligands, MTLn3 directionality
increases (Fig. 5C). Migration speed is unaffected (Fig. 5D). Changing the contractility and
adhesion with submaximal doses of either calyculin A or MnCl2 results in no large changes in
whole cell pS19-MRLC or pY118-Pax level (Fig. 5F-G). However, stress fibers appear robustly
in MTLn3 cells treated with either calyculin A or MnCl2 (Fig. 6A-D). In addition, the pS19-
MRLC level on stress fibers increases as well as the pY118-Pax levels in FAs (Fig. 6E-G).
Decreasing contractility or adhesion in MDA-MB-231 cells results in diminished
directionality and increasing contractility or adhesion in MTLn3 cells results in enhanced
directionality. Speed is unaffected. However, we were interested if MDA-MB-231 cells could be
made more directional and MTLn3 cells could be made less directional on aligned fibrils.
Consequently, we used calyculin A and MnCl2 to enhance contractility and adhesion in MDA-
MB-231 cells (Fig. S2A). Directionality is enhanced, but speed is diminished. However, Y-
27632 and P5D2 antibody treatment of MTLn3 cells do not affect directionality or speed (Fig.
S2B).
Contractility and adhesion inhibition have a synergistic effect on speed, but additive or
saturated effect on directionality
14
In Fig. 3, we showed evidence that inhibiting ROCK-mediated contractility or 1 integrin-
mediated adhesion in MDA-MB-231 cells diminishes directionality. However, we were also
interested in how simultaneous changes in contractility and adhesion affect cell migration. Here,
we propose three possibilities to describe the response of dual perturbations (Fig. S3A). The
change in level of the cell response (migration directionality or speed) between control and
inhibition 1 in isolation and control and inhibition 2 in isolation is denoted by I1 and I2,
respectively (Fig. S3A). The predicted change in cell response when two perturbations are used
simultaneously is I1 + I2. If the response is addictive, the predicted response should match the
measured response. If the response is synergistic, then the predicted level will be larger than
experimental level. Saturated cell responses occur when the predicted level is smaller than the
expected level. Since maximum concentrations of inhibitors completely blocked cell migration
(data not shown), precluding our ability to calculate directionality, we probed sub-maximum
concentrations that perturbed directionality, but kept speed roughly unchanged. Thus, we
investigated dose responses of Y-27632 or P5D2 antibody on MDA-MB-231 cells (Fig. 7A-D).
At higher concentrations of Y-27632 (0.5 µM) cell directionality decreases to untreated levels
(black bars, Fig. 7A), but larger concentrations of Y-27632 (1 µM) dramatically decreases cell
directionality (gray bar, Fig. 7A). Maximally disrupting ROCK activity (10 µM Y-27632, white
bar) decreases directionality to the same extent as 1 M Y-27632 (Fig. 7A). Because the dose
response of directionality and speed were different, we defined a dose as a low dose if it does not
interrupt either directionality or speed (black bars). We defined a dose as a submaximal dose if it
interrupts directionality, but not speed (grey bars). Finally, maximal doses interrupt both
directionality and speed (white bars). We then treated MDA-MB-231 cells with intermediate or
sub-maximal concentrations of Y-27632 and P5D2 antibody and analyzed cell speed and
directionality. After blocking ROCK and β1 integrin adhesion with low doses of Y-27632 and
P5D2 antibody or a low dose of Y-27632 and submaximal dose of P5D2 antibody, cell
directionality exhibits an additive relationship, because no difference is seen between the
predicted and experimental levels. Only when two sub-maximal doses are used does a saturated
response ensue (Fig. 7E). This represents a lower bound on changing directionality through
contraction or adhesion that is well above 0. Interestingly, blocking ROCK and β1 integrin
adhesion with low or submaximal doses of Y-27632 and P5D2 antibody produces synergistic
effects on speed (Fig. 7F).
15
Contractility and adhesion enhancers have an additive or saturated effect on both
directionality and speed
When a perturbation enhances a response, the definitions for synergistic and saturated are
inverted. The change in level of the cell response between control and enhancer 1 in isolation
and control and enhancer 2 in isolation is denoted by E1 and E2, respectively (Fig. S3B). The
predicted change in cell response when two perturbations were used simultaneously is E1 + E2. If
the response is addictive, the predicted response should match the measured response. If the
response is synergistic, then the predicted level will be smaller than the experimental level.
Saturated cell responses occur when the predicted level is larger than the expected level. For the
same reasons described above we probed sub-maximum concentrations that perturbed
directionality, but kept speed unchanged. Thus, we investigated dose responses of calyculin A or
MnCl2 on MTLn3 cells (Fig. 8A-D). Mildly enhancing contractility (black bars, 0.001 nM
calyculin A) does not change MTLn3 cell directionality. At 0.002 nM calyculin A (gray bars),
cell directionality quantitatively increases, while speed remains roughly constant. At higher
concentrations of 0.01 nM calyculin A (white bars), cell directionality increases further, but
migration speed also decreases. Calyculin A concentrations above 0.01 nM were not assessed
due to cell toxicity or complete inhibition of cell migration. Low doses, submaximal and
maximal doses are defined as mentioned above. Enhancing contractility and adhesion with
intermediate doses of calyculin A and MnCl2 results in additive cell directionality. Only when a
maximal and submaximal dose of calyculin A and MnCl2 were combined is a saturated
directionality response observed (Fig. 8E and F). Again, directionality appears to reach a
saturating level that is well below the maximum of 1. Speed on the other hand is additive (Fig.
8E and F).
16
Discussion:
In this paper we show that the way in which contact guidance cues are presented robustly
controls the directional fidelity of cancer cells. Shallow gratings are relatively weak directional
cues, whereas deep gratings and CP lines of collagen are potent. Epitaxially grown, aligned
collagen fibrils result in intermediate potency, but result in differences between two model breast
cancer cell lines: MDA-MB-231 and MTLn3 cells. MDA-MB-231 cells are more directional
than MTLn3 cells and this may translate to quantitatively higher invasion and migration that is
seen in vivo [44]. Small decreases in ROCK-mediated contractility or 1 integrin-mediated
adhesion (Fig. 9B, blue oval with black circles) decreases directional fidelity in MDA-MB-231
cells (mesenchymal), whereas small increases (Fig. 9A, yellow oval with black circles) increases
directional fidelity. On the other hand, small decreases in ROCK-mediated contractility or 1
integrin-mediated adhesion (Fig. 9B, blue oval with gray squares) does not affect directionality
greatly in MTLn3 cells (amoeboid), but does decrease speed, whereas small increases (Fig. 9A,
yellow oval with gray squares) increases directionality and decreases speed. Inhibiting
contractility or making large decreases in ROCK-mediated contractility diminishes both speed
and directionality in MDA-MB-231 cells (Fig. 9A, purple oval). Interestingly, the level of
phosphorylation of pS19-MRLC in stress fibers and pY118-Pax in FAs appear to predict cell
directionality (Fig. 9C and D). These same conditions do not result in large changes in cell speed
(Fig. 9E and F), indicating that directionality correlates sensitively to changes in ROCK-
mediated myosin contractility and paxillin phosphorylation. When both contractility and
adhesion are tuned the resultant directionality is often additive, i.e. the result was the sum of the
changes seen in each single perturbation. Saturation is also observed indicating that there are
limits in the ability to tune contact guidance fidelity in different cell types by altering
contractility and adhesion. Migration speed on the other hand, is either additive or synergistic.
Potency of contact guidance cues in directing cell migration
Numerous approaches have been used to study contact guidance in vitro. However, these contact
guidance cues could either be potent or weak, so much work has focused on what features of the
cue enhance or degrade contact guidance fidelity. On gratings cell alignment percentage or
average directionality increases with increased pitch size (ridge + groove width), but more
sensitively with increased groove depth. The feature size used in this paper matches previously
work [10, 11, 56, 57] on non-cancer cells. Directionality from cell migration tracks was not
17
assessed in any of these studies, but static images were used to calculate the percentage of cells
aligned to within 10°. This percentage was 60% for fibroblasts and 10-20% for epithelial cells.
The cell directionality was greater than 0.9 for fibroblasts, whereas endothelial and smooth
muscle cells showed a directionality of 0.3, indicating that the phenotypes of the cancer cells
examined in this paper lie closer to the endothelial or smooth muscle cells. More contractile cells
like fibroblasts seem to engage in higher fidelity contact guidance than less contractile cells like
epithelial cells [9, 56-59]. In addition to gratings, CP has been used as a contact guidance cue.
The average directionality increases with increased line period [60, 61], spacing [15, 16] and
adhesiveness [15, 16]. The directionality of MTLn3 cells in this study matches well with what
we have seen previously [15]. When comparing gratings to CP lines of ECM, others have
shown that gratings are less potent than lines at dimensions that approximately match ours [62],
whereas larger dimensions show that gratings are more potent [63]. We show that indeed
potency depends on grating depth, but under the conditions that we probed no cell type
differences were found.
However, only when we used epitaxially grown, aligned collagen fibers did we observe
large differences between cell lines. First, it is possible that tuning either the gratings to be more
potent or the CP lines to be less potent would result in similar cell type differences. Indeed,
others have seen cell type differences on gratings [9, 56-59]. Potency of the contact guidance cue
is an important factor for in vitro studies. Directed migration in vivo often does not occur with
high fidelity, because of noise in the directional signal. This noise can lead to dramatically
different directional sensing outputs [64], so intermediate potencies are likely more appropriate
environments. Second, it is possible that the structure of collagen is important. Epitaxially grown,
aligned collagen fibers form D-bands structures with periodic gaps and overlap regions that
match well with collagen structures in vivo [20]. However, both CP lines of collagen and
gratings are coated with heterotrimeric unpolymerized collagen. Cells might be able to sense D-
banding, thus increasing directional fidelity [21]. Third, it is possible that the mechanical
properties govern this difference. Both gratings and CP lines of collagen are stiff. However,
epitaxial collagen assembled onto mica is only weakly attached to the surface and fibrils can be
remodeled through cell traction force. Future work will be focused on transferring collagen fibers
to flexible substrates and examining the role of mechanics in governing contact guidance in these
systems.
18
Myosin phosphorylation on stress fibers and paxillin phosphorylation in adhesions as
mediators of contact guidance
Others have shown that contact guidance depends on myosin contractility. Inhibiting myosin
contractility decreases alignment in smooth muscle cells [32], endothelial cells [34], MTLn3
cells [15] and neurons [37, 65]. Interestingly, contact guidance of T cells seems to be unaffected
by decreases in contractility [66]. This is consistent with the fact that T cells exert weak traction
forces. This observation agrees largely with our data showing that MTLn3 directionality does not
decrease below the control condition in response to decreases in contractility or adhesion (Fig.
9A and B) and further suggests that additional factors set the ranger over which cells can tune
their directionality on contact guidance cues. In our previous work, MTLn3 cell directionality
did decrease in response to decreases in contractility, but this was on a much more potent contact
guidance cue, CP lines of collagen [15]. The Rho/ROCK pathway seems to be the determining
factor for directional fidelity in osteoblasts [33], endothelial [34], stem cells [33] epithelial cells
[35, 36] and neuron cells [37] and both increases and decreases can tune up or down the
alignment of cells [35]. The Rho/ROCK pathway also appears to control contact guidance in 3D
[6]. Other Rho GTPases like Cdc42 or Rac [35, 36] and other myosin kinases like MLCK are
unimportant [37]. The dependence of directionality on Rho/ROCK is distinct to 1D, 2D or 3D
random migration systems, where Rac seems to be the driver of “directional migration” or
persistence [67]. Furthermore, in random motility others have shown a correlation between speed
and directional persistence [68]. However, we observe that directionality and speed are not
highly correlated (Fig. 9A and B). In random motility systems, polarization acts to enhance
speed, such that as directionality increases, speed increases as well through an F-actin retrograde
flow-dependent mechanism. Contact guidance likely relies on extrinsic polarity that is brought
about through the formation of contractile stress fibers templated by the aligned collagen fibers
and that operates differently than intrinsic polarity present during random migration.
In comparison to contractility, there have been fewer studies examining the requirements
of adhesion during contact guidance. Recently, 1 integrin was shown to be important in
confined migration [69] and 1 integrin is important in generating traction forces [24]. Both of
these lines of evidence indicate a role for 1 integrin during contact guidance. In addition, others
have shown that contact guidance fidelity is dependent on FA maturation [31], which was
assayed through morphological analysis of FAs, but no compositional analysis was performed.
19
Paxillin phosphorylation can mark FA maturation, but it also marks FAs with high turnover,
allowing cells to pull up FAs oriented away from the direction of the contact guidance cue
leading to enhanced orientation along the contact guidance cue [32]. In addition to contact
guidance, paxillin regulates durotaxis [70]. In particular, inhibition of the phosphorylation of
Y118 abrogates durotaxis by inhibiting force fluctuations at FAs. While contact guidance is not
the same as durotaxis it does share some features [71], particularly in the context of epitaxially
grown, aligned collagen fibers. Cells can deform the collagen fibrils attached to the mica. The
observed stiffness in the longitudinal direction is likely higher than that in the perpendicular
direction. This could be thought of as setting up a circumferential gradient in observed stiffness
based on the orientation of the cells, forcing cells to turn towards the stiffer direction, i.e. the
longitudinal direction. This could explain similarities in the contractile and adhesion apparatus
used in contact guidance and durotaxis.
Contractility and adhesion balancing regulate contact guidance
While both ROCK-mediated contractility and 1 integrin-mediated adhesion appear to regulate
contact guidance, their roles in controlling directionality are similar. We first posited a role for
contractility in contact guidance from earlier work [15], however this was on CP lines that
resulted in higher cell directionality. Our hypothesis was that while migration speed is a biphasic
function of contraction and adhesion, directionality was more or less monotonic with a possible
saturation point. Indeed, we observe saturating behavior for both MDA-MB-231 (Fig. 7) and
MTLn3 (Fig. 8), when combinations of larger perturbations are used. The current reason for this
saturation behavior is not known, however it is not due to the stalling of migration. For small
perturbations, the effects on contraction and adhesion are approximately additive, suggesting that
both contractility and adhesion share in determining directionality through stress fiber formation
brought on by MRLC phosphorylation. A recent modeling effort has examined dual
perturbations in contractility (motor function) and adhesion (clutch function) in regulating the
stiffness at which the maximum migration speed occurs [72]. Combinations of perturbations of
parameters that describe both the motor and clutch function cooperate to change the sensitivity of
the optimal stiffness. We also see changes in speed under dual perturbations that are additive, but
some are synergistic, i.e. the experimental response is more dramatic than the predicted response.
Feedback between contractility and adhesion might allow sensitivity in regulating migration
20
speed during contact guidance, even though smaller single perturbations seem to more
dramatically affect directionality during contact guidance.
We are beginning to understand the cytoskeletal structures, FA species and intracellular
signaling that is intrinsic to different forms of directional migration. Non-overlapping structures
and pathways seem to distinguish different directional sensing mechanisms. While chemotaxis,
directed migration in response to a soluble gradient, appears to be dependent on Cdc42 [73], N-
WASP [74] and cofilin [75], haptotaxis, directed migration in response to a insoluble matrix-
bound gradient, appears to be heavily dependent on Rac, Wave and Arp2/3 [76, 77]. Durotaxis
on the other hand requires the cycling of paxillin phosphorylation and FA force [70]. Finally,
contact guidance requires ROCK-mediated contractility and results in changes in paxillin
phosphorylation. Discovering the signaling pathways during each form of directed migration will
further our ability to predict migrational responses in the environments including the TME were
multiple directional cues are presented.
21
Conclusions:
In this paper we show that the potency of different contact guidance cues varies dramatically.
CP lines of collagen are highly potent, whereas gratings are less potent. Epitaxially grown,
aligned collagen fibrils represent intermediate potency that illuminates differences among breast
cancer cells with different migration mode. MDA-MB-231 cells (mesenchymal mode) sense
contact guidance with high fidelity, but this directional fidelity can be decreased by inhibiting
ROCK-mediated contractility and 1 integrin-mediated adhesion. In contrast, MTLn3 cells
(amoeboid mode) sense contact guidance with low fidelity, but this directional fidelity can be
increased by enhancing contractility or activating integrins. Dual perturbations of contractility
and adhesion result in additive changes in directionality, indicating that alterations in contraction
and adhesion are interchangeable. Perturbations in contractility and adhesion that generate
dramatic changes in directionality alter MRLC and paxillin phosphorylation slightly on a whole
cell level, but much more intensely when localized to stress fibers and in FAs. MRLC
phosphorylation on stress fibers and paxillin phosphorylation in FAs are poorly predictive of cell
migration speed on contact guidance cues, but predict directionality well across different
contractility and adhesion perturbations in two cell lines with distinct motility modes.
Acknowledgements:
We acknowledge Andrew Hillier, Joseph Petefish, Zhiqi Yao and Mir Md Hossen with help in
preparing and characterizing the collagen fibrils and gratings. ICS acknowledges support from
the National Institutes of Health/National Cancer Institute [R03CA184575] for general project
funding. The content is solely the responsibility of the authors and does not necessarily represent
the official views of the NIH.
.
22
References:
[1] Provenzano PP, Eliceiri KW, Campbell JM, Inman DR, White JG, Keely PJ. Collagen
reorganization at the tumor-stromal interface facilitates local invasion. BMC Med. 2006;4.
[2] Hanley CJ, Noble F, Ward M, Bullock M, Drifka C, Mellone M, et al. A subset of
myofibroblastic cancer-associated fibroblasts regulate collagen fiber elongation, which is
prognostic in multiple cancers. Oncotarget. 2016;7:6159-74.
[3] Malik R, Lelkes PI, Cukierman E. Biomechanical and biochemical remodeling of stromal
extracellular matrix in cancer. Trends Biotechnol. 2015;33:230-6.
[4] Peranzoni E, Rivas-Caicedo A, Bougherara H, Salmon H, Donnadieu E. Positive and
negative influence of the matrix architecture on antitumor immune surveillance. Cell Mol Life
Sci. 2013;70:4431-48.
[5] Guo C, Kaufman LJ. Flow and magnetic field induced collagen alignment. Biomaterials.
2007;28:1105-14.
[6] Riching KM, Cox BL, Salick MR, Pehlke C, Riching AS, Ponik SM, et al. 3D Collagen
Alignment Limits Protrusions to Enhance Breast Cancer Cell Persistence. Biophysical Journal.
2014;107:2546-58.
[7] Singh S, Bandini SB, Donnelly PE, Schwartz J, Schwarzbauer JE. A cell-assembled, spatially
aligned extracellular matrix to promote directed tissue development. J Mat Chem B.
2014;2:1449-53.
[8] Amatangelo MD, Bassi DE, Klein-Szanto AJP, Cukierman E. Stroma-derived three-
dimensional matrices are necessary and sufficient to promote desmoplastic differentiation of
normal fibroblasts. Am J Pathol. 2005;167:475-88.
[9] Clark P, Connolly P, Curtis ASG, Dow JAT, Wilkinson CDW. Topographical control of cell
behavior 2. Multiple grooved substrata. Development. 1990;108:635-44.
[10] Teixeira AI, Abrams GA, Bertics PJ, Murphy CJ, Nealey PF. Epithelial contact guidance on
well-defined micro- and nanostructured substrates. Journal of Cell Science. 2003;116:1881-92.
[11] Loesberg WA, te Riet J, van Delft F, Schon P, Figdor CG, Speller S, et al. The threshold at
which substrate nanogroove dimensions may influence fibroblast alignment and adhesion.
Biomaterials. 2007;28:3944-51.
[12] Tuft BW, Li SF, Xu LJ, Clarke JC, White SP, Guymon BA, et al. Photopolymerized
microfeatures for directed spiral ganglion neurite and Schwann cell growth. Biomaterials.
2013;34:42-54.
[13] Doyle AD, Wang FW, Matsumoto K, Yamada KM. One-dimensional topography underlies
three-dimensional fibrillar cell migration. Journal of Cell Biology. 2009;184:481-90.
[14] Maiuri P, Terriac E, Paul-Gilloteaux P, Vignaud T, McNally K, Onuffer J, et al. The first
World Cell Race. Current Biology. 2012;22:R673-R5.
[15] Romsey NR, Hou Y, Rodriguez LL, Schneider IC. The Number of Lines a Cell Contacts
and Cell Contractility Drive the Efficiency of Contact Guidance. Cell Mol Bioeng. 2014;7:122-
35.
[16] Borghi N, Lowndes M, Maruthamuthu V, Gardel ML, Nelson WJ. Regulation of cell motile
behavior by crosstalk between cadherin- and integrin-mediated adhesions. Proc Natl Acad Sci U
S A. 2010;107:13324-9.
[17] Csucs G, Quirin K, Danuser G. Locomotion of fish epidermal keratocytes on spatially
selective adhesion patterns. Cell Motility and the Cytoskeleton. 2007;64:856-67.
[18] Kandere-Grzybowska K, Campbell CJ, Mahmud G, Komarova Y, Soh S, Grzybowski BA.
Cell motility on micropatterned treadmills and tracks. Soft Matter. 2007;3:672-9.
23
[19] Jiang FZ, Horber H, Howard J, Muller DJ. Assembly of collagen into microribbons: effects
of pH and electrolytes. Journal of Structural Biology. 2004;148:268-78.
[20] Fang M, Goldstein EL, Matich EK, Orr BG, Holl MMB. Type I Collagen Self-Assembly:
The Roles of Substrate and Concentration. Langmuir. 2013;29:2330-8.
[21] Poole K, Khairy K, Friedrichs J, Franz C, Cisneros DA, Howard J, et al. Molecular-scale
topographic cues induce the orientation and directional movement of fibroblasts on two-
dimensional collagen surfaces. J Mol Biol. 2005;349:380-6.
[22] Wang J, Petefish JW, Hillier AC, Schneider IC. Epitaxially Grown Collagen Fibrils Reveal
Diversity in Contact Guidance Behavior among Cancer Cells. Langmuir. 2015;31:307-14.
[23] Cluzel C, Saltel F, Lussi J, Paulhe F, Imhof BA, Wehrle-Haller B. The mechanisms and
dynamics of αvβ3 integrin clustering in living cells. The Journal of Cell Biology. 2005;171:383-
92.
[24] Lin GL, Cohen DM, Desai RA, Breckenridge MT, Gao L, Humphries MJ, et al. Activation
of beta 1 but not beta 3 integrin increases cell traction forces. FEBS Lett. 2013;587:763-9.
[25] Carragher NO, Walker SM, Carragher LSA, Harris F, Sawyer TK, Brunton VG, et al.
Calpain 2 and Src dependence distinguishes mesenchymal and amoeboid modes of tumour cell
invasion: a link to integrin function. Oncogene. 2006;25:5726-40.
[26] Pasapera AM, Schneider IC, Rericha E, Schlaepfer DD, Waterman CM. Myosin II activity
regulates vinculin recruitment to focal adhesions through FAK-mediated paxillin
phosphorylation. Journal of Cell Biology. 2010;188:877-90.
[27] Zaidel-Bar R, Milo R, Kam Z, Geiger B. A paxillin tyrosine phosphorylation switch
regulates the assembly and form of cell-matrix adhesions. Journal of Cell Science.
2007;120:137-48.
[28] Webb DJ, Donais K, Whitmore LA, Thomas SM, Turner CE, Parsons JT, et al. FAK-Src
signalling through paxillin, ERK and MLCK regulates adhesion disassembly. Nature Cell
Biology. 2004;6:154-+.
[29] Sahai E, Marshall CJ. Differing modes of tumour cell invasion have distinct requirements
for Rho/ROCK signalling and extracellular proteolysis. Nature Cell Biology. 2003;5:711-9.
[30] Wyckoff JB, Pinner SE, Gschmeissner S, Condeelis JS, Sahai E. ROCK- and myosin-
dependent matrix deformation enables protease-independent tumor-cell invasion in vivo. Current
Biology. 2006;16:1515-23.
[31] Cassidy JW, Roberts JN, Smith CA, Robertson M, White K, Biggs MJ, et al. Osteogenic
lineage restriction by osteoprogenitors cultured on nanometric grooved surfaces: The role of
focal adhesion maturation. Acta Biomater. 2014;10:651-60.
[32] Saito AC, Matsui TS, Ohishi T, Sato M, Deguchi S. Contact guidance of smooth muscle
cells is associated with tension-mediated adhesion maturation. Experimental Cell Research.
2014;327:1-11.
[33] Calzado-Martin A, Mendez-Vilas A, Multigner M, Saldana L, Gonzalez-Carrasco JL,
Gonzalez-Martin ML, et al. On the role of RhoA/ROCK signaling in contact guidance of bone-
forming cells on anisotropic Ti6Al4V surfaces. Acta Biomater. 2011;7:1890-901.
[34] Franco D, Klingauf M, Bednarzik M, Cecchini M, Kurtcuoglu V, Gobrecht J, et al. Control
of initial endothelial spreading by topographic activation of focal adhesion kinase. Soft Matter.
2011;7:7313-24.
[35] Rajnicek AM, Foubister LE, McCaig CD. Alignment of corneal and lens epithelial cells by
co-operative effects of substratum topography and DC electric fields. Biomaterials.
2008;29:2082-95.
24
[36] Rajnicek AM, Foubister LE, McCaig CD. Prioritising guidance cues: Directional migration
induced by substratum contours and electrical gradients is controlled by a rho/cdc42 switch.
Developmental Biology. 2007;312:448-60.
[37] Ferrari A, Cecchini M, Serresi M, Faraci P, Pisignano D, Beltram F. Neuronal polarity
selection by topography-induced focal adhesion control. Biomaterials. 2010;31:4682-94.
[38] Waterman-Storer CM. Microtubule/Organelle Motility Assays. Current Protocols in Cell
Biology: John Wiley & Sons, Inc.; 2001.
[39] Singh BK, Hillier AC. Surface plasmon resonance imaging of biomolecular interactions on
a grating-based sensor array. Analytical Chemistry. 2006;78:2009-18.
[40] Edelstein A, Amodaj N, Hoover K, Vale R, Stuurman N. Computer Control of Microscopes
Using µManager: John Wiley & Sons, Inc.; 2010.
[41] Dittel BN, McCarthy JB, Wayner EA, Lebien TW. Regulation of Human B-cell Precursor
Adhesion to Bone-marrow Stromal Cells by Cytokines That Exert Opposing Effects on the
Expression of Vascular Cell-adhesion Molecule-1 (VCAM-1). Blood. 1993;81:2272-82.
[42] Schneider IC, Hays CK, Waterman CM. Epidermal Growth Factor-induced Contraction
Regulates Paxillin Phosphorylation to Temporally Separate Traction Generation from De-
adhesion. Molecular Biology of the Cell. 2009;20:3155-67.
[43] Wolf K, Mazo I, Leung H, Engelke K, von Andrian UH, Deryugina EI, et al. Compensation
mechanism in tumor cell migration: mesenchymal-amoeboid transition after blocking of
pericellular proteolysis. Journal of Cell Biology. 2003;160:267-77.
[44] Zhou ZN, Sharma VP, Beaty BT, Roh-Johnson M, Peterson EA, Van Rooijen N, et al.
Autocrine HBEGF expression promotes breast cancer intravasation, metastasis and macrophage-
independent invasion in vivo. Oncogene. 2014;33:3784-93.
[45] Wang Y, Lam JB, Lam KSL, Liu J, Lam MC, Hoo RLC, et al. Adiponectin modulates the
glycogen synthase kinase-3 beta/beta-catenin signaling pathway and attenuates mammary
tumorigenesis of MDA-MB-231 cells in nude mice. Cancer Research. 2006;66:11462-70.
[46] van Nimwegen MJ, Verkoeijen S, van Buren L, Burg D, de Water BV. Requirement for
focal adhesion kinase in the early phase of mammary adenocarcinoma lung metastasis formation.
Cancer Research. 2005;65:4698-706.
[47] Doerr R, Zvibel I, Chiuten D, Dolimpio J, Reid LM. Clonal growth of tumors on tissue-
specific biomatrices and correlation with organ specificity of metastases. Cancer Research.
1989;49:384-92.
[48] Sanz-Moreno V, Gadea G, Ahn J, Paterson H, Marra P, Pinner S, et al. Rac Activation and
Inactivation Control Plasticity of Tumor Cell Movement. Cell. 2008;135:510-23.
[49] Kraning-Rush CM, Carey SP, Califano JP, Smith BN, Reinhart-King CA. The role of the
cytoskeleton in cellular force generation in 2D and 3D environments. Phys Biol. 2011;8.
[50] Mierke CT, Rosel D, Fabry B, Brabek J. Contractile forces in tumor cell migration. Eur J
Cell Biol. 2008;87:669-76.
[51] Straight AF, Cheung A, Limouze J, Chen I, Westwood NJ, Sellers JR, et al. Dissecting
temporal and spatial control of cytokinesis with a myosin II inhibitor. Science. 2003;299:1743-7.
[52] Saitoh M, Ishikawa T, Matsushima S, Naka M, Hidaka H. Selective-inhibition of Catalytic
Activity of Smooth-muscle Myosin Light Chain Kinase. Journal of Biological Chemistry.
1987;262:7796-801.
[53] Uehata M, Ishizaki T, Satoh H, Ono T, Kawahara T, Morishita T, et al. Calcium
sensitization of smooth muscle mediated by a Rho-associated protein kinase in hypertension.
Nature. 1997;389:990-4.
25
[54] Takai A, Bialojan C, Troschka M, Ruegg JC. Smooth-muscle Myosin Phosphatase
Inhibition and Force Enhancement by Black Sponge Toxin. FEBS Lett. 1987;217:81-4.
[55] Bazzoni G, Shih DT, Buck CA, Hemler ME. Monoclonal-antibody 9EG7 Defines a Novel
Beta(1) Integrin Epitope Induced by Soluble Ligand and Manganese, but Inhibited by Calcium.
Journal of Biological Chemistry. 1995;270:25570-7.
[56] Fraser SA, Ting YH, Mallon KS, Wendt AE, Murphy CJ, Nealey PF. Sub-micron and
nanoscale feature depth modulates alignment of stromal fibroblasts and corneal epithelial cells in
serum-rich and serum-free media. J Biomed Mater Res Part A. 2008;86A:725-35.
[57] Biela SA, Su Y, Spatz JP, Kemkemer R. Different sensitivity of human endothelial cells,
smooth muscle cells and fibroblasts to topography in the nano-micro range. Acta Biomater.
2009;5:2460-6.
[58] Clark P, Connolly P, Curtis ASG, Dow JAT, Wilkinson CDW. Cell guidance by ultrafine
topography in vitro. Journal of Cell Science. 1991;99:73-7.
[59] Pot SA, Liliensiek SJ, Myrna KE, Bentley E, Jester JV, Nealey PF, et al. Nanoscale
Topography-Induced Modulation of Fundamental Cell Behaviors of Rabbit Corneal Keratocytes,
Fibroblasts, and Myofibroblasts. Invest Ophthalmol Vis Sci. 2010;51:1373-81.
[60] Clark P, Connolly P, Moores GR. Cell guidance by micropatterned adhesiveness in vitro.
Journal of Cell Science. 1992;103:287-92.
[61] Kasten A, Naser T, Brullhoff K, Fiedler J, Muller P, Moller M, et al. Guidance of
Mesenchymal Stem Cells on Fibronectin Structured Hydrogel Films. PLoS One. 2014;9.
[62] Britland S, Morgan H, WojiakStodart B, Riehle M, Curtis A, Wilkinson C. Synergistic and
hierarchical adhesive and topographic guidance of BHK cells. Experimental Cell Research.
1996;228:313-25.
[63] Charest JL, Eliason MT, Garcia AJ, King WP. Combined microscale mechanical
topography and chemical patterns on polymer cell culture substrates. Biomaterials.
2006;27:2487-94.
[64] Tonazzini I, Meucci S, Faraci P, Beltram F, Cecchini M. Neuronal differentiation on
anisotropic substrates and the influence of nanotopographical noise on neurite contact guidance.
Biomaterials. 2013;34:6027-36.
[65] Spedden E, Wiens MR, Demirel MC, Staii C. Effects of Surface Asymmetry on Neuronal
Growth. PLoS One. 2014;9.
[66] Kwon KW, Park H, Song KH, Choi JC, Ahn H, Park MJ, et al. Nanotopography-Guided
Migration of T Cells. J Immunol. 2012;189:2266-73.
[67] Pankov R, Endo Y, Even-Ram S, Araki M, Clark K, Cukierman E, et al. A Rac switch
regulates random versus directionally persistent cell migration. Journal of Cell Biology.
2005;170:793-802.
[68] Maiuri P, Rupprecht JF, Wieser S, Ruprecht V, Benichou O, Carpi N, et al. Actin Flows
Mediate a Universal Coupling between Cell Speed and Cell Persistence. Cell. 2015;161:374-86.
[69] Paul CD, Shea DJ, Mahoney MR, Chai A, Laney V, Hung WC, et al. Interplay of the
physical microenvironment, contact guidance, and intracellular signaling in cell decision making.
Faseb Journal. 2016;30:2161-70.
[70] Plotnikov SV, Pasapera AM, Sabass B, Waterman CM. Force Fluctuations within Focal
Adhesions Mediate ECM-Rigidity Sensing to Guide Directed Cell Migration. Cell.
2012;151:1513-27.
26
[71] Janson IA, Putnam AJ. Extracellular matrix elasticity and topography: Material-based cues
that affect cell function via conserved mechanisms. J Biomed Mater Res Part A. 2015;103:1246-
58.
[72] Bangasser BL, Rosenfeld SS, Odde DJ. Determinants of Maximal Force Transmission in a
Motor-Clutch Model of Cell Traction in a Compliant Microenvironment. Biophysical Journal.
2013;105:581-92.
[73] Allen WE, Zicha D, Ridley AJ, Jones GE. A role for Cdc42 in macrophage chemotaxis.
Journal of Cell Biology. 1998;141:1147-57.
[74] King SJ, Worth DC, Scales TME, Monypenny J, Jones GE, Parsons M. beta 1 integrins
regulate fibroblast chemotaxis through control of N-WASP stability. Embo J. 2011;30:1705-18.
[75] Mouneimne G, DesMarais V, Sidani M, Scemes E, Wang WG, Song XY, et al. Spatial and
temporal control of cofilin activity is required for directional sensing during chemotaxis. Current
Biology. 2006;16:2193-205.
[76] Wu CY, Asokan SB, Berginski ME, Haynes EM, Sharpless NE, Griffith JD, et al. Arp2/3 Is
Critical for Lamellipodia and Response to Extracellular Matrix Cues but Is Dispensable for
Chemotaxis. Cell. 2012;148:973-87.
[77] King SJ, Asokan SB, Haynes EM, Zimmerman SP, Rotty JD, Alb JG, et al. Lamellipodia
are crucial for haptotactic sensing and response. Journal of Cell Science. 2016;129:2329-42.
27
Figure legends:
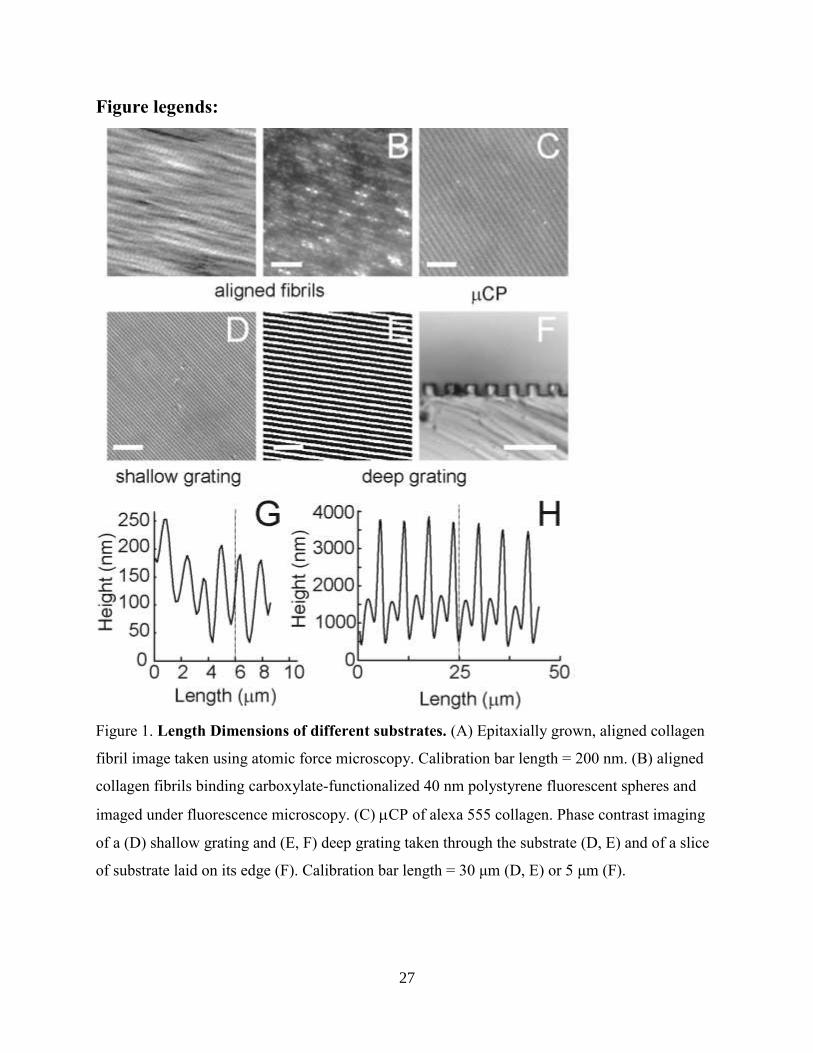
Figure 1. Length Dimensions of different substrates. (A) Epitaxially grown, aligned collagen
fibril image taken using atomic force microscopy. Calibration bar length = 200 nm. (B) aligned
collagen fibrils binding carboxylate-functionalized 40 nm polystyrene fluorescent spheres and
imaged under fluorescence microscopy. (C) CP of alexa 555 collagen. Phase contrast imaging
of a (D) shallow grating and (E, F) deep grating taken through the substrate (D, E) and of a slice
of substrate laid on its edge (F). Calibration bar length = 30 μm (D, E) or 5 μm (F).
28
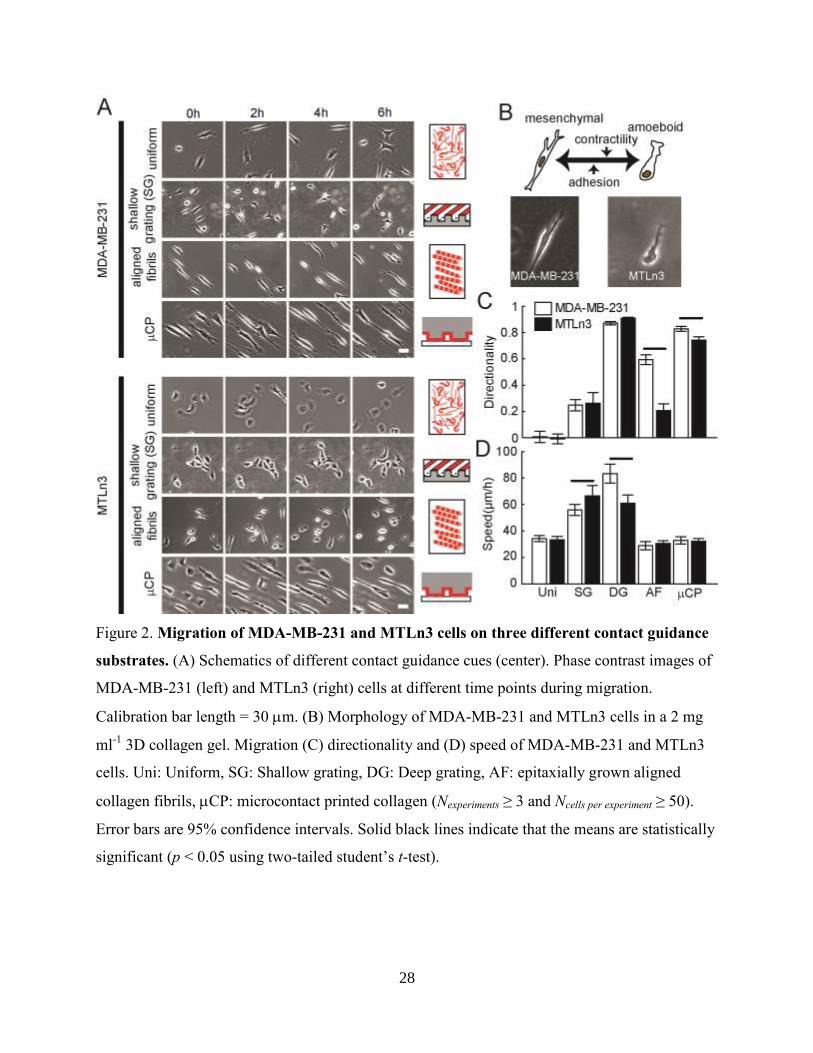
Figure 2. Migration of MDA-MB-231 and MTLn3 cells on three different contact guidance
substrates. (A) Schematics of different contact guidance cues (center). Phase contrast images of
MDA-MB-231 (left) and MTLn3 (right) cells at different time points during migration.
Calibration bar length = 30 m. (B) Morphology of MDA-MB-231 and MTLn3 cells in a 2 mg
ml-1
3D collagen gel. Migration (C) directionality and (D) speed of MDA-MB-231 and MTLn3
cells. Uni: Uniform, SG: Shallow grating, DG: Deep grating, AF: epitaxially grown aligned
collagen fibrils, CP: microcontact printed collagen (Nexperiments ≥ 3 and Ncells per experiment ≥ 50).
Error bars are 95% confidence intervals. Solid black lines indicate that the means are statistically
significant (p < 0.05 using two-tailed student’s t-test).
29
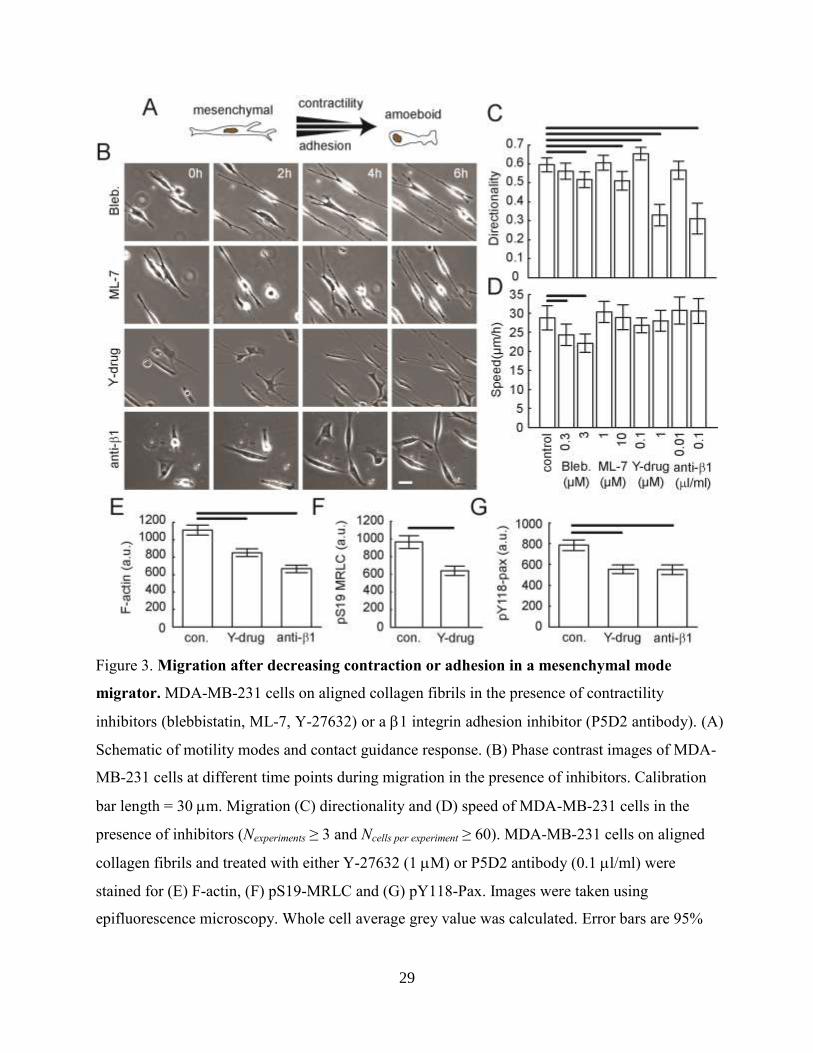
Figure 3. Migration after decreasing contraction or adhesion in a mesenchymal mode
migrator. MDA-MB-231 cells on aligned collagen fibrils in the presence of contractility
inhibitors (blebbistatin, ML-7, Y-27632) or a 1 integrin adhesion inhibitor (P5D2 antibody). (A)
Schematic of motility modes and contact guidance response. (B) Phase contrast images of MDA-
MB-231 cells at different time points during migration in the presence of inhibitors. Calibration
bar length = 30 m. Migration (C) directionality and (D) speed of MDA-MB-231 cells in the
presence of inhibitors (Nexperiments ≥ 3 and Ncells per experiment ≥ 60). MDA-MB-231 cells on aligned
collagen fibrils and treated with either Y-27632 (1 M) or P5D2 antibody (0.1 l/ml) were
stained for (E) F-actin, (F) pS19-MRLC and (G) pY118-Pax. Images were taken using
epifluorescence microscopy. Whole cell average grey value was calculated. Error bars are 95%

30
confidence intervals. Solid black lines indicate that the means are statistically significant (p <
0.05 using two-tailed student’s t-test).
31
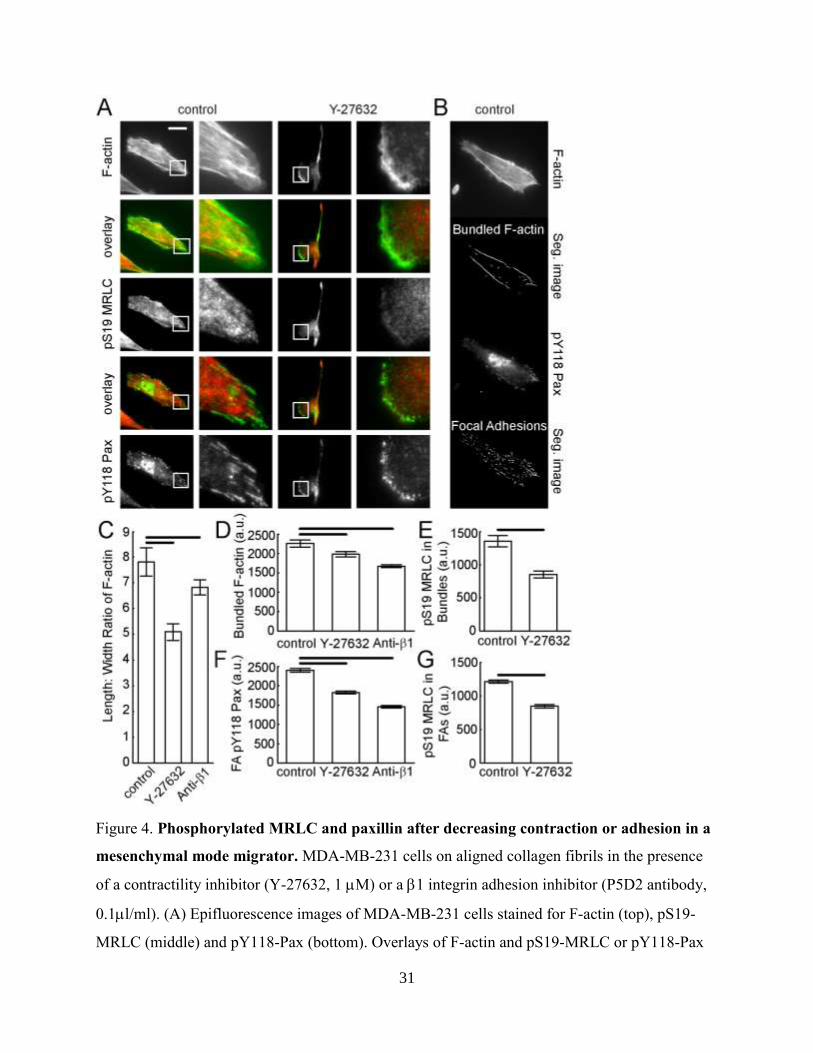
Figure 4. Phosphorylated MRLC and paxillin after decreasing contraction or adhesion in a
mesenchymal mode migrator. MDA-MB-231 cells on aligned collagen fibrils in the presence
of a contractility inhibitor (Y-27632, 1 M) or a 1 integrin adhesion inhibitor (P5D2 antibody,
0.1l/ml). (A) Epifluorescence images of MDA-MB-231 cells stained for F-actin (top), pS19-
MRLC (middle) and pY118-Pax (bottom). Overlays of F-actin and pS19-MRLC or pY118-Pax
32
and pS19-MRLC are included. Zoomed region is indicated by the white box and is shown to the
right. Calibration bar length = 30 m. (B) Sample images showing segmented F-actin bundles
and FAs. (C) Average aspect ratio of F-actin bundles. (D) Mean grey value of segmented F-actin
bundles. (E) Mean grey value of pS19-MRLC within regions on F-actin bundles. (F) Mean grey
value of pY118-Pax on segmented FAs. (G) Mean grey value of pS19-MRLC on segmented FAs.
(Nexperiments ≥ 3 and Ncells per experiment ≥ 26). Error bars are 95% confidence intervals. Solid black
lines indicate that the means are statistically significant (p < 0.05 using two-tailed student’s t-
test).
33
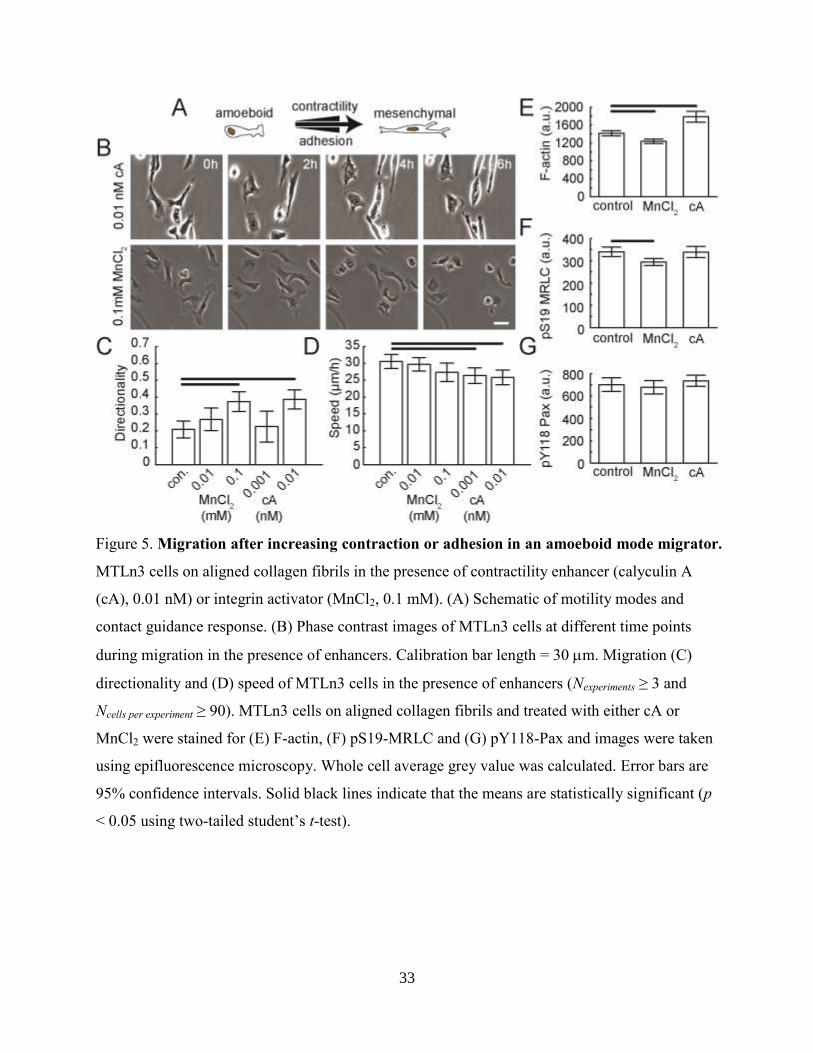
Figure 5. Migration after increasing contraction or adhesion in an amoeboid mode migrator.
MTLn3 cells on aligned collagen fibrils in the presence of contractility enhancer (calyculin A
(cA), 0.01 nM) or integrin activator (MnCl2, 0.1 mM). (A) Schematic of motility modes and
contact guidance response. (B) Phase contrast images of MTLn3 cells at different time points
during migration in the presence of enhancers. Calibration bar length = 30 m. Migration (C)
directionality and (D) speed of MTLn3 cells in the presence of enhancers (Nexperiments ≥ 3 and
Ncells per experiment ≥ 90). MTLn3 cells on aligned collagen fibrils and treated with either cA or
MnCl2 were stained for (E) F-actin, (F) pS19-MRLC and (G) pY118-Pax and images were taken
using epifluorescence microscopy. Whole cell average grey value was calculated. Error bars are
95% confidence intervals. Solid black lines indicate that the means are statistically significant (p
< 0.05 using two-tailed student’s t-test).
34
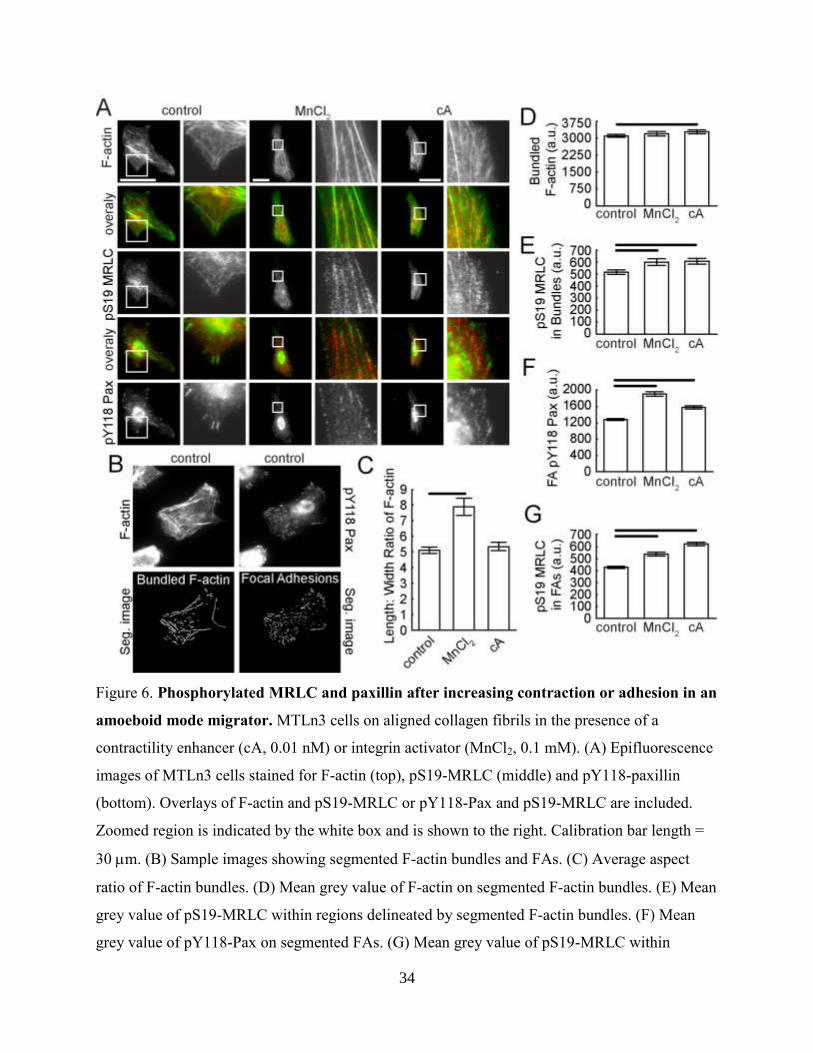
Figure 6. Phosphorylated MRLC and paxillin after increasing contraction or adhesion in an
amoeboid mode migrator. MTLn3 cells on aligned collagen fibrils in the presence of a
contractility enhancer (cA, 0.01 nM) or integrin activator (MnCl2, 0.1 mM). (A) Epifluorescence
images of MTLn3 cells stained for F-actin (top), pS19-MRLC (middle) and pY118-paxillin
(bottom). Overlays of F-actin and pS19-MRLC or pY118-Pax and pS19-MRLC are included.
Zoomed region is indicated by the white box and is shown to the right. Calibration bar length =
30 m. (B) Sample images showing segmented F-actin bundles and FAs. (C) Average aspect
ratio of F-actin bundles. (D) Mean grey value of F-actin on segmented F-actin bundles. (E) Mean
grey value of pS19-MRLC within regions delineated by segmented F-actin bundles. (F) Mean
grey value of pY118-Pax on segmented FAs. (G) Mean grey value of pS19-MRLC within

35
regions delineated by segmented FAs (Nexperiments ≥ 3 and Ncells per experiment ≥ 27). Error bars are 95%
confidence intervals. Solid black lines indicate that the means are statistically significant (p <
0.05 using two-tailed student’s t-test).
36
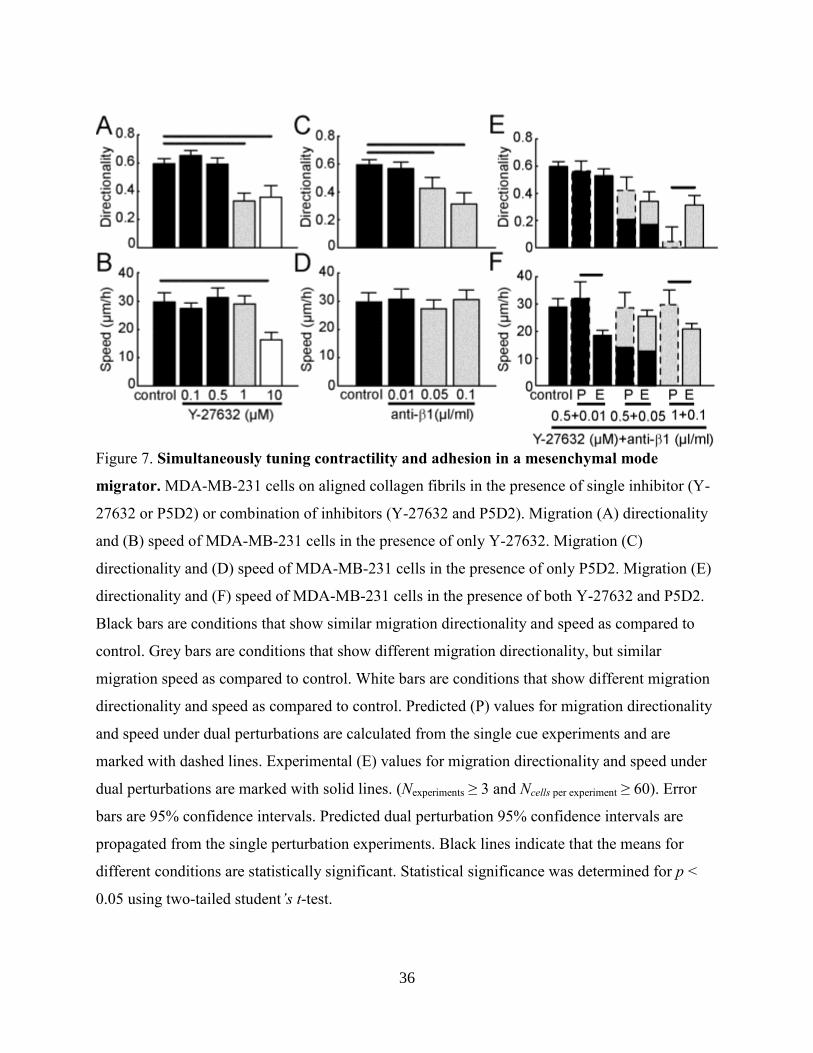
Figure 7. Simultaneously tuning contractility and adhesion in a mesenchymal mode
migrator. MDA-MB-231 cells on aligned collagen fibrils in the presence of single inhibitor (Y-
27632 or P5D2) or combination of inhibitors (Y-27632 and P5D2). Migration (A) directionality
and (B) speed of MDA-MB-231 cells in the presence of only Y-27632. Migration (C)
directionality and (D) speed of MDA-MB-231 cells in the presence of only P5D2. Migration (E)
directionality and (F) speed of MDA-MB-231 cells in the presence of both Y-27632 and P5D2.
Black bars are conditions that show similar migration directionality and speed as compared to
control. Grey bars are conditions that show different migration directionality, but similar
migration speed as compared to control. White bars are conditions that show different migration
directionality and speed as compared to control. Predicted (P) values for migration directionality
and speed under dual perturbations are calculated from the single cue experiments and are
marked with dashed lines. Experimental (E) values for migration directionality and speed under
dual perturbations are marked with solid lines. (Nexperiments ≥ 3 and Ncells per experiment ≥ 60). Error
bars are 95% confidence intervals. Predicted dual perturbation 95% confidence intervals are
propagated from the single perturbation experiments. Black lines indicate that the means for
different conditions are statistically significant. Statistical significance was determined for p <
0.05 using two-tailed student’s t-test.
37
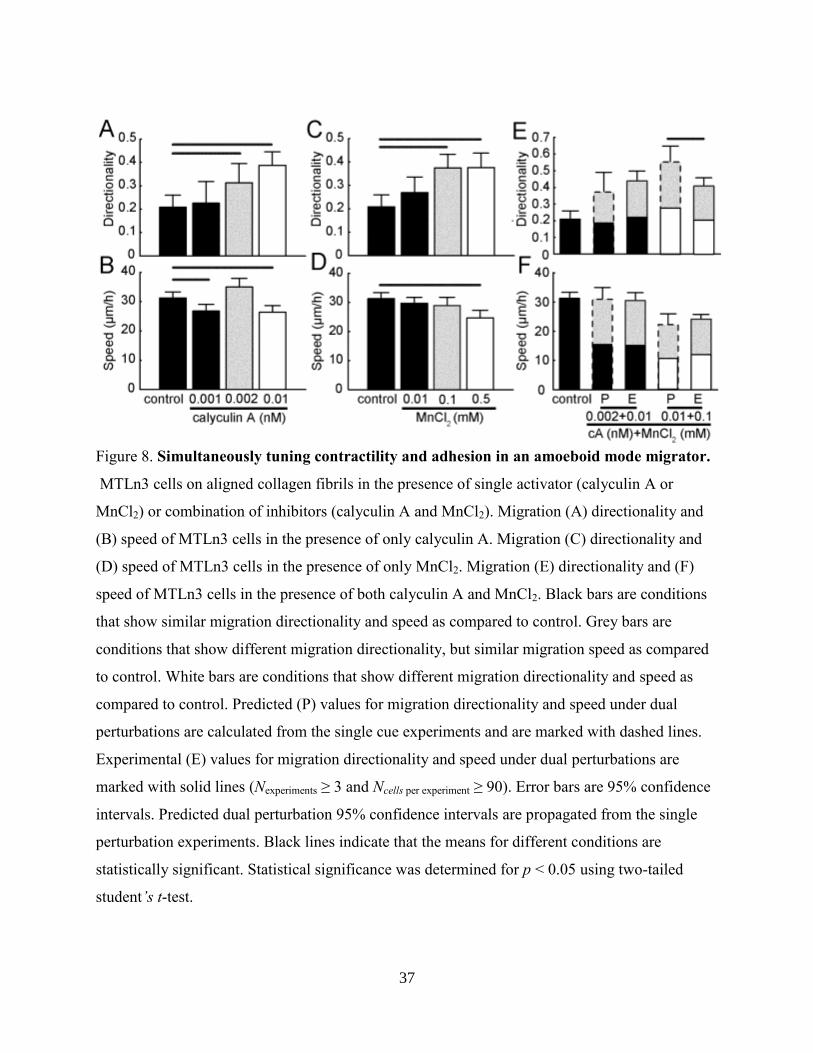
Figure 8. Simultaneously tuning contractility and adhesion in an amoeboid mode migrator.
MTLn3 cells on aligned collagen fibrils in the presence of single activator (calyculin A or
MnCl2) or combination of inhibitors (calyculin A and MnCl2). Migration (A) directionality and
(B) speed of MTLn3 cells in the presence of only calyculin A. Migration (C) directionality and
(D) speed of MTLn3 cells in the presence of only MnCl2. Migration (E) directionality and (F)
speed of MTLn3 cells in the presence of both calyculin A and MnCl2. Black bars are conditions
that show similar migration directionality and speed as compared to control. Grey bars are
conditions that show different migration directionality, but similar migration speed as compared
to control. White bars are conditions that show different migration directionality and speed as
compared to control. Predicted (P) values for migration directionality and speed under dual
perturbations are calculated from the single cue experiments and are marked with dashed lines.
Experimental (E) values for migration directionality and speed under dual perturbations are
marked with solid lines (Nexperiments ≥ 3 and Ncells per experiment ≥ 90). Error bars are 95% confidence
intervals. Predicted dual perturbation 95% confidence intervals are propagated from the single
perturbation experiments. Black lines indicate that the means for different conditions are
statistically significant. Statistical significance was determined for p < 0.05 using two-tailed
student’s t-test.
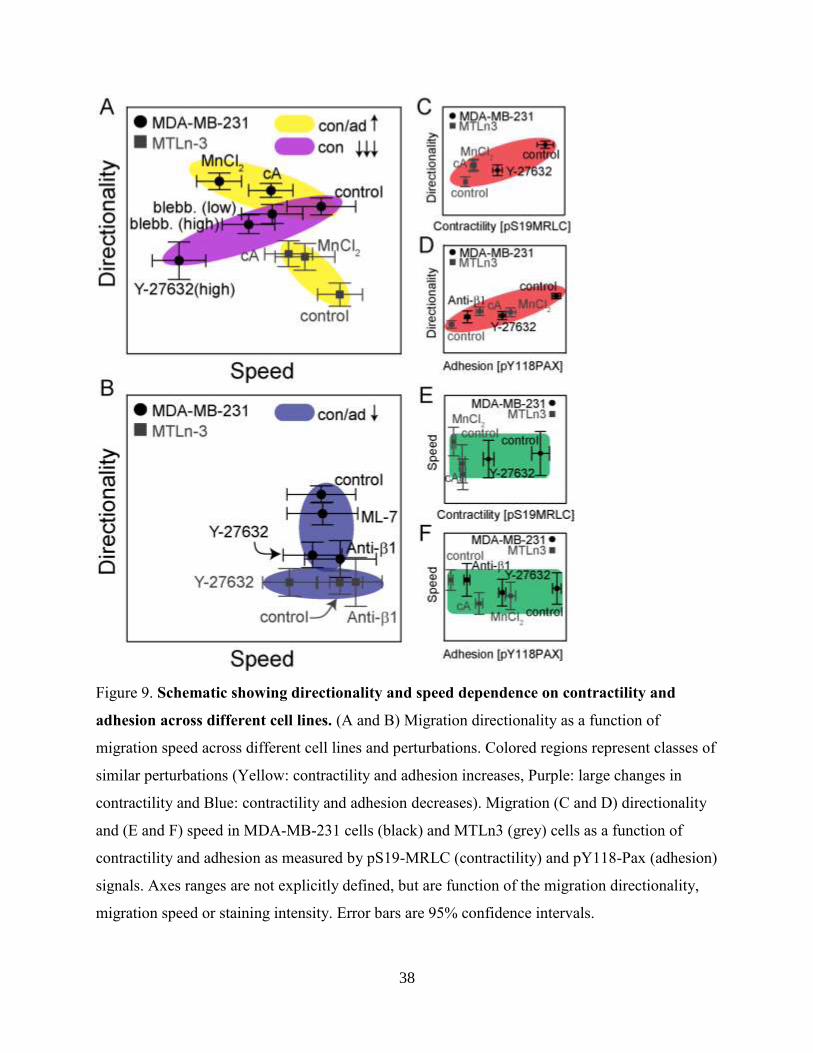
38
Figure 9. Schematic showing directionality and speed dependence on contractility and
adhesion across different cell lines. (A and B) Migration directionality as a function of
migration speed across different cell lines and perturbations. Colored regions represent classes of
similar perturbations (Yellow: contractility and adhesion increases, Purple: large changes in
contractility and Blue: contractility and adhesion decreases). Migration (C and D) directionality
and (E and F) speed in MDA-MB-231 cells (black) and MTLn3 (grey) cells as a function of
contractility and adhesion as measured by pS19-MRLC (contractility) and pY118-Pax (adhesion)
signals. Axes ranges are not explicitly defined, but are function of the migration directionality,
migration speed or staining intensity. Error bars are 95% confidence intervals.
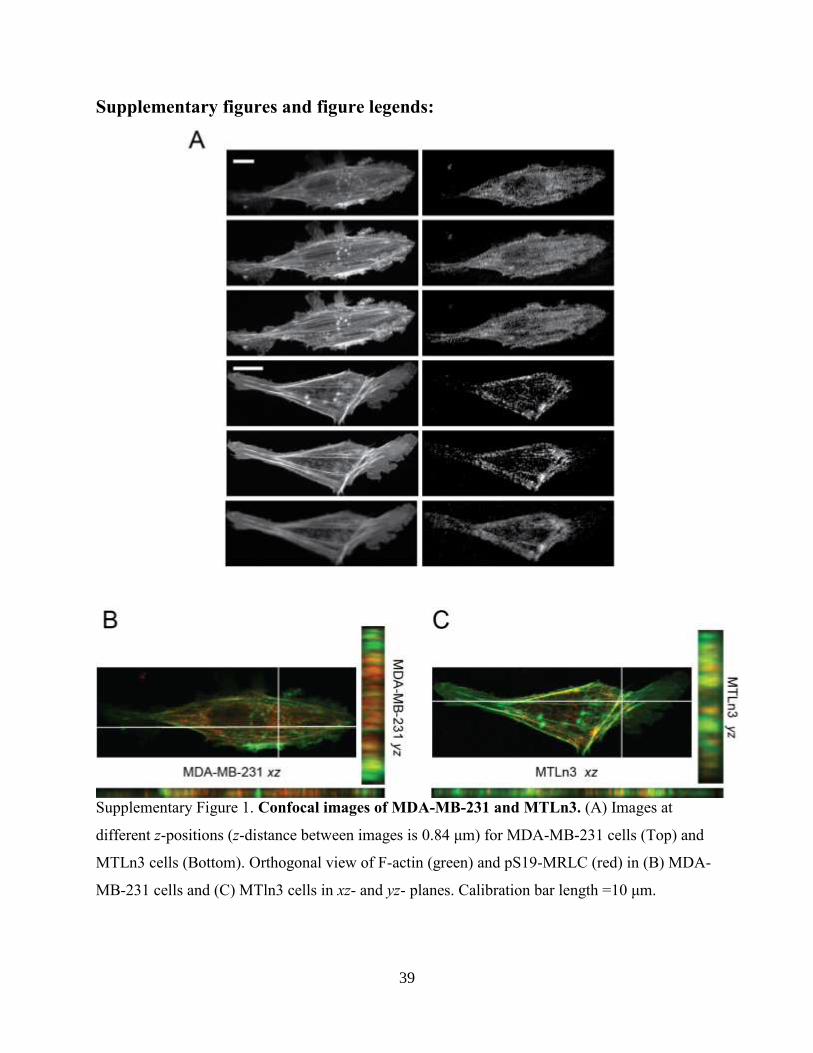
39
Supplementary figures and figure legends:
Supplementary Figure 1. Confocal images of MDA-MB-231 and MTLn3. (A) Images at
different z-positions (z-distance between images is 0.84 μm) for MDA-MB-231 cells (Top) and
MTLn3 cells (Bottom). Orthogonal view of F-actin (green) and pS19-MRLC (red) in (B) MDA-
MB-231 cells and (C) MTln3 cells in xz- and yz- planes. Calibration bar length =10 μm.
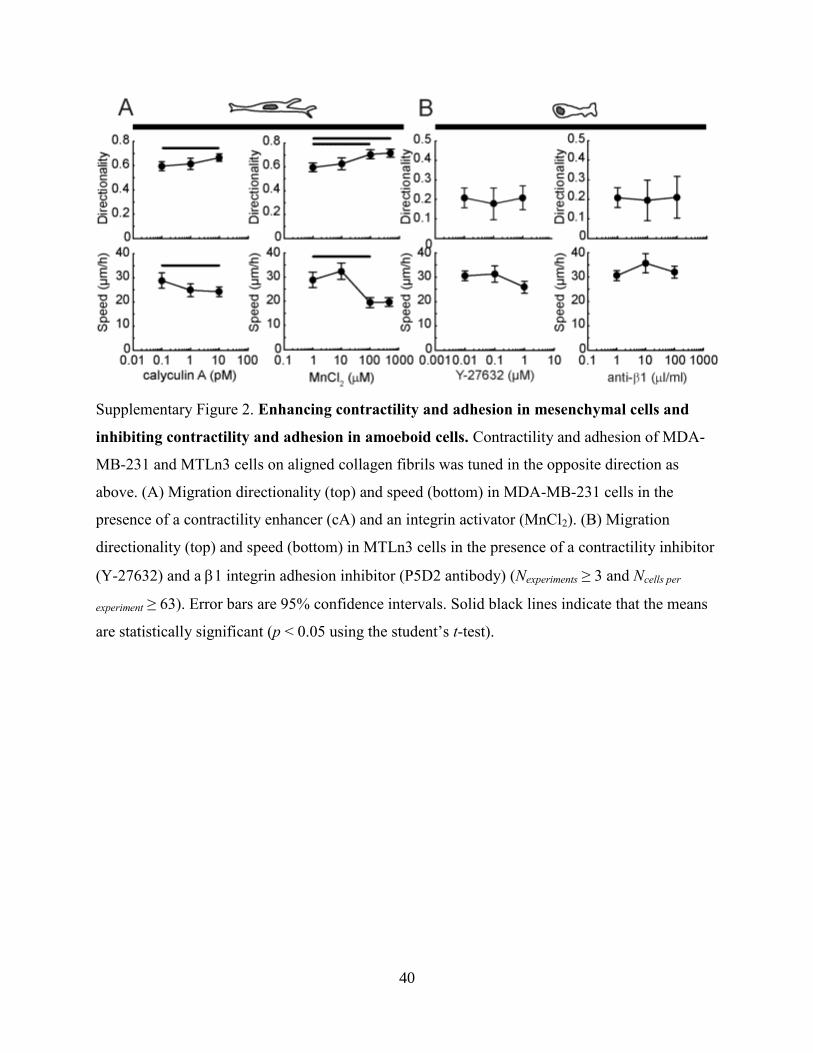
40
Supplementary Figure 2. Enhancing contractility and adhesion in mesenchymal cells and
inhibiting contractility and adhesion in amoeboid cells. Contractility and adhesion of MDA-
MB-231 and MTLn3 cells on aligned collagen fibrils was tuned in the opposite direction as
above. (A) Migration directionality (top) and speed (bottom) in MDA-MB-231 cells in the
presence of a contractility enhancer (cA) and an integrin activator (MnCl2). (B) Migration
directionality (top) and speed (bottom) in MTLn3 cells in the presence of a contractility inhibitor
(Y-27632) and a 1 integrin adhesion inhibitor (P5D2 antibody) (Nexperiments ≥ 3 and Ncells per
experiment ≥ 63). Error bars are 95% confidence intervals. Solid black lines indicate that the means
are statistically significant (p < 0.05 using the student’s t-test).
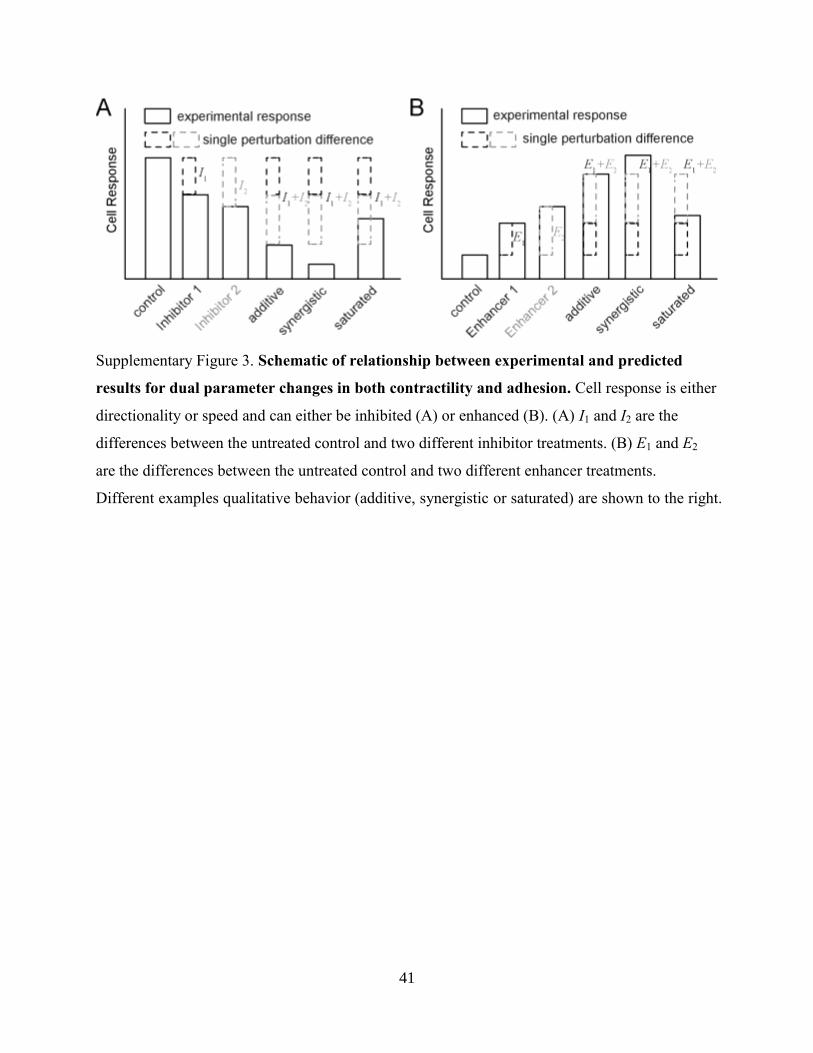
41
Supplementary Figure 3. Schematic of relationship between experimental and predicted
results for dual parameter changes in both contractility and adhesion. Cell response is either
directionality or speed and can either be inhibited (A) or enhanced (B). (A) I1 and I2 are the
differences between the untreated control and two different inhibitor treatments. (B) E1 and E2
are the differences between the untreated control and two different enhancer treatments.
Different examples qualitative behavior (additive, synergistic or saturated) are shown to the right.

42
Related Documents