MYH9 is a major-effect risk gene for focal segmental glomerulosclerosis Jeffrey B Kopp 1,17 , Michael W Smith 2,16,17 , George W Nelson 2,17 , Randall C Johnson 2 , Barry I Freedman 3 , Donald W Bowden 3 , Taras Oleksyk 2 , Louise M McKenzie 2 , Hiroshi Kajiyama 1 , Tejinder S Ahuja 4 , Jeffrey S Berns 5 , William Briggs 6 , Monique E Cho 1 , Richard A Dart 7 , Paul L Kimmel 8 , Stephen M Korbet 9 , Donna M Michel 10 , Michele H Mokrzycki 11 , Jeffrey R Schelling 12 , Eric Simon 13 , Howard Trachtman 14 , David Vlahov 15 & Cheryl A Winkler 2 The increased burden of chronic kidney and end-stage kidney diseases (ESKD) in populations of African ancestry has been largely unexplained. To identify genetic variants predisposing to idiopathic and HIV-1–associated focal segmental glomerulosclerosis (FSGS), we carried out an admixture-mapping linkage-disequilibrium genome scan on 190 African American individuals with FSGS and 222 controls. We identified a chromosome 22 region with a genome-wide logarithm of the odds (lod) score of 9.2 and a peak lod of 12.4 centered on MYH9, a functional candidate gene expressed in kidney podocytes. Multiple MYH9 SNPs and haplotypes were recessively associated with FSGS, most strongly a haplotype spanning exons 14 through 23 (OR ¼ 5.0, 95% CI ¼ 3.5–7.1; P ¼ 4 10 23 , n ¼ 852). This association extended to hypertensive ESKD (OR ¼ 2.2, 95% CI ¼ 1.5–3.4; n ¼ 433), but not type 2 diabetic ESKD (n ¼ 476). Genetic variation at the MYH9 locus substantially explains the increased burden of FSGS and hypertensive ESKD among African Americans. The prevalence of chronic kidney disease (CKD) in the United States is currently estimated at 13% and is associated with significant morbid- ity and mortality 1 . Approximately 100,000 Americans develop end- stage kidney (renal) disease (ESKD) each year. The cumulative lifetime risk for ESKD varies by ancestry, and is approximately 7.5% for African Americans and 2.1% for European Americans 2 . African Americans have a disproportionate risk for several forms of CKD, among them diabetic nephropathy 3 , hypertensive nephrosclerosis 4 , lupus nephritis 5 , focal segmental glomerulosclerosis (FSGS) 6 and HIV- associated nephropathy (a distinct form of FSGS, also termed collap- sing glomerulopathy) 7,8 . The disproportionate risk for CKD may be partially explained by differences in social-economic status, lifestyle factors and clinical factors such as blood pressure control, but most of the increased risk remains unexplained 9 . FSGS is a clinical syndrome involving podocyte injury and glomer- ular scarring, and includes genetic forms with autosomal dominant or recessive mendelian inheritance, reactive forms associated with other illnesses (including HIV-1 disease) or medications, and a sporadic, idiopathic form, which accounts for the majority of cases 10 . Recent data suggest an increase in the incidence of FSGS, which currently accounts for up to 3% of ESKD cases 6 . African Americans have a fourfold increased risk for sporadic FSGS 11 and an 18- to 50-fold increased risk for HIV-1–associated FSGS 7,12 . Individuals of African descent also have increased risk for FSGS in other geographic regions, further suggesting that genetic factors contribute to these disparities 11 . A strategy for identifying genes underlying such ancestry-driven health disparities is mapping by admixture linkage disequilibrium (MALD). MALD has successfully identified a genomic region asso- ciated with prostate cancer 13 subsequently replicated by a genome-wide association study 14 , as well as genes associated with hypertension 15 , multiple sclerosis 16 , white blood cell count 17 and variable interleukin 6 levels 18 . The admixture method is most robust for diseases that have large ancestry-driven or racial disparities that are not fully explained by environmental factors and that occur in populations that have Received 21 April; accepted 2 July; published online 14 September 2008; doi:10.1038/ng.226 1 Kidney Disease Section, National Institute of Diabetes and Digestive and Kidney Diseases, National Institutes of Health, Bethesda, Maryland 20892, USA. 2 Laboratory of Genomic Diversity, SAIC-Frederick, National Cancer Institute, Frederick, Maryland 21702, USA. 3 Section of Nephrology, Wake Forest School of Medicine, Winston-Salem, North Carolina 27157, USA. 4 University of Texas Medical Branch, Galveston, Texas 77555, USA. 5 Renal-Electrolyte and Hypertension Division, University of Pennsylvania School of Medicine, Philadelphia, Pennsylvania 19104, USA. 6 William Beaumont Hospital, Royal Oak, Michigan 48073, USA. 7 Department of Hypertension and Nephrology, Marshfield Clinic, Marshfield, Wisconsin 54449, USA. 8 Department of Medicine, Division of Renal Diseases and Hypertension, George Washington University Medical Center, Washington, DC 20037, USA. 9 Department of Medicine, Rush University Medical Center, Chicago, Illinois 60612, USA. 10 Hypertension and Kidney Specialists, Lancaster, Pennsylvania 17601, USA. 11 Division of Nephrology, Albert Einstein College of Medicine, Bronx, New York 10461, USA. 12 Department of Medicine, Case Western Reserve University, Cleveland, Ohio 44109, USA. 13 Nephrology Section, Tulane University School of Medicine, New Orleans, Louisiana 70112, USA. 14 Department of Pediatrics, Division of Nephrology, Schneider Children’s Hospital System, New Hyde Park, New York 11040, USA. 15 New York Academy of Medicine, New York, New York 10029, USA. 16 Present address: Genetics and Genomics, Advanced Technology Program, SAIC-Frederick, National Cancer Institute, Frederick, Maryland 21701, USA. 17 These authors contributed equally to this work. Correspondence should be addressed to C.A.W. ([email protected]). NATURE GENETICS VOLUME 40 [ NUMBER 10 [ OCTOBER 2008 1175 ARTICLES

Welcome message from author
This document is posted to help you gain knowledge. Please leave a comment to let me know what you think about it! Share it to your friends and learn new things together.
Transcript

MYH9 is a major-effect risk gene for focal segmentalglomerulosclerosisJeffrey B Kopp1,17, Michael W Smith2,16,17, George W Nelson2,17, Randall C Johnson2, Barry I Freedman3,Donald W Bowden3, Taras Oleksyk2, Louise M McKenzie2, Hiroshi Kajiyama1, Tejinder S Ahuja4,Jeffrey S Berns5, William Briggs6, Monique E Cho1, Richard A Dart7, Paul L Kimmel8, Stephen M Korbet9,Donna M Michel10, Michele H Mokrzycki11, Jeffrey R Schelling12, Eric Simon13, Howard Trachtman14,David Vlahov15 & Cheryl A Winkler2
The increased burden of chronic kidney and end-stage kidney diseases (ESKD) in populations of African ancestry has been largelyunexplained. To identify genetic variants predisposing to idiopathic and HIV-1–associated focal segmental glomerulosclerosis(FSGS), we carried out an admixture-mapping linkage-disequilibrium genome scan on 190 African American individuals withFSGS and 222 controls. We identified a chromosome 22 region with a genome-wide logarithm of the odds (lod) score of 9.2 anda peak lod of 12.4 centered on MYH9, a functional candidate gene expressed in kidney podocytes. Multiple MYH9 SNPs andhaplotypes were recessively associated with FSGS, most strongly a haplotype spanning exons 14 through 23 (OR ¼ 5.0, 95%CI ¼ 3.5–7.1; P ¼ 4 � 10�23, n ¼ 852). This association extended to hypertensive ESKD (OR ¼ 2.2, 95% CI ¼ 1.5–3.4; n ¼433), but not type 2 diabetic ESKD (n ¼ 476). Genetic variation at the MYH9 locus substantially explains the increased burdenof FSGS and hypertensive ESKD among African Americans.
The prevalence of chronic kidney disease (CKD) in the United States iscurrently estimated at 13% and is associated with significant morbid-ity and mortality1. Approximately 100,000 Americans develop end-stage kidney (renal) disease (ESKD) each year. The cumulative lifetimerisk for ESKD varies by ancestry, and is approximately 7.5% forAfrican Americans and 2.1% for European Americans2. AfricanAmericans have a disproportionate risk for several forms of CKD,among them diabetic nephropathy3, hypertensive nephrosclerosis4,lupus nephritis5, focal segmental glomerulosclerosis (FSGS)6 and HIV-associated nephropathy (a distinct form of FSGS, also termed collap-sing glomerulopathy)7,8. The disproportionate risk for CKD may bepartially explained by differences in social-economic status, lifestylefactors and clinical factors such as blood pressure control, but most ofthe increased risk remains unexplained9.
FSGS is a clinical syndrome involving podocyte injury and glomer-ular scarring, and includes genetic forms with autosomal dominant orrecessive mendelian inheritance, reactive forms associated with other
illnesses (including HIV-1 disease) or medications, and a sporadic,idiopathic form, which accounts for the majority of cases10. Recentdata suggest an increase in the incidence of FSGS, which currentlyaccounts for up to 3% of ESKD cases6. African Americans have afourfold increased risk for sporadic FSGS11 and an 18- to 50-foldincreased risk for HIV-1–associated FSGS7,12. Individuals of Africandescent also have increased risk for FSGS in other geographic regions,further suggesting that genetic factors contribute to these disparities11.
A strategy for identifying genes underlying such ancestry-drivenhealth disparities is mapping by admixture linkage disequilibrium(MALD). MALD has successfully identified a genomic region asso-ciated with prostate cancer13 subsequently replicated by a genome-wideassociation study14, as well as genes associated with hypertension15,multiple sclerosis16, white blood cell count17 and variable interleukin 6levels18. The admixture method is most robust for diseases that havelarge ancestry-driven or racial disparities that are not fully explainedby environmental factors and that occur in populations that have
Received 21 April; accepted 2 July; published online 14 September 2008; doi:10.1038/ng.226
1Kidney Disease Section, National Institute of Diabetes and Digestive and Kidney Diseases, National Institutes of Health, Bethesda, Maryland 20892, USA. 2Laboratory ofGenomic Diversity, SAIC-Frederick, National Cancer Institute, Frederick, Maryland 21702, USA. 3Section of Nephrology, Wake Forest School of Medicine, Winston-Salem,North Carolina 27157, USA. 4University of Texas Medical Branch, Galveston, Texas 77555, USA. 5Renal-Electrolyte and Hypertension Division, University of PennsylvaniaSchool of Medicine, Philadelphia, Pennsylvania 19104, USA. 6William Beaumont Hospital, Royal Oak, Michigan 48073, USA. 7Department of Hypertension andNephrology, Marshfield Clinic, Marshfield, Wisconsin 54449, USA. 8Department of Medicine, Division of Renal Diseases and Hypertension, George Washington UniversityMedical Center, Washington, DC 20037, USA. 9Department of Medicine, Rush University Medical Center, Chicago, Illinois 60612, USA. 10Hypertension and KidneySpecialists, Lancaster, Pennsylvania 17601, USA. 11Division of Nephrology, Albert Einstein College of Medicine, Bronx, New York 10461, USA. 12Department ofMedicine, Case Western Reserve University, Cleveland, Ohio 44109, USA. 13Nephrology Section, Tulane University School of Medicine, New Orleans, Louisiana 70112,USA. 14Department of Pediatrics, Division of Nephrology, Schneider Children’s Hospital System, New Hyde Park, New York 11040, USA. 15New York Academy ofMedicine, New York, New York 10029, USA. 16Present address: Genetics and Genomics, Advanced Technology Program, SAIC-Frederick, National Cancer Institute,Frederick, Maryland 21701, USA. 17These authors contributed equally to this work. Correspondence should be addressed to C.A.W. ([email protected]).
NATURE GENETICS VOLUME 40 [ NUMBER 10 [ OCTOBER 2008 1 17 5
ART I C LES

undergone recent admixture between ancestral populations, for exam-ple, Hispanic Americans and African Americans19,20.
The principle underlying admixture mapping is that, whereas mostgenetic variants are similar in allele frequencies across ancestral popula-tions, a small subset of genetic variants shows considerable frequencydifferences, and these variants can be used to estimate local chromo-somal ancestry. Recent admixture occurring between genetically distinctpopulations generates long-range linkage disequilibrium (LD) andchromosomal segments originating from theancestral populations that can be exploited tomap disease genes that are more frequent inone ancestral population relative to the other.For diseases or traits where the predisposinggenetic variants occur at sufficiently differentfrequencies between the ancestral populations,admixture mapping has a distinct advantageover genome wide scans: both theoreticallyand empirically, considerably fewer informa-tive SNP markers (o2,000) are required forcomplete genome coverage21.
We hypothesized that given the fourfoldincreased risk for idiopathic FSGS, the 18- to50-fold increase in HIV-1–associated FSGS,and the higher rate of many kidney diseasesin people of African ancestry, the underlyinggenetic variants would both be very frequentand have moderate to strong effects in Afri-can Americans but would be infrequent inEuropean Americans. Here we present theresults of a MALD study to discover genesassociated with biopsy-proven, idiopathicFSGS and HIV-1–associated FSGS in 412African Americans, followed by regional finemapping to identify specific alleles and ahaplotype associated with FSGS. Havingidentified MYH9 as a functional and posi-tional candidate gene, we tested associatedMYH9 SNPs in a larger group of 852 AfricanAmerican FSGS cases and controls. The asso-ciated MYH9 SNPs were also tested in a
replication group of 346 European American FSGS cases and controlsand in an extension group of 717 African American cases and controlswith ESKD due to hypertension or type 2 diabetes mellitus.
RESULTSOverview of MALD resultsThe MALD scan, consisting of 1,272 SNPs typed on African AmericanFSGS cases (n ¼ 190) and African American controls matched for age,
Table 1 Study subjects for discovery, replication and extension analysis
AnalysisCases Controls
Ancestry Type n (age at diagnosis) Type n (age at enrollment)
MALDa and regional mappingb discovery
African American Idiopathic FSGS 188 (38 ± 14) Normal donors 370 (44 ± 8)
African American HIV+ FSGS 53 (38 ± 8) Hypernormalc 241 (44 ± 6)
MYH9 confirmation
European American Idiopathic FSGS 125 (39 ± 18) Normal donors 221 (50 ± 9)
MYH9 extension
African American Hypertensive ESKD 241 (54 ± 15) Normal donorsd 192 (50 ± 10)
African American Diabetic ESKD 284 (60 ± 10)
Totale 891 1,024
aMALD analysis was of 190 African American HIV-negative and HIV-positive FSGS cases randomly selected and matched by HIV-1 status, age and sex to 222 controls. bRegional mapping (Table 2)was done for the same 412 MALD participants with global and local ancestry estimates. All African American FSGS of 241 cases and 611 controls were used in the positional candidate geneinterrogation of MYH9. cHIV-1–infected for 8 or more years with normal urine protein to creatinine ratio o0.5. dShared donors for MYH9 extension geographically matched to hypertensive anddiabetic ESRD cases. eSeventeen MYH9 SNPs were typed for 891 cases and 1,024 controls.
0
10
lod
scor
e
–10
Chromosome position (Mb) 2210 11 12 13 14 15 16 1718192021 X
a
b
Chromosome 22 position (Mb)
African ancestry (%
)
Locu
s–ge
nom
e od
ds (
billi
ons) Locus–genome
statistic CasesControls
Case-controlLocus-genome
Statistic*
0
10
20
20 30 40 50
80
90
95% credible intervalLocus-genome lod score
Genome-wide Peak
Initial screen
1 2 3 4 5 6 7 8 9
9.2
8.7
7.7
10.5
12.4
10.1
8.8
13.7
Even markers
Odd markers
Dense markers at peak
Figure 1 Genome-wide admixture analysis and chromosome 22 gene localization. (a) Lod scores of the
case-control statistic (blue) and the locus-genome score (green) across the genome from the
ANCESTRYMAP analysis. (The case control statistic was converted to a lod score as described in
Methods.) The x axis shows a concatenated set of chromosomes (gray) with locations of the MALDmarkers interrogated indicated below (black). (b) Lod scores for alternate runs of the ANCESTRYMAP
analysis, and the 95% credible interval for the location of a genetic factor responsible for the
chromosome 22 MALD peak spans from 34,422,950 to 35,655,902 bp (build 36). The locus-genome
statistic, with the 95% credible interval shaded, is shown along with the percent African ancestry in
cases and controls.
1 17 6 VOLUME 40 [ NUMBER 10 [ OCTOBER 2008 NATURE GENETICS
ART I C LES
sex and HIV-1 infection status (n ¼ 222) (Table 1), yielded a genome-wide lod score of 9.2 (Fig. 1a,b); scores greater than 2 are consideredsignificant. There was a single prominent peak located on chromosome22, with a lod score of 12.4 (Fig. 1b), and a pronounced elevation ofAfrican ancestry in FSGS cases, with 92% carrying African-inheritedchromosomes as compared to a genome average of 81% (Supplemen-tary Fig. 1a online). To determine whether the peak was robust and notsubject to fluctuation if a different marker set was used, we divided themarkers into even and odd ordered SNPs and tested each set indepen-dently: the genome-wide and peak scores for the even set were 8.7 and10.1, respectively, and 7.7 and 8.8 for the odd set, respectively (Fig. 1b).After additional MALD markers were added to the original scan, thegenome-wide and peak scores were 10.5 and 13.7, respectively (Fig. 1b).The 95% credible interval for the MALD peak extended along chromo-some 22q13.1 from coordinates 34.423 Mb to 35.656 Mb (Fig. 1b).
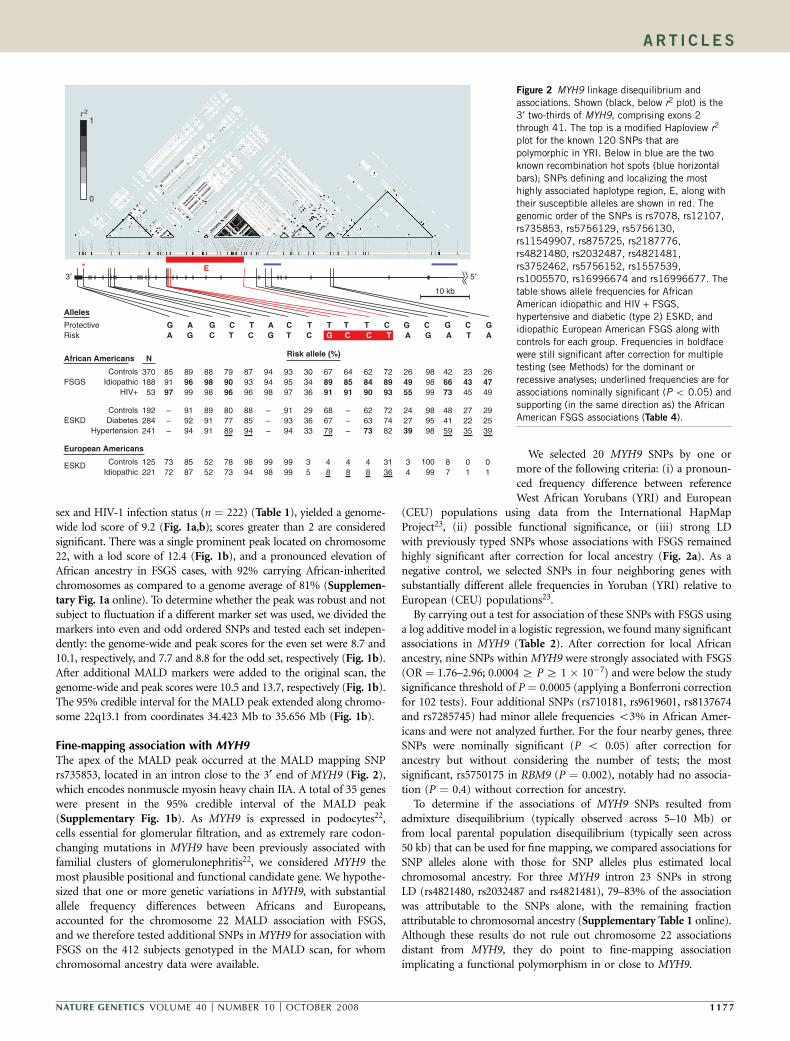
Fine-mapping association with MYH9The apex of the MALD peak occurred at the MALD mapping SNPrs735853, located in an intron close to the 3¢ end of MYH9 (Fig. 2),which encodes nonmuscle myosin heavy chain IIA. A total of 35 geneswere present in the 95% credible interval of the MALD peak(Supplementary Fig. 1b). As MYH9 is expressed in podocytes22,cells essential for glomerular filtration, and as extremely rare codon-changing mutations in MYH9 have been previously associated withfamilial clusters of glomerulonephritis22, we considered MYH9 themost plausible positional and functional candidate gene. We hypothe-sized that one or more genetic variations in MYH9, with substantialallele frequency differences between Africans and Europeans,accounted for the chromosome 22 MALD association with FSGS,and we therefore tested additional SNPs in MYH9 for association withFSGS on the 412 subjects genotyped in the MALD scan, for whomchromosomal ancestry data were available.
We selected 20 MYH9 SNPs by one ormore of the following criteria: (i) a pronoun-ced frequency difference between referenceWest African Yorubans (YRI) and European
(CEU) populations using data from the International HapMapProject23, (ii) possible functional significance, or (iii) strong LDwith previously typed SNPs whose associations with FSGS remainedhighly significant after correction for local ancestry (Fig. 2a). As anegative control, we selected SNPs in four neighboring genes withsubstantially different allele frequencies in Yoruban (YRI) relative toEuropean (CEU) populations23.
By carrying out a test for association of these SNPs with FSGS usinga log additive model in a logistic regression, we found many significantassociations in MYH9 (Table 2). After correction for local Africanancestry, nine SNPs within MYH9 were strongly associated with FSGS(OR ¼ 1.76–2.96; 0.0004 Z PZ 1 � 10�7) and were below the studysignificance threshold of P ¼ 0.0005 (applying a Bonferroni correctionfor 102 tests). Four additional SNPs (rs710181, rs9619601, rs8137674and rs7285745) had minor allele frequencies o3% in African Amer-icans and were not analyzed further. For the four nearby genes, threeSNPs were nominally significant (P o 0.05) after correction forancestry but without considering the number of tests; the mostsignificant, rs5750175 in RBM9 (P ¼ 0.002), notably had no associa-tion (P ¼ 0.4) without correction for ancestry.
To determine if the associations of MYH9 SNPs resulted fromadmixture disequilibrium (typically observed across 5–10 Mb) orfrom local parental population disequilibrium (typically seen across50 kb) that can be used for fine mapping, we compared associations forSNP alleles alone with those for SNP alleles plus estimated localchromosomal ancestry. For three MYH9 intron 23 SNPs in strongLD (rs4821480, rs2032487 and rs4821481), 79–83% of the associationwas attributable to the SNPs alone, with the remaining fractionattributable to chromosomal ancestry (Supplementary Table 1 online).Although these results do not rule out chromosome 22 associationsdistant from MYH9, they do point to fine-mapping associationimplicating a functional polymorphism in or close to MYH9.
5′3′E*
r 2
0
1
10 kb
Protective G A G C T A C T T T T C G C G C GRisk A G C T C G T C G C C T A G A T A
N
ControlsIdiopathic
HIV+
ControlsDiabetes
Hypertension
European Americans
African Americans
Idiopathic
Alleles
Risk allele (%)
FSGS
ESKD
ESKD Controls
37018853
192284241
125221
859197
–––
7372
899699
919294
8587
889898
899191
5252
799096
807789
7873
879396
888594
9894
949498
–––
9998
939597
919394
9999
303436
293633
35
678991
686779
48
648591
–––
48
628490
626373
48
728993
727482
3136
264955
242739
34
426673
484159
87
234345
272235
01
264749
292539
01
989899
989598
99100
Figure 2 MYH9 linkage disequilibrium and
associations. Shown (black, below r2 plot) is the
3¢ two-thirds of MYH9, comprising exons 2
through 41. The top is a modified Haploview r2
plot for the known 120 SNPs that are
polymorphic in YRI. Below in blue are the two
known recombination hot spots (blue horizontal
bars); SNPs defining and localizing the most
highly associated haplotype region, E, along with
their susceptible alleles are shown in red. The
genomic order of the SNPs is rs7078, rs12107,
rs735853, rs5756129, rs5756130,
rs11549907, rs875725, rs2187776,
rs4821480, rs2032487, rs4821481,
rs3752462, rs5756152, rs1557539,rs1005570, rs16996674 and rs16996677. The
table shows allele frequencies for African
American idiopathic and HIV + FSGS,
hypertensive and diabetic (type 2) ESKD, and
idiopathic European American FSGS along with
controls for each group. Frequencies in boldface
were still significant after correction for multiple
testing (see Methods) for the dominant or
recessive analyses; underlined frequencies are for
associations nominally significant (P o 0.05) and
supporting (in the same direction as) the African
American FSGS associations (Table 4).
NATURE GENETICS VOLUME 40 [ NUMBER 10 [ OCTOBER 2008 1 17 7
ART I C LES
We also repeated the association analysis in a subgroup of the MALDpanel, limited to 245 African American individuals carrying twoAfrican chromosomes with certainty 495% at each locus examined,as estimated by ANCESTRYMAP. By restricting the analysis to indivi-duals with only African ancestry at the locus, we largely eliminated theeffects of admixture in the association analysis. Supplementary Table 1presents the analyses done for each of 17 MYH9 SNPs and for the 12SNPs in the four flanking genes. We found that 6 of 17 MYH9 SNPsretained significant associations (P ¼ 4 � 10–4 to 5 � 10�5) below theBonferroni P o 0.0005 cut-off for significance, whereas none of the 12SNPs in nearby genes were significant (P 4 0.07).
In an effort to determine the genetic model that best explained theSNP associations, we compared individuals carrying one or two riskalleles to individuals homozygous for the nonrisk allele (12 versus 11and 22 versus 11, where 2 is the risk allele) and homozygousindividuals carrying two risk alleles to individuals heterozygous forthe risk allele (22 versus 12), with African ancestry taken as a covariate(Table 3). Using the stringent correction for multiple tests, we foundthat eight comparisons were significant: five comparing 22 to 12 andthree comparing 22 to 11. For the three intron 23 SNPs (rs4821480,rs2032487 and rs4821481), the association was clearly recessive, as theupper confidence interval for the OR for the 12 vs. 11 comparison was
Table 2 Regional mapping for FSGS associations with MYH9 and four nearby genes
SNP association (local ancestry correction)
Uncorrected Correcteda
SNPb Genomic position (Mb) OR (95% CI)c Pd OR (95% CI) P
RBM9
rs5750175 34.479 0.89 (0.67,1.17) 0.40 0.60 (0.44,0.83) 0.002
rs5755943 34.496 1.08 (0.81,1.44) 0.59 0.84 (0.62,1.15) 0.28
MYH9
rs7078 35.008 2.03 (1.29,3.20) 0.002 1.49 (0.91,2.44) 0.11
rs12107 35.008 2.51 (1.35,4.64) 0.003 1.81 (0.93,3.52) 0.08
rs735853 35.009 10.75 (3.82,30.3) 7 � 10–6 5.65 (1.89,16.92) 0.002
rs5756129 35.014 2.74 (1.74,4.30) 1 � 10–5 2.38 (1.49,3.81) 0.0003
rs5756130 35.014 0.49 (0.29,0.82) 0.007 0.43 (0.25,0.74) 0.002
rs11549907 35.015 0.55 (0.30,0.98) 0.04 0.49 (0.27,0.89) 0.02
rs875725 35.022 0.46 (0.26,0.81) 0.008 0.40 (0.22,0.73) 0.002
rs2187776 35.025 1.21 (0.89,1.65) 0.23 1.09 (0.79,1.50) 0.61
rs4821480 35.025 4.18 (2.74,6.40) 4 � 10–11 2.96 (1.78,4.94) 3 � 10–5
rs2032487 35.025 3.95 (2.66,5.86) 9 � 10–12 2.91 (1.85,4.58) 4 � 10–6
rs4821481 35.026 4.13 (2.78,6.12) 2 � 10–12 2.95 (1.81,4.81) 1 � 10–5
rs3752462 35.040 3.88 (2.50,6.02) 1 � 10–9 2.75 (1.72,4.40) 2 � 10–5
rs5756152 35.042 2.77 (2.04,3.76) 7 � 10–11 2.34 (1.71,3.21) 1 � 10–7
rs1557539 35.044 0.34 (0.13,0.92) 0.03 0.41 (0.14,1.19) 0.10
rs1005570 35.045 2.85 (2.07,3.92) 1 � 10–10 2.28 (1.63,3.19) 1 � 10–6
rs16996674 35.057 2.14 (1.58,2.90) 9 � 10–7 1.76 (1.29,2.42) 0.0004
rs16996677 35.057 2.28 (1.69,3.06) 6 � 10–8 1.86 (1.37,2.54) 8 � 10–5
PVALB
rs736721 35.533 1.58 (1.17,2.14) 0.003 1.49 (1.10,2.04) 0.01
rs739031 35.538 1.57 (1.14,2.16) 0.006 1.25 (0.89,1.75) 0.19
rs2269511 35.541 1.09 (0.83,1.44) 0.53 0.89 (0.66,1.2) 0.44
TST
rs5756477 35.737 1.10 (0.82,1.47) 0.53 1.03 (0.76,1.40) 0.84
rs130598 35.738 1.28 (0.92,1.79) 0.14 0.97 (0.68,1.40) 0.88
rs470029 35.740 1.58 (1.11,2.26) 0.01 1.42 (0.99,2.04) 0.06
TMPRSS6
rs855788 35.804 2.62 (1.69,4.05) 2 � 10–5 1.65 (0.99,2.74) 0.05
rs855787 35.805 1.15 (0.83,1.60) 0.39 1.01 (0.72,1.42) 0.94
rs2543519 35.810 1.39 (1.03,1.86) 0.03 1.36 (1.00,1.85) 0.05
rs1421312 35.818 1.11 (0.84,1.47) 0.44 0.99 (0.74,1.32) 0.92
aSNP association with the estimated local chromosomal ancestry, determined by including that SNP in ANCESTRYMAP, included as a covariate in the logistic regression. bGenomic positions refer toNCBI build 36. cOdds ratio and P from logistic regression under the log additive model, limited to the African American FSGS cases (n ¼ 190) and controls (n ¼ 222) included in the MALD scan.dP values in boldface are less than the Bonferroni correction cutoff of 0.0005.
1 17 8 VOLUME 40 [ NUMBER 10 [ OCTOBER 2008 NATURE GENETICS
ART I C LES

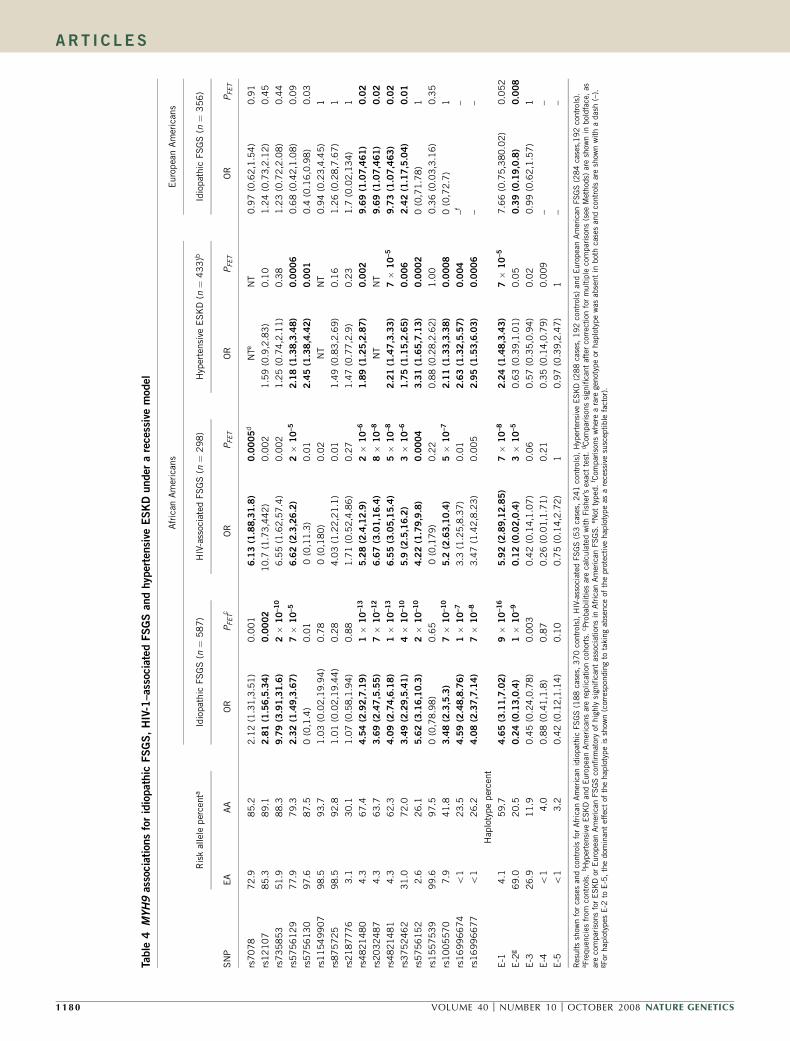
close to 1, whereas the ORs for the 22 vs. 12 comparisons ranged from3.5 to 4.4, with narrow confidence limits (Table 3). In addition, threeSNPs (rs5756152, rs1005570 and rs16996677) seemed additive, withORs for the 22 vs. 11 comparisons ranging from 3.9 to 5.7, again withnarrow confidence intervals. As the fine-mapping analysis suggestedthat the intron 23 SNPs best represent the local association, a recessivemodel is favored, but without knowledge of the causal sequencevariation, choosing a definitive genetic model is premature.
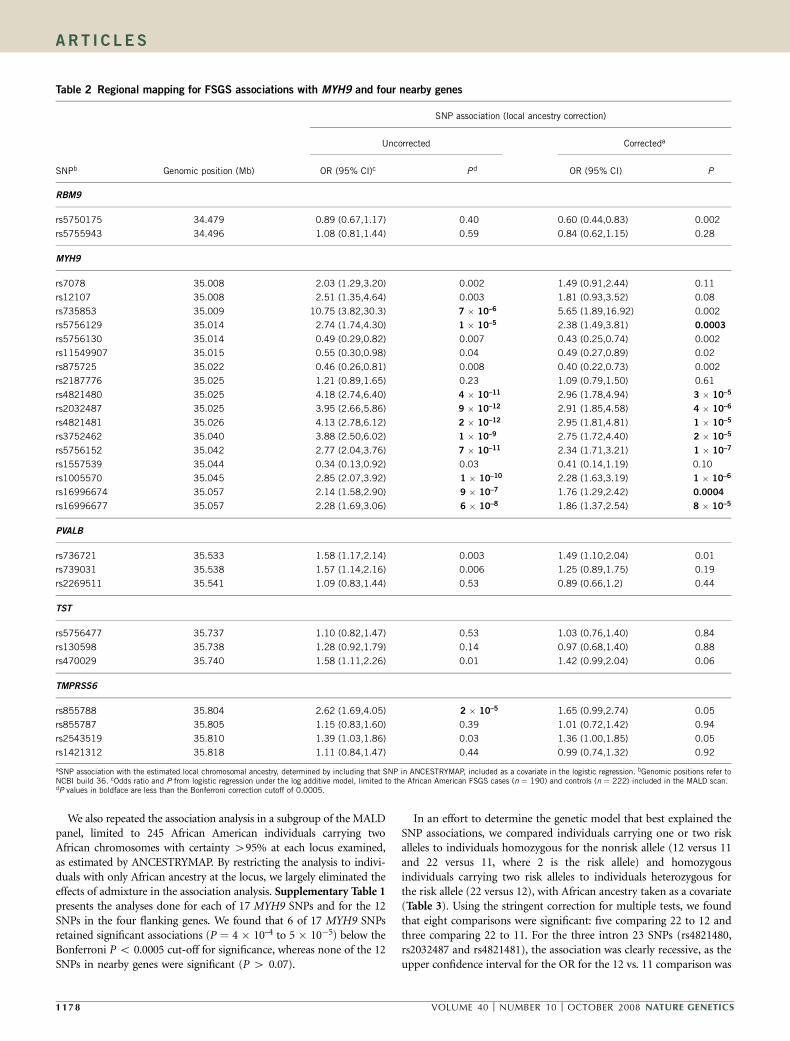
MYH9 associations with idiopathic and HIV-1–associated FSGSA larger set of African American FSGS cases (n ¼ 241) and controls(n ¼ 611), which includes the group used in the MALD scan alongwith additional FSGS cases, supported the initial MYH9 associationspresented in Tables 2 and 3. Because local ancestry was available foronly the MALD subset, the results could not be corrected for localancestry. Of the 17 SNPs typed, all but five showed association withFSGS, with seven having P o 10�12 (Supplementary Table 2 online).For the seven most highly associated SNPs, the susceptible allele wasvery frequent both in African Americans (29–91%) (SupplementaryTable 2) and in Yorubans (40–97%, data from the InternationalHapMap Project)23, but much less frequent (3–52%) in EuropeanAmericans (Supplementary Table 2). The strongest associations werefor the three SNPs located within intron 23 (OR ¼ 4.5–4.8, P ¼ 2 �10�18–1 � 10�20) for the recessive model, presented in Figure 3 alongwith the genotype distribution for African- and European-Americancases and controls.
The 17 MYH9 SNPs were also analyzed in the idiopathic FSGS andthe HIV-1–associated FSGS subgroups, representing syndromes withdistinct pathological features (Table 4). The pattern of MYH9 SNPassociations is similar for both forms of FSGS in African Americans,showing consistent associations with FSGS (OR ¼ 3.5–6.7) andsignificance below P ¼ 0.0005 for 11 SNPs for idiopathic FSGS and8 SNPs for HIV-1–associated FSGS for the recessive model. Results forthe dominant genetic model are presented in Supplementary Table 3online, showing that the significance and strength of the associationsare weaker or absent in the dominant model.
MYH9 haplotype associationsWe analyzed inferred haplotypes for MYH9 SNPs, both within strictlydefined local haplotype blocks (Supplementary Table 4a online)and within larger regions of elevated LD that are bounded byrecombination hot spots23 (Supplementary Table 4b), for combinedidiopathic and HIV-1–associated FSGS associations. The strongestrisk association with FSGS (OR ¼ 5.0, 95% CI ¼ 3.5–7.1 and
Table 3 MYH9 genotype associations for FSGS for 412 African American cases and controls with ancestry data
Alleles Genotype frequencya 12 vs. 11 22 vs. 11 22 vs.12
SNP Ref(1) Risk(2) 11 12 22 OR (95% CI)b P c OR (95% CI) P OR (95% CI) P
rs7078 G A 0.023 0.255 0.721 0.69 (0.14,1.52) 0.64 0.89 (0.19,1.95) 0.88 1.81 (1.01,2.43) 0.05
rs12107 A G 0.010 0.190 0.800 N (0,N)d 0.99 N (0,N) 0.98 1.71 (0.86,2.44) 0.13
rs735853 G C 0.018 0.194 0.787 N (0,N) 1.00 N (0,N) 0.98 5.48 (1.8,9.69) 0.003
rs5756129 C T 0.053 0.302 0.644 3.08 (0.36,9.15) 0.30 6.95 (0.81,20.88) 0.08 2.33 (1.39,3.03) 0.001
rs5756130 T C 0.016 0.214 0.769 N (0,N) 0.99 N (0,N) 0.98 2.17 (1.24,2.90) 0.007
rs11549907 A G 0.005 0.135 0.860 0.61 (0.03,2.6) 0.73 1.35 (0.08,5.57) 0.83 2.27 (1.19,3.16) 0.01
rs875725 C T 0.003 0.163 0.834 0 (0,N) 0.99 0 (0,N) 0.99 2.86 (1.55,3.92) 0.0008
rs2187776 T C 0.500 0.407 0.093 1.05 (0.68,1.31) 0.81 1.23 (0.57,1.81) 0.60 1.17 (0.55,1.72) 0.68
rs4821480 T G 0.130 0.394 0.476 0.61 (0.18,1.13) 0.42 3.29 (0.8,6.76) 0.10 4.41 (2.47,5.94) 5.7 � 10–7
rs2032487 T C 0.134 0.454 0.412 0.78 (0.24,1.43) 0.69 3.82 (0.95,7.76) 0.06 3.62 (2.18,4.68) 6.0 � 10–7
rs4821481 T C 0.135 0.476 0.389 0.77 (0.23,1.41) 0.66 3.19 (0.59,7.53) 0.18 3.5 (2.05,4.59) 4.1 � 10–6
rs3752462 C T 0.064 0.421 0.514 1.07 (0.21,2.45) 0.94 2 (0.36,4.82) 0.43 3.09 (1.87,4) 1.2 � 10–5
rs5756152 G A 0.537 0.397 0.066 2.32 (1.44,2.95) 0.0006 5.71 (2.95,8) 2.3 � 10–7 2.36 (1.26,3.26) 0.008
rs1557539 C G 0.003 0.056 0.941 N (0,N) 0.99 N (0,N) 0.98 2.39 (0.83,4.1) 0.11
rs1005570 G A 0.323 0.497 0.180 1.71 (0.91,2.36) 0.09 5.12 (2.49,7.4) 8.8 � 10–6 2.69 (1.65,3.46) 7.1 � 10–5
rs16996674 C T 0.571 0.370 0.058 1.54 (0.98,1.94) 0.06 3.65 (1.82,5.21) 0.0003 2.17 (1.09,3.09) 0.03
rs16996677 G A 0.543 0.381 0.076 1.59 (1,2.02) 0.05 3.94 (2.04,5.52) 4.6 � 10–5 2.35 (1.24,3.24) 0.008
Association analysis for combined idiopathic and HIV-associated FSGS using MALD study subjects (190 cases and 222 controls). aPopulation frequencies for normal controls in EuropeanAmericans (n ¼ 221) and African Americans (n ¼ 370). bOdds ratios, confidence intervals and probabilities calculated by logistic regression controlling for African chromosomal ancestry. cP valuesin boldface are less than the Bonferroni correction cutoff of 0.0005. dOdds ratios are shown as infinite (N) for logistic regression results divergent due to limited numbers.
AfricanAmericans
EuropeanAmericans
n = 638
Controls
n = 231
Controls
n = 247
FSGS
n = 125
FSGS
4.82 × 10⁻¹⁹
4.22 × 10⁻¹⁸
4.51 × 10⁻²⁰
3.94 × 10⁻¹⁵
5.04 × 10⁻²³
OR =P =
OR =P =
9.70.02
9.70.02
9.70.02
2.40.01
7.70.052
Copies of risk allele: 0 1 2
Haplotype E-1rs4821480 rs2032487 rs4821481 rs3752462
Haplotype Block E
Figure 3 Frequencies of the three genotypes for the MYH9 SNPs
rs4821480, rs2032487, rs4821481 and rs3752462, and haplotype E-1,
the most frequent haplotype containing the four SNPs, in African American
and European American FSGS cases and controls. Odds ratios and P values
for the recessive model comparing FSGS cases and controls are shown.
NATURE GENETICS VOLUME 40 [ NUMBER 10 [ OCTOBER 2008 1 17 9
ART I C LES
Table
4MYH9associationsforidiopathic
FSGS,HIV-1–associatedFSGSandhypertensive
ESKDunderarecessivemodel
Afr
ican
Am
eric
ans
Euro
pea
nA
mer
ican
s
Ris
kal
lele
per
centa
Idio
pat
hic
FSG
S(n
¼5
87)
HIV
-ass
ocia
ted
FSG
S(n
¼2
98
)H
yper
tensi
veE
SK
D(n
¼4
33
)bId
iopat
hic
FSG
S(n
¼3
56
)
SN
PEA
AA
OR
PFETc
OR
PFET
OR
PFET
OR
PFET
rs70
78
72.9
85.2
2.1
2(1
.31
,3.5
1)
0.0
01
6.13(1.88,31.8)
0.0005
dN
TeN
T0.9
7(0
.62,1
.54)
0.9
1
rs12
10
785.3
89.1
2.81(1.56,5.34)
0.0002
10.7
(1.7
3,4
42)
0.0
02
1.5
9(0
.9,2
.83
)0.1
01.2
4(0
.73,2
.12)
0.4
5
rs73
58
53
51.9
88.3
9.79(3.91,31.6)
2�
10–10
6.5
5(1
.62,5
7.4
)0
.00
21.2
5(0
.74
,2.1
1)
0.3
81.2
3(0
.72,2
.08)
0.4
4
rs57
56
12
977.9
79.3
2.32(1.49,3.67)
7�
10–5
6.62(2.3,26.2)
2�
10–5
2.18(1.38,3.48)
0.0006
0.6
8(0
.42,1
.08)
0.0
9
rs57
56
13
097.6
87.5
0(0
,1.4
)0
.01
0(0
,11.3
)0
.01
2.45(1.38,4.42)
0.001
0.4
(0.1
6,0
.98
)0.0
3
rs11
54
99
07
98.5
93.7
1.0
3(0
.02
,19.9
4)
0.7
80
(0,1
80)
0.0
2N
TN
T0.9
4(0
.23,4
.45)
1
rs87
57
25
98.5
92.8
1.0
1(0
.02
,19.4
4)
0.2
84.0
3(1
.22,2
1.1
)0
.01
1.4
9(0
.83
,2.6
9)
0.1
61.2
6(0
.28,7
.67)
1
rs21
87
77
63.1
30.1
1.0
7(0
.58
,1.9
4)
0.8
81.7
1(0
.52,4
.86
)0
.27
1.4
7(0
.77
,2.9
)0.2
31.7
(0.0
2,1
34)
1
rs48
21
48
04.3
67.4
4.54(2.92,7.19)
1�
10–13
5.28(2.4,12.9)
2�
10–6
1.89(1.25,2.87)
0.002
9.69(1.07,461)
0.02
rs20
32
48
74.3
63.7
3.69(2.47,5.55)
7�
10–12
6.67(3.01,16.4)
8�
10–8
NT
NT
9.69(1.07,461)
0.02
rs48
21
48
14.3
62.3
4.09(2.74,6.18)
1�
10–13
6.55(3.05,15.4)
5�
10–8
2.21(1.47,3.33)
7�
10–5
9.73(1.07,463)
0.02
rs37
52
46
231.0
72.0
3.49(2.29,5.41)
4�
10–10
5.9
(2.5,16.2)
3�
10–6
1.75(1.15,2.65)
0.006
2.42(1.17,5.04)
0.01
rs57
56
15
22.6
26.1
5.62(3.16,10.3)
2�
10–10
4.22(1.79,9.8)
0.0004
3.31(1.65,7.13)
0.0002
0(0
,71.7
8)
1
rs15
57
53
999.6
97.5
0(0
,78
.98
)0
.65
0(0
,17
9)
0.2
20.8
8(0
.28
,2.6
2)
1.0
00.3
6(0
.03,3
.16)
0.3
5
rs10
05
57
07.9
41.8
3.48(2.3,5.3)
7�
10–10
5.2
(2.63,10.4)
5�
10–7
2.11(1.33,3.38)
0.0008
0(0
,72.7
)1
rs16
99
66
74
o1
23.5
4.59(2.48,8.76)
1�
10–7
3.3
(1.2
5,8
.37)
0.0
12.63(1.32,5.57)
0.004
–f–
rs16
99
66
77
o1
26.2
4.08(2.37,7.14)
7�
10–8
3.4
7(1
.42,8
.23
)0
.00
52.95(1.53,6.03)
0.0006
––
Hap
loty
pe
per
cent
E-1
4.1
59.7
4.65(3.11,7.02)
9�
10–16
5.92(2.89,12.85)
7�
10–8
2.24(1.48,3.43)
7�
10–5
7.6
6(0
.75,3
80.0
2)
0.0
52
E-2
g69.0
20.5
0.24(0.13,0.4)
1�
10–9
0.12(0.02,0.4)
3�
10–5
0.6
3(0
.39
,1.0
1)
0.0
50.39(0.19,0.8)
0.008
E-3
26.9
11.9
0.4
5(0
.24
,0.7
8)
0.0
03
0.4
2(0
.14,1
.07
)0
.06
0.5
7(0
.35
,0.9
4)
0.0
20.9
9(0
.62,1
.57)
1
E-4
o1
4.0
0.8
8(0
.41
,1.8
)0
.87
0.2
6(0
.01,1
.71
)0
.21
0.3
5(0
.14
,0.7
9)
0.0
09
––
E-5
o1
3.2
0.4
2(0
.12
,1.1
4)
0.1
00.7
5(0
.14,2
.72
)1
0.9
7(0
.39
,2.4
7)
1–
–
Res
ults
show
nfo
rca
ses
and
contr
ols
for
Afr
ican
Am
eric
anid
iopat
hic
FS
GS
(188
case
s,3
70
contr
ols)
,H
IV-a
ssoc
iate
dFS
GS
(53
case
s,24
1co
ntr
ols)
,H
yper
tensi
veES
KD
(288
case
s,1
92
contr
ols)
and
Euro
pea
nA
mer
ican
FSG
S(2
84
case
s,1
92
contr
ols)
.a F
requen
cies
from
contr
ols.
bH
yper
tensi
veE
SK
Dan
dEuro
pea
nA
mer
ican
sar
ere
plica
tion
cohor
ts.
c Pro
bab
ilitie
sar
eca
lcula
ted
with
Fis
her
’sex
act
test
.dC
ompar
ison
ssi
gnifi
cant
afte
rco
rrec
tion
for
multip
leco
mpar
ison
s(s
eeM
ethod
s)ar
esh
own
inbol
dfa
ce,
asar
eco
mpar
ison
sfo
rE
SK
Dor
Euro
pea
nA
mer
ican
FS
GS
confirm
ator
yof
hig
hly
sign
ifica
nt
asso
ciat
ions
inA
fric
anA
mer
ican
FSG
S.
e Not
typed
.f C
ompar
ison
sw
her
ea
rare
genot
ype
orhap
loty
pe
was
abse
nt
inbot
hca
ses
and
contr
ols
are
show
nw
ith
adas
h(–
).g F
orhap
loty
pes
E-2
toE
-5,
the
dom
inan
tef
fect
ofth
ehap
loty
pe
issh
own
(cor
resp
ondin
gto
taki
ng
abse
nce
ofth
epro
tect
ive
hap
loty
pe
asa
rece
ssiv
esu
scep
tible
fact
or).
1 18 0 VOLUME 40 [ NUMBER 10 [ OCTOBER 2008 NATURE GENETICS
ART I C LES

P ¼ 4 � 10�23, recessive model) was for the most frequent haplotype(E-1) spanning a region indicated in Figure 2 comprising thethree intron 23 SNPs and rs3752462 (Fig. 3 and SupplementaryTable 2). The recessive E-1 haplotype association was also observed foridiopathic FSGS (OR ¼ 4.7, 95% CI ¼ 3.1–7.0, P ¼ 9 � 10�16) andHIV-1–associated FSGS (OR ¼ 5.9, 95% CI ¼ 2.9–12.9, P¼ 7 � 10�8)as shown in Table 4. The E-1 haplotype has a frequency of 60% inAfrican Americans but only 4% in European Americans.
MYH9 FSGS associations in European AmericansThe study population also contained 125 European Americans withidiopathic, biopsy-confirmed FSGS and 221 European Americannormal donor controls, constituting an independent FSGS group forreplication of the findings obtained in African Americans (Table 1).Testing a recessive model for SNP and haplotype FSGS associations forthis group, uncorrected for population structure, we found that thefour SNPs determining haplotype E-1 showed modestly significantassociations, although the haplotype E-1 itself fell short of signi-ficance (Table 4). The haplotype most frequent (69%) in EuropeanAmericans, E-2, showed a significant dominant protective effect(OR ¼ 0.39, 95% CI ¼ 0.19–0.80, P ¼ 0.008), consistent with itseffect in African Americans (Table 4). We considered whether FSGSrisk factors rare in European Americans were associated with Africanancestry in our self-identified European American subjects. Analysis ofpopulation substructure principal components using EIGENSOFT24
indicated that three of the four FSGS cases carrying two copies ofhaplotype E-1 had significant African ancestry. Eliminating these threeindividuals, and correcting for overall population substructure usingthe first EIGENSOFT eigenvector calculated from SNPs outside ofchromosome 22, we found that the association with haplotype E-2remained nominally significant (OR ¼ 0.47, 95% CI ¼ 0.23–0.97,P ¼ 0.04), but none of the SNP associations were significant(P 4 0.07). Although African ancestry confounds the analysis ofEuropean American FSGS, the data support a replication of the FSGSsignal in this independent group.
Extension to hypertensive ESKDTo determine whether MYH9 might harbor risk factors for ESKDattributed to hypertensive nephrosclerosis or type 2 diabetic nephro-sclerosis in the African American population, we analyzed 14 MYH9SNPs for association with hypertensive ESKD (n ¼ 241) or type 2diabetes–associated ESKD (n ¼ 284) using a geographically matchedcontrol group (n ¼ 192) (Table 1). Hypertensive ESKD associations(Table 4) were significant and consistent in direction with the FSGSassociations for nine MYH9 SNPs and haplotype E-1. The strongestassociations were for rs4821481 (OR ¼ 2.2; 95% CI ¼ 1.5–3.5, P ¼ 7� 10�5); the association for haplotype E-1 was virtually identical. SNPassociations with hypertensive ESKD were independent of individualoverall proportion of African ancestry (analysis not shown). Nosignificant associations were observed for SNPs with type 2 diabeticESKD (Supplementary Table 5 online).
We considered whether the MYH9 associations with FSGS mightresult from a specific association with ESKD due to FSGS. In a survivalanalysis of 161 African American FSGS cases, haplotype E-1 showedno association with progression to ESKD (relative hazard ¼ 1.03, 95%CI ¼ 0.55–1.94; P ¼ 0.92, recessive model) (SupplementaryFig. 2 online).
DISCUSSIONThe podocytopathies, including FSGS and collapsing glomerulopathy,involve genetic and acquired forms of podocyte injury10, and podocyte
injury is proposed to play a central role in the pathogenesis of otherprogressive kidney diseases, including diabetic and hypertensivenephrosclerosis25. Over ten genes have been associated with FSGS;most are associated with disease forms with mendelian inheritance orwith evidence for new mutations26. With regard to sporadic, non-familial FSGS, associations have been identified with WT1 and NPHS2(refs. 27,28), but polymorphisms in these genes explain only a smallportion of the disease burden.
We have used MALD to identify genetic variation in MYH9 as animportant contributing factor to the development of idiopathic FSGS,HIV-associated FSGS (collapsing glomerulopathy) and hypertensiveESKD. The MALD scan revealed a single peak centered on MYH9 onchromosome 22q13.1 that showed strong association of Africanchromosomal ancestry with FSGS in African Americans. Fine map-ping and functional considerations further implicated MYH9. MYH9polymorphism does not differentially affect progression from FSGS toESKD, indicating that the MYH9 association with FSGS is a generalassociation for this disease, and is not limited to ESKD due to FSGS.
An independent study29 of an African American population com-posed of both diabetic and nondiabetic individuals with ESKD alsofound a MALD association with a similar, overlapping region ofchromosome 22. As this study found a very similar peak on chromo-some 22, and had overlapping collaborators with our study, we sharedour finding of a strong association of MYH9 variants with FSGS.Kao et al. explain the admixture signal with the three MYH9 intron23 SNPs that had the strongest FSGS associations in our study, andreplicate our findings of an association of nondiabetic ESKD and theMYH9 locus29.MYH9 risk alleles are more frequent among African Americans, and
protective alleles are more frequent among European Americans(Fig. 3), providing a genetic explanation for the disparities in riskfor FSGS and hypertensive ESKD in these populations.
Nonmuscle myosin, like muscle myosin, is assembled from sepa-rately coded heavy and light chains, and binds to actin to performintracellular motor functions30. Mutations in MYH9 have beenassociated with four autosomal dominant clinical syndromes: May-Hegglin, Sebastian, Fechtner and Epstein31. All four syndromes involveautosomal dominant macrothrombocytopenia, with the variableaccompaniment of sensorineural deafness, cataracts, neutrophilDohle-like bodies and glomerular disease31. There are few histologicdescriptions of MYH9-associated glomerular disease. One individualwith a MYH9 mutation, undergoing kidney biopsy early in the diseasecourse, had normal light microscopy and electron microscopic evi-dence of focal podocyte foot process effacement and loss of podocyteslit diaphragms, indicating podocyte injury32. The Myh9 knockoutmouse shows embryonic lethality, whereas heterozgyous mice haveapparently normal phenotype other than hearing loss with incompletepenetrance33. Myosin IIA has been localized to podocytes and possiblymesangial cells22,32. Other mutations affecting podocyte proteins thatinteract with the actin cytoskeleton, including alpha-actinin-4(ref. 34), CD2-associated protein35 and synaptopodin36, have beenassociated with podocyte injury and FSGS in humans or experimentalanimals, suggesting the requirement for an intact actin cytoskeletonto maintain normal podocyte cytoarchitecture and filtrationbarrier function.
Our extension samples revealed that MYH9 was also associated withthe common clinical syndrome of hypertensive nephrosclerosis inAfrican Americans, but not with diabetic nephropathy. Individualswith hypertensive ESKD typically present with advanced nephropathyand secondarily elevated blood pressure with resultant left ventricularhypertrophy and retinal vascular changes. Some of these individuals
NATURE GENETICS VOLUME 40 [ NUMBER 10 [ OCTOBER 2008 1 18 1
ART I C LES

may have occult glomerular diseases, often FSGS or global glomerulo-sclerosis presenting in non-nephrotic forms, as they do not typicallyundergo renal biopsy37,38. Renal biopsy studies typically reveal thepresence of focal or global glomerulosclerosis in clinically diagnosedhypertensive nephrosclerosis39,40. Notably, the renal microvasculaturechanges that are typically attributed to hypertension fail to correlatewith measured blood pressure, suggesting that factors other thanhypertension caused nephropathy. In practice, cases are not often heldto the strict diagnostic clinical criteria as in these reports, andhypertensive nephrosclerosis is a diagnosis of exclusion in manynondiabetic forms of nephropathy. It is possible that undiagnosedFSGS in those labeled with hypertensive nephrosclerosis contributedto the association, and studies involving biopsy-proven hypertensivenephrosclerosis are needed to clarify this issue. Alternatively, indivi-duals with hypertension and with particular MYH9 alleles may bemore susceptible to podocyte injury and progressive glomerulardisease. The lack of demonstrated association of MYH9 with diabeticESKD suggests that the underlying mechanisms leading to impairedkidney function in diabetics may be distinct from those of FSGS orhypertensive ESKD. It is possible that the podocyte is not the primarytarget of the metabolic abnormalities that are believed to causediabetic nephropathy, or alternatively that those abnormalities arequantitatively much more important than MYH9 variation. Never-theless, because of the disease burden, it should be determinedwhether MYH9 variation influences the rate of progressive kidneyfunction loss in diabetic kidney disease.
Genetic studies of glomerular diseases such as FSGS are limited bythe number of subjects available—typically hundreds rather than thethousands recommended for genome-wide association studies. Smallsample sizes are generally unworkable for genome-wide associationstudies because of the need for statistical power to overcome correct-ing for the current 1,000,000 SNPs typed, and because the associationsobserved generally have modest odds ratios. However, there is a strongargument to be made for using admixture mapping for gene discoveryin diseases such as FSGS with large ancestry-driven disparities that arenot fully explained by non-genetic factors, because the gene or genesunderpinning the disease may have strong effects and/or very frequentalleles, as observed in this study, and because the smaller number ofmarkers needed simplifies the statistical issues.
A limitation of our study is that we have not yet identified thecausal sequence variation in MYH9 that is associated with FSGS.Initial resequencing of the 40 exons and intron-exon junctions ofMYH9 in 14 African Americans with FSGS and haplotype E-1 showedno obvious causal variation (data not shown). We hypothesize that thefunctional variation occurs in regulatory elements or splice-sitedeterminants, and that these influence RNA expression or proteinstructure in podocytes. Further studies are needed to identify causalvariants and to provide an understanding of what additional geneticor environmental factors must interact with MYH9 variants to causepodocyte injury leading to kidney failure.
Recently, results of genome-wide scans and MALD scans have beenreported with generally modest odds ratios for the genotype-phenotypeassociations. These weak effects have been attributed to the complexnature of the diseases involving the interaction of multiple genetic andenvironmental factors. The present study using a MALD approach hassecurely identified a main effect gene that is involved in two histolo-gically distinct forms of FSGS: idiopathic FSGS, which is characterizedby depletion of podocytes, and HIV-1–associated FSGS (collapsingglomerulopathy), which is characterized by podocyte proliferation.Extrapolating to population data from our case-control study, thefractions of sporadic or HIV-associated FSGS among African Americans
that can be explained41 by this haplotype are 4.7% and 12%, respec-tively. The large frequency difference for haplotype E-1 (60% in AfricanAmericans versus 4% in European Americans) combined with theextremely high FSGS susceptibility conferred by this factor (OR ¼ 5.0for carriers, 95% CI ¼ 3.5–7.1, recessive model; SupplementaryTable 2) provides a plausible cause for the higher incidence of FSGS,HIV-associated nephropathy and hypertensive nephrosclerosis amongAfrican Americans. For individuals not carrying haplotype E-1, theextrapolated population frequency of sporadic FSGS is very similarbetween African Americans (0.06%; 95% CI ¼ 0.03–0.1%) andEuropean Americans (0.05%; 95% CI ¼ 0.04–0.06%), suggesting thatthe two populations have comparable background levels of suscept-ibility to FSGS in the absence of MYH9 genetic susceptibility factors,and that MYH9 factors may account for 66–100% of the disparity insusceptibility to FSGS. The identification of MYH9 genetic variation asa risk factor for FSGS and hypertensive ESKD underscores theimportance of the actin cytoskeleton in podocyte biology and as apotential pharmacologic target.
METHODSHuman subjects. Kidney biopsy-confirmed idiopathic FSGS or HIV-1–asso-
ciated FSGS cases were enrolled from 22 academic medical centers in the
United States as part of the US National Institutes of Health (NIH) FSGS
Genetic Study27,28, see Supplementary Note. The study enrolled 366 subjects
with idiopathic or HIV-1–associated FSGS and 832 control subjects without
known kidney disease. Cases with one or more family members with FSGS were
excluded. Table 1 lists the number of participants included in the present study,
self-reported ancestry, disease diagnosis and date of diagnosis for cases and date
of enrollment for controls.
The FSGS study population (Table 1) consisted of three case groups:
(i) idiopathic FSGS among African Americans (n ¼ 188) without a family
history of kidney disease, with biopsy-proven FSGS; (ii) HIV-1–associated
FSGS among African Americans (n ¼ 53) with HIV-1 infection and with
kidney biopsies that were consistent with HIV-1–associated nephropathy, with
collapse of glomerular capillaries and podocyte hyperplasia; (iii) idiopathic
FSGS among European Americans with sporadic, biopsy-proven FSGS. Age at
kidney biopsy, available for all cases, was taken as a proxy for age of FSGS onset.
The mean age of onset of FSGS for European Americans was 39 ± 18 years, for
African Americans the mean age of onset for HIV-1–associated FSGS was 38 ±
8 years and for idiopathic FSGS the mean age of onset was 34 ± 14 years.
Three groups of FSGS controls are listed in Table 1. African American
normal controls (n ¼ 370) are blood donors lacking a history of kidney disease
from the NIH Clinical Center in Bethesda, Maryland and HIV-seronegative
subjects enrolled in the AIDS Link to the Intravenous Drug Experience
(ALIVE) cohort from Baltimore, Maryland. The mean age at enrollment was
44 ± 8 years. HIV-1–infected hypernormal controls (n ¼ 241) are African
Americans enrolled in the ALIVE cohort. The absence of kidney disease was
defined as having normal serum creatinine (r1.4 mg/dl) and lack of protei-
nuria (urine protein to creatinine ratio o0.5). This group represents a
hypernormal sample, in that they are drawn from the African American
population at risk for HIV-1–associated FSGS, have been HIV-1 infected for
at least 8 years, and yet lack evidence of kidney disease. The mean age at
enrollment was 44 ± 6 years. European American controls (n ¼ 221) are
normal blood donors lacking a history of kidney disease from the NIH Clinical
Center in Bethesda, Maryland and the NCI-Frederick Blood Donor Program in
Frederick, Maryland. The mean age at enrollment was 50 ± 9 years.
The extension cohort (Table 1) comprised unrelated African Americans with
ESKD attributed to nondiabetic hypertension (n ¼ 241) or type 2 diabetes
(n ¼ 284) and African American shared control subjects (n ¼ 192) without
kidney disease from the southeastern United States, using previously reported
diagnostic criteria42,43. For hypertensive ESKD, the mean age in years at
enrollment was 56 ± 14 years and age of onset of ESKD was 54 ± 15 years.
For diabetic ESKD, the mean age in years at enrollment was 64 ± 10 years, age
at diagnosis for type 2 diabetes was 43 ± 11 years, and age of onset of ESKD was
60 ± 10 years. The shared controls were geographically matched with no signs
1 18 2 VOLUME 40 [ NUMBER 10 [ OCTOBER 2008 NATURE GENETICS
ART I C LES

or symptoms of kidney disease; the mean age in years at enrollment was
50 ± 10 years.
Institutional review boards at each collaborating medical center approved
study protocols and each subject provided informed consent to participate.
Additional information about the study subjects is provided in the Supple-
mentary Note online.
Genotyping. The ParAllele platform (Affymetrix) was used to genotype 412
African American FSGS cases and controls for the MALD scan. The genotyping
interrogated 1,331 highly informative MALD markers not known to be in LD in
ancestral populations from the map that we previously published19. Of these, 59
were excluded from analysis because the controls either did not fit Hardy-
Weinberg expectations or because the genotypes were inconsistent with esti-
mates of ancestral population allele frequencies (both at P o 0.001). Ancestral
population allele counts for admixture analysis were compiled from our MALD
map construction data19, other studies13 and HapMap data44. Follow-up
genotyping in the region of the chromosome 22 peak was done for the 412
MALD samples and MYH9 genotyping was conducted on all study participants
(Table 1) using Taqman assays (Applied Biosystems). Duplicate samples (10%)
were distributed across plates to assess for consistency between genotype calls.
Plates with less than 95% complete call rate or with contaminated water controls
were repeated. Genomic positions of SNPs are from NCBI build 36.
MALD genome-scan analysis. The ANCESTRYMAP program was used to scan
the genome for regions of African ancestry that differ significantly from the
genome average in cases and from the same locus in controls20. From current
estimates of FSGS prevalence in African Americans and European Ameri-
cans7,11, and the prevalence of HIV-1 infection in the study populations, we
assumed an eightfold increase in the risk of FSGS in individuals of African
ancestry (carrying two African chromosomes) compared to those of European
ancestry. Under the log-additive model used by ANCESTRYMAP, this implies
an approximately 2.8-fold increase in risk per African chromosome that was
used in the analyses presented. Additional analyses considered alternate risk
models ranging from 0.25- to 4-fold risk per African chromosome.
We assessed significance by lod scores reported by ANCESTRYMAP. The
program was used with 100 burn-in and 200 follow-on iterations for all Markov
chain–Monte Carlo runs as recommended20. Locus-genome lod scores were
calculated on the basis of a comparison of the estimated percent ancestry at a
locus and the genome-wide ancestry average of the cases. We converted the
case-control T statistic to a lod score by calculating a P value assuming
approximate normality due to the large number of degrees of freedom, and
using lod ¼ log10(P /(1 – P)). We also calculated a lod score for genome-wide
significance; a score greater than 2.0 was considered significant45. The 95%
credible interval for the location of the FSGS disease gene was derived from the
locus-genome lod score–based relative probability distribution18. Calculations
for the 95% credible interval were made using the maldmap package in R
version 2.6.1.
Distinguishing short-range (fine mapping) from long-range (admixture-
based) associations. We carried out three logistic regression analyses for each
SNP in MYH9 or in nearby genes to separate the long-range effects of
admixture linkage disequilibrium (5–10 cM) from the short-range (typically
10–50 kb) effects of local haplotype structure in the ancestral populations. The
first two regressions used the number of African chromosomes carried by each
individual at the given SNP, estimated by ANCESTRYMAP, as a regression
covariate. The first analysis (Table 2) tested the strength of the genotype
association for each SNP, comparing a model with the SNP alone (number of
susceptible alleles carried) with a model including both the SNP and the
ancestry (estimated number of copies of African chromosomes carried). In a
second related analysis, we estimated the fraction of the associations due to
chromosomal African ancestry by comparing the reduction of sample deviance
in the model containing both the SNP genotype and the estimate of chromo-
somal ancestry, compared to the model containing the SNP genotypes alone18.
A third regression analyzed the SNP effect alone, on a subset of individuals
carrying two African chromosome segments at the tested locus with probability
greater than 95%, based on the ANCESTRYMAP estimate. All three logistic
regressions (function glm in R) used an additive model.
Adjusting for population substructure. We previously reported no evidence of
population substructure among FSGS cases and controls for the African
American subjects30. For 346 European American FSGS cases and controls,
we used the EIGENSOFT26 program to test and correct for population
stratification, using 11 markers on chromosome 22 outside of MYH9 and 88
markers on other chromosomes24. The first principal component captured
most of the population variation, and, most relevantly, captured most of the
variation differentiating African Americans and European Americans when
both were included in the analysis; this variation was well resolved whether all
SNPs, or only non–chromosome 22 SNPs, were used to generate the EIGEN-
SOFT eigenvectors. To adjust for overall population substructure, as opposed to
local chromosomal ancestry, we used each individual’s component of the first
eigenvector calculated by EIGENSOFT from non–chromosome 22 SNPs as a
covariate in logistic regression with explanatory SNP and haplotype variables.
For 717 cases and controls in the ESKD replication and extension study, we
estimated the overall admixture fractions of the individual subjects with
frappe46 using 67 ancestry-informative markers, and tested whether admixture
fraction contributed significantly to MYH9 associations with ESKD by includ-
ing this estimate as a logistic regression covariate along with the SNP and
haplotype variables.
Statistical analysis of SNP and haplotype associations. We tested for pheno-
type-genotype associations using dominant, recessive and additive models.
P values were determined by Fisher’s exact test (function fisher.test in R); all
tests are two-sided. To extrapolate from our case-control data to population
data for estimation of the attributable fraction (AF) and explained fraction
(EF)41, we assumed an FSGS prevalence of pAA ¼ 0.2% for HIV-1–uninfected
African Americans, and pEA ¼ 0.05% for HIV-1–uninfected European Amer-
icans6; we assumed the 10% prevalence of FSGS among HIV-1–infected
subjects that prevailed before effective antiretroviral therapy, as our HIV-1–
infected cases and controls were collected in this era7. The estimate of the
percent of difference in susceptibility, D, to FSGS explained by haplotype E-1 is
based on the estimate prevalence p00 of FSGS in African Americans not carrying
haplotype E-1, using D E (pAA – p00)/(pAA – pEA).
For survival analysis for progression from FSGS to ESKD we used the R
functions survfit and coxph. Time to ESKD was taken from the onset of kidney
disease; where an onset date was not available the biopsy date was used.
Haplotype inference. We inferred haplotypes both within local haplotype blocks
defined by the confidence interval method47, and within longer regions of LD
bounded by defined recombination hot spots48. Haplotypes were inferred by an
in-house implementation of the expectation-maximization (EM) algorithm49,
which measures reliability of inferences as the uncertainty (calculated as entropy)
of bootstrap-replicated haplotype inferences. Genetic associations with inferred
haplotypes were confirmed with haplotypes inferred by PHASE 2.1 (ref. 50).
Corrections for multiple comparisons. For African American FSGS SNP
associations, our analysis involved 102 MYH9 comparisons (17 SNPs examined
for 6 genetic models); thus, using a Bonferroni correction that is conservative in
that it ignores the non-independence of the tests, we considered P o 0.0005 to
be significant after correction. We show nominal P estimates in the text and
tables. We considered African American haplotypes for HapMap blocks,
maximal robustly inferred blocks, and all robustly inferred blocks containing
the highly associated intron 23 SNPs, for a total of 75 haplotypes considered for
three genetic models (225 comparisons); thus, for African American haplotype
associations, we considered P o 0.0002 to be significant (Table 3). For the
ESKD and European American FSGS replication tests (Table 4), we considered
P o 0.05 to be significant for associations confirming African American FSGS
associations that were significant after correction.
Note: Supplementary information is available on the Nature Genetics website.
ACKNOWLEDGMENTSWe thank the subjects and controls who participated in the NIH Genetic Studyand the Wake Forest ESRD Study, and the physicians who assisted by identifyingcases for these studies. M. Branton, D. Smith, L. Bartlett and L. Howard providedclinical support. E. Binns, Y. Zhou and M. Jamba provided laboratory assistance.The following members of the NIH FSGS Genetics Study Group also contributed
NATURE GENETICS VOLUME 40 [ NUMBER 10 [ OCTOBER 2008 1 18 3
ART I C LES

samples: F. Hutchinson (University of South Carolina); R. Mannon (DukeUniversity); P. Nachman (University of North Carolina, Chapel Hill); T.K. Rao(State University of New York, Downstate) and M. Smith (Cincinnati Children’sHospital). Research blood donor samples were provided by S. Leitman (NIH). Wethank S.J. O’Brien and B. Gold for discussions, N. Patterson for assistance withthe ANCESTRYMAP program, and S. Leitman for assistance in identifyinghealthy volunteers.
The content of this publication does not necessarily reflect the views or policiesof the Department of Health and Human Services, nor does mention of tradenames, commercial products or organizations imply endorsement by the USgovernment. The publisher or recipient acknowledges right of the US governmentto retain a nonexclusive, royalty-free license in and to any copyright coveringthe article.
This research was supported in part by the Intramural Research Program of theNIH, National Cancer Institute, Center for Cancer Research. This project hasbeen funded in whole or in part with federal funds from the National CancerInstitute, National Institutes of Health, under contract N01-CO-12400, theIntramural Research Programs of the National Institute for Diabetes, Digestive,and Kidney Diseases (ZO-1 DK043308), and by a grant from the NIH (RO1 DK070941 (B.I.F.)).
COMPETING INTERESTS STATEMENTThe authors declare competing financial interests: details accompany the full-textHTML version of the paper at http://www.nature.com/naturegenetics/.
Published online at http://www.nature.com/naturegenetics/
Reprints and permissions information is available online at http://npg.nature.com/
reprintsandpermissions/
1. Coresh, J. et al. Prevalence of chronic kidney disease in the United States. J. Am. Med.Assoc. 298, 2038–2047 (2007).
2. Kiberd, B.A. & Clase, C.M. Cumulative risk for developing end-stage renal disease inthe US population. J. Am. Soc. Nephrol. 13, 1635–1644 (2002).
3. Cowie, C.C. et al. Disparities in incidence of diabetic end-stage renal disease accordingto race and type of diabetes. N. Engl. J. Med. 321, 1074–1079 (1989).
4. Toto, R.D. Proteinuria and hypertensive nephrosclerosis in African Americans. KidneyInt. Suppl. 66, S102–S104 (2004).
5. Fernandez, M. et al. A multiethnic, multicenter cohort of patients with systemic lupuserythematosus (SLE) as a model for the study of ethnic disparities in SLE. ArthritisRheum. 57, 576–584 (2007).
6. Kitiyakara, C., Eggers, P. & Kopp, J.B. Twenty-one-year trend in ESRD due to focalsegmental glomerulosclerosis in the United States. Am. J. Kidney Dis. 44, 815–825(2004).
7. Kopp, J.B. & Winkler, C. HIV-associated nephropathy in African Americans. Kidney Int.Suppl. 63, S43–S49 (2003).
8. Schwartz, E.J. & Klotman, P.E. Pathogenesis of human immunodeficiency virus (HIV)-associated nephropathy. Semin. Nephrol. 18, 436–445 (1998).
9. Powe, N.R. To have and have not: health and health care disparities in chronic kidneydisease. Kidney Int. 64, 763–772 (2003).
10. Barisoni, L., Schnaper, H.W. & Kopp, J.B. A proposed taxonomy for the podocytopa-thies: a reassessment of the primary nephrotic diseases. Clin. J. Am. Soc. Nephrol. 2,529–542 (2007).
11. Kitiyakara, C., Kopp, J.B. & Eggers, P. Trends in the epidemiology of focal segmentalglomerulosclerosis. Semin. Nephrol. 23, 172–182 (2003).
12. Eggers, P.W. & Kimmel, P.L. Is there an epidemic of HIV infection in the US ESRDprogram? J. Am. Soc. Nephrol. 15, 2477–2485 (2004).
13. Freedman, M.L. et al. Admixture mapping identifies 8q24 as a prostate cancer risk locusin African-American men. Proc. Natl. Acad. Sci. USA 103, 14068–14073 (2006).
14. Yeager, M. et al. Genome-wide association study of prostate cancer identifies a secondrisk locus at 8q24. Nat. Genet. 39, 645–649 (2007).
15. Zhu, X. et al. Admixture mapping for hypertension loci with genome-scan markers.Nat. Genet. 37, 177–181 (2005).
16. Reich, D. et al. A whole-genome admixture scan finds a candidate locus for multiplesclerosis susceptibility. Nat. Genet. 37, 1113–1118 (2005).
17. Nalls, M.A. et al. Admixture mapping of white cell count: genetic locus responsible forlower white blood cell count in the Health ABC and Jackson Heart studies. Am. J. Hum.Genet. 82, 81–87 (2008).
18. Reich, D. et al. Admixture mapping of an allele affecting interleukin 6 soluble receptorand interleukin 6 levels. Am. J. Hum. Genet. 80, 716–726 (2007).
19. Smith, M.W. et al. A high density admixture map for disease gene discovery in AfricanAmericans. Am. J. Hum. Genet. 74, 1001–1013 (2004).
20. Patterson, N. et al. Methods for high-density admixture mapping of disease genes.Am. J. Hum. Genet. 74, 979–1000 (2004).
21. Zhu, X., Tang, H. & Risch, N. Admixture mapping and the role of population structurefor localizing disease genes. Adv. Genet. 60, 547–569 (2008).
22. Arrondel, C. et al. Expression of the nonmuscle myosin heavy chain IIA in the humankidney and screening for MYH9 mutations in Epstein and Fechtner syndromes. J. Am.Soc. Nephrol. 13, 65–74 (2002).
23. The International HapMap Consortium. A haplotype map of the human genome. Nature437, 1299–1320 (2005).
24. Price, A.L. et al. Discerning the ancestry of European Americans in genetic associationstudies. PLoS Genet. 4, e236 (2008).
25. Wiggins, R.C. The spectrum of podocytopathies: a unifying view of glomerular diseases.Kidney Int. 71, 1205–1214 (2007).
26. Winn, M.P. Approach to the evaluation of heritable diseases and update on familialfocal segmental glomerulosclerosis. Nephrol. Dial. Transplant. 18(Suppl. 6),vi14–vi20 (2003).
27. McKenzie, L.M. et al. NPHS2 variation in sporadic focal segmental glomerulosclerosis.J. Am. Soc. Nephrol. 18, 2987–2995 (2007).
28. Orloff, M.S. et al. Variants in the Wilms’ tumor gene are associated with focalsegmental glomerulosclerosis in the African American population. Physiol. Genomics21, 212–221 (2005).
29. Kao, W.H.L. et al. MYH9 is associated with nondiabetic end-stage renal disease inAfrican Americans. Nat. Genet. advance online publication, doi:10.1038/ng.232(14 September 2008).
30. Sellers, J.R. Myosins: a diverse superfamily. Biochim. Biophys. Acta 1496, 3–22(2000).
31. Dong, F. et al. Genotype-phenotype correlation in MYH9-related thrombocytopenia.Br. J. Haematol. 130, 620–627 (2005).
32. Ghiggeri, G.M. et al. Genetics, clinical and pathological features of glomerulonephritisassociated with mutations of nonmuscle myosin IIA (Fechtner syndrome). Am. J.Kidney Dis. 41, 95–104 (2003).
33. Matsushita, T. et al. Targeted disruption of mouse ortholog of the human MYH9responsible for macrothrombocytopenia with different organ involvement: hematologi-cal, nephrological, and otological studies of heterozygous KO mice. Biochem. Biophys.Res. Commun. 325, 1163–1171 (2004).
34. Kaplan, J.M. et al. Mutations in ACTN4, encoding alpha-actinin-4, cause familial focalsegmental glomerulosclerosis. Nat. Genet. 24, 251–256 (2000).
35. Kim, J.M. et al. CD2-associated protein haploinsufficiency is linked to glomerulardisease susceptibility. Science 300, 1298–1300 (2003).
36. Asanuma, K. et al. Synaptopodin orchestrates actin organization and cell motility viaregulation of RhoA signalling. Nat. Cell Biol. 8, 485–491 (2006).
37. Freedman, B.I., Iskandar, S.S. & Appel, R.G. The link between hypertension andnephrosclerosis. Am. J. Kidney Dis. 25, 207–221 (1995).
38. Zarif, L. et al. Inaccuracy of clinical phenotyping parameters for hypertensive nephro-sclerosis. Nephrol. Dial. Transplant. 15, 1801–1807 (2000).
39. Fogo, A. et al. Accuracy of the diagnosis of hypertensive nephrosclerosis in AfricanAmericans: a report from the African American Study of Kidney Disease (AASK) Trial.AASK Pilot Study Investigators. Kidney Int. 51, 244–252 (1997).
40. Marcantoni, C., Ma, L.J., Federspiel, C. & Fogo, A.B. Hypertensive nephrosclerosis inAfrican Americans versus Caucasians. Kidney Int. 62, 172–180 (2002).
41. O’Brien, S.J. & Nelson, G.W. Human genes that limit AIDS. Nat. Genet. 36, 565–574(2004).
42. Freedman, B.I. et al. A genome scan for ESRD in black families enriched fornondiabetic nephropathy. J. Am. Soc. Nephrol. 15, 2719–2727 (2004).
43. Bowden, D.W. et al. A genome scan for diabetic nephropathy in African Americans.Kidney Int. 66, 1517–1526 (2004).
44. Thorisson, G.A., Smith, A.V., Krishnan, L. & Stein, L.D. The International HapMapProject web site. Genome Res. 15, 1592–1593 (2005).
45. Reich, D. & Patterson, N. Will admixture mapping work to find disease genes? Phil.Trans. R. Soc. Lond. B 360, 1605–1607 (2005).
46. Tang, H., Peng, J., Wang, P. & Risch, N.J. Estimation of individual admixture:analytical and study design considerations. Genet. Epidemiol. 28, 289–301(2005).
47. Gabriel, S.B. et al. The structure of haplotype blocks in the human genome. Science296, 2225–2229 (2002).
48. Frazer, K.A. et al. A second generation human haplotype map of over 3.1 million SNPs.Nature 449, 851–861 (2007).
49. Excoffier, L. & Slatkin, M. Maximum-likelihood estimation of molecular haplotypefrequencies in a diploid population. Mol. Biol. Evol. 12, 921–927 (1995).
50. Stephens, M. & Scheet, P. Accounting for decay of linkage disequilibrium in haplo-type inference and missing-data imputation. Am. J. Hum. Genet. 76, 449–462(2005).
1 18 4 VOLUME 40 [ NUMBER 10 [ OCTOBER 2008 NATURE GENETICS
ART I C LES
Related Documents