Research Center Borstel Leibniz-Center for Medicine and Biosciences Priority Area Infections Program Director: Prof. Dr. Ulrich Schaible Cellular Microbiology Group Mycobacterium tuberculosis - Host-Cell Interactions in the Phagosome Dissertation for Fulfillment of Requirements for the Doctoral Degree of the University of Lübeck from the Department of Natural Sciences Submitted by Anna Christina Geffken from Büschelskamp/Scheeßel

Welcome message from author
This document is posted to help you gain knowledge. Please leave a comment to let me know what you think about it! Share it to your friends and learn new things together.
Transcript

Research Center Borstel
Leibniz-Center for Medicine and Biosciences
Priority Area Infections
Program Director: Prof. Dr. Ulrich Schaible
Cellular Microbiology Group
Mycobacterium tuberculosis -
Host-Cell Interactions in the Phagosome
Dissertation
for Fulfillment of Requirements
for the Doctoral Degree
of the University of Lübeck
from the Department of Natural Sciences
Submitted by
Anna Christina Geffken
from Büschelskamp/Scheeßel

________________________________________________________________
First referee: Prof. Dr. Ulrich E. Schaible
Second referee: Prof. Dr. Jan Rupp
Date of oral examination: 20.01.2016

III
Content
ABSTRACT ............................................................................................................... 8
1 INTRODUCTION .............................................................................................. 10
1.1 Tuberculosis ................................................................................................ 10
1.1.1 History of Tuberculosis ........................................................................... 10
1.1.2 Epidemiology of Tuberculosis ................................................................. 11
1.1.3 The disease generalities......................................................................... 12
1.1.3.1 Stages of TB ................................................................................... 12
1.1.3.2 Therapy ........................................................................................... 13
1.1.3.3 Vaccines ......................................................................................... 13
1.2 Mycobacterium tuberculosis ...................................................................... 13
1.2.1 Microbiology of the Mycobacterium tuberculosis complex ...................... 13
1.2.2 The process of M. tuberculosis infection ................................................ 14
1.3 The role of innate immunity in Tuberculosis disease............................... 15
1.3.1 Cells of the innate immune system ......................................................... 15
1.3.2 The role of phagocytes in innate immunity ............................................. 16
1.3.3 Pattern recognition receptors of mycobacterial antigens ........................ 16
1.3.4 The cell biology of phagocytosis in professional phagocytes .................. 18
1.4 Host-pathogen interactions in the phagosome ......................................... 24
1.4.1 The role of cell envelope and secreted proteins in M. tuberculosis
virulence ............................................................................................................... 24
1.4.2 The role of cell envelope lipids in M. tuberculosis virulence ................... 26
1.5 Objectives .................................................................................................... 30
2 MATERIAL AND METHODS ............................................................................ 31
2.1 Material ......................................................................................................... 31
2.1.1 Consumables ......................................................................................... 31
2.1.2 Chemicals .............................................................................................. 32
2.1.3 SiRNA .................................................................................................... 34
2.1.4 Lipids ...................................................................................................... 34

IV
2.1.5 Antibodies and dyes ............................................................................... 35
2.1.6 Cell-lines ................................................................................................ 35
2.1.7 Bacteria.................................................................................................. 35
2.1.8 Hardware ............................................................................................... 35
2.1.9 Software ................................................................................................. 37
2.2 Methods ....................................................................................................... 38
2.2.1 Isolation and purification of lipid coated bead phagosomes from
macrophages for mass spectrometry analysis ..................................................... 38
2.2.1.1 Cell strains and culture conditions .................................................. 38
2.2.1.2 Cell counting ................................................................................... 38
2.2.1.3 Coating of beads with M. bovis BCG cell-wall lipid Trehalose-6,6’-
dimycolate ....................................................................................................... 38
2.2.1.4 “Infection” of macrophages with lipid coated beads ........................ 39
2.2.1.5 Isolation and purification of lipid coated bead phagosomes from
macrophages .................................................................................................... 39
2.2.1.6 Purification of lipid coated bead phagosomes via sorting by FACS 40
2.2.1.7 Quality control and quantification of lipid coated bead phagosomes 41
2.2.2 Methods for proteomic analysis ............................................................. 42
2.2.2.1 Modifications to chapter 2.2.1 for proteomic analysis ...................... 42
2.2.2.2 1D-PAGE ........................................................................................ 42
2.2.2.3 Gel-based liquid chromatography coupled to mass spectrometry
(GeLC-MS) ....................................................................................................... 42
2.2.2.4 Data Analysis .................................................................................. 44
2.2.3 Methods for evaluation of TDM interaction partners ............................... 44
2.2.3.1 Cell culture ...................................................................................... 44
2.2.3.2 “Infection” of macrophages with lipid coated beads ........................ 44
2.2.3.3 Infection of macrophages with M. tuberculosis ............................... 44
2.2.3.4 Lysosomal labeling ......................................................................... 45
2.2.3.5 Immunofluorescence staining ......................................................... 45
2.2.3.6 Gene knock down by small interference RNA ................................. 46
2.2.3.7 Western blot.................................................................................... 46
2.2.3.8 Colony forming unit assay ............................................................... 48
2.2.4 Methods for lipidomic analysis ............................................................... 48
2.2.4.1 Modifications to chapter 2.2.1 for lipidomic analysis ....................... 48

V
2.2.4.2 Lipid extraction from isolated and purified lipid coated bead
phagosomes ..................................................................................................... 49
2.2.4.3 Derivatization of cholesterol ............................................................ 50
2.2.4.4 µLC-FT-ICR-MS .............................................................................. 50
2.2.4.5 ESI Qq-TOF-MS .............................................................................. 51
2.2.4.6 Data processing and analysis.......................................................... 52
2.2.4.7 Statistical analysis and graphic representation ................................ 53
3 RESULTS ......................................................................................................... 54
3.1 Method development: Isolation and purification of bead phagosomes for
mass spectrometry analysis ................................................................................. 54
3.1.1 Quality control of purified bead phagosomes.......................................... 55
3.1.2 Purification of bead phagosomes via sorting by FACS ........................... 56
3.2 The TDM bead phagosome proteome ........................................................ 58
3.2.1 Introduction of selected proteins and STRING analysis .......................... 67
3.3 Evaluation of TDM interaction partners ..................................................... 69
3.3.1 Evaluation of the presence of candidate proteins on control bead, TDM
bead and M. tuberculosis phagosomes by immunofluorescence staining............. 69
3.3.2 Evaluation of the presence of candidate proteins on isolated and purified
control and TDM bead phagosomes by Western blot ........................................... 81
3.3.3 Evaluation of the role of candidate proteins for intracellular survival of M.
tuberculosis by small interfering RNA/CFUs analysis ........................................... 82
3.4 A role for the β-actin cytoskeleton in TDM-mediated inhibition of
phagosome maturation ......................................................................................... 84
3.5 The lipid coated bead phagosome lipidome ............................................. 89
4 DISCUSSION .................................................................................................... 95
4.1 Resume ........................................................................................................ 95
4.2 Method development: Isolation and purification of bead phagosomes
from macrophages for mass spectrometry analysis........................................... 97

VI
4.2.1 Quantification of phagosomal proteins by spectral counting is a label-free
and semi-quantitative approach ......................................................................... 100
4.2.2 Evaluation of proteomics data by immunofluorescence staining and
Western blot revealed contradicting results ........................................................ 100
4.3 TDM induced changes on the bead phagosome proteome ................... 102
4.3.1 TDM bead phagosomes accumulate proteins of the annexin superfamily .
............................................................................................................. 107
4.3.2 TDM bead phagosomes accumulate proteins involved in vesicle fusion ....
............................................................................................................. 109
4.4 The actin cytoskeleton is involved in M. tuberculosis-mediated inhibition
of phagosome maturation ................................................................................... 111
4.4.1 β-actin accumulates on TDM bead and M. tuberculosis phagosomes . 112
4.4.2 Removal of β-actin drives M. tuberculosis into a functional phago-
lysosome ............................................................................................................ 113
4.4.3 Proteins regulating actin treadmilling are important for survival of M.
tuberculosis in macrophages but not the WASH-complex .................................. 113
4.5 TDM-mediated inhibition of phagosome maturation changes the lipid
composition of bead phagosomes ..................................................................... 116
4.6 Conclusion: TDM-mediated changes of the phagosomal proteome and
lipidome – potential interaction partners or innocent bystanders? ................ 120
4.7 Perspectives .............................................................................................. 122
LITERATURE ........................................................................................................ 124
SUPPLEMENTARY MATERIAL ........................................................................... 141
LIST OF FIGURES ................................................................................................ 180
LIST OF TABLES.................................................................................................. 182
LIST OF ABBREVIATIONS AND SYMBOLS ....................................................... 183
PUBLICATIONS AND CONFERENCES ............................................................... 187
VII
ACKNOWLEDGEMENTS .................................................................................... 1888
ERKLÄRUNG .................................................................................................... 18989
Abstract
8
Abstract
Worldwide, Tuberculosis is the prime human “killer” caused by a single bacterial
pathogen species, Mycobacterium tuberculosis. Still, the interactions between M.
tuberculosis and its predominant host-cell, the macrophage, are far from being fully
understood at the molecular level. Phagocytosed particles become enclosed inside
phagosomes which, under normal conditions, subsequently mature to phago-
lysosomes by successive fusion and fission events upon interaction with endo- and
lysosomes. M. tuberculosis however, stalls phagosome maturation at an early
phagosomal stage to create a niche for its survival and proliferation.
For that purpose, M. tuberculosis requires virulence factors impeding phagosomal
maturation. Positioned at the surface of mycobacteria, cell-wall glycolipids represent
the molecular forefront of macrophage-M. tuberculosis interactions. Lipidome-based
studies revealed glycolipid, trehalose-6,6’-dimycolate (TDM) as important contributor
to inhibition of phagosome maturation, but the actual virulence function of TDM and its
interaction partners remain elusive. To study the function of single M. tuberculosis lipid
species in phagosome biogenesis, we established a “lipid coated bead model”. Upon
phagocytosis, lipid coated bead phagosomes were purified and analyzed by mass
spectrometry for their protein and lipid compositions.
By a systems-biology approach combining lipidomics, proteomics and RNAi studies,
we revealed that (i) the TDM bead phagosome proteome is different compared to
control ones, (i) the actin cytoskeleton represents an indirect TDM target for inhibition
of phagosome maturation and (iii) differential phagosomal membrane lipid
compositions by TDM interaction may promote association of actin cytoskeleton
nucleation promoting factors. To conclude, we identified putative target structures to
interfere with TDM virulence function and intracellular survival of M. tuberculosis.
Zusammenfassung
Tuberkulose ist, nach HIV/AIDS, die zweithäufigste Infektionskrankheit des
Menschen. Die WHO schätzt, dass circa ein Drittel der Weltbevölkerung latent mit TB
infiziert ist und jedes Jahr etwa 9 Millionen Menschen an TB erkranken und 1.5
Millionen daran sterben. Trotzdem ist die Interaktion zwischen Mycobacterium
tuberculosis und der favorisierten Wirtszelle, den Makrophagen, auf molekularer
Ebene nicht genau verstanden. Wenn Makrophagen nicht intrazellulär lebende
Bakterien phagozytieren, werden diese durch die Reifung des so entstandenen
Phagosomes und der Fusion mit Lysosomen schrittweise verdaut und auf diese Weise

9
unschädlich gemacht. Als intrazelluläres Bakterium jedoch, hat sich M. tuberculosis
auf das Überleben in Phagozyten spezialisiert und wird von den Zellen des
angeborenen Immunsystems nicht zerstört.
Um dies zu erreichen, besitzt M. tuberculosis ein breites Spektrum an Virulenz-
faktoren. Zu diesen zählen, unter anderem, die einzigartigen Lipide der mykobak-
teriellen Zellwand. Glycolipide wie Trehalose-6,6´-dimykolat (TDM) befinden sich an
der vorderster Front, wenn Mycobakterien auf ihre Wirtszelle treffen. Vorherige
Studien konnten zeigen, dass TDM für die Inhibition der Phagosomen Reifung eine
Schlüsselrolle spielt. Trotzdem ist die molekulare Virulenzfunktion von TDM nicht
geklärt.
Um die Funktion einzelner Lipidspezies von M. tuberculosis zu untersuchen, haben
wir ein „lipid coated bead model“ etabliert, welches die Infektion von Wirtszellen durch
Mykobakterien nachahmen soll. In diesem Modell werden TDM ummantelte Beads
von Makrophagen phagozytiert und die so entstandenen Bead Phagosomen isoliert,
aufgereinigt und mit Hilfe massenspektrometrischer Analysen auf ihre Protein- und
Lipid-Zusammensetzung untersucht.
Unsere Untersuchungen ergaben, (i) dass sich das Proteom von TDM-Bead-
Phagosomen von Kontroll-Bead-Phagosomen unterscheidet, (ii) dass das Aktin
Zytoskelett eine Zielstruktur darstellt, die durch die Interaktion der Zelle mit TDM
beeinflusst wird, um die Phagosomen Reifung zu hemmen und (iii) dass Lipide in der
Phagosomen-Membran direkte TDM-Interaktionspartner darstellen, welche TDM
manipuliert um Nukleations-Promotionsfaktoren für die Bildung des Aktin Zytoskeletts
am Phagosom zu rekrutieren.

Introduction
10
1 Introduction
1.1 Tuberculosis
1.1.1 History of Tuberculosis
“Es geht so nicht weiter. Ihre Frau Tochter, wenn nicht etwas geschieht, das sie der
Einsamkeit und dem Schmerzlichen ihres nun seit Jahren geführten Lebens entreißt,
wird schnell hinsiechen. Eine Disposition für Phthisis war immer da…[…].“
Effi Briest, Theodor Fontane
Phthisis, Schwindsucht, consumption, scrofula, Pott's disease or white plaque, are
several descriptive names for one single infectious disease, nowadays termed
Tuberculosis (TB). TB is an aerosol-transmitted infectious disease of the lung caused
by bacterial pathogens of the Mycobacterium tuberculosis complex (MTBC).
In 1984, John Hayman hypothesized that mankind has co-evolved together with
mycobacterial pathogens since 150 million years [1]. However, only with increasing
population size based on the industrial revolution, during the 19th and early 20th
century, TB became pandemic. In the late 19th century, 70 % to 90 % of the urban
population of Europe and North America were infected and about 80 % of those
individuals with active TB died [2]. In 1882, the knowledge about TB changed
dramatically when Robert Koch held a presentation entitled “Die Aetiologie der
Tuberkulose” [3]. Robert Koch identified the tubercle bacillus as etiological agent of
TB. Based on these findings, in 1921 Albert Calmette and his associate Camille Guérin
developed the first vaccine against TB by attenuating Mycobacterium bovis.
Consequently, in the next decades, the BCG (Bacille Calmette-Guérin) vaccine was
used to vaccinate millions of infants worldwide. Despite the knowledge of the
etiological agent of TB, treatment was limited to inpatient sanatoria where patients
were treated by rest, fresh air, sunlight and a rich diet [4]. Only in 1944 and 1946, TB
treatment became achievable when the first antibiotics effective against M.
tuberculosis, streptomycin and PAS, were discovered [5]. Consequently, the number
of TB cases declined in Europe due to improved socioeconomic conditions, better
nutrition, hygiene and surveillance sequestration of TB patients but also as a results
of successful antibiotic treatment [6].
However, from 1985 on, TB experienced a renaissance primarily in developing, but
also to some extent in industrialized countries. This was largely due to the HIV/AIDS
pandemic [7]. For the period 1990-1999, the World Health Organization (WHO)

Introduction
11
predicted an increase in annual global incidence from 7.5 million to 10.2 million new
cases [8]. Consequently, the WHO established a global framework for TB control
termed DOTS (directly observed therapy, short course) to improve case detection,
monitoring and supervision of drug intake [9]. Additionally, in 1998, the Stop TB
initiative was established as a global plan for TB control. In 2006 this was further
extended by establishing the Stop TB partnership and to the Global Plan to Stop TB
2006-2015. This plan aimed to halve TB prevalence and mortality compared with 1990
levels by 2015 and to achieve TB elimination by 2050. It can be quoted as success
that between 1990-2010 global TB mortality rates fell by around 40 % [10].
1.1.2 Epidemiology of Tuberculosis
Still, TB remains the second leading cause of death from a single infectious agent
worldwide after HIV [11]. The WHO estimates that one third of the human population
is latently infected. In the year 2013, globally there were an estimated 9 million cases
and 1.5 million deaths [11]. However, the current situation is torn: the WHO classifies
22 high burden countries that account for over 81 % of the world’s TB cases [10].
Among those are the South East Asian region, the African Region and the Western
Pacific Region. In stark contrary are the developed countries of the Americas and the
European Region with only 3 % and 4 % of incident cases in 2013, respectively (Figure
1.1) [11].
Introduction
12
Figure 1.1: Global trends in estimated rates of TB incidence in 2013. Modified from [11]. The
WHO classifies 22 high burden countries accounting for 81 % of the worlds TB cases. These in-
clude the South East Asian Region, the African Region and the Western Pacific Region. To the
contrary, the Americas and the European Region harbour 3 % and 4 % of all cases, respectively.
HIV remains a very important risk factor to develop acute TB. As within the 9 million
incident cases in 2013, 13 % were HIV co-infected. Another alarming scenario is the
increase in multi- and extensively-drug-resistant (MDR/XDR)-TB, primarily in countries
with functional but substandard heath care systems. Here repeated inadequate or
incomplete drug therapies are likely to be the cause of the emergence of drug re-
sistance in M. tuberculosis. Most of these cases occur in Russia, China and India [10].
1.1.3 The disease generalities
1.1.3.1 Stages of TB
Infection with TB primarily occurs by inhalation of pathogen containing aerosols (Ø
<5 µm) originating from humans with active pulmonary TB expelled by coughing or
sneezing. As few as 1-3 bacteria are sufficient to cause infection [11]. In 70 % of cases,
TB manifest as pulmonary disease [12]. However, extra-pulmonary TB occurs
frequently and aside from the lung, practically every part of the human body can be
infected.
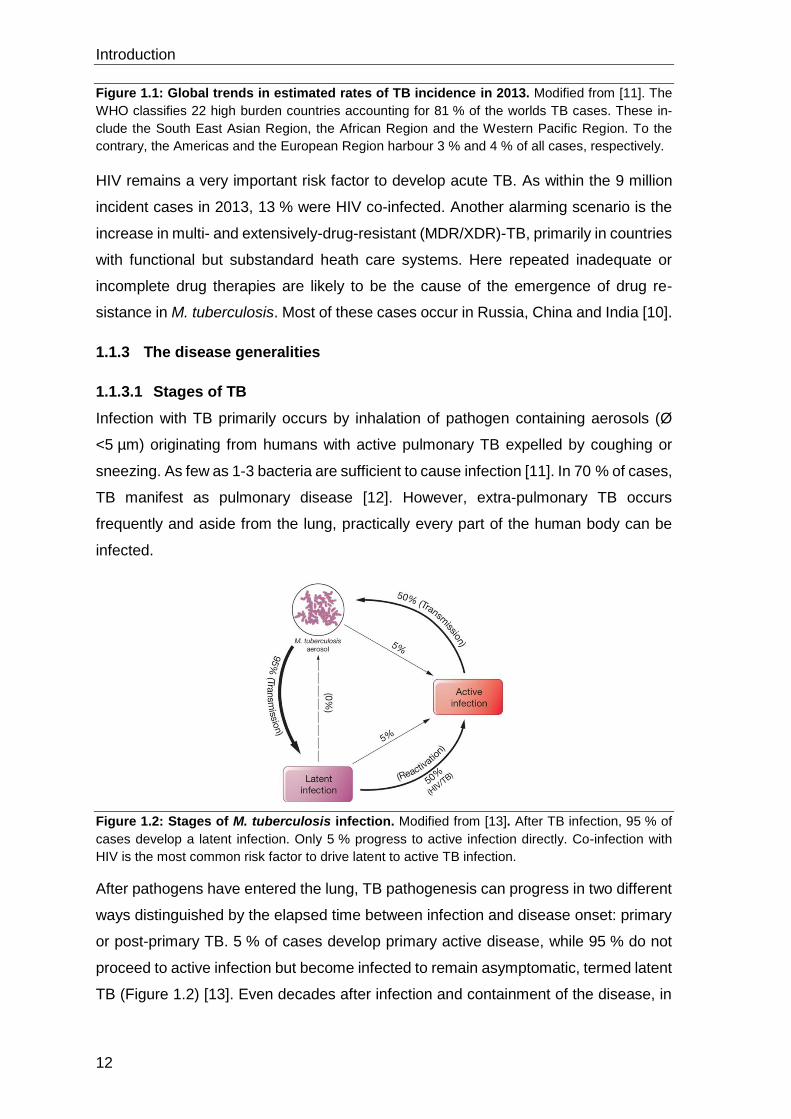
Figure 1.2: Stages of M. tuberculosis infection. Modified from [13]. After TB infection, 95 % of
cases develop a latent infection. Only 5 % progress to active infection directly. Co-infection with
HIV is the most common risk factor to drive latent to active TB infection.
After pathogens have entered the lung, TB pathogenesis can progress in two different
ways distinguished by the elapsed time between infection and disease onset: primary
or post-primary TB. 5 % of cases develop primary active disease, while 95 % do not
proceed to active infection but become infected to remain asymptomatic, termed latent
TB (Figure 1.2) [13]. Even decades after infection and containment of the disease, in

Introduction
13
5-10 % of cases, latent TB can be reactivated termed post-primary TB [14]. The most
prominent risk factor to progress from latent to active TB today is still HIV co-infection.
However diabetes, tumor necrosis factor α (TNF-α) antagonist therapies of
autoimmune disease patients and smoking are other important risk factors [15]–[17].
1.1.3.2 Therapy
TB can be treated with antibiotics. However, single drug therapy is not recommended
since this treatment will inevitably promote drug resistance [18]. Thus multi-drug
therapy is standard and to date there are 28 different approved antibiotic species
classified as first-line and second-line drugs. First-line drugs are the core TB treatment
and have bactericidal activity while second-line drugs are rather bacteriostatic [18].
The WHO recommended regimen for treatment of active drug-susceptible TB is
divided to two phases: an initial phase (intensive phase) of two months comprising four
first-line drugs followed by a four months treatment (stabilisation phase) with
combination of two first-line drugs [19],[23]. With this, cure rates of more than 90 %
are achieved [21]. An emerging problem is the development of MDR- and XDR-TB
because the drugs applied today are in use since 1960 and have not been properly
used in many settings and regions. Evidently, new TB drugs are urgently needed. In
addition, new attempts should be made to treat TB that must include better
understanding of the host-pathogen interaction early in infection. That way, host-
directed therapies can be developed.
1.1.3.3 Vaccines
Up to date, there is no vaccine that reliably prevents TB. Developed in 1921, the BCG
vaccine is effective only in the prevention of severe disease as meningitis and military
TB in children under 5 years [18]. While in low-risk transmission countries such as
Germany BCG vaccination is no longer advised, in high burden countries the WHO
still recommends BCG vaccination for neonates [11],[19]. Regardless, overall the
vaccine has an estimated efficacy of approximately 50 % for the prevention of TB and
is thus not expected to have any significant impact in reducing global TB incidence
[18],[22]. Thus new and more efficient TB vaccines must be developed.
1.2 Mycobacterium tuberculosis
1.2.1 Microbiology of the Mycobacterium tuberculosis complex
Within the kingdom of bacteria, M. tuberculosis belongs to the phylum of
Actinobacteria and is further classified in the family Mycobacteriaceae and the genus
Introduction
14
Mycobacterium [23]. Due to the unique mycobacterial cell-wall they cannot truly be
classified as Gram-positive. Mycobacteria are rod-shaped and non-motile with a size
of 0.2 to 0.6 µm by 1 to 10 µm. In liquid culture their growth is pleomorphic as they can
occur as single rods or as multicellular and branched filaments.
Human and animal pathogens of the Mycobacterium tuberculosis complex are
classified as slow-growers (generation time >24 h) while avirulent species such as e.g.
Mycobacterium smegmatis are fast-growers (generation time >3-4 h) and are mostly
found in environmental habitats such as water or soil. MTBC bacteria are obligate
pathogens of mammals and comprises seven different species: M. tuberculosis, M.
bovis (ssp. bovis and caprae), M. africanum, M. microti, M. canetti und M. pinnipedii
[24]. M. tuberculosis is the most notorious pathogen in humans [10]. M. canetii and M.
africanum (clade I and II) are also human pathogens but are primarily isolated from
African patients. M. bovis is known as the causative agent of TB in cattle but has a
wide host spectrum including humans, domestic or wild bovines. M. caprae, M.
pinipedii are able to infect goats, deer and seals, respectively [25],[26].
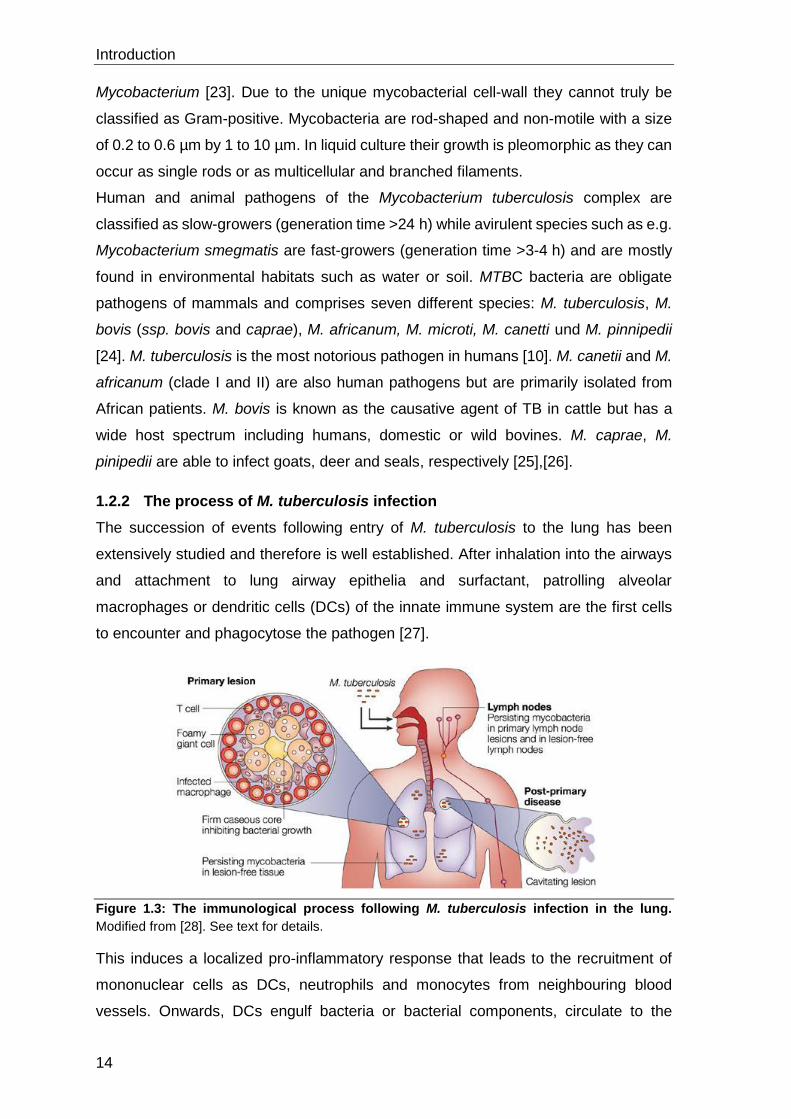
1.2.2 The process of M. tuberculosis infection
The succession of events following entry of M. tuberculosis to the lung has been
extensively studied and therefore is well established. After inhalation into the airways
and attachment to lung airway epithelia and surfactant, patrolling alveolar
macrophages or dendritic cells (DCs) of the innate immune system are the first cells
to encounter and phagocytose the pathogen [27].
Figure 1.3: The immunological process following M. tuberculosis infection in the lung.
Modified from [28]. See text for details.
This induces a localized pro-inflammatory response that leads to the recruitment of
mononuclear cells as DCs, neutrophils and monocytes from neighbouring blood
vessels. Onwards, DCs engulf bacteria or bacterial components, circulate to the

Introduction
15
draining lymph nodes and present mycobacterial antigens via the major
histocompatibility complex (MHC) class I or class II or CD1 molecules to naive T-cells
[29]. T-cells then migrate to the lungs to orchestrate anti-infection immunity, thereby
enhancing the antibacterial activity of macrophages by releasing activating cytokines,
such as interferon-γ (IFN-γ) and TNF-α. This T-helper 1 response is considered to
result in arrest of the infection in granuloma or complete clearance [30]. The bacteria
can persist within granulomas for years to decades in a dormant stage leading to latent
TB. Granulomas represent an organized structure composed of macrophages, giant
foamy cells (derived from macrophages), T- and B-cells as well as blood vessels.
Furthermore granulomas become encapsulated by a fibrotic and often calcified matrix.
Latent TB is therefore described as a state of equilibrium between bacterial growth
and immune control, in which maintained immune responses sequester the infection
locally, thus permitting host-controlled persistence [31]. Exacerbating lung pathology
is limited via regulatory T-cells and probably myeloid suppressor cells by the release
of anti-inflammatory cytokines as interleukin-10 and transforming growth factor-β.
The latent TB stage is asymptomatic. In contrast, active primary and post-primary TB
encompasses a heterogeneous range of symptoms depending on various factors as
the site of infection, co-morbidity or age [32]. Independent from the site of infection,
the clinical presentation of active TB shares systematic symptoms as fever, malaise,
weakness and weight loss [18]. Symptoms of pulmonary TB are cough, hemoptysis
and radiological abnormalities such as lung cavities or densities [33].
1.3 The role of innate immunity in Tuberculosis disease
1.3.1 Cells of the innate immune system
In humans, as all mammals, immunity to pathogens is mediated by the innate and
adaptive immune system. Innate immunity refers to intrinsic and rather nonspecific
defence mechanisms while acquired immunity matures over time to become highly
antigen specific. However, both types of immune responses are the result of cells
circulating the blood and lymphatic fluid [23]. All cells comprising the immune defense
derive from a common progenitor termed (hematopoietic) stem cell. Stem cells locate
in the bone marrow. Through the influence of distinct cytokines they differentiate to
myeloid and lymphoid progenitor cells and erythroid megakaryocytes [34]. Myeloid
progenitors give rise to innate immune cells such as myeloid DCs, macrophages,
neutrophils, eosinophils, basophils and mast-cells. Lymphoid progenitors mature to T-

Introduction
16
and B-lymphocytes, NK-cells (natural killer cells) as well plasmacytoid DCs yielding
the acquired immune system.
1.3.2 The role of phagocytes in innate immunity
When a pathogen invades a host, specialized white blood cells called phagocytes of
the innate immune system are the first cells to deal with the invader. Phagocytes are
at the starting point of the innate and adaptive immune response because they are
able to (i) recognize, engulf and destroy microbes, (ii) release pro-inflammatory
cytokines and chemokines to attract inflammatory innate cells but also those of the
adaptive immune system and (iii) to process and present foreign antigens for
presentation to T-cells. The term phagocyte has its origin in the ancient Greek terms
“phagein; eating” and “cytos; cell” [23]. The process of phagocytosis is defined as the
ingestion of particles larger than 0.5 µm and was discovered more than 100 years ago
by Ilja Mechnikov [35]. In mammals, three different professional phagocytes can be
distinguished: macrophages, neutrophils and DCs. The macrophage is the central cell
in innate immunity against M. tuberculosis.
Phagocytosis is a relatively specific process because it involves recognition and
binding of “prey” by receptors on the phagocyte surface [36]. Recognition of foreign
particles by professional phagocytes is facilitated by germline encoded pattern
recognition receptors (PRRs) specific for pathogen associated molecular pattern
(PAMP) [37]. PAMPs are molecules absent from higher organisms and therefore serve
as identifiers of pathogens for the innate immune system. PRRs that sense PAMPs of
Mycobacteria are of various families and include the Toll-like receptors (TLRs), the
nucleotide oligomerization domain (NOD)-like receptors (NLRs), scavenger receptors
(SR) and C-type lectin receptors (CLRs). Phagocytes also express opsonic receptors
that bind pathogens decorated by opsonins as immunoglobulins or components of the
complement cascade. These comprise the Fcγ (FcγR) and complement receptors
(CRs). Many of these interactions mediate either pro- or anti-inflammatory signaling
events or phagocytosis, or both.
1.3.3 Pattern recognition receptors of mycobacterial antigens
TLRs are archetypal PRRs located at plasma or endosomal membranes of innate as
well as adaptive immune cells. Upon ligand binding and receptor dimerization, several
adaptor proteins transport the signal into the nucleus. Subsequently, the NF-ĸB
transcriptional regulator induces the production of pro-inflammatory cytokines and
chemokines. Several TLRs were described to sense mycobacterial PAMPs:

Introduction
17
Heterodimers of TLR2/TLR6 and TLR2/TLR1 have reported to sense triacylated and
diacylated lipoproteins, respectively [41],[42]. Other reported ligands for TLR2 are
mycobacterial cell-wall lipids as trehalose-6,6-dimycolate (TDM), lipomannan (LM)
and phosphatidylinositol mannosides (PIMs) [43],[44]. Furthermore, unmethylated,
mycobacterial DNA with CpG motifs was shown to be recognized by phagosomal
TLR9 [41].
M. tuberculosis can also interact with receptors of the NLR family [42]. NOD-like
receptors are intracellular sensors of PAMPs since they are primarily localized in the
cytoplasm of monocytes and macrophages. NOD2 senses muramyl dipeptide (MDP)
and synergizes with TLR2 to induce an inflammatory response to M. tuberculosis.
Additionally the NLRP3 recognizes M. tuberculosis secreted ESAT6 to promote
inflammasome activation [43].
Lung monocytes/macrophages and DCs express SRs on their plasma membrane. SR
sub-group A consists of SR-AI, SR-AII and MARCO, while SR sub-group B consists
of SR-B1 and CD36 [44]. Of these, the macrophage receptor with collagenous
structure (MARCO) and class A SR types I and II (SR-A) have been shown to bind
acetylated low-density lipoprotein. MARCO was recently discovered to bind TDM and
thereby to tether M. tuberculosis to macrophages, activate the TLR4/CD14 signalling
pathways and initiate phagocytosis [39]. SR-A also senses TDM but rather induces
anti-inflammatory actions. CD36 was shown to be involved in the uptake of
Mycobacteria by class B Drosophila macrophage-like cells in crosstalk with TLR2 [45].
CTLs represent another family of PRRs sensing mycobacterial PAMPS, comprising
the mannose receptor (MR), Dectin-1/2, the macrophage inducible Ca2+-dependent
(C-type) lectin (Mincle), MCL and the dendritic cell-specific intercellular adhesion
molecule-3-grabbing non-integrin (DC-SIGN). The MR, a transmembrane protein
expressed on tissue and alveolar macrophages as well as DCs, binds various
mycobacterial antigens such as lipoarabinomannan (LAM), PIM, arabinomannans,
mannans and mannose-containing proteins and induces phagocytosis [52],[53].
Dectin-1 is expressed in macrophages, DCs and neutrophils and initiates phagocytosis
by sensing mycobacterial α-glucans [48]. Mincle was recently discovered to be a key
CTL in recognition of TDM [49]. Moreover, also MCL, an FcRγ-coupled activating
receptor, was shown to respond to TDM [50]. DC-SIGN is present on the membrane
of DCs, tissue and alveolar macrophages. As key receptor for M. tuberculosis, it
recognizes antigens as LAM, 19 kDa antigen molecules, ManLAM, LM,

Introduction
18
arabinomannan, mannosylated glycoproteins, PIMs and α-glucans [51]–[54]. Of the
soluble collectins from the CLRs family, the soluble mannose binding lectin (MBL) and
surfactant proteins A and D (SP-A/D) are able to sense molecules of M. tuberculosis.
SP-A and SP-D, produced by the respiratory epithelium, bind lipoarabinomannans
(LAM) and glycoproteins of the mycobacterial cell-wall thereby promoting
phagocytosis and enhanced phago-lysosomal fusion [55]. Synthesized in the liver and
circulating the extracellular space, MBL bind to glycans such as D-mannose or L-
fucose [56]. Thereby complement is directly activated and linked to the MBL coat via
the classical lectin pathway to facilitate CR binding and phagocytosis.
Of the opsonic receptors, the complement receptor 3 (CR3), expressed in neutrophils,
monocytes, NK-cells and macrophages, is involved in the complement pathway for the
binding of opsonized Mycobacteria [57]. Complement opsonins such as C3b and C3b
bind the antigen 85C (AG85C) of M. tuberculosis, tether the bacilli to the membrane
of phagocytes and activate both classical and/or alternative complement pathways.
CR3 also directly interacts with the bacilli since it is able to bind to LAM, β-β-glucans,
mannose and PIMs [58]–[60]. Further, the family of Fc-receptors bind antibodies which
complex M. tuberculosis and antigens thereof. These receptors bind the Fc-part of
immunoglobulin antibodies. In the context of M. tuberculosis infection, Fc-receptors of
the γ-type have the most important role since, in response to mycobacterial infection,
they mediate the rapid ingestion of IgG opsonized particles. FcγR are found on the
surface of macrophages, DCs, neutrophils, B- and NK-cells. Antigen-specific IgG are
secreted by activated B-cells upon direct antigen recognition by surface expressed
IgG-receptors in combination with cytokines secreted by activated T-cells [64],[65].
Upon binding of opsonised particles by several FcγR, their cytosolic immunoreceptor
tyrosine-based motifs (ITAM) trigger particle uptake, accelerate phagosome
maturation and signal for the production of pro-inflammatory cytokine secretion [63].
1.3.4 The cell biology of phagocytosis in professional phagocytes
Phagocytosis of particles such as pathogens is the exclusive effector mechanism of
macrophages, neutrophils and DCs. As explained in detail above, phagocytic
receptors tether bacteria as M. tuberculosis to the phagosomal membrane and initiate
uptake. Overall the process of phagocytosis can be divided into three main steps: (i)
particle recognition, (ii) particle internalization and (iii) maturation of the particle-
containing phagosome to the phago-lysosome. Several PRRs engage in the process
of particle binding and thus multiple signaling cascades are triggered concomitantly.
Introduction
19
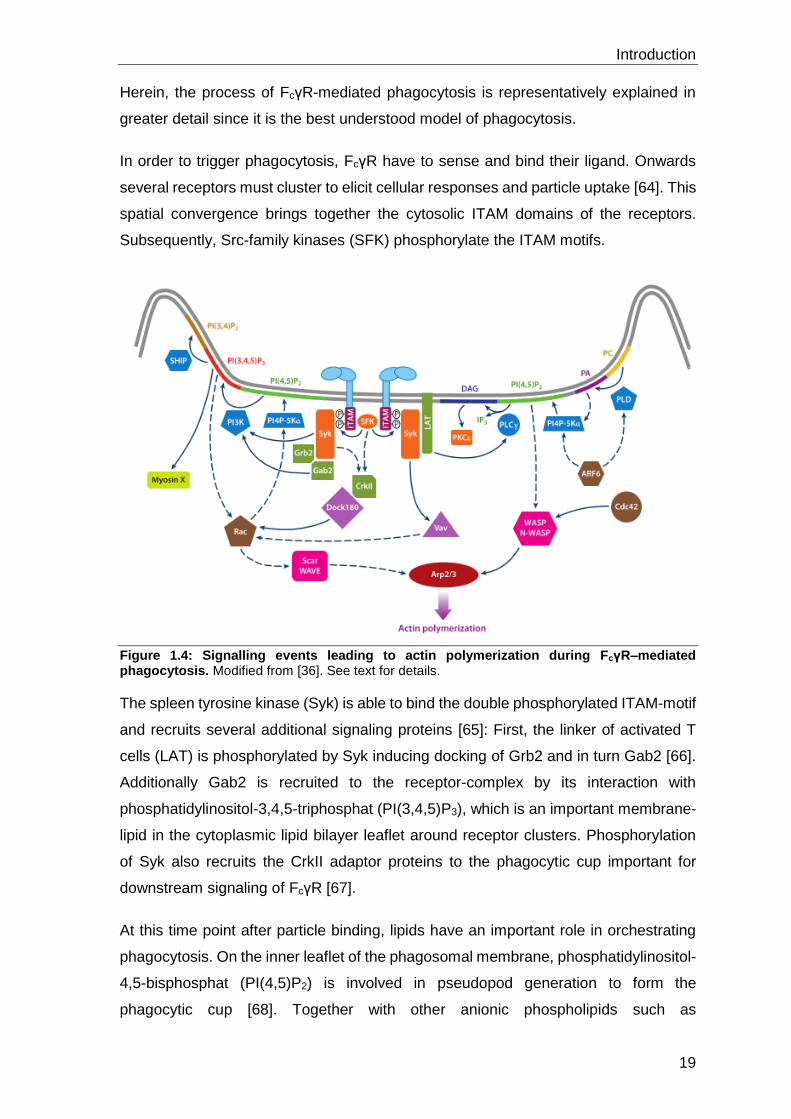
Herein, the process of FcγR-mediated phagocytosis is representatively explained in
greater detail since it is the best understood model of phagocytosis.
In order to trigger phagocytosis, FcγR have to sense and bind their ligand. Onwards
several receptors must cluster to elicit cellular responses and particle uptake [64]. This
spatial convergence brings together the cytosolic ITAM domains of the receptors.
Subsequently, Src-family kinases (SFK) phosphorylate the ITAM motifs.
Figure 1.4: Signalling events leading to actin polymerization during FcγR–mediated phagocytosis. Modified from [36]. See text for details.
The spleen tyrosine kinase (Syk) is able to bind the double phosphorylated ITAM-motif
and recruits several additional signaling proteins [65]: First, the linker of activated T
cells (LAT) is phosphorylated by Syk inducing docking of Grb2 and in turn Gab2 [66].
Additionally Gab2 is recruited to the receptor-complex by its interaction with
phosphatidylinositol-3,4,5-triphosphat (PI(3,4,5)P3), which is an important membrane-
lipid in the cytoplasmic lipid bilayer leaflet around receptor clusters. Phosphorylation
of Syk also recruits the CrkII adaptor proteins to the phagocytic cup important for
downstream signaling of FcγR [67].
At this time point after particle binding, lipids have an important role in orchestrating
phagocytosis. On the inner leaflet of the phagosomal membrane, phosphatidylinositol-
4,5-bisphosphat (PI(4,5)P2) is involved in pseudopod generation to form the
phagocytic cup [68]. Together with other anionic phospholipids such as

Introduction
20
phosphatidylserine (PS) and PI(3,4)P2, it creates a negative charge at the inner leaflet
of the plasma membrane. This attracts phosphatidyl-kinases such as PI4P-5K which
is essential for the lipid-homeostasis. Shortly after the transient synthesis of PI(4,5)P2,
it disappears allowing particle internalization probably by actin disassembly [69]. The
decrease of PI(4,5)P2 is mediated by PI-specific phospholipase Cγ and PI-3-kinase,
which are recruited to the phagocytic cup and hydrolyze PI(4,5)P2 to diacylglycerol
(DAG) or phosphorylate it to PI(3,4,5)P3 respectively [71],[73]. To further support
phagocytic cup formation, in addition phospholipase D is attracted to hydrolyze
phosphatidylcholine (PC) to phosphatidic acid (PA). With its cone shape, PA promotes
curvature of the membrane.
The formation of pseudopods and the phagocytic cup depend on the correct
orchestration of actin assembly and disassembly. This is mediated by small GTPases
of the Rho family. During phagocytosis these comprise Cdc42 and Rac1/2 which
stimulate formation of filopodia and lamellopodia, respectively [71]. Both cellular
protrusions are important for the formation of the phagocytic cup and the nascent
phagosome. Additionally the GTPase ARF6 delivers endosome membranes to
nascent phagosomes. Downstream of these GTPases, the assembly and disassembly
of (branched) actin filaments at the phagocytic cup is controlled by actin binding
proteins (APBs) and nucleation-promoting-factors (NPFs). Here the Arp2/3 complex
and the NPFs Wiskott-Aldrich syndrome proteins (WASP)/N-WASP or Scar/WAVE-
family proteins have an important role. Together with PI(4,5)P2, Cdc42 activates the
NPFs, which in turn activate Arp2/3 to promote actin assembly [72]. Furthermore,
several proteins such as myosins interact with actin filaments during phagocytosis. It
has been shown that myosin II, IXb and IC are important for particle engulfment and
that myosin X has a role in phagosome formation [73].

Introduction
21
Figure 1.5: Stages of phagosome maturation. Modified from [36]. After sealing of the nascent phagosome, maturation starts immediately. Through highly orchestrated fusion and fission events with early (EE), intermediate (IE), late (LE) and lysosomes (LY), the phago-lysosome matures. The phago-lysosome is a hostile organelle with a low pH of 4.5 containing hydrolytic enzymes as cathepsins, AMPs and reactive oxygen- and reactive nitrogen-intermediates. Specific phago-lysosomal markers are LAMP1 and LAMP2, high contents of the v-H+-ATPase and the absence of early endosome markers such as Rab5 or EEA1. Phagosomes of M. tuberculosis (Mtb) pause at an early phagosomal stage.

Introduction
22
After scission from the plasma membrane, the nascent phagosome interacts with early
endosomes thereby initiating phagosome maturation. These membrane fusion events
are mediated by Rab GTPases. Vps34 is targeted to Rab5-positive membranes via
Vps15 and catalyzes the conversion of PI to PI(3)P which is essential for progression
to the late phagosomal stage [74]. PI(3)P together with Rab5 recruit EEA1. The latter
has a fusion-promoting function as it interacts with syntaxin13, a soluble N-
ethylmaleimide-sensitive factor attachment protein (SNARE). SNARE-proteins are
universal mediators of membrane fusion. They form complexes composed of R-
SNARE (localized at donor membranes as early endosomes) and Q-SNARE (localized
at acceptor membranes as early phagosomes) proteins. These hairpin-like protein
complexes bring donor- and acceptor membranes in close proximity, thereby reducing
the free energy barrier for membrane fusion [36].
Despite fusion with early endosomes, the volume of the early phagosome remains
constant. This is due to the fission of endosomes recycling from phagosomes to e.g.
retrieve cell-surface proteins as the transferrin-receptor (TfR) back to the plasma
membrane. Endosomal fission from phagosomes is mediated by an elaborate network
of signaling, budding and tubulating components as Rab4, Rab11, Eps15, the hetero-
oligomeric complex (COPI) and the retromer complex [36]. Another mechanism
maintaining phagosome size is the formation of intraluminal vesicles (ILVs). At the
intermediary phagosomal stage ILVs develop via invagination and pinching of the
phagosomal membrane with the help of the endosomal sorting complex for transport
(ESCRT) machinery and PI(3)P binding proteins Hrs and SNX3 [75].
With ongoing fusion and fission of the phagosome with intermediary and late
endosomes, phagosome maturation proceeds. At the late stage, the phagosome
differs significantly from its early stage. It loses early markers such as Rab5, gains late
markers like Rab7, acidifies and acquires acid hydrolases. The exchange between
Rab5 and Rab7 is an essential step towards maturation. Simultaneously, late
phagosomes acquire the lysosome-associated membrane proteins 1 and 2
(LAMP1/2). Apart from providing membrane integrity and protection against
membrane-active enzymes, LAMP1 and 2 were recently shown to be important for
phagosome maturation by recruiting Rab7. Another characteristic of late phagosomes
is the presence of the unique lipid lysobisphosphatidic acid (LBPA) inside ILVs.
Furthermore, acidification of the maturing phagosome is a consequence of the
constant accumulation of proton (H+) pumps as the vacuolar ATPase (v-H+-ATPase).

Introduction
23
This multimeric protein complex translocates H+ across the phagosomal membrane at
the expense of ATP lowering the early pH of 6.3 to 4.5 [36].
Finally, the late phagosome fuses with lysosomes to form phago-lysosomes. This final
fusion event is, in part, coordinated by the formation of a specific SNARE complex
made of syntaxin7 and VAMP7. The phago-lysosome is the intracellular compartment
that is specifically designed to digest proteins, lipid-membranes, carbohydrates and
thus also microbes [36]. The v-H+-ATPase-mediated acidification of the late
phagosome starts a well-defined process of activation of microbicidal effectors. Due
to the low pH, microbial growth is inhibited, the enzymatic activity of proteases such
as cathepsin B, D and L is optimized at pH of 4.5 and the natural-resistance-associated
macrophage protein1 (NRAMP) is recruited. NRAMP is able to export metal ions such
as iron (Fe3+) from the phago-lysosome to sequestrate ions essential for growth of
intra-phagosomal bacteria [76]. The phago-lysosome harbors several bactericidal
peptides and proteins: lysozyme is able to hydrolyze peptidoglycan; the main structural
components of bacterial cell-walls. Furthermore, cationic antimicrobial peptides
(cAMPs) interact with anionic bacterial membranes and generate pores allowing the
diffusion of ions across the cell-wall. With high proton concentrations and the activation
by pro-inflammatory cytokines as IFN-γ, the macrophage is also capable of producing
reactive oxygen intermediates (ROI) by the NADPH oxidase (NOX2) and reactive
nitrogen intermediates (RNI) by nitrous oxide synthase 2 (iNOS) (Figure 1.6). ROI and
RNI contribute to the elimination of pathogens in phago-lysosomes by damaging
proteins, lipids and DNA/RNA.
Figure 1.6: Production of ROI and RNI in the phagosome. Modified from [77]. The membrane-standing proteins iNOS and NOX2 catalyse the production of NO-and O2-radicals from oxygen. These highly reactive compounds further react to form peroxinitrite (ONOO-) or nitrogen dioxide radicals (NO2
-) and hydrogen peroxide (H2O2), respectively. All compounds are able to damage proteins, lipids, DNA and RNA.

Introduction
24
1.4 Host-pathogen interactions in the phagosome
As outlined, M. tuberculosis infects the host by engaging phagocytic receptors to enter
professional phagocytes as macrophages to abuse as host-cells. After invasion, the
pathogen ensures survival and colonization by deviating the microbicidal mechanism
of phagosome maturation. For that purpose, M. tuberculosis expresses an array of
virulence factors. The main reservoir of M. tuberculosis virulence factors is their unique
and highly complex cell-wall. Here lipids and proteins synergize to disturb the
macrophage microbicidal properties. This chapter gives a detailed overview about the
secreted virulence factors as well as the components of the mycobacterial cell-wall
and, as far as known, their molecular function in virulence.
Per definition, virulence factors are peptides, proteins or lipids of pathogens, whose
inactivation leads to a significant loss in pathogenicity or virulence but fails to impair
the bacterial growth in standard growing media [77]. This criterion comprises a very
large spectrum of candidates including the genes and proteins required for expression,
transport and positioning of virulence factors. In the present work, the focus lies on
lipids that are at the molecular forefront of direct interaction with the host-cell.
The reference laboratory strain M. tuberculosis H37Rv harbors 14 regions of difference
in its genome (RD 1-14) which are absent in the vaccine strain M. bovis BCG and are
thought to be related to pathogenicity. Together with 6 regions termed H37Rv deletion
1-5 (RvD1-5) and the M. tuberculosis specific deletion (TbD1), these regions are
believed to code for the virulence factors of the MTBC. However, the virulence-
associated genes of M. tuberculosis are not classically concentrated on pathogenicity
islands as in other bacteria such as Salmonella but rather are widely distributed
throughout the genome.
1.4.1 The role of cell envelope and secreted proteins in M. tuberculosis
virulence
Proteomic studies of the mycobacterial cell envelope revealed more than 500 proteins
[77]. Most of them are thought to be important for cell-wall homeostasis but 5 % might
have a role in virulence. Cell-wall proteins include the outer membrane proteins
(OMPs) localized in the mycobacterial outer membrane (MOM), cell-wall-associated
or secreted lipo- and glycoproteins.
The delivery of virulence proteins across the cell envelope during infection of host-
cells is mediated via specialized type 1-4 secretion systems (T1-4SS) [78]. The

Introduction
25
genome of M. tuberculosis encodes for at least four types of secretion systems but
only T2SS and the Mycobacteria specific T7SS have a role in virulence. The ESAT6
secretion system 1 (ESX-1) is a specialized T7SS for secretion of virulence relevant
proteins ESAT6 (ESXA), CPF10 (ESXB), EspA-D and EspR. ESAT6 and CFP10,
encoded on RD1 and indispensable for virulence of M. tuberculosis, are small proteins
of 9 kDa and 10 kDa respectively, which form heterodimers [78]. Their virulence
function has been linked to M. tuberculosis escape from the phagosome into the
cytoplasm and spread to uninfected cells as well as inhibition of apoptosis [79].
OMPs are MOM-associated and therefore can directly interact with the host-cell [77].
Lipo- and glycoproteins are exported into the cell-wall or the host-cell cytosol via T2SS
or general Sec secretory pathways. The fibronectin binding proteins are a complex of
three proteins (FbpA-C), better known as the antigen 85 complex (Ag85). Besides
being a mycolic acid transferase, this complex is the major secreted protein of
Mycobacteria and has been shown to mediate the adhesion of the pathogen to
fibronectin on mucosal surfaces, thereby facilitating entry to the host. The six Mce
(mammalian cell entry) proteins are secreted or surface exposed. It has been shown
that Mce1 supports entry of mycobacterial pathogens into mammalian cells and
survival inside macrophages [80]. Adhesion of M. tuberculosis to epithelial cells is also
accomplished via HbhA (heparin-binding protein). HbhA tethers Mycobacteria to
epithelial cells and promotes bacterial aggregation and primary biofilm formation [81].
Furthermore, the 15 kDa lipoprotein was shown to interact with TLR2 possibly
regulating immune responses in favor of mycobacterial survival in the phagosome.
The 27 kDa lipoprotein AG P27 (LprG) has been shown to have a role in infection by
suppression of the host immune response and to bind DC-SIGN mediating adhesion
[77].
M. tuberculosis harbours also three cell-wall associated secretory glycoproteins: the
MPT83 antigen, the 45-47-kDa alanine-proline-rich antigen (Apa, Rv1860) and LqpH
(19 kDa antigen). All three are believed to be potential adhesins and thus have role in
host-cell attachment. Additionally LqpH binds MR, is able to inhibit antigen
presentation of MHC class II molecules in a TLR2-dependent manner and induces
apoptosis for the cell to cell spread of the pathogen [82]. Furthermore, Psts-1 (38 kDa
glycoprotein) was also shown be secreted and to interact with TLR2 and TLR4
resulting in induction pro-inflammatory cytokines [77].

Introduction
26
Pathogens of the MTBC harbor several secreted virulence proteins which increase the
resistance to host toxic compounds as ROI and RNI, arrest phagosome maturation
and prevent apoptosis. M. tuberculosis employs at least six proteins that are secreted
into the phagosomal lumen via SecA2 to directly interfering with ROI and RNI. SodC,
KatG, AhpC, TpX, Mel2 and putatively Acr2 have superoxide dismutase activity that
either inhibits production of O2 radicals or detoxifies H2O2. Further, M. tuberculosis
possesses several proteins suggested to be involved in inhibition of phagosome
maturation. These include Ndk, PtpA and PE_PGRS30. Ndk was shown to inhibit
recruitment of Rab7-GTP and Rab5-GTP to phagosomes and inactivate their function
by dephosphorylation [77]. Furthermore the phosphatase PtpA dephosphorylates
VPS33B, a host protein involved in regulation of membrane fusion. PtpA also binds to
the v-H+-ATPase machinery, thereby inhibiting luminal acidification. The detailed role
of PE_PGRS30 is unknown, although its deletion renders mutants unable to inhibit to
phago-lysosome fusion [77]. Recently the secreted acid phosphatase SapM was found
to dephosphorylate PIP(3)P, that has an essential role in phagosome maturation [83].
Inhibition of apoptosis is another strategy to survive inside professional phagocytes
since the programmed cell death is one of the major mechanisms of the innate immune
response to contain the spread of pathogens. Virulent Mycobacteria modulate host-
cell death by switching from apoptosis to necrosis. This is achieved by controlling the
production of ROI and RNI-mediated apoptosis by NuoG, SecA2/SodA, Rv3600-3653c
and protein kinase PknE.
1.4.2 The role of cell envelope lipids in M. tuberculosis virulence
The mycobacterial cell envelope is composed of three layers: (i) the outermost layer
composed of the capsule and the mycobacterial outer membrane (MOM), (ii) the cell-
wall core composed of arabinogalactan (AG) covalently linked to peptidoglycan (PG)
and (iii) the plasma membrane (PM) (Figure 1.7). The mycobacterial cell-wall
contributes to virulence also by being highly impermeable impeding entry of toxic
molecules as antibiotics.

Introduction
27
Figure 1.7: Schematic representation of the composition of the mycobacterial cell-wall. Modified from [84]. The mycobacterial cell-wall is partitioned in three layers. The capsule constitutes the outermost surface, followed by the mycobacterial outer membrane (MOM) or mycolic acid layer. Peptidoglycan (PG) and arabinogalactan (AG) build the core of the cell-wall. The plasma membrane or cell membrane (CM) surrounds the lumen of the pathogen.
(i) The plasma membrane (PM) is an asymmetric bilayer composed of phospholipids
as phosphatidylglycerol (PG), P2G, phosphatidylethanolamine (PE) and proteins.
Mannosylated lipoarabinomannan (ManLAM) and phosphatidyl-inositol mannosides
(PIMs) are anchored here via their phosphatidyl-myo-inositol residue.
(ii) The cell-wall core is composed of arabinogalactan (AG) and peptidoglycan (PG).
AG is a polymer made of arabinose and galactose monosaccharides that tethers the
mycolic acid layer to peptidoglycan (PG). The PG polymer is orientated orthogonal to
the plasma membrane and consists of sugars as N-acetyl-α-D-glucosamine and
modified muramic acid and the amino acids L-alanyl-D-isoglutaminyl-meso-
diaminopimelyl-D-alanine (L-ala-D-glu-A2pm-D-Ala) similar to Gram-positive and
Gram-negative bacteria. The peptide chain can be cross linked to the peptide chain of
another strand forming the 3D mesh-like layer [23]. The cell-wall core forms a rigid
layer outside the PM providing cellular shape and strength as well as scaffold for AG
and the MOM.
(iii) The mycobacterial outer membrane (MOM) is composed of a bilayer membrane of
mycolic acids, mannosylated molecules, acyltrehaloses, mycocerate-containing
glycolipids and glycoproteins.
The mannosylated molecules comprise glycoproteins and (lipo) glycans as PIMs,
lipomannan (LM), lipoarabinomannan (LAM) and mannose-capped LAM (ManLAM).
These molecules are non covalently linked to the mycolic acids of the MOM (PIM) or

Introduction
28
the phospholipids of the plasma membrane (LM and LAM) through hydrophobic
interactions or their phosphatidyl-myo-inositol part [85].
PIMs can be divided into two groups concerning their number of mannoses: the lower
(PIM2-4) and higher order PIMs (PIM5-6). PIMs exhibit virulence function via the
induction of phagocytosis through binding to CR3 (lower) and the limiting of
phagosome-lysosome fusion events by binding to MR (higher). Furthermore, PIMs
facilitate early endosomal fusion in a Rab5-dependent manner [86]. The most
abundant forms of PIM in Mycobacteria are di-, tri- or tetra-acylated PIMs. LMs engage
with DC-SIGN. As heterodimer with TLR2/TLR1, DC-SIGN then induces apoptosis and
has pro-inflammatory effects on host-cells [82]. Mannose-capped LAM (ManLAM) is
one of the most abundant mannosylated lipids in the cell-wall of slow-growing
pathogenic Mycobacteria. Its influence on host-cell functions is diverse. Upon contact
between the pathogen and the host-cell, ManLAM interacts through its mannose
residues with the MR on macrophages and induces phagocytosis. By engaging MR,
the early phagosomal state of the pathogen-containing vacuole is maintained. Via
binding to DC-SIGN, phagocytosis is triggered as well and anti-inflammatory pathways
are up-regulated [87]. ManLAM was also shown to intercalate into the phagosomal
membrane via its PI-anchor disturbing lipid microdomains. Furthermore, it interferes
with phagosomal maturation by interfering with the recruitment of PI(3)P and Rab5 to
the phagosomal membrane [87]. Inside the phagosome it reduces phagosomal
microbicidal activity by inhibiting production of ROI, RNI and inflammatory cytokines
and apoptosis. ManLAM is also shedded from the MOM and has been shown to traffic
inside macrophage membranes [88].
The acyltrehaloses comprise the sulfatides (SL), diacyltrehaloses (DAT),
triacyltrehaloses (TAT), polyacyltrehaloses (PAT), trehalose monomycolate (TMM)
and trehalose dimycolate (TDM).
Figure 1.8: Acyltrehaloses TMM and TDM of the mycobacterial outer membrane. Modified from [82]. TMM and TDM are made of a headgroup of the sugar trehalose that can be esterified at position 6 and/or 6´ to one or two mycolic acids, respectively.

Introduction
29
The exact function of SL in mycobacterial virulence, in particular in intracellular
trafficking of Mycobacteria, remains to be fully understood. However, DAT, TAT, PAT
lipids, although non-essential for mycobacterial viability in vitro, probably contribute to
the properties of the cell surface and the permeability barrier formed by the cell
envelope [77].
TDM, the most abundant lipid in the mycobacterial cell-wall, is composed of trehalose
esterified with one (TMM, precursor of TDM) or two (TDM) mycolic acids at position 6
and/or 6’ (Trehalose-6,6-dimycolate) (Figure 1.8). Mycolic acids are long-chain fatty
acids, α-branched and β-hydroxylated with different chain lengths (from 60 to 90
carbon atoms in Mycobacteria) and chemical functional groups, such as double bonds,
cyclopropanes or oxygenated functions located at two defined positions of the
meromycolic chain [87]. TDM is also referred to as “cord factor” since its presence
alters the colony morphology to rope-like forms [23]. Alike ManLAM, TDM has various
functions relevant for M. tuberculosis early in infection as well as in granuloma
formation [89]. TDM has been proposed to be the main glycolipid interfering with
phagosome maturation. In 2003, Indrigo et al. showed that TDM restores virulence
function of delipidated Mycobacteria [90]. Moreover beads coated with TDM are able
to delay phagosome maturation and retain a close proximity to the phagosomal
membrane, prerequisite to inhibit phagosome maturation [91]. However, in IFN-γ-
activated macrophages, the inhibitory effect of TDM on phagosome maturation is
abolished by NO [91]. Furthermore, TDM alone is sufficient to induce granuloma
formation when intravenously injected on oil droplet formulations into mice. TDM-
mediated granuloma formation is mediated by Mincle. Engagement of Mincle activates
the Syk-Card9 signalling pathway in macrophages, which is required for activation of
macrophages in vitro and for granuloma formation in vivo following injection [92].
However, the exact molecular function of TDM remains unknown.
The mycerosate-containing lipids are phtiocerol dimycerosates (PDIM) and phenolic
glycolipids (PGL). Besides the importance of PDIM in multiplication of M. tuberculosis,
the lipid has been shown to inhibit secretion of pro-inflammatory cytokines and was
proposed to inhibit phagosome maturation by incorporating into host membranes
disturbing their organization [36],[93]. Also, cell surface associated PDIM were shown
to mask underlying PAMPs avoiding activation of pro-inflammatory processes [94].
PGL from M. marinum has been found to inhibit maturation of bead phagosomes [95].

Introduction
30
(iv) The capsule is a loosely-bound, non-covalently linked structure on the outermost
compartment of the cell. In M. tuberculosis it is composed of proteins, such as porins
for nutrient uptake, oligosaccharides and only small amounts of lipids such as PIMs
[82]. Capsular components are prone to release upon contact with the host-cell or
within the phagosome. The oligosaccharides comprise α-D-glucan, D-arabino-D-
mannan and D-mannan and were described to mediate phagocytosis via non-opsonic
binding to CR3 [82].
1.5 Objectives
The aim of this PhD-thesis was to investigate how TDM exerts its virulence function
inside the phagosome of macrophages. We hypothesize that TDM manipulates host-
cell biology through interaction with targets at the phagosome interface, in order to
inhibit phagosome maturation. To identify putative interaction partners, the lipid-coated
bead model should be used. Therefore, the following aims had to be accomplished:
i. establishment of a protocol for isolation and purification of magnetic lipid-
coated bead phagosomes from macrophages suitable for mass spectrometry
based proteomic and lipidomic analysis,
ii. analysis of control and TDM bead phagosomes proteomes and lipidomes to
identify potential host-cell-derived direct or indirect interaction partners,
iii. evaluation of selected potential host-cell targets of TDM for their role in TDM-
and M. tuberculosis-mediated inhibition of phagosome maturation and
intracellular survival.

Material and Methods
31
2 Material and Methods
2.1 Material
2.1.1 Consumables
Table 2-1: Consumables
Designation Manufacturer
75 cm2 flask Corning
5 ml screw top vial Chromacol
Dynabeads M-280 tosylactivated Life Technologies
50 ml tube, blue screw cap Greiner Bio-One
15 ml centrifuge tubes Corning
Filtropur S plus 0.2 Sarstedt
1000 µl pipette tips Sarstedt
200 µl pipette tips Sarstedt
10 µl pipette tips Molecular Bio Products
25 ml stripette Costar Corning
10 ml stripette Costar Corning
5 ml stripette Costar Corning
1 ml stripette Costar Corning
25 cm cell scraper Sarstedt
Syringe, plastipak 1 ml Becton Dickinson
Canula, microlance 3, 23 G1, Nr. 16 Becton Dickinson
FACS tube, 5 ml Becton Dickinson
1.5 ml, 2 ml reaction-tube Sarstedt
96-well plate, flat bottom Corning
2 ml protein lobind tube Eppendorf
24-well plate, flat bottom Corning
4-10 % criterion-TGX-precast gel Biorad
LC-vial 100 µl Chromacol
Coverslips, 10 mm, round VWR
Canula, microlance 3, 37G 3/4, Nr. 20 Becton Dickinson
Parafilm laboratory film BEMIS
6-well plate, flat bottom Corning
IPFL00010, immobilon-FL PVDF, 0.45 µm Merck
Petri dish Sarstedt

Material and Methods
32
Glass pasteur pipettes Brand
1.5 ml glass vials Marchery Nagel
2 ml eppendorf reaction tubes Eppendorf
HPLC vial with insert, 0.3 ml Chromacol
Caps for HPLC vials Chromacol
2.1.2 Chemicals
Table 2-2: Chemicals
Designation Manufacturer
Dulbecco’s Modified Eagle’s Medium (DMEM) PAN Biotech
Fetal bovine serum (FBS/FCS) Merck
L-Glutamine PAN Biotech
Penicillin/Streptomycin PAN Biotech
Trypan blue solution 0.4 % Sigma-Aldrich
Trichlormethan/Chloroform Carl Roth
Phosphate buffered saline (PBS) PAN Biotech
BSA (albumin bovine fraction V) Serva
D(+)-Saccharose Carl Roth
4-(2-Hydroxyethyl)piperazine-1-ethanesulfonic acid
(HEPES)
Sigma-Aldrich
1,4-Dithiothreit Carl Roth
Gelatin from porcine skin for electrophoresis, type A Sigma-Aldrich
Complete EDTA free, protease inhibitor cocktail
tablets
Roche
Deoxyribonuclease I from bovine pancreas type IV Sigma-Aldrich
Trypsin gold, mass spectrometry grade Promega
Ficoll PM 70, type 70 Sigma-Aldrich
Roti-load Carl Roth
StrataClean resin Agilent Technologies
Hydrochloric acid fuming 37 % Merck
Deionized water, millipore water Merck
2-Nitrophenyl β-D-galactopyranoside (ONPG) Sigma-Aldrich
Triton X 100 Carl Roth
Citric acid, anhydrous Sigma-Aldrich
Sodium citrate monobasic Sigma-Aldrich
Sodium carbonate Carl Roth

Material and Methods
33
Ammonium persulfate Sigma-Aldrich
Potassium thiocyanate (KSCN) Sigma-Aldrich
Iron (III) chloride (FeCl3) ABCR
Trizma base Sigma-Aldrich
Glycerol Sigma-Aldrich
Sodium-dodecyl sulphate (SDS) Carl Roth
2-Mercaptoethanol Sigma-Aldrich
Bromphenol blue–xylene cyanole dye solution Sigma-Aldrich
Acetic acid, 100 % Carl Roth
Ethanol Carl Roth
Colloidal coomassie Sigma-Aldrich
Ammonium bicarbonate Fluka
Acetonitril Carl Roth
Aeris C18 reversed-phase material Phenomenex
Paraformaldehyde Carl Roth
Middlebrook 7H9 broth Beckton Dickinson
Oleic albumin dextrose catalase (OADC) Sigma-Aldrich
Hygromycin B Sigma-Aldrich
LatrunkulinA Sigma-Aldrich
Dimethyl sulfoxide Sigma-Aldrich
Ammonium chloride Carl Roth
Goat serum PAN Biotech
4',6-Diamidino-2-phenylindole dilactate (DAPI) Life Technologies
Confocal matrix Micro-Tech-Lab
Cell line nucleofector kit V Lonza
Pierce 660 nm protein assay reagent Life Technologies
Tris base Sigma-Aldrich
30 % Acrylamide/Bisacrylamide solution Biorad
Sodium dodecyl sulphate Sigma-Aldrich
Tetramethylethylenediamine (TEMED) Biorad
Glycine AMRESCO
Methanol VWR
Powdered milk Carl Roth
Tween 20 Sigma-Aldrich
Tween 80 Carl Roth

Material and Methods
34
ECL Western blotting detection reagent GE Healthcare
Mycobacteria 7H11 Agar Beckton Dickinson
Cattle serum PAN Biotech
Methyl tert-buthyl ether for HPLC (MTBE) Sigma-Aldrich
Water LC-MS Sigma-Aldrich
Methanol LC-MS Sigma-Aldrich
Acetyl chloride Sigma-Aldrich
Chloroform for HPLC Sigma-Aldrich
Ammonium hydroxide solution Sigma-Aldrich
Ammonium acetate for mass spectrometry Sigma-Aldrich
2-Propanol LC-MS Sigma-Aldrich
2.1.3 SiRNA
Table 2-3: siRNA
Designation Manufacturer
ON-TARGETplus SMARTpool – mouse-annexinA1 GE Healthcare
ON-TARGETplus SMARTpool – mouse-annexinA6 GE Healthcare
ON-TARGETplus SMARTpool – mouse-cofilin1 GE Healthcare
ON-TARGETplus SMARTpool – mouse-profilin1 GE Healthcare
ON-TARGETplus SMARTpool – mouse-SNAP23 GE Healthcare
ON-TARGETplus SMARTpool – mouse-VAMP3 GE Healthcare
ON-TARGETplus SMARTpool – mouse-WASH1 GE Healthcare
ON-TARGETplus SMARTpool – mouse-NTR GE Healthcare
2.1.4 Lipids
Table 2-4: Lipids
Designation Manufacturer
Trehalose-6,6'-dimycolate from M. bovis (BCG) BioClot
17:0-14:1, PC Avanti Polar Lipids
17:0-20:4, PC Avanti Polar Lipids
17:0-14:1, PE Avanti Polar Lipids
17:0-14:1, PG Avanti Polar Lipids
17:0-14:1, PS Avanti Polar Lipids
D18:1-12:0, Sphingomyelin Avanti Polar Lipids
C25 Ceramide Avanti Polar Lipids
17:0, Lyso-PC Avanti Polar Lipids

Material and Methods
35
16:0-17:0, BMP (R,R) Avanti Polar Lipids
2.1.5 Antibodies and dyes
Table 2-5: Antibodies and dyes
Designation Manufacturer
Anti-annexin A1 Abcam
Anti-annexin VI Abcam
Anti-cofilin1 Abcam
Anti-profilin1 Abcam
Anti-SNAP23 Acris Antibodies
Anti-cellubrevin (VAMP3) Abcam
Anti-WASH1 Atlas Antibodies
LAMP1 1D4B self made
Anti-rat cy3 Life Technologies
Anti-rabbit cy2 Life Technologies
Anti-rabbit cy5 Life Technologies
Anti-rabbit alexa405 Life Technologies
Anti-rat HRP Jackson Immuno Research
Anti-rabbit HRP Jackson Immuno Research
Lysotracker red Life Technologies
PhalloidinAlexa488 Life Technologies
PhalloidinAlexa594 Life Technologies
2.1.6 Cell-lines
Table 2-6: Cell-lines
Designation Manufacturer
RAW264.7 macrophage cell line ATCC, US
2.1.7 Bacteria
Table 2-7: Bacteria
Designation Source
M. tuberculosis H37Rv-GFP Tanya Parish [96]
2.1.8 Hardware
Table 2-8: Hardware
Type Manufacturer
CO2 cell Incubator, HERA-cell 240 Thermo Fisher Scientific

Material and Methods
36
DynaMag-2 magnet Life Technologies
Tube rotator SB3 Stuart
HERAEUS multifuge 3SR+ Thermo Fisher Scientific
Rotor SORVALL HERAEUS 75006445 Thermo Fisher Scientific
Ultrasonic bath, sonorex super RK255H Bandelin
Clean bench, MSC-advantage class II biological
Safety cabinets
Thermo Fisher Scientific
Finnpipette, 1-10 μl, 10-100 μl, 100-1000 μl Thermo Fisher Scientific
Pipetboy, finnipette Thermo Fisher Scientific
Metal douncer WHEATON
1.5 ml tube heater, univortemp MT100 Universal Labortechnik
TCS SP5 confocal microscope Leica
Nikon eclipse TS100 Nikon GmbH
Table-top centrifuge, HERAEUS PICO 17 Thermo Fisher Scientific
Table-top centrifuge, HERAEUS FRESCO 17 Thermo Fisher Scientific
Table-top centrifuge 5424R Eppendorf
Vacuum-centrifuge for speed vacuum ScanVAC
Tecan sunrise microplate reader Tecan Group Ltd.
FACSAria IIU Becton Dickinson
Biorad power pac HC Biorad
Mini-PROTEAN tetra handcast systems Biorad
EASY-nLC II system Thermo Fisher Scientific
Proxeon 1000 system Thermo Fisher Scientific
P-2000 laser puller Sutter Instrument
Sorcerer-SEQUEST SageN Research
LTQ orbitrap velos Thermo Fisher Scientific
UV/Vis spectrophotometer Jenway
Neubauer-improved counting chamber Paul Marienfeld
Nucleofector 2b device Lonza
Tecan infinite M200 microplate reader Tecan Group Ltd.
Mini trans-blot cell Biorad
Horizontal shaker Heidolph Instruments
Amersham hypercassette autoradiography GE Healthcare
Amersham ECL Western blotting detection
reagent
GE Healthcare

Material and Methods
37
Medical film processor Konica Minolta
GS-800 calibrated densitometer Biorad
1100 HPLC Agilent Technologies
BETASIL diol-100 column ThermoFisher Scientific
Apollo dual ESI/MALDI ion source Bruker Daltonics
Bruker apex Qe FT-MS Bruker Daltonics
Q-TOF ultima, equipped with ESI source Waters
2.1.9 Software
Table 2-9: Software
Designation Manufacturer
Microsoft office 2010 Microsoft
Magellan 6.0/7.0 Tecan Group Ltd.
Scaffold 4 Proteome Software
Compass apex control 3.0.0 Bruker Daltonics
HyStar 3.2 Bruker Daltonics
Data analysis 3.2/4.0 Bruker Daltonics
LipidXplorer [97]
MassLynx 4.0 Waters
Graph pad prism 5.0/6.0 Graph Pad Software

Material and Methods
38
2.2 Methods
2.2.1 Isolation and purification of lipid coated bead phagosomes from
macrophages for mass spectrometry analysis
2.2.1.1 Cell strains and culture conditions
RAW264.7 macrophages were cultivated in Dulbecco's Modified Eagle's Medium
(DMEM)-media supplemented with 10 % (v/v) fetal calf sera (FCS), 1 % (v/v) L-
glutamine and 1 % (v/v) penicillin/streptomycin at 37 °C and 7.5 % CO2. The media is
further referred to as D10-media. For infection experiments with M. tuberculosis GFP,
D10-media without antibiotics was used.
2.2.1.2 Cell counting
RAW264.7 macrophages were washed with 5 ml PBS, scratched into 5 ml PBS and
the cell concentration was determined using a Neubauer counting chamber. Therefore,
10 µl of the cell suspension was pipetted in a Neubauer counting chamber and cells
were counted using a light microscope. Live/dead staining was accomplished using
Trypan blue.
2.2.1.3 Coating of beads with M. bovis BCG cell-wall lipid Trehalose-6,6’-
dimycolate
Trehalose-6,6-dimycolate (TDM) was solved in chloroform to a concentration of
5 mg/ml, filled to a 5 ml glass-vial and stored at -20 °C until further use. Tosylactivated
Dynabeads M-280 were stored at 4 °C up to one year.
The number of control and TDM coated beads was adjusted to the number of T75-
flasks prepared with a confluent monolayer of RAW264.7 macrophages. A confluent
monolayer of RAW264.7 macrophages usually contains 107 cells. “Bead infection” was
carried out with a multiplicity of infection (MOI) of 10. Likewise, per 107 macrophages,
108 beads were prepared.
Required amounts of beads were collected, the storage solution was removed using
the DynaMag-2 magnet and beads were washed thrice with 1 ml PBS using the
DynaMg-2 magnet. Then 1 % bovine serum albumin (BSA)-solution was prepared in
20 ml PBS and sterilized by filtration through a 0.20 µm filter. Subsequently, beads
were incubated in sterile 1 % BSA in PBS for 3 h at room-temperature (RT) on a tube
rotator. Beads were centrifuged for 5 min at 1500 rpm, the supernatant was discarded
and beads were solved in 1 ml PBS. Again, beads were washed thrice with 1 ml PBS

Material and Methods
39
using the DynaMg-2 magnet. For labeling BSA-coated beads with TDM, 50 µg TDM
per 107 beads were used. Therefore, a distinct amount of TDM was placed into a glass-
vial and vaporized using gaseous nitrogen. Subsequently, beads solved in 1 ml PBS
were added and incubated for 1.5 h in an ultrasonic bath. Control beads (BSA-coated
only) were treated likewise but without TDM. Beads were ready to use directly or were
stored up to one week at 4 °C until further use.
2.2.1.4 “Infection” of macrophages with lipid coated beads
One day prior “bead infection” experiments, four T75-flasks were equipped with 107
RAW264.7 macrophages and incubated over-night (ON) in D10-media at 37 °C and
7.5 % CO2. Control and TDM coated beads were prepared as outlined in 2.2.1.3.
“Bead infection” with control and TDM beads was carried out in parallel.
The experiment was started by removing media from RAW264.7 macrophages grown
in T75-flasks and washing the macrophages with 5 ml PBS. Then 5 ml ice-cold D10-
media was added. Therefore, T75-flasks were put upright in order to avoid direct
contact between the media and the cells at this time point. Subsequently control and
TDM beads were pipetted directly into ice-cold D10-media and mixed carefully by
shaking. Bead suspension was poured onto the cells by putting flasks in a horizontal
position and gentle shaking. Macrophages were further incubated for 5 min at 4 °C
and 5 min at 37 °C and 7.5 % CO2. Beads not attached to the cells were removed by
discarding the D10-media and washing once with warm 5 ml D10-media. Then 10 ml
D10-media were added and cells were incubated at 37 °C and 7.5 % CO2.
2.2.1.5 Isolation and purification of lipid coated bead phagosomes from
macrophages
After desired time points, D10-medium was discarded and cells were washed with 5 ml
PBS. Subsequently, 10 ml ice-cold PBS were added and macrophages containing
bead phagosomes were scratched of the flask, transferred to a 50 ml falcon tube and
spun down 5 min at 1500 rpm at 4 °C. In case more than 1 T75-flask with 107
macrophages (control or TDM) was prepared, all technical replicates were pooled from
this step on. Supernatant was discarded and pelleted cells were solved in 1 ml ice-
cold homogenization buffer (HB, 250 mM sucrose, 20 mM 4-(2-hydroxyethyl)-1-
piperazineethanesulfonic acid (HEPES), 1 mM dithiothreitol (DTT), 0.1 % (v/v) gelatin,
1 tablet protease inhibitor) and transferred into the douncer. To disrupt the cells, the
stamp of the douncer was pushed down strongly 15-30 times and the destruction
progress was followed under the light-microscope. Subsequently, samples were

Material and Methods
40
pushed through a syringe needle gauge (0.20 µm) to further lyse cells. Samples were
supplied with 50 u/ml DNase I and incubated for 10 min at 37 °C, before samples were
washed three times with 1 ml ice-cold HB and three times with ice-cold PBS by using
the DynaMag-2 magnet. For further purification and removal of cell-debris, samples
were briefly digested with 2.5 µg trypsin per 1 mg protein for 10 min at 37 °C. Samples
were washed three times with HB using the DynaMag-2 magnet. Samples were loaded
onto a 15 % Ficoll-gradient (1.5 g Ficoll-powder solved in 10 ml HB) and centrifuged
for 15 min at 2220 rpm at 4 °C. The supernatant was then carefully removed by
pipetting and the pellet was solved in 1 ml HB. The samples were again washed three
times with 1 ml ice-cold HB and three times with ice-cold PBS using the DynaMag-2
magnet. At this point, 100 µl of every sample were saved for further analysis with the
β-galactosidase assay (2.2.1.7.1) and the ferrozoin-assay (2.2.1.7.2). For lipidomic
analysis and Western blot, the purification process was stopped here and samples
were stored at -20 °C until further use.
2.2.1.6 Purification of lipid coated bead phagosomes via sorting by FACS
For further purification of bead phagosomes by sorting via FACS, samples were placed
in FACS tubes and 2 ml ice-cold PBS (final volume 3 ml) was added. Sorting by FACS
was carried out using a 70 µm nozzle size, with a low flow rate of 4 µl/sec resulting in
a sorting speed of approximately 4000-7000 events/sec. All together, 107 control and
TDM beads phagosomes were sorted into five collecting 15 ml falcon-tubes (5x 2x106
beads phagosomes per tube) prepared with 5 ml ice-cold PBS supplemented with
protease-inhibitors. During the sorting process, tubes were kept at 4 °C for the 6-
10 min sorting time. The sorting efficiency was evaluated by re-analyzing the sorted
bead phagosome fraction.
Control and TDM bead phagosomes were re-isolated from the sorting supernatant
using the DynaMag-2 magnet, solved in 12.5 µl sorting supernatant and stored at -
20 °C until further use. The sorting supernatant was pooled in a 50 ml falcon-tube and
remaining proteins were precipitated by using 20 µl “StrataClean beads” per sample.
For this purpose, StrataClean beads had to be prepared as follows: 20 µl were
incubated with 180 µl hydrochloric acid (HCl) for 6 h at 100 °C. StrataClean beads
were spun down 10 min at 10.000 xg, the HCl-supernatant was removed, StrataClean
beads were solved with 1 ml of sorted supernatant, added to the remaining sorted
supernatant and incubated ON at 4 °C on a tube-rotator. The next day, StrataClean
beads were spun down for 45 min at 10.000 xg, the supernatant was removed and the

Material and Methods
41
pellet was solved in 1 ml deionized water. Again StrataClean beads were spun down
for 5 min at 20.000 xg, the supernatant was removed and samples were dried in a
vacuum centrifuge. Finally, StrataClean beads were solved in 12.5 µl of sorted
supernatant and stored at -20 °C until further use.
2.2.1.7 Quality control and quantification of lipid coated bead phagosomes
2.2.1.7.1 Lysosomal β-galactosidase assay
Validation of TDM-mediated inhibition of bead phagosome maturation was evaluated
by measuring lysosomal β-galactosidase activity.
The protocol was adapted from a previous report [98]. 150 µl of the lysosomal β-
galactosidase reaction mix (10 mM p-nitrophenyl-β-D-galactopyrannoside (ONPG),
0.7 % (v/v) Triton X-100, 150 mM citrate buffer (40 mM citric acid, 10 mM sodium
citrate dehydrate, pH3.5)) was added to 10 µl bead phagosome samples distributed in
a 96-well plate. Samples were incubated at 37 °C and the reaction was stopped by
addition of 150 µl 0.5 M sodium carbonate solution after 1 h. This assay was
performed with three technical replicates. Absorbance at 405 nm (A405) was
determined using a microplate absorbance reader. Enzyme activities were normalized
to the iron-concentration.
2.2.1.7.2 Ferrozoin assay
To quantify the amount of magnetic beads in phagosome samples, the iron content
was used. The beads are 2.8 µm uniform, superparamagnetic, polystyrene beads
coated with a polyurethane layer and since they harbor definite amounts of iron, the
iron-concentration in the sample can be directly linked to the number of bead
phagosomes.
10 µl purified control and TDM bead phagosomes were incubated with 50 µl 12 % HCl
for 4 h at 60 °C. Afterwards, samples were spun down at 12.000 xg for 10 min
Supernatants were collected and distributed in a 96-well plate. Samples were
supplemented with 50 µl 1 % ammonium persulfate (APS) and incubated for 5 min at
RT and 100 µl 0.1 M potassium thiocyanate (KSCN) for 5 min at RT in tandem. Finally
absorbance was measured at 490 nm (A490) using a microplate absorbance reader. In
order to calculate iron concentrations, the assay was performed with 50 µl of two
standard dilution series ranging from 1000 µM to 18.75 µM and 300 µM to 4.6 µM,
respectively and treated likewise.

Material and Methods
42
Iron-concentrations of control and TDM bead phagosome samples were calculated
with the help of the standard dilution series using Microsoft Excel 2010. The assay
was performed with three technical replicates per sample.
2.2.2 Methods for proteomic analysis
2.2.2.1 Modifications to chapter 2.2.1 for proteomic analysis
“Bead infection” of RAW264.7 macrophages with control and TDM beads was carried
out pair-wise one pair per day. For proteomic analysis, 4 T75-flasks with 107
RAW264.7 macrophages were prepared for one sort of bead (control and TDM) giving
rise to 8 T75-flasks with 107 cells each to be prepared one day prior the bead infection
experiment. RAW264.7 macrophages were infected with a MOI of 10. Accordingly
4x10⁸ beads were coated with BSA (control) only and 4x10⁸ with TDM as outlined
specifically in 2.2.1.3.
Further processing samples was carried out at the laboratory of our collaboration
partners Prof. Dr. Dörte Becher and Dr. Andreas Otto at the University of Greifswald,
Department of Microbial Proteomics by Jürgen Bartel. Here four pairs of control and
TDM bead phagosomes and their corresponding StrataClean bead precipitated
supernatants (in total 16 samples) were further processed for mass spectrometry
analysis.
2.2.2.2 1D-PAGE
First, samples were dried in a vacuum centrifuge and solved with 20 µl Roti-load. Then
samples were incubated for 5 min at 95 °C, cooled, spun down by centrifugation, and
loaded onto a 4–20 % Criterion-TGX-Precast gel. Electrophoresis was carried out at
150 V. The gel was fixed with 10 % (v/v) acetic acid in 40 % (v/v) ethanol for 15 min
and stained with colloidal Coomassie overnight.
2.2.2.3 Gel-based liquid chromatography coupled to mass spectrometry (GeLC-
MS)
After staining, the gel was washed twice with water to remove excessive Coomassie
stain. The stacking gel was removed and all gel lanes of interest were excised. The
lanes were cut into 10 equidistant pieces. Each gel piece was further chopped up into
small cubes of approximately 1 mm3 and transferred into a low binding tube. The gel
pieces were washed/destained at least three times for 15 min with 700 μl of gel wash
buffer (0.2 M ammonium bicarbonate in 30 % (v/v) acetonitrile) at 37 °C under
vigorous shaking. The destained gel pieces were desiccated in a vacuum centrifuge
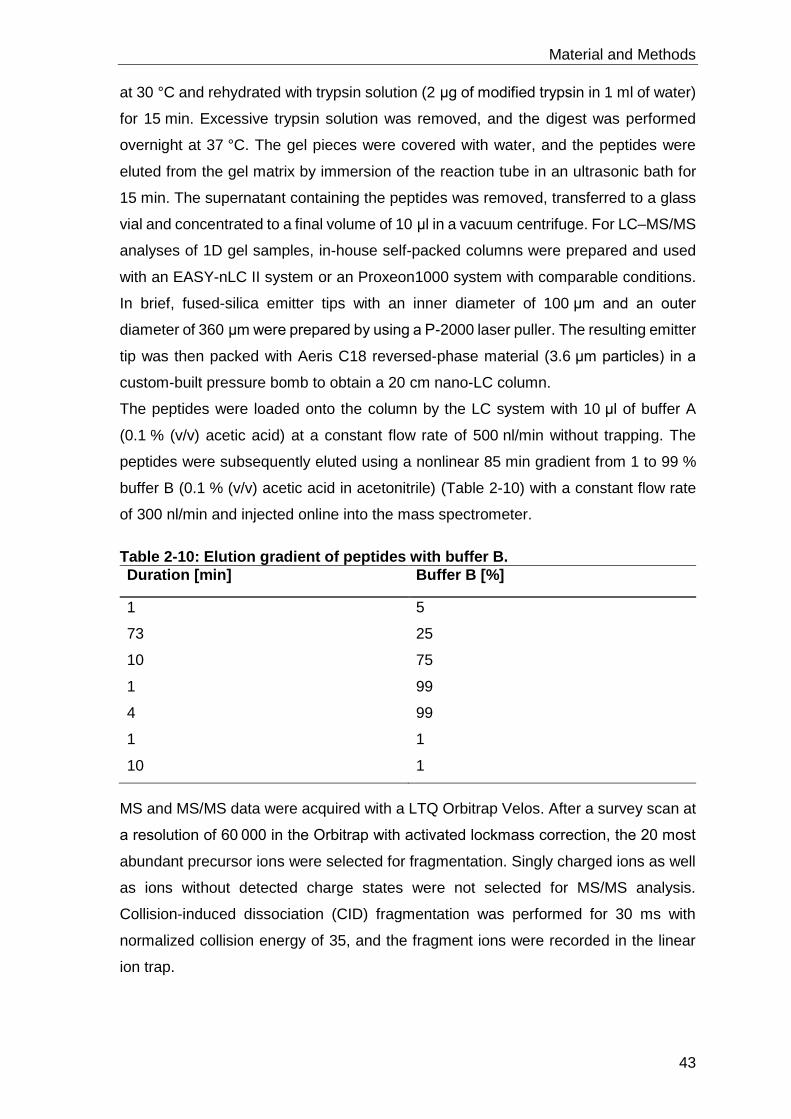
Material and Methods
43
at 30 °C and rehydrated with trypsin solution (2 μg of modified trypsin in 1 ml of water)
for 15 min. Excessive trypsin solution was removed, and the digest was performed
overnight at 37 °C. The gel pieces were covered with water, and the peptides were
eluted from the gel matrix by immersion of the reaction tube in an ultrasonic bath for
15 min. The supernatant containing the peptides was removed, transferred to a glass
vial and concentrated to a final volume of 10 μl in a vacuum centrifuge. For LC–MS/MS
analyses of 1D gel samples, in-house self-packed columns were prepared and used
with an EASY-nLC II system or an Proxeon1000 system with comparable conditions.
In brief, fused-silica emitter tips with an inner diameter of 100 μm and an outer
diameter of 360 μm were prepared by using a P-2000 laser puller. The resulting emitter
tip was then packed with Aeris C18 reversed-phase material (3.6 μm particles) in a
custom-built pressure bomb to obtain a 20 cm nano-LC column.
The peptides were loaded onto the column by the LC system with 10 μl of buffer A
(0.1 % (v/v) acetic acid) at a constant flow rate of 500 nl/min without trapping. The
peptides were subsequently eluted using a nonlinear 85 min gradient from 1 to 99 %
buffer B (0.1 % (v/v) acetic acid in acetonitrile) (Table 2-10) with a constant flow rate
of 300 nl/min and injected online into the mass spectrometer.
Table 2-10: Elution gradient of peptides with buffer B.
Duration [min] Buffer B [%]
1 5
73 25
10 75
1 99
4 99
1 1
10 1
MS and MS/MS data were acquired with a LTQ Orbitrap Velos. After a survey scan at
a resolution of 60 000 in the Orbitrap with activated lockmass correction, the 20 most
abundant precursor ions were selected for fragmentation. Singly charged ions as well
as ions without detected charge states were not selected for MS/MS analysis.
Collision-induced dissociation (CID) fragmentation was performed for 30 ms with
normalized collision energy of 35, and the fragment ions were recorded in the linear
ion trap.

Material and Methods
44
2.2.2.4 Data Analysis
Database searching was performed with Sorcerer-SEQUEST 4. After initial extraction
from the proprietary raw files, spectra were searched with Sequest against a target-
decoy database with a set of common laboratory contaminants based on the fasta
sequences for Mus musculus downloaded from NCBI. The resulting peptide-to-
spectrum matches were compiled with the Scaffold 4 software. Proteins were only
considered as identified when at least two unique peptides matching solid quality
criteria (delta cN > 0.1 and XCorr > 2.5, 3.5 and 3.8 for doubly, triply, or higher charged
peptides) have been assigned.
2.2.3 Methods for evaluation of TDM interaction partners
2.2.3.1 Cell culture
One day prior infection with beads or M. tuberculosis GFP, a 24-well plate was
equipped with sterile coverslips (Ø10 mm). 2x10⁵ RAW264.7 macrophages
resuspended in 100 µl D10-media were seeded onto each coverslip to form a drop
and incubated for 1 h at 37 °C and 7.5 % CO2 to let cells adhere to the glass. Finally,
wells were filled up to a total volume of 500 µl with D10-media and incubated ON at
37 °C and 7.5 % CO2.
2.2.3.2 “Infection” of macrophages with lipid coated beads
RAW264.7 macrophages were infected with control or TDM beads in a MOI of 3. D10-
media was discarded and cells were washed once with 500 µl 37 °C PBS.
Subsequently, D10-media containing control or TDM beads was added and
macrophages were incubated for 5 min at 4 °C and 5 min at 37 °C and 7.5 % CO2.
The supernatant containing non-attached beads was removed and cells were washed
once with 500 µl 37 °C D10-media. 500 µl 37 °C D10-media was added and cells were
further incubated at 37 °C and 7.5 % CO2 and stopped at the time points indicated by
fixing coverslips in 500 µl 4 % paraformaldehyde (PFA) ON at 4 °C.
2.2.3.3 Infection of macrophages with M. tuberculosis
2.2.3.3.1 M. tuberculosis GFP culture
Infection experiments with M. tuberculosis GFP were carried out in the biosafety-level
3 laboratory. M. tuberculosis GFP was thawed one week prior infection experiment
and cultivated in 10 ml 7H9-media supplemented with 10 % (v/v) OADC and 5 µg/ml
hygromycin at 37 °C. After four days, the culture was split 1:10 in 10 ml 7H9-media
supplemented with 10 % (v/v) OADC and 5 µg/ml hygromycin and incubated for three
days at 37 °C.

Material and Methods
45
2.2.3.3.2 Determination of bacterial number
For infection of macrophages, the M. tuberculosis GFP culture was harvested by
centrifugation at 4000 rpm for 10 min. The supernatant was removed, the pellet was
resuspended in 10 ml PBS and centrifuged at 4000 rpm for 10 min. Again, the
supernatant was removed and the pellet was resuspended in 1 ml PBS. For
separation, the bacterial suspension was pushed through a needle five times. The
number of bacteria was determined by optical density (OD580). Therefore, samples
were diluted 1:20 in 4 % PFA. An OD580 of 0.1 correlated with 5*107 bacteria per ml.
2.2.3.3.3 Macrophage infection
RAW264.7 macrophages were infected with M. tuberculosis GFP in a MOI of 3. D10-
medium was removed and cells were washed once with 500 µl warm PBS.
Subsequently, 200 µl D10-media containing M. tuberculosis GFP was added and
macrophages were centrifuged 5 min at 1500 rpm. Infection was stopped by putting
the coverslips into a new 24-well plate equipped with 500 µl 4 % PFA and incubation
ON at 4 °C.
2.2.3.4 Lysosomal labeling
For staining of lysosomes, 20 min prior stopping the experiment, cells were incubated
with 70 nM lysotracker red.
2.2.3.5 Immunofluorescence staining
Coverslips were placed on parafilm and washed twice with 100 µl PBS. To lower
background fluorescence, coverslips were incubated for 20 min with 70 µl 50 mM
ammonium chloride, washed again twice with 100 µl PBS and blocked and
permeabilized for 15 min with 70 µl 10 % (v/v) goat serum/0.1 % (v/v) Triton X in PBS.
Afterwards, samples were washed twice with 100 µl PBS. Primary antibodies were
incubated 1 h at RT. Samples were washed twice with 100 µl PBS and the secondary
species specific antibody was added for 30 min at RT. Coverslips were washed twice
with 100 µl PBS and stained for DNA with 100 µl 0.5 mg/ml 4',6-diamidino-2-
phenylindole (DAPI) for 10 min at RT. Finally samples were washed twice with 100 µl
PBS and embedded onto microscopic glass slides using confocal matrix. Table 2-11
lists the antibodies used herein and their corresponding dilutions used for
immunofluorescence staining.

Material and Methods
46
Table 2-11: Dilutions of primary and secondary antibodies and other labels
Antibodies Final immunofluorescence dilution
Anti-annexinA1 1/1000
Anti-annexin6 1/1000
Anti-cofilin1 1/300
Anti-profilin1 1/300
Anti-SNAP23 1/100
Anti-VAMP3 5 µg/ml
Anti-LAMP1 1/1000
Anti- WASH1 1/150
Anti-rabbit cy2 1/100
Anti-rabbit cy3 1/100
Anti-rat cy5 1/100
Anti-rabbit alexa405 1/100
Dyes Final immunofluorescence dilution
Phalloidin Alexa 488 1/40
Lysotracker red 70 nM
2.2.3.6 Gene knock down by small interference RNA
Cell numbers were determined as described in 2.2.1.2. 2x10⁶ cells were added to a
1.5 ml tube and spun down 10 min at 90 xg at RT. The pellet was resuspended in
100 µl RT Nucleofector-solution. Subsequently, 60 pmol siRNA was added and the
cells were transferred into the transfection cuvette. Transfection was carried out in the
Nucleofector device using program D32. Immediately, 500 µl warm D10-media was
added and cells were transferred to 6-well (control) or 24-well (for experiment) plates
equipped with 1 ml pre-warmed D10-media and incubated for desired time frames at
37°C and 7.5 % CO2 until use. In parallel to siRNAs targeted to desired proteins,
transfection with non-targeting RNA was carried out likewise. For control of siRNA
mediated knock-down of desired proteins, cells were transfected with non-targeting
siRNA, harvested as described above and destroyed by three freeze-thaw cycles
(N2(l), 37 °C H2O). Quantification of protein levels was determined by Western blot.
2.2.3.7 Western blot
2.2.3.7.1 Determination of protein concentration
Protein concentration was determined using the Pierce 660 nm assay: 10 µl of
samples were incubated with 150 µl Pierce reagent for 5 min at RT and the

Material and Methods
47
absorbance was determined at 660 nm using a microplate reader. A BSA-based
standard dilution series (2 mg/ml to 0.03125 mg/ml) was treated likewise. Protein
concentrations were calculated by the software of the microplate reader.
2.2.3.7.2 SDS-PAGE
For SDS-PAGE, 10 µg protein of control and TDM bead phagosomes were mixed with
Roti-load, incubated 5 min at 95 °C, spun down shortly and loaded onto a 10 % SDS-
gel. The gel was run for 1-1.5 h at 100 V with electrode running buffer (3.03 g tris base,
14.4 g glycine, 1 g SDS for 1 l) using the Biorad Mini-PROTEAN Tetra Cell system.
Table 2-12: SDS-PAGE gel formulations.
Ingredient Volume [ml] for stacking gel (4 %)
Volume [ml] for resolving gel (10 %)
Deionized water 6.1 4.1
30 % Acrylamide/Bis Solution, 19:1 1.3 3.3
1.5 M TRIS/HCl, pH8.8 - 2.5
0.5 M TRIC/HCl, pH6.8 2.5 -
10 % SDS 0.1 0.1
TEMED 0.01 0.005
10 % APS 0.05 0.05
2.2.3.7.3 Blotting
For Western blotting, gels were placed onto a PVDF-membrane and blotted for 45 min
at 100 V in transfer buffer (25 mM tris, 192 mM glycine, 20 % (v/v) methanol, pH8.3)
using the Biorad Mini Trans-Blot Cell system. The PVDF-membranes were blocked to
prevent unspecific antibody binding by incubation with blocking buffer (5 % (v/v) milk
powder, 0.05 % (v/v) Tween 20 in PBS) ON at 4 °C with gentle shaking. On the next
day, membranes were incubated with the primary antibodies in 8 ml blocking buffer
according to Table 2-13 ON at 4 °C with gentle shaking.
Table 2-13: Concentrations of antibodies used for Western blot.
Antibodies Final dilution for Western blot
Anti-annexinA1 1/1000
Anti-annexin6 1/1000

Material and Methods
48
Anti-cofilin1 1/5000
Anti-profilin1 1/20000
Anti-SNAP23 1/2500
Anti-VAMP3 1 µg/ml
Anti-α-tubulin 1/1000
anti-rabbit HRP 1/5000
Membranes were washed thrice with 10 ml blocking buffer for 10 min under gentle
shaking. The secondary antibody coupled to horseradish peroxidase (HRP) was
applied for 3 h at RT in 8 ml blocking buffer. Finally, membranes were washed thrice
with 10 ml blocking buffer for 10 min under gentle shaking and rinsed shortly with
deionised water. Subsequently, membranes were incubated with 2 ml HRP ECL
chemiluminescent detection reagent for 1 min at RT. Finally, blots were placed into
autoradiography cassettes, exposed for different time points (15 sec to 2 min) and
developed. Developed films were scanned with a densitometer to obtain high
resolution digital pictures.
2.2.3.8 Colony forming unit assay
M. tuberculosis GFP was grown as described in 2.2.3.3. For CFU analysis, 2x10⁵
RAW264.7 macrophages per well were infected with M. tuberculosis GFP in a MOI of
0.5. D10-media was removed and cells were washed once with 500 µl PBS.
Subsequently, 200 µl D10-media containing M. tuberculosis GFP was added and
macrophages were centrifuged 5 min at 1500 rpm and incubated at 37 °C and 7.5 %
CO2. After 2 h post infection, the media was removed, cells were washed with 200 µl
D10-media and incubated with 500 µl fresh D10-media at 37 °C and 7.5 % CO2. CFU
were analyzed at desired time points after infection. Therefore, the D10-media was
removed, cells were washed with 200 µl PBS and disrupted by addition of 100 µl 0.5 %
(v/v) Triton X 100 in PBS. Subsequently, a dilution series from 10-1 to 10-5 was
prepared in 0.05 % (v/v) Tween 80 in PBS. 50 µl of dilutions 10-2 to 10-5 were streaked
out onto 7H11-agar/10 % (v/v) cattle serum plates and incubated at 37 °C for 3-4
weeks.
2.2.4 Methods for lipidomic analysis
2.2.4.1 Modifications to chapter 2.2.1 for lipidomic analysis
Control and TDM bead infection of RAW264.7 macrophages was carried out pair wise
one pair per day. For lipid analysis 2 T75-flasks with 107 RAW264.7 macrophages
were prepared one day prior the bead infection experiment for one sort of bead giving

Material and Methods
49
rise to 4 T75-flasks with 107 cells each. RAW264.7 macrophages were infected with a
MOI of 10. Accordingly 2x 10⁸ control and TDM beads were prepared as outlined
specifically in 2.2.1.3. Infection of RAW264.7 macrophages with control and TDM
beads and subsequent isolation and purification of bead phagosomes was carried out
as described in 2.2.1, except that D10-media lacking FCS was used.
The data shown here derive from two separate efforts to determine the lipid
composition of bead phagosomes. In the first experiment, sample volumes of three
control and TDM bead phagosome pairs corresponding to 4.000 pM iron were
extracted. In the second attempt, sample volumes of four pairs corresponding to
15.000 pM iron were used. Increasing the amount of source material was necessary
to increase signal intensities of cholesterol in acetylated extracts as they were found
to be very low in the first experiment.
Analysis of lipids was performed in the “Bioanalytical Chemistry” laboratory of Dr.
Dominik Schwudke together with Dr. Nicole Zehethofer.
2.2.4.2 Lipid extraction from isolated and purified lipid coated bead
phagosomes
All glass pipettes and glass vials used for lipid extraction were washed three times with
water, methanol and methyl tert-buthyl ether (MTBE) prior to use. First sample
volumes corresponding to 4.000 pM and 15.000 pM iron were transferred to 2 ml
Eppendorf tubes and dried 4-6 h at 37 °C and 500 rpm in a vacuum centrifuge.
Subsequently, 50 µl water, 270 µl methanol and 50 µl internal standard mix (Table
2-14) were added and mixed thoroughly.
Table 2-14: Internal standard mix
Lipid Concentration [fmol/µl]
17:0-14:1 PC 1.346
17:0-20:4 PC 1.090
17:0-14:1 PE 1.613
17:0-14:1 PG 1.546
17:0-14:1 PS 1.360
17:0-14:1 PI 1.272
Sphingomyelin (d18:1/12:0) 1.230
C25 Ceramide 1.320
16:0-17:0 BMP (R,R) 1.332

Material and Methods
50
17:0 Lyso PC 1.420
Cholesterol D7 1.270
Then 1 ml MTBE was added and samples were incubated shaking at 600 rpm for 1 h
at RT. For phase separation, 250 µl water was added and samples were spun for 1 min
at 12.000 rpm. The upper organic phase (circa 800 µl) was transferred to a new 2 ml
Eppendorf tube and dried 1-1.5 h at 37 °C in a vacuum centrifuge. Samples were
dissolved in 100 µl chloroform/methanol (86/13, v/v). 50 µl were transferred to an LC
vial for analysis. 50 µl were saved for cholesterol measurements. Negative controls
comprised uncoated, BSA-coated, TDM-coated and cell free assay BSA-coated and
TDM-coated beads and were treated likewise.
2.2.4.3 Derivatization of cholesterol
Cholesterol measurements were performed as described in [99]. Briefly, due to its
neutral chemical nature, cholesterol had to be acetylated in order to be ionized for
mass spectrometry analysis. All glass pipettes and glass vials used for acetylation
were washed three times with water, methanol and chloroform prior to use. First,
samples were transferred to a glass vial and dried in a vacuum centrifuge 1-1.5 h at
37 °C. Derivatization was performed by addition of 200 µl acetylchloride/chloroform
(1/5, v/v) and incubation for 1 h at RT under a fume hood in an open glass vial.
Afterwards, residual acetylation reagent was removed by centrifugation in a vacuum
centrifuge 1-1.5 h at 37 °C. Until use, samples were stored at -20 °C.
2.2.4.4 µLC-FT-ICR-MS
An Agilent 1100 HPLC system was used for the separation of the phospholipids on a
150 mm BETASIL Diol-100 column with a particle size of 5 µm and 0.32 mm inner
diameter using 5 µl injection volumes. The solvents, gradient profile and flow rates are
shown in Table 2-15.
Table 2-15: Gradient and flow rates used for the separation of phospholipids by µLC-FT-ICR-MS
Time [min] Flow rate [µl/min] Solvent A [%] Solvent B [%]
0 5 0 100
5 5 0 100

Material and Methods
51
25 5 58 42
29 5 58 42
30 5 58 42
35 10 58 42
36 10 70 30
40 10 70 30
41 10 0 100
55 10 0 100
Solvents: A, methanol/ammonia solution 28-30 % (99/1, v/v), B, chloroform/methanol/ammonia solution 28-30 % (86/13/1, v/v/v)
All mass spectrometric analyses were performed on a high resolution Bruker Apex Qe
FT-MS equipped with a 7 Tesla actively shielded magnet and an Apollo Dual ESI/
MALDI ion source. For lipid analysis, full scan MS data were acquired in the positive
and negative ion mode in the first 50 min of the liquid chromatography (LC) separation.
Instrumental parameters were as shown in Table 2-16. Data acquisition was
performed using the HyStar 3.2 software.
Table 2-16: FT-ICR-MS instrumental settings
Parameter Positive ion mode Negative ion mode
data points 1 M 1 M
accumulation time 0.9 seconds 1.1 seconds
average spectra 1 1
source temperature 200 °C 200 °C
ionization voltage 4500 kV 3800 kV
Q1 mass 300 m/z 250 m/z
collision energy 0 V 0 V
TOF time 0.0014 0.0014
nebulising gas 1 l/min 1 l/min
dry gas 5 l/min 3 l/min
2.2.4.5 ESI Qq-TOF-MS
Cholesteryl acetate was measured using an ESI Qq-TOF-MS operating in the parallel
reaction monitoring (PRM) mode. Prior to analysis, dried samples were dissolved in
100 µl MS-mix (1/2/4, v/v/v, chloroform, methanol containing 0.1 % ammonium
acetatel, 2-propanol). For flow injection analysis, 20 µl of the mixture were injected into
the ESI Qq-TOF-MS via an Agilent 1100 HPLC system. The solvent used and flow
rates are shown in Table 2-17.
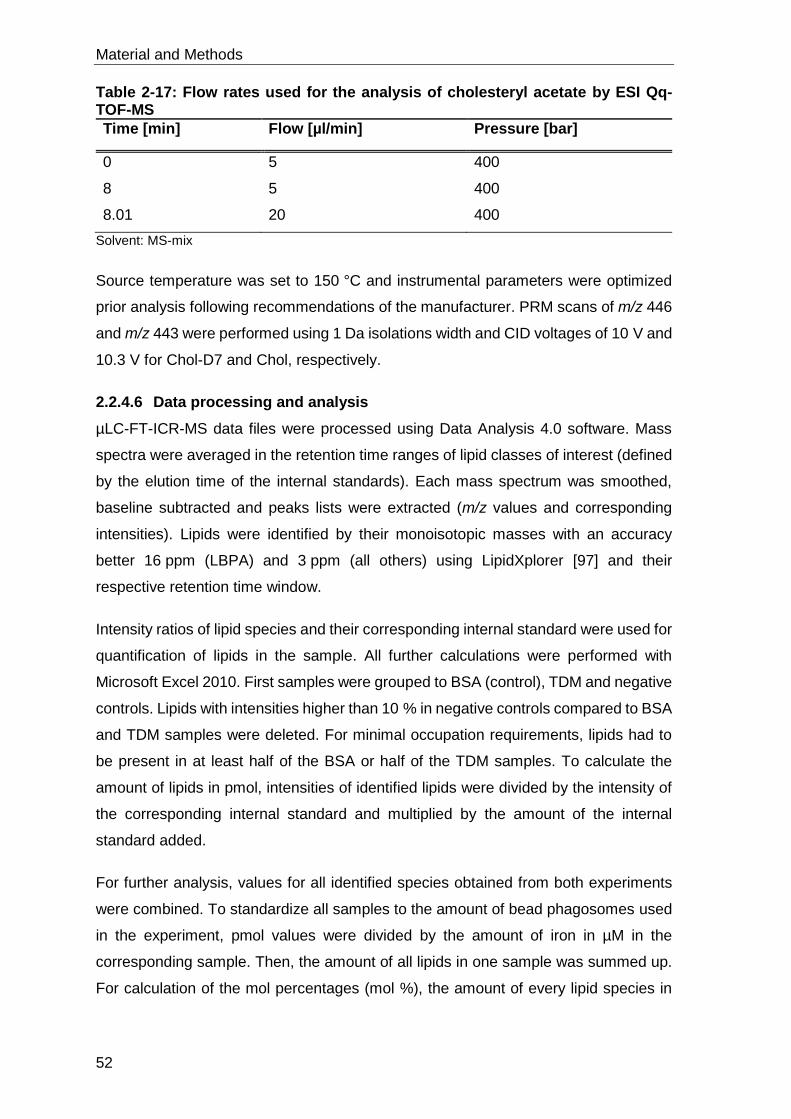
Material and Methods
52
Table 2-17: Flow rates used for the analysis of cholesteryl acetate by ESI Qq-TOF-MS
Time [min] Flow [µl/min] Pressure [bar]
0 5 400
8 5 400
8.01 20 400
Solvent: MS-mix
Source temperature was set to 150 °C and instrumental parameters were optimized
prior analysis following recommendations of the manufacturer. PRM scans of m/z 446
and m/z 443 were performed using 1 Da isolations width and CID voltages of 10 V and
10.3 V for Chol-D7 and Chol, respectively.
2.2.4.6 Data processing and analysis
µLC-FT-ICR-MS data files were processed using Data Analysis 4.0 software. Mass
spectra were averaged in the retention time ranges of lipid classes of interest (defined
by the elution time of the internal standards). Each mass spectrum was smoothed,
baseline subtracted and peaks lists were extracted (m/z values and corresponding
intensities). Lipids were identified by their monoisotopic masses with an accuracy
better 16 ppm (LBPA) and 3 ppm (all others) using LipidXplorer [97] and their
respective retention time window.
Intensity ratios of lipid species and their corresponding internal standard were used for
quantification of lipids in the sample. All further calculations were performed with
Microsoft Excel 2010. First samples were grouped to BSA (control), TDM and negative
controls. Lipids with intensities higher than 10 % in negative controls compared to BSA
and TDM samples were deleted. For minimal occupation requirements, lipids had to
be present in at least half of the BSA or half of the TDM samples. To calculate the
amount of lipids in pmol, intensities of identified lipids were divided by the intensity of
the corresponding internal standard and multiplied by the amount of the internal
standard added.
For further analysis, values for all identified species obtained from both experiments
were combined. To standardize all samples to the amount of bead phagosomes used
in the experiment, pmol values were divided by the amount of iron in µM in the
corresponding sample. Then, the amount of all lipids in one sample was summed up.
For calculation of the mol percentages (mol %), the amount of every lipid species in

Material and Methods
53
pmol was divided by the sum of all lipids identified in the samples and multiplied by
100.
ESI Qq-TOF-MS data were processed using the MassLynx 4.0 software. Intensity
values were obtained by manually combining mass spectra observed above half peak
height (spectra #3-59) in PRM scans of m/z 446 and m/z 443, respectively. Intensities
of peaks corresponding to the product ion masses of cholesteryl acetate (m/z 369) and
the deuterated standard (m/z 376) were picked and used for calculations. To calculate
the amount of free cholesterol, the intensity ratio of cholesteryl acetate and the
corresponding deuterated internal standard was used.
2.2.4.7 Statistical analysis and graphic representation
For statistical analysis and graphic representation, the Graph Pad Prism 5 software
was used. For statistical analysis of lipid classes, the mol % of every lipid class was
summarized. Values for every sample pair were analyzed with a paired TTest and
depicted with a before-and-after plot.
For statistical analysis of lipid species, as well, mol % values were used. For every
lipid class and corresponding samples pair, p-values were calculated using a paired
TTest. Further, the ratios between every sample pair were calculated by dividing the
mol % of TDM samples by the mol % of control samples. The mean of all seven p-
values for every lipid species was transformed to a log10-value and multiplied by -1.
The mean of all seven ratios for every lipid species was transformed to a log2-value.
For volcano-plot analysis, the transformed ratios were plotted against the transformed
p-values.

Results
54
3 Results
3.1 Method development: Isolation and purification of bead
phagosomes for mass spectrometry analysis
Inhibition of phagosome maturation by TDM is well established, but the underlying
mechanisms at the phagosomal interface remain unknown [90], [91], [100].
Consequently an experimental system to study the effect of single lipid species on
phagosome maturation and concomitantly to identify potential host-cell interaction
partners was required. In 2008, Axelrod et al. developed a reductionist lipid-coated
bead model [91]. Lipids such as TDM were coated to beads and fed to macrophages
to monitor bead phagosome maturation using stage specific markers.
To achieve the prime aim of this study that is identification of host-cell derived putative
interaction partners, bead phagosome proteomes and lipidomes had to be analyzed
by mass spectrometry. Based on the model system described by Axelrod et al., an
optimized protocol to isolate and purify bead phagosomes from macrophages was
developed.
To identify TDM specific interaction partners, control and TDM bead phagosomes were
isolated and purified for comparative proteomic and lipidomic analysis. Thus, magnetic
beads were coated with BSA (control) and TDM and used for “bead infection” of
macrophages. After 30 min, bead phagosome maturation was stopped by scraping the
cells in ice-cold buffer and disruption using a metal douncer. The disruption process
released un-cleaved DNA which caused formation of aggregated vesicles. Therefore,
as a first purification step, samples were treated with DNase to eliminate DNA. Further,
samples were washed three times using a magnet. Since the bead phagosomes still
stuck together, samples were additionally treated with trypsin. To separate bead
phagosomes from cell debris, a Ficoll gradient was applied. Differences in phagosome
maturation were controlled by measuring lysososmal β-galactosidase activity in the
samples prior continuing the purification procedure. This step had to be performed
prior sorting, because after sorting process bead phagosome concentrations were too
low to yield a signal in the lysososmal β-galactosidase assay. As final step, bead
phagosomes were sorted by FACS to separate bead phagosomes from residual cell
debris. Bead phagosomes were isolated from the FACS supernatant using a magnet
and proteins remaining in the supernatant were precipitated using StrataClean beads.
A scheme of the overall practical procedure for isolation and purification of bead
phagosomes is shown in Figure 3.1.
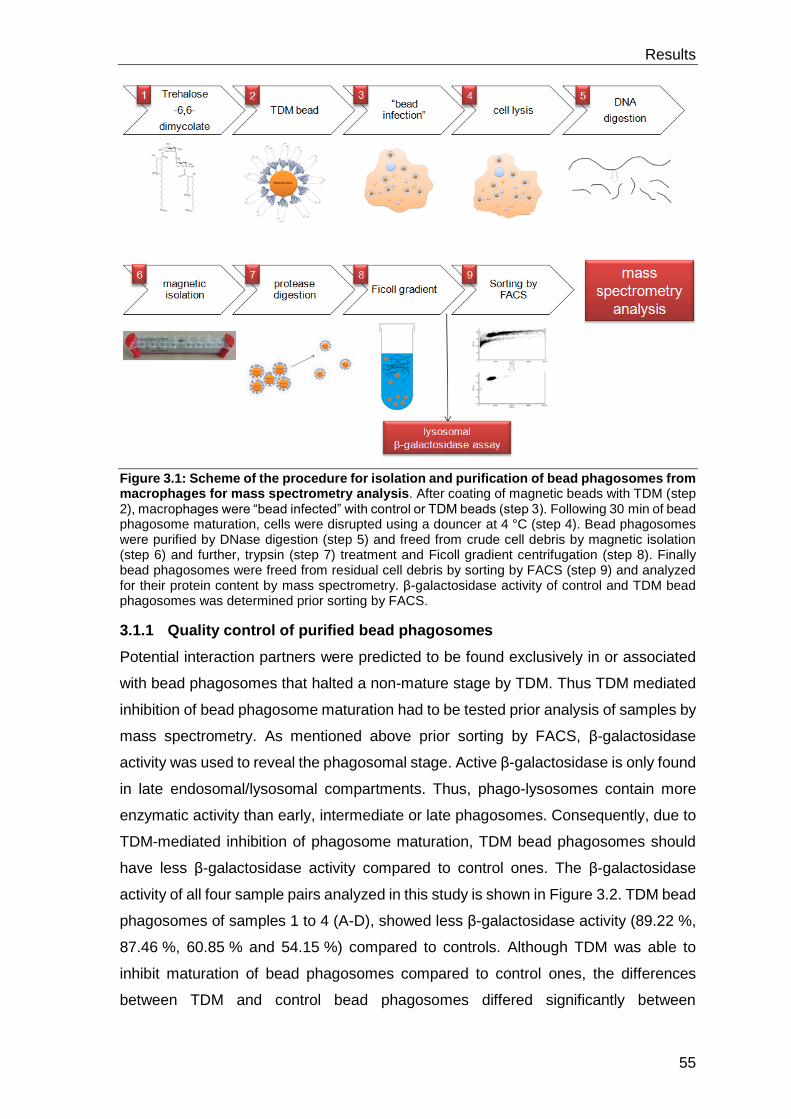
Results
55
Figure 3.1: Scheme of the procedure for isolation and purification of bead phagosomes from macrophages for mass spectrometry analysis. After coating of magnetic beads with TDM (step 2), macrophages were “bead infected” with control or TDM beads (step 3). Following 30 min of bead phagosome maturation, cells were disrupted using a douncer at 4 °C (step 4). Bead phagosomes were purified by DNase digestion (step 5) and freed from crude cell debris by magnetic isolation (step 6) and further, trypsin (step 7) treatment and Ficoll gradient centrifugation (step 8). Finally bead phagosomes were freed from residual cell debris by sorting by FACS (step 9) and analyzed for their protein content by mass spectrometry. β-galactosidase activity of control and TDM bead phagosomes was determined prior sorting by FACS.
3.1.1 Quality control of purified bead phagosomes
Potential interaction partners were predicted to be found exclusively in or associated
with bead phagosomes that halted a non-mature stage by TDM. Thus TDM mediated
inhibition of bead phagosome maturation had to be tested prior analysis of samples by
mass spectrometry. As mentioned above prior sorting by FACS, β-galactosidase
activity was used to reveal the phagosomal stage. Active β-galactosidase is only found
in late endosomal/lysosomal compartments. Thus, phago-lysosomes contain more
enzymatic activity than early, intermediate or late phagosomes. Consequently, due to
TDM-mediated inhibition of phagosome maturation, TDM bead phagosomes should
have less β-galactosidase activity compared to control ones. The β-galactosidase
activity of all four sample pairs analyzed in this study is shown in Figure 3.2. TDM bead
phagosomes of samples 1 to 4 (A-D), showed less β-galactosidase activity (89.22 %,
87.46 %, 60.85 % and 54.15 %) compared to controls. Although TDM was able to
inhibit maturation of bead phagosomes compared to control ones, the differences
between TDM and control bead phagosomes differed significantly between

Results
56
preparations. All four sample pairs were used further purification and mass
spectrometry analysis.
Figure 3.2: β-galactosidase assay of purified control versus TDM bead phagosomes. A-D: Macrophages were “bead infected” with control and TDM beads at a MOI of 10. Bead phagosome maturation was allowed for 30 min. Afterwards, cells were harvested and bead phagosomes were isolated and purified as described in detail in section 2.2.1. Prior to sorting by FACS, 150 µl of control and TDM bead phagosomes in PBS were saved for verification of β-galactosidase activity as described in 2.2.1.7. The β-galactosidase activity was standardized with the number of beads per sample.
3.1.2 Purification of bead phagosomes via sorting by FACS
The efficiency of the final purification step by FACS is shown in Figure 3.3. After
sorting, TDM and control bead phagosome samples were reanalysed for purity and
presence of remaining contaminating cell debris. Representatively, prior sorting, in
control bead isolation number 4 and in TDM bead phagosome isolation number 3,
86.23 % and 93.22 % of all detectable particles were bead phagosomes, respectively.
However, sorting by FACS increased the purity of the samples to 97.72 % and
98.88 %, respectively. Concluding, sorting by FACS was suitable to exclude
contaminants and increase purity of isolated bead phagosomes.

Results
57
Figure 3.3: Control and TDM bead phagosomes prior to and after sorting by FACS. Representative fraction of bead phagosomes enriched by a FACSAriaII cell sorter from TDM bead phagosome isolation #3 (lower) and control bead isolation #4 (upper). The Area of Forward (FSC-A) and Side Scatter (SSC-A) was used to determine the bead fraction. Before sorting, the portion of bead was around 93.22 % (TDM) and 86.23 % (control) (left scatter plot), after sorting and re-analyzing the sorted fraction, the enrichment was increased up to 98.22 % and 97.72 % purity of bead phagosomes (right scatter plot), respectively.

Results
58
3.2 The TDM bead phagosome proteome
Processing of all sample pairs for mass spectrometry analysis was performed in the
laboratory of our collaboration partners Prof. Dr. Dörte Becher and Dr. Andreas Otto
in Greifswald by Jürgen Bartel as described in detail in 2.2.2. The data obtained that
way, were received as “Scaffold file” and further processed with the “Scaffold 4”
software.
In total 1054 proteins were detected in all four sample pairs (Table 0-1). In control and
TDM bead phagosome samples, 919 and 843 proteins were detected, respectively.
As shown in Figure 3.4, 708 proteins were shared between both groups while 211 and
135 proteins were detected exclusively either in control or TDM bead phagosome
samples, respectively.
Figure 3.4: Intersection diagram of total numbers of identified proteins in proteomes of control versus TDM bead phagosome samples. Four pairs of isolated and purified control and TDM bead phagosomes samples were analyzed for their protein content by mass spectrometry. Results were processed using the “Scaffold 4” software. 1054 proteins were identified in total. 708 proteins were shared between control and TDM bead phagosome proteomes whereas 211 proteins were found exclusively in control and 135 in TDM bead phagosomes, respectively.
Using the Scaffold 4 software, the NCBI annotations were downloaded that provide
current information about each identified protein. Figure 3.5 depicts all proteins
grouped according to their cellular localization according to the NCBI definition.

Results
59
Figure 3.5: Identified proteins in control and TDM beads phagosomes grouped according to their cellular localization. Four pairs of isolated and purified control and TDM bead phagosomes samples were analyzed for their protein composition by mass spectrometry. Results were processed using the “Scaffold 4” software. Using the “quantify” mode, all identified proteins were sorted according to their cellular localization. The numbers shown above for each category exceed the total numbers of 1054 identified proteins because some proteins were allocated to several cellular localizations.
Accordingly, 684 and 512 proteins were associated with intracellular organelles and
the organelle part (same as intracellular organelle, term should not be used any more
according NCBI but has not been replaced at the time this thesis was prepared),
respectively. 632 were cytoplasmic proteins. Of the 478 membrane proteins, 294 and
229 were allocated to organelle or plasma membranes, respectively. 288 proteins
were grouped to the nucleus. 173 mitochondrial proteins were discovered. Further, of
the endoplasmic reticulum and the cytoskeleton 123 proteins were enriched whereas
87 proteins were assigned to the Golgi apparatus and the endosome. 21 ribosomal
and 83 extracellular proteins were identified. Finally, 264 proteins had unknown
localization.
Proteins specified with the categories ribosome, extracellular region, Golgi apparatus,
cytoskeleton, ER, mitochondria, nucleus and cytoplasm are potential contaminant
proteins, because per definition of the gene ontology (GO) terms, these groups do not
comprise proteins that localize in intracellular vesicles or their membranes. In contrast,
categories endosome, intracellular organelle, organelle part or membrane and
organelle membrane can contain, per GO term definition, proteins within organized
structure of distinctive morphology and function, occurring within the cell or associated

Results
60
with membranes thereof. These categories may be those containing phagosomal or
lysosomal proteins.
Next, the percentage of proteins according to their cellular localization in control versus
TDM bead phagosome was compared. Figure 3.6 shows that there were no major
differences between both samples.
Figure 3.6: Percentage distribution of all proteins identified in control versus TDM bead phagosome samples grouped according to their cellular localization. Four pairs of isolated and purified control and TDM bead phagosome samples were analyzed for their protein content by mass spectrometry. Results were processed using the “Scaffold 4” software. The “quantify” mode of the software sorts all identified proteins according to their cellular localization and calculates the percentages of identified proteins that can be classified to a cellular compartment. The numbers shown above for every category exceed 100 because some proteins have more than one cellular localization.
Identified proteins were quantified by spectral counting. Using the Scaffold 4 software,
the exclusive unique spectrum count (EUSC) mode was selected to assess the
“number of unique spectra associated only with this protein”. For further calculations,
the EUSC of all proteins identified in all four sample pairs was exported from Scaffold
4 to a Microsoft Excel file. In order to find proteins that were more abundant in TDM
bead phagosome samples compared to controls, and thus are potential TDM host-cell
derived interaction partners, first all proteins with an overall EUSC less than 10 were
excluded. For minimal occupation requirements, proteins had to be identified in at least
4 of the 8 control or TDM bead phagosome samples. Subsequently the EUSC for all
proteins identified in the 8 control and TDM bead phagosomes samples were summed
up and the value of all EUSC from TDM phagosomes was divided by the number of
all EUSC from control phagosomes. Proteins with ratios of ≥2 were considered
enriched to TDM bead samples. Thus, the list of TDM specific proteins comprised 34
(Table 3-1). Proteins with ratios of ≤0.5 were considered enriched in control bead

Results
61
samples (Table 3-2). Table 3-3 gives an overview about the cellular localization and
biological process of the 34 proteins enriched to TDM bead phagosome samples.
Table 3-1: List of proteins enriched in TDM bead phagosomes compared to controls. 1054 proteins were identified in control and TDM bead phagosomes. To unravel potential host-cell derived TDM interaction partners, all proteins with an overall EUSC less than 10 were excluded. Next, for minimal occupation requirements, proteins had to be identified in at least 4 of 8 control or TDM bead phagosomes samples. Finally the EUSCs of all control and all TDM bead phagosome samples were added and TDM/control ratios were calculated. 34 proteins with ratios ≥2 were considered enriched in TDM bead phagosomes and thus potential interaction partners.
Identified protein Accession number
EUSC control
EUSCTDM
Ratio
Rab22B OS tr|Q3TXV4|Q3TXV4 2 13 6.5
Valine--tRNA ligase sp|Q9Z1Q9|SYVC 2 11 5.5
Vesicle-associated membrane protein 7
sp|P70280|VAMP7 3 15 5.0
Ras-related protein Rab-11A sp|P62492|RB11A 2 9 4.5
Protein 5730469M10Rik tr|Q3U125|Q3U125 3 12 4.0
Annexin A1 sp|P10107|ANXA1 5 17 3.4
Cofilin-1 tr|F8WGL3|F8WGL3 4 13 3.3
Profilin-1 sp|P62962|PROF1 7 22 3.1
Annexin A6 tr|F8WIT2|F8WIT2 8 25 3.1
TOM34 sp|Q9CYG7|TOM34 3 9 3.0
60S ribosomal protein L22 sp|P67984|RL22 7 18 2.6
Vesicle-associated membrane protein 3
sp|P63024|VAMP3 8 20 2.5
Synaptosomal-associated protein 23
tr|Q9D3L3|Q9D3L3 7 17 2.4
Cytochrome c oxidase subunit 4 isoform 1, mitochondrial
sp|P19783|COX41 5 12 2.4
Protein ERGIC-53 sp|Q9D0F3|LMAN1 5 12 2.4
Voltage-dependent anion-selective channel protein 3
sp|Q60931|VDAC3 5 12 2.4
MKIAA1699 protein (Fragment) tr|Q69ZD1|Q69ZD1 5 12 2.4
Signal recognition particle 68 kDa protein
sp|Q8BMA6|SRP68 8 19 2.4
Pescadillo homolog tr|Q5SQ20|Q5SQ20 6 14 2.3
Elongation factor 2 sp|P58252|EF2 4 9 2.3
Neutrophil cytosol factor 2 sp|O70145|NCF2 4 9 2.3
Cytosolic phospholipase A2 sp|P47713|PA24A 5 11 2.2
Ras-related protein Rab-8A sp|P55258|RAB8A 12 26 2.2
Lysosomal protective protein tr|G3X8T3|G3X8T3 6 13 2.2
Ras-related protein Rab-10 sp|P61027|RAB10 6 13 2.2
Nucleolar protein 58 sp|Q6DFW4|NOP58 6 13 2.2
Histone H4 sp|P62806|H4 13 28 2.2
Uncharacterized protein tr|E9PZV5|E9PZV5 11 22 2.0
YLP motif-containing protein 1 tr|D3YWX2|D3YWX2
6 12 2.0
Major facilitator superfamily domain-containing protein 1
sp|Q9DC37|MFSD1 4 8 2.0

Results
62
Synaptic vesicle membrane protein VAT-1 homolog
sp|Q62465|VAT1 6 12 2.0
ATP-dependent RNA helicase DDX18
sp|Q8K363|DDX18 6 12 2.0
Unconventional myosin-Ie sp|E9Q634|MYO1E 6 12 2.0
V-type proton ATPase subunit F
sp|Q9D1K2|VATF 4 8 2.0
Table 3-2: List of proteins enriched in control bead phagosomes. 1054 proteins were identified in control and TDM bead phagosomes. To unravel potential host-cell derived TDM interaction partners, all proteins with an overall EUSC less than 10 were excluded. Next, for minimal occupation requirements, proteins had to be identified in at least 4 of 8 control or TDM bead phagosomes samples. Finally the EUSCs of all control and all TDM bead phagosome samples were added and TDM/control ratios were calculated. Proteins with ratios ≤0.5 were considered enriched in control bead samples.
Identified protein accession number
EUSC control
EUSC TDM
ratio
Cytochrome b-245 heavy chain sp|Q61093|CY24B 14 7 0.5
ER-resident protein 29 sp|P57759|ERP29 14 7 0.5
MO colony-stimulating factor 1 receptor
sp|P09581|CSF1R 8 4 0.5
Arfip1 protein tr|A2RSX9|A2RSX9
15 7 0.5
Desmoplakin sp|E9Q557|DESP 156 70 0.4
Pre-mRNA-processing factor 6 sp|Q91YR7|PRP6 16 7 0.4
Prelamin-A/C sp|P48678|LMNA 22 9 0.4
Triosephosphate isomerase sp|P17751|TPIS 10 4 0.4
14-3-3 protein epsilon sp|P62259|1433 15 6 0.4
Fructose-bisphosphate aldolase tr|A6ZI44|A6ZI44 18 6 0.3
Protein Sec14l1 tr|A2A9B9|A2A9B9 18 4 0.2
Isoform 3 of Poly(rC)-binding protein 2
sp|Q61990-|PCBP2
14 3 0.2
Table 3-3: Cellular localization and biological process of proteins enriched to TDM bead over control phagosomes.
Identified protein Cellular compartment
Biological process
Rab22B OS early endosome / late endosome / phagocytic vesicle / trans-Golgi network / membrane
small GTPase mediated signal transduction / protein transport / receptor internalization / Rab protein signal transduction / cellular response to insulin stimulus / Golgi to plasma membrane protein transport / regulated secretory pathway / Golgi vesicle transport / phagosome maturation
Valine--tRNA ligase
mitochondrium valyl-tRNA aminoacylation
VAMP7 Golgi apparatus / ER membrane / late endosome
vesicle-mediated transport/ Golgi to plasma membrane

Results
63
membrane / phagocytic vesicle / cell junction / lysosomal membrane /
protein transport/ eosinophil and neutrophil degranulation
Rab-11A Golgi apparatus / ER membrane / late endosome membrane / phagocytic vesicle / cell junction / lysosomal membrane
small GTPase mediated signal transduction / cytokinesis / protein transport / neurite development / melanosome transport
Protein 5730469M10Rik
cytoplasm / mitochondrium extracellular exosome
regulation of osteoclast differentiation / oxidation-reduction process
Annexin A1 mitochondrial membrane / cornified envelope / extracellular vesicular exosome / nucleus / basolateral plasma membrane / nucleus /
neutrophil homeostasis / alpha-beta T cell differentiation / gliogenesis / insulin secretion / peptide cross-linking / estrous cycle phase / response to drug
Cofilin-1 extracellular region / nucleus / cytoplasm / cytoskeleton / plasma membrane / cell-cell junction / focal adhesion / actin cytoskeleton / membrane / nuclear matrix / lamellopodium /cortical actin cytoskeleton / cell leading edge / vesicle / ruffle membrane
mitotic cytokinesis / neural crest cell migration / neural fold formation / protein phosphorylation / protein import into nucleus / cytoskeleton organization / actin filament organization / response to virus / regulation of cell morphogenesis / negative regulation of cell size / regulation of dendritic spine morphogenesis / response to amino acid / positive regulation of actin filament depolymerisation /
Profilin-1 cytoplasm / cytoskeleton / extracellular region / nucleus
neural tube closure / sequestering of actin monomers
Annexin A6 cytoplasm / mitochondrium / lysosomal membrane / cytosol / focal adhesion / membrane / late endosome membrane / melanosome / perinuclear region of cytoplasm / extracellular exosome /
calcium ion transport / regulation of muscle contraction / ion transmembrane transport / protein homooligomerization / mitochondrial calcium ion homeostasis / apoptotic signalling pathway
TOM34 mitochondrion / mitochondrial outer membrane /
protein targeting to mitochondrion /
60S ribosomal protein L22
cytoplasm / ribosome / cytosolic large ribosomal subunit / ribosome
alpha-beta T cell differentiation / translation
VAMP 3 secretory granule / recycling endosome / cytoplasmic vesicle / plasma membrane / clathrin coated vesicle membrane
substrate adhesion-dependent cell spreading / positive regulation of receptor recycling / neurotransmitter secretion / substrate

Results
64
adhesion-dependent cell spreading / calcium ion-dependent exocytosis /
SNAP23 nucleoplasm / cytoplasm / plasma membrane / focal adhesion / membrane / cell junction / SNARE complex / cytoplasmic vesicle / specific granule / mast cell granule / neuron projection / synapse / extracellular exosome
histamine secretion by mast cell / transport / exocytosis / protein transport / synaptic vesicle priming / synaptic vesicle fusion to presynaptic membrane
Cytochrome c oxidase subunit 4 isoform 1, mitochondrial
mitochondrion / mitochondrial inner membrane / nucleus
response to nutrient
Protein ERGIC-53 Golgi apparatus / ER membrane / ER to Golgi transport vesicle / ER-Golgi intermediate compartment membrane / Golgi membrane
positive regulation of organelle organization / ER to Golgi vesicle-mediated transport /
Voltage-dependent anion-selective channel protein 3
mitochondrion / mitochondrial outer membrane / pore complex / mitochondrial inner membrane
nerve-nerve synaptic transmission / behavioural fear response / learning
MKIAA1699 protein (Fragment)
exocyst / cytoplasm / membrane / growth cone membrane
vesicle docking involved in exocytosis / protein transport
Signal recognition particle 68 kDa protein
signal recognition particle, endoplasmic reticulum targeting / nucleolus
SRP-dependent cotranslational protein targeting to membrane / response to drug
Pescadillo homolog
condensed chromosome / nucleus / nucleoplasm / chromosome / nucleolus / cytoplasm / membrane / preribosome
maturation of LSU-rRNA from tricistronic rRNA transcript / SSU-rRNA, 5.8S rRNA, LSU-rRNA / rRNA processing / nucleolus organization / cell proliferation / protein localization to organelle / ribosome biogenesis / ribosomal large subunit biogenesis / regulation of cell cycle
Elongation factor 2 cytoplasm translational elongation / hemopoietic progenitor cell differentiation / GTP catabolic process /
Neutrophil cytosol factor 2
signal recognition particle, endoplasmic reticulum / nucleolus
SRP-dependent cotranslational protein targeting to membrane / response to drug
Cytosolic phospholipase A2
Golgi apparatus / ER / cytoplasmic membrane-bounded vesicle
regulation of cell proliferation / phospholipid catabolic process / arachidonic acid
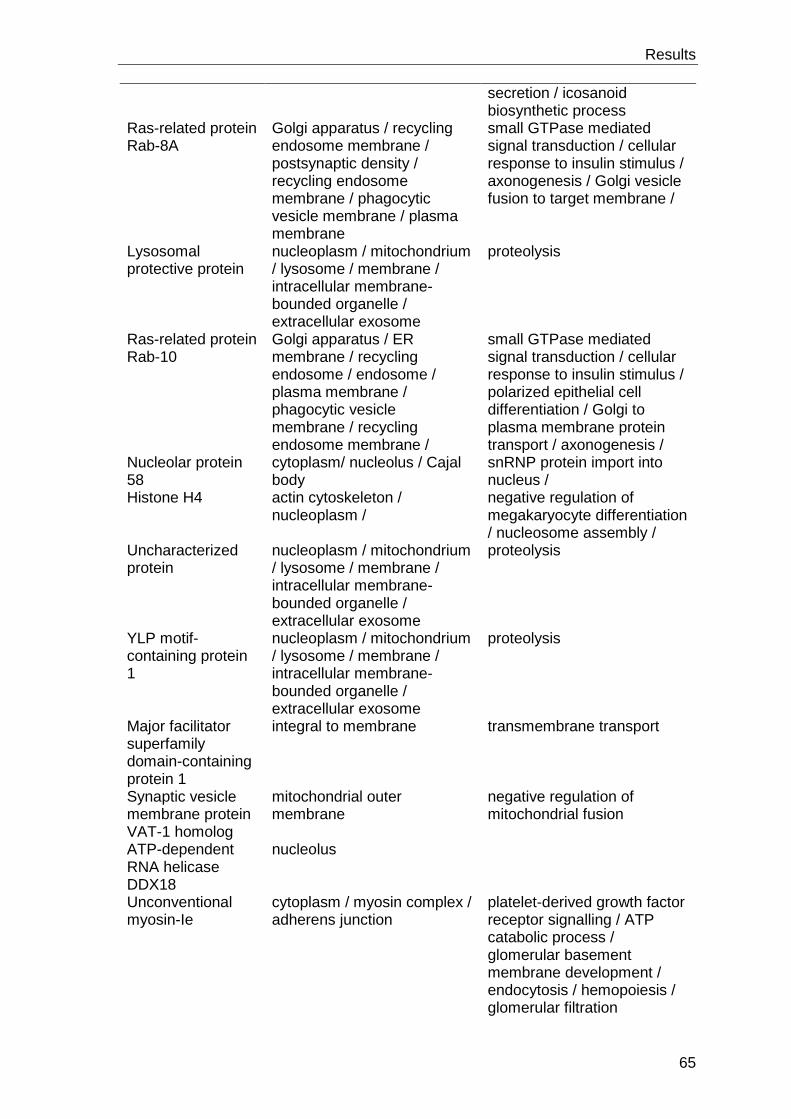
Results
65
secretion / icosanoid biosynthetic process
Ras-related protein Rab-8A
Golgi apparatus / recycling endosome membrane / postsynaptic density / recycling endosome membrane / phagocytic vesicle membrane / plasma membrane
small GTPase mediated signal transduction / cellular response to insulin stimulus / axonogenesis / Golgi vesicle fusion to target membrane /
Lysosomal protective protein
nucleoplasm / mitochondrium / lysosome / membrane / intracellular membrane-bounded organelle / extracellular exosome
proteolysis
Ras-related protein Rab-10
Golgi apparatus / ER membrane / recycling endosome / endosome / plasma membrane / phagocytic vesicle membrane / recycling endosome membrane /
small GTPase mediated signal transduction / cellular response to insulin stimulus / polarized epithelial cell differentiation / Golgi to plasma membrane protein transport / axonogenesis /
Nucleolar protein 58
cytoplasm/ nucleolus / Cajal body
snRNP protein import into nucleus /
Histone H4 actin cytoskeleton / nucleoplasm /
negative regulation of megakaryocyte differentiation / nucleosome assembly /
Uncharacterized protein
nucleoplasm / mitochondrium / lysosome / membrane / intracellular membrane-bounded organelle / extracellular exosome
proteolysis
YLP motif-containing protein 1
nucleoplasm / mitochondrium / lysosome / membrane / intracellular membrane-bounded organelle / extracellular exosome
proteolysis
Major facilitator superfamily domain-containing protein 1
integral to membrane transmembrane transport
Synaptic vesicle membrane protein VAT-1 homolog
mitochondrial outer membrane
negative regulation of mitochondrial fusion
ATP-dependent RNA helicase DDX18
nucleolus
Unconventional myosin-Ie
cytoplasm / myosin complex / adherens junction
platelet-derived growth factor receptor signalling / ATP catabolic process / glomerular basement membrane development / endocytosis / hemopoiesis / glomerular filtration

Results
66
V-type proton ATPase subunit F
vacuolar proton-transporting V-type ATPase complex
ATP hydrolysis coupled proton transport

Results
67
3.2.1 Introduction of selected proteins and STRING analysis
To see whether and how the 34 enriched proteins interact, they were analyzed with
the STRING 9.1 online tool. STRING (Search Tool for the Retrieval of Interacting
Genes/Proteins) is a database of direct (physical) and indirect (functional) predicted
protein interactions. One protein could not be identified since its entry in the source
(NCBI entries) used by STRING was deleted.
Figure 3.7 shows the interaction network of 33 of the 34 selected proteins. Identified
proteins are illustrated by dots, identified genes by smaller dots with their
corresponding names. Interaction between proteins is illustrated by colour-coded
connecting lines. In general, more lines indicate more profound interaction. The
arrangement of proteins without known interactions in the network is purely random
and does not correspond to their potential function or the genetic organisation.
Figure 3.7: STRING network of proteins enriched in TDM bead phagosomes. 1054 proteins were identified in control and TDM bead phagosomes. To unravel potential host-cell derived TDM interaction partners, all proteins with an overall EUSC less than 10 were excluded. Next, for minimal occupation requirements, proteins had to be identified in at least 4 of 8 control or TDM bead phagosomes samples. Finally the EUSCs of all control and all TDM bead phagosome samples were added and TDM/control ratios were calculated. 34 proteins with ratios equal or greater than 2 were considered enriched in TDM and thus potential interaction partners. 33 proteins were analyzed regarding their interaction using the online tool STRING 9.1.
The STRING network shows 6 (numbers 1-6) major interacting networks. Network 1
comprises 7 proteins and 1 gene which function in membrane organization and protein

Results
68
localization to membranes. Network 2 includes 3 proteins that have a role in protein
localization to organelles and are ribonucleoprotein complex binding proteins. Network
3 is made of 3 proteins that take part in cellular respiration and energy metabolism.
Network 4 comprises 2 proteins that interact with the actin cytoskeleton. Network 5
involves 3 proteins that are known to be important for hemopoiesis. Finally, network 6
includes 2 proteins involved in fatty acid biosynthesis.
Of the 34 potential TDM interacting proteins, 6 were chosen for further analysis
regarding localization and function in trafficking and M. tuberculosis infection in
macrophages using fluorescence microscopy, Western blot and siRNA knock-down
experiments, respectively (Table 3-4). Selection of those 6 proteins was based on 3
criteria, (i) known association with endosomes/phagosomes and/or (ii) component of
the 6 major networks (Figure 3.7) and (iii) availability of appropriate antibodies for
analysis with immunofluorescence microscopy and Western blot.
Selected proteins are listed in Table 3-4. AnnexinA1 and A6 are important for
calcium/phospholipid-binding, which promotes membrane fusion during phagosome
maturation. They were also found on mycobacterial phagosomes and were described
to link actin filaments to the phagosome during phagocytosis [101], [102]. Profilin1 and
cofilin1 are known to regulate the actin cytoskeleton dynamics important for
phagosome biogenesis [103]. The synaptosomal-associated protein 23 (Snap23) was
recently shown to regulate phagosome formation and maturation in macrophages
[104]. VAMP3 is s SNARE-protein involved in vesicle transport to and from endosomes
and phagosomes.
Table 3-4: Identified proteins selected for further analysis as potential host-cell derived TDM interaction partners.
Identified proteins Accession Number EUSC control
EUSC TDM
Ratio
Annexin A1 sp|P10107|ANXA1 5 17 3.4
Annexin A6 tr|F8WIT2|F8WIT2 8 25 3.1
Cofilin-1 tr|F8WGL3|F8WGL3 4 13 3.3
Profilin-1 sp|P62962|PROF1 7 22 3.1
Synaptosomal-associated
protein (SNAP23)
tr|Q9D3L3|Q9D3L3 7 17 2.4
Vesicle-associated
membrane protein 3 (VAMP3)
sp|P63024|VAMP3 8 20 2.5

Results
69
3.3 Evaluation of TDM interaction partners
First, we analyzed the intracellular localization of the selected proteins with respect to
bead and M. tuberculosis phagosomes in macrophages. Therefore, RAW264.7
macrophages were incubated with control beads, TDM beads or M. tuberculosis GFP.
Bead phagosome maturation was stopped after 30 min and M. tuberculosis GFP after
2 h. Subsequently, infected macrophages were stained using antibodies against
annexinA1, annexinA6, cofilin1, profilin1, SNAP23 and VAMP3. To determine the
maturation status of bead and M. tuberculosis GFP phagosomes, macrophages were
co-stained for LAMP1. LAMP1 is an integral membrane protein highly abundant in
matured phagosomes, late endosomes and lysosomes [36]. Thus it is commonly used
as a marker for late phago-/endosomes and phago-lysosomes. Infected cells stained
for cofilin1 and profilin1 were additionally stained for actin in order to study co-
localization of actin with the nucleation-promoting-factors (NPFs).
Notably, not all antibodies available could be used for immunofluorescence staining of
RAW264.7 macrophages infected with M. tuberculosis GFP because they cross-
reacted with M. tuberculosis GFP (results not shown). According to information
obtained from the manufacturers, these polyclonal antibodies were generated in
rabbits using adjuvants containing mycobacterial components. Consequently, the
antibody to annexinA1 was not used because it stained free M. tuberculosis GFP.
Specific binding of antibodies was tested by incubating RAW264.7 macrophages and
M. tuberculosis GFP with the secondary antibody alone. This revealed that neither
Alexa405 anti-rabbit, Cy2 anti-rabbit, Cy3 anti-rat nor Cy5 anti-rabbit displayed
unspecific binding to RAW264.7 macrophages or M. tuberculosis GFP.
In all experiments, TDM bead phagosomes showed significantly decreased LAMP1
association compared to controls. Thus, TDM successfully inhibited maturation of
bead phagosomes.
3.3.1 Evaluation of the presence of candidate proteins on control bead, TDM
bead and M. tuberculosis phagosomes by immunofluorescence staining
AnnexinA1: Figure 3.8 shows representative immunofluorescence pictures of control
(A-D) and TDM (E-H) bead phagosomes in RAW264.7 macrophages stained for
annexinA1 (green) and LAMP1 (red). Quantitative analysis showed that the annexinA1
staining pattern for both bead types was similar, neither TDM nor control bead
phagosomes accumulated annexinA1 as assessed by immunofluorescence staining
(Figure 3.8, I).
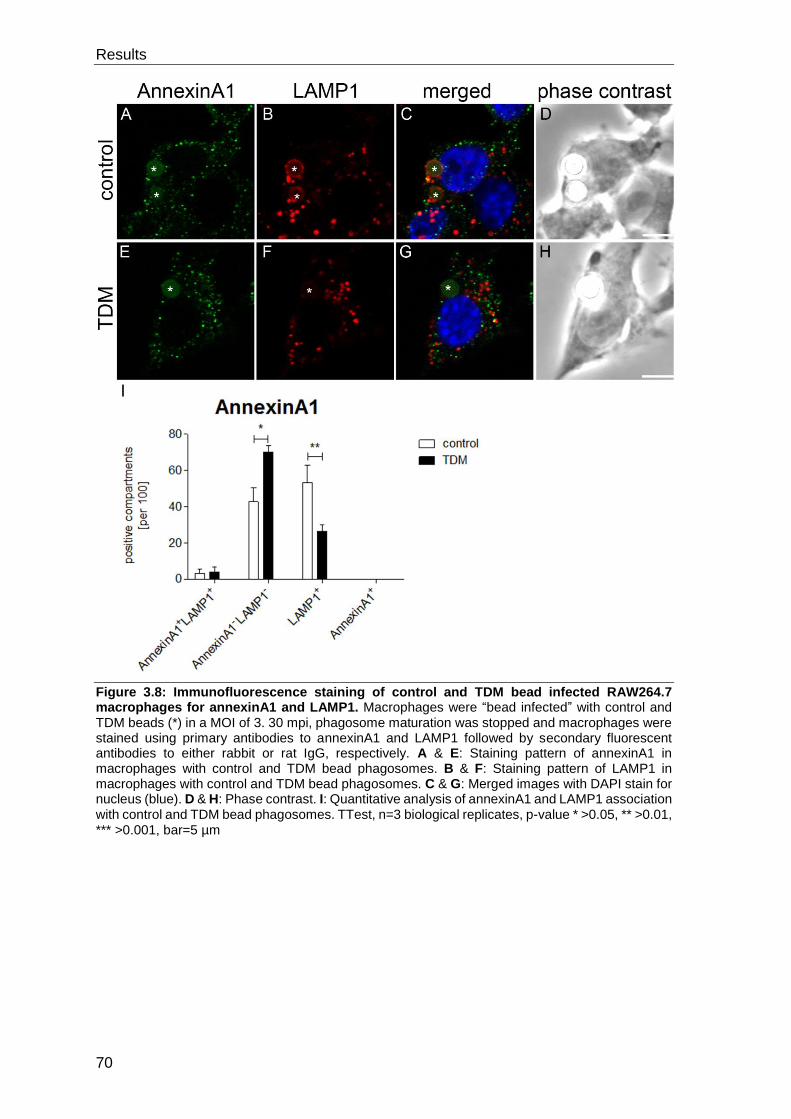
Results
70
Figure 3.8: Immunofluorescence staining of control and TDM bead infected RAW264.7 macrophages for annexinA1 and LAMP1. Macrophages were “bead infected” with control and TDM beads (*) in a MOI of 3. 30 mpi, phagosome maturation was stopped and macrophages were stained using primary antibodies to annexinA1 and LAMP1 followed by secondary fluorescent antibodies to either rabbit or rat IgG, respectively. A & E: Staining pattern of annexinA1 in macrophages with control and TDM bead phagosomes. B & F: Staining pattern of LAMP1 in macrophages with control and TDM bead phagosomes. C & G: Merged images with DAPI stain for nucleus (blue). D & H: Phase contrast. I: Quantitative analysis of annexinA1 and LAMP1 association with control and TDM bead phagosomes. TTest, n=3 biological replicates, p-value * >0.05, ** >0.01, *** >0.001, bar=5 µm

Results
71
AnnexinA6: Figure 3.9 shows representative immunofluorescence pictures of control
(A-D), TDM (E-H) bead and M. tuberculosis GFP (I-L) phagosomes in RAW264.7
macrophages stained for annexinA6 (green) and LAMP1 (red). Quantitative analysis
revealed that neither bead nor M. tuberculosis GFP phagosomes accumulated
annexinA6 as assessed by immunofluorescence staining (Figure 3.9, M)
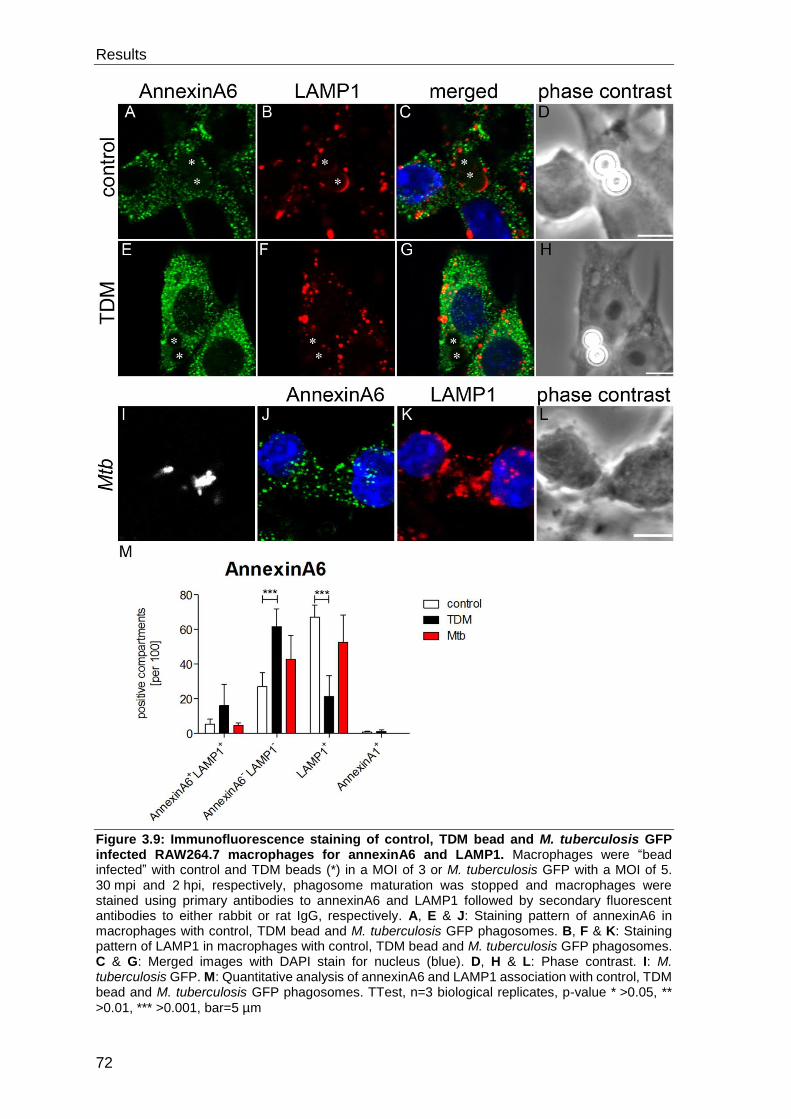
Results
72
Figure 3.9: Immunofluorescence staining of control, TDM bead and M. tuberculosis GFP infected RAW264.7 macrophages for annexinA6 and LAMP1. Macrophages were “bead infected” with control and TDM beads (*) in a MOI of 3 or M. tuberculosis GFP with a MOI of 5. 30 mpi and 2 hpi, respectively, phagosome maturation was stopped and macrophages were stained using primary antibodies to annexinA6 and LAMP1 followed by secondary fluorescent antibodies to either rabbit or rat IgG, respectively. A, E & J: Staining pattern of annexinA6 in macrophages with control, TDM bead and M. tuberculosis GFP phagosomes. B, F & K: Staining pattern of LAMP1 in macrophages with control, TDM bead and M. tuberculosis GFP phagosomes. C & G: Merged images with DAPI stain for nucleus (blue). D, H & L: Phase contrast. I: M. tuberculosis GFP. M: Quantitative analysis of annexinA6 and LAMP1 association with control, TDM bead and M. tuberculosis GFP phagosomes. TTest, n=3 biological replicates, p-value * >0.05, **
>0.01, *** >0.001, bar=5 µm

Results
73
Cofilin1: Figure 3.10 shows representative immunofluorescence pictures of control
bead (A-D), TDM (E-H) bead and M. tuberculosis (I-L) phagosomes in RAW264.7
macrophages stained for cofilin1 (green) and LAMP1 (red). Quantitative analysis
showed that the cofilin1 staining pattern for both bead types was similar since
punctuate pattern were absent from control and TDM bead phagosomes. In contrast,
phagosomes of M. tuberculosis GFP show a significant punctuate association with
cofilin1 when LAMP1-positive (arrow). Further, TDM bead and M. tuberculosis
phagosomes were significantly associated with actin compared to controls (not
shown). However, actin did not co-localize with cofilin1. In conclusion,
immunofluorescence staining revealed association of cofilin1 only with LAMP1-
positive M. tuberculosis but not with bead phagosomes or actin.

Results
74
Figure 3.10: Immunofluorescence staining of control, TDM bead and M. tuberculosis GFP infected RAW264.7 macrophages for cofilin1 and LAMP1. Macrophages were “bead infected” with control and TDM beads (*) in a MOI of 3 or M. tuberculosis GFP with a MOI of 5. 30 mpi and 2 hpi, respectively, phagosome maturation was stopped and macrophages were stained using primary antibodies to cofilin1 and LAMP1 followed by secondary fluorescent antibodies to either rabbit or rat IgG, respectively. A, E & J: Staining pattern of cofilin1 in macrophages with control, TDM bead and M. tuberculosis GFP phagosomes. B, F & K: Staining pattern of LAMP1 in macrophages with control, TDM bead and M. tuberculosis GFP phagosomes. C & G: Merged images with DAPI stain for nucleus (blue). D, H & L: Phase contrast. I: M. tuberculosis GFP. M: Quantitative analysis of cofilin1 and LAMP1 association with control, TDM bead and M. tuberculosis
GFP phagosomes. TTest, n=3 biological replicates, p-value * >0.05, ** >0.01, *** >0.001, bar=5 µm

Results
75
Profilin1: Figure 3.11 shows representative immunofluorescence pictures of control (A-
D), TDM (E-H) bead and M. tuberculosis GFP (I-L) phagosomes in RAW264.7
macrophages stained for profilin1 (green) and LAMP1 (red). The profilin1 staining
pattern for both bead types was similar, as the candidate protein was completely
absent from control and TDM bead phagosomes as analyzed by immunofluorescence
staining. However, as with cofilin1, phagosomes of M. tuberculosis GFP show a
significant association with profilin1 when LAMP1-positive (arrow). Further, TDM bead
and M. tuberculosis phagosomes were significantly associated with actin compared to
controls (not shown). However, actin did not co-localize with profilin1. In conclusion,
immunofluorescence staining revealed association of profilin1 only with LAMP1-
positive M. tuberculosis but not with bead phagosomes or actin.

Results
76
Figure 3.11: Immunofluorescence staining of control, TDM bead and M. tuberculosis GFP infected RAW264.7 macrophages for profilin1 and LAMP1. Macrophages were “bead infected” with control and TDM beads (*) in a MOI of 3 or M. tuberculosis GFP with a MOI of 5. 30 mpi and 2 hpi, respectively, phagosome maturation was stopped and macrophages were stained using primary antibodies to profilin1 and LAMP1 followed by secondary fluorescent antibodies to either rabbit or rat IgG, respectively. A, E & J: Staining pattern of profilin1 in macrophages with control, TDM bead and M. tuberculosis GFP phagosomes. B, F & K: Staining pattern of LAMP1 in macrophages with control, TDM bead and M. tuberculosis GFP phagosomes. C & G: Merged images with DAPI stain for nucleus (blue). D, H & L: Phase contrast. I: M. tuberculosis GFP. M: Quantitative analysis of profilin1 and LAMP1 association with control, TDM bead and M. tuberculosis GFP phagosomes. TTest, n=3 biological replicates, p-value * >0.05, ** >0.01, ***
>0.001, bar=5 µm
Results
77
SNAP23: Figure 3.12 shows representative immunofluorescence pictures of control
(A-D), TDM (E-H) bead and M. tuberculosis GFP (I-L) phagosomes in RAW264.7
macrophages stained for SNAP23 (green) and LAMP1 (red). Quantitative analysis
revealed that neither bead nor M. tuberculosis GFP phagosomes accumulated
SNAP23 (Figure 3.12, M). In conclusion, as assessed by immunofluorescence
staining, SNAP23 did not reveal a significant association with bead or M. tuberculosis
GFP phagosomes.

Results
78
Figure 3.12: Immunofluorescence staining of control, TDM bead and M. tuberculosis GFP infected RAW264.7 macrophages for SNAP23 and LAMP1. Macrophages were “bead infected” with control and TDM beads (*) in a MOI of 3 or M. tuberculosis with a MOI of 5. 30 mpi and 2 hpi, respectively, phagosome maturation was stopped and macrophages were stained using primary antibodies to SNAP23 and LAMP1 followed by secondary fluorescent antibodies to either rabbit or rat IgG, respectively. A, E & J: Staining pattern of SNAP23 in macrophages with control, TDM bead and M. tuberculosis GFP phagosomes. B, F & K: Staining pattern of LAMP1 in macrophages with control, TDM bead and M. tuberculosis GFP phagosomes. C & G: Merged images with DAPI stain for nucleus (blue). D, H & L: Phase contrast. I: M. tuberculosis GFP. M: Quantitative analysis of SNAP23 and LAMP1 association with control, TDM bead and M. tuberculosis phagosomes. TTest, n=3 biological replicates, p-value * >0.05, ** >0.01, *** >0.001, bar=5 µm

Results
79
VAMP3: Figure 3.13 shows representative immunofluorescence pictures of control (A-
D), TDM (E-H) bead and M. tuberculosis GFP (I-L) phagosomes in RAW264.7
macrophages stained for VAMP3 (green) and LAMP1 (red). Quantitative analysis
revealed that neither bead nor M. tuberculosis phagosomes were significantly
associated with candidate protein VAMP3 as assessed by immunofluorescence
staining.

Results
80
Figure 3.13: Immunofluorescence staining of control, TDM bead and M. tuberculosis GFP infected RAW264.7 macrophages for VAMP3 and LAMP1. Macrophages were “bead infected” with control and TDM beads (*) in a MOI of 3 or M. tuberculosis with a MOI of 5. 30 mpi and 2 hpi, respectively, phagosome maturation was stopped and macrophages were stained using primary antibodies to VAMP3 and LAMP1 followed by secondary fluorescent antibodies to either rabbit or rat IgG, respectively. A, E & J: Staining pattern of VAMP3 in macrophages with control, TDM bead and M. tuberculosis GFP phagosomes. B, F & K: Staining pattern of LAMP1 in macrophages with control, TDM bead and M. tuberculosis GFP phagosomes. C & G: Merged images with DAPI stain for nucleus (blue). D, H & L: Phase contrast. I: M. tuberculosis GFP. M: Quantitative analysis of VAMP3 and LAMP1 association with control, TDM bead and M. tuberculosis phagosomes. TTest,
n=3 biological replicates, p-value * >0.05, ** >0.01, *** >0.001. bar=5 µm

Results
81
3.3.2 Evaluation of the presence of candidate proteins on isolated and purified
control and TDM bead phagosomes by Western blot
To further validate the differential abundances of annexinA1, annexinA6, cofilin1,
profilin1, SNAP23 and VAMP3 found by proteomics, control and TDM bead
phagosomes were isolated and purified from RAW264.7 macrophages and analyzed
by Western blot. For this purpose, the isolation and purification protocol did not include
sorting by FACS. This was due to the fact that, after sorting by FACS, protein
concentrations of candidate proteins were below the Western blot detection limit.
The β-galactosidase assay of three independent isolations revealed 60 %, 43 % and
46 % remaining β-galactosidase activity in TDM bead phagosomes compared to
control ones (results not shown). Figure 3.14 shows representative pictures of the
amount of proteins annexinA1, annexinA6, profilin1, SNAP23 and VAMP3 on control
versus TDM bead phagosomes. The bands below represent the loading control signal
for α-tubulin. Quantification of three independent experiments via densitometry
revealed that average annexinA1 was 35 %, annexinA6 75 %, profilin1 31 %, SNAP23
72 % and VAMP3 16 % more abundant on TDM versus control bead phagosomes.
Cofilin1 could not be detected.
Figure 3.14: Quantification of candidate proteins annexinA1, annexinA6, profilin1, SNAP23 and VAMP3 on isolated control versus TDM bead phagosomes via Western blot. Macrophages were “bead infected” with control and TDM beads with an MOI of 10. 30 mpi, bead phagosome maturation was stopped. Bead phagosomes were subsequently isolated and purified as described in chapter 2.2.1. Control and TDM bead phagosomes isolated and purified in three independent experiments were analyzed by Western blot and quantified by densitometry as described in 2.2.3. Figure 3.14 shows representative pictures of one experiment. Cofilin1 could not be detected by Western Blot. Average, annexinA1 was 35 %, annexinA6 75 %, profilin1 31 %, SNAP23 72 % and VAMP3 16 % more abundant on TDM versus control bead phagosomes.

Results
82
3.3.3 Evaluation of the role of candidate proteins for intracellular survival of M.
tuberculosis by small interfering RNA/CFUs analysis
Ultimately, the relevance of candidate proteins in early processes of M. tuberculosis-
mediated inhibition of phagosome maturation and consequently survival in
macrophages was tested. Therefore, candidate proteins were knocked-down in
RAW264.7 macrophages using the small interfering RNA (siRNA) technology followed
by infection with M. tuberculosis and analysis of colony-forming-units (CFUs) at 2 hpi,
4 hpi, 1 dpi, 2 dpi and 3 dpi (hours/days post infection). As control, untreated (negative
control, NK) and RAW264.7 macrophages transfected with non-targeting-RNA (NTR)
were used. Of note, due to technical difficulties only candidate proteins annexinA6,
cofilin1, profilin1 and VAMP3 could be analyzed.
The efficiency of siRNA-mediated knock-down of candidate proteins was tested via
Western blot. In this experimental set-up, the role of candidate proteins early in
infection should be tested. Thus only their absence on the day of infection was of
interest and evaluated by Western blot as shown in Figure 3.15. The upper bands
show the signals for annexinA6, profilin1, cofilin1 and VAMP3, 1 day (profilin1,
VAMP3) and 2 days (annexinA6, cofilin1) post transfection (dpt) with NTR and
targeting-siRNA in RAW264.7 macrophages, respectively. The bands below represent
the loading control signal for α-tubulin. Densitometry analysis revealed that, compared
to NTR controls, the amount of annexinA6 was reduced to 80 %, of cofilin1 to 5 %, of
profilin1 to 55 % and of VAMP3 to 2 %.
Figure 3.15: Control of siRNA-mediated knock-down of candidate proteins annexinA6, cofilin1, profilin1 and VAMP3 via Western blot. Macrophages were transfected with siRNA for annexinA6, profilin1, cofilin1 and VAMP3 and NTR as control. 1 dpt or 2 dpt, cells were infected with M. tuberculosis or harvested and destroyed by a freeze (N2 (l)) and thaw (37 °C) cycle. Samples were treated with DNAse and the protein concentration was determined using the Pierce 660 nm protein assay. Afterwards, 10 µg of protein were loaded onto a SDS-PAGE. Gels were blotted, blocked and incubated with antibodies against annexinA6, cofilin1, profilin1 and VAMP3 in

Results
83
parallel with an antibody against α-tubulin as loading control. Subsequently, blots were incubated with anti-rabbit coupled to HRP. Blots were washed, developed with an ECL-solution and exposed to Hyperfilm 10 sec to 2 min corresponding to band strength. Densitometry analysis revealed that, compared to NTR controls, the amount of annexinA6 was reduced to 80 %, of cofilin1 to 5 %, of profilin1 to 55 % and of VAMP3 to 2 % as assessed by Western blot.
Figure 3.15 shows the CFUs of M. tuberculosis from macrophages with reduced
amounts of (A) annexinA6, (B) cofilin1, (C) profilin1 and (E) VAMP3. Compared to NTR
controls, reduction of annexinA6 significantly lowered CFUs at 2 and 4 hpi. Similarly,
knock-down of cofilin1 revealed significantly decreased M. tuberculosis CFUs at 2 and
4 hpi and 1 dpi whereas reduced amounts of profilin1 decreased CFUs at 4 hpi and
1 dpi. Finally, the CFU of cells with reduced VAMP3 is significantly increased at 2 hpi.
Figure 3.16: Survival of M. tuberculosis inside RAW264.7 macrophages after knock-down of annexinA6, cofilin1, profilin1 and VAMP3 using RNA interference. Macrophages were transfected with NTR or siRNA for annexinA6, cofilin1, profilin1 and VAMP3. 1 dpi or 2 dpt, macrophages were infected with M. tuberculosis with an MOI of 0.5. As negative control, untreated macrophages were infected as well. CFUs were analyzed 2 hpi, 4 hpi, 1 dpi, 2 dpi and 3 dpi. The CFU assay was performed once with three technical replicates and analyzed with Two-Way-ANOVA with Bonferroni post test. NTR served as control for statistical analysis. n=3 technical replicates, p-values *< 0.5 *, < 0.01 **, < 0.001 ***.
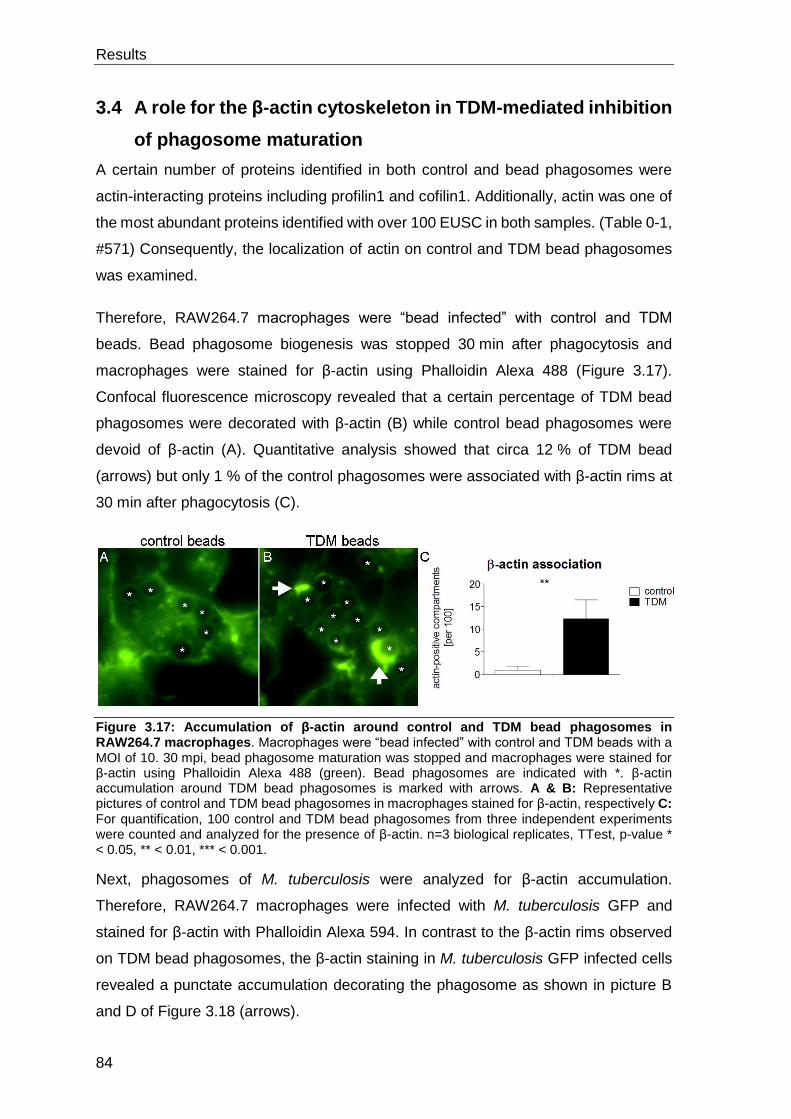
Results
84
3.4 A role for the β-actin cytoskeleton in TDM-mediated inhibition
of phagosome maturation
A certain number of proteins identified in both control and bead phagosomes were
actin-interacting proteins including profilin1 and cofilin1. Additionally, actin was one of
the most abundant proteins identified with over 100 EUSC in both samples. (Table 0-1,
#571) Consequently, the localization of actin on control and TDM bead phagosomes
was examined.
Therefore, RAW264.7 macrophages were “bead infected” with control and TDM
beads. Bead phagosome biogenesis was stopped 30 min after phagocytosis and
macrophages were stained for β-actin using Phalloidin Alexa 488 (Figure 3.17).
Confocal fluorescence microscopy revealed that a certain percentage of TDM bead
phagosomes were decorated with β-actin (B) while control bead phagosomes were
devoid of β-actin (A). Quantitative analysis showed that circa 12 % of TDM bead
(arrows) but only 1 % of the control phagosomes were associated with β-actin rims at
30 min after phagocytosis (C).
Figure 3.17: Accumulation of β-actin around control and TDM bead phagosomes in RAW264.7 macrophages. Macrophages were “bead infected” with control and TDM beads with a MOI of 10. 30 mpi, bead phagosome maturation was stopped and macrophages were stained for β-actin using Phalloidin Alexa 488 (green). Bead phagosomes are indicated with *. β-actin accumulation around TDM bead phagosomes is marked with arrows. A & B: Representative pictures of control and TDM bead phagosomes in macrophages stained for β-actin, respectively C: For quantification, 100 control and TDM bead phagosomes from three independent experiments were counted and analyzed for the presence of β-actin. n=3 biological replicates, TTest, p-value * < 0.05, ** < 0.01, *** < 0.001.
Next, phagosomes of M. tuberculosis were analyzed for β-actin accumulation.
Therefore, RAW264.7 macrophages were infected with M. tuberculosis GFP and
stained for β-actin with Phalloidin Alexa 594. In contrast to the β-actin rims observed
on TDM bead phagosomes, the β-actin staining in M. tuberculosis GFP infected cells
revealed a punctate accumulation decorating the phagosome as shown in picture B
and D of Figure 3.18 (arrows).

Results
85
Figure 3.18: Localization of β-actin and WASH1 around M. tuberculosis GFP phagosomes in RAW264.7 macrophages. Macrophages were infected with M. tuberculosis GFP with a MOI of 3. 2 hpi, phagosome maturation was stopped and macrophages were stained for β-actin and WASH1 using Phalloidin Alexa 549 (red) and a primary antibody against WASH1 and secondary anti-rabbit IgG fluorescent antibody (white), respectively. β-actin and WASH1 accumulation around M. tuberculosis GFP phagosomes is marked with arrows. A: M. tuberculosis GFP. B: β-actin staining pattern in macrophages. C: WASH1 staining pattern in macrophages. D: merged picture.
Spontaneous polymerization of monomeric cytoplasmic actin is relatively inefficient.
Thus, polymerization is facilitated by several proteins acting in synergy. Actin
polymerization on target membranes is mediated by the Arp2/3 complex in cooperation
with nucleating-promoting-factors (NPFs). Recently, the WASH-complex was
discovered to be the major actin polymerisation-promoting complex on endosomes.
The WASH-complex is constituted by five proteins: strumpellin, SWIP, WASH1,
Fam21 and CCDC53. To analyze whether β-actin on phagosomes of M. tuberculosis
is associated with the WASH-complex, RAW264.7 macrophages infected with M.
tuberculosis GFP and stained for β-actin were co-stained for WASH1 (Figure 3.18).
Indeed, WASH1 co-localized with β-actin to the M. tuberculosis GFP phagosome as
indicated with arrows in pictures C and D [103].
To test whether the accumulation of β-actin around the phagosome of M. tuberculosis
is involved in inhibition of phagosome maturation, 30 min after M. tuberculosis GFP
infection, β-actin was removed with Latrunkulin A (LatA), a drug that depolymerises F-
actin. After 2 hpi and 4 hpi, phagosomes of M. tuberculosis GFP were analyzed for
their association with lysotracker (A) and the lysosomal marker LAMP1 (B) (Figure
3.19). Upon LatA treatment of RAW264.7 macrophages, the numbers of M.
tuberculosis GFP in mature phagosomes as indicated by lysotracker positive staining
were significantly increased at 2 hpi (A). In contrast, after 4 hpi LatA did not alter
lysotracker association with M. tuberculosis GFP. LAMP1 association with M.
tuberculosis was also significantly enhanced at 2 hpi but not 4 hpi (B).
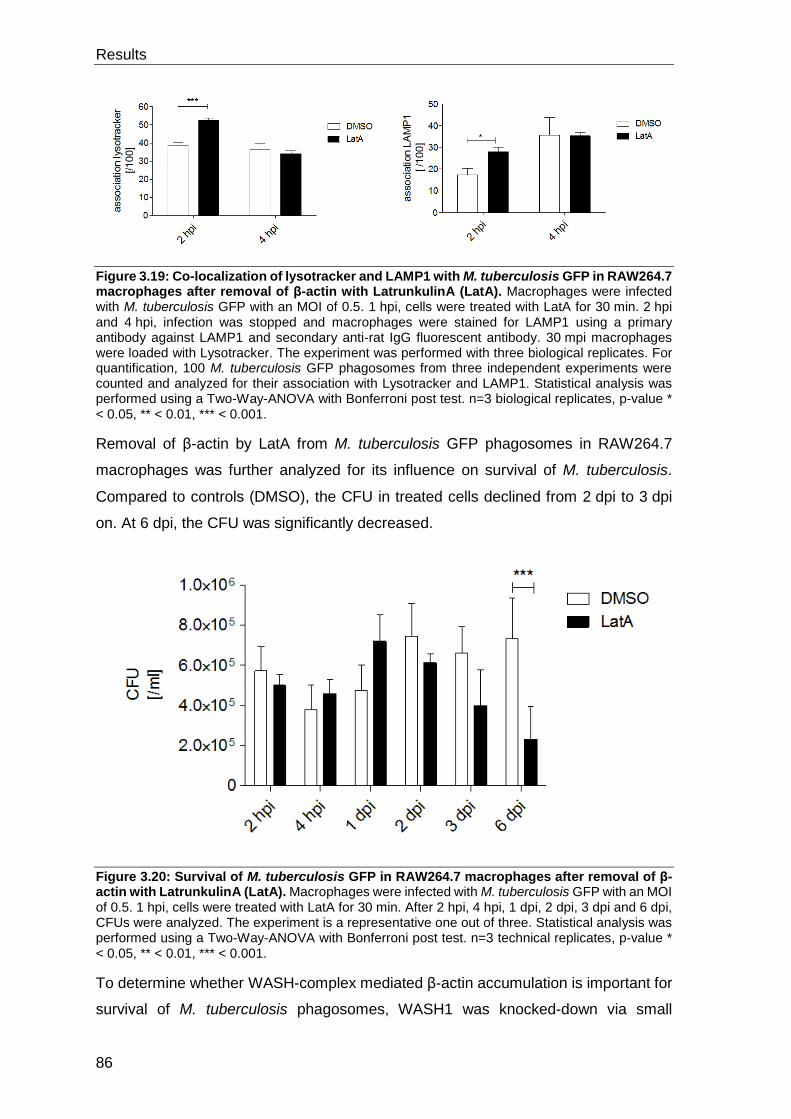
Results
86
Figure 3.19: Co-localization of lysotracker and LAMP1 with M. tuberculosis GFP in RAW264.7 macrophages after removal of β-actin with LatrunkulinA (LatA). Macrophages were infected with M. tuberculosis GFP with an MOI of 0.5. 1 hpi, cells were treated with LatA for 30 min. 2 hpi and 4 hpi, infection was stopped and macrophages were stained for LAMP1 using a primary antibody against LAMP1 and secondary anti-rat IgG fluorescent antibody. 30 mpi macrophages were loaded with Lysotracker. The experiment was performed with three biological replicates. For quantification, 100 M. tuberculosis GFP phagosomes from three independent experiments were counted and analyzed for their association with Lysotracker and LAMP1. Statistical analysis was performed using a Two-Way-ANOVA with Bonferroni post test. n=3 biological replicates, p-value * < 0.05, ** < 0.01, *** < 0.001.
Removal of β-actin by LatA from M. tuberculosis GFP phagosomes in RAW264.7
macrophages was further analyzed for its influence on survival of M. tuberculosis.
Compared to controls (DMSO), the CFU in treated cells declined from 2 dpi to 3 dpi
on. At 6 dpi, the CFU was significantly decreased.
Figure 3.20: Survival of M. tuberculosis GFP in RAW264.7 macrophages after removal of β-actin with LatrunkulinA (LatA). Macrophages were infected with M. tuberculosis GFP with an MOI of 0.5. 1 hpi, cells were treated with LatA for 30 min. After 2 hpi, 4 hpi, 1 dpi, 2 dpi, 3 dpi and 6 dpi, CFUs were analyzed. The experiment is a representative one out of three. Statistical analysis was performed using a Two-Way-ANOVA with Bonferroni post test. n=3 technical replicates, p-value * < 0.05, ** < 0.01, *** < 0.001.
To determine whether WASH-complex mediated β-actin accumulation is important for
survival of M. tuberculosis phagosomes, WASH1 was knocked-down via small

Results
87
interference RNA in RAW264.7 macrophages. The efficiency of siRNA-mediated
knock-down of WASH1 was tested via Western blot. In this experimental set-up, the
role of the WASH-complex early in infection should be tested. Thus only its absence
on the day of infection was of interest. The upper bands show the amount of protein
of WASH1, 2 day post transfection (dpt) in RAW264.7 macrophages treated with NTR
and WASH1-targeting siRNA. The bands below represent loading control with α-
tubulin. Overall the amount of WASH1 was decreased successfully by siRNA knock-
down. Compared to 2 dpt NTR control, the amount of WASH1 was significantly
reduced to 0 % as assessed by Western blot.
Figure 3.21: Control of siRNA-mediated knock-down of WASH1 via Western blot. Macrophages were transfected with siRNA targeting WASH1 and NTR as control. 2 dpt, cells were infected with M. tuberculosis or harvested and destroyed by a freeze (N2 (l)) and thaw (37 °C) cycle. Samples were treated with DNAse and the protein concentration was determined using the Pierce 660 nm protein assay. Afterwards, 10 µg of protein were loaded onto a SDS-PAGE. Gels were blotted, blocked and incubated with antibodies against WASH1 in parallel with an antibody against α-tubulin as loading control ON at 4 °C. Subsequently, blots were incubated with anti-rabbit coupled to HRP. Blots were washed, developed with an ECL-solution and exposed to Hyperfilm 10 sec to 2 min corresponding to band strength. As assessed by Western blot, the amount of WASH1 could be reduced to 0 %.
2 dpt with WASH1-targeting siRNA, macrophages were infected with M. tuberculosis
and CFUs were analyzed 2 hpi, 4 hpi, 1 dpi, 2 dpi and 3 dpi. Over time, knock-down
of WASH1 had no major impact on CFUs when compared to controls although CFUs
were significantly increased compared to controls at 2 dpi.

Results
88
Figure 3.22: Survival of M. tuberculosis inside RAW264.7 macrophages after knock-down of WASH1 using RNA interference. Macrophages were transfected with NTR and siRNA targeting WASH1. 2 dpt, macrophages were infected with M. tuberculosis with an MOI of 0.5. As negative control, untreated macrophages were infected as well. CFU were analyzed 2 hpi, 4 hpi, 1 dpi, 2 dpi and 3 dpi. The CFU assay was performed once with three technical replicates and analyzed with Two-Way-ANOVA with Bonferroni post test. NTR served as control for statistical analysis. n=3 technical replicates, p-values *< 0.05 *, < 0.01 **, < 0.001 ***.

Results
89
3.5 The lipid coated bead phagosome lipidome
In order to analyze whether TDM affects the lipid composition of bead phagosomes,
RAW264.7 macrophages were “bead infected” with control and TDM beads.
Subsequently control and TDM bead phagosomes were isolated and purified, internal
standards were added and lipids were extracted. Samples were analyzed by mass
spectrometry for the lipid composition as described in 2.2.4. Comparison of control and
TDM bead phagosomes should then reveal TDM-mediated changes in the bead
phagosome lipidome.
Seven pairs of control and TDM bead phagosomes were compared. Prior mass
spectrometry analysis, the β-galactosidase activity of all pairs was determined. TDM
bead phagosome preparations 1 and 4 showed remaining β-galactosidase activities
of 55 %, 3 of 28 %, 2, 5, 6 and 7 of 62 %, 64 %, 69 % and 64 %, respectively.
Figure 3.23: β-galactosidase activity of all seven paired samples used for lipidomic analysis of bead phagosomes. Macrophages were “bead infected” with control and TDM beads with a MOI of 10. 30 mpi, bead phagosome maturation was stopped and bead phagosomes were isolated and purified as described in 2.2.1. β-galactosidase activity was determined as described in 2.2.1.7. Percentages are shown above bars.
We analysed the different classes of ceramides (Cer), cholesterol (Chol),
lysobisphosphatic acid (LBPA), lyso-phosphatidylcholine (LPC), phosphatidylcholine
(PC), plasmalogen phosphatidylcholine (PC-O), phosphatidylethanolamine (PE),
plasmalogen phosphatidylethanolamine (PE-O), phosphatidylglycerol (PG),
phosphatidylinositol (PI), phosphatidylserine (PS) and sphingomyelins (SM).

Results
90
For a first general overview about the lipid composition of bead phagosomes, Figure
3.24 shows the lipid class composition of matured control bead phagosomes.
Accordingly, with 24 %, 23 % and 19 %, PC, LBPA and cholesterol were the most
prominent lipids in the bead phagosome lipidome, respectively, followed by SM (9 %),
PC-O (6 %), PI (5 %), PS (5 %), PE-O (4 %), PE (3%), Cer (1 %), PG (1 %) and LPC
(0.3 %).
Figure 3.24: Identified lipid classes in control bead phagosomes. Macrophages were “bead infected” with control and TDM beads with a MOI of 10. 30 mpi, bead phagosome maturation was stopped and bead phagosomes were isolated and purified as described in 2.2.1. Subsequently, internal standards were added, lipids were extracted and pairs of control and TDM bead phagosomes samples were analyzed for their lipid content by mass spectrometry as described in 2.2.4. Results were processed using Microsoft Excel and Prism 6.0. The pie chart shows the composition of lipid classes identified in matured control bead phagosomes.
The lipid profile was compared between control and TDM bead phagosomes.
Therefore, mol % of lipid classes of matching pairs were analyzed with a paired TTest.
Figure 3.25 and Figure 3.26, show the befor-and-after-plot of the 12 lipid classes
identified in all seven control (before) and TDM (after) bead phagosome pairs. Overall,
the lipid composition of control and TDM bead phagosomes was comparable.
However, three lipid classes were significantly different in TDM samples compared to
controls. While amounts of LBPA (Figure 3.25, C) were lower in TDM samples
compared to controls, amounts of cholesterol (Figure 3.25, B) and PS (Figure 3.26, E)
were significantly enhanced.

Results
91
Figure 3.25: Before-and-after-plot of Cer, Chol, LBPA, LPC, PC and PC-O identified in control versus TDM bead phagosomes. Macrophages were “bead infected” with control and TDM beads with a MOI of 10. 30 mpi, bead phagosome maturation was stopped and bead phagosomes were isolated and purified as described in 2.2.1. Subsequently, internal standards were added, lipids were extracted and pairs of control and TDM bead phagosomes samples were analyzed for their lipid content by mass spectrometry as described in 2.2.4. Results were processed using Microsoft Excel and Prism 6.0. Statistical analysis was performed with a paired TTest. n=7 biological replicates, p-value * < 0.05, ** < 0.01, *** < 0.001.

Results
92
Figure 3.26: Before-and-after-plot of PE, PE-O, PG, PI, PS and SM identified in control versus TDM bead phagosomes. Macrophages were “bead infected” with control and TDM beads with a MOI of 10. 30 mpi, bead phagosome maturation was stopped and bead phagosomes were isolated and purified as described in 2.2.1. Subsequently, internal standards were added, lipids were extracted and pairs of control and TDM bead phagosomes samples were analyzed for their lipid content by mass spectrometry as described in 2.2.4. Results were processed using Microsoft Excel and Prism 6.0. Statistical analysis was performed with a paired TTest. n=7 biological replicates, p-value * < 0.05, ** < 0.01, *** < 0.001.
Results
93
The TDM-induced changes in lipid class composition of bead phagosomes were
further analyzed on lipid species level. Summarizing, 16 lipid species were identified
for ceramides, 1 for cholesterol, 48 for LBPA, 5 for LPC, 38 for PC, 34 for PC-O, 30
for PE, 38 for PE-O, 31 for PG, 23 for PI, 27 for PS and 21 for SM (Table 0-2)
For graphic representation of single lipid species, a volcano-plot was chosen (Figure
3.27). Therefore the mean of p-values calculated from the mol % of all identified lipid
species in sample pairs was transformed to a negative log10 value and plotted against
the mean of the mol % fold change (ratio of TDM/control) of all sample pairs
transformed to a log2 value. This gives a volcano-plot as shown in Figure 3.27. Every
spot represents a single lipid species. Single lipid species shift left when decreased
and right when increased in TDM samples compared to controls. If single lipid species
have a paired p-value <0.05 and thus are significantly altered, they have a -log10 value
>1.13 (dashed horizontal line). If the fold change is >1.5 or >2, log2 values are >0.58
or >1 (dashed red vertical lines), respectively. If the fold change is <0.75 or <0.5, log2
values are <-0.41 or <-1 (dashed green vertical lines), respectively. Lipid species that
center around 0 are equally distributed in control versus TDM bead phagosome
samples.
The volcano-plot confirms the decrease of LBPA (turquoise dots) because most of the
LBPA species shift to the left. Species 44:10 but most prominently, species 36:2 is
significantly reduced in TDM bead compared to control phagosomes. Similarly, the
increase in PS in TDM samples compared to controls is revealed by the shift of several
PS (dark green) lipid species to the right. PS 37:1, PS 38:4 and PS 38:5 are
significantly accumulated in TDM samples compared to controls. The single light green
spot marked with “Chol” indicates a minor but significant increase in TDM bead
phagosome samples. Although increased without statistical significance on the lipid
class level, ceramides 32:1, 34:0, 34:1 and 41:2 are significantly accumulated in TDM
bead phagosomes. Similarly, SM species 40:1, 41:1, 42:2 are significantly increased
in TDM bead phagosomes.

Results
94
Figure 3.27: Volcano-plot - Distribution of identified lipid species in control versus TDM bead phagosome samples. Macrophages were “bead infected” with control and TDM beads with a MOI of 10. 30 mpi, bead phagosome maturation was stopped and bead phagosomes were isolated and purified as described in 2.2.1. Subsequently, internal standards were added, lipids were extracted and pairs of control and TDM bead phagosomes samples were analyzed for their lipid content by mass spectrometry as described in 2.2.4. For volcano-plot graphic representation, -log10 transformed p-values and log2 transformed fold changes of control versus TDM sample pairs were plotted. Every dot represents a single lipid species. Unchanged lipid species centre around 0. Altered lipid species shift left when decreased and right when increased in TDM bead phagosomes. Significant changes (p-value <0.05) appear above the horizontal black dashed line. Fold-changes >1.5 or >2 appear beyond red vertical dashed lines and fold-changes <0.75 or <0.5 appear beyond the green vertical dashed lines. Results were processed using Microsoft Excel and Prism 6.0. n=7 biological replicates

Discussion
95
4 Discussion
4.1 Resume
Localized in the mycobacterial outer membrane, the cell-wall lipid TDM is a major
virulence factor of M. tuberculosis. When coated to beads, TDM was shown to inhibit
bead phagosome maturation [90], [91]. However, the molecular function underlying
TDM-mediated inhibition of phagosome maturation remains elusive. We hypothesized,
that TDM exerts its virulence function by interacting with host-cell partners at the
phagosome interface. In the TDM determined vesicle, these interaction partners are
present either within the phagosome, inside the phagosomal membrane or linked to
the cytoplasmic side of the phagosome. The direct or indirect interaction of TDM with
these interactors putatively affects phagosome maturation. Thus the main aim of this
thesis was to identify TDM direct or indirect interaction partners. To study the effect of
TDM, a simplified lipid-coated bead model was used. Beads were coated with TDM
and used for “bead infection” of macrophages to isolate and purify bead phagosomes
for mass spectrometry based proteomics and lipidomics.
To identify and quantify potential interaction partners, a protocol had to be developed
that enabled isolation and purification of bead phagosomes for mass spectrometry
analysis. An existing protocol including (i) coating of beads with TDM, (ii) “bead
infection” of macrophages (iii) bead phagosome isolation from macrophages by
magnet and (iv) purification of bead phagosomes by DNase digestion and Ficoll-
gradient centrifugation was refined by addition of a protease digestion step and sorting
bead phagosomes by FACS.
Proteomics of control and TDM bead phagosomes identified 1054 proteins in total.
Grouping of identified proteins according to their cellular localization revealed 2916
proteins that could be assigned as phagosome-associated whereas 898 proteins were
potential contaminants indicating an enrichment of phagosomal proteins. After
application of exclusion criteria, 34 proteins were filtered that were enriched in TDM
bead phagosomes compared to controls and thus potential TDM interaction partners.
Of these, annexinA1, annexinA6, cofilin1, profilin1, SNAP23 and VAMP3 were chosen
for further analysis because they have been described to be associated with
phagosomes as part of a phagosome-interacting network.

Discussion
96
Immunofluorescence to verify mass spectrometry results, however failed to reveal
specific association with TDM bead or M. tuberculosis phagosomes. Notably, cofilin1
and profilin1 were found positive to LAMP1 M. tuberculosis phagosomes. In contrast
to the immunofluorescence approach, Western blot analysis of isolated and purified
bead phagosomes confirmed enrichment of all 6 candidate proteins on TDM bead
phagosomes compared to control ones. Preliminary siRNA experiments to knock-
down candidate proteins in macrophages for subsequent infection with M. tuberculosis
indicated that absence of annexinA6 and VAMP3 impairs phagocytosis and that
cofilin1 and profilin1 are important for survival of the pathogen in macrophages.
Furthermore, proteomics revealed enrichment of β-actin and β-actin-binding-proteins
in bead phagosome proteomes. Fluorescence staining using Phalloidin demonstrated
accumulation of β-actin on TDM bead and a punctate pattern on M. tuberculosis
phagosomes that co-localized with NPF WASH1. Removal of β-actin drove M.
tuberculosis in phago-lysosomes and impaired survival of M. tuberculosis in
macrophages. However, preliminary RNA interference experiments suggested that
WASH1 is dispensable for survival of M. tuberculosis in macrophages.
Differential lipidomics by mass spectrometry of control and TDM bead phagosomes
demonstrated that TDM bead phagosomes had significantly less LBPA and
significantly increased amounts of cholesterol and phosphatidylserine compared to
control ones. Analysis at the single lipid species level additionally revealed significant
increase of certain ceramide and sphingomyeline species in TDM bead phagosomes
when compared to control ones.
In conclusion, these results reflect that TDM and control bead phagosomes vary on
protein and lipid levels because each bead phagosome represents a different
maturation stage. However, identified TDM interactors may have an important direct
or indirect functional role in inhibition of phagosome maturation. Notably, there is a
specific association of the actin cytoskeleton network with non-maturing M.
tuberculosis and TDM bead phagosomes. A model for actin cytoskeleton function in
interference with phagosome biogenesis by TDM is proposed.
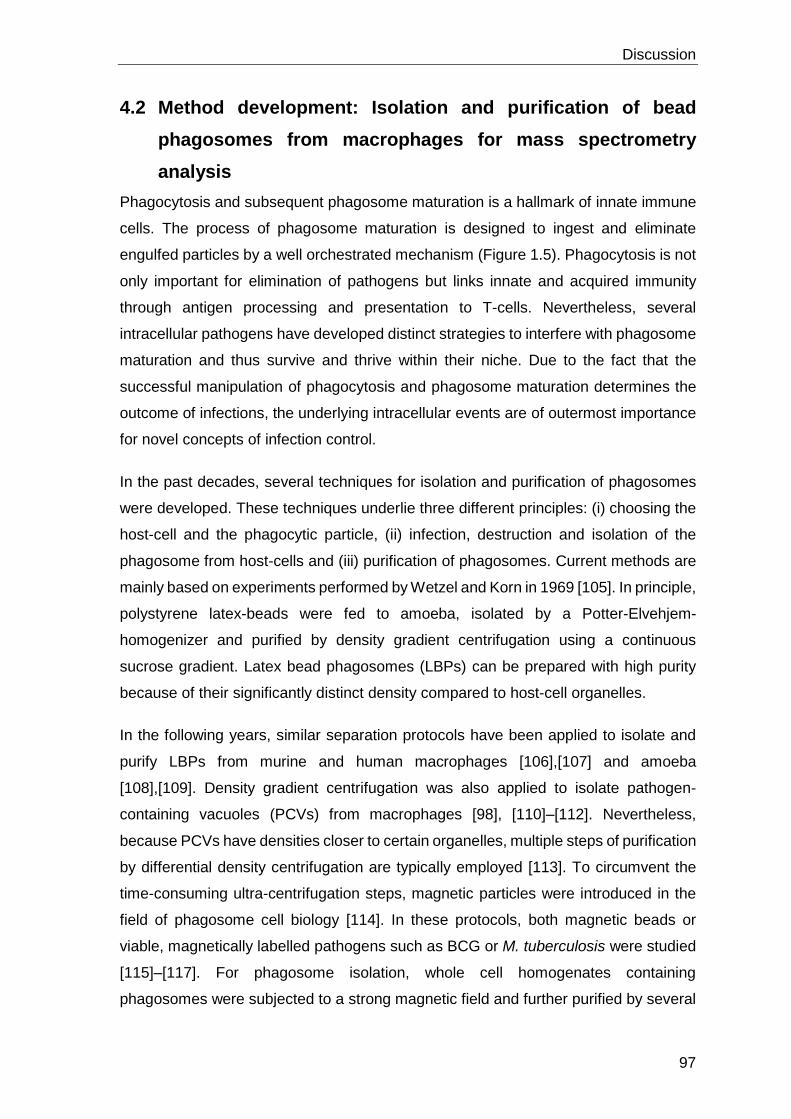
Discussion
97
4.2 Method development: Isolation and purification of bead
phagosomes from macrophages for mass spectrometry
analysis
Phagocytosis and subsequent phagosome maturation is a hallmark of innate immune
cells. The process of phagosome maturation is designed to ingest and eliminate
engulfed particles by a well orchestrated mechanism (Figure 1.5). Phagocytosis is not
only important for elimination of pathogens but links innate and acquired immunity
through antigen processing and presentation to T-cells. Nevertheless, several
intracellular pathogens have developed distinct strategies to interfere with phagosome
maturation and thus survive and thrive within their niche. Due to the fact that the
successful manipulation of phagocytosis and phagosome maturation determines the
outcome of infections, the underlying intracellular events are of outermost importance
for novel concepts of infection control.
In the past decades, several techniques for isolation and purification of phagosomes
were developed. These techniques underlie three different principles: (i) choosing the
host-cell and the phagocytic particle, (ii) infection, destruction and isolation of the
phagosome from host-cells and (iii) purification of phagosomes. Current methods are
mainly based on experiments performed by Wetzel and Korn in 1969 [105]. In principle,
polystyrene latex-beads were fed to amoeba, isolated by a Potter-Elvehjem-
homogenizer and purified by density gradient centrifugation using a continuous
sucrose gradient. Latex bead phagosomes (LBPs) can be prepared with high purity
because of their significantly distinct density compared to host-cell organelles.
In the following years, similar separation protocols have been applied to isolate and
purify LBPs from murine and human macrophages [106],[107] and amoeba
[108],[109]. Density gradient centrifugation was also applied to isolate pathogen-
containing vacuoles (PCVs) from macrophages [98], [110]–[112]. Nevertheless,
because PCVs have densities closer to certain organelles, multiple steps of purification
by differential density centrifugation are typically employed [113]. To circumvent the
time-consuming ultra-centrifugation steps, magnetic particles were introduced in the
field of phagosome cell biology [114]. In these protocols, both magnetic beads or
viable, magnetically labelled pathogens such as BCG or M. tuberculosis were studied
[115]–[117]. For phagosome isolation, whole cell homogenates containing
phagosomes were subjected to a strong magnetic field and further purified by several

Discussion
98
washing steps [114]–[117]. Upon removal of the magnet, the phagosomes were
collected and further enriched. Furthermore, organelle and free-flow electrophoresis
were used for purification of PCVs. Here PVCs were separated from other intracellular
organelles in homogenates of infected macrophages by electrophoresis through a
gradient according to their charge and size [111]. However, using the described
methods, phagosomes could never be perfectly purified since complete separation
from other cell constituents was never achieved due to the complex interaction of
phagosomes with other compartments in the cytoplasm [113]. Consequently,
phagosomes were rather enriched than purified.
In the present study, magnetic bead phagosomes were isolated and purified from
macrophages. The practical procedure included (i) bead infection of macrophages with
magnetic beads, (ii) homogenization of macrophages using a douncer, (iii) isolation of
magnetic bead phagosomes with a magnet and (iv) purification of bead phagosomes
by DNase and trypsin digestion steps, Ficoll-gradient centrifugation and final sorting
by FACS.
Magnetic (Dyna-) beads are polystyrene beads with enclosed magnetic particles. The
bead surface is tosylactivated to covalently bind proteins/peptides via primary amino-
or sulfhydryl groups. We covalently bound BSA to link TDM to the magnetic beads.
From previous experiments, we knew that this technique is suitable to coat beads with
TDM and that these TDM beads are able to inhibit phagosome maturation [91]. Binding
is most likely enabled by hydrophobic interactions between the mycolic acids of TDM
and hydrophobic pockets of BSA. Accordingly, the trehalose-moiety of TDM most likely
sticks out for interaction with host-cell “targets”.
Disruption of macrophages to isolate bead phagosomes is a delicate task since
phagosomes must remain intact. In many protocols for isolation of LBPs,
homogenization is achieved by passing cells through syringes with needle gauges
ranging from 25 to 28 [113]. This worked fine for LBPs since they have a much smaller
diameter (0.8-1.1 µm). We homogenized macrophages with a douncer. This method
allows destruction of macrophages without affecting phagosome integrity since the
gap between the pestle and the douncer chasses (13 µm) is wide enough for bead
phagosomes (Ø 2.8 µm) to stay intact.
Digestion of DNA with DNase is a very important step in the process of phagosome
purification because, due to their negative charge attracting cell debris, nucleotides

Discussion
99
(DNA in particular) can change a sample into a sticky gel impeding all further
purification efforts [98].
We noticed that, despite removal of DNA, bead phagosomes still stuck together,
probably due to protein-meshworks linking bead phagosomes together. Thus samples
were additionally treated with trypsin. Protease digestion was applied for phagosome
isolation procedures before [111]. However, it is still an unusual step, due to the fact
that proteases act non-targeted and therefore may also digest proteins of interest.
Thus, this step had to be performed very precise regarding incubation time and sample
protein to trypsin concentration and the enzyme had to be effectively removed
afterwards. However, maintained β-galactosidase activity in phagosome preparations
after trypsin treatment indicated bead phagosome integrity.
Sucrose gradient centrifugation takes advantage of the fact that latex beads have a
relatively low density and thus migrate in sucrose gradients differently from other cell
organelles [105]. Polystyrene beads including magnetic ones used herein have a
relatively high density, which precluded sucrose gradients from being applied for
further purification. Therefore, we used a Ficoll-gradient to separate phagosomes from
cellular debris. Ficoll-gradients are hydrophilic polysaccharide meshworks commonly
used to separate cell populations but also allowed us to separate magnetic bead
phagosomes from cellular debris and other organelles [98], [115], [118].
However, our own results and other reports on isolation of particle containing
phagosomes showed that contaminations with non-phagosomal host-cell material
from distinct compartments such as ER, mitochondrial or nucleus cannot be
completely avoided by the purification steps described above. Together with
increasing sensitivity of mass spectrometry methods in recent years, purity of
phagosome preparations is a significant bottleneck because high abundant
contaminating proteins can overwrite signals of phagosomal proteins with lower
abundance [119]. In 1998, Ramachandra et al. discussed sorting by flow cytometry as
an easy and rapid method for isolating phagosomes from cell lysates [120]. Sorting by
FACS was applied to isolate Salmonella and Staphylococcus aureus phagosomes
from infected cells [121]–[123]. We introduced FACS sorting as a new method to
further purify bead phagosomes. Bead phagosomes were sorted by size, re-isolated
using a magnet and analyzed by mass spectrometry. Proteins in the supernatant from
phagosomes which were destroyed during sampling into tubes after sorting were
precipitated using protein-binding beads [124]. Mass spectrometry analysis revealed
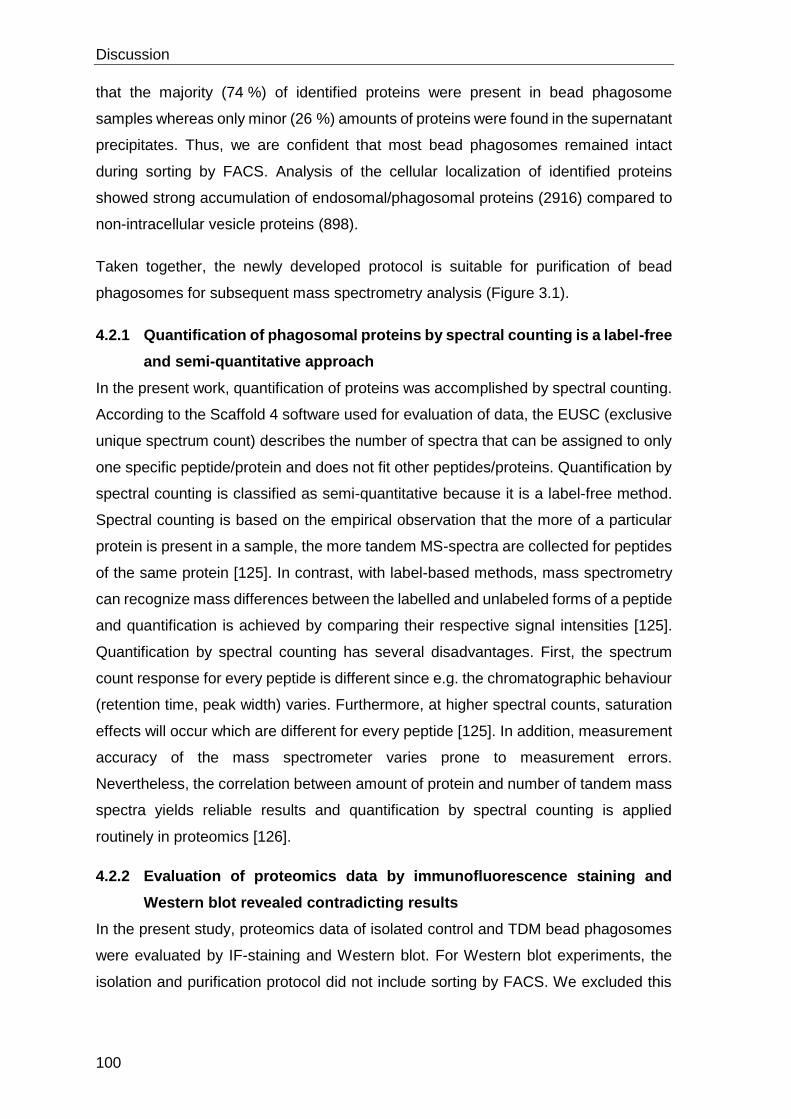
Discussion
100
that the majority (74 %) of identified proteins were present in bead phagosome
samples whereas only minor (26 %) amounts of proteins were found in the supernatant
precipitates. Thus, we are confident that most bead phagosomes remained intact
during sorting by FACS. Analysis of the cellular localization of identified proteins
showed strong accumulation of endosomal/phagosomal proteins (2916) compared to
non-intracellular vesicle proteins (898).
Taken together, the newly developed protocol is suitable for purification of bead
phagosomes for subsequent mass spectrometry analysis (Figure 3.1).
4.2.1 Quantification of phagosomal proteins by spectral counting is a label-free
and semi-quantitative approach
In the present work, quantification of proteins was accomplished by spectral counting.
According to the Scaffold 4 software used for evaluation of data, the EUSC (exclusive
unique spectrum count) describes the number of spectra that can be assigned to only
one specific peptide/protein and does not fit other peptides/proteins. Quantification by
spectral counting is classified as semi-quantitative because it is a label-free method.
Spectral counting is based on the empirical observation that the more of a particular
protein is present in a sample, the more tandem MS-spectra are collected for peptides
of the same protein [125]. In contrast, with label-based methods, mass spectrometry
can recognize mass differences between the labelled and unlabeled forms of a peptide
and quantification is achieved by comparing their respective signal intensities [125].
Quantification by spectral counting has several disadvantages. First, the spectrum
count response for every peptide is different since e.g. the chromatographic behaviour
(retention time, peak width) varies. Furthermore, at higher spectral counts, saturation
effects will occur which are different for every peptide [125]. In addition, measurement
accuracy of the mass spectrometer varies prone to measurement errors.
Nevertheless, the correlation between amount of protein and number of tandem mass
spectra yields reliable results and quantification by spectral counting is applied
routinely in proteomics [126].
4.2.2 Evaluation of proteomics data by immunofluorescence staining and
Western blot revealed contradicting results
In the present study, proteomics data of isolated control and TDM bead phagosomes
were evaluated by IF-staining and Western blot. For Western blot experiments, the
isolation and purification protocol did not include sorting by FACS. We excluded this

Discussion
101
purification step, because protein concentration of samples (107 bead phagosomes)
after sorting by FACS was below the Western blot detection limit.
Evaluation of proteomics data by IF-staining and Western blot, gave very different
results. While Western blot experiments confirmed proteomics data, i.e. enrichment of
candidate proteins in TDM bead phagosomes, the respective proteins could not be
detected on bead phagosomes by IF-staining. These results may be due to the
epitopes of the antigens recognized by the antibodies in their native (IF-staining)
versus linearized (Western blot) form. However, the staining pattern of all candidate
proteins in macrophages resembled that shown in previous reports of those
antibodies. Another possibility, the antigens could be present in a different
conformation at phagosomes compared to other compartments.

Discussion
102
4.3 TDM induced changes on the bead phagosome proteome
A “proteome” is described as the complement of proteins in a sample as e.g. isolated
phagosomes. Up to date, searching “phagosome” and “proteome” on pubmed.com
revealed 68 hits. Probably one third of these results covered LBP studies, the gold
standard to study phagocytosis and phagosome maturation. Only one third dealt with
PCV-proteomes. Searching “Mycobacterium tuberculosis”, “phagosome” and
“proteome” only gave 5 results. Although analysis of isolated mycobacterial
phagosomes is reported several times, only 3 studies presented whole proteomes of
Mycobacteria containing phagosomes.
Mycobacterial phagosomes have been characterized before by various approaches
[119], [131], [132]. Due to the fact that Mycobacteria maintain early endosomal
characteristics, they acquire proteins of the early and intermediate phagosomes stage
such as the transferrin receptor (TfR), Rab5, EEA1, synthaxin4, synthaxin6 and
VAMP3 and carry limited amounts of v-H+-ATPase, lysosomal hydrolases including
cathepsinD, LAMP1/2 and Rab7 [129]–[131]. In a previous study with TDM beads, IF-
staining and Western blot experiments confirmed retention of TfR and exclusion of
LAMP1 and mature cathepsinD [91].
Our proteomics data corroborate that TfR and VAMP3 are enriched on TDM bead
phagosomes compared to controls (# 303, 166, Table 0-1). Rab5a and Rab5c were
equally distributed in both samples (# 208, 456, Table 0-1). Syntaxin4 was only found
in the TDM sample (#128, Table 0-1). In contrast, syntaxin6, EEA1 and LAMP2 were
not detected. In both samples, the v-H+-ATPase was one of the most abundant
proteins since plenty subunits were identified (# 16, 200, 262, 380, 389, 416, 426, 445-
447, 837, 1020, Table 0-1). Nevertheless, lower abundance of the v-H+-ATPase on
TDM bead phagosomes was not observed. In fact, many subunits were accumulated
in TDM samples. Levels of LAMP1 were almost similar in both samples with a trend to
lower amounts in TDM samples (# 612, Table 0-1). In contrast, Rab7a was strongly
accumulated at TDM bead phagosomes compared to controls (#233, Table 0-1).
These data indicate that TDM bead phagosomes share characteristics with M.
tuberculosis phagosomes but differ regarding other ones.
In the present study, 843 proteins were identified in TDM bead phagosomes.
Proteomic analysis of BCG containing phagosomes from the human monocyte cell line
THP-1 identified 447 proteins [127]. Similar to our results, proteins from several

Discussion
103
categories were identified. Table 4-1 provides a coarse overview about proteins
identified in BCG versus TDM bead phagosomes:
Table 4-1: Comparison of proteins identified in BCG versus TDM bead phagosomes. Modified from [127]. The left column provides a coarse overview of proteins identified in BCG phagosomes. The right column lists proteins identified in BCG phagosomes that were present in TDM phagosomes as well. Underlined proteins were exclusively present in BCG compared to latex bead phagosomes.
BCG phagosome proteome TDM bead phagosome proteome
Endosomal/lysosomal proteins:
CD63, LAMP1, LAMP2, lysosomal membrane protein 2, subunit B of v-ATPase, cathepsin D, cathepsin Z, palmitoyl-protein thioesterase, lysosomal acid phosphatase, N-acetylglucosamine-6-sulfatase, lysosomal α-glucosidase, acid ceramidase, prosaposin, M6PR, Golgi apparatus protein 1, mannosidase-2
LAMP1, subunit B of v-ATPase, cathepsin D cathepsin Z, palmitoyl-protein thioesterase, acid ceramidase, M6PR, mannosidase-2
Multivesicular body and exosome pathway:
Alix, CHMP4 integrin β1/2 / α-5, CD63, Rap-1B/1A, Rab7, annexins A2, A4, A5, Hsc70, Hsp90, actin, cofilin, tubulin, tubulin α-1C chain / β-chain, moesin, pyruvate kinase, enolase, elongation factor 1-α/14-3-3, stress-induced-phosphoprotein 1, charged multivesicular body protein 4b, septin-7, sec22b
Alix, CHMP4 integrin β1/2 / α-5, Rap-1B/1A, Rab7, annexins A2, A4, A5, actin, cofilin, tubulin, moesin, enolase, elongation factor 1-α/14-3-3, septin-7, stress-induced-phosphoprotein 1
Lipid raft proteins:
flotilin1, stomatin, erlin2
stomatin
Signaling proteins:
CD44, ADP-ribosylation factor (Arf)-like protein 8b/8a, brain acid-soluble protein 1, heterotrimeric G-proteins GNAI2, GNAI3, GNB1, GNG5, GNG12, IQGAP1, 14-3-3 family proteins β/α, ε,η,γ, ζ/δ and θ, CAP1, very long-chain-specific acyl-CoA dehydrogenase, ADP/ATP translocase 2, guanine nucleotide-binding protein Gi/Gs/Gt subunit β-1, platelet endothelial cell adhesion molecule
CD44, brain acid-soluble protein 1, 14-3-3 family proteins β/α, ε,η,γ, ζ/δ and θ, CAP1, platelet endothelial cell adhesion molecule

Discussion
104
Rab and Rab-related proteins:
Rab7a, Rab11a, Rab11b, Rab1a, Rab1b Rab6a, Rab21, Rab14, RalB, RalA, Rap1A/1B, GDI, Ras GTPase-activating-like protein IQGAP1
Rab7a, Rab11A, Rab21, Rab14, Rab6a
Secreted proteins:
Apolipoprotein D/E, complement factors C3/C9, retinoid-inducible serine carboxy-peptidase
retinoid-inducible serine carboxy-peptidase
Proteins of unknown function:
Fam3C, tumor protein D54, VAT1, transmembrane emp24 domain-containing protein 9
Fam3C, tumor protein D54
Others:
glutamate dehydrogenase 1, nucleobindin-1, vacuolar proton pump subunit C1, 60 S ribosomal protein L35, 60 S ribosomal protein L8, macrophage migration-inhibitory factor, translocon-associated protein subunit α, band 4.1-like protein 3, intracellular adhesion molecule 1
vacuolar proton pump subunit C1, 60 S ribosomal protein L35, 60 S ribosomal protein L8, macrophage migration-inhibitory factor, translocon-associated protein subunit α, band 4.1-like protein 3, intracellular adhesion molecule 1
In the study by Lee et al., BCG phagosomes were further compared to LBPs to detect
BCG phagosome specific proteins revealing 32 exclusive proteins in BCG
phagosomes (underlined in Table 4-1). Of these, 17 were not present in TDM bead
phagosomes indicating specificity for BCG. Overall, comparison with our data revealed
a large overlap between the TDM and BCG phagosome proteomes.
In another study performed by Rao et al., proteomes of phagosomes with either M.
tuberculosis H37Rv, attenuated strain M. tuberculosis H37Ra or BCG were compared
in a systems biology approach [132]. Principal component analysis revealed that
proteins Hsd17b12, Rpl38, Rpl6, nicastrin, Rab11b, Gnb1, Rps3a, Cdc42 and
C230096C10Rik were specifically enriched in M. tuberculosis H37Rv phagosomes. Of
these, only Hsd17b12 and Gnb1 were found in TDM bead preparations indicating
exclusive enrichment in phagosomes containing viable M. tuberculosis. In contrast,
the of proteins Cct8, Asns, Nomo1, Ptcd3, Rpl26, Rpl11, Cyb5b and Rab5a enriched
in BCG phagosomes, only Ptcd3, Rpl26 and Rpl11 were absent in TDM bead samples.

Discussion
105
This comparison indicates that TDM bead phagosomes may share more
characteristics with phagosomes containing BCG than those with M. tuberculosis. Of
note, the whole phagosome proteome data of M. tuberculosis H37Rv and BCG were
not available for comparison to the scientific community.
In experiments similar to ours, Shui et al. coated latex-beads with ManLAM from M.
tuberculosis, PILAM (phosphoinositol-capped LAM) from M. smegmatis as well as LPS
from E.coli [133]. All three bead types were fed to RAW264.7 macrophages and the
membrane fraction of bead phagosomes was isolated and analyzed in an iTRAQ-
labelled approach by mass spectrometry. 823 proteins were identified in total and 42
proteins were significantly up- or down-regulated (p > 1.25-fold, p < 0.05-fold) by
exposure of macrophages to ManLAM but not the other two lipoglycan beads:
Table 4-2: Comparison of proteins identified in ManLAM versus TDM bead phagosomes. Modified from [133]. The left column provides the list of proteins up- and down-regulated in ManLAM bead phagosomes compared to controls. The right column lists proteins identified in ManLAM bead that were present in TDM bead phagosomes as well.
ManLAM-specific phagosome proteome
TDM bead phagosome proteome
up-regulated:
transferrin receptor protein 1 vacuolar protein sorting-associated
protein 41 homologue Rab-5A Rab-5C Rab-14 isoform 1 of sequestosome-1 isoform 2 of sequestosome-1 ferritin H subunit calnexin heat-shock protein 90B1 tripeptidyl-peptidase 1 N-acetylglucosamine-6-sulfatase D-3-phosphoglycerate dehydrogenase alpha-N-acetylglucosaminidase vimentin titin 24 kDa protein Ddost
transferrin receptor protein 1 Rab-5A Rab-5C Rab-14 Calnexin tripeptidyl-peptidase 1 D-3-phosphoglycerate dehydrogenase alpha-N-acetylglucosaminidase Ddost
down-regulated:
mannose-6-phosphate receptor CD63 scavenger receptor class B member 2 lysosomal membrane glycoprotein 1 lysosomal membrane glycoprotein 2 transmembrane protein 55A
mannose-6-phosphate receptor lysosomal membrane glycoprotein 1 transmembrane protein 55A

Discussion
106
early endosome antigen 1 vesicle transport through interaction with
t-SNAREs homologue 1B Rab-7A Rab-7B immune regulator 1, ATPase, H+
transporting ATPase, H+ transporting, lysosomal V0
subunit a vacuolar ATP synthase subunit B vacuolar ATP synthase subunit E1 vacuolar ATP synthase subunit S1 vacuolar ATP synthase subunit C vacuolar ATP synthase subunit F vacuolar ATP synthase subunit d vacuolar ATP synthase catalytic subunit
A isoform 1 of reticulon-4 cathepsin Z lysosomal acid phosphatase collectin subfamily member 12 zinc finger, FYVE domain containing 26
vesicle transport through interaction with
t-SNAREs homologue 1B Rab-7A ATPase, H+ transporting, lysosomal V0
subunit a vacuolar ATP synthase subunit B vacuolar ATP synthase subunit d isoform 1 of Reticulon-4 cathepsin Z
Of the 18 proteins up-regulated in ManLAM bead phagosomes, 9 were present in TDM
bead phagosomes and of these the TfR1, Rab14, calnexin and the tripeptidyl-
peptidase 1 were also within the group of proteins enriched in TDM bead phagosomes.
Of the 24 proteins down-regulated in ManLAM bead phagosomes, 9 were present in
TDM samples and similarly, LAMP1 and the v-type ATPase subunit b were decreased
compared to controls. This comparison indicates that phagosomal proteomes of
ManLAM and TDM beads share certain proteins. However, proteins identified in both
samples were differently regulated.
To summarize, most of the early/intermediate phagosomal marker proteins found on
mycobacterial phagosomes were also found enriched in TDM bead phagosomes
compared to controls. Similarly, late phagosomal marker proteins were absent or
decreased on TDM bead phagosomes compared to controls. In addition, comparison
with phagosomes from BCG, M. tuberculosis and ManLAM coated LBs, revealed an
overlap of proteins also identified in TDM bead phagosomes. These results further
validate the purification method applied as suitable to achieve sufficiently pure bead
phagosomes from macrophages.
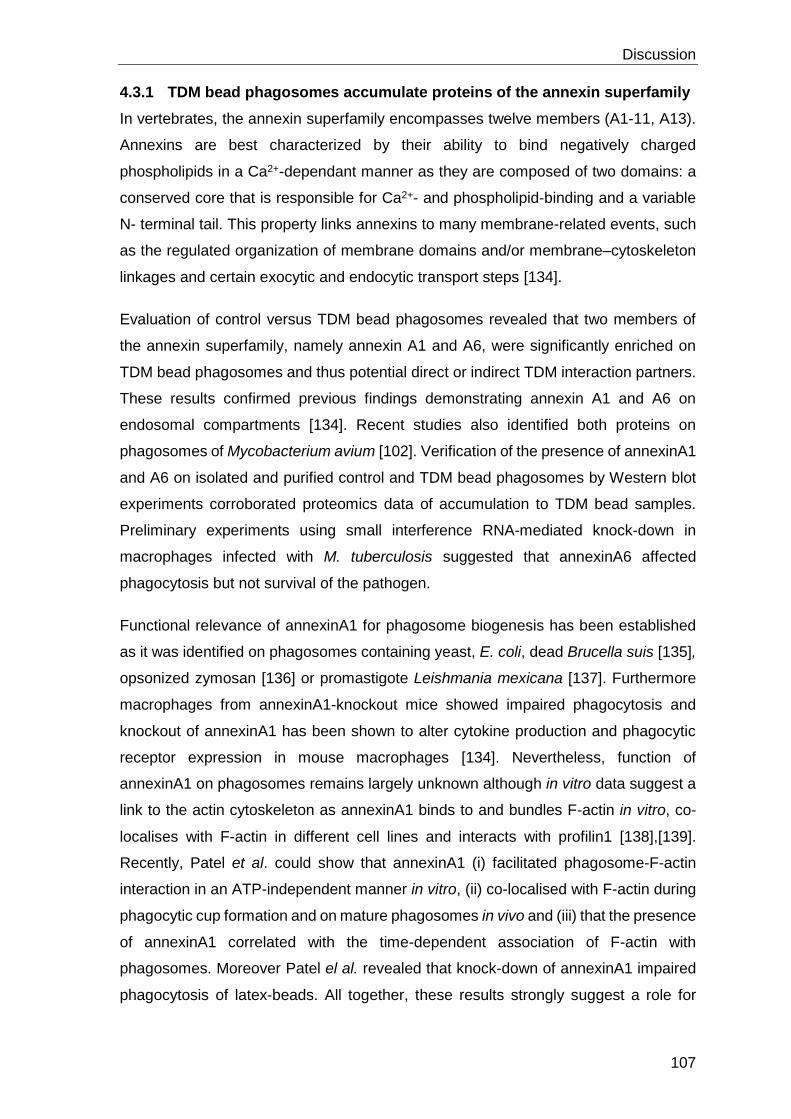
Discussion
107
4.3.1 TDM bead phagosomes accumulate proteins of the annexin superfamily
In vertebrates, the annexin superfamily encompasses twelve members (A1-11, A13).
Annexins are best characterized by their ability to bind negatively charged
phospholipids in a Ca2+-dependant manner as they are composed of two domains: a
conserved core that is responsible for Ca2+- and phospholipid-binding and a variable
N- terminal tail. This property links annexins to many membrane-related events, such
as the regulated organization of membrane domains and/or membrane–cytoskeleton
linkages and certain exocytic and endocytic transport steps [134].
Evaluation of control versus TDM bead phagosomes revealed that two members of
the annexin superfamily, namely annexin A1 and A6, were significantly enriched on
TDM bead phagosomes and thus potential direct or indirect TDM interaction partners.
These results confirmed previous findings demonstrating annexin A1 and A6 on
endosomal compartments [134]. Recent studies also identified both proteins on
phagosomes of Mycobacterium avium [102]. Verification of the presence of annexinA1
and A6 on isolated and purified control and TDM bead phagosomes by Western blot
experiments corroborated proteomics data of accumulation to TDM bead samples.
Preliminary experiments using small interference RNA-mediated knock-down in
macrophages infected with M. tuberculosis suggested that annexinA6 affected
phagocytosis but not survival of the pathogen.
Functional relevance of annexinA1 for phagosome biogenesis has been established
as it was identified on phagosomes containing yeast, E. coli, dead Brucella suis [135],
opsonized zymosan [136] or promastigote Leishmania mexicana [137]. Furthermore
macrophages from annexinA1-knockout mice showed impaired phagocytosis and
knockout of annexinA1 has been shown to alter cytokine production and phagocytic
receptor expression in mouse macrophages [134]. Nevertheless, function of
annexinA1 on phagosomes remains largely unknown although in vitro data suggest a
link to the actin cytoskeleton as annexinA1 binds to and bundles F-actin in vitro, co-
localises with F-actin in different cell lines and interacts with profilin1 [138],[139].
Recently, Patel et al. could show that annexinA1 (i) facilitated phagosome-F-actin
interaction in an ATP-independent manner in vitro, (ii) co-localised with F-actin during
phagocytic cup formation and on mature phagosomes in vivo and (iii) that the presence
of annexinA1 correlated with the time-dependent association of F-actin with
phagosomes. Moreover Patel el al. revealed that knock-down of annexinA1 impaired
phagocytosis of latex-beads. All together, these results strongly suggest a role for

Discussion
108
annexinA1 in controlling association of actin with phagosomes during phagocytosis
but also during phagosome biogenesis.
Association of annexinA6 to phagosomes was initially demonstrated for latex bead
phagosomes by Desjardins and co-workers in 1994 [140]. In the following years,
annexinA6 was detected on early and late endosomal membranes as well [134]. In
contrast to other annexins, annexinA6 has two core-modules and thus allows the
molecule to bind to either 1 membrane or 2 separate ones. AnnexinA6 binds negative
charged phospholipids such as PS, PI, PA, PE and arachidonic acid in a Ca2+-
dependent manner [141]. Moreover annexinA6 was revealed to bind cholesterol in the
absence of Ca2+ [141]. Mass spectrometry analysis of the lipid composition of bead
phagosome membranes revealed that PS and cholesterol were accumulated in TDM
bead phagosomes compared to controls (see below). As PS and cholesterol are
preferred binding partners of annexinA6, both lipids may have contributed to
enrichment of annexinA6 to TDM bead phagosomes [142].
AnnexinA6 was described to modulate intracellular cholesterol homeostasis, as its up-
regulation resulted in cholesterol accumulation in late endosomes and consequently
inhibited cholesterol export to the Golgi apparatus and plasma membrane [141].
Similar to annexinA1, A6 was also demonstrated to regulate membrane-actin
interactions during endo- and exocytosis [141]. Enrich et al. recently demonstrated that
membrane localization of annexinA6 caused a rearrangement of F-actin at the plasma
membrane stabilizing the cortical actin cytoskeleton. Besides, interacting with F-actin,
annexinA6 was identified as a binding partner of spectrin. Furthermore, annexinA6
regulating receptor-mediated endocytosis via spectrin was proposed to be involved in
the internalization of LDL (low density lipoprotein) [143].
Enrichment of both annexins to TDM bead phagosomes could simply reflect their early
phagosomal stage as annexinA1 and A6 were shown to be important for actin
assembly during phagocytosis or receptor-mediated endocytosis, respectively. On the
other hand, due to their preferential binding to lipids such as PS and cholesterol
accumulated to TDM phagosomes, annexinA1 and A6 could be attracted by TDM via
phagosomal membrane lipids to function as actin nucleation-promoting-factors (NPFs)
or to attract additional NPFs. This may promote formation of actin rims, which can limit
phagosome maturation (Figure 3.17). The latter hypothesis is further supported by the
partially overlapping intracellular localization of annexinA1 and profilin1 and annexinA6
and spectrin [139], [141]. Both, profilin1 and spectrin are known to regulate actin

Discussion
109
nucleation. One could speculate that the annexinA1-profilin and annexinA6-spectrin
interaction participates in regulating the membrane-associated actin cytoskeleton
[143]. However, further evaluations of these protein interactions are required.
4.3.2 TDM bead phagosomes accumulate proteins involved in vesicle fusion
M. tuberculosis is an intracellular pathogen that interferes with phagosome maturation
and fusion with lysosomes. Thus proteins mediating phagosome-endosome or -
lysosome fusion termed SNARE-proteins, represent promising targets for
manipulation and intracellular bacteria have been suggested to interfere with
expression or function of these proteins in order to secure survival inside host-cells.
However, little is known about SNARE proteins in the process of phagocytosis and
phagosome maturation.
As outlined, vesicle fusion is executed by soluble SNARE (N-ethylmaleimide-sensitive
factor attachment protein receptor) proteins. These membrane-anchoring proteins
localize to and function in diverse endomembrane systems in which docking and fusion
between membranes takes place [144]. The SNARE superfamily comprises 36
members in humans with 2 subgroups: The syntaxin and SNAP25 families contain a
conserved glutamine (Q) residue at a central position of the SNARE motif and are
therefore called Qa- and Qbc-SNAREs, respectively. Members of the vesicle-
associated membrane protein (VAMP) family contain a conserved arginine (R) residue
at the same position and are therefore called R-SNAREs [145]. For vesicle fusion,
several Q-SNAREs at target membranes have to assemble and form an acceptor
complex. Acceptor complexes then interact with the vesicular R-SNAREs mediating
vesicle fusion.
Our mass spectrometry results revealed that TDM bead phagosomes accumulate the
Q-SNARE SNAP23 and the R-SNARE VAMP3. Verification of proteomic data by
Western Blot confirmed enrichment of SNARE proteins to TDM bead phagosomes
However, preliminary depletion experiments of VAMP3 by siRNA in macrophages and
subsequent infection with M. tuberculosis suggested that VAMP3 is involved in
phagocytic processes rather than survival of the pathogen.
SNAP23 is a Qbc-SNARE protein located at the plasma membrane and recycling
endomembranes. Together with Syntaxin4, SNAP23 mediates fusion of recycling
endosome membranes bearing VAMP3 with the plasma membrane at the point of
phagocytic-cup formation [146]. However, little is known about its involvement in
membrane fusion with intracellular vesicles during and after phagocytosis. Recently,

Discussion
110
Sakurai et al. could show that overexpression of SNAP23 in macrophages promoted
phago-lysosome fusion indicating a role for SNAP23 in phagosome maturation [104].
SiRNA-mediated reduction of SNAP23 reduced the number of phagocytic events and
delayed phagosome maturation. Furthermore, VAMP7 was identified as cognate R-
SNARE of SNAP23. Taken together, these results revealed that SNAP23 is involved
in phagosome formation and maturation by forming several different SNARE
complexes at the plasma and/or phagosomal membranes.
The R-SNARE VAMP3, also termed cellubrevin, localizes to early and recycling
endosomes and promotes exocytosis of proinflammatory cytokines at the phagocytic
cup when docking to its cognate Q-SNARE, syntaxin-4 and SNAP23 at the plasma
membrane [147]. VAMP3-mediated fusion of vesicles near phagocytic cups has been
revealed to facilitate growth of pseudopods during phagocytosis [148]. However,
BMDM from VAMP3 KO mice revealed that VAMP3 is not essential for phagocytosis
of latex beads but only decelerates phagocytosis through mannose- and β-glucan
receptors [149]. In contrast, our results suggested that cells lacking VAMP3 take up
more M. tuberculosis bacteria as controls whereas survival of M. tuberculosis was not
altered upon VAMP3 depletion. This is in agreement with results from Castañeda-
Ramírez et al. showing that depletion of VAMP3 did not alter survival of Brucella in
J774.A1 macrophages [147]. Furthermore, Fratti et al. demonstrated that phagosomes
of M. tuberculosis and latex-beads acquire VAMP3 over time but only M. tuberculosis
specifically cleaved and thereby inactivated VAMP3 suggesting VAMP3 as target for
Mycobacteria [150].
On the one hand, enrichment of SNAP23 and VAMP3 to TDM bead phagosomes could
simply reflect the early maturation stage of bead phagosomes since both proteins are
present in the plasma membrane from which early phagosomal membranes derive.
On the other hand, inactivation and consequently, retention of SNAP23 and VAMP3
via TDM could prevent mycobacterial vesicles from fusion with early endosomes.
Additional experiments have to be performed in order to confirm these hypotheses.

Discussion
111
4.4 The actin cytoskeleton is involved in M. tuberculosis-
mediated inhibition of phagosome maturation
In the cytoplasm, actin exists in two states, the monomeric (G-actin) and the
filamentous (F-actin). In a process termed actin treadmilling, several G-actin proteins
bind ATP and initiate the nucleation process. At the growing end, termed barbed ends
(+), ATP-bound G-actin monomers nucleate to form filamentous actin. At the pointed
end (-), filamentous actin depolymerises as G-actin monomers hydrolyse ATP and
dissociate.
However, spontaneous nucleation of actin filaments is relatively inefficient. Thus, cells
actively regulate de novo assembly and disassembly of actin filaments as well as their
organisation into functional higher networks with the help of actin-binding-proteins
(ABPs). Generally, ABPs are polypeptides, which in response to signalling cues
undergo conformational changes, and further transmit these signals to downstream
cytoskeletal partners and membranes [151]. Formins and tandem W domain-based
filament nucleators can nucleate F-actin de novo while NPFs-Arp2/3 complexes
mediate branched actin network formation from F-actin mother filaments. Several
NPFs are known that interact with Arp2/3: WASP family verprolin-homologous protein
(WAVE), Wiskott–Aldrich syndrome protein (WASP), neural WASP (NWASP), WASP
and SCAR homologue (WASH), junction-mediating and regulatory protein (JMY) and
cortactin [152]. Regulated by the Rho-family GTPase Rac, WAVE-Arp2/3 complexes
drive branched actin filament formation at lamellipodial protrusions. WASP/NWASP-
Arp2/3 complexes function under the control of Cdc42 for the formation of branched
actin filaments for phagocytosis, endocytosis and exocytosis, adhesion and podosome
formation and trafficking within and from the Golgi apparatus [153]. WASH is a recently
discovered NPF that has been found on endosomes, where it stimulates ARP2/3
activity and controls endosomal sorting [154]. WASH is part of a ~500 kDa complex
(termed WASH complex) with FAM21, SWIP (strumpellin- and WASH-interacting
protein; also known as KIAA1033), strumpellin and CCDC53 (coiled-coil domain-
containing protein 53) and contributes to cargo sorting and scission of transport
intermediates destined for most endosomal routes [152]. Recently, Fam21 was
discovered to link the WASH-complex to endosomes by binding VPS35 of the retromer
complex [155].

Discussion
112
4.4.1 β-actin accumulates on TDM bead and M. tuberculosis phagosomes
Our proteomics data showed that in control and TDM bead phagosomes, actin was
one of the most abundant proteins. Thus, we investigated the localization of actin in
bead infected macrophages and observed that TDM bead phagosomes accumulated
actin rims 30 minutes post infection in RAW264.7 macrophages. In contrast, control
beads were devoid of actin. Quantification revealed that circa 12 % of TDM bead
phagosomes were positive for actin but less than 1 % of control beads.
Isolated latex-bead phagosomes (LPBs) have been described before to initiate actin
assembly in vitro in the presence of ATP and cytosol. Moreover LBPs were revealed
to accumulate actin in vivo [156]–[159]. In the latter studies, actin was localized to latex
beads in a similar pattern to TDM bead phagosomes. In contrast to our findings, actin
accumulation was strongest on late-maturation stage LBPs (1-24 hpi) and suggested
to have a role in fusion of late endosomes to phagosomes and actin-based motility. In
contrast, Lerm et al. suggested that actin depolymerization is important for phagosome
maturation of IgG-opsonized yeast in neutrophils [160]. The discrepancies may be due
to the different experimental systems used. The process of phagocytosis and
phagosome maturation and the underlying cellular processes highly depend on the
phagocytic particle studied. The particles used in these studies were latex beads or
IgG-opsonized particles, which may bind to different receptors than BSA or TDM
beads resulting in different phagocytosis and phagosome biogenesis processes.
In addition to TDM bead, we also revealed that phagosomes of M. tuberculosis
accumulated actin, although in a rather punctate pattern. Several intracellular
pathogens enrich actin to their phagosomes to establish and maintain an intracellular
niche [164], [165]. Internalized Salmonella reside in F- actin-coated phagosomes,
thereby escaping elimination by macrophages [163]. Moreover, the intracellular
parasite Leishmania donovani secures its intracellular survival by forming a coat of F-
actin in a Cdc42- and Rac1-dependent manner [164]. Furthermore, in the
Dictyostelium discoideum model system, phagosomes with M. marinum were entirely
associated with actin whereas in mammalian BV2 macrophages, actin appeared as a
punctual pattern resembling our findings [103]. Therefore, M. marinum recruits WASP
to its phagosomal membrane. In addition, recently the gene product Rv1626 of M.
tuberculosis was shown to interact with Arp2/3 [165]–[167].
Thus, the established default ability of phagosomes to nucleate actin, the well
established strategy of actin nucleation by several pathogens to evade phagosome
maturation and the accumulation of actin on TDM bead and M. tuberculosis

Discussion
113
phagosomes indicates that M. tuberculosis uses the default actin accumulation of
premature phagosomes trough TDM.
4.4.2 Removal of β-actin drives M. tuberculosis into a functional phago-
lysosome
To analyze the function of actin accumulation at M. tuberculosis phagosomes for
mycobacterial survival inside macrophages, actin was removed using Latrunkulin A,
which promoted maturation of M. tuberculosis phagosomes. At later infection stages,
LatA treatment had no effect, suggesting that the mycobacterial compartment
undergoes a phase, in which accumulation of F-actin is essential for phagosomal
arrest. This is in contrast to other studies showing that only mature phagosomes and
late endosomes nucleate actin in order to facilitate fusion with lysosomes [158], [159].
However our results are in accordance with studies reporting nucleation of actin by
immature phagosomes [157], [168]. Liebl & Griffiths concluded that actin accumulation
on immature phagosomes forms a fusion barrier to block fusion with vesicles
promoting maturation whereas Guérin et al. suggested that actin is required for fusion
with early endosomes. Our results confirm the hypothesis of Liebl & Griffith since
removal of actin with Latrunkulin A resulted in phagosome maturation and concurrent
reduced survival of M. tuberculosis macrophages.
We therefore conclude that F-actin nucleation on the mycobacterial phagosome is
distinctly regulated over the course of infection: Actin polymerization at early time
points is required for blocking fusion with endosomes but is suppressed at later stages
to block fusion of the established niche, competent for mycobacterial replication, with
lysosomes. This is an evolutionary conserved mechanism used by M. tuberculosis and
M. marinum in both mammalian macrophages and the social amoeba Dictyostelium
discoideum [103].
4.4.3 Proteins regulating actin treadmilling are important for survival of M.
tuberculosis in macrophages but not the WASH-complex
Phagosomal membranes carry all the machinery sufficient to assemble F-actin de
novo by the activity of actin-binding peripheral membrane proteins [140], [169]. Up to
date, several actin-binding-proteins were identified on phagosomes: annexins, talin,
vinculin, α-actinin, myosins, MARKS (myristoylated, alanine-rich C-kinase substrate),
profiling, TACO/coronin1 and Arp2/3 [169]. However, most of these proteins were only
described to be present on isolated LBPs and not further analyzed for their role in actin
assembly during phagosome maturation. As an exception, ezrin/moesin was shown to

Discussion
114
mediate de novo actin assembly on LPBs [156]. Furthermore, TACO/coronin1 was
dispensable for F-actin dependent processes, but essential for the inhibition of M.
tuberculosis and M. bovis BCG phagosome maturation [170], [171]. All mentioned
ABPs except for vinculin and MARKS were identified in our bead phagosomes with
profilin1, cofilin1 and annexins A1 and A6 up-regulated in TDM bead phagosomes.
Our mass spectrometry analysis showed that profilin1 and cofilin1 were threefold
accumulated on TDM bead phagosomes compared to controls as corroborated by
Western blot.
In a process called actin treadmilling, G-actin binds ATP and assembles to F-actin.
ATP hydrolysis of G-actin leads to de-polymerization of the existing filament at the
pointed end. Actin treadmilling is assisted by cytoplasmic G-actin binding proteins
cofilin and profilin. Profilin interacts with actin nucleators and accelerates ADP to ATP
exchange to promote incorporation of ATP-bound G-actin to an existing microfilament.
Cofilin accelerates dissociation of ADP-bound G-actin from pointed ends. Thus the
main function of both proteins is to regulate the dynamics of actin inside the cytoplasm
by promoting actin polymerization and depolymerisation, respectively. Although their
function in phagocytosis is established, their role in actin polymerization for
endosomal-phagosomal trafficking is only beginning to become clearer. Experiments
revealed that cofilin together with the WASP-Arp2/3-complex, has a role in
phagocytosis of Candida albicans by neutrophils [172]. Similarly, profilin is required for
Fc-receptor mediated phagocytosis [173]. Recently, cofilin was shown to participate in
actin depolymerisation hindering fusion of Legionella phagosomes with lysosomes in
a caspase regulated manner [174]. In addition, profilin and cofilin were demonstrated
to be essential for actin coat formation at LBPs in the D. discoideum model system
[175]. Bielig et al. lately suggested a link between bacterial induced changes in actin
dynamics and the intracellular receptor NOD1 via the cofilin phosphatase SSH1 [176].
Accumulation of profilin1 and cofilin1 indicates that actin is actively assembled and
disassembled on TDM bead phagosomes. The fact that both proteins are enriched on
TDM bead phagosomes further suggests that levels of actin are maintained. This is in
accordance with the presence of actin found on phagosomes of TDM bead and M.
tuberculosis. Depolymerisation of actin with LatrunkulinA and knock-down of profilin1
and cofilin1 resulted in debased survival of M. tuberculosis in macrophages. This
suggests that F-actin assembly is important for M. tuberculosis to establish and
maintain a proliferative niche in macrophages. However, knock-down of WASH1 did
not inhibit survival of M. tuberculosis. This suggests that actin polymerization at the

Discussion
115
mycobacterial phagosome uses other actin-nucleators to establish the protective actin-
coat. These results are in contrast with previous finings in M. marinum infected D.
discoideum amoeba [103]. In wash-/- amoeba, vacuoles of M. marinum were
significantly more associated with the v-H+-ATPase and thus more mature than in WT
amoeba [103]. These conflicting results may be due to the fact that knock-down of
WASH1 did not completely remove WASH1 from RAW264.7 macrophages.
Remaining WASH1 might have been sufficient to establish the protective actin-coat.
Moreover, the WASH-complex might be active even in the absence of WASH1. Since
in addition to WASH, other ABPs such as annexinA1 and annexinA6 were found at
TDM bead phagosomes, these actin-nucleators might be sufficient to establish actin
coats at M. tuberculosis phagosomes.

Discussion
116
4.5 TDM-mediated inhibition of phagosome maturation changes
the lipid composition of bead phagosomes
Phospholipids, glycolipids and cholesterol are membrane lipids that constitute the
plasma membrane, compartmentalize cells and coordinate signaling, targeting and
trafficking events in the course of phagosome generation and maturation. Certain lipid-
species are required both, as substrates for and as activators of enzymes responsible
for the generation of important second messengers [177]. Lastly, specific lipid head-
groups recruit proteins possessing lipid-binding domains and/or confer curvature and
charge to the membrane surface, promoting electrostatic attraction and retention of
proteins [177]. However, lipids have long been neglected players in phagosome
biology. Thus their role in phagocytosis and phagosome maturation is only beginning
to be understood. So far, the best studied and probably most important function of
lipids is coordination of recruitment and retention of key proteins for phagocytosis.
Shortly after nascent phagosome formation, the phagocytic membrane resembles the
plasma membrane. But maturation entails further changes in the lipid composition of
the phagosomal membrane, raising the possibility of additional fluctuations in surface
charge and consequently, protein targeting [177].
In the present work, the lipid composition of control bead phagosomes was compared
to TDM bead phagosomes in order to reveal TDM-mediated changes in the bead
phagosome lipidome regarding twelve different lipid classes. To our knowledge this is
the first analysis of the lipid composition of bead phagosomes that covered more than
six different lipid classes.
In 1994, Desjardins and co-workers dissected the lipid-composition of early (2 hpi) and
late (24 hpi) LBPs [178]. They described SM, PC, PS, PI, PE and LBPA. Early LBPs
contained less SM and PE and more PC than late LPBs. These differences were not
confirmed by our results using control and TDM beads. The amounts of SM, PE and
PC were similar in control and TDM bead phagosomes. In contrast, to the work of
Desjardins et al. showing unchanged PS and LBPA levels, our analyses revealed that
PS was accumulated in TDM whereas LBPA was reduced compared to control bead
phagosomes. In addition cholesterol, which was not analyzed in the former study, was
accumulated in TDM bead phagosomes. Analysis on the lipid-species level confirmed
these results but further revealed up-regulation of certain ceramide and
sphingomyeline species in TDM bead phagosomes compared to controls.

Discussion
117
Based on our proteomic analysis of control and TDM bead phagosomes and previous
studies using the same model, we assume that, due to TDM inhibitory effects, TDM
are less mature than control bead phagosomes [91]. However, it is questionable
whether both experiments can be compared since Desjardins et al. determined 2 hpi
and 24 hpi as early or late time points, respectively. The time points analyzed in our
study are significantly different. In addition, Desjardins et al. used latex-beads which
may use different phagocytic receptors than BSA and TDM beads.
Of the three lipid classes accumulated in TDM bead phagosomes, cholesterol is best
described for its role in phagosome maturation. Together with shpingolipids and
several proteins, cholesterol forms so called lipid microdomains which are implicated
in signal transduction and membrane trafficking. Yet, the distribution of cholesterol in
maturing endosomes is not clear. The plasma membrane contains relatively high
amounts of cholesterol and glycosphingolipids [179]. Thus accumulation of cholesterol
in TDM bead phagosomes compared to controls may simply reflect their early
phagosomal stage maintaining plasma membrane-like composition. Other studies
suggested that lysosomes harbor little cholesterol while late endosomes are
cholesterol rich [177]. This hypothesis could be confirmed by our results as TDM bead
phagosomes harbored more cholesterol than control bead which are enriched for late
endosomal/lysosomal marker proteins. Further, accumulation of cholesterol was
shown to inhibit phago-lysosomal fusion but not fusion of early endosomes with
phagosomes [180]. The authors suggested that accumulation of cholesterol rendered
phagosomal membrane organization non-fusogenic by inactivation of important
fusion-mediating proteins such as Rab7. Thus accumulation of cholesterol to
phagosomes is favourable for pathogens to reside in early phagosomes in order to
survive within phagocytes. Our results confirm this hypothesis as TDM bead
phagosomes accumulating cholesterol are delayed in phago-lysosomal fusion.
The role of cholesterol in mycobacterial infection has been studied before: Cholesterol
is indispensable for uptake of Mycobacteria into phagocytes. Furthermore, cholesterol
is essential for maintaining the phagosome membrane closely apposed to the
mycobacterial surface and therefore for prevention of phagosome maturation [181]. In
this study, removal of cholesterol promoted phago-lysosome fusion and also
diminished lipid-domain containing sphingomyelins and binding of lipid-microdomain
interacting proteins. Cholesterol can also be used as carbon source as M. tuberculosis
was shown to harbour genes required for cholesterol intake and catabolism [182].

Discussion
118
Therefore, establishing a niche with access to cholesterol can promote intracellular
growth.
The fact that TDM bead phagosomes accumulated cholesterol indicates that TDM is
involved in reorganization of phagosomal membranes for the inhibition of phagosome
maturation. TDM may accumulate cholesterol because (i) it ensures a tight apposition
important for the pathogen to deliver virulence factors across the phagosomal
membrane (ii) cholesterol can attract cytosolic proteins as annexins that mediate
accumulation of actin to establish an actin coat inhibiting phagosome maturation, (iii)
cholesterol serves an important nutrient source or (iv) high levels of cholesterol change
the phagosomal membrane organization in order to avoid activation or recruitment of
phagosome maturation effector proteins.
About 15 % of total plasma membrane lipids in the inner leaflet are constituted by PS
species. In stark contrast, little PS is detectable in the outer leaflet of healthy cells
plasma membranes [177]. This asymmetric distribution is lost during apoptosis, and
flipping of PS to the outer surface serves to identify cells destined for efferocytosis and
degradation [177]. However, little is known about PS distribution, metabolism, and
function during the course of phagosome maturation [177]. The study of Desjardins
and co-workers suggested that amounts of PS remain relatively unchanged during in
the course of phagosome maturation [178]. In contrast, our results show that PS was
accumulated to TDM bead phagosomes compared to controls [183]. In studies by
Yeung et al., the amount of PS on sheep red-blood-cell phagosomes was suggested
to be maintained through fusion with endosomes and lysosomes. PS in early
phagosomes most probably derives from the plasma membrane. But the observation
that PS was still present after 1 hour post infection, indicated that PS is either
maintained in the phagosomal membrane or delivered to the phagosome during
maturation through fusion with endosomes from the recycling or late endocytic
pathway [183]. Consequently, phagosomes of intracellular pathogens as Legionella
and Chlamydia, interfering with phagosome maturation, were shown to be devoid of
PS [183]. However this was not the case for TDM bead phagosomes indicating that
these phagosomes might have access to the endocytic pathway further corroborated
by late endocytic marker proteins in the TDM bead phagosome proteome. Indeed
mycobacterial phagosomes have, although arrested at an early phagosomal state,
access to the endocytic pathway and an intense exchange with the plasma membrane
[115],[184]. Moreover, since PS is an anionic lipid, Yeung et al. also suggested that
PS serves to recruit cationic proteins such as Src kinases to endosomal/phagosomal

Discussion
119
membranes. Taken together, retention of PS may recruit or retain proteins involved in
controlling phagosome biogenesis.
Lysobisphosphatic acid (LBPA) is an unusual lipid found in high amounts in late
endosomes and intra-luminal-vesicles (ILVs) of multivesicular bodies but is not
detected elsewhere in the cell [185]. Though, it is frequently used as marker for
endosome/phagosome maturation. In late endosomes, LBPA makes up 15 mol % of
all total cellular phospholipids [179]. In control bead phagosomes we found 22 mol %
but only 14 mol % in TDM bead phagosomes. This indicates that TDM bead
phagosomes had less access to late endosomes than controls.
The main LBPA isoform detected in several cell lines was shown to be 2,2’-dioleoyl
LBPA [185]–[189]. Thus it may also be the major biologically active species. This was
confirmed by our results as LBPA 38:2 was revealed to be the most abundant lipid-
species found in bead phagosomes. LBPA has two identified protein interaction
partners: ALIX (also termed programmed cell death interacting protein 6, PDCD6IP)
and Hsp70 [190]. ALIX is recruited to endosomes via interactions with LBPA
suggesting that apart from ILVs, LBPA can be present on the cytoplasmic leaflet of
late endosomes/phagosomes. Our proteomic analysis identified 4 EUSC for PDCD6IP
and Hsp70 in TDM bead phagosomes and 2 EUSC of Hsp70 in control samples.
Interaction of 2,2’-dioleoyl LBPA with ALIX triggers ILVs formation within acidic
liposomes. However, the most important function of LBPA-ALIX interaction is
cholesterol homeostasis [191]. LBPA-ALIX interaction mediates the back-fusion of
cholesterol-rich ILV in late endosomes ensuring cholesterol homeostasis. In
conclusion, exclusion of LBPA may maintain cholesterol content of mycobacterial
phagosomes.

Discussion
120
4.6 Conclusion: TDM-mediated changes of the phagosomal
proteome and lipidome – potential interaction partners or
innocent bystanders?
Overall 1054 proteins and 12 different lipid classes with 312 different lipid species were
detected in control and TDM bead phagosomes. All proteins and lipids detected raise
the question whether their presence is a consequence of TDM-mediated manipulation
of phagosome maturation or if they are maturation stage specific and thus innocent
bystanders. However, the fact that certain proteins associate with the actin
cytoskeleton suggest a role for the actin cytoskeleton in TDM-mediated inhibition of
phagosome maturation.
At this point, one should consider distribution of TDM on beads. We assumed a rather
uniform distribution of TDM on BSA beads. Yet, experiments in artificial bilayers
suggested that TDM is organized in domains with unusual high compared to control
bilayers (Thomas Gutsmann, personal communication). Further one must account the
orientation of TDM regardless uniform or domain-like distribution on BSA beads. We
supposed that TDM binds to hydrophobic pockets of BSA via its mycolic acids so that
the trehalose moiety stacked out. Moreover, previous experiments revealed that TDM
is firmly attached to BSA beads [91]. Binding with both mycolic acids would allow the
trehalose-headgroup to interact with host-cell derived interaction partners (1, Figure
4.1). Nevertheless, binding with one mycolic acid but also detachment of TDM from
BSA cannot be totally excluded (2, 3 Figure 4.1). This would allow TDM to intercalate
to the phagosomal membrane.
We hypothesize that TDM may be responsible for the accumulation of actin around M.
tuberculosis phagosomes to establish inhibition of phagosome maturation. Regardless
orientation of TDM, phagosomal membrane lipids as cholesterol and PS might be
direct interaction partners of TDM. Retention of certain lipids may attract indirect
interaction partners as cytosolic proteins involved in actin accumulation (such as
annexins or cofilin1) to establish the protective actin coat. When intercalating into the
phagosomal membrane, TDM might also directly manipulate cytosolic actin-binding-
proteins and/or nucleation-promoting-factors. TDM inside phagosomal membranes
may also inactivate SNARE proteins responsible for membrane fusion events.
Moreover, retention of cholesterol itself might contribute to inhibition of phagosome

Discussion
121
maturation as accumulation of the lipid was shown to permit membrane fusion
processes [180].
Figure 4.1: Scheme of the potential function of TDM-mediated inhibition of phagosome maturation. TDM may (1) interact with host-cell proteins or lipids via its trehalose headgroup, (2) by intercalation of 1 mycolic acid with the phagosomal membrane or (3) by intercalation of the whole molecule to the phagosomal membrane. TDM may exert several mechanisms to inhibit phagosome maturation. TDM could influence the phagosomal membrane and retain phosphatidylserine (PS) and cholesterol (chol). PS and cholesterol are major binding partners for annexinA1 and annexinA6. Annexins then may induce actin nucleation at the phagosomal membrane by recruiting actin-binding-proteins and/or nucleation-promoting-factors as profilin1 (pfl1) to establish actin rims. Actin rims might inhibit fusion of the phagosome with multivesicular bodies (MVBs) and lysosomes. Furthermore TDM might retain cholesterol on the phagosomal membrane to inhibit fusion with MVBs and lysosomes because the lipid itself was shown to inhibit fusion processes. SNAREs SNAP23 and VAMP3 indicate the fusogenic properties of TDM bead phagosomes with early and intermediate endosomes but might also be manipulated and thus inactivated by TDM intercalating to the phagosomal membrane.

Discussion
122
4.7 Perspectives
In this PhD-thesis, a protocol for isolation and purification of magnetic lipid-coated
bead phagosomes was developed. Still, the protocol has its drawbacks. A critical step
is the trypsin digestion because it may remove potential TDM interaction partners from
the outer surface of the phagosomal membrane. Emphasis should be put on
development of another way to detach bead phagosomes from each other. In other
studies, bead phagosomes were freed by incubation with ATP that leads to
depolymerization of actin networks possibly gluing bead-phagosomes together.
Another critical step is the label-free approach for quantification of proteins. For the
future, macrophages should be metabolically labeled by stable-isotope-labeling-in-
cell-culture (SILAC) in order to establish a fully-quantitative method. Furthermore,
purification by FACS sorting should include IF-staining of bead phagosomes for
LAMP1 in order to sort bead phagosomes according to their maturation state in
addition to size.
Herein 34 proteins were discovered to be accumulated to TDM bead phagosomes
compared to controls. Of the latter, 6 were chosen for further analysis. An ongoing
attempt should be the analysis of remaining 27 proteins for their potential function in
TDM-mediated inhibition of phagosome maturation using IF-staining, Western blot and
siRNA knock-down/CFU experiments. Moreover, the siRNA knock-down/CFU
experiments shown herein were performed once. To further verify the results, the
experiment should be repeated at least three times, also for statistical reasons.
We could show actin accumulation on TDM bead and M. tuberculosis phagosomes
has a role in inhibition of phagosome maturation. SiRNA/CFU experiments suggested
that profilin1 and cofilin1 are important for survival of M. tuberculosis whereas WASH1,
annexinA6, SNAP23 and VAMP3 were not. Ongoing experiments must elucidate the
NPF of actin on phagosomes of TDM beads and M. tuberculosis. Potential candidates
are annexins as they are well known actin nucleators. Apart from analysing the survival
of M. tuberculosis in absence of candidate proteins, one must also check whether TDM
and the pathogen are still able to nucleate actin on their phagosomes and inhibit
phagosome maturation. This could be accomplished by siRNA knock-down and
subsequent IF-staining of phagosomes of TDM beads and M. tuberculosis by
lysotracker, LAMP1 and actin. The latter experiment is most important as it would

Discussion
123
directly show the link between the single virulence factor TDM and its interaction
partner.
Further experiments to evaluate the role of lipids in TDM-mediated inhibition of
phagosome maturation are difficult. In contrast to most proteins, depletion of lipids has
extensive impact on cell physiology. In addition, specific antibodies to certain lipids are
rare. However, ongoing experiments could include staining of TDM bead phagosome
membranes in macrophages using fluorescent dyes specific for cholesterol rich
domains. Moreover, for comparison with TDM bead phagosome samples, the lipid
composition of M. tuberculosis phagosomes should be analyzed.
To conclude, this thesis suggests that TDM inhibits phagosome maturation by
manipulating the cells actin cytoskeleton. However, experiments are required to further
corroborate this hypothesis. Moreover, this thesis provides several other interesting
TDM targets worth analyzing.

Literature
124
Literature
[1] H. J., “Mycobacterium ulcerans: an infection from Jurassic time?,” Lancet, no. 2, pp. 1015–6, 1984.
[2] H. U. Library, “CONTAGION, Historical Views of Disease and Epidemics, Tuberculosis in Europe and North Americs, 1800-1922.” [Online]. Available: http://ocptest.hul.harvard.edu/contagion/tuberculosis.html.
[3] R. Koch, “Die Ätiologie der Tuberkulose,” pp. 1–18, 1882.
[4] T. M. Daniel, “The history of tuberculosis.,” Respir. Med., vol. 100, no. 11, pp. 1862–70, Nov. 2006.
[5] Y. Zhang and W. W. Yew, “STATE OF THE ART Mechanisms of drug resistance in Mycobacterium tuberculosis,” vol. 13, no. 11, pp. 1320–1330, 2009.
[6] T. McKeown, R. G. Brown, and R. G. Record, “An interpretation of the modern rise of population in Europe.,” Popul. Stud. (NY)., vol. 26, no. 3, pp. 345–382, 1972.
[7] C. Lienhardt, P. Glaziou, M. Uplekar, K. Lönnroth, H. Getahun, and M. Raviglione, “Global tuberculosis control: lessons learnt and future prospects.,” Nat. Rev. Microbiol., vol. 10, no. 6, pp. 407–16, Jun. 2012.
[8] P. J. Dolin, M. C. Raviglione, and a Kochi, “Global tuberculosis incidence and mortality during 1990-2000.,” Bull. World Health Organ., vol. 72, no. 2, pp. 213–20, Jan. 1994.
[9] P. Graf, “Framework for effective tuberculosis control,” Tuber. Lung Dis., 1994.
[10] World Health Organization, “Global tuberculosis report 2013,” 2013.
[11] World Health Organization, “Global tuberculosis report 2014,” Geneva, 2014.
[12] M. G. Harisinghani, T. C. McLoud, J. A. Shepard, J. P. Ko, M. M. Shroff, and P. R. Mueller, “Tuberculosis from head to toe.,” Radiographics, vol. 20, no. 2, pp. 449–70; quiz 528–9, 532, Jan. .
[13] A. Koul, E. Arnoult, N. Lounis, J. Guillemont, and K. Andries, “The challenge of new drug discovery for tuberculosis.,” Nature, vol. 469, no. 7331, pp. 483–90, Jan. 2011.
[14] E. Vynnycky and P. E. Fine, “Lifetime risks, incubation period, and serial interval of tuberculosis.,” Am. J. Epidemiol., vol. 152, no. 3, pp. 247–63, Aug. 2000.

Literature
125
[15] C. Y. Jeon and M. B. Murray, “Diabetes mellitus increases the risk of active tuberculosis: a systematic review of 13 observational studies.,” PLoS Med., vol. 5, no. 7, p. e152, Jul. 2008.
[16] P. Brassard, A. Kezouh, and S. Suissa, “Antirheumatic drugs and the risk of tuberculosis.,” Clin. Infect. Dis., vol. 43, no. 6, pp. 717–22, Sep. 2006.
[17] V. Gajalakshmi, R. Peto, T. S. Kanaka, and P. Jha, “Smoking and mortality from tuberculosis and other diseases in India: retrospective study of 43000 adult male deaths and 35000 controls.,” Lancet, vol. 362, no. 9383, pp. 507–15, Aug. 2003.
[18] “Wiley: Handbook of Tuberculosis: Clinics, Diagnostics, Therapy, and Epidemiology - Stefan H. E. Kaufmann, Paul van Helden.” [Online]. Available: http://eu.wiley.com/WileyCDA/WileyTitle/productCd-3527318887.html. [Accessed: 18-Nov-2014].
[19] Robert Koch Institut, “RKI-Ratgeber für Ärzte - Tuberkulose,” 2014. [Online]. Available: http://www.rki.de/DE/Content/Infekt/EpidBull/Merkblaetter/Ratgeber_Tuberkulose.html;jsessionid=04DE588D78812C81C7210D1223B3A4B9.2_cid363. [Accessed: 02-Dec-2014].
[20] M. Zhang, S. Y. Li, I. M. Rosenthal, D. V. Almeida, Z. Ahmad, P. J. Converse, C. A. Peloquin, E. L. Nuermberger, and J. H. Grosset, “Treatment of tuberculosis with rifamycin-containing regimens in immune-deficient mice,” Am. J. Respir. Crit. Care Med., vol. 183, no. 9, pp. 1254–1261, 2011.
[21] D. L. Combs, R. J. O’Brien, and L. J. Geiter, “USPHS Tuberculosis Short-Course Chemotherapy Trial 21: effectiveness, toxicity, and acceptability. The report of final results.,” Ann. Intern. Med., vol. 112, no. 6, pp. 397–406, Mar. 1990.
[22] G. A. Colditz, T. F. Brewer, C. S. Berkey, M. E. Wilson, E. Burdick, H. V Fineberg, and F. Mosteller, “Efficacy of BCG vaccine in the prevention of tuberculosis. Meta-analysis of the published literature.,” JAMA, vol. 271, no. 9, pp. 698–702, Mar. 1994.
[23] M. T. Madigan, J. M. Martinko, T. D. Brock, and M. Thomm, Brock Mikrobiologie. Pearson Studium, 2006.
[24] J. E. Galagan, “Genomic insights into tuberculosis,” Nat Rev Genet, vol. 15, no. 5, pp. 307–320, May 2014.
[25] T. Wirth, F. Hildebrand, C. Allix-Béguec, F. Wölbeling, T. Kubica, K. Kremer, D. van Soolingen, S. Rüsch-Gerdes, C. Locht, S. Brisse, A. Meyer, P. Supply, and S. Niemann, “Origin, spread and demography of the Mycobacterium tuberculosis complex.,” PLoS Pathog., vol. 4, no. 9, p. e1000160, Jan. 2008.

Literature
126
[26] S. Mostowy and M. a Behr, “The origin and evolution of Mycobacterium tuberculosis.,” Clin. Chest Med., vol. 26, no. 2, pp. 207–16, v–vi, Jun. 2005.
[27] L. S. Schlesinger, “Entry of Mycobacterium tuberculosis into mononuclear phagocytes.,” Curr. Top. Microbiol. Immunol., vol. 215, pp. 71–96, Jan. 1996.
[28] G. R. Stewart, B. D. Robertson, and D. B. Young, “Tuberculosis: a problem with persistence.,” Nat. Rev. Microbiol., vol. 1, no. 2, pp. 97–105, Nov. 2003.
[29] S. H. Kaufmann and U. E. Schaible, “Antigen presentation and recognition in bacterial infections.,” Curr. Opin. Immunol., vol. 17, no. 1, pp. 79–87, Feb. 2005.
[30] J. D. Ernst, “The immunological life cycle of tuberculosis.,” Nat. Rev. Immunol., vol. 12, no. 8, pp. 581–91, Aug. 2012.
[31] J. E. Gomez and J. D. McKinney, “M. tuberculosis persistence, latency, and drug tolerance.,” Tuberculosis (Edinb)., vol. 84, no. 1–2, pp. 29–44, Jan. 2004.
[32] A. O’Garra, P. S. Redford, F. W. McNab, C. I. Bloom, R. J. Wilkinson, and M. P. R. Berry, “The immune response in tuberculosis.,” Annu. Rev. Immunol., vol. 31, pp. 475–527, Jan. 2013.
[33] O. Brändli, “The clinical presentation of tuberculosis.,” Respiration., vol. 65, no. 2, pp. 97–105, Jan. 1998.
[34] Y. Katsura, “Redefinition of lymphoid progenitors.,” Nat. Rev. Immunol., vol. 2, no. 2, pp. 127–32, Feb. 2002.
[35] E. Metschnikoff, “Ueber die Beziehung der Phagocyten zu Milzbrandbacillen,” Arch. für Pathol. Anat. und Physiol. und für Klin. Med., vol. 97, no. 3, pp. 502–526, Sep. 1884.
[36] R. S. Flannagan, V. Jaumouillé, and S. Grinstein, “The cell biology of phagocytosis.,” Annu. Rev. Pathol., vol. 7, pp. 61–98, Jan. 2012.
[37] O. Takeuchi and S. Akira, “Pattern recognition receptors and inflammation.,” Cell, vol. 140, no. 6, pp. 805–20, Mar. 2010.
[38] K. Takeda and S. Akira, “Toll-like receptors in innate immunity.,” Int. Immunol., vol. 17, no. 1, pp. 1–14, Jan. 2005.
[39] D. M. E. Bowdish, K. Sakamoto, M. Kim, M. Kroos, S. Mukhopadhyay, C. a Leifer, K. Tryggvason, S. Gordon, and D. G. Russell, “MARCO, TLR2, and CD14 are required for macrophage cytokine responses to mycobacterial trehalose dimycolate and Mycobacterium tuberculosis.,” PLoS Pathog., vol. 5, no. 6, p. e1000474, Jun. 2009.

Literature
127
[40] A. K. Mishra, N. N. Driessen, B. J. Appelmelk, and G. S. Besra, “Lipoarabinomannan and related glycoconjugates: structure, biogenesis and role in Mycobacterium tuberculosis physiology and host-pathogen interaction.,” FEMS Microbiol. Rev., vol. 35, no. 6, pp. 1126–57, Nov. 2011.
[41] M. M. Hossain and M.-N. Norazmi, “Pattern recognition receptors and cytokines in Mycobacterium tuberculosis infection--the double-edged sword?,” Biomed Res. Int., vol. 2013, p. 179174, Jan. 2013.
[42] L. Franchi, N. Warner, K. Viani, and G. Nuñez, “Function of Nod-like receptors in microbial recognition and host defense.,” Immunol. Rev., vol. 227, no. 1, pp. 106–28, Jan. 2009.
[43] B. B. Mishra, P. Moura-Alves, A. Sonawane, N. Hacohen, G. Griffiths, L. F. Moita, and E. Anes, “Mycobacterium tuberculosis protein ESAT-6 is a potent activator of the NLRP3/ASC inflammasome.,” Cell. Microbiol., vol. 12, no. 8, pp. 1046–63, Aug. 2010.
[44] L. Peiser, S. Mukhopadhyay, and S. Gordon, “Scavenger receptors in innate immunity.,” Curr. Opin. Immunol., vol. 14, no. 1, pp. 123–8, Feb. 2002.
[45] J. A. Philips, E. J. Rubin, and N. Perrimon, “Drosophila RNAi screen reveals CD36 family member required for mycobacterial infection.,” Science, vol. 309, no. 5738, pp. 1251–3, Aug. 2005.
[46] L. S. Schlesinger, S. R. Hull, and T. M. Kaufman, “Binding of the terminal mannosyl units of lipoarabinomannan from a virulent strain of Mycobacterium tuberculosis to human macrophages.,” J. Immunol., vol. 152, no. 8, pp. 4070–9, Apr. 1994.
[47] J. B. Torrelles, A. K. Azad, and L. S. Schlesinger, “Fine discrimination in the recognition of individual species of phosphatidyl-myo-inositol mannosides from Mycobacterium tuberculosis by C-type lectin pattern recognition receptors.,” J. Immunol., vol. 177, no. 3, pp. 1805–16, Aug. 2006.
[48] P. Dinadayala, A. Lemassu, P. Granovski, S. Cérantola, N. Winter, and M. Daffé, “Revisiting the structure of the anti-neoplastic glucans of Mycobacterium bovis Bacille Calmette-Guerin. Structural analysis of the extracellular and boiling water extract-derived glucans of the vaccine substrains.,” J. Biol. Chem., vol. 279, no. 13, pp. 12369–78, Mar. 2004.
[49] E. Ishikawa, T. Ishikawa, Y. S. Morita, K. Toyonaga, H. Yamada, O. Takeuchi, T. Kinoshita, S. Akira, Y. Yoshikai, and S. Yamasaki, “Direct recognition of the mycobacterial glycolipid, trehalose dimycolate, by C-type lectin Mincle.,” J. Exp. Med., vol. 206, no. 13, pp. 2879–88, Dec. 2009.
[50] Y. Miyake, K. Toyonaga, D. Mori, S. Kakuta, Y. Hoshino, A. Oyamada, H. Yamada, K.-I. Ono, M. Suyama, Y. Iwakura, Y. Yoshikai, and S. Yamasaki, “C-type lectin MCL is an FcRγ-coupled receptor that mediates the

Literature
128
adjuvanticity of mycobacterial cord factor.,” Immunity, vol. 38, no. 5, pp. 1050–62, May 2013.
[51] T. B. H. Geijtenbeek, S. J. Van Vliet, E. A. Koppel, M. Sanchez-Hernandez, C. M. J. E. Vandenbroucke-Grauls, B. Appelmelk, and Y. Van Kooyk, “Mycobacteria target DC-SIGN to suppress dendritic cell function.,” J. Exp. Med., vol. 197, no. 1, pp. 7–17, Jan. 2003.
[52] L. Tailleux, O. Schwartz, J.-L. Herrmann, E. Pivert, M. Jackson, A. Amara, L. Legres, D. Dreher, L. P. Nicod, J. C. Gluckman, P. H. Lagrange, B. Gicquel, and O. Neyrolles, “DC-SIGN is the major Mycobacterium tuberculosis receptor on human dendritic cells.,” J. Exp. Med., vol. 197, no. 1, pp. 121–7, Jan. 2003.
[53] N. Maeda, J. Nigou, J.-L. Herrmann, M. Jackson, A. Amara, P. H. Lagrange, G. Puzo, B. Gicquel, and O. Neyrolles, “The cell surface receptor DC-SIGN discriminates between Mycobacterium species through selective recognition of the mannose caps on lipoarabinomannan.,” J. Biol. Chem., vol. 278, no. 8, pp. 5513–6, Feb. 2003.
[54] S. Pitarque, J.-L. Herrmann, J.-L. Duteyrat, M. Jackson, G. R. Stewart, F. Lecointe, B. Payre, O. Schwartz, D. B. Young, G. Marchal, P. H. Lagrange, G. Puzo, B. Gicquel, J. Nigou, and O. Neyrolles, “Deciphering the molecular bases of Mycobacterium tuberculosis binding to the lectin DC-SIGN reveals an underestimated complexity.,” Biochem. J., vol. 392, no. Pt 3, pp. 615–24, Dec. 2005.
[55] J. B. Torrelles, A. K. Azad, L. N. Henning, T. K. Carlson, and L. S. Schlesinger, “Role of C-type lectins in mycobacterial infections.,” Curr. Drug Targets, vol. 9, no. 2, pp. 102–12, Feb. 2008.
[56] W. I. Weis, K. Drickamer, and W. A. Hendrickson, “Structure of a C-type mannose-binding protein complexed with an oligosaccharide.,” Nature, vol. 360, no. 6400, pp. 127–34, Nov. 1992.
[57] A. Tanne and O. Neyrolles, “C-type lectins in immunity to Mycobacterium tuberculosis.,” Front. Biosci. (Schol. Ed)., vol. 3, pp. 1147–64, Jan. 2011.
[58] B. P. Thornton, V. Vĕtvicka, M. Pitman, R. C. Goldman, and G. D. Ross, “Analysis of the sugar specificity and molecular location of the beta-glucan-binding lectin site of complement receptor type 3 (CD11b/CD18).,” J. Immunol., vol. 156, no. 3, pp. 1235–46, Feb. 1996.
[59] L. M. Thorson, D. Doxsee, M. G. Scott, P. Wheeler, and R. W. Stokes, “Effect of mycobacterial phospholipids on interaction of Mycobacterium tuberculosis with macrophages.,” Infect. Immun., vol. 69, no. 4, pp. 2172–9, Apr. 2001.
[60] H. Tada, S. Aiba, K.-I. Shibata, T. Ohteki, and H. Takada, “Synergistic effect of Nod1 and Nod2 agonists with toll-like receptor agonists on human
Literature
129
dendritic cells to generate interleukin-12 and T helper type 1 cells.,” Infect. Immun., vol. 73, no. 12, pp. 7967–76, Dec. 2005.
[61] S. Schwander and K. Dheda, “Human lung immunity against Mycobacterium tuberculosis: insights into pathogenesis and protection.,” Am. J. Respir. Crit. Care Med., vol. 183, no. 6, pp. 696–707, Mar. 2011.
[62] M. Moser and O. Leo, “Key concepts in immunology.,” Vaccine, vol. 28 Suppl 3, pp. C2–13, Aug. 2010.
[63] F. Nimmerjahn and J. V Ravetch, “Fcgamma receptors as regulators of immune responses.,” Nat. Rev. Immunol., vol. 8, no. 1, pp. 34–47, Jan. 2008.
[64] D. Holowka, D. Sil, C. Torigoe, and B. Baird, “Insights into immunoglobulin E receptor signaling from structurally defined ligands.,” Immunol. Rev., vol. 217, pp. 269–79, Jun. 2007.
[65] S. A. Johnson, C. M. Pleiman, L. Pao, J. Schneringer, K. Hippen, and J. C. Cambier, “Phosphorylated immunoreceptor signaling motifs (ITAMs) exhibit unique abilities to bind and activate Lyn and Syk tyrosine kinases.,” J. Immunol., vol. 155, no. 10, pp. 4596–603, Nov. 1995.
[66] S. Tridandapani, T. W. Lyden, J. L. Smith, J. E. Carter, K. M. Coggeshall, and C. L. Anderson, “The adapter protein LAT enhances fcgamma receptor-mediated signal transduction in myeloid cells.,” J. Biol. Chem., vol. 275, no. 27, pp. 20480–7, Jul. 2000.
[67] H. Gu, R. J. Botelho, M. Yu, S. Grinstein, and B. G. Neel, “Critical role for scaffolding adapter Gab2 in Fc gamma R-mediated phagocytosis.,” J. Cell Biol., vol. 161, no. 6, pp. 1151–61, Jun. 2003.
[68] R. J. Botelho, M. Teruel, R. Dierckman, R. Anderson, A. Wells, J. D. York, T. Meyer, and S. Grinstein, “Localized biphasic changes in phosphatidylinositol-4,5-bisphosphate at sites of phagocytosis.,” J. Cell Biol., vol. 151, no. 7, pp. 1353–68, Dec. 2000.
[69] C. C. Scott, W. Dobson, R. J. Botelho, N. Coady-Osberg, P. Chavrier, D. A. Knecht, C. Heath, P. Stahl, and S. Grinstein, “Phosphatidylinositol-4,5-bisphosphate hydrolysis directs actin remodeling during phagocytosis.,” J. Cell Biol., vol. 169, no. 1, pp. 139–49, Apr. 2005.
[70] N. Ninomiya, K. Hazeki, Y. Fukui, T. Seya, T. Okada, O. Hazeki, and M. Ui, “Involvement of phosphatidylinositol 3-kinase in Fc gamma receptor signaling.,” J. Biol. Chem., vol. 269, no. 36, pp. 22732–7, Sep. 1994.
[71] A. D. Hoppe and J. A. Swanson, “Cdc42, Rac1, and Rac2 display distinct patterns of activation during phagocytosis.,” Mol. Biol. Cell, vol. 15, no. 8, pp. 3509–19, Aug. 2004.

Literature
130
[72] R. C. May, E. Caron, A. Hall, and L. M. Machesky, “Involvement of the Arp2/3 complex in phagocytosis mediated by FcgammaR or CR3.,” Nat. Cell Biol., vol. 2, no. 4, pp. 246–8, Apr. 2000.
[73] N. Araki, “Role of microtubules and myosins in Fc gamma receptor-mediated phagocytosis.,” Front. Biosci., vol. 11, pp. 1479–90, Jan. 2006.
[74] O. V Vieira, R. J. Botelho, L. Rameh, S. M. Brachmann, T. Matsuo, H. W. Davidson, A. Schreiber, J. M. Backer, L. C. Cantley, and S. Grinstein, “Distinct roles of class I and class III phosphatidylinositol 3-kinases in phagosome formation and maturation.,” J. Cell Biol., vol. 155, no. 1, pp. 19–25, Oct. 2001.
[75] V. Pons, P.-P. Luyet, E. Morel, L. Abrami, F. G. van der Goot, R. G. Parton, and J. Gruenberg, “Hrs and SNX3 functions in sorting and membrane invagination within multivesicular bodies.,” PLoS Biol., vol. 6, no. 9, p. e214, Sep. 2008.
[76] N. Jabado, A. Jankowski, S. Dougaparsad, V. Picard, S. Grinstein, and P. Gros, “Natural resistance to intracellular infections: natural resistance-associated macrophage protein 1 (Nramp1) functions as a pH-dependent manganese transporter at the phagosomal membrane.,” J. Exp. Med., vol. 192, no. 9, pp. 1237–48, Nov. 2000.
[77] M. A. Forrellad, L. I. Klepp, A. Gioffré, J. Sabio y García, H. R. Morbidoni, M. de la Paz Santangelo, A. A. Cataldi, and F. Bigi, “Virulence factors of the Mycobacterium tuberculosis complex.,” Virulence, vol. 4, pp. 3–66, 2013.
[78] A. M. Abdallah, N. C. Gey van Pittius, P. a D. Champion, J. Cox, J. Luirink, C. M. J. E. Vandenbroucke-Grauls, B. J. Appelmelk, and W. Bitter, “Type VII secretion--mycobacteria show the way.,” Nat. Rev. Microbiol., vol. 5, no. 11, pp. 883–91, Nov. 2007.
[79] N. van der Wel, D. Hava, D. Houben, D. Fluitsma, M. van Zon, J. Pierson, M. Brenner, and P. J. Peters, “M. tuberculosis and M. leprae translocate from the phagolysosome to the cytosol in myeloid cells.,” Cell, vol. 129, no. 7, pp. 1287–98, Jun. 2007.
[80] S. Arruda, G. Bomfim, R. Knights, T. Huima-Byron, and L. W. Riley, “Cloning of an M. tuberculosis DNA fragment associated with entry and survival inside cells.,” Science, vol. 261, no. 5127, pp. 1454–7, Sep. 1993.
[81] F. D. Menozzi, J. H. Rouse, M. Alavi, M. Laude-Sharp, J. Muller, R. Bischoff, M. J. Brennan, and C. Locht, “Identification of a heparin-binding hemagglutinin present in mycobacteria.,” J. Exp. Med., vol. 184, no. 3, pp. 993–1001, Sep. 1996.
[82] D. Kaur, M. E. Guerin, H. Skovierová, P. J. Brennan, and M. Jackson, “Chapter 2: Biogenesis of the cell wall and other glycoconjugates of

Literature
131
Mycobacterium tuberculosis.,” Adv. Appl. Microbiol., vol. 69, pp. 23–78, Jan. 2009.
[83] I. Vergne, J. Chua, H.-H. Lee, M. Lucas, J. Belisle, and V. Deretic, “Mechanism of phagolysosome biogenesis block by viable Mycobacterium tuberculosis.,” Proc. Natl. Acad. Sci. U. S. A., vol. 102, no. 11, pp. 4033–8, Mar. 2005.
[84] D. C. Crick, S. Mahapatra, and P. J. Brennan, “Biosynthesis of the arabinogalactan-peptidoglycan complex of Mycobacterium tuberculosis.,” Glycobiology, vol. 11, no. 9, p. 107R–118R, Sep. 2001.
[85] S. Pitarque, G. Larrouy-Maumus, B. Payré, M. Jackson, G. Puzo, and J. Nigou, “The immunomodulatory lipoglycans, lipoarabinomannan and lipomannan, are exposed at the mycobacterial cell surface.,” Tuberculosis (Edinb)., vol. 88, no. 6, pp. 560–5, Nov. 2008.
[86] J. B. Torrelles and L. S. Schlesinger, “Diversity in Mycobacterium tuberculosis mannosylated cell wall determinants impacts adaptation to the host.,” Tuberculosis (Edinb)., vol. 90, no. 2, pp. 84–93, Mar. 2010.
[87] O. Neyrolles and C. Guilhot, “Recent advances in deciphering the contribution of Mycobacterium tuberculosis lipids to pathogenesis.,” Tuberculosis (Edinb)., vol. 91, no. 3, pp. 187–95, May 2011.
[88] S. Xu, A. Cooper, S. Sturgill-Koszycki, T. van Heyningen, D. Chatterjee, I. Orme, P. Allen, and D. G. Russell, “Intracellular trafficking in Mycobacterium tuberculosis and Mycobacterium avium-infected macrophages.,” J. Immunol., vol. 153, no. 6, pp. 2568–78, Sep. 1994.
[89] R. L. Hunter, M. R. Olsen, C. Jagannath, and J. K. Actor, “Multiple roles of cord factor in the pathogenesis of primary, secondary, and cavitary tuberculosis, including a revised description of the pathology of secondary disease.,” Ann. Clin. Lab. Sci., vol. 36, no. 4, pp. 371–86, Jan. 2006.
[90] J. Indrigo, “Cord factor trehalose 6,6’-dimycolate (TDM) mediates trafficking events during mycobacterial infection of murine macrophages,” Microbiology, vol. 149, no. 8, pp. 2049–2059, Aug. 2003.
[91] S. Axelrod, H. Oschkinat, J. Enders, B. Schlegel, V. Brinkmann, S. H. E. Kaufmann, A. Haas, and U. E. Schaible, “Delay of phagosome maturation by a mycobacterial lipid is reversed by nitric oxide.,” Cell. Microbiol., vol. 10, no. 7, pp. 1530–45, Jul. 2008.
[92] R. Lang, “Recognition of the mycobacterial cord factor by Mincle: relevance for granuloma formation and resistance to tuberculosis.,” Front. Immunol., vol. 4, no. January, p. 5, Jan. 2013.
[93] C. Astarie-Dequeker, L. Le Guyader, W. Malaga, F.-K. Seaphanh, C. Chalut, A. Lopez, and C. Guilhot, “Phthiocerol dimycocerosates of M. tuberculosis participate in macrophage invasion by inducing changes in the

Literature
132
organization of plasma membrane lipids.,” PLoS Pathog., vol. 5, no. 2, p. e1000289, Mar. 2009.
[94] C. J. Cambier, K. K. Takaki, R. P. Larson, R. E. Hernandez, D. M. Tobin, K. B. Urdahl, C. L. Cosma, and L. Ramakrishnan, “Mycobacteria manipulate macrophage recruitment through coordinated use of membrane lipids.,” Nature, no. 2, Dec. 2013.
[95] N. Robinson, T. Kolter, M. Wolke, J. Rybniker, P. Hartmann, and G. Plum, “Mycobacterial phenolic glycolipid inhibits phagosome maturation and subverts the pro-inflammatory cytokine response,” Traffic, vol. 9, no. 11, pp. 1936–1947, 2008.
[96] B. Corleis, D. Korbel, R. Wilson, J. Bylund, R. Chee, and U. E. Schaible, “Escape of Mycobacterium tuberculosis from oxidative killing by neutrophils.,” Cell. Microbiol., vol. 14, no. 7, pp. 1109–21, Jul. 2012.
[97] R. Herzog, K. Schuhmann, D. Schwudke, J. L. Sampaio, S. R. Bornstein, M. Schroeder, and A. Shevchenko, “LipidXplorer: a software for consensual cross-platform lipidomics.,” PLoS One, vol. 7, no. 1, p. e29851, Jan. 2012.
[98] a Lührmann and A. Haas, “A method to purify bacteria-containing phagosomes from infected macrophages.,” Methods Cell Sci., vol. 22, no. 4, pp. 329–41, Jan. 2000.
[99] G. Liebisch, M. Binder, R. Schifferer, T. Langmann, B. Schulz, and G. Schmitz, “High throughput quantification of cholesterol and cholesteryl ester by electrospray ionization tandem mass spectrometry (ESI-MS/MS).,” Biochim. Biophys. Acta, vol. 1761, no. 1, pp. 121–8, Jan. 2006.
[100] B. J. Spargo, L. M. Crowe, T. Ioneda, B. L. Beaman, and J. H. Crowe, “Cord factor (alpha,alpha-trehalose 6,6’-dimycolate) inhibits fusion between phospholipid vesicles.,” Proc. Natl. Acad. Sci. U. S. A., vol. 88, no. 3, pp. 737–40, Feb. 1991.
[101] D. M. Patel, S. F. Ahmad, D. G. Weiss, V. Gerke, and S. A. Kuznetsov, “Annexin A1 is a new functional linker between actin filaments and phagosomes during phagocytosis.,” J. Cell Sci., vol. 124, no. Pt 4, pp. 578–88, Feb. 2011.
[102] M. G. Pittis, L. Muzzolin, P. G. Giulianini, and R. C. Garcia, “Mycobacteria-containing phagosomes associate less annexins I, VI, VII and XI, but not II, concomitantly with a diminished phagolysosomal fusion.,” Eur. J. Cell Biol., vol. 82, no. 1, pp. 9–17, Jan. 2003.
[103] M. Kolonko, A. C. Geffken, T. Blumer, K. Hagens, U. E. Schaible, and M. Hagedorn, “WASH-driven actin polymerization is required for efficient mycobacterial phagosome maturation arrest.,” Cell. Microbiol., Sep. 2013.
[104] C. Sakurai, H. Hashimoto, H. Nakanishi, S. Arai, Y. Wada, G.-H. Sun-Wada, I. Wada, and K. Hatsuzawa, “SNAP-23 regulates phagosome

Literature
133
formation and maturation in macrophages.,” Mol. Biol. Cell, vol. 23, no. 24, pp. 4849–63, Dec. 2012.
[105] M. G. Wetzel and E. D. Korn, “Phagocytosis of latex beads by Acahamoeba castellanii (Neff). 3. Isolation of the phagocytic vesicles and their membranes.,” J. Cell Biol., vol. 43, no. 1, pp. 90–104, Oct. 1969.
[106] M. Desjardins, L. a. Huber, R. G. Parton, and G. Griffiths, “Biogenesis of phagolysosomes proceeds through a sequential series of interactions with the endocytic apparatus,” J. Cell Biol., vol. 124, no. 5, pp. 677–688, 1994.
[107] P. Chakraborty, S. Sturgill-Koszycki, and D. G. Russell, “Isolation and characterization of pathogen-containing phagosomes.,” Methods Cell Biol., vol. 45, pp. 261–76, Jan. 1994.
[108] D. Gotthardt, H. J. Warnatz, O. Henschel, F. Brückert, M. Schleicher, and T. Soldati, “High-resolution dissection of phagosome maturation reveals distinct membrane trafficking phases.,” Mol. Biol. Cell, vol. 13, no. 10, pp. 3508–20, Oct. 2002.
[109] a. G. Ulsamer, P. L. Wright, M. G. Wetzel, and E. D. Korn, “Plasma and phagosome membranes of Acanthamoeba castellanii.,” J. Cell Biol., vol. 51, no. 1, pp. 193–215, 1971.
[110] S. L. Zeichner, “Isolation and characterization of phagosomes containing Chlamydia psittaci from L cells,” Infect. Immun., vol. 38, no. 1, pp. 325–342, 1982.
[111] Z. Hasan, C. Schlax, L. Kuhn, I. Lefkovits, D. Young, J. Thole, and J. Pieters, “Isolation and characterization of the mycobacterial phagosome: segregation from the endosomal/lysosomal pathway.,” Mol. Microbiol., vol. 24, no. 3, pp. 545–553, 1997.
[112] D. Howe and R. A. Heinzen, “Fractionation of the Coxiella burnetii parasitophorous vacuole.,” Methods Mol. Biol., vol. 445, pp. 389–406, Jan. 2008.
[113] Q. Li, C. Jagannath, P. K. Rao, C. R. Singh, and G. Lostumbo, “Analysis of phagosomal proteomes: from latex-bead to bacterial phagosomes.,” Proteomics, vol. 10, no. 22, pp. 4098–116, Nov. 2010.
[114] D. A. Lutz, X. M. Chen, and B. J. McLaughlin, “Isolation of the phagocytic compartment from macrophages using a paramagnetic, particulate ligand.,” Anal. Biochem., vol. 214, no. 1, pp. 205–11, Oct. 1993.
[115] S. Sturgill-koszycki, U. E. Schaible, and D. G. Russell, “Mycobacterium-containing phagosomes,” vol. 15, no. 24, pp. 6960–6968, 1996.
[116] P. Lönnbro, P. Nordenfelt, and H. Tapper, “Isolation of bacteria-containing phagosomes by magnetic selection.,” BMC Cell Biol., vol. 9, p. 35, 2008.

Literature
134
[117] C. Steinhäuser, U. Heigl, V. Tchikov, J. Schwarz, T. Gutsmann, K. Seeger, J. Brandenburg, J. Fritsch, J. Schroeder, K. H. Wiesmüller, I. Rosenkrands, P. Walther, J. Pott, E. Krause, S. Ehlers, W. Schneider-Brachert, S. Schütze, and N. Reiling, “Lipid-Labeling facilitates a novel magnetic isolation procedure to characterize pathogen-containing phagosomes,” Traffic, vol. 14, no. 3, pp. 321–336, 2013.
[118] T. Dallenga, B. Corleis, and U. E. Schaible, “Infection of Human Neutrophils to Study Virulence Properties of Mycobacterium tuberculosis.,” Methods Mol. Biol., vol. 1285, pp. 343–55, Jan. 2015.
[119] Q. Li, “Phagosome proteomics: a powerful tool to assess bacteria-mediated immunomodulation.,” Bioeng. Bugs, vol. 2, no. 4, pp. 194–8, Jan. .
[120] L. Ramachandra, R. M. Sramkoski, D. H. Canaday, W. H. Boom, and C. V Harding, “Flow analysis of MHC molecules and other membrane proteins in isolated phagosomes.,” J. Immunol. Methods, vol. 213, no. 1, pp. 53–71, Apr. 1998.
[121] K. Surmann, S. Michalik, P. Hildebrandt, P. Gierok, M. Depke, L. Brinkmann, J. Bernhardt, M. G. Salazar, Z. Sun, D. Shteynberg, U. Kusebauch, R. L. Moritz, B. Wollscheid, M. Lalk, U. Völker, and F. Schmidt, “Comparative proteome analysis reveals conserved and specific adaptation patterns of Staphylococcus aureus after internalization by different types of human non-professional phagocytic host cells.,” Front. Microbiol., vol. 5, p. 392, Jan. 2014.
[122] H. Pförtner, J. Wagner, K. Surmann, P. Hildebrandt, S. Ernst, J. Bernhardt, C. Schurmann, M. Gutjahr, M. Depke, U. Jehmlich, V. Dhople, E. Hammer, L. Steil, U. Völker, and F. Schmidt, “A proteomics workflow for quantitative and time-resolved analysis of adaptation reactions of internalized bacteria.,” Methods, vol. 61, no. 3, pp. 244–50, Jun. 2013.
[123] D. Becker, M. Selbach, C. Rollenhagen, M. Ballmaier, T. F. Meyer, M. Mann, and D. Bumann, “Robust Salmonella metabolism limits possibilities for new antimicrobials.,” Nature, vol. 440, no. 7082, pp. 303–7, Mar. 2006.
[124] F. Bonn, J. Bartel, K. Büttner, M. Hecker, A. Otto, and D. Becher, “Picking vanished proteins from the void: how to collect and ship/share extremely dilute proteins in a reproducible and highly efficient manner.,” Anal. Chem., vol. 86, no. 15, pp. 7421–7, Aug. 2014.
[125] M. Bantscheff, M. Schirle, G. Sweetman, J. Rick, and B. Kuster, “Quantitative mass spectrometry in proteomics: A critical review,” Anal. Bioanal. Chem., vol. 389, no. 4, pp. 1017–1031, 2007.
[126] D. H. Lundgren, S.-I. Hwang, L. Wu, and D. K. Han, “Role of spectral counting in quantitative proteomics.,” Expert Rev. Proteomics, vol. 7, no. 1, pp. 39–53, Feb. 2010.

Literature
135
[127] B.-Y. Lee, D. Jethwaney, B. Schilling, D. L. Clemens, B. W. Gibson, and M. a Horwitz, “The Mycobacterium bovis bacille Calmette-Guerin phagosome proteome.,” Mol. Cell. Proteomics, vol. 9, no. 1, pp. 32–53, Jan. 2010.
[128] J. Mattow, F. Siejak, K. Hagens, D. Becher, D. Albrecht, A. Krah, F. Schmidt, P. R. Jungblut, S. H. E. Kaufmann, and U. E. Schaible, “Proteins unique to intraphagosomally grown Mycobacterium tuberculosis.,” Proteomics, vol. 6, no. 8, pp. 2485–94, Apr. 2006.
[129] A. O. Barry, J.-L. Mege, and E. Ghigo, “Hijacked phagosomes and leukocyte activation: an intimate relationship.,” J. Leukoc. Biol., vol. 89, no. 3, pp. 373–82, Mar. 2011.
[130] R. a Fratti, J. M. Backer, J. Gruenberg, S. Corvera, and V. Deretic, “Role of phosphatidylinositol 3-kinase and Rab5 effectors in phagosomal biogenesis and mycobacterial phagosome maturation arrest.,” J. Cell Biol., vol. 154, no. 3, pp. 631–44, Aug. 2001.
[131] V. Deretic and R. A. Fratti, “MicroReview Mycobacterium tuberculosis phagosome,” vol. 31, pp. 1603–1609, 1999.
[132] P. K. Rao, C. R. Singh, C. Jagannath, and Q. Li, “Original Article A systems biology approach to study the phagosomal proteome modulated by mycobacterial infections,” Clin. Exp. Med., pp. 233–247, 2009.
[133] W. Shui, C. J. Petzold, A. Redding, J. Liu, A. Pitcher, L. Sheu, T. Hsieh, J. D. Keasling, and C. R. Bertozzi, “Organelle Membrane Proteomics Reveals Differential Influence of Mycobacterial Lipoglycans on Macrophage Phagosome Maturation and Autophagosome Accumulation research articles,” vol. 11, no. Figure 1, pp. 339–348, 2011.
[134] V. Gerke, C. E. Creutz, and S. E. Moss, “Annexins: linking Ca2+ signalling to membrane dynamics.,” Nat. Rev. Mol. Cell Biol., vol. 6, no. 6, pp. 449–461, 2005.
[135] M. C. Harricane, E. Caron, F. Porte, and J. P. Liautard, “Distribution of annexin I during non-pathogen or pathogen phagocytosis by confocal imaging and immunogold electron microscopy.,” Cell Biol. Int., vol. 20, no. 3, pp. 193–203, Mar. 1996.
[136] M. Kaufman, T. Leto, and R. Levy, “Translocation of annexin I to plasma membranes and phagosomes in human neutrophils upon stimulation with opsonized zymosan: possible role in phagosome function.,” Biochem. J., vol. 316 ( Pt 1, pp. 35–42, May 1996.
[137] H. L. Collins, U. E. Schaible, J. D. Ernst, and D. G. Russell, “Transfer of phagocytosed particles to the parasitophorous vacuole of Leishmania mexicana is a transient phenomenon preceding the acquisition of annexin I by the phagosome.,” J. Cell Sci., vol. 110 ( Pt 2, pp. 191–200, Jan. 1997.

Literature
136
[138] M. J. Hayes, U. Rescher, V. Gerke, and S. E. Moss, “Annexin-actin interactions.,” Traffic, vol. 5, no. 8, pp. 571–6, Aug. 2004.
[139] M. T. Alvarez-Martinez, J. C. Mani, F. Porte, C. Faivre-Sarrailh, J. P. Liautard, and J. Sri Widada, “Characterization of the interaction between annexin I and profilin.,” Eur. J. Biochem., vol. 238, no. 3, pp. 777–84, Jun. 1996.
[140] M. Desjardins, J. E. Celis, G. Van Meer, H. Dieplinger, a. Jahraus, G. Griffiths, and L. a. Huber, “Molecular characterization of phagosomes,” J. Biol. Chem., vol. 269, no. 51, pp. 32194–32200, 1994.
[141] C. Enrich, C. Rentero, S. V. de Muga, M. Reverter, V. Mulay, P. Wood, M. Koese, and T. Grewal, “Annexin A6-Linking Ca2+ signaling with cholesterol transport,” Biochim. Biophys. Acta - Mol. Cell Res., vol. 1813, no. 5, pp. 935–947, 2011.
[142] A. Alvarez-Guaita, S. Vilà de Muga, D. M. Owen, D. Williamson, A. Magenau, A. García-Melero, M. Reverter, M. Hoque, R. Cairns, R. Cornely, F. Tebar, T. Grewal, K. Gaus, J. Ayala-Sanmartín, C. Enrich, and C. Rentero, “Evidence for annexin A6-dependent plasma membrane remodelling of lipid domains,” Br. J. Pharmacol., p. n/a–n/a, 2015.
[143] V. Gerke and S. E. Moss, “Annexins: from structure to function.,” Physiol. Rev., vol. 82, no. 2, pp. 331–371, 2002.
[144] Y. A. Chen and R. H. Scheller, “SNARE-mediated membrane fusion.,” Nat. Rev. Mol. Cell Biol., vol. 2, no. 2, pp. 98–106, Feb. 2001.
[145] D. Fasshauer, R. B. Sutton, A. T. Brunger, and R. Jahn, “Conserved structural features of the synaptic fusion complex: SNARE proteins reclassified as Q- and R-SNAREs.,” Proc. Natl. Acad. Sci. U. S. A., vol. 95, no. 26, pp. 15781–6, Dec. 1998.
[146] J. L. Stow, A. P. Manderson, and R. Z. Murray, “SNAREing immunity: the role of SNAREs in the immune system.,” Nat. Rev. Immunol., vol. 6, no. 12, pp. 919–29, Dec. 2006.
[147] A. Castañeda-Ramírez, J. L. Puente, A. González-Noriega, and A. Verdugo-Rodríguez, “Silencing of VAMP3 expression does not affect Brucella melitensis infection in mouse macrophages.,” Virulence, vol. 3, no. 5, pp. 434–9, Aug. 2012.
[148] L. Bajno, X. R. Peng, A. D. Schreiber, H. P. Moore, W. S. Trimble, and S. Grinstein, “Focal exocytosis of VAMP3-containing vesicles at sites of phagosome formation.,” J. Cell Biol., vol. 149, no. 3, pp. 697–706, May 2000.
[149] L.-A. H. Allen, C. Yang, and J. E. Pessin, “Rate and extent of phagocytosis in macrophages lacking vamp3.,” J. Leukoc. Biol., vol. 72, no. 1, pp. 217–21, Jul. 2002.

Literature
137
[150] R. a. Fratti, J. Chua, and V. Deretic, “Cellubrevin alterations and Mycobacterium tuberculosis phagosome maturation arrest,” J. Biol. Chem., vol. 277, no. 19, pp. 17320–17326, 2002.
[151] P. Rougerie, V. Miskolci, and D. Cox, “Generation of membrane structures during phagocytosis and chemotaxis of macrophages: Role and regulation of the actin cytoskeleton,” Immunol. Rev., vol. 256, no. 1, pp. 222–239, 2013.
[152] J. D. Rotty, C. Wu, and J. E. Bear, “New insights into the regulation and cellular functions of the ARP2/3 complex.,” Nat. Rev. Mol. Cell Biol., vol. 14, no. 1, pp. 7–12, Jan. 2013.
[153] E. D. Goley and M. D. Welch, “The ARP2/3 complex: an actin nucleator comes of age.,” Nat. Rev. Mol. Cell Biol., vol. 7, no. 10, pp. 713–26, Oct. 2006.
[154] E. Derivery, C. Sousa, J. J. Gautier, B. Lombard, D. Loew, and A. Gautreau, “The Arp2/3 activator WASH controls the fission of endosomes through a large multiprotein complex.,” Dev. Cell, vol. 17, no. 5, pp. 712–23, Nov. 2009.
[155] E. Helfer, M. E. Harbour, V. Henriot, G. Lakisic, C. Sousa-Blin, L. Volceanov, M. N. J. Seaman, and A. Gautreau, “Endosomal recruitment of the WASH complex: active sequences and mutations impairing interaction with the retromer.,” Biol. Cell, vol. 105, no. 5, pp. 191–207, May 2013.
[156] H. Defacque, M. Egeberg, a Habermann, M. Diakonova, C. Roy, P. Mangeat, W. Voelter, G. Marriott, J. Pfannstiel, H. Faulstich, and G. Griffiths, “Involvement of ezrin/moesin in de novo actin assembly on phagosomal membranes.,” EMBO J., vol. 19, no. 2, pp. 199–212, Jan. 2000.
[157] I. Guérin and C. de Chastellier, “Disruption of the actin filament network affects delivery of endocytic contents marker to phagosomes with early endosome characteristics: the case of phagosomes with pathogenic mycobacteria.,” Eur. J. Cell Biol., vol. 79, no. 10, pp. 735–49, Oct. 2000.
[158] A. Jahraus, M. Egeberg, B. Hinner, A. Habermann, E. Sackman, A. Pralle, H. Faulstich, V. Rybin, H. Defacque, and G. Griffiths, “ATP-dependent membrane assembly of F-actin facilitates membrane fusion.,” Mol. Biol. Cell, vol. 12, no. 1, pp. 155–70, Jan. 2001.
[159] R. Kjeken, M. Egeberg, A. Habermann, M. Kuehnel, P. Peyron, M. Floetenmeyer, P. Walther, A. Jahraus, H. Defacque, S. A. Kuznetsov, and G. Griffiths, “Fusion between phagosomes, early and late endosomes: a role for actin in fusion between late, but not early endocytic organelles.,” Mol. Biol. Cell, vol. 15, no. 1, pp. 345–58, Jan. 2004.
[160] M. Lerm, V. P. Brodin, I. Ruishalme, O. Stendahl, and E. Särndahl, “Inactivation of Cdc42 is necessary for depolymerization of phagosomal F-

Literature
138
actin and subsequent phagosomal maturation.,” J. Immunol., vol. 178, no. 11, pp. 7357–7365, 2007.
[161] C. V. da Silva, L. Cruz, N. da S. Araújo, M. B. Angeloni, B. B. Fonseca, A. de O. Gomes, F. D. R. Carvalho, A. L. R. Gonçalves, and B. de F. Barbosa, “A glance at Listeria and Salmonella cell invasion: different strategies to promote host actin polymerization.,” Int. J. Med. Microbiol., vol. 302, no. 1, pp. 19–32, Jan. 2012.
[162] S. Ehsani, J. C. Santos, C. D. Rodrigues, R. Henriques, L. Audry, C. Zimmer, P. Sansonetti, G. Tran Van Nhieu, and J. Enninga, “Hierarchies of host factor dynamics at the entry site of Shigella flexneri during host cell invasion.,” Infect. Immun., vol. 80, no. 7, pp. 2548–57, Jul. 2012.
[163] S. Méresse, K. E. Unsworth, a Habermann, G. Griffiths, F. Fang, M. J. Martínez-Lorenzo, S. R. Waterman, J. P. Gorvel, and D. W. Holden, “Remodelling of the actin cytoskeleton is essential for replication of intravacuolar Salmonella.,” Cell. Microbiol., vol. 3, no. 8, pp. 567–77, Aug. 2001.
[164] M. Lerm, A. Holm, A. Seiron, E. Särndahl, K.-E. Magnusson, and B. Rasmusson, “Leishmania donovani requires functional Cdc42 and Rac1 to prevent phagosomal maturation.,” Infect. Immun., vol. 74, no. 5, pp. 2613–8, May 2006.
[165] L. M. Stamm, M. A. Pak, J. H. Morisaki, S. B. Snapper, K. Rottner, S. Lommel, and E. J. Brown, “Role of the WASP family proteins for Mycobacterium marinum actin tail formation.,” Proc. Natl. Acad. Sci. U. S. A., vol. 102, no. 41, pp. 14837–42, Oct. 2005.
[166] M. D. Welch and M. Way, “Arp2/3-mediated actin-based motility: a tail of pathogen abuse.,” Cell Host Microbe, vol. 14, no. 3, pp. 242–55, Sep. 2013.
[167] L. M. Stamm, J. H. Morisaki, L.-Y. Gao, R. L. Jeng, K. L. McDonald, R. Roth, S. Takeshita, J. Heuser, M. D. Welch, and E. J. Brown, “Mycobacterium marinum escapes from phagosomes and is propelled by actin-based motility.,” J. Exp. Med., vol. 198, no. 9, pp. 1361–8, Nov. 2003.
[168] D. Liebl and G. Griffiths, “Transient assembly of F-actin by phagosomes delays phagosome fusion with lysosomes in cargo-overloaded macrophages.,” J. Cell Sci., vol. 122, no. Pt 16, pp. 2935–45, Aug. 2009.
[169] H. Defacque, M. Egeberg, a Antzberger, W. Ansorge, M. Way, and G. Griffiths, “Actin assembly induced by polylysine beads or purified phagosomes: quantitation by a new flow cytometry assay.,” Cytometry, vol. 41, no. 1, pp. 46–54, Sep. 2000.
[170] G. Ferrari, H. Langen, M. Naito, and J. Pieters, “A coat protein on phago- somes involved in the intracellular survival of mycobacteria.,” Cell, vol. 97, no. 97, pp. 435–447, 1999.
Literature
139
[171] R. Jayachandran, V. Sundaramurthy, B. Combaluzier, P. Mueller, H. Korf, K. Huygen, T. Miyazaki, I. Albrecht, J. Massner, and J. Pieters, “Survival of mycobacteria in macrophages is mediated by coronin 1-dependent activation of calcineurin.,” Cell, vol. 130, no. 1, pp. 37–50, Jul. 2007.
[172] J. M. Robinson and J. A. Badwey, “Rapid association of cytoskeletal remodeling proteins with the developing phagosomes of human neutrophils.,” Histochem. Cell Biol., vol. 118, no. 2, pp. 117–25, Aug. 2002.
[173] M. G. Coppolino, M. Krause, P. Hagendorff, D. a Monner, W. Trimble, S. Grinstein, J. Wehland, and a S. Sechi, “Evidence for a molecular complex consisting of Fyb/SLAP, SLP-76, Nck, VASP and WASP that links the actin cytoskeleton to Fcgamma receptor signalling during phagocytosis.,” J. Cell Sci., vol. 114, no. Pt 23, pp. 4307–4318, 2001.
[174] A. Akhter, K. Caution, A. Abu Khweek, M. Tazi, B. a. Abdulrahman, D. H. a Abdelaziz, O. H. Voss, A. I. Doseff, H. Hassan, A. K. Azad, L. S. Schlesinger, M. D. Wewers, M. a. Gavrilin, and A. O. Amer, “Caspase-11 Promotes the Fusion of Phagosomes Harboring Pathogenic Bacteria with Lysosomes by Modulating Actin Polymerization,” Immunity, vol. 37, no. 1, pp. 35–47, 2012.
[175] A. Yuan and C. P. Chia, “Co-loss of profilin I, II and cofilin with actin from maturing phagosomes inDictyostelium discoideum,” Protoplasma, vol. 209, no. 3–4, pp. 214–225, Sep. 1999.
[176] H. Bielig, K. Lautz, P. R. Braun, M. Menning, N. Machuy, C. Brügmann, S. Barisic, S. a. Eisler, M. Andree, B. Zurek, H. Kashkar, P. J. Sansonetti, A. Hausser, T. F. Meyer, and T. a. Kufer, “The Cofilin Phosphatase Slingshot Homolog 1 (SSH1) Links NOD1 Signaling to Actin Remodeling,” PLoS Pathog., vol. 10, no. 9, p. e1004351, 2014.
[177] B. E. Steinberg and S. Grinstein, “Pathogen destruction versus intracellular survival: The role of lipids as phagosomal fate determinants,” J. Clin. Invest., vol. 118, no. 6, pp. 2002–2011, 2008.
[178] M. Desjardinsl, E. Julio, G. Van Meer, H. Dieplingerlll, A. Jahrausl, G. Griffithsl, L. A. Huberlo, M. Desjardins, J. E. Celis, G. van Meer, H. Dieplinger, a Jahraus, G. Griffiths, and L. a Huber, “Molecular characterization of phagosomes.,” J. Biol. Chem., vol. 269, no. 51, pp. 32194–200, Dec. 1994.
[179] C. Bissig and J. Gruenberg, “Lipid sorting and multivesicular endosome biogenesis,” Cold Spring Harb. Perspect. Biol., vol. 5, no. 10, 2013.
[180] K. K. Huynh, E. Gershenzon, and S. Grinstein, “Cholesterol accumulation by macrophages impairs phagosome maturation,” J. Biol. Chem., vol. 283, no. 51, pp. 35745–35755, 2008.

Literature
140
[181] C. de Chastellier, “The many niches and strategies used by pathogenic mycobacteria for survival within host macrophages.,” Immunobiology, vol. 214, no. 7, pp. 526–42, Jul. 2009.
[182] G. Cook, M. Berney, and S. Gebhard, “Physiology of mycobacteria,” … Microb. Physiol., vol. 2911, no. 09, 2009.
[183] T. Yeung, B. Heit, J.-F. Dubuisson, G. D. Fairn, B. Chiu, R. Inman, A. Kapus, M. Swanson, and S. Grinstein, “Contribution of phosphatidylserine to membrane surface charge and protein targeting during phagosome maturation.,” J. Cell Biol., vol. 185, no. 5, pp. 917–28, Jun. 2009.
[184] D. G. Russell, J. Dant, and S. Sturgill-Koszycki, “Mycobacterium avium- and Mycobacterium tuberculosis-containing vacuoles are dynamic, fusion-competent vesicles that are accessible to glycosphingolipids from the host cell plasmalemma.,” J. Immunol., vol. 156, no. 12, pp. 4764–73, Jun. 1996.
[185] T. Kobayashi, E. Stang, K. S. Fang, P. de Moerloose, R. G. Parton, and J. Gruenberg, “A lipid associated with the antiphospholipid syndrome regulates endosome structure and function.,” Nature, vol. 392, no. 6672, pp. 193–7, Mar. 1998.
[186] J. R. Wherrett and S. Huterer, “Bis-(monoacylglyceryl)-phosphate of rat and human liver: fatty acid composition and NMR spectroscopy.,” Lipids, vol. 8, no. 9, pp. 531–3, Sep. 1973.
[187] S. Huterer and J. Wherrett, “Metabolism of bis(monoacylglycero)phosphate in macrophages.,” J. Lipid Res., vol. 20, no. 8, pp. 966–73, Nov. 1979.
[188] C. Luquain, R. Dolmazon, J. M. Enderlin, C. Laugier, M. Lagarde, and J. F. Pageaux, “Bis(monoacylglycerol) phosphate in rat uterine stromal cells: structural characterization and specific esterification of docosahexaenoic acid.,” Biochem. J., vol. 351 Pt 3, pp. 795–804, Nov. 2000.
[189] T. Thornburg, C. Miller, T. Thuren, L. King, and M. Waite, “Glycerol reorientation during the conversion of phosphatidylglycerol to bis(monoacylglycerol)phosphate in macrophage-like RAW 264.7 cells.,” J. Biol. Chem., vol. 266, no. 11, pp. 6834–40, Apr. 1991.
[190] C. Bissig, M. Lenoir, M.-C. Velluz, I. Kufareva, R. Abagyan, M. Overduin, and J. Gruenberg, “Viral infection controlled by a calcium-dependent lipid-binding module in ALIX.,” Dev. Cell, vol. 25, no. 4, pp. 364–73, May 2013.
[191] J. Chevallier, Z. Chamoun, G. Jiang, G. Prestwich, N. Sakai, S. Matile, R. G. Parton, and J. Gruenberg, “Lysobisphosphatidic acid controls endosomal cholesterol levels.,” J. Biol. Chem., vol. 283, no. 41, pp. 27871–80, Oct. 2008.

Supplementary material
141
Supplementary material
Table 0-1: List of all proteins identified in control and TDM bead phagosomes. Identified protein Accession number EUSC
control EUSC TDM
1. Collagen alpha-2(I) chain sp|Q01149|CO1A2_MOUSE 0 3
2. MCG129639 tr|G3UW73|G3UW73_MOUSE 0 2
3. Uncharacterized protein tr|E9Q9X1|E9Q9X1_MOUSE 0 2
4. Cytohesin-4 (Fragment) tr|Q571J1|Q571J1_MOUSE 0 2
5. Keratin, type II cytoskeletal 4 sp|P07744|K2C4_MOUSE 0 9
6. contamination K2M2_SHEEP 0 6
7. Vesicle-associated membrane protein 8
sp|O70404|VAMP8_MOUSE 0 4
8. contamination K1C15_SHEEP 0 2
9. Thioredoxin sp|P10639|THIO_MOUSE 0 2
10. MCG49183 tr|Q14AA6|Q14AA6_MOUSE 0 2
11. Prosaposin, isoform CRA_a tr|Q8BFQ1|Q8BFQ1_MOUSE 0 2
12. contamination K1H4_HUMAN 0 5
13. Proteolipid protein 2 sp|Q9R1Q7|PLP2_MOUSE 0 2
14. Catenin delta-1 tr|D3Z7H6|D3Z7H6_MOUSE 0 2
15. Eukaryotic translation initiation factor 2B, subunit 3
tr|B1AUN2|B1AUN2_MOUSE 0 2
16. V-type proton ATPase subunit S1 sp|Q9R1Q9|VAS1_MOUSE 0 2
17. Disintegrin and metalloproteinase domain-containing protein 10
sp|O35598|ADA10_MOUSE 0 3
18. Programmed cell death protein 6 sp|P12815|PDCD6_MOUSE 0 4
19. La-related protein 4 tr|G3X9Q6|G3X9Q6_MOUSE (+2)
0 2
20. Electron transfer flavoprotein subunit beta
sp|Q9DCW4|ETFB_MOUSE 0 2
21. Uncharacterized protein tr|Q3USX5|Q3USX5_MOUSE 0 2
22. Beta-hexosaminidase subunit beta sp|P20060|HEXB_MOUSE 0 2
23. contamination KRHB4_HUMAN 0 8
24. Charged multivesicular body protein 1a
sp|Q921W0|CHM1A_MOUSE 0 2
25. Isoform II of Macrophage scavenger receptor types I and II
sp|P30204-2|MSRE_MOUSE 0 2
26. Tissue alpha-L-fucosidase sp|Q99LJ1|FUCO_MOUSE 0 2
27. Acetyl-CoA acetyltransferase, mitochondrial
sp|Q8QZT1|THIL_MOUSE 0 5
28. 60S ribosomal protein L12 sp|P35979|RL12_MOUSE 0 2
29. Isoform 3 of Mitogen-activated protein kinase 14
sp|P47811-3|MK14_MOUSE 0 2
30. Zinc finger E-box-binding homeobox 2
tr|H9H9S3|H9H9S3_MOUSE 0 2
31. Transporter tr|E9PXG1|E9PXG1_MOUSE 0 6
32. Envoplakin sp|Q9D952|EVPL_MOUSE 0 3
33. Isoform 2 of C-terminal-binding protein 2
sp|P56546-2|CTBP2_MOUSE 0 3
34. Dedicator of cytokinesis protein 8 sp|Q8C147|DOCK8_MOUSE 0 3
35. Succinate dehydrogenase [ubiquinone] iron-sulfur subunit, mitochondrial
sp|Q9CQA3|DHSB_MOUSE 0 2
36. von Willebrand factor A domain-containing protein 5A
sp|Q99KC8|VMA5A_MOUSE 0 4

Supplementary material
142
37. Annexin A5 sp|P48036|ANXA5_MOUSE 0 9
38. Histone-arginine methyltransferase CARM1
tr|D3YUP1|D3YUP1_MOUSE 0 2
39. Replication factor C subunit 5 sp|Q9D0F6|RFC5_MOUSE 0 3
40. Proteasome subunit beta type-4 sp|P99026|PSB4_MOUSE 0 2
41. Tyrosine-protein phosphatase non-receptor type 9
sp|O35239|PTN9_MOUSE 0 4
42. Ran GTPase-activating protein 1 tr|F8WGD1|F8WGD1_MOUSE 0 6
43. Protein FAM49B sp|Q921M7|FA49B_MOUSE 0 2
44. Pleckstrin homology domain-containing family O member 2
sp|Q8K124|PKHO2_MOUSE 0 2
45. T-complex protein 1 subunit theta sp|P42932|TCPQ_MOUSE 0 3
46. Sorting nexin-2 sp|Q9CWK8|SNX2_MOUSE 0 2
47. UPF0760 protein C2orf29 homolog sp|Q9CWN7|CB029_MOUSE 0 2
48. MCG13663, isoform CRA_a tr|G5E829|G5E829_MOUSE 0 2
49. Coatomer subunit beta tr|E9PYW9|E9PYW9_MOUSE 0 2
50. Histone acetyltransferase p300 sp|B2RWS6|EP300_MOUSE 0 3
51. 60S ribosomal protein L30 sp|P62889|RL30_MOUSE 0 2
52. Isoform 3 of Protein SMG7 sp|Q5RJH6-3|SMG7_MOUSE 0 2
53. Sciellin sp|Q9EQG3|SCEL_MOUSE 0 3
54. Mannosyl-oligosaccharide glucosidase
sp|Q80UM7|MOGS_MOUSE 0 2
55. Pyrroline-5-carboxylate reductase 2 sp|Q922Q4|P5CR2_MOUSE 0 4
56. Inositol 1,4,5-trisphosphate receptor type 2
sp|Q9Z329|ITPR2_MOUSE 0 3
57. JNK1 beta1 protein kinase tr|A6P3E4|A6P3E4_MOUSE 0 2
58. Disabled homolog 2 tr|E9QL31|E9QL31_MOUSE 0 2
59. Lymphokine-activated killer T-cell-originated protein kinase
sp|Q9JJ78|TOPK_MOUSE 0 2
60. Isoform Short of H-2 class II histocompatibility antigen gamma chain
sp|P04441-2|HG2A_MOUSE 0 2
61. ADP-ribosylation factor-binding protein GGA2
sp|Q6P5E6|GGA2_MOUSE 0 7
62. Dolichyl-diphosphooligosaccharide--protein glycosyltransferase subunit STT3B
sp|Q3TDQ1|STT3B_MOUSE 0 3
63. 60S ribosomal protein L7 (Fragment) tr|F6XI62|F6XI62_MOUSE 0 4
64. 28S ribosomal protein S23, mitochondrial
sp|Q8VE22|RT23_MOUSE 0 4
65. ATP-dependent RNA helicase DDX24
tr|F8WJA0|F8WJA0_MOUSE 0 2
66. Eukaryotic translation initiation factor 3 subunit F
sp|Q9DCH4|EIF3F_MOUSE 0 2
67. Isoform 2 of Cyclin-G-associated kinase
sp|Q99KY4-2|GAK_MOUSE (+1)
0 2
68. Sodium-coupled neutral amino acid transporter 2
sp|Q8CFE6|S38A2_MOUSE 0 2
69. Probable helicase with zinc finger domain
sp|Q6DFV5|HELZ_MOUSE 0 3
70. Probable ATP-dependent RNA helicase DDX17
sp|Q501J6|DDX17_MOUSE 0 3
71. Prolactin regulatory element-binding protein
sp|Q9WUQ2|PREB_MOUSE 0 2
72. Serine/threonine-protein kinase Chk1 sp|O35280|CHK1_MOUSE 0 2
73. Serine incorporator 1 sp|Q9QZI8|SERC1_MOUSE 0 2

Supplementary material
143
74. contamination K1M1_SHEEP 0 5
75. 40S ribosomal protein S8 tr|D3YW44|D3YW44_MOUSE 0 4
76. Transmembrane protein 55B tr|F8WHW3|F8WHW3_MOUSE (+1)
0 2
77. Protein Ahnak2 (Fragment) tr|F7DBB3|F7DBB3_MOUSE 0 2
78. Growth arrest specific 7 tr|B1ATI9|B1ATI9_MOUSE 0 2
79. Proline-serine-threonine phosphatase-interacting protein 1
sp|P97814|PPIP1_MOUSE 0 2
80. FXYD domain-containing ion transport regulator 5
sp|P97808|FXYD5_MOUSE 0 2
81. Beclin-1 sp|O88597|BECN1_MOUSE 0 2
82. Ubiquinone biosynthesis protein COQ9, mitochondrial
sp|Q8K1Z0|COQ9_MOUSE 0 2
83. Glucosamine--fructose-6-phosphate aminotransferase [isomerizing] 1
sp|P47856|GFPT1_MOUSE 0 2
84. Short-chain specific acyl-CoA dehydrogenase, mitochondrial
sp|Q07417|ACADS_MOUSE 0 2
85. Sister chromatid cohesion protein PDS5 homolog B
sp|Q4VA53|PDS5B_MOUSE 0 2
86. Presequence protease, mitochondrial sp|Q8K411|PREP_MOUSE 0 2
87. U3 small nucleolar ribonucleoprotein protein IMP4
sp|Q8VHZ7|IMP4_MOUSE 0 2
88. Tripartite motif-containing protein 14 sp|Q8BVW3|TRI14_MOUSE 0 2
89. Sphingomyelin phosphodiesterase sp|Q04519|ASM_MOUSE 0 2
90. Myeloid leukemia factor 2 sp|Q99KX1|MLF2_MOUSE 0 2
91. RAB34, member of RAS oncogene family (Fragment)
tr|B1AQD4|B1AQD4_MOUSE 0 2
92. Syntaxin-12 sp|Q9ER00|STX12_MOUSE 0 3
93. Isoform 4 of Unconventional myosin-Ic
sp|Q9WTI7-4|MYO1C_MOUSE 0 2
94. EF hand domain containing 2 tr|Q8C845|Q8C845_MOUSE 0 3
95. Glutathione S-transferase P 1 sp|P19157|GSTP1_MOUSE 0 2
96. Apoptosis-inducing factor 1, mitochondrial
sp|Q9Z0X1|AIFM1_MOUSE 0 5
97. 39S ribosomal protein L37, mitochondrial
sp|Q921S7|RM37_MOUSE 0 3
98. WD repeat-containing protein mio sp|Q8VE19|MIO_MOUSE 0 3
99. High affinity immunoglobulin gamma Fc receptor I
sp|P26151|FCGR1_MOUSE 0 4
100. SLP adapter and CSK-interacting membrane protein
sp|Q3UU41|SCIMP_MOUSE 0 4
101. N-acylneuraminate cytidylyltransferase
sp|Q99KK2|NEUA_MOUSE 0 2
102. Lamin-B1 sp|P14733|LMNB1_MOUSE 0 4
103. Fibrinogen beta chain sp|Q8K0E8|FIBB_MOUSE 0 4
104. Tyrosine-protein kinase JAK1 sp|P52332|JAK1_MOUSE 0 2
105. Guanine nucleotide-binding protein G(I)/G(S)/G(O) subunit gamma
sp|Q9DAS9|GBG12_MOUSE 0 4
106. Isoform 3 of Vacuolar protein sorting-associated protein 37A
sp|Q8CHS8-3|VP37A_MOUSE (+1)
0 2
107. Condensin complex subunit 2 sp|Q8C156|CND2_MOUSE 0 2
108. Tryptophan--tRNA ligase, cytoplasmic
sp|P32921|SYWC_MOUSE 0 4
109. Methyltransferase-like protein 9 sp|Q9EPL4|METL9_MOUSE 0 2
110. Copine-3 sp|Q8BT60|CPNE3_MOUSE 0 2

Supplementary material
144
111. Homocysteine-responsive endoplasmic reticulum-resident ubiquitin-like domain member 1 protein
sp|Q9JJK5|HERP1_MOUSE (+1)
0 2
112. Coiled-coil domain-containing protein 115
sp|Q8VE99|CC115_MOUSE 0 2
113. Protein Serpinb6a tr|F8WIV2|F8WIV2_MOUSE 0 2
114. Far upstream element-binding protein 1
tr|Q3TUE1|Q3TUE1_MOUSE 0 2
115. 60S ribosomal protein L13 tr|E9PZ94|E9PZ94_MOUSE 0 2
116. Heat shock protein beta-8 sp|Q9JK92|HSPB8_MOUSE 0 2
117. Bone marrow stromal antigen 2 sp|Q8R2Q8|BST2_MOUSE 0 2
118. MCG129854 tr|G3X9C2|G3X9C2_MOUSE 0 2
119. Aldehyde dehydrogenase tr|B1AV77|B1AV77_MOUSE (+1)
0 2
120. Isoform 2 of Drebrin-like protein sp|Q62418-2|DBNL_MOUSE 0 3
121. AT-rich interactive domain-containing protein 3A
sp|Q62431|ARI3A_MOUSE 0 3
122. NADH dehydrogenase [ubiquinone] 1 beta subcomplex subunit 7
sp|Q9CR61|NDUB7_MOUSE 0 2
123. Uncharacterized protein tr|Q7TQE2|Q7TQE2_MOUSE 0 2
124. DNA ligase (Fragment) tr|D3YUC0|D3YUC0_MOUSE 0 2
125. COMM domain-containing protein 7 sp|Q8BG94|COMD7_MOUSE 0 2
126. Sestrin-1 tr|E9PXR3|E9PXR3_MOUSE 0 2
127. Retinol dehydrogenase 13 sp|Q8CEE7|RDH13_MOUSE 0 3
128. Syntaxin-4 sp|P70452|STX4_MOUSE 0 2
129. Serine beta-lactamase-like protein LACTB, mitochondrial
sp|Q9EP89|LACTB_MOUSE 0 2
130. DnaJ homolog subfamily C member 9 sp|Q91WN1|DNJC9_MOUSE 0 2
131. 60S ribosomal protein L18 (Fragment)
tr|G3UZJ6|G3UZJ6_MOUSE 0 2
132. Uncharacterized protein tr|E9PWX5|E9PWX5_MOUSE 0 2
133. Dual specificity protein phosphatase 14
sp|Q9JLY7|DUS14_MOUSE 0 4
134. YTH domain family 1 tr|A2AWN8|A2AWN8_MOUSE (+1)
0 2
135. 15 kDa selenoprotein sp|Q9ERR7|SEP15_MOUSE 0 2
136. Rab22B tr|Q3TXV4|Q3TXV4_MOUSE 2 13
137. Valine--tRNA ligase sp|Q9Z1Q9|SYVC_MOUSE 2 11
138. Vesicle-associated membrane protein 7
sp|P70280|VAMP7_MOUSE 3 15
139. Ras-related protein Rab-11A sp|P62492|RB11A_MOUSE 2 9
140. Protein 5730469M10Rik tr|Q3U125|Q3U125_MOUSE (+1)
3 12
141. MCG130981 tr|G3UW34|G3UW34_MOUSE 2 7
142. Sec1 family domain-containing protein 1
sp|Q8BRF7|SCFD1_MOUSE 2 7
143. Mitochondrial import inner membrane translocase subunit TIM44
sp|O35857|TIM44_MOUSE 2 7
144. NADH dehydrogenase [ubiquinone] flavoprotein 2, mitochondrial
sp|Q9D6J6|NDUV2_MOUSE 2 7
145. Annexin A1 sp|P10107|ANXA1_MOUSE 5 17
146. Cofilin-1 tr|F8WGL3|F8WGL3_MOUSE 4 13
147. Profilin-1 sp|P62962|PROF1_MOUSE 7 22
148. Annexin tr|F8WIT2|F8WIT2_MOUSE 8 25

Supplementary material
145
149. Interferon-induced transmembrane protein 3
sp|Q9CQW9|IFM3_MOUSE 6 18
150. Ubiquitin-associated protein 2-like sp|Q80X50|UBP2L_MOUSE 2 6
151. Ribosomal RNA-processing protein 1 homolog A
tr|E9QL52|E9QL52_MOUSE 2 6
152. Integrin alpha-4 tr|E9QK91|E9QK91_MOUSE (+1)
3 9
153. Ras-related protein Rap-1b sp|Q99JI6|RAP1B_MOUSE 3 9
154. Transmembrane emp24 domain-containing protein 9
sp|Q99KF1|TMED9_MOUSE 2 6
155. High affinity immunoglobulin epsilon receptor subunit gamma
sp|P20491|FCERG_MOUSE 2 6
156. Mitochondrial import receptor subunit TOM34
sp|Q9CYG7|TOM34_MOUSE 3 9
157. Isoform 2 of Regulation of nuclear pre-mRNA domain-containing protein 2
sp|Q6NXI6-2|RPRD2_MOUSE 2 6
158. Gamma-aminobutyric acid receptor-associated protein-like 2
sp|P60521|GBRL2_MOUSE 2 6
159. Peptidyl-prolyl cis-trans isomerase FKBP11
sp|Q9D1M7|FKB11_MOUSE 2 6
160. Apoptosis regulator BAX sp|Q07813|BAX_MOUSE 2 6
161. 17beta-hydroxysteroid dehydrogenase type 10/short chain L-3-hydroxyacyl-CoA dehydrogenase
tr|Q99N15|Q99N15_MOUSE 3 8
162. Tyrosine-protein kinase BAZ1B sp|Q9Z277|BAZ1B_MOUSE 3 8
163. Protein Ythdf2 tr|E9Q2W5|E9Q2W5_MOUSE 3 8
164. 60S ribosomal protein L22 sp|P67984|RL22_MOUSE 7 18
165. Protein Dnajc13 tr|D4AFX7|D4AFX7_MOUSE 2 5
166. Vesicle-associated membrane protein 3
sp|P63024|VAMP3_MOUSE 8 20
167. FK506-binding protein 15 sp|Q6P9Q6|FKB15_MOUSE 2 5
168. Periplakin sp|Q9R269|PEPL_MOUSE 2 5
169. Copine VIII tr|B2RS65|B2RS65_MOUSE 2 5
170. Ubiquitin-like modifier-activating enzyme 1
sp|Q02053|UBA1_MOUSE 2 5
171. Hematopoietic lineage cell-specific protein
sp|P49710|HCLS1_MOUSE 2 5
172. Synaptosomal-associated protein tr|Q9D3L3|Q9D3L3_MOUSE 7 17
173. Cytochrome c oxidase subunit 4 isoform 1, mitochondrial
sp|P19783|COX41_MOUSE 5 12
174. Protein ERGIC-53 sp|Q9D0F3|LMAN1_MOUSE 5 12
175. Voltage-dependent anion-selective channel protein 3
sp|Q60931|VDAC3_MOUSE 5 12
176. MKIAA1699 protein (Fragment) tr|Q69ZD1|Q69ZD1_MOUSE 5 12
177. Signal recognition particle 68 kDa protein
sp|Q8BMA6|SRP68_MOUSE 8 19
178. Cation-dependent mannose-6-phosphate receptor
sp|P24668|MPRD_MOUSE 3 7
179. Vacuolar protein sorting-associated protein 11 homolog
sp|Q91W86|VPS11_MOUSE 3 7
180. Pescadillo homolog tr|Q5SQ20|Q5SQ20_MOUSE 6 14
181. Elongation factor 2 sp|P58252|EF2_MOUSE 4 9
182. Neutrophil cytosol factor 2 sp|O70145|NCF2_MOUSE 4 9
183. Multifunctional protein ADE2 sp|Q9DCL9|PUR6_MOUSE 4 9

Supplementary material
146
184. Electron transfer flavoprotein-ubiquinone oxidoreductase, mitochondrial
sp|Q921G7|ETFD_MOUSE 4 9
185. Cytosolic phospholipase A2 sp|P47713|PA24A_MOUSE 5 11
186. Ras-related protein Rab-8A sp|P55258|RAB8A_MOUSE 12 26
187. Lysosomal protective protein tr|G3X8T3|G3X8T3_MOUSE 6 13
188. Ras-related protein Rab-10 sp|P61027|RAB10_MOUSE 6 13
189. Nucleolar protein 58 sp|Q6DFW4|NOP58_MOUSE 6 13
190. Histone H4 sp|P62806|H4_MOUSE 13 28
191. Uncharacterized protein tr|E9PZV5|E9PZV5_MOUSE 11 22
192. 40S ribosomal protein S16 sp|P14131|RS16_MOUSE 2 4
193. YLP motif-containing protein 1 tr|D3YWX2|D3YWX2_MOUSE 6 12
194. Major facilitator superfamily domain-containing protein 1
sp|Q9DC37|MFSD1_MOUSE 4 8
195. Synaptic vesicle membrane protein VAT-1 homolog
sp|Q62465|VAT1_MOUSE 6 12
196. Uncharacterized protein tr|E9Q6H6|E9Q6H6_MOUSE 4 8
197. ATP-dependent RNA helicase DDX18
sp|Q8K363|DDX18_MOUSE 6 12
198. DnaJ homolog subfamily C member 7 sp|Q9QYI3|DNJC7_MOUSE 6 12
199. Unconventional myosin-Ie sp|E9Q634|MYO1E_MOUSE 6 12
200. V-type proton ATPase subunit F sp|Q9D1K2|VATF_MOUSE 4 8
201. Transmembrane protein 144 sp|Q8VEH0|TM144_MOUSE 3 6
202. Ras-related protein Rab-35 sp|Q6PHN9|RAB35_MOUSE 2 4
203. Nucleolar RNA helicase 2 sp|Q9JIK5|DDX21_MOUSE 5 10
204. Cytochrome b-c1 complex subunit 1, mitochondrial
sp|Q9CZ13|QCR1_MOUSE 3 6
205. Isoform 2 of Tyrosine-protein phosphatase non-receptor type 23
sp|Q6PB44-2|PTN23_MOUSE (+1)
3 6
206. Cytochrome b5 type B sp|Q9CQX2|CYB5B_MOUSE 3 6
207. Heat shock 70 kDa protein 4L sp|P48722|HS74L_MOUSE 2 4
208. Ras-related protein Rab-5A sp|Q9CQD1|RAB5A_MOUSE 2 4
209. Ras-related protein Rab-32 sp|Q9CZE3|RAB32_MOUSE 2 4
210. Folliculin sp|Q8QZS3|FLCN_MOUSE 2 4
211. 40S ribosomal protein S6 tr|D3Z6N6|D3Z6N6_MOUSE 3 6
212. IgE-binding protein sp|P03975|IGEB_MOUSE 3 6
213. MCG11326, isoform CRA_b tr|D3YWT1|D3YWT1_MOUSE 2 4
214. SEC23-interacting protein sp|Q6NZC7|S23IP_MOUSE 2 4
215. Sec11-like 1 (S. cerevisiae), isoform CRA_e
tr|D3Z569|D3Z569_MOUSE 3 6
216. CDP-diacylglycerol--inositol 3-phosphatidyltransferase
sp|Q8VDP6|CDIPT_MOUSE 2 4
217. Golgi-associated plant pathogenesis-related protein 1
sp|Q9CYL5|GAPR1_MOUSE 2 4
218. Rho GDP-dissociation inhibitor 1 sp|Q99PT1|GDIR1_MOUSE 2 4
219. Plastin-2 sp|Q61233|PLSL_MOUSE 16 30
220. RAS-related C3 botulinum substrate 1, isoform CRA_a
tr|Q3TLP8|Q3TLP8_MOUSE 8 15
221. Mitochondrial import receptor subunit TOM22 homolog
sp|Q9CPQ3|TOM22_MOUSE 8 15
222. Receptor-interacting serine/threonine-protein kinase 1
sp|Q60855|RIPK1_MOUSE 7 13
223. Capping protein (Actin filament) muscle Z-line, alpha 1
tr|Q5RKN9|Q5RKN9_MOUSE 7 13

Supplementary material
147
224. Tumor susceptibility gene 101 protein sp|Q61187|TS101_MOUSE 10 18
225. Adenylyl cyclase-associated protein 1 sp|P40124|CAP1_MOUSE 5 9
226. Peroxisomal membrane protein 11B tr|D6RFQ2|D6RFQ2_MOUSE 5 9
227. Peroxiredoxin 1 (Fragment) tr|B1AXW5|B1AXW5_MOUSE 14 25
228. ADP-ribosylation factor-like protein 8A
sp|Q8VEH3|ARL8A_MOUSE 4 7
229. ADP-ribosylation factor 4 sp|P61750|ARF4_MOUSE (+1) 12 21
230. contamination K1H1_HUMAN 8 14
231. Eukaryotic initiation factor 4A-III sp|Q91VC3|IF4A3_MOUSE 8 14
232. Beta-parvin sp|Q9ES46|PARVB_MOUSE 4 7
233. Ras-related protein Rab-7a sp|P51150|RAB7A_MOUSE 35 61
234. Eukaryotic translation initiation factor 3 subunit E
sp|P60229|EIF3E_MOUSE 3 5
235. Ras-related protein Rab-2A sp|P53994|RAB2A_MOUSE 12 20
236. Inositol 1,4,5-trisphosphate receptor type 3
sp|P70227|ITPR3_MOUSE 6 10
237. Guanine nucleotide-binding protein G(k) subunit alpha
sp|Q9DC51|GNAI3_MOUSE 6 10
238. Small subunit processome component 20 homolog
tr|E9QK83|E9QK83_MOUSE 6 10
239. Vesicle-associated membrane protein 4
sp|O70480|VAMP4_MOUSE 6 10
240. Probable cation-transporting ATPase 13A2
sp|Q9CTG6|AT132_MOUSE 6 10
241. Actin-related protein 3 sp|Q99JY9|ARP3_MOUSE 3 5
242. Stromal cell-derived factor 2-like protein 1
sp|Q9ESP1|SDF2L_MOUSE 3 5
243. Metaxin-2 sp|O88441|MTX2_MOUSE 3 5
244. 40S ribosomal protein S18 sp|P62270|RS18_MOUSE (+1) 14 23
245. Actin-related protein 2 sp|P61161|ARP2_MOUSE 11 18
246. Arf-GAP domain and FG repeat-containing protein 2
sp|Q80WC7|AGFG2_MOUSE (+1)
24 39
247. 3-ketoacyl-CoA thiolase A, peroxisomal
sp|Q921H8|THIKA_MOUSE 8 13
248. Probable phospholipid-transporting ATPase IIB
sp|P98195|ATP9B_MOUSE 8 13
249. Translocon-associated protein subunit delta
sp|Q62186|SSRD_MOUSE (+1)
13 21
250. Tripeptidyl-peptidase 1 sp|O89023|TPP1_MOUSE 5 8
251. Fermitin family homolog 3 sp|Q8K1B8|URP2_MOUSE 20 32
252. Protein Rab1 tr|H7BX41|H7BX41_MOUSE 5 8
253. Vesicle-trafficking protein SEC22b sp|O08547|SC22B_MOUSE 5 8
254. Uncharacterized protein tr|E9Q390|E9Q390_MOUSE 19 30
255. Succinyl-CoA ligase [GDP-forming] subunit beta, mitochondrial
sp|Q9Z2I8|SUCB2_MOUSE 7 11
256. Monocyte differentiation antigen CD14
sp|P10810|CD14_MOUSE 16 25
257. Voltage-dependent anion-selective channel protein 1
sp|Q60932|VDAC1_MOUSE 27 42
258. Nicalin tr|D3YU17|D3YU17_MOUSE 9 14
259. Aldehyde dehydrogenase family 3 member B1
sp|Q80VQ0|AL3B1_MOUSE 11 17
260. Ras-related protein Rap-1A sp|P62835|RAP1A_MOUSE 15 23
261. Annexin A7 sp|Q07076|ANXA7_MOUSE (+1)
27 41

Supplementary material
148
262. V-type proton ATPase 16 kDa proteolipid subunit
sp|P63082|VATL_MOUSE 2 3
263. N-acetyltransferase 10 sp|Q8K224|NAT10_MOUSE 10 15
264. Asparagine synthetase [glutamine-hydrolyzing]
sp|Q61024|ASNS_MOUSE 8 12
265. Signal peptidase complex subunit 2 sp|Q9CYN2|SPCS2_MOUSE 10 15
266. Ras-related protein R-Ras2 sp|P62071|RRAS2_MOUSE 10 15
267. Trimeric intracellular cation channel type B
sp|Q9DAV9|TM38B_MOUSE 8 12
268. Succinate dehydrogenase [ubiquinone] flavoprotein subunit, mitochondrial
sp|Q8K2B3|DHSA_MOUSE 12 18
269. Transcription intermediary factor 1-beta
sp|Q62318|TIF1B_MOUSE 2 3
270. Transmembrane emp24 domain-containing protein 10
sp|Q9D1D4|TMEDA_MOUSE 6 9
271. ATP synthase subunit d, mitochondrial
sp|Q9DCX2|ATP5H_MOUSE (+1)
6 9
272. Proteasome subunit alpha type-7 sp|Q9Z2U0|PSA7_MOUSE 4 6
273. Protein Trip12 tr|G5E870|G5E870_MOUSE 2 3
274. Endoplasmic reticulum aminopeptidase
sp|Q9EQH2|ERAP1_MOUSE 2 3
275. ADP-ribosylation factor 5 sp|P84084|ARF5_MOUSE 8 12
276. Heterogeneous nuclear ribonucleoprotein A/B
sp|Q99020|ROAA_MOUSE 4 6
277. Heterochromatin protein 1-binding protein 3
sp|Q3TEA8|HP1B3_MOUSE 2 3
278. Actin-related protein 2/3 complex subunit 4
sp|P59999|ARPC4_MOUSE 4 6
279. Long-chain-fatty-acid--CoA ligase 3 sp|Q9CZW4|ACSL3_MOUSE 4 6
280. 14-3-3 protein eta sp|P68510|1433F_MOUSE 2 3
281. Zinc finger FYVE domain-containing protein 1
sp|Q810J8|ZFYV1_MOUSE 2 3
282. Ubiquitin-conjugating enzyme E2 variant 3
sp|Q3U1V6|UEVLD_MOUSE 4 6
283. B-cell leukemia/lymphoma 2 related protein A1b
tr|Q497M6|Q497M6_MOUSE 2 3
284. Synergin gamma sp|Q5SV85|SYNRG_MOUSE 2 3
285. Prostaglandin E synthase 2 sp|Q8BWM0|PGES2_MOUSE 2 3
286. Sideroflexin-1 sp|Q99JR1|SFXN1_MOUSE 2 3
287. 40S ribosomal protein S4, X isoform sp|P62702|RS4X_MOUSE 17 25
288. Macrophage-expressed gene 1 protein
sp|A1L314|MPEG1_MOUSE 13 19
289. Uncharacterized protein (Fragment) tr|Q3U505|Q3U505_MOUSE 25 36
290. Cathepsin sp|P10605|CATB_MOUSE 7 10
291. Rho-related GTP-binding protein RhoG
sp|P84096|RHOG_MOUSE 14 20
292. Vacuolar protein sorting 16 (Yeast) tr|G3X8X7|G3X8X7_MOUSE 7 10
293. ADP-ribosylation factor 6 sp|P62331|ARF6_MOUSE 26 37
294. T-complex protein 1 subunit eta sp|P80313|TCPH_MOUSE 26 37
295. Annexin A4 sp|P97429|ANXA4_MOUSE 26 37
296. Integrin beta-2 sp|P11835|ITB2_MOUSE 20 28
297. Prohibitin-2 sp|O35129|PHB2_MOUSE 15 21
298. Solute carrier family 2, facilitated glucose transporter member 1
sp|P17809|GTR1_MOUSE 5 7

Supplementary material
149
299. Eukaryotic translation initiation factor 3 subunit A
sp|P23116|EIF3A_MOUSE 5 7
300. WD repeat-containing protein 91 sp|Q7TMQ7|WDR91_MOUSE 5 7
301. Eukaryotic translation initiation factor 3 subunit C
sp|Q8R1B4|EIF3C_MOUSE 5 7
302. Isoform 2 of Tyrosine-protein kinase Lyn
sp|P25911-2|LYN_MOUSE (+1)
5 7
303. Transferrin receptor protein 1 sp|Q62351|TFR1_MOUSE 23 32
304. Clathrin interactor 1 tr|Q5SUH7|Q5SUH7_MOUSE 16 22
305. Prostaglandin G/H synthase 1 sp|P22437|PGH1_MOUSE 8 11
306. Nucleoporin NUP188 homolog sp|Q6ZQH8|NU188_MOUSE 8 11
307. DEAH (Asp-Glu-Ala-His) box polypeptide 37
tr|Q6NZL1|Q6NZL1_MOUSE 8 11
308. 4F2 cell-surface antigen heavy chain tr|G3UWA6|G3UWA6_MOUSE 11 15
309. 40S ribosomal protein S14 sp|P62264|RS14_MOUSE 11 15
310. ATP-binding cassette sub-family E member 1
sp|P61222|ABCE1_MOUSE 11 15
311. Protein Nup205 tr|F6PXL5|F6PXL5_MOUSE 25 34
312. Cyclin-dependent kinase 1 sp|P11440|CDK1_MOUSE 17 23
313. ADP-ribosylation factor 1 sp|P84078|ARF1_MOUSE 29 39
314. Myb-binding protein 1A sp|Q7TPV4|MBB1A_MOUSE 35 47
315. RAB14, member RAS oncogene family
tr|A2AL34|A2AL34_MOUSE 24 32
316. Plexin-B2 sp|B2RXS4|PLXB2_MOUSE 6 8
317. Receptor-type tyrosine-protein phosphatase C
tr|F8WHG6|F8WHG6_MOUSE 6 8
318. Coronin-1A sp|O89053|COR1A_MOUSE 3 4
319. E3 ubiquitin-protein ligase RNF213 sp|E9Q555|RN213_MOUSE 3 4
320. 1-acylglycerol-3-phosphate O-acyltransferase ABHD5
sp|Q9DBL9|ABHD5_MOUSE 6 8
321. 40S ribosomal protein S9 sp|Q6ZWN5|RS9_MOUSE 3 4
322. PERQ amino acid-rich with GYF domain-containing protein 2 (Fragment)
tr|G3UYG6|G3UYG6_MOUSE 3 4
323. Fatty acyl-CoA reductase 1 sp|Q922J9|FACR1_MOUSE 9 12
324. Alpha-actinin-1 sp|Q7TPR4|ACTN1_MOUSE 3 4
325. Vacuolar protein sorting-associated protein 37C
sp|Q8R105|VP37C_MOUSE 6 8
326. NAD-dependent protein deacetylase sirtuin-
sp|Q8VDQ8|SIR2_MOUSE 3 4
327. Synaptosomal-associated protein 47 sp|Q8R570|SNP47_MOUSE 6 8
328. Sorting nexin-5 sp|Q9D8U8|SNX5_MOUSE 3 4
329. Procollagen galactosyltransferase 1 sp|Q8K297|GT251_MOUSE 3 4
330. Interferon-induced transmembrane protein 2
sp|Q99J93|IFM2_MOUSE 3 4
331. ADP-ribosylation factor-like protein 8B
sp|Q9CQW2|ARL8B_MOUSE 37 49
332. Alpha-actinin-4 sp|P57780|ACTN4_MOUSE 25 33
333. Syntaxin-7 sp|O70439|STX7_MOUSE 19 25
334. ATP synthase subunit beta, mitochondrial
sp|P56480|ATPB_MOUSE 89 117
335. Protein LYRIC sp|Q80WJ7|LYRIC_MOUSE 13 17
336. Lysosomal alpha-glucosidase sp|P70699|LYAG_MOUSE 10 13
337. Guanine nucleotide-binding protein subunit beta-2-like 1
sp|P68040|GBLP_MOUSE 14 18

Supplementary material
150
338. Ras-related GTP-binding protein B sp|Q6NTA4|RRAGB_MOUSE 14 18
339. Vacuolar protein sorting 25 (Yeast) tr|A2A4J8|A2A4J8_MOUSE 7 9
340. Galectin-9 tr|B1AQR8|B1AQR8_MOUSE 7 9
341. Capping protein (Actin filament), gelsolin-like
tr|Q99LB4|Q99LB4_MOUSE 14 18
342. Isoform 1B of Synaptogyrin-1 sp|O55100-2|SNG1_MOUSE 14 18
343. Transmembrane protein 63A sp|Q91YT8|TM63A_MOUSE 7 9
344. Cytochrome P450 20A1 sp|Q8BKE6|CP20A_MOUSE 7 9
345. Isoform 2 of Basigin sp|P18572-2|BASI_MOUSE (+1)
11 14
346. Tubulin beta-4B chain sp|P68372|TBB4B_MOUSE 11 14
347. Neutrophil cytosol factor 1 tr|F8WH69|F8WH69_MOUSE 26 33
348. Talin-1 sp|P26039|TLN1_MOUSE 30 38
349. DnaJ homolog subfamily B member 6 sp|O54946|DNJB6_MOUSE 19 24
350. Voltage-dependent anion-selective channel protein 2 (Fragment)
tr|G3UX26|G3UX26_MOUSE 12 15
351. Erlin-2 sp|Q8BFZ9|ERLN2_MOUSE 8 10
352. Guanine nucleotide-binding protein G(I)/G(S)/G(T) subunit beta-1
sp|P62874|GBB1_MOUSE 8 10
353. Ras-related protein Rab-8B sp|P61028|RAB8B_MOUSE 12 15
354. 60S acidic ribosomal protein P0 sp|P14869|RLA0_MOUSE 4 5
355. Protein Gm10036 tr|E9PYL9|E9PYL9_MOUSE 4 5
356. Eukaryotic translation initiation factor 3 subunit I
sp|Q9QZD9|EIF3I_MOUSE 4 5
357. Guanine nucleotide-binding protein subunit alpha-13
sp|P27601|GNA13_MOUSE 4 5
358. Prohibitin sp|P67778|PHB_MOUSE 17 21
359. MCG2650 tr|D3YTT7|D3YTT7_MOUSE 17 21
360. Tyrosine-protein phosphatase non-receptor type 6
sp|P29351|PTN6_MOUSE (+1) 39 48
361. ERO1-like protein alpha sp|Q8R180|ERO1A_MOUSE 13 16
362. Cathepsin D sp|P18242|CATD_MOUSE 22 27
363. Cathepsin Z sp|Q9WUU7|CATZ_MOUSE 9 11
364. Transmembrane protein 106B (Fragment)
tr|D3Z191|D3Z191_MOUSE 9 11
365. NADPH--cytochrome P450 reductase sp|P37040|NCPR_MOUSE 9 11
366. 2'-5'-oligoadenylate synthase 1A tr|F2Z419|F2Z419_MOUSE 9 11
367. Sugar phosphate exchanger 2 sp|Q9WU81|SPX2_MOUSE 24 29
368. Glyceraldehyde-3-phosphate dehydrogenase
tr|E9PX42|E9PX42_MOUSE 53 64
369. V-type proton ATPase subunit C 1 sp|Q9Z1G3|VATC1_MOUSE 44 53
370. Formin-like protein 1 sp|Q9JL26|FMNL_MOUSE 10 12
371. Apoptosis-inducing factor 2 sp|Q8BUE4|AIFM2_MOUSE 10 12
372. Ras-related protein Rap-2b sp|P61226|RAP2B_MOUSE 10 12
373. Ferritin tr|Q9CPX4|Q9CPX4_MOUSE 5 6
374. Brain acid soluble protein 1 sp|Q91XV3|BASP1_MOUSE 5 6
375. Large neutral amino acids transporter small subunit 1
sp|Q9Z127|LAT1_MOUSE 10 12
376. Guanine nucleotide-binding protein G(i) subunit alpha-2
sp|P08752|GNAI2_MOUSE 51 61
377. MKIAA0791 protein (Fragment) tr|Q6ZQ45|Q6ZQ45_MOUSE 21 25
378. Calreticulin sp|P14211|CALR_MOUSE 22 26
379. Electron transfer flavoprotein subunit alpha, mitochondrial
sp|Q99LC5|ETFA_MOUSE 11 13
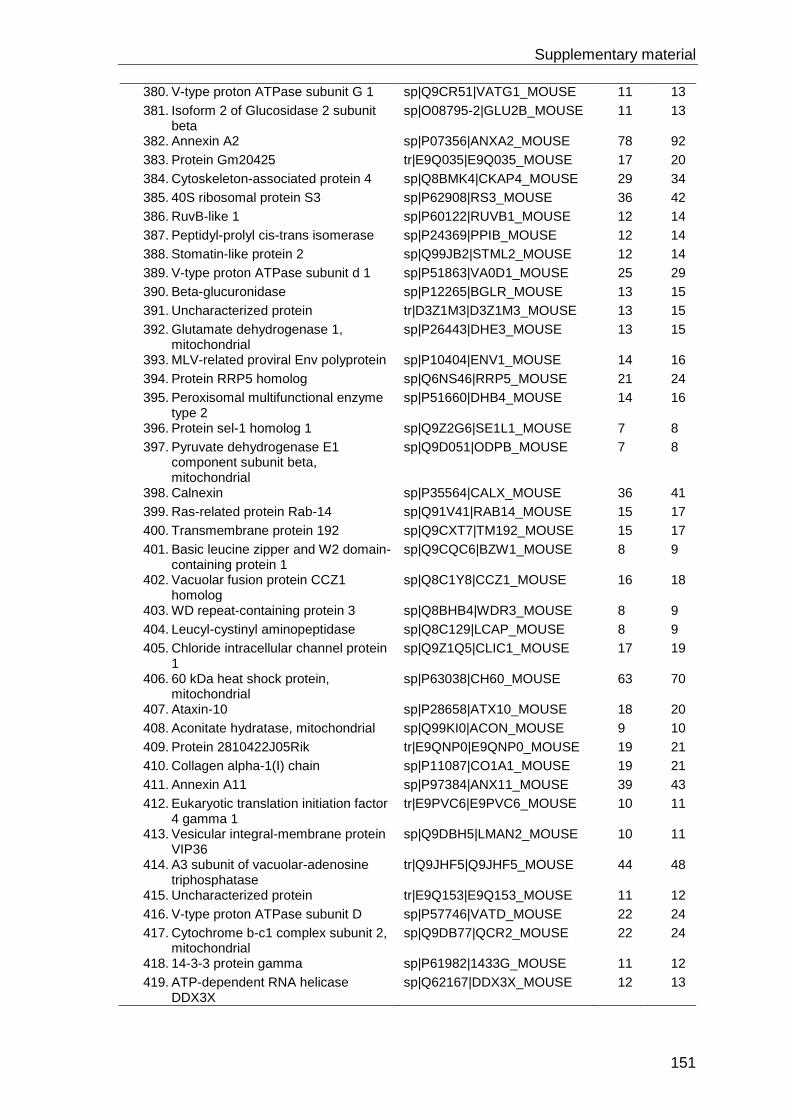
Supplementary material
151
380. V-type proton ATPase subunit G 1 sp|Q9CR51|VATG1_MOUSE 11 13
381. Isoform 2 of Glucosidase 2 subunit beta
sp|O08795-2|GLU2B_MOUSE 11 13
382. Annexin A2 sp|P07356|ANXA2_MOUSE 78 92
383. Protein Gm20425 tr|E9Q035|E9Q035_MOUSE 17 20
384. Cytoskeleton-associated protein 4 sp|Q8BMK4|CKAP4_MOUSE 29 34
385. 40S ribosomal protein S3 sp|P62908|RS3_MOUSE 36 42
386. RuvB-like 1 sp|P60122|RUVB1_MOUSE 12 14
387. Peptidyl-prolyl cis-trans isomerase sp|P24369|PPIB_MOUSE 12 14
388. Stomatin-like protein 2 sp|Q99JB2|STML2_MOUSE 12 14
389. V-type proton ATPase subunit d 1 sp|P51863|VA0D1_MOUSE 25 29
390. Beta-glucuronidase sp|P12265|BGLR_MOUSE 13 15
391. Uncharacterized protein tr|D3Z1M3|D3Z1M3_MOUSE 13 15
392. Glutamate dehydrogenase 1, mitochondrial
sp|P26443|DHE3_MOUSE 13 15
393. MLV-related proviral Env polyprotein sp|P10404|ENV1_MOUSE 14 16
394. Protein RRP5 homolog sp|Q6NS46|RRP5_MOUSE 21 24
395. Peroxisomal multifunctional enzyme type 2
sp|P51660|DHB4_MOUSE 14 16
396. Protein sel-1 homolog 1 sp|Q9Z2G6|SE1L1_MOUSE 7 8
397. Pyruvate dehydrogenase E1 component subunit beta, mitochondrial
sp|Q9D051|ODPB_MOUSE 7 8
398. Calnexin sp|P35564|CALX_MOUSE 36 41
399. Ras-related protein Rab-14 sp|Q91V41|RAB14_MOUSE 15 17
400. Transmembrane protein 192 sp|Q9CXT7|TM192_MOUSE 15 17
401. Basic leucine zipper and W2 domain-containing protein 1
sp|Q9CQC6|BZW1_MOUSE 8 9
402. Vacuolar fusion protein CCZ1 homolog
sp|Q8C1Y8|CCZ1_MOUSE 16 18
403. WD repeat-containing protein 3 sp|Q8BHB4|WDR3_MOUSE 8 9
404. Leucyl-cystinyl aminopeptidase sp|Q8C129|LCAP_MOUSE 8 9
405. Chloride intracellular channel protein 1
sp|Q9Z1Q5|CLIC1_MOUSE 17 19
406. 60 kDa heat shock protein, mitochondrial
sp|P63038|CH60_MOUSE 63 70
407. Ataxin-10 sp|P28658|ATX10_MOUSE 18 20
408. Aconitate hydratase, mitochondrial sp|Q99KI0|ACON_MOUSE 9 10
409. Protein 2810422J05Rik tr|E9QNP0|E9QNP0_MOUSE 19 21
410. Collagen alpha-1(I) chain sp|P11087|CO1A1_MOUSE 19 21
411. Annexin A11 sp|P97384|ANX11_MOUSE 39 43
412. Eukaryotic translation initiation factor 4 gamma 1
tr|E9PVC6|E9PVC6_MOUSE 10 11
413. Vesicular integral-membrane protein VIP36
sp|Q9DBH5|LMAN2_MOUSE 10 11
414. A3 subunit of vacuolar-adenosine triphosphatase
tr|Q9JHF5|Q9JHF5_MOUSE 44 48
415. Uncharacterized protein tr|E9Q153|E9Q153_MOUSE 11 12
416. V-type proton ATPase subunit D sp|P57746|VATD_MOUSE 22 24
417. Cytochrome b-c1 complex subunit 2, mitochondrial
sp|Q9DB77|QCR2_MOUSE 22 24
418. 14-3-3 protein gamma sp|P61982|1433G_MOUSE 11 12
419. ATP-dependent RNA helicase DDX3X
sp|Q62167|DDX3X_MOUSE 12 13

Supplementary material
152
420. Ras-related GTP-binding protein C sp|Q99K70|RRAGC_MOUSE 12 13
421. Galactocerebrosidase sp|P54818|GALC_MOUSE 13 14
422. Sorting nexin 1 tr|Q6NZD2|Q6NZD2_MOUSE 15 16
423. Elongation factor Tu, mitochondrial sp|Q8BFR5|EFTU_MOUSE 16 17
424. Lactadherin sp|P21956|MFGM_MOUSE (+1)
16 17
425. Dolichyl-diphosphooligosaccharide--protein glycosyltransferase subunit 1
sp|Q91YQ5|RPN1_MOUSE 33 35
426. V-type proton ATPase subunit B, brain isoform
sp|P62814|VATB2_MOUSE 85 90
427. Tubulin beta-5 chain sp|P99024|TBB5_MOUSE 68 72
428. 6-phosphofructokinase tr|Q8C605|Q8C605_MOUSE 34 36
429. Elongation factor 1-alpha 1 sp|P10126|EF1A1_MOUSE 35 37
430. Dolichyl-diphosphooligosaccharide--protein glycosyltransferase subunit STT3A
sp|P46978|STT3A_MOUSE 18 19
431. contamination ENO1_YEAST 55 58
432. Phospholipid hydroperoxide glutathione peroxidase, mitochondrial
sp|O70325|GPX41_MOUSE 19 20
433. Sarcoplasmic/endoplasmic reticulum calcium ATPase 2
sp|O55143|AT2A2_MOUSE 39 41
434. Alpha-soluble NSF attachment protein
sp|Q9DB05|SNAA_MOUSE 39 41
435. Aldehyde dehydrogenase, mitochondrial
sp|P47738|ALDH2_MOUSE 20 21
436. Presenilin-1 sp|P49769|PSN1_MOUSE 21 22
437. Alkyldihydroxyacetonephosphate synthase, peroxisomal
tr|A2AL50|A2AL50_MOUSE 22 23
438. EH domain-containing protein 4 sp|Q9EQP2|EHD4_MOUSE 54 56
439. Flotillin-1 sp|O08917|FLOT1_MOUSE 29 30
440. Protein disulfide-isomerase sp|P09103|PDIA1_MOUSE 64 66
441. Tetratricopeptide repeat protein 39B sp|Q8BYY4|TT39B_MOUSE 39 40
442. EH domain-containing protein 1 tr|F6YBI4|F6YBI4_MOUSE 47 48
443. Protein disulfide-isomerase A6 sp|Q922R8|PDIA6_MOUSE 60 61
444. ATP synthase subunit alpha, mitochondrial
sp|Q03265|ATPA_MOUSE 63 64
445. V-type proton ATPase subunit E 1 sp|P50518|VATE1_MOUSE 64 65
446. V-type proton ATPase catalytic subunit A
sp|P50516|VATA_MOUSE 163 165
447. V-type proton ATPase subunit H sp|Q8BVE3|VATH_MOUSE 53 53
448. Protein disulfide-isomerase A3 sp|P27773|PDIA3_MOUSE 52 52
449. Protein Ahnak tr|E9Q616|E9Q616_MOUSE 15 15
450. Prolow-density lipoprotein receptor-related protein 1
sp|Q91ZX7|LRP1_MOUSE 6 6
451. Hexokinase-2 tr|E9Q5B5|E9Q5B5_MOUSE 22 22
452. Histone H2B type 1-F/J/L sp|P10853|H2B1F_MOUSE 3 3
453. Uncharacterized protein tr|E9PZD8|E9PZD8_MOUSE 2 2
454. Keratin, type I cytoskeletal 13 sp|P08730|K1C13_MOUSE 13 13
455. Isoform 2 of Phospholipase D4 sp|Q8BG07-2|PLD4_MOUSE (+1)
18 18
456. Ras-related protein Rab-5C sp|P35278|RAB5C_MOUSE 25 25
457. Vesicle transport through interaction with t-SNAREs homolog 1B
tr|E9Q5B1|E9Q5B1_MOUSE 28 28
458. ATP-binding cassette sub-family A member 3
sp|Q8R420|ABCA3_MOUSE 10 10

Supplementary material
153
459. H(+)/Cl(-) exchange transporter 7 sp|O70496|CLCN7_MOUSE 10 10
460. H-2 class I histocompatibility antigen, L-D alpha chain
sp|P01897|HA1L_MOUSE 13 13
461. Catalase sp|P24270|CATA_MOUSE 6 6
462. Uncharacterized protein C18orf8 homolog
sp|Q8VC42|MIC1_MOUSE 16 16
463. Phosphatidylinositol 4-kinase type 2-alpha
sp|Q2TBE6|P4K2A_MOUSE 11 11
464. Protein-glutamine gamma-glutamyltransferase K
sp|Q9JLF6|TGM1_MOUSE 5 5
465. ADP/ATP translocase 2 sp|P51881|ADT2_MOUSE 2 2
466. Signal recognition particle receptor subunit
sp|Q9DBG7|SRPR_MOUSE 11 11
467. Serum paraoxonase/lactonase 3 sp|Q62087|PON3_MOUSE 11 11
468. Keratin, type II cytoskeletal 80 sp|Q0VBK2|K2C80_MOUSE 2 2
469. Trifunctional enzyme subunit alpha, mitochondrial
sp|Q8BMS1|ECHA_MOUSE 12 12
470. Metaxin-1 sp|P47802|MTX1_MOUSE 12 12
471. H-2 class I histocompatibility antigen, K-D alpha chain
sp|P01902|HA1D_MOUSE 15 15
472. MKIAA0118 protein (Fragment) tr|Q6A0C7|Q6A0C7_MOUSE 11 11
473. Protein Srp72 tr|F8VQC1|F8VQC1_MOUSE 12 12
474. D-3-phosphoglycerate dehydrogenase
sp|Q61753|SERA_MOUSE 14 14
475. Protein Gls tr|E9PUF0|E9PUF0_MOUSE 5 5
476. rRNA 2'-O-methyltransferase fibrillarin
sp|P35550|FBRL_MOUSE 4 4
477. Phosphatidylinositide phosphatase SAC1
sp|Q9EP69|SAC1_MOUSE 6 6
478. Basic leucine zipper and W2 domain-containing protein 2
sp|Q91VK1|BZW2_MOUSE 6 6
479. Protein Nup98 tr|E9PYP6|E9PYP6_MOUSE (+1)
5 5
480. Histone H2A tr|F8WIX8|F8WIX8_MOUSE 2 2
481. NADH-ubiquinone oxidoreductase 75 kDa subunit, mitochondrial
sp|Q91VD9|NDUS1_MOUSE 7 7
482. Cleft lip and palate transmembrane protein 1 homolog
sp|Q8VBZ3|CLPT1_MOUSE 11 11
483. Syntaxin-8 sp|O88983|STX8_MOUSE 10 10
484. Vam6/Vps39-like protein sp|Q8R5L3|VPS39_MOUSE 9 9
485. Carbonic anhydrase 2 sp|P00920|CAH2_MOUSE 2 2
486. Segment polarity protein dishevelled homolog DVL-2
sp|Q60838|DVL2_MOUSE 4 4
487. Secretory carrier-associated membrane protein 3
tr|Q3UXS0|Q3UXS0_MOUSE (+2)
7 7
488. Formyltetrahydrofolate synthetase tr|F6YW06|F6YW06_MOUSE 8 8
489. Transmembrane protein 55A sp|Q9CZX7|TM55A_MOUSE 2 2
490. Serine/threonine-protein kinase A-Raf sp|P04627|ARAF_MOUSE 3 3
491. Trifunctional enzyme subunit beta, mitochondrial
sp|Q99JY0|ECHB_MOUSE 4 4
492. Putative sodium-coupled neutral amino acid transporter 7
sp|Q8BWH0|S38A7_MOUSE 2 2
493. Nitric oxide synthase-interacting protein
sp|Q9D6T0|NOSIP_MOUSE 6 6
494. Isoform 2 of Sorcin sp|Q6P069-2|SORCN_MOUSE (+1)
2 2

Supplementary material
154
495. Isoform 2 of Dual specificity protein kinase TTK
sp|P35761-2|TTK_MOUSE (+1)
5 5
496. Mitochondrial fission 1 protein sp|Q9CQ92|FIS1_MOUSE 6 6
497. Transmembrane protein 104 tr|A2A6S1|A2A6S1_MOUSE 5 5
498. TAR DNA-binding protein 43 sp|Q921F2|TADBP_MOUSE 4 4
499. RNA-binding protein with multiple-splicing
tr|Q9CPU5|Q9CPU5_MOUSE 6 6
500. Legumain sp|O89017|LGMN_MOUSE 7 7
501. Protein tweety homolog 3 sp|Q6P5F7|TTYH3_MOUSE 4 4
502. Replication factor C subunit 3 sp|Q8R323|RFC3_MOUSE 8 8
503. Heat shock protein 105 kDa sp|Q61699|HS105_MOUSE 4 4
504. Probable ATP-dependent RNA helicase DDX46
sp|Q569Z5|DDX46_MOUSE 5 5
505. Reticulon-4 sp|Q99P72|RTN4_MOUSE 2 2
506. 40S ribosomal protein S19 sp|Q9CZX8|RS19_MOUSE 5 5
507. Ribosomal RNA processing protein 1 homolog B
sp|Q91YK2|RRP1B_MOUSE 6 6
508. Protein Tmem181a tr|Q3U3W2|Q3U3W2_MOUSE 2 2
509. Oxysterol-binding protein tr|E9PXZ2|E9PXZ2_MOUSE 4 4
510. GTP-binding protein Rheb sp|Q921J2|RHEB_MOUSE 2 2
511. Isoform 2 of Zinc finger MIZ domain-containing protein 1
sp|Q6P1E1-2|ZMIZ1_MOUSE (+1)
3 3
512. Antigen peptide transporter 2 sp|P36371|TAP2_MOUSE 2 2
513. Sister chromatid cohesion protein PDS5 homolog A
tr|E9QPI5|E9QPI5_MOUSE 2 2
514. Isoform 3 of YTH domain family protein 3
sp|Q8BYK6-3|YTHD3_MOUSE 3 3
515. Uncharacterized protein (Fragment) tr|F6XLC7|F6XLC7_MOUSE 2 2
516. S-adenosylmethionine synthase isoform type-2
sp|Q3THS6|METK2_MOUSE 2 2
517. Integrator complex subunit 6 sp|Q6PCM2|INT6_MOUSE 2 2
518. Lanosterol 14-alpha demethylase sp|Q8K0C4|CP51A_MOUSE 5 5
519. Protein 2700078E11Rik tr|E9PV69|E9PV69_MOUSE (+1)
2 2
520. Protein NDRG2 sp|Q9QYG0|NDRG2_MOUSE 2 2
521. Isoform A0 of Neuropilin-2 sp|O35375-2|NRP2_MOUSE (+2)
2 2
522. Very long-chain specific acyl-CoA dehydrogenase, mitochondrial
sp|P50544|ACADV_MOUSE 2 2
523. Nucleolar protein 56 sp|Q9D6Z1|NOP56_MOUSE 2 2
524. CDGSH iron-sulfur domain-containing protein 1
sp|Q91WS0|CISD1_MOUSE 2 2
525. 5'-AMP-activated protein kinase subunit gamma-1
sp|O54950|AAKG1_MOUSE 3 3
526. Protein canopy homolog 3 sp|Q9DAU1|CNPY3_MOUSE 2 2
527. Splicing factor 3A subunit 1 sp|Q8K4Z5|SF3A1_MOUSE 2 2
528. Protein Rab9 (Fragment) tr|A2AFP5|A2AFP5_MOUSE 2 2
529. Serine-threonine kinase receptor-associated protein
sp|Q9Z1Z2|STRAP_MOUSE 2 2
530. Sp110 nuclear body protein sp|Q8BVK9|SP110_MOUSE 2 2
531. Pleckstrin homology domain-containing family A member 1
sp|Q8BUL6|PKHA1_MOUSE 2 2
532. 3-hydroxyisobutyrate dehydrogenase, mitochondrial
sp|Q99L13|3HIDH_MOUSE 2 2
533. AP-2 complex subunit beta tr|H3BKM0|H3BKM0_MOUSE 2 2

Supplementary material
155
534. Glycerol kinase tr|B1ASZ3|B1ASZ3_MOUSE 2 2
535. Chromatin assembly factor 1 subunit B
sp|Q9D0N7|CAF1B_MOUSE 2 2
536. Scavenger receptor class B member 1
sp|Q61009|SCRB1_MOUSE 2 2
537. Equilibrative nucleoside transporter 1 sp|Q9JIM1|S29A1_MOUSE 2 2
538. Eukaryotic translation initiation factor 3 subunit H
sp|Q91WK2|EIF3H_MOUSE 2 2
539. Nucleobindin-2 sp|P81117|NUCB2_MOUSE 2 2
540. Centromere protein V sp|Q9CXS4|CENPV_MOUSE 2 2
541. Golgi phosphoprotein 3-like tr|H3BJ07|H3BJ07_MOUSE 2 2
542. Nucleoporin NUP53 sp|Q8R4R6|NUP53_MOUSE 3 3
543. Bifunctional purine biosynthesis protein PURH
sp|Q9CWJ9|PUR9_MOUSE 2 2
544. Transient receptor potential cation channel subfamily V member 2
sp|Q9WTR1|TRPV2_MOUSE 2 2
545. Exportin-1 sp|Q6P5F9|XPO1_MOUSE 2 2
546. Sorting nexin-8 tr|Q3U0I9|Q3U0I9_MOUSE 2 2
547. ADP/ATP translocase 1 sp|P48962|ADT1_MOUSE 2 2
548. Mitochondrial-processing peptidase subunit alpha
sp|Q9DC61|MPPA_MOUSE 2 2
549. Pre-mRNA 3'-end-processing factor FIP1
tr|D3Z3F1|D3Z3F1_MOUSE (+1)
2 2
550. Proteasome subunit beta type-3 sp|Q9R1P1|PSB3_MOUSE 2 2
551. Nucleoporin NDC1 sp|Q8VCB1|NDC1_MOUSE 2 2
552. Procollagen-lysine,2-oxoglutarate 5-dioxygenase 1
sp|Q9R0E2|PLOD1_MOUSE 2 2
553. Lymphocyte-specific protein 1 sp|P19973|LSP1_MOUSE 2 2
554. FUN14 domain-containing protein 2 sp|Q9D6K8|FUND2_MOUSE 2 2
555. ATP-binding cassette sub-family D member 1
sp|P48410|ABCD1_MOUSE 2 2
556. Homeobox protein Rhox5 sp|P52651|RHOX5_MOUSE 2 2
557. Dolichol-phosphate (Beta-D) mannosyltransferase 1
tr|A2BDX2|A2BDX2_MOUSE 2 2
558. Retinol dehydrogenase 11 sp|Q9QYF1|RDH11_MOUSE 2 2
559. Isoform 2 of RNA polymerase II subunit A C-terminal domain phosphatase SSU72
sp|Q9CY97-2|SSU72_MOUSE (+1)
2 2
560. Ras-related protein Ral-A sp|P63321|RALA_MOUSE 2 2
561. Uncharacterized protein C9orf114 sp|Q3UHX9|CI114_MOUSE 2 2
562. Nucleolysin TIAR sp|P70318|TIAR_MOUSE 2 2
563. Galectin-8 tr|A8DIL0|A8DIL0_MOUSE (+1)
2 2
564. contamination Albu_Bovine 125 124
565. Erythrocyte band 7 integral membrane protein
sp|P54116|STOM_MOUSE 108 107
566. Sodium/potassium-transporting ATPase subunit alpha-1
sp|Q8VDN2|AT1A1_MOUSE 79 77
567. Palmitoyl-protein thioesterase 1 sp|O88531|PPT1_MOUSE 37 36
568. contamination K22E_HUMAN 397 386
569. ATP-binding cassette sub-family B member 6, mitochondrial
sp|Q9DC29|ABCB6_MOUSE 30 29
570. Vesicle-fusing ATPase 2 sp|P46460|NSF_MOUSE 28 27

Supplementary material
156
571. Actin, cytoplasmic 1, N-terminally processed
tr|F8WI82|F8WI82_MOUSE 107 103
572. Protein disulfide-isomerase A4 sp|P08003|PDIA4_MOUSE 69 66
573. Endoplasmin sp|P08113|ENPL_MOUSE 91 87
574. Clathrin heavy chain 1 sp|Q68FD5|CLH_MOUSE 22 21
575. Acid ceramidase sp|Q9WV54|ASAH1_MOUSE 43 41
576. Probable phospholipid-transporting ATPase IA
tr|Q8BR88|Q8BR88_MOUSE 20 19
577. Tyrosine-protein kinase SYK tr|E9PWE9|E9PWE9_MOUSE 18 17
578. Receptor-interacting serine-threonine kinase 3, isoform CRA_b
tr|G3X8V8|G3X8V8_MOUSE 18 17
579. Eukaryotic initiation factor 4A-I sp|P60843|IF4A1_MOUSE 17 16
580. Cytoplasmic FMR1-interacting protein 1
sp|Q7TMB8|CYFP1_MOUSE 17 16
581. Protein Slc2a6 tr|A2AR26|A2AR26_MOUSE 16 15
582. DnaJ homolog subfamily A member 1 sp|P63037|DNJA1_MOUSE 15 14
583. Heat shock cognate 71 kDa protein sp|P63017|HSP7C_MOUSE 74 69
584. Aspartate-beta-hydroxylase tr|A2AL85|A2AL85_MOUSE 29 27
585. Heat shock protein HSP 90-beta sp|P11499|HS90B_MOUSE 55 51
586. Gamma-soluble NSF attachment protein (Fragment)
tr|D3Z4B2|D3Z4B2_MOUSE 13 12
587. Alpha-enolase sp|P17182|ENOA_MOUSE 25 23
588. Isoform 2 of Immunity-related GTPase family M protein 1
sp|Q60766-2|IRGM1_MOUSE (+1)
12 11
589. Signal recognition particle 54 kDa protein
sp|P14576|SRP54_MOUSE 23 21
590. 78 kDa glucose-regulated protein sp|P20029|GRP78_MOUSE 169 154
591. contamination K2C1_HUMAN 458 417
592. HEAT repeat containing 1 tr|G3X9B1|G3X9B1_MOUSE 55 50
593. Tetratricopeptide repeat protein 35 sp|Q9CRD2|TTC35_MOUSE 11 10
594. Alpha-N-acetylglucosaminidase (Sanfilippo disease IIIB)
tr|A2BFA6|A2BFA6_MOUSE 43 39
595. contamination TRYP_PIG 106 96
596. Heparan-alpha-glucosaminide N-acetyltransferase
sp|Q3UDW8|HGNAT_MOUSE 21 19
597. Neutral amino acid transporter ASCT2
tr|Q9ESU7|Q9ESU7_MOUSE 21 19
598. E3 SUMO-protein ligase RanBP2 sp|Q9ERU9|RBP2_MOUSE 31 28
599. Cell division cycle protein 123 homolog
sp|Q8CII2|CD123_MOUSE 10 9
600. Heat shock protein 9 tr|Q7TSZ0|Q7TSZ0_MOUSE 68 61
601. U3 small nucleolar RNA-associated protein 6 homolog
sp|Q8VCY6|UTP6_MOUSE 19 17
602. Isoform Stat3B of Signal transducer and activator of transcription 3
sp|P42227-2|STAT3_MOUSE (+1)
19 17
603. Dynamin-2 tr|G3X9G4|G3X9G4_MOUSE 28 25
604. Tubulin alpha-1B chain sp|P05213|TBA1B_MOUSE 54 48
605. Coiled-coil domain-containing protein 22
sp|Q9JIG7|CCD22_MOUSE 9 8
606. RuvB-like 2 sp|Q9WTM5|RUVB2_MOUSE 18 16
607. contamination K1C10_HUMAN 362 318
608. Eukaryotic translation initiation factor 4 gamma 2
tr|G3XA17|G3XA17_MOUSE 8 7

Supplementary material
157
609. Rho GTPase-activating protein 1 sp|Q5FWK3|RHG01_MOUSE 8 7
610. Long-chain-fatty-acid--CoA ligase 5 sp|Q8JZR0|ACSL5_MOUSE 16 14
611. Keratin, type II cytoskeletal 5 tr|D3Z4Y4|D3Z4Y4_MOUSE 95 83
612. Lysosome-associated membrane glycoprotein 1
sp|P11438|LAMP1_MOUSE 31 27
613. Glucosylceramidase sp|P17439|GLCM_MOUSE 23 20
614. Sphingosine-1-phosphate lyase 1 sp|Q8R0X7|SGPL1_MOUSE 15 13
615. DnaJ homolog subfamily B member 11
sp|Q99KV1|DJB11_MOUSE 15 13
616. Lysozyme C-2 sp|P08905|LYZ2_MOUSE 7 6
617. Transmembrane glycoprotein NMB sp|Q99P91|GPNMB_MOUSE 7 6
618. Chromodomain-helicase-DNA-binding protein 4
tr|E9QAS5|E9QAS5_MOUSE 7 6
619. ATPase, Ca++ transporting, ubiquitous
tr|B1ATS5|B1ATS5_MOUSE 7 6
620. Nodal modulator 1 sp|Q6GQT9|NOMO1_MOUSE 21 18
621. Filamin, alpha tr|B7FAU9|B7FAU9_MOUSE 7 6
622. Protein disulfide-isomerase TMX3 sp|Q8BXZ1|TMX3_MOUSE 7 6
623. Mitochondrial import inner membrane translocase subunit TIM50
sp|Q9D880|TIM50_MOUSE 7 6
624. Vacuolar fusion protein MON1 homolog A
sp|Q6PDG8|MON1A_MOUSE 7 6
625. Lysosomal acid lipase/cholesteryl ester hydrolase
sp|Q9Z0M5|LICH_MOUSE 27 23
626. Pyruvate kinase isozymes M1/M2 sp|P52480|KPYM_MOUSE 53 45
627. Heterogeneous nuclear ribonucleoprotein U
sp|Q8VEK3|HNRPU_MOUSE 13 11
628. P2X tr|E9QNH4|E9QNH4_MOUSE 13 11
629. Neutral alpha-glucosidase AB sp|Q8BHN3|GANAB_MOUSE 12 10
630. Oxysterol-binding protein tr|B9EJ86|B9EJ86_MOUSE 6 5
631. Heterogeneous nuclear ribonucleoprotein F
sp|Q9Z2X1|HNRPF_MOUSE 6 5
632. Plastin 3 (T-isoform) tr|B1AX58|B1AX58_MOUSE 6 5
633. Toll-like receptor 7 1 sp|P58681|TLR7_MOUSE 17 14
634. L-lactate dehydrogenase tr|G5E8N5|G5E8N5_MOUSE 17 14
635. Retinoic acid early-inducible protein 1-beta
sp|O08603|RAE1B_MOUSE 11 9
636. Transforming protein RhoA sp|Q9QUI0|RHOA_MOUSE 11 9
637. Translocon-associated protein subunit alpha
sp|Q9CY50|SSRA_MOUSE 11 9
638. Flotillin-2 sp|Q60634|FLOT2_MOUSE 16 13
639. contamination K1C9_HUMAN 446 360
640. Probable ATP-dependent RNA helicase DDX5
sp|Q61656|DDX5_MOUSE (+1)
15 12
641. mRNA export factor sp|Q8C570|RAE1L_MOUSE 10 8
642. Dolichyl-diphosphooligosaccharide--protein glycosyltransferase 48 kDa subunit
sp|O54734|OST48_MOUSE 15 12
643. Cas scaffolding protein family member 4
sp|Q08EC4|CASS4_MOUSE 10 8
644. Phosphoglycerate kinase 1 sp|P09411|PGK1_MOUSE 5 4
645. Transducin beta-like protein 3 tr|Q8CE86|Q8CE86_MOUSE 5 4
646. Isoform 2 of Src-like-adapter sp|Q60898-2|SLAP1_MOUSE 5 4
647. RNA-binding protein Musashi homolog 2
sp|Q920Q6|MSI2H_MOUSE (+2)
5 4

Supplementary material
158
648. 14-3-3 protein zeta/delta sp|P63101|1433Z_MOUSE 34 27
649. Keratin, type II cytoskeletal 2 oral sp|Q3UV17|K22O_MOUSE 24 19
650. Heterogeneous nuclear ribonucleoprotein M
sp|Q9D0E1|HNRPM_MOUSE 18 14
651. Alpha-N-acetylgalactosaminidase sp|Q9QWR8|NAGAB_MOUSE 18 14
652. Mitochondrial inner membrane protein
tr|E9QLA0|E9QLA0_MOUSE 9 7
653. Heat shock protein HSP 90-alpha sp|P07901|HS90A_MOUSE 9 7
654. MKIAA4127 protein (Fragment) tr|Q570Z6|Q570Z6_MOUSE 9 7
655. Sorting nexin-9 tr|E9QNH3|E9QNH3_MOUSE (+1)
9 7
656. Aminopeptidase sp|P97449|AMPN_MOUSE 9 7
657. 9 7
658. Hypoxia up-regulated protein 1 sp|Q9JKR6|HYOU1_MOUSE 48 37
659. Leucine-rich PPR motif-containing protein,
sp|Q6PB66|LPPRC_MOUSE 13 10
660. IQ motif containing GTPase activating protein 1, isoform CRA_c
tr|G3UW45|G3UW45_MOUSE 21 16
661. Monofunctional C1-tetrahydrofolate synthase, mitochondrial
sp|Q3V3R1|C1TM_MOUSE 28 21
662. Syntenin-1 sp|O08992|SDCB1_MOUSE (+1)
4 3
663. Protein unc-93 homolog B1 tr|E9PYK0|E9PYK0_MOUSE 8 6
664. Asparagine--tRNA ligase, cytoplasmic
sp|Q8BP47|SYNC_MOUSE 20 15
665. Vacuolar protein sorting-associated protein 35
sp|Q9EQH3|VPS35_MOUSE 12 9
666. EH domain-containing protein 2 sp|Q8BH64|EHD2_MOUSE 8 6
667. Beta-hexosaminidase subunit alpha sp|P29416|HEXA_MOUSE 4 3
668. Capping protein (Actin filament) muscle Z-line, beta
tr|A2AMW0|A2AMW0_MOUSE 8 6
669. Structural maintenance of chromosomes protein
tr|E9Q1E9|E9Q1E9_MOUSE 4 3
670. Protein SCAF8 tr|F6WUK6|F6WUK6_MOUSE 4 3
671. Cohesin subunit SA-1 sp|Q9D3E6|STAG1_MOUSE 4 3
672. Tyrosine-protein kinase BTK sp|P35991|BTK_MOUSE 4 3
673. Pachytene checkpoint protein 2 homolog
sp|Q3UA06|PCH2_MOUSE 4 3
674. Osteopontin sp|P10923|OSTP_MOUSE (+1)
4 3
675. 60S acidic ribosomal protein P2 sp|P99027|RLA2_MOUSE 4 3
676. Something about silencing protein 10 sp|Q9JI13|SAS10_MOUSE (+1)
4 3
677. Keratin, type I cytoskeletal 14 sp|Q61781|K1C14_MOUSE 94 70
678. UDP-glucose:glycoprotein glucosyltransferase 1
sp|Q6P5E4|UGGG1_MOUSE 31 23
679. Moesin sp|P26041|MOES_MOUSE 15 11
680. Lamin-B receptor sp|Q3U9G9|LBR_MOUSE 15 11
681. Mitotic checkpoint protein BUB3 sp|Q9WVA3|BUB3_MOUSE 15 11
682. Programmed cell death 6-interacting protein
sp|Q9WU78|PDC6I_MOUSE 22 16
683. Lysosome membrane protein 2 sp|O35114|SCRB2_MOUSE 22 16
684. DnaJ homolog subfamily C member sp|P60904|DNJC5_MOUSE 11 8
685. Isoform 2 of NADH-cytochrome b5 reductase 3
sp|Q9DCN2-2|NB5R3_MOUSE (+1)
11 8

Supplementary material
159
686. Isoform 2 of Prolyl 4-hydroxylase subunit alpha-1
sp|Q60715-2|P4HA1_MOUSE 11 8
687. Long-chain-fatty-acid--CoA ligase 4 sp|Q9QUJ7|ACSL4_MOUSE 14 10
688. Histone acetyltransferase type B catalytic subunit
sp|Q8BY71|HAT1_MOUSE 14 10
689. Neutrophil cytosol factor 4 sp|P97369|NCF4_MOUSE 21 15
690. Ceroid-lipofuscinosis neuronal protein 5 homolog
sp|Q3UMW8|CLN5_MOUSE 7 5
691. Ubiquitin-associated protein 2 sp|Q91VX2|UBAP2_MOUSE 7 5
692. Desmoglein-1-alpha sp|Q61495|DSG1A_MOUSE 30 21
693. RNA-binding protein 12 sp|Q8R4X3|RBM12_MOUSE 10 7
694. Pro-cathepsin H sp|P49935|CATH_MOUSE 10 7
695. Far upstream element-binding protein 2
sp|Q3U0V1|FUBP2_MOUSE 10 7
696. Minor histocompatibility antigen H13 sp|Q9D8V0|HM13_MOUSE 13 9
697. Keratin, type I cytoskeletal 42 sp|Q6IFX2|K1C42_MOUSE 31 21
698. Niemann Pick type tr|G3X8W9|G3X8W9_MOUSE 18 12
699. Isoform Cytoplasmic of Fumarate hydratase, mitochondrial
sp|P97807-2|FUMH_MOUSE (+1)
12 8
700. Integrin alpha M, isoform CRA_a tr|G5E8F1|G5E8F1_MOUSE 9 6
701. Toll-like receptor 13 sp|Q6R5N8|TLR13_MOUSE 9 6
702. T-complex protein 1 subunit tr|Q3U0I3|Q3U0I3_MOUSE 6 4
703. Lon protease homolog tr|E9Q120|E9Q120_MOUSE 15 10
704. Transcriptional regulator ATRX sp|Q61687|ATRX_MOUSE 3 2
705. Monocarboxylate transporter 1 sp|P53986|MOT1_MOUSE 6 4
706. Nuclear pore complex protein Nup160
sp|Q9Z0W3|NU160_MOUSE 12 8
707. Isocitrate dehydrogenase [NADP] tr|F8WIY0|F8WIY0_MOUSE (+1)
9 6
708. Charged multivesicular body protein 4b
sp|Q9D8B3|CHM4B_MOUSE 9 6
709. Pleckstrin sp|Q9JHK5|PLEK_MOUSE 3 2
710. Unconventional myosin-Va tr|D3Z4J3|D3Z4J3_MOUSE 3 2
711. Zinc finger SWIM domain-containing protein KIAA0913
sp|Q3UHH1|K0913_MOUSE 3 2
712. ADP-ribosylation factor guanine nucleotide-exchange factor 2 (Brefeldin A-inhibited)
tr|A2A5R2|A2A5R2_MOUSE 3 2
713. Stromal membrane-associated protein 2
sp|Q7TN29|SMAP2_MOUSE 6 4
714. Histone H1.3 sp|P43277|H13_MOUSE 3 2
715. Condensin complex subunit 1 sp|Q8K2Z4|CND1_MOUSE 3 2
716. Staphylococcal nuclease domain-containing protein 1
sp|Q78PY7|SND1_MOUSE 3 2
717. Vacuolar protein sorting-associated protein 28 homolog
sp|Q9D1C8|VPS28_MOUSE 9 6
718. DNA replication licensing factor MCM2
sp|P97310|MCM2_MOUSE 3 2
719. Cytosol aminopeptidase sp|Q9CPY7|AMPL_MOUSE 3 2
720. Protein 9030624J02Rik (Fragment) tr|D3YW19|D3YW19_MOUSE 6 4
721. Copine-2 sp|P59108|CPNE2_MOUSE 3 2
722. Gelsolin sp|P13020|GELS_MOUSE (+1) 3 2
723. Isoform 2 of Telomere-associated protein RIF1
sp|Q6PR54-2|RIF1_MOUSE (+1)
3 2
724. Nucleobindin-1 sp|Q02819|NUCB1_MOUSE 3 2

Supplementary material
160
725. Isoform 2 of Vacuolar protein sorting-associated protein 26A
sp|P40336-2|VP26A_MOUSE (+1)
6 4
726. Lymphocyte-specific helicase sp|Q60848|HELLS_MOUSE 3 2
727. NADH dehydrogenase [ubiquinone] iron-sulfur protein 3, mitochondrial
sp|Q9DCT2|NDUS3_MOUSE 3 2
728. Ubiquitin-conjugating enzyme E2 N sp|P61089|UBE2N_MOUSE 3 2
729. Monoacylglycerol lipase ABHD6 sp|Q8R2Y0|ABHD6_MOUSE 6 4
730. Interleukin enhancer-binding factor 2 sp|Q9CXY6|ILF2_MOUSE 3 2
731. Group XV phospholipase A2 sp|Q8VEB4|PAG15_MOUSE 3 2
732. Ubiquilin-4 sp|Q99NB8|UBQL4_MOUSE 3 2
733. Reticulocalbin-2 sp|Q8BP92|RCN2_MOUSE 3 2
734. General transcription factor IIH subunit 4
sp|O70422|TF2H4_MOUSE 3 2
735. Junction plakoglobin sp|Q02257|PLAK_MOUSE 64 42
736. Uncharacterized protein (Fragment) tr|F6UF97|F6UF97_MOUSE 31 20
737. Gasdermin-D sp|Q9D8T2|GSDMD_MOUSE 11 7
738. Midasin tr|A2ANY6|A2ANY6_MOUSE 8 5
739. Serine/threonine-protein kinase TBK1 sp|Q9WUN2|TBK1_MOUSE 8 5
740. Keratin, type I cytoskeletal 17 sp|Q9QWL7|K1C17_MOUSE 123 76
741. Vacuolar protein sorting-associated protein 13C
tr|E9QLN1|E9QLN1_MOUSE 23 14
742. Plakophilin-1 sp|P97350|PKP1_MOUSE 20 12
743. DnaJ homolog subfamily C member 3 sp|Q91YW3|DNJC3_MOUSE 10 6
744. Melanoma inhibitory activity protein 3 sp|Q8BI84|MIA3_MOUSE 5 3
745. NCK associated protein 1 like tr|Q8K1X4|Q8K1X4_MOUSE 5 3
746. Keratin, type II cytoskeletal 6A tr|D3Z6R0|D3Z6R0_MOUSE 109 65
747. Myosin-9 sp|Q8VDD5|MYH9_MOUSE 44 26
748. Protein Gcn1l1 tr|E9PVA8|E9PVA8_MOUSE 24 14
749. Engulfment and cell motility protein 1 tr|F8WIL9|F8WIL9_MOUSE 12 7
750. Tubulin beta-6 chain sp|Q922F4|TBB6_MOUSE 12 7
751. Cell cycle control protein 50A tr|D3YVV1|D3YVV1_MOUSE 12 7
752. Heat shock protein 75 kDa, mitochondrial
tr|F6YP65|F6YP65_MOUSE 19 11
753. Phosphate carrier protein, mitochondrial
sp|Q8VEM8|MPCP_MOUSE (+1)
7 4
754. Retinoid-inducible serine carboxypeptidase
sp|Q920A5|RISC_MOUSE 7 4
755. ATPase, Ca++ transporting, plasma membrane 4
tr|Q32ME1|Q32ME1_MOUSE 7 4
756. Guanine nucleotide-binding protein G(s) subunit alpha isoforms short
sp|P63094|GNAS2_MOUSE 7 4
757. Dihydrolipoyllysine-residue succinyltransferase component of 2-oxoglutarate dehydrogenase complex, mitochondrial
sp|Q9D2G2|ODO2_MOUSE 7 4
758. Transgelin-2 sp|Q9WVA4|TAGL2_MOUSE 7 4
759. Mitochondrial import receptor subunit TOM40 homolog
sp|Q9QYA2|TOM40_MOUSE 7 4
760. Keratin 16 tr|Q3ZAW8|Q3ZAW8_MOUSE 62 35
761. Nuclear pore complex protein Nup93 sp|Q8BJ71|NUP93_MOUSE 9 5
762. contamination TRY1_BOVIN 9 5
763. Tyrosine-protein kinase HCK sp|P08103|HCK_MOUSE 9 5
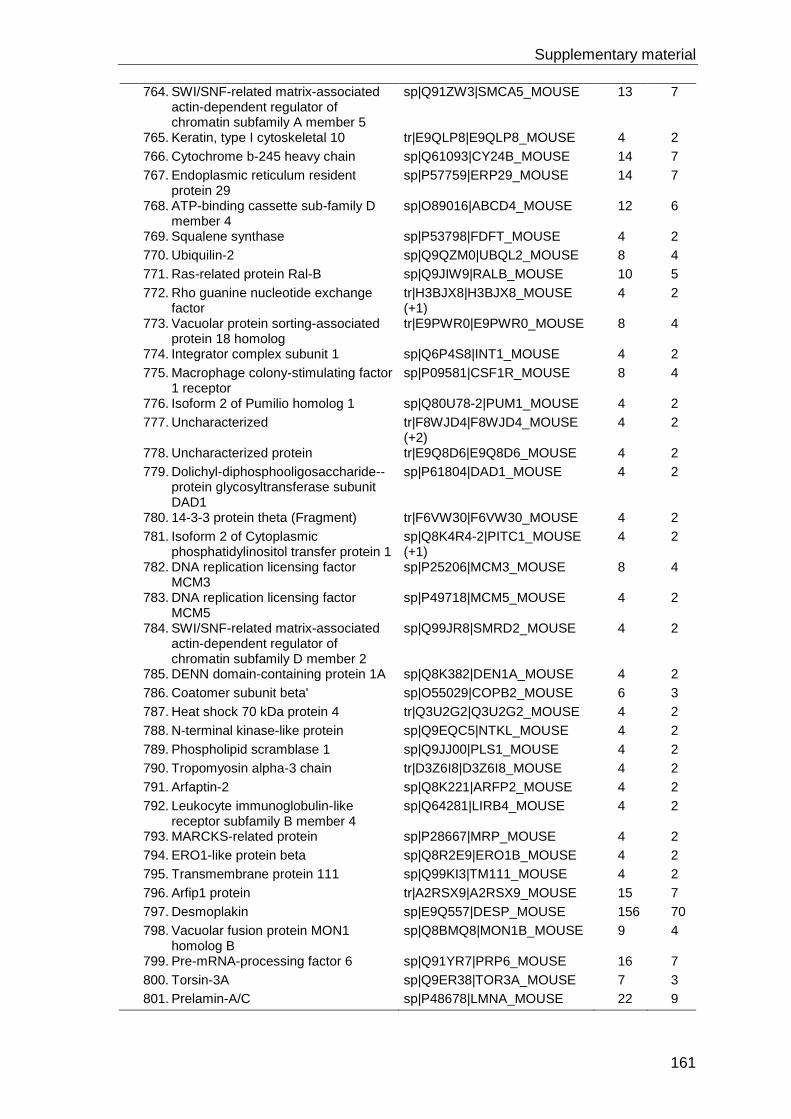
Supplementary material
161
764. SWI/SNF-related matrix-associated actin-dependent regulator of chromatin subfamily A member 5
sp|Q91ZW3|SMCA5_MOUSE 13 7
765. Keratin, type I cytoskeletal 10 tr|E9QLP8|E9QLP8_MOUSE 4 2
766. Cytochrome b-245 heavy chain sp|Q61093|CY24B_MOUSE 14 7
767. Endoplasmic reticulum resident protein 29
sp|P57759|ERP29_MOUSE 14 7
768. ATP-binding cassette sub-family D member 4
sp|O89016|ABCD4_MOUSE 12 6
769. Squalene synthase sp|P53798|FDFT_MOUSE 4 2
770. Ubiquilin-2 sp|Q9QZM0|UBQL2_MOUSE 8 4
771. Ras-related protein Ral-B sp|Q9JIW9|RALB_MOUSE 10 5
772. Rho guanine nucleotide exchange factor
tr|H3BJX8|H3BJX8_MOUSE (+1)
4 2
773. Vacuolar protein sorting-associated protein 18 homolog
tr|E9PWR0|E9PWR0_MOUSE 8 4
774. Integrator complex subunit 1 sp|Q6P4S8|INT1_MOUSE 4 2
775. Macrophage colony-stimulating factor 1 receptor
sp|P09581|CSF1R_MOUSE 8 4
776. Isoform 2 of Pumilio homolog 1 sp|Q80U78-2|PUM1_MOUSE 4 2
777. Uncharacterized tr|F8WJD4|F8WJD4_MOUSE (+2)
4 2
778. Uncharacterized protein tr|E9Q8D6|E9Q8D6_MOUSE 4 2
779. Dolichyl-diphosphooligosaccharide--protein glycosyltransferase subunit DAD1
sp|P61804|DAD1_MOUSE 4 2
780. 14-3-3 protein theta (Fragment) tr|F6VW30|F6VW30_MOUSE 4 2
781. Isoform 2 of Cytoplasmic phosphatidylinositol transfer protein 1
sp|Q8K4R4-2|PITC1_MOUSE (+1)
4 2
782. DNA replication licensing factor MCM3
sp|P25206|MCM3_MOUSE 8 4
783. DNA replication licensing factor MCM5
sp|P49718|MCM5_MOUSE 4 2
784. SWI/SNF-related matrix-associated actin-dependent regulator of chromatin subfamily D member 2
sp|Q99JR8|SMRD2_MOUSE 4 2
785. DENN domain-containing protein 1A sp|Q8K382|DEN1A_MOUSE 4 2
786. Coatomer subunit beta' sp|O55029|COPB2_MOUSE 6 3
787. Heat shock 70 kDa protein 4 tr|Q3U2G2|Q3U2G2_MOUSE 4 2
788. N-terminal kinase-like protein sp|Q9EQC5|NTKL_MOUSE 4 2
789. Phospholipid scramblase 1 sp|Q9JJ00|PLS1_MOUSE 4 2
790. Tropomyosin alpha-3 chain tr|D3Z6I8|D3Z6I8_MOUSE 4 2
791. Arfaptin-2 sp|Q8K221|ARFP2_MOUSE 4 2
792. Leukocyte immunoglobulin-like receptor subfamily B member 4
sp|Q64281|LIRB4_MOUSE 4 2
793. MARCKS-related protein sp|P28667|MRP_MOUSE 4 2
794. ERO1-like protein beta sp|Q8R2E9|ERO1B_MOUSE 4 2
795. Transmembrane protein 111 sp|Q99KI3|TM111_MOUSE 4 2
796. Arfip1 protein tr|A2RSX9|A2RSX9_MOUSE 15 7
797. Desmoplakin sp|E9Q557|DESP_MOUSE 156 70
798. Vacuolar fusion protein MON1 homolog B
sp|Q8BMQ8|MON1B_MOUSE 9 4
799. Pre-mRNA-processing factor 6 sp|Q91YR7|PRP6_MOUSE 16 7
800. Torsin-3A sp|Q9ER38|TOR3A_MOUSE 7 3
801. Prelamin-A/C sp|P48678|LMNA_MOUSE 22 9

Supplementary material
162
802. Dedicator of cytokinesis protein 2 sp|Q8C3J5|DOCK2_MOUSE 32 13
803. Sortilin-related receptor sp|O88307|SORL_MOUSE 5 2
804. Sphingomyelin phosphodiesterase 4 sp|Q6ZPR5|NSMA3_MOUSE 10 4
805. Triosephosphate isomerase sp|P17751|TPIS_MOUSE 10 4
806. 14-3-3 protein epsilon sp|P62259|1433E_MOUSE 15 6
807. DnaJ homolog subfamily A member 2 sp|Q9QYJ0|DNJA2_MOUSE 5 2
808. Coiled-coil domain-containing protein 47
sp|Q9D024|CCD47_MOUSE 5 2
809. Hexokinase-1 sp|P17710|HXK1_MOUSE 5 2
810. Estradiol 17-beta-dehydrogenase 12 sp|O70503|DHB12_MOUSE 5 2
811. Phospholipase D1, isoform CRA_a 1 tr|G3X9E4|G3X9E4_MOUSE 5 2
812. Glycogen [starch] synthase, muscle tr|D3Z0Q6|D3Z0Q6_MOUSE 5 2
813. Exosc10 protein tr|Q8K366|Q8K366_MOUSE 5 2
814. Translocation protein SEC63 homolog
sp|Q8VHE0|SEC63_MOUSE 5 2
815. Ragulator complex protein LAMTOR2 sp|Q9JHS3|LTOR2_MOUSE 5 2
816. Plasma alpha-L-fucosidase sp|Q99KR8|FUCO2_MOUSE 5 2
817. Maspardin sp|Q9CQC8|SPG21_MOUSE 5 2
818. Serine/threonine-protein kinase SIK2 tr|H3BKG1|H3BKG1_MOUSE (+2)
8 3
819. Protein Ncapg tr|E9PWG6|E9PWG6_MOUSE 8 3
820. Ribonucleoside-diphosphate reductase large subunit
sp|P07742|RIR1_MOUSE 8 3
821. Isoform 2 of Proteasome-associated protein ECM29
sp|Q6PDI5-2|ECM29_MOUSE (+1)
11 4
822. Nuclear pore membrane glycoprotein 210
sp|Q9QY81|PO210_MOUSE 11 4
823. Serine incorporator 3 sp|Q9QZI9|SERC3_MOUSE 6 2
824. Fructose-bisphosphate aldolase tr|A6ZI44|A6ZI44_MOUSE 18 6
825. IST1 homolog sp|Q9CX00|IST1_MOUSE 9 3
826. Isoform 2 of Serine/threonine-protein kinase N1
sp|P70268-2|PKN1_MOUSE (+1)
9 3
827. Integrator complex subunit 7 sp|Q7TQK1|INT7_MOUSE 6 2
828. Keratin, type II cytoskeletal 71 sp|Q9R0H5|K2C71_MOUSE 9 3
829. Galectin-3-binding protein sp|Q07797|LG3BP_MOUSE 6 2
830. General transcription factor IIIC, polypeptide 3
tr|Q3TMP1|Q3TMP1_MOUSE 6 2
831. Putative phospholipase B-like 2 sp|Q3TCN2|PLBL2_MOUSE 6 2
832. Alpha-galactosidase A tr|Q8BGZ6|Q8BGZ6_MOUSE (+1)
6 2
833. Adipocyte plasma membrane-associated protein
sp|Q9D7N9|APMAP_MOUSE 6 2
834. DnaJ homolog subfamily C member 10
sp|Q9DC23|DJC10_MOUSE 6 2
835. Vacuolar protein sorting-associated protein 37B
sp|Q8R0J7|VP37B_MOUSE 6 2
836. Isoform Short of 14-3-3 protein beta/alpha
sp|Q9CQV8-2|1433B_MOUSE (+1)
10 3
837. Isoform A1-I of V-type proton ATPase 116 kDa subunit a isoform 1
sp|Q9Z1G4-2|VPP1_MOUSE (+1)
7 2
838. ATP synthase subunit gamma, mitochondrial
sp|Q91VR2|ATPG_MOUSE (+1)
7 2
839. SUN domain-containing protein 2 sp|Q8BJS4|SUN2_MOUSE 8 2
840. Protein Sec14l1 tr|A2A9B9|A2A9B9_MOUSE 18 4
841. MKIAA4216 protein (Fragment) tr|Q5DTH1|Q5DTH1_MOUSE 9 2

Supplementary material
163
842. Isoform 3 of Poly(rC)-binding protein 2
sp|Q61990-3|PCBP2_MOUSE (+1)
14 3
843. 14-3-3 protein sigma sp|O70456|1433S_MOUSE 20 3
844. Cytoplasmic dynein 1 heavy chain 1 sp|Q9JHU4|DYHC1_MOUSE 2 0
845. Isoform 3 of Cytoskeleton-associated protein 5
sp|A2AGT5-3|CKAP5_MOUSE 2 0
846. Transmembrane protein C2orf18 homolog
sp|Q8VE96|CB018_MOUSE 5 0
847. Protein transport protein Sec61 subunit alpha isoform 1
sp|P61620|S61A1_MOUSE 2 0
848. Ragulator complex protein LAMTOR1 sp|Q9CQ22|LTOR1_MOUSE 2 0
849. Hippocalcin-like protein sp|P62748|HPCL1_MOUSE 4 0
850. Golgi apparatus protein 1 sp|Q61543|GSLG1_MOUSE (+1)
2 0
851. Cathepsin S sp|O70370|CATS_MOUSE (+1)
8 0
852. Solute carrier family 15 member 4 sp|Q91W98|S15A4_MOUSE 6 0
853. Peptidyl-prolyl cis-trans isomerase A sp|P17742|PPIA_MOUSE 2 0
854. Nipped-B-like protein sp|Q6KCD5|NIPBL_MOUSE 4 0
855. Serine/threonine-protein kinase mTOR
sp|Q9JLN9|MTOR_MOUSE 2 0
856. ATP synthase subunit b, mitochondrial
sp|Q9CQQ7|AT5F1_MOUSE 5 0
857. DNA repair protein RAD50 sp|P70388|RAD50_MOUSE 4 0
858. Protein Gm10119 tr|D3Z6C3|D3Z6C3_MOUSE 5 0
859. MKIAA0248 protein (Fragment) tr|Q6A099|Q6A099_MOUSE 4 0
860. Signal peptide peptidase-like 2A sp|Q9JJF9|SPP2A_MOUSE 3 0
861. B-cell receptor-associated protein 31 sp|Q61335|BAP31_MOUSE (+1)
3 0
862. Uridine-cytidine kinase 2 sp|Q99PM9|UCK2_MOUSE 4 0
863. WASH complex subunit 7 sp|Q3UMB9|WASH7_MOUSE 3 0
864. Keratin, type II cytoskeletal 1b sp|Q6IFZ6|K2C1B_MOUSE 8 0
865. Sorting nexin 3 tr|Q78ZM0|Q78ZM0_MOUSE 2 0
866. StAR-related lipid transfer protein 3 sp|Q61542|STAR3_MOUSE 2 0
867. Myosin-4 sp|Q5SX39|MYH4_MOUSE 2 0
868. Protein FAM162A sp|Q9D6U8|F162A_MOUSE 3 0
869. Isoform 2 of Torsin-1A-interacting protein 1
sp|Q921T2-2|TOIP1_MOUSE (+2)
3 0
870. EF-hand domain-containing family member A1
sp|Q8CD10|EFHA1_MOUSE 4 0
871. Protein Wdfy4 tr|E9Q2M9|E9Q2M9_MOUSE 6 0
872. DNA topoisomerase 2-alpha sp|Q01320|TOP2A_MOUSE 2 0
873. Non-specific lipid-transfer protein sp|P32020|NLTP_MOUSE 5 0
874. Isoform 2 of Nuclear pore complex protein Nup88
sp|Q8CEC0-2|NUP88_MOUSE (+2)
2 0
875. Protein BC005561 tr|E9Q5E2|E9Q5E2_MOUSE 2 0
876. Isoform 3 of 2-oxoglutarate dehydrogenase, mitochondrial
sp|Q60597-3|ODO1_MOUSE 5 0
877. Protein Cad tr|E9QAI5|E9QAI5_MOUSE 3 0
878. Cathepsin L1 sp|P06797|CATL1_MOUSE 2 0
879. Calcium-binding mitochondrial carrier protein Aralar1
sp|Q8BH59|CMC1_MOUSE 3 0
880. Mucolipin-1 sp|Q99J21|MCLN1_MOUSE 2 0
881. Heat shock 70 kDa protein 1B sp|P17879|HS71B_MOUSE (+1)
7 0
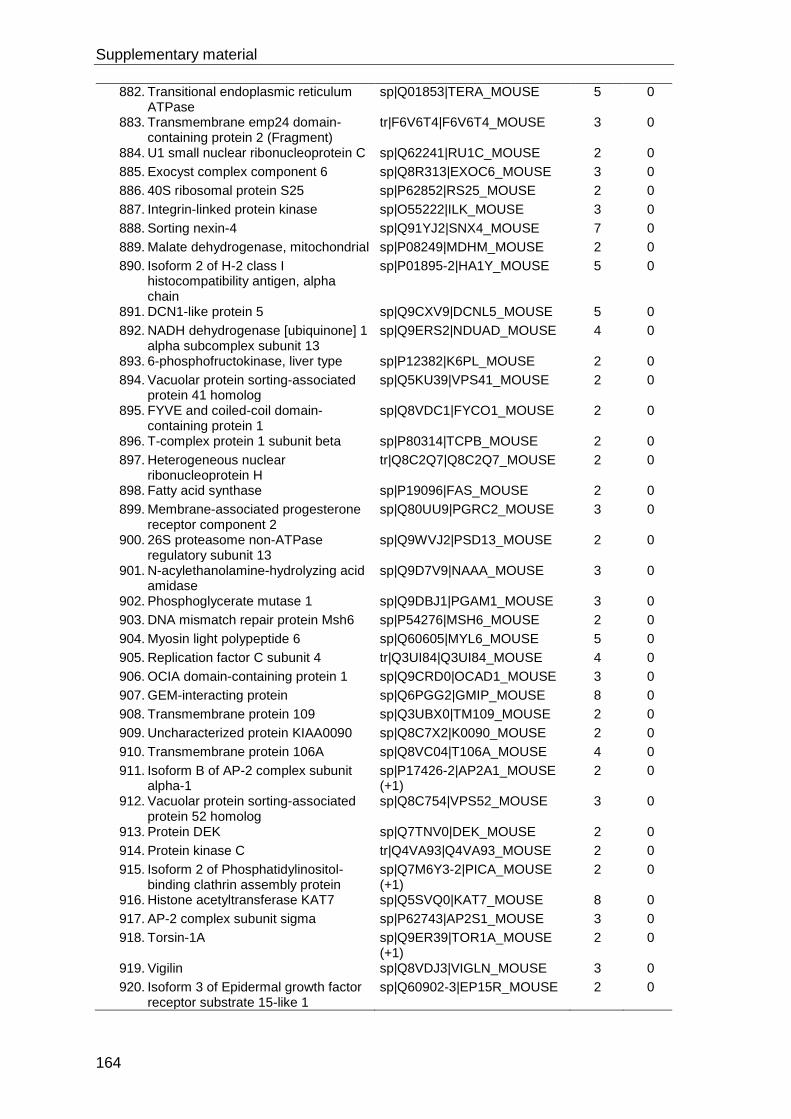
Supplementary material
164
882. Transitional endoplasmic reticulum ATPase
sp|Q01853|TERA_MOUSE 5 0
883. Transmembrane emp24 domain-containing protein 2 (Fragment)
tr|F6V6T4|F6V6T4_MOUSE 3 0
884. U1 small nuclear ribonucleoprotein C sp|Q62241|RU1C_MOUSE 2 0
885. Exocyst complex component 6 sp|Q8R313|EXOC6_MOUSE 3 0
886. 40S ribosomal protein S25 sp|P62852|RS25_MOUSE 2 0
887. Integrin-linked protein kinase sp|O55222|ILK_MOUSE 3 0
888. Sorting nexin-4 sp|Q91YJ2|SNX4_MOUSE 7 0
889. Malate dehydrogenase, mitochondrial sp|P08249|MDHM_MOUSE 2 0
890. Isoform 2 of H-2 class I histocompatibility antigen, alpha chain
sp|P01895-2|HA1Y_MOUSE 5 0
891. DCN1-like protein 5 sp|Q9CXV9|DCNL5_MOUSE 5 0
892. NADH dehydrogenase [ubiquinone] 1 alpha subcomplex subunit 13
sp|Q9ERS2|NDUAD_MOUSE 4 0
893. 6-phosphofructokinase, liver type sp|P12382|K6PL_MOUSE 2 0
894. Vacuolar protein sorting-associated protein 41 homolog
sp|Q5KU39|VPS41_MOUSE 2 0
895. FYVE and coiled-coil domain-containing protein 1
sp|Q8VDC1|FYCO1_MOUSE 2 0
896. T-complex protein 1 subunit beta sp|P80314|TCPB_MOUSE 2 0
897. Heterogeneous nuclear ribonucleoprotein H
tr|Q8C2Q7|Q8C2Q7_MOUSE 2 0
898. Fatty acid synthase sp|P19096|FAS_MOUSE 2 0
899. Membrane-associated progesterone receptor component 2
sp|Q80UU9|PGRC2_MOUSE 3 0
900. 26S proteasome non-ATPase regulatory subunit 13
sp|Q9WVJ2|PSD13_MOUSE 2 0
901. N-acylethanolamine-hydrolyzing acid amidase
sp|Q9D7V9|NAAA_MOUSE 3 0
902. Phosphoglycerate mutase 1 sp|Q9DBJ1|PGAM1_MOUSE 3 0
903. DNA mismatch repair protein Msh6 sp|P54276|MSH6_MOUSE 2 0
904. Myosin light polypeptide 6 sp|Q60605|MYL6_MOUSE 5 0
905. Replication factor C subunit 4 tr|Q3UI84|Q3UI84_MOUSE 4 0
906. OCIA domain-containing protein 1 sp|Q9CRD0|OCAD1_MOUSE 3 0
907. GEM-interacting protein sp|Q6PGG2|GMIP_MOUSE 8 0
908. Transmembrane protein 109 sp|Q3UBX0|TM109_MOUSE 2 0
909. Uncharacterized protein KIAA0090 sp|Q8C7X2|K0090_MOUSE 2 0
910. Transmembrane protein 106A sp|Q8VC04|T106A_MOUSE 4 0
911. Isoform B of AP-2 complex subunit alpha-1
sp|P17426-2|AP2A1_MOUSE (+1)
2 0
912. Vacuolar protein sorting-associated protein 52 homolog
sp|Q8C754|VPS52_MOUSE 3 0
913. Protein DEK sp|Q7TNV0|DEK_MOUSE 2 0
914. Protein kinase C tr|Q4VA93|Q4VA93_MOUSE 2 0
915. Isoform 2 of Phosphatidylinositol-binding clathrin assembly protein
sp|Q7M6Y3-2|PICA_MOUSE (+1)
2 0
916. Histone acetyltransferase KAT7 sp|Q5SVQ0|KAT7_MOUSE 8 0
917. AP-2 complex subunit sigma sp|P62743|AP2S1_MOUSE 3 0
918. Torsin-1A sp|Q9ER39|TOR1A_MOUSE (+1)
2 0
919. Vigilin sp|Q8VDJ3|VIGLN_MOUSE 3 0
920. Isoform 3 of Epidermal growth factor receptor substrate 15-like 1
sp|Q60902-3|EP15R_MOUSE 2 0

Supplementary material
165
921. Protein Nup98 tr|E9Q4S2|E9Q4S2_MOUSE 3 0
922. Dedicator of cytokinesis protein 5 sp|B2RY04|DOCK5_MOUSE 2 0
923. FH1/FH2 domain-containing protein 1 sp|Q6P9Q4|FHOD1_MOUSE 2 0
924. NADH dehydrogenase [ubiquinone] iron-sulfur protein 2, mitochondrial
sp|Q91WD5|NDUS2_MOUSE 2 0
925. DNA mismatch repair protein Msh2 sp|P43247|MSH2_MOUSE 2 0
926. Glycerol-3-phosphate dehydrogenase, mitochondrial
sp|Q64521|GPDM_MOUSE 2 0
927. CTP synthase 1 sp|P70698|PYRG1_MOUSE 2 0
928. ADP-ribosylation factor-like protein 1 sp|P61211|ARL1_MOUSE 2 0
929. Exportin-5 sp|Q924C1|XPO5_MOUSE 2 0
930. Neighbor of COX4 sp|O70378|CX4NB_MOUSE 2 0
931. Nuclear pore complex protein Nup107
tr|E9Q4V9|E9Q4V9_MOUSE 3 0
932. Probable ATP-dependent RNA helicase DHX58
sp|Q99J87|DHX58_MOUSE 2 0
933. Uncharacterized protein tr|E9QK78|E9QK78_MOUSE 2 0
934. Isoform 2 of RNA-binding protein 39 sp|Q8VH51-2|RBM39_MOUSE (+1)
3 0
935. Sorting and assembly machinery component 50 homolog
sp|Q8BGH2|SAM50_MOUSE 2 0
936. Serpin B5 sp|P70124|SPB5_MOUSE 4 0
937. Arginine-glutamic acid dipeptide repeats protein
sp|Q80TZ9|RERE_MOUSE 2 0
938. Nucleolar GTP-binding protein 1 sp|Q99ME9|NOG1_MOUSE 2 0
939. Protein transport protein Sec23B sp|Q9D662|SC23B_MOUSE 7 0
940. Dihydrolipoyl dehydrogenase, mitochondrial
sp|O08749|DLDH_MOUSE 2 0
941. Cytochrome sp|P56395|CYB5_MOUSE (+1) 2 0
942. RNA 3'-terminal phosphate cyclase sp|Q9D7H3|RTC1_MOUSE 2 0
943. Replication factor C subunit 2 sp|Q9WUK4|RFC2_MOUSE 7 0
944. Isocitrate dehydrogenase [NAD] subunit alpha, mitochondrial
sp|Q9D6R2|IDH3A_MOUSE 2 0
945. Ran-binding protein 3-like sp|Q6PDH4|RNB3L_MOUSE 2 0
946. Structural maintenance of chromosomes protein 3
tr|E9Q762|E9Q762_MOUSE 3 0
947. Rho guanine nucleotide exchange factor 10-like protein
sp|A2AWP8|ARGAL_MOUSE 2 0
948. Eukaryotic translation initiation factor 3 subunit D
sp|O70194|EIF3D_MOUSE 2 0
949. Phosphoenolpyruvate carboxykinase [GTP], mitochondrial
sp|Q8BH04|PCKGM_MOUSE 3 0
950. Dedicator of cytokinesis protein 1 sp|Q8BUR4|DOCK1_MOUSE 2 0
951. Origin recognition complex subunit 4 sp|O88708|ORC4_MOUSE 6 0
952. Isoform 3 of ADP-dependent glucokinase
sp|Q8VDL4-3|ADPGK_MOUSE (+1)
2 0
953. Centromere/kinetochore protein zw10 homolog
sp|O54692|ZW10_MOUSE 2 0
954. Acyl-CoA dehydrogenase family member 9, mitochondrial
sp|Q8JZN5|ACAD9_MOUSE 3 0
955. Bystin sp|O54825|BYST_MOUSE 2 0
956. Beta-2 microglobulin tr|Q91XJ8|Q91XJ8_MOUSE 2 0
957. Glucose-6-phosphate 1-dehydrogenase X
sp|Q00612|G6PD1_MOUSE 6 0
958. Thioredoxin domain-containing protein 5
sp|Q91W90|TXND5_MOUSE 2 0

Supplementary material
166
959. Uncharacterized tr|E9Q360|E9Q360_MOUSE 2 0
960. Magnesium transporter protein 1 (Fragment)
tr|F6WHL0|F6WHL0_MOUSE 3 0
961. Protein SDA1 homolog sp|Q80UZ2|SDA1_MOUSE (+1)
2 0
962. Isoform 2 of Ubiquilin-1 sp|Q8R317-2|UBQL1_MOUSE 2 0
963. Calumenin sp|O35887|CALU_MOUSE 2 0
964. Aspartate aminotransferase, mitochondrial
sp|P05202|AATM_MOUSE 2 0
965. Eyes absent 3 homolog (Drosophila) tr|Q6P4T3|Q6P4T3_MOUSE 4 0
966. Prostaglandin G/H synthase 2 sp|Q05769|PGH2_MOUSE 3 0
967. 40S ribosomal protein S20 sp|P60867|RS20_MOUSE 2 0
968. 3-hydroxyacyl-CoA dehydratase 2 sp|Q9D3B1|HACD2_MOUSE 2 0
969. DNA polymerase tr|D6RFB8|D6RFB8_MOUSE 2 0
970. Complement component 1 Q subcomponent-binding protein, mitochondrial
tr|Q8R5L1|Q8R5L1_MOUSE 3 0
971. Isoform 3 of Heterogeneous nuclear ribonucleoprotein D0
sp|Q60668-3|HNRPD_MOUSE 3 0
972. Conserved oligomeric Golgi complex subunit 5
sp|Q8C0L8|COG5_MOUSE 2 0
973. Cohesin subunit SA-2 tr|A2AFF6|A2AFF6_MOUSE 2 0
974. Protein canopy homolog 2 sp|Q9QXT0|CNPY2_MOUSE 3 0
975. Beta-galactosidase tr|E9PVK3|E9PVK3_MOUSE 2 0
976. Isoform Bcl-X(beta) of Bcl-2-like protein 1
sp|Q64373-3|B2CL1_MOUSE (+3)
5 0
977. Uncharacterized protein KIAA0564 homolog
sp|Q8CC88|K0564_MOUSE 2 0
978. Glioblastoma amplified sequence tr|Q7TMG8|Q7TMG8_MOUSE 2 0
979. Eukaryotic translation initiation factor 3 subunit L
sp|Q8QZY1|EIF3L_MOUSE 2 0
980. Neutral cholesterol ester hydrolase 1 sp|Q8BLF1|NCEH1_MOUSE 2 0
981. Cleft lip and palate transmembrane protein 1-like protein
sp|Q8BXA5|CLP1L_MOUSE 2 0
982. MCG5400 tr|Q6ZWQ9|Q6ZWQ9_MOUSE 2 0
983. Protein Rabl2 tr|E9Q9D5|E9Q9D5_MOUSE 2 0
984. Beta-mannosidase sp|Q8K2I4|MANBA_MOUSE 3 0
985. Nucleoporin SEH1 sp|Q8R2U0|SEH1_MOUSE (+1)
2 0
986. Insulin-degrading enzyme (Fragment) tr|F6RPJ9|F6RPJ9_MOUSE 2 0
987. WASH complex subunit strumpellin sp|Q8C2E7|STRUM_MOUSE 4 0
988. Ribosomal biogenesis protein LAS1L sp|A2BE28|LAS1L_MOUSE 2 0
989. Serine palmitoyltransferase 2 sp|P97363|SPTC2_MOUSE 3 0
990. Calmodulin tr|Q3UKW2|Q3UKW2_MOUSE 2 0
991. Serine/threonine-protein phosphatase PP1-alpha catalytic subunit
sp|P62137|PP1A_MOUSE 2 0
992. Isoform 2 of Heterogeneous nuclear ribonucleoproteins A2/B1
sp|O88569-2|ROA2_MOUSE (+2)
2 0
993. RRP12-like protein sp|Q6P5B0|RRP12_MOUSE 2 0
994. Isoform 2 of Heat shock 70 kDa protein 14
sp|Q99M31-2|HSP7E_MOUSE 2 0
995. Exportin-2 tr|E9Q1T9|E9Q1T9_MOUSE 2 0
996. 40S ribosomal protein S2 sp|P25444|RS2_MOUSE 2 0
997. Formin binding protein 1 tr|A2AQ41|A2AQ41_MOUSE 2 0

Supplementary material
167
998. ATP-binding cassette sub-family D member 3
sp|P55096|ABCD3_MOUSE 2 0
999. Rho GTPase-activating protein 17 tr|E9QAJ9|E9QAJ9_MOUSE 2 0
1000. Lysophosphatidic acid phosphatase type 6
sp|Q8BP40|PPA6_MOUSE 2 0
1001. 26S proteasome non-ATPase regulatory subunit 14
sp|O35593|PSDE_MOUSE 2 0
1002. Isoform 1 of Serine/threonine-protein phosphatase 2A 56 kDa regulatory subunit gamma isoform
sp|Q60996-2|2A5G_MOUSE (+3)
4 0
1003. Charged multivesicular body protein 5
sp|Q9D7S9|CHMP5_MOUSE 3 0
1004. Elongation factor Ts, mitochondrial sp|Q9CZR8|EFTS_MOUSE 4 0
1005. Eukaryotic peptide chain release factor GTP-binding subunit ERF3A
tr|Q8K2E1|Q8K2E1_MOUSE 2 0
1006. Protein KTI12 homolog sp|Q9D1R2|KTI12_MOUSE 2 0
1007. Arrestin domain containing 1 (Fragment)
tr|A2AIS9|A2AIS9_MOUSE 2 0
1008. Toll-like receptor 9 sp|Q9EQU3|TLR9_MOUSE 2 0
1009. Guanine nucleotide-binding protein G(q) subunit alpha
sp|P21279|GNAQ_MOUSE 2 0
1010. NADH dehydrogenase [ubiquinone] iron-sulfur protein 7, mitochondrial
sp|Q9DC70|NDUS7_MOUSE 2 0
1011. PDZ and LIM domain protein 2 sp|Q8R1G6|PDLI2_MOUSE 2 0
1012. Nucleolar complex protein 4 homolog sp|Q8BHY2|NOC4L_MOUSE 5 0
1013. Neutral ceramidase sp|Q9JHE3|ASAH2_MOUSE 3 0
1014. Calcium-binding mitochondrial carrier protein Aralar2
sp|Q9QXX4|CMC2_MOUSE (+1)
2 0
1015. Proteasome activator complex subunit 3
sp|P61290|PSME3_MOUSE 3 0
1016. HIV-1 tat interactive protein 2, homolog (Human)
tr|Q99KN6|Q99KN6_MOUSE 2 0
1017. Toll-like receptor 3 sp|Q99MB1|TLR3_MOUSE 2 0
1018. S-phase kinase-associated protein sp|Q9WTX5|SKP1_MOUSE 3 0
1019. GPI transamidase component PIG-S tr|E9Q761|E9Q761_MOUSE 3 0
1020. V-type proton ATPase subunit d sp|Q80SY3|VA0D2_MOUSE 4 0
1021. Leucine-rich repeat-containing protein 8D
sp|Q8BGR2|LRC8D_MOUSE 3 0
1022. Vacuolar-sorting protein SNF8 sp|Q9CZ28|SNF8_MOUSE (+1)
4 0
1023. ATP synthase protein 8 tr|Q7JCZ0|Q7JCZ0_MOUSE 2 0
1024. Retinoic acid early-inducible protein 1-gamma
sp|O08604|RAE1C_MOUSE 2 0
1025. Nuclear pore complex protein Nup54 sp|Q8BTS4|NUP54_MOUSE 2 0
1026. LETM1 and EF-hand domain-containing protein 1, mitochondrial
sp|Q9Z2I0|LETM1_MOUSE 3 0
1027. Hamartin sp|Q9EP53|TSC1_MOUSE 2 0
1028. 28S ribosomal protein S27, mitochondrial
sp|Q8BK72|RT27_MOUSE 2 0
1029. Uncharacterized protein (Fragment) tr|F6SY09|F6SY09_MOUSE (+1)
2 0
1030. Lipoprotein lipase sp|P11152|LIPL_MOUSE 2 0
1031. Nucleotide exchange factor SIL1 sp|Q9EPK6|SIL1_MOUSE 2 0
1032. Isoform 2 of R3H domain-containing protein 2
sp|Q80TM6-2|R3HD2_MOUSE (+1)
2 0
1033. Pentatricopeptide repeat-containing protein 3, mitochondrial
sp|Q14C51|PTCD3_MOUSE 2 0

Supplementary material
168
1034. Histone deacetylase 8 sp|Q8VH37|HDAC8_MOUSE 4 0
1035. PCI domain-containing protein 2 tr|E9Q1N1|E9Q1N1_MOUSE 2 0
1036. Isoform 2 of Protein SET sp|Q9EQU5-2|SET_MOUSE 2 0
1037. Serine palmitoyltransferase 1 sp|O35704|SPTC1_MOUSE 2 0
1038. GPI-anchor transamidase sp|Q9CXY9|GPI8_MOUSE (+4)
2 0
1039. Protein tweety homolog 2 sp|Q3TH73|TTYH2_MOUSE 2 0
1040. Inosine triphosphate pyrophosphatase
sp|Q9D892|ITPA_MOUSE 2 0
1041. 28S ribosomal protein S29, mitochondrial
tr|G3X9M0|G3X9M0_MOUSE 2 0
1042. Serine/threonine-protein phosphatase 2A activator
sp|P58389|PTPA_MOUSE 2 0
1043. Ubiquitin carboxyl-terminal hydrolase isozyme L5
sp|Q9WUP7|UCHL5_MOUSE 2 0
1044. Coronin-1C sp|Q9WUM4|COR1C_MOUSE 2 0
1045. 2',3'-cyclic-nucleotide 3'-phosphodiesterase
sp|P16330|CN37_MOUSE 2 0
1046. NEDD8-conjugating enzyme Ubc12 (Fragment)
tr|F7CDT0|F7CDT0_MOUSE 2 0
1047. AP-3 complex subunit sigma-1 sp|Q9DCR2|AP3S1_MOUSE 2 0
1048. Integrator complex subunit 2 sp|Q80UK8|INT2_MOUSE 2 0
1049. Malate dehydrogenase, cytoplasmic sp|P14152|MDHC_MOUSE 2 0
1050. Fibrinogen gamma chain sp|Q8VCM7|FIBG_MOUSE (+1)
2 0
1051. Isoform 2 of Polyamine-modulated factor 1
sp|Q9CPV5-2|PMF1_MOUSE (+1)
2 0
1052. Nuclease-sensitive element-binding protein 1
sp|P62960|YBOX1_MOUSE 2 0
1053. BAG family molecular chaperone regulator 4
sp|Q8CI61|BAG4_MOUSE 2 0
1054. UMP-CMP kinase sp|Q9DBP5|KCY_MOUSE 2 0

Supplementary material
169
Table 0-2: Lipid species identified in control and TDM bead phagosomes. NAME Pair 1 Pair 2 Pair 3 Pair 4 Pair 5 Pair 6 Pair 7
control [mol %]
TDM [mol %]
control [mol %]
TDM [mol %]
control [mol %]
TDM [mol %]
control [mol %]
TDM [mol %]
control [mol %]
TDM [mol %]
control [mol %]
TDM [mol %]
control [mol %]
TDM [mol %]
Cer [32:0] 2,69E-04 2,02E-04 2,12E-04 1,37E-03 4,03E-04 5,92E-04 2,42E-03
Cer [32:1] 6,03E-03 7,90E-03 3,35E-03 4,03E-03 2,45E-03 3,46E-03 4,14E-03 7,11E-03 3,72E-03 8,09E-03 4,29E-03 4,05E-03
Cer [34:0] 7,01E-02 5,62E-02 2,45E-01 2,50E-01 8,96E-03 2,80E-02 4,16E-02 1,48E-01 1,15E-02 5,86E-02 1,51E-02 6,64E-02 1,92E-02 1,59E-01
Cer [34:1] 5,16E-01 5,62E-01 2,33E-01 2,54E-01 2,44E-01 2,81E-01 2,25E-01 2,58E-01 2,53E-01 3,47E-01 2,20E-01 5,08E-01 2,27E-01 1,70E-01
Cer [34:2] 4,53E-03 2,78E-03 2,72E-03 1,84E-03 2,74E-03 3,17E-03 4,88E-03 3,48E-03 6,39E-03 3,32E-03 2,98E-03
Cer [36:0] 3,39E-03 7,85E-03 1,15E-02 1,04E-01 5,00E-03 1,73E-02 7,13E-03 1,75E-02 7,39E-03 1,18E-01
Cer [36:1] 8,11E-02 6,61E-02 4,07E-02 4,83E-02 2,16E-02 4,58E-02 3,40E-02 3,04E-02 4,12E-02 4,25E-02 3,77E-02 5,82E-02 3,68E-02 2,76E-02
Cer [36:2] 3,33E-03 1,78E-03 2,26E-03 1,82E-03 2,00E-03 2,50E-03 6,19E-03 2,74E-03 4,13E-03 3,71E-03 1,97E-03
Cer [37:0] 3,52E-03 5,53E-04 5,42E-04 2,55E-03 4,83E-03
Cer [40:1] 1,11E-01 1,61E-01 6,72E-02 5,36E-02 1,54E-01 1,22E-01 1,32E-01 1,79E-01 1,04E-01 4,61E-02
Cer [40:2] 8,33E-03 1,01E-02 8,16E-03 1,43E-02 6,74E-03 8,67E-03 1,37E-02 1,39E-02 1,45E-02 1,95E-02 1,31E-02 6,90E-03
Cer [41:2] 8,40E-03 1,03E-02 7,00E-03 9,52E-03 5,23E-03 8,91E-03 9,80E-03 1,38E-02 1,03E-02 1,38E-02 8,43E-03 7,42E-03
Cer [42:2] 2,83E-01 3,06E-01 2,66E-01 3,39E-01 3,67E-01 4,43E-01 3,52E-01 3,80E-01 4,71E-01 3,81E-01 4,09E-01 6,03E-01 3,67E-01 2,21E-01
Cer [42:3] 2,63E-02 1,25E-02 1,39E-02 1,30E-02 2,11E-02 9,87E-03 1,21E-02 1,84E-02 1,19E-02 1,69E-02 2,13E-02 1,36E-02 7,70E-03
Cer [43:2] 3,35E-03 3,59E-03 4,21E-03 2,81E-03 2,31E-03 5,19E-03 5,95E-03 4,99E-03 6,24E-03 4,10E-03 3,19E-03
Cer [44:2] 4,53E-03 6,14E-03 3,56E-03 1,99E-03 4,55E-03 7,11E-03 4,42E-03 8,09E-03 3,97E-03 3,33E-03
Cholesterol 7,96E+00
1,28E+01
4,02E+00
6,47E+00
2,63E+01
2,82E+01
1,93E+01
2,74E+01
2,60E+01
3,04E+01
2,44E+01
2,64E+01
2,19E+01
3,50E+01
LBPA [32:1] 1,14E-02 6,82E-03 5,37E-03 4,95E-02 2,26E-02 6,21E-02 4,82E-02 5,63E-02 1,15E-01 6,81E-02 6,09E-02 7,94E-02 4,54E-02
LBPA [32:2] 1,87E-02 7,85E-03 1,26E-02 8,84E-03
LBPA [34:1] 7,82E-02 3,90E-02 2,46E-01 1,09E-01 2,61E-01 1,50E-01 5,10E-01 2,48E-01 2,86E-01 5,48E-01 3,50E-01 4,08E-01 4,45E-01 2,00E-01
LBPA [34:2] 1,83E-01 8,78E-02 6,36E-01 2,54E-01
LBPA [34:3] 1,69E-02 1,44E-01 6,74E-02
LBPA [34:4] 7,43E-03 2,86E-03 1,30E-03 3,52E-03 4,62E-03 6,19E-03 7,01E-03 6,20E-03 5,80E-03 9,52E-03 7,02E-03
LBPA [35:2] 2,61E-01 9,56E-02
LBPA [35:3] 2,28E-02 8,94E-03
LBPA [36:0] 3,49E-02 2,55E-02 1,87E-02 1,35E-02
LBPA [36:2] 6,47E+00
3,56E+00
2,89E+01
1,20E+01
6,05E+00
2,55E+00
1,91E+01
1,33E+01
1,07E+01
5,44E+00
1,27E+01
7,44E+00
1,59E+01
6,97E+00
LBPA [36:3] 2,96E+00
1,26E+00
5,01E-01 3,39E-01 2,08E+00
1,71E+00
1,17E+00
1,15E+00
1,21E+00
1,65E+00
1,84E+00
1,87E+00

Supplementary material
170
LBPA [36:4] 4,04E-01 1,68E-01 5,37E-02 3,76E-02 1,73E-01 1,41E-01 1,46E-01 1,68E-01 1,49E-01 1,74E-01 2,21E-01 1,75E-01
LBPA [36:5] 3,35E-02 1,64E-02
LBPA [37:2] 5,37E-01 2,20E-01
LBPA [37:3] 3,23E-01 1,19E-01
LBPA [37:4] 6,81E-02 3,05E-02
LBPA [38:1] 4,99E-01 1,59E-01 2,79E-02 1,94E-01 8,81E-02 9,25E-02 1,01E-01 1,33E-01 1,68E-01 1,44E-01
LBPA [38:2] 1,29E+00
3,93E-01 1,27E-01 1,05E-01 1,26E+00
2,96E-01 1,59E-01 3,26E-01 1,81E-01 2,58E-01 3,04E-01 2,94E-01
LBPA [38:3] 2,42E+00
9,20E-01 1,21E-01 1,13E-01 1,26E+00
5,61E-01 2,68E-01 4,79E-01 2,79E-01 5,50E-01 4,96E-01 6,49E-01
LBPA [38:4] 2,80E+00
1,01E+00
2,08E-01 1,32E-01 8,61E-01 8,21E-01 5,19E-01 5,97E-01 4,99E-01 6,94E-01 7,90E-01 8,29E-01
LBPA [38:5] 6,75E-01 2,86E-01 1,00E-01 6,41E-02 2,92E-01 3,74E-01 2,94E-01 3,37E-01 2,88E-01 3,63E-01 4,46E-01 3,72E-01
LBPA [38:6] 3,62E-01 1,82E-01 6,47E-02 4,06E-02 1,93E-01 2,16E-01 1,62E-01 2,22E-01 1,61E-01 1,86E-01 2,43E-01 2,39E-01
LBPA [38:7] 7,17E-02 3,06E-02 2,61E-02 1,52E-02 4,69E-02 4,65E-02 5,33E-02 9,50E-02 5,22E-02 4,68E-02 7,33E-02 5,92E-02
LBPA [39:4] 3,63E-01 1,13E-01 1,40E-02 6,48E-03 5,80E-02 3,65E-02 4,55E-02 3,47E-02 4,69E-02 6,25E-02 6,17E-02
LBPA [39:5] 8,79E-02 3,14E-02 5,94E-03 2,81E-03 1,43E-02 2,06E-02 1,86E-02 2,11E-02 1,78E-02 1,65E-02 2,66E-02 2,38E-02
LBPA [39:6] 3,19E-02 1,30E-02
LBPA [39:7] 1,04E-02
LBPA [39:9] 6,13E-03 2,79E-03 1,54E-02 4,13E-03 6,77E-03 7,79E-03 1,60E-02 6,33E-03
LBPA [40:1] 8,13E-03 3,64E-03
LBPA [40:3] 2,01E-01 4,85E-02 1,34E-02 8,25E-03 4,69E-02 2,30E-02 4,18E-02 2,81E-02 3,52E-02 4,67E-02 5,28E-02
LBPA [40:4] 4,79E-01 1,19E-01 1,19E-02 3,45E-02 2,28E-02 3,75E-02 2,15E-02 3,12E-02 3,52E-02 3,23E-02
LBPA [40:5] 1,18E+00
3,75E-01 1,10E-01 2,99E-01 1,86E-01 2,88E-01 1,99E-01 2,86E-01 3,57E-01 3,17E-01
LBPA [40:6] 1,68E+00
5,39E-01 4,84E-01 2,85E-01 1,97E+00
1,37E+00
1,24E+00
1,35E+00
1,77E+00
1,61E+00
LBPA [40:7] 4,54E-01 1,02E+00
5,83E-01 3,11E+00
1,93E+00
2,63E+00
1,96E+00
1,97E+00
2,99E+00
2,40E+00
LBPA [40:8] 1,51E-02 2,84E-01 8,71E-02 9,86E-02 4,55E-02 1,99E-01 2,14E-01 2,76E-01 3,01E-01 2,49E-01 2,69E-01 4,21E-01 2,92E-01
LBPA [41:7] 3,28E-02 1,49E-02 1,00E-02 4,13E-03 2,09E-02 2,39E-02 2,25E-02 3,33E-02 2,38E-02 2,01E-02 3,55E-02 3,28E-02
LBPA [41:8] 1,24E-02 3,69E-03 1,50E-03 5,39E-03 1,36E-02 1,02E-02 1,07E-02 1,17E-02 1,04E-02 2,22E-02 1,56E-02
LBPA [42:10] 4,74E-02 1,56E-02
LBPA [42:5] 1,40E-02 2,39E-02 9,24E-03 7,82E-03 3,31E-02 2,61E-02 2,92E-02 2,92E-02 2,48E-02 4,53E-02 3,40E-02
LBPA [42:6] 9,78E-02 2,33E-02 2,83E-02 8,06E-02 6,71E-02 9,09E-02 7,39E-02 6,54E-02 1,05E-01 9,19E-02
LBPA [42:7] 2,33E-01 5,07E-02 5,62E-02 2,80E-02 1,46E-01 1,29E-01 1,21E-01 1,52E-01 1,25E-01 1,27E-01 1,98E-01 1,63E-01
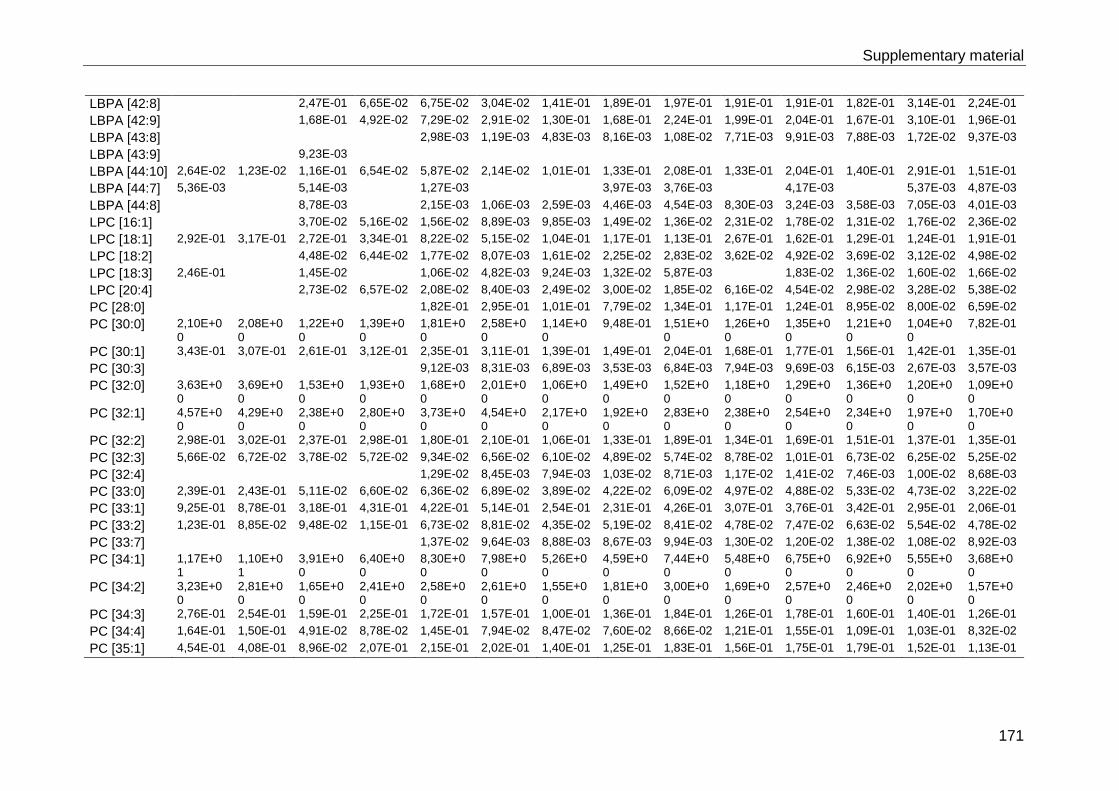
Supplementary material
171
LBPA [42:8] 2,47E-01 6,65E-02 6,75E-02 3,04E-02 1,41E-01 1,89E-01 1,97E-01 1,91E-01 1,91E-01 1,82E-01 3,14E-01 2,24E-01
LBPA [42:9] 1,68E-01 4,92E-02 7,29E-02 2,91E-02 1,30E-01 1,68E-01 2,24E-01 1,99E-01 2,04E-01 1,67E-01 3,10E-01 1,96E-01
LBPA [43:8] 2,98E-03 1,19E-03 4,83E-03 8,16E-03 1,08E-02 7,71E-03 9,91E-03 7,88E-03 1,72E-02 9,37E-03
LBPA [43:9] 9,23E-03
LBPA [44:10] 2,64E-02 1,23E-02 1,16E-01 6,54E-02 5,87E-02 2,14E-02 1,01E-01 1,33E-01 2,08E-01 1,33E-01 2,04E-01 1,40E-01 2,91E-01 1,51E-01
LBPA [44:7] 5,36E-03 5,14E-03 1,27E-03 3,97E-03 3,76E-03 4,17E-03 5,37E-03 4,87E-03
LBPA [44:8] 8,78E-03 2,15E-03 1,06E-03 2,59E-03 4,46E-03 4,54E-03 8,30E-03 3,24E-03 3,58E-03 7,05E-03 4,01E-03
LPC [16:1] 3,70E-02 5,16E-02 1,56E-02 8,89E-03 9,85E-03 1,49E-02 1,36E-02 2,31E-02 1,78E-02 1,31E-02 1,76E-02 2,36E-02
LPC [18:1] 2,92E-01 3,17E-01 2,72E-01 3,34E-01 8,22E-02 5,15E-02 1,04E-01 1,17E-01 1,13E-01 2,67E-01 1,62E-01 1,29E-01 1,24E-01 1,91E-01
LPC [18:2] 4,48E-02 6,44E-02 1,77E-02 8,07E-03 1,61E-02 2,25E-02 2,83E-02 3,62E-02 4,92E-02 3,69E-02 3,12E-02 4,98E-02
LPC [18:3] 2,46E-01 1,45E-02 1,06E-02 4,82E-03 9,24E-03 1,32E-02 5,87E-03 1,83E-02 1,36E-02 1,60E-02 1,66E-02
LPC [20:4] 2,73E-02 6,57E-02 2,08E-02 8,40E-03 2,49E-02 3,00E-02 1,85E-02 6,16E-02 4,54E-02 2,98E-02 3,28E-02 5,38E-02
PC [28:0] 1,82E-01 2,95E-01 1,01E-01 7,79E-02 1,34E-01 1,17E-01 1,24E-01 8,95E-02 8,00E-02 6,59E-02
PC [30:0] 2,10E+00
2,08E+00
1,22E+00
1,39E+00
1,81E+00
2,58E+00
1,14E+00
9,48E-01 1,51E+00
1,26E+00
1,35E+00
1,21E+00
1,04E+00
7,82E-01
PC [30:1] 3,43E-01 3,07E-01 2,61E-01 3,12E-01 2,35E-01 3,11E-01 1,39E-01 1,49E-01 2,04E-01 1,68E-01 1,77E-01 1,56E-01 1,42E-01 1,35E-01
PC [30:3] 9,12E-03 8,31E-03 6,89E-03 3,53E-03 6,84E-03 7,94E-03 9,69E-03 6,15E-03 2,67E-03 3,57E-03
PC [32:0] 3,63E+00
3,69E+00
1,53E+00
1,93E+00
1,68E+00
2,01E+00
1,06E+00
1,49E+00
1,52E+00
1,18E+00
1,29E+00
1,36E+00
1,20E+00
1,09E+00
PC [32:1] 4,57E+00
4,29E+00
2,38E+00
2,80E+00
3,73E+00
4,54E+00
2,17E+00
1,92E+00
2,83E+00
2,38E+00
2,54E+00
2,34E+00
1,97E+00
1,70E+00
PC [32:2] 2,98E-01 3,02E-01 2,37E-01 2,98E-01 1,80E-01 2,10E-01 1,06E-01 1,33E-01 1,89E-01 1,34E-01 1,69E-01 1,51E-01 1,37E-01 1,35E-01
PC [32:3] 5,66E-02 6,72E-02 3,78E-02 5,72E-02 9,34E-02 6,56E-02 6,10E-02 4,89E-02 5,74E-02 8,78E-02 1,01E-01 6,73E-02 6,25E-02 5,25E-02
PC [32:4] 1,29E-02 8,45E-03 7,94E-03 1,03E-02 8,71E-03 1,17E-02 1,41E-02 7,46E-03 1,00E-02 8,68E-03
PC [33:0] 2,39E-01 2,43E-01 5,11E-02 6,60E-02 6,36E-02 6,89E-02 3,89E-02 4,22E-02 6,09E-02 4,97E-02 4,88E-02 5,33E-02 4,73E-02 3,22E-02
PC [33:1] 9,25E-01 8,78E-01 3,18E-01 4,31E-01 4,22E-01 5,14E-01 2,54E-01 2,31E-01 4,26E-01 3,07E-01 3,76E-01 3,42E-01 2,95E-01 2,06E-01
PC [33:2] 1,23E-01 8,85E-02 9,48E-02 1,15E-01 6,73E-02 8,81E-02 4,35E-02 5,19E-02 8,41E-02 4,78E-02 7,47E-02 6,63E-02 5,54E-02 4,78E-02
PC [33:7] 1,37E-02 9,64E-03 8,88E-03 8,67E-03 9,94E-03 1,30E-02 1,20E-02 1,38E-02 1,08E-02 8,92E-03
PC [34:1] 1,17E+01
1,10E+01
3,91E+00
6,40E+00
8,30E+00
7,98E+00
5,26E+00
4,59E+00
7,44E+00
5,48E+00
6,75E+00
6,92E+00
5,55E+00
3,68E+00
PC [34:2] 3,23E+00
2,81E+00
1,65E+00
2,41E+00
2,58E+00
2,61E+00
1,55E+00
1,81E+00
3,00E+00
1,69E+00
2,57E+00
2,46E+00
2,02E+00
1,57E+00
PC [34:3] 2,76E-01 2,54E-01 1,59E-01 2,25E-01 1,72E-01 1,57E-01 1,00E-01 1,36E-01 1,84E-01 1,26E-01 1,78E-01 1,60E-01 1,40E-01 1,26E-01
PC [34:4] 1,64E-01 1,50E-01 4,91E-02 8,78E-02 1,45E-01 7,94E-02 8,47E-02 7,60E-02 8,66E-02 1,21E-01 1,55E-01 1,09E-01 1,03E-01 8,32E-02
PC [35:1] 4,54E-01 4,08E-01 8,96E-02 2,07E-01 2,15E-01 2,02E-01 1,40E-01 1,25E-01 1,83E-01 1,56E-01 1,75E-01 1,79E-01 1,52E-01 1,13E-01

Supplementary material
172
PC [35:2] 3,39E-01 2,78E-01 1,48E-01 2,36E-01 2,05E-01 2,07E-01 1,33E-01 1,43E-01 2,26E-01 1,45E-01 1,99E-01 1,88E-01 1,65E-01 1,39E-01
PC [36:1] 1,75E+00
1,50E+00
5,35E-01 1,34E+00
8,92E-01 8,96E-01 6,44E-01 9,54E-01 5,22E-01 8,83E-01 5,92E-01 6,19E-01 5,29E-01 8,13E-01
PC [36:2] 4,90E+00
4,14E+00
3,30E+00
6,17E+00
4,28E+00
4,62E+00
3,24E+00
4,19E+00
4,82E+00
3,44E+00
4,62E+00
4,61E+00
3,83E+00
3,83E+00
PC [36:3] 9,98E-01 8,56E-01 7,12E-01 1,14E+00
9,52E-01 1,08E+00
5,91E-01 1,01E+00
1,56E+00
6,70E-01 1,41E+00
1,20E+00
1,05E+00
9,32E-01
PC [36:4] 4,47E-01 4,68E-01 1,64E-01 2,85E-01 3,15E-01 2,15E-01 1,78E-01 1,76E-01 2,69E-01 2,84E-01 3,85E-01 3,02E-01 2,84E-01 1,94E-01
PC [36:5] 1,09E-01 1,05E-01 3,58E-02 6,83E-02 9,27E-02 6,00E-02 5,68E-02 6,36E-02 8,21E-02 9,62E-02 1,36E-01 1,06E-01 9,92E-02 7,81E-02
PC [37:1] 7,51E-02 4,94E-03 7,38E-03 6,38E-03 4,89E-03 7,26E-03 4,83E-03 5,26E-03 3,22E-03 4,04E-03
PC [37:2] 8,01E-02 3,06E-02 7,35E-02 3,69E-02 3,63E-02 2,86E-02 3,02E-02 3,57E-02 3,29E-02 3,42E-02 3,21E-02 2,76E-02 2,76E-02
PC [38:1] 1,40E-02 1,61E-02 1,14E-02 6,63E-03 7,48E-03 1,26E-02 7,60E-03 8,57E-03 5,25E-03 5,15E-03
PC [38:2] 2,31E-01 2,22E-01 8,21E-02 1,48E-01 8,85E-02 1,06E-01 8,90E-02 6,51E-02 7,11E-02 8,25E-02 7,50E-02 6,86E-02 6,16E-02 6,30E-02
PC [38:3] 3,36E-01 2,61E-01 1,69E-01 2,76E-01 9,79E-02 1,21E-01 6,70E-02 9,71E-02 1,18E-01 6,67E-02 1,02E-01 9,30E-02 8,09E-02 8,48E-02
PC [38:4] 3,63E-01 2,69E-01 2,64E-01 3,37E-01 1,09E-01 1,34E-01 6,62E-02 1,10E-01 1,18E-01 8,76E-02 1,15E-01 8,96E-02 8,73E-02 9,99E-02
PC [38:5] 2,73E-01 2,57E-01 1,62E-01 2,36E-01 1,73E-01 1,53E-01 1,26E-01 1,48E-01 1,66E-01 1,66E-01 2,51E-01 2,02E-01 1,78E-01 1,72E-01
PC [38:6] 7,32E-02 5,11E-02 3,09E-02 4,76E-02 5,68E-02 5,24E-02 3,13E-02 4,06E-02 5,50E-02 4,38E-02 8,46E-02 5,89E-02 5,94E-02 5,13E-02
PC [40:2] 5,85E-02 9,36E-03 1,35E-02 1,90E-02 1,26E-02 6,04E-03 6,17E-03 7,96E-03 5,11E-03 5,36E-03 6,60E-03 5,89E-03
PC [40:3] 1,44E-02 1,46E-02 9,53E-03 1,35E-02 6,44E-03 4,55E-03 9,51E-03 8,02E-03 8,58E-03 7,14E-03 6,52E-03 3,94E-03
PC [40:4] 6,20E-02 2,26E-02 2,72E-02 1,00E-02 1,24E-02 6,28E-03 4,68E-03 9,39E-03 6,72E-03 5,30E-03 4,43E-03 5,36E-03
PC [40:5] 4,04E-02 4,37E-02 1,65E-02 2,54E-02 1,13E-02 1,02E-02 1,78E-02 1,08E-02 1,60E-02 1,09E-02 1,13E-02 8,55E-03
PC [40:7] 2,37E-02 2,21E-02 1,85E-02 2,87E-02 9,58E-03 1,17E-02 2,04E-02 8,56E-03 2,07E-02 1,08E-02 1,28E-02 1,32E-02
PC [44:10] 8,40E-03 1,56E-02 2,79E-03 3,00E-03 5,17E-03 4,22E-03 3,08E-03 5,44E-03 1,51E-03 3,26E-03
PC-O [28:0] 4,80E-02 2,76E-02 2,91E-02 2,64E-02 4,03E-02 1,91E-02 1,66E-02 2,33E-02 1,61E-02 2,18E-02 2,37E-02 1,47E-02 1,76E-02
PC-O [29:0] 5,51E-02 4,03E-02 2,80E-02 2,35E-02 2,03E-02 2,58E-02 1,60E-02 1,03E-02 1,37E-02 1,51E-02 1,33E-02 1,15E-02 9,61E-03 9,44E-03
PC-O [30:0] 1,12E+00
9,76E-01 5,19E-01 6,46E-01 4,08E-01 4,38E-01 4,19E-01 2,70E-01 2,17E-01 2,54E-01 2,12E-01 2,15E-01 1,89E-01 2,05E-01
PC-O [30:1] 7,19E-02 4,29E-02 6,67E-02 7,81E-02 6,52E-02 7,05E-02 4,41E-02 3,82E-02 4,85E-02 3,97E-02 4,33E-02 4,34E-02 3,74E-02 2,97E-02
PC-O [31:0] 3,18E-01 2,21E-01 9,98E-02 1,39E-01 8,63E-02 8,37E-02 8,17E-02 7,94E-02 6,35E-02 7,84E-02 6,50E-02 7,20E-02 6,88E-02 6,73E-02
PC-O [31:1] 6,65E-02 5,24E-02 4,26E-02 4,96E-02 4,93E-02 5,40E-02 2,74E-02 2,53E-02 4,16E-02 3,08E-02 3,61E-02 3,18E-02 2,99E-02 2,43E-02
PC-O [31:2] 1,78E-02 9,36E-03 1,24E-02 8,64E-03 8,25E-03 9,72E-03 6,73E-03 1,08E-02 1,11E-02 9,61E-03 8,34E-03
PC-O [32:0] 5,34E-01 5,15E-01 5,86E-01 5,81E-01 2,49E-01 4,71E-01 2,66E-01 3,21E-01 2,78E-01 4,26E-01
PC-O [32:2] 5,62E-02 7,36E-02 4,37E-02 4,98E-02 2,86E-02 3,05E-02 4,30E-02 2,90E-02 3,61E-02 3,04E-02 3,29E-02 2,62E-02
PC-O [32:3] 1,84E-02 1,16E-02 1,88E-02 1,15E-02 8,85E-03 1,35E-02 1,60E-02 1,28E-02 1,31E-02 1,27E-02
PC-O [33:0] 2,04E-01 1,75E-01 3,90E-02 7,10E-02 4,60E-02 4,24E-02 4,47E-02 3,81E-02 2,61E-02 4,04E-02 2,56E-02 3,69E-02 3,04E-02 3,62E-02
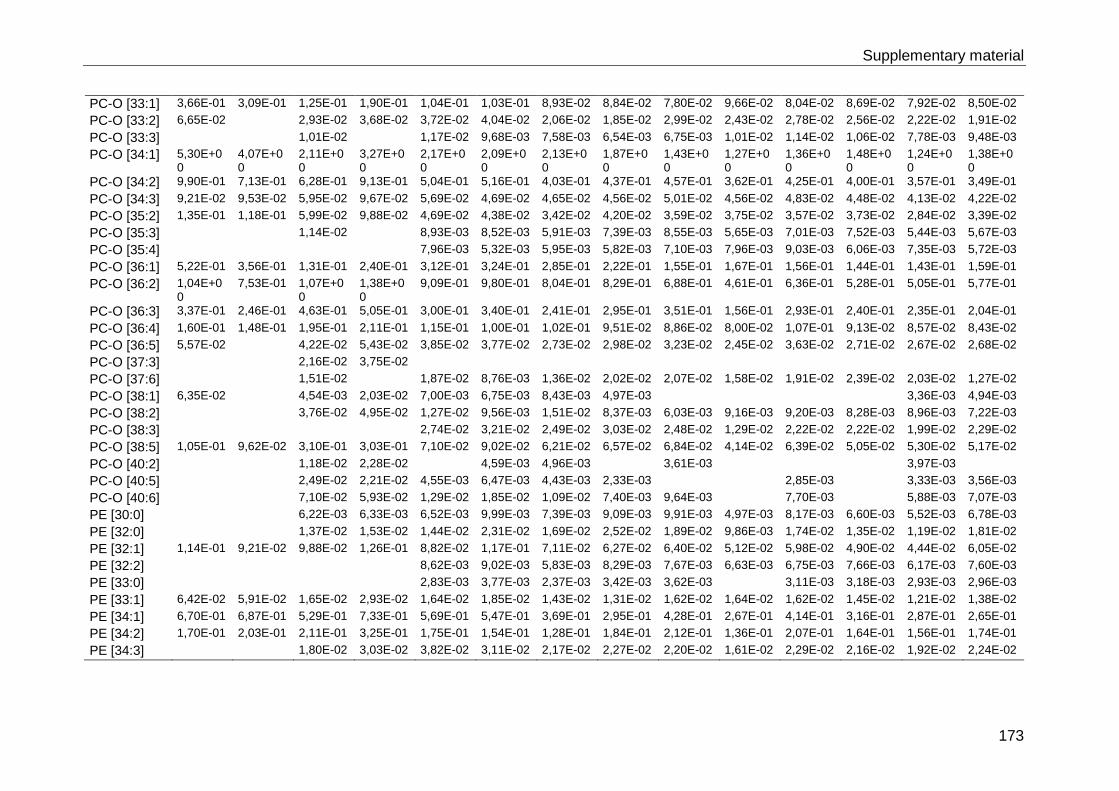
Supplementary material
173
PC-O [33:1] 3,66E-01 3,09E-01 1,25E-01 1,90E-01 1,04E-01 1,03E-01 8,93E-02 8,84E-02 7,80E-02 9,66E-02 8,04E-02 8,69E-02 7,92E-02 8,50E-02
PC-O [33:2] 6,65E-02 2,93E-02 3,68E-02 3,72E-02 4,04E-02 2,06E-02 1,85E-02 2,99E-02 2,43E-02 2,78E-02 2,56E-02 2,22E-02 1,91E-02
PC-O [33:3] 1,01E-02 1,17E-02 9,68E-03 7,58E-03 6,54E-03 6,75E-03 1,01E-02 1,14E-02 1,06E-02 7,78E-03 9,48E-03
PC-O [34:1] 5,30E+00
4,07E+00
2,11E+00
3,27E+00
2,17E+00
2,09E+00
2,13E+00
1,87E+00
1,43E+00
1,27E+00
1,36E+00
1,48E+00
1,24E+00
1,38E+00
PC-O [34:2] 9,90E-01 7,13E-01 6,28E-01 9,13E-01 5,04E-01 5,16E-01 4,03E-01 4,37E-01 4,57E-01 3,62E-01 4,25E-01 4,00E-01 3,57E-01 3,49E-01
PC-O [34:3] 9,21E-02 9,53E-02 5,95E-02 9,67E-02 5,69E-02 4,69E-02 4,65E-02 4,56E-02 5,01E-02 4,56E-02 4,83E-02 4,48E-02 4,13E-02 4,22E-02
PC-O [35:2] 1,35E-01 1,18E-01 5,99E-02 9,88E-02 4,69E-02 4,38E-02 3,42E-02 4,20E-02 3,59E-02 3,75E-02 3,57E-02 3,73E-02 2,84E-02 3,39E-02
PC-O [35:3] 1,14E-02 8,93E-03 8,52E-03 5,91E-03 7,39E-03 8,55E-03 5,65E-03 7,01E-03 7,52E-03 5,44E-03 5,67E-03
PC-O [35:4] 7,96E-03 5,32E-03 5,95E-03 5,82E-03 7,10E-03 7,96E-03 9,03E-03 6,06E-03 7,35E-03 5,72E-03
PC-O [36:1] 5,22E-01 3,56E-01 1,31E-01 2,40E-01 3,12E-01 3,24E-01 2,85E-01 2,22E-01 1,55E-01 1,67E-01 1,56E-01 1,44E-01 1,43E-01 1,59E-01
PC-O [36:2] 1,04E+00
7,53E-01 1,07E+00
1,38E+00
9,09E-01 9,80E-01 8,04E-01 8,29E-01 6,88E-01 4,61E-01 6,36E-01 5,28E-01 5,05E-01 5,77E-01
PC-O [36:3] 3,37E-01 2,46E-01 4,63E-01 5,05E-01 3,00E-01 3,40E-01 2,41E-01 2,95E-01 3,51E-01 1,56E-01 2,93E-01 2,40E-01 2,35E-01 2,04E-01
PC-O [36:4] 1,60E-01 1,48E-01 1,95E-01 2,11E-01 1,15E-01 1,00E-01 1,02E-01 9,51E-02 8,86E-02 8,00E-02 1,07E-01 9,13E-02 8,57E-02 8,43E-02
PC-O [36:5] 5,57E-02 4,22E-02 5,43E-02 3,85E-02 3,77E-02 2,73E-02 2,98E-02 3,23E-02 2,45E-02 3,63E-02 2,71E-02 2,67E-02 2,68E-02
PC-O [37:3] 2,16E-02 3,75E-02
PC-O [37:6] 1,51E-02 1,87E-02 8,76E-03 1,36E-02 2,02E-02 2,07E-02 1,58E-02 1,91E-02 2,39E-02 2,03E-02 1,27E-02
PC-O [38:1] 6,35E-02 4,54E-03 2,03E-02 7,00E-03 6,75E-03 8,43E-03 4,97E-03 3,36E-03 4,94E-03
PC-O [38:2] 3,76E-02 4,95E-02 1,27E-02 9,56E-03 1,51E-02 8,37E-03 6,03E-03 9,16E-03 9,20E-03 8,28E-03 8,96E-03 7,22E-03
PC-O [38:3] 2,74E-02 3,21E-02 2,49E-02 3,03E-02 2,48E-02 1,29E-02 2,22E-02 2,22E-02 1,99E-02 2,29E-02
PC-O [38:5] 1,05E-01 9,62E-02 3,10E-01 3,03E-01 7,10E-02 9,02E-02 6,21E-02 6,57E-02 6,84E-02 4,14E-02 6,39E-02 5,05E-02 5,30E-02 5,17E-02
PC-O [40:2] 1,18E-02 2,28E-02 4,59E-03 4,96E-03 3,61E-03 3,97E-03
PC-O [40:5] 2,49E-02 2,21E-02 4,55E-03 6,47E-03 4,43E-03 2,33E-03 2,85E-03 3,33E-03 3,56E-03
PC-O [40:6] 7,10E-02 5,93E-02 1,29E-02 1,85E-02 1,09E-02 7,40E-03 9,64E-03 7,70E-03 5,88E-03 7,07E-03
PE [30:0] 6,22E-03 6,33E-03 6,52E-03 9,99E-03 7,39E-03 9,09E-03 9,91E-03 4,97E-03 8,17E-03 6,60E-03 5,52E-03 6,78E-03
PE [32:0] 1,37E-02 1,53E-02 1,44E-02 2,31E-02 1,69E-02 2,52E-02 1,89E-02 9,86E-03 1,74E-02 1,35E-02 1,19E-02 1,81E-02
PE [32:1] 1,14E-01 9,21E-02 9,88E-02 1,26E-01 8,82E-02 1,17E-01 7,11E-02 6,27E-02 6,40E-02 5,12E-02 5,98E-02 4,90E-02 4,44E-02 6,05E-02
PE [32:2] 8,62E-03 9,02E-03 5,83E-03 8,29E-03 7,67E-03 6,63E-03 6,75E-03 7,66E-03 6,17E-03 7,60E-03
PE [33:0] 2,83E-03 3,77E-03 2,37E-03 3,42E-03 3,62E-03 3,11E-03 3,18E-03 2,93E-03 2,96E-03
PE [33:1] 6,42E-02 5,91E-02 1,65E-02 2,93E-02 1,64E-02 1,85E-02 1,43E-02 1,31E-02 1,62E-02 1,64E-02 1,62E-02 1,45E-02 1,21E-02 1,38E-02
PE [34:1] 6,70E-01 6,87E-01 5,29E-01 7,33E-01 5,69E-01 5,47E-01 3,69E-01 2,95E-01 4,28E-01 2,67E-01 4,14E-01 3,16E-01 2,87E-01 2,65E-01
PE [34:2] 1,70E-01 2,03E-01 2,11E-01 3,25E-01 1,75E-01 1,54E-01 1,28E-01 1,84E-01 2,12E-01 1,36E-01 2,07E-01 1,64E-01 1,56E-01 1,74E-01
PE [34:3] 1,80E-02 3,03E-02 3,82E-02 3,11E-02 2,17E-02 2,27E-02 2,20E-02 1,61E-02 2,29E-02 2,16E-02 1,92E-02 2,24E-02

Supplementary material
174
PE [35:1] 5,67E-02 6,84E-02 2,99E-02 4,74E-02 4,35E-02 3,69E-02 2,61E-02 2,29E-02 3,97E-02 2,71E-02 3,82E-02 3,12E-02 2,79E-02 2,29E-02
PE [35:2] 2,52E-02 3,27E-02 2,15E-02 4,27E-02 2,29E-02 1,72E-02 1,61E-02 2,73E-02 3,40E-02 2,54E-02 3,32E-02 3,09E-02 2,74E-02 2,91E-02
PE [36:1] 5,44E-01 8,15E-01 4,96E-01 9,09E-01 6,15E-01 4,69E-01 3,46E-01 2,95E-01 5,16E-01 2,99E-01 4,97E-01 3,68E-01 3,34E-01 2,80E-01
PE [36:2] 5,58E-01 1,09E+00
8,22E-01 1,74E+00
8,95E-01 6,25E-01 6,63E-01 1,03E+00
1,41E+00
7,71E-01 1,42E+00
1,14E+00
1,11E+00
1,04E+00
PE [36:3] 8,23E-02 1,82E-01 1,37E-01 2,89E-01 1,73E-01 1,14E-01 1,33E-01 3,03E-01 3,70E-01 1,87E-01 3,65E-01 2,89E-01 2,78E-01 2,96E-01
PE [36:4] 4,50E-02 9,91E-02 3,11E-02 6,87E-02 5,18E-02 3,49E-02 3,20E-02 4,65E-02 6,50E-02 4,69E-02 6,53E-02 5,50E-02 5,30E-02 5,14E-02
PE [36:5] 6,69E-03 1,60E-02 1,05E-02 9,62E-03 1,19E-02 1,52E-02 1,32E-02 1,47E-02 1,32E-02 1,47E-02 1,46E-02
PE [37:1] 2,36E-03 3,89E-03 2,65E-03 1,84E-03 1,81E-03 2,93E-03 2,57E-03 2,02E-03 2,67E-03 2,07E-03 2,04E-03 3,85E-03
PE [37:2] 7,61E-03 1,97E-02 9,81E-03 6,37E-03 8,53E-03 1,19E-02 1,64E-02 1,11E-02 1,72E-02 1,46E-02 1,37E-02 1,47E-02
PE [37:3] 5,72E-03 1,34E-02 5,96E-03 4,60E-03 4,45E-03 8,16E-03 1,02E-02 5,66E-03 9,33E-03 9,64E-03 8,06E-03 8,79E-03
PE [38:1] 2,73E-03 8,95E-03 4,31E-03 2,87E-03 2,63E-03 3,10E-03 3,46E-03 3,55E-03 3,10E-03 3,57E-03 3,24E-03 3,17E-03
PE [38:2] 1,50E-02 3,11E-03 5,69E-03 3,79E-03 4,46E-03 1,19E-02 1,00E-02 7,85E-03 1,20E-02 1,12E-02 9,72E-03 7,57E-03 1,06E-02
PE [38:3] 6,17E-02 1,84E-01 1,09E-01 2,45E-01 1,10E-01 7,98E-02 8,44E-02 1,11E-01 2,00E-01 8,95E-02 1,71E-01 1,47E-01 1,36E-01 1,21E-01
PE [38:4] 1,54E-01 3,87E-01 1,93E-01 3,99E-01 2,72E-01 2,00E-01 1,60E-01 2,08E-01 3,72E-01 1,70E-01 3,21E-01 2,75E-01 2,54E-01 2,29E-01
PE [38:5] 7,32E-02 1,46E-01 7,93E-02 1,59E-01 1,60E-01 1,20E-01 8,92E-02 1,17E-01 1,93E-01 9,39E-02 1,66E-01 1,36E-01 1,30E-01 1,32E-01
PE [38:6] 2,91E-02 1,12E-02 2,46E-02 4,04E-02 3,00E-02 2,13E-02 2,10E-02 3,59E-02 2,30E-02 3,24E-02 2,68E-02 2,89E-02 2,83E-02
PE [40:2] 1,96E-03 1,63E-03 2,48E-03 1,72E-03 1,60E-03 1,64E-03 1,71E-03 2,20E-03 1,44E-03
PE [40:4] 1,98E-03 1,85E-03 2,07E-03 2,07E-03 3,73E-03 2,46E-03 2,91E-03 4,07E-03 2,90E-03 2,03E-03
PE [40:5] 4,02E-02 6,52E-02 3,19E-02 7,27E-02 1,81E-02 1,53E-02 2,01E-02 1,34E-02 2,17E-02 1,21E-02 2,08E-02 2,01E-02 2,12E-02 1,73E-02
PE [40:6] 2,87E-02 5,45E-02 2,10E-02 4,21E-02 3,26E-02 2,94E-02 2,19E-02 1,23E-02 2,95E-02 1,86E-02 2,64E-02 2,02E-02 2,40E-02 1,88E-02
PE [40:7] 8,67E-03 1,76E-02 1,38E-02 1,35E-02 9,82E-03 6,95E-03 1,26E-02 9,30E-03 1,20E-02 9,80E-03 8,93E-03 9,92E-03
PE-O [30:0] 1,00E-03 1,35E-03 1,14E-03 1,59E-03 1,25E-03 2,06E-03 1,37E-03 1,69E-03 2,01E-03
PE-O [30:1] 2,53E-03 2,59E-03 2,90E-03 4,44E-03 4,72E-03 3,44E-03 3,54E-03 2,68E-03 2,42E-03 2,62E-03 4,58E-03
PE-O [32:0] 6,66E-03 1,69E-02 3,32E-03 3,42E-03 3,15E-03 4,71E-03 1,46E-03 4,03E-03 2,03E-03 3,23E-03 1,87E-03 4,15E-03
PE-O [32:1] 2,21E-02 9,96E-03 1,01E-02 1,51E-02 2,17E-02 1,42E-02 1,30E-02 1,09E-02 1,57E-02
PE-O [32:2] 3,25E-02 1,92E-02 6,11E-02 7,69E-02 4,72E-02 4,80E-02 6,06E-02 6,07E-02 4,34E-02 6,90E-02 4,36E-02 4,90E-02 4,12E-02 6,66E-02
PE-O [32:3] 3,95E-03 2,45E-03 2,03E-03 2,72E-03 3,86E-03 3,40E-03 5,08E-03 3,51E-03 4,59E-03 3,13E-03 4,85E-03
PE-O [33:1] 2,65E-03 4,48E-03 1,42E-03 8,68E-04 1,53E-03 2,99E-03 2,21E-03 7,69E-04 1,91E-03 1,22E-03 1,91E-03 1,35E-03
PE-O [33:2] 2,69E-02 1,32E-02 2,06E-02 1,62E-02 1,37E-02 1,73E-02 1,99E-02 1,78E-02 2,49E-02 1,73E-02 1,94E-02 1,61E-02 2,44E-02
PE-O [33:3] 2,86E-03 3,25E-03 2,48E-03 3,00E-03 2,76E-03 4,37E-03 6,05E-03 4,66E-03 3,99E-03 3,89E-03 4,37E-03
PE-O [34:0] 5,38E-03 4,51E-03 3,32E-03 4,05E-03 8,37E-03 4,24E-03 5,80E-03 3,79E-03 4,09E-03 2,46E-03 6,79E-03
PE-O [34:2] 2,15E-01 2,16E-01 4,27E-01 7,20E-01 4,72E-01 3,39E-01 5,50E-01 6,85E-01 5,00E-01 7,60E-01 5,29E-01 5,32E-01 4,85E-01 7,35E-01
PE-O [34:3] 8,39E-02 7,37E-02 1,26E-01 1,96E-01 3,12E-01 2,36E-01 3,35E-01 3,60E-01 4,16E-01 5,90E-01 4,26E-01 4,15E-01 3,77E-01 4,59E-01

Supplementary material
175
PE-O [34:4] 6,33E-03 1,03E-02 1,10E-02 8,13E-03 1,01E-02 1,15E-02 1,21E-02 2,04E-02 1,24E-02 1,28E-02 1,26E-02 1,50E-02
PE-O [35:2] 1,90E-02 2,46E-02 5,10E-02 3,81E-02 2,25E-02 4,17E-02 6,23E-02 4,13E-02 6,83E-02 4,69E-02 4,86E-02 4,41E-02 6,92E-02
PE-O [35:3] 3,66E-02 2,32E-02 3,86E-02 4,93E-02 5,27E-02 7,77E-02 5,65E-02 5,64E-02 5,57E-02 6,18E-02
PE-O [35:4] 3,98E-03 1,07E-02 5,78E-03 4,48E-03 5,94E-03 9,46E-03 8,96E-03 1,38E-02 7,63E-03 8,59E-03 9,60E-03 1,10E-02
PE-O [36:2] 6,53E-02 1,43E-01 1,05E-01 2,55E-01 2,29E-01 1,32E-01 2,61E-01 2,80E-01 1,81E-01 2,85E-01 1,90E-01 2,03E-01 1,97E-01 2,83E-01
PE-O [36:3] 6,28E-02 1,25E-01 1,54E-01 3,42E-01 4,29E-01 2,55E-01 4,69E-01 5,60E-01 5,27E-01 8,31E-01 5,58E-01 5,94E-01 5,40E-01 7,03E-01
PE-O [36:4] 3,83E-02 9,11E-02 1,48E-01 3,13E-01 2,78E-01 1,72E-01 2,96E-01 4,11E-01 4,34E-01 5,70E-01 4,28E-01 4,43E-01 4,21E-01 5,25E-01
PE-O [36:5] 8,72E-02 1,83E-01 2,28E-01 4,00E-01 4,20E-01 2,88E-01 3,45E-01 4,09E-01 6,04E-01 5,16E-01 5,57E-01 5,43E-01 5,24E-01 4,81E-01
PE-O [36:6] 4,60E-02 2,79E-02 5,64E-02 1,56E-01 1,14E-01 1,17E-01 9,60E-02 1,42E-01 1,42E-01 1,32E-01 1,16E-01 1,19E-01 1,15E-01
PE-O [37:3] 4,75E-03 2,22E-03 4,88E-03 6,96E-03 4,95E-03 9,69E-03 5,68E-03 8,06E-03 6,03E-03 9,70E-03
PE-O [37:4] 1,47E-02 3,10E-02 2,43E-02 1,46E-02 2,58E-02 4,28E-02 4,04E-02 4,51E-02 3,64E-02 4,27E-02 4,06E-02 4,98E-02
PE-O [37:6] 4,14E-02 4,31E-03 9,78E-03 1,64E-02 1,11E-02 1,20E-02 1,24E-02 1,85E-02 1,74E-02 1,70E-02 1,57E-02 1,58E-02 1,71E-02
PE-O [38:2] 4,17E-03 1,04E-02 9,28E-03 4,88E-03 1,19E-02 6,79E-03 6,38E-03 1,08E-02 5,98E-03 6,41E-03 5,53E-03 8,86E-03
PE-O [38:3] 9,59E-04 7,94E-03 3,58E-03 1,64E-03 7,78E-03 6,89E-03 2,23E-03 8,84E-03 4,16E-03 5,62E-03 6,33E-03 7,64E-03
PE-O [38:4] 3,70E-02 7,67E-02 1,09E-01 1,97E-01 1,32E-01 8,96E-02 1,45E-01 1,59E-01 1,43E-01 1,58E-01 1,26E-01 1,42E-01 1,30E-01 1,77E-01
PE-O [38:5] 9,17E-02 1,37E-01 2,33E-01 3,58E-01 5,41E-01 4,10E-01 4,38E-01 4,15E-01 6,50E-01 4,79E-01 5,52E-01 5,22E-01 5,31E-01 4,83E-01
PE-O [38:6] 8,75E-02 1,19E-01 2,27E-01 3,17E-01 5,14E-01 4,02E-01 4,16E-01 3,18E-01 6,09E-01 4,29E-01 5,15E-01 4,63E-01 4,74E-01 3,91E-01
PE-O [38:7] 6,28E-02 4,04E-02 5,18E-02 7,89E-02 2,26E-01 1,96E-01 1,81E-01 9,63E-02 2,02E-01 1,64E-01 1,66E-01 1,41E-01 1,48E-01 1,28E-01
PE-O [39:6] 7,59E-03 1,19E-02 1,13E-02 8,19E-03 1,13E-02 7,14E-03 1,33E-02 1,06E-02 1,11E-02 1,06E-02 1,11E-02 9,90E-03
PE-O [39:7] 5,29E-03 8,82E-03 1,24E-02 1,12E-02 1,06E-02 6,65E-03 1,17E-02 9,68E-03 9,05E-03 8,42E-03 8,66E-03 8,90E-03
PE-O [40:3] 2,17E-03 6,93E-03 2,95E-03 2,17E-03 4,27E-03 2,67E-03 1,40E-03 3,27E-03 1,50E-03 2,00E-03 1,68E-03 2,31E-03
PE-O [40:4] 6,58E-03 1,23E-02 4,50E-03 2,96E-03 6,88E-03 2,69E-03 4,53E-03 3,42E-03 3,29E-03 4,47E-03 3,75E-03 3,25E-03
PE-O [40:5] 1,30E-02 1,95E-02 9,02E-03 7,02E-03 1,03E-02 6,77E-03 6,94E-03 7,16E-03 6,76E-03 5,70E-03 6,82E-03 9,49E-03
PE-O [40:6] 4,35E-02 6,91E-02 6,42E-02 5,38E-02 6,49E-02 2,67E-02 4,97E-02 4,97E-02 3,78E-02 4,34E-02 4,28E-02 3,52E-02
PE-O [40:7] 1,27E-01 1,26E-01 1,21E-01 4,27E-02 1,10E-01 7,56E-02 8,98E-02 6,56E-02 7,31E-02 7,52E-02
PE-O [42:7] 2,63E-03 1,85E-03 2,13E-03 1,35E-03 3,27E-03 3,08E-03 3,48E-03
PG [32:0] 9,92E-03 7,95E-03 6,96E-03 5,95E-03 8,88E-03 1,05E-02 9,08E-03 9,16E-03 7,96E-03 8,18E-03
PG [32:2] 1,76E-03 2,62E-03 9,04E-04 8,29E-04 8,34E-04 6,80E-04 7,83E-04 9,40E-04 1,90E-03 5,87E-04 7,52E-04 8,92E-04
PG [33:2] 7,56E-04 2,49E-04 1,66E-04 3,28E-04 8,16E-04
PG [34:0] 2,92E-03 1,85E-02 1,59E-02 1,97E-02 1,88E-02 2,63E-02 1,65E-02 2,28E-02 2,20E-02 2,61E-02
PG [34:1] 2,62E-01 1,78E-01 1,32E-01 9,72E-02 4,05E-01 5,19E-01 1,90E-01 6,22E-02 2,33E-01 1,04E-01 2,35E-01 1,44E-01 1,18E-01 4,73E-02
PG [34:2] 1,13E-01 2,58E-02 5,75E-02 5,58E-02 2,55E-02 2,82E-02 3,06E-02 1,52E-02 2,34E-02 1,23E-02 6,06E-02 1,63E-02 1,61E-02 2,14E-02
PG [34:3] 1,16E-02 9,70E-03 1,01E-02 2,37E-03 2,28E-03 2,80E-03 3,14E-03 3,57E-03 1,72E-03 8,39E-03 2,17E-03 2,42E-03 3,48E-03
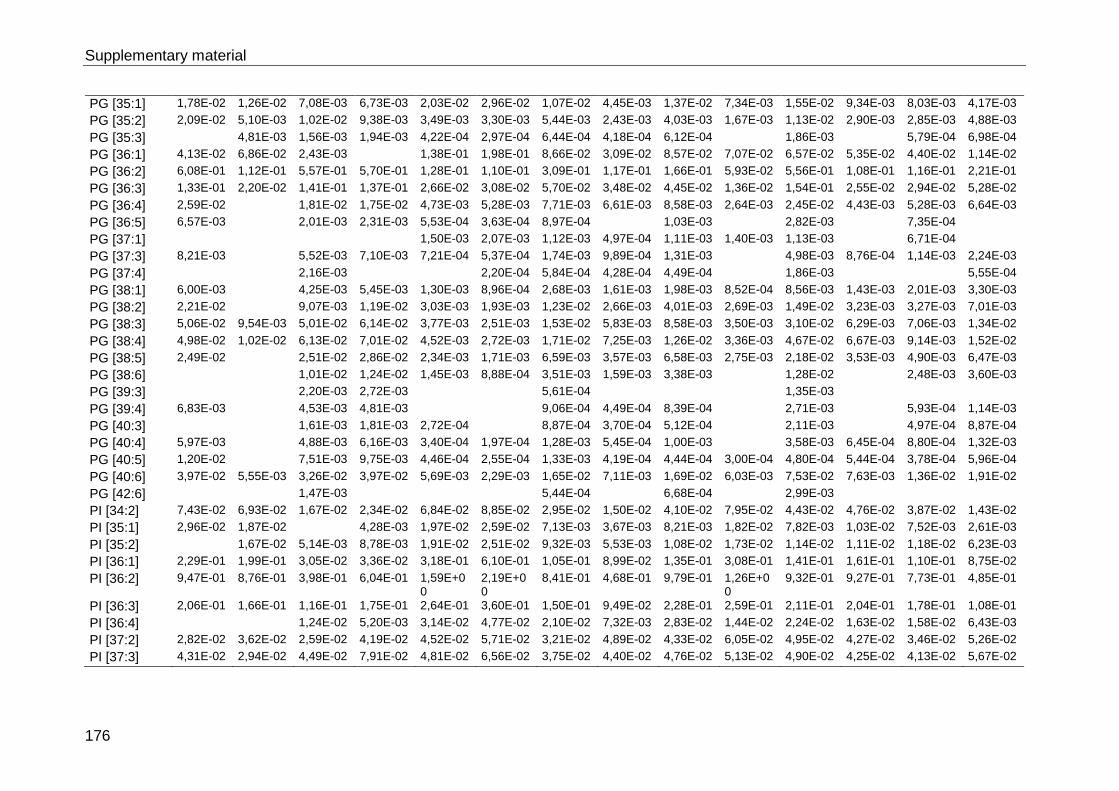
Supplementary material
176
PG [35:1] 1,78E-02 1,26E-02 7,08E-03 6,73E-03 2,03E-02 2,96E-02 1,07E-02 4,45E-03 1,37E-02 7,34E-03 1,55E-02 9,34E-03 8,03E-03 4,17E-03
PG [35:2] 2,09E-02 5,10E-03 1,02E-02 9,38E-03 3,49E-03 3,30E-03 5,44E-03 2,43E-03 4,03E-03 1,67E-03 1,13E-02 2,90E-03 2,85E-03 4,88E-03
PG [35:3] 4,81E-03 1,56E-03 1,94E-03 4,22E-04 2,97E-04 6,44E-04 4,18E-04 6,12E-04 1,86E-03 5,79E-04 6,98E-04
PG [36:1] 4,13E-02 6,86E-02 2,43E-03 1,38E-01 1,98E-01 8,66E-02 3,09E-02 8,57E-02 7,07E-02 6,57E-02 5,35E-02 4,40E-02 1,14E-02
PG [36:2] 6,08E-01 1,12E-01 5,57E-01 5,70E-01 1,28E-01 1,10E-01 3,09E-01 1,17E-01 1,66E-01 5,93E-02 5,56E-01 1,08E-01 1,16E-01 2,21E-01
PG [36:3] 1,33E-01 2,20E-02 1,41E-01 1,37E-01 2,66E-02 3,08E-02 5,70E-02 3,48E-02 4,45E-02 1,36E-02 1,54E-01 2,55E-02 2,94E-02 5,28E-02
PG [36:4] 2,59E-02 1,81E-02 1,75E-02 4,73E-03 5,28E-03 7,71E-03 6,61E-03 8,58E-03 2,64E-03 2,45E-02 4,43E-03 5,28E-03 6,64E-03
PG [36:5] 6,57E-03 2,01E-03 2,31E-03 5,53E-04 3,63E-04 8,97E-04 1,03E-03 2,82E-03 7,35E-04
PG [37:1] 1,50E-03 2,07E-03 1,12E-03 4,97E-04 1,11E-03 1,40E-03 1,13E-03 6,71E-04
PG [37:3] 8,21E-03 5,52E-03 7,10E-03 7,21E-04 5,37E-04 1,74E-03 9,89E-04 1,31E-03 4,98E-03 8,76E-04 1,14E-03 2,24E-03
PG [37:4] 2,16E-03 2,20E-04 5,84E-04 4,28E-04 4,49E-04 1,86E-03 5,55E-04
PG [38:1] 6,00E-03 4,25E-03 5,45E-03 1,30E-03 8,96E-04 2,68E-03 1,61E-03 1,98E-03 8,52E-04 8,56E-03 1,43E-03 2,01E-03 3,30E-03
PG [38:2] 2,21E-02 9,07E-03 1,19E-02 3,03E-03 1,93E-03 1,23E-02 2,66E-03 4,01E-03 2,69E-03 1,49E-02 3,23E-03 3,27E-03 7,01E-03
PG [38:3] 5,06E-02 9,54E-03 5,01E-02 6,14E-02 3,77E-03 2,51E-03 1,53E-02 5,83E-03 8,58E-03 3,50E-03 3,10E-02 6,29E-03 7,06E-03 1,34E-02
PG [38:4] 4,98E-02 1,02E-02 6,13E-02 7,01E-02 4,52E-03 2,72E-03 1,71E-02 7,25E-03 1,26E-02 3,36E-03 4,67E-02 6,67E-03 9,14E-03 1,52E-02
PG [38:5] 2,49E-02 2,51E-02 2,86E-02 2,34E-03 1,71E-03 6,59E-03 3,57E-03 6,58E-03 2,75E-03 2,18E-02 3,53E-03 4,90E-03 6,47E-03
PG [38:6] 1,01E-02 1,24E-02 1,45E-03 8,88E-04 3,51E-03 1,59E-03 3,38E-03 1,28E-02 2,48E-03 3,60E-03
PG [39:3] 2,20E-03 2,72E-03 5,61E-04 1,35E-03
PG [39:4] 6,83E-03 4,53E-03 4,81E-03 9,06E-04 4,49E-04 8,39E-04 2,71E-03 5,93E-04 1,14E-03
PG [40:3] 1,61E-03 1,81E-03 2,72E-04 8,87E-04 3,70E-04 5,12E-04 2,11E-03 4,97E-04 8,87E-04
PG [40:4] 5,97E-03 4,88E-03 6,16E-03 3,40E-04 1,97E-04 1,28E-03 5,45E-04 1,00E-03 3,58E-03 6,45E-04 8,80E-04 1,32E-03
PG [40:5] 1,20E-02 7,51E-03 9,75E-03 4,46E-04 2,55E-04 1,33E-03 4,19E-04 4,44E-04 3,00E-04 4,80E-04 5,44E-04 3,78E-04 5,96E-04
PG [40:6] 3,97E-02 5,55E-03 3,26E-02 3,97E-02 5,69E-03 2,29E-03 1,65E-02 7,11E-03 1,69E-02 6,03E-03 7,53E-02 7,63E-03 1,36E-02 1,91E-02
PG [42:6] 1,47E-03 5,44E-04 6,68E-04 2,99E-03
PI [34:2] 7,43E-02 6,93E-02 1,67E-02 2,34E-02 6,84E-02 8,85E-02 2,95E-02 1,50E-02 4,10E-02 7,95E-02 4,43E-02 4,76E-02 3,87E-02 1,43E-02
PI [35:1] 2,96E-02 1,87E-02 4,28E-03 1,97E-02 2,59E-02 7,13E-03 3,67E-03 8,21E-03 1,82E-02 7,82E-03 1,03E-02 7,52E-03 2,61E-03
PI [35:2] 1,67E-02 5,14E-03 8,78E-03 1,91E-02 2,51E-02 9,32E-03 5,53E-03 1,08E-02 1,73E-02 1,14E-02 1,11E-02 1,18E-02 6,23E-03
PI [36:1] 2,29E-01 1,99E-01 3,05E-02 3,36E-02 3,18E-01 6,10E-01 1,05E-01 8,99E-02 1,35E-01 3,08E-01 1,41E-01 1,61E-01 1,10E-01 8,75E-02
PI [36:2] 9,47E-01 8,76E-01 3,98E-01 6,04E-01 1,59E+00
2,19E+00
8,41E-01 4,68E-01 9,79E-01 1,26E+00
9,32E-01 9,27E-01 7,73E-01 4,85E-01
PI [36:3] 2,06E-01 1,66E-01 1,16E-01 1,75E-01 2,64E-01 3,60E-01 1,50E-01 9,49E-02 2,28E-01 2,59E-01 2,11E-01 2,04E-01 1,78E-01 1,08E-01
PI [36:4] 1,24E-02 5,20E-03 3,14E-02 4,77E-02 2,10E-02 7,32E-03 2,83E-02 1,44E-02 2,24E-02 1,63E-02 1,58E-02 6,43E-03
PI [37:2] 2,82E-02 3,62E-02 2,59E-02 4,19E-02 4,52E-02 5,71E-02 3,21E-02 4,89E-02 4,33E-02 6,05E-02 4,95E-02 4,27E-02 3,46E-02 5,26E-02
PI [37:3] 4,31E-02 2,94E-02 4,49E-02 7,91E-02 4,81E-02 6,56E-02 3,75E-02 4,40E-02 4,76E-02 5,13E-02 4,90E-02 4,25E-02 4,13E-02 5,67E-02

Supplementary material
177
PI [37:4] 2,88E-02 2,34E-02 1,10E-02 1,48E-02
PI [38:2] 3,55E-02 3,91E-02 9,63E-04 7,19E-02 8,26E-03 2,10E-02
PI [38:3] 1,19E+00
1,06E+00
2,24E+00
3,60E+00
2,36E+00
2,73E+00
1,71E+00
1,95E+00
2,13E+00
1,37E+00
2,11E+00
1,53E+00
1,45E+00
1,83E+00
PI [38:4] 1,07E+00
9,83E-01 1,50E+00
2,31E+00
1,57E+00
2,31E+00
1,28E+00
1,08E+00
1,84E+00
1,01E+00
1,54E+00
1,12E+00
1,16E+00
1,20E+00
PI [38:5] 2,13E-01 2,01E-01 2,09E-01 3,03E-01 2,47E-01 3,52E-01 2,19E-01 1,24E-01 3,20E-01 2,34E-01 2,79E-01 2,10E-01 2,15E-01 1,50E-01
PI [38:6] 6,24E-03 9,82E-03 1,28E-02 1,86E-02 9,41E-03 3,95E-03 1,61E-02 1,78E-02 1,38E-02 1,03E-02 1,08E-02 4,89E-03
PI [39:3] 2,73E-02 1,43E-02 2,34E-02 1,94E-02 3,19E-02 1,75E-02 1,36E-02 2,13E-02 2,29E-02 2,10E-02 1,55E-02 1,56E-02 1,38E-02
PI [39:4] 3,01E-02 7,40E-03 1,21E-02 1,19E-02 1,33E-02 9,46E-03 5,78E-03 1,41E-02 9,77E-03 1,25E-02 1,07E-02 9,02E-03 4,68E-03
PI [39:5] 3,08E-03 4,95E-03 6,03E-03 3,49E-03 2,29E-03 5,95E-03 4,99E-03 5,92E-03 5,21E-03 4,16E-03 2,66E-03
PI [40:3] 4,36E-02 4,35E-02 1,35E-02 2,08E-02 2,47E-02 3,37E-02 1,97E-02 5,78E-03 1,67E-02 1,96E-02 1,71E-02 1,35E-02 9,69E-03 5,81E-03
PI [40:4] 5,39E-02 4,17E-02 2,21E-02 3,62E-02 4,74E-02 7,32E-02 5,09E-02 2,22E-02 4,80E-02 3,49E-02 4,27E-02 3,07E-02 2,59E-02 1,79E-02
PI [40:5] 6,04E-02 5,46E-02 3,03E-02 4,20E-02 1,02E-01 1,82E-01 8,40E-02 2,59E-02 9,74E-02 8,03E-02 8,74E-02 5,46E-02 5,08E-02 2,74E-02
PI [40:6] 2,25E-02 1,59E-02 2,44E-02 5,04E-02 3,46E-02 1,38E-02 5,67E-02 4,46E-02 4,66E-02 2,77E-02 2,63E-02 1,64E-02
PI [40:7] 7,29E-03 1,17E-02 9,52E-03 9,68E-03 5,78E-03 4,90E-03 1,88E-02 8,15E-03 1,30E-02 7,11E-03 8,95E-03 7,33E-03
PS [33:1] 1,52E-02 1,73E-02 1,22E-02 1,39E-02 1,42E-02 2,13E-02 2,95E-02
PS [34:1] 7,64E-01 6,88E-01 2,53E-01 3,25E-01 6,47E-01 7,86E-01 5,17E-01 3,80E-01 3,66E-01 6,21E-01 3,42E-01 4,64E-01 3,68E-01 3,41E-01
PS [34:2] 2,19E-02 6,38E-02 7,76E-02 5,78E-02 4,78E-02 5,04E-02 8,90E-02 4,58E-02 6,48E-02 5,40E-02 6,06E-02
PS [35:1] 1,40E-01 1,67E-01 2,43E-01 1,15E-01 1,36E-01 1,14E-01 1,75E-01 1,27E-01 2,19E-01 5,70E-01 1,36E-01 1,48E-01 2,51E-01
PS [35:2] 2,19E-02 3,43E-02 1,55E-02 1,98E-02 1,92E-02 2,45E-02 1,66E-02 5,19E-02 3,58E-02 2,98E-02 4,01E-02
PS [36:1] 4,07E+00
3,34E+00
2,19E+00
2,78E+00
2,64E+00
3,07E+00
2,25E+00
2,26E+00
1,99E+00
2,62E+00
1,82E+00
2,44E+00
2,08E+00
1,89E+00
PS [36:2] 1,18E+00
8,80E-01 5,65E-01 6,41E-01 1,04E+00
1,31E+00
1,05E+00
9,43E-01 9,72E-01 1,25E+00
8,85E-01 1,15E+00
1,03E+00
8,38E-01
PS [36:4] 9,80E-03 3,42E-02 4,24E-02 2,42E-02 1,98E-02 3,03E-02 2,22E-02
PS [37:1] 1,18E-01 5,74E-01 8,07E-01 7,09E-02 7,78E-02 1,11E-01 4,80E-01 2,53E-01 4,87E-01 2,62E-01 2,77E-01 2,61E-01 8,13E-01
PS [37:2] 1,95E-01 2,55E-01 3,06E-02 3,09E-02 4,59E-02 1,48E-01 6,64E-02 9,17E-02 5,79E-02 2,28E-01
PS [37:3] 2,27E-02 5,00E-02 5,13E-03 9,83E-03 1,76E-02 5,60E-02 2,91E-02
PS [38:0] 4,72E-02 1,13E-02 2,48E-02 4,89E-02 3,32E-02 8,75E-02 6,09E-02 3,94E-02 9,45E-02
PS [38:1] 1,82E-02 3,06E-02 3,71E-02 3,31E-02 2,45E-02 3,03E-02 2,00E-02 7,01E-02 3,48E-02 2,49E-02 4,03E-02 2,15E-02
PS [38:2] 1,67E-02 3,21E-02 3,36E-02 3,73E-02 3,78E-02 2,85E-02 2,62E-02 4,01E-02 2,68E-02 2,53E-02 2,51E-02 2,33E-02
PS [38:3] 2,71E-01 1,48E-01 1,96E-01 7,60E-02 8,49E-02 8,79E-02 7,49E-02 7,31E-02 1,13E-01 8,19E-02 1,03E-01 8,24E-02 6,81E-02
PS [38:4] 2,18E-01 1,43E-01 1,91E-01 1,40E-01 1,94E-01 1,43E-01 1,47E-01 1,72E-01 2,20E-01 1,44E-01 1,83E-01 1,41E-01 1,54E-01
PS [38:5] 2,81E-02 3,71E-02 5,11E-02 6,65E-02 5,39E-02 5,33E-02 7,27E-02 9,81E-02 6,20E-02 7,53E-02 6,01E-02 7,45E-02

Supplementary material
178
PS [39:1] 8,24E-03 3,58E-02 8,71E-03 4,39E-03 6,77E-03 1,87E-02 1,31E-02 4,91E-02 4,55E-02 4,47E-02 1,80E-02 3,92E-02
PS [39:3] 6,20E-02 7,84E-02 5,41E-03 3,33E-03 7,52E-03 2,47E-02 1,17E-02 5,00E-02 1,79E-02 2,21E-02 2,76E-02
PS [39:4] 1,47E-01 1,77E-01 1,08E-02 7,22E-03 1,81E-02 7,04E-02 4,74E-02 4,68E-02 3,66E-02 3,01E-02 4,05E-02 1,19E-01
PS [40:1] 4,39E-02 2,25E-02 3,04E-02 5,80E-02 3,03E-02 8,18E-02 5,54E-02 2,83E-02 8,73E-02
PS [40:2] 6,17E-03 2,44E-02 2,05E-02 1,98E-02 1,88E-02 1,88E-02 2,18E-02 2,69E-02
PS [40:3] 2,49E-02 3,85E-02 1,17E-02 9,06E-03 1,43E-02 1,63E-02 1,82E-02 1,51E-02
PS [40:4] 1,03E-02 5,89E-03 4,62E-03 7,66E-03
PS [40:5] 1,14E-01 3,84E-02 4,66E-02 1,85E-02 1,61E-02 2,62E-02 1,24E-02 1,57E-02 2,08E-02 2,46E-02
PS [40:6] 1,47E-01 3,48E-02 4,44E-02 3,13E-02 2,00E-02 3,42E-02 1,60E-02 2,17E-02 4,52E-02 1,69E-02 2,53E-02 2,58E-02 2,38E-02
PS [43:6] 1,73E-02 1,02E-02 1,34E-02 1,48E-02 2,47E-02 2,53E-02 2,78E-02 2,80E-02 2,80E-02
SM [32:1] 2,53E-01 2,95E-01 9,19E-02 1,55E-01 7,94E-02 6,95E-02 6,44E-02 6,78E-02 6,16E-02 1,03E-01 6,08E-02 8,25E-02 8,11E-02 7,50E-02
SM [33:1] 1,52E-01 2,20E-01 8,29E-02 1,54E-01 8,99E-02 7,08E-02 6,73E-02 8,74E-02 7,75E-02 1,18E-01 7,38E-02 1,08E-01 1,01E-01 7,90E-02
SM [34:1] 1,14E+01
1,32E+01
3,73E+00
7,08E+00
4,85E+00
4,18E+00
4,20E+00
4,31E+00
3,45E+00
5,23E+00
3,25E+00
5,02E+00
4,71E+00
4,29E+00
SM [34:4] 1,24E-02 1,89E-02 9,72E-03 1,31E-02 1,28E-02 1,12E-02 2,19E-02 1,32E-02 1,64E-02 1,47E-02 1,36E-02
SM [35:1] 1,60E-01 1,75E-01 5,21E-02 8,78E-02 6,90E-02 5,40E-02 5,42E-02 7,05E-02 6,42E-02 8,60E-02 5,14E-02 7,85E-02 8,01E-02 6,49E-02
SM [35:4] 1,50E-02 7,63E-03 1,25E-02 1,15E-02 8,77E-03 1,54E-02 1,33E-02 1,20E-02 1,65E-02 8,55E-03
SM [36:1] 1,01E+00
1,08E+00
3,96E-01 6,60E-01 4,13E-01 3,81E-01 3,53E-01 4,17E-01 5,29E-01 6,26E-01 4,26E-01 7,06E-01 6,63E-01 4,05E-01
SM [36:4] 6,95E-01 1,16E+00
3,05E-01 7,34E-01 6,86E-01 3,62E-01 5,59E-01 5,32E-01 3,62E-01 7,18E-01 4,48E-01 4,91E-01 4,96E-01 4,47E-01
SM [36:5] 7,49E-03 4,13E-03 6,43E-03 5,71E-03 3,72E-03 1,01E-02 7,02E-03 7,11E-03 8,85E-03 8,93E-03
SM [37:1] 6,77E-03 8,03E-03 8,49E-03 6,71E-03 1,14E-02 1,21E-02 1,15E-02 1,41E-02 1,34E-02 8,11E-03
SM [37:4] 1,03E-02 4,39E-03 8,05E-03 8,35E-03 4,99E-03 1,41E-02 8,07E-03 8,81E-03 7,82E-03 9,89E-03
SM [38:1] 2,51E-01 4,04E-01 1,09E-01 1,79E-01 1,01E-01 9,15E-02 9,09E-02 8,02E-02 1,07E-01 1,49E-01 8,48E-02 1,43E-01 1,34E-01 9,34E-02
SM [38:4] 2,92E-02 7,45E-02
SM [40:1] 1,20E+00
1,62E+00
3,63E-01 6,77E-01 4,49E-01 4,78E-01 3,81E-01 3,66E-01 3,79E-01 6,53E-01 3,14E-01 5,70E-01 4,87E-01 5,09E-01
SM [40:2] 1,16E-01 1,00E-01 6,77E-02 1,12E-01 5,77E-02 4,97E-02 4,88E-02 5,06E-02 5,52E-02 7,83E-02 4,93E-02 8,27E-02 7,57E-02 6,56E-02
SM [40:4] 1,56E-02 4,76E-03 1,12E-02 7,60E-03 7,70E-03 1,78E-02 1,30E-02 1,22E-02 1,09E-02 1,08E-02
SM [41:1] 1,35E-01 1,49E-01 5,48E-02 8,77E-02 7,20E-02 6,92E-02 5,88E-02 6,55E-02 5,89E-02 1,09E-01 5,46E-02 8,41E-02 7,21E-02 8,54E-02
SM [41:2] 1,03E-01 4,08E-02 8,15E-02 4,84E-02 4,40E-02 4,64E-02 4,77E-02 4,25E-02 7,40E-02 3,76E-02 5,76E-02 5,54E-02 5,54E-02
SM [42:1] 8,04E-01 1,05E+00
2,18E-01 4,23E-01
SM [42:2] 2,65E+00
2,91E+00
1,32E+00
2,40E+00
1,42E+00
1,62E+00
1,69E+00
1,47E+00
1,16E+00
1,78E+00
1,06E+00
1,85E+00
1,61E+00
1,81E+00
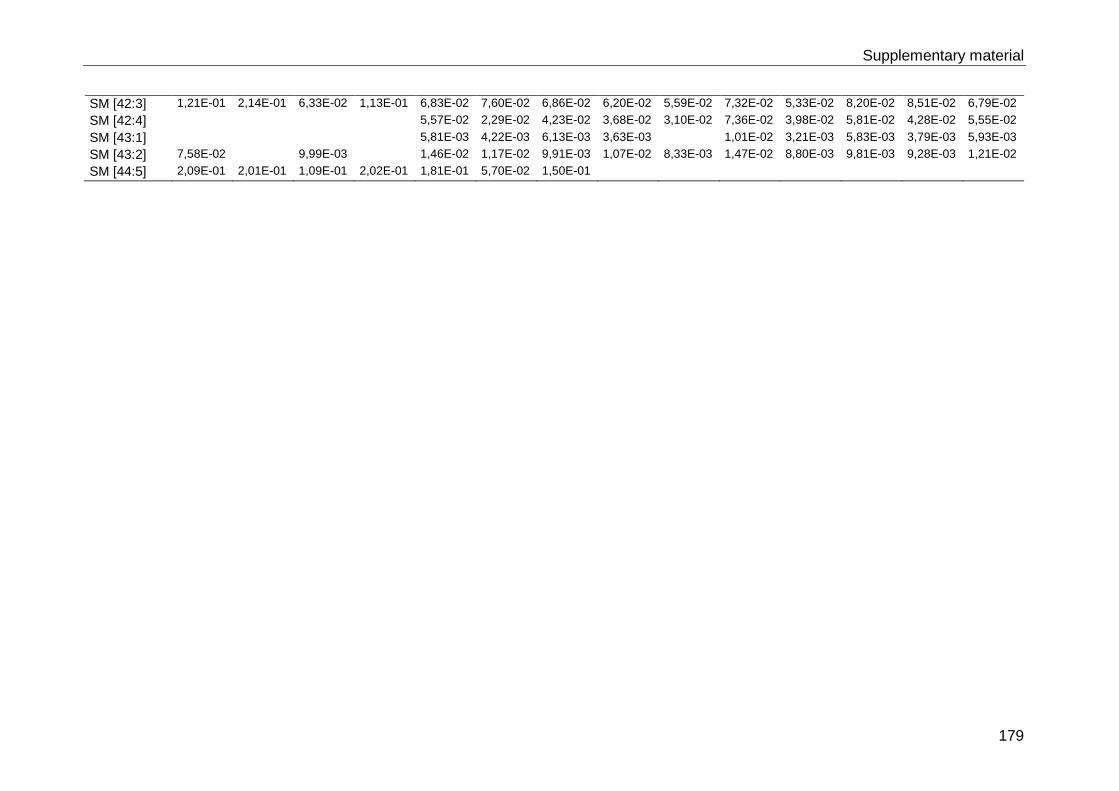
Supplementary material
179
SM [42:3] 1,21E-01 2,14E-01 6,33E-02 1,13E-01 6,83E-02 7,60E-02 6,86E-02 6,20E-02 5,59E-02 7,32E-02 5,33E-02 8,20E-02 8,51E-02 6,79E-02
SM [42:4] 5,57E-02 2,29E-02 4,23E-02 3,68E-02 3,10E-02 7,36E-02 3,98E-02 5,81E-02 4,28E-02 5,55E-02
SM [43:1] 5,81E-03 4,22E-03 6,13E-03 3,63E-03 1,01E-02 3,21E-03 5,83E-03 3,79E-03 5,93E-03
SM [43:2] 7,58E-02 9,99E-03 1,46E-02 1,17E-02 9,91E-03 1,07E-02 8,33E-03 1,47E-02 8,80E-03 9,81E-03 9,28E-03 1,21E-02
SM [44:5] 2,09E-01 2,01E-01 1,09E-01 2,02E-01 1,81E-01 5,70E-02 1,50E-01

List of figures
180
List of figures
Figure 1.1: Global trends in estimated rates of TB incidence in 2013.. .................... 12
Figure 1.2: Stages of M. tuberculosis infection.. ...................................................... 12
Figure 1.3: The immunological process following M. tuberculosis infection in the lung..
................................................................................................................................ 14
Figure 1.4: Signalling events leading to actin polymerization during FcγR–mediated
phagocytosis.. .......................................................................................................... 19
Figure 1.5: Stages of phagosome maturation. ......................................................... 21
Figure 1.6: Production of ROI and RNI in the phagosome. ...................................... 23
Figure 1.7: Schematic representation of the composition of the mycobacterial cell-wall.
................................................................................................................................ 27
Figure 1.8: Acyltrehaloses TMM and TDM of the mycobacterial outer membrane. .. 28
Figure 3.1: Scheme of the procedure for isolation and purification of bead phagosomes
from macrophages for mass spectrometry analysis.. ............................................... 55
Figure 3.2: β-galactosidase assay of purified control versus TDM bead phagosomes.
................................................................................................................................ 56
Figure 3.3: Control and TDM bead phagosomes prior to and after sorting by FACS..
................................................................................................................................ 57
Figure 3.4: Intersection diagram of total numbers of identified proteins in proteomes of
control versus TDM bead phagosome samples. ...................................................... 58
Figure 3.5: Identified proteins in control and TDM beads phagosomes grouped
according to their cellular localization. ..................................................................... 59
Figure 3.6: Percentage distribution of all proteins identified in control versus TDM bead
phagosome samples grouped according to their cellular localization. ...................... 60
Figure 3.7: STRING network of proteins enriched in TDM bead phagosomes.. ....... 67
Figure 3.8: Immunofluorescence staining of control and TDM bead infected RAW264.7
macrophages for annexinA1 and LAMP1. ............................................................... 70
Figure 3.9: Immunofluorescence staining of control, TDM bead and M. tuberculosis
GFP infected RAW264.7 macrophages for annexinA6 and LAMP1......................... 72
Figure 3.10: Immunofluorescence staining of control, TDM bead and M. tuberculosis
GFP infected RAW264.7 macrophages for cofilin1 and LAMP1. ............................. 74
Figure 3.11: Immunofluorescence staining of control, TDM bead and M. tuberculosis
GFP infected RAW264.7 macrophages for profilin1 and LAMP1. ............................ 76
Figure 3.12: Immunofluorescence staining of control, TDM bead and M. tuberculosis
GFP infected RAW264.7 macrophages for SNAP23 and LAMP1. ........................... 78

List of figures
181
Figure 3.13: Immunofluorescence staining of control, TDM bead and M. tuberculosis
GFP infected RAW264.7 macrophages for VAMP3 and LAMP1. ............................. 80
Figure 3.14: Quantification of candidate proteins annexinA1, annexinA6, profilin1,
SNAP23 and VAMP3 on isolated control versus TDM bead phagosomes via Western
blot. .......................................................................................................................... 81
Figure 3.15: Control of siRNA-mediated knock-down of candidate proteins annexinA6,
cofilin1, profilin1 and VAMP3 via Western blot. ........................................................ 82
Figure 3.16: Survival of M. tuberculosis inside RAW264.7 macrophages after knock-
down of annexinA6, cofilin1, profilin1 and VAMP3 using RNA interference.............. 83
Figure 3.17: Accumulation of β-actin around control and TDM bead phagosomes in
RAW264.7 macrophages. ........................................................................................ 84
Figure 3.18: Localization of β-actin and WASH1 around M. tuberculosis GFP
phagosomes in RAW264.7 macrophages. ............................................................... 85
Figure 3.19: Co-localization of lysotracker and LAMP1 with M. tuberculosis GFP in
RAW264.7 macrophages after removal of β-actin with LatrunkulinA (LatA). ............ 86
Figure 3.20: Survival of M. tuberculosis GFP in RAW264.7 macrophages after removal
of β-actin with LatrunkulinA (LatA). .......................................................................... 86
Figure 3.21: Control of siRNA-mediated knock-down of WASH1 via Western blot.. . 87
Figure 3.22: Survival of M. tuberculosis inside RAW264.7 macrophages after knock-
down of WASH1 using RNA interference. ................................................................ 88
Figure 3.23: β-galactosidase activity of all seven paired samples used for lipidomic
analysis of bead phagosomes. ................................................................................. 89
Figure 3.24: Identified lipid classes in control bead phagosomes. ............................ 90
Figure 3.25: Before-and-after-plot of Cer, Chol, LBPA, LPC, PC and PC-O identified
in control versus TDM bead phagosomes.. .............................................................. 91
Figure 3.26: Before-and-after-plot of PE, PE-O, PG, PI, PS and SM identified in control
versus TDM bead phagosomes. ............................................................................. 92
Figure 3.27: Volcano-plot - Distribution of identified lipid species in control versus TDM
bead phagosome samples.94
Figure 4.1: Scheme of the potential function of TDM-mediated inhibition of phagosome
maturation. ............................................................................................................. 121

List of tables
182
List of tables
Table 2-1: Consumables .......................................................................................... 31
Table 2-2: Chemicals ............................................................................................... 32
Table 2-3: siRNA ..................................................................................................... 34
Table 2-4: Lipids ...................................................................................................... 34
Table 2-5: Antibodies and dyes ............................................................................... 35
Table 2-6: Cell-lines ................................................................................................. 35
Table 2-7: Bacteria .................................................................................................. 35
Table 2-8: Hardware ................................................................................................ 35
Table 2-9: Software ................................................................................................. 37
Table 2-10: Elution gradient of peptides with buffer B. ............................................. 43
Table 2-11: Dilutions of primary and secondary antibodies and other labels ........... 46
Table 2-12: SDS-PAGE gel formulations. ................................................................ 47
Table 2-13: Concentrations of antibodies used for Western blot. ............................. 47
Table 2-14: Internal standard mix ............................................................................ 49
Table 2-15: Gradient and flow rates used for the separation of phospholipids by µLC-
FT-ICR-MS .............................................................................................................. 50
Table 2-16: FT-ICR-MS instrumental settings .......................................................... 51
Table 2-17: Flow rates used for the analysis of cholesteryl acetate by ESI Qq-TOF-MS
................................................................................................................................ 52
Table 3-1: List of proteins enriched in TDM bead phagosomes compared to controls..
................................................................................................................................ 61
Table 3-2: List of proteins enriched in control bead phagosomes. ........................... 62
Table 3-3: Cellular localization and biological process of proteins enriched to TDM
bead over control phagosomes. ............................................................................... 62
Table 3-4: Identified proteins selected for further analysis as potential host-cell derived
TDM interaction partners. ........................................................................................ 68
Table 4-1: Comparison of proteins identified in BCG versus TDM bead phagosomes..
.............................................................................................................................. 103
Table 4-2: Comparison of proteins identified in ManLAM versus TDM bead
phagosomes.. ........................................................................................................ 105
Table 0-1: List of all proteins identified in control and TDM bead phagosomes. .... 141
Table 0-2: Lipid species identified in control and TDM bead phagosomes. ........... 169
List of abbreviations and symbols
183
List of abbreviations and symbols
M. tuberculosis Mycobacterium tuberculosis
TDM trehalose-6,6´dimycolate
TB tuberculosis
WHO world health organization
MTBC Mycobacterium tuberculosis complex
M. bovis Mycobacterium bovis
BCG bacille Calmette-Guérin
HIV human immunodeficiency virus
AIDS acquired immunodeficiency syndrome
MDR TB multi drug resistant tuberculosis
XDR TB extensively drug resistant tuberculosis
TNF-α tumor necrosis factor alpha
DCs dendritic cells
NCBI National Center for Biotechnology Information
MHC major histocompatibility complex
CD1 molecules cluster of differentiation 1
T-cells lymphocytes matured in the thymus
IFN-γ interferon-gamma
B-cells lymphocytes matured in the bone marrow
NK-cells natural killer cells
LPS lipopolysaccharide
PRRs pattern recognition receptors
PAMPs pathogen associated molecular pattern
FcγR Fc gamma receptor
NFĸB nuclear factor kappa-light-chain-enhancer of
activated B-cells
LM lipomannan
PIM phosphatidyl mannosides
DNA deoxyribonucleic acid
CpG motifs cytosine phosphate guanine motif
MDP muramyl dipetide
LAM lipoarabinomannan
IgG immunoglobulin G
ITAM cytosolic immunoreceptor-based motif

List of abbreviations and symbols
184
DAG diacylglycerol
ATP adenosine triphosphate
GTP guanine triphosphate
ABP actin binding proteins
NPF nucleation promoting factor
WASP Wiskott-Aldrich syndrome proteins
PI phosphatidylinositol
SNARE soluble N-ethylmaleimide-sensitive factor
attachment protein
TfR transferring receptor
ILVs intraluminal vesicles
LAMP lysosome-associated membrane protein
LBPA lyso-bisphosphatic acid
VAMP vesicle-associated membrane protein
pH potentia hydrogenii
ROI reactive oxygen species
NADPH nicotinamide adenine dinucleotide phosphate
RNI reactive nitrogen species
RNA ribonucleic acid
NO nitric oxide
O2 oxygen
ONOO- peroxinitrite
CO2 carbon dioxide
NO2 nitrogen dioxide
H2O2 hydrogen peroxide
H37Rv M. tuberculosis laboratory reference strain
sec seconds
min minute (s)
h hours (s)
% percent
OMP outer membrane protein
MOM mycobacterial outer membrane
AG arabinogalactan
PG peptidoglycan
PM plasma membrane

List of abbreviations and symbols
185
PG phosphatidylglycerol
PE phosphatidylethanolamine
ManLAM mannosylated lipoarabinomannan
TMM trehalose monomycolate
HPLC high performance liquid chromatography
MS mass spectrometry
v/v volume concentration
MOI multiplicity of infection
BSA bovine serum albumin
RT room temperature
°C degrees Celsius
u units
β beta
M molar
1D-PAGE 1 dimension polyacrylamide gel electrophoresis
V Volt
mm3 cubic milli meter
ON over night
PBS phosphate buffered saline
OD optical density
SDS-PAGE sodium dodecyl sulfate polyacrylamide gel
electrophoresis
PVDF polyvinylidene fluoride
CFU colony forming units
rpm rounds per minute
FT-MS Fourier transformation mass spectrometry
LC liquid chromatography
ESI electron spray ionization
MALDI matrix assisted laser desorption ionization
Qq-TOF-MS quadrupole time of flight mass spectrometry
m/z mass to charge ratio
Da Dalton
FACS fluorescence-activated cell sorting
mpi minutes post infection
hpi hs post infection
List of abbreviations and symbols
186
siRNA small interference ribonucleic acid
NTR non-targeting RNA
dpt days post transfection
d deci
c centi
m milli
µ micro
n nano
p pico
f femto
l liter
M molar
g Gramm
Cer ceramides
Cho cholesterol
LBPA lyso-bisphosphatic acid
LPC lyso phosphatidylcholine
PC phosphatidylcholine
PC-O plasmalogen phosphatidylcholine
PE phosphatidylethanolamine
PE-O plasmalogen phosphatidylethanolamine
PG phosphatidylglycerol
PI phosphatidylinositol
PS phosphatidylserine
SM sphingomyeline
PA phosphatidic acid
LBP latex bead phagosomes
PCV pathogen containing vacuole
ER endoplasmic reticulum
EUSC exclusive unique spectrum count
Ca2+ calcium
LatA latrunkulin A

Publications and Conferences
187
Publications and Conferences
Publications
J. Herweg, N. Hansmeier, A. Otto, A.C. Geffken, P. Subbarayal, B. K. Prusty,
D. Becher, M. Hensel, U. E. Schaible, T. Rudel and H. Hilbi, “Purification and
proteomics of pathogen-modified vacuoles and membranes”, in Frontiers in
Microbiology, submitted
AC. Geffken, E. C. Patin, and U. E. Schaible, “Chapter 22 : Isolation of Bead-
Phagosomes Bead Phagosomes to Study Virulence Function of M . tuberculosis
Cell-wall Lipids,” in Mycobacteria Protocols, Third Edit., T. Parish and D. Roberts,
Eds. Springer, 2015, pp. 1–10.
M. Kolonko, A. C. Geffken, T. Blumer, K. Hagens, U. E. Schaible, and M.
Hagedorn, “WASH-driven actin polymerization is required for efficient
mycobacterial phagosome maturation arrest.,” Cell. Microbiol., vol. 16, no.
October 2013, pp. 232–246, Sep. 2013.
Selected conferences
LCI-Symposia, “Emerging Infections”, 29.-30.01.2015, Hamburg
Keystone Symposia “Host Response in Tuberculosis”, 21.-28.01.2015, NM, USA
Poster: M. tuberculosis – Host-Pathogen Interactions in the Phagosome
3rd International Symposia for PhD-Students, “Protein Trafficking in Health and
Disease”, 10.-12.09.2014, Hamburg
Poster: M. tuberculosis – Host-Pathogen Interactions in the Phagosome
Scientific Advisory Board Meeting, 30.09.2014, Borstel
Poster: M. tuberculosis – Wirtszellinteraktionen im Phagosom
1st Poster-Price, 300 € Travel Grand
International Proteomics Summer School, 14.-19.07.2014, Greifswald
LCI-Symposia, “Pathogenesis of Infections”, 30.-31.01.2014, Hamburg
Symposium “Systems Biology of Infections”, 23.06-27.06.2013, Lugano,
Switzerland
Poster: M. tuberculosis – Host-Pathogen Interactions in the Phagosome
17th DGFI-Symposia, “Infektion und immunabwehr“, 21.-23.03.2013, Burg
Rothenfels
Talk: WASH-driven F-actin is required for efficient mycobacterial phagosome
maturation arrest
3rd Presentation Price

Acknowledgements
188
Acknowledgements
First, I would like to thank my supervisor Prof. Dr. Ulrich Emil Schaible for giving me
the opportunity to pursue my PhD studies his lab group “Cellular Microbiology” in
Borstel as well as for his guidance throughout the course of this work.
I would also like to thank my committee members, Prof. Dr. Jan Rupp and Prof. Dr.
Norbert Tautz (University of Lübeck).
Many thanks to Prof. Dr. Dörte Becher and Dr. Andreas Otto (University of Greifswald)
for the excellent cooperation regarding mass spectrometry of my bead phagosome
proteome. You really helped me a lot with my mass spectrometry studies. In addition,
I always had a really nice time during my research visits in Greifswald and during the
Proteomics Summer School.
In addition, many thanks also to Dr. Dominik Schwudke and Dr. Nicole Zehethofer for
the excellent cooperation regarding the mass spectrometry of my phagosome
lipidome. I really enjoyed spending time at the Parkallee 10 eating a lot of your sweets
A big thank you also to Prof. Dr. Thomas Gutsmann for being my co-supervisor and
all the fruitful discussions.
I would also like to thank Kristine Hagens, Jacqueline Eich, Nina Grohmann and
Dagmar Meyer for your great technical assistance in the lab. Further, I would like to
thank Martina Hein, Dr. Jochen Behrends and Dr. Thomas Scholzen for technical
assistance and a lot of patience with the confocal microscope and the FACS machines.
Further, I would like to thank the Cellular Microbiology Group, present and former
members: Maike Burmeister, Carlotta Ober-Blöbaum, Jannike Blank, Dr. Tobias
Dallenga, Bhesh Paudyal, Lars Eggers, Dr. Natalja Redinger, Dr. Bianca Schneider,
Dr. Yeojun Yun, Dr. Matthias Hauptmann, Dr. Steffi Renk for the great working
environment. Working and going to conferences with you guys was a lot of fun all the
time Moreover, I would like to thank “my” trainee Christoph Leschczyk for being a
great help during the last 8 month! I wish you all the best for your future and of course
a PhD-project without Western blots
Furthermore, I would like to thank my family. Papa Helmut, Mama Gesa, Bruder Yves,
Oma Irmgard (2x), Opa Heinz und Walter, Onkel Peter und Cousin Lucas. Thank you
a lot for your patience with me in the last 6 month Kim and Denise, thanks for your
friendship
Robert, this is for you ♥ !

189
Erklärung
Hiermit versichere ich an Eides statt, dass ich die vorliegende Dissertation
selbstständig angefertigt habe und keine anderen Hilfsmittel als angegeben verwendet
habe. Weder vor noch gleichzeitig habe ich andernorts einen Zulassungsantrag
gestellt oder diese Dissertation vorgelegt. Ich habe mich bisher noch keinem
Promotionsverfahren unterzogen. Ferner bin ich damit einverstanden, dass die
vorliegende Dissertation von der Frankfurter Bibliothek gespeichert und im Internet
veröffentlicht wird.
Hamburg, den
__________________________
Anna Christina Geffken
Related Documents

![[Micro] mycobacterium tuberculosis](https://static.cupdf.com/doc/110x72/55d6fc67bb61ebfa2a8b47ea/micro-mycobacterium-tuberculosis.jpg)