My NASA Data - Lesson Plans An Earth System View of Earthrise Purpose Students are introduced to the Earthrise phenomenon by seeing the Earth as the Apollo 8 astronauts 1 / 15

Welcome message from author
This document is posted to help you gain knowledge. Please leave a comment to let me know what you think about it! Share it to your friends and learn new things together.
Transcript
My NASA Data - Lesson Plans
An Earth System View of Earthrise
Purpose
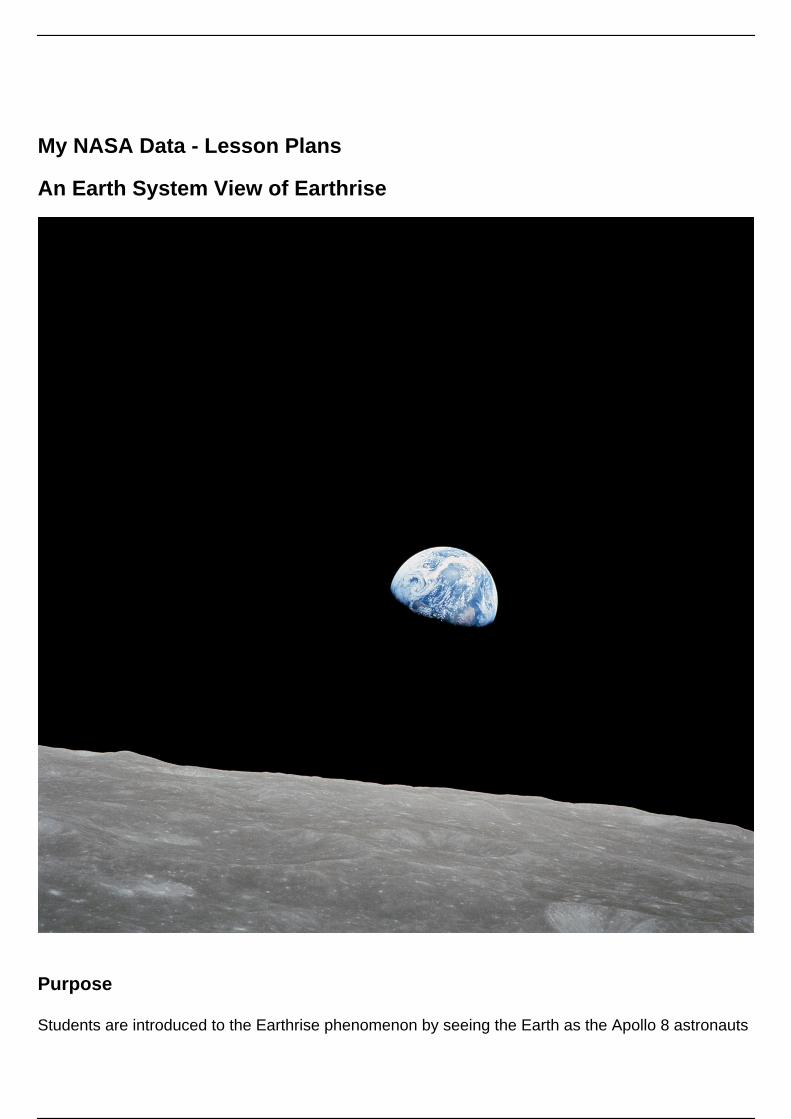
Students are introduced to the Earthrise phenomenon by seeing the Earth as the Apollo 8 astronauts
1 / 15
viewed our home planet for the first time from the Moon. They will analyze a time series of mappedplots of Earth science variables that NASA monitors to better understand the Earth System. Studentswill document changes of a variable over time as they create a new visualization. They will share thisvisualization with a peer who has monitored a different Earth System variable and workcollaboratively to make observations about temporal and spatial change making inferences abouthow these variables may be related. As a result, they develop research questions which studentsmay use in future investigations.
This lesson can be used as a launching activity for introducing Earth Systems or the phenomenon ofEarthrise.
Learning Objectives
Analyze the sequence of plots over time for different variables for changesCreate visualization for showcasing key areas experiencing change over timeCollaborate with peer to showcase changes and identify opportunities for future researchDevelop research questions
Why Does NASA Study This Phenomenon?
On Christmas Eve, 1968, none of the astronauts aboard Apollo 8 were prepared for the spellbindingmoment when they would first see their home planet rise from behind the desolate lunar horizon. Thevision of Earth provided them the first spot of color as they floated in the blackness of space, orbitingthe lunar surface. "Earthrise" is the name given to a photograph of the Earth taken by William Andersduring lunar orbit.
Essential Questions
1. How is the global system changing?2. What other parts of the Earth System change over time?3. Where do these changes tend to occur?4. What variables appear to be correlated?
Cross-Curricular Connections
National Geography Standards:
8th Grade 7.1: The physical processes that shape the patterns of Earth's surface: The fourcomponents of Earth’s physical systems (the atmosphere, biosphere, hydrosphere, andlithosphere) are interdependent12th Grade 7.1: The physical processes that shape the patterns of Earth's surface: Theinteractions of Earth's physical systems (the atmosphere, biosphere, hydrosphere, andlithosphere) vary across space and time.
Materials Required
Per Student:
Virtual:
2 / 15
Interactive Google SlideEarth System Poster Card Google Slides
cloud covervegetationsurface temperatureprecipitation
Chrome Canvas: This is a chrome drawing app that allows you to create and use multiplelayers in a drawing. For virtual learners, this app will be used in place of Student Data sheet:Earthrise Map Inventory. Jamboard - Gallery Walk (optional)Image
In person:
NASA Earthrise in photos: Photograph #1: and #2 (shown only one at a time) on projectorSticky notesColoring pencils or crayons (six different colors)
red, yellow, green, blue, purple, brown
Student Data sheet: Earthrise Map InventoryEarth System Poster Cards (Variable Full Set includes: Cloud Cover, Vegetation, Surface“Skin” Temperature, and Precipitation for dates: January, March, May, July, September,November
Technology Requirements
Internet RequiredOne-to-One (tablet, laptop, or CPU)One-to-a-GroupTeacher computer/projector onlyVisualization Tool RequiredAdvanced technical equipment/expertise required
Teacher Background Information
The "Earthrise" photograph became one of the most famous photos from all of the Apollo missionsand one of the most reproduced space photographs of all time. It has been credited for inspiring thebeginning of the environmental movement as this view underscored the need to better understandand protect the Earth. In Life Magazine's 100 Photographs that Changed the World edition,wilderness photographer Galen Rowell called Earthrise, "the most influential environmentalphotograph ever taken."
NASA is, and will continue to be, in the forefront of researching our planet’s interconnected systems,from a global scale down to minute processes in the Earth System. NASA is focused on developing ascientific understanding of the Earth as a whole system and its response to natural or human-inducedchanges. NASA's research on the Earth focuses on the following five questions. Answering thesequestions is vital to understanding the Earth and protecting it for future generations.
How is the global system changing?
3 / 15
What are the primary forces of the Earth system?How does the Earth system respond to natural and human-induced changes?What are the consequences of change in the Earth system for human civilization?How well can we predict future changes in the Earth system?
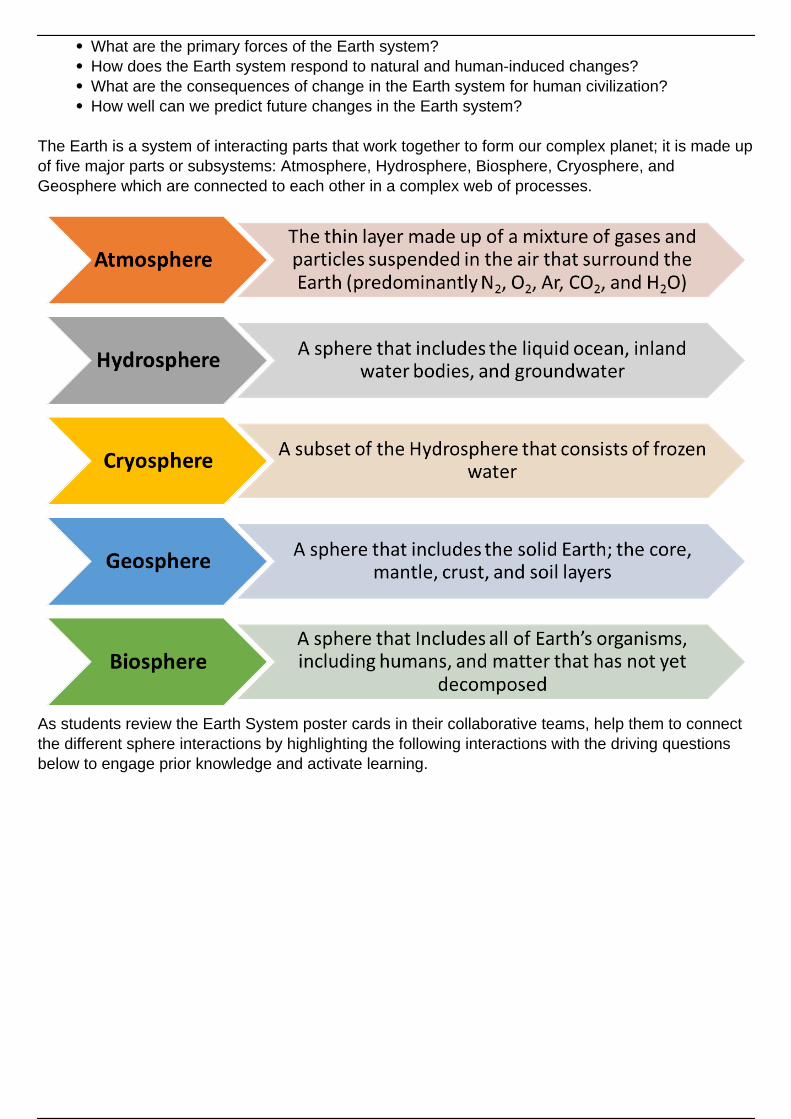
The Earth is a system of interacting parts that work together to form our complex planet; it is made upof five major parts or subsystems: Atmosphere, Hydrosphere, Biosphere, Cryosphere, andGeosphere which are connected to each other in a complex web of processes.
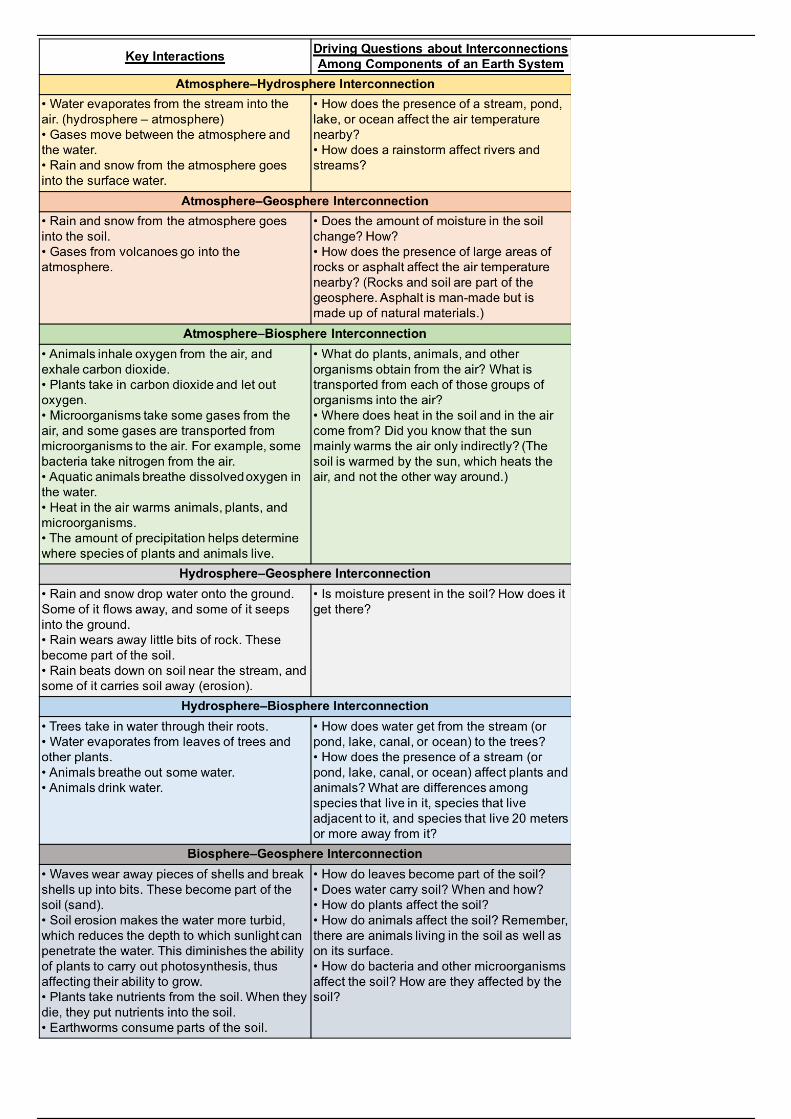
As students review the Earth System poster cards in their collaborative teams, help them to connectthe different sphere interactions by highlighting the following interactions with the driving questionsbelow to engage prior knowledge and activate learning.
4 / 15
5 / 15
For more information:
GLOBE’s Connecting the Parts of the Earth System for more information on systeminteractions.NASA EO Kids: 60 Years of Looking at Earth from AboveBlue Marble Matches Lesson Plan/Activity, Grade Levels: 3-12This 5-E lesson connects the shape of Earth's surface (and the names of the features thatcorrespond to those shapes and textures) to the processes that form them. It also introducesstudents to how scientists use Earth to gain a better understanding of other planetary bodiesin the solar system.
Procedure
Introduce Earthrise
Photograph 1.Earthrise in black and white (1968)
Display the iconic Earthrise Photograph #1 (black and white) to the class. Present the followingquestions to students to answer:
1. What are the main features of the picture?
The Earth is rising over the lunar surface. The illuminated side of the Earth is rising above thehorizon, showing the land, oceans, and swirling clouds that are part of the Earth system.
1. Describe the different environments displayed in the photograph.How are they similar?
Solid rocky surfaces both exist on the Earth and the Moon.
6 / 15
How are they different?
The Moon’s gray cratered surface contrasts sharply with the black of space.On the other hand, the Earth has many different shades and patterns.
2. Have students work with a partner to analyze the image and share their observations.
3. Next, students work with their partner to make inferences about the photograph by presentingthe following questions to answer:
1. Where is this picture taken from? How do you know? The Moon. This is a naturalplanetary object and is close to Earth like the Moon.
2. What is happening in the picture? The Earth sits beyond the Moon’s horizon. TheMoon orbits the Earth.
3. What is most notable about these environments? The Earth rests in the emptinessand darkness of space; its surface is differentiated with white and dark features. TheMoon’s surface has a bumpy texture with light and dark materials.
4. Now, present Earthrise photograph #2 (in color) and have them observe the photo for newobservations and inferences.
7 / 15
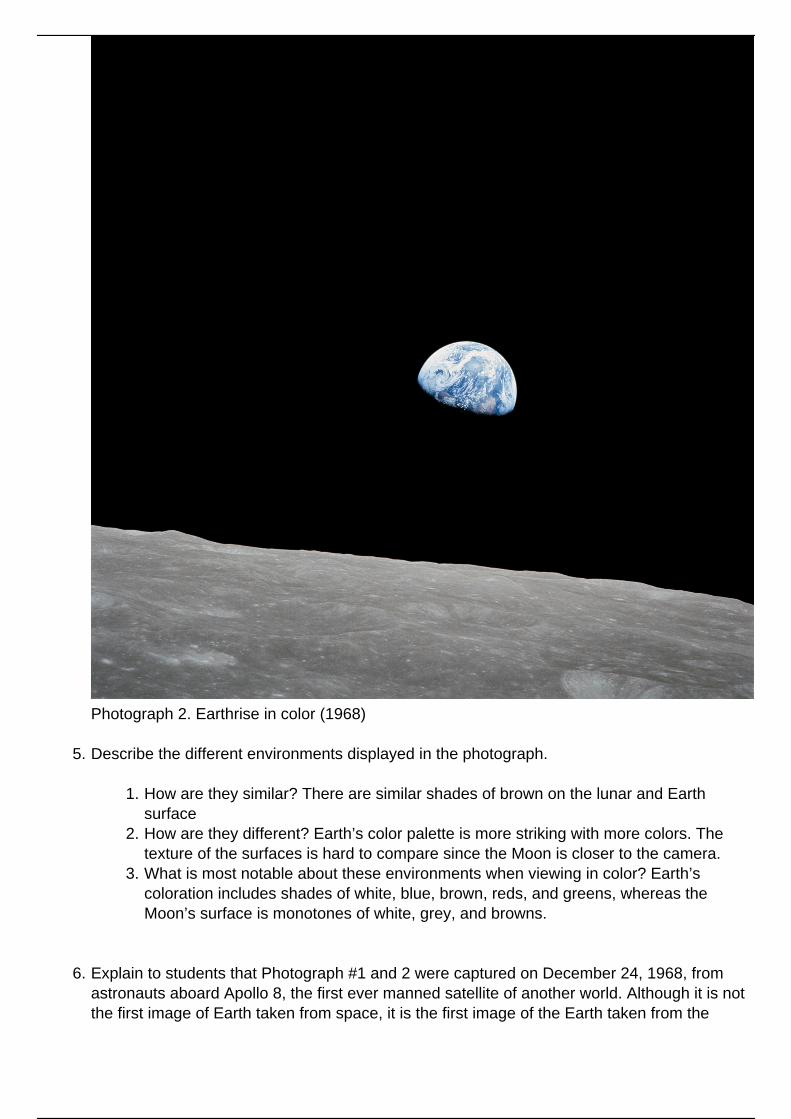
Photograph 2. Earthrise in color (1968)
5. Describe the different environments displayed in the photograph.
1. How are they similar? There are similar shades of brown on the lunar and Earthsurface
2. How are they different? Earth’s color palette is more striking with more colors. Thetexture of the surfaces is hard to compare since the Moon is closer to the camera.
3. What is most notable about these environments when viewing in color? Earth’scoloration includes shades of white, blue, brown, reds, and greens, whereas theMoon’s surface is monotones of white, grey, and browns.
6. Explain to students that Photograph #1 and 2 were captured on December 24, 1968, fromastronauts aboard Apollo 8, the first ever manned satellite of another world. Although it is notthe first image of Earth taken from space, it is the first image of the Earth taken from the
8 / 15

perspective of Earth rising above the horizon of another world. Apollo 8 astronauts FrankBorman, James Lovell, and William Anders were coming around from the far side of the Moonon their fourth orbit. William Anders photographed the Moon from the right side window of thespacecraft and exclaimed: “Oh my God, look at that picture over there! There’s the Earthcomin’ up. Wow, is that pretty!”
For more information about the Apollo 8 mission and the Earthrise photograph, check out theEarthrise: What It's Like to Escape Our Planet | Op-Docs in the Recommended Resources(section on Earthrise photo, as explained by the NASA astronauts on Apollo 8, 14:05-16:45).
The second image is the first photograph of Earth in color taken as Earth rose above the lunarhorizon. This photograph became one of the most famous photos from all of the Apollomissions and one of the most reproduced space photographs of all time. It has been creditedfor inspiring the beginning of the environmental movement as this view underscored the needto better understand and protect the Earth. In Life Magazine's 100 Photographs that Changedthe World edition, wilderness photographer Galen Rowell called Earthrise, "the mostinfluential environmental photograph ever taken."
7. Ask students to brainstorm and share what new information the color photograph providesabout our home planet. What may these colors represent? What sphere in the Earth Systemdo they belong? Direct students to connect their descriptions of the natural phenomena to theobserved color, as well as to the name of the sphere in the Earth System which they belong.
Blues: Answers may include but not limited to...Oceans and other water bodies as part of theHydrosphereWhites: Answers may include but not limited to...Clouds, snow, and ice as part of theCryosphere; white coloration may also indicate urban environments belonging to theGeosphere.Reds: Answers may include but not limited to...Deserts and other landforms as part of theGeosphere; the ocean may also be observed by the appearance of certain algal bloomsbelonging to the Biosphere.Browns: Answers may include but not limited to...Deserts and other landforms in theGeosphere; brown coloration of waterways may also be observed by the appearance of silt-laden water in the Hydrosphere; brown may also be observed on land due to changes of leafcolor in temperate forests in the autumn season as part of the Biosphere.Greens: Answers may include but not limited to...Forests and vegetated landforms, as part ofthe Biosphere.
Activate Prior Knowledge
Now that you have explored the Earthrise photographs depicting Earth from a point of view of themoon, let's explore what you know about Earth from your own perspective.
9 / 15

Credit: Ed.gov
1. Present the following question, “What did you see outside in nature on your way to schooltoday?”
2. Students work in their teams to brainstorm the various parts of the system that you’veencountered today.
Students will write each idea on a sticky note.3. Have students come to the front of the board and place their sticky note.4. As a class, review and sort their ideas about different parts of nature that they have
encountered into the four major spheres of the Earth System. NOTE: During this activity, wewill focus on the Atmosphere, Biosphere, Geosphere, and Hydrosphere. For the purpose ofthis activity, we will consider the Cryosphere as part of the Hydrosphere.
Organize the notes under the following headers, after the students have identified thespheres through class discussion.
Part 1: Explore Time Series Poster Cards
Building from your observations on your way to school, use the poster cards to observe thesevariables on a longer time scale and from a different perspective just like NASA scientists do. EarthSystem Poster Cards are tools that help us observe change in certain scientific variables amongdifferent Earth System spheres.
1. Distribute poster cards of the four variables among students.
10 / 15
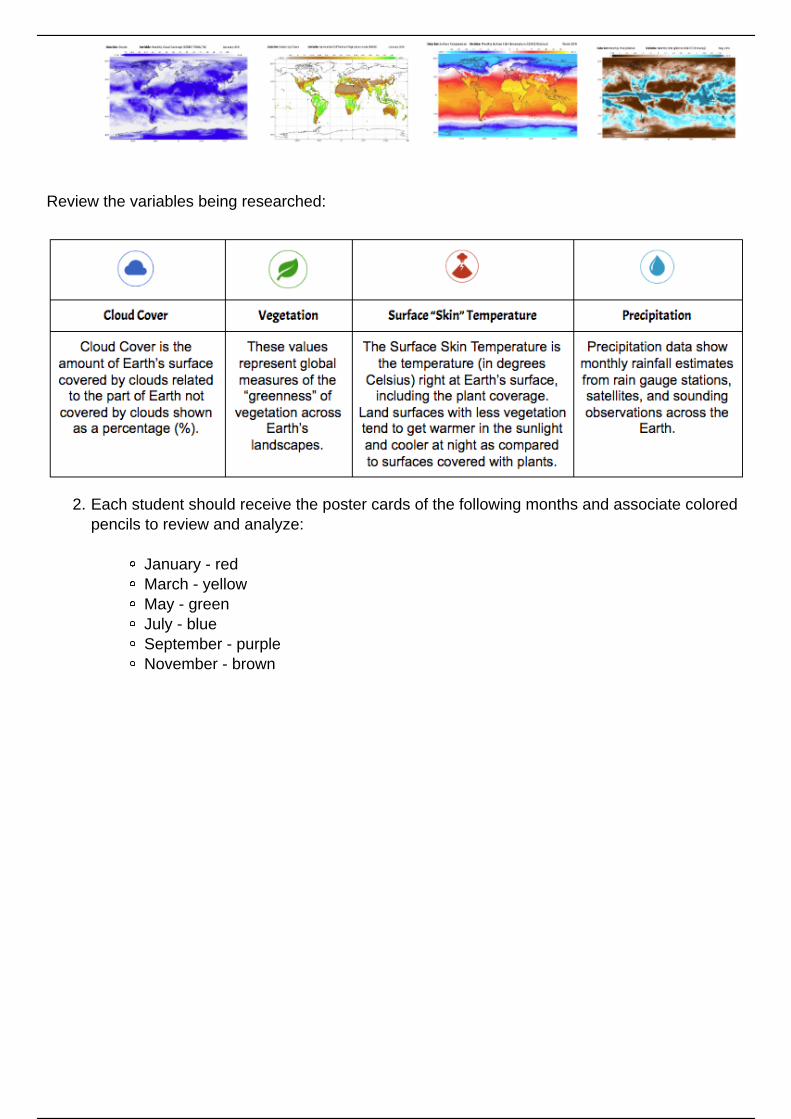
Review the variables being researched:
2. Each student should receive the poster cards of the following months and associate coloredpencils to review and analyze:
January - redMarch - yellowMay - greenJuly - blueSeptember - purpleNovember - brown
11 / 15
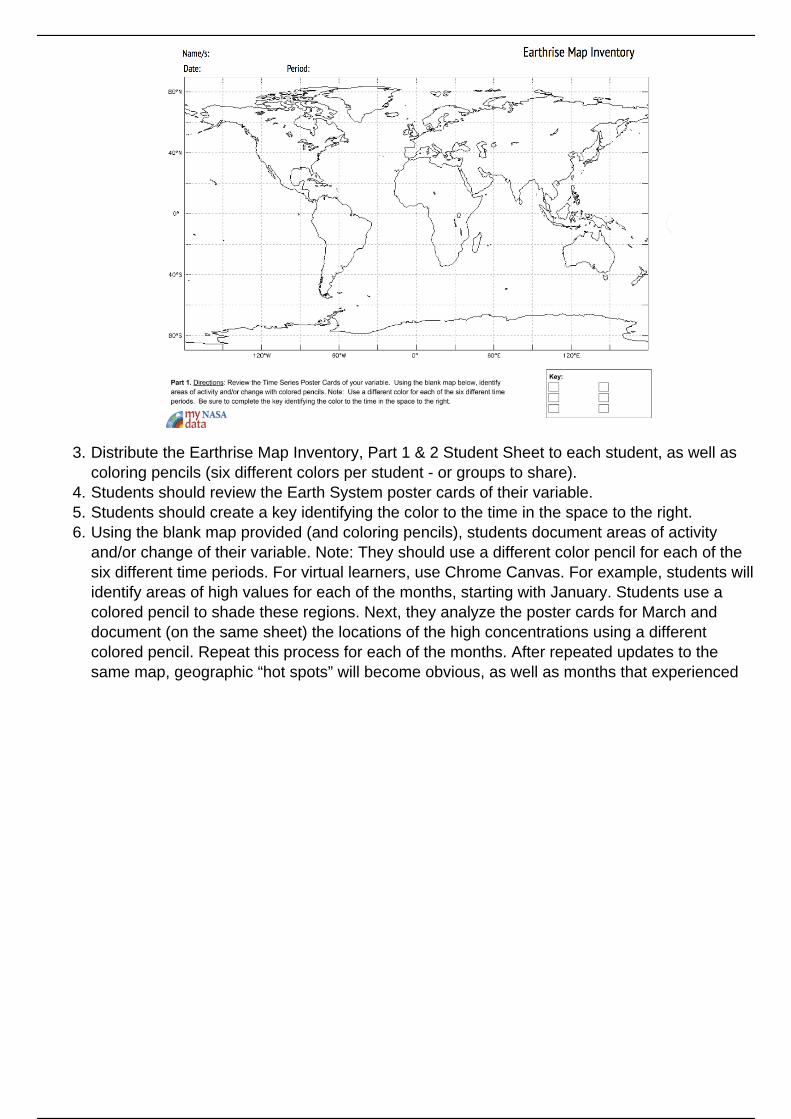
3. Distribute the Earthrise Map Inventory, Part 1 & 2 Student Sheet to each student, as well ascoloring pencils (six different colors per student - or groups to share).
4. Students should review the Earth System poster cards of their variable.5. Students should create a key identifying the color to the time in the space to the right.6. Using the blank map provided (and coloring pencils), students document areas of activity
and/or change of their variable. Note: They should use a different color pencil for each of thesix different time periods. For virtual learners, use Chrome Canvas. For example, students willidentify areas of high values for each of the months, starting with January. Students use acolored pencil to shade these regions. Next, they analyze the poster cards for March anddocument (on the same sheet) the locations of the high concentrations using a differentcolored pencil. Repeat this process for each of the months. After repeated updates to thesame map, geographic “hot spots” will become obvious, as well as months that experienced
12 / 15
a shift in geographic range.
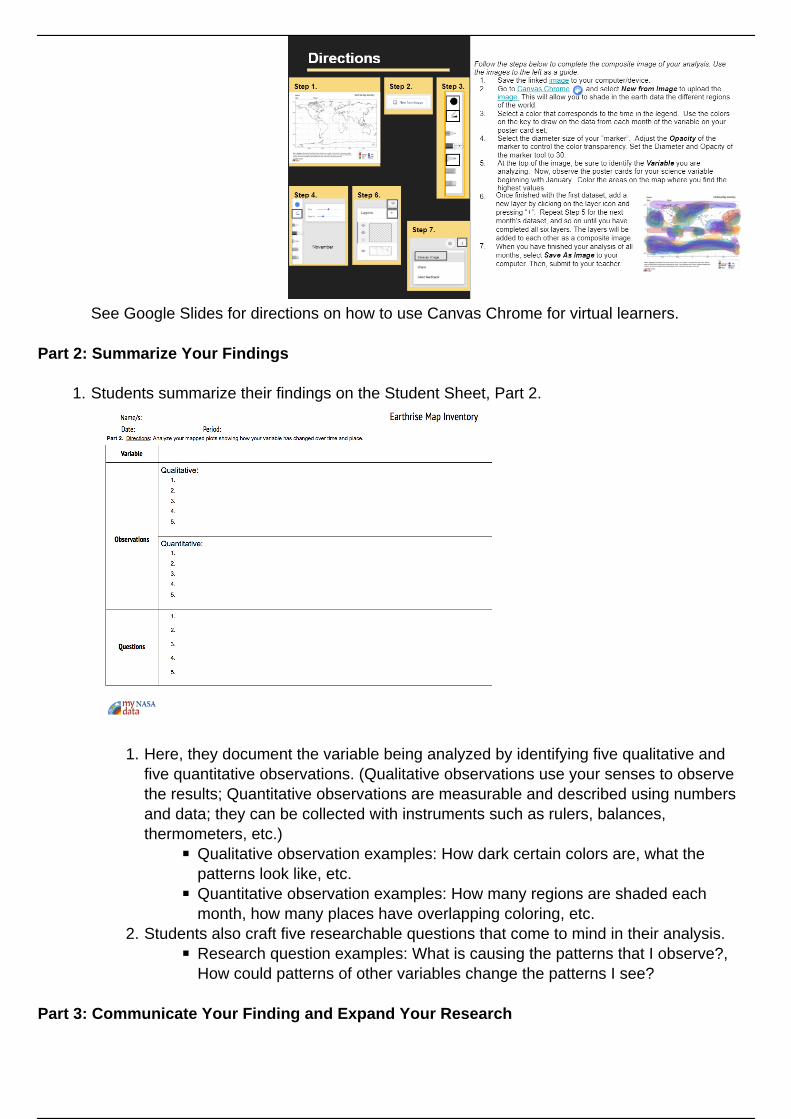
See Google Slides for directions on how to use Canvas Chrome for virtual learners.
Part 2: Summarize Your Findings
1. Students summarize their findings on the Student Sheet, Part 2.
1. Here, they document the variable being analyzed by identifying five qualitative andfive quantitative observations. (Qualitative observations use your senses to observethe results; Quantitative observations are measurable and described using numbersand data; they can be collected with instruments such as rulers, balances,thermometers, etc.)
Qualitative observation examples: How dark certain colors are, what thepatterns look like, etc. Quantitative observation examples: How many regions are shaded eachmonth, how many places have overlapping coloring, etc.
2. Students also craft five researchable questions that come to mind in their analysis.Research question examples: What is causing the patterns that I observe?,How could patterns of other variables change the patterns I see?
Part 3: Communicate Your Finding and Expand Your Research
13 / 15

1. Distribute Part 3 of the Earthrise Map Inventory.2. Students team up with a student exploring a different variable.3. Together, they complete the two tables by analyzing the two science variables as they
compare their observations. They document patterns or relationships found among the two inTable A.
4. Explain to students the types of questions:Descriptive Questions: describe the variables you are measuring. (How many…?, Howoften…?, etc.)Comparative Questions: examine the differences between two or more groups on oneor more dependent variables (What is the difference…?, How do ______ compare?,etc.)Correlative Questions: analyze the causal relationships, associations, trends and/orinteractions amongst two or more variables on one or more groups (How does ____change with ____?, What is the relationship of _____ to ________?, etc.)
In Table B., students work together to create their own questions using the three different types ofquestions: Descriptive, Comparative, and Correlative.
Part 4: Share your Research with a Gallery Walk
1. Students share their findings through a gallery walk. This will help students view the patternsof other variables they did not study. The class should be able to have a clear view of eachvariable this way. Have nearly half of your students post their data sheets on the walls anddisperse themselves around the room. An important factor is that the student works arespread far enough apart to reduce significant crowding.
2. The other half will walk around and visit the displayed work while carrying a clipboard withtheir own data. They will share their own data through the process. Students should alsodiscuss the questions they formulated in Parts 2 and 3.
3. Post the following questions on the board or projector for the students to answer as theyconduct their Gallery Walk. Students will be expected to present their answers at the end in
14 / 15
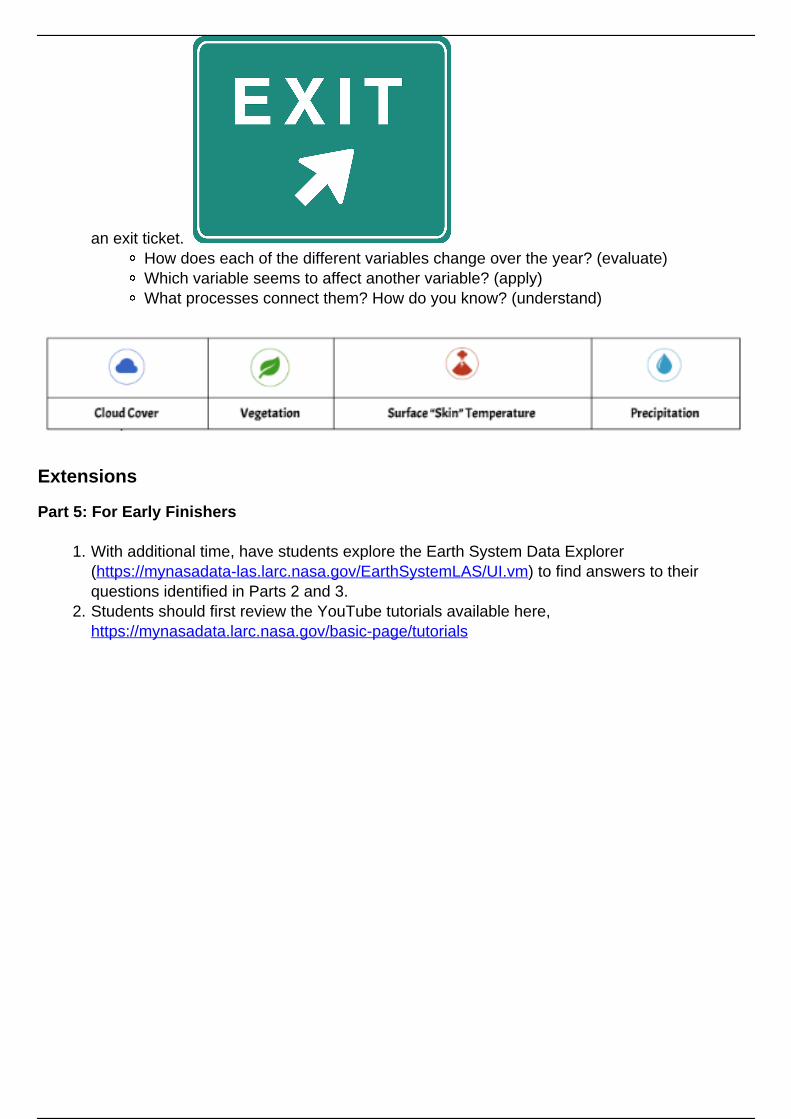
an exit ticket. How does each of the different variables change over the year? (evaluate)Which variable seems to affect another variable? (apply)What processes connect them? How do you know? (understand)
Extensions
Part 5: For Early Finishers
1. With additional time, have students explore the Earth System Data Explorer(https://mynasadata-las.larc.nasa.gov/EarthSystemLAS/UI.vm) to find answers to theirquestions identified in Parts 2 and 3.
2. Students should first review the YouTube tutorials available here, https://mynasadata.larc.nasa.gov/basic-page/tutorials
Powered by TCPDF (www.tcpdf.org)
15 / 15
Related Documents


