THE UNITED REPUBLIC OF TANZANIA PRIME MINISTER’S OFFICE REGIONAL ADMINISTRATION AND LOCAL GOVERNMENT MWANZA INVESTMENT PROFILE - 2013 Prepared by: Regional Commissioner’s Office, P. O. Box 119 MWANZA Tel. No.: 0282500366/2501037 Fax No. 0282501057/2541242 E-mail Address: [email protected] October, 2013

Welcome message from author
This document is posted to help you gain knowledge. Please leave a comment to let me know what you think about it! Share it to your friends and learn new things together.
Transcript
THE UNITED REPUBLIC OF TANZANIA
PRIME MINISTER’S OFFICE
REGIONAL ADMINISTRATION AND LOCAL GOVERNMENT
MWANZA INVESTMENT PROFILE
- 2013
Prepared by: Regional Commissioner’s Office, P. O. Box 119 MWANZA
Tel. No.: 0282500366/2501037 Fax No. 0282501057/2541242 E-mail Address: [email protected] October, 2013

Mwanza Region: Investment Profile 2012 Page of 68
i
… Amongst other things, Tanzania’s investment regime offers free repatriation of capital and the ability to externalize profits, by putting fewer restrictions on capital movements. …
Juliet Rugeiyamu KairukiExecutive Director, Tanzania Investment CentreEmpowerment (Prime Minister’s Office)
RC’s PHOTO
Mwanza Region: Investment Profile 2012 Page of 68
ii
Foreword
Mwanza Regional Profile has been prepared to provide a baseline for a focused development opportunities in the Region. The profile has covered information for all sectors on how best they effectively contribute forwards acceleration of investment and its economic growth to the Region and the National cake as well. This profile is critically important as it analyses the availability of abundant resources and the investment opportunity that are not yet fully utilized. For that case, the Region is welcoming different investors from different angles to look for; and invest to these abundant potentials and ensuring the opening up of its exploitation for the economic growth and well-being of Mwanza people and all Tanzanians at large. Mwanza people are convinced that, the exploitation of the available potentials will be shared, sustainable and beneficial to our present generation and future as well. Despite, these abundant untapped resources, Mwanza still remains poor because it still lacks capital, skills and technological resources to exploit its natural wealth for economic development. Thinking of all these; it is desirable to say that “The future we choose today will determine the kind of Mwanza our children and their future will live in” Hence come ones, come all to invest into this potential and stratergic region to ensure that resources are invested in a manner that will enhance private sector to realize profits quantitatively and qualitatively.
Eng. Evarist Ndikilo Regional Commissioner
Mwanza
Mwanza Region: Investment Profile 2012 Page of 68
iii
Disclaimer
This profile was published to assist potential investors, both local and foreign, to access essential information regarding investments and investing in Mwanza. The document does not in any way give exhaustive information or detailed practical instructions. It also points out sources of other information in both private and public sectors. Most or all of information contained in this profile was derived from consultation among government ministries, private sector, and other agencies. Materials in this document therefore should only be used for the intended purposes and not to be used for defense in a legal dispute or any matter of that nature.
Reasons to Invest in Mwanza A climate suitable for both tourism and agriculture Strategic location with transport links to neighbouring countries like Rwanda, Burundi, Kenya and
Uganda. Peace and political stability that offers a safe environment with low crime rates. High growth potential An inexpensive and trainable workforce A source of skills in the local education institutions Transport links with other regions and proximity to neighboring countries (Kenya, Uganda,
Burundi, Rwanda, and DRC.)
Priority Investment Areas
Mwanza Region: Investment Profile 2012 Page of 68
iv
Executive Summary
Mwanza region is a hub for commerce, transport, regional cooperation and economic development in the Lake Zone. The region is situated on Lake Victoria, one of the biggest fresh-water lakes in the world, at the crossroads of trade between Tanzania and neighboring countries of Uganda, Kenya Rwanda, and Burundi. Mwanza has every reason to be a prosperous commercial center and due to rapid growth in economy especially in industrial development and tourist attractions, massive migration of people from all over the country searching for employment opportunities and better life options in Mwanza. The region contributes 9% of National GDP after Dar es Salaam region. Mwanza was traditionally industrial base exploiting cotton, fish and mining is near the end of a slow spiral of decline. In this context, the Region Secretariat has decided to promote Region’s economic development, aspiring toward the achievement of the Millennium Development Goals (MDGs) 2015, largely by attracting local and foreign investors since it has all features of welcoming environment for economic development.
This profile, therefore, provides prospective investors and interested parties with insightful information about investing in Mwanza, including:
• An overview of the main investment opportunities the region presents • An summary of the geographical, political and economic characteristics of the country • An introduction to the primary agency responsible for promoting and facilitating investment into the country, the Tanzania Investment Centre (TIC)
The profile is expected to promote economic growth, increase knowledge or technical know how to local human capital, infrastructure development, or basic services provision by virtue of its identity in relation to the local economic environment. Thus, investors who need to find opportunities where the investment will “naturally” lead to the desired effect in the course of pursuing its own success. At this end, the profile will direct investors to look for investment opportunities in the region and surrounding areas for judging their preference on what to invest, where to invest, when to invest and how the region will facilitate investment procedures.
The profile comprises of seven chapters: Chapter One present important outlook and background of the region profile by highlighting key background information such as the economic context within which the region is operating, its location, climate and topography, ecological zones, administration, population and total area as well as concept and objective of investment. Chapter Two gives an overview of the existing investment which has been explained in detail by looking the previous performance of each sector and the current situation. Chapter three gives an in – depth analysis of the investment opportunities in each sector. In this context, the profile tries to show up un-expoited opportunities available in the region, where by it provides basis for investors to analyse the feasibility investment opportunities available in the region. Chapter Four shows up management and facilitation of investment; in this context the profile describes difference policy in favour of investors, land matters and disputes, prevailing facilitation center for investors’ i.e: TIC and the regional government in supporting investment in the region.

Mwanza Region: Investment Profile 2012 Page of 68
v
………………..
Mwanza Region: Investment Profile 2012 Page of 68
vi
Table of Contents Foreword .................................................................................................................................................... ii
Disclaimer .................................................................................................................................................. iii
Reasons to Invest in Mwanza ..................................................................................................................... iii
Priority Investment AreasExecutive Summary ............................................................................................ iii
Executive Summary .....................................................................................................................................iv
1 INTRODUCTION AND BACKGROUND ................................................................................................... 1
1.1 Mwanza in the Broader Context .................................................................................................. 1
1.2 Regional Economic Blocks ............................................................................................................ 1
1.3 The economy ............................................................................................................................... 2
1.4 Markets for Investors................................................................................................................... 3
1.5 Trade ........................................................................................................................................... 3
1.6 Mwanza Region ........................................................................................................................... 4
1.6.1 Cross Border Trade .............................................................................................................. 4
1.6.2 Inter-Regional Trade/Cooperations ...................................................................................... 5
2 CURRENT INVESTMENT SITUATION .......................................................................................... 6
2.1 Agriculture................................................................................................................................... 6
2.2 Livestock...................................................................................................................................... 7
2.2.1 Livestock infrastructures ...................................................................................................... 7
2.2.2 Marketing of Livestock and Livestock Products..................................................................... 8
2.2.3 Leather Processing ............................................................................................................... 8
2.3 Natural Resources ....................................................................................................................... 8
2.3.1 Forestry ............................................................................................................................... 8
2.3.2 Fisheries .............................................................................................................................. 9
2.3.3 Beekeeping ........................................................................................................................ 10
2.4 Tourisim .................................................................................................................................... 10
2.5 Mining ....................................................................................................................................... 11
2.6 Land/Real Estate ........................................................................................................................ 12
2.7 Industries .................................................................................................................................. 12
2.7.1 Ginneries ........................................................................................................................... 12
2.7.2 Flour Meals Factories ......................................................................................................... 12
2.7.3 Agro – Based Industries ...................................................................................................... 13
Mwanza Region: Investment Profile 2012 Page of 68
vii
2.7.4 Fish Processing Industries .................................................................................................. 13
2.7.5 Brewing Industries; ............................................................................................................ 13
2.7.6 Textile Industries................................................................................................................ 13
2.7.7 Timber Industries ............................................................................................................... 13
2.8 Infrastructure ............................................................................................................................ 13
2.8.1 Road Transport .................................................................................................................. 13
2.8.2 Railway transport ............................................................................................................... 14
2.8.3 Air transport ...................................................................................................................... 15
2.8.4 Marine transport ............................................................................................................... 15
2.8.5 Energy and Power Supply ................................................................................................... 15
2.8.6 Hydro Power: ..................................................................................................................... 15
2.8.7 Fuel wood Energy: ............................................................................................................. 15
2.8.8 Fossil fuels ......................................................................................................................... 16
2.8.9 Fuel from Getropha plant ................................................................................................... 16
2.8.10 Solar Energy: ...................................................................................................................... 16
2.9 Communications ........................................................................................................................ 16
2.9.1 Telecommunication ........................................................................................................... 16
2.9.2 News and Media ................................................................................................................ 16
2.10 Financial Sector ......................................................................................................................... 17
2.10.1 Non -Banking Financial Institutions .................................................................................... 17
2.10.2 Insurance Firms .................................................................................................................. 17
2.10.3 Social Security Funds .......................................................................................................... 17
2.11 Education Sector........................................................................................................................ 17
2.11.1 Pre – Primary Education ..................................................................................................... 17
2.11.2 Primary School Education................................................................................................... 18
2.11.3 Secondary School Education .............................................................................................. 18
2.11.4 Adult Education ................................................................................................................. 19
2.11.5 Vocational Training ............................................................................................................ 19
2.12 Health Infrastructure ................................................................................................................. 20
2.13 Water Sector ............................................................................................................................. 20
2.9.1 Domestic Water Supplies ...................................................................................................... 20
2.9.2 Water Supply Service in Urban Areas .................................................................................... 21
Mwanza Region: Investment Profile 2012 Page of 68
viii
Source: Regional Commissioner’s Office2012 .................................................................................. 21
2.9.3 Water Supply Service in Rural Area .............................................................................. 21
3 INVESTMENT OPPORTUNITIES ................................................................................................ 22
3.1 Agriculture and Livestock Development .............................................................................. 22
3.1.1 Irrigation Farming ........................................................................................................... 23
3.1.2 Horticulture ..................................................................................................................... 23
3.2 Livestock Production .............................................................................................................. 24
3.2.1 Meat Processing .............................................................................................................. 24
3.3 Natural Resources ................................................................................................................... 24
3.3.1 Fishing .............................................................................................................................. 25
3.3.2 Mining and Energy Sector .............................................................................................. 25
3.4 Tourism ................................................................................................................................... 26
3.5 Transport and Infrastructure ................................................................................................. 27
Specific areas ...................................................................................................................................... 27
3.6 Trade and Manufacturing ...................................................................................................... 28
3.7 Other Investment Areas ......................................................................................................... 28
3.7.1 Health services ................................................................................................................ 28
3.7.2 Solid and Liquid Waste Management ........................................................................... 29
3.8 Education sector ...................................................................................................................... 29
3.9 Financial services .................................................................................................................... 29
3.10 Real estate ................................................................................................................................ 29
3.11 Land banks .............................................................................................................................. 29
4 MANAGEMENT AND FACILITATION .................................................................................... 30
4.1 Investment Policy and Legislation ........................................................................................ 30
4.2 Land Matters and land Disputes................................................................................................. 31
4.3 Availability of TIC Zonal Office .................................................................................................. 31
4.4 Government Administration ...................................................................................................... 32
4.4.1 Regional Secretariat ........................................................................................................... 32
4.4.2 Local Government Authority .............................................................................................. 32
5 ANNEXES ........................................................................................................................................... 33
Mwanza Region: Investment Profile 2012 Page of 68
ix
Annex 5.1 Tax Structure and Administration ......................................................................................... 34
5.1.1 Registration with Domestic Revenue; ................................................................................. 34
5.1.2 Value Added Tax (VAT) ....................................................................................................... 35
5.1.3 VAT Deferment: ................................................................................................................. 35
5.1.4 VAT Refunds: ..................................................................................................................... 35
5.1.5 Taxes on profits and income .............................................................................................. 35
Annex 5.2 Priorities & restrictions ........................................................................................................ 42
Annex 53 Investment protection, investor treatment and dispute settlement ...................................... 44
Annex 5.4 Land Use Policy .................................................................................................................... 46
Annex 5.5 Foreign exchange and performance requirements ............................................................... 47
Annex 5.6 Incorporation and exit .................................................................................................... 49
Annex 5.7 Contacts for further information ....................................................................................... 53
Mwanza Region: Investment Profile 2012 Page of 68
x
List of Tables
Table 1:1 GDP, Inflation and Trade, 2009 - 2012 ...................................................................................... 2
Table 2:1 Area under irrigation as per year 20122/12 .............................................................................. 6
Table 2:2 Total Area, Dry Land, Water area, Total Arable land and Percentage of land Cultivated Vs Arable land as per 2012 .............................................................................................................................. 7
Table 2:3 Number of Live Stock in Each District for the Year 2011 ........................................................... 7
Table 2:4 Livestock infrastructure Available in Mwanza Region (2011) .................................................... 8
Table 2:5 Number of Fish Ponds per District for the Year 20122 .............................................................. 9
Table 2:6 Tourist Sites in Mwanza ......................................................................................................... 10
Table 2:7 Mineral extracted during the year 2011 - 2012................................................................... 12
Table 2:8 Lengths and Grades of Roads by Districts in Mwanza Region 2011 ......................................... 14
Table 2:9 Length of Road Network by District in Mwanza by 2011 ..................................................... 14
Table 2:10 Distribution of Pre-Primary Schools by District and Ownership as of 2012 .......................... 17
Table 2:11 Distribution of Primary Schools by District, Ownership and Sex in 2012 .............................. 18
Table 2:12 Distribution of Advanced Secondary Schools by District in 2012 ......................................... 18
Table 2:13 Distribution of Vocational Training Centers by District in 2012 ........................................... 19
Table 2:14 Water Supply Coverage in Mwanza Region (Busega District inclusive) ................................ 20
Table 2:15 Urban Water Service Coverage by 2012 ............................................................................. 21
Table 5:1 Capital Allowances For Depreciatable Assets.......................................................................... 36
Table 5:2 Taxes on Personal Income (TZS) ............................................................................................. 37
Table 5:3 Withholding Tax Rates (%) ..................................................................................................... 38
Table 5:4 Capital Gains Taxes (%) .......................................................................................................... 39
Table 5:5 EAC Common External Tariff (%) ............................................................................................ 41
Table 5:6 Services Offered by the Tanzania Investment Centre .......................................................... 47
Table 5:7 Starting a Business in Tanzania, Steps, time and cost ............................................................. 49
Table 5:8 A Sample Foreign Investors in Tanzania ................................................................................. 51
Mwanza Region: Investment Profile 2012 Page of 68
1
1 INTRODUCTION AND BACKGROUND
1.1 Mwanza in the Broader Context Tanzania, with its large and growing domestic population, strategic location, abundance of natural resources and internal political stability, presents a uniquely attractive investment opportunity. The country with a population of 44.9 million (national census 2012) is the largest in East Africa and its new middle-class is growing rapidly. Tanzania faces the Indian Ocean; it is the natural trading gateway for the 5 landlocked countries surrounding it, which are: the Democratic Republic of Congo (DRC), Rwanda, Burundi, Uganda and Zambia. The country is further blessed with vast natural riches: minerals in the form of gold, diamonds, copper, coal; more recently large discoveries of natural gas along its shores and it enjoys vast tracts of beautiful natural scenery including game reserves and sandy beaches. Democratic principles are firmly engrained in the country; since its independence in 1961, the country has never suffered a civil war and its political leaders have come to power through an electoral process. Free-market principles are also firmly engrained and successive Governments have continued to open up and liberalize Tanzania’s economy. As a result, Tanzania has enjoyed over 5 consecutive years of 7% real GDP growth and is a member what the World Bank has dubbed the “7% Club”, a group of countries forecast to achieve 7% or more real GDP growth for next decade. Investments in Tanzania are guaranteed against nationalization and expropriation through various agreements of protection and promotion of investments such as the Multilateral Investment Guarantee Agency (MIGA), of which Tanzania is a member. Tanzania also offers access to major markets of the world, such as America and Europe, through special bilateral trade and investment agreements and arrangements, for instance, the Africa Growth Opportunity Act (AGOA) of which Tanzania is a signatory.
1.2 Regional Economic Blocks Tanzania is a member of two major regional organizations. One of these is the Sourthen African Development Community (SADC). Although it is now primarily an economic organization, SADC began in 1980 with objective that was as much political as economic: to reduce dependence on then apartheid South Africa.
It has evolved considerably since then and hopes one day soon to achieve a customs union. Negotiations were also launched in June 2011 in Johannesburg, South Africa, to create a Tripartite Free Trade Area with two other regional organizations the common Market for Eastern and southern Africa (COMESA) and the East African Community (EAC)”
Mwanza Region: Investment Profile 2012 Page of 68
2
The second regional organization to which Tanzania belongs is the East African Community (EAC). The EAC is one of the oldest regional co-operation arrangement in Africa. The EAC has set very ambitious goals for itself. It intends to be far more than a free (or preferential) trade area. By 2010, intra-EAC trade had grown to USD 4.1 billion from USD 2.2 billion in 2005. 13
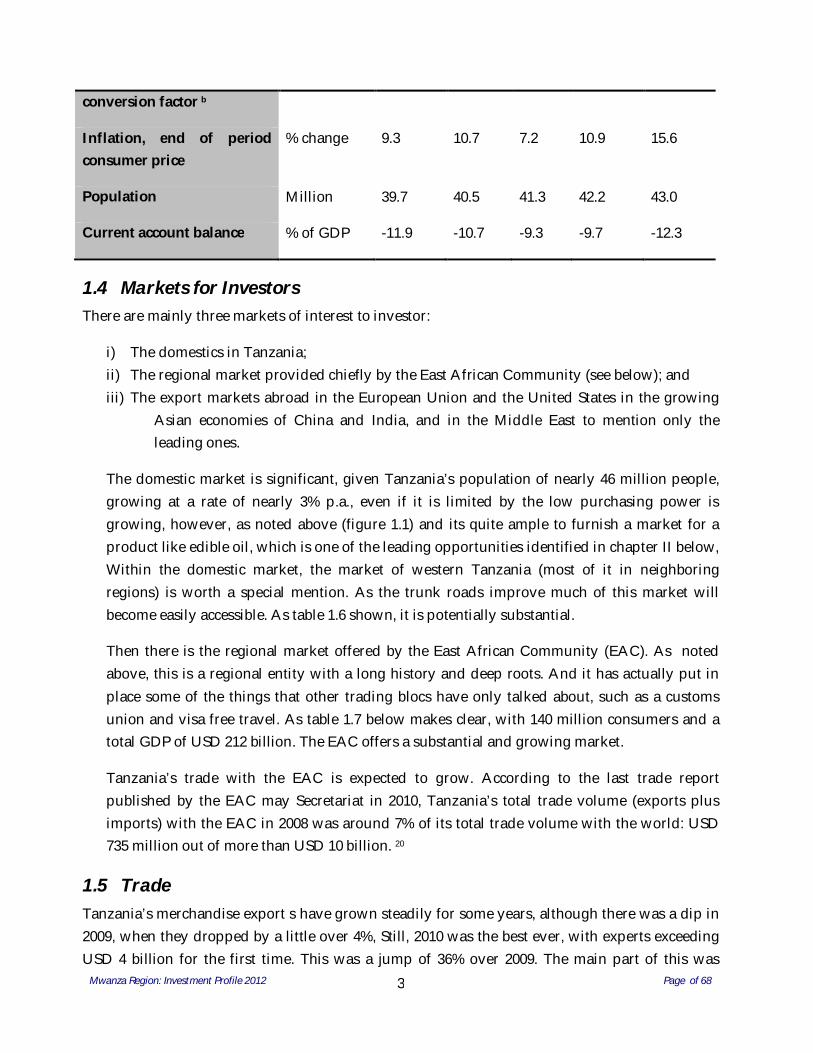
1.3 The economy The Tanzanian economy has been doing quite well lately. Real GDP has grown at 6 to 7 per cent for the past several years and is expected by the IMF to continue growing strongly in the next few years. However, inflation has picked up as well. According o the Bank of Tanzania headline inflation (including food and fuel) and been just over 4% in October 2010 but had risen to nearly 18% by October 2011. The energy and fuels rate in October 2011 was over 37%!)
The IMF expects economic performance to strengthen further in 2012 and over the medium term, benefiting from the implementation of the five-years development plan and initiatives under the Southern Agriculture Corridor of Tanzania (SAGCOT). One new factor is the strong prospect of substantial new foreign direct investment in Tanzania’s natural gas sector in the near future. According to some reports the confirmation of some 1.7 trillion cubic meters of natural gas reserves may be forthcoming over the next five years. Discussions have been under way in Tanzania on how to make the most of this potential natural resource wealth and a Natural Gas Master Plan is being developed. 18
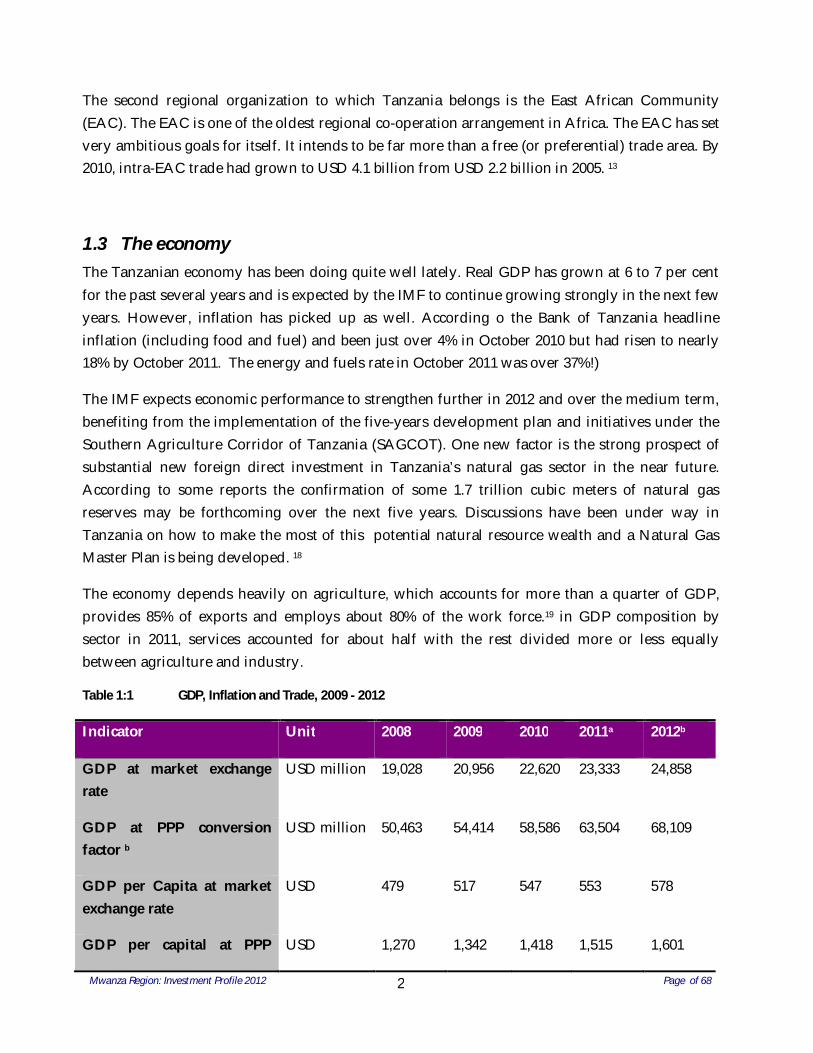
The economy depends heavily on agriculture, which accounts for more than a quarter of GDP, provides 85% of exports and employs about 80% of the work force.19 in GDP composition by sector in 2011, services accounted for about half with the rest divided more or less equally between agriculture and industry.
Table 1:1 GDP, Inflation and Trade, 2009 - 2012
Indicator Unit 2008 2009 2010 2011a 2012b
GDP at market exchange rate
USD million 19,028 20,956 22,620 23,333 24,858
GDP at PPP conversion factor b
USD million 50,463 54,414 58,586 63,504 68,109
GDP per Capita at market exchange rate
USD 479 517 547 553 578
GDP per capital at PPP USD 1,270 1,342 1,418 1,515 1,601
Mwanza Region: Investment Profile 2012 Page of 68
3
conversion factor b
Inflation, end of period consumer price
% change 9.3 10.7 7.2 10.9 15.6
Population Million 39.7 40.5 41.3 42.2 43.0
Current account balance % of GDP -11.9 -10.7 -9.3 -9.7 -12.3
1.4 Markets for Investors There are mainly three markets of interest to investor:
i) The domestics in Tanzania; ii) The regional market provided chiefly by the East African Community (see below); and iii) The export markets abroad in the European Union and the United States in the growing
Asian economies of China and India, and in the Middle East to mention only the leading ones.
The domestic market is significant, given Tanzania’s population of nearly 46 million people, growing at a rate of nearly 3% p.a., even if it is limited by the low purchasing power is growing, however, as noted above (figure 1.1) and its quite ample to furnish a market for a product like edible oil, which is one of the leading opportunities identified in chapter II below, Within the domestic market, the market of western Tanzania (most of it in neighboring regions) is worth a special mention. As the trunk roads improve much of this market will become easily accessible. As table 1.6 shown, it is potentially substantial.
Then there is the regional market offered by the East African Community (EAC). As noted above, this is a regional entity with a long history and deep roots. And it has actually put in place some of the things that other trading blocs have only talked about, such as a customs union and visa free travel. As table 1.7 below makes clear, with 140 million consumers and a total GDP of USD 212 billion. The EAC offers a substantial and growing market.
Tanzania’s trade with the EAC is expected to grow. According to the last trade report published by the EAC may Secretariat in 2010, Tanzania’s total trade volume (exports plus imports) with the EAC in 2008 was around 7% of its total trade volume with the world: USD 735 million out of more than USD 10 billion. 20
1.5 Trade Tanzania’s merchandise export s have grown steadily for some years, although there was a dip in 2009, when they dropped by a little over 4%, Still, 2010 was the best ever, with experts exceeding USD 4 billion for the first time. This was a jump of 36% over 2009. The main part of this was
Mwanza Region: Investment Profile 2012 Page of 68
4
manganese ore exports of over USD 350 million- there had been none in 2008 and 2009. Other factors were an 18% increase in gold exports-Tanzania is Africa’s fourth largest gold producer and small increases in the exports of a number of agricultural products.
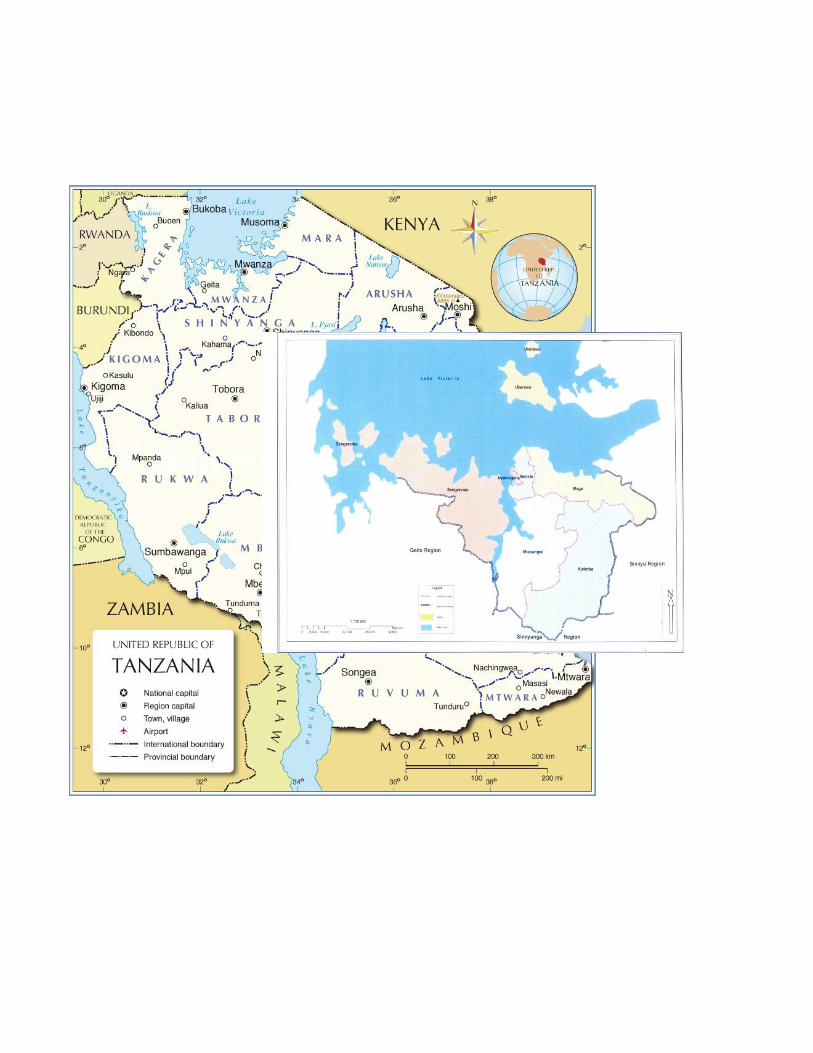
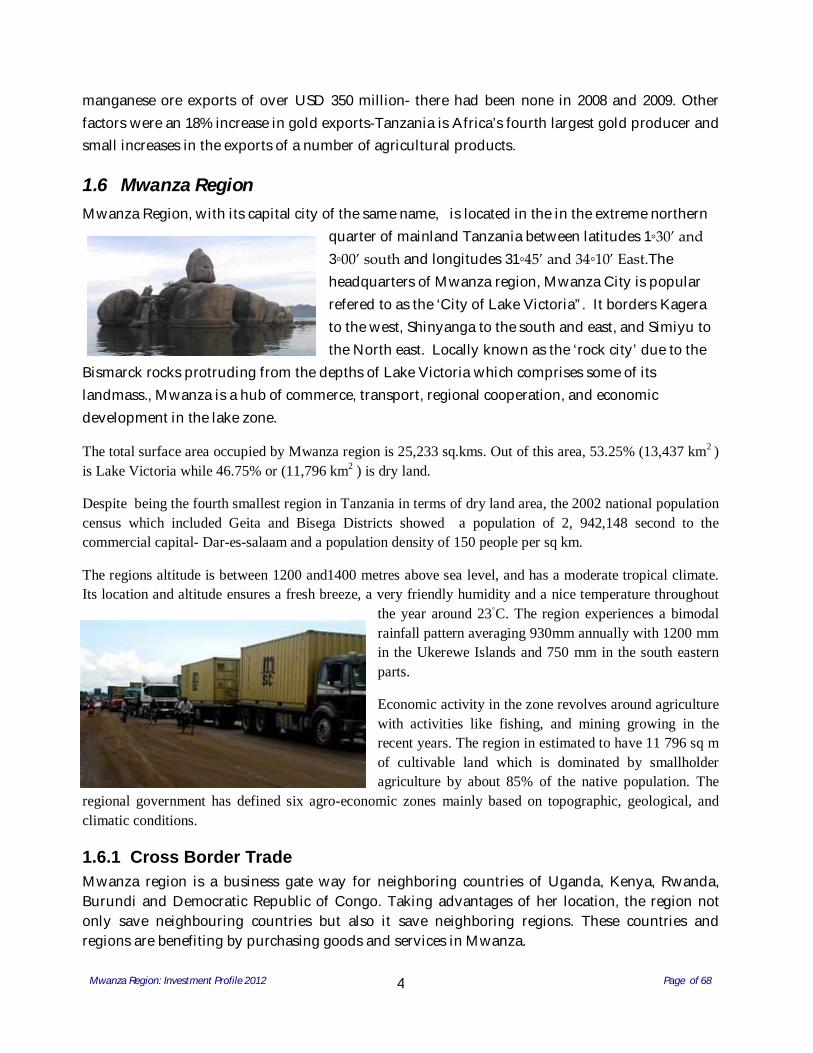
1.6 Mwanza Region Mwanza Region, with its capital city of the same name, is located in the in the extreme northern
quarter of mainland Tanzania between latitudes 1◦30’ and 3◦00’ south and longitudes 31◦45’ and 34◦10’ East.The headquarters of Mwanza region, Mwanza City is popular refered to as the ‘City of Lake Victoria”. It borders Kagera to the west, Shinyanga to the south and east, and Simiyu to the North east. Locally known as the ‘rock city’ due to the
Bismarck rocks protruding from the depths of Lake Victoria which comprises some of its landmass., Mwanza is a hub of commerce, transport, regional cooperation, and economic development in the lake zone.
The total surface area occupied by Mwanza region is 25,233 sq.kms. Out of this area, 53.25% (13,437 km2 ) is Lake Victoria while 46.75% or (11,796 km2 ) is dry land.
Despite being the fourth smallest region in Tanzania in terms of dry land area, the 2002 national population census which included Geita and Bisega Districts showed a population of 2, 942,148 second to the commercial capital- Dar-es-salaam and a population density of 150 people per sq km.
The regions altitude is between 1200 and1400 metres above sea level, and has a moderate tropical climate. Its location and altitude ensures a fresh breeze, a very friendly humidity and a nice temperature throughout
the year around 23◦C. The region experiences a bimodal rainfall pattern averaging 930mm annually with 1200 mm in the Ukerewe Islands and 750 mm in the south eastern parts.
Economic activity in the zone revolves around agriculture with activities like fishing, and mining growing in the recent years. The region in estimated to have 11 796 sq m of cultivable land which is dominated by smallholder agriculture by about 85% of the native population. The
regional government has defined six agro-economic zones mainly based on topographic, geological, and climatic conditions.
1.6.1 Cross Border Trade Mwanza region is a business gate way for neighboring countries of Uganda, Kenya, Rwanda, Burundi and Democratic Republic of Congo. Taking advantages of her location, the region not only save neighbouring countries but also it save neighboring regions. These countries and regions are benefiting by purchasing goods and services in Mwanza.
Mwanza Region: Investment Profile 2012 Page of 68
5
Through East Africa Community, the region has already planned to improve and formalize cross border trade and integration among partner member states by reducing or eliminating trade barriers and the coordination of monetary and fiscal policies. This has been beneficial to local people as it reduces costs for both consumers and producers, as well as to increase trade between the countries taking part in the integration and beyond.
1.6.2 Inter-Regional Trade/Cooperations Moreover, Mwanza region is connected to different economic infrastructures like airport, railway, road, and marine transport. Through Mwanza airport, services are provided to different passengers with their goods and cargo handling within and outside the country. Mwanza airport can accommodate different aircrafts like Air Tanzania, Precision Air, Fast Jet, Auric Air, Coastal Travel, Rwanda Air and Kahama Mining. These flights serve passengers, cargo and others are for hiring (charter planes). These flights make local routes to Dar es Salaam, Arusha, Kilimanjaro, Zanzibar, Kigoma, Mpanda etc. International routes include Mwanza to Nairobi, Entebbe, Kigali and Bujumbura.
Likewise, railway line connects Mwanza to central regions of Tanzania, Dar es Salaam and overseas; whereas road transport connects Mwanza to the nearby regions and all East Africa Community member states. At the same time, water transport connects Mwanza to Mara and Kagera Regions as well as Kenya and Uganda states.
Mwanza Region: Investment Profile 2012 Page of 68
6
2 CURRENT INVESTMENT SITUATION
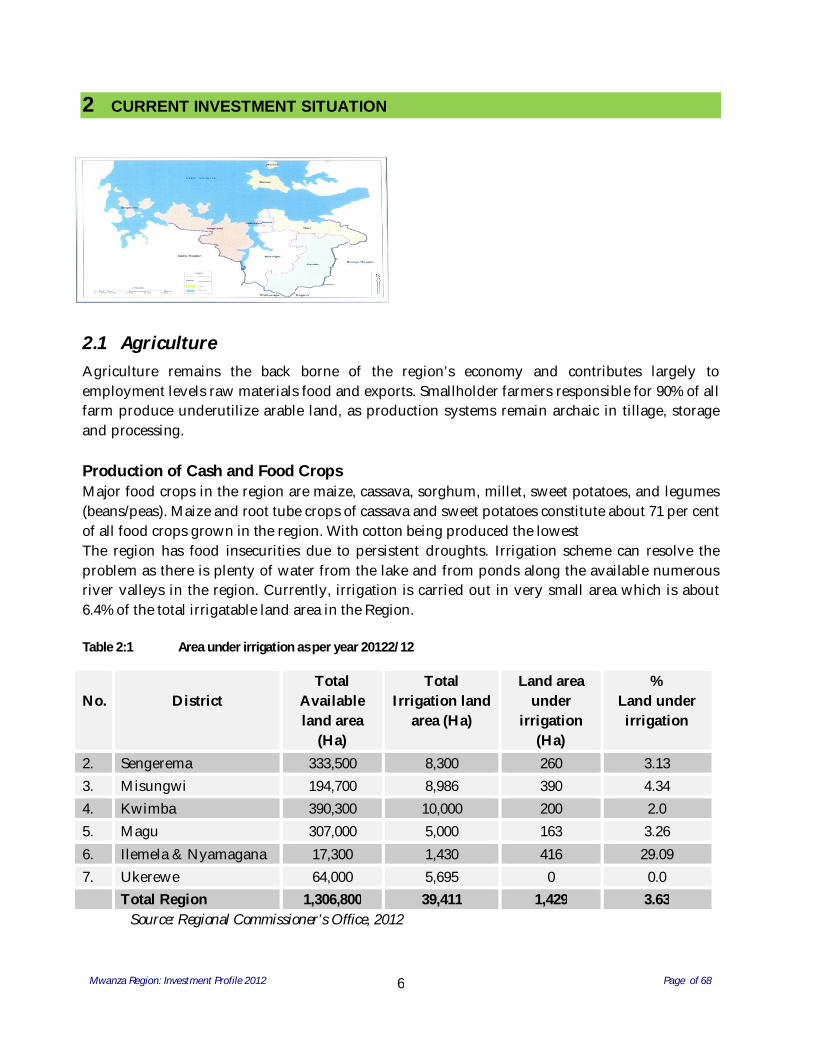
2.1 Agriculture Agriculture remains the back borne of the region’s economy and contributes largely to employment levels raw materials food and exports. Smallholder farmers responsible for 90% of all farm produce underutilize arable land, as production systems remain archaic in tillage, storage and processing. Production of Cash and Food Crops Major food crops in the region are maize, cassava, sorghum, millet, sweet potatoes, and legumes (beans/peas). Maize and root tube crops of cassava and sweet potatoes constitute about 71 per cent of all food crops grown in the region. With cotton being produced the lowest The region has food insecurities due to persistent droughts. Irrigation scheme can resolve the problem as there is plenty of water from the lake and from ponds along the available numerous river valleys in the region. Currently, irrigation is carried out in very small area which is about 6.4% of the total irrigatable land area in the Region. Table 2:1 Area under irrigation as per year 20122/12
No.
District
Total Available land area
(Ha)
Total Irrigation land
area (Ha)
Land area under
irrigation (Ha)
% Land under irrigation
2. Sengerema 333,500 8,300 260 3.13 3. Misungwi 194,700 8,986 390 4.34 4. Kwimba 390,300 10,000 200 2.0 5. Magu 307,000 5,000 163 3.26 6. Ilemela & Nyamagana 17,300 1,430 416 29.09 7. Ukerewe 64,000 5,695 0 0.0 Total Region 1,306,800 39,411 1,429 3.63
Source: Regional Commissioner’s Office, 2012
Mwanza Region: Investment Profile 2012 Page of 68
7
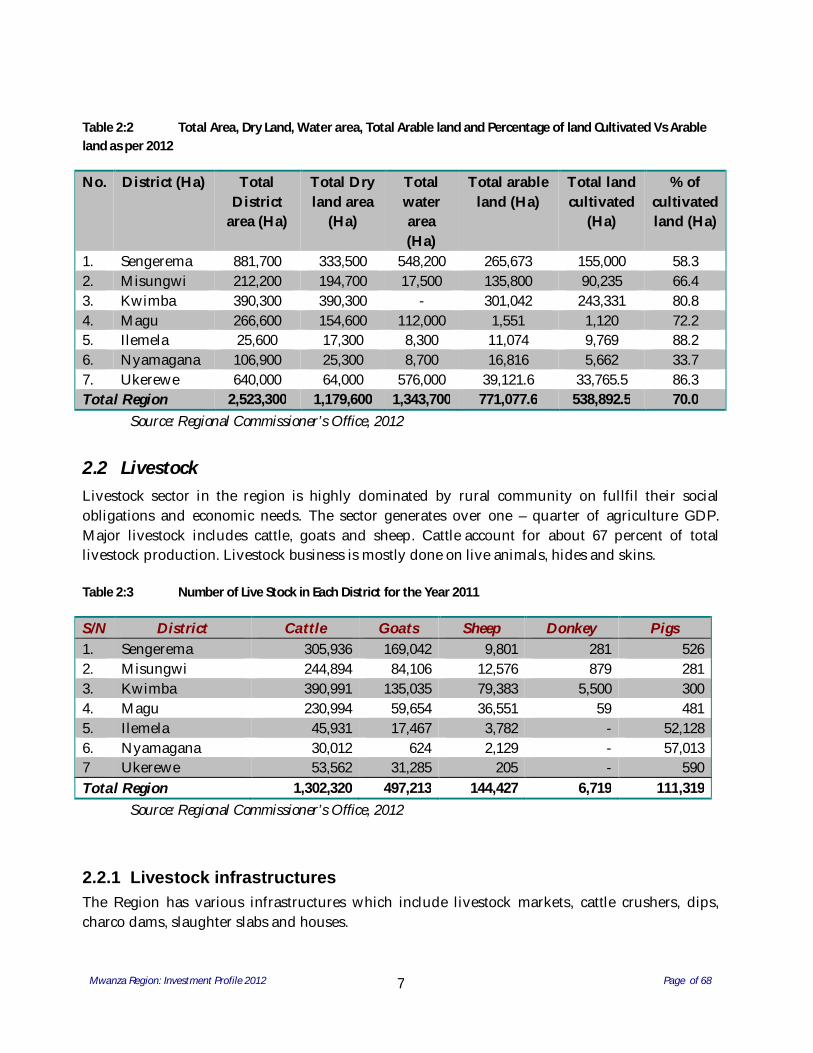
Table 2:2 Total Area, Dry Land, Water area, Total Arable land and Percentage of land Cultivated Vs Arable land as per 2012
No. District (Ha) Total District
area (Ha)
Total Dry land area
(Ha)
Total water area (Ha)
Total arable land (Ha)
Total land cultivated
(Ha)
% of cultivated land (Ha)
1. Sengerema 881,700 333,500 548,200 265,673 155,000 58.3 2. Misungwi 212,200 194,700 17,500 135,800 90,235 66.4 3. Kwimba 390,300 390,300 - 301,042 243,331 80.8 4. Magu 266,600 154,600 112,000 1,551 1,120 72.2 5. Ilemela 25,600 17,300 8,300 11,074 9,769 88.2 6. Nyamagana 106,900 25,300 8,700 16,816 5,662 33.7 7. Ukerewe 640,000 64,000 576,000 39,121.6 33,765.5 86.3 Total Region 2,523,300 1,179,600 1,343,700 771,077.6 538,892.5 70.0
Source: Regional Commissioner’s Office, 2012
2.2 Livestock Livestock sector in the region is highly dominated by rural community on fullfil their social obligations and economic needs. The sector generates over one – quarter of agriculture GDP. Major livestock includes cattle, goats and sheep. Cattle account for about 67 percent of total livestock production. Livestock business is mostly done on live animals, hides and skins. Table 2:3 Number of Live Stock in Each District for the Year 2011
S/N District Cattle Goats Sheep Donkey Pigs 1. Sengerema 305,936 169,042 9,801 281 526 2. Misungwi 244,894 84,106 12,576 879 281 3. Kwimba 390,991 135,035 79,383 5,500 300 4. Magu 230,994 59,654 36,551 59 481 5. Ilemela 45,931 17,467 3,782 - 52,128 6. Nyamagana 30,012 624 2,129 - 57,013 7 Ukerewe 53,562 31,285 205 - 590 Total Region 1,302,320 497,213 144,427 6,719 111,319
Source: Regional Commissioner’s Office, 2012
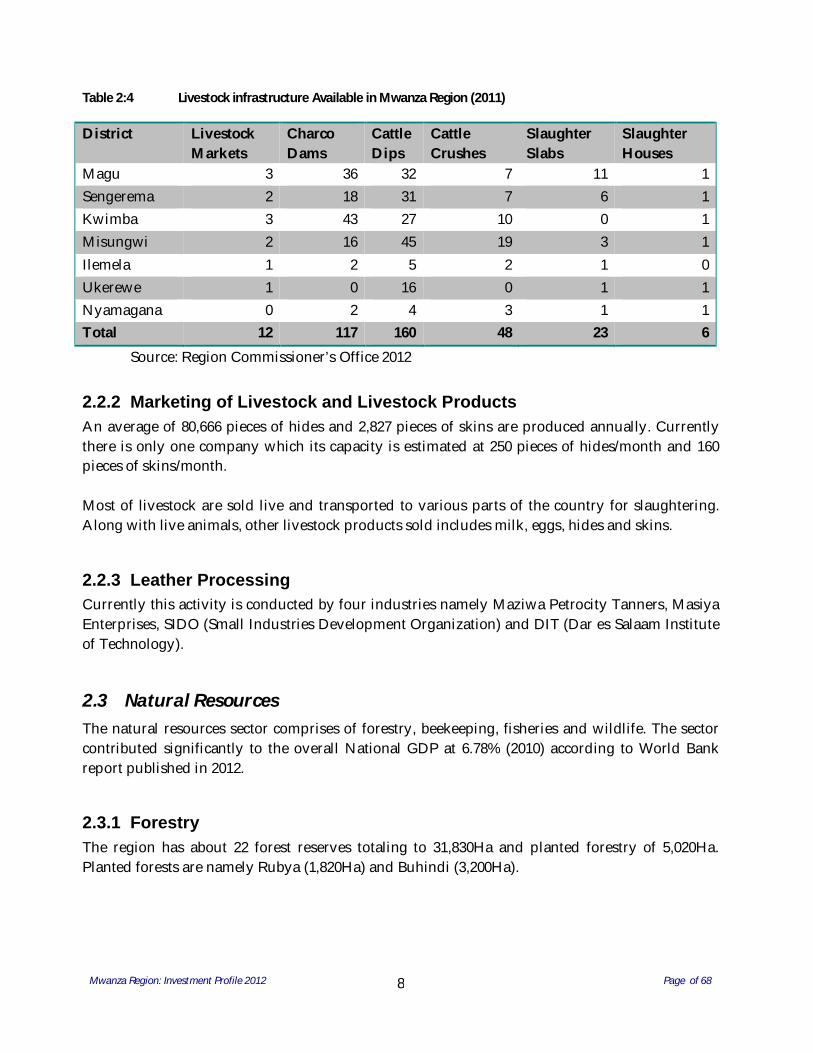
2.2.1 Livestock infrastructures The Region has various infrastructures which include livestock markets, cattle crushers, dips, charco dams, slaughter slabs and houses.
Mwanza Region: Investment Profile 2012 Page of 68
8
Table 2:4 Livestock infrastructure Available in Mwanza Region (2011)
District Livestock Markets
Charco Dams
Cattle Dips
Cattle Crushes
Slaughter Slabs
Slaughter Houses
Magu 3 36 32 7 11 1 Sengerema 2 18 31 7 6 1 Kwimba 3 43 27 10 0 1 Misungwi 2 16 45 19 3 1 Ilemela 1 2 5 2 1 0 Ukerewe 1 0 16 0 1 1 Nyamagana 0 2 4 3 1 1 Total 12 117 160 48 23 6
Source: Region Commissioner’s Office 2012
2.2.2 Marketing of Livestock and Livestock Products An average of 80,666 pieces of hides and 2,827 pieces of skins are produced annually. Currently there is only one company which its capacity is estimated at 250 pieces of hides/month and 160 pieces of skins/month.
Most of livestock are sold live and transported to various parts of the country for slaughtering. Along with live animals, other livestock products sold includes milk, eggs, hides and skins.
2.2.3 Leather Processing Currently this activity is conducted by four industries namely Maziwa Petrocity Tanners, Masiya Enterprises, SIDO (Small Industries Development Organization) and DIT (Dar es Salaam Institute of Technology).
2.3 Natural Resources The natural resources sector comprises of forestry, beekeeping, fisheries and wildlife. The sector contributed significantly to the overall National GDP at 6.78% (2010) according to World Bank report published in 2012.
2.3.1 Forestry The region has about 22 forest reserves totaling to 31,830Ha and planted forestry of 5,020Ha. Planted forests are namely Rubya (1,820Ha) and Buhindi (3,200Ha).
Mwanza Region: Investment Profile 2012 Page of 68
9
2.3.1.1 Natural Forest Reserves There are two types of natural forest reserves (a) Those under Central Government (b) Those under Local Government i.e District Council and village Councils. The forest reserves under Central Government control are distributed as follows:-
1. Kome with forest reserve 2,100Ha. in Sengerema District 2. Maisome Forest reserve with 12,000Ha. in Sengerema District 3. Sayaka forest reserve with 5,421Ha. in Magu District
2.3.2 Fisheries Fishing on the fresh waters of Lake Victoria is one of the most important undertakings. The sector contributes 7% of regional economy. It is believed that fisheries activities in the region leads in terms of foreign exchange earnings contribution to the region's economy According to 2011 frame survey, the Region had a total of 52,942 fishermen with 14,480 fishing boats and canoes. There were 174,151 gillnets, 4759 fishnets for “dagaa” (Rastrineobola argentius), 3,379,474 longline hooks, 7,080 Handline hooks and 4,127 monofilaments.
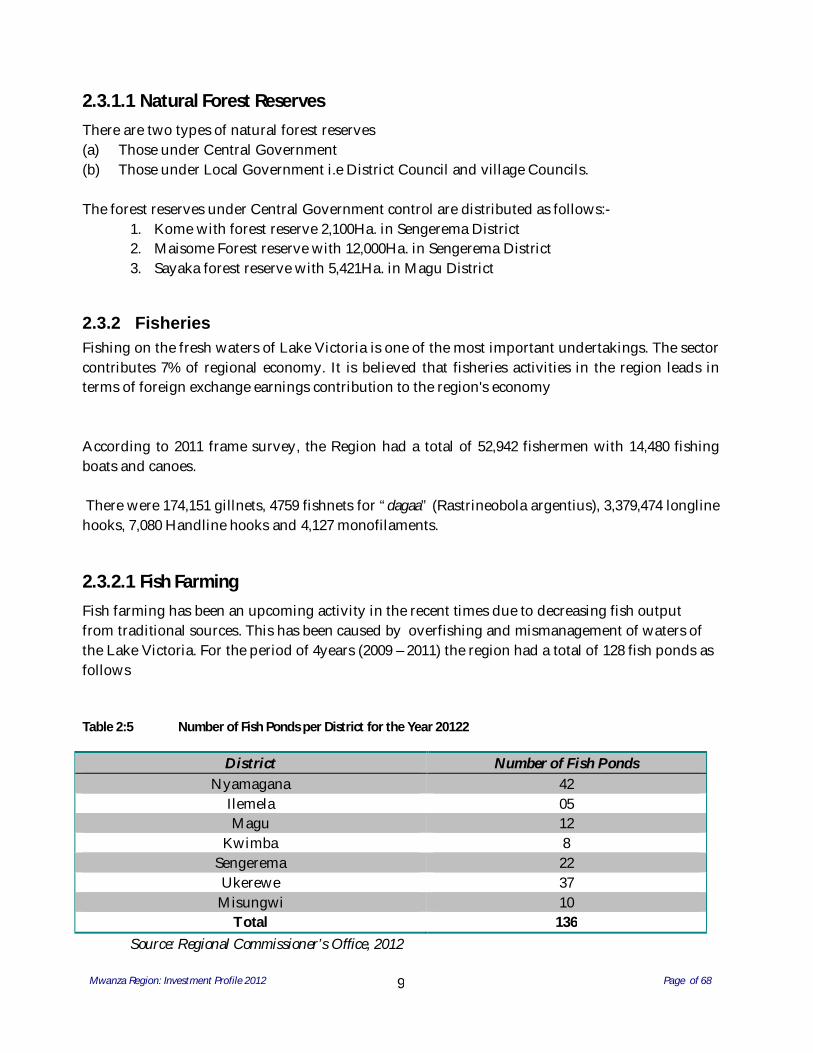
2.3.2.1 Fish Farming Fish farming has been an upcoming activity in the recent times due to decreasing fish output from traditional sources. This has been caused by overfishing and mismanagement of waters of the Lake Victoria. For the period of 4years (2009 – 2011) the region had a total of 128 fish ponds as follows Table 2:5 Number of Fish Ponds per District for the Year 20122
District Number of Fish Ponds Nyamagana 42
Ilemela 05 Magu 12
Kwimba 8 Sengerema 22 Ukerewe 37
Misungwi 10 Total 136
Source: Regional Commissioner’s Office, 2012
Mwanza Region: Investment Profile 2012 Page of 68
10
Table 2:5 presents a cross section of fish farming activities in Mwanza. Amongst these ponds, Mwanza Fishing Industries Ltd owns 25 ponds to feed its industry while others are owned by individuals. The species planted in the ponds include: Tilapia and Momyrus catfish.
2.3.2.2 Fish Sales About 16,913 tons of fish is exported to European Union (EU) and Far East countries of Japan and Australia. A total of 426,633.50 tons been sold to other regions within the country and about 6,214.10 tons is consumed locally within the Mwanza region itself.
2.3.3 Beekeeping Mwanza Region has total of 2,938 (August, 2012) beehives at; Magu with 70, Misungwi 493, Mwanza City 230, Ukerewe 488, Sengerema 587 and Kwimba has 970 whereby local hives 349 and modern hives 621. The beekeepers use local modern and drum hives to produce bee products. The region is still making effort to encourage bee keeper to use modern hive since they are highly productive. Bee keeping products includes honey, wax, royal jelly, pollen and propols. Part of the produces is sold in Mara and Kagera region in Tanzania and exported in Kenya and Uganda.
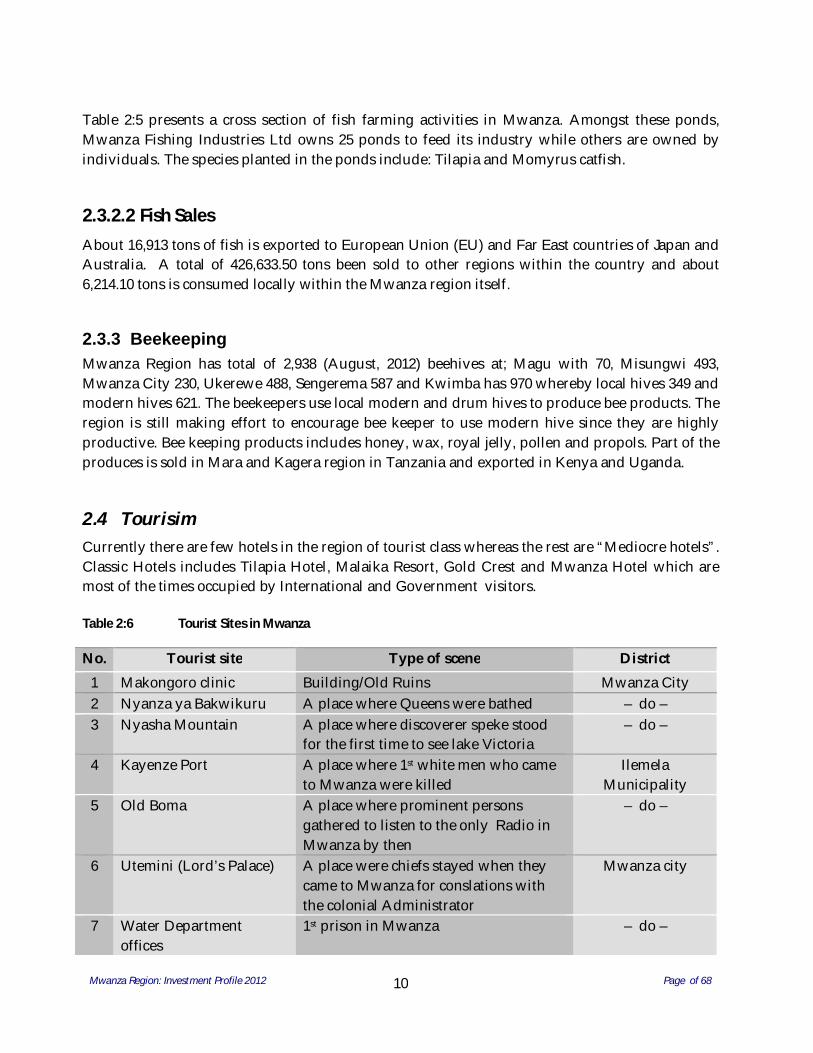
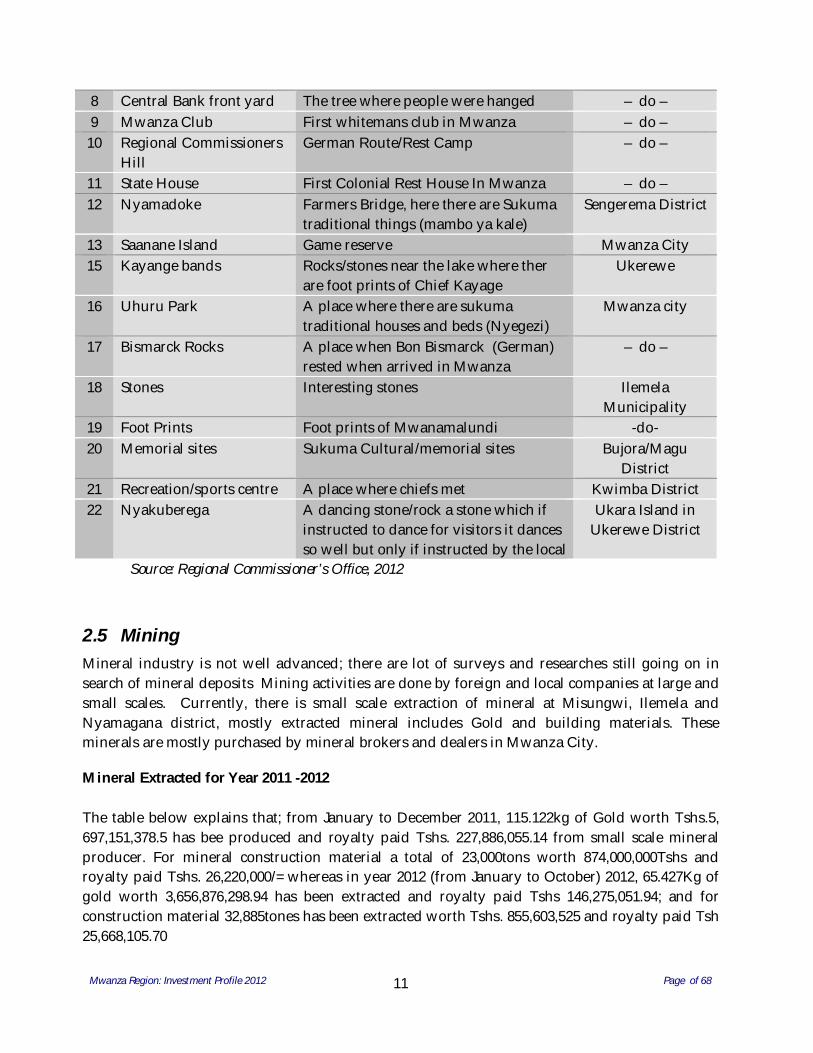
2.4 Tourisim Currently there are few hotels in the region of tourist class whereas the rest are “Mediocre hotels”. Classic Hotels includes Tilapia Hotel, Malaika Resort, Gold Crest and Mwanza Hotel which are most of the times occupied by International and Government visitors. Table 2:6 Tourist Sites in Mwanza
No. Tourist site Type of scene District 1 Makongoro clinic Building/Old Ruins Mwanza City 2 Nyanza ya Bakwikuru A place where Queens were bathed – do – 3 Nyasha Mountain A place where discoverer speke stood
for the first time to see lake Victoria – do –
4 Kayenze Port A place where 1st white men who came to Mwanza were killed
Ilemela Municipality
5 Old Boma A place where prominent persons gathered to listen to the only Radio in Mwanza by then
– do –
6 Utemini (Lord’s Palace) A place were chiefs stayed when they came to Mwanza for conslations with the colonial Administrator
Mwanza city
7 Water Department offices
1st prison in Mwanza – do –
Mwanza Region: Investment Profile 2012 Page of 68
11
8 Central Bank front yard The tree where people were hanged – do – 9 Mwanza Club First whitemans club in Mwanza – do –
10 Regional Commissioners Hill
German Route/Rest Camp – do –
11 State House First Colonial Rest House In Mwanza – do – 12 Nyamadoke Farmers Bridge, here there are Sukuma
traditional things (mambo ya kale) Sengerema District
13 Saanane Island Game reserve Mwanza City 15 Kayange bands Rocks/stones near the lake where ther
are foot prints of Chief Kayage Ukerewe
16 Uhuru Park A place where there are sukuma traditional houses and beds (Nyegezi)
Mwanza city
17 Bismarck Rocks A place when Bon Bismarck (German) rested when arrived in Mwanza
– do –
18 Stones Interesting stones Ilemela Municipality
19 Foot Prints Foot prints of Mwanamalundi -do- 20 Memorial sites Sukuma Cultural/memorial sites Bujora/Magu
District 21 Recreation/sports centre A place where chiefs met Kwimba District 22 Nyakuberega A dancing stone/rock a stone which if
instructed to dance for visitors it dances so well but only if instructed by the local
Ukara Island in Ukerewe District
Source: Regional Commissioner’s Office, 2012
2.5 Mining Mineral industry is not well advanced; there are lot of surveys and researches still going on in search of mineral deposits Mining activities are done by foreign and local companies at large and small scales. Currently, there is small scale extraction of mineral at Misungwi, Ilemela and Nyamagana district, mostly extracted mineral includes Gold and building materials. These minerals are mostly purchased by mineral brokers and dealers in Mwanza City.
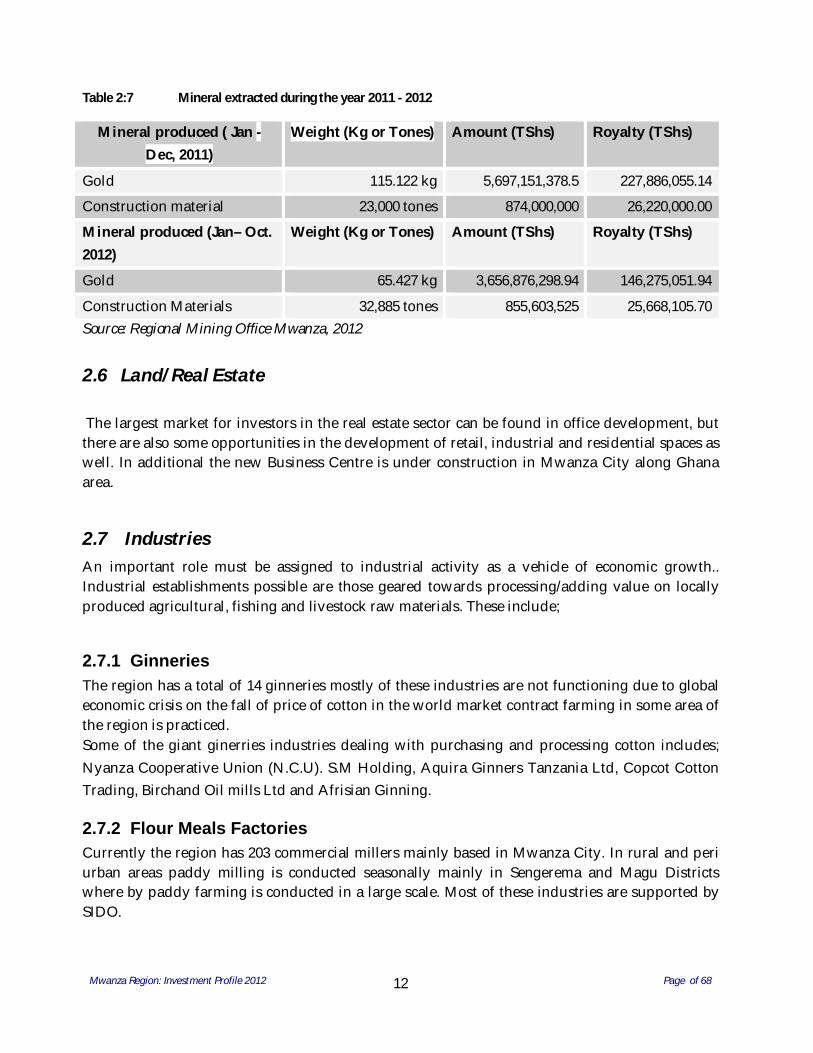
Mineral Extracted for Year 2011 -2012 The table below explains that; from January to December 2011, 115.122kg of Gold worth Tshs.5, 697,151,378.5 has bee produced and royalty paid Tshs. 227,886,055.14 from small scale mineral producer. For mineral construction material a total of 23,000tons worth 874,000,000Tshs and royalty paid Tshs. 26,220,000/= whereas in year 2012 (from January to October) 2012, 65.427Kg of gold worth 3,656,876,298.94 has been extracted and royalty paid Tshs 146,275,051.94; and for construction material 32,885tones has been extracted worth Tshs. 855,603,525 and royalty paid Tsh 25,668,105.70
Mwanza Region: Investment Profile 2012 Page of 68
12
Table 2:7 Mineral extracted during the year 2011 - 2012
Mineral produced ( Jan - Dec, 2011)
Weight (Kg or Tones) Amount (TShs) Royalty (TShs)
Gold 115.122 kg 5,697,151,378.5 227,886,055.14
Construction material 23,000 tones 874,000,000 26,220,000.00
Mineral produced (Jan– Oct. 2012)
Weight (Kg or Tones) Amount (TShs) Royalty (TShs)
Gold 65.427 kg 3,656,876,298.94 146,275,051.94
Construction Materials 32,885 tones 855,603,525 25,668,105.70 Source: Regional Mining Office Mwanza, 2012
2.6 Land/Real Estate …………………….. The largest market for investors in the real estate sector can be found in office development, but there are also some opportunities in the development of retail, industrial and residential spaces as well. In additional the new Business Centre is under construction in Mwanza City along Ghana area.
2.7 Industries An important role must be assigned to industrial activity as a vehicle of economic growth.. Industrial establishments possible are those geared towards processing/adding value on locally produced agricultural, fishing and livestock raw materials. These include;
2.7.1 Ginneries The region has a total of 14 ginneries mostly of these industries are not functioning due to global economic crisis on the fall of price of cotton in the world market contract farming in some area of the region is practiced. Some of the giant ginerries industries dealing with purchasing and processing cotton includes; Nyanza Cooperative Union (N.C.U). S.M Holding, Aquira Ginners Tanzania Ltd, Copcot Cotton Trading, Birchand Oil mills Ltd and Afrisian Ginning.
2.7.2 Flour Meals Factories Currently the region has 203 commercial millers mainly based in Mwanza City. In rural and peri urban areas paddy milling is conducted seasonally mainly in Sengerema and Magu Districts where by paddy farming is conducted in a large scale. Most of these industries are supported by SIDO.
Mwanza Region: Investment Profile 2012 Page of 68
13
2.7.3 Agro – Based Industries Mwanza region has fruit canning and juice concentrates making industries. The region has very few sophisticated factories dealing with agro – based industries these includes Lema Food Supply, Regent Food & Drink Lts, Mwanza Food Industries, and Ashif F. Ladhan. They all produce juice concentrates which could be exported to countries where if they could be processed in sophisticated factories.
2.7.4 Fish Processing Industries Mwanza region has seven fish fillet the industries include: Mwanza Fishing Industries Ltd, Nile perch Fisheries Ltd, Omega Fish Ltd, Tanzania Fish Processors Ltd, Vic Fish Ltd, Tanzania Fish Development Co. and Tan Perch Ltd.
2.7.5 Brewing Industries; Currently the region has only 2 brewing industries located in Mwanza City these include; Tanzania Breweries Limited (TBL) and Serengeti Breweries. These industries are owned by private companies and the major shareholder for Tanzania Breweries Limited is SABMiller from South Africa and for Serengeti Breweries is East Africa Breweries from Kenya.
2.7.6 Textile Industries Tanzania produces raw cotton and textiles. Cotton is one of the export commodities contributing 3% of total exports in 2000 after coffee (15%), raw cashewnut (9%), tobacco (7%) and tea (6%)... Mwanza Textile Mill is the only in operational but not efficiently as it was before. The company has advantage of the African Growth Opportunity Act (AGOA) but not yet benefited from that opportunity; other opportunities available in the textile sector which related to the AGOA are the capitalization process and modern technology acquire by private owners.
2.7.7 Timber Industries The region has over 114 small scale timber industries, which produces timbers of different sizes. The timber processed includes pines, mininga and mitundu from Mwanza rural areas and outside region. About 4,346.8 cubic meters of timbers are processed yearly in the region. The actual demand of timber in the region is 7,459.6 cubic meters per annum. There sector employ over 3,000 casual laborers. Whereas about 57 registered businessmen are dealing with timber selling in Mwanza region.
2.8 Infrastructure
2.8.1 Road Transport
Mwanza Region: Investment Profile 2012 Page of 68
14
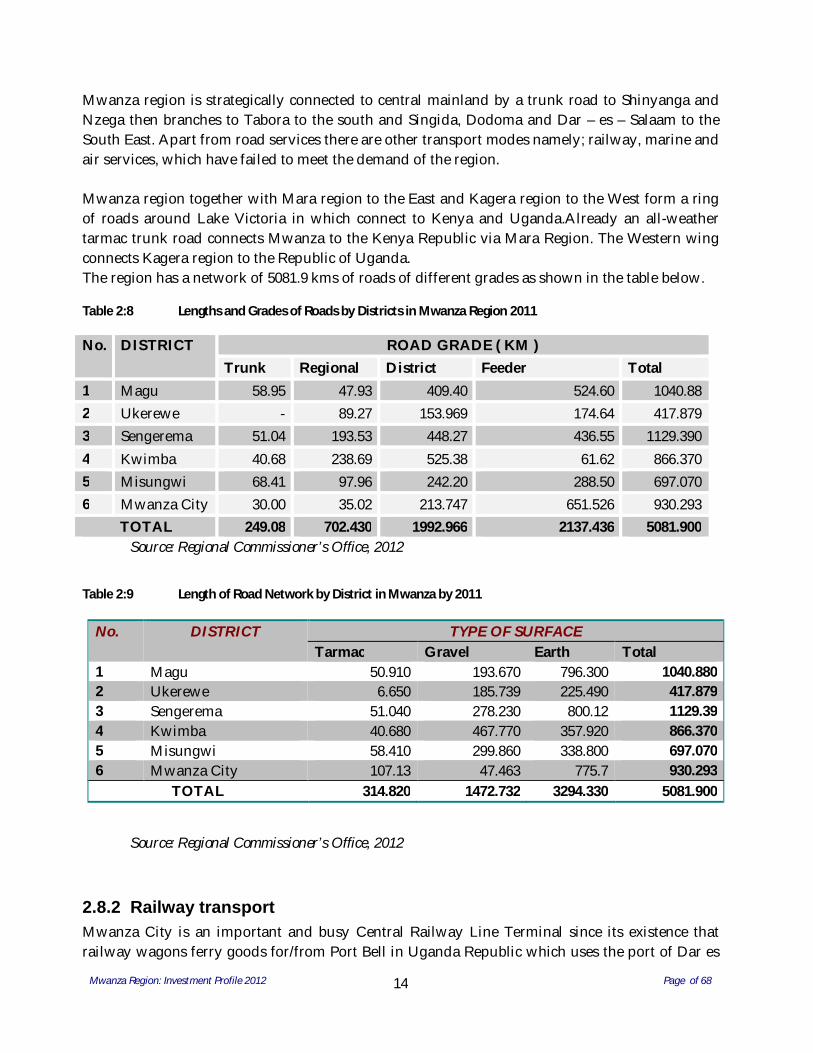
Mwanza region is strategically connected to central mainland by a trunk road to Shinyanga and Nzega then branches to Tabora to the south and Singida, Dodoma and Dar – es – Salaam to the South East. Apart from road services there are other transport modes namely; railway, marine and air services, which have failed to meet the demand of the region. Mwanza region together with Mara region to the East and Kagera region to the West form a ring of roads around Lake Victoria in which connect to Kenya and Uganda.Already an all-weather tarmac trunk road connects Mwanza to the Kenya Republic via Mara Region. The Western wing connects Kagera region to the Republic of Uganda. The region has a network of 5081.9 kms of roads of different grades as shown in the table below.
Table 2:8 Lengths and Grades of Roads by Districts in Mwanza Region 2011
No. DISTRICT ROAD GRADE ( KM ) Trunk Regional District Feeder Total
1 Magu 58.95 47.93 409.40 524.60 1040.88 2 Ukerewe - 89.27 153.969 174.64 417.879 3 Sengerema 51.04 193.53 448.27 436.55 1129.390 4 Kwimba 40.68 238.69 525.38 61.62 866.370 5 Misungwi 68.41 97.96 242.20 288.50 697.070 6 Mwanza City 30.00 35.02 213.747 651.526 930.293
TOTAL 249.08 702.430 1992.966 2137.436 5081.900 Source: Regional Commissioner’s Office, 2012
Table 2:9 Length of Road Network by District in Mwanza by 2011
Source: Regional Commissioner’s Office, 2012
2.8.2 Railway transport Mwanza City is an important and busy Central Railway Line Terminal since its existence that railway wagons ferry goods for/from Port Bell in Uganda Republic which uses the port of Dar es
No. DISTRICT TYPE OF SURFACE Tarmac Gravel Earth Total
1 Magu 50.910 193.670 796.300 1040.880 2 Ukerewe 6.650 185.739 225.490 417.879 3 Sengerema 51.040 278.230 800.12 1129.39 4 Kwimba 40.680 467.770 357.920 866.370 5 Misungwi 58.410 299.860 338.800 697.070 6 Mwanza City 107.13 47.463 775.7 930.293
TOTAL 314.820 1472.732 3294.330 5081.900
Mwanza Region: Investment Profile 2012 Page of 68
15
Salaam as its out/inlet overseas. Significant parts of Uganda, Democratic Republic of Congo (DRC), Rwanda, Burundi, Mwanza Region and other lake regions of Mara and Kagera do imports and exports which are carried by Central railway line.
2.8.3 Air transport Air transport is Tanzania Mainland’s’ third most important means of transport. Mwanza Airport is 881air kms from Dar – es – Salaam. In the year 2000 Mwanza airport on international traffic accounted for 395 aircraft movements involving 2,542 passengers on scheduled services, non-scheduled services involved 522 aircraft movements serving 1631 passengers. The aircraft companies operate in Mwanza airport includes; Air Tanzania Ltd, Precision Air, Fast Jet, Auric Air, Coastal Travel, Kahama Mining and Rwanda Air.
2.8.4 Marine transport Mwanza region is well served by marine transport to Mara and Kagera regions but also to the neighbouring Republics of Uganda and Kenya.. There are 42 ships each with carrying capacity of over 50 tons. There are over 14,000 smaller ships and other vessels including ferries, motorboats, canoes etc with carrying capacity below 50 tons.
2.8.5 Energy and Power Supply Major sources of commercial energy in Mwanza region are petroleum, hydropower and about 90% of population use traditional solid fuels in residential sector. Power cuts are common due to low water levels in the hydro-electric dams since the region still depend on the the power supply from the National Grid. The main energy and power found in Mwanza include:
2.8.6 Hydro Power: All districts in Mwanza are connected to National Grid Power. The major towns and minor towns and settlements where electricity line passes are connected. Although electricity line passes near many communities but the level of connection to the power is minimal due to poverty.
2.8.7 Fuel wood Energy: In year 2002, the regional population was estimated at 2,703,603 (Geita District inclusive) shows that, over 90% of the population depends on fuel wood for domestic cooking. Estimates of wood requirement per capita are put at 2 cubic metres per year, by that year, the Region required 5.4 million cubic metres of round wood to satisfy its demand. This attracts for the need for every household to have its own “Ngitiri” (own forest) otherwise, the present forests will he depleted not more than 20 year to come.
Mwanza Region: Investment Profile 2012 Page of 68
16
2.8.8 Fossil fuels Over 90% of the Region’s households depend on kerosene for lighting. For the case of urban population a significant proportion also depend on kerosene for lighting rather than electricity. Fossil fuels include diesel, oils, and petrol which are used to energize transport, industries and various commercial establishments.
2.8.9 Fuel from Getropha plant This is vegetation grown in Mwanza that have seed which if processed produce diesel/kerosene and possible other types of fuel. The vegetation is not well developed/surveyed in Mwanza region that means people know less about the importance of the plant.
2.8.10 Solar Energy: The energy is limited to some institutions belonging to the religious organizations, government and very few individuals. Solar energy technology is new but not very new to people of Mwanza for the period of 7 years (2004 -2010) as the Ministry of Energy and Minerals in collaboration with the support of International organizations ie, UNDP and GEF (Global Environment Fund) launched a Solar Photovoltaic (Solar PV) project in the region.
2.9 Communications
2.9.1 Telecommunication Tanzania Telecommunication Company Limited (TTCL) is the inland based telephone provider for the Region. In addition there are e-mail services and several cellular telephone services provided by a number of private and semi-private telecommunication companies. These include Vodacom, Airtel, Tigo, and Zantel. There are adequate telephone services in all urban centres in the Region and in some parts of the rural areas.
2.9.2 News and Media There are eleven Radio Stations which can be accessed in Mwanza Region. These are;- TBC1 FM, Radio Free Africa – RFA, Radio Maria, Living Water radio Kwa Neema radio and Radio One. Others include TBC Taifa, KISS FM, and Clouds FM, Capital radio, Afya radio, Mwanza City FM radio, Sengerema radio and East Africa radio. Television stations can be accessed via satellites by using antennas and boosters. Some of the local stations which can be accessed include TBC1, ITV, Star TV, Channel 10, Channel 5 and EATV, depending on the type of the antenna used. Other international world wide stations such as CNN, BBC, CFI, Al Jazeera, and other more may be accessed. Through ICT Inter Network, Mwanza has a Regional website domained as www.mwanza.go.tz
Mwanza Region: Investment Profile 2012 Page of 68
17
2.10 Financial Sector The region has more than 15 banks (2012). They are both local and international Banks. There is a positive trend in lending to SMEs that builds confidence in banking growth potential among financial institutions Furthermore Mwanza region has the branch of Bank of Tanzania (BOT) which ensuring that commercial banks and other financial institutions conduct their business on a sound prudential basis and according to the various laws and regulations in force
2.10.1 Non -Banking Financial Institutions Non-banking financial institutions in the region are FINCA, PRIDE, BLUE FINANCIAL, SELF; WADOKI SACCOS, VICTORIA SACCOS, MWANZA SACCOS, JUMAKI SACCOS, and WAKAKI SACCOS, UZINZA SACCOS and others.These institutions lend and keep money from the customers under certain conditionalities.
2.10.2 Insurance Firms There are now nine major actively operating insurance companies. Seven of them are Reinsurance Companies and 2 Insurance brokers .Most of these insurance companies are based in Mwanza City. However, some of them have established branches at district level or they are operating business with banks, District Councils and individual. These include Bumaco, Jubilee, Lion of Tanzania, Eastern Insurance Co. Ltd, Madila, NIC, Reliance, Talent Brokers and Halima Insurance Company Ltd.
2.10.3 Social Security Funds The region has numbers of social security funds. These funds are desirous of freeing members from hardships arising out of loss of income due to old age, disability, death and other related risks. These funds includes; NSSF, PPF, PSPF, GEPF and LAPF
2.11 Education Sector
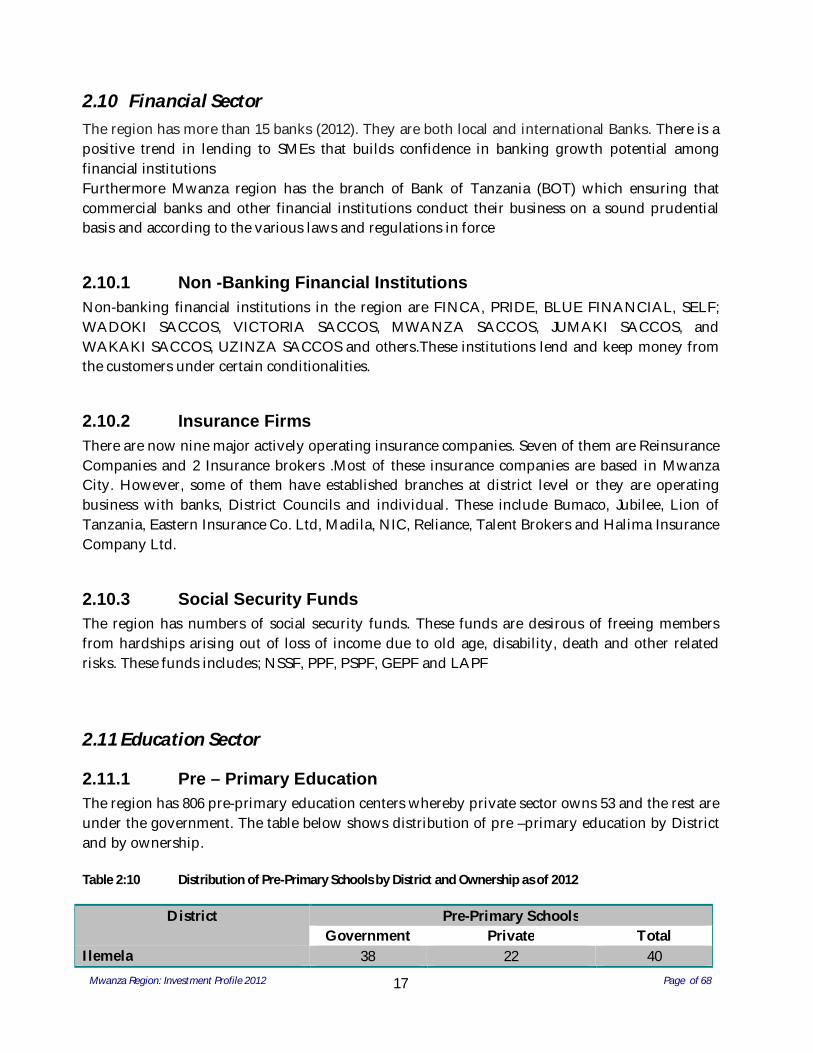
2.11.1 Pre – Primary Education The region has 806 pre-primary education centers whereby private sector owns 53 and the rest are under the government. The table below shows distribution of pre –primary education by District and by ownership. Table 2:10 Distribution of Pre-Primary Schools by District and Ownership as of 2012
District Pre-Primary Schools Government Private Total
Ilemela 38 22 40
Mwanza Region: Investment Profile 2012 Page of 68
18
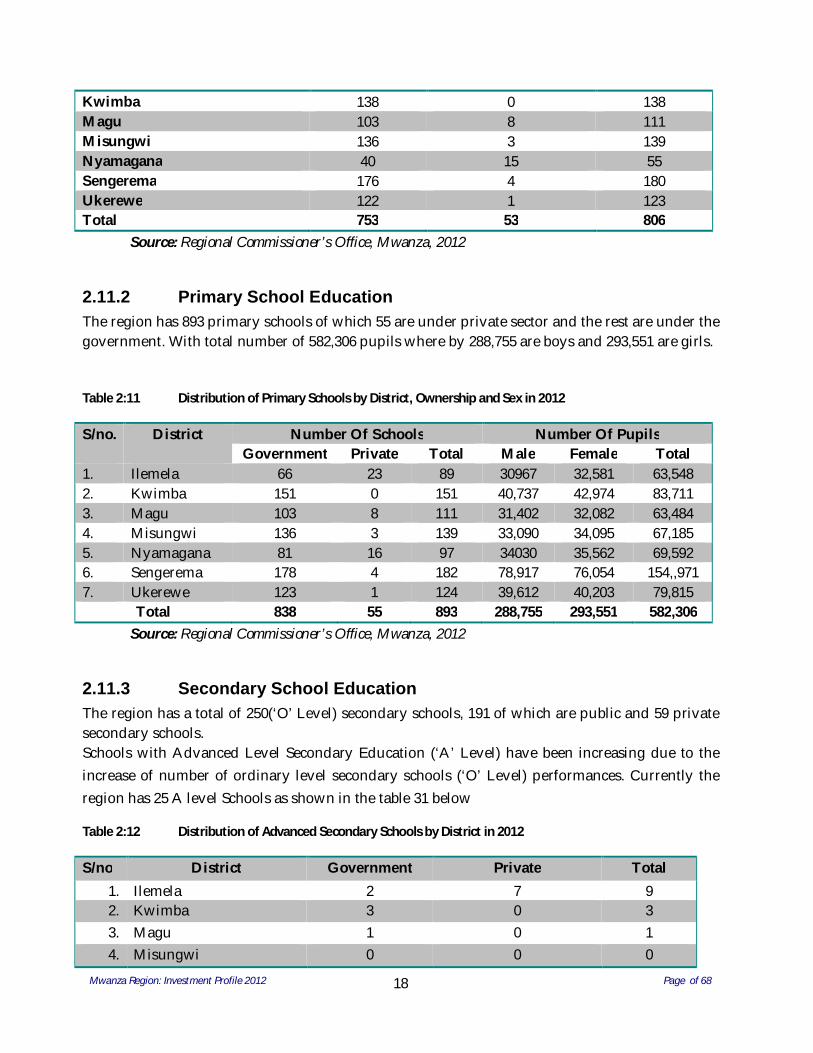
Kwimba 138 0 138 Magu 103 8 111 Misungwi 136 3 139 Nyamagana 40 15 55 Sengerema 176 4 180 Ukerewe 122 1 123 Total 753 53 806
Source: Regional Commissioner’s Office, Mwanza, 2012
2.11.2 Primary School Education The region has 893 primary schools of which 55 are under private sector and the rest are under the government. With total number of 582,306 pupils where by 288,755 are boys and 293,551 are girls. Table 2:11 Distribution of Primary Schools by District, Ownership and Sex in 2012
S/no. District Number Of Schools Number Of Pupils Government Private Total Male Female Total
1. Ilemela 66 23 89 30967 32,581 63,548 2. Kwimba 151 0 151 40,737 42,974 83,711 3. Magu 103 8 111 31,402 32,082 63,484 4. Misungwi 136 3 139 33,090 34,095 67,185 5. Nyamagana 81 16 97 34030 35,562 69,592 6. Sengerema 178 4 182 78,917 76,054 154,,971 7. Ukerewe 123 1 124 39,612 40,203 79,815
Total 838 55 893 288,755 293,551 582,306 Source: Regional Commissioner’s Office, Mwanza, 2012
2.11.3 Secondary School Education The region has a total of 250(‘O’ Level) secondary schools, 191 of which are public and 59 private secondary schools. Schools with Advanced Level Secondary Education (‘A’ Level) have been increasing due to the increase of number of ordinary level secondary schools (‘O’ Level) performances. Currently the region has 25 A level Schools as shown in the table 31 below
Table 2:12 Distribution of Advanced Secondary Schools by District in 2012
S/no District Government Private Total 1. Ilemela 2 7 9 2. Kwimba 3 0 3 3. Magu 1 0 1 4. Misungwi 0 0 0
Mwanza Region: Investment Profile 2012 Page of 68
19
5. Nyamagana 5 4 9 6. Sengerema 1 2 3 7. Ukerewe 0 0 0
Total 12 13 25
2.11.4 Adult Education Various adult educations programes such as Complementary Basic Education Training (COBET), Intregrated Community Based Adult Education (ICBAE) and Open and Distance Learning (ODL) The region has 8,398 students who are persuing such education programes where females are 4354 and 4044 males
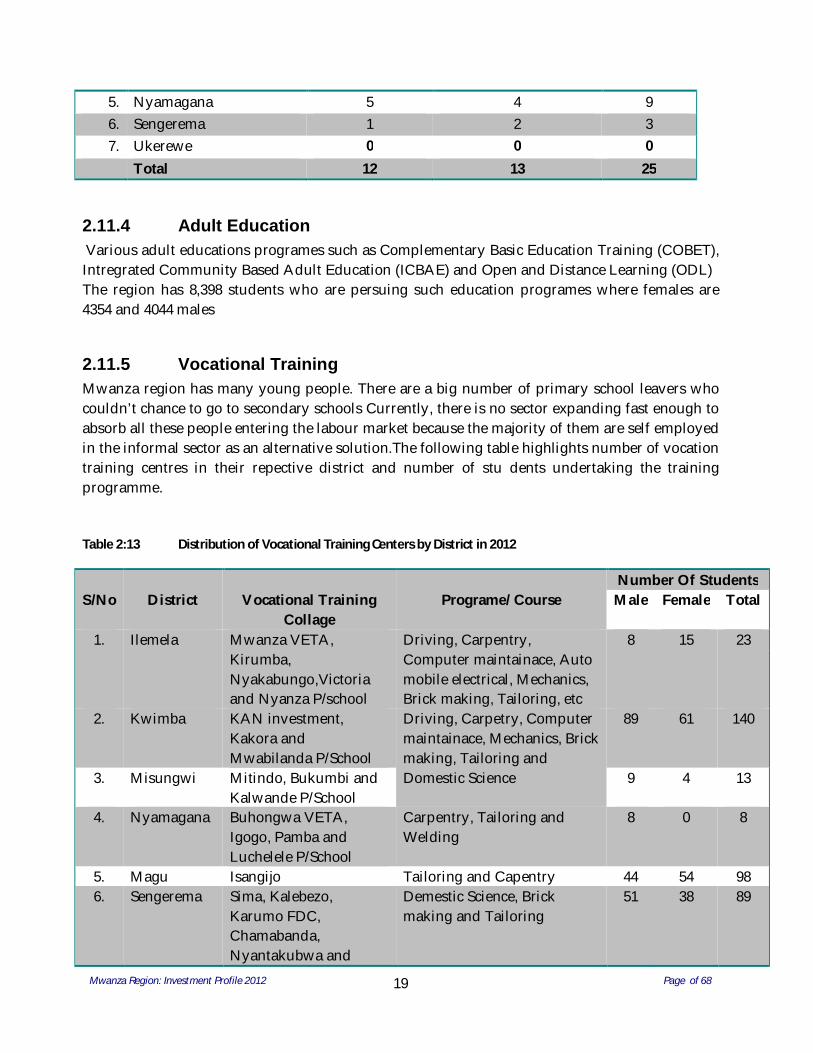
2.11.5 Vocational Training Mwanza region has many young people. There are a big number of primary school leavers who couldn’t chance to go to secondary schools Currently, there is no sector expanding fast enough to absorb all these people entering the labour market because the majority of them are self employed in the informal sector as an alternative solution.The following table highlights number of vocation training centres in their repective district and number of stu dents undertaking the training programme. Table 2:13 Distribution of Vocational Training Centers by District in 2012
S/No
District
Vocational Training
Collage
Programe/ Course
Number Of Students Male Female Total
1. Ilemela Mwanza VETA, Kirumba, Nyakabungo,Victoria and Nyanza P/school
Driving, Carpentry, Computer maintainace, Auto mobile electrical, Mechanics, Brick making, Tailoring, etc
8 15 23
2. Kwimba KAN investment, Kakora and Mwabilanda P/School
Driving, Carpetry, Computer maintainace, Mechanics, Brick making, Tailoring and Domestic Science
89 61 140
3. Misungwi Mitindo, Bukumbi and Kalwande P/School
9 4 13
4. Nyamagana Buhongwa VETA, Igogo, Pamba and Luchelele P/School
Carpentry, Tailoring and Welding
8 0 8
5. Magu Isangijo Tailoring and Capentry 44 54 98 6. Sengerema Sima, Kalebezo,
Karumo FDC, Chamabanda, Nyantakubwa and
Demestic Science, Brick making and Tailoring
51 38 89
Mwanza Region: Investment Profile 2012 Page of 68
20
Sengerema FDC 7. Ukerewe Bukongo and Kitangaza Tailoring and Domestic
Science 17 13 30
Total 226 105 401 Source: Regional Commissioner’s Office, Mwanza, 2012
2.12 Health Infrastructure The current status on medical facilities is reflected by which lists a total of 299 dispensaries, out of which 228 are owned by government. Of the 37 health centers nine are private. Among the 14 hospitals 6 are owned by the Government. The dispensary is the first health post in the district health referral system. It is headed by a Rural Medical Aid (an assistant clinical officer) and when working well can handle 90% of the problems requiring medical help in the community it covers. The region has 3 universities namely St. Augustine University of Tanzania (SAUT), Bugando Medical College and Open University of Tanzania. The region has 4 teacher’s colleges, 2 registered vocational training colleges and 8 Folk Development College that comprises of 17 colleges in the region; the table below shows distributions of colleges and universities by district.
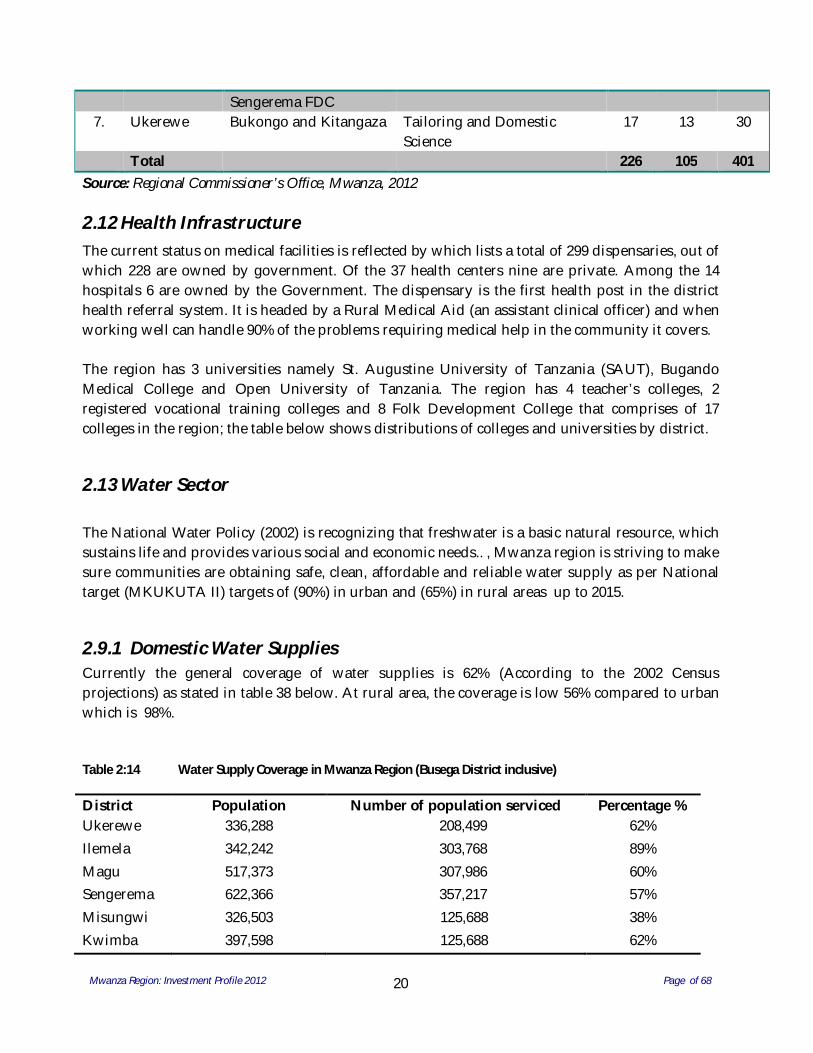
2.13 Water Sector The National Water Policy (2002) is recognizing that freshwater is a basic natural resource, which sustains life and provides various social and economic needs.. , Mwanza region is striving to make sure communities are obtaining safe, clean, affordable and reliable water supply as per National target (MKUKUTA II) targets of (90%) in urban and (65%) in rural areas up to 2015.
2.9.1 Domestic Water Supplies Currently the general coverage of water supplies is 62% (According to the 2002 Census projections) as stated in table 38 below. At rural area, the coverage is low 56% compared to urban which is 98%. Table 2:14 Water Supply Coverage in Mwanza Region (Busega District inclusive)
District Population Number of population serviced Percentage % Ukerewe 336,288 208,499 62% Ilemela 342,242 303,768 89% Magu 517,373 307,986 60% Sengerema 622,366 357,217 57% Misungwi 326,503 125,688 38% Kwimba 397,598 125,688 62%
Mwanza Region: Investment Profile 2012 Page of 68
21
Nyamagana 275,122 243,873 89% Total 2,817,492 1,746,363 62%
Source: Region Commissioner’s Office, 2012
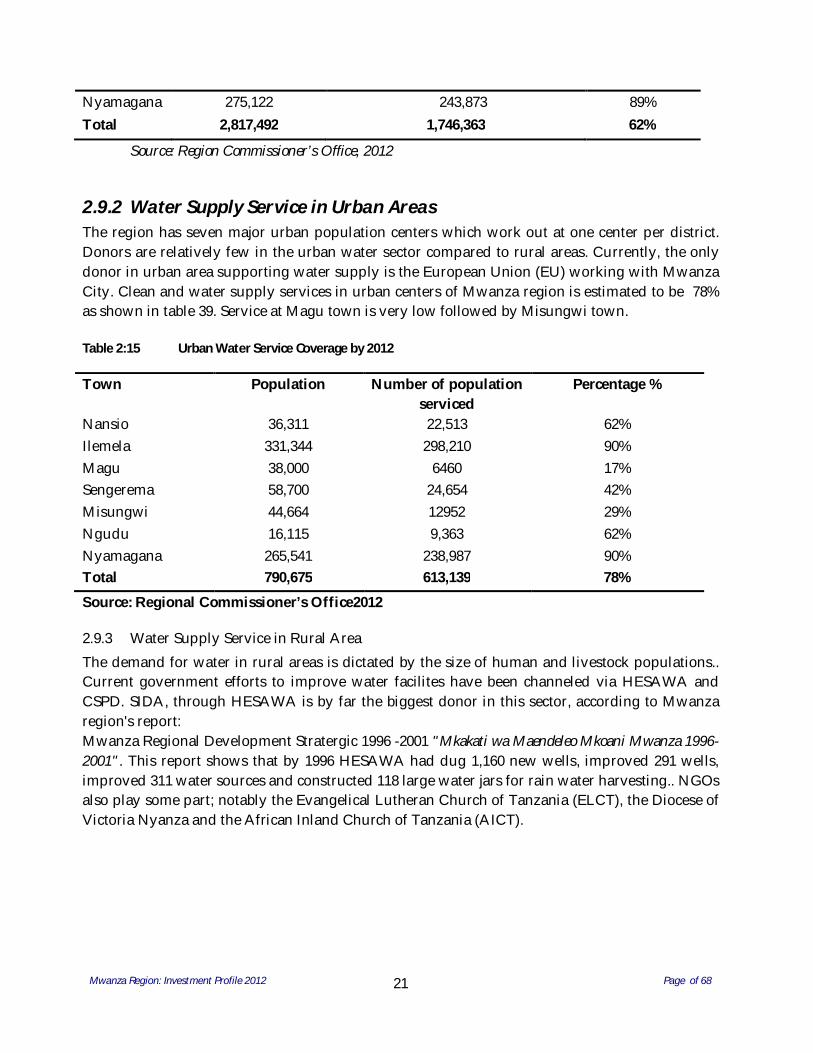
2.9.2 Water Supply Service in Urban Areas The region has seven major urban population centers which work out at one center per district. Donors are relatively few in the urban water sector compared to rural areas. Currently, the only donor in urban area supporting water supply is the European Union (EU) working with Mwanza City. Clean and water supply services in urban centers of Mwanza region is estimated to be 78% as shown in table 39. Service at Magu town is very low followed by Misungwi town. Table 2:15 Urban Water Service Coverage by 2012
Town Population Number of population serviced
Percentage %
Nansio 36,311 22,513 62% Ilemela 331,344 298,210 90% Magu 38,000 6460 17% Sengerema 58,700 24,654 42% Misungwi 44,664 12952 29% Ngudu 16,115 9,363 62% Nyamagana 265,541 238,987 90% Total 790,675 613,139 78%
Source: Regional Commissioner’s Office2012
2.9.3 Water Supply Service in Rural Area The demand for water in rural areas is dictated by the size of human and livestock populations.. Current government efforts to improve water facilites have been channeled via HESAWA and CSPD. SIDA, through HESAWA is by far the biggest donor in this sector, according to Mwanza region's report: Mwanza Regional Development Stratergic 1996 -2001 "Mkakati wa Maendeleo Mkoani Mwanza 1996- 2001". This report shows that by 1996 HESAWA had dug 1,160 new wells, improved 291 wells, improved 311 water sources and constructed 118 large water jars for rain water harvesting.. NGOs also play some part; notably the Evangelical Lutheran Church of Tanzania (ELCT), the Diocese of Victoria Nyanza and the African Inland Church of Tanzania (AICT).
Mwanza Region: Investment Profile 2012 Page of 68
22
3 INVESTMENT OPPORTUNITIES Introduction
Investment opportunities in Mwanza and the surrounding regions are mainly to be found in agriculture and agro-processing (in particular processing cotton), mining, fishing and tourism. These are described in the following sections. There are opportunities in some other fields such as transportation , and other light manufacturing. It is important to note that any specific opportunities described below are meant to be illustrative. There may be other opportunities for investment as well.
3.1 Agriculture and Livestock Development The agriculture sector, as a whole in Tanzania has an annual growth rate of 6% and accounts for nearly half the GDP contribution, 70% of the rural household income, and absorbs 80% of the entire workforce. (TIC Investment Profile 2013-14). Suffice it to say that agriculture is the main investment opportunity in Mwanza region. The Government has introduced a specialist agricultural revolution initiative namely Kilimo Kwanza which has opened up infinite investment opportunities for interested parties.
Additionally, several reforms have been undertaken in this sector such as a review of land laws to allow for long term leases for foreign companies and redefining the role of government and private sector that allow for the latter to participate in production, processing, and public support functions. Mwanza has enormous water resources potential; with 53.25% of its area being lake Victoria. Water for irrigation can be obtained from the lake and from the river basins that feed into the lake.
Potential land under irrigation in Mwanza is approximately 39411 hectares of which only 1,429 (3.93%) hectares are under irrigation farming at presenta. This provides for high agricultural investment opportunities such as importing modern and efficient farming equipment, providing training on modern farming techniques eg. appropriate use of irrigation technology, and initiation of modernized irrigation farming projects.
Reasons for investment
The presence of an investment profile that highlights opportunities in Mwanza. Market opportunity: with a rapidly growing population and rising incomes, the market
for agricultural produce in Tanzania is estimated at 6% p.a.
a Source: Regional Commissioner’s office 2012
Mwanza Region: Investment Profile 2012 Page of 68
23
Mwanza’s competitive advantage - it lies in ideal soils for cotton production horticulture, ample rainfall and water for irrigation, and a large and inexpensive labour force.
Specific areas
3.1.1 Irrigation Farming Investments opportunities lie in introducing irrigation schemes as there is plenty of water from the lake and from ponds along the available numerous river valleys in the Region. As mentioned earlier only 3.93% of the total irrigable land is presently being utilized. In Mwanza, about 94 Ha is available for irrigation farming for small scale farming. These unimproved irrigations schemes are in Kwimba District Council at Kimiza and Mahiga. With suitable weather conditions -bimodal rainfall (Between 700-1200mm) per year and temperatures between 25o – 28oC, an ample opportunity is provided for agricultural production. Further, the Mwanza enjoys the Lake Victoria and Simiyu River water bodies’ hence agricultural production can be carried throughout the year.
3.1.2 Horticulture The horticultural industry is the fastest growing industry in Tanzania within the agricultural sector recording an annual average growth of 9-12 percent. Contribution of the investments in horticultural businesses to total agricultural investments has averaged 17 percent since 2007b. A number of investors are already engaged in the production and marketing of horticultural crops mainly for export markets. These crops include vegetables and flowers such as roses and fruits such as avocados, Mangoes, pineapples and berries
In Mwanza, about 140,000 Ha along Lake Victoria (in Nyamagana, Ilemela, Kwimba, Magu, Sengerema, Ukerewe and Misungwi.) is suitable for horticultural crop production particularly through Green house farming for vegetables such as tomatoes, onion, carrot, cabbages, green and chillies.
b( TIC investment profile 2013-14)
Mwanza Region: Investment Profile 2012 Page of 68
24
3.2 Livestock Production Tanzania’s livestock population has been increasing by 5% per anum. Its 21.3 million large herd of cattle makes it the largest in southern Africa. However, on the downside, 97% of all animals are kept by smallholders who are often faced with poor productivity and yield. Mwanza region has the highest livestock density in the country and the third largest total herd of all regions. The increased meat production for intra and inter-regional consumption, hides and skins for domestic and export must have high priority. Mwanza Region is endowed with good quality pasture land (287,319Ha) with a livestock population distributed vis 1.3 million cattle, 500,000 goats, and 150,000 sheep. This presents an excellent opportunity for the establishment of Commercial Ranches and Livestock Multiplication Units (LMU). Specifically in Mabuku (62 Km from Mwanza City) in Misungwi District, there is about 10,000 Ha of land with a cattle capacity of 6,000 livestock.
3.2.1 Meat Processing Mwanza is strategically located in the zone to house a modern meat processing plant. The entire zone is endowed with large number of livestock and a centrally place meat processing plant will definitely provide leverage to all other regions. In addition, a modern abattoir would be a timely investment through public-private partnership initiative. Mwanza Region alone enjoys a livestock population of 1.3 million cattle, 500,000 goats, and 150,000 sheep. Target districts for locating these investments include: Nyamagana and Ilemela District Kwimba and Sengerema Districts
3.3 Natural Resources The natural resources sector in Tanzania comprises of forestry and beekeeping, wildlife and fisheries. The whole country has vast untapped natural resources that provide avenues for investment in factories, industries and training. The terrestrial area is the grassland savannah rich in wildlife and equatorial rainforests, miombo woodlands and plateaus with amazing scenery. Similar to other sectors, private investments are highly encouraged in the natural resources sector. Some of the opportunities available in mwanza region are outlined hereafter.
Mwanza Region: Investment Profile 2012 Page of 68
25
3.3.1 Fishing Tanzania is one of the largest fishing nations in Africa. According to FAO; it is ranked in the top ten countries in terms of total capture fisheries production. Inland production is from water bodies which Lake Victoria is the largest with Tanzania’s territorial claim being 51% with substantial fish resources of 381,162c metric tons per year from Lake Victoria. Investment areas include supply of refrigerated trucks and cold storage facilities & estblishment of manufacturing of inputs like fishing craft and gears in Ukerewe, Sengerema, Misungwi, Nyamagana, Ilemela and Magu District. Some other areas of investment are in the field of value addition such as processing, canning and packaging for export. As at December 2011, there were 9 fish processing plants operating around Lake Victoria on the Tanzanian side of the lake. These plants fillet nile perch mainly for export and producing a variety of by products like skins, maws, chips and frames. Most of these are semi-processed through drying, and smoking. Investment opportunities exist in the purchase of semi-processed fish products, and further processing them to produce various value-added products like such as fish meal, cakes for domestic and export marketsd
3.3.2 Mining and Energy Sector The mining sector in Tanzania is extremely important as it accounts for a significant share of the country’s export revenues. The governments plan is to have this sector contribute 10% of GDP by 2025. The main mineral mined in Mwanza are gold and diamond in Misungwi district and construction materials. Opportunities exist in establishing refinery industries for mineral processing and hiring/selling equipments for large and small scale miners.
In the energy sector, investment opportunities lie in consultancies, power infrastructure reconstructions and rehabilitations, materials and technologies supply and financing. More efforts in investment are need to in this sector to reduce the defforestation done by human activities for the sake of getting power. In the energy sector, opportunities exist consultancies for alternative sources of energy such as solar, wind energy and harnessing coal energy.
dTIC investment profile 2013-14
Mwanza Region: Investment Profile 2012 Page of 68
26
3.4 Tourism Tanzania is a well known tourist destination in East Africa. The most visited attractions are the Serengeti plains, the Ngorongoro crater, Mount Kilimanjaro, and Zanzibar Island. But these are a small portion of what the country has to offer. Being a region with a promising future for tourism and business, Mwanza offers enormous investment opportunities with abundant unique natural features.The exploitation of Lake Victoria as a tourist attraction is possible so long as the necessary tourism infrastructure is in place including a good, all weather road network of up to tarmac standard.
Mwanza is one of the unique destinations on the Tanzania that has yet been discovered by many. It is a land of much wonder holding an unparalleled diversity of Fauna, Flora and many natural features. The wonders of rocks, the scenery, topography and very friendly people harbour the growth of excellent cultural tourism beach holidays, game hunting, infrastructure ventures, historical and archaeological ventures- and certainly the best wildlife photographic safaris on the continent. The tourism industry (if at all is properly managed provides excellent investment opportunities in construction and management of hotels. Lodges and restaurants, infrastructure ventures aviation projects, training institutions, tour operations, travel agencies and marketing organization.
According to the national industry’s mission statement that forms the basis of the tourism policy is to develop sustainable quality tourism that is ecologically friendly to the conservation and restoration of the environment and its people’s culture. In so doing the industry seeks to maximize the net gains that emanate from the various tourism activities. It is for this reason that the government is now highly concerned with the improvement of the infrastructure quality and diversity, ease of destination entry formalities, relaxation of foreign exchange regulations and controls, revision of applicable taxes and maintenance of peace, stability and security. As a stimulant, the private sector is increasingly investing in the various tourist plants, improvement of destination access from major sources and within marketing promotion and training of the human resource.
Reasons for investment
A variety of opportunities for high value investment Strategic location with easy access to neighbouring countries like Kenya,
Uganda, Rwanda, Burundi makes it ideal for inclusion in package tours Lake Victoria and numerous other tourist attractions including: The Bujora
Museum is where Sukuma cultural history is The historical museums in the
Mwanza Region: Investment Profile 2012 Page of 68
27
Region such as Sanane project in Western port of Mwanza City at Nyamagana. game reserves such as Sanane Island that covers 95 hectares and is uniquely located within Lake Victoria
Specific areas
Provision of accommodation and tourist services: presently the hotel industry in Mwanza is quite undeveloped. Hotels of tourist calibre are still absent. Presently Tilapia hotel seems to attract many foreigners, Mwanza Hotel is mainly used by government officials and other local businessmen. Hotel Tilapia has 40 rooms while Mwanza Hotel has 50 rooms. Occupancy rate is between70% to 90% daily. Other areas of investment include: Man-made tourist attractions like amusement parks and gambling resorts; Conference tourism; Beach development, and lake cruises; Hospitality colleges; Hotels and specialized cuisine restaurants; Tented camps and lodges; Sports tourism; Shopping malls; and Tour Operators and Transport.
3.5 Transport and Infrastructure There has been sustained effort by the Tanzanian government to create essential transport infrastructure and services to improve overall accessibility in the country and attract foreign direct investment.
Specific areas
Water Transportation offers excellent opportunities to invest in Mwanza. For instance, construction and provision of water transport services to the region lies untapped. Similarly supply and operation of luxury marine fast ferries are awaiting investors. Other specific areas include: expansion of the Mwanza City Port and providing ships docking facility, build a car freight station and freight village which will help consolidate cargo handling activities in the port; and construct warehouses security and logistics among others.
Road Transport also offers excellent public-private partnership model of investment. Further, the establishment of the East African Community makes for special opportunities in the transport industry including: The development of a ring road highway around Lake Victoria within Mwanza; the development of a highway from the lake regions to Dar es Salaam via Shinyanga, Tabora and Singida; road rehabilitation and construction in rural areas are required. The upgrading of district and feeder roads to open up key areas with agricultural potential is very strategic.
Mwanza Region: Investment Profile 2012 Page of 68
28
As for Air Transport, investment opportunities lie in air charter and commercial air services. Other opportunities are catering, supply of equipment, security, construction of cold storage facilities at the airport, establishment of business centre, duty free shops, aircraft maintenance hangar, Hangar and warehouse complex and exhibition centre.
3.6 Trade and Manufacturing The sector has shown steady growth over the years, registering an annual growt of 4% and a small contribution to GDP (8% ). The sector is third in FDI contribution after agriculture and tourism. Present activities include manufacturing of simple consumer goods like food, bevarages, textiles and wood products. Mwanza Region in particular is rich in supply of quality raw materials and it is fast growing manufacturing base provide existing opportunities for companies look to invest and add value to varieties of mining, fishing, agricultural and livestock products. Great opportunities exist in the establishment of industries such as Chemical Industries, Food and Beverage Products; Textile, Clothing and Leather Products and Metal and Non – Metallic Products. Reasons for investment
Infancy of the sector provides ample opportunities for industry establishment Availability of an inexpensive labour force The presence of government impetus towards development of the
manufacturing sector ensures smooth setting of operations Presence of Export Processing Zones : Mwanza is one of the initial areas that
have been scanned for the implementation of the programme, due to its strategic location, industrial supportive infrastructure, peace and security, human resource and industrial skill and availability of plots.
3.7 Other Investment Areas
3.7.1 Health services Investment opportunities lie in building new and modern hospitals, health centers and dispensaries. Likewise, there will be opportunities in construction of pharmaceutical industries, intravenous infusion, medical oxygen plants and hospital equipments. Modern hospital management and establishment of health insurance investment. Opportunities in establishing Hi-Tech hospital which could serve as medical tourist centre.
Mwanza Region: Investment Profile 2012 Page of 68
29
3.7.2 Solid and Liquid Waste Management Investment opportunities in solid and liquid waste management facilities are plenty since there is only one facility in operation as at now.
3.8 Education sector Many opportunities still exist for establishing education and training institutions as well as related academies. The region encourages private sectors to set up specialised schools of excellence in Management, Science and Technology, Finance, Marketing and Tourism etc.
3.9 Financial services Investment opportunities remain unlimited in establishing commercial banks and other financial institutions. The region has strong potential for banks and other financial institutions to undertake additional activities such as investment consultations, asset valuation, sales and insurance, loans to identified groups in the rural area such as SACCOS, VICOBA etc.
3.10 Real estate Investment opportunities in office and residential accommodation are abundant.
3.11 Land banks There is no specific land area earmarked and surveyed ready for investment (Land Park) but the region has pointed out some of the area which are suitable for investments owned by indigenous, if someone/ Investors impressed with the area s/he can communicate with land owners .
30
4 MANAGEMENT AND FACILITATION
4.1 Investment Policy and Legislation The following policies and legislation aim to contribute to a better investment environment in Tanzania, including Mwanza Region:
National Investment Policy – Is a Government statement setting out favorable conditions to investors, the investment policy objectives and strategies and issues needed in promoting and retaining investment in the Country:
Tanzania Investment Act – Gives powers to T.I.C to coordinate, promote and facilitate investment in Tanzania together with advising the Government on investment policy and related matters,
Business Environment Strengthening for Tanzania (BEST) – A multi donor funded programme aimed at working with the Government and other stakeholders in business to eliminate hurdles to undertaking business and investment in Tanzania so as to contribute towards poverty alleviation efforts,
National Policies – Relevant Sector Policies are in place to guide interventions in the relevant areas. National Forest Policy (1998), Bee keeping Policy (1998), Small and Medium Enterprises Development Policy (2003), National Land Policy (1995), Land Act (1999), Village Land Act (1999) and Mining Act (1998) are relevant to develop the District Investment Profile (DIP),
Small and Medium Enterprises (SMEs) Development Policy – Encourages investments in small and medium enterprises, which could be rural to contribute to poverty alleviation efforts. Mwanza Region has a greater potential to promote the development of such SMEs,
Agricultural and Livestock Policy – Is geared towards poverty alleviation and aims at attaining, among other things, increased standards of living in rural areas, increased foreign exchange earnings and increased production capability among people in the sector,
Mining Policy, Mining Act (1998) and Guidelines – Outlines how mining could improve the economy and the conditions of the rural population and it encourages participation in mining activities to all entrepreneurs with capital. Small scale mining activities are also considered.
Tanzania Government with its Investment Incentive Strategies, in year 2003/2004 reduced a number of taxes that were an obstacle to investment. Consequently, the Region through its
31
District Council also is in the process to implement the following way forward so as to attract and facilitate investment by:
Improve the infrastructure in the investment areas; Review existing District Council by-laws; Reduce the number of days from 180 to 30 to consider and grant an application from
investors for land; Improve the attitude of the staff at Secretariat and Districts level towards a more
positive outlook in dealing withi investors; Observe good governance practices in handling investor’s issues including being in line
with the poverty reduction strategy Maintain peace and security within Districts by establishing dispute resolving
mechanisms at all levels (land dispute tribunal)
4.2 Land Matters and land Disputes The region has a strategy of preparation Land Use Planning which will enable the village councils to prepare village land use plans. These plans will enable individuals including investors to acquire more easily their land title. The Land Act no.5 of 1999 provides for procedures for the resolution of land disputes and rights of appeal at the village level. More specifically, section 60 is about the formulation of the village lands tribunal, section 61 stipulates the responsibilities of the village lands tribunal as a conflict resolution body, and section 62 gives a right for appeal to the following agencies and courts:
Village land tribunal Ward land tribunal District Lands and Housing Tribunal The High Court of Tanzania-Section responsible for Land Matters. The Appeal Court of Tanzania
4.3 Availability of TIC Zonal Office
Availability of TIC zone office has put in place a regulatory framework to deal with the promotion and facilitation of investment. TIC in Mwanza operates as a ‘one stop centre’ for all local and foreign investors so as to expedite facilitation of investment in all sectors. TIC currently has registered number of projects, has facilitated new projects and the expansion and rehabilitation numbers of projects in the region. These projects has provided employment opportunities and TIC has created good invironment for local, foreign and by either joint venturing with local investors
32
4.4 Government Administration Tanzania today is a land of countless business opportunities. Over the past two decades, it has been transformed from a centrally planned economy to a market oriented system through successful implementation of legal, regulatory and institutional reforms. Mwanza as one of the region in Tanzania encourage private sector through advocacy and campaign eg, coordinating Investors forum, publications of opportunities found in identified areas into the Regional Secretariet website, publications of bronchures and advertisement through investment profile.
4.4.1 Regional Secretariat The Regional Secretariat’s major role is to facilitate development of Local Government Authorities in realization of goals and targets in relation to community welfare and national development through ensuring peace and tranquility, providing technical advice and capacity building.
4.4.2 Local Government Authority In Mwanza region all councils follows recommendations of the Local Government Reform Programme, they have put in place suggestion boxes at all public offices for democratic expression of their views and discontent with services provided. Council also obliged to mainstream stakeholders plan and budget in the Annual District Development Plan and Budget (ADDPB).
33
5 ANNEXES
Annex 5.1 Tax Structure and Administration
Annex 5.2 Priorities and Restrictions
Annex 5.3 Dispute Settlement
Annex 5.4 Land Use Policy
Annex 5.5 Foreign exchange and performance requirements
Annex 5.6 Incorporation and Exit
Annex 5.7 Contacts for Further Information
34
Annex 5.1 Tax Structure and Administration Tanzania has a stable and predictable fiscal regime, providing a soft landing to all investors. It recognizes that investors need to recover their investment costs first before paying corporate tax. The administration of various tax laws is entrusted to the Tanzania Revenue Authority (TRA), a semi autonomous government agency created by Act No.11 of Parliament in 1995. It is responsible for Central Government taxes and several non–tax revenues. Revenue departments under TRA include;
(a) Domestic Revenue Department, (b) Customs and Excise Department, (c) Large Taxpayer Department, and (d) Tax Investigations Department
5.1.1 Registration with Domestic Revenue; The registration which can be undertaken by TIC on behalf of the investor requires the following documents;
(i) Memorandum and Articles of Association, (ii) Certificate of Registration or Certificate of Incorporation, (iii) Investment Feasibility Study, (iv) Certificate of Incentives in the case of projects approved by TIC, (v) Partnership Agreement (deed), in the case of a partnership, (vi) Lease Agreement, and (vii) Photographs of directors. Forms to be filled include (i) Business Inquiry
Forms (ii) IT 21 forms for companies (iii) IT 20 forms for individuals, and (iv) TIN form.
Taxes under the domestic revenue department include: -
1. Corporate tax (30% for both resident and non resident); 2. Withholding tax (for dividend payments, pension, insurance premium, royalties,
transport and disposal of assets); 3. Income tax rates for individuals (the marginal rate ranges from 18.5% to 30%); 4. Income tax rate for non-resident individuals (a flat rate of 20% applies); 5. Taxable value of employment benefits (generally all benefits are taxable); 6. Capital gains tax (the gain/loss upon sale realization is included in business income and Taxed at the general rate); 7. Skills and development levy (6% of the gross emoluments paid to employees); 8. Gaming tax (as prescribed in the Pools and Lotteries Act, 1967)
35
When a loss is incurred, such a loss is an allowable deduction in ascertaining the total income of that person; thus a loss is carried forward indefinitely. A number of capital deductions are entitled under the Income Tax Act 2004, including wear and tear granted to a person who owns machinery. The law allows a 50% allowance in the first year of use for plant and machinery used in manufacturing processes and fixed in a factory, fish farming, and providing services to tourists and fixed in a hotel. Thereafter, different wear and tear rates apply.
5.1.2 Value Added Tax (VAT) VAT is consumption tax charged at a single rate of 18%. Registration is compulsory for any business, which has a turnover of more than 40mn TZS per anum. Applicants for VAT registration should complete form No. VAT 101. A taxpayer is required to submit a monthly VAT return along with the payments to the nearest regional VAT office by the last working day of the month following the month of business.
5.1.3 VAT Deferment: Capital goods and deemed capital goods for investment do not attract VAT up front as the VAT is deferred to allow investor relief of tax up front. VAT deferment on any capital goods is open to all VAT registered and non-registered traders.
5.1.4 VAT Refunds: VAT refunds are made either within 30 days or 6 months from the due date depending on the type of taxpayer. Regular repayment traders like exporters can claim their refunds within 30 days while other traders can get their refunds after six (6) months. There are various goods and services that are either zero rated, such as exports or VAT exemption, such as health supplies and tourists services. The TRA desk at TIC will provide the list of goods and services falling under these categories as well as those with special relief.
5.1.5 Taxes on profits and income Corporate taxes
The tax rate on both resident and non-resident corporations is 30%. However, a non-resident corporation is also required to pay an additional 10% on its repatriated profits. (A company is resident in Tanzania it is incorporated in Tanzania, or its management and control was exercised in Tanzania during the year of income, or it has a permanent domestic establishment in Tanzania. A non-resident company is taxed in Tanzania to the extent that the income has been sourced in the United republic of Tanzania). Newly listed companies, enjoy a reduced rate of 25% for the first three years, provided that at least 30% of their shares are publicly issued. An alternative minimum tax of 0.3% is charged on
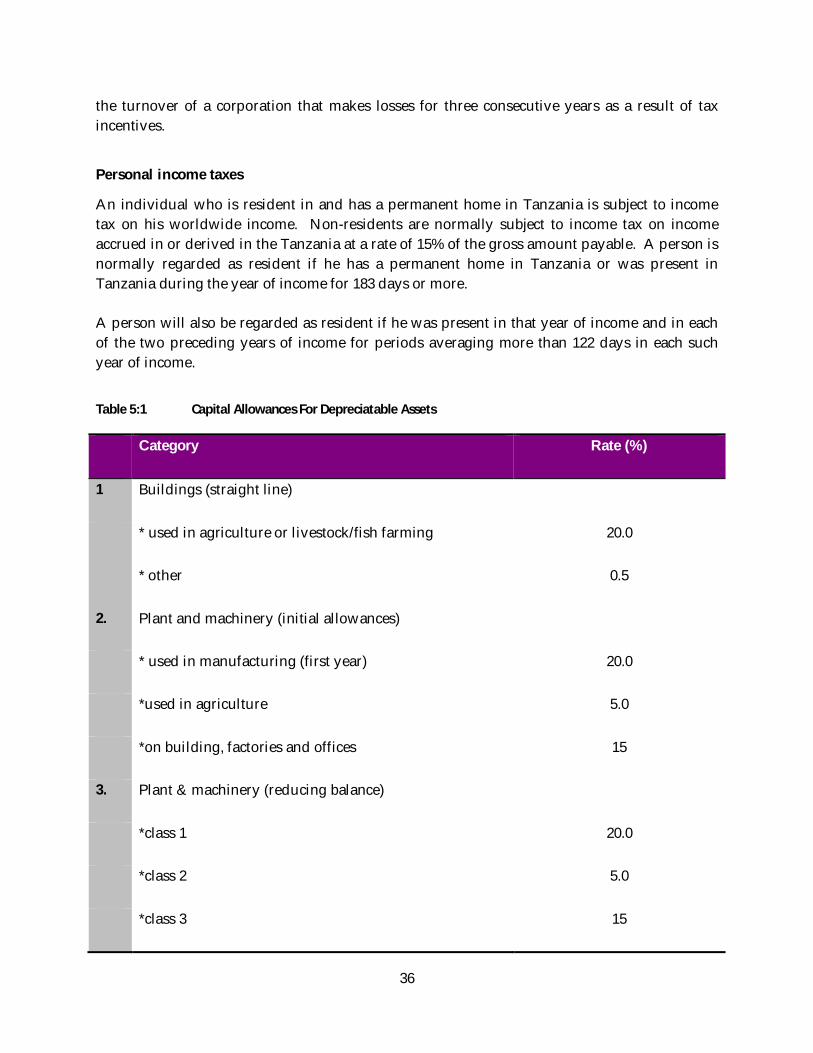
36
the turnover of a corporation that makes losses for three consecutive years as a result of tax incentives.
Personal income taxes
An individual who is resident in and has a permanent home in Tanzania is subject to income tax on his worldwide income. Non-residents are normally subject to income tax on income accrued in or derived in the Tanzania at a rate of 15% of the gross amount payable. A person is normally regarded as resident if he has a permanent home in Tanzania or was present in Tanzania during the year of income for 183 days or more. A person will also be regarded as resident if he was present in that year of income and in each of the two preceding years of income for periods averaging more than 122 days in each such year of income.
Table 5:1 Capital Allowances For Depreciatable Assets
Category Rate (%)
1 Buildings (straight line)
* used in agriculture or livestock/fish farming 20.0
* other 0.5
2. Plant and machinery (initial allowances)
* used in manufacturing (first year) 20.0
*used in agriculture 5.0
*on building, factories and offices 15
3. Plant & machinery (reducing balance)
*class 1 20.0
*class 2 5.0
*class 3 15
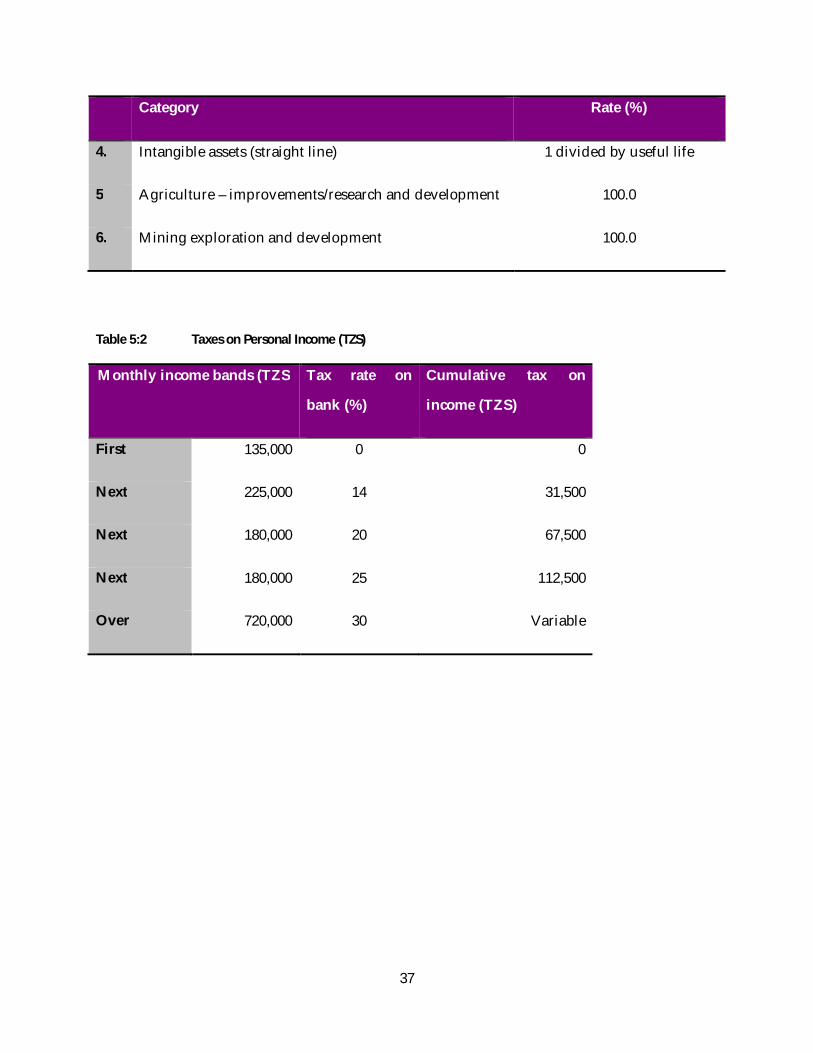
37
Category Rate (%)
4. Intangible assets (straight line) 1 divided by useful life
5 Agriculture – improvements/research and development 100.0
6. Mining exploration and development 100.0
Table 5:2 Taxes on Personal Income (TZS)
Monthly income bands (TZS Tax rate on
bank (%)
Cumulative tax on
income (TZS)
First 135,000 0 0
Next 225,000 14 31,500
Next 180,000 20 67,500
Next 180,000 25 112,500
Over 720,000 30 Variable
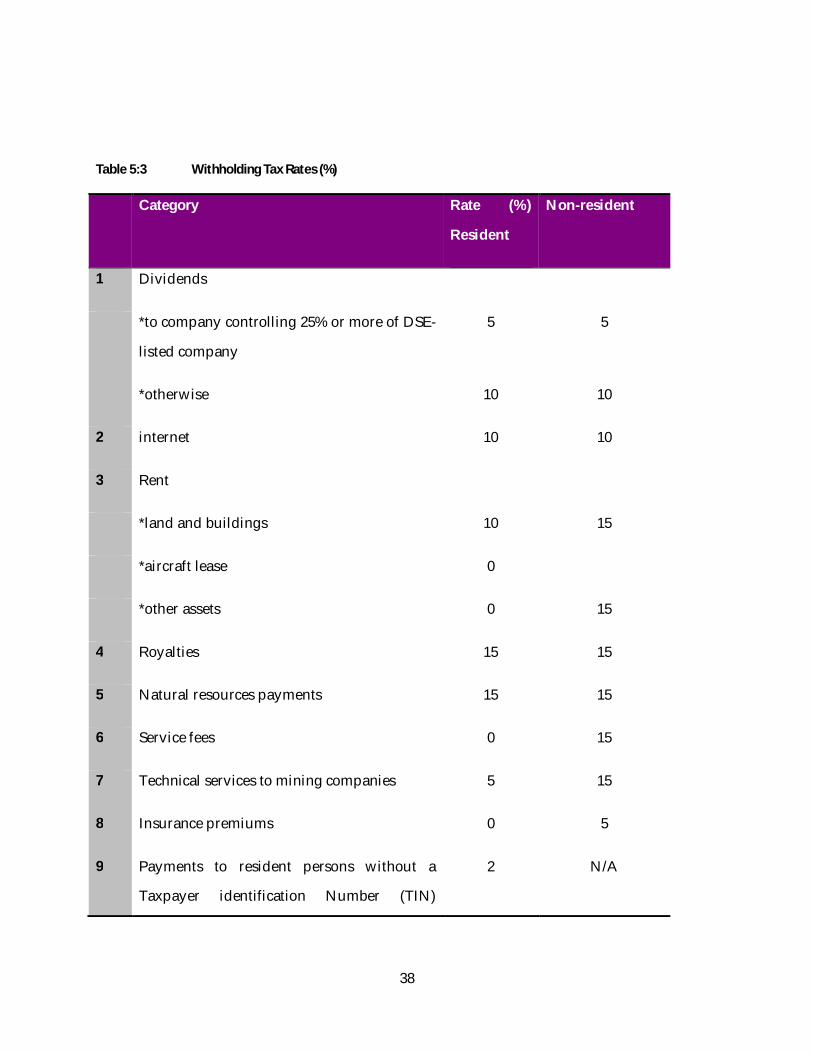
38
Table 5:3 Withholding Tax Rates (%)
Category Rate (%)
Resident
Non-resident
1 Dividends
*to company controlling 25% or more of DSE-
listed company
5 5
*otherwise 10 10
2 internet 10 10
3 Rent
*land and buildings 10 15
*aircraft lease 0
*other assets 0 15
4 Royalties 15 15
5 Natural resources payments 15 15
6 Service fees 0 15
7 Technical services to mining companies 5 15
8 Insurance premiums 0 5
9 Payments to resident persons without a
Taxpayer identification Number (TIN)
2 N/A
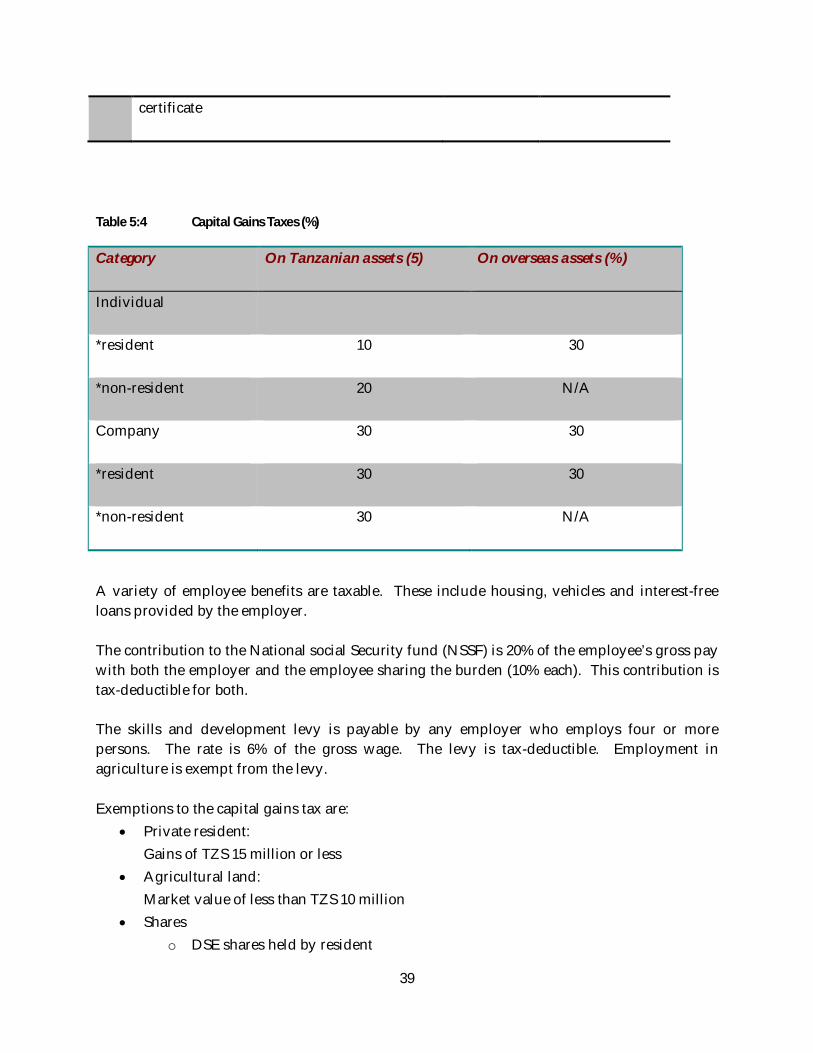
39
Table 5:4 Capital Gains Taxes (%)
Category On Tanzanian assets (5) On overseas assets (%)
Individual
*resident 10 30
*non-resident 20 N/A
Company 30 30
*resident 30 30
*non-resident 30 N/A
A variety of employee benefits are taxable. These include housing, vehicles and interest-free loans provided by the employer. The contribution to the National social Security fund (NSSF) is 20% of the employee’s gross pay with both the employer and the employee sharing the burden (10% each). This contribution is tax-deductible for both. The skills and development levy is payable by any employer who employs four or more persons. The rate is 6% of the gross wage. The levy is tax-deductible. Employment in agriculture is exempt from the levy. Exemptions to the capital gains tax are:
Private resident: Gains of TZS 15 million or less
Agricultural land: Market value of less than TZS 10 million
Shares o DSE shares held by resident
certificate
40
o Shares held by non-resident with shareholding of less than 25% o Units in a approved collective investment scheme o Shares in a resident company held by another resident company with a
shareholding of 25% or more.
Foreign tax relief On double taxation treaties, see Chapter II.3. Incentives, special zones and related matters. Taxes on goods and services Value-added tax (VAT) VAT is charged at the rate of 18% on the supply of goods and services. Whether imported or domestically produced. Certain supplies such as insurance, education financial services and tourist services are exempt from VAT, while supplies of human and veterinary medicine are zero-rated. The registration there hold is gross turnover of TZS 40 million per annum. A separate application can be made to the Commissioner for Customs to deem motor vehicles as capital goods. Capital goods (plan and machinery, excluding motor vehicles) and goods and series provided under a technical aid or donor-funded project and special agreements are relieved from VAT. Government agencies are not relieved from VAT. Excise duty Excise duty is charged on various imported and locally produced goods and services, especially on certain consumer goods such as petroleum and alcohol and tobacco products. The rates may be specific, such as TZS 40 per litre on heavy furnace oil, or ad valorem, such as 20% on motor vehicles older than 10 years. Stamp duty Stamp duty is payable on a range of transactions such as lease agreements, conveyances and transfers of shares. (Most such instruments need to be stamped to have legal status). The duty is 1% on all transactions except the conveyance of agricultural land, which latter incurs a duty of TZS 500. Taxes on international trade
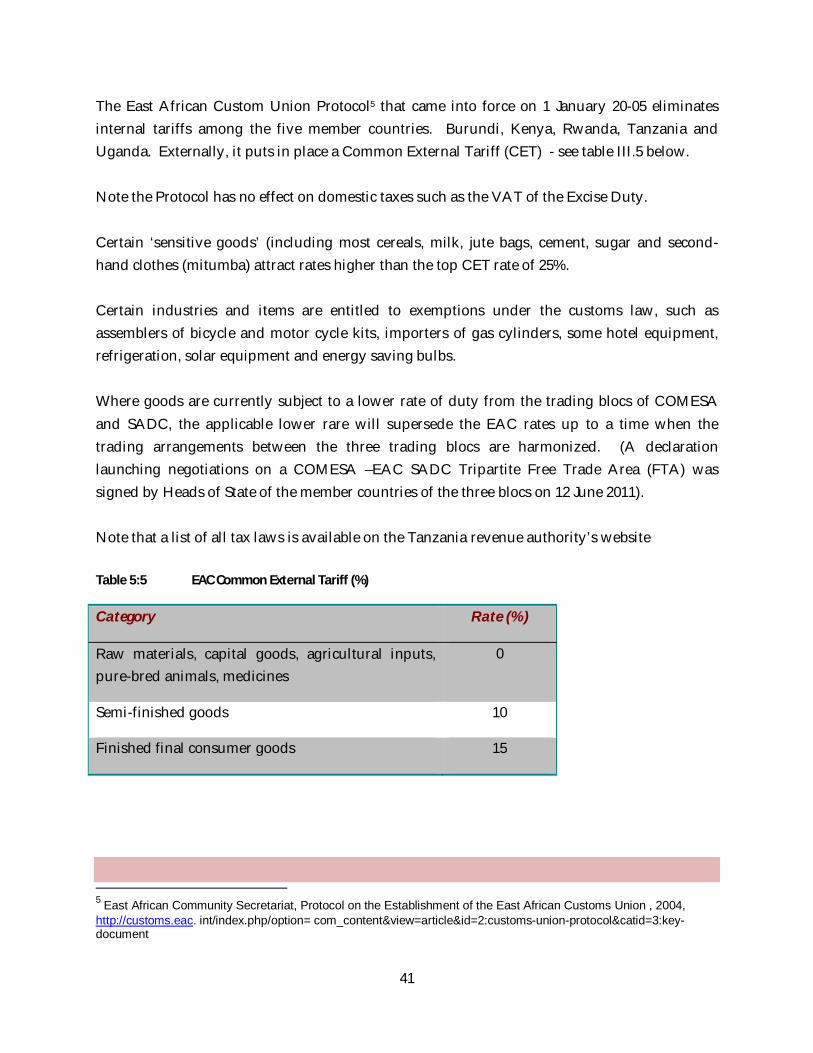
41
The East African Custom Union Protocol5 that came into force on 1 January 20-05 eliminates internal tariffs among the five member countries. Burundi, Kenya, Rwanda, Tanzania and Uganda. Externally, it puts in place a Common External Tariff (CET) - see table III.5 below. Note the Protocol has no effect on domestic taxes such as the VAT of the Excise Duty. Certain ‘sensitive goods’ (including most cereals, milk, jute bags, cement, sugar and second-hand clothes (mitumba) attract rates higher than the top CET rate of 25%. Certain industries and items are entitled to exemptions under the customs law, such as assemblers of bicycle and motor cycle kits, importers of gas cylinders, some hotel equipment, refrigeration, solar equipment and energy saving bulbs. Where goods are currently subject to a lower rate of duty from the trading blocs of COMESA and SADC, the applicable lower rare will supersede the EAC rates up to a time when the trading arrangements between the three trading blocs are harmonized. (A declaration launching negotiations on a COMESA –EAC SADC Tripartite Free Trade Area (FTA) was signed by Heads of State of the member countries of the three blocs on 12 June 2011). Note that a list of all tax laws is available on the Tanzania revenue authority’s website Table 5:5 EAC Common External Tariff (%)
Category Rate (%)
Raw materials, capital goods, agricultural inputs, pure-bred animals, medicines
0
Semi-finished goods 10
Finished final consumer goods 15
5 East African Community Secretariat, Protocol on the Establishment of the East African Customs Union , 2004, http://customs.eac. int/index.php/option= com_content&view=article&id=2:customs-union-protocol&catid=3:key-document
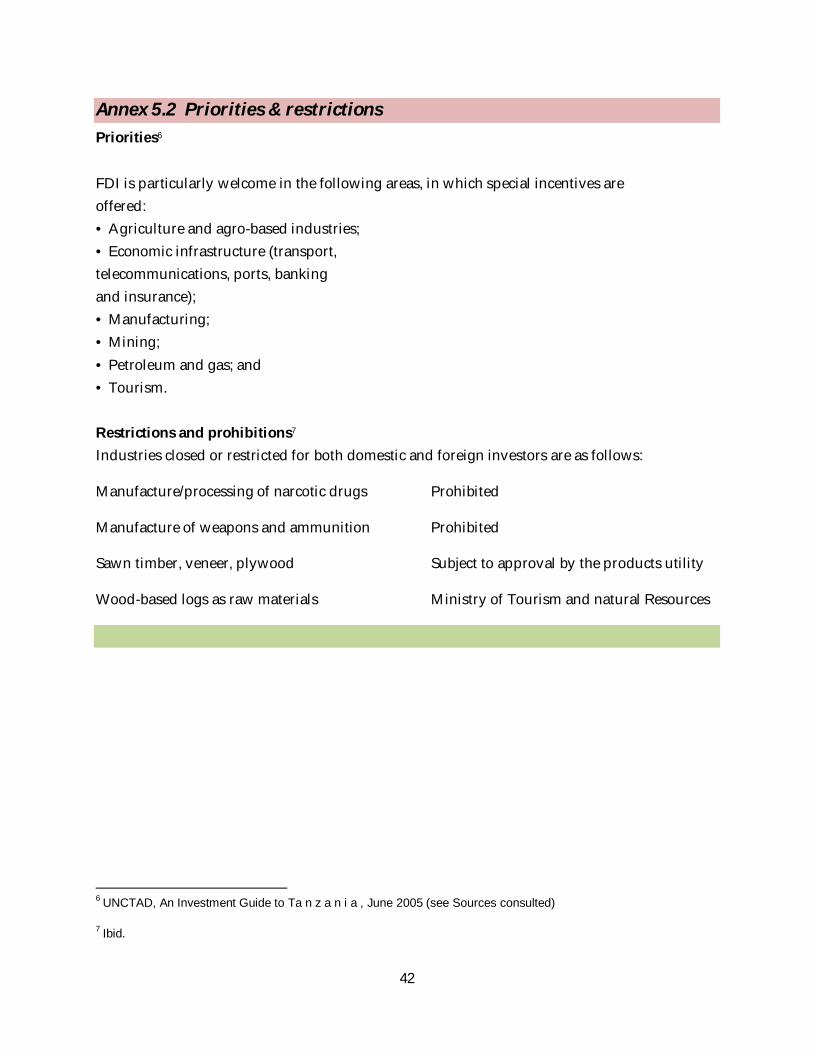
42
Annex 5.2 Priorities & restrictions Priorities6 FDI is particularly welcome in the following areas, in which special incentives are offered: • Agriculture and agro-based industries; • Economic infrastructure (transport, telecommunications, ports, banking and insurance); • Manufacturing; • Mining; • Petroleum and gas; and • Tourism. Restrictions and prohibitions7 Industries closed or restricted for both domestic and foreign investors are as follows:
Manufacture/processing of narcotic drugs Prohibited
Manufacture of weapons and ammunition Prohibited
Sawn timber, veneer, plywood Subject to approval by the products utility
Wood-based logs as raw materials Ministry of Tourism and natural Resources
6 UNCTAD, An Investment Guide to Ta n z a n i a , June 2005 (see Sources consulted) 7 Ibid.
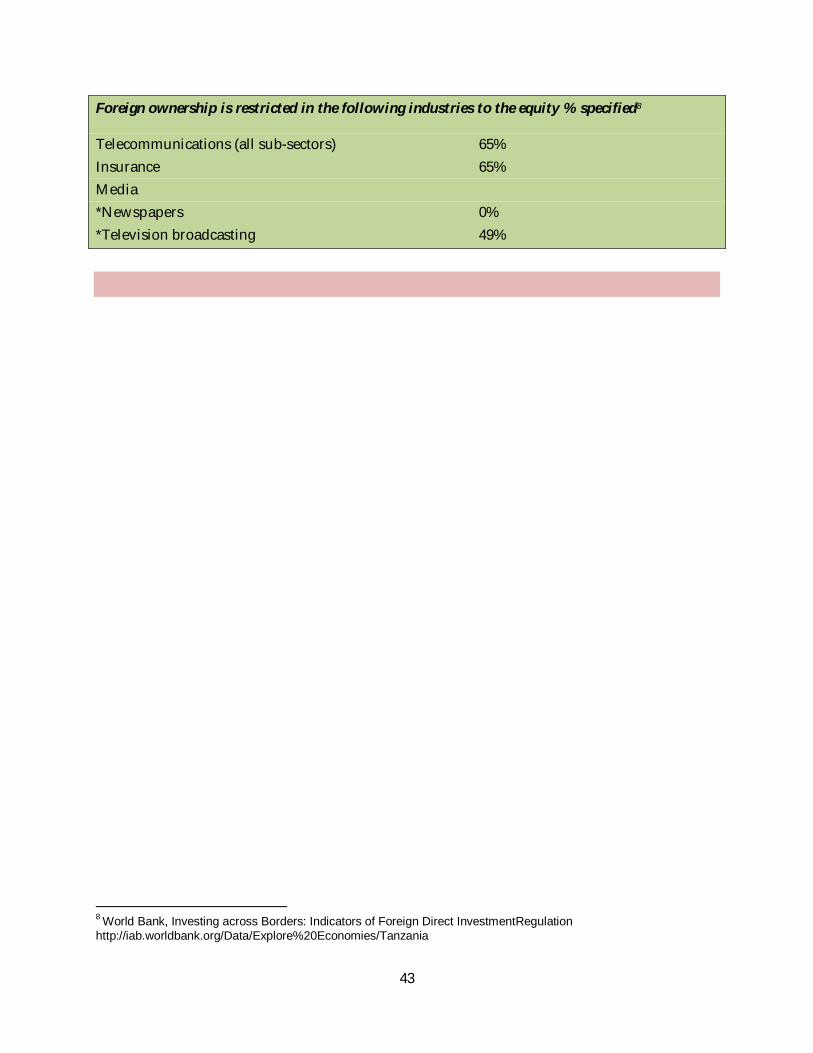
43
Foreign ownership is restricted in the following industries to the equity % specified8
Telecommunications (all sub-sectors) 65% Insurance 65% Media *Newspapers 0% *Television broadcasting 49%
8 World Bank, Investing across Borders: Indicators of Foreign Direct InvestmentRegulation http://iab.worldbank.org/Data/Explore%20Economies/Tanzania
44
Annex 53 Investment protection, investor treatment and dispute settlement Investment protection Investment is protected under law in Tanzania. The Constitution (Chapter One, Part III, Section 24) acknowledges the right to private property and permits nationalization only with fair and adequate compensation. Section 22 of the Tanzania Investment Act No. 26 of 1997 affirms that “no business enterprise shall be nationalized or expropriated by the Government” except by due process which makes provision for a) the payment of fair, adequate and prompt compensation which may be repatriated in convertible currency and b) the right of access to the Courts or to arbitration for the determination of the investor's interest or right and the amount of compensation to which he is entitled9. Tanzania has been a member of the Multilateral Investment Guarantee Agency (MIGA) of the World Bank Group since June 19, 1992. It is also a signatory to the Convention on the Settlement of Investment Disputes between States and Nationals of Other States (ratified May 18, 1992, entered into force June 17, 1992). Additional protection may be offered in specific cases by the provisions of bilateral investment treaties in force — see table II.11 on BITs currently in force in Chapter II above. No foreign investment has in fact been expropriated in Tanzania since 1985. Investor treatment There is no discrimination against foreign companies under the law in Tanzania Dispute settlement As noted earlier, a Commercial Court was established in Dar es Salaam in 1999 to deal with commercial disputes. Since then, new commercial courts have been opened in Mwanza and Arusha. Access has been improved and costs have been lowered. Nonetheless, there is an ongoing problem of court capacity, which means that dispute settlement remains a lengthy and time-consuming process for investors. 9 Tanzania Chamber of Commerce, Industry and Agriculture, The Tanzania Investment Act, 1997 http://www.tccia. com/tccia/wp-content/uploads/legal/acts/Investment%20Act1997.pdf .
45
Beyond the commercial courts, the Government has initiated another approach to dispute resolution. The Investor Complaints Bureau was established in 2010 and is chaired by the Government’s Chief Secretary. Both investors, and the TIC on behalf of investors, can address their concerns to the Bureau. One example is an incident in which the Ministry of Infrastructure and Development wanted to monopolize roadside billboards, for which it planned to sell usage permits. Investors took their concerns about this matter to the TIC and it in turn approached the Bureau. Resolution was provided at a high level and much more quickly than would have been possible through the commercial courts. And then there is arbitration. Tanzania has an Arbitration Act (2002) that governs both domestic arbitration and the enforcement of foreign arbitral awards. If a dispute is related to ownership of immoveable property, it cannot be arbitrated. The administration of arbitrations is carried out by the National Construction Council (NCC) and the Tanzania Institute of Arbitrators. The enforcement procedure is quite lengthy. Tanzania is also a member of the International Centre for the Settlement of Investment Disputes (ICSID), associated with the World Bank. However, there is no specific legislation in Tanzania providing for enforcement either under the 1958 New York Convention on the Recognition and Enforcement of Foreign Arbitral Awards or under the ICSID Convention.
46
Annex 5.4 Land Use Policy Under section 4 (1) of the Land Act 1999 as amended, all land in Tanzania belongs to the State. It may be acquired for use through: • Rights of occupancy granted by the Government; • Derivative rights granted by the Tanzania Investment Centre; and • Sub-leases created out of the rights of occupancy held by the private sector. Rights of occupancy and derivative rights are granted for both short-term and long-term periods. Periods of long-term rights of occupancy range from 5−99 years and are renewable. The Tanzania Investment Centre (TIC) can help investors to whom it has issued a Certificate of Incentives acquire land, both rural and urban, and it does not charge a fee for this service. It now has officers from the respective Government ministries and departments stationed at the Centre to facilitate land acquisition. The TIC also maintains a land bank, which contains designated plots of land that can be made available to foreign investors. However, a request for land not already in the land bank has to go through a lengthy review and approval process by local level authorities as well as the President's office, in order to be officially re-designated, from Village Land, with customary rights of occupancy, to General Land, which can be titled for investment and sale. The process of acquiring land can thus be difficult and time-consuming for foreign investors. In part, this is because less than 10% of land has been surveyed and the registration of title deeds is handled manually and mainly at the local level. A partnership with a local investor is one way out of these difficulties, as the local partner can provide the land.
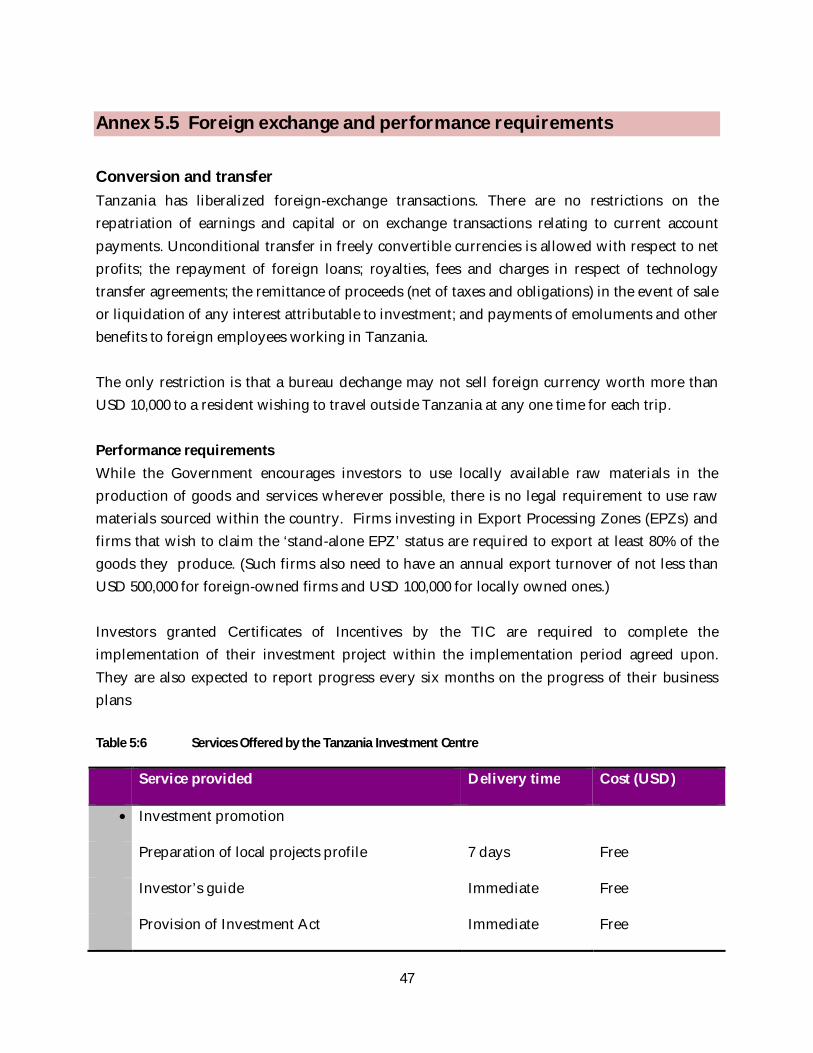
47
Annex 5.5 Foreign exchange and performance requirements Conversion and transfer Tanzania has liberalized foreign-exchange transactions. There are no restrictions on the repatriation of earnings and capital or on exchange transactions relating to current account payments. Unconditional transfer in freely convertible currencies is allowed with respect to net profits; the repayment of foreign loans; royalties, fees and charges in respect of technology transfer agreements; the remittance of proceeds (net of taxes and obligations) in the event of sale or liquidation of any interest attributable to investment; and payments of emoluments and other benefits to foreign employees working in Tanzania. The only restriction is that a bureau dechange may not sell foreign currency worth more than USD 10,000 to a resident wishing to travel outside Tanzania at any one time for each trip. Performance requirements While the Government encourages investors to use locally available raw materials in the production of goods and services wherever possible, there is no legal requirement to use raw materials sourced within the country. Firms investing in Export Processing Zones (EPZs) and firms that wish to claim the ‘stand-alone EPZ’ status are required to export at least 80% of the goods they produce. (Such firms also need to have an annual export turnover of not less than USD 500,000 for foreign-owned firms and USD 100,000 for locally owned ones.) Investors granted Certificates of Incentives by the TIC are required to complete the implementation of their investment project within the implementation period agreed upon. They are also expected to report progress every six months on the progress of their business plans Table 5:6 Services Offered by the Tanzania Investment Centre
Service provided Delivery time Cost (USD)
Investment promotion
Preparation of local projects profile 7 days Free
Investor’s guide Immediate Free
Provision of Investment Act Immediate Free
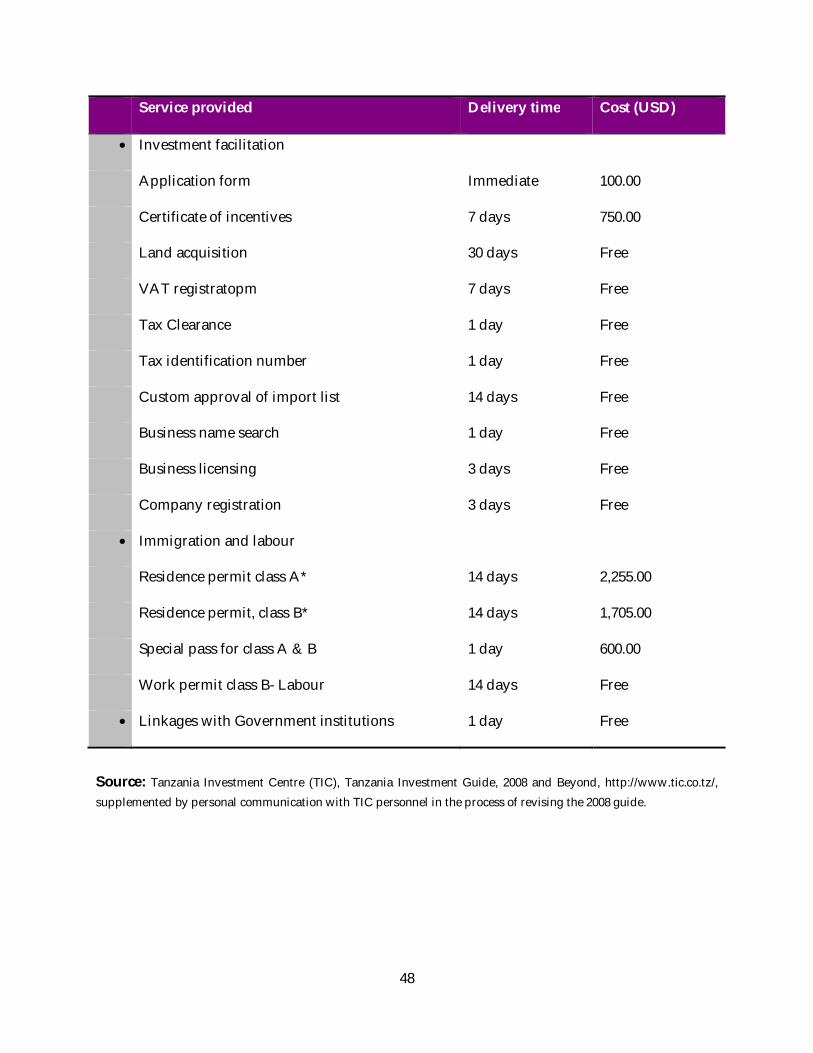
48
Service provided Delivery time Cost (USD)
Investment facilitation
Application form Immediate 100.00
Certificate of incentives 7 days 750.00
Land acquisition 30 days Free
VAT registratopm 7 days Free
Tax Clearance 1 day Free
Tax identification number 1 day Free
Custom approval of import list 14 days Free
Business name search 1 day Free
Business licensing 3 days Free
Company registration 3 days Free
Immigration and labour
Residence permit class A* 14 days 2,255.00
Residence permit, class B* 14 days 1,705.00
Special pass for class A & B 1 day 600.00
Work permit class B- Labour 14 days Free
Linkages with Government institutions 1 day Free
Source: Tanzania Investment Centre (TIC), Tanzania Investment Guide, 2008 and Beyond, http://www.tic.co.tz/, supplemented by personal communication with TIC personnel in the process of revising the 2008 guide.

49
Annex 5.6 Incorporation and exit Table III.7 below describes the steps involved in starting a business in Tanzania. While the procedure is broadly similar for both foreign and domestic investors, there are some differences as well. In step 2, for example, a domestic business is issued a Certificate of Incorporation, with the cost ranging from TZS 126,200 to TZS 400,000 (USD 80−250), while a foreign company receives a Certificate of Compliance, at a cost of USD 1,200.10 A number of these steps are undertaken by the Tanzania Investment Centre on behalf of investors who meet certain minimum capital requirements — see the preceding table. The TIC can also provide further details — A Pointers to further information is provided in Annex 5.7. Table 5:7 Starting a Business in Tanzania, Steps, time and cost
Procedure Time (Days) Cost (TZS)
1 Apply for clearance of the proposed company 1 No charge name at the Business Registration and
Licensing Authority (BRELA)
1 No charge
2 Apply for a certificate of incorporation and 7 Variable of commencement to Registrar of Companies
7 Variable
3 Apply for taxpayer identification number (TIN) 2 No charge with the Tanzania Revenue Authority
2 No charge
4 Income tax officials inspect the office site of the No 1y No charge
10 Tanzania Investment Centre (TIC), Tanzania Investment Guide, 2008 and Beyond http://www.tic.co.tz/
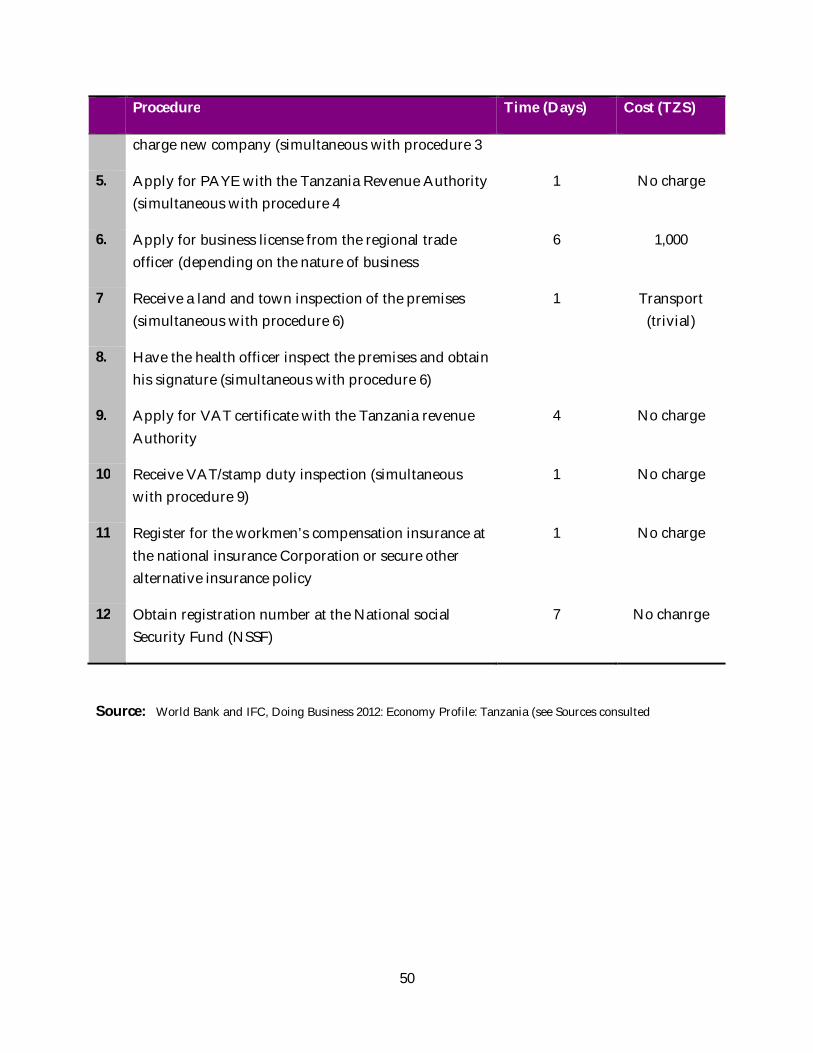
50
Procedure Time (Days) Cost (TZS)
charge new company (simultaneous with procedure 3
5. Apply for PAYE with the Tanzania Revenue Authority (simultaneous with procedure 4
1 No charge
6. Apply for business license from the regional trade officer (depending on the nature of business
6 1,000
7 Receive a land and town inspection of the premises (simultaneous with procedure 6)
1 Transport (trivial)
8. Have the health officer inspect the premises and obtain his signature (simultaneous with procedure 6)
9. Apply for VAT certificate with the Tanzania revenue Authority
4 No charge
10 Receive VAT/stamp duty inspection (simultaneous with procedure 9)
1 No charge
11 Register for the workmen’s compensation insurance at the national insurance Corporation or secure other alternative insurance policy
1 No charge
12 Obtain registration number at the National social Security Fund (NSSF)
7 No chanrge
Source: World Bank and IFC, Doing Business 2012: Economy Profile: Tanzania (see Sources consulted
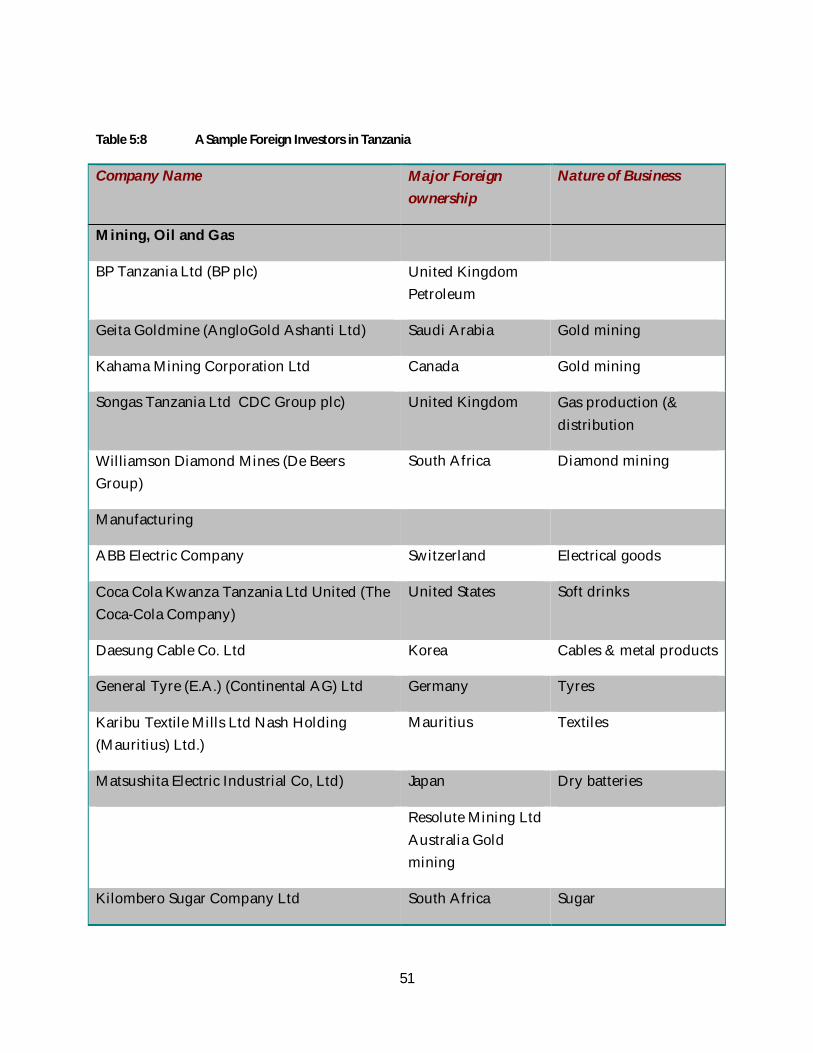
51
Table 5:8 A Sample Foreign Investors in Tanzania
Company Name Major Foreign ownership
Nature of Business
Mining, Oil and Gas
BP Tanzania Ltd (BP plc) United Kingdom Petroleum
Geita Goldmine (AngloGold Ashanti Ltd) Saudi Arabia Gold mining
Kahama Mining Corporation Ltd Canada Gold mining
Songas Tanzania Ltd CDC Group plc) United Kingdom Gas production (& distribution
Williamson Diamond Mines (De Beers Group)
South Africa Diamond mining
Manufacturing
ABB Electric Company Switzerland Electrical goods
Coca Cola Kwanza Tanzania Ltd United (The Coca-Cola Company)
United States Soft drinks
Daesung Cable Co. Ltd Korea Cables & metal products
General Tyre (E.A.) (Continental AG) Ltd Germany Tyres
Karibu Textile Mills Ltd Nash Holding (Mauritius) Ltd.)
Mauritius Textiles
Matsushita Electric Industrial Co, Ltd) Japan Dry batteries
Resolute Mining Ltd Australia Gold mining
Kilombero Sugar Company Ltd South Africa Sugar
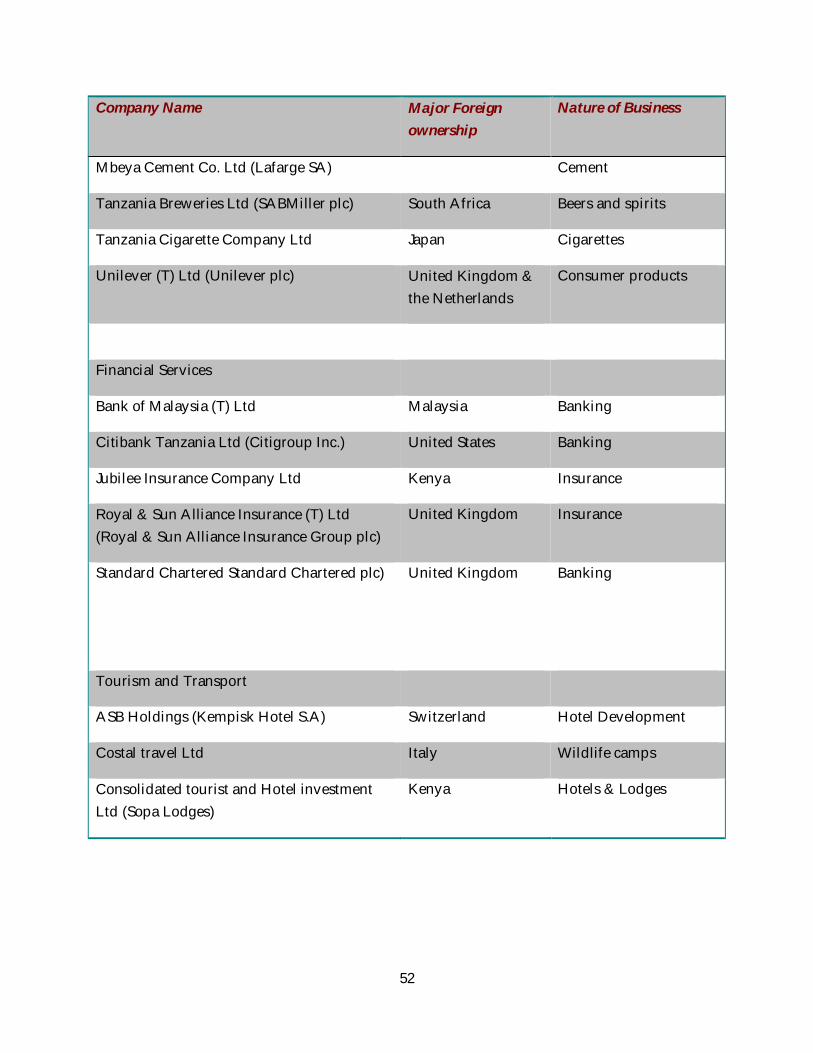
52
Company Name Major Foreign ownership
Nature of Business
Mbeya Cement Co. Ltd (Lafarge SA) Cement
Tanzania Breweries Ltd (SABMiller plc) South Africa Beers and spirits
Tanzania Cigarette Company Ltd Japan Cigarettes
Unilever (T) Ltd (Unilever plc) United Kingdom & the Netherlands
Consumer products
Financial Services
Bank of Malaysia (T) Ltd Malaysia Banking
Citibank Tanzania Ltd (Citigroup Inc.) United States Banking
Jubilee Insurance Company Ltd Kenya Insurance
Royal & Sun Alliance Insurance (T) Ltd (Royal & Sun Alliance Insurance Group plc)
United Kingdom Insurance
Standard Chartered Standard Chartered plc)
United Kingdom Banking
Tourism and Transport
ASB Holdings (Kempisk Hotel S.A) Switzerland Hotel Development
Costal travel Ltd Italy Wildlife camps
Consolidated tourist and Hotel investment Ltd (Sopa Lodges)
Kenya Hotels & Lodges
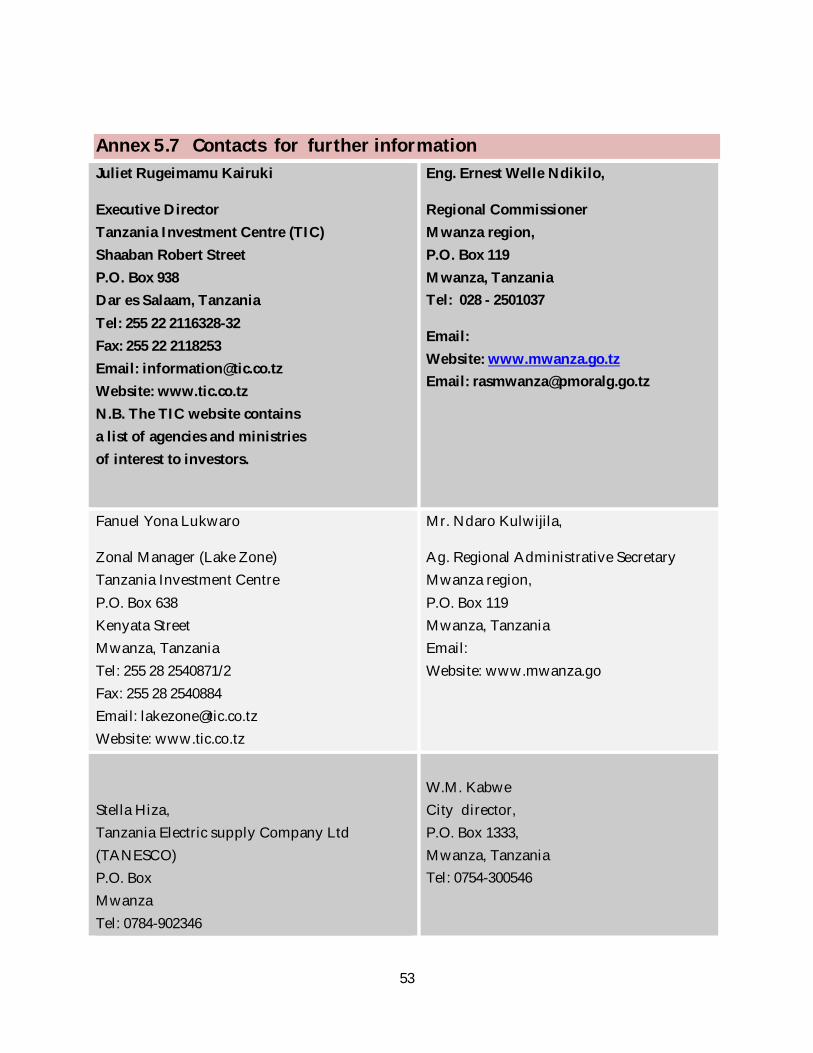
53
Annex 5.7 Contacts for further information Juliet Rugeimamu Kairuki
Executive Director Tanzania Investment Centre (TIC) Shaaban Robert Street P.O. Box 938 Dar es Salaam, Tanzania Tel: 255 22 2116328-32 Fax: 255 22 2118253 Email: [email protected] Website: www.tic.co.tz N.B. The TIC website contains a list of agencies and ministries of interest to investors.
Eng. Ernest Welle Ndikilo,
Regional Commissioner Mwanza region, P.O. Box 119 Mwanza, Tanzania Tel: 028 - 2501037
Email: Website: www.mwanza.go.tz Email: [email protected]
Fanuel Yona Lukwaro
Zonal Manager (Lake Zone) Tanzania Investment Centre P.O. Box 638 Kenyata Street Mwanza, Tanzania Tel: 255 28 2540871/2 Fax: 255 28 2540884 Email: [email protected] Website: www.tic.co.tz
Mr. Ndaro Kulwijila,
Ag. Regional Administrative Secretary Mwanza region, P.O. Box 119 Mwanza, Tanzania Email: Website: www.mwanza.go
Stella Hiza, Tanzania Electric supply Company Ltd (TANESCO) P.O. Box Mwanza Tel: 0784-902346
W.M. Kabwe City director, P.O. Box 1333, Mwanza, Tanzania Tel: 0754-300546
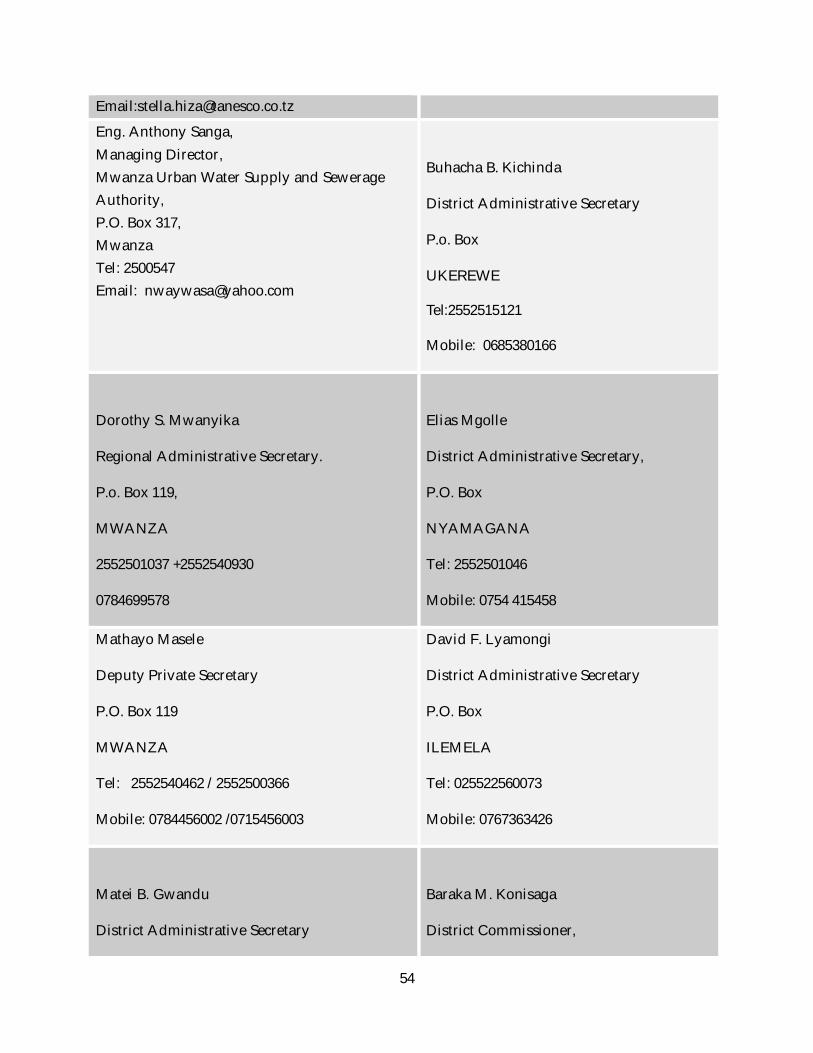
54
Email:[email protected]
Eng. Anthony Sanga, Managing Director, Mwanza Urban Water Supply and Sewerage Authority, P.O. Box 317, Mwanza Tel: 2500547 Email: [email protected]
Buhacha B. Kichinda
District Administrative Secretary
P.o. Box
UKEREWE
Tel:2552515121
Mobile: 0685380166
Dorothy S. Mwanyika
Regional Administrative Secretary.
P.o. Box 119,
MWANZA
2552501037 +2552540930
0784699578
Elias Mgolle
District Administrative Secretary,
P.O. Box
NYAMAGANA
Tel: 2552501046
Mobile: 0754 415458
Mathayo Masele
Deputy Private Secretary
P.O. Box 119
MWANZA
Tel: 2552540462 / 2552500366
Mobile: 0784456002 /0715456003
David F. Lyamongi
District Administrative Secretary
P.O. Box
ILEMELA
Tel: 025522560073
Mobile: 0767363426
Matei B. Gwandu
District Administrative Secretary
Baraka M. Konisaga
District Commissioner,
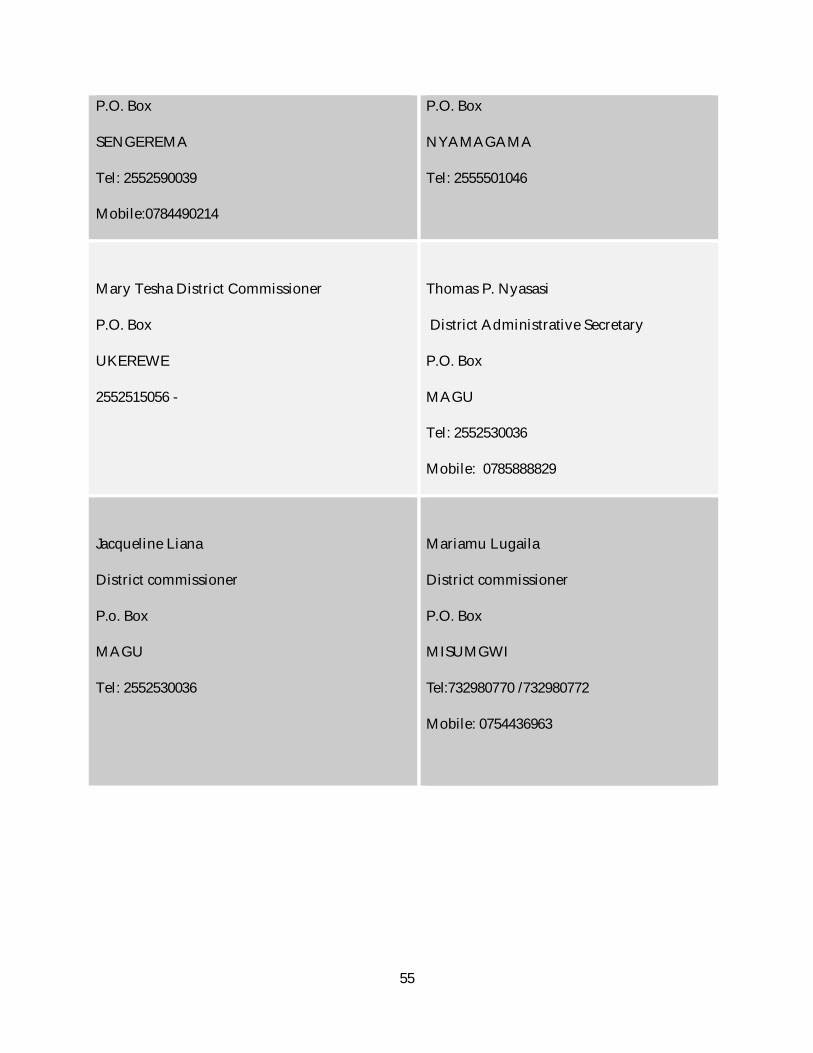
55
P.O. Box
SENGEREMA
Tel: 2552590039
Mobile:0784490214
P.O. Box
NYAMAGAMA
Tel: 2555501046
Mary Tesha District Commissioner
P.O. Box
UKEREWE
2552515056 -
Thomas P. Nyasasi
District Administrative Secretary
P.O. Box
MAGU
Tel: 2552530036
Mobile: 0785888829
Jacqueline Liana
District commissioner
P.o. Box
MAGU
Tel: 2552530036
Mariamu Lugaila
District commissioner
P.O. Box
MISUMGWI
Tel:732980770 /732980772
Mobile: 0754436963

56
Related Documents