GLOBAL EQUITY PORTFOLIO HLMVX: Institutional Class INTERNATIONAL EQUITY PORTFOLIO HLMIX: Institutional Class INTERNATIONAL SMALL COMPANIES PORTFOLIO HLMRX: Institutional Class INSTITUTIONAL EMERGING MARKETS PORTFOLIO HLMEX: Class I HLEEX: Class II FRONTIER EMERGING MARKETS PORTFOLIO HLFMX: Institutional Class I HLFFX: Institutional Class II MUTUAL FUNDS FOR INSTITUTIONAL INVESTORS As with all mutual funds, the Securities and Exchange Commission has not approved or disapproved these securities or determined if this prospectus is truthful or complete. Any representation to the contrary is a criminal offense. PROSPECTUS February 28, 2018 GLOBAL EQUITY RESEARCH PORTFOLIO HLRGX: Institutional Class INTERNATIONAL EQUITY RESEARCH PORTFOLIO HLIRX: Institutional Class EMERGING MARKETS RESEARCH PORTFOLIO HLREX: Institutional Class

Welcome message from author
This document is posted to help you gain knowledge. Please leave a comment to let me know what you think about it! Share it to your friends and learn new things together.
Transcript

GLOBAL EQUITY PORTFOLIOHLMVX: Institutional Class
InTERnATIOnAL EQUITY PORTFOLIOHLMIX: Institutional Class
InTERnATIOnAL SMALL COMPAnIES PORTFOLIOHLMRX: Institutional Class
InSTITUTIOnAL EMERGInG MARKETS PORTFOLIOHLMEX: Class I
HLEEX: Class II
FROnTIER EMERGInG MARKETS PORTFOLIOHLFMX: Institutional Class I
HLFFX: Institutional Class II
MUTUAL FUNDS FOR INSTITUTIONAL INVESTORS
As with all mutual funds, the Securities and Exchange Commission has not approved or disapproved these securities or determined if this prospectus
is truthful or complete. Any representation to the contrary is a criminal offense.
PROSPECTUSFebruary 28, 2018
GLOBAL EQUITY RESEARCH PORTFOLIOHLRGX: Institutional Class
InTERnATIOnAL EQUITY RESEARCH PORTFOLIOHLIRX: Institutional Class
EMERGInG MARKETS RESEARCH PORTFOLIOHLREX: Institutional Class
Harding, Loevner Funds, Inc. (the “Fund”)
Supplement dated March 5, 2018 to the
Prospectus for Individual Investors and Prospectus for Institutional Investors, each dated February
28, 2018, as supplemented (the “Prospectuses”) and Statement of Additional Information, dated
February 28, 2018, as supplemented (the “SAI”)
Disclosure Related to the International Small Companies Portfolio (Institutional and Investor
Classes) (the “Portfolio”)
Effective April 2, 2018, Jafar Rizvi and Anix Vyas will serve as co-lead portfolio managers of the
Portfolio. Accordingly, the paragraph that appears after the caption “Portfolio Managers” for the
Portfolio in each Prospectus is replaced with the following:
Jafar Rizvi and Anix Vyas serve as the portfolio managers of the International Small Companies
Portfolio. Mr. Rizvi has held his position since June 2011 and Mr. Vyas has held his position since April
2018. Messrs. Rizvi and Vyas are co-lead portfolio managers.
In addition, effective April 2, 2018, corresponding changes are made to the “Portfolio Management”
section in each Prospectus and the following disclosure is added:
Anix Vyas, CFA has been a portfolio manager since 2018 and an analyst since 2013. As an analyst, he
focuses on industrials and materials companies. Mr. Vyas graduated from Fordham University in 2002
and received an MBA in Finance from University of Pennsylvania, the Wharton School, in 2010. He
joined Harding Loevner in 2013. Mr. Vyas serves as a co-lead portfolio manager for the International
Small Companies Portfolio.
In addition, effective April 2, 2018, corresponding changes are made to the table disclosing the other
accounts managed by the Fund’s portfolio managers in the SAI and the following information is added:
Portfolio Manager
RICs
Other Pooled Accounts
Other A/Cs
Number of
Accounts
Total Assets of
Accounts
Managed
Number of
Accounts
Total Assets of
Accounts
Managed
Number of
Accounts
Total Assets of
Accounts
Managed
Anix Vyas* 1 $222,655,540 0 $0 2 $100,189,638
* Information provided as of December 31, 2017.
In addition, effective April 2, 2018, corresponding changes are made to the table disclosing the dollar
range of equity securities of the Fund beneficially owned by the Fund’s portfolio managers in the SAI and
the following information is added:

Portfolio Manager
Dollar Range of
Equity Securities In the Fund
Anix Vyas* Global Equity Portfolio: None
International Equity Portfolio: None
International Small Companies Portfolio: $10,001-$50,000
Institutional Emerging Markets Portfolio: None
Emerging Markets Portfolio: None
Frontier Emerging Markets Portfolio: $10,001-$50,000
Global Equity Research Portfolio: $1-$10,000
International Equity Research Portfolio: None
Emerging Markets Research Portfolio: None
* Information provided as of December 31, 2017.
Investors Should Retain this Supplement for Future Reference.

� TABLE OF CONTENTS
3 Portfolio Summaries
3 Global Equity Portfolio
6 International Equity Portfolio
9 International Small Companies Portfolio
12 Institutional Emerging Markets Portfolio – Class I
15 Institutional Emerging Markets Portfolio – Class II
18 Frontier Emerging Markets Portfolio – Institutional Class I
21 Frontier Emerging Markets Portfolio – Institutional Class II
24 Global Equity Research Portfolio
27 International Equity Research Portfolio
30 Emerging Markets Research Portfolio
33 Investment Objectives and Investment Process
35 Additional Information on Portfolio Investment Strategies and Risks
38 Management of the Fund
40 Shareholder Information
47 Distribution of Fund Shares
48 Financial Highlights
58 Privacy Notice
Back Cover Availability of Additional Information about the Fund

PORTFOLIOSUMMARY
GLOBAL EQUITY PORTFOLIO
INVESTMENT OBJECTIVE
The Global Equity Portfolio (the “Portfolio”) seeks long-term capital appreciation through investments in equitysecurities of companies based both inside and outside theUnited States.
PORTFOLIO FEES AND EXPENSES
This table describes the fees and expenses that you maypay if you buy and hold shares of the InstitutionalClass of the Portfolio.
SHAREHOLDER FEES(fees paid directly from your investment)
Maximum Sales Charge (Load) Imposed on Purchases (asa percentage of offering price) None
Redemption Fee (as a percentage of amount redeemedwithin 90 days or less from the date of purchase) 2.00%
ANNUAL PORTFOLIO OPERATING EXPENSES(expenses that you pay each year as a percentage of thevalue of your investment)
Management Fees 0.80%
Distribution (12b-1) Fees None
Other Expenses 0.13%
Total Annual Portfolio Operating Expenses 0.93%
Fee Waiver and/or Expense Reimbursement1 0.00%
Total Annual Portfolio Operating Expenses After Fee
Waiver and/or Expense Reimbursement1 0.93%
1Harding Loevner LP has contractually agreed to waive a portion of its management fee and/orreimburse the Institutional Class of the Portfolio for its other operating expenses to theextent Total Annual Portfolio Operating Expenses (excluding dividend expenses, borrowingcosts, interest expense relating to short sales, interest, taxes, brokerage commissions andextraordinary expenses), as a percentage of average daily net assets, exceed 0.95% throughFebruary 28, 2019.
Example: This example is intended to help you comparethe cost of investing in the Institutional Class of thePortfolio with the cost of investing in other mutual funds.The example assumes that you invest $10,000 in theInstitutional Class of the Portfolio for the time periodsindicated and then redeem all of your shares at the endof those periods. The example also assumes that yourinvestment has a 5% return each year and that theInstitutional Class’s operating expenses remain the same.Although your actual costs may be higher or lower, basedon these assumptions your costs would be:
1 YEAR 3 YEARS 5 YEARS 10 YEARS
$95 $296 $515 $1,143
PORTFOLIO TURNOVER
The Portfolio pays transaction costs, such ascommissions, when it buys and sells securities (or “turnsover” its portfolio). A higher portfolio turnover rate may
indicate higher transaction costs and may result in highertaxes when Portfolio shares are held in a taxable account.These costs, which are not reflected in annual portfoliooperating expenses or in the Example, affect thePortfolio’s performance. During the most recent fiscalyear, the Portfolio’s portfolio turnover rate was 33% ofthe average value of its portfolio.
PRINCIPAL INVESTMENT STRATEGIES
The Portfolio invests in companies based in the UnitedStates and other developed markets, as well as inemerging and frontier markets. Harding Loevner LP(“Harding Loevner”), the Portfolio’s investment adviser,undertakes fundamental research in an effort to identifycompanies that are well managed, financially sound, fastgrowing, and strongly competitive, and whose shares areunder-priced relative to estimates of their value. Toreduce its volatility, the Portfolio is diversified acrossdimensions of geography, industry, currency, and marketcapitalization. The Portfolio normally holds investmentsacross at least 15 countries.
The Portfolio will normally invest broadly in equitysecurities of companies domiciled in the followingcountries and regions: (1) Europe; (2) the Pacific Rim;(3) the United States, Canada, and Mexico; and(4) countries with emerging or frontier markets. At least65% of total assets will be denominated in at least threecurrencies, which may include the U.S. dollar. Forpurposes of compliance with this restriction, AmericanDepositary Receipts, Global Depositary Receipts, andEuropean Depositary Receipts (collectively, “DepositaryReceipts”), will be considered to be denominated in thecurrency of the country where the securities underlyingthe Depositary Receipts are principally traded.
The Portfolio invests, under normal circumstances, atleast 80% of its net assets (plus any borrowings forinvestment purposes) in common stocks, preferredstocks, rights, and warrants issued by companies that arebased both inside and outside the United States,securities convertible into such securities (includingDepositary Receipts), and investment companies thatinvest in the types of securities in which the Portfoliowould normally invest.
Because some emerging market countries do not permitforeigners to participate directly in their securitiesmarkets or otherwise present difficulties for efficientforeign investment, the Portfolio may use equityderivative securities, and, in particular, participationnotes, to gain exposure to those countries.
3

PRINCIPAL RISKS
The Portfolio is subject to numerous risks, any of whichcould cause an investor to lose money. The principal risksof the Portfolio are as follows:
Market Risk: Investments in the Portfolio may lose valuedue to a general downturn in stock markets.
Currency Risk: Foreign currencies may experiencesteady or sudden devaluation relative to the U.S. dollar,adversely affecting the value of the Portfolio’sinvestments. Because the Portfolio’s net asset value isdetermined on the basis of U.S. dollars, if the localcurrency of a foreign market depreciates against the U.S.dollar, you may lose money even if the foreign marketprices of the Portfolio’s holdings rise.
Foreign Investment Risk: Securities issued by foreignentities involve risks not associated with U.S.investments. These risks include additional taxation,political, economic, social, or, diplomatic instability, andthe above-mentioned possibility of changes in foreigncurrency exchange rates. There may also be less publicly-available information about a foreign issuer. Such risksmay be magnified with respect to securities of issuers infrontier emerging markets.
Emerging and Frontier Market Risk: Emerging andfrontier market securities involve certain risks, such asexposure to economies less diverse and mature than thatof the United States or more established foreign markets.Economic or political instability may cause larger pricechanges in emerging or frontier market securities than insecurities of issuers based in more developed foreigncountries.
Participation Notes Risk: Participation notes are issuedby banks, or broker-dealers, or their affiliates and aredesigned to replicate the return of a particularunderlying equity or debt security, currency, or market.When the participation note matures, the issuer of theparticipation note will pay to, or receive from, thePortfolio the difference between the nominal value of theunderlying instrument at the time of purchase and thatinstrument’s value at maturity. Participation notesinvolve the same risks associated with a directinvestment in the underlying security, currency, ormarket. In addition, participation notes involvecounterparty risk, because the Portfolio has no rightsunder participation notes against the issuer(s) of theunderlying security(ies) and must rely on thecreditworthiness of the issuer of the participation note.
Small- and Mid-Capitalization Risk: The securities ofsmaller and medium-sized companies have historicallyexhibited more volatility with a lower degree of liquiditythan larger companies.
NAV Risk: The net asset value of the Portfolio and thevalue of your investment will fluctuate.
PORTFOLIO PERFORMANCE
The following bar chart shows how the investmentresults of the Portfolio’s Institutional Class shares havevaried from year to year. The table that follows shows
how the average annual total returns of the Portfolio’sInstitutional Class shares compare with a broad measureof market performance. Together, these provide anindication of the risks of investing in the Portfolio. Howthe Institutional Class shares of the Portfolio haveperformed in the past (before and after taxes) is notnecessarily an indication of how it will perform in thefuture.
Updated Portfolio performance information is available atwww.hardingloevnerfunds.com or by calling (877) 435-8105.
GLOBAL EQUITY PORTFOLIO
15.55% -8.22% 17.42% 20.27% 5.60% 32.15%
-10%
0%
10%
20%
30%
40%
2010 2011 2012 2013 2014 2017
6.02%
2016
1.52%
2015
The best calendar quarter return during the periodshown above was 15.90% in the 1st quarter of 2012; theworst was -16.23% in the 3rd quarter of 2011.
AVERAGE ANNUAL TOTAL RETURNS(for the periods ended December 31, 2017)
1-YEAR 5-YEAR
SINCEINCEPTION
11/03/09
GLOBAL EQUITY PORTFOLIO - INSTITUTIONAL CLASS
Return Before Taxes 32.15% 12.56% 11.09%
Return After Taxes onDistributions1 28.13% 11.36% 10.29%
Return After Taxes onDistributions and Sale ofPortfolio Shares1 21.18% 9.91% 8.98%
MSCI ALL COUNTRY WORLD(NET) INDEX(reflects no deduction for fees,expenses, or U.S. taxes) 23.96% 10.81% 9.82%
1After-tax returns in the table above are calculated using the historical highest individualfederal marginal income tax rates and do not reflect the impact of state and local taxes.Actual after-tax returns depend on an investor’s tax situation and may differ from thoseshown, and after-tax returns shown are not relevant to investors who hold their Portfolioshares through tax-deferred arrangements, such as 401(k) plans or Individual RetirementAccounts.
MANAGEMENT
Investment AdviserHarding Loevner serves as investment adviser to thePortfolio.
Portfolio ManagersPeter Baughan, Ferrill Roll, Scott Crawshaw, ChristopherMack, and Richard Schmidt serve as the portfoliomanagers of the Global Equity Portfolio. Mr. Baughan
4

has held his position since February 2003, Mr. Roll hasheld his position since January 2001, Mr. Crawshaw hasheld his position since January 2018, Mr. Mack has heldhis position since June 2014 and Mr. Schmidt has heldhis position since February 2015. Messrs. Baughan andRoll are the co-lead portfolio managers.
PURCHASE AND SALE OF PORTFOLIOSHARES
The minimum initial investment in the InstitutionalClass of the Portfolio is $100,000. Additional purchasesmay be for any amount. You may purchase or redeem(sell) shares of the Portfolio on any business day throughcertain authorized brokers and other financialintermediaries or directly from the Portfolio by mail,telephone, or wire.
TAX CONSIDERATIONS
The Portfolio’s distributions are generally taxable to youas ordinary income, capital gains, or a combination ofthe two, unless you are investing through a tax-deferredarrangement, such as a 401(k) plan or an individualretirement account. Upon withdrawal, your investmentthrough a tax-deferred arrangement may becometaxable.
PAYMENTS TO BROKERS-DEALERS ANDOTHER FINANCIAL INTERMEDIARIES
If you purchase Portfolio shares through a broker-dealeror other financial intermediary (such as a bank), thePortfolio and its related companies may pay theintermediary for the sale of Portfolio shares and relatedservices. These payments may create a conflict of interestby influencing the broker-dealer or other intermediaryand your salesperson to recommend the Portfolio overanother investment. Ask your salesperson or visit yourfinancial intermediary’s website for more information.
5

PORTFOLIOSUMMARY
INTERNATIONAL EQUITY PORTFOLIO
INVESTMENT OBJECTIVE
The International Equity Portfolio (the “Portfolio”) seekslong-term capital appreciation through investments inequity securities of companies based outside theUnited States.
PORTFOLIO FEES AND EXPENSES
This table describes the fees and expenses that you maypay if you buy and hold shares of the InstitutionalClass of the Portfolio.
SHAREHOLDER FEES(fees paid directly from your investment)
Maximum Sales Charge (Load) Imposed on Purchases (asa percentage of offering price) None
Redemption Fee (as a percentage of amount redeemedwithin 90 days or less from the date of purchase) 2.00%
ANNUAL PORTFOLIO OPERATING EXPENSES(expenses that you pay each year as a percentage of thevalue of your investment)
Management Fees 0.68%
Distribution (12b-1) Fees None
Other Expenses 0.14%
Total Annual Portfolio Operating Expenses 0.82%
Fee Waiver and/or Expense Reimbursement1 0.00%
Total Annual Portfolio Operating Expenses After Fee
Waiver and/or Expense Reimbursement1 0.82%
1Harding Loevner LP has contractually agreed to waive a portion of its management fee and/orreimburse the Institutional Class of the Portfolio for its other operating expenses to the extentTotal Annual Portfolio Operating Expenses (excluding dividend expenses, borrowing costs,interest expense relating to short sales, interest, taxes, brokerage commissions andextraordinary expenses), as a percentage of average daily net assets, exceed 1.00% throughFebruary 28, 2019.
Example: This example is intended to help you comparethe cost of investing in the Institutional Class of thePortfolio with the cost of investing in other mutual funds.The example assumes that you invest $10,000 in theInstitutional Class of the Portfolio for the time periodsindicated and then redeem all of your shares at the endof those periods. The example also assumes that yourinvestment has a 5% return each year and that theInstitutional Class’s operating expenses remain the same.Although your actual costs may be higher or lower, basedon these assumptions your costs would be:
1 YEAR 3 YEARS 5 YEARS 10 YEARS
$84 $262 $455 $1,014
PORTFOLIO TURNOVER
The Portfolio pays transaction costs, such ascommissions, when it buys and sells securities (or “turnsover” its portfolio). A higher portfolio turnover rate may
indicate higher transaction costs and may result in highertaxes when Portfolio shares are held in a taxable account.These costs, which are not reflected in annual portfoliooperating expenses or in the Example, affect thePortfolio’s performance. During the most recent fiscalyear, the Portfolio’s portfolio turnover rate was 12% ofthe average value of its portfolio.
PRINCIPAL INVESTMENT STRATEGIESThe Portfolio invests primarily in companies based indeveloped markets outside the United States as well as incompanies in emerging and frontier markets. HardingLoevner LP (“Harding Loevner”), the Portfolio’sinvestment adviser, undertakes fundamental research inan effort to identify companies that are well managed,financially sound, fast growing, and strongly competitive,and whose shares are under-priced relative to estimatesof their value. To reduce its volatility, the Portfolio isdiversified across dimensions of geography, industry,currency, and market capitalization. The Portfolionormally holds investments across at least 15 countries.
Factors bearing on whether a company is considered tobe “based” outside the United States may include: (1) itis legally domiciled outside the United States; (2) itconducts at least 50% of its business, as measured by thelocation of its sales, earnings, assets, or production,outside the United States; or (3) it has the principalexchange listing for its securities outside theUnited States.
The Portfolio will normally invest broadly in equitysecurities of companies domiciled in the followingcountries and regions: (1) Europe; (2) the Pacific Rim;(3) Canada and Mexico; and (4) countries with emergingor frontier markets. At least 65% of total assets will bedenominated in at least three currencies other than theU.S. dollar. For purposes of compliance with thisrestriction, American Depositary Receipts, GlobalDepositary Receipts, and European Depositary Receipts(collectively, “Depositary Receipts”), will be consideredto be denominated in the currency of the country wherethe securities underlying the Depositary Receipts areprincipally traded.
The Portfolio invests, under normal circumstances, atleast 80% of its net assets (plus any borrowings forinvestment purposes) in common stocks, preferredstocks, rights, and warrants issued by companies that arebased outside the United States, securities convertibleinto such securities (including Depositary Receipts), andinvestment companies that invest in the types ofsecurities in which the Portfolio would normally invest.The Portfolio also may invest in securities of U.S.companies that derive, or are expected to derive, asignificant portion of their revenues from their foreignoperations, although under normal circumstances notmore than 15% of the Portfolio’s total assets will beinvested in securities of U.S. companies.
6

Because some emerging market countries do not permitforeigners to participate directly in their securitiesmarkets or otherwise present difficulties for efficientforeign investment, the Portfolio may use equityderivative securities, and, in particular, participationnotes, to gain exposure to those countries.
PRINCIPAL RISKS
The Portfolio is subject to numerous risks, any of whichcould cause an investor to lose money. The principalrisks of the Portfolio are as follows:
Market Risk: Investments in the Portfolio may lose valuedue to a general downturn in stock markets.
Currency Risk: Foreign currencies may experiencesteady or sudden devaluation relative to the U.S. dollar,adversely affecting the value of the Portfolio’sinvestments. Because the Portfolio’s net asset value isdetermined on the basis of U.S. dollars, if the localcurrency of a foreign market depreciates against the U.S.dollar, you may lose money even if the foreign marketprices of the Portfolio’s holdings rise.
Foreign Investment Risk: Securities issued by foreignentities involve risks not associated with U.S.investments. These risks include additional taxation,political, economic, social, or diplomatic instability, andthe above-mentioned possibility of changes in foreigncurrency exchange rates. There may also be less publicly-available information about a foreign issuer. Such risksmay be magnified with respect to securities of issuers infrontier emerging markets.
Emerging and Frontier Market Risk: Emerging andfrontier market securities involve certain risks, such asexposure to economies less diverse and mature than thatof the United States or more established foreign markets.Economic or political instability may cause larger pricechanges in emerging or frontier market securities than insecurities of issuers based in more developed foreigncountries.
Participation Notes Risk: Participation notes are issuedby banks, or broker-dealers, or their affiliates and aredesigned to replicate the return of a particularunderlying equity or debt security, currency, or market.When the participation note matures, the issuer of theparticipation note will pay to, or receive from, thePortfolio the difference between the nominal value of theunderlying instrument at the time of purchase and thatinstrument’s value at maturity. Participation notesinvolve the same risks associated with a directinvestment in the underlying security, currency, ormarket. In addition, participation notes involvecounterparty risk, because the Portfolio has no rightsunder participation notes against the issuer(s) of theunderlying security(ies) and must rely on thecreditworthiness of the issuer of the participation note.
NAV Risk: The net asset value of the Portfolio and thevalue of your investment will fluctuate.
PORTFOLIO PERFORMANCE
The following bar chart shows how the investmentresults of the Portfolio’s Institutional Class shares havevaried from year to year. The table that follows showshow the average annual total returns of the Portfolio’sInstitutional Class shares compare with a broad measureof market performance. Together, these provide anindication of the risks of investing in the Portfolio. Howthe Institutional Class shares of the Portfolio haveperformed in the past (before and after taxes) is notnecessarily an indication of how it will perform in thefuture.
Updated Portfolio performance information is available atwww.hardingloevnerfunds.com or by calling (877) 435-8105.
INTERNATIONAL EQUITY PORTFOLIO
-60%
-40%
-20%
0%
20%
40%
60%
17.49% -9.78% 20.28% 14.02% -1.61% 5.31%-39.24%
2008
40.57%
2009 2010 2011 2012 2013 2014 2016
29.90%
2017
-1.62%
2015
The best calendar quarter return during the periodshown above was 21.43% in the 2nd quarter of 2009; theworst was -22.12% in the 4th quarter of 2008.
AVERAGE ANNUAL TOTAL RETURNS(for the periods ended December 31, 2017)
1-YEAR 5-YEAR 10-YEAR
INTERNATIONAL EQUITY PORTFOLIO - INSTITUTIONAL CLASS
Return Before Taxes 29.90% 8.59% 5.10%
Return After Taxes onDistributions1 29.39% 8.43% 4.68%
Return After Taxes onDistributions and Sale ofPortfolio Shares1 17.33% 6.86% 4.05%
MSCI ALL COUNTRY WORLDex-U.S. (NET) INDEX(reflects no deduction for fees,expenses, or U.S. taxes) 27.20% 6.80% 1.84%
1After-tax returns in the table above are calculated using the historical highest individualfederal marginal income tax rates and do not reflect the impact of state and local taxes.Actual after-tax returns depend on an investor’s tax situation and may differ from thoseshown, and after-tax returns shown are not relevant to investors who hold their Portfolioshares through tax-deferred arrangements, such as 401(k) plans or Individual RetirementAccounts.
MANAGEMENT
Investment AdviserHarding Loevner serves as investment adviser to thePortfolio.
7

Portfolio ManagersFerrill Roll, Alexander Walsh, Scott Crawshaw, BryanLloyd, Patrick Todd, and Andrew West serve as theportfolio managers of the International Equity Portfolio.Mr. Roll has held his position since October 2004,Mr. Walsh has held his position since January 2001,Mr. Crawshaw has held his position since January 2018,Mr. Lloyd has held his position since June 2014,Mr. Todd has held his position since January 2017, andMr. West has held his position since June 2014. Messrs.Roll and Walsh are the co-lead portfolio managers.
PURCHASE AND SALE OF PORTFOLIOSHARES
The minimum initial investment in the InstitutionalClass of the Portfolio is $100,000. Additional purchasesmay be for any amount. You may purchase or redeem(sell) shares of the Portfolio on any business day throughcertain authorized brokers and other financialintermediaries or directly from the Portfolio by mail,telephone, or wire.
TAX CONSIDERATIONS
The Portfolio’s distributions are generally taxable to youas ordinary income, capital gains, or a combination ofthe two, unless you are investing through a tax-deferredarrangement, such as a 401(k) plan or an individualretirement account. Upon withdrawal, your investmentthrough a tax-deferred arrangement may becometaxable.
PAYMENTS TO BROKERS-DEALERS ANDOTHER FINANCIAL INTERMEDIARIES
If you purchase Portfolio shares through a broker-dealeror other financial intermediary (such as a bank), thePortfolio and its related companies may pay theintermediary for the sale of Portfolio shares and relatedservices. These payments may create a conflict of interestby influencing the broker-dealer or other intermediaryand your salesperson to recommend the Portfolio overanother investment. Ask your salesperson or visit yourfinancial intermediary’s website for more information.
8

PORTFOLIOSUMMARY
INTERNATIONAL SMALL COMPANIES PORTFOLIO
INVESTMENT OBJECTIVE
The International Small Companies Portfolio (the“Portfolio”) seeks long-term capital appreciation throughinvestments in equity securities of small companies basedoutside the United States.
PORTFOLIO FEES AND EXPENSES
This table describes the fees and expenses that you maypay if you buy and hold shares of the InstitutionalClass of the Portfolio.
SHAREHOLDER FEES(fees paid directly from your investment)
Maximum Sales Charge (Load) Imposed on Purchases(as a percentage of offering price) None
Redemption Fee (as a percentage of amount redeemedwithin 90 days or less from the date of purchase) 2.00%
ANNUAL PORTFOLIO OPERATING EXPENSES(expenses that you pay each year as a percentage of thevalue of your investment)
Management Fees 1.15%
Distribution (12b-1) Fees None
Other Expenses 0.26%
Total Annual Portfolio Operating Expenses 1.41%
Fee Waiver and/or Expense Reimbursement1 -0.26%
Total Annual Portfolio Operating Expenses After Fee
Waiver and/or Expense Reimbursement1 1.15%
1Harding Loevner LP has contractually agreed to waive a portion of its management fee and/orreimburse the Institutional Class of the Portfolio for its other operating expenses to theextent Total Annual Portfolio Operating Expenses (excluding dividend expenses, borrowingcosts, interest expense relating to short sales, interest, taxes, brokerage commissions andextraordinary expenses), as a percentage of average daily net assets, exceed 1.15% throughFebruary 28, 2019.
Example: This example is intended to help you comparethe cost of investing in the Institutional Class of thePortfolio with the cost of investing in other mutual funds.The example assumes that you invest $10,000 in theInstitutional Class of the Portfolio for the time periodsindicated and then redeem all of your shares at the endof those periods. The example also assumes that yourinvestment has a 5% return each year and that theInstitutional Class’s operating expenses remain the same,except that the example assumes the fee waiver andexpense reimbursement agreement pertains only throughFebruary 28, 2019. Although your actual costs may behigher or lower, based on these assumptions your costswould be:
1 YEAR 3 YEARS 5 YEARS 10 YEARS
$117 $421 $746 $1,668
PORTFOLIO TURNOVER
The Portfolio pays transaction costs, such ascommissions, when it buys and sells securities (or “turnsover” its portfolio). A higher portfolio turnover rate mayindicate higher transaction costs and may result in highertaxes when Portfolio shares are held in a taxable account.These costs, which are not reflected in annual portfoliooperating expenses or in the Example, affect thePortfolio’s performance. During the most recent fiscalyear, the Portfolio’s portfolio turnover rate was 19% ofthe average value of its portfolio.
PRINCIPAL INVESTMENT STRATEGIES
The Portfolio invests primarily in small companies basedoutside the United States, including companies inemerging and frontier as well as in developed markets.Companies considered to be small are those having amarket capitalization, at time of purchase, within therange of the market capitalization of companies in thePortfolio’s benchmark index, currently the MSCI AllCountry World ex-US Small Cap Index (the “Index”). Asof December 31, 2017, the range of market capitalizationof companies in the Index was US$43 million toUS$10.2 billion. To reduce its volatility, the Portfolio isdiversified across dimensions of geography, industry, andcurrency. The Portfolio normally holds investmentsacross at least 15 countries.
Factors bearing on whether a company is considered tobe “based” outside the United States may include: (1) itis legally domiciled outside the United States; (2) itconducts at least 50% of its business, as measured by thelocation of its sales, earnings, assets, or production,outside the United States; or (3) it has the principalexchange listing for its securities outside the UnitedStates.
The Portfolio will normally invest broadly in equitysecurities of small companies domiciled in the followingcountries and regions: (1) Europe; (2) the Pacific Rim;(3) Canada and Mexico; and (4) countries with emergingor frontier markets. At least 65% of total assets will bedenominated in at least three currencies other than theU.S. dollar. For purposes of compliance with thisrestriction, American Depositary Receipts, GlobalDepositary Receipts, and European Depositary Receipts(collectively, “Depositary Receipts”) will be considered tobe denominated in the currency of the country where thesecurities underlying the Depositary Receipts areprincipally traded.
The Portfolio invests, under normal circumstances, atleast 80% of its net assets (plus any borrowings forinvestment purposes) in common stocks, preferredstocks, rights, and warrants issued by small companiesthat are based outside the United States, securities
9

convertible into such securities (including DepositaryReceipts), and investment companies that invest in thetypes of securities in which the Portfolio would normallyinvest. If the Portfolio continues to hold securities ofsmall companies whose market capitalization,subsequent to purchase, grows to exceed the upper rangeof the market capitalization of the Index, it may continueto treat them as small for the purposes of the 80%requirement. The Portfolio also may invest in securitiesof small U.S. companies that derive, or are expected toderive, a significant portion of their revenues from theirforeign operations, although under normal circumstancesnot more than 15% of the Portfolio’s total assets will beinvested in securities of U.S. companies.
Because some emerging market countries do not permitforeigners to participate directly in their securitiesmarkets or otherwise present difficulties for efficientforeign investment, the Portfolio may use equityderivative securities, and, in particular, participationnotes, to gain exposure to those countries.
PRINCIPAL RISKS
The Portfolio is subject to numerous risks, any of whichcould cause an investor to lose money. The principalrisks of the Portfolio are as follows:
Market Risk: Investments in the Portfolio may lose valuedue to a general downturn in stock markets.
Currency Risk: Foreign currencies may experiencesteady or sudden devaluation relative to the U.S. dollar,adversely affecting the value of the Portfolio’sinvestments. Because the Portfolio’s net asset value isdetermined on the basis of U.S. dollars, if the localcurrency of a foreign market depreciates against the U.S.dollar, you may lose money even if the foreign marketprices of the Portfolio’s holdings rise.
Foreign Investment Risk: Securities issued by foreignentities involve risks not associated with U.S.investments. These risks include additional taxation,political, economic, social, or diplomatic instability, andthe above-mentioned possibility of changes in foreigncurrency exchange rates. There may also be less publicly-available information about a foreign issuer. Such risksmay be magnified with respect to securities of issuers infrontier emerging markets.
Emerging and Frontier Market Risk: Emerging andfrontier market securities involve certain risks, such asexposure to economies less diverse and mature than thatof the United States or more established foreign markets.Economic or political instability may cause larger pricechanges in emerging or frontier market securities than insecurities of issuers based in more developed foreigncountries.
Small Company Risk: The securities of smallercompanies have historically exhibited more volatilitywith a lower degree of liquidity than larger companies.
Participation Notes Risk: Participation notes are issuedby banks, or broker-dealers, or their affiliates and aredesigned to replicate the return of a particular
underlying equity or debt security, currency, or market.When the participation note matures, the issuer of theparticipation note will pay to, or receive from, thePortfolio the difference between the nominal value of theunderlying instrument at the time of purchase and thatinstrument’s value at maturity. Participation notesinvolve the same risks associated with a directinvestment in the underlying security, currency, ormarket. In addition, participation notes involvecounterparty risk, because the Portfolio has no rightsunder participation notes against the issuer(s) of theunderlying security(ies) and must rely on thecreditworthiness of the issuer of the participation note.
NAV Risk: The net asset value of the Portfolio and thevalue of your investment will fluctuate.
PORTFOLIO PERFORMANCE
The following bar chart shows how the investmentresults of the Portfolio’s Institutional Class shares havevaried from year to year. The table that follows showshow the average annual total returns of the Portfolio’sInstitutional Class shares compare with a broad measureof market performance. Together, these provide anindication of the risks of investing in the Portfolio. Howthe Institutional Class shares of the Portfolio haveperformed in the past (before and after taxes) is notnecessarily an indication of how it will perform in thefuture.
Updated Portfolio performance information is available atwww.hardingloevnerfunds.com or by calling (877) 435-8105.
INTERNATIONAL SMALL COMPANIES PORTFOLIO
24.30% 25.29% -4.38% 34.66%
-20%
-10%
0%
10%
20%
30%
40%
2012 2013 2014 2017
0.30%
2016
4.29%
2015
The best calendar quarter return during the periodshown above was 16.56% in the 1st quarter of 2012; theworst was -8.31% in the 3rd quarter of 2015.
10

AVERAGE ANNUAL TOTAL RETURNS(for the periods ended December 31, 2017)
1-YEAR 5-YEAR
SINCEINCEPTION
6/30/2011
INTERNATIONAL SMALL COMPANIES PORTFOLIO -INSTITUTIONAL CLASS
Return Before Taxes 34.66% 11.03% 8.26%
Return After Taxes onDistributions1 34.27% 10.32% 7.67%
Return After Taxes onDistributions and Sale ofPortfolio Shares1 19.93% 8.74% 6.55%
MSCI ALL COUNTRY WORLDex-U.S. SMALL CAP (NET)INDEX(reflects no deduction for fees,expenses, or U.S. taxes) 31.62% 10.02% 6.80%
1After-tax returns in the table above are calculated using the historical highest individualfederal marginal income tax rates and do not reflect the impact of state and local taxes.Actual after-tax returns depend on an investor’s tax situation and may differ from thoseshown, and after-tax returns shown are not relevant to investors who hold their Portfolioshares through tax-deferred arrangements, such as 401(k) plans or Individual RetirementAccounts.
MANAGEMENT
Investment AdviserHarding Loevner serves as investment adviser to thePortfolio.
Portfolio ManagersJafar Rizvi serves as the portfolio manager of theInternational Small Companies Portfolio. Mr. Rizvi hasheld his position since June 2011.
PURCHASE AND SALE OF PORTFOLIOSHARES
The minimum initial investment in the InstitutionalClass of the Portfolio is $100,000. Additional purchasesmay be for any amount. You may purchase or redeem(sell) shares of the Portfolio on any business day throughcertain authorized brokers and other financialintermediaries or directly from the Portfolio by mail,telephone, or wire.
TAX CONSIDERATIONS
The Portfolio’s distributions are generally taxable to youas ordinary income, capital gains, or a combination ofthe two, unless you are investing through a tax-deferredarrangement, such as a 401(k) plan or an individualretirement account. Upon withdrawal, your investmentthrough a tax-deferred arrangement may becometaxable.
PAYMENTS TO BROKERS-DEALERS ANDOTHER FINANCIAL INTERMEDIARIES
If you purchase Portfolio shares through a broker-dealeror other financial intermediary (such as a bank), thePortfolio and its related companies may pay theintermediary for the sale of Portfolio shares and relatedservices. These payments may create a conflict of interestby influencing the broker-dealer or other intermediaryand your salesperson to recommend the Portfolio overanother investment. Ask your salesperson or visit yourfinancial intermediary’s website for more information.
11
PORTFOLIOSUMMARY
INSTITUTIONAL EMERGING MARKETS PORTFOLIO – CLASS I
INVESTMENT OBJECTIVE
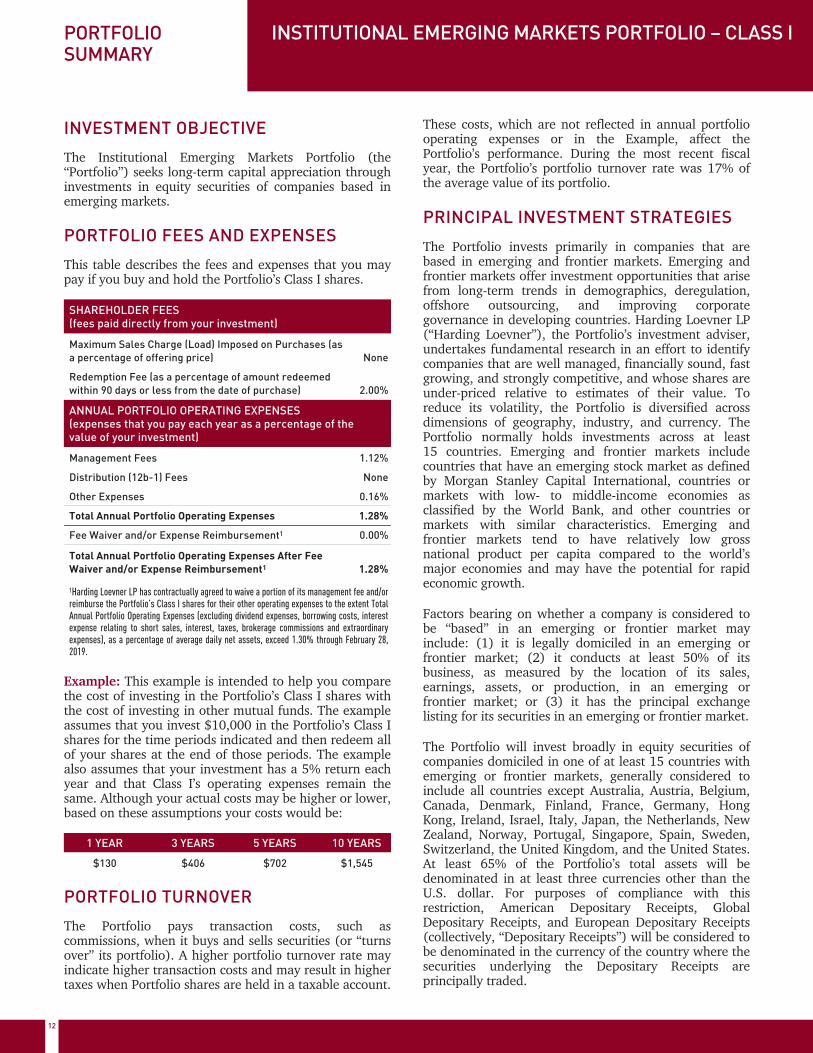
The Institutional Emerging Markets Portfolio (the“Portfolio”) seeks long-term capital appreciation throughinvestments in equity securities of companies based inemerging markets.
PORTFOLIO FEES AND EXPENSES
This table describes the fees and expenses that you maypay if you buy and hold the Portfolio’s Class I shares.
SHAREHOLDER FEES(fees paid directly from your investment)
Maximum Sales Charge (Load) Imposed on Purchases (asa percentage of offering price) None
Redemption Fee (as a percentage of amount redeemedwithin 90 days or less from the date of purchase) 2.00%
ANNUAL PORTFOLIO OPERATING EXPENSES(expenses that you pay each year as a percentage of thevalue of your investment)
Management Fees 1.12%
Distribution (12b-1) Fees None
Other Expenses 0.16%
Total Annual Portfolio Operating Expenses 1.28%
Fee Waiver and/or Expense Reimbursement1 0.00%
Total Annual Portfolio Operating Expenses After Fee
Waiver and/or Expense Reimbursement1 1.28%
1Harding Loevner LP has contractually agreed to waive a portion of its management fee and/orreimburse the Portfolio’s Class I shares for their other operating expenses to the extent TotalAnnual Portfolio Operating Expenses (excluding dividend expenses, borrowing costs, interestexpense relating to short sales, interest, taxes, brokerage commissions and extraordinaryexpenses), as a percentage of average daily net assets, exceed 1.30% through February 28,2019.
Example: This example is intended to help you comparethe cost of investing in the Portfolio’s Class I shares withthe cost of investing in other mutual funds. The exampleassumes that you invest $10,000 in the Portfolio’s Class Ishares for the time periods indicated and then redeem allof your shares at the end of those periods. The examplealso assumes that your investment has a 5% return eachyear and that Class I’s operating expenses remain thesame. Although your actual costs may be higher or lower,based on these assumptions your costs would be:
1 YEAR 3 YEARS 5 YEARS 10 YEARS
$130 $406 $702 $1,545
PORTFOLIO TURNOVER
The Portfolio pays transaction costs, such ascommissions, when it buys and sells securities (or “turnsover” its portfolio). A higher portfolio turnover rate mayindicate higher transaction costs and may result in highertaxes when Portfolio shares are held in a taxable account.
These costs, which are not reflected in annual portfoliooperating expenses or in the Example, affect thePortfolio’s performance. During the most recent fiscalyear, the Portfolio’s portfolio turnover rate was 17% ofthe average value of its portfolio.
PRINCIPAL INVESTMENT STRATEGIES
The Portfolio invests primarily in companies that arebased in emerging and frontier markets. Emerging andfrontier markets offer investment opportunities that arisefrom long-term trends in demographics, deregulation,offshore outsourcing, and improving corporategovernance in developing countries. Harding Loevner LP(“Harding Loevner”), the Portfolio’s investment adviser,undertakes fundamental research in an effort to identifycompanies that are well managed, financially sound, fastgrowing, and strongly competitive, and whose shares areunder-priced relative to estimates of their value. Toreduce its volatility, the Portfolio is diversified acrossdimensions of geography, industry, and currency. ThePortfolio normally holds investments across at least15 countries. Emerging and frontier markets includecountries that have an emerging stock market as definedby Morgan Stanley Capital International, countries ormarkets with low- to middle-income economies asclassified by the World Bank, and other countries ormarkets with similar characteristics. Emerging andfrontier markets tend to have relatively low grossnational product per capita compared to the world’smajor economies and may have the potential for rapideconomic growth.
Factors bearing on whether a company is considered tobe “based” in an emerging or frontier market mayinclude: (1) it is legally domiciled in an emerging orfrontier market; (2) it conducts at least 50% of itsbusiness, as measured by the location of its sales,earnings, assets, or production, in an emerging orfrontier market; or (3) it has the principal exchangelisting for its securities in an emerging or frontier market.
The Portfolio will invest broadly in equity securities ofcompanies domiciled in one of at least 15 countries withemerging or frontier markets, generally considered toinclude all countries except Australia, Austria, Belgium,Canada, Denmark, Finland, France, Germany, HongKong, Ireland, Israel, Italy, Japan, the Netherlands, NewZealand, Norway, Portugal, Singapore, Spain, Sweden,Switzerland, the United Kingdom, and the United States.At least 65% of the Portfolio’s total assets will bedenominated in at least three currencies other than theU.S. dollar. For purposes of compliance with thisrestriction, American Depositary Receipts, GlobalDepositary Receipts, and European Depositary Receipts(collectively, “Depositary Receipts”) will be considered tobe denominated in the currency of the country where thesecurities underlying the Depositary Receipts areprincipally traded.
12

The Portfolio invests at least 65% of its total assets incommon stocks, preferred stocks, rights, and warrantsissued by companies that are based in emerging orfrontier markets, securities convertible into suchsecurities (including Depositary Receipts), andinvestment companies that invest in the types ofsecurities in which the Portfolio would normally invest.The Portfolio also may invest in securities of U.S.companies that derive, or are expected to derive, asignificant portion of their revenues from their foreignoperations, although under normal circumstances, notmore than 15% of the Portfolio’s total assets will beinvested in securities of U.S. companies.
The Portfolio invests, under normal circumstances, atleast 80% of its net assets (plus any borrowings forinvestment purposes) in emerging markets securities,which includes frontier markets securities, andinvestment companies that invest in the types ofsecurities in which the Portfolio would normally invest.
Because some emerging market countries do not permitforeigners to participate directly in their securitiesmarkets or otherwise present difficulties for efficientforeign investment, the Portfolio may use equityderivative securities, and, in particular, participationnotes, to gain exposure to those countries.
PRINCIPAL RISKS
The Portfolio is subject to numerous risks, any of whichcould cause an investor to lose money. The principal risksof the Portfolio are as follows:
Market Risk: Investments in the Portfolio may lose valuedue to a general downturn in stock markets.
Currency Risk: Foreign currencies may experiencesteady or sudden devaluation relative to the U.S. dollar,adversely affecting the value of the Portfolio’sinvestments. Because the Portfolio’s net asset value isdetermined on the basis of U.S. dollars, if the localcurrency of a foreign market depreciates against the U.S.dollar, you may lose money even if the foreign marketprices of the Portfolio’s holdings rise.
Foreign Investment Risk: Securities issued by foreignentities involve risks not associated with U.S.investments. These risks include additional taxation,political, economic, social, or diplomatic instability, andthe above-mentioned possibility of changes in foreigncurrency exchange rates. There may also be less publicly-available information about a foreign issuer. Such risksmay be magnified with respect to securities of issuers infrontier emerging markets.
Emerging and Frontier Market Risk: Emerging andfrontier market securities involve certain risks, such asexposure to economies less diverse and mature than thatof the United States or more established foreign markets.Economic or political instability may cause larger pricechanges in emerging or frontier market securities than insecurities of issuers based in more developed foreigncountries.
Participation Notes Risk: Participation notes are issuedby banks, or broker-dealers, or their affiliates and aredesigned to replicate the return of a particularunderlying equity or debt security, currency, or market.When the participation note matures, the issuer of theparticipation note will pay to, or receive from, thePortfolio the difference between the nominal value of theunderlying instrument at the time of purchase and thatinstrument’s value at maturity. Participation notesinvolve the same risks associated with a directinvestment in the underlying security, currency, ormarket. In addition, participation notes involvecounterparty risk, because the Portfolio has no rightsunder participation notes against the issuer(s) of theunderlying security(ies) and must rely on thecreditworthiness of the issuer of the participation note.
NAV Risk: The net asset value of the Portfolio and thevalue of your investment will fluctuate.
Financials Sector Risk: To the extent the Portfolioinvests in securities and other obligations of issuers in thefinancials sector, the Portfolio will be vulnerable toevents affecting companies in the financials industry.Examples of risks affecting the financials sector includechanges in governmental regulation, issues relating tothe availability and cost of capital, changes in interestrates and/or monetary policy, and price competition. Inaddition, financials companies are often more highlyleveraged than other companies, making them inherentlyriskier.
PORTFOLIO PERFORMANCE
The following bar chart shows how the investmentresults of the Portfolio’s Class I shares have varied fromyear to year. The table that follows shows how theaverage annual total returns of the Portfolio’s Class Ishares compare with a broad measure of marketperformance. Together, these provide an indication ofthe risks of investing in the Portfolio. How the Portfolio’sClass I shares have performed in the past (before andafter taxes) is not necessarily an indication of how theywill perform in the future.
Updated Portfolio performance information is available atwww.hardingloevnerfunds.com or by calling (877) 435-8105.
INSTITUTIONAL EMERGING MARKETS PORTFOLIO – CLASS I
-60%
-20%
0%
20%
40%
60%
80%
35.33%
2017
20.80% -16.97% 22.46% 4.35% -1.87%-52.48%
2008
63.97%
2009 2010 2011 2012 2013 2014
13.27%
2016
-13.47%
2015
-40%
The best calendar quarter return during the periodshown above was 33.21% in the 2nd quarter of 2009; theworst was -28.41% in the 4th quarter of 2008.
13
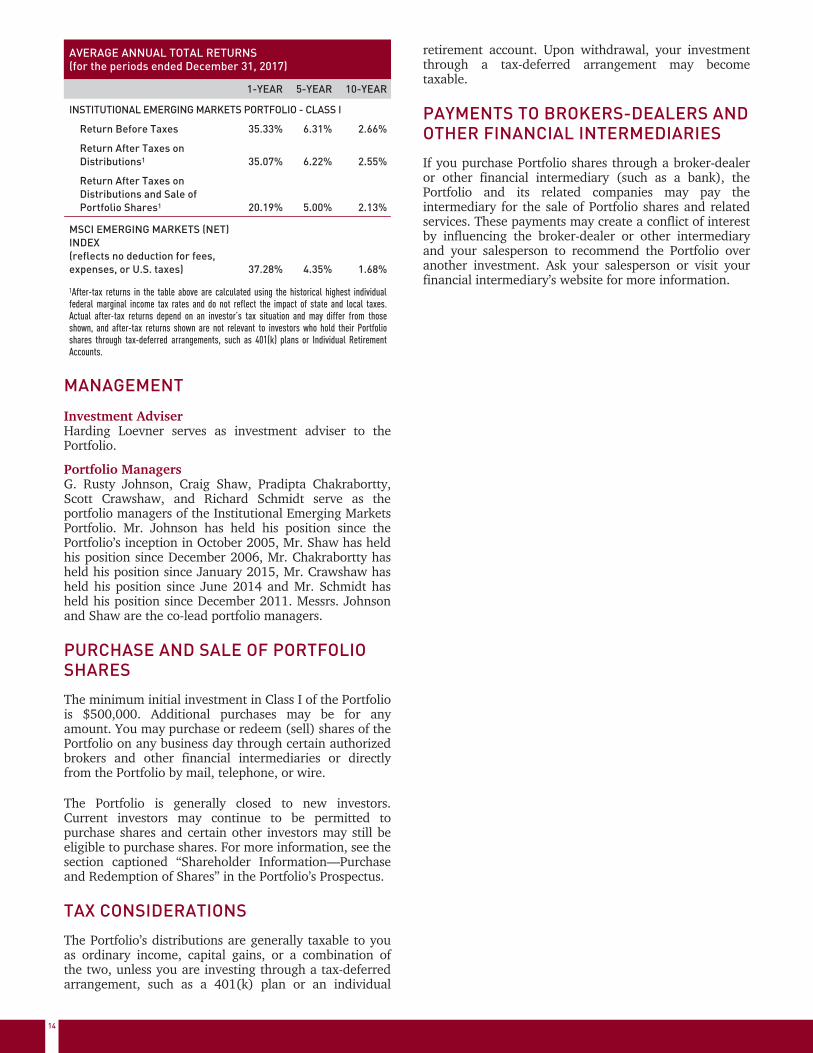
AVERAGE ANNUAL TOTAL RETURNS(for the periods ended December 31, 2017)
1-YEAR 5-YEAR 10-YEAR
INSTITUTIONAL EMERGING MARKETS PORTFOLIO - CLASS I
Return Before Taxes 35.33% 6.31% 2.66%
Return After Taxes onDistributions1 35.07% 6.22% 2.55%
Return After Taxes onDistributions and Sale ofPortfolio Shares1 20.19% 5.00% 2.13%
MSCI EMERGING MARKETS (NET)INDEX(reflects no deduction for fees,expenses, or U.S. taxes) 37.28% 4.35% 1.68%
1After-tax returns in the table above are calculated using the historical highest individualfederal marginal income tax rates and do not reflect the impact of state and local taxes.Actual after-tax returns depend on an investor’s tax situation and may differ from thoseshown, and after-tax returns shown are not relevant to investors who hold their Portfolioshares through tax-deferred arrangements, such as 401(k) plans or Individual RetirementAccounts.
MANAGEMENT
Investment AdviserHarding Loevner serves as investment adviser to thePortfolio.
Portfolio ManagersG. Rusty Johnson, Craig Shaw, Pradipta Chakrabortty,Scott Crawshaw, and Richard Schmidt serve as theportfolio managers of the Institutional Emerging MarketsPortfolio. Mr. Johnson has held his position since thePortfolio’s inception in October 2005, Mr. Shaw has heldhis position since December 2006, Mr. Chakrabortty hasheld his position since January 2015, Mr. Crawshaw hasheld his position since June 2014 and Mr. Schmidt hasheld his position since December 2011. Messrs. Johnsonand Shaw are the co-lead portfolio managers.
PURCHASE AND SALE OF PORTFOLIOSHARES
The minimum initial investment in Class I of the Portfoliois $500,000. Additional purchases may be for anyamount. You may purchase or redeem (sell) shares of thePortfolio on any business day through certain authorizedbrokers and other financial intermediaries or directlyfrom the Portfolio by mail, telephone, or wire.
The Portfolio is generally closed to new investors.Current investors may continue to be permitted topurchase shares and certain other investors may still beeligible to purchase shares. For more information, see thesection captioned “Shareholder Information—Purchaseand Redemption of Shares” in the Portfolio’s Prospectus.
TAX CONSIDERATIONS
The Portfolio’s distributions are generally taxable to youas ordinary income, capital gains, or a combination ofthe two, unless you are investing through a tax-deferredarrangement, such as a 401(k) plan or an individual
retirement account. Upon withdrawal, your investmentthrough a tax-deferred arrangement may becometaxable.
PAYMENTS TO BROKERS-DEALERS ANDOTHER FINANCIAL INTERMEDIARIES
If you purchase Portfolio shares through a broker-dealeror other financial intermediary (such as a bank), thePortfolio and its related companies may pay theintermediary for the sale of Portfolio shares and relatedservices. These payments may create a conflict of interestby influencing the broker-dealer or other intermediaryand your salesperson to recommend the Portfolio overanother investment. Ask your salesperson or visit yourfinancial intermediary’s website for more information.
14

PORTFOLIOSUMMARY
INSTITUTIONAL EMERGING MARKETS PORTFOLIO –CLASS II
INVESTMENT OBJECTIVE
The Institutional Emerging Markets Portfolio (the“Portfolio”) seeks long-term capital appreciation throughinvestments in equity securities of companies based inemerging markets.
PORTFOLIO FEES AND EXPENSES
This table describes the fees and expenses that you maypay if you buy and hold the Portfolio’s Class II shares.
SHAREHOLDER FEES(fees paid directly from your investment)
Maximum Sales Charge (Load) Imposed on Purchases(as a percentage of offering price) None
Redemption Fee (as a percentage of amount redeemedwithin 90 days or less from the date of purchase) 2.00%
ANNUAL PORTFOLIO OPERATING EXPENSES(expenses that you pay each year as a percentage of thevalue of your investment)
Management Fees 1.12%
Distribution (12b-1) Fees None
Other Expenses 0.11%
Total Annual Portfolio Operating Expenses 1.23%
Fee Waiver and/or Expense Reimbursement1 -0.11%
Total Annual Portfolio Operating Expenses After Fee
Waiver and/or Expense Reimbursement1 1.12%
1Harding Loevner LP has contractually agreed to waive a portion of its management fee and/orreimburse the Portfolio’s Class II shares for their other operating expenses to the extent TotalAnnual Portfolio Operating Expenses (excluding dividend expenses, borrowing costs, interestexpense relating to short sales, interest, taxes, brokerage commissions and extraordinaryexpenses), as a percentage of average daily net assets, exceed the applicable contractualmanagement fee, currently 1.15% on the first $1 billion of average daily net assets, 1.13% onthe next $1 billion, 1.11% on the next $1 billion, and 1.09% for average daily net assets over$3 billion, through February 28, 2019.
Example: This example is intended to help youcompare the cost of investing in the Portfolio’s Class IIshares with the cost of investing in other mutual funds.The example assumes that you invest $10,000 in thePortfolio’s Class II shares for the time periods indicatedand then redeem all of your shares at the end of thoseperiods. The example also assumes that yourinvestment has a 5% return each year and thatPortfolio’s Class II’s operating expenses remain thesame, except that the example assumes the fee waiverand expense reimbursement agreement pertains onlythrough February 28, 2019. Although your actual costsmay be higher or lower, based on these assumptionsyour costs would be:
1 YEAR 3 YEARS 5 YEARS 10 YEARS
$114 $379 $665 $1,479
PORTFOLIO TURNOVER
The Portfolio pays transaction costs, such ascommissions, when it buys and sells securities (or “turnsover” its portfolio). A higher portfolio turnover rate mayindicate higher transaction costs and may result in highertaxes when Portfolio shares are held in a taxable account.These costs, which are not reflected in annual portfoliooperating expenses or in the Example, affect thePortfolio’s performance. During the most recent fiscalyear, the Portfolio’s portfolio turnover rate was 17% ofthe average value of its portfolio.
PRINCIPAL INVESTMENT STRATEGIES
The Portfolio invests primarily in companies that arebased in emerging and frontier markets. Emerging andfrontier markets offer investment opportunities that arisefrom long-term trends in demographics, deregulation,offshore outsourcing, and improving corporategovernance in developing countries. Harding Loevner LP(“Harding Loevner”), the Portfolio’s investment adviser,undertakes fundamental research in an effort to identifycompanies that are well managed, financially sound, fastgrowing, and strongly competitive, and whose shares areunder-priced relative to estimates of their value. Toreduce its volatility, the Portfolio is diversified acrossdimensions of geography, industry, and currency. ThePortfolio normally holds investments across at least 15countries. Emerging and frontier markets includecountries that have an emerging stock market as definedby Morgan Stanley Capital International, countries ormarkets with low- to middle-income economies asclassified by the World Bank, and other countries ormarkets with similar characteristics. Emerging andfrontier markets tend to have relatively low grossnational product per capita compared to the world’smajor economies and may have the potential for rapideconomic growth.
Factors bearing on whether a company is considered tobe “based” in an emerging or frontier market mayinclude: (1) it is legally domiciled in an emerging orfrontier market; (2) it conducts at least 50% of itsbusiness, as measured by the location of its sales,earnings, assets, or production, in an emerging orfrontier market; or (3) it has the principal exchangelisting for its securities in an emerging or frontier market.
The Portfolio will invest broadly in equity securities ofcompanies domiciled in one of at least 15 countries withemerging or frontier markets, generally considered toinclude all countries except Australia, Austria, Belgium,Canada, Denmark, Finland, France, Germany, HongKong, Ireland, Israel, Italy, Japan, the Netherlands, NewZealand, Norway, Portugal, Singapore, Spain, Sweden,Switzerland, the United Kingdom, and the United States.At least 65% of the Portfolio’s total assets will bedenominated in at least three currencies other than the
15

U.S. dollar. For purposes of compliance with thisrestriction, American Depositary Receipts, GlobalDepositary Receipts, and European Depositary Receipts(collectively, “Depositary Receipts”) will be considered tobe denominated in the currency of the country where thesecurities underlying the Depositary Receipts areprincipally traded.
The Portfolio invests at least 65% of its total assets incommon stocks, preferred stocks, rights, and warrantsissued by companies that are based in emerging orfrontier markets, securities convertible into suchsecurities (including Depositary Receipts), andinvestment companies that invest in the types ofsecurities in which the Portfolio would normally invest.The Portfolio also may invest in securities of U.S.companies that derive, or are expected to derive, asignificant portion of their revenues from their foreignoperations, although under normal circumstances, notmore than 15% of the Portfolio’s total assets will beinvested in securities of U.S. companies.
The Portfolio invests, under normal circumstances, atleast 80% of its net assets (plus any borrowings forinvestment purposes) in emerging markets securities,which includes frontier markets securities, andinvestment companies that invest in the types ofsecurities in which the Portfolio would normally invest.
Because some emerging market countries do not permitforeigners to participate directly in their securitiesmarkets or otherwise present difficulties for efficientforeign investment, the Portfolio may use equityderivative securities, and, in particular, participationnotes, to gain exposure to those countries.
PRINCIPAL RISKS
The Portfolio is subject to numerous risks, any of whichcould cause an investor to lose money. The principalrisks of the Portfolio are as follows:
Market Risk: Investments in the Portfolio may lose valuedue to a general downturn in stock markets.
Currency Risk: Foreign currencies may experiencesteady or sudden devaluation relative to the U.S. dollar,adversely affecting the value of the Portfolio’sinvestments. Because the Portfolio’s net asset value isdetermined on the basis of U.S. dollars, if the localcurrency of a foreign market depreciates against the U.S.dollar, you may lose money even if the foreign marketprices of the Portfolio’s holdings rise.
Foreign Investment Risk: Securities issued by foreignentities involve risks not associated with U.S.investments. These risks include additional taxation,political, economic, social, or diplomatic instability, andthe above-mentioned possibility of changes in foreigncurrency exchange rates. There may also be less publicly-available information about a foreign issuer. Such risksmay be magnified with respect to securities of issuers infrontier emerging markets.
Emerging and Frontier Market Risk: Emerging andfrontier market securities involve certain risks, such asexposure to economies less diverse and mature than thatof the United States or more established foreign markets.Economic or political instability may cause larger pricechanges in emerging or frontier market securities than insecurities of issuers based in more developed foreigncountries.
Participation Notes Risk: Participation notes are issuedby banks, or broker-dealers, or their affiliates and aredesigned to replicate the return of a particularunderlying equity or debt security, currency, or market.When the participation note matures, the issuer of theparticipation note will pay to, or receive from, thePortfolio the difference between the nominal value of theunderlying instrument at the time of purchase and thatinstrument’s value at maturity. Participation notesinvolve the same risks associated with a directinvestment in the underlying security, currency, ormarket. In addition, participation notes involvecounterparty risk, because the Portfolio has no rightsunder participation notes against the issuer(s) of theunderlying security(ies) and must rely on thecreditworthiness of the issuer of the participation note.
NAV Risk: The net asset value of the Portfolio and thevalue of your investment will fluctuate.
Financials Sector Risk: To the extent the Portfolioinvests in securities and other obligations of issuers in thefinancials sector, the Portfolio will be vulnerable toevents affecting companies in the financials industry.Examples of risks affecting the financials sector includechanges in governmental regulation, issues relating tothe availability and cost of capital, changes in interestrates and/or monetary policy, and price competition. Inaddition, financials companies are often more highlyleveraged than other companies, making them inherentlyriskier.
PORTFOLIO PERFORMANCE
The following bar chart shows how the investmentresults of the Portfolio’s Class II shares have varied fromyear to year. The table that follows shows how theaverage total returns of the Portfolio’s Class II sharescompare with a broad measure of market performance.Together, these provide an indication of the risks ofinvesting in the Portfolio. How the Portfolio’s Class IIshares have performed in the past (before and aftertaxes) is not necessarily an indication of how they willperform in the future.
Updated Portfolio performance information is availableat www.hardingloevnerfunds.com or by calling(877) 435-8105.
16

INSTITUTIONAL EMERGING MARKETS PORTFOLIO – CLASS II
13.44%
-20%
-10%
0%
10%
40%
2016
35.79%
2017
-13.31%
2015
30%
20%
The best calendar quarter return during the periodshown above was 11.83% in the 1st quarter of 2017; theworst was -15.50% in the 3rd quarter of 2015.
AVERAGE ANNUAL TOTAL RETURNS(for the periods ended December 31, 2017)
1-YEAR
SINCEINCEPTION
3/5/2014
INSTITUTIONAL EMERGING MARKETS PORTFOLIO - CLASS II
Return Before Taxes 35.79% 8.09%
Return After Taxes on Distributions1 35.52% 7.96%
Return After Taxes on Distributionsand Sale of Portfolio Shares1 20.47% 6.43%
MSCI EMERGING MARKETS (NET) INDEX(reflects no deduction for fees, expenses,or U.S. taxes) 37.28% 7.63%
1After-tax returns in the table above are calculated using the historical highest individualfederal marginal income tax rates and do not reflect the impact of state and local taxes.Actual after-tax returns depend on an investor’s tax situation and may differ from thoseshown, and after-tax returns shown are not relevant to investors who hold their Portfolioshares through tax-deferred arrangements, such as 401(k) plans or Individual RetirementAccounts.
MANAGEMENT
Investment AdviserHarding Loevner serves as investment adviser to thePortfolio.
Portfolio ManagersG. Rusty Johnson, Craig Shaw, Pradipta Chakrabortty,Scott Crawshaw, and Richard Schmidt serve as theportfolio managers of the Institutional Emerging MarketsPortfolio. Mr. Johnson has held his position since thePortfolio’s inception in October 2005, Mr. Shaw has heldhis position since December 2006, Mr. Chakrabortty hasheld his position since January 2015, Mr. Crawshaw hasheld his position since June 2014 and Mr. Schmidt hasheld his position since December 2011. Messrs. Johnsonand Shaw are the co-lead portfolio managers.
PURCHASE AND SALE OF PORTFOLIOSHARES
The minimum initial investment in Class II of thePortfolio is $25,000,000. Additional purchases may befor any amount. You may purchase or redeem (sell)shares of the Portfolio on any business day through
certain authorized brokers and other financialintermediaries or directly from the Portfolio by mail,telephone, or wire.
The Portfolio is generally closed to new investors.Current investors may continue to be permitted topurchase shares and certain other investors may still beeligible to purchase shares. For more information, see thesection captioned “Shareholder Information—Purchaseand Redemption of Shares” in the Portfolio’s prospectus.
TAX CONSIDERATIONS
The Portfolio’s distributions are generally taxable to youas ordinary income, capital gains, or a combination ofthe two, unless you are investing through a tax-deferredarrangement, such as a 401(k) plan or an individualretirement account. Upon withdrawal, your investmentthrough a tax-deferred arrangement may becometaxable.
PAYMENTS TO BROKERS-DEALERS ANDOTHER FINANCIAL INTERMEDIARIES
If you purchase Portfolio shares through a broker-dealeror other financial intermediary (such as a bank), thePortfolio and its related companies may pay theintermediary for the sale of Portfolio shares and relatedservices. These payments may create a conflict of interestby influencing the broker-dealer or other intermediaryand your salesperson to recommend the Portfolio overanother investment. Ask your salesperson or visit yourfinancial intermediary’s website for more information.
17

PORTFOLIOSUMMARY
FRONTIER EMERGING MARKETS PORTFOLIO –INSTITUTIONAL CLASS I
INVESTMENT OBJECTIVE
The Frontier Emerging Markets Portfolio (the “Portfolio”)seeks long-term capital appreciation through investmentsin equity securities of companies based in frontier andsmaller emerging markets.
PORTFOLIO FEES AND EXPENSES
This table describes the fees and expenses that you maypay if you buy and hold the Portfolio’s InstitutionalClass I (formerly “Institutional Class”) shares.
SHAREHOLDER FEES(fees paid directly from your investment)
Maximum Sales Charge (Load) Imposed on Purchases (asa percentage of offering price) None
Redemption Fee (as a percentage of amount redeemedwithin 90 days or less from the date of purchase) 2.00%
ANNUAL PORTFOLIO OPERATING EXPENSES1
(expenses that you pay each year as a percentage of thevalue of your investment)
Management Fees 1.35%
Distribution (12b-1) Fees None
Other Expenses 0.31%
Total Annual Portfolio Operating Expenses 1.66%
Fee Waiver and/or Expense Reimbursement2 0.00%
Total Annual Portfolio Operating Expenses After Fee
Waiver and/or Expense Reimbursement2 1.66%
1Expense information in this table has been restated to reflect current fees. Therefore, theexpenses in this table will not correlate to the expenses shown in the Financial Highlights ofthe Portfolio.2Harding Loevner LP has contractually agreed to waive a portion of its management fee and/orreimburse the Institutional Class I of the Portfolio for its other operating expenses to theextent Total Annual Portfolio Operating Expenses (excluding dividend expenses, borrowingcosts, interest expense relating to short sales, interest, taxes, brokerage commissions andextraordinary expenses), as a percentage of average daily net assets, exceed 1.75% throughFebruary 28, 2019.
Example: This example is intended to help youcompare the cost of investing in the Portfolio’sInstitutional Class I shares with the cost of investing inother mutual funds. The example assumes that youinvest $10,000 in the Portfolio’s Institutional Class Ishares for the time periods indicated and then redeemall of your shares at the end of those periods. Theexample also assumes that your investment has a 5%return each year and that Institutional Class I’soperating expenses remain the same. Although youractual costs may be higher or lower, based on theseassumptions your costs would be:
1 YEAR 3 YEARS 5 YEARS 10 YEARS
$169 $523 $902 $1,965
PORTFOLIO TURNOVER
The Portfolio pays transaction costs, such ascommissions, when it buys and sells securities (or “turnsover” its portfolio). A higher portfolio turnover rate mayindicate higher transaction costs and may result in highertaxes when Portfolio shares are held in a taxable account.These costs, which are not reflected in annual portfoliooperating expenses or in the Example, affect thePortfolio’s performance. During the most recent fiscalyear, the Portfolio’s portfolio turnover rate was 28% ofthe average value of its portfolio.
PRINCIPAL INVESTMENT STRATEGIES
The Portfolio invests primarily in companies that arebased in frontier emerging markets, including the smallertraditionally-recognized emerging markets. Frontieremerging markets, with the exception of theoil-producing Gulf States and certain of the smallertraditionally-recognized emerging markets, tend to haverelatively low gross national product per capita comparedto the larger traditionally-recognized emerging marketsand the world’s major developed economies. The frontieremerging markets include the least developed marketseven by emerging markets standards. Frontier emergingmarkets offer investment opportunities that arise fromlong-term trends in demographics, deregulation, offshoreoutsourcing, and improving corporate governance indeveloping countries. Harding Loevner LP (“HardingLoevner”), the Portfolio’s investment adviser, undertakesfundamental research in an effort to identify companiesthat are well managed, financially sound, fast growing,and strongly competitive, and whose shares are under-priced relative to estimates of their value. To reduce itsvolatility, the Portfolio is diversified across dimensions ofgeography, industry, and currency. The Portfolionormally holds investments across at least 15 countries.
As used herein, frontier emerging markets includecountries that are represented in the MSCI FrontierMarkets Index or the S&P Frontier Markets BMI, orsimilar market indices, and the smaller of thetraditionally-recognized emerging markets, such as thoseindividually constituting less than 5% of the MSCIEmerging Markets Index or the S&P Emerging MarketsBMI. Factors bearing on whether a company isconsidered to be “based” in a frontier emerging marketmay include: (1) it is legally domiciled in a frontieremerging market; (2) it conducts at least 50% of itsbusiness, as measured by the location of its sales,earnings, assets, or production, in frontier emergingmarkets; or (3) it has the principal exchange listing forits securities in a frontier emerging market. Frontieremerging markets generally include all countries exceptAustralia, Austria, Belgium, Canada, Denmark, Finland,France, Germany, Hong Kong, Ireland, Israel, Italy,Japan, the Netherlands, New Zealand, Norway, Portugal,Singapore, Spain, Sweden, Switzerland, the United
18

Kingdom, and the United States and the largertraditionally-recognized emerging markets of Taiwan,South Korea, Mexico, South Africa, Brazil, India, China,and Russia. At least 65% of the Portfolio’s total assetswill be denominated in at least three currencies otherthan the U.S. dollar. For purposes of compliance withthis restriction, American Depositary Receipts, GlobalDepositary Receipts, and European Depositary Receipts(collectively, “Depositary Receipts”) will be considered tobe denominated in the currency of the country where thesecurities underlying the Depositary Receipts areprincipally traded.
The Portfolio invests at least 65% of its total assets incommon stocks, preferred stocks, rights, and warrantsissued by companies that are based in the frontieremerging markets, securities convertible into suchsecurities (including Depositary Receipts), andinvestment companies that invest in the types ofsecurities in which the Portfolio would normally invest.The Portfolio also may invest in securities of U.S.companies that derive, or are expected to derive, asignificant portion of their revenues from their foreignoperations, although under normal circumstances, notmore than 15% of the Portfolio’s total assets will beinvested in securities of U.S. companies.
The Portfolio invests, under normal circumstances, atleast 80% of its net assets (plus any borrowings forinvestment purposes) in frontier emerging marketsecurities, and investment companies that invest in thetypes of securities in which the Portfolio would normallyinvest.
The Portfolio may invest up to 35% of its total assets insecurities of companies in any one industry if, at the timeof investment, that industry represents 20% or more ofthe Portfolio’s benchmark index, currently the MSCIFrontier Emerging Markets Index.
Because some frontier emerging market countries do notpermit foreigners to participate directly in their securitiesmarkets or otherwise present difficulties for efficientforeign investment, the Portfolio may use equityderivative securities, and, in particular, participationnotes, to gain exposure to those countries.
PRINCIPAL RISKS
The Portfolio is subject to numerous risks, any of whichcould cause an investor to lose money. The principalrisks of the Portfolio are as follows:
Market Risk: Investments in the Portfolio may lose valuedue to a general downturn in stock markets.
Currency Risk: Foreign currencies may experiencesteady or sudden devaluation relative to the U.S. dollar,adversely affecting the value of the Portfolio’sinvestments. Because the Portfolio’s net asset value isdetermined on the basis of U.S. dollars, if the localcurrency of a foreign market depreciates against the U.S.dollar, you may lose money even if the foreign marketprices of the Portfolio’s holdings rise.
Foreign Investment Risk: Securities issued by foreignentities involve risks not associated with U.S.investments. These risks include additional taxation,political, economic, social, or diplomatic instability, andthe above-mentioned possibility of changes in the foreigncurrency exchange rates. There may also be less publicly-available information about a foreign issuer. Such risksmay be magnified with respect to securities of issuers infrontier emerging markets.
Frontier Emerging Market Risk: Frontier emergingmarket securities involve certain risks, such as exposureto economies less diverse and mature than that of theUnited States or more established foreign markets.Economic or political instability may cause larger pricechanges in frontier emerging market securities than insecurities of issuers based in more developed foreigncountries, including securities of issuers based in largeremerging markets. Frontier emerging markets generallyreceive less investor attention than developed marketsand larger emerging markets.
Participation Notes Risk: Participation notes are issuedby banks, or broker-dealers, or their affiliates and aredesigned to replicate the return of a particularunderlying equity or debt security, currency, or market.When the participation note matures, the issuer of theparticipation note will pay to, or receive from, thePortfolio the difference between the nominal value of theunderlying instrument at the time of purchase and thatinstrument’s value at maturity. Participation notesinvolve the same risks associated with a directinvestment in the underlying security, currency, ormarket. In addition, participation notes involvecounterparty risk, because the Portfolio has no rightsunder participation notes against the issuer(s) of theunderlying security(ies) and must rely on thecreditworthiness of the issuer of the participation note.
Concentration Risk: The Portfolio may invest up to 35%of its total assets in securities of companies in any oneindustry if, at the time of investment, that industryrepresents 20% or more of the Portfolio’s benchmarkindex, currently the MSCI Frontier Emerging MarketsIndex. Accordingly, at any time the Portfolio has such aconcentration of investments in a single industry group,it will be particularly vulnerable to factors that adverselyaffect that industry group.
NAV Risk: The net asset value of the Portfolio and thevalue of your investment will fluctuate.
Financial Services Sector Risk: To the extent thePortfolio invests in securities and other obligations ofissuers in the financials sector, the Portfolio will bevulnerable to events affecting companies in the financialsindustry. Examples of risks affecting the financials sectorinclude changes in governmental regulation, issuesrelating to the availability and cost of capital, changes ininterest rates and/or monetary policy, and pricecompetition. In addition, financials companies are oftenmore highly leveraged than other companies, makingthem inherently riskier.
19

PORTFOLIO PERFORMANCE
The following bar chart shows how the investmentresults of the Portfolio’s Institutional Class I shares havevaried from year to year. The table that follows showshow the average annual total returns of the Portfolio’sInstitutional Class I shares compare with a broadmeasure of market performance. Together, these providean indication of the risks of investing in the Portfolio.How the Portfolio’s Institutional Class I shares haveperformed in the past (before and after taxes) is notnecessarily an indication of how they will perform in thefuture.
Updated Portfolio performance information is available atwww.hardingloevnerfunds.com or by calling (877) 435-8105.
FRONTIER EMERGING MARKETS PORTFOLIO
38.97% -21.03% 19.88% 17.03% 6.22% 25.09%
-30%
-10%
0%
10%
20%
40%
2009
24.84%
2010 2011 2012 2013 2014 2017
2.16%
2016
-19.10%
2015
30%
-20%
The best calendar quarter return during the periodshown above was 37.37% in the 2nd quarter of 2009; theworst was -15.65% in the 3rd quarter of 2011.
AVERAGE ANNUAL TOTAL RETURNS(for the periods ended December 31, 2017)
1-YEAR 5-YEAR
SINCEINCEPTION
5/27/2008
FRONTIER EMERGING MARKETS PORTFOLIO -INSTITUTIONAL CLASS I
Return Before Taxes 25.09% 5.14% -0.30%
Return After Taxes onDistributions1 24.51% 5.05% -0.38%
Return After Taxes onDistributions and Sale ofPortfolio Shares1 14.65% 4.19% -0.12%
MSCI FRONTIER EMERGINGMARKETS (NET) INDEX(reflects no deduction for fees,expenses, or U.S. taxes) 26.78% 3.98% -1.25%
1After-tax returns in the table above are calculated using the historical highest individualfederal marginal income tax rates and do not reflect the impact of state and local taxes.Actual after-tax returns depend on an investor’s tax situation and may differ from thoseshown, and after-tax returns shown are not relevant to investors who hold their Portfolioshares through tax-deferred arrangements, such as 401(k) plans or Individual RetirementAccounts.
MANAGEMENT
Investment AdviserHarding Loevner serves as investment adviser to thePortfolio.
Portfolio ManagersPradipta Chakrabortty and Babatunde Ojo serve as theportfolio managers of the Frontier Emerging MarketsPortfolio. Mr. Chakrabortty has held his position sinceDecember 2008 and Mr. Ojo has held his position sinceJune 2014. Messrs. Chakrabortty and Ojo are the co-leadportfolio managers.
PURCHASE AND SALE OF PORTFOLIOSHARES
The minimum initial investment in Institutional Class I ofthe Portfolio is $100,000. Additional purchases may befor any amount. You may purchase or redeem (sell)shares of the Portfolio on any business day throughcertain authorized brokers and other financialintermediaries or directly from the Portfolio by mail,telephone, or wire.
TAX CONSIDERATIONS
The Portfolio’s distributions are generally taxable to youas ordinary income, capital gains, or a combination ofthe two, unless you are investing through a tax-deferredarrangement, such as a 401(k) plan or an individualretirement account. Upon withdrawal, your investmentthrough a tax-deferred arrangement may becometaxable.
PAYMENTS TO BROKERS-DEALERS ANDOTHER FINANCIAL INTERMEDIARIES
If you purchase Portfolio shares through a broker-dealeror other financial intermediary (such as a bank), thePortfolio and its related companies may pay theintermediary for the sale of Portfolio shares and relatedservices. These payments may create a conflict of interestby influencing the broker-dealer or other intermediaryand your salesperson to recommend the Portfolio overanother investment. Ask your salesperson or visit yourfinancial intermediary’s website for more information.
20

PORTFOLIOSUMMARY
FRONTIER EMERGING MARKETS PORTFOLIO –INSTITUTIONAL CLASS II
INVESTMENT OBJECTIVE
The Frontier Emerging Markets Portfolio (the “Portfolio”)seeks long-term capital appreciation through investmentsin equity securities of companies based in frontier andsmaller emerging markets.
PORTFOLIO FEES AND EXPENSES
This table describes the fees and expenses that you maypay if you buy and hold the Portfolio’s InstitutionalClass II shares.
SHAREHOLDER FEES(fees paid directly from your investment)
Maximum Sales Charge (Load) Imposed on Purchases(as a percentage of offering price) None
Redemption Fee (as a percentage of amount redeemedwithin 90 days or less from the date of purchase) 2.00%
ANNUAL PORTFOLIO OPERATING EXPENSES(expenses that you pay each year as a percentage of thevalue of your investment)
Management Fees 1.35%
Distribution (12b-1) Fees None
Other Expenses 0.23%
Total Annual Portfolio Operating Expenses 1.58%
Fee Waiver and/or Expense Reimbursement1 -0.23%
Total Annual Portfolio Operating Expenses After Fee
Waiver and/or Expense Reimbursement1 1.35%
1Harding Loevner LP has contractually agreed to waive a portion of its management fee and/orreimburse the Institutional Class II of the Portfolio for its other operating expenses to theextent Total Annual Portfolio Operating Expenses (excluding dividend expenses, borrowingcosts, interest expense relating to short sales, interest, taxes, brokerage commissions andextraordinary expenses), as a percentage of average daily net assets, exceed 1.35% throughFebruary 28, 2019.
Example: This example is intended to help youcompare the cost of investing in the Portfolio’sInstitutional Class II shares with the cost of investing inother mutual funds. The example assumes that youinvest $10,000 in the Portfolio’s Institutional Class IIshares for the time periods indicated and then redeemall of your shares at the end of those periods. Theexample also assumes that your investment has a 5%return each year and that Institutional Class II’soperating expenses remain the same, except that theexample assumes that the fee waiver and expensereimbursement pertains only through February 28,2019. Although your actual costs may be higher orlower, based on these assumptions your costs would be:
1 YEAR 3 YEARS 5 YEARS 10 YEARS
$137 $476 $839 $1,859
PORTFOLIO TURNOVER
The Portfolio pays transaction costs, such ascommissions, when it buys and sells securities (or “turnsover” its portfolio). A higher portfolio turnover rate mayindicate higher transaction costs and may result in highertaxes when Portfolio shares are held in a taxable account.These costs, which are not reflected in annual portfoliooperating expenses or in the Example, affect thePortfolio’s performance. During the most recent fiscalyear, the Portfolio’s portfolio turnover rate was 28% ofthe average value of its portfolio.
PRINCIPAL INVESTMENT STRATEGIES
The Portfolio invests primarily in companies that arebased in frontier emerging markets, including the smallertraditionally-recognized emerging markets. Frontieremerging markets, with the exception of theoil-producing Gulf States and certain of the smallertraditionally-recognized emerging markets, tend to haverelatively low gross national product per capita comparedto the larger traditionally-recognized emerging marketsand the world’s major developed economies. The frontieremerging markets include the least developed marketseven by emerging markets standards. Frontier emergingmarkets offer investment opportunities that arise fromlong-term trends in demographics, deregulation, offshoreoutsourcing, and improving corporate governance indeveloping countries. Harding Loevner LP (“HardingLoevner”), the Portfolio’s investment adviser, undertakesfundamental research in an effort to identify companiesthat are well managed, financially sound, fast growing,and strongly competitive, and whose shares are under-priced relative to estimates of their value. To reduce itsvolatility, the Portfolio is diversified across dimensions ofgeography, industry, and currency. The Portfolionormally holds investments across at least 15 countries.
As used herein, frontier emerging markets includecountries that are represented in the MSCI FrontierMarkets Index or the S&P Frontier Markets BMI, orsimilar market indices, and the smaller of thetraditionally-recognized emerging markets, such as thoseindividually constituting less than 5% of the MSCIEmerging Markets Index or the S&P Emerging MarketsBMI. Factors bearing on whether a company isconsidered to be “based” in a frontier emerging marketmay include: (1) it is legally domiciled in a frontieremerging market; (2) it conducts at least 50% of itsbusiness, as measured by the location of its sales,earnings, assets, or production, in frontier emergingmarkets; or (3) it has the principal exchange listing forits securities in a frontier emerging market. Frontieremerging markets generally include all countries exceptAustralia, Austria, Belgium, Canada, Denmark, Finland,France, Germany, Hong Kong, Ireland, Israel, Italy,Japan, the Netherlands, New Zealand, Norway, Portugal,Singapore, Spain, Sweden, Switzerland, the United
21

Kingdom, and the United States and the largertraditionally-recognized emerging markets of Taiwan,South Korea, Mexico, South Africa, Brazil, India, China,and Russia. At least 65% of the Portfolio’s total assetswill be denominated in at least three currencies otherthan the U.S. dollar. For purposes of compliance withthis restriction, American Depositary Receipts, GlobalDepositary Receipts, and European Depositary Receipts(collectively, “Depositary Receipts”) will be considered tobe denominated in the currency of the country where thesecurities underlying the Depositary Receipts areprincipally traded.
The Portfolio invests at least 65% of its total assets incommon stocks, preferred stocks, rights, and warrantsissued by companies that are based in the frontieremerging markets, securities convertible into suchsecurities (including Depositary Receipts), andinvestment companies that invest in the types ofsecurities in which the Portfolio would normally invest.The Portfolio also may invest in securities of U.S.companies that derive, or are expected to derive, asignificant portion of their revenues from their foreignoperations, although under normal circumstances, notmore than 15% of the Portfolio’s total assets will beinvested in securities of U.S. companies.
The Portfolio invests, under normal circumstances, atleast 80% of its net assets (plus any borrowings forinvestment purposes) in frontier emerging marketsecurities, and investment companies that invest in thetypes of securities in which the Portfolio would normallyinvest.
The Portfolio may invest up to 35% of its total assets insecurities of companies in any one industry if, at the timeof investment, that industry represents 20% or more ofthe Portfolio’s benchmark index, currently the MSCIFrontier Emerging Markets Index.
Because some frontier emerging market countries do notpermit foreigners to participate directly in their securitiesmarkets or otherwise present difficulties for efficientforeign investment, the Portfolio may use equityderivative securities, and, in particular, participationnotes, to gain exposure to those countries.
PRINCIPAL RISKS
The Portfolio is subject to numerous risks, any of whichcould cause an investor to lose money. The principalrisks of the Portfolio are as follows:
Market Risk: Investments in the Portfolio may lose valuedue to a general downturn in stock markets.
Currency Risk: Foreign currencies may experiencesteady or sudden devaluation relative to the U.S. dollar,adversely affecting the value of the Portfolio’sinvestments. Because the Portfolio’s net asset value isdetermined on the basis of U.S. dollars, if the localcurrency of a foreign market depreciates against the U.S.dollar, you may lose money even if the foreign marketprices of the Portfolio’s holdings rise.
Foreign Investment Risk: Securities issued by foreignentities involve risks not associated with U.S.investments. These risks include additional taxation,political, economic, social, or diplomatic instability, andthe above-mentioned possibility of changes in the foreigncurrency exchange rates. There may also be less publicly-available information about a foreign issuer. Such risksmay be magnified with respect to securities of issuers infrontier emerging markets.
Frontier Emerging Market Risk: Frontier emergingmarket securities involve certain risks, such as exposureto economies less diverse and mature than that of theUnited States or more established foreign markets.Economic or political instability may cause larger pricechanges in frontier emerging market securities than insecurities of issuers based in more developed foreigncountries, including securities of issuers based in largeremerging markets. Frontier emerging markets generallyreceive less investor attention than developed marketsand larger emerging markets.
Participation Notes Risk: Participation notes are issuedby banks, or broker-dealers, or their affiliates and aredesigned to replicate the return of a particularunderlying equity or debt security, currency, or market.When the participation note matures, the issuer of theparticipation note will pay to, or receive from, thePortfolio the difference between the nominal value of theunderlying instrument at the time of purchase and thatinstrument’s value at maturity. Participation notesinvolve the same risks associated with a directinvestment in the underlying security, currency, ormarket. In addition, participation notes involvecounterparty risk, because the Portfolio has no rightsunder participation notes against the issuer(s) of theunderlying security(ies) and must rely on thecreditworthiness of the issuer of the participation note.
Concentration Risk: The Portfolio may invest up to 35%of its total assets in securities of companies in any oneindustry if, at the time of investment, that industryrepresents 20% or more of the Portfolio’s benchmarkindex, currently the MSCI Frontier Emerging MarketsIndex. Accordingly, at any time the Portfolio has such aconcentration of investments in a single industry group,it will be particularly vulnerable to factors that adverselyaffect that industry group.
NAV Risk: The net asset value of the Portfolio and thevalue of your investment will fluctuate.
Financial Services Sector Risk: To the extent thePortfolio invests in securities and other obligations ofissuers in the financials sector, the Portfolio will bevulnerable to events affecting companies in the financialsindustry. Examples of risks affecting the financials sectorinclude changes in governmental regulation, issuesrelating to the availability and cost of capital, changes ininterest rates and/or monetary policy, and pricecompetition. In addition, financials companies are oftenmore highly leveraged than other companies, makingthem inherently riskier.
22

PORTFOLIO PERFORMANCE
The following bar chart shows how the investmentresults of the Portfolio’s Institutional Class I shares havevaried from year to year. The table that follows showshow the average annual total returns of the Portfolio’sInstitutional Class I shares compare with a broadmeasure of market performance. Together, these providean indication of the risks of investing in the Portfolio.How the Portfolio’s Institutional Class I shares haveperformed in the past (before and after taxes) is notnecessarily an indication of how they will perform in thefuture.
Updated Portfolio performance information is available atwww.hardingloevnerfunds.com or by calling (877) 435-8105.
FRONTIER EMERGING MARKETS PORTFOLIO
38.97% -21.03% 19.88% 17.03% 6.22% 25.09%
-30%
-10%
0%
10%
20%
40%
2009
24.84%
2010 2011 2012 2013 2014 2017
2.16%
2016
-19.10%
2015
30%
-20%
The best calendar quarter return during the periodshown above was 37.37% in the 2nd quarter of 2009 theworst was -15.65% in the 3rd quarter of 2011.
AVERAGE ANNUAL TOTAL RETURNS(for the periods ended December 31, 2017)
1-YEAR 5-YEAR
SINCEINCEPTION
5/27/2008
FRONTIER EMERGING MARKETS PORTFOLIO -INSTITUTIONAL CLASS I
Return Before Taxes 25.09% 5.14% -0.30%
Return After Taxes onDistributions1 24.51% 5.05% -0.38%
Return After Taxes onDistributions and Sale ofPortfolio Shares1 14.65% 4.19% -0.12%
MSCI FRONTIER EMERGINGMARKETS (NET) INDEX(reflects no deduction for fees,expenses, or U.S. taxes) 26.78% 3.98% -1.25%
1After-tax returns in the table above are calculated using the historical highest individualfederal marginal income tax rates and do not reflect the impact of state and local taxes.Actual after-tax returns depend on an investor’s tax situation and may differ from thoseshown, and after-tax returns shown are not relevant to investors who hold their Portfolioshares through tax-deferred arrangements, such as 401(k) plans or Individual RetirementAccounts.
MANAGEMENT
Investment AdviserHarding Loevner serves as investment adviser to thePortfolio.
Portfolio ManagersPradipta Chakrabortty and Babatunde Ojo serve as theportfolio managers of the Frontier Emerging MarketsPortfolio. Mr. Chakrabortty has held his position sinceDecember 2008 and Mr. Ojo has held his position sinceJune 2014. Messrs. Chakrabortty and Ojo are the co-leadportfolio managers.
PURCHASE AND SALE OF PORTFOLIOSHARES
The minimum initial investment in the InstitutionalClass II of the Portfolio is $10,000,000. Additionalpurchases may be for any amount. You may purchase orredeem (sell) shares of the Portfolio on any business daythrough certain authorized brokers and other financialintermediaries or directly from the Portfolio by mail,telephone, or wire.
TAX CONSIDERATIONS
The Portfolio’s distributions are generally taxable to youas ordinary income, capital gains, or a combination ofthe two, unless you are investing through a tax-deferredarrangement, such as a 401(k) plan or an individualretirement account. Upon withdrawal, your investmentthrough a tax-deferred arrangement may becometaxable.
PAYMENTS TO BROKERS-DEALERS ANDOTHER FINANCIAL INTERMEDIARIES
If you purchase Portfolio shares through a broker-dealeror other financial intermediary (such as a bank), thePortfolio and its related companies may pay theintermediary for the sale of Portfolio shares and relatedservices. These payments may create a conflict of interestby influencing the broker-dealer or other intermediaryand your salesperson to recommend the Portfolio overanother investment. Ask your salesperson or visit yourfinancial intermediary’s website for more information.
23

PORTFOLIOSUMMARY
GLOBAL EQUITY RESEARCH PORTFOLIO
INVESTMENT OBJECTIVE
The Global Equity Research Portfolio (the “Portfolio”)seeks long-term capital appreciation through investmentsin equity securities of companies based both inside andoutside the United States.
PORTFOLIO FEES AND EXPENSES
This table describes the fees and expenses that you maypay if you buy and hold shares of the InstitutionalClass of the Portfolio.
SHAREHOLDER FEES(fees paid directly from your investment)
Maximum Sales Charge (Load) Imposed on Purchases(as a percentage of offering price) None
Redemption Fee (as a percentage of amount redeemedwithin 90 days or less from the date of purchase) 2.00%
ANNUAL PORTFOLIO OPERATING EXPENSES(expenses that you pay each year as a percentage of thevalue of your investment)
Management Fees 0.80%
Distribution (12b-1) Fees None
Other Expenses 2.69%
Total Annual Portfolio Operating Expenses 3.49%
Fee Waiver and/or Expense Reimbursement1 -2.59%
Total Annual Portfolio Operating Expenses After Fee
Waiver and/or Expense Reimbursement1 0.90%
1Harding Loevner LP has contractually agreed to waive a portion of its management fee and/orreimburse the Institutional Class of the Portfolio for its other operating expenses to theextent Total Annual Portfolio Operating Expenses (excluding dividend expenses, borrowingcosts, interest expense relating to short sales, interest, taxes, brokerage commissions andextraordinary expenses), as a percentage of average daily net assets, exceed 0.90% throughFebruary 28, 2019.
Example: This example is intended to help youcompare the cost of investing in the InstitutionalClass of the Portfolio with the cost of investing in othermutual funds. The example assumes that you invest$10,000 in the Institutional Class of the Portfolio for thetime periods indicated and then redeem all of yourshares at the end of those periods. The example alsoassumes that your investment has a 5% return eachyear and that the Institutional Class’s operatingexpenses remain the same, except that the exampleassumes the fee waiver and expense reimbursementagreement pertains only through February 28, 2019.Although your actual costs may be higher or lower,based on these assumptions your costs would be:
1 YEAR 3 YEARS 5 YEARS 10 YEARS
$92 $829 $1,590 $3,592
PORTFOLIO TURNOVER
The Portfolio pays transaction costs, such ascommissions, when it buys and sells securities (or “turnsover” its portfolio). A higher portfolio turnover rate mayindicate higher transaction costs and may result in highertaxes when Portfolio shares are held in a taxable account.These costs, which are not reflected in annual portfoliooperating expenses or in the Example, affect thePortfolio’s performance. During the most recent fiscalyear, the Portfolio’s portfolio turnover rate was 36% ofthe average value of its portfolio.
PRINCIPAL INVESTMENT STRATEGIES
The Portfolio invests in companies based in the UnitedStates and other developed markets, as well as incompanies in emerging and frontier markets. HardingLoevner LP (“Harding Loevner”), the Portfolio’sinvestment adviser, undertakes fundamental research inan effort to identify companies that are well managed,financially sound, fast growing, and strongly competitive,and whose shares are under-priced relative to estimatesof their value. The investment adviser’s analysts, aftercompleting this research, assign a rating to each stockbased upon its potential return relative to an appropriatebenchmark. The universe of stocks eligible for investmentin the Portfolio are those rated for purchase by theanalysts and that otherwise meet the investmentcharacteristics and guidelines established for thePortfolio. These guidelines include limits on exposure bygeography, industry and currency, and may include otherlimits, such as market capitalization. To reduce itsvolatility, the Portfolio is diversified across theseelements. The Portfolio may invest in companies in allcapitalization ranges, including smaller andmedium-sized companies.
The investment adviser expects that a majority of thestocks that its analysts have rated for purchase that meetthe Portfolio’s investment characteristics and guidelineswill be held in the Portfolio. The portfolio managers mayexclude any stock in their discretion based on factorssuch as trading volumes, market capitalization, orgeography. In determining the weight of each security inthe Portfolio, the portfolio managers will seek tomaintain a portfolio that, over time, is generally lessvolatile than the Portfolio’s benchmark, taking intoconsideration factors including the relevant security’spredicted relative price performance, the timeliness ofinvestment potential, the implications for portfolio riskand the requirement to observe the investmentcharacteristics and guidelines established for thePortfolio. The portfolio managers will periodicallyre-balance the portfolio when and as they deemappropriate, to reflect, among other things, changes tosecurities prices, analysts’ ratings, desired investmentcharacteristics, investment guidelines, or assumptionsabout prospective volatility or tracking error. The
24

portfolio managers will use risk models and otherquantitative tools to assist them in determining portfolioweightings.
The Portfolio will normally invest broadly in equitysecurities of companies domiciled in the followingcountries and regions: (1) Europe; (2) the Pacific Rim;(3) the United States, Canada, and Mexico; and(4) countries with emerging or frontier markets. At least65% of total assets will be denominated in at least threecurrencies, which may include the U.S. dollar. Forpurposes of compliance with this restriction, AmericanDepositary Receipts, Global Depositary Receipts, andEuropean Depositary Receipts (collectively, “DepositaryReceipts”), will be considered to be denominated in thecurrency of the country where the securities underlyingthe Depositary Receipts are principally traded.
The Portfolio invests, under normal circumstances, atleast 80% of its net assets (plus any borrowings forinvestment purposes) in common stocks, preferredstocks, rights, and warrants issued by companies that arebased both inside and outside the United States,securities convertible into such securities (includingDepositary Receipts), and investment companies thatinvest in the types of securities in which the Portfoliowould normally invest.
Because some emerging market countries do not permitforeigners to participate directly in their securitiesmarkets or otherwise present difficulties for efficientforeign investment, the Portfolio may use equityderivative securities, and, in particular, participationnotes, to gain exposure to those countries.
PRINCIPAL RISKS
The Portfolio is subject to numerous risks, any of whichcould cause an investor to lose money. The principalrisks of the Portfolio are as follows:
Market Risk: Investments in the Portfolio may lose valuedue to a general downturn in stock markets.
Currency Risk: Foreign currencies may experiencesteady or sudden devaluation relative to the U.S. dollar,adversely affecting the value of the Portfolio’sinvestments. Because the Portfolio’s net asset value isdetermined on the basis of U.S. dollars, if the localcurrency of a foreign market depreciates against the U.S.dollar, you may lose money even if the foreign marketprices of the Portfolio’s holdings rise.
Foreign Investment Risk: Securities issued by foreignentities involve risks not associated with U.S.investments. These risks include additional taxation,political, economic, social, or diplomatic instability, andthe above-mentioned possibility of changes in foreigncurrency exchange rates. There may also be less publicly-available information about a foreign issuer. Such risksmay be magnified with respect to securities of issuers infrontier emerging markets.
Emerging and Frontier Market Risk: Emerging andfrontier market securities involve certain risks, such as
exposure to economies less diverse and mature than thatof the United States or more established foreign markets.Economic or political instability may cause larger pricechanges in emerging or frontier market securities than insecurities of issuers based in more developed foreigncountries.
Participation Notes Risk: Participation notes are issuedby banks, or broker-dealers, or their affiliates and aredesigned to replicate the return of a particularunderlying equity or debt security, currency, or market.When the participation note matures, the issuer of theparticipation note will pay to, or receive from, thePortfolio the difference between the nominal value of theunderlying instrument at the time of purchase and thatinstrument’s value at maturity. Participation notesinvolve the same risks associated with a directinvestment in the underlying security, currency, ormarket. In addition, participation notes involvecounterparty risk, because the Portfolio has no rightsunder participation notes against the issuer(s) of theunderlying security(ies) and must rely on thecreditworthiness of the issuer of the participation note.
Small- and Mid-Capitalization Risk: The securities ofsmaller and medium-sized companies have historicallyexhibited more volatility with a lower degree of liquiditythan larger companies.
NAV Risk: The net asset value of the Portfolio and thevalue of your investment will fluctuate.
PORTFOLIO PERFORMANCE
The following bar chart shows the investment results ofthe Portfolio’s Institutional Class shares. The table thatfollows shows how the average total returns of thePortfolio’s Institutional Class shares compare with abroad measure of market performance. Together, theseprovide an indication of the risks of investing in thePortfolio. How the Institutional Class shares of thePortfolio have performed in the past (before and aftertaxes) is not necessarily an indication of how it willperform in the future.
Updated Portfolio performance information is available atwww.hardingloevnerfunds.com or by calling (877) 435-8105.
GLOBAL EQUITY RESEARCH PORTFOLIO
28.24%
0%
5%
10%
15%
30%
2017
25%
20%
The best calendar quarter return during the periodshown above was 8.03% in the 1st quarter of 2017; theworst was 4.93% in the 3rd quarter of 2017.
25

AVERAGE ANNUAL TOTAL RETURNS(for the periods ended December 31, 2017)
1-YEAR
SINCEINCEPTION
12/19/16
GLOBAL EQUITY RESEARCH PORTFOLIO - INSTITUTIONAL CLASS
Return Before Taxes 28.24% 26.74%
Return After Taxes on Distributions1 26.16% 24.74%
Return After Taxes on Distributionsand Sale of Portfolio Shares1 16.12% 19.55%
MSCI ALL COUNTRY WORLD (NET) INDEX(reflects no deduction for fees, expenses,or U.S. taxes) 23.96% 22.91%
1After-tax returns in the table above are calculated using the historical highest individualfederal marginal income tax rates and do not reflect the impact of state and local taxes.Actual after-tax returns depend on an investor’s tax situation and may differ from thoseshown, and after-tax returns shown are not relevant to investors who hold their Portfolioshares through tax-deferred arrangements, such as 401(k) plans or Individual RetirementAccounts.
MANAGEMENT
Investment AdviserHarding Loevner serves as investment adviser to thePortfolio.
Portfolio ManagersAndrew West and Moon Surana serve as the portfoliomanagers of the Global Equity Research Portfolio.Mr. West and Ms. Surana have held their positions sincethe Portfolio’s inception in December 2016.
PURCHASE AND SALE OF PORTFOLIOSHARES
The minimum initial investment in the InstitutionalClass of the Portfolio is $100,000. Additional purchasesmay be for any amount. You may purchase or redeem(sell) shares of the Portfolio on any business day throughcertain authorized brokers and other financialintermediaries or directly from the Portfolio by mail,telephone, or wire.
TAX CONSIDERATIONS
The Portfolio’s distributions are generally taxable to youas ordinary income, capital gains, or a combination ofthe two, unless you are investing through a tax-deferredarrangement, such as a 401(k) plan or an individualretirement account. Upon withdrawal, your investmentthrough a tax-deferred arrangement may becometaxable.
PAYMENTS TO BROKERS-DEALERS ANDOTHER FINANCIAL INTERMEDIARIES
If you purchase Portfolio shares through a broker-dealeror other financial intermediary (such as a bank), thePortfolio and its related companies may pay theintermediary for the sale of Portfolio shares and relatedservices. These payments may create a conflict of interest
by influencing the broker-dealer or other intermediaryand your salesperson to recommend the Portfolio overanother investment. Ask your salesperson or visit yourfinancial intermediary’s website for more information.
26

PORTFOLIOSUMMARY
INTERNATIONAL EQUITY RESEARCH PORTFOLIO
INVESTMENT OBJECTIVE
The International Equity Research Portfolio (the“Portfolio”) seeks long-term capital appreciation throughinvestments in equity securities of companies basedoutside the United States.
PORTFOLIO FEES AND EXPENSES
This table describes the fees and expenses that you maypay if you buy and hold shares of the Institutional Classof the Portfolio.
SHAREHOLDER FEES(fees paid directly from your investment)
Maximum Sales Charge (Load) Imposed on Purchases(as a percentage of offering price) None
Redemption Fee (as a percentage of amount redeemedwithin 90 days or less from the date of purchase) 2.00%
ANNUAL PORTFOLIO OPERATING EXPENSES(expenses that you pay each year as a percentage of thevalue of your investment)
Management Fees 0.75%
Distribution (12b-1) Fees None
Other Expenses 1.51%
Total Annual Portfolio Operating Expenses 2.26%
Fee Waiver and/or Expense Reimbursement1 -1.36%
Total Annual Portfolio Operating Expenses After Fee
Waiver and/or Expense Reimbursement1 0.90%
1Harding Loevner LP has contractually agreed to waive a portion of its management fee and/orreimburse the Institutional Class of the Portfolio for its other operating expenses to theextent Total Annual Portfolio Operating Expenses (excluding dividend expense, borrowingcosts, interest expense relating to short sales, interest, taxes, brokerage commissions andextraordinary expenses), as a percentage of average daily net assets, exceed 0.90% throughFebruary 28, 2019.
Example: This example is intended to help you comparethe cost of investing in the Institutional Class of thePortfolio with the cost of investing in other mutual funds.The example assumes that you invest $10,000 in theInstitutional Class of the Portfolio for the time periodsindicated and then redeem all of your shares at the endof those periods. The example also assumes that yourinvestment has a 5% return each year and that theInstitutional Class’s operating expenses remain the same.Although your actual costs may be higher or lower, basedon these assumptions your costs would be:
1 YEAR 3 YEARS 5 YEARS 10 YEARS
$92 $575 $1,086 $2,489
PORTFOLIO TURNOVER
The Portfolio pays transaction costs, such ascommissions, when it buys and sells securities (or “turnsover” its portfolio). A higher portfolio turnover rate may
indicate higher transaction costs and may result in highertaxes when Portfolio shares are held in a taxable account.These costs, which are not reflected in annual portfoliooperating expenses or in the Example, affect thePortfolio’s performance. During the most recent fiscalyear, the Portfolio’s portfolio turnover rate was 55% ofthe average value of its portfolio.
PRINCIPAL INVESTMENT STRATEGIES
The Portfolio invests primarily in companies based indeveloped markets outside the United States as well as incompanies in emerging and frontier markets. HardingLoevner LP (“Harding Loevner”), the Portfolio’sinvestment adviser, undertakes fundamental research inan effort to identify companies that are well managed,financially sound, fast growing, and strongly competitive,and whose shares are under-priced relative to estimatesof their value. The investment adviser’s analysts, aftercompleting this research, assign a rating to each stockbased upon its potential return relative to an appropriatebenchmark. The universe of stocks eligible for investmentin the Portfolio are those rated for purchase by theanalysts and that otherwise meet the investmentcharacteristics and guidelines established for thePortfolio. These guidelines include limits on exposure bygeography, industry, and currency, and may includeother limits, such as market capitalization. To reduce itsvolatility, the Portfolio is diversified across theseelements. The Portfolio may invest in companies in allcapitalization ranges, including smaller andmedium-sized companies.
The investment adviser expects that a majority of thestocks that its analysts have rated for purchase that meetthe Portfolio’s investment characteristics and guidelineswill be held in the Portfolio. The portfolio managers mayexclude any stock in their discretion based on factorssuch as trading volumes, market capitalization, orgeography. In determining the weight of each security inthe Portfolio, the portfolio managers will seek tomaintain a portfolio that, over time, is generally lessvolatile than the Portfolio’s benchmark, taking intoconsideration factors including the relevant security’spredicted relative price performance, the timeliness ofinvestment potential, the implications for portfolio riskand the requirement to observe the investmentcharacteristics and guidelines established for thePortfolio. The portfolio managers will periodicallyre-balance the portfolio when and as they deemappropriate, to reflect, among other things, changes tosecurities prices, analysts’ ratings, desired investmentcharacteristics, investment guidelines or assumptionsabout prospective volatility or tracking error. Theportfolio managers will use risk models and otherquantitative tools to assist them in determining portfolioweightings.
27

The Portfolio invests, under normal circumstances, atleast 80% of its net assets (plus any borrowings forinvestment purposes) in common stocks, preferredstocks, rights, and warrants issued by companies that arebased outside the United States, securities convertibleinto such securities (including Depositary Receipts, asdefined below), and investment companies that invest inthe types of securities in which the Portfolio wouldnormally invest. Factors bearing on whether a companyis considered to be “based” outside the United States mayinclude: (1) it is legally domiciled outside the UnitedStates; (2) it conducts at least 50% of its business, asmeasured by the location of its sales, earnings, assets, orproduction, outside the United States; or (3) it has theprincipal exchange listing for its securities outside theUnited States. The Portfolio also may invest in securitiesof U.S. companies that derive, or are expected to derive,a significant portion of their revenues from their foreignoperations, although under normal circumstances notmore than 15% of the Portfolio’s total assets will beinvested in securities of U.S. companies. The Portfoliowill normally invest broadly in equity securities ofcompanies domiciled in the following countries andregions: (1) Europe; (2) the Pacific Rim; (3) Canada andMexico; and (4) countries with emerging or frontiermarkets. At least 65% of total assets will be denominatedin at least three currencies other than the U.S. dollar. Forpurposes of compliance with this restriction, AmericanDepositary Receipts, Global Depositary Receipts, andEuropean Depositary Receipts (collectively, “DepositaryReceipts”), will be considered to be denominated in thecurrency of the country where the securities underlyingthe Depositary Receipts are principally traded.
Because some emerging market countries do not permitforeigners to participate directly in their securitiesmarkets or otherwise present difficulties for efficientforeign investment, the Portfolio may use equityderivative securities, and, in particular, participationnotes, to gain exposure to those countries.
PRINCIPAL RISKS
The Portfolio is subject to numerous risks, any of whichcould cause an investor to lose money. The principal risksof the Portfolio are as follows:
Market Risk: Investments in the Portfolio may lose valuedue to a general downturn in stock markets.
Currency Risk: Foreign currencies may experiencesteady or sudden devaluation relative to the U.S. dollar,adversely affecting the value of the Portfolio’sinvestments. Because the Portfolio’s net asset value isdetermined on the basis of U.S. dollars, if the localcurrency of a foreign market depreciates against the U.S.dollar, you may lose money even if the foreign marketprices of the Portfolio’s holdings rise.
Foreign Investment Risk: Securities issued by foreignentities involve risks not associated with U.S.investments. These risks include additional taxation,political, economic, social, or diplomatic instability, andthe above-mentioned possibility of changes in foreign
currency exchange rates. There may also be less publicly-available information about a foreign issuer. Such risksmay be magnified with respect to securities of issuers infrontier emerging markets.
Emerging and Frontier Market Risk: Emerging andfrontier market securities involve certain risks, such asexposure to economies less diverse and mature than thatof the United States or more established foreign markets.Economic or political instability may cause larger pricechanges in emerging or frontier market securities than insecurities of issuers based in more developed foreigncountries.
Participation Notes Risk: Participation notes are issuedby banks, or broker-dealers, or their affiliates and aredesigned to replicate the return of a particularunderlying equity or debt security, currency, or market.When the participation note matures, the issuer of theparticipation note will pay to, or receive from, thePortfolio the difference between the nominal value of theunderlying instrument at the time of purchase and thatinstrument’s value at maturity. Participation notesinvolve the same risks associated with a directinvestment in the underlying security, currency, ormarket. In addition, participation notes involvecounterparty risk, because the Portfolio has no rightsunder participation notes against the issuer(s) of theunderlying security(ies) and must rely on thecreditworthiness of the issuer of the participation note.
Small- and Mid-Capitalization Risk: The securities ofsmaller and medium-sized companies have historicallyexhibited more volatility with a lower degree of liquiditythan larger companies.
NAV Risk: The net asset value of the Portfolio and thevalue of your investment will fluctuate.
PORTFOLIO PERFORMANCE
The following bar chart shows how the investmentresults of the Portfolio’s Institutional Class shares havevaried from year to year. The table that follows showshow the average annual total returns of the Portfolio’sInstitutional Class shares compare with a broad measureof market performance. Together, these provide anindication of the risks of investing in the Portfolio. Howthe Institutional Class shares of the Portfolio haveperformed in the past (before and after taxes) is notnecessarily an indication of how it will perform in thefuture.
Updated Portfolio performance information is available atwww.hardingloevnerfunds.com or by calling (877) 435-8105.
28

INTERNATIONAL EQUITY RESEARCH PORTFOLIO
7.95%
0%
5%
10%
15%
30%
25%
2016
29.57%
2017
20%
The best calendar quarter return during the periodshown above was 9.35% in the 1st quarter of 2017; theworst was -4.08% in the 4th quarter of 2016.
AVERAGE ANNUAL TOTAL RETURNS(for the periods ended December 31, 2017)
1-YEAR
SINCEINCEPTION
12/17/15
INTERNATIONAL EQUITY RESEARCH PORTFOLIO -INSTITUTIONAL CLASS
Return Before Taxes 29.57% 18.18%
Return After Taxes on Distributions1 27.32% 16.87%
Return After Taxes on Distributions andSale of Portfolio Shares1 17.54% 13.92%
MSCI ALL COUNTRY WORLD ex-U.S. (NET)INDEX (reflects no deduction for fees,expenses, or U.S. taxes) 27.20% 15.37%
1After-tax returns in the table above are calculated using the historical highest individualfederal marginal income tax rates and do not reflect the impact of state and local taxes.Actual after-tax returns depend on an investor’s tax situation and may differ from thoseshown, and after-tax returns shown are not relevant to investors who hold their Portfolioshares through tax-deferred arrangements, such as 401(k) plans or Individual RetirementAccounts.
MANAGEMENT
Investment AdviserHarding Loevner serves as investment adviser to thePortfolio.
Portfolio ManagersAndrew West and Moon Surana serve as the portfoliomanagers of the International Equity Research Portfolio.Mr. West and Ms. Surana have held their positions sincethe Portfolio’s inception in December 2015.
PURCHASE AND SALE OF PORTFOLIOSHARES
The minimum initial investment in the InstitutionalClass of the Portfolio is $100,000. Additional purchasesmay be for any amount. You may purchase or redeem(sell) shares of the Portfolio on any business day throughcertain authorized brokers and other financialintermediaries or directly from the Portfolio by mail,telephone, or wire.
TAX CONSIDERATIONS
The Portfolio’s distributions are generally taxable to youas ordinary income, capital gains, or a combination ofthe two, unless you are investing through a tax-deferredarrangement, such as a 401(k) plan or an individualretirement account. Upon withdrawal, your investmentthrough a tax-deferred arrangement may becometaxable.
PAYMENTS TO BROKERS-DEALERS ANDOTHER FINANCIAL INTERMEDIARIES
If you purchase Portfolio shares through a broker-dealeror other financial intermediary (such as a bank), thePortfolio and its related companies may pay theintermediary for the sale of Portfolio shares and relatedservices. These payments may create a conflict of interestby influencing the broker-dealer or other intermediaryand your salesperson to recommend the Portfolio overanother investment. Ask your salesperson or visit yourfinancial intermediary’s website for more information.
29

PORTFOLIOSUMMARY
EMERGING MARKETS RESEARCH PORTFOLIO
INVESTMENT OBJECTIVE
The Emerging Markets Research Portfolio (the“Portfolio”) seeks long-term capital appreciation throughinvestments in equity securities of companies based inemerging markets.
PORTFOLIO FEES AND EXPENSES
This table describes the fees and expenses that you maypay if you buy and hold shares of the InstitutionalClass of the Portfolio.
SHAREHOLDER FEES(fees paid directly from your investment)
Maximum Sales Charge (Load) Imposed on Purchases(as a percentage of offering price) None
Redemption Fee (as a percentage of amount redeemedwithin 90 days or less from the date of purchase) 2.00%
ANNUAL PORTFOLIO OPERATING EXPENSES(expenses that you pay each year as a percentage of thevalue of your investment)
Management Fees 1.15%
Distribution (12b-1) Fees None
Other Expenses 2.57%
Total Annual Portfolio Operating Expenses 3.72%
Fee Waiver and/or Expense Reimbursement1 -2.42%
Total Annual Portfolio Operating Expenses After Fee
Waiver and/or Expense Reimbursement1 1.30%
1Harding Loevner LP has contractually agreed to waive a portion of its management fee and/orreimburse the Institutional Class of the Portfolio for its other operating expenses to theextent Total Annual Portfolio Operating Expenses (excluding dividend expenses, borrowingcosts, interest expense relating to short sales, interest, taxes, brokerage commissions andextraordinary expenses), as a percentage of average daily net assets, exceed 1.30% throughFebruary 28, 2019.
Example: This example is intended to help youcompare the cost of investing in the InstitutionalClass of the Portfolio with the cost of investing in othermutual funds. The example assumes that you invest$10,000 in the Institutional Class of the Portfolio for thetime periods indicated and then redeem all of yourshares at the end of those periods. The example alsoassumes that your investment has a 5% return eachyear and that the Institutional Class’s operatingexpenses remain the same, except that the exampleassumes the fee waiver and expense reimbursementagreement pertains only through February 28, 2019.Although your actual costs may be higher or lower,based on these assumptions your costs would be:
1 YEAR 3 YEARS 5 YEARS 10 YEARS
$132 $914 $1,715 $3,811
PORTFOLIO TURNOVER
The Portfolio pays transaction costs, such ascommissions, when it buys and sells securities (or “turnsover” its portfolio). A higher portfolio turnover rate mayindicate higher transaction costs and may result in highertaxes when Portfolio shares are held in a taxable account.These costs, which are not reflected in annual portfoliooperating expenses or in the Example, affect thePortfolio’s performance. During the most recent fiscalyear, the Portfolio’s portfolio turnover rate was 46% ofthe average value of its portfolio.
PRINCIPAL INVESTMENT STRATEGIES
The Portfolio invests primarily in companies that arebased in emerging and frontier markets. Emerging andfrontier markets offer investment opportunities that arisefrom long-term trends in demographics, deregulation,offshore outsourcing, and improving corporategovernance in developing countries. Harding Loevner LP(“Harding Loevner”), the Portfolio’s investment adviser,undertakes fundamental research in an effort to identifycompanies that are well managed, financially sound, fastgrowing, and strongly competitive, and whose shares areunder-priced relative to estimates of their value. Theinvestment adviser’s analysts, after completing thisresearch, assign a rating to each stock based upon itspotential return relative to an appropriate benchmark.The universe of stocks eligible for investment in thePortfolio are those rated for purchase by the analysts andthat otherwise meet the investment characteristics andguidelines established for the Portfolio. These guidelinesinclude limits on exposure by geography, industry andcurrency, and may include other limits, such as marketcapitalization. To reduce its volatility, the Portfolio isdiversified across these elements. The Portfolio mayinvest in companies in all capitalization ranges, includingsmaller and medium-sized companies.
The investment adviser expects that a majority of thestocks that its analysts have rated for purchase that meetthe Portfolio’s investment characteristics and guidelineswill be held in the Portfolio. The portfolio managers mayexclude any stock in their discretion based on factorssuch as trading volumes, market capitalization, orgeography. In determining the weight of each security inthe Portfolio, the portfolio managers will seek tomaintain a portfolio that, over time, is generally lessvolatile than the Portfolio’s benchmark, taking intoconsideration factors including the relevant security’spredicted relative price performance, the timeliness ofinvestment potential, the implications for portfolio riskand the requirement to observe the investmentcharacteristics and guidelines established for thePortfolio. The portfolio managers will periodicallyre-balance the portfolio when and as they deemappropriate, to reflect, among other things, changes tosecurities prices, analysts’ ratings, desired investmentcharacteristics, investment guidelines or assumptions
30

about prospective volatility or tracking error. Theportfolio managers will use risk models and otherquantitative tools to assist them in determining portfolioweightings.
The Portfolio normally holds investments across at least15 countries. Emerging and frontier markets includecountries that have an emerging stock market as definedby Morgan Stanley Capital International, countries ormarkets with low- to middle-income economies asclassified by the World Bank, and other countries ormarkets with similar characteristics. Emerging andfrontier markets tend to have relatively low grossnational product per capita compared to the world’smajor economies and may have the potential for rapideconomic growth.
Factors bearing on whether a company is considered tobe “based” in an emerging or frontier market mayinclude: (1) it is legally domiciled in an emerging orfrontier market; (2) it conducts at least 50% of itsbusiness, as measured by the location of its sales,earnings, assets, or production, in an emerging orfrontier market; or (3) it has the principal exchangelisting for its securities in an emerging or frontier market.
The Portfolio will invest broadly in equity securities ofcompanies domiciled in one of at least 15 countries withemerging or frontier markets, generally considered toinclude all countries except Australia, Austria, Belgium,Canada, Denmark, Finland, France, Germany, HongKong, Ireland, Israel, Italy, Japan, the Netherlands, NewZealand, Norway, Portugal, Singapore, Spain, Sweden,Switzerland, the United Kingdom, and the United States.At least 65% of the Portfolio’s total assets will bedenominated in at least three currencies other than theU.S. dollar. For purposes of compliance with thisrestriction, American Depositary Receipts, GlobalDepositary Receipts, and European Depositary Receipts(collectively, “Depositary Receipts”) will be considered tobe denominated in the currency of the country where thesecurities underlying the Depositary Receipts areprincipally traded.
The Portfolio invests at least 65% of its total assets incommon stocks, preferred stocks, rights, and warrantsissued by companies that are based in emerging orfrontier markets, securities convertible into suchsecurities (including Depositary Receipts), andinvestment companies that invest in the types ofsecurities in which the Portfolio would normally invest.The Portfolio also may invest in securities of U.S.companies that derive, or are expected to derive, asignificant portion of their revenues from their foreignoperations, although under normal circumstances, notmore than 15% of the Portfolio’s total assets will beinvested in securities of U.S. companies.
The Portfolio invests, under normal circumstances, atleast 80% of its net assets (plus any borrowings forinvestment purposes) in emerging markets securities,which includes frontier markets, and investmentcompanies that invest in the types of securities in whichthe Portfolio would normally invest.
Because some emerging market countries do not permitforeigners to participate directly in their securitiesmarkets or otherwise present difficulties for efficientforeign investment, the Portfolio may use equityderivative securities, and, in particular, participationnotes, to gain exposure to those countries.
PRINCIPAL RISKS
The Portfolio is subject to numerous risks, any of whichcould cause an investor to lose money. The principal risksof the Portfolio are as follows:
Market Risk. Investments in the Portfolio may lose valuedue to a general downturn in stock markets.
Currency Risk. Foreign currencies may experiencesteady or sudden devaluation relative to the U.S. dollar,adversely affecting the value of the Portfolio’sinvestments. Because the Portfolio’s net asset value isdetermined on the basis of U.S. dollars, if the localcurrency of a foreign market depreciates against the U.S.dollar, you may lose money even if the foreign marketprices of the Portfolio’s holdings rise.
Foreign Investment Risk. Securities issued by foreignentities involve risks not associated with U.S.investments. These risks include additional taxation,political, economic, social, or diplomatic instability, andthe above-mentioned possibility of changes in foreigncurrency exchange rates. There may also be less publicly-available information about a foreign issuer. Such risksmay be magnified with respect to securities of issuers infrontier emerging markets.
Emerging and Frontier Market Risk. Emerging andfrontier market securities involve certain risks, such asexposure to economies less diverse and mature than thatof the United States or more established foreign markets.Economic or political instability may cause larger pricechanges in emerging or frontier market securities than insecurities of issuers based in more developed foreigncountries.
Participation Notes Risk. Participation notes are issuedby banks, or broker-dealers, or their affiliates and aredesigned to replicate the return of a particularunderlying equity or debt security, currency, or market.When the participation note matures, the issuer of theparticipation note will pay to, or receive from, thePortfolio the difference between the nominal value of theunderlying instrument at the time of purchase and thatinstrument’s value at maturity. Participation notesinvolve the same risks associated with a directinvestment in the underlying security, currency, ormarket. In addition, participation notes involvecounterparty risk, because the Portfolio has no rightsunder participation notes against the issuer(s) of theunderlying security(ies) and must rely on thecreditworthiness of the issuer of the participation note.
Small- and Mid-Capitalization Risk: The securities ofsmaller and medium-sized companies have historicallyexhibited more volatility with a lower degree of liquiditythan larger companies.
NAV Risk. The net asset value of the Portfolio and thevalue of your investment will fluctuate.
31

Financial Services Sector Risk. To the extent thePortfolio invests in securities and other obligations ofissuers in the financials sector, the Portfolio will bevulnerable to events affecting companies in the financialsindustry. Examples of risks affecting the financials sectorinclude changes in governmental regulation, issuesrelating to the availability and cost of capital, changes ininterest rates and/or monetary policy, and pricecompetition. In addition, financials companies are oftenmore highly leveraged than other companies, makingthem inherently riskier.
PORTFOLIO PERFORMANCEThe following bar chart shows the investment results ofthe Portfolio’s Institutional Class. The table that followsshows how the average total returns of the Portfolio’sInstitutional Class shares compare with a broad measureof market performance. Together, these provide anindication of the risks of investing in the Portfolio. Howthe Institutional Class shares of the Portfolio haveperformed in the past (before and after taxes) is notnecessarily an indication of how it will perform in thefuture.
Updated Portfolio performance information is available atwww.hardingloevnerfunds.com or by calling (877) 435-8105.
EMERGING MARKETS RESEARCH PORTFOLIO
34.53%
0%
5%
10%
15%
40%
2017
35%
30%
25%
20%
The best calendar quarter return during the periodshown above was 11.09% in the 1st quarter of 2017; theworst was 5.91% in the 4th quarter of 2017.
AVERAGE ANNUAL TOTAL RETURNS(for the periods ended December 31, 2017)
1-YEAR
SINCEINCEPTION
12/19/16
EMERGING MARKETS RESEARCH PORTFOLIO -INSTITUTIONAL CLASS
Return Before Taxes 34.53% 34.56%
Return After Taxes on Distributions1 30.36% 30.51%
Return After Taxes on Distributions andSale of Portfolio Shares1 19.57% 24.51%
MSCI EMERGING + FRONTIER MARKETS(NET) INDEX (reflects no deduction forfees, expenses, or U.S. taxes) 37.13% 37.81%
1After-tax returns in the table above are calculated using the historical highest individualfederal marginal income tax rates and do not reflect the impact of state and local taxes. Actualafter-tax returns depend on an investor’s tax situation and may differ from those shown, andafter-tax returns shown are not relevant to investors who hold their Portfolio shares throughtax-deferred arrangements, such as 401(k) plans or Individual Retirement Accounts.
MANAGEMENT
Investment AdviserHarding Loevner serves as investment adviser to thePortfolio.
Portfolio ManagersAndrew West and Moon Surana serve as the portfoliomanagers of the Emerging Markets Research Portfolio.Mr. West and Ms. Surana have held their positions sincethe Portfolio’s inception in December 2016.
PURCHASE AND SALE OF PORTFOLIOSHARES
The minimum initial investment in the InstitutionalClass of the Portfolio is $100,000. Additional purchasesmay be for any amount. You may purchase or redeem(sell) shares of the Portfolio on any business day throughcertain authorized brokers and other financialintermediaries or directly from the Portfolio by mail,telephone, or wire.
TAX CONSIDERATIONS
The Portfolio’s distributions are generally taxable to youas ordinary income, capital gains, or a combination ofthe two, unless you are investing through a tax-deferredarrangement, such as a 401(k) plan or an individualretirement account. Upon withdrawal, your investmentthrough a tax-deferred arrangement may becometaxable.
PAYMENTS TO BROKERS-DEALERS ANDOTHER FINANCIAL INTERMEDIARIES
If you purchase Portfolio shares through a broker-dealeror other financial intermediary (such as a bank), thePortfolio and its related companies may pay theintermediary for the sale of Portfolio shares and relatedservices. These payments may create a conflict of interestby influencing the broker-dealer or other intermediaryand your salesperson to recommend the Portfolio overanother investment. Ask your salesperson or visit yourfinancial intermediary’s website for more information.
32

INVESTMENT OBJECTIVESAND INVESTMENT PROCESSHarding, Loevner Funds, Inc. (the “Fund”) is a no-load,open-end management investment company thatcurrently has nine separate diversified portfoliosincluding the Global Equity Portfolio, InternationalEquity Portfolio, International Small CompaniesPortfolio, Institutional Emerging Markets Portfolio,Frontier Emerging Markets Portfolio, Global EquityResearch Portfolio, International Equity ResearchPortfolio, and Emerging Markets Research Portfoliowhose Institutional, Class I, Class II, or InstitutionalClass I, and Institutional Class II shares are offered in thisProspectus (each, a “Portfolio,” and collectively, the“Portfolios”). Each Portfolio has its own investmentobjective, strategy, and policies. The Fund is advised byHarding Loevner. There is no assurance that a Portfoliowill achieve its investment objective.
The investment objectives, policies, and risks of thePortfolios are detailed below. Except as otherwiseindicated, the Fund’s board of directors (the “Board ofDirectors”) may change the investment policies at any
time to the extent that such changes are consistent withthe investment objective of the applicable Portfolio.However, each Portfolio’s investment objective isfundamental and may not be changed without a majorityvote of the Portfolio’s outstanding shares, which isdefined under the Investment Company Act of 1940, asamended, as the lesser of (a) 67% of the shares of theapplicable Portfolio present or represented if the holdersof more than 50% of the shares are present orrepresented at the shareholders’ meeting, or (b) morethan 50% of the shares of the applicable Portfolio (a“majority vote”).
The Portfolios may, from time to time, take temporarydefensive positions that are inconsistent with thePortfolios’ principal investment strategies in attemptingto respond to adverse changes in market and economicconditions. For temporary defensive purposes, thePortfolios may temporarily hold cash (foreign currenciesor multinational currency) and/or invest up to 100% oftheir assets in high quality debt securities or moneymarket instruments of U.S. or foreign issuers. ThePortfolios may miss certain investment opportunities ifthey use such temporary defensive strategies and thusmay not achieve their investment objectives.
INVESTMENT OBJECTIVES
The investment objective of each Portfolio is:
Portfolio Objective
Global EquityGlobal Equity Research
Seeks long-term capital appreciation through investments in equity securities ofcompanies based both inside and outside the United States
International EquityInternational Equity Research
Seeks long-term capital appreciation through investments in equity securities ofcompanies based outside the United States
International Small Companies Seeks long-term capital appreciation through investments in equity securities ofsmall companies based outside the United States
Institutional Emerging MarketsEmerging Markets Research
Seeks long-term capital appreciation through investments in equity securities ofcompanies based in emerging markets
Frontier Emerging Markets Seeks long-term capital appreciation through investments in equity securities ofcompanies based in frontier and smaller emerging markets
33

INVESTMENT PROCESS
Harding Loevner believes investing in the shares of high-quality growth businesses at reasonable prices leads tosuperior risk-adjusted returns over the long-term. Thefirm manages the Portfolios utilizing a bottom-up,business-focused approach based on careful study ofindividual companies and the competitive dynamics ofthe global industries in which they participate. Theprocess Harding Loevner uses to identify and valuecompanies consists of four parts: (1) Initial Qualificationof companies for further research; (2) In-Depth Researchinto the businesses of qualified candidates; (3) Valuationand Rating of securities of potential investments; and(4) Portfolio Construction by selecting from analyst-ratedsecurities to create a diversified portfolio from the most-promising opportunities.
To qualify companies for more intensive research,Harding Loevner’s investment analysts survey companiesin their assigned portions of the investment universe inan effort to identify potential candidates that meet fourkey criteria. They must exhibit: (i) CompetitiveAdvantages that enable them to earn high margins thatcan be sustained over time; (ii) Sustainable Growth insales, earnings and cash flows; (iii) Financial Strength, interms of free cash flow and available borrowing capacity;and (iv) Quality Management including a proven recordof success and respect for interests of minorityshareholders. Sources for investment ideas includeanalysts’ investigations into the competitors, suppliers,and customers of existing companies under research;their encounters with companies during onsite companyvisits, investor conferences, trade shows, and otherresearch travel; and objective screens on companyfundamentals using Harding Loevner’s quality andgrowth factors.
Companies that appear qualified on these key criteria arethen examined more intensively using primary andsecondary, including management interviews, contactwith trade associations, and visits to company facilities.Investment analysts assess qualified companies on tencompetitive, management and financial characteristicsusing a proprietary scoring system known as the QualityAssessment (“QA”) framework. This framework aidsanalysts in gaining insight into companies’ competitivepositions and the extent and durability of their growthprospects, and facilitates comparisons across differentcountries and industries.
To evaluate the investment potential of the strongestcandidates, analysts construct financial models using avariety of standardized methods, including a multi-stagecash flow return on investment approach and discountedcash flow analysis, to forecast long-term growth inearnings and cash flows. The financial models includeadjustments based upon the QA score and are combinedwith industry data, including market-valuation of peersand corporate merger and acquisition activity, to formthe basis for their estimates of the value of thecompanies’ securities. Based upon their business forecastsand evaluation of investment potential, analysts predictthe relative price performance of stocks under their
coverage, and issue purchase and sale recommendationsaccordingly. When issuing a recommendation on thestock of a company, an analyst also sets out anexpectation for future business performance of thecompany (“mileposts”). These mileposts provide theanalyst with an indelible record of his/her expectationsfor the business and form the basis for ongoing review ofthe company’s progress.
In constructing portfolios for the Global Equity,International Equity, International Small Companies,Institutional Emerging Markets and Frontier EmergingMarkets Portfolios, Harding Loevner’s portfolio managersselect among the analyzed securities. In constructingportfolios for the Global Equity Research Portfolio,International Equity Research Portfolio, and EmergingMarkets Research Portfolio, portfolio managers invest incompanies recommended for purchase by HardingLoevner’s analyst team. The portfolio managers take intoconsideration the securities’ predicted relative priceperformance, the timeliness and investment potential,the implications for portfolio risk of their selections, andthe requirement to observe portfolio diversificationguidelines.
A holding is reduced or removed from a Portfolio if andwhen it: (i) grows to too large a proportion of theportfolio, in terms of its impact on portfolio risk;(ii) becomes substantially overpriced in relation to itsestimated value; (iii) fails to achieve the pre-establishedmilestones for business (as opposed to share price)performance, including breach of trust by management;or (iv) is displaced by more compelling investmentopportunities; and (v) with respect to the Global EquityResearch Portfolio, International Equity ResearchPortfolio, and Emerging Markets Research Portfolio, is nolonger recommended for purchase by the analyst team,or, in the judgment of the portfolio managers, necessaryor appropriate to meet risk diversification and otherguidelines established for the Portfolio.
34
ADDITIONAL INFORMATIONON PORTFOLIO INVESTMENTSTRATEGIES AND RISKS
OTHER INVESTMENT STRATEGIES
The Global Equity, International Equity, InternationalSmall Companies, Global Equity Research, andInternational Equity Research Portfolios may each investup to 20%, and the Institutional Emerging Markets,Frontier Emerging Markets, and Emerging MarketsResearch Portfolios may each invest up to 35%, of theirrespective total assets in debt securities of domestic andforeign issuers, including emerging market and frontieremerging market issuers. The types of debt securities thePortfolios may invest in include instruments such ascorporate bonds, debentures, notes, commercial paper,short-term notes, medium-term notes, and variable ratenotes. Up to 20% of such securities may be rated belowinvestment grade, that is, rated below Baa by Moody’s orbelow BBB by S&P and in unrated securities judged to beof equivalent quality as determined by Harding Loevner(commonly referred to as “junk bonds”). However, aPortfolio may not invest in securities rated, at the time ofinvestment, C or below by Moody’s, or D or below byS&P, or in securities of comparable quality as determinedby Harding Loevner.
RISKS ASSOCIATED WITH THEPORTFOLIOS’ INVESTMENT POLICIESAND TECHNIQUES
The share price of a Portfolio will change daily based onchanges in the value of the securities that a Portfolioholds. The principal risks of investing in each of thePortfolios and the circumstances reasonably likely tocause the value of your investment to decline aredescribed in the “Portfolio Summary” section of eachPortfolio in this Prospectus. Additional informationconcerning those principal risks and the additional risksthat apply to each Portfolio is set forth below. Please notethat there are other circumstances that are not describedhere that could cause the value of your investment todecline and prevent a Portfolio from achieving itsinvestment objective.
Market Risk. The risk that the value of the securities inwhich a Portfolio invests may go up or down in responseto the prospects of individual companies, particularindustry sectors or governments and/or such factors asgeneral economic conditions, political or regulatorydevelopments, changes in interest rates, and perceiveddesirability of equity securities relative to otherinvestments. Price changes may be temporary or last forextended periods. A Portfolio’s investments may be over-weighted from time to time in one or more industrysectors, which will increase the Portfolio’s exposure torisk of loss from adverse developments affecting thosesectors.
Foreign Investments. Securities issued by foreigngovernments, foreign corporations, internationalagencies and obligations of foreign banks involve risksnot associated with securities issued by U.S. entities.Changes in foreign currency exchange rates may affectthe value of investments of a Portfolio. With respect tocertain foreign countries, there is the possibility ofexpropriation of assets, confiscatory taxation, andpolitical or social instability or diplomatic developmentsthat could affect investment in those countries. Theremay be less publicly-available information about aforeign financial instrument than about a U.S. instrumentand foreign entities may not be subject to accounting,auditing and financial reporting standards, andrequirements comparable to those of U.S. entities. APortfolio could encounter difficulties in obtaining orenforcing a judgment against the issuer in certain foreigncountries. Such risks may be magnified with respect tosecurities of issuers in frontier emerging markets. Inaddition, certain foreign investments may be subject toforeign withholding or other taxes, although the Portfoliowill seek to minimize such withholding taxes wheneverpractical. Investors may be able to deduct such taxes incomputing their taxable income or to use such amountsas credits (subject to a holding period and certain otherrestrictions) against their U.S. income taxes if more than50% of the Portfolio’s total assets at the close of anytaxable year consist of stock or securities of foreigncorporations. Ownership of unsponsored DepositaryReceipts may not entitle the Portfolio to financial orother reports from the issuer to which it would beentitled as the owner of sponsored Depositary Receipts.See also “Shareholder Information—Tax Considerations”below.
Emerging and Frontier Market Securities. The risks ofinvesting in foreign securities may be intensified in thecase of investments in issuers domiciled or doingsubstantial business in developing countries with limitedor immature capital markets. Security prices andcurrency valuations in emerging and frontier markets canbe significantly more volatile than in the moreestablished markets of the developed nations, reflectingthe greater uncertainties of investing in less maturemarkets and economies. In particular, developingcountries may have relatively unstable governments,present the risk of sudden adverse government actionand even nationalization of businesses, restrictions onforeign ownership, or prohibitions of repatriation ofassets, and may have less protection of property rightsthan more developed countries. The economies ofdeveloping countries may be predominantly based ononly a few industries, may be highly vulnerable tochanges in local or global trade conditions and maysuffer from extreme debt burdens or volatile inflationrates. Local securities markets may trade a small numberof securities and may be unable to respond effectively toincreases in trading volume, potentially making promptliquidation of substantial holdings difficult or impossibleat times. Transaction settlement and dividend collectionprocedures may be less reliable than in developedmarkets. Securities of issuers located in developingcountries may have limited marketability and may besubject to more abrupt or erratic price movements.
35

Small- and Mid-Capitalization Companies. Investmentin smaller and medium-sized companies involves greaterrisk than investment in larger, more establishedcompanies. Their common stock and other securities maytrade less frequently and in limited volume. Accordingly,the prices of such securities are generally more sensitiveto purchase and sale transactions and tend to be morevolatile than the prices of securities of companies withlarger market capitalizations. Because of this, if aPortfolio wishes to sell a large quantity of a small ormedium-sized company’s shares, it may have to sell at alower price than it believes is reflective of the value ofthe shares, or it may have to sell in smaller quantitiesthan desired and over a period of time. These companiesmay face greater business risks because they lack themanagement depth or experience, financial resources,product diversification, or competitive strengths of largercompanies, and they may be more adversely affected bypoor economic conditions. There may be less publicly-available information about smaller companies thanlarger companies. Small company stocks, as a group,tend to go in and out of favor based on economicconditions and market sentiment, and during certainperiods will perform poorly relative to other types ofinvestments, including larger company stocks. Generally,the smaller the company size, the greater these risksbecome.
High Yield/High Risk Securities. The Portfolios mayinvest in debt and convertible securities rated lower thanBaa by Moody’s, or BBB by S&P, or unrated securities ofequivalent quality as determined by Harding Loevner(commonly referred to as “junk bonds”). Junk bondstypically involve greater risk and are less liquid thanhigher grade debt securities. The lower the ratings ofsuch debt securities, the greater their risks render themlike equity securities. None of the Portfolios may invest insecurities rated, at the time of investment, C or below byMoody’s, or D or below by S&P, or the equivalent asdetermined by Harding Loevner, which may be in defaultwith respect to payment of principal or interest.
Illiquid and Restricted Securities. Each Portfolio mayinvest up to 15% of the value of its net assets in illiquidsecurities. Illiquid securities are securities that may notbe sold or disposed of in the ordinary course of businesswithin seven days at approximately the value at which aPortfolio has valued the investments and includesecurities with legal or contractual restrictions on resale,time deposits, repurchase agreements having maturitieslonger than seven days, and securities that do not havereadily available market quotations. In addition, aPortfolio may invest in securities that are sold in privateplacement transactions between their issuers and theirpurchasers and that are neither listed on an exchangenor traded over-the-counter. These factors may have anadverse effect on the Portfolio’s ability to dispose ofparticular securities and may limit a Portfolio’s ability toobtain accurate market quotations for purposes ofvaluing securities and calculating net asset value and tosell securities at fair value. If any privately placedsecurities held by a Portfolio are required to be registeredunder the securities laws of one or more jurisdictionsbefore being resold, the Portfolio may be required to bearthe expenses of registration.
Derivatives and Hedging. The Portfolios may usederivative instruments, including without limitation,options, futures, participation notes, options on futures,forwards, swaps, structured securities, and derivativesrelating to foreign currency transactions (collectively,“derivatives”), for hedging purposes and to increaseoverall return for the Portfolios. The use of derivativesinvolves special risks, including possible default by theother party to the transaction, illiquidity and, to theextent a Portfolio’s orientation as to certain anticipatedmarket movements is incorrect, the possibility that theuse of derivatives could result in greater losses than ifthey had not been used.
Options and Futures. The Portfolios may purchase orsell options. The sale of put and call options could resultin losses to a Portfolio, force the purchase, or sale ofportfolio securities at inopportune times, or for priceshigher or lower than current market values, or cause thePortfolio to hold a security it might otherwise sell. Thepurchase of options involves costs associated with theoption premium and, if the option is exercised, risksassociated with the settlement and the creditworthinessof the party selling the option. The use of options andfutures transactions entails certain special risks. Inparticular, the variable degree of correlation betweenprice movements of futures contracts and pricemovements in the related portfolio position of a Portfoliocould create the possibility that losses on the derivativewill be greater than gains in the value of the Portfolio’sposition. The loss from investing in futures transactionsthat are unhedged or uncovered is potentially unlimited.In addition, futures and options markets could be illiquidin some circumstances and certain over-the-counteroptions could have no markets. A Portfolio might not beable to close out certain positions without incurringsubstantial losses. To the extent a Portfolio utilizesfutures and options transactions for hedging, suchtransactions should tend to reduce the risk of loss due toa decline in the value of the hedged position and, at thesame time, limit any potential gain to the Portfolio thatmight result from an increase in value of the position.Finally, the daily variation margin requirements forfutures contracts create a greater ongoing potentialfinancial risk than would the purchase of options, inwhich case the exposure is limited to the cost of theinitial premium and transaction costs.
Participation Notes. Participation notes are issued bybanks, or broker-dealers, or their affiliates and aredesigned to replicate the return of a particularunderlying equity or debt security, currency, or market.When the participation note matures, the issuer of theparticipation note will pay to, or receive from, a Portfoliothe difference between the nominal value of theunderlying instrument at the time of purchase and thatinstrument’s value at maturity. Participation notesinvolve the same risks associated with a directinvestment in the underlying security, currency, ormarket that they seek to replicate. A Portfolio has norights under participation notes against the issuer(s) ofthe underlying security(ies) and must rely on thecreditworthiness of the issuer(s) of the participationnotes. In general, the opportunity to sell participationnotes to a third party will be limited or nonexistent.
36

Additional information regarding the risks and specialconsiderations associated with derivatives appears in theStatement of Additional Information (“SAI”), which maybe obtained by following the instructions at the back ofthis Prospectus.
NAV Risk. The net asset value of a Portfolio and thevalue of your investment will fluctuate.
Geographic Risk. Concentration of the investments of aPortfolio in issuers located in a particular country orregion will subject such Portfolio, to a greater extent thanif investments were less concentrated, to the risks ofvolatile economic cycles and/or conditions, anddevelopments that may be particular to that country orregion, such as: adverse securities markets; adverseexchange rates; social, political, regulatory, economic orenvironmental developments; or natural disasters.
Management Risk. A strategy used by Harding Loevnermay fail to produce the intended results.
Credit Quality. The value of an individual security orparticular type of security can be more volatile than themarket as a whole and can behave differently from thevalue of the market as a whole. Lower-quality debtsecurities (those of less than investment- grade quality)and certain other types of securities involve greater risk ofdefault or price changes due to changes in the creditquality of the issuer. The value of lower-quality debtsecurities and certain other types of securities can be morevolatile due to increased sensitivity to adverse issuer,political, regulatory, market or economic developments,and such securities might be difficult to resell.
Debt Security Risk. Debt securities may lose value dueto unfavorable fluctuations in the level of interest rates ordue to a decline in the creditworthiness of the issuer. Asinterest rates rise, the value of debt securities generallydeclines. This risk is generally greater for debt securitieswith longer maturities than for debt securities withshorter maturities.
Counterparty (or Default) Risk. An issuer of fixed-income securities held by a Portfolio or a counterparty to aderivative transaction entered into by a Portfolio maydefault on its obligation to pay interest and repayprincipal. Generally, the lower the credit rating of asecurity, the greater the risk that the issuer of the securitywill default on its obligation. High-quality securities aregenerally believed to have relatively low degrees of creditrisk. The Portfolios intend to enter into financialtransactions only with counterparties that are creditworthyat the time of the transactions. There is always the riskthat the analysis of creditworthiness is incorrect or maychange due to market conditions. To the extent that aPortfolio focuses its transactions with a limited number ofcounterparties, it will be more susceptible to the risksassociated with one or more counterparties.
Concentration Risk. The Frontier Emerging MarketsPortfolio may invest up to 35% of its total assets in thesecurities of companies in any one industry if, at the timeof investment, that industry represents 20% or more ofthe Portfolio’s benchmark index, currently the MSCI
Frontier Emerging Markets Index. At any time thePortfolio has such a concentration of investments in asingle industry group, it will be particularly vulnerable toadverse economic, political, and other factors that affectthat industry group. Investment opportunities in manyfrontier emerging market countries may be concentratedin the banking industry. In many frontier emergingmarkets, banks are among the largest publicly-tradedcompanies and their securities are among the mostwidely traded. The banking industry is a comparativelynarrow segment of the economy generally, including infrontier emerging market countries and, therefore, thePortfolio may experience greater volatility than portfoliosinvesting in a less-concentrated fashion or a broaderrange of industries. Issuers in the banking industry maybe subject to additional risks such as increasedcompetition within the industry, or changes inlegislation, or government regulations affecting theindustry. The value of the Portfolio’s shares may beparticularly vulnerable to factors affecting the bankingindustry, such as the availability and cost of capitalfunds, changes in interest rates, the rate of corporate andconsumer debt defaults, extensive governmentregulation, and price competition. Such risks may bemagnified with respect to securities of issuers in frontieremerging markets. Please refer to the Portfolio’s SAI forfurther information relating to concentration.
Currency Risk. Investments in foreign currencies aresubject to the risk that those currencies will decline invalue relative to the U.S. dollar or, in the case of hedgedpositions, that the U.S. dollar will decline relative to thecurrency being hedged. Currency exchange rates mayexperience steady or sudden fluctuation over shortperiods of time. A decline in the value of foreigncurrencies relative to the U.S. dollar will reduce the valueof securities held by a Portfolio and denominated inthose currencies. A Portfolio may seek to reduce currencyrisk by hedging part or all of its exposure to variousforeign currencies, although a Portfolio generally doesnot hedge foreign currency exposure; however, if suchhedging techniques are employed, there is no assurancethat they will be successful.
Financial Services Sector Risk. To the extent a Portfolioinvests in securities and other obligations of issuers in thefinancials sector, the Portfolio will be vulnerable to eventsaffecting companies in the financials industry. Examples ofrisks affecting the financials sector include changes ingovernmental regulation, issues relating to the availabilityand cost of capital, changes in interest rates and/ormonetary policy, and price competition. In addition,financials companies are often more highly leveraged thanother companies, making them inherently riskier.
DISCLOSURE OF PORTFOLIO HOLDINGSA description of the Fund’s policies and proceduresregarding disclosure of each Portfolio’s portfoliosecurities is available in the SAI. Portfolio holdingsinformation as of each calendar quarter end is availableto shareholders on the Fund’s website. This informationis available no sooner than five (5) business days afterthe applicable calendar quarter end. Certain otheradditional information about the Fund’s Portfolios isavailable publicly on the website for AMG Funds,www.amgfunds.com.
37

MANAGEMENT OF THE FUND
INVESTMENT ADVISER
Harding Loevner serves as investment adviser to theFund’s Portfolios. Harding Loevner, established in 1989,is a registered investment adviser that provides globalinvestment management for private investors andinstitutions. As of December 31, 2017, Harding Loevnermanaged approximately $62 billion in assets. HardingLoevner is located at 400 Crossing Boulevard, FourthFloor, Bridgewater, New Jersey 08807.
Subject to the direction and authority of the Board ofDirectors, Harding Loevner provides investment advisoryservices to each Portfolio pursuant to investmentadvisory agreements (the “Investment AdvisoryAgreements”). Under the Investment AdvisoryAgreements, Harding Loevner is responsible forproviding investment research and advice, determiningwhich portfolio securities shall be purchased or sold byeach Portfolio, purchasing and selling securities on behalfof the Portfolios, and determining how voting and otherrights with respect to the portfolio securities of thePortfolios are exercised in accordance with eachPortfolio’s investment objective, policies, and restrictions.Harding Loevner also provides office space, equipment,and personnel necessary to manage the Portfolios.Harding Loevner bears the expense of providing theabove services to each Portfolio.
The aggregate annualized advisory fees paid by eachPortfolio, excluding any applicable waivers orreimbursements, to Harding Loevner during the fiscalyear ended October 31, 2017 as a percentage of eachPortfolio’s average daily net assets were:
PortfolioAggregate
Advisory Fees
Global Equity 0.80%
International Equity 0.68%
International Small Companies 1.15%
Institutional Emerging Markets 1.12%
Frontier Emerging Markets 1.40%
Global Equity Research 0.80%
International Equity Research 0.75%
Emerging Markets Research 1.15%
Harding Loevner may make payments from its ownresources to parties that provide distribution,recordkeeping, shareholder communication, and otherservices under mutual fund supermarket and otherprograms. See also “Distribution of Fund Shares” below.
ADVISORY CONTRACT APPROVAL
A discussion of the basis for the Board of Director’sapproval of the Investment Advisory Agreement for the
Portfolios, except the Global Equity Research Portfolioand Emerging Markets Research Portfolio, is available inthe Fund’s annual report to shareholders for the periodended October 31, 2017. A discussion of the basis for theBoard of Director’s approval of the Investment AdvisoryAgreement for the Global Equity Research Portfolio andEmerging Markets Research Portfolio is available in theFund’s semi-annual report to shareholders for the periodended April 30, 2017.
PORTFOLIO MANAGEMENT
Peter Baughan, CFA has been a co-lead portfoliomanager since 2003 and an analyst since 1997. As ananalyst, he focuses on consumer discretionary andindustrials companies. Mr. Baughan graduated from theUniversity of North Carolina, Chapel Hill in 1983 andjoined Harding Loevner in 1997. Mr. Baughan serves as aco-lead portfolio manager for the Global Equity Portfolio.
Pradipta Chakrabortty has been a portfolio manager andan analyst since 2008. As an analyst, he focuses onfrontier emerging market companies. Mr. Chakraborttygraduated from BIRLA Institute of Technology & Science(Pilani, India) in 1994, received an MBA in Finance andMarketing from XLRI School of Management(Jamshedpur, India) in 1998, and received an MBA inFinance from University of Pennsylvania, the WhartonSchool, in 2008. He joined Harding Loevner in 2008.Mr. Chakrabortty serves as a co-lead portfolio managerfor the Frontier Emerging Markets Portfolio and as aportfolio manager for the Institutional Emerging MarketsPortfolio and Emerging Markets Portfolio.
Scott Crawshaw has been a portfolio manager since 2014and an analyst since 2015. As an analyst, he focuses onemerging markets companies. Mr. Crawshaw graduatedfrom University of Bristol in 1995. From 2004 to 2014,Mr. Crawshaw was a senior portfolio manager andresearch analyst for Russell Investments. He joinedHarding Loevner in 2014. Mr. Crawshaw serves as aportfolio manager for the Global Equity Portfolio,International Equity Portfolio, Institutional EmergingMarkets Portfolio, and Emerging Markets Portfolio.
G. Rusty Johnson, CFA has been a co-lead portfoliomanager since 1998, and an analyst since 1994. As ananalyst, he focuses on emerging markets companies. Hegraduated from Washington and Lee University in 1986.He also studied at Fu Jen University in Taiwan andChinese University in Hong Kong. Mr. Johnson joinedHarding Loevner in 1994. Mr. Johnson serves as a co-lead portfolio manager for the Institutional EmergingMarkets Portfolio and Emerging Markets Portfolio.
Bryan Lloyd, CFA has been a portfolio manager since2014 and an analyst since 2011 when he joined HardingLoevner. As an analyst, he focuses on financialscompanies. Mr. Lloyd graduated from Lafayette Collegein 1996. Mr. Lloyd serves as a portfolio manager for theInternational Equity Portfolio.
Christopher Mack, CFA has been a portfolio managersince 2014 and an analyst since 2008. As an analyst, he
38

focuses on information technology companies. Mr. Mackgraduated from Lafayette College in 2004 and joinedHarding Loevner that same year. Mr. Mack serves as aportfolio manager for the Global Equity Portfolio.
Babatunde Ojo, CFA has been a portfolio manager since2014 and an analyst since 2012. As an analyst, hefocuses on frontier emerging markets companies. Mr. Ojograduated from University of Lagos in 2002. He receivedan MBA in Finance and Management from University ofPennsylvania, the Wharton School, in 2012 and joinedHarding Loevner that same year. Mr. Ojo serves as a co-lead portfolio manager for the Frontier EmergingMarkets Portfolio.
Jafar Rizvi, CFA has been a portfolio manager since 2011and an analyst since 2008. As an analyst, he focuses onconsumer discretionary, telecom services andinternational small companies. Mr. Rizvi graduated fromAligarh University in 1988 and from J Nehru Universityin 1990. He received an MBA from Baruch College, TheCity University of New York in 1998 and an MPA fromColumbia University’s School of International & PublicAffairs in 2010. He joined Harding Loevner in 2008.Mr. Rizvi serves as a portfolio manager for theInternational Small Companies Portfolio.
Ferrill Roll, CFA has been a co-lead portfolio managersince 2001, an analyst since 1996, and the Co-ChiefInvestment Officer since 2016. As an analyst, he focuseson financials companies. Mr. Roll graduated fromStanford University in 1980 and joined Harding Loevnerin 1996. Mr. Roll serves as a co-lead portfolio managerfor the Global Equity Portfolio and International EquityPortfolio.
Richard Schmidt, CFA has been a portfolio manager andanalyst since 2011. As an analyst, he focuses onconsumer staples companies. Mr. Schmidt graduatedfrom Georgetown University in 1986. He joined HardingLoevner in 2011. Mr. Schmidt serves as a portfoliomanager for the Global Equity Portfolio, InstitutionalEmerging Markets Portfolio, and Emerging MarketsPortfolio.
Craig Shaw, CFA has been a portfolio manager since2006 and an analyst since 2001. As an analyst, hefocuses on energy companies. Mr. Shaw graduated fromConcordia College in 1986, and received an MIM inInternational Management from Thunderbird/GarvinSchool of International Management in 1989. He joinedHarding Loevner in 2001. Mr. Shaw serves as a co-leadportfolio manager for the Institutional Emerging MarketsPortfolio and Emerging Markets Portfolio.
Moon Surana, CFA has been a portfolio manager since2015 and an analyst since 2009. As an analyst, shefocuses on financials companies. Ms. Surana graduatedfrom Manipal Institute of Technology in 2005 andreceived an MS in Financial Engineering from theUniversity of Michigan in 2008. She joined HardingLoevner in 2009. Ms. Surana serves as a portfoliomanager for the Global Equity Research Portfolio,International Equity Research Portfolio, and EmergingMarkets Research Portfolio.
Patrick Todd, CFA has been a portfolio manager since2017 and an analyst since 2012 when he joined HardingLoevner. As an analyst, he focuses on health care andreal estate companies. Mr. Todd graduated from HarvardUniversity in 2002 and received an MBA in Applied ValueInvesting from Columbia Business School in 2011.Mr. Todd serves as a portfolio manager for theInternational Equity Portfolio.
Alexander Walsh, CFA has been a portfolio managersince 2001, and an analyst since 1994. As an analyst, hefocuses on health care companies. Mr. Walsh graduatedfrom McGill University in 1978 and joined HardingLoevner in 1994. Mr. Walsh serves as a co-lead portfoliomanager for the International Equity Portfolio.
Andrew West, CFA has been a portfolio manager since2014, an analyst since 2006 and the Manager ofInvestment Research since 2011. As an analyst, hefocuses on consumer discretionary and industrialscompanies. Mr. West graduated from the University ofCentral Florida in 1991 and received an MBA in Financeand International Business from New York University,Leonard N. Stern School of Business, in 2003. He joinedHarding Loevner in 2006. Mr. West serves as a portfoliomanager for the International Equity Portfolio, GlobalEquity Research Portfolio, International Equity ResearchPortfolio, and Emerging Markets Research Portfolio.
Additional information regarding the portfolio managers’compensation, their management of other funds andtheir ownership of the Fund can be found in the SAI.
PORTFOLIO EXPENSES
Each Portfolio pays for all of its expenses out of its ownassets. Harding Loevner or other service providers maywaive all or any portion of their fees and reimbursecertain expenses to each Portfolio. Any fee waiver orexpense reimbursement would increase the investmentperformance of each Portfolio for the period duringwhich the waiver or reimbursement is in effect.
39

SHAREHOLDER INFORMATIONDETERMINATION OF NET ASSET VALUEThe “net asset value” per share (“NAV”) of the Portfoliosis calculated as of the close of business (normally 4:00p.m. New York Time) on days when the New York StockExchange is open for business, except when trading isrestricted (a “Business Day”). Each Class or Portfoliodetermines its NAV per share by subtracting that Class orPortfolio’s liabilities (including accrued expenses anddividends payable) from the total value of the Portfolio’sinvestments or the portion of a Portfolio’s investmentsattributable to a Class and other assets and dividing theresult by the total issued and outstanding shares of theClass or Portfolio. Because the Portfolios may invest inforeign securities that are primarily listed on foreignexchanges that may trade on weekends or other dayswhen the Portfolios do not price their shares, the value ofthe Portfolios’ assets may be affected on days whenshareholders will not be able to purchase or redeem thePortfolios’ shares.
Each Portfolio’s investments are valued based on marketquotations, or if market quotations are not readilyavailable or are deemed unreliable, the fair value of thePortfolio’s investments may be determined in good faithunder procedures established by the Board of Directorsas discussed below.
Fair Valuation. Since trading in many foreign securitiesis normally completed before the time at which aPortfolio calculates its NAV, the effect on the value ofsuch securities held by a Portfolio of events that occurbetween the close of trading in the security and the timeat which the Portfolio prices its securities would not bereflected in the Portfolio’s calculation of its NAV ifforeign securities were generally valued at their closingprices.
To address this issue, the Board of Directors hasapproved the daily use of independently providedquantitative models that may adjust the closing prices ofcertain foreign equity securities based on informationthat becomes available after the foreign market closes,through the application of an adjustment factor to suchsecurities’ closing price. Adjustment factors may begreater than, less than, or equal to one. Thus, use ofthese quantitative models could cause the Portfolio’s NAVper share to differ significantly from that which wouldhave been calculated using closing market prices. Theuse of these quantitative models is also intended todecrease the opportunities for persons to engage in “timezone arbitrage,” i.e., trading intended to take advantageof stale closing prices in foreign markets that could affectthe NAV of the Portfolios.
Additionally, any securities for which market quotationsare not readily available, such as when a foreign marketis closed, or for which available prices are deemedunreliable are priced by Harding Loevner at “fair value asdetermined in good faith” in accordance with proceduresestablished by and under the general supervision of theBoard of Directors.
PURCHASE AND REDEMPTION OFSHARES
Purchases. The minimum initial investment in theInstitutional Class of the Global Equity Portfolio, theInternational Equity Portfolio, the International SmallCompanies Portfolio, the Global Equity ResearchPortfolio, the International Equity Research Portfolio,and the Emerging Markets Research Portfolio andInstitutional Class I of the Frontier Emerging MarketsPortfolio is $100,000. The minimum initial investment inClass I of the Institutional Emerging Markets Portfolio is$500,000. The minimum initial investment in each ofClass II of the Institutional Emerging Markets Portfolioand Institutional Class II of the Frontier EmergingMarkets Portfolio is $25,000,000 and $10,000,000,respectively. Additional purchases or redemptions maybe of any amount. Institutions may satisfy the minimuminvestment by aggregating their fiduciary accounts. TheFund reserves the right to waive the minimum initialinvestment amount for any Portfolio.
The Fund has authorized one or more brokers to receivepurchase orders on its behalf. Such brokers areauthorized to designate other intermediaries to acceptpurchase orders on the Fund’s behalf. The Fund will bedeemed to have received a purchase order when anauthorized broker or, if applicable, a broker’s authorizedagent receives the order in proper form. Share purchaseorders placed through an authorized broker or thebroker’s authorized designee will be priced at the NAVper share next determined after they are received inproper form by an authorized broker or the broker’sauthorized designee and accepted by the Fund. Withrespect to purchases of Portfolio shares through certainbrokers: 1) a broker may charge transaction fees, orother different, or additional fees; 2) duplicate mailingsof Fund material to shareholders who reside at the sameaddress may be eliminated; and 3) the minimum initialinvestment through certain brokers may be less than adirect purchase with the Fund.
The offering of shares of a Portfolio is continuous andpurchases of shares of a Portfolio may be made on anyBusiness Day. The Fund offers shares of each Portfolio ata public offering price equal to the NAV per share nextdetermined after receipt of a purchase order.
Institutional Emerging Markets Portfolio: TheInstitutional Emerging Markets Portfolio is generallyclosed to new investors. Certain investors may continueto acquire shares, subject to the requirements andlimitations set forth below:
▪ Investors who are shareholders, of record or through anintermediary, of the Institutional Emerging MarketsPortfolios as of April 10, 2017 may continue to makeadditional purchases and reinvestments of distributionsinto their accounts; however, any investment in excessof $5 million (as a single investment or a series ofrelated investments) requires the prior approval ofHarding Loevner.
40

▪ Participants in retirement or employee benefit plansthat, as of April 10, 2017, have arrangements in placein respect of the Institutional Emerging MarketsPortfolio may continue to make additional purchasesand reinvestments of distributions into their accounts.
▪ Financial intermediaries using asset-allocation modelportfolios that, as of April 10, 2017, havearrangements in place in respect of the InstitutionalEmerging Markets Portfolio (“Current ModelPortfolios”) may make or allow purchases andreinvestments of distributions in existing or newaccounts for investors in such Current ModelPortfolios; however, financial intermediaries may notincrease the allocation in to the Institutional EmergingMarkets Portfolio in Current Model Portfolios withoutthe approval of Harding Loevner.
Where Harding Loevner’s prior approval is required,Harding Loevner will review the investment on anindividual basis and may, but is not required to, permit itafter considering relevant factors including, but notlimited to, whether the additional purchases are exceptedto negatively impact the Institutional Emerging MarketsPortfolio or its shareholders as a whole.
Other investors generally may not purchase shares of theInstitutional Emerging Markets Portfolio. If you arepurchasing shares of the Institutional Emerging MarketsPortfolio through a financial intermediary, please consultwith the appropriate representative to confirm youreligibility to invest in the Portfolio.
Investors may be required to demonstrate eligibility tobuy shares of the Institutional Emerging MarketsPortfolio before an investment is accepted.
The Fund and Harding Loevner may make exceptions orotherwise modify this policy at any time. For questionsabout qualifying to purchase shares of the InstitutionalEmerging Markets Portfolio, please call (877) 435-8105.
You may purchase shares of a Portfolio utilizing thefollowing methods:
Wire Transfer: Purchases of shares may be made by wiretransfer of Federal funds. Share purchase orders areeffective on the date when the Transfer Agent receives acompleted Account Application Form (and other requireddocuments) and Federal funds become available to theFund in the Fund’s account with the Transfer Agent asset forth below. The shareholder’s bank may impose acharge to execute the wire transfer. Please call theTransfer Agent at (877) 435-8105 for instructions andpolicies on purchasing shares by wire.
In order to purchase shares on a particular Business Day,a purchaser must call the Transfer Agent as soon aspossible, but no later than by the close of business(normally 4:00 p.m. New York Time), to inform the Fundof the incoming wire transfer and clearly indicate thename of the Portfolio and which class of shares is to bepurchased. If Federal funds are received by the Fund thatsame day, the order will be effective on that day. If the
Fund receives trade instructions after the above-mentioned cut-off time, or if the Transfer Agent does notreceive Federal funds, such purchase order shall beexecuted as of the date that Federal funds are received.Portfolio shares are normally issued upon receipt ofpayment by cash, check, or wire transfer.
Check: A check used to purchase shares in a Portfoliomust be payable to the Portfolio in which you wish topurchase shares, and must be drawn against funds ondeposit at a U.S. bank. For a new account, the ordermust include a completed Account Application Form(and other required documents, if any). For an existingaccount, the order should include the account numberfrom your statement. In all cases, the purchase price isbased on the NAV per share next determined after thepurchase order and check are received and deposited ingood order. The Fund or the Transfer Agent reserves theright to reject any check. All checks for share purchasesshould be sent to the Fund’s Transfer Agent at:
Regular Mail:Harding, Loevner Funds, Inc.c/o The Northern Trust CompanyP.O. Box 4766Chicago, Illinois 60680-4766
Overnight Delivery:The Northern Trust CompanyAttn: Harding, Loevner Funds, Inc.801 S. Canal St.Attn: Funds Center C5SChicago, Illinois 60607
The Fund reserves the right in its sole discretion: (i) tosuspend or modify the offering of a Portfolio’s shares;(ii) to reject purchase orders; and (iii) to modify oreliminate the minimum initial investment in Portfolioshares. Purchase orders may be refused if, for example,they are of a size that could disrupt management of aPortfolio.
Please note that in compliance with the USA Patriot Actof 2001, the Fund’s Transfer Agent will verify certaininformation on your account application as part of theFund’s anti-money laundering compliance program. Ifyou do not supply the necessary information, the Fund’sTransfer Agent may not be able to open your account.Additionally, if the Fund’s Transfer Agent is unable toverify your identity or that of another person authorizedto act on your behalf, or if it believes it has identifiedpotentially criminal activity, the Fund reserves the rightto close your account or take any other action it deemsreasonable or required by law.
Redemptions. Upon the request of a shareholder, theFund will redeem all or any part of the shares heldthrough the account. The redemption price is the NAVper share next determined after receipt by the TransferAgent of proper notice of redemption as described below.If the Transfer Agent receives such notice by the close ofbusiness (normally 4:00 p.m. New York Time) on anyBusiness Day, the redemption will be effective on thedate of receipt.
41

Payment of redemption proceeds made by check or wirewill normally be made within one to three Business Daysfollowing receipt of the redemption request, or at othertimes in accordance with the requirements of yourintermediary.
For Shares held directly with the Fund, payment ofredemption proceeds by wire will normally be made onthe next Business Day following receipt of theredemption order. For payment by check, the Portfoliostypically expect to mail the check on the next BusinessDay following receipt of the redemption order.
For Shares held through financial intermediaries, thelength of time that the Portfolios typically expect to payredemption proceeds depends on the method of paymentand the agreement between the financial intermediaryand the Portfolio. For redemption proceeds that are paiddirectly to you by a Portfolio, the Portfolio typicallyexpects to make payments by wire or by mailing a checkon the next Business Day following the Portfolio’s receiptof a redemption order from the financial intermediary.For payments that are made to your financialintermediary for transmittal to you, the Portfolios expectto pay redemption proceeds to the financial intermediarywithin one to three Business Days following thePortfolio’s receipt of the redemption order from thefinancial intermediary.
Payment of redemption proceeds may take longer thanthe time a Portfolio typically expects and may take up toseven days, as permitted by the 1940 Act.
For redemption orders that settle on federal bankholidays, your redemption proceeds will be sent on thenext Business Day following the holiday.
If you are redeeming shares recently purchased by checkor electronic transaction, your redemption may not bepaid until your check or electronic transaction hascleared. This may delay your payment for up to 10 days.If the notice is received on a day that is not a BusinessDay or after the above-mentioned cut-off time, theredemption notice will be deemed received as of the nextBusiness Day.
The Fund has authorized one or more brokers to receiveredemption orders on its behalf. Such brokers areauthorized to designate other intermediaries to receiveredemption orders on the Fund’s behalf. The Fund willbe deemed to have received a redemption order when anauthorized broker or, if applicable, a broker’s authorizedagent receives the order in proper form. Shareredemption orders placed through an authorized brokeror the broker’s authorized designee will be priced at thePortfolio’s NAV per share next determined after they arereceived in good order by an authorized broker or thebroker’s authorized designee.
Other than the redemption fee assessed on short-termredemptions, as described below, the Fund imposes nocharge to redeem shares; however, a shareholder’s orbroker’s bank may impose its own wire transfer fee forreceipt of a wire. Redemptions may be executed in any
amount requested by the shareholder up to the amountthe shareholder has invested in the Portfolio. When ashareholder’s account balance falls below the minimuminitial investment amount of a class in which suchshareholder is invested following a redemption, suchshareholder will be notified that the minimum accountbalance is not being maintained and will be allowed60 days to make additional investments. If suchshareholder does not make additional investments, thenthe Portfolio may close the account or convert the sharesin the account to another share class (See “ShareClass Conversions” below).
To redeem shares, a shareholder or any authorized agent(so designated on the Account Application Form) mustprovide the Transfer Agent with the dollar or shareamount to be redeemed, the account to which theredemption proceeds should be wired (which accountshall have been previously designated by the shareholderon its Account Application Form), the name of theshareholder, and the shareholder’s account number.Shares that are redeemed prior to the record date of adistribution do not receive dividends.
Certain requests or changes must be made in writing tothe Transfer Agent and must include a signatureguaranteed by a national bank that is a member of theMedallion Signature Program, using the specificMedallion “Guaranteed” stamp. Notarized signaturesare not sufficient. Further documentation may berequired when the Transfer Agent deems it appropriate.Requests or changes must include a SignatureGuarantee if a shareholder:
▪ wishes to change its authorized agent;
▪ wishes to redeem shares within 10 Business Days ofchanging the account address of record;
▪ wishes to change the account designated to receiveredemption proceeds; or
▪ requests that a check be mailed to a different addressthan the record address.
A shareholder may request redemption by calling theTransfer Agent (toll-free) at (877) 435-8105. Telephoneredemption privileges are made available to shareholdersof the Fund on the Account Application Form. The Fundor the Transfer Agent employ reasonable proceduresdesigned to confirm that instructions communicated bytelephone are genuine. The Fund or the Transfer Agentmay require personal identification codes and will onlywire funds according to pre-existing bank accountinstructions. No bank account instruction changes will beaccepted via telephone.
Generally, all redemptions will be for cash. Periodically,the Portfolios may satisfy redemption requests byaccessing a line of credit or overdraft facility. On a lessregular basis, under stressed market conditions, as wellas for other temporary or emergency purposes, thePortfolios may satisfy redemption requests by distributingredemption proceeds in-kind (instead of cash) or byborrowing through other sources. While the Portfolios do
42

not generally use redemptions in-kind, the Fund reservesthe right to redeem from any Portfolio in-kind to managethe impact of large redemptions on the Portfolios.Redemption in-kind proceeds will typically be made bydelivering a pro-rata amount of a Portfolio’s holdingsthat are readily marketable securities to the redeemingshareholder within seven days after the Portfolio’s receiptof the redemption order.
Redemption proceeds will only be paid to theshareholder of record, to a financial intermediary holdingan account in the name of the shareholder of record, orto a court-appointed guardian or executor of theshareholder of record.
Restrictions on Frequent Trading. Frequent purchasesand sales of a Portfolio’s shares can harm shareholders invarious ways, including reducing the returns to long-term shareholders by increasing costs (such as brokeragecommissions) to the Portfolio and by disrupting portfoliomanagement strategies. Accordingly, the Board ofDirectors has adopted policies and procedures todiscourage frequent trading of Portfolio shares. The Funduses fees on short-term redemptions and fair valuepricing of securities to discourage frequent trading andeliminate the opportunity for time zone arbitrage. Aredemption fee of 2% of the value of the sharesredeemed, paid to the Portfolio, is imposed on shares ofa Portfolio redeemed 90 days or less after their date ofpurchase. The redemption fee is intended to discouragefrequent trading and, to the extent that frequent tradingoccurs, to impose the cost of that activity on theshareholders who engage in it. While the Fund iscommitted to preventing market timing and disruptivefrequent trading in the Portfolios, there is no guaranteethat the Fund or its agents will be able to detect allinstances of time zone arbitrage and frequent trading.
The short-term redemption fee does not apply to thefollowing transactions:
▪ Redemptions due to processing errors.
▪ Redemptions due to death or disability.
▪ Redemptions due to a qualified domestic relationsorder or a divorce decree.
▪ 401(k) or 403(b) account transactions, including:minimum required distributions, redemptionspursuant to systematic withdrawal programs,redemptions in connection with termination ofemployment, involuntary distribution, forfeitures,loans, and return of excess contribution amounts.
▪ 529 Plan transactions.
▪ Redemptions by other funds.
▪ Redemptions by accounts participating in certainwealth management programs (including wrapprograms and automatic rebalancing programs) thathave represented to the Fund that (i) their investmentstrategy is not expected to result in frequent trading;and (ii) they have adopted procedures reasonablydesigned to detect and deter frequent trading.
Omnibus accounts are maintained by intermediariesacting on behalf of multiple shareholders. Theseintermediaries may currently be unable to assessredemption fees. Since individual trades in omnibusaccounts are not ordinarily disclosed to the Fund, theFund may be unable to detect or deter frequent tradingby participants in such omnibus accounts.
Exchange Privilege. Institutional Class, Class I, andClass II shares of the Portfolios may be exchanged forshares of another Portfolio or class of the Fund(excluding Institutional Class Z) based on the respectiveNAV of the shares involved in the exchange, if: (i) theshareholder wishing to exchange shares resides in a statewhere the Portfolio and class of shares to be acquired arequalified for sale; and (ii) the investment meets theminimum investment requirement for the Portfolio andclass of shares to be acquired. The following tableincludes the minimum initial investment required byeach class of each Portfolio.
43

PortfolioMinimum Initial Investment
(by Class)
$5,000 $100,000 $500,000 $10,000,000 $25,000,000
Global Equity Advisor Class† Institutional Class
International Equity Investor Class† Institutional Class
International Small Companies Investor Class† Institutional Class
Institutional Emerging Markets‡ Class I‡ Class II‡
Emerging Markets†‡ Advisor Class†
Frontier Emerging Markets Investor Class† Institutional Class I Institutional Class II
Global Equity Research Investor Class† Institutional Class
International Equity Research Investor Class† Institutional Class
Emerging Markets Research Investor Class† Institutional Class
† Not offered in this Prospectus.‡ Effective as of the close of business on June 30, 2016, the Portfolio is generally closed to new investors. Current investors will continue to be
permitted to purchase shares and certain other investors may still be eligible to purchase shares. For more information, see the section“Shareholder Information—Purchase and Redemption of Shares” in the Portfolio’s Prospectus.
An exchange order is treated for tax purposes the sameas a redemption (on which a taxable gain or loss may berealized) followed by a purchase and may be subject tofederal income tax. Investors who wish to makeexchanges should telephone the Transfer Agent (toll-free) at (877) 435-8105.
Share Class Conversions. If a shareholder’s accountbalance falls below the minimum initial investmentamount of a class in which such shareholder is invested,the Global Equity, International Equity, InternationalSmall Companies, Frontier Emerging Markets, GlobalEquity Research, International Equity Research andEmerging Markets Research Portfolios may convert theshareholder’s Institutional Class or Institutional Class Ishares to Investor Class or Advisor Class shares (asapplicable) of the same Portfolio, the Frontier EmergingMarkets Portfolio may convert the Institutional Class IIshares to Institutional Class I shares, and the InstitutionalEmerging Markets Portfolio may convert theshareholder’s Class II shares to Class I shares, at whichtime the shareholder’s account will be subject to therequirements of Investor Class or Advisor Class shares,Institutional Class I shares or Class I shares, respectively.Such shareholder will be notified and will be allowed 60days to make additional investments before anyconversion occurs. Any such conversion will occur at therelative NAV of the two share classes, without theimposition of any fees or other charges if the accountsare held directly with the Fund. Where a retirement planor other financial intermediary holds Institutional Class,Institutional Class I or Institutional Class II, or Class I orClass II shares on behalf of its participants or clients,shares held by such participants or clients will beconverted to Investor Class, Institutional Class I, orClass I shares as described above when a participant orclient rolls over its accounts with the retirement plan orfinancial intermediary into an individual retirementaccount and such participant or client is not otherwiseeligible to purchase Institutional Class, InstitutionalClass II, or Class II shares of the Portfolio. A conversion
between share classes of the same Portfolio is generallynot a taxable event.
On the request of shareholders, Class I shares of theInstitutional Emerging Markets Portfolio or InstitutionalClass I shares of the Frontier Emerging Markets Portfoliomay be converted to Class II or Institutional Class IIshares of such Portfolio, respectively, if the accountbalance of the shareholder requesting conversion is atleast $25,000,000 and $10,000,000, respectively.Investors who wish to request a conversion shouldtelephone the Transfer Agent (toll-free) at(877) 435-8105 or their salesperson.
Subject to the approval of the Fund, InstitutionalClass shares of a Portfolio may be exchanged forInstitutional Class Z shares of the Global Equity Portfolio,International Equity Portfolio or International EquityResearch Portfolio (which are not offered in thisProspectus) based on the respective NAV of the sharesinvolved in the exchange, assuming that the shareholderwishing to exchange shares resides in a state where thedesired shares are qualified for sale.
DIVIDENDS
Each Class of the Portfolios will declare a dividend fromits net investment income and distributions from itsrealized net short-term and net long-term capital gains, ifany, at least annually, and (unless a shareholder haselected to receive cash) pay such dividends anddistributions by automatically reinvesting in additionalshares of the Portfolio at the NAV per share on theex-date of the dividends or distributions.
TAX CONSIDERATIONS
The following discussion is for general information only.An investor should consult with his or her own taxadviser as to the tax consequences of an investment in a
44

Portfolio, including the status of distributions from eachPortfolio under applicable state or local law.
Federal Income Taxes. Each Class or Portfolio intendsto distribute all of its taxable income by automaticallyreinvesting dividends in additional shares of the sameClass or Portfolio and distributing those shares to itsshareholders, unless a shareholder elects on the AccountApplication Form to receive cash payments for suchdistributions. Shareholders receiving distributions from aPortfolio in the form of additional shares will be treatedfor federal income tax purposes as receiving adistribution of the amount of cash that they would havereceived had they elected to receive the distribution incash.
Dividends paid by a Portfolio from its investmentcompany taxable income (including interest and netshort-term capital gains) will be taxable to a U.S.shareholder as ordinary income, whether received incash or in additional shares. Distributions of net capitalgains (the excess of net long-term capital gains over netshort-term capital losses) are generally taxable toshareholders at the applicable capital gains rates,regardless of how long they have held their shares. If aportion of a Portfolio’s income consists of qualifyingdividends paid by corporations, a portion of thedividends paid by the Portfolio may be eligible for eitherthe corporate dividends-received deduction or the lowerindividual tax rate on qualified dividends if both thePortfolio and shareholder satisfy applicable holdingperiod requirements. The maximum individual rateapplicable to “qualified dividend income” and long-termcapital gains is currently generally either 15% or 20%,depending on whether the individual’s income exceedscertain threshold amounts. An additional 3.8% Medicaretax is imposed on certain net investment income(including ordinary dividends and capital gaindistributions received from the Portfolio and net gainsfrom redemptions or other taxable dispositions ofPortfolio shares) of U.S. individuals, estates, and trusts tothe extent that such person’s “modified adjusted grossincome” (in the case of an individual) or “adjusted grossincome” (in the case of an estate or trust) exceeds certainthreshold amounts.
The sale or exchange of Portfolio shares is a taxabletransaction for federal income tax purposes. Eachshareholder will generally recognize a gain or loss onsuch transactions equal to the difference, if any, betweenthe amount of the net sales proceeds and theshareholder’s tax basis in the Portfolio shares. Such gainor loss will be capital gain or loss if the shareholder heldits Portfolio shares as a capital asset. Any capital gain orloss will generally be treated either as long-term capitalgain or loss if the shareholder held the Portfolio sharesfor more than one year at the time of the sale orexchange, or otherwise as short-term capital gain or loss.
If a shareholder buys shares of a Portfolio before adistribution, the shareholder will be subject to tax on theentire amount of the taxable distribution received.Distributions are taxable to shareholders even if they arepaid from income or gain earned by the Portfolio before
their investment (and thus were included in the pricethey paid for their Portfolio shares).
The Portfolios (or their administrative agents) arerequired to report to the Internal Revenue Service andfurnish to shareholders the cost basis information for saletransactions of shares purchased on or after January 1,2012. Shareholders may elect to have one of several costbasis methods applied to their account when calculatingthe cost basis of shares sold, including average cost,first-in, first-out or some other specific identificationmethod. Unless you instruct otherwise, the Portfolios willuse average cost as their default cost basis method, andwill treat sales as first coming from shares purchasedprior to January 1, 2012. If average cost is used for thefirst sale of shares covered by these new rules, theshareholder may only use an alternative cost method forshares purchased prospectively. Shareholders shouldconsult with their tax advisors to determine the best costbasis method for their tax situation. Shareholders thathold their shares through a financial intermediary shouldcontact such financial intermediary with respect toreporting of cost basis and available elections for theiraccounts.
A distribution will be treated as paid on December 31 ofthe current calendar year if it is declared by a Portfolio inOctober, November or December with a record date inany such month and paid by the Portfolio during Januaryof the following calendar year. Such distributions will betaxable to shareholders in the calendar year in which thedistributions are declared, rather than the calendar yearin which the distributions are received. The Fund willinform shareholders of the amount and tax status of allamounts treated as distributed to them after the close ofeach calendar year.
If more than 50% of the value of a Portfolio’s total assetsat the close of any taxable year consists of securities offoreign corporations, the Portfolio will be eligible to filean election with the Internal Revenue Service that wouldgenerally enable its shareholders to benefit from anyforeign tax credit or deduction available for any foreigntaxes the Portfolio pays. Pursuant to this election, ashareholder will be required to include in gross income(in addition to dividends actually received) its pro ratashare of the foreign taxes paid by a Portfolio, and may beentitled either to deduct its pro rata share of the foreigntaxes in computing its taxable income or to use theamount as a foreign tax credit against its U.S. federalincome tax liability (subject to certain holding period andother requirements). The consequences of such anelection are discussed in more detail in the SAI.
The Portfolios may be required to withhold U.S. federalincome tax at the applicable rate on all distributionspayable to shareholders if they fail to provide thePortfolios with their correct taxpayer identificationnumber or to make required certifications, or if they havebeen notified by the IRS that they are subject to backupwithholding. Backup withholding is not an additionaltax. Any amounts withheld may be credited against U.S.federal income tax liability.
45

Foreign shareholders may be subject to different U.S.federal income tax treatment, including withholding taxat the rate of 30% on amounts treated as ordinarydividends from the Portfolios, as discussed in more detailin the SAI.
State and Local Taxes. A Portfolio may be subject tostate, local or foreign taxation in any jurisdiction inwhich the Portfolio may be deemed to be doing business.
Portfolio distributions may be subject to state and localtaxes. Shareholders should consult their own tax advisersregarding the particular tax consequences of aninvestment in a Portfolio. The foregoing discussion isonly a brief summary of the important federal taxconsiderations generally affecting the Fund and itsshareholders. No attempt is made to present a detailedexplanation of the federal, state or local income taxtreatment of the Fund or its shareholders, and thisdiscussion is not intended as a substitute for careful taxplanning. Accordingly, potential investors should consulttheir tax advisers with specific reference to their own taxsituation.
SHAREHOLDER COMMUNICATIONS
Inquiries concerning the Fund may be made by writing toHarding, Loevner Funds, Inc., c/o The Northern TrustCompany, Attn: Funds Center C5S 801 South CanalStreet, Chicago, Illinois 60607 or by calling the Fund(toll-free) at (877) 435-8105.
When the Fund sends financial reports, prospectuses, andother regulatory materials to shareholders, we attempt toreduce the volume of mail you receive by sending onecopy of these documents to two or more account holderswho share the same address. This will continueindefinitely, unless you notify us otherwise. Should youwish to receive individual copies of materials, please callthe Transfer Agent at (877) 435-8105. Once we havereceived your instructions, you will begin receivingindividual copies for each account at the same addresswithin 30 days.
46

DISTRIBUTION OF FUNDSHARESShares of the Fund are distributed by QuasarDistributors, LLC (“Quasar”) pursuant to a distributionagreement (the “Distribution Agreement”) betweenHarding Loevner, the Fund, and Quasar, under whichQuasar serves as the exclusive distributor of the Fund.
The Fund has agreements with various financialintermediaries under which customers of theseintermediaries may purchase and hold shares of thePortfolios. These intermediaries assess fees inconsideration for providing certain account maintenance,record keeping and transactional services. In recognitionof the savings of expenses to the Fund arising from theintermediaries’ assumption of non-distribution relatedfunctions that the Fund would otherwise perform, suchas providing sub-accounting and related shareholderservices, each Portfolio or Class is authorized (exceptInstitutional Class Z, which is not offered in thisProspectus), pursuant to a Shareholder Servicing Plan, topay to each intermediary up to 0.25% of its average dailynet assets attributable to that intermediary (subject toany applicable fee waiver and/or expensereimbursement). Because of the fee waivers and/orexpense reimbursements applicable to the Portfoliosduring the fiscal year ended October 31, 2017, HardingLoevner paid a portion of the Portfolios’ share of thesefees during that period.
In addition, Harding Loevner may, at its own expenseand out of its own legitimate profits, provide additionalcash payments to financial intermediaries that distributeshares of the Portfolios. Harding Loevner may also sharewith financial advisors and 529 Plan managers and/oradministrators certain marketing expenses or pay for theopportunity to distribute the Portfolios, sponsorinformational meetings, seminars, client awarenessevents, support for marketing materials, or businessbuilding programs. These payments, sometimes referredto as “revenue sharing,” do not change the price paid byinvestors to purchase the Fund’s shares or the amountthe Portfolios receive as proceeds from such sales. Suchpayments may differ as to amount among financialintermediaries based on various factors, including levelsof assets and/or sales (based on gross or net sales) orsome other criteria. In some circumstances, the paymentsmay relate to the Portfolios’ inclusion on a financialintermediary’s preferred list of funds offered to its clientsand may create an incentive for a broker-dealer, or otherfinancial intermediary, or its representatives torecommend or offer shares of the Portfolios to itscustomers over other funds that do not have sponsorsmaking similar payments. You may wish to considerwhether such arrangements exist when evaluating anyrecommendations to purchase or sell shares of thePortfolios. The Fund may enter into additional similararrangements in the future. Further informationconcerning these arrangements is included in the SAI.
47

FINANCIAL HIGHLIGHTSThe financial highlights table is intended to help youunderstand each Portfolio’s financial performance for thepast five years or since inception, if less than five years.Certain information reflects financial results for a singleshare of a Class. The total returns in the table representthe rate that an investor would have earned or lost on aninvestment in a Class or Portfolio (assumingreinvestment of all dividends and distributions). Thisinformation has been derived from the Fund’s financial
statements, which have been audited by KPMG LLP, anindependent registered public accounting firm, whosereport, along with the Fund’s financial statements, areincluded in the annual report, which is incorporated byreference in this Prospectus and the SAI. Information onhow to obtain the semi-annual and audited annualreports for the Fund is found on the back cover of thisProspectus.
GLOBAL EQUITY PORTFOLIO – INSTITUTIONAL CLASS
For the FiscalYear Ended
Oct. 31, 2017
For the FiscalYear Ended
Oct. 31, 2016
For the FiscalYear Ended
Oct. 31, 2015
For the FiscalYear Ended
Oct. 31, 2014
For the FiscalYear Ended
Oct. 31, 2013
Net asset value, beginning of year . . . . . . . . . . . . . . $ 32.53 $ 32.44 $ 32.98 $ 29.84 $ 25.05
Increase (Decrease) in Net Assets fromOperations:
Net investment income (loss)(1) . . . . . . . . . . . . . . . . 0.09 0.13 0.13 0.13 0.17
Net realized and unrealized gain (loss) oninvestments and foreign currency-relatedtransactions . . . . . . . . . . . . . . . . . . . . . . . . . . . . . . . . 8.74 0.92 0.68 3.27 4.74
Net increase (decrease) from investmentoperations . . . . . . . . . . . . . . . . . . . . . . . . . . . . . . . . . . . 8.83 1.05 0.81 3.40 4.91
Distributions to Shareholders from:
Net investment income . . . . . . . . . . . . . . . . . . . . . . . . . (0.13) (0.12) (0.12) (0.13) (0.12)
Net realized gain from investments . . . . . . . . . . . . . . . (0.39) (0.84) (1.23) (0.13) —
Total distributions . . . . . . . . . . . . . . . . . . . . . . . . . . . . (0.52) (0.96) (1.35) (0.26) (0.12)
Net asset value, end of year . . . . . . . . . . . . . . . . . . . $ 40.84 $ 32.53 $ 32.44 $ 32.98 $ 29.84
Total Return . . . . . . . . . . . . . . . . . . . . . . . . . . . . . . . . 27.58% 3.43% 2.51% 11.47% 19.66%
Ratios/Supplemental Data:
Net assets, end of year (000’s) . . . . . . . . . . . . . . . . . $790,097 $779,020 $805,291 $731,897 $543,293
Expenses to average net assets . . . . . . . . . . . . . . . . . 0.93% 0.92% 0.92% 0.97% 0.99%
Expenses to average net assets (net of fees waived/reimbursed) . . . . . . . . . . . . . . . . . . . . . . . . . . . . . . . 0.93% 0.92% 0.92% 0.95% 0.95%
Net investment income to average net assets . . . . . 0.25% 0.42% 0.41% 0.43% 0.62%
Portfolio turnover rate . . . . . . . . . . . . . . . . . . . . . . . 33% 24% 45% 30% 13%
(1) Net investment income per share was calculated using the average shares outstanding method.
48

INTERNATIONAL EQUITY PORTFOLIO – INSTITUTIONAL CLASS
For the FiscalYear Ended
Oct. 31, 2017
For the FiscalYear Ended
Oct. 31, 2016
For the FiscalYear Ended
Oct. 31, 2015
For the FiscalYear Ended
Oct. 31, 2014
For the FiscalYear Ended
Oct. 31, 2013
Net asset value, beginning of year . . . . . . . . . . . . . . $ 18.37 $ 17.69 $ 18.30 $ 17.97 $ 15.15
Increase (Decrease) in Net Assets fromOperations:
Net investment income (loss)(1) . . . . . . . . . . . . . . . . 0.23 0.21 0.20 0.18 0.17
Net realized and unrealized gain (loss) oninvestments and foreign currency-relatedtransactions . . . . . . . . . . . . . . . . . . . . . . . . . . . . . . . . 4.22 0.64 (0.63) 0.29 2.78
Net increase (decrease) from investmentoperations . . . . . . . . . . . . . . . . . . . . . . . . . . . . . . . . . . . 4.45 0.85 (0.43) 0.47 2.95
Distributions to Shareholders from:
Net investment income . . . . . . . . . . . . . . . . . . . . . . . . . (0.18) (0.17) (0.18) (0.14) (0.13)
Net realized gain from investments . . . . . . . . . . . . . . . — — — — —
Total distributions . . . . . . . . . . . . . . . . . . . . . . . . . . . . (0.18) (0.17) (0.18) (0.14) (0.13)
Net asset value, end of year . . . . . . . . . . . . . . . . . . . $ 22.64 $ 18.37 $ 17.69 $ 18.30 $ 17.97
Total Return . . . . . . . . . . . . . . . . . . . . . . . . . . . . . . . . 24.47% 4.91% (2.40)% 2.65% 19.58%
Ratios/Supplemental Data:
Net assets, end of year (000’s) . . . . . . . . . . . . . . . . . $11,107,736 $6,354,810 $4,591,802 $3,819,491 $3,467,793
Expenses to average net assets . . . . . . . . . . . . . . . . . 0.82% 0.84% 0.85% 0.87% 0.87%
Expenses to average net assets (net of fees waived/reimbursed) . . . . . . . . . . . . . . . . . . . . . . . . . . . . . . . 0.82% 0.84% 0.85% 0.87% 0.87%
Net investment income to average net assets . . . . . 1.22% 1.20% 1.11% 1.01% 1.06%
Portfolio turnover rate . . . . . . . . . . . . . . . . . . . . . . . 12% 22% 12% 10% 20%
(1) Net investment income per share was calculated using the average shares outstanding method.
49

INTERNATIONAL SMALL COMPANIES PORTFOLIO –INSTITUTIONAL CLASS
For the FiscalYear Ended
Oct. 31, 2017
For the FiscalYear Ended
Oct. 31, 2016
For the FiscalYear Ended
Oct. 31, 2015
For the FiscalYear Ended
Oct. 31, 2014
For the FiscalYear Ended
Oct. 31, 2013
Net asset value, beginning of year . . . . . . . . . . . . . . $ 13.72 $ 13.40 $ 13.85 $ 14.47 $ 11.45
Increase (Decrease) in Net Assets fromOperations:
Net investment income (loss)(1) . . . . . . . . . . . . . . . . 0.11 0.20 0.11 0.08 0.07
Net realized and unrealized gain (loss) oninvestments and foreign currency-relatedtransactions . . . . . . . . . . . . . . . . . . . . . . . . . . . . . . . . 3.41 0.34 (0.25) 0.23 3.09
Net increase (decrease) from investmentoperations . . . . . . . . . . . . . . . . . . . . . . . . . . . . . . . . . . . 3.52 0.54 (0.14) 0.31 3.16
Distributions to Shareholders from:
Net investment income . . . . . . . . . . . . . . . . . . . . . . . . . (0.16) (0.09) (0.05) (0.06) (0.14)
Net realized gain from investments . . . . . . . . . . . . . . . (0.41) (0.13) (0.26) (0.87) —
Total distributions . . . . . . . . . . . . . . . . . . . . . . . . . . . . (0.57) (0.22) (0.31) (0.93) (0.14)
Net asset value, end of year . . . . . . . . . . . . . . . . . . . $ 16.67 $ 13.72 $ 13.40 $ 13.85 $ 14.47
Total Return . . . . . . . . . . . . . . . . . . . . . . . . . . . . . . . . 26.98% 4.15% (0.98)% 2.28% 27.88%
Ratios/Supplemental Data:
Net assets, end of year (000’s) . . . . . . . . . . . . . . . . . $144,170 $62,785 $ 47,276 $28,711 $ 26,236
Expenses to average net assets . . . . . . . . . . . . . . . . . 1.41% 1.60% 1.64% 1.59% 1.68%
Expenses to average net assets (net of fees waived/reimbursed) . . . . . . . . . . . . . . . . . . . . . . . . . . . . . . . 1.15% 1.25% 1.30% 1.30% 1.39%
Net investment income to average net assets . . . . . 0.72% 1.51% 0.79% 0.58% 0.57%
Portfolio turnover rate . . . . . . . . . . . . . . . . . . . . . . . 19% 49% 38% 36% 97%
(1) Net investment income per share was calculated using the average shares outstanding method.
50

INSTITUTIONAL EMERGING MARKETS PORTFOLIO – CLASS I
For the FiscalYear Ended
Oct. 31, 2017
For the FiscalYear Ended
Oct. 31, 2016
For the FiscalYear Ended
Oct. 31, 2015
For the FiscalYear Ended
Oct. 31, 2014
For the FiscalYear Ended
Oct. 31, 2013
Net asset value, beginning of year . . . . . . . . . . . . . . $ 17.65 $ 16.04 $ 18.60 $ 18.07 $ 16.56
Increase (Decrease) in Net Assets fromOperations:
Net investment income (loss)(1) . . . . . . . . . . . . . . . . 0.19 0.14 0.13 0.20 0.18
Net realized and unrealized gain (loss) oninvestments and foreign currency-relatedtransactions . . . . . . . . . . . . . . . . . . . . . . . . . . . . . . . . 4.20 1.56 (2.56) 0.48 1.45
Net increase (decrease) from investmentoperations . . . . . . . . . . . . . . . . . . . . . . . . . . . . . . . . . . . 4.39 1.70 (2.43) 0.68 1.63
Distributions to Shareholders from:
Net investment income . . . . . . . . . . . . . . . . . . . . . . . . . (0.10) (0.09) (0.13) (0.15) (0.12)
Net realized gain from investments . . . . . . . . . . . . . . . — — — — —
Total distributions . . . . . . . . . . . . . . . . . . . . . . . . . . . . (0.10) (0.09) (0.13) (0.15) (0.12)
Net asset value, end of year . . . . . . . . . . . . . . . . . . . $ 21.94 $ 17.65 $ 16.04 $ 18.60 $ 18.07
Total Return . . . . . . . . . . . . . . . . . . . . . . . . . . . . . . . . 25.08% 10.74% (13.14)% 3.80% 9.85%
Ratios/Supplemental Data:
Net assets, end of year (000’s) . . . . . . . . . . . . . . . . . $4,386,511 $3,051,419 $1,876,495 $1,521,194 $1,043,041
Expenses to average net assets . . . . . . . . . . . . . . . . . 1.28% 1.29% 1.31% 1.31% 1.33%
Expenses to average net assets (net of fees waived/reimbursed) . . . . . . . . . . . . . . . . . . . . . . . . . . . . . . . 1.28% 1.29% 1.30% 1.30% 1.30%
Net investment income to average net assets . . . . . 0.97% 0.88% 0.77% 1.12% 1.06%
Portfolio turnover rate . . . . . . . . . . . . . . . . . . . . . . . 17% 20% 23% 26% 18%
(1) Net investment income per share was calculated using the average shares outstanding method.
51

INSTITUTIONAL EMERGING MARKETS PORTFOLIO – CLASS II
For the FiscalYear Ended
Oct. 31, 2017(2)
For the FiscalYear Ended
Oct. 31, 2016(2)
For the FiscalYear Ended
Oct. 31, 2015(2)
For the PeriodEnded
Oct. 31, 2014(2)(3)
Net asset value, beginning of year . . . . . . . . . . . . . . . . $ 17.71 $ 16.14 $ 18.81 $ 17.58
Increase (Decrease) in Net Assets from Operations:
Net investment income (loss)(1) . . . . . . . . . . . . . . . . . . 0.22 0.16 0.16 0.17
Net realized and unrealized gain (loss) oninvestments and foreign currency-relatedtransactions . . . . . . . . . . . . . . . . . . . . . . . . . . . . . . . . . . 4.21 1.59 (2.60) 1.06
Net increase (decrease) from investment operations . . . 4.43 1.75 (2.44) 1.23
Distributions to Shareholders from:
Net investment income . . . . . . . . . . . . . . . . . . . . . . . . . . . (0.20) (0.18) (0.23) —
Net realized gain from investments . . . . . . . . . . . . . . . . . — — — —
Total distributions . . . . . . . . . . . . . . . . . . . . . . . . . . . . . . . (0.20) (0.18) (0.23) —
Net asset value, end of year . . . . . . . . . . . . . . . . . . . . . . $ 21.94 $ 17.71 $ 16.14 $ 18.81
Total Return . . . . . . . . . . . . . . . . . . . . . . . . . . . . . . . . . . . 25.43% 11.06% (13.06)% 7.00%(A)
Ratios/Supplemental Data:
Net assets, end of year (000’s) . . . . . . . . . . . . . . . . . . . $458,288 $381,031 $ 241,425 $194,477
Expenses to average net assets . . . . . . . . . . . . . . . . . . . 1.23% 1.24% 1.27% 1.30%(B)
Expenses to average net assets (net of fees waived/reimbursed) . . . . . . . . . . . . . . . . . . . . . . . . . . . . . . . . . . 1.12% 1.13% 1.14% 1.14%(B)
Net investment income to average net assets . . . . . . . 1.12% 0.96% 0.96% 1.36%(B)
Portfolio turnover rate . . . . . . . . . . . . . . . . . . . . . . . . . 17% 20% 23% 26%(A)
(1) Net investment income per share was calculated using the average shares outstanding method.(2) All per share amounts and net asset values have been adjusted as a result of the reverse share split effected after the close of business on
December 1, 2017.(3) For the period from March 5, 2014 (commencement of class operations) through October 31, 2014.(A) Not Annualized.(B) Annualized.
52

FRONTIER EMERGING MARKETS PORTFOLIO – INSTITUTIONAL CLASS I
For the FiscalYear Ended
Oct. 31, 2017
For the FiscalYear Ended
Oct. 31, 2016
For the FiscalYear Ended
Oct. 31, 2015
For the FiscalYear Ended
Oct. 31, 2014
For the FiscalYear Ended
Oct. 31, 2013
Net asset value, beginning of year . . . . . . . . . . . . . . $ 7.35 $ 7.62 $ 9.50 $ 8.46 $ 7.12
Increase (Decrease) in Net Assets fromOperations:
Net investment income (loss)(1) . . . . . . . . . . . . . . . . 0.05 0.10 0.11 0.09 0.07
Net realized and unrealized gain (loss) oninvestments and foreign currency-relatedtransactions . . . . . . . . . . . . . . . . . . . . . . . . . . . . . . . . 1.17 (0.29) (1.84) 0.97 1.35
Net increase (decrease) from investmentoperations . . . . . . . . . . . . . . . . . . . . . . . . . . . . . . . . . . . 1.22 (0.19) (1.73) 1.06 1.42
Distributions to Shareholders from:
Net investment income . . . . . . . . . . . . . . . . . . . . . . . . . (0.07) (0.08) (0.05) (0.02) (0.08)
Net realized gain from investments . . . . . . . . . . . . . . . — — (0.10) — —
Total distributions . . . . . . . . . . . . . . . . . . . . . . . . . . . . (0.07) (0.08) (0.15) (0.02) (0.08)
Net asset value, end of year . . . . . . . . . . . . . . . . . . . $ 8.50 $ 7.35 $ 7.62 $ 9.50 $ 8.46
Total Return . . . . . . . . . . . . . . . . . . . . . . . . . . . . . . . . 16.82% (2.43)% (18.35)% 12.60% 20.20%
Ratios/Supplemental Data:
Net assets, end of year (000’s) . . . . . . . . . . . . . . . . . $266,844 $342,114 $ 451,646 $474,838 $271,728
Expenses to average net assets . . . . . . . . . . . . . . . . . 1.71% 1.79% 1.79% 1.77% 1.80%
Expenses to average net assets (net of fees waived/reimbursed) . . . . . . . . . . . . . . . . . . . . . . . . . . . . . . . 1.71% 1.79% 1.79% 1.77% 1.80%
Net investment income to average net assets . . . . . 0.69% 1.41% 1.29% 1.01% 0.94%
Portfolio turnover rate . . . . . . . . . . . . . . . . . . . . . . . 28% 47% 38% 37% 24%
(1) Net investment income per share was calculated using the average shares outstanding method.
53

FRONTIER EMERGINGMARKETS PORTFOLIO –INSTITUTIONAL CLASS II
For the PeriodEnded
Oct. 31, 2017(2)(3)
Net asset value, beginning of year . . . . . . . . . . . . . . . . . . . . . . . . . . . . . . . . . . . . . . . . . . . . . . . . . . . . . . . $ 7.43
Increase (Decrease) in Net Assets from Operations:
Net investment income (loss)(1) . . . . . . . . . . . . . . . . . . . . . . . . . . . . . . . . . . . . . . . . . . . . . . . . . . . . . . . . . 0.08
Net realized and unrealized gain (loss) on investments and foreign currency-related transactions . . . . 0.99
Net increase (decrease) from investment operations . . . . . . . . . . . . . . . . . . . . . . . . . . . . . . . . . . . . . . . . . . . 1.07
Distributions to Shareholders from:
Net investment income . . . . . . . . . . . . . . . . . . . . . . . . . . . . . . . . . . . . . . . . . . . . . . . . . . . . . . . . . . . . . . . . . . —
Net realized gain from investments . . . . . . . . . . . . . . . . . . . . . . . . . . . . . . . . . . . . . . . . . . . . . . . . . . . . . . . . —
Total distributions . . . . . . . . . . . . . . . . . . . . . . . . . . . . . . . . . . . . . . . . . . . . . . . . . . . . . . . . . . . . . . . . . . . . . . —
Net asset value, end of year . . . . . . . . . . . . . . . . . . . . . . . . . . . . . . . . . . . . . . . . . . . . . . . . . . . . . . . . . . . . . $ 8.50
Total Return . . . . . . . . . . . . . . . . . . . . . . . . . . . . . . . . . . . . . . . . . . . . . . . . . . . . . . . . . . . . . . . . . . . . . . . . . . 14.40%(A)
Ratios/Supplemental Data:
Net assets, end of year (000’s) . . . . . . . . . . . . . . . . . . . . . . . . . . . . . . . . . . . . . . . . . . . . . . . . . . . . . . . . . . $166,698
Expenses to average net assets . . . . . . . . . . . . . . . . . . . . . . . . . . . . . . . . . . . . . . . . . . . . . . . . . . . . . . . . . . 1.58%(B)
Expenses to average net assets (net of fees waived/reimbursed) . . . . . . . . . . . . . . . . . . . . . . . . . . . . . . . 1.35%(B)
Net investment income to average net assets . . . . . . . . . . . . . . . . . . . . . . . . . . . . . . . . . . . . . . . . . . . . . . . 1.47%(B)
Portfolio turnover rate . . . . . . . . . . . . . . . . . . . . . . . . . . . . . . . . . . . . . . . . . . . . . . . . . . . . . . . . . . . . . . . . . 28%(A)
(1) Net investment income per share was calculated using the average shares outstanding method.(2) For the period from March 1, 2017 (commencement of class operations) through October 31, 2017.(3) All per share amounts and net asset values have been adjusted as a result of the share dividend effected after the close of business on December 1,
2017.(A) Not Annualized.(B) Annualized.
54

GLOBAL EQUITYRESEARCH PORTFOLIO –INSTITUTIONAL CLASS
For the PeriodEnded
Oct. 31, 2017(2)
Net asset value, beginning of year . . . . . . . . . . . . . . . . . . . . . . . . . . . . . . . . . . . . . . . . . . . . . . . . . . . . . . . $ 10.00
Increase (Decrease) in Net Assets from Operations:
Net investment income (loss)(1) . . . . . . . . . . . . . . . . . . . . . . . . . . . . . . . . . . . . . . . . . . . . . . . . . . . . . . . . . 0.08
Net realized and unrealized gain (loss) on investments and foreign currency-related transactions . . . . 2.15
Net increase (decrease) from investment operations . . . . . . . . . . . . . . . . . . . . . . . . . . . . . . . . . . . . . . . . . . . 2.23
Distributions to Shareholders from:
Net investment income . . . . . . . . . . . . . . . . . . . . . . . . . . . . . . . . . . . . . . . . . . . . . . . . . . . . . . . . . . . . . . . . . . —
Net realized gain from investments . . . . . . . . . . . . . . . . . . . . . . . . . . . . . . . . . . . . . . . . . . . . . . . . . . . . . . . . —
Total distributions . . . . . . . . . . . . . . . . . . . . . . . . . . . . . . . . . . . . . . . . . . . . . . . . . . . . . . . . . . . . . . . . . . . . . . —
Net asset value, end of year . . . . . . . . . . . . . . . . . . . . . . . . . . . . . . . . . . . . . . . . . . . . . . . . . . . . . . . . . . . . . $ 12.23
Total Return . . . . . . . . . . . . . . . . . . . . . . . . . . . . . . . . . . . . . . . . . . . . . . . . . . . . . . . . . . . . . . . . . . . . . . . . . . 22.30%(A)
Ratios/Supplemental Data:
Net assets, end of year (000’s) . . . . . . . . . . . . . . . . . . . . . . . . . . . . . . . . . . . . . . . . . . . . . . . . . . . . . . . . . . $ 5,308
Expenses to average net assets . . . . . . . . . . . . . . . . . . . . . . . . . . . . . . . . . . . . . . . . . . . . . . . . . . . . . . . . . . 3.49%(B)
Expenses to average net assets (net of fees waived/reimbursed) . . . . . . . . . . . . . . . . . . . . . . . . . . . . . . . 0.90%(B)
Net investment income to average net assets . . . . . . . . . . . . . . . . . . . . . . . . . . . . . . . . . . . . . . . . . . . . . . . 0.80%(B)
Portfolio turnover rate . . . . . . . . . . . . . . . . . . . . . . . . . . . . . . . . . . . . . . . . . . . . . . . . . . . . . . . . . . . . . . . . . 36%(A)
(1) Net investment income per share was calculated using the average shares outstanding method.(2) For the period from December 19, 2016 (commencement of class operations) through October 31, 2017.(A) Not Annualized.(B) Annualized.
55

INTERNATIONAL EQUITYRESEARCH PORTFOLIO –INSTITUTIONAL CLASS
For the FiscalYear Ended
Oct. 31, 2017
For the PeriodEnded
Oct. 31, 2016(2)
Net asset value, beginning of year . . . . . . . . . . . . . . . . . . . . . . . . . . . . . . . . . . . . . . . . . . . . . . . . . $ 11.10 $ 10.00
Increase (Decrease) in Net Assets from Operations:
Net investment income (loss)(1) . . . . . . . . . . . . . . . . . . . . . . . . . . . . . . . . . . . . . . . . . . . . . . . . . . . 0.12 0.14
Net realized and unrealized gain (loss) on investments and foreign currency-relatedtransactions . . . . . . . . . . . . . . . . . . . . . . . . . . . . . . . . . . . . . . . . . . . . . . . . . . . . . . . . . . . . . . . . . . . 2.26 0.96
Net increase (decrease) from investment operations . . . . . . . . . . . . . . . . . . . . . . . . . . . . . . . . . . . . . 2.38 1.10
Distributions to Shareholders from:
Net investment income . . . . . . . . . . . . . . . . . . . . . . . . . . . . . . . . . . . . . . . . . . . . . . . . . . . . . . . . . . . . (0.17) —
Net realized gain from investments . . . . . . . . . . . . . . . . . . . . . . . . . . . . . . . . . . . . . . . . . . . . . . . . . . (0.20) —
Total distributions . . . . . . . . . . . . . . . . . . . . . . . . . . . . . . . . . . . . . . . . . . . . . . . . . . . . . . . . . . . . . . . . (0.37) —
Net asset value, end of year . . . . . . . . . . . . . . . . . . . . . . . . . . . . . . . . . . . . . . . . . . . . . . . . . . . . . . . $ 13.11 $ 11.10
Total Return . . . . . . . . . . . . . . . . . . . . . . . . . . . . . . . . . . . . . . . . . . . . . . . . . . . . . . . . . . . . . . . . . . . . 22.26% 11.00%(A)
Ratios/Supplemental Data:
Net assets, end of year (000’s) . . . . . . . . . . . . . . . . . . . . . . . . . . . . . . . . . . . . . . . . . . . . . . . . . . . . $ 9,479 $ 6,244
Expenses to average net assets . . . . . . . . . . . . . . . . . . . . . . . . . . . . . . . . . . . . . . . . . . . . . . . . . . . . 2.26% 3.54%(B)
Expenses to average net assets (net of fees waived/reimbursed) . . . . . . . . . . . . . . . . . . . . . . . . . 0.90% 0.90%(B)
Net investment income to average net assets . . . . . . . . . . . . . . . . . . . . . . . . . . . . . . . . . . . . . . . . . 0.99% 1.51%(B)
Portfolio turnover rate . . . . . . . . . . . . . . . . . . . . . . . . . . . . . . . . . . . . . . . . . . . . . . . . . . . . . . . . . . . 55% 33%(A)
(1) Net investment income per share was calculated using the average shares outstanding method.(2) For the period from December 17, 2015 (commencement of class operations) through October 31, 2016.(A) Not Annualized.(B) Annualized.
56

EMERGING MARKETSRESEARCH PORTFOLIO –INSTITUTIONAL CLASS
For the PeriodEnded
Oct. 31, 2017(2)
Net asset value, beginning of year . . . . . . . . . . . . . . . . . . . . . . . . . . . . . . . . . . . . . . . . . . . . . . . . . . . . . . . $ 10.00
Increase (Decrease) in Net Assets from Operations:
Net investment income (loss)(1) . . . . . . . . . . . . . . . . . . . . . . . . . . . . . . . . . . . . . . . . . . . . . . . . . . . . . . . . . 0.10
Net realized and unrealized gain (loss) on investments and foreign currency-related transactions . . . . 2.91
Net increase (decrease) from investment operations . . . . . . . . . . . . . . . . . . . . . . . . . . . . . . . . . . . . . . . . . . . 3.01
Distributions to Shareholders from:
Net investment income . . . . . . . . . . . . . . . . . . . . . . . . . . . . . . . . . . . . . . . . . . . . . . . . . . . . . . . . . . . . . . . . . . —
Net realized gain from investments . . . . . . . . . . . . . . . . . . . . . . . . . . . . . . . . . . . . . . . . . . . . . . . . . . . . . . . . —
Total distributions . . . . . . . . . . . . . . . . . . . . . . . . . . . . . . . . . . . . . . . . . . . . . . . . . . . . . . . . . . . . . . . . . . . . . . —
Net asset value, end of year . . . . . . . . . . . . . . . . . . . . . . . . . . . . . . . . . . . . . . . . . . . . . . . . . . . . . . . . . . . . . $ 13.01
Total Return . . . . . . . . . . . . . . . . . . . . . . . . . . . . . . . . . . . . . . . . . . . . . . . . . . . . . . . . . . . . . . . . . . . . . . . . . . 30.10%(A)
Ratios/Supplemental Data:
Net assets, end of year (000’s) . . . . . . . . . . . . . . . . . . . . . . . . . . . . . . . . . . . . . . . . . . . . . . . . . . . . . . . . . . $ 5,880
Expenses to average net assets . . . . . . . . . . . . . . . . . . . . . . . . . . . . . . . . . . . . . . . . . . . . . . . . . . . . . . . . . . 3.72%(B)
Expenses to average net assets (net of fees waived/reimbursed) . . . . . . . . . . . . . . . . . . . . . . . . . . . . . . . 1.30%(B)
Net investment income to average net assets . . . . . . . . . . . . . . . . . . . . . . . . . . . . . . . . . . . . . . . . . . . . . . . 1.04%(B)
Portfolio turnover rate . . . . . . . . . . . . . . . . . . . . . . . . . . . . . . . . . . . . . . . . . . . . . . . . . . . . . . . . . . . . . . . . . 46%(A)
(1) Net investment income per share was calculated using the average shares outstanding method.(2) For the period from December 19, 2016 (commencement of class operations) through October 31, 2017.(A) Not Annualized.(B) Annualized.
57

HARDING, LOEVNER FUNDS,INC. (THE “FUND”)
PRIVACY NOTICE
The Fund collects nonpublic personal information aboutyou from the following sources:
▪ Information, such as your name, address, socialsecurity number, assets, and income, submitted byyou on applications, forms, or in other written orverbal customer communications. This informationmay also be provided by a consultant orintermediary acting on your behalf.
▪ Information that results from any transactionperformed by us for you.
The Fund will not disclose any nonpublic personalinformation about you or its former customers toanyone except as permitted or required by law.
If you decide to close your account(s) or become aninactive customer, the Fund will adhere to the privacypolicies and practices as described in this notice.
The Fund restricts access to your personal and accountinformation to only those employees who need to knowthat information to provide products or services to you.The Fund maintains physical, administrative andtechnical safeguards to protect your nonpublic personalinformation.
[This page is not part of the Prospectus]
58

HARdInG, LOEvnER FUndS, InC.c/o Northern Trust
Attn: Funds Center C5S
801 South Canal Street
Chicago, IL 60607
(877) 435-8105
www.hardingloevnerfunds.com
Investment Company Act file number 811-07739
AvAILABILITY OF AddITIOnAL InFORMATIOn ABOUT THE FUnd
The SAI, dated February 28, 2018, as may be supplemented thereafter, containing additional information about the Fund and each Portfolio, has been filed with the Securities and Exchange Commission (the ‘‘Commission’’) and is incorporated by reference into this Prospectus. Additional information about each Portfolio’s investments is available in the Fund’s annual and semi-annual reports to shareholders. In the Fund’s annual report, you will find a discussion of the market conditions and investment strategies that significantly affected each Portfolio’s performance during its last fiscal year.
To order free copies of the Fund’s annual or semi-annual report or its SAI, to request other information about the Fund and to make general shareholder inquiries, call (toll free) 1(877)435-8105, or write to the following address:
Harding, Loevner Funds, Inc.c/o The Northern Trust CompanyP.O. Box 4766Chicago, Illinois 60680-4766
The SAI and the Fund’s annual and semi-annual reports are also available free of charge on Harding Loevner’s website at hardingloevnerfunds.com.
Information about the Fund and each Portfolio (including the SAI and the Fund’s annual and semi-annual reports) can be reviewed and copied at the Commission’s Public Reference Room in Washington, D.C. Information on the operation of the Public Reference Room may be obtained by calling the Commission at 1(202)551-8090. Reports and other information about the Fund are also available on the EDGAR database on the Commission’s Internet site at SEC.gov, by writing to the Public Reference Section of the Commission, Washington, D.C. 20549-1520 or by electronic request at the following e-mail address: [email protected]. A duplication fee will be applied to written requests and needs to be paid at the time your request is submitted.
Related Documents