Mutual Fund Regulation in India-Assessing its Benefits T.S. SOMAS HEKAR* Abstract This paper attempts to empirically verify the benefit of the Securities and Exchange Board of India (SEBI) mutual fund regulation in India. By comparing the performance of funds governed by the stricter SEBI regulations with that of funds governed by the weaker Unit Trust of India (TI) Act regulations, on average, the SEBI funds outperformed the LTI funds over time. Mu- tual fund portfolio disclosure requirements and corporate governance structures are attributed to SEBI superior performance. I. Introduction The mutual fund' industry in India has witnessed rapid growth since its "liberalization" in 1993. Prior to 1993, only public sector banks or insurance companies, along with the Unit Trust of India (UTI) were allowed to manage funds. The entry of private fund managers, both Indian and foreign, initiated a period of substantial growth in the assets managed by the fund industry. With 44.7 million investors in mutual funds, 2 the collec- * T.S. Somashekar is an assistant professor at the National Law School of India University in Bangalore. He received his Master of Arts in Economics in 1995 from Bangalore University. He has submitted his thesis on Economic Analysis of Mutual Fund Regulation in India. He started his teaching career at St. Joseph's College, Bangalore, in 1998 and was a visiting faculty member at NLSIU between October 2001 and January 2002. He joined NLSIU as a regular faculty in March 2002. His areas of interest and research include Law and Economics, Business Strategy, Public Policy analysis and the World Trade Organization. He was an Erasmus Mundus Fellow in the Institute for Law and Economics at the University of Hamburg, Germany in 2006. In 2008, he was an advisor to the Ministry of Comnerce and Industries, Government of Karnataka, to help formulate the industrial policy. He is a member of the advisory board for the European Doctorate in Law and Economics (EDLE). In 2009, he was selected for the U.S. International Visitors Leadership Program (IVLP) to study U.S. Trade Policy. He has published articles on Mutual Fund and Insurance Regulation. 1. Mutual funds are financial intermediaries that pool together funds of various investors and invest the same in financial securities. The benefits of investing through a fund include lower costs and a superior portfolio. The fund charges a management fee in return for its services. See LNFs.s'IOPEDIA, MUTUAL FUND BAsics TUTORIAL 2-3 (2006), http://www.investopedia.com/university/mutualfunds/. 2. UTI, MUTUAL FLNDS IN INDIA: CHALLENGES, OPPORTUNITIES, AND STRATEGIC PERSPECTIVES, 13 (1997).

Welcome message from author
This document is posted to help you gain knowledge. Please leave a comment to let me know what you think about it! Share it to your friends and learn new things together.
Transcript

Mutual Fund Regulation in India-Assessing itsBenefits
T.S. SOMAS HEKAR*
Abstract
This paper attempts to empirically verify the benefit of the Securities and Exchange Board ofIndia (SEBI) mutual fund regulation in India. By comparing the performance of funds governedby the stricter SEBI regulations with that of funds governed by the weaker Unit Trust of India(TI) Act regulations, on average, the SEBI funds outperformed the LTI funds over time. Mu-tual fund portfolio disclosure requirements and corporate governance structures are attributed toSEBI superior performance.
I. Introduction
The mutual fund' industry in India has witnessed rapid growth since its "liberalization"in 1993. Prior to 1993, only public sector banks or insurance companies, along with theUnit Trust of India (UTI) were allowed to manage funds. The entry of private fundmanagers, both Indian and foreign, initiated a period of substantial growth in the assetsmanaged by the fund industry. With 44.7 million investors in mutual funds, 2 the collec-
* T.S. Somashekar is an assistant professor at the National Law School of India University in Bangalore.
He received his Master of Arts in Economics in 1995 from Bangalore University. He has submitted his thesison Economic Analysis of Mutual Fund Regulation in India. He started his teaching career at St. Joseph'sCollege, Bangalore, in 1998 and was a visiting faculty member at NLSIU between October 2001 and January2002. He joined NLSIU as a regular faculty in March 2002. His areas of interest and research include Lawand Economics, Business Strategy, Public Policy analysis and the World Trade Organization. He was anErasmus Mundus Fellow in the Institute for Law and Economics at the University of Hamburg, Germany in2006. In 2008, he was an advisor to the Ministry of Comnerce and Industries, Government of Karnataka, tohelp formulate the industrial policy. He is a member of the advisory board for the European Doctorate inLaw and Economics (EDLE). In 2009, he was selected for the U.S. International Visitors LeadershipProgram (IVLP) to study U.S. Trade Policy. He has published articles on Mutual Fund and InsuranceRegulation.
1. Mutual funds are financial intermediaries that pool together funds of various investors and invest thesame in financial securities. The benefits of investing through a fund include lower costs and a superiorportfolio. The fund charges a management fee in return for its services. See LNFs.s'IOPEDIA, MUTUAL FUNDBAsics TUTORIAL 2-3 (2006), http://www.investopedia.com/university/mutualfunds/.
2. UTI, MUTUAL FLNDS IN INDIA: CHALLENGES, OPPORTUNITIES, AND STRATEGIC PERSPECTIVES, 13
(1997).

1452 THE INTERNATIONAL LAWYER
tive assets under management at the end of 1993 totalled Rs.470 billion, with UTI manag-ing the largest portion, or Rs.390 billion assets. 3 By February 2009, the asset size ofinvestments in mutual funds had grown to around five trillion rupees. 4 Given the substan-tial amount of assets currently under management, and the fact that tens of millions offamilies s are now saving through this strategy, the importance of assessing the impact ofregulatory constraints on the performance of mutual funds is crucial.
II. Background
Mutual funds are regulated to various degrees across the globe. Regulation is required
to balance out market failures that arise primarily as a result of information asymmetry.Compared to the average investor, fund managers possess superior information with re-spect to the active working of funds and their portfolio dynamics. Such information asym-metry can encourage fund managers to behave opportunistically, and cause amisalignment of interests between investors and fund managers. The typical investorseeks to maximize his risk-weighted returns while the fund manager seeks to maximize theportfolio management fees tied to asset size. Investment inflow to mutual funds theoreti-cally should depend on performance aside from a host of other factors such as marketingexpenses, entry and exit load, management fees, fund style, overall stock market senti-ment, and economic growth. Research by Martin Gruber indicates that fund investors inthe United States rely heavily on past performance of funds when making investmentdecisions. 6 Surprisingly, while better performing funds attracted increasing investmentinflows, weaker funds did not suffer corresponding outflows of investment money.7
Hence, there seems to be an asymmetry in the influence of performance on fund invest-ment inflow and outflow. Gruber attributes the tendency of investors to maintain posi-tions with losing funds to the influence of advertisements and broker advice.8 As a result
of such behavior, a fund manager has an incentive to spend more on marketing to mini-mize the impact of poor performance. Somashekar discovered a similar tendency amongstIndian investors who maintained investments with poor performing Indian mutual funds. 9
The marketing expenses of such funds are deducted from total returns, and thus, the "in-vestor is paying to be convinced into staying with a poor performing fund."' 0
3. Id.4. ASSOCIATION OF MUTUAL FUNDS IN INDIA (AMFRJ, MUTUAL FUND DATA FOR THE
MONTH-FEBRUARY 2009 (2009), available at http://www.amfiindia.com/spages/amfeb20O9repo.pdf.5. The most comprehensive survey of household investment was last done in 1999 by the Securities and
Exchange Board of India (SEBI) and the National Council for Applied Economic Research (NCAER). Thissurvey revealed that almost nine percent of Indian households or 15 million families (or 23 million individu-als) had invested in mutual funds. One can safely assume that this figure has since increased substantiallygiven increased awareness and growth in mutual funds assets. See BUSINESS LINE'S INVESTMENT WORLD,THRUST ON RISK CoNrAINMENT (2000), http://www.thehindubusinessline.com/businessline/iw/2000/1O/29/stories/0829h019.htm.
6. See Martin J. Gruber, Another Puzzle: The Growth in Actively Managed Mutual Funds, 51 J. FIN. 783(1996), available at http://www.seligson.fi/resource/gruber1996.pdf.
7. Id.8. Id.9. T. S. Somashekar, True Economies or False Economies: Do Indian Mutual Funds Compete Under the Shadow
of Regulatory Ceilings?, 15 ICFAI J. APPLIED FIN. 20 (2009).10. Id.
VOL. 43, NO. 4
MUTUAL FUND REGULATION IN INDIA 1453
An increase in assets under management also potentially causes problems for existing
investors, such as a negative impact on returns, as asset size increases. For instance, a
study by Chen et al, after accounting for various benchmarks, found that returns declined
with lagged fund size for the period 1962 to 1999 in the United States.' l Similarly,
Somashekar observed that larger Indian funds tend to underperform during bare phases of
the stock market. 12 Although increases in asset size may negatively impact returns, the
fund manager may allow growth in assets under management in order to collect higher
fees.
Chevalier and Ellison point out that because mutual fund inflows depend on past per-
formance, an underperforming fund manager might have an incentive to take higher risks
toward the end of the year in order to inflate performance results. 13 Furthermore, such an
ex-post alteration in risk levels of the portfolio may not be in accordance with the risk
appetite of the investor, or the levels agreed to in the investment prospectus. This type of
post-contractual opportunism can compromise the interests of the investors, and expose
them to poor portfolio selectivity and higher portfolio risks than proposed in the offer
document. Additionally, there are other organizational or operational risks as a result of
human errors or fraud.
The objective of the regulator is to overcome such market failures by ensuring ideal
conditions such as those found in competitive markets. There are, however, both direct
and indirect compliance costs associated with such regulations that may lead to a negative
impact on performance. For instance, most regulatory regimes emphasize proper corpo-
rate governance structure and transparency to reduce investor hazards. Transparency is
achieved primarily through periodic disclosure of portfolio expenditure and performance.
While disclosure helps to avoid moral hazards in investment decisions, mandating exces-
sively frequent disclosures can have a negative impact on the returns of the fund in ques-
tion. A study by Myers et al. shows that it is possible for competitors to mimic the
portfolios of actively managed mutual funds and earn similar or even superior returns after
expenses are taken out.14 This form of competition could lead to copycat funds free riding
on the research efforts of the original fund, thereby diluting its performance. Regulationsmay also impose constraints on investments to avoid conflicts of interest. Such constraints
can increase costs and reduce the flexibility of the fund manager to react to market
changes.
11. The main reasons for this are found to be investments in small illiquid stocks and also organizational
diseconomies. See J. Chen et al., Does Fund Size Erode Mutual Fund Performance?, The Role of Liquidity andOrganization, 94 AM. ECON. RFV. 5:(2004), at 1276, available at http://www.atypon-link.com/AEAP/doi/pdf/10.1257/0002828043052277.
12. After accounting for all other factors larger funds seemed to have done better only because of a largernumber of bullish phases of the market. With increasing asset size a few funds voluntarily restricted theirasset size. This was because they perceived limited investment opportunities and increased risk of adversemarket impact of their transactions. See T.S. Somashekar, Fund Size and Fund Returns: An Empirical Stdy ofIndian Mutual Funds, 56 INDMAN ECON. J. 102 (2008).
13. A detailed study of such behavior can found in Judith Chevalier & Glenn Ellison, Risk Taking by MutualFunds as a Response to Incentives, 105 J. POL. ECON. 1167 (1997), available at http://www.joumals.uchicago.edu/doi/pdf/10. 1086/516389.
14. See Mary Margaret Myers et al., Copycat Funds: Information Disclosure Regulation and the Returns to Active
Management in the Mutual Fund Industry, (MIT Dept. of Econ., Working Paper No. 02-04, October 2001),available at http://papers.ssrn.com/paper.taf abstract id=293617.
WINTER 2009

1454 THE INTERNATIONAL LAWYER
It is difficult for a regulator to achieve the correct degree of control, and thus the dan-gers of under- or over-regulating are possible. Under-regulation can expose the investorto unexpected risks, while over-regulation would expose the investor to lower returns.Therefore, it is crucial that a regulatory regime get its regulations right with minimalmargins of error.
This paper attempts to examine whether regulations have imposed more costs than ben-efits, and therefore compromised returns. Such a process is fraught with the difficulty ofengaging in counterfactual questions. One is posed with the problem of understandingwhat the possible performance would have been in the absence of regulations. But fortu-nately, the situation eases up as we have a comparative perspective possible. During thedecade between 1993 and 2003, India had two alternate regulatory regimes for mutualfunds. 15 The UTI and its funds came under the regulations of UTI Act of 1963, and allother mutual funds came under SEBI (Mutual Funds) Regulations. 16 SEBI regulationswere definitely more constraining than the UTI regulations. Hence, we have a set offunds with stronger regulations and another with weaker regulations. The performance ofthese two sets of funds is compared after accounting for other characteristics such as in-vestment style 17 and size of assets managed.
In a competitive market, funds cannot exist if they consistently underperform. There-fore, funds ordinarily strive to ensure that they deliver returns that are comparable to theirpeers. In the case of the UTI, because it is a public sector mutual fund with supposedgovernment backing, one could argue that the incentive to perform would probably not bethere. But one fails to see the point that the UTI had become a very popular investmentmechanism for millions of investors, and the government could afford to see it un-derperform only to face political risks. In fact, when the most popular UTI fund, UnitScheme-64 (US-64), began to face performance issues during the 1990s, they dug deepinto their accumulated reserves to deliver good returns to their investors, despite not be-ing an assured returns scheme.1s Such was the pressure to ensure that investors were notdisappointed. Therefore, it would be flippant to assume that the public sector fund househad no incentive to perform. At the same time, though, the organizational aspirations donot necessarily have to be realized due to the potential moral hazards. Being under lesser
15. In January 2003, UTI was split into two fund houses. All assured return schemes and the US-64 wereretained with the UTI and the rest of the schemes were transferred to a new fund called UTI Mutual FundPvt.Ltd. The latter came under SEBI Regulations. The coexistence of two separate regulatory regimes cameto an end with this split.
16. These regulations were substantially amended in 1996 and periodically since then. See Securities andExchange Board of India, Regulations, http://www.sebi.gov.in/Index.jsp?contentDisp=Department&dep-id=4 (last visited Dec. 23, 2009).
17. A fund could choose to invest in stocks on the basis of the size its market capitalization (large , mid orsmall), or its valuation in the stock market (depending on the price-earnings ratio or book value)or a combi-nation of these. This leads to nine possible styles of investment. The investment style of a fund has beenfound to be important in explaining performance.
18. The concept of "assured return" schemes is strange for mutual funds. It was popular during the early1990s before SEBI regulations came into effect. SEBI regulations of 1996 called for such schemes to guaran-tee both the capital and the returns. Many funds that assured returns ran into rough weather. For example,Canstar fund of Canbank Mutual Fund (now Canrobeco Mutual Fund) and GIC Big Value Fund of theGeneral Insurance Company (GIC) Mutual Fund could not deliver the promised returns. For more on this,see SECURITIES AND EXCHANGE BOARD OF INDIA ANNuAL REPORT, 1996-97, available at http:/
www.sebi.gov.in/annualreport/9697/report96 97.html.
VOL. 43, NO. 4
MUTUAL FUND REGULATION IN INDIA 1455
constraints and weaker disclosure norms, the temptation of getting away with hazardousbehavior is strong. The primary means of doing this could be through choice of invest-ments based on ulterior motives rather than investments based on returns. This meanspoor stock selectivity compared to funds under stronger SEBI regulations. In the next
part of the paper, the regulatory differences are discussed.
IH. Comparison of the Regulatory Structure of SEBI (Mutual Funds)
Regulations and UTI Act (1963)
UTI was created by an act of the Union government of India, and hence, is a Uniongovernment undertaking. It came into being on February 1, 1964 by virtue of the UTIAct of 1963. The objective of the fund was to promote savings and investment by Indianhouseholds through participation in the securities market. The initial capital of the UTIwas 50 million Rupees, contributed by the Reserve Bank of India (RBI), the State Bank of
India (SB), the Life Insurance Corporation of India (LIC), and other scheduled banks andfinancial institutions. In 1975, the Industrial Development Bank of India (IDBl) took overthe RBI stake as well as the rights and responsibilities.19 In 1964, it launched its first"scheme," or fund: the US-64, which was intended to be an open-ended, non-assured
income fund with a balanced portfolio of equity and debt.
In 1993, a three-member committee with N. Vaghul as the Chairman examined the
structure of mutual fund regulations. It recommended that all the existing schemes ofUTI be divided into two categories: (1) mutual fund type schemes and (2) non-mutualfund type schemes. All mutual fund type schemes were to have an asset managementcompany and follow SEBI Regulations. Following these recommendations, UTI placedall new schemes launched after July 1994 under SEBI Regulations.
The regulatory structure of UTI can be discussed in terms of its organizational struc-
ture, its investment constraints, and its disclosure norms. In terms of its organizationalstructure, there was a combination of all the roles: the sponsor, the manager, and thetrustee in one body. The board of trustees was entrusted with the responsibility of super-intendence, direction, and management of the affairs of the UTI. Each of the trustees wasappointed by the sponsors themselves with the IDBI, by virtue of being the largest stake-
holder, having the largest number of trustees at four. The RBI appointed one, and theIDBI appointed the chairman of UTI in consultation with the Union government of In-
dia. This meant that there was no arms-length relationship between the sponsor, thetrustee, and the fund manager. The corporate governance structure did not do much todiscourage opportunistic behavior.
UTI's investment objectives allowed it to borrow to meet dividend repayment obliga-
tions with a limit of ten percent of the fund's net asset value (NAV). It could also act like alending agency, and lend to corporations and cooperative societies engaged in industrialactivities. No UTI schemes were allowed to invest more than five percent of the NAV inthe equity of a specific company, and not more than fifteen percent in the securities of acompany. UTI could also invest in the securities of an unlisted, but soon to be listed,
19. See IMAu.c.A CO.\I.-i rEE REPORT (2001), available at www.capitalmarket.com/mutuallutireport.htm.
WINTER 2009

1456 THE INTERNATIONAL LAWYER
company to the extent of twenty percent of its NAV. New company investments can goup to ten percent of the securities issued, or thirty percent of the aggregate assets.
In terms of disclosure norms, UTI had to state objectives clearly in the offer documentand reveal scheme performance once a year. But most important, UTI had no obligationto reveal its portfolio. Neither were there any constraints on expense ratios. However,UTI charged no management fees and operated largely on a non-profit basis. None ofUTI's funds were required to report NAV on a regular basis. This non-disclosure meantthat investors were completely in the dark regarding performance for substantial periodsof time, often for six months at a time.
Hence, UTI had neither the corporate governance structure nor the transparency interms of portfolio disclosure to ensure that moral hazards would be contained. It seemeda perfect recipe for opportunistic activities through dubious investments. The Parekhcommittee report20 points out how the portfolio structure of US-64 was substantially al-tered to become more equity-oriented in 1998 compared to 1986 without informing theinvesting public. Faced with decreasing returns from debt, UTI had no option but to turnto equity for better returns. The US-64 sought to maintain returns, and had been dippinginto its reserves to continue paying dividends unrelated to performance. Trustees hadallowed the situation to deteriorate when they were to be the protectors of the investors'interest. The Parekh committee believed that the dominance of the public sector spon-sor-nominated trustees allowed the government to abuse the scheme, and use it to supportthe government's disinvestment of public sector undertakings. The committee found thatinvestment decisions were too concentrated in the hands of the top management, and thatthere was no independent fund management team.
While these observations were general to UTI, the main focus was on the US-64.These distortions can be attributed primarily to the lack of proper corporate governancestructures and also lack of transparency. Investments were made with little regard forgenerating best returns.
The SEBI (Mutual Fund) Regulations of 1993 replaced the guidelines issued in 1990 bythe government of India. These in turn were replaced by a comprehensive set of regula-tions in 1996. These regulations laid out the corporate governance structure, the invest-ment constraints, expense caps, and disclosure requirements. The regulations haveundergone continuous revisions as and when weaknesses were seen.
A person or group of persons (sponsors) interested in setting up a fund has to apply tothe SEBI. The latter, in turn, assesses the credibility of the sponsors and decides on theregistration after certain minimum conditions are fulfilled. The mutual fund itself is to beconstituted in the form of a trust (Indian Trust Act) to be executed by the trustees in favorof the investors. The trustees themselves are appointed by the mutual fund, and two-thirds of them are to be independent and not associated with the sponsor in any manner.The trustee members are to be people of established integrity. The trustee or the sponsorthen appoints the AMC. The AMC itself must have a proven track record and a reputa-tion for fairness. The trustees ensure that the AMC functions in accordance with the
20. The Deepak Parekh committee was set up in the wake of the crises that faced the US-64 in 1997-98.The committee recommended that independent trustees be appointed and that each fund should have aseparate fund manager. For a detailed commentary on the happenings, see Cleaning up the Mess, HINDU, Jan.10, 2002, http://www.hindu.com/thehindu/biz/2002/01/10/stories/2002011000290100.htm.
VOL. 43, NO. 4
MUTUAL FUND REGULATION IN INDIA 1457
interests of the investors, and within the framework of the regulations. Thus, SEBI's
regulations create a corporate governance structure with three distinct arms, and further
guidelines ensure arms-length transactions between the three.
Funds investment regulations are contained in SEBI regulations schedule VII. Some ofthe more important regulations are indicated below:
1. No mutual fund, under all its schemes, should own more than ten percent of any
company's paid up capital carrying voting rights.
2. Inter-scheme transfers of securities within a fund house are to be done at market
prices and on a spot settlement basis.
3. The initial issue expenses with respect to any scheme may not exceed six percent of
the funds raised under that scheme.
4. No short sales are permitted.
5. No investments in securities of unlisted companies that are associated with or part
of the sponsor group of companies.
6. No mutual fund scheme shall invest more than ten percent of its NAV in the equity
shares or equity related instruments of any company. This limit is exempted for
investments in index fund or sector or industry specific scheme. 21
These are some of the investment restrictions, and they are comparable in some ways
with those of the UTI, except that there were no specific inter-scheme/fund transactionregulations for the latter. The issue of sponsor-related companies was also not addressed
by the UTI regulations.
In order to contain the expenses that could be charged to the investors, SEBI decided to
go in for direct control. 22 These control measures, contained in Chapter VII of the SEBI
(Mutual Fund) Regulations, are briefly outlined below:
II. The Asset Management Company is allowed to charge investment and advisory
fees limited to:(i) One and a quarter of one percent of the weekly average net assets outstanding
in each accounting year for the scheme concerned, as long as the net assets do
not exceed Rs.1000 million, and
(ii) One percent of the excess amount over Rs.1000 million, where net assets so
calculated exceed Rs.1000 million. 23
For schemes launched on a no-load basis, the asset management company is allowed an
additional management fee not exceeding one percent of the weekly average net assets
outstanding in each financial year. The AMC is also allowed to charge initial issue ex-
penses and recurring expenses.24
Besides spelling out the various costs that could be included in the overall operating
expenses, which included the advisory or management fee, SEBI also placed a cap on
21. Securities and Exchange Board of India (Mutual Fund) Regulations, ch. VII (1996), available at http:IIwww.appuonline.com/mf/knowledge/regulation- 1996.html.
22. Id.23. Id.24. These expenses included marketing and selling expenses (including agent's commission), brokerage and
transaction cost, registrar services for transfer of units sold or redeemed, fees and expenses of trustees, auditfees, custodian fees, costs related to investor communication, cost of providing account statements, dividend/redemption cheques, warrants, and finally insurance premium paid by the fund. See id.
WINTER 2009

1458 THE INTERNATIONAL LAWYER
same. The operating expense ratio (ER) as a percent of assets managed is capped in thefollowing manner:
(i) On the first Rs.1000 million of the average weekly net assets 2.5%(ii) On the next Rs.3000 million of the average weekly net assets 2.25%(iii) On the next Rs.3000 million of the average weekly net assets 2.0%(iv) On the balance on the assets 1.75%.25
For debt funds, such recurring expe'ses are to be "lesser by at least 0.25% of the weeklyaverage net assets outstanding in each financial year." 26 What is notable is that the man-agement fee is tied to the asset size. This could be construed as indirectly related toperformance, as the asset size of an open-ended fund also depends on the relative returngenerated. But it is a "weak form" of performance fee. It assumes that fund flow dependson fund performance. This may not be entirely true, as discussed earlier.
Mutual funds are allowed "load" funds, "no-load" funds, or a mixture of them.27 Foropen-ended schemes floated on a "load" basis, the initial issue expenses can be amortizedover a period not exceeding five years. But if any issue expenses are incurred during thelife of open-ended schemes, they cannot be amortized. If the fund has no entry load, thenthe AMC is permitted to charge an additional fee not exceeding one percent of the NAV.
SEBI has also gradually strengthened the disclosure rules for funds.28 These obliga-tions require semi-annual portfolio and accounts disclosures in a widely circulated EnglishDaily within one month of the half-year ending.29
Overall, SEBI regulations have tried a mix of better corporate governance structure,information flow, direct controls over expenses, and fees to ensure that the investor isgiven a fair deal. These two regulatory regimes are compared in Table 1 given below.
The above differences in regulations lead us to two conclusions. First, UTI investorshave greater risks arising out of principal-agent problems. The chances of poor portfolioselectivity, and consequently, poorer returns are greater when compared to funds regu-lated by SEBI regulations. But at the same time, UTI is a non-profit, public-sector entitywith no management fees charged. Expenses were also possibly lower due to economiesof scale. These lower expenses could make up for the slack in performance when the NAVis considered. Further, in the case of funds regulated by SEBI, there could be a greaterassurance in terms of portfolio selectivity but such could come at a certain cost. The costof regulations is both direct and indirect. The direct costs are the compliance costs, whichinclude costs of the trustee board, shareholder intimations, disclosure costs (personnel,printing, and mailing) and SEBI fees. 30 The second type of cost is indirect and oftenignored. They involve the possibly negative effect of regulatory constraints such as invest-
25. Id.26. Id.27. The schedule X of SEBI (Mutual Fund) Regulations deals with expenses of funds with and without
entry and exit loads.28. See Securities and Exchange Board of India, supra note 21.29. Id.30. In a survey, Payal Malik finds that the present SEBI regulations are perceived to be of the high cost-
high benefit type by Mutual Fund managers. She estimates the compliance costs to bean average of 5.35% ofthe overall operating expenses of the AMC's. It is comparable to the United States but much higher com-pared to similar markets such as Thailand. See Payal Malik, Compliance Cost of Financial Regulatian, 39 ECON.& POL. WKLY. 28, 3083 (2004).
VOL. 43, NO. 4
MUTUAL FUND REGULATION IN INDIA 1459
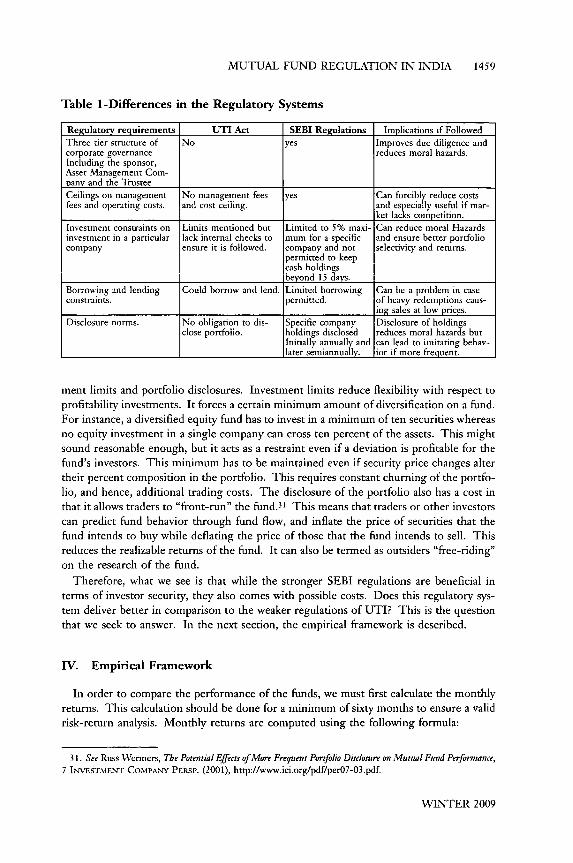
Table 1-Differences in the Regulatory Systems
Regulatory requirements UTI Act SEBI Regulations Implications if FollowedThree tier structure of No yes Improves due diligence andcorporate governance reduces moral hazards.Including the sponsor,Asset Management Com-pany and the TrusteeCeilings on management No management fees yes Can forcibly reduce costsfees and operating costs, and cost ceiling, and especially useful if mar-
ket lacks competition.
Investment constraints on Limits mentioned but Limited to 5% maxi- Can reduce moral Hazardsinvestment in a particular lack internal checks to mum for a specific and ensure better portfoliocompany ensure it is followed, company and not selectivity and returns.
permitted to keepcash holdingsbeyond 15 days.
Borrowing and lending Could borrow and lend. Limited borrowing Can be a problem in caseconstraints. permitted. of heavy redemptions caus-
ing sales at low prices.Disclosure norms. No obligation to dis- Specific company Disclosure of holdings
close portfolio, holdings disclosed reduces moral hazards butInitially annually and can lead to imitating behav-
later semiannually. ior if more frequent.
ment limits and portfolio disclosures. Investment limits reduce flexibility with respect toprofitability investments. It forces a certain minimum amount of diversification on a fund.For instance, a diversified equity fund has to invest in a minimum of ten securities whereasno equity investment in a single company can cross ten percent of the assets. This mightsound reasonable enough, but it acts as a restraint even if a deviation is profitable for thefund's investors. This minimum has to be maintained even if security price changes altertheir percent composition in the portfolio. This requires constant churning of the portfo-lio, and hence, additional trading costs. The disclosure of the portfolio also has a cost inthat it allows traders to "front-run" the fund. 31 This means that traders or other investorscan predict fund behavior through fund flow, and inflate the price of securities that thefund intends to buy while deflating the price of those that the fund intends to sell. Thisreduces the realizable returns of the fund. It can also be termed as outsiders "free-riding"on the research of the fund.
Therefore, what we see is that while the stronger SEBI regulations are beneficial interms of investor security, they also comes with possible costs. Does this regulatory sys-
tem deliver better in comparison to the weaker regulations of UTI? This is the questionthat we seek to answer. In the next section, the empirical framework is described.
IV. Empirical Framework
In order to compare the performance of the funds, we must first calculate the monthlyreturns. This calculation should be done for a minimum of sixty months to ensure a validrisk-return analysis. Monthly returns are computed using the following formula:
31. See Russ Wermers, The Potential Effects of More Frequent Portfolio Disclosure on Mutual Fund Performance,7 INVESTViENT[- COMPANY PERSP. (2001), http://www.ici.org/pdf/per07-03.pdf.
WINTER 2009

1460 THE INTERNATIONAL LAWYER
returns = NA r - NA V1 (1)NA V,_1
NAV,.I represents the month end NAV, and NAV,__ represents the month beginningNAV. The monthly returns are then used to compute various risk-return ratios which aregiven below.
Sharpe Ratio32
(Rp-Rf)/7(2RP is the average fund return. RF is the risk-free return. The risk-free return here is
taken as the bank interest on one-year term deposits. During this period, the generalpublic did not have access to treasury bills, and public sector banks were considered risk-free. ap is the standard deviation of the portfolio. The results of this calculation will helpus understand the risk-return performance of various funds.
Information Ratio (IR)33
( Rp- Rm )/1r (3)
R. is the return on the benchmark - in this case, the BSE-sensex,34 and a,r is the stan-dard deviation of the excess return or returns of the portfolio in excess of the market.This ratio focuses on the risk-return generated by the manager's ability to use informationto deviate from the benchmark - the higher the better. The standard IR measure, how-ever, runs into problems if there are negative excess returns. Hence, an alternate measurecalled the "Modified Information Ratio" (MIR) is also used:
MIR - (Rp-Rm)(4)
The only change is that the denominator, the standard deviation of the excess returns, ismodified by adding an exponent. The exponent is the excess return divided by the abso-lute value of the excess return. When the excess return is positive, the standard IR andMIR are the same. When the excess return is negative, the IR and MIR can be verydifferent.
32. This was first proposed by Sharpe in 1966 and remains among the most popular measures despite thecreation of several more recent risk-reward measures. A detailed discussion of this measure can be found inWilliam F. Sharpe, Mutual Fund Performance, 39 J. Bus. 119 (1966), available at http://www.jstor.org/stable/pdfplus/2325404.pdf; William F. Sharpe, Adjustingfor Risk in Portfolio Performance Measuremnt, 1 J. PORTFO-
LIO MGMT. 29 (1975).
33. For a good discussion of the information ratio, see Thomas Goodwin, The Information Ratio, 54 FIN.ANALYSTS J. 4, 34 (1998), available at http://www.jstor.org/stable/pdfplus/4480091.pdf.
34. This benchmark was chosen because it was one of the most popular reference index that funds them-selves had opted to be compared against.
VOL. 43, NO. 4
MUTUAL FUND REGULATION IN INDIA 1461
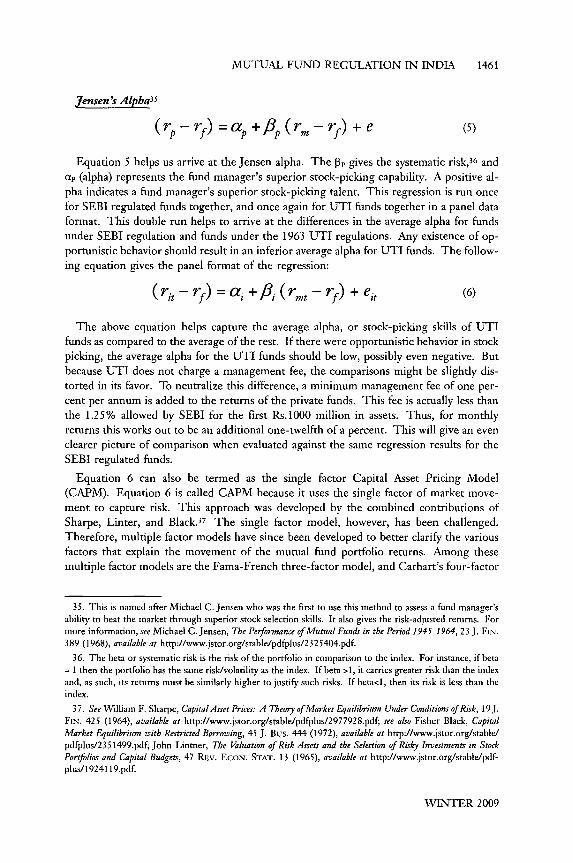
Jensen's Alpha 35
(rp - rf) = ap +/8p (r. - rf) + e (5)
Equation 5 helps us arrive at the Jensen alpha. The 3, gives the systematic risk, 36 andap (alpha) represents the fund manager's superior stock-picking capability. A positive al-pha indicates a fund manager's superior stock-picking talent. This regression is run oncefor SEBI regulated funds together, and once again for UTI funds together in a panel dataformat. This double run helps to arrive at the differences in the average alpha for fundsunder SEBI regulation and funds under the 1963 UTI regulations. Any existence of op-portunistic behavior should result in an inferior average alpha for UTI funds. The follow-ing equation gives the panel format of the regression:
(rit- ) =ai +i (rmt- f) + ei, (6)
The above equation helps capture the average alpha, or stock-picking skills of UTIfunds as compared to the average of the rest. If there were opportunistic behavior in stockpicking, the average alpha for the UTI funds should be low, possibly even negative. Butbecause UTI does not charge a management fee, the comparisons might be slightly dis-torted in its favor. To neutralize this difference, a minimum management fee of one per-cent per annum is added to the returns of the private funds. This fee is actually less thanthe 1.25% allowed by SEBI for the first Rs.1000 million in assets. Thus, for monthlyreturns this works out to be an additional one-twelfth of a percent. This will give an evenclearer picture of comparison when evaluated against the same regression results for theSEBI regulated funds.
Equation 6 can also be termed as the single factor Capital Asset Pricing Model(CAPM). Equation 6 is called CAPM because it uses the single factor of market move-ment to capture risk. This approach was developed by the combined contributions ofSharpe, Linter, and Black.37 The single factor model, however, has been challenged.Therefore, multiple factor models have since been developed to better clarify the variousfactors that explain the movement of the mutual fund portfolio returns. Among thesemultiple factor models are the Fama-French three-factor model, and Carhart's four-factor
35. This is named after Michael C. Jensen who was the first to use this method to assess a fund manager'sability to beat the market through superior stock selection skills. It also gives the risk-adjusted returns. Formore information, see Michael C. Jensen, The Performance of Mutual Funds in the Period 1945-1964, 23 J. FIN.389 (1968), available at http://www.jstor.org/stable/pdfplus/2325404.pdf.
36. The beta or systematic risk is the risk of the portfolio in comparison to the index. For instance, if betaI then the portfolio has the same risk/volatility as the index. If beta >1, it carries greater risk than the index
and, as such, its returns must be similarly higher to justify such risks. If beta<l, then its risk is less than theindex.
37. See William F. Sharpe, CapitalAsset Prices: A Theory of Market Equilibrium Under Conditions of Risk, 19J.FIN. 425 (1964), available at http://www.jstor.org/stable/pdfplus/2977928.pdf; see also Fisher Black, CapitalMarket Equilibrium with Restricted Borrowing, 45 J. Bus. 444 (1972), available at http://www.jstor.org/stable/pdfplus/2351499.pdf; John Lintner, The Valuation of Risk Assets and the Selection of Risky Investments in StockPortfolios and Capital Budgets, 47 REv. ECON. STAT. 13 (1965), available at http://www.jstor.org/stable/pdf-plus/1924119.pdf.
WINTER 2009

1462 THE INTERNATIONAL LAWYER
model. 38 These additional risk factors are able to better explain the overall movement inportfolio returns, as well as to help isolate the "true" alpha. But the single factor model isused here for two reasons. First, the additional factors, outlined by Fama-French, arealso, in some sense, skill factors. For instance, an investment manager must have theability to foresee the other factors that could contribute to returns, albeit with a higherrisk. Hence, the single factor alpha, while not measuring stock selectivity skills alone, stillmeasures a set of skills. Second, even if the alpha has been overstated due to non-inclu-sion of other factors, it has been done for both sets of funds, which share a similar invest-ment approach. As a result, it would have little impact on the objective at hand.
A sample of ten open-end diversified equity funds with growth objectives has been se-lected. The selected funds were of similar investment styles during the period of study,and hence investment style diversities are eliminated. 39 The period of the study is fromMay, 1995 to October, 2000. It gives us sixty-six monthly returns for each fund, which issufficient for risk-weighted returns comparison. The time period was selected to give us acomparison of the funds' performance during the existence of the two different regulatorystructures.
The criteria for the selection of funds were that the SEBI regulated funds needed tohave started before 1996, and the UTI funds should have existed prior to 1994. This isbecause all UTI funds started after 1994 were "voluntarily" brought under SEBI regula-tions. Hence, these funds have been excluded because they would not serve the purpose ofcomparing the impact of the different regulations. Further, the term "voluntary" is avague concept with no definite obligations, placing such funds neither under SEBI norunder UTI regulations with much definiteness. It was also imperative that the funds se-lected be similar in terms of investment objective. The selected funds all focus on a diver-sified equity portfolio with a growth objective. The sample size is limited, however,because data availability in a continual manner was a serious constraint. Most funds alsoreported their NAV on a weekly basis, which made issues more complicated because theNAVs used for monthly return calculations had to match up in terms of dates. The NAV
38. See Eugene F. Fama & Kenneth R. French, The Cross-Section of Epected Stock Returns, 47 J. FIN. 427(1992), available at http://www.jstor.org/stable/pdfplus/2329112.pdf; Eugene F. Fama & Kenneth R. French,Common Risk Factors in the Returns on Stocks and Bonds, 33 J. FIN. ECON. 3 (1993), available at http://www.nes.ru/-agoriaev/Papers/Fama-French % 205% 20factors% 20for% 20stocks% 20and% 20vonds% 20JFE93 .pdf.Fama and French included additional factors such as Small-Minus-Big (in terms of market capitalization)stock returns and high-minus-low (in terms of book-to-price ratio) stock returns. They added these factorsas they found that the historic returns of small cap stocks and value stocks exceeded that of larger cap stocksand growth stocks respectively. To the Fama-French three factor model Carhart added a fourth explanatoryfactor, the momentum factor. See Mark M. Carhart, On Persistence in Mutual Performance, 52 J. FIN. 57(1997), available at http://www.jstor.org/stable/pdfplus/2329556.pdf. For a simple perspective of CAPM andthe Fama-French Three Factor model, see Kent L. Womack & Ying NMII Zhang, Understanding Risk andReturn, the CAPM, and the Fama-Frencb Three-Factor Model, 03-111 TucK SCH. Bus. 1 (2003), htrp://papers.ssm.com/sol3/Delivery.c fm/SSRNID481881-code0312l9l00.pdf~abstractid=481881 &mirid=1.
39. By using a homogenous set of funds with no difference in style, the stock picking talent is the onlyvariable, and thus, can be observed. For an in-depth analysis of fund style and stock picking skill measure-ment, independent of style, see Louis K. C. Chan et al., On Mutual Fund Investment Styles, 15 REv. FN. STUD.1407 (2002), available at http://www.jstor.org/stable/pdfplus/1262659.pdf.
VOL. 43, NO. 4

MUTUAL FUND REGULATION IN INDIA 1463
data has been sourced from the UTI, the database NAV India, 40 and individual fund housewebsites. The sample is illustrated in Table 2.
The sample contains three funds from UTI, three from HDFC taken over by Zurich,three from Franklin Templeton taken over from Pioneer ITI Mutual Fund, and one fromJM Fund House. In total, we have selected ten funds from four different fund houses.
The flagship fund of UTI, US-64, was consciously excluded from this sample. Thisfund, an income fund, was the subject of intense controversy when it collapsed in the late1990s. It provides probably the best example of potential moral hazards that arise frompoor transparency or poor information disclosure. But at the same time, this fund wasalso the most abused by the government, as it was used to induce deliberate interventionsin the market as well as to support government public sector disinvestments. Therefore,the sample does not incorporate US-64 because it is not a pure equity fund, and its portfo-lio distortions have been manip-ulated due to govcrnmental coercion.
Table 2-Sample of Funds
Fund Fund House InceptionMaster Gain UTI April 1992Master Growth UTI February 1993Master Plus UTI December 1991HDFC Prudence* HDFC February, 1994HDFC Capital Builder* HDFC January 1994HDFC Equity* HDFC December 1994Franklin Blue Chip** Franklin Templeton November 1993Franklin Prima** Franklin Templeton November 1993Franklin Prima Plus*" Franklin Templeton September 1994JM Equity JM December 1994
SOURCE: Association of Mutual Funds India (2009).All these funds were initially a part of 20th Century Asset Management Company taken over byZurich India Mutual Fund. Zurich India was itself taken over by HDFC Mutual Fund in 2003**These funds were taken over from Pioneer ITI Mutual Fund by Franklin Templeton mutual fund in2002.Data for UTI is sourced from UTI. Data for Franklin Templeton funds is sourced from the Fundswebsite and for other funds data is from NAV India data base.
V. Results and Analysis
First, the performance of funds in terms of the Sharpe ratio, Information ratio, andJensen's alpha are used to rank the funds. These results are given in Table 3 with explana-tions following.
Among the funds, we see that two of the UTI funds have negative Sharpe ratios, whichindicates that the return per unit of risk, defined as standard deviation of the fund returns,is negative. Two other private sector funds, regulated by SEBI, also demonstrate negative
40. AsSOCIATION oF MUTUAL FUNDS INDIA (2009), http://www.amfiindia.com/. The database NAV In-dia is a mutual funds specific database and a venture of Capital Market Limited.
WINTER 2009

1464 THE INTERNATIONAL LAWYER
Sharpe ratios. These four funds with negative Sharpe ratios also have a lower rankingthan the index. This proves that a passive investment in the index would have deliveredsuperior returns.
Table 3-Sharpe Ratio Rankings for Sampled Funds
Rank Fund Name (rP - r) UP Sharpe Ratio
1 Franklin Prima plus 1.06 9.12 0.12
2 Franklin Blue Chip 0.96 8.59 0.11
3 HDFC Equity 0.79 8.22 0.09
4 HDFC Prudence 0.39 4.9 0.08
5 Master plus 0.14 7.53 0.02
6 Franklin Prima 0.17 10.62 0.02
7 Index -0.01 8.64 -0.001
8 Master growth -0.1 8.09 -0.01
9 JM equity -0.14 9.34 -0.02
10 HDFC capital builder -0.15 7.52 -0.02
11 Master gain -0.43 7.66 -0.06
While all of the other private sector funds have demonstrated positive returns per unit
of risk, one from the UTI stable fund and the Master Plus fund joins them. The MasterPlus fund has a rank of 5 with a very small Sharpe ratio of 0.02. Nothing extremely
positive can be said about UTI funds in terms of this measure. When giving these ranksone also has to keep in mind that UTI had substantially lower expense ratios (ER) when
compared to the other funds. This mean that the deductions from the unit asset value interms of expenses was smaller when compared to the other funds. The ER of UTI islower for two additional reasons: first, it could be due to possible economies of scale thatit enjoyed because it was substantially larger than all other funds, second, UTI did notcharge management fees, in contrast to the 1.25-1% charged by other funds. In fact, UTIcross-subsidized the expenses of some domestic funds, such as US-64, through the earn-ings and fees generated by other funds meant for foreign investors. It is important to
note, however, that the hypothesis that UTI enjoyed economies of scale remains untested.However, it is certain that UTI did not charge management fees, which indeed gave it anadvantage because it had lower costs when it came to deducting expenses. As a result, theperformance of UTI funds appears all the more unimpressive.
Table 4 illustrates the IR and MIR rankings. Because IR gives the returns of a fund ascompared to a benchmark (excess return) per unit of tracking error, or the standard devia-
tion of the excess return, it differs from the Sharpe ratio which gives returns in excess ofthe risk-free return divided by the portfolio returns' standard deviation. The MIR is also
calculated to avoid errors that might creep in due to negative excess return.
The rankings of funds in terms of IR are the same as that for the Sharpe ratio. But oncewe factor in the MIR, the rankings change for the funds with negative excess returns,
VOL. 43, NO. 4

MUTUAL FUND REGULATION IN INDIA 1465
although overall it is the same story for UTI funds. The IR or the MIR give us the returnfor the risk taken by the fund manager for deviating from the market risk, or it could bethe risk-return for only the fund manager's selectivity skills and not actually for the re-turns due the general market movement. In this case, Master Plus is the only UTI fund toshow a positive return based on the fund manager's selectivity skills, though it is a verysmall 0.02 return. The other two UTI funds show negative returns for deviating from themarket. Two other private sector funds also show a negative MIR. A fund house like UTIshould demonstrate better selectivity skills given its considerable experience in the Indianmarkets. But it is instead the newcomer private funds that have performed better. It isdifficult to accept that UTI's results come as a consequence of inferior management.Thus, this only raises more doubts as to whether it is a lack of transparency that is leading
to stock selection that is not based on maximizing returns.
Table 4-Information Ratio (IR) Rankings for Sample Funds
Rank Name R, , IR MIR
1 Franklin Prima plus 1.07 9.12 0.12 0.12
2 Franklin Blue Chip 0.97 8.59 0.11 0.11
3 HDFC Equity 0.8 8.22 0.09 0.09
4 HDFC Prudence 0.4 4.9 0.08 0.08
5 Master plus 0.15 7.53 0.02 0.02
6 Franklin Prima 0.18 10.62 0.02 0.02
7 Master gain -0.43 7.66 -0.05 -27.99
8 HDFC capital builder -0.14 7.52 -0.02 -33.40
9 Master growth -0.09 8.09 -0.01 -36.18
10 JM equity -0.13 9.34 -0.02 -41.66
The next step involves computing the average Jensen alpha for the two sets of fundsseparately, using Equation 6 for each. A random effects model is used for the SEBI regu-lated funds, and an OLS model is used for the UTI funds 4 1. Table 5 demonstrates theresults for funds regulated by SEBI.
Table 5-Average Jensen Alpha for Funds Regulated by SEBI
Variable Coefficient Std-error t-statistic Probability
C 0.45 0.27 1.60 0.10
0.71 0.03 21.8 0.00
Adjusted R-squared 0.52
Table 5 shows a positive alpha of 0.45, which is significant at the ten percent levels.This means that SEBI regulated funds demonstrate, on average, positive stock selection
41. The poolabilty test and Hausman specification test have been excluded for brevity.
WINTER 2009

1466 THE INTERNATIONAL LAWYER
skills. The beta, which is 0.71, shows the degree to which the returns can be explained bythe chosen benchmark. The fact that it is less than one indicates a level of risk less thanthat of the index. Their deviation from the index, through alternate stock composition,shows positive rewards. In a competitive market, funds are constrained to spend moneyon research to identify stocks that could deliver better returns than the index. Such per-formance is rewarded by investors through further inflows of money/investments into theopen-end equity fund. In turn, enhancing the managed assets provides an incentive forthe fund manager because the management fee is fixed at one percent. Thus, the higherthe assets, the larger the absolute fee. Though there was no use of performance-basedfees during this period, the fact that absolute fees were linked to asset size, and the factthat there was no indexing of the fees in any manner to inflation, offers a strong incentiveto enhance performance. The manager's interests are, therefore, intertwined with that ofthe investors'. This is affirmed by the average positive alpha.
Table 6-Average Jensen Alpha for UTI Funds
Variable Coefficient Std-error t-statistic Probability
C -0.12 0.35 -0.36 0.720.71 0.04 17.49 0.00
Adjusted R-squared 0.62
Table 6 depicts the results for UTI funds. The hypothesis of inferior stock selectivity isproven true by an average alpha that is negative (as expected) and not significant. The lowsignificance could also be due to the small sample, however. But even with a small samplesize, we have no significant stock selectivity skills demonstrated. The average beta of 0.71shows that the UTI funds did not share the same risk as the index, but their deviationfrom the index composition was not met with any reward. This leads us to the issue of apossible clash of interests and opportunistic behavior. It could be argued that this lack ofstock selection skills was due to purely bad decisions made in good faith, or an inefficientfund manager. If this were the case, then one could have expected a change in fund man-agers. While UTI had no specific manager, it continued despite the fund's poor perform-ance. Such poor selectivity on the basis of good faith is hard to accept from an institutionas experienced as UTI. We would instead prefer to conclude that the difference in alphais simply due to choice of portfolio - a portfolio that the fund chose not to disclose basedon significant "self-interest" rather than "investor-interest." Although the difference inthe alpha of 0.45 may contain some element of misjudgment, it is too large to be a com-plete result of it.
The comparison so far has been between UTI funds, which charged no managementfee, and the SEBI-regulated funds that were allowed to charge management fees between1 and 1.25% of AUM.42 Therefore, our comparison so far would tend to favor the UTIfunds. The NAV of SEBI-regulated funds would be less because of the management fee,whereas UTI funds operated on a non-profit motive. In fact, the US-64 was cross-subsi-dized by income earned and floated from foreign investors. This being the case, we think
42. See Jenson, supra note 35.
VOL. 43, NO. 4

MUTUAL FUND REGULATION IN INDIA 1467
it might be pertinent to add the management fee to the return of the other funds andcompare the results again. But this approach involves certain difficulties. Data on actualmanagement fees charged was not available for these funds. The only alternative then wasto use the average for the industry. The Mutual Fund Yearbook gives us aggregate datawith respect to expense categories and asset size for pure equity funds.43 From this, it waspossible to calculate the average percent of management fees charged by the SEBI regu-lated pure equity funds. Table 7 gives these numbers.
Table 7-Average Assets and Management Fees of a Pure Equity Funds
1996 1997 1998 1999 2000
Assets Size 496883 394899 395019 487253 91108(Rs.Millions)Management Fee 5783 4639 4353 3985 6724(Rs.Millions)Management Fee 1.14 1.17 1.09 0.8 0.74(% of assets)
From the above table we see an average management fee of 0.97, or about one percentof the assets. This amount is then divided by twelve to get monthly expenses, and theresult is added to each of the monthly returns of the private funds. Using these returns,regression 6 is computed again.
Table 8-Average Jensen Alpha (with average management fee included) forSEBI Regulated Funds
Variable Coefficient Std-error t-statistic Probability
C 0.53 0.26 1.9 0.05[3 0.71 0.03 21.79 0.00
Adjusted squared 0.62
Table 8 shows the new results for private, SEBI-regulated funds with the managementfee added back in to returns. As a result, we get a higher alpha of 0.53, which is also moresignificant now at the five percent levels. These results help to further consolidate thehypothesis that SEBI-regulated funds had a better incentive to ensure due diligence inportfolio selection and thus, to performed better.
VI. Conclusion
In order to assess the benefits of regulation, the performance of funds under differentregulatory intensities was compared. On average, funds that came under the more con-
43. The Mutual Fund Yearbook is a joint publication of Association of Mutual Funds of India (AMFI) andUTI Institute for Capital Markets (UTIICM). It contains aggregative data pertaining to assets, income and,expenditure of different categories of funds.
WINTER 2009

1468 THE INTERNATIONAL LAWYER
straining regulations of SEBI showed much better stock selectivity. This superior per-formance can be attributed to a combination of better regulations and fund management.While it cannot be said conclusively that the performance resulted entirely from trans-parency and prevention of opportunistic behavior, there is strong evidence to support thatit was a significant factor. Better disclosure norms and corporate governance structureshave, on average, ensured more benefits than costs.
VOL. 43, NO. 4
Related Documents


