Mutation-Selection Models of Codon Substitution and Their Use to Estimate Selective Strengths on Codon Usage Ziheng Yang* and Rasmus Nielsen *Department of Biology, Galton Laboratory, University College London, London, United Kingdom; and Department of Biology, University of Copenhagen, Copenhagen, Denmark Current models of codon substitution are formulated at the levels of nucleotide substitution and do not explicitly consider the separate effects of mutation and selection. They are thus incapable of inferring whether mutation or selection is responsible for evolution at silent sites. Here we implement a few population genetics models of codon substitution that explicitly consider mutation bias and natural selection at the DNA level. Selection on codon usage is modeled by introducing codon-fitness parameters, which together with mutation-bias parameters, predict optimal codon frequencies for the gene. The selective pressure may be for translational efficiency and accuracy or for fine-tuning translational kinetics to produce correct protein folding. We apply the models to compare mitochondrial and nuclear genes from several mammalian species. Model assumptions concerning codon usage are found to affect the estimation of sequence distances (such as the synonymous rate d S , the nonsynonymous rate d N , and the rate at the 4-fold degenerate sites d 4 ), as found in previous studies, but the new models produced very similar estimates to some old ones. We also develop a likelihood ratio test to examine the null hypothesis that codon usage is due to mutation bias alone, not influenced by natural selection. Application of the test to the mammalian data led to rejection of the null hypothesis in most genes, suggesting that natural selection may be a driving force in the evolution of synonymous codon usage in mammals. Estimates of selection coefficients nevertheless suggest that selection on codon usage is weak and most mutations are nearly neutral. The sensitivity of the analysis on the assumed mutation model is discussed. Introduction In protein-coding genes, synonymous codons that code for the same amino acid do not appear at the same frequency (Ikemura 1981, 1985). Whether the origin and maintenance of such codon usage bias is due to biases in the mutation process or to natural selection has been a matter of much controversy (see, e.g., Duret 2002 for review). Mutation bias must play a role, but the significance of selection in driving the evolution of codon usage is less certain and may depend on the species. In fast-growing organisms with large population sizes, such as Escherichia coli, Saccharo- myces cerevisiae, and yeast, codon usage is generally thought to be under selective pressure, as supported by sev- eral lines of evidence. First, codon frequencies are corre- lated with the cellular cognate tRNA concentrations (Ikemura 1981, 1985; Bennetzen and Hall 1982; Bulmer 1987; Sharp and Li 1987; Moriyama and Powell 1997). Preferential use of so-called major codons to match the most abundant tRNAs may enhance translational speed and improve translational accuracy (for reviews, see Akashi 1995; Sharp et al. 1995; Duret 2002). In addition, major codons may reduce the energetic cost of translation by re- ducing the chances of amino acid misincorporations and ribosomal drop-offs (Kurland 1992) and by freeing up the protein synthesis machinery through faster ribosomal elongation. Second, in both Drosophila and Caenorhabdi- tis elegans, codon usage is correlated with gene expression, with highly expressed genes having strongly biased codon usage, presumably because of stronger selective pressure (Duret and Mouchiroud 1999; Castillo-Davis and Hartl 2002). Third, silent substitution rate (measured by the se- quence distances d S or d 4 at the synonymous or 4-fold de- generate sites) is lower in genes with highly biased codon usage, implying stronger purifying selection on silent mu- tations in highly biased genes (e.g., Sharp and Li 1987). This correlation was nevertheless found to depend on the method used to estimate silent rates (Dunn et al. 2001; Bierne and Eyre-Walker 2003). Fourth, in Drosophila, co- don usage is more biased for conserved amino acids than for nonconserved amino acids (Akashi 1994). This may be ex- plained by selection for translational accuracy because highly conserved amino acids are expected to be function- ally more important and less tolerant to misincorporations of wrong amino acids and are thus under stronger selective pressure. In slowly growing organisms with small population sizes such as vertebrates, natural selection may be ineffi- cient and indeed its effect on codon usage is controversial (see, e.g., Duret 2002 for a review). In contrast to results for bacteria, yeast, and Drosophila, strong evidence for selec- tion on codon usage is lacking in vertebrates. For example, Kanaya et al. (2001) found a correspondence between co- don bias and tRNA gene copy number (a proxy for tRNA concentration) in Schizosaccharomyces pombe and C. ele- gans but not in Xenopus laevis and Homo sapiens; in the later species, highly expressed genes such as ribosomal genes and histone genes do not have strong codon bias. Some studies (e.g., Musto et al. 2001) found a correlation between codon bias and putative expression levels (as mea- sured by expressed sequence tag frequencies), but this cor- relation could be explained by transcription-coupled repair (Duret 2002). Besides selection for translational efficiency and accu- racy, recent experimental work suggests that the selective pressure on codon usage may also be due to the need for an optimal translation kinetics, to ensure correct protein fold- ing. Protein folding is thought to be cotranslational, occur- ring at the same time the protein is translated from the mRNA (Frydman 2001). The use of preferred and unpre- ferred codons may affect the rate at which the protein is translated. The translation kinetics may be important in sep- arating temporally folding events during protein synthesis Key words: codon substitution model, codon usage, mutation, selection, synonymous substitution. E-mail: [email protected]. Mol. Biol. Evol. 25(3):568–579. 2008 doi:10.1093/molbev/msm284 Advance Access publication January 3, 2008 Ó The Author 2008. Published by Oxford University Press on behalf of the Society for Molecular Biology and Evolution. All rights reserved. For permissions, please e-mail: [email protected]

Welcome message from author
This document is posted to help you gain knowledge. Please leave a comment to let me know what you think about it! Share it to your friends and learn new things together.
Transcript

Mutation-Selection Models of Codon Substitution and Their Use to EstimateSelective Strengths on Codon Usage
Ziheng Yang* and Rasmus Nielsen�*Department of Biology, Galton Laboratory, University College London, London, United Kingdom; and �Department of Biology,University of Copenhagen, Copenhagen, Denmark
Current models of codon substitution are formulated at the levels of nucleotide substitution and do not explicitly considerthe separate effects of mutation and selection. They are thus incapable of inferring whether mutation or selection isresponsible for evolution at silent sites. Here we implement a few population genetics models of codon substitution thatexplicitly consider mutation bias and natural selection at the DNA level. Selection on codon usage is modeled byintroducing codon-fitness parameters, which together with mutation-bias parameters, predict optimal codon frequenciesfor the gene. The selective pressure may be for translational efficiency and accuracy or for fine-tuning translationalkinetics to produce correct protein folding. We apply the models to compare mitochondrial and nuclear genes fromseveral mammalian species. Model assumptions concerning codon usage are found to affect the estimation of sequencedistances (such as the synonymous rate dS, the nonsynonymous rate dN, and the rate at the 4-fold degenerate sites d4), asfound in previous studies, but the new models produced very similar estimates to some old ones. We also developa likelihood ratio test to examine the null hypothesis that codon usage is due to mutation bias alone, not influenced bynatural selection. Application of the test to the mammalian data led to rejection of the null hypothesis in most genes,suggesting that natural selection may be a driving force in the evolution of synonymous codon usage in mammals.Estimates of selection coefficients nevertheless suggest that selection on codon usage is weak and most mutations arenearly neutral. The sensitivity of the analysis on the assumed mutation model is discussed.
Introduction
In protein-coding genes, synonymous codons thatcode for the same amino acid do not appear at the samefrequency (Ikemura 1981, 1985). Whether the origin andmaintenance of such codon usage bias is due to biases inthemutation process or to natural selection has been amatterof much controversy (see, e.g., Duret 2002 for review).Mutation biasmust play a role, but the significance of selectionin driving the evolution of codon usage is less certain andmay depend on the species. In fast-growing organisms withlarge population sizes, such as Escherichia coli, Saccharo-myces cerevisiae, and yeast, codon usage is generallythought to be under selective pressure, as supported by sev-eral lines of evidence. First, codon frequencies are corre-lated with the cellular cognate tRNA concentrations(Ikemura 1981, 1985; Bennetzen and Hall 1982; Bulmer1987; Sharp and Li 1987; Moriyama and Powell 1997).Preferential use of so-called major codons to match themost abundant tRNAs may enhance translational speedand improve translational accuracy (for reviews, see Akashi1995; Sharp et al. 1995; Duret 2002). In addition, majorcodons may reduce the energetic cost of translation by re-ducing the chances of amino acid misincorporations andribosomal drop-offs (Kurland 1992) and by freeing upthe protein synthesis machinery through faster ribosomalelongation. Second, in both Drosophila and Caenorhabdi-tis elegans, codon usage is correlated with gene expression,with highly expressed genes having strongly biased codonusage, presumably because of stronger selective pressure(Duret and Mouchiroud 1999; Castillo-Davis and Hartl2002). Third, silent substitution rate (measured by the se-quence distances dS or d4 at the synonymous or 4-fold de-generate sites) is lower in genes with highly biased codon
usage, implying stronger purifying selection on silent mu-tations in highly biased genes (e.g., Sharp and Li 1987).This correlation was nevertheless found to depend on themethod used to estimate silent rates (Dunn et al. 2001;Bierne and Eyre-Walker 2003). Fourth, in Drosophila, co-don usage is more biased for conserved amino acids than fornonconserved amino acids (Akashi 1994). This may be ex-plained by selection for translational accuracy becausehighly conserved amino acids are expected to be function-ally more important and less tolerant to misincorporationsof wrong amino acids and are thus under stronger selectivepressure.
In slowly growing organisms with small populationsizes such as vertebrates, natural selection may be ineffi-cient and indeed its effect on codon usage is controversial(see, e.g., Duret 2002 for a review). In contrast to results forbacteria, yeast, and Drosophila, strong evidence for selec-tion on codon usage is lacking in vertebrates. For example,Kanaya et al. (2001) found a correspondence between co-don bias and tRNA gene copy number (a proxy for tRNAconcentration) in Schizosaccharomyces pombe and C. ele-gans but not in Xenopus laevis and Homo sapiens; in thelater species, highly expressed genes such as ribosomalgenes and histone genes do not have strong codon bias.Some studies (e.g., Musto et al. 2001) found a correlationbetween codon bias and putative expression levels (as mea-sured by expressed sequence tag frequencies), but this cor-relation could be explained by transcription-coupled repair(Duret 2002).
Besides selection for translational efficiency and accu-racy, recent experimental work suggests that the selectivepressure on codon usage may also be due to the need for anoptimal translation kinetics, to ensure correct protein fold-ing. Protein folding is thought to be cotranslational, occur-ring at the same time the protein is translated from themRNA (Frydman 2001). The use of preferred and unpre-ferred codons may affect the rate at which the protein istranslated. The translation kinetics may be important in sep-arating temporally folding events during protein synthesis
Key words: codon substitution model, codon usage, mutation,selection, synonymous substitution.
E-mail: [email protected].
Mol. Biol. Evol. 25(3):568–579. 2008doi:10.1093/molbev/msm284Advance Access publication January 3, 2008
� The Author 2008. Published by Oxford University Press on behalf ofthe Society for Molecular Biology and Evolution. All rights reserved.For permissions, please e-mail: [email protected]

on the ribosome, thus ensuring ‘‘beneficial’’ interactionsand avoiding ‘‘unwanted’’ interactions within the growingpeptide, to achieve high yield of the correctly foldedprotein. Kimchi-Sarfaty et al. (2007) reported that certainsynonymous mutations in the multidrug resistance 1 generesulted in altered drug and inhibitor interactions. Theyfound similar mRNA and protein levels but altered proteinconformations between the ‘‘wild type’’ and mutant proteinproducts and hypothesized that the incorporation ofrare synonymous codons may have affected the timingof folding. This form of selection differs from translationalselection in that preferred codons are not always advanta-geous if the optimal folding requires a slow translation. Itis unclear how important such selection for proteinfolding is to the evolutionary process of protein-codinggenes.
A number of authors have studied population geneticsmodels in which the proportions of synonymous codons aremodeled as the product of interactions between mutationbias, natural selection, and genetic drift (Kimura 1983;Li 1987; Bulmer 1991; McVean and Charlesworth1999). McVean and Vieira (1999) applied maximum likeli-hood (ML) to fit such a model to counts of synonymouscodons for 2-fold amino acids in protein-coding genes inseveral Drosophila species, to estimate parameters of mu-tation bias and selective pressure. The analysis does notconsider the evolutionary relationships among species,which may provide useful information concerning relativemutation rates between nucleotides. This model was ex-tended by McVean and Vieira (2001) to analyze synony-mous differences between different species, withnonsynonymous differences ignored. Nielsen et al.(2007) implemented a codon-substitution model in whicha mutation is favored or disfavored by natural selection de-pending on whether it changes an unpreferred codon intoa preferred one or vice versa. The model was applied toDrosophila protein–coding genes to obtain ML estimatesof parameters measuring the strength of selection. Thismethod requires a priori partitioning of synonymous co-dons into preferred and unpreferred categories and also as-sumes only one selection coefficient to accommodateselection on codon usage.
In this paper, we implement a few new models of co-don substitution that relax those assumptions. Our motiva-tions for this study are 2-fold. First, we devise a likelihoodratio test (LRT) of neutral evolution of codon usage to inferpossible effects of natural selection. Whereas many previ-ous studies have performed correlation analysis to test thevarious predictions of the mutation and selection theory ofcodon usage bias (see above), the LRT addresses this prob-lem directly. Our model also provides direct measurementsof selection acting on silent sites. Second, we examine theeffects of model assumptions about codon usage on estima-tion of sequence distances such as dS, dN, and their ratiox 5 dN/dS. There has been considerable interest in theuse of the x ratio to detect positive selection affecting pro-tein evolution, and some concerns have been expressed asto whether this inference is affected by natural selection act-ing on silent sites (Kreitman and Akashi 1995; Yang andBielawski 2000). We analyze 2 sets of data to address theseissues, the first of the human and chimpanzee mitochondrial
protein–coding genes and the second of 5,639 protein-coding genes from the 5 mammalian species: human, chim-panzee, macaque, mouse, and rat.
TheoryA Mutation-Selection Model of Codon Substitution
We construct a model of codon substitution by spec-ifying the instantaneous rate of substitution from sense co-dons I 5 i1i2i3 to J 5 j1j2j3, where i1 is the nucleotide at thefirst position in codon I, and so on. We assume that pointmutations occur independently at nucleotide sites and thusthe rate is zero if I and J differ at more than 2 or 3 codonpositions (Goldman and Yang 1994). Thus, we focus on therate between 2 codons that differ at only one position, sayposition k, with ik 6¼ jk. We explicitly model the process ofone codon substituting another codon, that is, mutation, se-lection on the DNA (selection on codon usage), and selec-tion on the protein.
Mutation Bias
Let the mutation rate from nucleotides i to j be lij pergeneration. The mutation model applies to all 3 codon po-sitions, although the base compositions at the 3 positionsmay differ. We use the general time reversible (GTR orREV) model (e.g., Yang 1994) to describe the mutationprocess so that lij5aijp�j , with aij 5 aji for all i 6¼ j. Herep�j reflects mutation bias; if p�T is large, mutations are biasedtoward T. One of the mutation-bias parameters is redun-dant, and we scale them so that
Pp�j 51. If the HKY mu-
tation model (Hasegawa et al. 1985) is used, lij5ljp�j ifi and j differ by a transition and lij5lp�j if i and j differby a transversion, with j to be the transition/transversionrate ratio. Our analysis below is based mostly on theHKY model, but GTR is used in some analyses to examinethe robustness of the results.
Selection on Codon Usage
We model selection on codon usage by introducinga fitness parameter fI for codon I. The selection coefficientfor the mutation that changes the wild type codon I intoa new mutant codon J is thus sIJ 5 fJ � fI. The probabilityof fixation of the mutation is 2sIJ
1�e�2NsIJ, where N is the effec-
tive chromosomal population size (Fisher 1930; Wright1931; Kimura 1957). Let FI 5 2NfI be the scaled fitnessof codon I, and SIJ 5 2NsIJ 5 2N(fJ � fI) 5 FJ � FI bethe scaled selection coefficient. As the number of theI / J mutations in a generation is Nlik jk , the substitutionrate from codons I to J is given as
Nlik jk �2sIJ
1�e�2NsIJ5aikjkp
�jk� SIJ1�e�SIJ
5aikjkp�jk�hðSIJÞ;
ð1Þ
wherehðSIJÞ5 SIJ�ð1�e�SIJ Þ is the ratioof thefixationprob-
ability of the I / J mutation to the fixation probability ofa neutral mutation, with h(SIJ) , 1, 5 1 and . 1 for delete-rious mutations (with SIJ , 0), neutral mutations (SIJ 5 0),and advantageous mutations (SIJ . 0), respectively.
Mutation-Selection Models of Codon Substitution 569

When the model is applied to sequence data from dif-ferent species, we have in this study assumed that the ef-fective population size N and the selection coefficientsare the same among lineages. Those assumptions can berelaxed at the expense of including more parameters(McVean and Vieira 2001; Nielsen et al. 2007).
Selection on the Protein
To describe selection on the protein, we multiply thesubstitution rate by x if and only if the mutation is nonsy-nonymous (Goldman and Yang 1994; Yang and Nielsen1998). Thus, x is the nonsynonymous/synonymous substi-tution rate ratio. The use of one single x to describe selec-tion on the protein is very simplistic. However, previousmodels that incorporate amino acid chemical propertiesto specify codon substitution rates achieved only moderate(although statistically significant) improvements to themodel’s fit to data, and furthermore, such models producedrather similar estimates of mutation parameters to the sim-ple model of one x ratio (Goldman and Yang 1994; Yanget al. 1998). Here our focus is on the effect of selection onsynonymous codon usage. We also implement the site mod-els that assume variable x ratios among codons in the gene(Nielsen and Yang 1998; Yang et al. 2000).
To summarize, the substitution rate from codons I to Jis specified as
qIJ5f 0; if the 2 codons differ at more than one position;aikjkp
�jkhðSIJÞ; for synonymous substitution;
xaikjkp�jkhðSIJÞ; for nonsynonymous substitution:
ð2Þ
The diagonals of the rate matrix Q 5 {qIJ} are determinedby the requirement that each row in the matrix sums to zero.As only the difference SIJ 5 FJ � FI enters the probabilitycalculation under the model, we fix one of the 61 FI’s tozero and estimate 60 free parameters for the universal ge-netic code. The model thus includes the following param-eters in the substitution rate matrix Q: 8 parameters in theGTR mutation model (or 4 parameters in HKY: j, p�T, p
�C,
and p�A), 60 scaled fitness parameters, and x. The sequencedistance t or branch lengths on the tree are additional pa-rameters to be estimated from the data.
After the Q matrix is constructed, the stationary distri-bution of the Markov chain, p5 {p1, p2, . . ., p61}, is givenby the system of linear equations pQ 5 0, subject to theconstraint that the pj’s sum to one. This distribution can alsobe calculated directly (see eq. 4 below). The matrix is thenmultiplied by a constant so that the ‘‘average’’ rate is one:�P
I pIqII 5 1. The transition probability matrix P(t) 5eQt is calculated following standard theory. (Note thatwe have used pJ, where the subscript J is a codon to indicatethe equilibrium frequency of codon J, and p�j , where thesubscript j is a nucleotide to represent the mutation-bias pa-rameter in the HKY or GTR mutation models.)
The Markov model of codon substitution specified byequation (2) is time reversible. To show this, it is sufficientto write the rate matrix as a product of a symmetrical matrixand a diagonal matrix (e.g., Yang 2006, p. 33–34). The rate
qIJ in equation (2) for a synonymous change can be rewrit-ten as
qIJ 5 aikjkp�jk� FJ�FI
1�eFI�FJ
5
�aikjk � 1Q
k#6¼kp�jk#
� FJ�FI
eFJ�eFI
���p�j1p
�j2p�j3e
FJ
�:
ð3Þ
HereQ
k# 6¼k p�jk#is the product of the mutation-bias parame-
ters for the 2 unchanged nucleotides (i.e., p�Tp�C if I 5 TCA
and J 5 TCG). The quantity in the square brackets, de-noted AIJ, satisfies AIJ 5 AJI for all I 6¼ J, whereas the quan-tity in the parentheses is a function of J only. The rate qIJwhen the I/ J substitution is nonsynonymous can be writ-ten in this form as well. Thus, the rate matrix Q5 {qIJ} canbewritten as a product of a symmetricalmatrix {AIJ} anda di-agonal matrix so that the Markov process is time reversible,with the stationary frequency for codon J given as
pJ}p�j1p�j2p
�j3� eFJ : ð4Þ
For example, the equilibrium frequencyof codonTCGispro-portional to p�Tp
�Cp
�G � eFTCG . This result makes it clear that
the stationary codon frequencies are determined by both mu-tation bias (represented by p�j1p
�j2p�j3 ) and selection on codon
usage (represented by eFJ ). Themodel is referred to below asthe FMutSel model. It may also be noted that instead of thecodon fitness parameters (FJ), one may use the codon fre-quencies (pJ) asparameters.The latterparametrization is con-venient for an approximate implementation to be describedbelow.
An LRT of Selection on Codon Usage
We implement a special case of the mutation-selectionmodel of codon substitution (eq. 2), in which all synony-mous codons (codons that encode the same amino acid)have the same fitness. Thus, instead of 60 (561 � 1) codonfitness parameters for the universal genetic code, only 19(520 � 1) amino acid fitness parameters are used. Themodel assumes that the amino acid frequencies are deter-minedby the functional requirements of theprotein, but thereis nofitnessdifference among the synonymouscodons.Fromthe theory above (eq. 4), the relative frequencies of synon-ymous codons are determined solely by the mutational-biasparameters. This model is referred to as FMutSel0.
An LRT can be constructed by comparing modelsFMutSel0 against FMutSel. Twice the log-likelihood dif-ference between the 2 models is compared with the v2 dis-tribution with degree of freedom 5 60 � 19 5 41 for theuniversal code (or 40 for the vertebrate mitochondrialcode). This constitutes a test of the null hypothesis that co-don usage is due to mutation bias alone and not to selectionacting at silent sites.
Measurements of Selection on Codon Usage
As our model explicitly separates mutation bias fromselection affecting codon usage, we devise a few measures
570 Yang and Nielsen

of the strength of natural selection on codon usage. Imagineobserving the Markov process of codon substitution at anysite (any codon triplet) for an infinitely long time. In a pro-portion pI of the time, the wild-type codon at the site in thepopulation is codon I. The mutation (from codon I) to codonJ, which changes the nucleotides ik into jk at codon positionk and which has scaled fitness SIJ 5 FJ � FI, occurs at therate lik jk . Averaged over time, the proportion of the I / Jmutation among all mutations is
mIJ5pIlik jkP
I 6¼J
pIlik jk5
pIaik jkp�jkP
I 6¼J
pIaik jkp�jk
; ð5Þ
where the sum in the denominator is over all pairs of codonsI and J with I 6¼ J.
One may then calculate the proportion of advanta-geous mutations among all mutations as
Pþ5XI 6¼J
mIJ SIJ.0; ð6Þ
where the indicator function SIJ.0 51 if SIJ . 0 or 5 0 ifotherwise. Similarly, the proportion of deleterious muta-tions among all mutations is
P�5XI 6¼J
mIJ SIJ,05 1� Pþ: ð7Þ
The strength of positive selection on an average ad-vantageous mutation may be measured by
�Sþ5XI 6¼J
mþIJSIJ SIJ.0; ð8Þ
where
mþIJ5
pIlik jk SIJ.0PI 6¼J
pIlik jk SIJ.0
; ð9Þ
is the proportion of the I / J mutation among all advan-tageous mutations. Here mþ
IJ is defined only if the I / Jmutation is advantageous, with SIJ . 0. Similarly, thestrength of negative selection may be measured by the av-erage SIJ among deleterious mutations with SIJ , 0.
One may also calculate the proportion of advanta-geous mutations among all ‘‘substitutions,’’ that is, amongthose mutations that have passed the filtering by natural se-lection. This can be calculated using equation (6), with theproportion mIJ calculated using equation (5) but with pIlik jkreplaced by pIlik jk hðSIJÞ or pIqIJ (eq. 2). Because the sub-stitution process is reversible, the proportion of advanta-geous mutations among substitutions is exactly 1
2.
An Approximate Implementation
In the FMutSel and FMutSel0 models, the codon fit-ness and amino acid fitness parameters are estimated by nu-merical optimization under ML. We also implementapproximate versions of these models by fixing the pre-dicted codon or amino acid frequencies to the observed fre-
quencies in the sequence data. These are referred to as‘‘FMutSel-F’’ and ‘‘FMutSel0-F,’’ respectively. This strat-egy reduces the number of parameters to be estimated bynumerical iteration by 60 under FMutSel-F for the universalgenetic code and by 19 under FMutSel0-F. Early modelsconcerning codon usage, such as F1 � 4, F3 � 4, and Fco-don, were all implemented using the observed base or co-don frequencies as parameter estimates (Yang 1997). Forfair comparison, they are now also implemented usingproper numerical optimization of the frequency parameters.Models implemented using the approximation are referredto using the suffix ‘‘-F’’ (e.g., F1 � 4-F).
Analysis of Real Data
We analyze 2 sets of data. The first consists of the mi-tochondrial genes of the human (GenBank accession num-ber D38112) and the chimpanzee (D38113) of Horai et al.(1995). The 12 protein-coding genes on the same strand ofthe genome are concatenated into one ‘‘supergene,’’ with3,569 codons in the alignment. The data were analyzed pre-viously by Hasegawa et al. (1998). We fit both the newmodels implemented in this paper and many old models im-plemented in the CODEML program (Yang 1997). Severaldistances between the 2 sequences are calculated under dif-ferent models, and our objective in this analysis is to exam-ine the impact of model assumptions concerning codonusage on distance estimation.
The second set of data consists of the 5,639 human–chimpanzee–macaque–mouse–rat quintet alignments of or-thologous genes from the macaque genome-sequencingproject (Rhesus Macaque Genome Sequencing and Analy-sis Consortium 2007). Codons that had alignment gaps in atleast one species are removed. The data were analyzed asthe primate pair of human and macaque genes, the rodentpair of mouse and rat genes, as well as the quintet includingall 5 species. Our objectives in those analyses are to conductthe LRT of neutral evolution at silent sites and to estimatethe coefficients of selection acting on codon usage.
Effects of the Model of Codon Usage on DistanceEstimation
The log-likelihood values and estimates of sequencedistances are shown in table 1 for the human and chimpan-zee mitochondrial data set. The assumed mutation model isHKY, but different models are used concerning codon us-age. The F1 � 4, F3 � 4, and Fcodon models specify thecodon-substitution rate to be proportional to the frequencyof the target codon, with the codon frequencies calculatedusing the 4 nucleotide frequencies (F1 � 4), the nucleotidefrequencies at the 3 codon positions (F3 � 4), or with allcodon frequencies treated as free parameters (Fcodon)(Yang 1997). The F1 � 4MG model was proposedby Muse and Gaut (1994) and assumes that the codon-substitution rate is proportional to the frequency of the tar-get nucleotide. F3 � 4MG is an extension of F1 � 4MGand uses different base frequencies at the 3 codon positions.F1 � 4MG and F1 � 4 predict the same equilibrium codonfrequencies, as do F3 � 4MG and F3 � 4.
Mutation-Selection Models of Codon Substitution 571
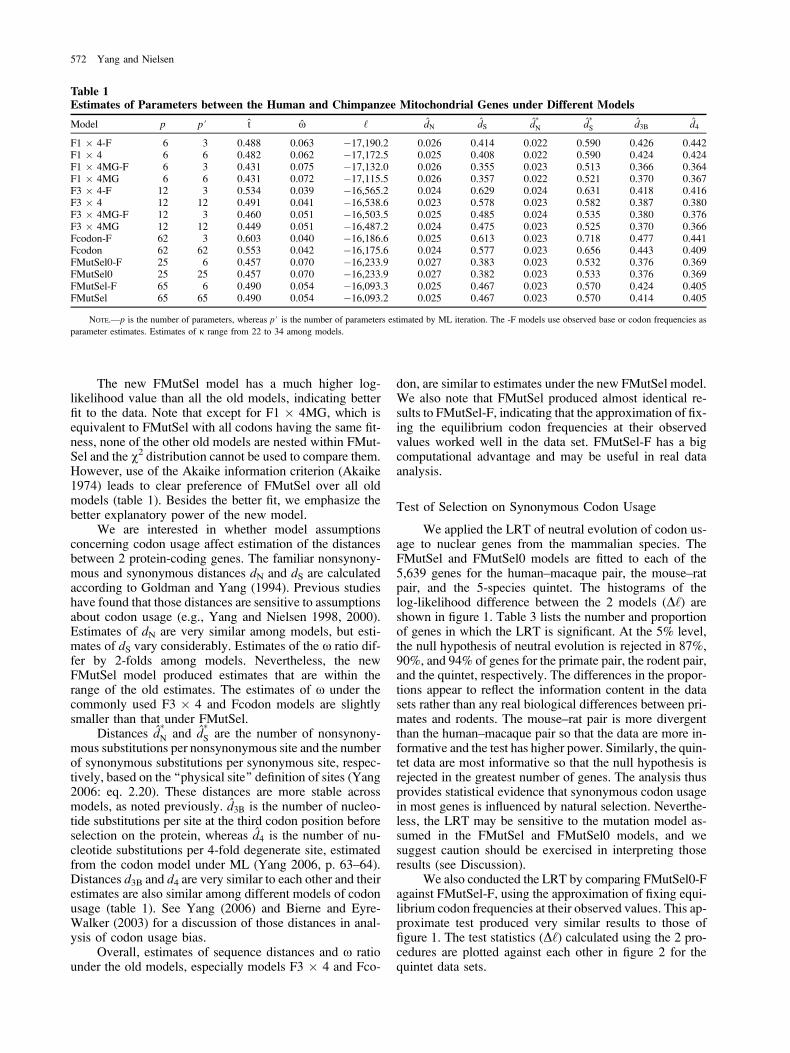
The new FMutSel model has a much higher log-likelihood value than all the old models, indicating betterfit to the data. Note that except for F1 � 4MG, which isequivalent to FMutSel with all codons having the same fit-ness, none of the other old models are nested within FMut-Sel and the v2 distribution cannot be used to compare them.However, use of the Akaike information criterion (Akaike1974) leads to clear preference of FMutSel over all oldmodels (table 1). Besides the better fit, we emphasize thebetter explanatory power of the new model.
We are interested in whether model assumptionsconcerning codon usage affect estimation of the distancesbetween 2 protein-coding genes. The familiar nonsynony-mous and synonymous distances dN and dS are calculatedaccording to Goldman and Yang (1994). Previous studieshave found that those distances are sensitive to assumptionsabout codon usage (e.g., Yang and Nielsen 1998, 2000).Estimates of dN are very similar among models, but esti-mates of dS vary considerably. Estimates of the x ratio dif-fer by 2-folds among models. Nevertheless, the newFMutSel model produced estimates that are within therange of the old estimates. The estimates of x under thecommonly used F3 � 4 and Fcodon models are slightlysmaller than that under FMutSel.
Distances d�N and d
�S are the number of nonsynony-
mous substitutions per nonsynonymous site and the numberof synonymous substitutions per synonymous site, respec-tively, based on the ‘‘physical site’’ definition of sites (Yang2006: eq. 2.20). These distances are more stable acrossmodels, as noted previously. d3B is the number of nucleo-tide substitutions per site at the third codon position beforeselection on the protein, whereas d4 is the number of nu-cleotide substitutions per 4-fold degenerate site, estimatedfrom the codon model under ML (Yang 2006, p. 63–64).Distances d3B and d4 are very similar to each other and theirestimates are also similar among different models of codonusage (table 1). See Yang (2006) and Bierne and Eyre-Walker (2003) for a discussion of those distances in anal-ysis of codon usage bias.
Overall, estimates of sequence distances and x ratiounder the old models, especially models F3 � 4 and Fco-
don, are similar to estimates under the new FMutSel model.We also note that FMutSel produced almost identical re-sults to FMutSel-F, indicating that the approximation of fix-ing the equilibrium codon frequencies at their observedvalues worked well in the data set. FMutSel-F has a bigcomputational advantage and may be useful in real dataanalysis.
Test of Selection on Synonymous Codon Usage
We applied the LRT of neutral evolution of codon us-age to nuclear genes from the mammalian species. TheFMutSel and FMutSel0 models are fitted to each of the5,639 genes for the human–macaque pair, the mouse–ratpair, and the 5-species quintet. The histograms of thelog-likelihood difference between the 2 models (D‘) areshown in figure 1. Table 3 lists the number and proportionof genes in which the LRT is significant. At the 5% level,the null hypothesis of neutral evolution is rejected in 87%,90%, and 94% of genes for the primate pair, the rodent pair,and the quintet, respectively. The differences in the propor-tions appear to reflect the information content in the datasets rather than any real biological differences between pri-mates and rodents. The mouse–rat pair is more divergentthan the human–macaque pair so that the data are more in-formative and the test has higher power. Similarly, the quin-tet data are most informative so that the null hypothesis isrejected in the greatest number of genes. The analysis thusprovides statistical evidence that synonymous codon usagein most genes is influenced by natural selection. Neverthe-less, the LRT may be sensitive to the mutation model as-sumed in the FMutSel and FMutSel0 models, and wesuggest caution should be exercised in interpreting thoseresults (see Discussion).
We also conducted the LRT by comparing FMutSel0-Fagainst FMutSel-F, using the approximation of fixing equi-librium codon frequencies at their observed values. This ap-proximate test produced very similar results to those offigure 1. The test statistics (D‘) calculated using the 2 pro-cedures are plotted against each other in figure 2 for thequintet data sets.
Table 1Estimates of Parameters between the Human and Chimpanzee Mitochondrial Genes under Different Models
Model p p# t x ‘ dN dS d�N d
�S d3B d4
F1 � 4-F 6 3 0.488 0.063 �17,190.2 0.026 0.414 0.022 0.590 0.426 0.442F1 � 4 6 6 0.482 0.062 �17,172.5 0.025 0.408 0.022 0.590 0.424 0.424F1 � 4MG-F 6 3 0.431 0.075 �17,132.0 0.026 0.355 0.023 0.513 0.366 0.364F1 � 4MG 6 6 0.431 0.072 �17,115.5 0.026 0.357 0.022 0.521 0.370 0.367F3 � 4-F 12 3 0.534 0.039 �16,565.2 0.024 0.629 0.024 0.631 0.418 0.416F3 � 4 12 12 0.491 0.041 �16,538.6 0.023 0.578 0.023 0.582 0.387 0.380F3 � 4MG-F 12 3 0.460 0.051 �16,503.5 0.025 0.485 0.024 0.535 0.380 0.376F3 � 4MG 12 12 0.449 0.051 �16,487.2 0.024 0.475 0.023 0.525 0.370 0.366Fcodon-F 62 3 0.603 0.040 �16,186.6 0.025 0.613 0.023 0.718 0.477 0.441Fcodon 62 62 0.553 0.042 �16,175.6 0.024 0.577 0.023 0.656 0.443 0.409FMutSel0-F 25 6 0.457 0.070 �16,233.9 0.027 0.383 0.023 0.532 0.376 0.369FMutSel0 25 25 0.457 0.070 �16,233.9 0.027 0.382 0.023 0.533 0.376 0.369FMutSel-F 65 6 0.490 0.054 �16,093.3 0.025 0.467 0.023 0.570 0.424 0.405FMutSel 65 65 0.490 0.054 �16,093.2 0.025 0.467 0.023 0.570 0.414 0.405
NOTE.—p is the number of parameters, whereas p# is the number of parameters estimated by ML iteration. The -F models use observed base or codon frequencies as
parameter estimates. Estimates of j range from 22 to 34 among models.
572 Yang and Nielsen

The Distribution of Selection Coefficients
We used the FMutSel model to calculate the propor-tions of mutations with different selective coefficients (S),generating an estimation of the distribution of S among newmutations. For this analysis, we use 4 large data sets: theconcatenated mitochondrial genes from the human andchimpanzee and the concatenated nuclear genes for the hu-man–macaque pair, the mouse–rat pair, and the quintet. Weused both model M0 (1-ratio), which assumes the same xratio for all codons, andM3 (discrete), which assumes 2 siteclasses in proportions p0 and p1 with different x ratiosx0 and x1 (Yang et al. 2000). The results are shown intable 2. The log-likelihood values under models M0(1-ratio) andM3 (discrete) are hugely different, indicating thatthe x ratio is highly variable among codons. Nevertheless,estimates of the mutation bias parameters (p�T; p
�C; p
�A) and
codon fitness parameters (not shown) are very similar be-tween the 2 models in each of the 4 large data sets (table 2).
We used parameter estimates obtained under modelM0 (1-ratio) to calculate the scaled selective coefficients(S) for mutations that involve 2 codons differing at exactlyone position and thus have nonzero rates. Those are the pos-sible mutations allowed by the model, and their probabil-ities of occurrences are given by equation (5). There are 526and 508 such mutations (codon pairs) for the universal andmitochondrial codes, respectively. The S values for thosemutations were binned into 21 bins to generate a histogram,with the mid value in each bin used as the representative forthat bin and with the proportion for the bin calculated as thesum of proportions (mIJ in eq. 5) of all mutations falling intothat bin. The results are shown in figure 3a. The proportion(Pþ) of advantageous mutations among all mutations isshown in table 2, as well as the average selective coefficientsof advantageous and deleterious mutations (�Sþand �S�).
0 18 38 58 78 98 118 138
0
100
200
300
400
500
600
700(a) human–macaque
Num
ber
of g
enes
0 18 38 58 78 98 118 138
0
100
200
300
400
500
600
700(b) mouse–rat
0 18 38 58 78 98 118 138
0
100
200
300
400
500(c) five species
FIG. 1.—Histograms of the log-likelihood difference (D‘) for test ofselection on codon usage for (a) the human–macaque genes, (b) themouse–rat genes, and (c) the quintet of all 5 species. Values greater than150 are grouped into the last bin. As 2D‘ is asymptotically distributed asv241 under the null model, the critical values for D‘ are 28.47 and 32.48 atthe 5% and 1% levels, respectively.
0
100
200
300
400
0 100 200 300 400
(exact)
(app
rox.
)FIG. 2.—The log-likelihood difference (D‘) for test of selection on
codon usage when the codon frequency parameters are estimated by MLiteration (exact) or by fixing them at the observed values. The 5-speciesmammalian genes are analyzed.
Mutation-Selection Models of Codon Substitution 573

Because preferred codons with higher fitness are more com-mon and most mutations lead to unpreferred codons withlower fitness, the distribution of S among new mutationsis skewed to the left, with the proportion Pþ,
12. The pro-
portion of advantageous mutations among substitutions ishigher thanPþ because an advantageousmutationhas a high-er fixation probability and makes a greater contribution tosubstitutions than does a deleterious mutation. Indeed, theproportions of advantageous mutations among substitutionsis 1
2, due to the reversibility of the substitution model.The estimates of �Sþ and �S� are greater and thus selec-
tion on silent sites is stronger in the mitochondrial genesthan in the nuclear genes (table 2). In the former, ;31%of new mutations are advantageous, whereas in the latter,the proportion is 37–40%. The much lower x ratios inthe mitochondrial genes than in the nuclear genes indicatethat the mitochondrial proteins are under much stronger se-lective constraint than the nuclear proteins. The difference ismore striking when one considers the fact that the effectivepopulation size for mitochondrial genes is ; 1
4that of the
nuclear genes and that selection is less efficient in smallerpopulations. The higher efficiency of selection in mtDNA,with respect to both codon usage and protein evolution, maybe due to the fact that the haploid mitochondrial genomemakes it easy to remove recessive mutations, whereas theymay remain hidden in the heterozygous state in nucleargenes. Another possible explanation is the hypothesis of se-lection for translational accuracy, which predicts strongerselection on codon usage on highly conserved proteins oron highly conserved amino acids in a protein because thefitness cost of translational misincorporation should dependon how the amino acid change affects protein function (Aka-shi 1994). If mitochondrial genes perform crucial biologicalfunctions and are more highly expressed than nuclear genes,this hypothesis may explain both the stronger selection onprotein evolution and the stronger selection on codon usage.
It should be noted that in our model, all S values arenonzero, and Pþ in table 2 includes mutations with S only
very slightly positive, the evolutionary dynamics of whichmay be indistinguishable from that of neutral mutations.For example, mutations with |S| . 2 are rare in all data sets.The estimated proportions of mutations with S . 2 andS, �2 are 0.2% and 1.7%, respectively, for the mitochon-drial genes, 0.2% and 1.6% for the human–macaque pair,0.1% and 1.0% for the mouse–rat pair, and 0.1% and 0.9%for the quintet. Thus, although the LRT rejects the nullmodel of neutral evolution of silent sites, selection on codonusage is mostly weak, and most mutations appear to benearly neutral with respect to selection on codon usage.
We are also interested in how natural selection on co-don usage changes the fitness distribution of mutations, thatis, how mutations of different fitness contribute to substi-tutions. A histogram of S after filtering by natural selectionon codon usage can be generated using the same procedureas described above, except that the proportion mIJ is calcu-lated using equation (5), with pIlik jk replaced bypIlik jk hðSIJÞ. The resulting histograms (fig. 3b) show theproportion of mutations with scaled fitness S that has sur-vived natural selection on codon usage. Similarly, If we re-place pIlik jk by pIqIJ in equation (5), the resultinghistograms (fig. 3c) represent the proportion of mutationswith fitness S among observed substitutions, that is, amongmutations that have passed the filtering by selection both oncodon usage bias and on amino acid replacements. Becauseof the detailed balance condition of the reversible Markovmodel of substitution, the distributions in figure 3b and c areall symmetrical. Note that here the distinction between se-lection on codon usage and selection on amino acid replace-ments is more conceptual than temporal, with noimplication that one necessarily occurs before the other.
DiscussionMechanistic Models of Codon Usage and Protein Evolution
A number of authors have studied the frequencies ofsynonymous codons for 2-fold degenerate amino acids as
Table 2Parameter Estimates under the Mutation-Selection (FMutSel) Model in 4 Concatenated Data Sets
Data Sets p b j x p�T p�C p�A p�G ‘ Pþ �Sþ �S�
Human–chimpanzee mitochondria
M0 (1-ratio) 65 0.490 29.0 0.054 0.213 0.186 0.419 0.182 �16,093.2 0.319 0.612 �0.916
M3 (discrete) 67 0.501 28.7p0 5 0.848, p1 5 0.151x0 5 0.006, x1 5 0.374 0.222 0.181 0.363 0.234 �16,079.9 0.306 0.645 �1.017
Human–macaqueM0 (1-ratio) 66 0.072 4.1 0.149 0.169 0.316 0.227 0.288 �10,095,235.6 0.370 0.435 �0.648
M3 (discrete) 68 0.076 4.2p0 5 0.997, p1 5 0.003x0 5 0.125, x1 5 17.2 0.167 0.319 0.225 0.290 �10,091,520.6 0.368 0.444 �0.662
Mouse–Rat
M0 (1-ratio) 66 0.195 3.5 0.111 0.190 0.284 0.275 0.252 �10,903,772.7 0.385 0.390 �0.562
M3 (discrete) 68 0.199 3.6p0 5 0.982, p1 5 0.018x0 5 0.079, x1 5 2.623 0.189 0.284 0.274 0.253 �10,897,867.4 0.385 0.390 �0.563
5 species
M0 (1-ratio) 72 0.657 3.2 0.119 0.183 0.287 0.262 0.268 �14,743,509.9 0.385 0.393 �0.565
M3 (discrete) 74 0.676 3.3p0 5 0.882, p1 5 0.118x0 5 0.040, x1 5 0.851 0.184 0.284 0.261 0.271 �14,683,601.6 0.386 0.388 �0.560
NOTE.—p is the number of parameters in the model. b is the distance between 2 sequences or the tree length for the 5-species data, measured by the expected number of
nucleotide substitutions per codon. Estimates of the 60 (for the mitochondrial data) or 61 (for nuclear genes) codon fitness parameters are not shown. Pþ is the proportion of
advantageous mutations. �Sþ and �S� are the average selection coefficients of advantageous and deleterious mutations, respectively.
574 Yang and Nielsen

the result of interactions between mutation, genetic drift,and natural selection (Kimura 1983; Li 1987; Bulmer1991; McVean and Charlesworth 1999). Let the 2 allelesbe 1 (preferred codon) and 0 (unpreferred codon), withthe mutation rate from 0 to 1 to be l1 and that in the reversedirection be l0. Suppose that the 2 alleles have fitness f0 andf1 so that the selection coefficient of the 0 / 1 mutation inthe allele-0 population is s 5 f1 � f0 and that of the 1 /0 mutation in the allele-1 population is �s. At mutation-selection-drift equilibrium, the probability density of thefrequency p of allele 1 is given as
f ðpÞ} e2Nspp2Nl1�1ð1� pÞ2Nl0�1; ð10Þ
(Wright 1931). This theory can be used to analyze codonusage in a single species, under the assumption that oneof the alleles is fixed. The probability that the populationis fixed at the preferred codon can be obtained by inte-grating the density f(p) from 1 � 1/N to 1 (e.g., Li 1987),as
pi } lie2Nfi ; i 5 0; 1; ð11Þ
hum
an–c
him
p m
t.
(a) Mutations (c) After protein(b) After codon usage
0
0.05
0.1
0.15
0.2
0
0.05
0.1
0.15
0.2
0
0.05
0.1
0.15
0.2
-3 -2 -1 0 1 2 3-3 -2 -1 0 1 2 3 -3 -2 -1 0 1 2 3
hum
an–m
acaq
ue
0
0.05
0.1
0.15
0.2
0
0.05
0.1
0.15
0.2
0
0.05
0.1
0.15
0.2
-3 -2 -1 0 1 2 3 -3 -2 -1 0 1 2 3 -3 -2 -1 0 1 2 3
mou
se–r
at
0
0.05
0.1
0.15
0.2
0
0.05
0.1
0.15
0.2
0
0.05
0.1
0.15
0.2
-3 -2 -1 0 1 2 3 -3 -2 -1 0 1 2 3 -3 -2 -1 0 1 2 3
Selection coefficient S
quin
tet
0
0.05
0.1
0.15
0.2
0
0.05
0.1
0.15
0.2
0
0.05
0.1
0.15
0.2
-3 -2 -1 0 1 2 3 -3 -2 -1 0 1 2 3 -3 -2 -1 0 1 2 3
FIG. 3.—Estimated distributions of selection coefficient S 5 2Ns from 4 data sets: concatenated human–chimpanzee mitochondrial genes,concatenated human–macaque nuclear genes, concatenated mouse–rat nuclear genes, and concatenated data for all 5 mammalian species. Thehistograms show the proportion of mutations with scaled selection coefficient S (a) among all mutations, (b) after filtering by natural selection on codonusage, and (c) after filtering by selection on both codon usage and on amino acid replacements. Model M0 (1-ratio) is used, with the same x ratio for allnonsynonymous changes. Parameter estimates are shown in table 2.
Mutation-Selection Models of Codon Substitution 575

where the proportionality constant is determined to ensurethat p0þ p1 5 1. If we assume that the same selective pres-sure applies to synonymous codons for all 2-fold degener-ate amino acids in a gene, p1 will be the proportion ofpreferred codons in the gene. The contributions of mutationand selection to the equilibrium frequencies of synonymouscodons are apparent from equation (11). This may also beconsidered a special case of equation (4), which gives theequilibrium distribution of the codon-substitution process.
McVean and Vieira (1999) used equation (11) to an-alyze observed counts of preferred codons for 2-fold aminoacids in severalDrosophila species, fitting binomial modelsby ML. The analysis used information on codon usage butignored differences between species. McVean and Vieira(2001) implemented a population genetics model that isvery similar to equation (2) to describe substitutions be-tween synonymous codons between species. The authorsanalyzed between-species synonymous differences to esti-mate the strength of natural selection on synonymous codonusage, with nonsynonymous differences ignored. TheFMutSel models extend the work of McVean and Vieirato a full codon substitution model, which is suitable forcomparative analysis of protein-coding genes frommultiplespecies.
Previous models of codon substitution (Goldman andYang 1994; Muse and Gaut 1994) aim to describe nucle-otide substitutions and do not explicitly accommodate mu-tation bias and natural selection acting on the DNA level.The models may thus be ill suited for studying the forcesand mechanisms of the evolutionary process at silent sites.The mutation-selection models implemented in this paperaddress this drawback, by introducing parameters that ex-plicitly describe mutation bias and natural selection actingon codon usage. We suggest that such models, with the easyinterpretation of the model parameters, may be very usefulfor studying the process of molecular sequence evolution.
There has been considerable interest in incorporatingfitness effects of new mutations in constructing substitutionmodels for phylogenetic analysis. Halpern and Bruno(1998) considered a codon-substitution model in whichat every amino acid site in the protein, different amino acidshave different fitness and thus different equilibrium fre-quencies. The model was developed for distance calcula-tion but is not practical for real data analysis due to itsuse of too many parameters. Moses et al. (2003) adaptedthe theory to describe nucleotide substitutions and to esti-mate site-specific substitution rates in noncoding regulatoryelements such as transcription factor–binding sites. Notethat from equation (4), we have
pIpJ
�lik jkljk ik
5p�ike
FI
p�jkeFJ�aikjkp
�jk
ajk ikp�ik
5 eFI�FJ ; ð12Þ
from which equation (9) of Halpern and Bruno (1998) canbe seen to equal h(SIJ) in equation (1), with h(SIJ) 5 1 forSIJ 5 0. Thus, the underlying population genetics theory isthe same although the applications are very different. Notethat given a reversible mutation model such as HKY orGTR, reversibility of codon substitution is a natural prop-erty of the model and not an additional assumption, as madeby Halpern and Bruno (1998) and Moses et al. (2003).
The FMutSel model also has similarities to the site-class models of amino acid replacement implemented byKoshi et al. (1999), which assume that different site classeshave different amino acid frequencies and different substi-tution patterns and that in each site class, every amino acid Jhas its own ‘‘propensity’’ FJ. Koshi et al. (1999, eq. 4) ap-plied a truncation on the substitution rate, equivalent to fix-ing h(SIJ) 5 1 whenever the difference in propensitySIJ 5 FJ � FI . 0. Like FMutSel, this model is also timereversible, with the same equilibrium distribution, wherethe frequency of amino acid J is proportional to eFJ . Exceptfor the truncation mentioned above, the model of Koshiet al. (1999) can be given a population genetics interpreta-tion, with the propensity interpreted as the scaled fitness FJ.However, the truncation of rates means that the model as-sumes that an advantageous mutation is fixed at the samerate as a neutral mutation, which is unrealistic biologically.A similar criticism was made by Thorne et al. (2007).
More recent work by Yu and Thorne (2006), Thorneet al. (2007), and Choi et al. (2007) assigned a fitness to thesequence when they developed mutation-selection modelsto describe the evolution of RNA or protein sequences. Anadvantage of those models is that they allow dependenceamong sites due to RNA or protein structural constraints.
We note that there has been some debate in the liter-ature concerning whether use of the x ratio to detect naturalselection acting on the protein (for reviews, see Yang andBielawski 2000; Yang 2002) requires the assumption ofneutral evolution at silent sites. Many authors take it forgranted that this assumption is needed. A concern is thatif selection acts on codon usage, codon models may be mis-led to produce an x ratio greater than one because selectionon silent sites has reduced dS and not because positive se-lection has elevated dN. From the mutation-selection mod-els implemented in this paper, it is clear that the assumptionis not necessary and it is possible to use the x ratio to detectpositive selection acting on the protein even if silent sitesare under natural selection, as assumed in FMutSel. Com-parison between dS and dN is a contrast between the ratesbefore and after the action of selection on the protein (Yang2006, eq. 2.19) so that the comparison is valid whether evo-lution at silent sites is driven by mutation or selection. Inthis regard, selection on silent sites may be more accuratelydescribed as selection on the DNA level as it affects bothsilent and replacement sites.
Sensitivity of the LRT to the Mutation Model
The mutation-selection model of codon substitutionmakes many simplistic assumptions about the evolutionaryprocess. For our purpose of testing for selection acting onsilent sites, the most worrying assumptions appear to bethose concerning the mutation process as the mutation-biasand codon-fitness parameters are expected to be highly cor-related in such an analysis. Indeed, the effects of the 2would be virtually impossible to separate if we had usedonly information on codon frequencies (see eqs. 4 and 11).
To examine the impact of the assumed mutation modelon the LRT of selection on codon usage, we implementedthe GTR mutation model (e.g., Yang 1994). The codon fre-quency parameters are estimated using the observed
576 Yang and Nielsen

frequencies rather than by ML iteration. Application of theLRT under the GTR model to the mammalian data pro-duced results very similar to those obtained under HKY.The proportions of genes for which the LRT is significantunder GTR (table 3) are slightly lower (by 1–2%) than un-der HKY. Figure 4 plots the test statistic (D‘) for the 2 mu-tation models for the quintet data sets. The results suggestthat the LRT may not be very sensitive to the assumed mu-tation model.
However, the estimates of codon-fitness parametersfor the concatenated data under the 2 mutation modelsare very different (results not shown). This is the case eventhough both mutation models predicted very similar codonfrequency parameters, which closely match the observedfrequencies. Our estimates of the selection coefficientsare affected by the mutation model. Thus, we found thatthe LRT is somewhat insensitive to the assumed mutationmodel but the estimates of codon fitness parameters are.
Both HKY and GTR assume independent mutations atnucleotide sites. There is considerable evidence suggestingthat the mutation rate of a nucleotide may depend on neigh-boring nucleotides (e.g., Bulmer 1986; Hwang and Green2004; Siepel and Haussler 2004). One well-known exampleof such context effects is the high mutation rate of CpG di-nucleotides in mammalian genomes. As the cytosine inCpG is prone to methylation and deamination, CpG dinu-cleotides have a very high rate of mutating into TpG(Scarano et al. 1967). With such mutational context effects,both the null and alternative hypotheses (FMutSel0 andFMutSel) in the LRT are violated, but the 2 models maynot be affected to the same extent, in which case the vio-lation of assumptions may cause the test to generate exces-sive false positives. For example, FMutSel0 predicts thatthe relative frequencies of 4-fold degenerate codons encod-ing the same amino acid are given by the mutation-bias pa-rameters (pj3 ), independent of the encoded amino acid. Ifthe mutation rate and pattern at the third codon position de-pend on the nucleotides at the first and second positions,FMutSel0 may fit the data poorly, but FMutSel may stillachieve a reasonable fit because of its use of a separate co-don fitness parameter FJ for each target codon J. Althoughboth FMutSel0 and FMutSel make use of information fromnonsynonymous differences as well as synonymous differ-ences, the test may nevertheless be sensitive to such muta-
tional context effects. It has also been suggested that onemutation event may affect multiple nucleotides and the as-sumption of independent mutations may be unrealistic (e.g.,Yang et al. 1998; Whelan and Goldman 2004). However,those studies typically analyze substitutions instead of mu-tations, and the apparent double or triple substitutions mayreflect artifacts of the inadequate substitution model ratherthan true double or triple mutations. The models developedhere concern the mutation process, and it would appear thatdouble or triple mutations, if not rare, should affect the 2models in similar ways. At any rate, the sensitivity ofthe LRT to violations of the assumed mutation model isnot well understood and merits further research.
We consider several strategies that may alleviate theconfounding effect of mutation and selection. The first isto make certain assumptions concerning either the mutationor the selection process. For example, the method of Nielsenet al. (2007) required prior knowledge of preferred and un-preferred codons and also assumed the same selectivestrength acting on all codons. The latter assumption maybe unrealistic in some data sets. A second strategy is to an-alyze pseudogenes or noncoding DNA to estimate mutationparameters and then use them in the mutation-selectionmodel of codon substitution to analyze coding genes. Sim-ilarly, one may analyze coding and neighboring noncodingregions jointly, with the same mutation-bias parameters ap-plied to both regions and the selection parameters applied tothe coding regions only. This requires that the same muta-tion process operates in both coding and noncoding regions,an assumption that may be violated due to translation-coupled repair (Duret 2002). A third strategy, suitable for jointanalysis of many genes from the same set of species, is toassume that the mutation parameters are shared amonggenes or at least among genes with similar codon usage biasor GC content at the third codon positions, whereas thestrengths of selection on codon usage may differ among
(HKY)
(GTR
)
y = 1.002x
R2 = 0.973
0
100
200
300
400
0 100 200 300 400
FIG. 4.—The log-likelihood difference (D‘) for test of selection oncodon usage when the assumed mutation model is HKY or GTR. The5-species mammalian genes are analyzed.
Table 3Number and Percentage (in Parentheses) of MammalianGenes for Which the Null Model of Neutral Evolution atSilent Sites Is Rejected
Data
Significance Level
5% 1%
HKY mutation model
Human–macaque 4,909 (87%) 4,336 (77%)Mouse–rat 5,073 (90%) 4,587 (81%)5 species 5,282 (94%) 4,945 (88%)
GTR mutation model
Human–macaque 4,815 (85%) 4,216 (75%)Mouse–rat 4,988 (88%) 4,479 (79%)5 species 5,240 (93%) 4,870 (86%)
NOTE.—A total of 5,639 genes are analyzed.
Mutation-Selection Models of Codon Substitution 577
genes. In this paper, we analyzed the 5,639 mammaliangenes separately, fitting 66 or more parameters to eachgene, so that the model is rather parameter-rich. Finally, de-veloping models that explicitly accommodate mutationalcontext effects may also be very useful in improving therealism of the models implemented here. In this regard,our likelihood model provides a natural framework for suchextensions.
Program Availability
The new FMutSel and FMutSel0 models developed inthis paper are implemented independently by the 2 authorsfor error checking. All models described in this paper areimplemented in the CODEML program in PAML 4 (Yang2007).
Acknowledgments
We thank 3 referees for many useful comments. Thisstudy is supported by a grant from the Biotechnological andBiological Sciences Research Council to Z.Y. and grantsfrom FNU (Danish Natural Science Research Council)and Danmarks Grundforskningsfond to R.N.
Literature Cited
Akaike H. 1974. A new look at the statistical modelidentification. IEEE Trans Automat Contr. 19:716–723.
Akashi H. 1994. Synonymous codon usage in Drosophilamelanogaster: natural selection and translational accuracy.Genetics. 136:927–935.
Akashi H. 1995. Inferring weak selection from patterns ofpolymorphism and divergence at ‘‘silent’’ sites in DrosophilaDNA. Genetics. 139:1067–1076.
Bennetzen JL, Hall BD. 1982. Codon selection in yeast. J BiolChem. 257:3026–3031.
Bierne N, Eyre-Walker A. 2003. The problem of counting sites inthe estimation of the synonymous and nonsynonymoussubstitution rates: implications for the correlation betweenthe synonymous substitution rate and codon usage bias.Genetics. 165:1587–1597.
Bulmer M. 1986. Neighboring base effects on substitution ratesin pseudogenes. Mol Biol Evol. 3:322–329.
Bulmer M. 1987. Coevolution of codon usage and transfer RNAabundance. Nature. 325:728–730.
Bulmer MG. 1991. The selection-mutation-drift theory ofsynonymous codon usage. Genetics. 129:897–907.
Castillo-Davis CI, Hartl DL. 2002. Genome evolution anddevelopmental constraint in Caenorhabditis elegans. MolBiol Evol. 19:728–735.
Choi SC, Hobolth A, Robinson DM, Kishino H, Thorne JL.2007. Quantifying the impact of protein tertiary structure onmolecular evolution. Mol Biol Evol. 24:1769–1782.
Dunn KA, Bielawski JP, Yang Z. 2001. Substitution rates inDrosophila nuclear genes: implications for translationalselection. Genetics. 157:295–305.
Duret L. 2002. Evolution of synonymous codon usage inmetazoans. Curr Opin Genet Dev. 12:640–649.
Duret L, Mouchiroud D. 1999. Expression pattern and,surprisingly, gene length shape codon usage in Caenorhabdi-tis, Drosophila, Arabidopsis. Proc Natl Acad Sci USA.96:4482–4487.
Fisher R. 1930. The distribution of gene ratios for rare mutations.Proc R Soc Edinb. 50:205–220.
Frydman J. 2001. Folding of newly translated proteins in vivo: therole of molecular chaperones. Annu Rev Biochem. 70:603–647.
Goldman N, Yang Z. 1994. A codon-based model of nucleotidesubstitution for protein-coding DNA sequences. Mol BiolEvol. 11:725–736.
Halpern AL, Bruno WJ. 1998. Evolutionary distances forprotein-coding sequences: modeling site-specific residuefrequencies. Mol Biol Evol. 15:910–917.
Hasegawa M, Cao Y, Yang Z. 1998. Preponderance of slightlydeleterious polymorphism in mitochondrial DNA: replace-ment/synonymous rate ratio is much higher within speciesthan between species. Mol Biol Evol. 15:1499–1505.
Hasegawa M, Kishino H, Yano T. 1985. Dating the human-apesplitting by a molecular clock of mitochondrial DNA. J MolEvol. 22:160–174.
Horai S, Hayasaka K, Kondo R, Tsugane K, Takahata N. 1995.Recent African origin of modern humans revealed bycomplete sequences of hominoid mitochondrial DNAs. ProcNatl Acad Sci USA. 92:532–536.
Hwang DG, Green P. 2004. Bayesian Markov chain Monte Carlosequence analysis reveals varying neutral substitution patternsin mammalian evolution. Proc Natl Acad Sci USA.101:13994–14001.
Ikemura T. 1981. Correlation between the abundance ofEscherichia coli transfer RNAs and the occurrence of therespective codons in its protein genes. J Mol Biol. 146:1–21.
Ikemura T. 1985. Codon usage and tRNA content in unicellularand multicellular organisms. Mol Biol Evol. 2:13–34.
Kanaya S, Yamada Y, Kinouchi M, Kudo Y, Ikemura T. 2001.Codon usage and tRNA genes in eukaryotes: correlation ofcodon usage diversity with translation efficiency and withCG-dinucleotide usage as assessed by multivariate analysis.J Mol Evol. 53:290–298.
Kimchi-Sarfaty C, Oh JM, Kim IW, Sauna ZE, Calcagno AM,Ambudkar SV, Gottesman MM. 2007. A ‘‘silent’’ poly-morphism in the MDR1 gene changes substrate specificity.Science. 315:525–528.
Kimura M. 1957. Some problems of stochastic processes ingenetics. Ann Math Stat. 28:882–901.
Kimura M. 1983. The neutral theory of molecular evolution.Cambridge: Cambridge University Press.
Koshi JM, Mindell DP, Goldstein RA. 1999. Using physical-chemistry-based substitution models in phylogenetic analysesof HIV-1 subtypes. Mol Biol Evol. 16:173–179.
Kreitman M, Akashi H. 1995. Molecular evidence for naturalselection. Annu Rev Ecol Syst. 26:403–422.
Kurland CG. 1992. Translational accuracy and the fitness ofbacteria. Annu Rev Genet. 26:29–50.
Li W-H. 1987. Models of nearly neutral mutations with particularimplications for nonrandom usage of synonymous codons.J Mol Evol. 24:337–345.
McVean GA, Charlesworth B. 1999. A population geneticsmodel for the evolution of synonymous codon usage: patternsand predictions. Genet Res. 74:145–158.
McVean GA, Vieira J. 1999. The evolution of codon preferencesin Drosophila: a maximum-likelihood approach to parameterestimation and hypothesis testing. J Mol Evol. 49:63–75.
McVean GA, Vieira J. 2001. Inferring parameters of mutation,selection and demography from patterns of synonymous siteevolution in Drosophila. Genetics. 157:245–257.
Moriyama EN, Powell JR. 1997. Codon usage bias and tRNAabundance in Drosophila. J Mol Evol. 45:514–523.
Moses AM, Chiang DY, Kellis M, Lander ES, Eisen MB. 2003.Position specific variation in the rate of evolution intranscription factor binding sites. BMC Evol Biol. 3:19.
578 Yang and Nielsen

Muse SV, Gaut BS. 1994. A likelihood approach for comparingsynonymous and nonsynonymous nucleotide substitutionrates, with application to the chloroplast genome. Mol Biol Evol.11:715–724.
Musto H, Cruveiller S, D’Onofrio G, Romero H, Bernardi G.2001. Translational selection on codon usage in Xenopuslaevis. Mol Biol Evol. 18:1703–1707.
Nielsen R, Bauer DuMont VL, Hubisz MJ, Aquadro CF. 2007.Maximum likelihood estimation of ancestral codon usage biasparameters in Drosophila. Mol Biol Evol. 24:228–235.
Nielsen R, Yang Z. 1998. Likelihood models for detectingpositively selected amino acid sites and applications to theHIV-1 envelope gene. Genetics. 148:929–936.
Rhesus Macaque Genome Sequencing and Analysis Consortium.2007. Evolutionary and biomedical insights from the Rhesusmacaque genome. Science. 316:222–234.
Scarano E, Iaccarino M, Grippo P, Parisi E. 1967. Theheterogeneity of thymine methyl group origin in DNApyrimidine isostichs of developing sea urchin embryos. ProcNatl Acad Sci USA. 57:1394–1400.
Sharp PM, Averof M, Lloyd AT, Matassi G, Peden JF. 1995.DNA sequence evolution: the sounds of silence. Philos TransR Soc Lond B Biol Sci. 349:241–247.
Sharp PM, Li WH. 1987. The rate of synonymous substitution inenterobacterial genes is inversely related to codon usage bias.Mol Biol Evol. 4:222–230.
Siepel A, Haussler D. 2004. Phylogenetic estimation of context-dependent substitution rates by maximum likelihood. MolBiol Evol. 21:468–488.
Thorne JL, Choi SC, Yu J, Higgs PG, Kishino H. 2007.Population genetics without intraspecific data. Mol Biol Evol.24:1667–1677.
WhelanS,GoldmanN. 2004.Estimating the frequencyof events thatcause multiple-nucleotide changes. Genetics. 167:2027–2043.
Wright S. 1931. Evolution in Mendelian populations. Genetics.16:97–159.
Yang Z. 1994. Estimating the pattern of nucleotide substitution.J Mol Evol. 39:105–111.
Yang Z. 1997. PAML: a program package for phylogeneticanalysis by maximum likelihood. Comput Appl Biosci. 13:555–556.
Yang Z. 2002. Inference of selection from multiple speciesalignments. Curr Opin Genet Dev. 12:688–694.
Yang Z. 2006. Computational molecular evolution. Oxford (UK):Oxford University Press.
Yang Z. 2007. PAML 4: phylogenetic analysis by maximumlikelihood. Mol Biol Evol. 24:1586–1591.
Yang Z, Bielawski JP. 2000. Statistical methods for detectingmolecular adaptation. Trends Ecol Evol. 15:496–503.
Yang Z, Nielsen R. 1998. Synonymous and nonsynonymous ratevariation in nuclear genes of mammals. J Mol Evol. 46:409–418.
Yang Z, Nielsen R. 2000. Estimating synonymous and non-synonymous substitution rates under realistic evolutionarymodels. Mol Biol Evol. 17:32–43.
Yang Z, Nielsen R, Goldman N, Pedersen A-MK. 2000. Codon-substitution models for heterogeneous selection pressure atamino acid sites. Genetics. 155:431–449.
Yang Z, Nielsen R, Hasegawa M. 1998. Models of amino acidsubstitution and applications to mitochondrial protein evolu-tion. Mol Biol Evol. 15:1600–1611.
Yu J, Thorne JL. 2006. Dependence among sites in RNAevolution. Mol Biol Evol. 23:1525–1537.
Jeffrey Thorne, Associate Editor
Accepted December 19, 2007
Mutation-Selection Models of Codon Substitution 579
Related Documents