Mutation Scanning Using MUT-MAP, a High-Throughput, Microfluidic Chip-Based, Multi-Analyte Panel Rajesh Patel 1 *, Alison Tsan 2 , Rachel Tam 1 , Rupal Desai 1 , Nancy Schoenbrunner 2 , Thomas W. Myers 3 , Keith Bauer 3 , Edward Smith 3 , Rajiv Raja 1 1 Oncology Biomarker Development, Genentech Inc., South San Francisco, California, United States of America, 2 Chemistry and Innovation Technology, Pleasanton, California, United States of America, 3 Program in Core Research Roche Molecular Systems Inc., Pleasanton, California, United States of America Abstract Targeted anticancer therapies rely on the identification of patient subgroups most likely to respond to treatment. Predictive biomarkers play a key role in patient selection, while diagnostic and prognostic biomarkers expand our understanding of tumor biology, suggest treatment combinations, and facilitate discovery of novel drug targets. We have developed a high- throughput microfluidics method for mutation detection (MUT-MAP, mutation multi-analyte panel) based on TaqMan or allele-specific PCR (AS-PCR) assays. We analyzed a set of 71 mutations across six genes of therapeutic interest. The six-gene mutation panel was designed to detect the most common mutations in the EGFR, KRAS, PIK3CA, NRAS, BRAF, and AKT1 oncogenes. The DNA was preamplified using custom-designed primer sets before the TaqMan/AS-PCR assays were carried out using the Biomark microfluidics system (Fluidigm; South San Francisco, CA). A cross-reactivity analysis enabled the generation of a robust automated mutation-calling algorithm which was then validated in a series of 51 cell lines and 33 FFPE clinical samples. All detected mutations were confirmed by other means. Sample input titrations confirmed the assay sensitivity with as little as 2 ng gDNA, and demonstrated excellent inter- and intra-chip reproducibility. Parallel analysis of 92 clinical trial samples was carried out using 2–100 ng genomic DNA (gDNA), allowing the simultaneous detection of multiple mutations. DNA prepared from both fresh frozen and formalin-fixed, paraffin-embedded (FFPE) samples were used, and the analysis was routinely completed in 2–3 days: traditional assays require 0.5–1 mg high-quality DNA, and take significantly longer to analyze. This assay can detect a wide range of mutations in therapeutically relevant genes from very small amounts of sample DNA. As such, the mutation assay developed is a valuable tool for high-throughput biomarker discovery and validation in personalized medicine and cancer drug development. Citation: Patel R, Tsan A, Tam R, Desai R, Schoenbrunner N, et al. (2012) Mutation Scanning Using MUT-MAP, a High-Throughput, Microfluidic Chip-Based, Multi- Analyte Panel. PLoS ONE 7(12): e51153. doi:10.1371/journal.pone.0051153 Editor: Todd W. Miller, Dartmouth, United States of America Received August 22, 2012; Accepted October 17, 2012; Published December 17, 2012 Copyright: ß 2012 Patel et al. This is an open-access article distributed under the terms of the Creative Commons Attribution License, which permits unrestricted use, distribution, and reproduction in any medium, provided the original author and source are credited. Funding: This study was funded by Genentech Inc. The funders were responsible for the study design, data collection and analysis, decision to publish, and preparation of the manuscript. Competing Interests: The authors have the following interests: All studies were funded by Genentech, Inc. Support for third-party writing assistance for this manuscript was provided by Genentech, Inc. Rajesh Patel, Rachel Tam, Rupal Desai and Rajiv Raja are or were employed by Genentech and Alison Tsan, Nancy Schoenbrunner Thomas W. Myers, Keith Bauer and Edward Smith are or were employed by Roche Molecular Systems Inc. There are no patents, products in development or marketed products to declare. This does not alter the authors’ adherence to all the PLOS ONE policies on sharing data and materials. * E-mail: [email protected] Introduction Biomarkers have assumed a central role in oncology, enabling the detection, characterization, and targeted treatment of a range of cancer types [1]. The successful application of targeted anticancer therapies depends on the detection of disease subtypes that are most likely to respond to treatment. As such, the detection and validation of tumor biomarkers is critical for the ongoing development of personalized healthcare, both through the support of effective and robust drug trials, and the effective employment of targeted therapies in the clinic [2]. Biomarkers are classified according to their utility: diagnostic biomarkers are indicators of biological status that allow classifica- tion of tumors according to their genetic and/or phenotypic characteristics. Predictive biomarkers allow the response to a particular line of treatment to be anticipated, based on the known mode of action of the chosen therapy and an understanding of the underlying tumor biology. Prognostic biomarkers enable the prediction of disease progression in the absence of treatment, and have been used to identify signaling pathways that are potential drivers of disease, and putative drug targets [3]. Although techniques such as tissue microarray immunohisto- chemistry (IHC) and reverse-transcription polymerase chain reaction (RT-PCR) allow high-throughput screening of protein and mRNA biomarkers in clinical samples [4], significant challenges remain. Biomarker levels vary across human popula- tions, and significant heterogeneity may be observed within single cancer types, even within samples from a single tumor [5,6]. This is exacerbated by the possibility that first-line chemotherapy may induce DNA damage in tumor cells, leading to changes in biomarker status; as biopsy samples are often obtained before first- line treatment, this may be an obstacle to the correct selection of subsequent targeted therapies, although the extent of this effect remains unclear [6]. While some anticancer therapeutics are entering the clinic with companion diagnostic tests, a wider characterization of tumor gene expression and mutation status will enable targeted therapies PLOS ONE | www.plosone.org 1 December 2012 | Volume 7 | Issue 12 | e51153

Welcome message from author
This document is posted to help you gain knowledge. Please leave a comment to let me know what you think about it! Share it to your friends and learn new things together.
Transcript
Mutation Scanning Using MUT-MAP, a High-Throughput,Microfluidic Chip-Based, Multi-Analyte PanelRajesh Patel1*, Alison Tsan2, Rachel Tam1, Rupal Desai1, Nancy Schoenbrunner2, Thomas W. Myers3,
Keith Bauer3, Edward Smith3, Rajiv Raja1
1 Oncology Biomarker Development, Genentech Inc., South San Francisco, California, United States of America, 2 Chemistry and Innovation Technology, Pleasanton,
California, United States of America, 3 Program in Core Research Roche Molecular Systems Inc., Pleasanton, California, United States of America
Abstract
Targeted anticancer therapies rely on the identification of patient subgroups most likely to respond to treatment. Predictivebiomarkers play a key role in patient selection, while diagnostic and prognostic biomarkers expand our understanding oftumor biology, suggest treatment combinations, and facilitate discovery of novel drug targets. We have developed a high-throughput microfluidics method for mutation detection (MUT-MAP, mutation multi-analyte panel) based on TaqMan orallele-specific PCR (AS-PCR) assays. We analyzed a set of 71 mutations across six genes of therapeutic interest. The six-genemutation panel was designed to detect the most common mutations in the EGFR, KRAS, PIK3CA, NRAS, BRAF, and AKT1oncogenes. The DNA was preamplified using custom-designed primer sets before the TaqMan/AS-PCR assays were carriedout using the Biomark microfluidics system (Fluidigm; South San Francisco, CA). A cross-reactivity analysis enabled thegeneration of a robust automated mutation-calling algorithm which was then validated in a series of 51 cell lines and 33FFPE clinical samples. All detected mutations were confirmed by other means. Sample input titrations confirmed the assaysensitivity with as little as 2 ng gDNA, and demonstrated excellent inter- and intra-chip reproducibility. Parallel analysis of 92clinical trial samples was carried out using 2–100 ng genomic DNA (gDNA), allowing the simultaneous detection of multiplemutations. DNA prepared from both fresh frozen and formalin-fixed, paraffin-embedded (FFPE) samples were used, and theanalysis was routinely completed in 2–3 days: traditional assays require 0.5–1 mg high-quality DNA, and take significantlylonger to analyze. This assay can detect a wide range of mutations in therapeutically relevant genes from very smallamounts of sample DNA. As such, the mutation assay developed is a valuable tool for high-throughput biomarker discoveryand validation in personalized medicine and cancer drug development.
Citation: Patel R, Tsan A, Tam R, Desai R, Schoenbrunner N, et al. (2012) Mutation Scanning Using MUT-MAP, a High-Throughput, Microfluidic Chip-Based, Multi-Analyte Panel. PLoS ONE 7(12): e51153. doi:10.1371/journal.pone.0051153
Editor: Todd W. Miller, Dartmouth, United States of America
Received August 22, 2012; Accepted October 17, 2012; Published December 17, 2012
Copyright: � 2012 Patel et al. This is an open-access article distributed under the terms of the Creative Commons Attribution License, which permitsunrestricted use, distribution, and reproduction in any medium, provided the original author and source are credited.
Funding: This study was funded by Genentech Inc. The funders were responsible for the study design, data collection and analysis, decision to publish, andpreparation of the manuscript.
Competing Interests: The authors have the following interests: All studies were funded by Genentech, Inc. Support for third-party writing assistance forthis manuscript was provided by Genentech, Inc. Rajesh Patel, Rachel Tam, Rupal Desai and Rajiv Raja are or were employed by Genentech and Alison Tsan,Nancy Schoenbrunner Thomas W. Myers, Keith Bauer and Edward Smith are or were employed by Roche Molecular Systems Inc. There are no patents,products in development or marketed products to declare. This does not alter the authors’ adherence to all the PLOS ONE policies on sharing data andmaterials.
* E-mail: [email protected]
Introduction
Biomarkers have assumed a central role in oncology, enabling
the detection, characterization, and targeted treatment of a range
of cancer types [1]. The successful application of targeted
anticancer therapies depends on the detection of disease subtypes
that are most likely to respond to treatment. As such, the detection
and validation of tumor biomarkers is critical for the ongoing
development of personalized healthcare, both through the support
of effective and robust drug trials, and the effective employment of
targeted therapies in the clinic [2].
Biomarkers are classified according to their utility: diagnostic
biomarkers are indicators of biological status that allow classifica-
tion of tumors according to their genetic and/or phenotypic
characteristics. Predictive biomarkers allow the response to a
particular line of treatment to be anticipated, based on the known
mode of action of the chosen therapy and an understanding of the
underlying tumor biology. Prognostic biomarkers enable the
prediction of disease progression in the absence of treatment,
and have been used to identify signaling pathways that are
potential drivers of disease, and putative drug targets [3].
Although techniques such as tissue microarray immunohisto-
chemistry (IHC) and reverse-transcription polymerase chain
reaction (RT-PCR) allow high-throughput screening of protein
and mRNA biomarkers in clinical samples [4], significant
challenges remain. Biomarker levels vary across human popula-
tions, and significant heterogeneity may be observed within single
cancer types, even within samples from a single tumor [5,6]. This
is exacerbated by the possibility that first-line chemotherapy may
induce DNA damage in tumor cells, leading to changes in
biomarker status; as biopsy samples are often obtained before first-
line treatment, this may be an obstacle to the correct selection of
subsequent targeted therapies, although the extent of this effect
remains unclear [6].
While some anticancer therapeutics are entering the clinic with
companion diagnostic tests, a wider characterization of tumor
gene expression and mutation status will enable targeted therapies
PLOS ONE | www.plosone.org 1 December 2012 | Volume 7 | Issue 12 | e51153
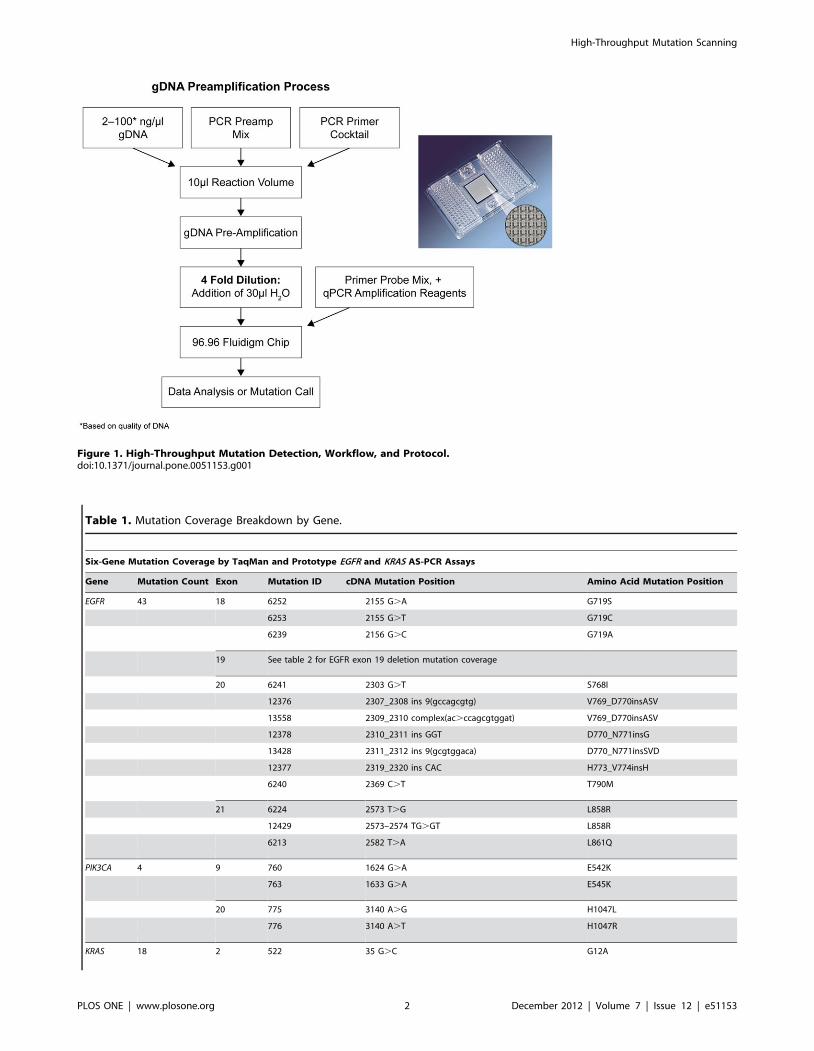
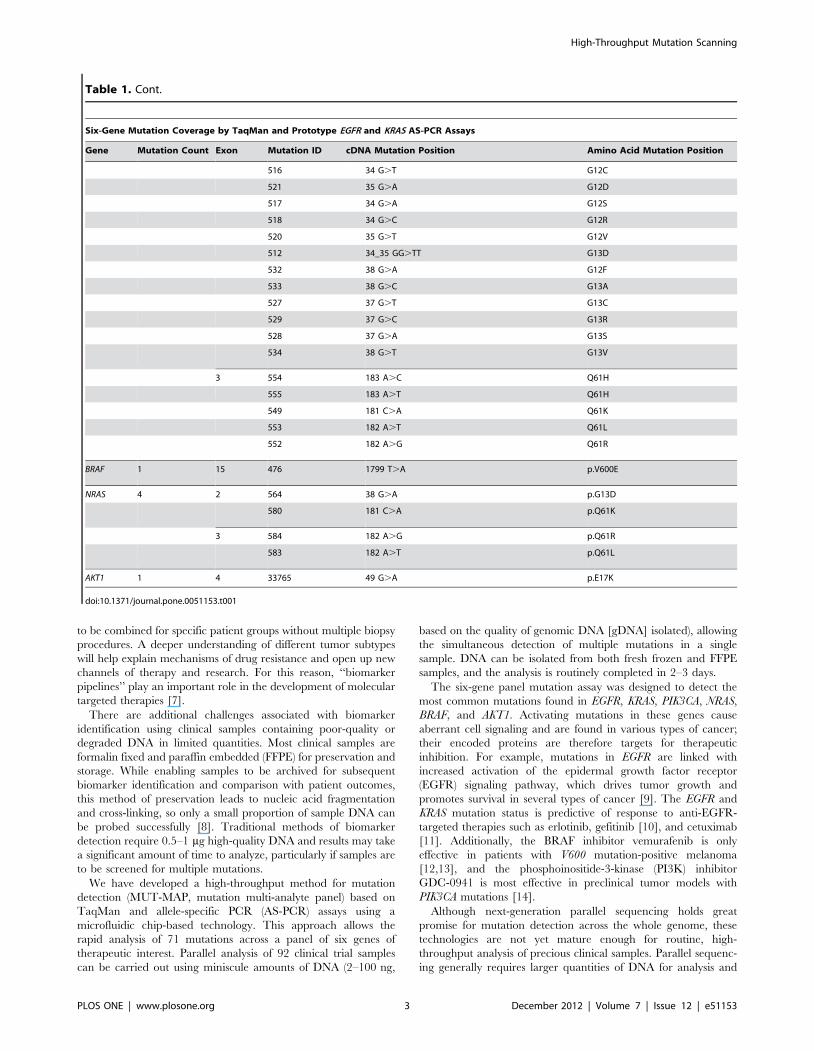
Table 1. Mutation Coverage Breakdown by Gene.
Six-Gene Mutation Coverage by TaqMan and Prototype EGFR and KRAS AS-PCR Assays
Gene Mutation Count Exon Mutation ID cDNA Mutation Position Amino Acid Mutation Position
EGFR 43 18 6252 2155 G.A G719S
6253 2155 G.T G719C
6239 2156 G.C G719A
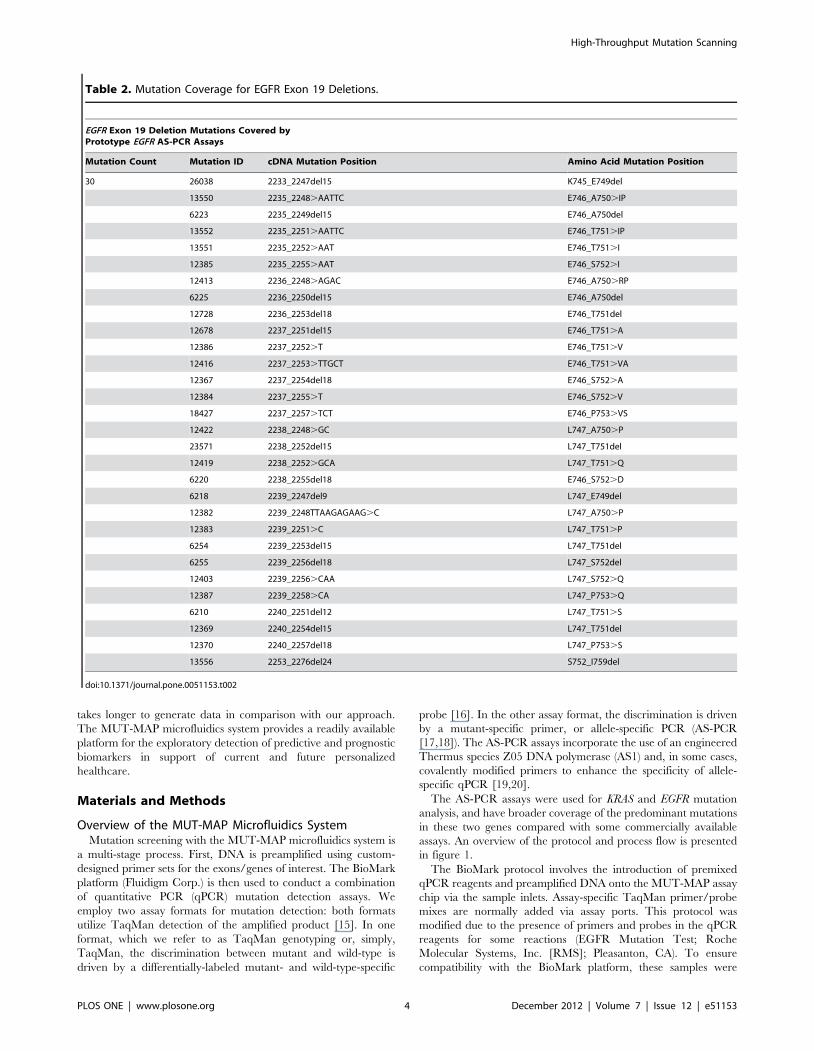
19 See table 2 for EGFR exon 19 deletion mutation coverage
20 6241 2303 G.T S768I
12376 2307_2308 ins 9(gccagcgtg) V769_D770insASV
13558 2309_2310 complex(ac.ccagcgtggat) V769_D770insASV
12378 2310_2311 ins GGT D770_N771insG
13428 2311_2312 ins 9(gcgtggaca) D770_N771insSVD
12377 2319_2320 ins CAC H773_V774insH
6240 2369 C.T T790M
21 6224 2573 T.G L858R
12429 2573–2574 TG.GT L858R
6213 2582 T.A L861Q
PIK3CA 4 9 760 1624 G.A E542K
763 1633 G.A E545K
20 775 3140 A.G H1047L
776 3140 A.T H1047R
KRAS 18 2 522 35 G.C G12A
Figure 1. High-Throughput Mutation Detection, Workflow, and Protocol.doi:10.1371/journal.pone.0051153.g001
High-Throughput Mutation Scanning
PLOS ONE | www.plosone.org 2 December 2012 | Volume 7 | Issue 12 | e51153
to be combined for specific patient groups without multiple biopsy
procedures. A deeper understanding of different tumor subtypes
will help explain mechanisms of drug resistance and open up new
channels of therapy and research. For this reason, ‘‘biomarker
pipelines’’ play an important role in the development of molecular
targeted therapies [7].
There are additional challenges associated with biomarker
identification using clinical samples containing poor-quality or
degraded DNA in limited quantities. Most clinical samples are
formalin fixed and paraffin embedded (FFPE) for preservation and
storage. While enabling samples to be archived for subsequent
biomarker identification and comparison with patient outcomes,
this method of preservation leads to nucleic acid fragmentation
and cross-linking, so only a small proportion of sample DNA can
be probed successfully [8]. Traditional methods of biomarker
detection require 0.5–1 mg high-quality DNA and results may take
a significant amount of time to analyze, particularly if samples are
to be screened for multiple mutations.
We have developed a high-throughput method for mutation
detection (MUT-MAP, mutation multi-analyte panel) based on
TaqMan and allele-specific PCR (AS-PCR) assays using a
microfluidic chip-based technology. This approach allows the
rapid analysis of 71 mutations across a panel of six genes of
therapeutic interest. Parallel analysis of 92 clinical trial samples
can be carried out using miniscule amounts of DNA (2–100 ng,
based on the quality of genomic DNA [gDNA] isolated), allowing
the simultaneous detection of multiple mutations in a single
sample. DNA can be isolated from both fresh frozen and FFPE
samples, and the analysis is routinely completed in 2–3 days.
The six-gene panel mutation assay was designed to detect the
most common mutations found in EGFR, KRAS, PIK3CA, NRAS,
BRAF, and AKT1. Activating mutations in these genes cause
aberrant cell signaling and are found in various types of cancer;
their encoded proteins are therefore targets for therapeutic
inhibition. For example, mutations in EGFR are linked with
increased activation of the epidermal growth factor receptor
(EGFR) signaling pathway, which drives tumor growth and
promotes survival in several types of cancer [9]. The EGFR and
KRAS mutation status is predictive of response to anti-EGFR-
targeted therapies such as erlotinib, gefitinib [10], and cetuximab
[11]. Additionally, the BRAF inhibitor vemurafenib is only
effective in patients with V600 mutation-positive melanoma
[12,13], and the phosphoinositide-3-kinase (PI3K) inhibitor
GDC-0941 is most effective in preclinical tumor models with
PIK3CA mutations [14].
Although next-generation parallel sequencing holds great
promise for mutation detection across the whole genome, these
technologies are not yet mature enough for routine, high-
throughput analysis of precious clinical samples. Parallel sequenc-
ing generally requires larger quantities of DNA for analysis and
Table 1. Cont.
Six-Gene Mutation Coverage by TaqMan and Prototype EGFR and KRAS AS-PCR Assays
Gene Mutation Count Exon Mutation ID cDNA Mutation Position Amino Acid Mutation Position
516 34 G.T G12C
521 35 G.A G12D
517 34 G.A G12S
518 34 G.C G12R
520 35 G.T G12V
512 34_35 GG.TT G13D
532 38 G.A G12F
533 38 G.C G13A
527 37 G.T G13C
529 37 G.C G13R
528 37 G.A G13S
534 38 G.T G13V
3 554 183 A.C Q61H
555 183 A.T Q61H
549 181 C.A Q61K
553 182 A.T Q61L
552 182 A.G Q61R
BRAF 1 15 476 1799 T.A p.V600E
NRAS 4 2 564 38 G.A p.G13D
580 181 C.A p.Q61K
3 584 182 A.G p.Q61R
583 182 A.T p.Q61L
AKT1 1 4 33765 49 G.A p.E17K
doi:10.1371/journal.pone.0051153.t001
High-Throughput Mutation Scanning
PLOS ONE | www.plosone.org 3 December 2012 | Volume 7 | Issue 12 | e51153
takes longer to generate data in comparison with our approach.
The MUT-MAP microfluidics system provides a readily available
platform for the exploratory detection of predictive and prognostic
biomarkers in support of current and future personalized
healthcare.
Materials and Methods
Overview of the MUT-MAP Microfluidics SystemMutation screening with the MUT-MAP microfluidics system is
a multi-stage process. First, DNA is preamplified using custom-
designed primer sets for the exons/genes of interest. The BioMark
platform (Fluidigm Corp.) is then used to conduct a combination
of quantitative PCR (qPCR) mutation detection assays. We
employ two assay formats for mutation detection: both formats
utilize TaqMan detection of the amplified product [15]. In one
format, which we refer to as TaqMan genotyping or, simply,
TaqMan, the discrimination between mutant and wild-type is
driven by a differentially-labeled mutant- and wild-type-specific
probe [16]. In the other assay format, the discrimination is driven
by a mutant-specific primer, or allele-specific PCR (AS-PCR
[17,18]). The AS-PCR assays incorporate the use of an engineered
Thermus species Z05 DNA polymerase (AS1) and, in some cases,
covalently modified primers to enhance the specificity of allele-
specific qPCR [19,20].
The AS-PCR assays were used for KRAS and EGFR mutation
analysis, and have broader coverage of the predominant mutations
in these two genes compared with some commercially available
assays. An overview of the protocol and process flow is presented
in figure 1.
The BioMark protocol involves the introduction of premixed
qPCR reagents and preamplified DNA onto the MUT-MAP assay
chip via the sample inlets. Assay-specific TaqMan primer/probe
mixes are normally added via assay ports. This protocol was
modified due to the presence of primers and probes in the qPCR
reagents for some reactions (EGFR Mutation Test; Roche
Molecular Systems, Inc. [RMS]; Pleasanton, CA). To ensure
compatibility with the BioMark platform, these samples were
Table 2. Mutation Coverage for EGFR Exon 19 Deletions.
EGFR Exon 19 Deletion Mutations Covered byPrototype EGFR AS-PCR Assays
Mutation Count Mutation ID cDNA Mutation Position Amino Acid Mutation Position
30 26038 2233_2247del15 K745_E749del
13550 2235_2248.AATTC E746_A750.IP
6223 2235_2249del15 E746_A750del
13552 2235_2251.AATTC E746_T751.IP
13551 2235_2252.AAT E746_T751.I
12385 2235_2255.AAT E746_S752.I
12413 2236_2248.AGAC E746_A750.RP
6225 2236_2250del15 E746_A750del
12728 2236_2253del18 E746_T751del
12678 2237_2251del15 E746_T751.A
12386 2237_2252.T E746_T751.V
12416 2237_2253.TTGCT E746_T751.VA
12367 2237_2254del18 E746_S752.A
12384 2237_2255.T E746_S752.V
18427 2237_2257.TCT E746_P753.VS
12422 2238_2248.GC L747_A750.P
23571 2238_2252del15 L747_T751del
12419 2238_2252.GCA L747_T751.Q
6220 2238_2255del18 E746_S752.D
6218 2239_2247del9 L747_E749del
12382 2239_2248TTAAGAGAAG.C L747_A750.P
12383 2239_2251.C L747_T751.P
6254 2239_2253del15 L747_T751del
6255 2239_2256del18 L747_S752del
12403 2239_2256.CAA L747_S752.Q
12387 2239_2258.CA L747_P753.Q
6210 2240_2251del12 L747_T751.S
12369 2240_2254del15 L747_T751del
12370 2240_2257del18 L747_P753.S
13556 2253_2276del24 S752_I759del
doi:10.1371/journal.pone.0051153.t002
High-Throughput Mutation Scanning
PLOS ONE | www.plosone.org 4 December 2012 | Volume 7 | Issue 12 | e51153
introduced via the assay inlets, and both TaqMan and AS-PCR
assay reagents were added via the sample inlets on the microfluidic
chip. Data analysis was also modified to accommodate these
changes.
DNA PreamplificationDNA was preamplified in 10 ml reactions on a 96-well plate
using a preamplification primer cocktail (Table S1) in the
presence of 1x ABI PreAmp Master Mix (Applied Biosystems;
Foster City, CA). gDNA (2–10 ng) was isolated from cell lines
and fresh frozen samples. However,due to the poor quality of
DNA obtained from FFPE clinical samples, 50–100 ng was used
for preamplification from this source. Primer concentrations
were 100 nM during the amplification reaction. Each pream-
plification sample set included a gDNA control to determine
preamplification performance as well as a no-template control.
An additional positive control was made in bulk by preampli-
fication of a cocktail of relevant mutant plasmids for all six
genes; this control was run on every chip.
Samples were preamplified using a Tetrad Thermal Cycler
(BioRad; Hercules, CA) according to the following protocol:
95uC for 10 minutes, then thermal cycling (20 cycles, each of
15 seconds at 95uC followed by 2 minutes at 60uC). Samples
were diluted fourfold, mixed, centrifuged at 3500 rpm (5810 R;
Eppendorf; Hauppauge, NY), and stored at 4uC or –20uC until
further processing. Following preamplification, rigorous proce-
dures were followed to prevent sample contamination, including
the use of dedicated workspaces and pipettes for pre- and post-
PCR reaction set-up, laminar flow hoods, and personal
protective equipment.
Preparation of ReagentsPrimer/probe concentrations of 900/200 nM were used in the
TaqMan reactions to detect mutations in the PIK3CA, BRAF,
NRAS, and AKT genes. Custom AS-PCR assays (Roche Molecular
Systems) were used to detect mutations in KRAS and EGFR genes
along with custom wild-type assays for both genes. A complete
description of primers and probes for the TaqMan reactions is
presented in table S2.
A commercially available EGFR Mutation Test (Roche
Molecular Systems) was modified to achieve compatibility with
the two-color BioMark readout (FAM and VIC) for detection of
mutations in EGFR. Hexachlorofluorescein (HEX)-labeled probes
were spiked into kit mastermixes to detect S768I and T790M in
the VIC channel. Additionally, a custom fourth tube was designed
to separately detect exon 20 insertion mutations using MMX3
from the RMS EGFR Mutation Test. The KRAS allele-specific
assays utilized a research kit from Roche Molecular Systems.
Both TaqMan and AS-PCR assays were carried out using the
AS1 qPCR master mix. Rox dye (final concentration 55 nM) for
signal normalization and 20x gel electrophoresis sample loading
buffer (Fluidigm Corp.) were added to the qPCR reactions.
Assays along with AS1 qPCR master mix were run in duplicate
by loading 5 ml into each well of the primed 96.96 Fluidigm Chip.
The diluted preamplified DNA samples were mixed with equal
volumes of 2x DNA assay loading buffer (Fluidigm Corp.). The
samples were run by loading 5 ml into each well on the chip. The
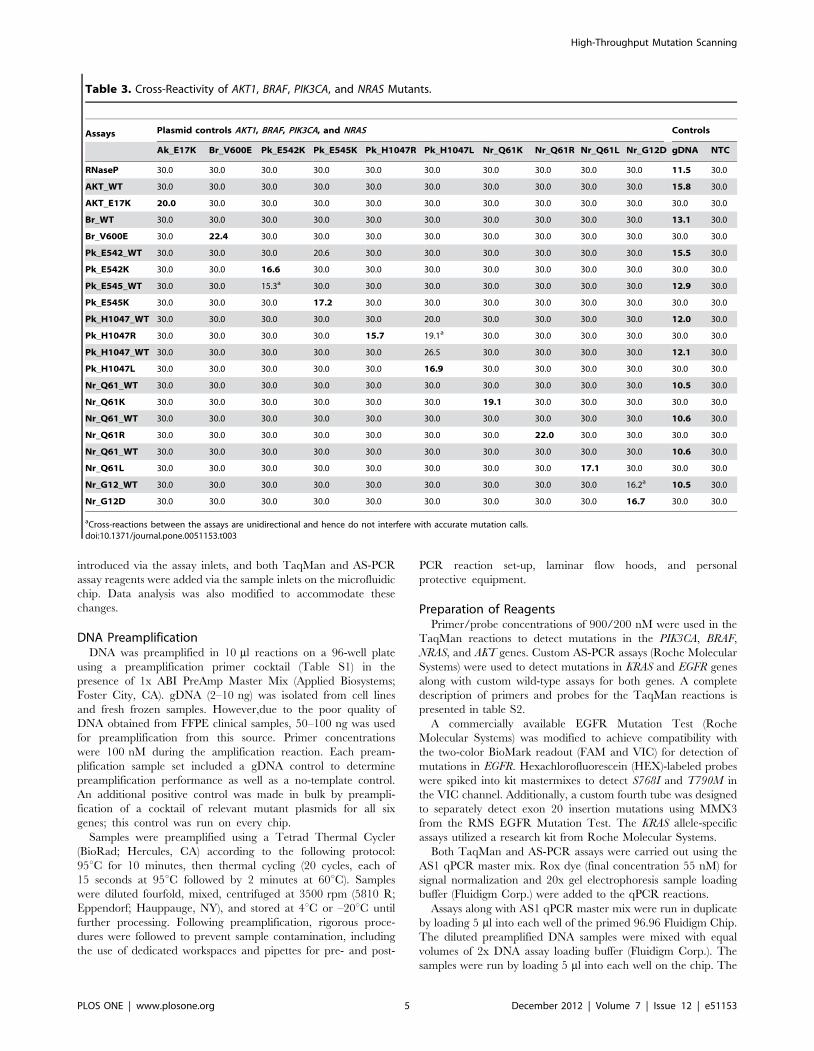
Table 3. Cross-Reactivity of AKT1, BRAF, PIK3CA, and NRAS Mutants.
Assays Plasmid controls AKT1, BRAF, PIK3CA, and NRAS Controls
Ak_E17K Br_V600E Pk_E542K Pk_E545K Pk_H1047R Pk_H1047L Nr_Q61K Nr_Q61R Nr_Q61L Nr_G12D gDNA NTC
RNaseP 30.0 30.0 30.0 30.0 30.0 30.0 30.0 30.0 30.0 30.0 11.5 30.0
AKT_WT 30.0 30.0 30.0 30.0 30.0 30.0 30.0 30.0 30.0 30.0 15.8 30.0
AKT_E17K 20.0 30.0 30.0 30.0 30.0 30.0 30.0 30.0 30.0 30.0 30.0 30.0
Br_WT 30.0 30.0 30.0 30.0 30.0 30.0 30.0 30.0 30.0 30.0 13.1 30.0
Br_V600E 30.0 22.4 30.0 30.0 30.0 30.0 30.0 30.0 30.0 30.0 30.0 30.0
Pk_E542_WT 30.0 30.0 30.0 20.6 30.0 30.0 30.0 30.0 30.0 30.0 15.5 30.0
Pk_E542K 30.0 30.0 16.6 30.0 30.0 30.0 30.0 30.0 30.0 30.0 30.0 30.0
Pk_E545_WT 30.0 30.0 15.3a 30.0 30.0 30.0 30.0 30.0 30.0 30.0 12.9 30.0
Pk_E545K 30.0 30.0 30.0 17.2 30.0 30.0 30.0 30.0 30.0 30.0 30.0 30.0
Pk_H1047_WT 30.0 30.0 30.0 30.0 30.0 20.0 30.0 30.0 30.0 30.0 12.0 30.0
Pk_H1047R 30.0 30.0 30.0 30.0 15.7 19.1a 30.0 30.0 30.0 30.0 30.0 30.0
Pk_H1047_WT 30.0 30.0 30.0 30.0 30.0 26.5 30.0 30.0 30.0 30.0 12.1 30.0
Pk_H1047L 30.0 30.0 30.0 30.0 30.0 16.9 30.0 30.0 30.0 30.0 30.0 30.0
Nr_Q61_WT 30.0 30.0 30.0 30.0 30.0 30.0 30.0 30.0 30.0 30.0 10.5 30.0
Nr_Q61K 30.0 30.0 30.0 30.0 30.0 30.0 19.1 30.0 30.0 30.0 30.0 30.0
Nr_Q61_WT 30.0 30.0 30.0 30.0 30.0 30.0 30.0 30.0 30.0 30.0 10.6 30.0
Nr_Q61R 30.0 30.0 30.0 30.0 30.0 30.0 30.0 22.0 30.0 30.0 30.0 30.0
Nr_Q61_WT 30.0 30.0 30.0 30.0 30.0 30.0 30.0 30.0 30.0 30.0 10.6 30.0
Nr_Q61L 30.0 30.0 30.0 30.0 30.0 30.0 30.0 30.0 17.1 30.0 30.0 30.0
Nr_G12_WT 30.0 30.0 30.0 30.0 30.0 30.0 30.0 30.0 30.0 16.2a 10.5 30.0
Nr_G12D 30.0 30.0 30.0 30.0 30.0 30.0 30.0 30.0 30.0 16.7 30.0 30.0
aCross-reactions between the assays are unidirectional and hence do not interfere with accurate mutation calls.doi:10.1371/journal.pone.0051153.t003
High-Throughput Mutation Scanning
PLOS ONE | www.plosone.org 5 December 2012 | Volume 7 | Issue 12 | e51153
Ta
ble
4.
Cro
ss-R
eac
tivi
tyo
fK
RA
SM
uta
nts
.
Ass
ay
sP
lasm
idC
on
tro
lsK
RA
SC
on
tro
ls
Kr_
G1
2S
Kr_
G1
2C
Kr_
G1
2R
Kr_
G1
2D
Kr_
G1
2V
Kr_
G1
2A
Kr
G1
2F
Kr_
G1
3S
Kr_
G1
3C
Kr_
G1
3R
Kr_
G1
3D
Kr_
G1
3V
Kr_
G1
3A
Kr_
Q6
1K
Kr_
Q6
1L
Kr_
Q6
1R
Kr_
Q6
1H
cK
r_Q
61
Ht
gD
NA
NT
C
Kr_
cntr
l1
2.1
12
.21
2.1
12
.01
2.1
12
.41
3.1
12
.51
2.6
12
.01
3.3
11
.61
2.3
12
.91
2.4
12
.61
3.0
12
.91
0.4
30
.0
Kr_
G1
2S
14
.32
4.8
28
.02
8.3
26
.62
5.7
30
.02
5.8
27
.72
6.1
26
.42
5.7
25
.82
4.2
24
.62
4.7
26
.72
7.3
23
.93
0.0
Kr_
G1
2C
24
.91
4.6
24
.22
9.4
27
.92
9.1
17
.6a
26
.92
8.9
27
.93
0.0
30
.02
9.6
26
.42
8.7
28
.92
8.5
30
.02
5.6
30
.0
Kr_
G1
2R
28
.72
4.2
14
.22
9.8
30
.02
8.2
30
.03
0.0
28
.92
6.0
30
.02
8.2
30
.02
8.4
30
.02
9.4
29
.02
8.3
28
.53
0.0
Kr_
G1
2D
27
.62
8.5
23
.81
3.6
24
.82
8.1
30
.02
5.2
25
.22
4.5
25
.32
4.9
25
.72
5.0
24
.82
5.0
25
.92
7.4
22
.93
0.0
Kr_
G1
2V
18
.22
3.4
25
.81
3.7
a1
3.8
22
.72
0.3
24
.22
4.3
24
.82
3.5
23
.92
2.9
22
.62
3.3
23
.12
3.8
23
.42
1.0
30
.0
Kr_
G1
2A
27
.42
6.2
21
.82
5.0
22
.81
4.1
30
.02
8.6
30
.02
4.8
27
.12
8.7
26
.92
8.6
28
.42
7.6
28
.12
9.6
25
.33
0.0
Kr_
G1
2F
30
.02
3.4
30
.03
0.0
20
.02
9.3
13
.13
0.0
30
.03
0.0
30
.03
0.0
30
.02
8.3
30
.02
9.3
30
.03
0.0
29
.83
0.0
Kr_
G1
3S
15
.8a
22
.92
2.1
24
.52
2.1
25
.02
6.4
13
.32
3.8
24
.72
4.0
22
.72
2.9
23
.32
3.0
22
.82
4.4
24
.22
1.4
30
.0
Kr_
G1
3C
17
.32
4.8
24
.72
2.4
13
.0a
22
.02
4.1
23
.81
3.3
22
.42
3.9
23
.72
3.7
22
.72
2.4
23
.02
3.1
23
.12
0.5
30
.0
Kr_
G1
3R
24
.92
6.6
29
.92
7.7
23
.32
8.0
29
.82
5.9
22
.61
3.3
28
.01
6.9
26
.53
0.0
28
.63
0.0
28
.53
0.0
26
.53
0.0
Kr_
G1
3D
29
.42
9.0
28
.21
9.9
23
.72
3.9
30
.03
0.0
29
.12
9.9
15
.02
5.4
28
.12
2.8
22
.82
3.3
23
.72
3.6
21
.43
0.0
Kr_
G1
3V
25
.52
0.5
26
.01
8.5
25
.82
6.8
28
.02
9.3
24
.83
0.0
24
.31
2.9
20
.22
6.2
25
.92
5.0
26
.72
6.1
23
.93
0.0
Kr_
G1
3A
23
.62
2.1
23
.41
7.0
20
.22
0.5
24
.72
1.6
13
.9a
20
.02
6.7
21
.71
2.9
21
.52
1.3
21
.42
2.0
21
.91
9.5
30
.0
Kr_
Q6
1K
26
.72
7.8
27
.42
6.6
27
.32
6.5
27
.92
5.5
27
.52
5.0
29
.12
5.2
25
.81
5.9
30
.03
0.0
30
.03
0.0
25
.33
0.0
Kr_
Q6
1L
28
.22
8.9
27
.32
6.3
28
.02
8.4
28
.32
6.8
27
.92
7.1
29
.92
6.4
27
.42
8.7
16
.52
8.6
30
.02
9.8
25
.43
0.0
Kr_
Q6
1R
26
.42
6.8
26
.82
7.0
27
.22
7.4
26
.42
5.3
27
.32
5.1
28
.32
4.6
25
.32
8.5
23
.61
5.4
27
.82
7.0
24
.23
0.0
Kr_
Q6
1H
c3
0.0
30
.02
9.5
29
.63
0.0
30
.02
9.6
29
.73
0.0
29
.33
0.0
29
.33
0.0
30
.03
0.0
26
.61
7.1
26
.62
7.5
30
.0
Kr_
Q6
1H
t2
8.0
27
.42
9.2
27
.12
7.0
29
.52
8.0
26
.22
8.4
25
.42
9.6
25
.62
5.9
26
.82
8.4
26
.52
8.8
16
.02
4.8
30
.0
aC
ross
-re
acti
on
sb
etw
ee
nth
eas
says
are
un
idir
ect
ion
alan
dh
en
ced
on
ot
inte
rfe
rew
ith
accu
rate
mu
tati
on
calls
.d
oi:1
0.1
37
1/j
ou
rnal
.po
ne
.00
51
15
3.t
00
4
High-Throughput Mutation Scanning
PLOS ONE | www.plosone.org 6 December 2012 | Volume 7 | Issue 12 | e51153
chip was then placed in the integrated fluidic circuit controller and
loaded before analysis with the BioMark reader. The following
thermal cycling protocol was used: 50uC (2 minutes), 70uC (30
minutes), 25uC (10 min), 50uC (2 minutes), and 95uC (4 minutes).
This was followed by 40 cycles of 95uC (10 seconds) and 61uC (30
seconds). The initial cycle [50uC (2 minutes), 70uC (30 minutes),
25uC (10 minutes)] is part of the protocol recommended by
Fluidigm for the 96.96 chip to ensure sufficient mixing of the
reagents.
Data were analyzed and cycle threshold (CT) values were
determined using BioMark real-time PCR analysis software
(Fluidigm Corp.), and automated mutation calling was carried
out using an algorithm based on the change in CT (DCT) values
between wild-type and mutant or between control and mutant, for
TaqMan and AS-PCR assays, respectively.
Six-Gene Mutation PanelThe use of MUT-MAP in this study allowed the screening of 71
mutations across the EGFR, KRAS, PIK3CA, NRAS, BRAF, and
AKT1 genes. The mutation coverage of this panel is presented in
tables 1 and 2. Validation of mutations detected in clinical samples
was performed using commercial mutation detection assays
(Qiagen DxS assays for PIK3CA, KRAS, and EGFR mutations),
and in-house developed and validated TaqMan assays (for BRAF,
NRAS, and AKT1).
Results
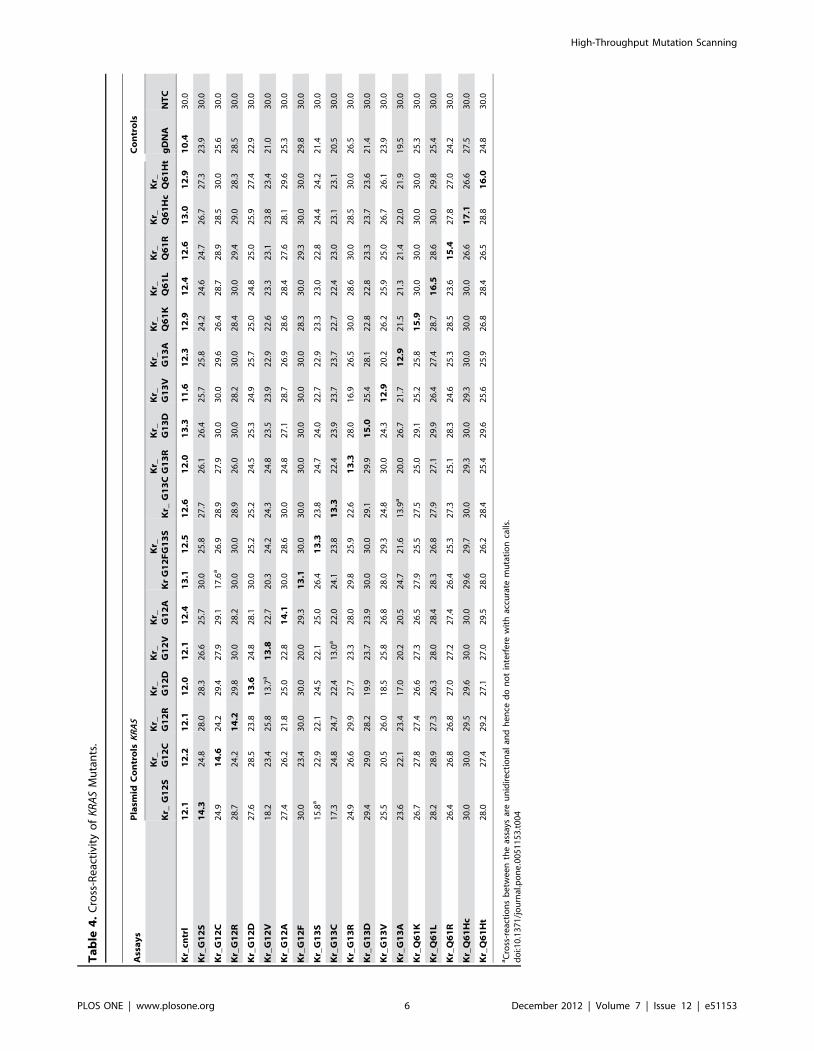
Plasmid ValidationA series of validation experiments was carried out to confirm the
reproducibility and accuracy of the microfluidic assay panel. In
order to validate the discrimination of closely related sequences by
the mutation screening panel, a complete cross-reactivity analysis
was conducted by screening every mutant plasmid target against
every mutant-specific assay. The CT values were generated by the
BioMark real-time PCR analysis software (Fluidigm Corp.) and
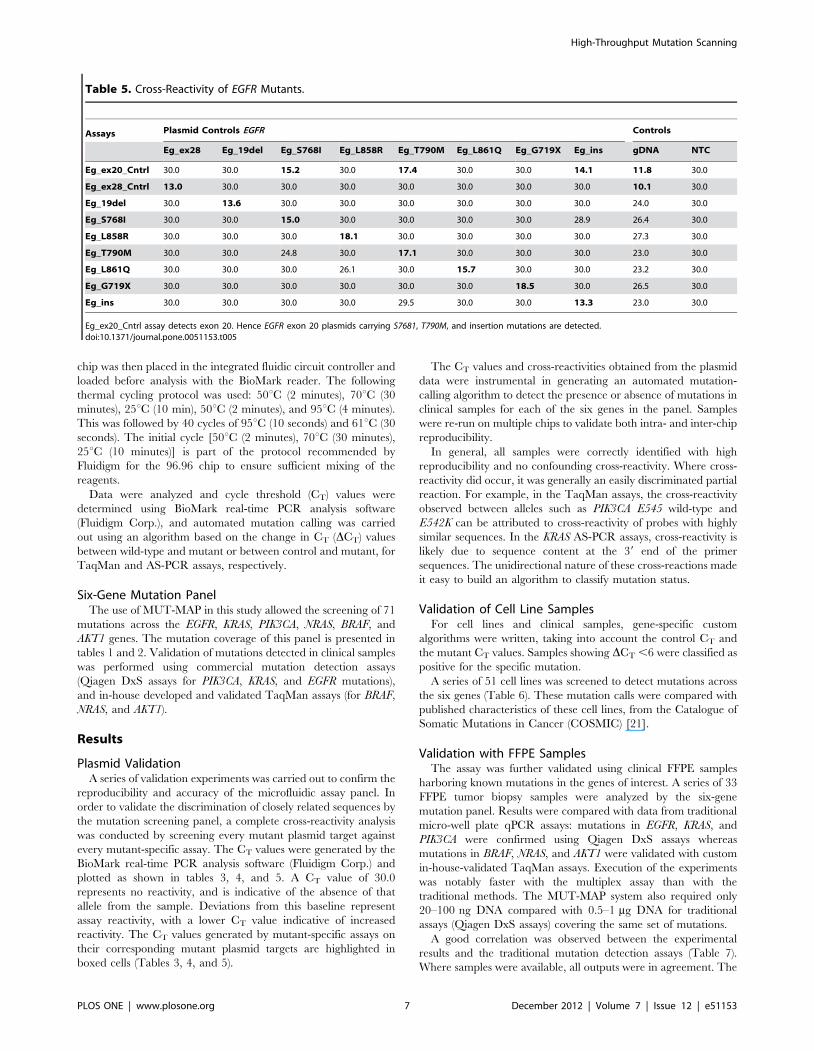
plotted as shown in tables 3, 4, and 5. A CT value of 30.0
represents no reactivity, and is indicative of the absence of that
allele from the sample. Deviations from this baseline represent
assay reactivity, with a lower CT value indicative of increased
reactivity. The CT values generated by mutant-specific assays on
their corresponding mutant plasmid targets are highlighted in
boxed cells (Tables 3, 4, and 5).
The CT values and cross-reactivities obtained from the plasmid
data were instrumental in generating an automated mutation-
calling algorithm to detect the presence or absence of mutations in
clinical samples for each of the six genes in the panel. Samples
were re-run on multiple chips to validate both intra- and inter-chip
reproducibility.
In general, all samples were correctly identified with high
reproducibility and no confounding cross-reactivity. Where cross-
reactivity did occur, it was generally an easily discriminated partial
reaction. For example, in the TaqMan assays, the cross-reactivity
observed between alleles such as PIK3CA E545 wild-type and
E542K can be attributed to cross-reactivity of probes with highly
similar sequences. In the KRAS AS-PCR assays, cross-reactivity is
likely due to sequence content at the 39 end of the primer
sequences. The unidirectional nature of these cross-reactions made
it easy to build an algorithm to classify mutation status.
Validation of Cell Line SamplesFor cell lines and clinical samples, gene-specific custom
algorithms were written, taking into account the control CT and
the mutant CT values. Samples showing DCT ,6 were classified as
positive for the specific mutation.
A series of 51 cell lines was screened to detect mutations across
the six genes (Table 6). These mutation calls were compared with
published characteristics of these cell lines, from the Catalogue of
Somatic Mutations in Cancer (COSMIC) [21].
Validation with FFPE SamplesThe assay was further validated using clinical FFPE samples
harboring known mutations in the genes of interest. A series of 33
FFPE tumor biopsy samples were analyzed by the six-gene
mutation panel. Results were compared with data from traditional
micro-well plate qPCR assays: mutations in EGFR, KRAS, and
PIK3CA were confirmed using Qiagen DxS assays whereas
mutations in BRAF, NRAS, and AKT1 were validated with custom
in-house-validated TaqMan assays. Execution of the experiments
was notably faster with the multiplex assay than with the
traditional methods. The MUT-MAP system also required only
20–100 ng DNA compared with 0.5–1 mg DNA for traditional
assays (Qiagen DxS assays) covering the same set of mutations.
A good correlation was observed between the experimental
results and the traditional mutation detection assays (Table 7).
Where samples were available, all outputs were in agreement. The
Table 5. Cross-Reactivity of EGFR Mutants.
Assays Plasmid Controls EGFR Controls
Eg_ex28 Eg_19del Eg_S768I Eg_L858R Eg_T790M Eg_L861Q Eg_G719X Eg_ins gDNA NTC
Eg_ex20_Cntrl 30.0 30.0 15.2 30.0 17.4 30.0 30.0 14.1 11.8 30.0
Eg_ex28_Cntrl 13.0 30.0 30.0 30.0 30.0 30.0 30.0 30.0 10.1 30.0
Eg_19del 30.0 13.6 30.0 30.0 30.0 30.0 30.0 30.0 24.0 30.0
Eg_S768I 30.0 30.0 15.0 30.0 30.0 30.0 30.0 28.9 26.4 30.0
Eg_L858R 30.0 30.0 30.0 18.1 30.0 30.0 30.0 30.0 27.3 30.0
Eg_T790M 30.0 30.0 24.8 30.0 17.1 30.0 30.0 30.0 23.0 30.0
Eg_L861Q 30.0 30.0 30.0 26.1 30.0 15.7 30.0 30.0 23.2 30.0
Eg_G719X 30.0 30.0 30.0 30.0 30.0 30.0 18.5 30.0 26.5 30.0
Eg_ins 30.0 30.0 30.0 30.0 29.5 30.0 30.0 13.3 23.0 30.0
Eg_ex20_Cntrl assay detects exon 20. Hence EGFR exon 20 plasmids carrying S7681, T790M, and insertion mutations are detected.doi:10.1371/journal.pone.0051153.t005
High-Throughput Mutation Scanning
PLOS ONE | www.plosone.org 7 December 2012 | Volume 7 | Issue 12 | e51153
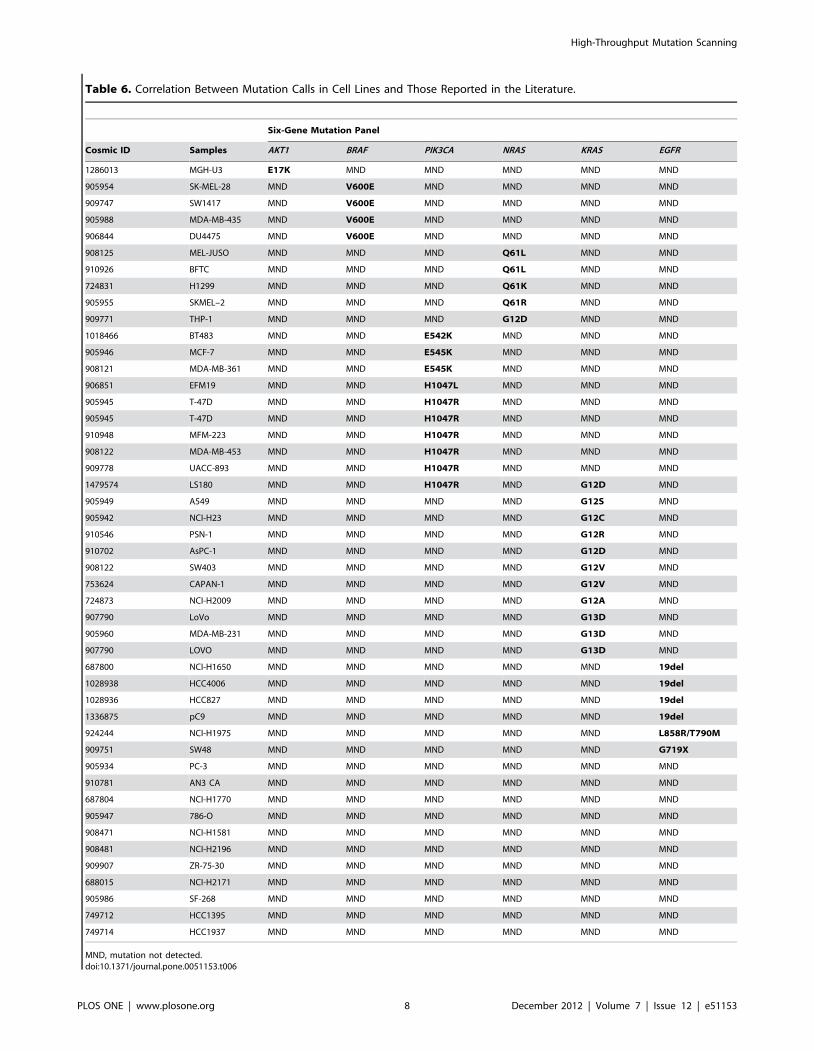
Table 6. Correlation Between Mutation Calls in Cell Lines and Those Reported in the Literature.
Six-Gene Mutation Panel
Cosmic ID Samples AKT1 BRAF PIK3CA NRAS KRAS EGFR
1286013 MGH-U3 E17K MND MND MND MND MND
905954 SK-MEL-28 MND V600E MND MND MND MND
909747 SW1417 MND V600E MND MND MND MND
905988 MDA-MB-435 MND V600E MND MND MND MND
906844 DU4475 MND V600E MND MND MND MND
908125 MEL-JUSO MND MND MND Q61L MND MND
910926 BFTC MND MND MND Q61L MND MND
724831 H1299 MND MND MND Q61K MND MND
905955 SKMEL–2 MND MND MND Q61R MND MND
909771 THP-1 MND MND MND G12D MND MND
1018466 BT483 MND MND E542K MND MND MND
905946 MCF-7 MND MND E545K MND MND MND
908121 MDA-MB-361 MND MND E545K MND MND MND
906851 EFM19 MND MND H1047L MND MND MND
905945 T-47D MND MND H1047R MND MND MND
905945 T-47D MND MND H1047R MND MND MND
910948 MFM-223 MND MND H1047R MND MND MND
908122 MDA-MB-453 MND MND H1047R MND MND MND
909778 UACC-893 MND MND H1047R MND MND MND
1479574 LS180 MND MND H1047R MND G12D MND
905949 A549 MND MND MND MND G12S MND
905942 NCI-H23 MND MND MND MND G12C MND
910546 PSN-1 MND MND MND MND G12R MND
910702 AsPC-1 MND MND MND MND G12D MND
908122 SW403 MND MND MND MND G12V MND
753624 CAPAN-1 MND MND MND MND G12V MND
724873 NCI-H2009 MND MND MND MND G12A MND
907790 LoVo MND MND MND MND G13D MND
905960 MDA-MB-231 MND MND MND MND G13D MND
907790 LOVO MND MND MND MND G13D MND
687800 NCI-H1650 MND MND MND MND MND 19del
1028938 HCC4006 MND MND MND MND MND 19del
1028936 HCC827 MND MND MND MND MND 19del
1336875 pC9 MND MND MND MND MND 19del
924244 NCI-H1975 MND MND MND MND MND L858R/T790M
909751 SW48 MND MND MND MND MND G719X
905934 PC-3 MND MND MND MND MND MND
910781 AN3 CA MND MND MND MND MND MND
687804 NCI-H1770 MND MND MND MND MND MND
905947 786-O MND MND MND MND MND MND
908471 NCI-H1581 MND MND MND MND MND MND
908481 NCI-H2196 MND MND MND MND MND MND
909907 ZR-75-30 MND MND MND MND MND MND
688015 NCI-H2171 MND MND MND MND MND MND
905986 SF-268 MND MND MND MND MND MND
749712 HCC1395 MND MND MND MND MND MND
749714 HCC1937 MND MND MND MND MND MND
MND, mutation not detected.doi:10.1371/journal.pone.0051153.t006
High-Throughput Mutation Scanning
PLOS ONE | www.plosone.org 8 December 2012 | Volume 7 | Issue 12 | e51153
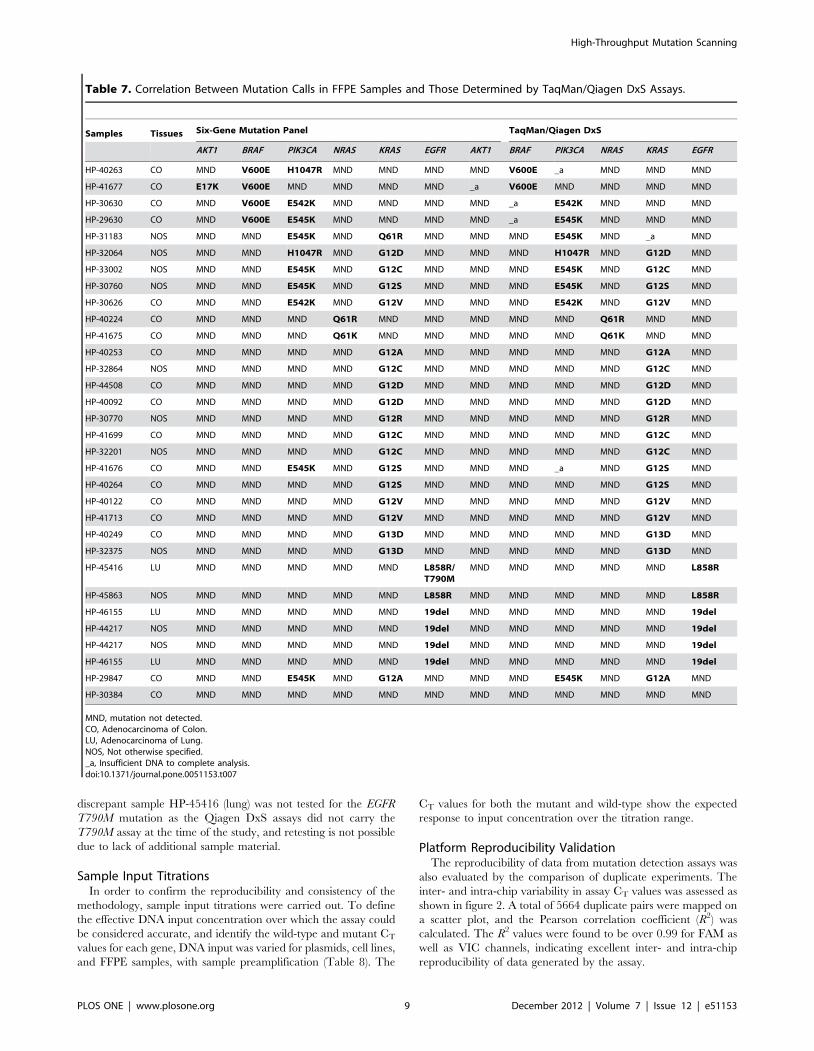
discrepant sample HP-45416 (lung) was not tested for the EGFR
T790M mutation as the Qiagen DxS assays did not carry the
T790M assay at the time of the study, and retesting is not possible
due to lack of additional sample material.
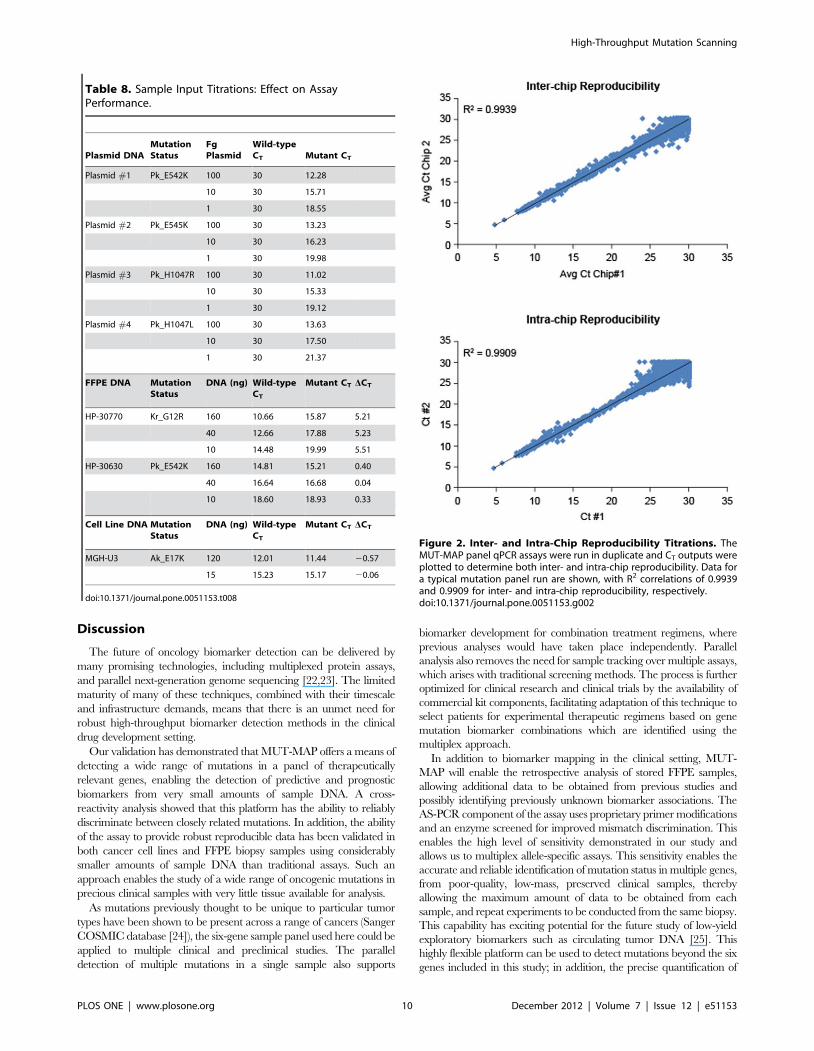
Sample Input TitrationsIn order to confirm the reproducibility and consistency of the
methodology, sample input titrations were carried out. To define
the effective DNA input concentration over which the assay could
be considered accurate, and identify the wild-type and mutant CT
values for each gene, DNA input was varied for plasmids, cell lines,
and FFPE samples, with sample preamplification (Table 8). The
CT values for both the mutant and wild-type show the expected
response to input concentration over the titration range.
Platform Reproducibility ValidationThe reproducibility of data from mutation detection assays was
also evaluated by the comparison of duplicate experiments. The
inter- and intra-chip variability in assay CT values was assessed as
shown in figure 2. A total of 5664 duplicate pairs were mapped on
a scatter plot, and the Pearson correlation coefficient (R2) was
calculated. The R2 values were found to be over 0.99 for FAM as
well as VIC channels, indicating excellent inter- and intra-chip
reproducibility of data generated by the assay.
Table 7. Correlation Between Mutation Calls in FFPE Samples and Those Determined by TaqMan/Qiagen DxS Assays.
Samples Tissues Six-Gene Mutation Panel TaqMan/Qiagen DxS
AKT1 BRAF PIK3CA NRAS KRAS EGFR AKT1 BRAF PIK3CA NRAS KRAS EGFR
HP-40263 CO MND V600E H1047R MND MND MND MND V600E _a MND MND MND
HP-41677 CO E17K V600E MND MND MND MND _a V600E MND MND MND MND
HP-30630 CO MND V600E E542K MND MND MND MND _a E542K MND MND MND
HP-29630 CO MND V600E E545K MND MND MND MND _a E545K MND MND MND
HP-31183 NOS MND MND E545K MND Q61R MND MND MND E545K MND _a MND
HP-32064 NOS MND MND H1047R MND G12D MND MND MND H1047R MND G12D MND
HP-33002 NOS MND MND E545K MND G12C MND MND MND E545K MND G12C MND
HP-30760 NOS MND MND E545K MND G12S MND MND MND E545K MND G12S MND
HP-30626 CO MND MND E542K MND G12V MND MND MND E542K MND G12V MND
HP-40224 CO MND MND MND Q61R MND MND MND MND MND Q61R MND MND
HP-41675 CO MND MND MND Q61K MND MND MND MND MND Q61K MND MND
HP-40253 CO MND MND MND MND G12A MND MND MND MND MND G12A MND
HP-32864 NOS MND MND MND MND G12C MND MND MND MND MND G12C MND
HP-44508 CO MND MND MND MND G12D MND MND MND MND MND G12D MND
HP-40092 CO MND MND MND MND G12D MND MND MND MND MND G12D MND
HP-30770 NOS MND MND MND MND G12R MND MND MND MND MND G12R MND
HP-41699 CO MND MND MND MND G12C MND MND MND MND MND G12C MND
HP-32201 NOS MND MND MND MND G12C MND MND MND MND MND G12C MND
HP-41676 CO MND MND E545K MND G12S MND MND MND _a MND G12S MND
HP-40264 CO MND MND MND MND G12S MND MND MND MND MND G12S MND
HP-40122 CO MND MND MND MND G12V MND MND MND MND MND G12V MND
HP-41713 CO MND MND MND MND G12V MND MND MND MND MND G12V MND
HP-40249 CO MND MND MND MND G13D MND MND MND MND MND G13D MND
HP-32375 NOS MND MND MND MND G13D MND MND MND MND MND G13D MND
HP-45416 LU MND MND MND MND MND L858R/T790M
MND MND MND MND MND L858R
HP-45863 NOS MND MND MND MND MND L858R MND MND MND MND MND L858R
HP-46155 LU MND MND MND MND MND 19del MND MND MND MND MND 19del
HP-44217 NOS MND MND MND MND MND 19del MND MND MND MND MND 19del
HP-44217 NOS MND MND MND MND MND 19del MND MND MND MND MND 19del
HP-46155 LU MND MND MND MND MND 19del MND MND MND MND MND 19del
HP-29847 CO MND MND E545K MND G12A MND MND MND E545K MND G12A MND
HP-30384 CO MND MND MND MND MND MND MND MND MND MND MND MND
MND, mutation not detected.CO, Adenocarcinoma of Colon.LU, Adenocarcinoma of Lung.NOS, Not otherwise specified._a, Insufficient DNA to complete analysis.doi:10.1371/journal.pone.0051153.t007
High-Throughput Mutation Scanning
PLOS ONE | www.plosone.org 9 December 2012 | Volume 7 | Issue 12 | e51153
Discussion
The future of oncology biomarker detection can be delivered by
many promising technologies, including multiplexed protein assays,
and parallel next-generation genome sequencing [22,23]. The limited
maturity of many of these techniques, combined with their timescale
and infrastructure demands, means that there is an unmet need for
robust high-throughput biomarker detection methods in the clinical
drug development setting.
Our validation has demonstrated that MUT-MAP offers a means of
detecting a wide range of mutations in a panel of therapeutically
relevant genes, enabling the detection of predictive and prognostic
biomarkers from very small amounts of sample DNA. A cross-
reactivity analysis showed that this platform has the ability to reliably
discriminate between closely related mutations. In addition, the ability
of the assay to provide robust reproducible data has been validated in
both cancer cell lines and FFPE biopsy samples using considerably
smaller amounts of sample DNA than traditional assays. Such an
approach enables the study of a wide range of oncogenic mutations in
precious clinical samples with very little tissue available for analysis.
As mutations previously thought to be unique to particular tumor
types have been shown to be present across a range of cancers (Sanger
COSMIC database [24]), the six-gene sample panel used here could be
applied to multiple clinical and preclinical studies. The parallel
detection of multiple mutations in a single sample also supports
biomarker development for combination treatment regimens, where
previous analyses would have taken place independently. Parallel
analysis also removes the need for sample tracking over multiple assays,
which arises with traditional screening methods. The process is further
optimized for clinical research and clinical trials by the availability of
commercial kit components, facilitating adaptation of this technique to
select patients for experimental therapeutic regimens based on gene
mutation biomarker combinations which are identified using the
multiplex approach.
In addition to biomarker mapping in the clinical setting, MUT-
MAP will enable the retrospective analysis of stored FFPE samples,
allowing additional data to be obtained from previous studies and
possibly identifying previously unknown biomarker associations. The
AS-PCR component of the assay uses proprietary primer modifications
and an enzyme screened for improved mismatch discrimination. This
enables the high level of sensitivity demonstrated in our study and
allows us to multiplex allele-specific assays. This sensitivity enables the
accurate and reliable identification of mutation status in multiple genes,
from poor-quality, low-mass, preserved clinical samples, thereby
allowing the maximum amount of data to be obtained from each
sample, and repeat experiments to be conducted from the same biopsy.
This capability has exciting potential for the future study of low-yield
exploratory biomarkers such as circulating tumor DNA [25]. This
highly flexible platform can be used to detect mutations beyond the six
genes included in this study; in addition, the precise quantification of
Table 8. Sample Input Titrations: Effect on AssayPerformance.
Plasmid DNAMutationStatus
FgPlasmid
Wild-typeCT Mutant CT
Plasmid #1 Pk_E542K 100 30 12.28
10 30 15.71
1 30 18.55
Plasmid #2 Pk_E545K 100 30 13.23
10 30 16.23
1 30 19.98
Plasmid #3 Pk_H1047R 100 30 11.02
10 30 15.33
1 30 19.12
Plasmid #4 Pk_H1047L 100 30 13.63
10 30 17.50
1 30 21.37
FFPE DNA MutationStatus
DNA (ng) Wild-typeCT
Mutant CT DCT
HP-30770 Kr_G12R 160 10.66 15.87 5.21
40 12.66 17.88 5.23
10 14.48 19.99 5.51
HP-30630 Pk_E542K 160 14.81 15.21 0.40
40 16.64 16.68 0.04
10 18.60 18.93 0.33
Cell Line DNA MutationStatus
DNA (ng) Wild-typeCT
Mutant CT DCT
MGH-U3 Ak_E17K 120 12.01 11.44 20.57
15 15.23 15.17 20.06
doi:10.1371/journal.pone.0051153.t008
Figure 2. Inter- and Intra-Chip Reproducibility Titrations. TheMUT-MAP panel qPCR assays were run in duplicate and CT outputs wereplotted to determine both inter- and intra-chip reproducibility. Data fora typical mutation panel run are shown, with R2 correlations of 0.9939and 0.9909 for inter- and intra-chip reproducibility, respectively.doi:10.1371/journal.pone.0051153.g002
High-Throughput Mutation Scanning
PLOS ONE | www.plosone.org 10 December 2012 | Volume 7 | Issue 12 | e51153
each amplicon opens up the possibility of being able to detect copy
number variations. Most significantly, however, the MUT-MAP assay
can form the basis for the development of a platform to support
efficient biomarker discovery and validation in support of detection and
personalized healthcare.
Supporting Information
Table S1 Preamplification Primer Sequences.(DOCX)
Table S2 TaqMan and Mutation Detection Assays.
(DOCX)
Author Contributions
Conceived and designed the experiments: RP. Performed the experiments:
RP RD RT. Analyzed the data: RP. Contributed reagents/materials/
analysis tools: RP AT RT RD NS TWM KB ES RR. Wrote the paper: RP
AT RT RD NS TWM KB ES RR.
References
1. Wistuba II, Gelovani JG, Jacoby JJ, Davis SE, Herbst RS (2011) Methodological
and practical challenges for personalized cancer therapies. Nat Rev Clin Oncol8: 135–141.
2. Sawyers CL (2008) The cancer biomarker problem. Nature 452: 548–552.
3. ODwyer D, Ralton LD, O’Shea A, Murray GI (2011) The proteomics ofcolorectal cancer: identification of a protein signature associated with prognosis.
PLoS ONE 6: e27718.4. Denkert C, Sinn BV, Issa Y, Maria MB, Maisch A, et al. (2011) Prediction of
response to neoadjuvant chemotherapy: New biomarker approaches and
concepts. Breast Care (Basel) 6: 265–272.5. Prat A, Ellis MJ, Perou CM (2011) Practical implications of gene-expression-
based assays for breast oncologists. Nat Rev Clin Oncol 9: 48–57.6. Jakobsen JN,Sorensen JB (2011) Intratumor heterogeneity and chemotherapy-
induced changes in EGFR status in non-small cell lung cancer. CancerChemother Pharmacol 68: 1–15.
7. Weberpals JI, Koti M, Squire JA (2011) Targeting genetic and epigenetic
alterations in the treatment of serous ovarian cancer. Cancer Genet 204: 525–535.
8. Mittempergher L, de Ronde JJ, Nieuwland M, Kerkhoven RM, Simon I, et al.(2011) Gene expression profiles from formalin fixed paraffin embedded breast
cancer tissue are largely comparable to fresh frozen matched tissue. PLoS ONE
6: e17163.9. Kuan CT, Wikstrand CJ, Bigner DD (2001) EGF mutant receptor vIII as a
molecular target in cancer therapy. Endocr Relat Cancer 8: 83–96.10. Lynch TJ Jr, Bell DW, Sordella R, Gurubhagavatula S, Okimoto RA, et al.
(2004) Activating mutations in the epidermal growth factor receptor underlyingresponsiveness of non-small-cell lung cancer to gefitinib. N Engl J Med 350:
2129–2139.
11. Lievre A, Bachet JB, Le Corre D, Boige V, Landi B, et al. (2006) KRAS mutationstatus is predictive of response to cetuximab therapy in colorectal cancer. Cancer
Res 66: 3992–3995.12. Hatzivassiliou G, Song K, Yen I, Brandhuber BJ, Anderson DJ, et al. (2010)
RAF inhibitors prime wild-type RAF to activate the MAPK pathway and
enhance growth. Nature 464: 431–435.13. Bollag G, Hirth P, Tsai J, Zhang J, Ibrahim PN, et al. (2010) Clinical efficacy of
a RAF inhibitor needs broad target blockade in BRAF-mutant melanoma.Nature 467: 596–599.
14. OBrien C, Wallin JJ, Sampath D, GuhaThakurta D, Savage H, et al. (2010)Predictive biomarkers of sensitivity to the phosphatidylinositol 39 kinase inhibitor
GDC-0941 in breast cancer preclinical models. Clin Cancer Res 16: 3670–3683.
15. Holland PM, Abramson RD, Watson R, Gelfand DH (1991) Detection of
specific polymerase chain reaction product by utilizing the 59–-39 exonuclease
activity of Thermus aquaticus DNA polymerase. Proc Natl Acad Sci U S A 88:
7276–7280.
16. Shi MM, Myrand SP, Bleavins MR, de la Iglesia FA (2001) Genotyping for
Functionally Important Human CYP2D6*4 (B) Mutation Using TaqMan
Probes. Methods Mol Med 49: 459–472.
17. Newton CR, Graham A, Heptinstall LE, Powell SJ, Summers C, et al. (1989)
Analysis of any point mutation in DNA. The amplification refractory mutation
system (ARMS). Nucleic Acids Res 17: 2503–2516.
18. Okayama H, Curiel DT, Brantly ML, Holmes MD, Crystal RG (1989) Rapid,
nonradioactive detection of mutations in the human genome by allele-specific
amplification. J Lab Clin Med 114: 105–113.
19. Will SG, Tsan A, Newton N (2011) ‘‘Allele-Specific Amplification,’’ U.S. Patent
2010/0099110A1. Available: http://patft.uspto.gov/. Accessed: 2012 Jul 7.
20. Reichert F, Bauer K, Myers TW, Schoenbrunner NJ, San Filippo J (2012)
‘‘DNA polymerases with increased 39-mismatch discrimination,’’ U.S. Patent
2011/0312041A1; Reichert F, Bauer K, Myers TW, ‘‘DNA polymerases with
increased 39-mismatch discrimination,’’ U.S. Patents US 2011–0318785 A1,
US-2012–0015405 A1, US-2012–0009628 A1, US 2011–0312037 A1, US
2011–0312039 A1, US 2011–0312038 A1, US 2011–0318786 A1. Available:
http://patft.uspto.gov/. Accessed: 2012 Jul 7.
21. Forbes SA, Bhamra G, Bamford S, Dawson E, Kok C, et al. (2008) The
Catalogue of Somatic Mutations in Cancer (COSMIC). Curr Protoc Hum
Genet Chapter 10: Unit 11.
22. Mani V, Chikkaveeraiah BV, Rusling JF (2011) Magnetic particles in
ultrasensitive biomarker protein measurements for cancer detection and
monitoring. Expert Opin Med Diagn 5: 381–391.
23. Cronin M, Ross JS (2011) Comprehensive next-generation cancer genome
sequencing in the era of targeted therapy and personalized oncology. Biomark
Med 5: 293–305.
24. Forbes SA, Bindal N, Bamford S, Cole C, Kok CY, et al. (2011) COSMIC:
mining complete cancer genomes in the Catalogue of Somatic Mutations in
Cancer. Nucleic Acids Res 39: D945–D950.
25. Sozzi G, Conte D, Mariani L, Lo VS, Roz L, et al. (2001) Analysis of circulating
tumor DNA in plasma at diagnosis and during follow-up of lung cancer patients.
Cancer Res 61: 4675–4678.
High-Throughput Mutation Scanning
PLOS ONE | www.plosone.org 11 December 2012 | Volume 7 | Issue 12 | e51153
Related Documents