This article appeared in a journal published by Elsevier. The attached copy is furnished to the author for internal non-commercial research and education use, including for instruction at the authors institution and sharing with colleagues. Other uses, including reproduction and distribution, or selling or licensing copies, or posting to personal, institutional or third party websites are prohibited. In most cases authors are permitted to post their version of the article (e.g. in Word or Tex form) to their personal website or institutional repository. Authors requiring further information regarding Elsevier’s archiving and manuscript policies are encouraged to visit: http://www.elsevier.com/authorsrights

Welcome message from author
This document is posted to help you gain knowledge. Please leave a comment to let me know what you think about it! Share it to your friends and learn new things together.
Transcript

This article appeared in a journal published by Elsevier. The attachedcopy is furnished to the author for internal non-commercial researchand education use, including for instruction at the authors institution
and sharing with colleagues.
Other uses, including reproduction and distribution, or selling orlicensing copies, or posting to personal, institutional or third party
websites are prohibited.
In most cases authors are permitted to post their version of thearticle (e.g. in Word or Tex form) to their personal website orinstitutional repository. Authors requiring further information
regarding Elsevier’s archiving and manuscript policies areencouraged to visit:
http://www.elsevier.com/authorsrights

Author's personal copy
Mussel watch update: Long-term trends in selected contaminants fromcoastal California, 1977–2010
Aroon R. Melwani a,⇑, Dominic Gregorio b, Yujie Jin b, Mark Stephenson c, Gary Ichikawa c, Emily Siegel b,Dave Crane d, Gunnar Lauenstein e,1, Jay A. Davis a
a San Francisco Estuary Institute, 4911 Central Ave., Richmond, CA 94804, USAb Division of Water Quality, State Water Resources Control Board, P.O. Box 100, Sacramento, CA 95812, USAc Marine Pollution Studies Laboratory, Department of Fish and Game, 7544 Sandholdt Rd., Moss Landing, CA 95039, USAd Water Pollution Control Laboratory, 2005 Nimbus Rd., Rancho Cordova, CA 95670, USAe National Oceanic and Atmospheric Administration, 1305 East West Highway, Silver Spring, MD 20910, USA
a r t i c l e i n f o
Keywords:BivalvesMusselsTrendsBioaccumulationContaminantsCalifornia
a b s t r a c t
This study examined trends in contaminants measured during three decades of ‘‘Mussel Watch’’ monitor-ing on the California coast. Chlorinated organic contaminants and butyltins declined the most rapidly,with tissue concentrations in 2010 that were up to 75% lower than during the 1980s. Silver and leaddeclined at about half of the stations statewide, but generally exhibited slower rates of decline relativeto the organic compounds. In contrast, copper increased at many stations, and PAHs showed little evi-dence for declines. Mussels from San Francisco Bay and the Southern California Bight were historicallythe most contaminated and have had the steepest declines. Overall, these data show that the ‘‘MusselWatch’’ approach to monitoring contaminants in California has provided some of the best evidence ofthe effectiveness of actions to improve water quality over the past 30 years. These datasets also highlightchallenges that remain in managing PAHs and copper.
� 2013 Elsevier Ltd. All rights reserved.
1. Introduction
Bivalve molluscs represent one of the most frequently used spa-tial and temporal trend indicators of contaminants in aquatic envi-ronments. Bivalves are important components of coastal habitats,are closely connected to changes in water quality, and reflect bio-accumulation near the base of the food web. Bivalves also offeradvantages as indicator species because of their capacity to retaincertain classes of chemicals. For example, PAHs do not accumulatein fish, but reach easily measurable concentrations in bivalves(Hellou et al., 2000; Mearns et al., 1999; Oros and Ross, 2005).The limited metabolism of most toxic compounds in bivalves(Walker and Livingstone, 1992) also makes them excellent moni-toring tools for emerging contaminants.
Bivalves have been used as indicators of contaminants through-out the United States and around the world (Hunt and Slone, 2010;Lauenstein and Daskalakis, 1998; O’Connor and Lauenstein, 2006;Ramu et al., 2007; Roach and Runcie, 1998; Stephenson and Leon-ard, 1994; Stephenson et al., 1995). Resident and transplantedmussels have been used to assess patterns in bioaccumulation inCalifornia waters for over four decades, including some of the
earliest work conducted anywhere using the ‘‘Mussel Watch’’approach (Butler, 1973; Graham, 1972; Mearns et al., 1991;Wyland, 1975).
California initiated its statewide mussel watch program in 1977to provide an indication of spatial and inter-annual trends in toxiccontaminants, principally heavy metals, synthetic organic com-pounds, and pesticides (Martin, 1985). The California State MusselWatch (CSMW) conducted annual monitoring of contaminants inresident and transplanted mussels until 2003. The CSMW yieldeda wealth of useful information, including demonstration of rapidimprovements in water quality resulting from bans on PCBs andseveral organochlorine pesticides, reductions in metals due to airpollution regulation and wastewater treatment, and bans on tribu-tyltin hull coatings (Davis et al., 2006; Stephenson et al., 1995; Tet-ra Tech, 2008). However, the CSMW has been mostly discontinueddue to a lack of funding. Since 2003, 20 sites have been monitoredwith limited funding resulting from an enforcement actionsettlement.
The most extensive mussel watch program in California has beenthe National Mussel Watch (NMW), part of the National Oceanic andAtmospheric Administration (NOAA) National Status and TrendsMonitoring Program. The program began in 1986 and is one of thelongest running, continuous coastal monitoring programs in theworld. The NMW was designed to monitor the status and trends ofchemical contamination of U.S. coastal waters (Lauenstein and
0025-326X/$ - see front matter � 2013 Elsevier Ltd. All rights reserved.http://dx.doi.org/10.1016/j.marpolbul.2013.04.025
⇑ Corresponding author. Current address: Department of Biological Sciences,Macquarie University, NSW 2109, Australia. Tel.: +61 405674958.
E-mail address: [email protected] (A.R. Melwani).1 Retired.
Marine Pollution Bulletin 81 (2014) 291–302
Contents lists available at SciVerse ScienceDirect
Marine Pollution Bulletin
journal homepage: www.elsevier .com/locate /marpolbul

Author's personal copy
Daskalakis, 1998). The NMW initially performed chemical analysisof resident oysters and mussels that spanned 145 stations. Thisnumber has steadily grown to 300 currently monitored stationsthroughout the United States. In California, 40 stations were sam-pled between 1986 and 2005, with consistent sampling performedat 35 sites. Sampling was conducted annually in the early years ofthe program, but was reduced to a biennial frequency in 1994. Notethat the majority of NMW sites are in different locations than thoseof CSMW.
The CSMW and NMW have together yielded one of the longestrunning time series on statewide bioaccumulation patterns. Theobjectives of this paper are to describe spatial and temporal trendsin mussel bioaccumulation using CSMW and NMW data in Califor-nia. Long-term trends were examined in 10 contaminants at morethan 50 stations along the California coastline.
2. Methods
2.1. California State Mussel Watch
Twenty-four CSMW stations along the California coastline havebeen consistently monitored for approximately 120 individualcontaminants in the California mussel, Mytilus californianus(Fig. 1 and Table 1a). Stations sampled for ten years or more wereincluded in our analyses. Applying this criterion, 10 stations werelocated north of Point Conception (northern California) and 14 sta-tions were located in southern California. Resident mussels weresampled at about one-third of the stations, and transplanted mus-sels collected from relatively clean locations were deployed andanalyzed at the other stations. CSMW transplant methods followprotocols described by Gunther et al. (1999).
Forty-five resident or transplanted (45-day deployment) mus-sels were analyzed per site. Sample collection and analytical tech-niques varied somewhat over time, and have been describedpreviously in Stephenson et al. (1995). Procedures employed in1992 have been consistent since that time.
Quality Assurance (QA) has been conducted by CSMW since theprogram began in 1977, including standard reference materialsand method blanks. Inter-calibration exercises between CSMWand NMW were conducted in 1988 with mussels from the Gulfof Farallones and Channel Islands, and good agreement betweenlabs was observed (Martin and Stephenson, 1990a, b). From 1986to 1998, CSMW participated in inter-calibration with the NationalResearch Council of Canada. Since 1996, CSMW has also partici-pated in NOAA’s inter-calibration program. Excellent agreementwas achieved each year for the metals and organics included in thispaper.
2.2. Regional Monitoring Program
The Regional Monitoring Program for Water Quality in the SanFrancisco Estuary (RMP) was initiated in 1993 and has extendedthe CSMW time series in San Francisco Bay. The RMP began mon-itoring 11 stations using transplanted mussels, oysters, and clamsto cover the range of salinities found in the Estuary (SFEI, 1994).In each sampling year, approximately 300 individual contaminantswere assessed. From 1994 to 2003, the number of stations fluctu-ated between 11 and 15 stations, based on design modifications(SFEI, 2010). The frequency of bivalve sampling was reduced fromannual to biennial in 2006 (Melwani et al., 2008). Of the original 11bivalve sampling stations in the RMP, six are historic CSMW siteswhere the long-term time series initiated by CSMW are still beingextended (Gunther et al., 1999; SFEI, 2005). Three of these stations(Emeryville, Dumbarton Bridge, and San Mateo Bridge) also coin-cide with long term NMW monitoring stations in San Francisco
Bay. Although detection of trends may be obscured to some extentby the use of different analytical laboratories and methods, the sixCSMW/RMP stations represent the best dataset available on bioac-cumulation trends in San Francisco Bay over the past 30 years(Fig. 1 and Table 1b). All CSMW/RMP stations were assessed bytransplanting mussels from relatively clean locations to targetedstations for deployment and subsequent chemical analysis(Gunther et al., 1999). All RMP data included QA/QC samples thatmet the data quality objectives specified in the RMP’s QualityAssurance Project Plan (Davis et al., 2001).
2.3. National Mussel Watch
Since 1986, the National Mussel Watch (NMW) has analyzedapproximately 150 contaminants in resident bivalve species fromstations across the United States (Kimbrough et al., 2008; O’Connorand Lauenstein, 2006). From 1986 to 2009, consistent samplingwas performed at 35 sites in California (Fig. 1 and Table 1c), includ-ing seven stations that correspond to protected locations desig-nated as Areas of Special Biological Significance (ASBS) by theState Water Resources Control Board. The majority of the NMWstations in California have results for more than 15 unique years.
Sample collections and analysis have followed NOAA’s StandardOperating Procedure (e.g., Lauenstein and Cantillo, 1998; McDon-ald et al., 2006). M. californianus are collected from the open coastsites, while both M. galloprovinciallis and M. trossulus are collectedin enclosed waters. Analytical protocols and quality assurance fol-low methods approved for the NMW Program (Lauenstein andCantillo, 1998). Since 2007, the California State Water ResourcesControl Board and the Southern California Coastal Water ResearchProject have collaborated with NOAA on expanding the spatial cov-erage and targeted analyte list for the NMW effort in the state.
2.4. Statistical analysis
Data for selected organic compounds (total chlordanes, totalDDTs, dieldrin, and total PCBs) and trace metals (lead, copper, sil-ver, and zinc) measured by both CSMW and NMW were examinedfor temporal trends. Analysis of RMP data focused on DDTs andPCBs only, which have been two contaminants of concern in SanFrancisco Bay. In addition, sufficient NMW data were collectedon total PAHs and total butyltins for evaluation of statewidetrends. Summing of organic contaminants in each dataset followedstandard protocols (SFEI, 2010) and was the same for each dataset,except for PCBs (Table S1). In the case of PCBs, CSMW and RMPdata represent the summation of PCBs as Aroclors, while NMWrepresent sums of PCB congeners. This difference was due toCSMW only using Aroclors during the early years of the Program,while the NMW analyzed congener data.
Temporal trends were assessed using linear regression analysisof concentrations versus year in R Statistical Software (version2.10.0). Concentrations were log-transformed to achieve normallydistributed residuals and equal variances, because mussel bioaccu-mulation monitoring data do not fit a normal distribution. Cen-sored data (below the detection limit) were substituted with zerovalues prior to all statistical analyses. In CSMW and RMP analyses,linear regressions were performed on lipid-normalized organicconcentrations and dry weight metal concentrations. All concen-trations in the NMW dataset were assessed on dry-weight basis.This was due to the use of inconsistent extraction methods todetermine lipid concentrations in historic NMW monitoring. Final-ly, at each location with a declining slope (b), the number of yearsfor concentrations to decline by 50% (i.e., half the initial concentra-tion; HIC) were calculated by HIC = log10(2)/b.
292 A.R. Melwani et al. / Marine Pollution Bulletin 81 (2014) 291–302

Author's personal copy
2.5. Data Presentation
Trends in 10 contaminants from three major mussel watchmonitoring programs in California are summarized in this paper(Table 2). Data from 24 stations monitored by the California StateMussel Watch (CSMW) from 1977 to 2010; six stations that wereoriginally CSMW stations (1980–1992) until the Regional Monitor-ing Program (RMP) took over (1993–2010); and 35 stationsmonitored by NOAA’s National Mussel Watch (1986–2009). DDTs,PCBs, PAHs, butyltins, silver, lead, and copper have been selectedfor detailed interpretation below. The entire dataset and graphicalanalysis for individual stations and contaminants not presentedare available by contacting the authors. In the results summary,two aspects of the concentrations should be noted: (1) organic
contaminant units differ between programs, and when in lipidweight and dry weight are referred to by the notation ‘lw’ and‘dw’, respectively; and (2) concentrations referred to as ‘low’ or‘high’ reflect the rounded value from the 25th or 75th percentileof the data distribution for each contaminant and dataset assessed,respectively.
3. Results
3.1. DDTs
DDTs in mussels have declined at nearly all CSMW stations.Ninety-percent of stations (17 of 19) had statistically significant
Fig. 1. Stations in California sampled across the three major mussel watch monitoring programs evaluated in this paper. Location names are provided in Tables 1a–c.
A.R. Melwani et al. / Marine Pollution Bulletin 81 (2014) 291–302 293

Author's personal copy
declines (Tables 2 and S2), which included eight of the longest run-ning stations (Fig. 2a). The majority of stations showing significantdeclines were located in southern California, where high concen-trations (>9800 ppb lw) predominated during the early 1980s.Thirteen sites in southern California exhibited statistically signifi-cant trends. These stations exhibited a range in Half-Initial-Con-centration (HIC) values of 6 to 13 years, which correspond todeclines of 75% or more over 30 years. The two CSMW stationsnot showing a significant trend over time were located at Sand-holdt Bridge (Moss Landing) and San Diego Bay at Harbor Island.
In San Francisco Bay, DDTs exhibited statistically significant de-clines at all six CSMW/RMP stations (Fig. 2b). Concentrations de-clined from approximately 1000 ppb lw in the early 1980s toabout 200 ppb lw in 2008. HIC ranged from 6 to 11 years, indicat-ing that 2010 concentrations in San Francisco Bay are also 75% low-er or more than those of the 1980s (Table S3).
Fewer significant trends in DDTs were observed at the NMWstations. However, the majority of sites not showing declines hadlow initial concentrations (<20 ppb dw). Note that although thesedata are presented on dry weight, they would still be relativelylow on a lipid basis (see Section 2). DDTs significantly declined at20 of 35 (57%) NMW stations (Tables 2 and S4). Twenty-seven siteshad initial concentrations >20 ppb dw, but only nine of these wereconsidered high concentrations (>170 ppb dw). Many of the sta-tions with significant trends had an HIC that fell within the rangeof 6–12 years, which was remarkably similar to the rates of declinefound at CSMW and RMP stations. One of the steepest decreasingtrends was at Royal Palms on the Palos Verdes Peninsula, a site thatis close to the Montrose Superfund Site, and has also been moni-
tored annually by CSMW. DDTs declined at this site from1061 ppb dw in 1986 to 275 ppb dw in 2008.
3.2. PCBs
PCBs in mussels revealed statistically significant declines atover half of CSMW stations (11 of 18, 61%) (Tables 2 and S2),including six of the longest running stations (Fig. 3a). PCBs in thenorthern part of the state generally exhibited low initial concentra-tions (<300 ppb lw) and a prevalence of ‘‘non-detects’’. The onlyCSMW site in northern California with concentrations that consis-tently exceeded 300 ppb lw was Sandholdt Bridge in Moss Landing,which was also high in DDTs. This location was one of the mostcontaminated sites across the state with regard to PCBs andshowed a slight decline. The majority of stations with high initialconcentrations (>9900 ppb lw) were located in southern California.Of the 14 stations in southern California, 10 showed statisticallysignificant declines. Many of these sites had HIC values that rangedfrom 7 to 12 years, which correspond to declines of 75% or more.However, current concentrations at a few southern locations, suchas Newport Bay at Rhine Channel remain relatively high (med-ian = 17,500 ppb lw).
PCBs exhibited statistically significant declines at all six CSMW/RMP stations. Mussels from San Francisco Bay have shown two dis-tinct temporal patterns in PCBs. For the northern Estuary locations(Pinole Point, Richmond Bridge/Red Rock), concentrations declinedfrom approximately 4000 ppb lw in 1982 to about 1000 ppb lw in2010 (Fig. 3b). For the southern Estuary locations (Treasure Island/Yerba Buena Island, Hunter’s Point/Alameda, Redwood Creek, and
Table 1aCalifornia State Mussel Watch monitoring stations sampled from 1977 to 2010. Stations marked with � are the 10 longest running consistent time series available (all stationswere not sampled in every year). Station numbers correspond to Fig. 1. Geographic locations refer to NC: North Coast; SF = San Francisco; CC: Central Coast; LA: Los Angeles; NB:Newport Beach; and SD: San Diego.
General location Station number Station name Mussel type Total years monitored
NC 1 Crescent City Residents 28NC 2 Trinidad Head� Residents 34NC 3 Mad river Slough Transplants 29NC 4 Samoa Bridge/West Residents 31NC 8 Bodega Head� Residents 34SF 12 San Francisco Bay at Fort Baker Transplants 30SF 19 J. Fitzgerald Residents 34CC 22 Sandholdt Bridge� Transplants 28CC 23 Pacific Grove� Residents 34LA 33 Royal Palms� Residents 34LA 35 LA Harbor at Consolidated Slip� Transplants 29LA 36 LA Harbor at National Steel Transplants 28LA 38 Anaheim Bay at Navy Marsh Transplants 28LA 39 Huntington Harbor at Edinger Street Transplants 28LA 40 Huntington Harbor at Warner Ave� Transplants 28NB 41 Newport Bay at Turning Basin Transplants 28NB 42 Newport Bay at Highway 1 Bridge� Transplants 29NB 43 Newport Bay at Rhine Channel Transplants 28NB 44 Newport Bay at Crows Nest� Transplants 29NB 45 Newport Bay at Bay Island Transplants 29SD 48 Oceanside� Residents 34SD 51 San Diego Bay at Harbor Island Transplants 28SD 52 San Diego Bay at Shelter Island Transplants 31
Table 1bStations sampled in the San Francisco Bay region from 1977 to 1992 by the California State Mussel Watch and from 1993 to 2010 by the Regional Monitoring Program (RMP).Transplanted mussels were collected at all stations. Station numbers correspond to Fig. 1.
General location Station number Station name Total years monitored
SF 10 Pinole Point 30SF 11 Richmond Bridge/Red Rock 31SF 14 Treasure Island/Yerba Buena Island 31SF 15 Hunters Point/Alameda 30SF 17 Redwood Creek 30SF 18 Dumbarton Bridge 30
294 A.R. Melwani et al. / Marine Pollution Bulletin 81 (2014) 291–302

Author's personal copy
Dumbarton Bridge), PCB concentrations were higher, and declinedfrom approximately 6000 ppb lw in 1982 to about 2000 ppb lw in2010. The rates of decline in PCBs were similar to DDTs at the samesites, with HIC values estimated to vary from 6 to 15 years(Table S3).
PCBs have declined at most of the NMW stations, but few sta-tions exhibited statistically significant trends (Tables 2 and S4).Twenty-seven sites had high initial concentrations (>10 ppb dw),and seven of these exhibited statistically significant declines. Threeof the sites with significant declines were in northern California
(Humboldt Bay, San Francisco Bay at San Mateo Bridge and Dum-barton Bridge) and the other five were near Los Angeles and SanDiego. The largest significant downward trend was at MissionBay near San Diego, where PCB concentrations dropped fromapproximately 100 ppb dw in 1988 to about 20 ppb dw in 2008.
3.3. PAHs
Trends in PAH concentrations were inconsistent across thestate. Twenty-three out of 35 sites exhibited increasing concentra-
Table 1cNational Mussel Watch (NMW) monitoring stations located in California sampled from 1986 to 2009. Resident mussels were collected at all stations. Station numbers correspondto Fig. 1. Site abbreviations correspond to NMW naming scheme. General locations refer to NC: North Coast; SF = San Francisco; CC: Central Coast; SCI: Southern CaliforniaIslands; LA: Los Angeles; NB: Newport Beach; and SD: San Diego.
General location Station number Station name Area of biological significancea Total years monitored
NC 1 Crescent Pt. St. George (SGSG) N 25NC 4 Eureka Samoa Bridge (EUSB) N 21NC 5 Humboldt Bay Jetty (HMBJ) N 25NC 6 Pt. Delgado Shelter Cove (PDSC) Y 25NC 7 Pt. Arena Lighthouse (PALH) N 25NC 9 Tomales Bay Spenger’s Residence (TMSR) N 25SF 13 SFB Emeryville (SFEM) N 24SF 16 SFB San Mateo Bridge (SFSM) N 25SF 18 SFB Dumbarton Bridge (SFDB) N 25CC 20 Monterey Bay Pt. Santa Cruz (MBSC) N 25CC 21 Monterey Bay Elkhorn Slough (MBES) N 17CC 22 Monterey Bay Moss Landing (MBML) N 21CC 23 Pacific Grove Lovers Point (PGLP) Y 25CC 24 San Simeon Point (SSSS) N 25CC 25 San Luis Obispo Bay (SLSL) N 25CC 26 Point Conception (PCPC) N 25CC 27 Point Santa Barbara (SBSB) N 25SCI 28 Santa Cruz Island Fraser Pt. (SCFP) Y 25LA 29 Point Dume (PDPD) Y 25LA 30 Santa Monica Bay Las Tunas Beach (TBSM) N 21LA 31 Marina Del Rey South Jetty (MDSJ) N 25LA 32 Redondo Beach Municipal Jetty (RBMJ) N 21LA 33 Royal Palms (PVRP) N 25LA 34 San Pedro Harbor (SPFP) N 25LA 37 Long Beach Breakwater (LBBW) N 21LA 38 Anaheim Bay West Jetty (ABWJ) N 25NB 46 Newport Beach West Jetty (NBWJ) Y 25SCI 47 South Catalina Island Bird Rock (SCBR) Y 25SD 48 Oceanside Municipal Jetty (OSBJ) N 25SD 49 La Jolla (LJLJ) Y 25SD 50 Mission Bay Ventura Bridge (MBVB) N 25SD 51 San Diego Bay Harbor Island (SDHI) N 25SD 53 San Diego Bay Coronado Bridge (SDCB) N 22SD 54 Point Loma Lighthouse (PLLH) N 25SD 55 Imperial Beach North Jetty (IBNJ) N 25
a Designated by California State Water Resources Control Board.
Table 2Summary of trend analysis in California State Mussel Watch (CSMW) and National Mussel Watch (NMW) data, showing number of stations (N) and proportions of stations (%)with statistically significant trends. PAHs and butyltins (BTs) were not measured at CSMW stations.
Contaminant CSMWa NMWb
Increasing trends Decreasing trends Increasing trends Decreasing trends
N % N % N % N %
DDTs 0 0 17 90 0 0 20 57Chlordanes 0 0 14 64 0 0 16 64Dieldrin 0 0 9 41 0 0 7 20PCBs 0 0 11 61 0 0 7 20PAHs – – – – 3 9 3 9BTs – – – – 0 0 11 31Lead 0 0 11 52 0 0 8 23Silver 0 0 11 52 0 0 10 29Copper 8 38 1 <1 4 11 6 17Zinc 1 <1 4 19 0 0 10 29
a Twenty-two stations assessed for Chlordanes and Dieldrin; N = 19 for DDTs; and N = 18 for PCBs. Twenty-one stations assessed for all metals.b Thirty-five stations assessed for all contaminants, except for Chlordanes (N = 25).
A.R. Melwani et al. / Marine Pollution Bulletin 81 (2014) 291–302 295

Author's personal copy
tions, but only three (9%) of these increases were statistically sig-nificant: Humboldt Bay, Shelter Cove, and Point Santa Barbara (Ta-bles 2 and S5). In addition, 12 sites had declining concentrations,with three (9%) being statistically significant: Long Beach, andSan Diego Bay at Harbor Island and Coronado Bridge. These declin-ing stations indicated HIC values that ranged from 9 to 17 years,which suggest generally slower declines compared to other organiccontaminants, such as DDTs and PCBs.
3.4. Butyltins
Butyltins declined at 32 of 35 NMW stations, and 11 (31%) ofthese declines were statistically significant (Tables 2 and S5). Themajority of locations (22 of 35) exhibited high initial concentra-tions (>320 ppb dw). Locations with the steepest declining trendswere near San Francisco (San Mateo Bridge and DumbartonBridge), Los Angeles (Marina Del Rey, Anaheim Bay, and Royal
Fig. 2a. Total DDTs in Mytilus californianus at the 10 longest running California State Mussel Watch stations sampled from 1977 to 2010. Units are parts per billion, lipidweight. Values below detection are shown by half circles along x-axis. Symbol on top right of each sub-plot indicates if the trend was statistically significant (5 = significantlinear decline, p < 0.05; � = greater than 50% of results were below detection).
Fig. 2b. Total DDTs in Mytilus californianus at California State Mussel Watch/Regional Monitoring Program stations sampled from 1980 to 2010. Units are parts per billion,lipid weight. Symbol on top right of each sub-plot indicates if the trend was statistically significant (5 = significant linear decline, p < 0.05).
296 A.R. Melwani et al. / Marine Pollution Bulletin 81 (2014) 291–302

Author's personal copy
Palms), and San Diego (Mission Bay and Pt. Loma Lighthouse).Many of these sites are located in harbors. HIC at these stationswere estimated at 4 years, which was the quickest rate of declineobserved in any contaminant evaluated. Sixteen other stationswith non-significant declining concentrations also revealed rela-tively low HIC (<10 years).
3.5. Lead
Lead declined at many of the CSMW stations with initially highconcentrations (>7 ppm dw). Statistically significant declines wereindicated at 11 of 21 (52%) stations (Tables 2 and S6). The majorityof stations showing significant declines were located in southern
Fig. 3a. Total PCBs in Mytilus californianus at the 10 longest running California State Mussel Watch stations sampled from 1977 to 2010. Units are parts per billion, lipidweight. Values below detection are shown by half circles along x-axis. Symbol on top right of each sub-plot indicates if the trend was statistically significant (5 = significantlinear decline, p < 0.05; � = greater than 50% results were below detection).
Fig. 3b. Total PCBs in Mytilus californianus at California State Mussel Watch/Regional Monitoring Program stations sampled from 1980 to 2010. Units are parts per billion,lipid weight. Symbol on top right of each sub-plot indicates if the trend was statistically significant (5 = significant linear decline, p < 0.05).
A.R. Melwani et al. / Marine Pollution Bulletin 81 (2014) 291–302 297

Author's personal copy
California (9 of 11), located from Los Angeles Harbor to Oceanside.The steepest declines were observed at Pacific Grove, Los AngelesHarbor, Royal Palms, Huntington Harbor, Newport Bay, and Ocean-side, where HICs generally ranged from 10 to 18 years. At RoyalPalms, concentrations declined from 15 ppm dw in 1977 to1.8 ppm dw in 2010.
Lead declined at most of the NMW stations, but statistically sig-nificant declines were only observed at 8 of 35 (23%) stations:Emeryville in San Francisco Bay, Moss Landing, Marina Del Rey,Royal Palms, San Pedro Harbor, Anaheim Bay, La Jolla, and San Die-go Bay at Harbor Island (Tables 2 and S7). The largest statisticallysignificant decline was at Marina Del Rey, where the lead concen-tration dropped from 35 ppm dw in 1987 to 2 ppm dw in 2008.Nine stations had low initial concentrations (<1 ppm dw), anddid not show a significant trend.
3.6. Silver
Significant declining trends in silver were indicated at half ofCSMW stations (11 of 21, 52%; Table 2). The most contaminatedstations displayed the steepest declines; specifically, San FranciscoBay at Fort Baker, Pacific Grove, Royal Palms, and Oceanside(Table S6 and Fig. 4). HIC at these stations ranged from 6 to12 years, corresponding to declines of 75% over 30 years. Theremainder of stations had low initial concentrations (<0.05 ppmdw), higher HICs, and have not shown any consistent trend.
Silver concentrations have declined slowly at many of the NMWstations; however, similar to the CSMW stations, the majority oflocations exhibited low (<0.05 ppm dw) initial concentrations(Table S7). Subsequently, most of the trends were non-significant.Significant declines were observed at 10 of 35 (29%) stations: SanMateo Bridge in San Francisco Bay, Santa Cruz, San Simeon, PointSanta Barbara, Redondo Beach, Royal Palms, Newport Beach, La Jol-la, Point Loma, and Imperial Beach, all of which were among themostly heavily contaminated stations. With a few exceptions,HIC at these stations ranged from 4 to 15 years. The largest statis-tically significant downward trend was at Point Loma, where silver
concentrations dropped from 34 ppm dw in 1991 to about 2 ppmdw in 2005.
3.7. Copper
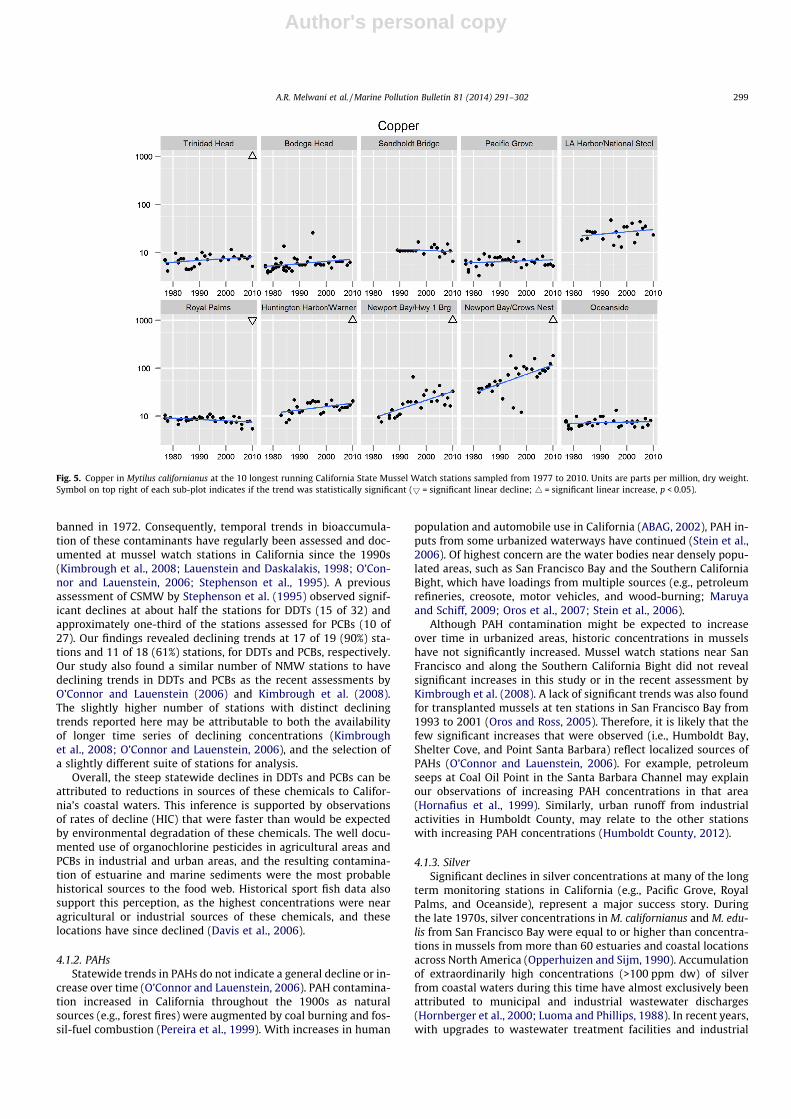
Copper increased at all but two CSMW stations. Eight of 22(38%) stations indicated statistically significant increases over time(Tables 2 and S6), including four stations that have the longest run-ning time series (Fig. 5). Many of the significant increases in south-ern California were at stations located in harbor areas, includingHuntington Harbor at Warner Ave, Newport Bay at Crows Nest,and San Diego Bay at Harbor Island. Newport Bay at Crows Nest ap-pears to be a particular recent hotspot, exhibiting copper concen-trations above 100 ppm dw in each year since 2007. This is morethan double the concentration detected at the same station duringthe 1980s. Only one station (Royal Palms) suggested a significantdecline in copper, but the trend has been relatively slow (HIC�100 years).
Trends in copper at NMW stations have been inconsistent, hav-ing increased at 14 stations and declined at the remaining 21 sta-tions (Table S7). Ten stations exhibited statistically significanttrends, with four statistically significant increases and six de-creases. Three of four increasing trends were observed in northernCalifornia, and all the declining trends were in southern California.The largest statistically significant decline was at Coronado Bridge,where the copper concentration dropped from 35 ppm dw in 1992to about 12 ppm dw in 2008 (HIC = 19 years). Trends in copper atNMW stations did not suggest a general pattern of increasing con-centrations statewide as was evident from the CSMW dataset.
4. Discussion
4.1. Statewide trends
4.1.1. DDTs and PCBsDDTs and PCBs have been two of the most prevalent legacy or-
ganic contaminants in California. They were used extensively until
Fig. 4. Silver in Mytilus californianus at the 10 longest running California State Mussel Watch stations sampled from 1977 to 2010. Units are parts per million, dry weight.Values below detection are shown by half circles along x-axis. Symbol on top right of each sub-plot indicates if the trend was statistically significant (5 = significant lineardecline, p < 0.05).
298 A.R. Melwani et al. / Marine Pollution Bulletin 81 (2014) 291–302
Author's personal copy
banned in 1972. Consequently, temporal trends in bioaccumula-tion of these contaminants have regularly been assessed and doc-umented at mussel watch stations in California since the 1990s(Kimbrough et al., 2008; Lauenstein and Daskalakis, 1998; O’Con-nor and Lauenstein, 2006; Stephenson et al., 1995). A previousassessment of CSMW by Stephenson et al. (1995) observed signif-icant declines at about half the stations for DDTs (15 of 32) andapproximately one-third of the stations assessed for PCBs (10 of27). Our findings revealed declining trends at 17 of 19 (90%) sta-tions and 11 of 18 (61%) stations, for DDTs and PCBs, respectively.Our study also found a similar number of NMW stations to havedeclining trends in DDTs and PCBs as the recent assessments byO’Connor and Lauenstein (2006) and Kimbrough et al. (2008).The slightly higher number of stations with distinct decliningtrends reported here may be attributable to both the availabilityof longer time series of declining concentrations (Kimbroughet al., 2008; O’Connor and Lauenstein, 2006), and the selection ofa slightly different suite of stations for analysis.
Overall, the steep statewide declines in DDTs and PCBs can beattributed to reductions in sources of these chemicals to Califor-nia’s coastal waters. This inference is supported by observationsof rates of decline (HIC) that were faster than would be expectedby environmental degradation of these chemicals. The well docu-mented use of organochlorine pesticides in agricultural areas andPCBs in industrial and urban areas, and the resulting contamina-tion of estuarine and marine sediments were the most probablehistorical sources to the food web. Historical sport fish data alsosupport this perception, as the highest concentrations were nearagricultural or industrial sources of these chemicals, and theselocations have since declined (Davis et al., 2006).
4.1.2. PAHsStatewide trends in PAHs do not indicate a general decline or in-
crease over time (O’Connor and Lauenstein, 2006). PAH contamina-tion increased in California throughout the 1900s as naturalsources (e.g., forest fires) were augmented by coal burning and fos-sil-fuel combustion (Pereira et al., 1999). With increases in human
population and automobile use in California (ABAG, 2002), PAH in-puts from some urbanized waterways have continued (Stein et al.,2006). Of highest concern are the water bodies near densely popu-lated areas, such as San Francisco Bay and the Southern CaliforniaBight, which have loadings from multiple sources (e.g., petroleumrefineries, creosote, motor vehicles, and wood-burning; Maruyaand Schiff, 2009; Oros et al., 2007; Stein et al., 2006).
Although PAH contamination might be expected to increaseover time in urbanized areas, historic concentrations in musselshave not significantly increased. Mussel watch stations near SanFrancisco and along the Southern California Bight did not revealsignificant increases in this study or in the recent assessment byKimbrough et al. (2008). A lack of significant trends was also foundfor transplanted mussels at ten stations in San Francisco Bay from1993 to 2001 (Oros and Ross, 2005). Therefore, it is likely that thefew significant increases that were observed (i.e., Humboldt Bay,Shelter Cove, and Point Santa Barbara) reflect localized sources ofPAHs (O’Connor and Lauenstein, 2006). For example, petroleumseeps at Coal Oil Point in the Santa Barbara Channel may explainour observations of increasing PAH concentrations in that area(Hornafius et al., 1999). Similarly, urban runoff from industrialactivities in Humboldt County, may relate to the other stationswith increasing PAH concentrations (Humboldt County, 2012).
4.1.3. SilverSignificant declines in silver concentrations at many of the long
term monitoring stations in California (e.g., Pacific Grove, RoyalPalms, and Oceanside), represent a major success story. Duringthe late 1970s, silver concentrations in M. californianus and M. edu-lis from San Francisco Bay were equal to or higher than concentra-tions in mussels from more than 60 estuaries and coastal locationsacross North America (Opperhuizen and Sijm, 1990). Accumulationof extraordinarily high concentrations (>100 ppm dw) of silverfrom coastal waters during this time have almost exclusively beenattributed to municipal and industrial wastewater discharges(Hornberger et al., 2000; Luoma and Phillips, 1988). In recent years,with upgrades to wastewater treatment facilities and industrial
Fig. 5. Copper in Mytilus californianus at the 10 longest running California State Mussel Watch stations sampled from 1977 to 2010. Units are parts per million, dry weight.Symbol on top right of each sub-plot indicates if the trend was statistically significant (5 = significant linear decline; 4 = significant linear increase, p < 0.05).
A.R. Melwani et al. / Marine Pollution Bulletin 81 (2014) 291–302 299
Author's personal copy
source controls, decreases in silver have been achieved both ineffluents and biota in receiving waters (summarized in Flegalet al., 2007). The steepest decline observed at a CSMW stationwas at Pacific Grove, where concentrations declined from approx-imately 2 ppm dw in 1977 to 0.1 ppm dw in 2004. This station is inan Area of Special Biological Significance and is located 500 yardsfrom an outfall that was terminated in 1980 due to a waste dis-charge prohibition, explaining the dramatic decrease. Notably,NMW monitoring at Pacific Grove which began in 1986 has notshown a significant decline, likely due to missing the period ofmost significant change in mussel concentrations. The majorityof declines in silver at both CSMW and NMW stations were ob-served in southern California. From 1971 to 1995, mass emissionsof silver from large wastewater treatment facilities in the SouthernCalifornia Bight decreased by 64% (Raco-Rands, 1996). Decreases inemissions from large municipal wastewater facilities in this region(e.g., the Joint Water Pollution Control Plant near Royal Palms) andimproved source controls (e.g., photographic wastes) likely explainthe significant trends.
4.1.4. LeadLead historically entered aquatic environments via leaded gaso-
line and urban runoff (Stephenson and Leonard, 1994). Similar tosilver, large declines of this legacy contaminant represent a successstory for environmental managers. Reductions in sources and loadsof lead have occurred due to the phaseouts of leaded gasoline andlead-based paints that have occurred since the 1970s. From 1971to 1995, the combined mass emissions of lead from the four largestmunicipal wastewater treatment facilities in southern Californiadecreased by nearly 99% (Raco-Rands, 1996). Selected CSMW sta-tions from Royal Palms to Oceanside are located near these treat-ment facilities, and thus not surprisingly, show the strongestdeclining trends. Similar trends in southern California were ob-served at National Mussel Watch stations by Kimbrough et al.(2008). The trends for lead and silver clearly indicate that reduc-tions in mass emissions from wastewater discharge, urban runoff,and atmospheric deposition have resulted in reduced contamina-tion at the base of the food web.
4.1.5. CopperCopper use has increased widely in California over the past
30 years (Lauenstein and Daskalakis, 1998; Stephenson and Leon-ard, 1994). Consequently, higher concentrations have been de-tected at many locations in California during monitoringconducted in the past decade (O’Connor and Lauenstein, 2005).
The primary source of copper to the marine environment hasbeen through antifouling paints on boats and other water vessels.Because tributyltin was prohibited for use on vessels that are lessthan 25 m in length in the 1988 Organotin Antifouling Paint Con-trol Act, copper became a preferred marine biocide. Copper mayenter the water by both passive leaching as well as from hull clean-ing (L.M. Candelaria, pers. comm.). Therefore, copper anti-foulingpaints may be sources of increasing copper levels at Californiamussel watch stations. There is an additional concern that coppermay be increasing in urban runoff due to use in brake pads (Ross-elot, 2006). Many of the stations with increasing copper concentra-tions in mussels were observed in harbors and marinas. Otherreports of increasing copper concentrations in bivalves have notedan association with enclosed embayments (O’Connor and Lauen-stein, 2005; Stephenson and Leonard, 1994). These observationssuggest that copper use in antifouling paints may be associatedwith the increasing copper concentrations in mussels. However,current levels of copper in mussels from most stations in Californiaare relatively low compared to other National Mussel Watch sta-tions across the United States (Kimbrough et al., 2008) and are cur-rently below levels that have been associated with toxic effects
(Jarvinen and Ankley, 1999). Exceptions are the few stations nearNewport and San Diego that have concentrations during 2003–2010 that exceed 100 ppb dw.
4.2. Trends at specific locations
4.2.1. San Francisco BayNumerous matrices monitored for contaminants in San Fran-
cisco Bay have not shown a declining trend of organic contami-nants and trace metal concentrations. PCBs in San Francisco sportfish (e.g., white croaker, shiner surfperch, and California halibut)have shown no decline over time (1994–2009) and a relativelyhigh variance (Davis et al., 2011; Greenfield et al., 2005). Concen-trations in water and sediments of the Bay have also been rela-tively constant (SFEI, 2005). The results shown here fortransplanted mussels at CSMW/RMP stations indicate statisticallysignificant declines in PCBs and DDTs at numerous stations in theBay. The NMW data also indicate significant declines in butyltinsand certain organic contaminants in San Francisco Bay: butyltinsand DDTs, declined significantly at 2 of 3 sites; and PCBs declinedsignificantly at one site. A possible explanation for these contrast-ing patterns is that the mussels are accumulating contaminantsfrom different pathways. For example, contaminants in sport fishand mussels have been poorly correlated (Yujie Jin, SWRCB, unpub-lished data). Fish consume prey that receive their exposure frommultiple locations on the margins of the Bay, where residencetimes for particle-associated contaminants are longer. In contrast,mussels are reflecting declines in water and sediment that occurat individual locations in the open Bay. RMP surveys of PCBs withinsmall fish over the past few years (Greenfield et al., 2011) havefound high concentrations at multiple locations of the Bay marginsthat support this hypothesis.
4.2.2. Salinas River mouth in Moss Landing HarborSandholdt Bridge is located in Moss Landing Harbor at the
mouth of the Salinas River. Mussels have been monitored for con-taminants in this area by both CSMW and NMW. Over the manyyears of mussel monitoring in California, PCBs and DDTs in MossLanding have been the highest of all stations in northern California.For example, DDT concentrations measured in the 1980s in north-ern California sites were all below 800 ppb lw other than in MossLanding, where concentrations exceeded 30,000 ppb lw. Concen-trations of DDTs at this site were lower during the early 1990s,but otherwise they have not changed much from pre-1980 levels.
The Salinas River has a large watershed with extensive irrigatedagricultural fields. The unusually high historic concentrations ofDDTs in Moss Landing Harbor likely originate from the applicationof organochlorine pesticides and subsequent runoff to the SalinasRiver, and its tributaries. DDT contamination of mussels in MossLanding has continued through to recent times, possibly due tohigh flow events, resuspension, and transport of contaminated sed-iments in the rivers. The relatively low concentrations(�10,000 ppb lw) of DDTs during the early 1990s reported by Ste-phenson et al. (1995) may reflect low runoff years, and the rela-tively high levels (>20,000 ppb lw) during the early 1980s andlater 1990s and 2000s reflect periods of increased flow and rainfall.Annual flow from the Salinas River during this period corroboratesthis hypothesis (Griffin, 2007). In addition, current sources of DDTto the Salinas River drainage may also exist. p,p0-DDE (a derivativeof DDT) is a by-product in the insecticide Kelthane, and may beassociated with the continued inputs of DDT that occur in the Sali-nas River watershed.
4.2.3. Royal Palms on the Palos Verdes PeninsulaMussel watch sampling of Royal Palms represents one of lon-
gest-running time series in the country, including data from the
300 A.R. Melwani et al. / Marine Pollution Bulletin 81 (2014) 291–302

Author's personal copy
earlier USEPA Mussel Watch program (Lauenstein and Daskalakis,1998). This station is located near the outfall of the JWPCP atWhite’s Point that discharged wastes from the Montrose ChemicalCorporation. Industrial waste produced by Montrose, which manu-factured DDT from 1947 to 1982 (Graham, 1972) was an immensesource of DDT contamination to the coastal waters in this region. Inaddition, PCBs have been measured in sediments of these watersfor more than 30 years, with peak inputs into the Southern Califor-nia Bight from 1965 to 1970 (Mearns et al., 1991). Additional off-shore outfalls contributed as principal sources of PCBs to theBight, including those discharging treatment wastewater effluentfrom the Hyperion (City of Los Angeles) and Orange County Sanita-tion District wastewater treatment plants (SCCWRP, 1973). There-fore, the declines in organic contaminants and numerous tracemetals evident at Royal Palms and other coastal locations in thisregion were undoubtedly influenced by reduced loads from theMontrose Chemical Corporation and POTW effluent discharges inthe region (Raco-Rands, 1996). Mussel monitoring by CSMW andNMW throughout the coastal embayments of southern Californiahas documented considerable improvement from the historic con-tamination of the late 1970s and early 1980s.
5. Conclusions
Bivalve monitoring in California has documented distinct regio-nal declines in some contaminants that have been subject to userestrictions or source control, including organochlorine pesticides,PCBs, butyltins, lead, and silver. Statistical declines were more fre-quently detected at CSMW stations than NMW stations. This ismost likely attributable to the earlier initiation of monitoring ofthe CSMW, and that many of those stations were in historicallythe most contaminated areas. In this study, statistically significantdeclines were found at more than 60% of CSMW stations for 3 of 4organic contaminants examined (including DDTs and PCBs), and atabout 50% of the CSMW stations for 2 of 4 trace metals (lead andsilver). DDT also declined at more than 50% of the NMW stations.Overall, the contaminant trends noted from CSMW data were con-sistent with those compiled recently by the NMW program (Kimb-rough et al., 2008; O’Connor and Lauenstein, 2006). Bivalvemonitoring has provided crucial evidence of the effectiveness ofthe management actions taken to reduce these contaminants andthe time for environmental breakdown to occur. Monitoring ofcontaminants with continuing emissions (e.g., PAHs and copper)has revealed that some pollutants are still accumulating in aquaticenvironment across the state, and are possibly on the increase incertain locations. Copper was the only contaminant that was indi-cated to have substantially increased. Generally, mussels from en-closed bay and harbor sites remain the greatest areas at risk fromcopper, due to being more heavily impacted by local inputs com-pared to open ocean sites.
The existence of historical time series for legacy contaminantsof concern in bivalves has proven a valuable data resource in Cal-ifornia. Bivalves can be ideal for addressing questions related tospatial trends and sources that affect coastal water quality, becausethey are stationary and integrate all forms of exposure that areoccurring at the sampling location. The vast majority of stationsshowing declines occurred in regions of elevated historic contam-ination, such as locations near San Francisco, Los Angeles, and SanDiego.
Bivalves are being considered as an important component inmonitoring for emerging contaminants in the aquatic environ-ment. The utility of marine bivalves for monitoring contaminantsof emerging concern (CECs) is currently being tested in a NMWpilot study throughout California (Maruya et al., 2014). Bivalvesare considered an essential component in monitoring for earlydetection and management of CECs. Therefore, initiation of time
series for CECs, along with continued monitoring at a subset of sta-tions for legacy contaminants where problems still persist, arelikely to be important components of future mussel watch moni-toring in California and other U.S. coastal waters.
Acknowledgements
The data used in this study were graciously provided by StateWater Resources Control Board (SWRCB), National Oceanic andAtmospheric Administration, and the Regional Monitoring Pro-gram for Water Quality in the San Francisco Estuary. This studywas funded by the Surface Water Ambient Monitoring Program,the SWRCB, and the San Francisco Estuary Institute (SFEI), withadditional support by a Commonwealth of Australia InternationalPostgraduate Research Scholarship to AM. We thank Rachel Allen,Shira Bezalel, Jennifer Hunt, and Marcus Klatt (all SFEI) and Papant-zin Cid (SWRCB) for their assistance with data management andgraphics on this project. Thanks to Chris Beegan (SWRCB), LindaCandelaria (Santa Ana RWQCB), Keith Maruya (SCCWRP), andtwo anonymous reviewers for providing constructive commentson earlier drafts of this manuscript. This is SFEI Contribution # 677.
Appendix A. Supplementary material
Supplementary data associated with this article can be found, inthe online version, at http://dx.doi.org/10.1016/j.marpolbul.2013.04.025.
References
ABAG, 2002. Historical Bay area population census figures and estimate. Associationof Bay Area Governments and U.S. Census Bureau.
Butler, P.A., 1973. Organochlorine residues in estuarine molluscs, 1965–1972 –National Pesticides Monitoring Program. Pestic. Monit. J. 6, 238–262.
Davis, J., Lowe, S., Hoenicke, R., Scelfo, G.H., Yee, D., 2001. 2001 Quality AssuranceProject Plan: Regional Monitoring Program for Trace Substances. San FranciscoEstuary Institute, Oakland, CA.
Davis, J.A., Grenier, J.L., Melwani, A.R., Bezalel, S., Letteney, E., Zhang, E., 2006. TheImpact of pollutant bioaccumulation on the fishing and aquatic life supportbeneficial uses of California water bodies: a review of historic and recent data,Draft Report. San Francisco Estuary Institute, p. 124.
Davis, J.A., Schiff, K., Melwani, A.R., Bezalel, S.N., Hunt, J.A., Allen, R.M., Ichikawa, G.,Bonnema, A., Heim, W.A., Crane, D., Swenson, S., Lamerdin, C., Stephenson, M.,2011. Contaminants in fish from the California coast, 2009: summary report onyear one of a two-year screening survey. San Francisco Estuary Institute,Oakland, CA.
Flegal, A.R., Brown, C.L., Squire, S., Ross, J.R.M., Scelfo, G.M., Hibdon, S., 2007. Spatialand temporal variations in silver contamination and toxicity in San FranciscoBay. Environ. Res. 105, 34–52.
Graham, D.L., 1972. Trace metal levels in intertidal mollusks of California. Veliger14, 365–372.
Greenfield, B.K., Allen, R., Melwani, A.R., Ridolfi, K., Harrold, K., Slotton, D., Ayers, S.,2011. Mercury and PCBs in small fish 2005–2010. San Francisco EstuaryInstitute, Oakland, CA.
Greenfield, B.K., Davis, J.A., Fairey, R., Roberts, C., Crane, D., Ichikawa, G., 2005.Seasonal, interannual, and long-term variation in sport fish contamination, SanFrancisco Bay. Sci. Total Environ. 336, 25–43.
Griffin, R.D., 2007. A 600-Year Streamflow History in the Salinas ValleyReconstructed from Blue Oak Tree Rings. University of Arkansas, Fayetteville,p. 67.
Gunther, A.J., Davis, J.A., Hardin, D., Gold, J., Bell, D., Crick, J., Scelfo, G., Sericano, J.,Stephenson, M., 1999. Long term bioaccumulation monitoring withtransplanted bivalves in San Francisco Bay. Mar. Poll. Bull. 38, 170–181.
Hellou, J., King, T., Willis, D.E., 2000. Seasonal and geographical distribution of PAHsin mussels, mytilus edulis, collected from an Urban Harbour. Polycycl. Aromat.Compd. 20, 21–38.
Hornafius, J.S., Quigley, D., Luyendyk, B.P., 1999. The world’s most spectacularmarine hydrocarbon seeps (Coal Oil Point, Santa Barbara Channel, California):Quantification of emissions. J. Geophys. Res. 104, 20703–20711.
Hornberger, M.I., Luoma, S.N., Cain, D.J., Parchaso, F., Brown, C.L., Bouse, R.M.,Wellise, C., Thompson, J.K., 2000. Linkage of bioaccumulation and biologicaleffects to changes in pollutant loads in south San Francisco Bay. Environ. Sci.Technol. 34, 2401–2409.
Humboldt County, 2012. Environmental Impact Report for the County of HumboldtGeneral Plan, Update, p. 631.
A.R. Melwani et al. / Marine Pollution Bulletin 81 (2014) 291–302 301
Author's personal copy
Hunt, C.D., Slone, E., 2010. Long-term monitoring using resident and caged musselsin Boston Harbor yield similar spatial and temporal trends in chemicalcontamination. Mar. Environ. Res. 70, 343–357.
Jarvinen, A.W., Ankley, G.T., 1999. Linkage of effects to tissue residues: developmentof a comprehensive database for aquatic organisms exposed to inorganic andorganic chemicals. SETAC Press.
Kimbrough, K.L., Johnson, W.E., Lauenstein, G.G., Christensen, J.D., Apeti, D.A., 2008.An Assessment of Two Decades of Contaminant Monitoring in the Nation’sCoastal Zone. Silver Spring, MD, p. 105.
Lauenstein, G.G., Cantillo, A.Y., 1998. Analytical Methods of the National Status andTrends Program Mussel Watch Project – 1993–1997 Update. Silver Spring, MD.
Lauenstein, G.G., Daskalakis, K.D., 1998. U.S. Long-term coastal contaminanttemporal trends determined from mollusk monitoring programs, 1965–1993.Mar. Pollut. Bull. 37, 6–13.
Luoma, S.N., Phillips, D.J.H., 1988. Distribution, variability, and impacts of traceelements in San Francisco Bay. Mar. Pollut. Bull. 19, 413–425.
Martin, M., 1985. State Mussel Watch: toxics surveillance in California. Mar. Pollut.Bull. 16, 140–146.
Martin, M., Stephenson, M.D., 1990a. Comparison of concentrations of contaminantsin mussels from the Channel Islands National Park and Marine Sanctuary, 1978versus 1988. California Dept. of Fish and Game, Marine Pollution StudiesLaboratory.
Martin, M., Stephenson, M.D., 1990b. Trace hydrocarbons and metals in mussels inthe Gulf of the Farallones National Marine Sanctuary 1988. CaliforniaDepartment of Fish and Game, Monterey, California.
Maruya, K., Dodder, N., Weisberg, S., Gregorio, D., Klosterhaus, S., Alvarez, D.,Furlong, E., Kimbrough, K., Lauenstein, G., Christensen, J., this 2014. RefocusingMussel Watch on contaminants of emerging concern (CECs): the California pilotstudy (2009–10). Marine Pollution Bulletin. 81, 334–339.
Maruya, K.A., Schiff, K., 2009. The extent and magnitude of sediment contaminationin the Southern California Bight. Geol. Soc. Am Spec. Papers 454, 399–412.
McDonald, S.J., Frank, D.S., Ramirez, J.A., Wang, B., Brooks, J.M., 2006. AncillaryMethods of the National Status and Trends Program: 2000-2006 Update. SilverSpring, MD, p. 17.
Mearns, A.J., Matta, M., Shigeneka, G., MacDonald, D., Buchman, M., Harris, H., Golas,J., Lauenstein, G., 1991. Contaminant trends in the Southern California Bight:Inventory and Assessment, Seattle, WA.
Mearns, A.J., O’Connor, T.P., Lauenstein, G.G., Highway, E.W., 1999. Relevance of theNational ‘‘Mussel Watch’’ Program to seafood fisheries management issuesduring oil spill response, International Oil Spill Conference 1999.
Melwani, A.R., Greenfield, B.K., Jahn, A., Oram, J.J., Sedlak, M., Davis, J.A., 2008. PowerAnalysis and Optimization of the RMP Status and Trends Program. San FranciscoEstuary Institute, Oakland, CA.
O’Connor, T.P., Lauenstein, G.G., 2005. Status and trends of copper concentrations inmussels and oysters in the USA. Mar. Chem. 97, 49–59.
O’Connor, T.P., Lauenstein, G.G., 2006. Trends in chemical concentrations in musselsand oysters collected along the US coast: Update to 2003. Mar. Environ. Res. 62,261–285.
Opperhuizen, A., Sijm, D.T.H.M., 1990. Bioaccumulation and biotransformation ofpolychlorinated dibenzo-p-dioxins and dibenzofurans in fish. Environ. Toxicol.Chem. 9, 175–186.
Oros, D.R., Ross, J.R.M., 2005. Polycyclic aromatic hydrocarbons in bivalves from theSan Francisco estuary: Spatial distributions, temporal trends, and sources(1993–2001). Mar. Environ. Res. 60, 466–488.
Oros, D.R., Ross, J.R.M., Spies, R.B., Mumley, T., 2007. Polycyclic aromatichydrocarbon (PAH) contamination in San Francisco Bay: a 10-yearretrospective of monitoring in an urbanized estuary. Environ. Res. 105, 101–118.
Pereira, W.E., Hostettler, F.D., Luoma, S.N., van Geen, A., Fuller, C.C., Anima, R.J.,1999. Sedimentary record of anthropogenic and biogenic polycyclic aromatichydrocarbons in San Francisco Bay, California. Mar. Chem. 64.
Raco-Rands, V., 1996. Characteristics of Effluents from Large MunicipalWasterwater Treatment Facilities in 1995. In: SCCWRP (Ed.). SouthernCalifornia Coastal Water Research Project, El Sagundo, CA.
Ramu, K., Kajiwara, N., Sudaryanto, A., Isobe, T., Takahashi, S., Subramanian, A.,Ueno, D., Zheng, G.J., Lam, P.K.S., Takada, H., Zakaria, M.P., Viet, P.H., Prudente,M., Tana, T.S., Tanabe, S., 2007. Asian mussel watch program: contaminationstatus of polybrominated diphenyl ethers and organochlorines in coastal watersof Asian Countries. Environ. Sci. Technol. 41, 4580–4586.
Roach, A.C., Runcie, J., 1998. Levels of selected chlorinated hydro-carbons in ediblefish tissues from polluted areas in the Georges/Cooks Rivers and SydneyHarbour, New South Wales, Australia. Mar. Pollut. Bull. 36, 323–344.
Rosselot, K.S., 2006. Copper Released from Brake Lining Wear in the San FranciscoBay Area. Prepared for the Brake Pad Partnership by Process Profiles, Calabasas,CA.
SCCWRP, 1973. The Ecology of the Southern California Bight: Implications for WaterQuality Management. Southern California Coastal Water Research Project, ElSegundo, CA.
SFEI, 1994. 1993 Annual Report – San Francisco Estuary Regional MonitoringProgram for Trace Substances. San Francisco Estuary Institute, Richmond, CA.
SFEI, 2005. RMP Annual Monitoring Results, 2003. San Francisco Estuary Institute,Oakland, CA.
SFEI, 2010. 2008 Annual Monitoring Results. The Regional Monitoring Program forWater Quality in the San Francisco Estuary (RMP). San Francisco EstuaryInstitute, Oakland, CA.
Stein, E.D., Tiefenthaler, L.L., Schiff, K., 2006. Watershed-based sources of polycyclicaromatic hydrocarbons in urban storm water. Environ. Toxicol. Chem. 25, 373–385.
Stephenson, M.D., Leonard, G.H., 1994. Evidence for the decline of silver and leadand the increase of copper from 1977 to 1990 in the coastal marine waters ofCalifornia. Mar. Pollut. Bull. 28, 148–153.
Stephenson, M.D., Martin, M., Tjeerdema, R.S., 1995. Long-term trends in DDT,polychlorinated-biphenyls, and chlordane in California mussels. Arch. Environ.Contam. Toxicol. 28, 443–450.
Tech, Tetra., 2008. Technical memorandum 2: North San Francisco Bay seleniumdata summary and source analysis. Tetra Tech, Inc., Lafayette, CA.
Walker, C.H., Livingstone, D.R., 1992. Persistent Pollutants in Marine Ecosystems.Pergamon Press Ltd., Oxford.
Wyland, J.V., 1975. A study of heavy metal distribution and toxicity in selectedmarine organisms from California. Stanford University, Palo Alto, California.
302 A.R. Melwani et al. / Marine Pollution Bulletin 81 (2014) 291–302
Related Documents