EQUITY RESEARCH | October 4, 2016 Lisa Yang +44(20)7552-3713 lisa.yang @ gs.com Goldman Sachs International Heath P. Terry, CFA (212) 357-1849 heath.terry @ gs.com Goldman, Sachs & Co. Masaru Sugiyama +81(3)6437-4691 masaru.sugiyama @ gs.com Goldman Sachs Japan Co., Ltd. Simona Jankowski, CFA (415) 249-7437 simona.jankowski @ gs.com Goldman, Sachs & Co. Goldman Sachs does and seeks to do business with companies covered in its research reports. As a result, investors should be aware that the firm may have a conflict of interest that could affect the objectivity of this report. Investors should consider this report as only a single factor in making their investment decision. For Reg AC certification and other important disclosures, see the Disclosure Appendix, or go to www.gs.com/research/hedge.html. Analysts employed by non-US affiliates are not registered/qualified as research analysts with FINRA in the U.S. The Goldman Sachs Group, Inc. The music industry is on the cusp of a new era of growth after nearly two decades of disruption. The rising popularity and sophistication of streaming platforms like Spotify and Pandora is ushering in a second digital music revolution – one that is creating value rather than destroying it like the piracy and unbundling that came before. In this first of a “double album“ on the nascent industry turnaround, we lay out the converging trends that we expect to almost double global music revenues over the next 15 years to $104bn, spreading benefits across the ecosystem. Streaming grows up and puts music back on path to growth after decades of disruption Heather Bellini, CFA (212) 357-7710 heather.bellini @ gs.com Goldman, Sachs & Co. MUSIC IN THE AIR STAIRWAY TO HEAVEN DOUBLE ALBUM

Welcome message from author
This document is posted to help you gain knowledge. Please leave a comment to let me know what you think about it! Share it to your friends and learn new things together.
Transcript

EQUITY RESEARCH | October 4, 2016
Lisa Yang+44(20)[email protected] Sachs International
Heath P. Terry, CFA(212) [email protected], Sachs & Co.
Masaru Sugiyama +81(3)[email protected] Goldman Sachs Japan Co., Ltd.
Simona Jankowski, CFA (415) [email protected] Goldman, Sachs & Co.
Goldman Sachs does and seeks to do business with companies covered in its research reports. As aresult, investors should be aware that the firm may have a conflict of interest that could affect theobjectivity of this report. Investors should consider this report as only a single factor in making theirinvestment decision. For Reg AC certification and other important disclosures, see the DisclosureAppendix, or go to www.gs.com/research/hedge.html. Analysts employed by non-US affiliates are notregistered/qualified as research analysts with FINRA in the U.S.
The Goldman Sachs Group, Inc.
The music industry is on the cusp of a new era of growthafter nearly two decades of disruption. The rising popularityand sophistication of streaming platforms like Spotify andPandora is ushering in a second digital music revolution –one that is creating value rather than destroying it like thepiracy and unbundling that came before. In this first of a“double album“ on the nascent industry turnaround, we layout the converging trends that we expect to almost doubleglobal music revenues over the next 15 years to $104bn,spreading benefits across the ecosystem.
Streaming grows up and puts musicback on path to growth afterdecades of disruption
Heather Bellini, CFA (212) [email protected], Sachs & Co.
MUSIC IN THE AIRSTAIRWAY TO HEAVEN
DOUBLE
ALBUM

October 4, 2016 Global: Media
Goldman Sachs Global Investment Research 2
Table of contents
Stairway to Heaven: Streaming drives new era of growth 4
The ecosystem 6
Stairway to $50 bn of additional revenue opportunity 9
Regulation sets the stage – streaming positive for rights holders 15
An interview with… John Enser, Head of Music and Partner, Olswang 27
An interview with… Leslie Jose Zigel, Chair of Entertainment Practice, Greenspoon Marder 29
Streaming drives greater monetization for music owners 31
Streaming benefits from a growing and captive audience 39
A rising tide lifts (almost) all boats 51
Labels have the most to gain from the growth of streaming and growing competition among distributors 51
Music publishers should benefit from streaming growth but to a lesser extent than labels 56
An interview with… Jane Dyball, CEO of UK Music Publishing Association 59
Subscription streaming platforms have significant growth potential but also face growing competition 61
An interview with… Dr. Hans-Holger Albrecht, CEO of Deezer 68
Ad funded streaming to eat into terrestrial radio 70
Sync revenues: An additional growth opportunity for rights holders 75
Live entertainment will become more important and a growth opportunity for streaming platforms 76
Stock implications 78
Appendix 81
Disclosure Appendix 82
The prices in the body of this report are based on the market close of October 3, 2016.
Contributing authors: Lisa Yang, Heath P. Terry CFA, Masaru Sugiyama, Simona Jankowski CFA, Heather Bellini CFA,
Robert D. Boroujerdi, Hugo Scott-Gall, Piyush Mubayi, Brett Feldman, Drew Borst, Otilia Bologan, Mark Grant, Yusuke
Noguchi, Matthew Cabral, Shateel T. Alam, Stephen Laszczyk, Aditya Buddhavarapu, Katherine Tait. We also would like
to thank Annabel Hazlitt and Kieran Chalmers for their contribution to this report.
Don’t miss Vol. 2: ‘Music in the Air: Paint it Black’
In the second of our “double album” on the music industry’s return to growth, we assess the risks and scenarios that could derail our thesis. Access the report below and visit our portal to watch a video summary of our thesis.
Vol. 2: Music in the Air – Paint it Black

MUSIC’S RETURN TO GROWTH in numbers
ROOM TO GROW IN PAY-TO-PLAY
<50%
Percentage of the DM population that
pays to listen to music. According to
YouTube, only 20% of people globally
have ever paid for music. (p. 31)
+60
million
The growth in paid streaming
subscribers globally between 2010 and
2015, bringing the total to 68mn people.
Associated revenue grew from $0.3bn to
$2.3bn. (p. 39)
EASY LISTENING
400 The number of streaming
platforms available globally. The
US alone boasts 57. (p. 32)
Audio streams consumed per day
by the US population during
1H2016—a 97% yoy jump. (p. 32)
630
million 2%
Paid streaming penetration globally as a
% of smartphone subscribers. (p. 9)
EMERGING MARKETS
90%
Piracy rates in China, India, Mexico,
and Brazil, according to IIPA, implying a
huge potential for better quality (paid/free)
streaming services. (p. 43)
Additional revenue (equivalent to 10%
of the global recorded music market) that
can be generated with a 1% increase in
paid penetration in EMs. (p. 45)
$1.5
billion
LISTENING LIVE
24 million / 40% Average unsold concert tickets in the US per year because of
lack of awareness of the events. Streaming sites like Pandora
are attempting to use behavioral and geo-targeting to better
match ticket supply and demand, which could help recover
some of the estimated $2bn in lost revenue. (p. 14)
PANDORA
DEEZER
APPLE MUSIC
AMAZON PRIME MUSIC
SPOTIFY
3mn
6mn
17mn
40mn
54mn
ALL ABOUT THAT BASE Current paid subscriber base for popular streaming platforms (p. 33)
30 million
vs. 21,000
The number of tracks available on
Spotify compared to the number of
tracks available at a Walmart
store. (p. 32)
THE PAYMENT GAP MILLENNIAL APP-ETITE
4 Of the 10 most-used apps by Millennials, the
number that are music-related. (p. 47)
77% Proportion of Spotify listeners that are
Gen Z/ Millennials. (p. 47)
0 Royalty paid by traditional radio to labels
and artists in the US. (p. 18)
40% / 4% Share of music listening on YouTube
compared to the share of global
recorded music revenue generated by
YouTube. (p. 25)

October 4, 2016 Global: Media
Goldman Sachs Global Investment Research 4
Stairway to Heaven: Streaming drives new era of growth
We believe new technology changes such as the emergence of internet radio and music
streaming are driving a new era of growth for the recorded music industry. New tech
enablers such as Spotify, Apple or Pandora have disentangled music content from its
delivery. The resulting convenience, accessibility and personalization has driven more
consumption of legal music and greater willingness to pay for it, at a time of improving
connectivity and growing consumer preference for accessing rather than owning music.
Unlike its predecessor, this “second” digital revolution creates more value for rights
holders (rather than destroys it), shifting revenue streams from structurally declining
markets (physical, download sales) to a significantly larger new revenue pool (ad-funded
and subscription streaming). This shift has enabled the recorded music market to return to
growth in 2015 following almost two decades of value destruction led by piracy and
unbundling.
We believe the overall music industry, including recording, publishing and live, is now set
to double to over $100 bn by 2030. In this first of a “double album“, we explore the
converging trends that make this digital revolution different to and more profitable than the last.
Streaming drives greater monetization of music content…
By revolutionizing the listening experience, making it seamless and personalized,
streaming improves the monetization of music content through 1) a range of subscription
streaming options with multiple price points that address consumers willing to pay for
better access and convenience, and 2) ad-funded, free streaming that addresses
consumers not able or willing to pay (therefore reducing piracy). Moreover, streaming
improves the discoverability of catalogues and increases their value.
… while benefitting from a growing and captive audience
We see particularly attractive forces supporting streaming growth:
Room to grow penetration of subscription services in DMs, currently at 3%. We see
scope to catch up with the Nordics, already at over 20% as user mix continues to
evolve favourably towards paid tiers. Globally, we forecast paid streaming to grow to
9% of the smartphone population in 2030 from 2% in 2015.
The nascent music markets in EMs, which stand to benefit from improving
recognition of IP, new business models (ad-funded, prepaid, telecom bundles, etc.) and
innovative payment capabilities. EMs accounted for just 10% of the global recorded
music market in 2015 and the Chinese music market was smaller than that of Sweden.
Media consumption habits of Generation Z and Millennials, who are the ideal
audience for streaming given their inherent characteristics of being “digital natives”
focused on experience and convenience. Millennials already spend more on music
than the average person in the US driven by paid streaming and live music.
Further benefit from telecom and tech companies’ large marketing budgets and
existing customer base as these players increasingly leverage music content to drive
greater differentiation of their services and upselling.
Further upside from regulatory changes
Convoluted rules and regulations dictate the flows of payments from platforms to rights
holders, and understanding these intricacies and their evolution is essential. We believe the
emergence of new digital distribution models is positive for rights holders given a more
attractive royalty structure in the US and see further upside from potential regulatory
changes which could reshape future flows of payments from platforms (especially
YouTube and on-demand streaming services).

October 4, 2016 Global: Media
Goldman Sachs Global Investment Research 5
A rising tide lifts (almost) all boats; industry responses will be key
In addition to the structural and regulatory tailwinds highlighted above, we believe industry
responses will be critical in shaping the future growth of the industry which has only
started to recover. We would expect some level of coordination among labels and
platforms to maximize that growth potential. As a result, we believe the split of revenue
pools will remain broadly unchanged in the medium term.
Subscription streaming services are the enablers and the direct beneficiaries of the above-mentioned shifts. We also believe they will increasingly leverage their promotion capabilities, user data and customer relationships to drive new revenue streams (e.g. ticketing) and improve their deals with the labels. However, the landscape is more competitive (Pandora and Amazon launch in 2H16) with risk of disruptive behaviour such as exclusivity and price competition. As a result, we believe their distributor’s cut will remain at c.30%, leading to $13 bn of additional revenue (net of royalities) by 2030. We expect the scene to be divided among pure play streaming services such as Spotify and large tech players such as Apple or Amazon.
Main beneficiaries in our coverage: Apple (Buy), Pandora (CL-Buy).
We expect ad-funded services to eat into terrestrial radio given the ongoing
migration to online listening and better targeting capabilities, creating $5 bn of
additional revenue by 2030. Future roll-out of connected cars and 5G will further
accelerate that shift.
Main beneficiary in our coverage: Pandora (CL-Buy); main loser: iHeart (Not
Covered)
We believe the labels have the most to gain given their royalty cut of 55%-60%.
Their position should remain solid as distribution fragments (and they will have a
vested interest in keeping a minimum of competitive tension among platforms) and
digital increases the complexity of the industry. The outcome of their (re)negotiations
with YouTube, Spotify or Amazon in the coming months and regulatory changes will
be key in this regard. However, we see disruptive forces, such as alternative labels,
driving a greater redistribution of profits to artists. Overall, we forecast that streaming
will increase their revenue pool by $21 bn by 2030 and profit pool by $7 bn.
Main beneficiaries in our coverage: Vivendi (CL-Buy), Sony (CL-Buy).
Publishers should see similar trends to labels but to a lesser extent given their
royalty cut of 10% (note that publishers and labels often belong to the same parent
company), creating an additional revenue pool of $3 bn and profit pool of $1 bn.
Live music growth benefits ticketing and streaming players. By using geo-specific
targeting to known fans, players such as Ticketfly/Pandora and other streaming
services should be able to drive down vacancy rates, increasing artist revenues, and
improving relationships with artists.
Main beneficiary in our coverage: Pandora (CL-Buy).
Industry risks: See the second of our double album “Paint It Black”
While a number of positive structural and regulatory shifts pave the way for better
monetisation of music content, industry responses will also be critical in shaping the future
growth of the industry. In this first of a “double album”, we have assumed some level of
coordination among labels and platforms to maximize that growth potential. In the second
of our double album, “Paint It Black”, we highlight potential disruptive behaviour that
could derail the music recovery.
See the second of our double album: Music in the Air – Paint it Black

The EcosystemEvolution of revenues 2015-2030E
2030E
$103.9bn
ARTIST,SONGWRITER
& OTHER**$26.9BN
ARTIST,SONGWRITER
& OTHER**$42.9BN
RECORDLABEL$15.0BN
TICKETING$2.5BN
PUBLISHER$3.7BN
STREAMING$1.4BNPHYSICAL
$2.9BN
DOWNLOAD$1.5BN
PUBLISHER$6.8BN
STREAMING$14.1BN
RECORDLABEL$35.5BN
TICKETING$3.8BN
PHYSICAL$0.7BN
DOWNLOAD$0.2BN
2015
$53.9bn
Industry segment
Industry player
*
*
* Excluding revenue from radio** Other includes concertpromoters, venue operators etc.
RECORDED MUSIC $23.8BN
RADI
O $2
9.5BN
LIVE MUSIC $24.7BN
PUBLISHING
$5.4
BN
LIVE MUSIC $38.3BN
RADI
O $2
3.8BN
RECORDED MUSIC $56.3BN
PUBLISHING$9
.3B
N
Source: IFPI, Goldman Sachs Global Investment Research

Physical/Online RetailShare of US CD salesAmazon (24%)Walmart (22%)
DownloadShare of US downloadsApple - iTunes (52%)Amazon (19%)Alphabet - Google Play (11%)
Pure PlayerShare of global paid subscribers Napster/Rhapsody (4%)Tidal (2%)Spotify (44%)Deezer (5%)Pandora (N/A)
Tech PlayerShare of global paid subscribers(unless otherwise indicated)Apple - Apple Music (15%)Alphabet - YouTube (90% share of ad-funded users)Amazon (N/A)Tencent - QQ Music (N/A)
AM/FMShare of US radio iHeartMedia (23%)CBS Radio (8%)Cumulus Media (8%) Entercom Communications Corporation (3%) Emmis Communications Corporation (c.2%)
Satellite RadioShare of US satellite radioSirius XM (100%)
Online RadioShare of US online radioPandora (31%)iHeartRadio (9%)
The EcosystemKey players and market shares (2015)
PURCHASE
STREAM(ACCESS)
BROADCAST
LABELVivendi - UMG (34%)Sony - SME (23%)WMG (17%)Independents (26%)
PUBLISHERSony (30%)Vivendi - UMPG (23%)WMG (13%)Independents (34%) inclBMG (5%), Kobalt (4%)
Share of global recorded music
Share of global music publishing
*
* Excluding revenue from radio** Other includes concertpromoters, venue operators etc.
UMG - Universal Music GroupSME - Sony Media EntertainmentWMG - Warner Music GroupUMPG - Universal Music Publishing GroupBMG - Bertelsmann Music Group
Source: IFPI, Goldman Sachs Global Investment Research Source: Company data, Music & Copyright, IFPI, Goldman Sachs Global Investment Research

October 4, 2016 Global: Media
Goldman Sachs Global Investment Research 8
We use the following list of terms interchangeably throughout the report:
Freemium = ad funded tier = free tier (applicable to streaming services such as Spotify
or Deezer but not to Apple Music or Tidal)
Interactive = on-demand (applicable to streaming services such as Spotify, Deezer, or
Apple Music but not to Pandora’s ad-supported internet radio service)
Internet radio = non interactive streaming = webcasting (applicable to Pandora’s
internet radio service or iHeart but not to Sirius XM’s satellite radio)
Rights owners = labels, artists, publishers and songwriters altogether or any one of
them
Recorded music companies = record labels = labels

October 4, 2016 Global: Media
Goldman Sachs Global Investment Research 9
Stairway to $50 bn of additional revenue opportunity
We forecast overall music industry (recorded music, music publishing and live music)
revenue to almost double in size over the next 15 years to $104 bn from $54 bn in
2015. Of that $50 bn revenue growth potential, we expect $32 bn to come from the
recorded music segment, which has only started to recover after almost two decades of
decline, while Publishing and Live should continue to show healthy growth and add $4 bn
and $14 bn of revenue respectively.
Exhibit 1: $50 bn of additional revenue opportunity mainly driven by recorded Music industry revenue split in bn, 2015 vs. 2030E
Source: IFPI, Goldman Sachs Global Investment Research.
We assess the size of the total addressable market by looking at the smartphone
population, consumer spending on entertainment and the advertising market (in particular
radio).
We forecast that paid streaming services will reach 9% of the global smartphone
population in 2030 from 2% in 2015 by extrapolating the 2015 penetration growth rate
of 50 bp. This level would still be below the average penetration for the top five paid
streaming markets of 11% in 2015 and less than half the penetration in Sweden and
Norway (over 20%), the most advanced markets. By comparison, Pay TV penetration is
48% of TV homes globally and SVOD (subscription video on demand) is 6% of
broadband homes (SNL Kagan/ Digital TV Research). In the US, Pay TV and SVOD are
in 85% and 48% of eligible homes compared to only 4% for music subscription.
Recorded $24
Publishing$5
Live Music $25
Recorded $56
Publishing $9
Live Music $38

October 4, 2016 Global: Media
Goldman Sachs Global Investment Research 10
Exhibit 2: We forecast global paid streaming penetration
to reach 9% by 2030E, slightly below the top five markets
today and less than half of the rate attained in Sweden Paid streaming penetration as % of smartphone subscribers
Exhibit 3: Paid streaming penetration stands at 2%
globally compared to 6% for SVOD and 48% for Pay TV Paid streaming penetration as % of smartphone subscribers,
SVOD penetration as % of broadband homes, Pay TV
penetration as % of TV homes, Smartphone penetration as %
of total population
Source: IFPI, ZenithOptimedia, Goldman Sachs Global Investment Research. Source: IFPI, Digital TV Research, SNL Kagan, ZenithOptimedia, Goldman Sachs Global Investment Research.
Exhibit 4: We expect music streaming to follow the path
of SVOD globally Global paid streaming penetration vs. SVOD penetration
Exhibit 5: Netflix’s penetration of eligible homes doubled
over three years to 16% in 2015 Global music paid streaming penetration vs. Netflix
international penetration of eligible homes
Source: IFPI, Digital TV Research, Goldman Sachs Global Investment Research. Source: IFPI, Digital TV Research, Company data, Goldman Sachs Global Investment Research.
0%
5%
10%
15%
20%
25%
2008
2009
2010
2011
2012
2013
2014
2015
2016E
2017E
2018E
2019E
2020E
2021E
2022E
2023E
2024E
2025E
2026E
2027E
2028E
2029E
2030E
Sweden Top 5 markets Western Europe Global
0%
10%
20%
30%
40%
50%
60%
70%
80%
90%
World Japan Germany US WesternEurope
Sweden
Music SVOD Pay TV Smartphone
0%
2%
4%
6%
8%
10%
12%
14%
16%
2010 2014E 2020E
SVOD Music streaming
0%
5%
10%
15%
20%
25%
30%2012
2013
2014
2015
2016
2017
2018
2019
2020
2021
2022
2023
2024
2025
2026
2027
2028
2029
2030
Netflix international penetration of eligible homes
Paid streaming penetration

October 4, 2016 Global: Media
Goldman Sachs Global Investment Research 11
Exhibit 6: Consumption of music streaming services comparable to SVOD Average weekly hours of streaming
Source: Press reports, Deezer.
Overall consumer spend on entertainment amounted to $1.3 tn in 2015 (Euromonitor),
with music accounting for 4.2% on our estimates. We forecast that share will rise to
5.6% in 2030, still well below the 7.6% attained in 1998. Based on overall consumer
spend, we expect music’s share to increase from 0.13% in 2015 to 0.15% in 2030,
compared to the 0.30% recorded in 1998.
Exhibit 7: Music revenue as % of entertainment spend
and overall consumer spend Entertainment includes: Recreational and Cultural Services,
Newspapers, Magazines, Books and Stationery
Exhibit 8: We forecast music revenue to remain below
1 pp of global nominal GDP by 2030, less than half the
share it had in 1998 Global music revenues as % of global nominal GDP
Source: Euromonitor, Goldman Sachs Global Investment Research. Source: World Bank, IFPI, Goldman Sachs Global Investment Research.
We forecast the ad funded, streaming market (including payments from YouTube,
Pandora, Spotify, etc.) to grow to $7.1 bn by 2030 from $1.5 bn currently. This
compares to a global advertising market worth $456 bn and global radio advertising
market worth $30 bn in 2015 as per MAGNA Global.
0
2
4
6
8
10
12
14
Vevo Netflix Pandora Hulu Spotify Amazon PrimeInstant Video
Deezer
Music Streaming Services
SVOD Services
0.10%
0.15%
0.20%
0.25%
0.30%
3.50%
4.00%
4.50%
5.00%
5.50%
6.00%
6.50%
7.00%
7.50%
8.00%
1998
2000
2002
2004
2006
2008
2010
2012
2014
2016E
2018E
2020E
2022E
2024E
2026E
2028E
2030E
% of entertainment spend (LHS) % of consumer spend
0.060%
0.080%
0.100%
0.120%
0.140%
0.160%
0.180%
0.200%
1998
2000
2002
2004
2006
2008
2010
2012
2014
2016E
2018E
2020E
2022E
2024E
2026E
2028E
2030E
% of Nominal GDP

October 4, 2016 Global: Media
Goldman Sachs Global Investment Research 12
Exhibit 9: The global addressable market for advertising
funded streaming is huge Advertising revenue by category ($ bn)
Exhibit 10: We expect digital radio and streaming
services to eat into the radio ad market in the US Advertising revenue by category ($ mn)
Source: MAGNA Global, IFPI. Source: MAGNA Global, IFPI, Goldman Sachs Global Investment Research.
Digging into the economics for stakeholders
Exhibit 11: Evolution of revenue pool for the different industry players Revenues, $ bn
Source: IFPI, PwC, Goldman Sachs Global Investment Research.
We believe the online innovators (interactive streaming platforms and ad funded services)
will grow to $14 bn of net revenue in 2030 from $1.4 bn today, assuming they retain a
distributor cut of 30%. With around 70% of their revenues being redistributed to rights
owners (71.5%/ 73% in the US/internationally in the case of Apple Music according to
Recode) and other COGS accounting for 10%-15%, this gives a gross margin of 15%-20% or
$6-8 bn of potential gross profit. We assume that pure streaming players (Spotify, Deezer,
Pandora, etc.) will account for 37% share of net subscriber additions over 2020-30E, Apple
Music 26% and other large tech players (Google, Amazon, etc.) 37%.
1.5 10.029.5
456.4
0
50
100
150
200
250
300
350
400
450
500
Total ad supportedstreaming
Programmaticadvertising
Global radioadvertising
Global advertising
0
5000
10000
15000
20000
25000
2003
2005
2007
2009
2011
2013
2015
2017E
2019E
2021E
2023E
2025E
2027E
2029E
US radio advertising Ad supported streaming SoundExchange Distributions
$0
$10
$20
$30
$40
$50
$60
$70
$80
$90
$100
$110
2007
2008
2009
2010
2011
2012
2013
2014
2015
2016E
2017E
2018E
2019E
2020E
2021E
2022E
2023E
2024E
2025E
2026E
2027E
2028E
2029E
2030E
Other (artists, songwriters, liveex ticketing)
Ticketing
Streaming
Label
Publishing
Download
Physical

October 4, 2016 Global: Media
Goldman Sachs Global Investment Research 13
For the incumbent labels, which receive around 55%-60% of the platforms’ revenue as
royalties, we forecast their revenue pool to grow to $35.5 bn in 2030 from $15 bn today
mainly through streaming. This compares to the current pool at risk of $9 bn from physical
and download sales. We believe profit growth could be even more meaningful as we
estimate margins are 15% in streaming and download and 8% in physical at present, with
the potential for streaming to grow to 20%-25% over time. This means $4-6 bn of additional
profit from streaming alone bringing the total pool to $9 bn, compared to the current pool
of $2 bn, of which $1 bn is from physical and downloads.
Exhibit 12: Streaming should help drive recorded music back to its 1999 peak by 2027 Global recorded music market breakdown ($ bn, LHS) vs. global music market growth (%, RHS)
Source: IFPI, Goldman Sachs Global Investment Research.
The incumbent publishers, who so far have been more insulated from digital disruption,
are also likely to gain as they receive around 10% of the platforms’ revenue as mechanical
and performance royalties. We forecast their revenue pool to grow to $7 bn in 2030 from
$4 bn in 2015, with streaming alone adding $3 bn of revenue. The main pool at risk (i.e.
physical mechanical royalties) is currently worth $0.6 bn on our estimates. Assuming
margin remains broadly unchanged at 30% as publishers do not benefit from the same
margin uplift in streaming as the labels, we forecast profit to double to $2 bn in 2030.
4%
0%
‐2%‐1%
‐5%
‐8%
‐7%
‐8%‐8%
‐6%
‐7%‐7%
‐5%
‐1%
1%
‐2%
0%
3%
4%
5%
7%6% 6% 6%
6% 6% 5%
‐10%
‐8%
‐6%
‐4%
‐2%
0%
2%
4%
6%
8%
$0
$5
$10
$15
$20
$25
$30
$35
$401998
1999
2000
2001
2002
2003
2004
2005
2006
2007
2008
2009
2010
2011
2012
2013
2014
2015
2016E
2017E
2018E
2019E
2020E
2021E
2022E
2023E
2024E
2025E
2026E
2027E
2028E
2029E
2030E
Physical Download Other Streaming Global market growth

October 4, 2016 Global: Media
Goldman Sachs Global Investment Research 14
Exhibit 13: Publishing – a $7 bn market by 2030 driven by
streaming Global music publishing market breakdown ($ bn)
Exhibit 14: Artists have become increasingly reliant on
touring Sources of artists income ($ bn)
Source: IFPI, Company data, Goldman Sachs Global Investment Research.
Source: Digital Music News.
For the live music segment, which has been the fastest growing area of the music industry,
streaming could also bring a significant revenue opportunity by leveraging listening data
for the marketing and promotion of live events and the possibility to connect directly with
fans, therefore increasing artist revenues and improving relationships with artists. We
forecast the market to grow to $38 bn by 2030 from $25 bn of revenue in 2015 according to
IFPI (International Federation of the Phonographic Industry). It is estimated that 40% of
tickets are currently unsold in the US (Billboard, September 4, 2010) and our analysis of
Pollstar data for over 5,000 live events in the United States over the last year shows an
average vacancy of 26% (29% for events at venues with fewer than 2,500 seats). Better
matching the supply and demand could save up to $2 bn of revenues for the US live
industry alone assuming 24 million tickets are unsold every year in the US at an average
price of $67.33 (WSJ, December 16, 2010).
Artists and songwriters should benefit from the recovery of the industry through the
contract royalties paid by labels/publishers and ongoing growth in live music. While much
of the recent focus has been on their income from royalties, we note that recorded music
has become a much less important source of revenue at 16% for the top 40 earning artists
compared to touring at 80% (this is not applicable to songwriters). Artists are also reported
to be earning 12% of gross contract royalties compared to 40% of the gross touring
revenue (Digital Music News). We believe that music creators will gain a stronger
bargaining position vs. the labels/publishers and the platforms as technology and new
disruptors (alternative label/publishers) will allow greater transparency and easier access to
users. This will be manifested through higher royalty payments from labels/publishers and
greater control over their IP over time. We estimate labels currently invest around 30%-35%
of their revenue (net of the publishing cut) in artists & repertoire and this may grow to 40%
or more over time. Meanwhile, we also expect publishers’ pay away to songwriters to rise
to c.55%-60% over time from 50% today.
$0.0
$1.0
$2.0
$3.0
$4.0
$5.0
$6.0
$7.0
2005
2006
2007
2008
2009
2010
2011
2012
2013
2014
2015
2016E
2017E
2018E
2019E
2020E
2021E
2022E
2023E
2024E
2025E
2026E
2027E
2028E
2029E
2030E
Physical mechanical Digital mechanical Performance royalties Sync Other
$0.0
$0.5
$1.0
$1.5
$2.0
$2.5
$3.0
$3.5
$4.0
$4.5
$5.0
1999 2000 2001 2002 2003 2004 2005 2006 2007 2008 2009 2010 2011 2012
Contact Royalties: 12% of gross Concerts Income 40% of gross
Freelance Sales Income 33% of gross

October 4, 2016 Global: Media
Goldman Sachs Global Investment Research 15
Regulation sets the stage – streaming positive for rights holders
The music industry is entrenched in a convoluted regulatory environment governing
copyrights and royalties and understanding its intricacies and the potential for change is
key. Our main focus will be the US, where we see the most upside for rights holders. We
believe the migration of listeners to online streaming is positive for labels/artists who enjoy
new sources of royalty payments in streaming as opposed to terrestrial radio where they
get paid nothing. Based on IFPI data, payments of nearly $3 bn were made to labels by
streaming services in 2015 and we expect that amount to increase to $11 bn in 2020 with
an average annual growth rate of 30% and to reach $28 bn by 2030 which is double the
current recorded music market size. Future regulatory reviews, notably of safe harbour
rules applicable to YouTube and of songwriting royalties applicable to interactive
streaming services, could drive further redistribution of revenue pools in favour of the
rights holders.
What are royalty payments?
Royalty payments are the method through which all the players involved in the production
of a song make money, yet they are extremely convoluted. When thinking about royalties
in the music industry, it is important to separate out the different copyrights, and so the
right to royalties, owned by different players. Songwriters own the rights to the lyrics and
melody of a piece of music, and these song copyrights are usually managed by music
publishers (we will often refer to songwriters/publishers together). Performance artists
own the rights to a particular recording of a song, known as the master recording, and
these master recording rights are usually assigned to record labels for management (we
will often refer to artists/labels together).
There are distinct types of royalties paid to rights owners. These royalty payments and the
way royalty rates are set vary significantly depending on how the song is accessed (AM/FM
vs. online radio, physical or digital purchase, streaming).
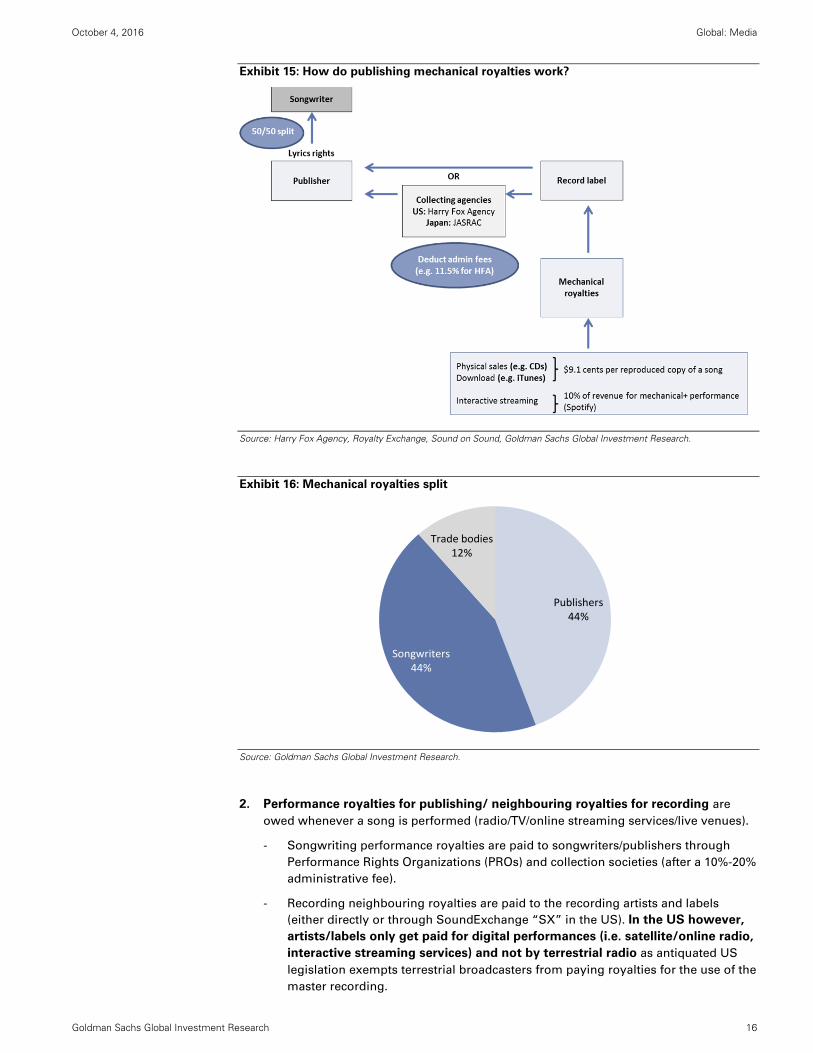
1. Mechanical royalties are owed whenever a song is manufactured onto a CD,
downloaded on a digital music site, or streamed through a service such as Spotify.
These are paid by the record label to the publisher (either directly or through a third
party organization such as Harry Fox Agency in the US). The publisher then shares
50% of its royalty with the songwriter. In the US, royalty rates are set by the
government through a compulsory license and are 1) either calculated on a penny
basis per song for physical/download, or 2) based on a formula for interactive
streaming services. Satellite and online radio such as Pandora or Sirius do not pay
mechanical royalties to publishers. In most countries outside of the US, royalties are
based on percentages of wholesale/consumer prices for physical/digital products
respectively and negotiated on an industry-wide basis.
October 4, 2016 Global: Media
Goldman Sachs Global Investment Research 16
Exhibit 15: How do publishing mechanical royalties work?
Source: Harry Fox Agency, Royalty Exchange, Sound on Sound, Goldman Sachs Global Investment Research.
Exhibit 16: Mechanical royalties split
Source: Goldman Sachs Global Investment Research.
2. Performance royalties for publishing/ neighbouring royalties for recording are
owed whenever a song is performed (radio/TV/online streaming services/live venues).
- Songwriting performance royalties are paid to songwriters/publishers through
Performance Rights Organizations (PROs) and collection societies (after a 10%-20%
administrative fee).
- Recording neighbouring royalties are paid to the recording artists and labels
(either directly or through SoundExchange “SX” in the US). In the US however,
artists/labels only get paid for digital performances (i.e. satellite/online radio,
interactive streaming services) and not by terrestrial radio as antiquated US
legislation exempts terrestrial broadcasters from paying royalties for the use of the
master recording.
Publishers44%
Songwriters44%
Trade bodies12%

October 4, 2016 Global: Media
Goldman Sachs Global Investment Research 17
Exhibit 17: How do performance royalties work?
Source: SoundExchange, Royalty Exchange, PRS for Music, Company data, Goldman Sachs Global Investment Research.
Exhibit 18: Terrestrial radio does not pay any performance royalties to labels/artists Estimated distribution of terrestrial radio performance royalties in the US
Source: Goldman Sachs Global Investment Research.
Publishers44%
Songwriters44%
PROs12%

October 4, 2016 Global: Media
Goldman Sachs Global Investment Research 18
3. Synchronisation or “sync” royalties are paid to songwriters/publishers and record
labels/artists for use of a song as background music for a movie, TV programme or
commercial, video game, etc. There is no explicit rate that defines the compulsory
percentage of royalty that must be paid. This will mostly depend on the commercial
value of the work to those who want it and on the media to be used. Sync royalties are
usually equally split between labels, artists, publishers and songwriters.
Exhibit 19: Estimated distribution of sync royalties to rights holders
Source: Goldman Sachs Global Investment Research.
Artists/Labels are the main beneficiaries of the move to streaming
The evolution of consumption from terrestrial to digital on one hand, and from ownership
to access on the other, has profound implications for the rights holders.
1. The move from analogue to satellite or internet radio services creates a new
revenue stream for artists/labels who get paid nothing by terrestrial radio.
The US is one of the few countries where terrestrial radio operators are exempted from
paying any performance royalties to labels and artists (although they are required to pay
the publishers and songwriters). This situation is inherited from the long-standing
argument that labels and artists receive important free promotion through radio play. With
analogue radio’s share of listening declining and other meaningful discovery platforms
emerging such as YouTube, social media or streaming services’ playlists, we see a strong
case for this rule to change over time but, as a US music lawyer puts it, it will likely face
strong lobby opposition. In the meantime, we expect to see more bilateral commercial
agreements (see later section “3. Compounding this already positive picture is the move by
many analogue operators to sign deals with labels to receive preferential royalty rates in
order to launch their own digital services”).
With the introduction of streaming services and online radio, US legislation evolved to
create a statutory license for digital audio transmissions and require the payment of
performance royalties by such services under the Digital Performance in Sound Recording
Act of 1995 and the Digital Millennium Copyright Act (“DMCA”) of 1998. The ongoing shift
of listeners from terrestrial radio to online radio and streaming services is therefore
incremental for labels and artists.
Labels, 25%
Artists, 25%
Publishers, 25%
Songwriters, 25%

October 4, 2016 Global: Media
Goldman Sachs Global Investment Research 19
Exhibit 20: Nearly half of digital radio listening is
displacing AM/FM in the US Survey, Summer 2013
Exhibit 21: While AM/FM consumption remains dominant
overall, streaming services are increasingly popular for
younger age groups Daily listening to streaming service vs. AM/FM by age group,
US, 2014
Source: Edison Research Streaming Audio Task Force, Summer 2013/ IAB.
Source: Activate.
The rate paid by non-interactive services such as Sirius or Pandora is set every five years
by the Copyright Royalty Board (CRB), a panel composed of three federal judges. Anyone
regulated by the CRB splits performance royalties on fixed terms with 50% going to the
label, 45% to the artist, and 5% to the Musicians’ Union after SoundExchange fees are
deducted. In contrast, on-demand streaming services such as Spotify or Tidal negotiate
their rates on the free market.
Leading digital radio service Pandora has historically paid on a pay-per-play basis under
CRB rules. The latest CRB ruling for 2016-2020 set these rates at $0.17 and $0.22 for ad-
funded and subscription services respectively in 2016, and these will be adjusted annually
to reflect changes in the Consumer Price Index for 2017-20. However, Pandora has just
negotiated direct deals with record labels, and the terms of those deals will supersede the
CRB ruling. The exception is the deal with Warner Music, under which Warner will continue
to distribute the artists’ share of the statutory ad-funded rates through SoundExchange.
Our US Internet team expects Pandora to pay $1.65 bn in total content acquisition costs in
2020 (50% of its online radio revenue) up from $610 mn in 2015 (45% of its online radio
revenue excluding one-offs). The increase is primarily driven by the launch of Pandora’s
on-demand offering in 4Q16, from which the company expects to pay 65-70% of revenue.
Leading satellite radio operator Sirius XM pays a flat fee out of its gross revenues. This rate
has progressively increased by c.50 bp pa from 7.0% in 2010 to 10.0% in 2015 and is set to
rise to 11.0% by 2017. Sirius XM paid royalty fees of $405 mn in 2015, up from $174 mn in
2010 – an 18.5% CAGR (vs. a 7.9% CAGR in subscriber growth). Our US Telecoms team
forecasts these fees to rise to $712 mn by 2020 at a CAGR of 12%. On January 5, 2016, CRB
started a new proceeding to set music royalties for the 2018-2022 five-year period.
44%
30%
26% Mostly replacing local"over‐the‐air" AM/FMradio stations
Mostly replacing yourCDs/MP3 collection
It's new time; not timetaken from radio orCDs/MP3s
55%
35%
17%
6%
45%
65%
83%
94%
0% 20% 40% 60% 80% 100%
13‐17
17‐34
34‐55
55+
Age
Streaming Services AM/FM

October 4, 2016 Global: Media
Goldman Sachs Global Investment Research 20
Exhibit 22: We forecast Pandora’s royalty fees to increase
to $1.65 bn in 2020 from $610 mn in 2015
Exhibit 23: We forecast Sirius XM’s royalty fees to
increase to $712 mn in 2020 from $405 mn in 2015
Source: Company data, Goldman Sachs Global Investment Research.
Source: Company data, Goldman Sachs Global Investment Research.
2. In our view the rise of on-demand streaming services is even more positive for
rights owners as compared to satellite/internet radio
Streaming services pay away a higher share of their revenue to rights holders than
satellite and online radio. As on-demand streaming royalties are negotiated on the free
market, streaming services generally pay c.70% of their revenues to labels and publishers
(90/10 split) similar to the levels physical and digital retailers pay. Apple Music pays a
slightly higher rate of 71.5% in the US and 73% elsewhere according to Recode. Pandora
has stated that its on-demand offering will pay 65-70% of associated revenue to rights
holders, and overall the company pays out 54% of music revenue to rights holders. Prior to
signing the direct deals with rights holders, Pandora paid c.45% of its online radio revenues
royalties in 2015 (excluding one-offs). Sirius XM, by contrast, pays away around 10% of
their revenue as royalties as they benefit from lower CRB-regulated rates.
Based on reported streaming revenue of $1.9 bn in 2015, this implies that roughly $1.361
bn was paid as royalties to labels/publishers in 2015 alone.
Exhibit 24: On-demand streaming services pay away around 70% of the revenue compared
to 10% for Sirius XM and 45% for Pandora radio in 2015
Source: Company data, Goldman Sachs Global Investment Research.
$0
$200
$400
$600
$800
$1,000
$1,200
$1,400
$1,600
$1,800
0.0%
10.0%
20.0%
30.0%
40.0%
50.0%
60.0%
70.0%2012
2013
2014
2015
2016
2017
2018
2019
2020
Pandora total royalty payments % of online radio revenue (LHS)
0.0%
2.0%
4.0%
6.0%
8.0%
10.0%
12.0%
14.0%
16.0%
0
100
200
300
400
500
600
700
800
2010
2011
2012
2013
2014
2015
2016E
2017E
2018E
2019E
2020E
Sirius XM royalty payment ($mn, LHS) Sirius Royalty rate (% of sales)
0%
10%
20%
30%
40%
50%
60%
70%
80%
Sirius XM Pandora On‐demand streaming
Royalty payments as % of Revenues subject to royalties
October 4, 2016 Global: Media
Goldman Sachs Global Investment Research 21
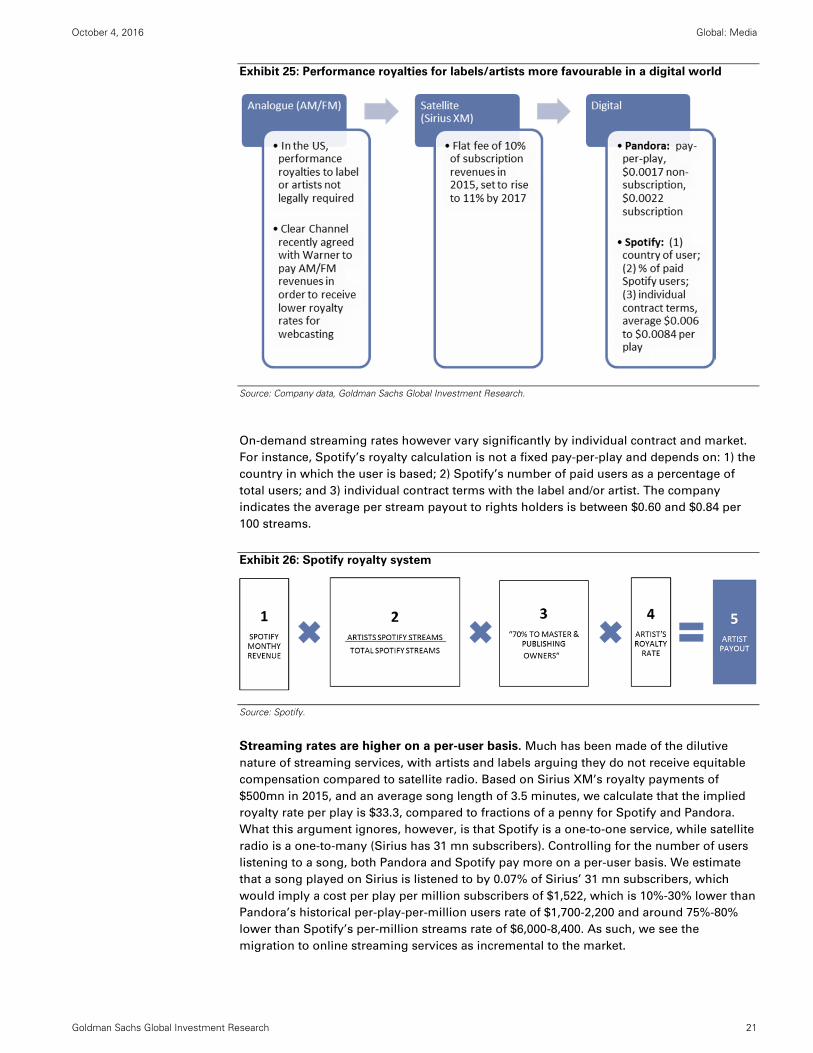
Exhibit 25: Performance royalties for labels/artists more favourable in a digital world
Source: Company data, Goldman Sachs Global Investment Research.
On-demand streaming rates however vary significantly by individual contract and market.
For instance, Spotify’s royalty calculation is not a fixed pay-per-play and depends on: 1) the
country in which the user is based; 2) Spotify’s number of paid users as a percentage of
total users; and 3) individual contract terms with the label and/or artist. The company
indicates the average per stream payout to rights holders is between $0.60 and $0.84 per
100 streams.
Exhibit 26: Spotify royalty system
Source: Spotify.
Streaming rates are higher on a per-user basis. Much has been made of the dilutive
nature of streaming services, with artists and labels arguing they do not receive equitable
compensation compared to satellite radio. Based on Sirius XM’s royalty payments of
$500mn in 2015, and an average song length of 3.5 minutes, we calculate that the implied
royalty rate per play is $33.3, compared to fractions of a penny for Spotify and Pandora.
What this argument ignores, however, is that Spotify is a one-to-one service, while satellite
radio is a one-to-many (Sirius has 31 mn subscribers). Controlling for the number of users
listening to a song, both Pandora and Spotify pay more on a per-user basis. We estimate
that a song played on Sirius is listened to by 0.07% of Sirius’ 31 mn subscribers, which
would imply a cost per play per million subscribers of $1,522, which is 10%-30% lower than
Pandora’s historical per-play-per-million users rate of $1,700-2,200 and around 75%-80%
lower than Spotify’s per-million streams rate of $6,000-8,400. As such, we see the
migration to online streaming services as incremental to the market.

October 4, 2016 Global: Media
Goldman Sachs Global Investment Research 22
Exhibit 27: The shift to digital consumption drives higher royalty payments in the US Royalty per million streams, 2015
Source: Spotify, Goldman Sachs Global Investment Research.
Pandora’s move to on-demand streaming presents upside for rights holders. Pandora
recently announced direct licensing agreements with record labels to launch an on-demand
streaming service in the US in 2H16 alongside its existing digital radio service. Under the
terms of the deal with UMG, Sony and independent labels, Pandora will pay away 65%-
70% of its subscription revenue to rights holders (while the CRB arrangements led to a pay
away rate in 1H16 of roughly 45% of its online radio subscription revenue). In conjunction
with these direct deals, Pandora also negotiated new terms for its ad-funded online radio
service and will pay away a LPM (licensing cost per 1,000 listener hours) of around $33
from roughly $31 previously. The terms of the deal with Warner on the subscription service
are unknown, but we would expect them to be similar to the other labels.
With Pandora targeting $1.3 bn of subscription revenue by 2020 without cannibalizing its
existing ad-funded radio business, this presents significant upside for the rights holders
given the expansion of Pandora’s addressable market and the higher royalties in on-
demand streaming as opposed to online radio. This will disproportionately benefit the
labels, who typically receive 74% of the royalties from on-demand services compared to
40% from online radio, while artists’ share will move to 11% from 40% (we argue however
that artists’ absolute royalties will still be higher in the on-demand world).
Exhibit 28: Estimated distribution of Pandora’s
performance/neighbouring royalties
Exhibit 29: Estimated distribution of interactive
streaming performance/neighbouring royalties in the US
Source: Goldman Sachs Global Investment Research.
Source: Goldman Sachs Global Investment Research.
$41
$1,522 $1,700 $2,200
$3,000
$6000‐8400
US terrestrial Sirius XM Pandora, free Pandora,subscription
Video streaming Spotify
Labels40%
Artists40%
SoundX4%
Publishers7%
Songwriters7%
PROs2%
Labels74%
Artists11%
Publishers7%
Songwriters7%
PROs2%
October 4, 2016 Global: Media
Goldman Sachs Global Investment Research 23
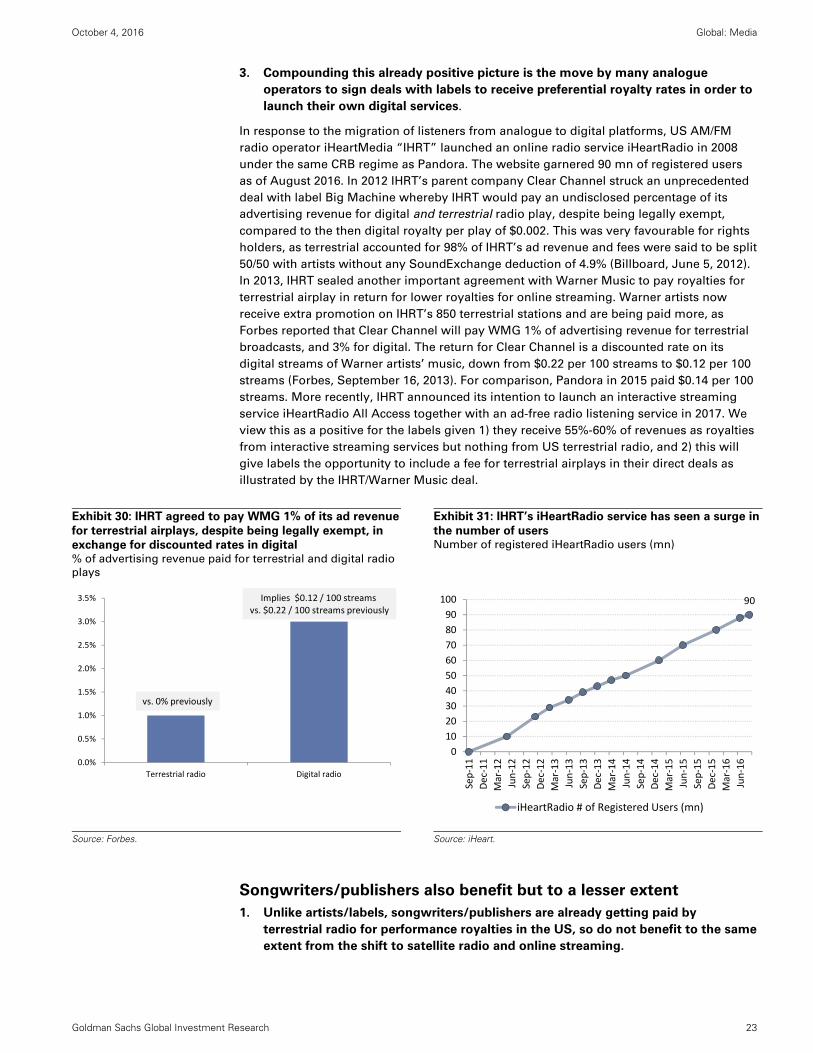
3. Compounding this already positive picture is the move by many analogue
operators to sign deals with labels to receive preferential royalty rates in order to
launch their own digital services.
In response to the migration of listeners from analogue to digital platforms, US AM/FM
radio operator iHeartMedia “IHRT” launched an online radio service iHeartRadio in 2008
under the same CRB regime as Pandora. The website garnered 90 mn of registered users
as of August 2016. In 2012 IHRT’s parent company Clear Channel struck an unprecedented
deal with label Big Machine whereby IHRT would pay an undisclosed percentage of its
advertising revenue for digital and terrestrial radio play, despite being legally exempt,
compared to the then digital royalty per play of $0.002. This was very favourable for rights
holders, as terrestrial accounted for 98% of IHRT’s ad revenue and fees were said to be split
50/50 with artists without any SoundExchange deduction of 4.9% (Billboard, June 5, 2012).
In 2013, IHRT sealed another important agreement with Warner Music to pay royalties for
terrestrial airplay in return for lower royalties for online streaming. Warner artists now
receive extra promotion on IHRT’s 850 terrestrial stations and are being paid more, as
Forbes reported that Clear Channel will pay WMG 1% of advertising revenue for terrestrial
broadcasts, and 3% for digital. The return for Clear Channel is a discounted rate on its
digital streams of Warner artists’ music, down from $0.22 per 100 streams to $0.12 per 100
streams (Forbes, September 16, 2013). For comparison, Pandora in 2015 paid $0.14 per 100
streams. More recently, IHRT announced its intention to launch an interactive streaming
service iHeartRadio All Access together with an ad-free radio listening service in 2017. We
view this as a positive for the labels given 1) they receive 55%-60% of revenues as royalties
from interactive streaming services but nothing from US terrestrial radio, and 2) this will
give labels the opportunity to include a fee for terrestrial airplays in their direct deals as
illustrated by the IHRT/Warner Music deal.
Exhibit 30: IHRT agreed to pay WMG 1% of its ad revenue
for terrestrial airplays, despite being legally exempt, in
exchange for discounted rates in digital % of advertising revenue paid for terrestrial and digital radio
plays
Exhibit 31: IHRT’s iHeartRadio service has seen a surge in
the number of users Number of registered iHeartRadio users (mn)
Source: Forbes.
Source: iHeart.
Songwriters/publishers also benefit but to a lesser extent
1. Unlike artists/labels, songwriters/publishers are already getting paid by
terrestrial radio for performance royalties in the US, so do not benefit to the same
extent from the shift to satellite radio and online streaming.
0.0%
0.5%
1.0%
1.5%
2.0%
2.5%
3.0%
3.5%
Terrestrial radio Digital radio
vs. 0% previously
Implies $0.12 / 100 streams vs. $0.22 / 100 streams previously
90
0
10
20
30
40
50
60
70
80
90
100
Sep‐11
Dec‐11
Mar‐12
Jun‐12
Sep‐12
Dec‐12
Mar‐13
Jun‐13
Sep‐13
Dec‐13
Mar‐14
Jun‐14
Sep‐14
Dec‐14
Mar‐15
Jun‐15
Sep‐15
Dec‐15
Mar‐16
Jun‐16
iHeartRadio # of Registered Users (mn)

October 4, 2016 Global: Media
Goldman Sachs Global Investment Research 24
2. For mechanical royalties in the US, streaming currently offers lower royalty rates
than physical/downloads. But there is upside from higher streaming
consumption and the upcoming CRB review.
Publishers/songwriters currently receive a $0.091 mandated rate per reproduced copy of a
song (CD, vinyl, MP3, etc.) independently of whether that copy is sold. Outside of the US
the rate typically varies in the range 8%-10% of wholesale prices for physical
products/consumer prices for digital products, according to digital music distribution
company TuneCore. When moving to interactive streaming services, the government-
mandated rate is at least 10.5% of the gross revenue after deduction of the payments to
collection societies such as ASCAP (the American Society of Composers, Authors and
Publishers), BMI (Broadcast Music, Inc.) and SESAC (The Society of European Stage
Authors and Composers).
This would imply average payment per 100 streams of about $0.05 according to music
royalty collection company Audiam. We calculate this implies that 182 streams of one song
would be needed to equate to the mechanical royalty generated from one reproduction.
Using the Recording Industry Association of America (RIAA) and Nielsen data for the
number of physical and digital copies sold and the number of audio streams consumed, we
calculate that there were 113 more audio streams consumed than physical/digital copies
sold in 2015 meaning streaming is currently dilutive. However, we forecast that ratio to
grow to 209:1 in 2016 and 1180:1 by 2020. Even though the growth in streaming value does
not follow the growth in consumption (Spotify’s paid streaming ARPU does not depend on
individual consumption, although ad-funded revenues do), we believe the increase in
streaming consumption will be able to compensate for lower royalty rates. Warner Music’s
2015 10K form reveals that its revenue from digital mechanical royalties exceeded physical
for the first time in 2015.
The upcoming CRB review of songwriting mechanical rates applicable to interactive
streaming services such as Spotify or Deezer could totally change the way
songwriters/publishers are getting paid (see next section).
Exhibit 32: 182 streams of one song currently needed to
match the revenue from one unit sale – we forecast the
number of streams in comparison to unit sales to exceed
182 from 2016
Exhibit 33: Digital mechanical royalties are already
exceeding physical for Warner Warner/Chappell breakdown of publishing revenue, $ mn
Source: Goldman Sachs Global Investment Research.
Source: Warner Music Group data.
3. In Japan, the online shift is positive for songwriters/publishers, as physical
mechanical royalty rates are typically 1%-2% lower than digital to compensate for their higher manufacturing costs known as the “record cover fee”.
0
200
400
600
800
1000
1200
1400
2013 2014 2015 2016E 2017E 2018E 2019E 2020E
1 reproduction =182 streams 0
50
100
150
200
250
300
2005
2006
2007
2008
2009
2010
2011
2012
2013
2014
2015
Physical Mechanical Performance Synchronisation
Digital Mechanical Other

October 4, 2016 Global: Media
Goldman Sachs Global Investment Research 25
Future regulatory changes could present upside for rights holders
1. The US review of safe harbour rules and implications of the recent EU Copyright
proposal will be important in addressing the value gap between the usage and
monetization of music on platforms such as YouTube.
What are safe harbour rules? These provisions exempt passive, neutral hosting platforms
from copyright infringement liability for the actions of their users. Put another way, online
service providers, including YouTube and internet service providers, are not responsible
for vetting whether or not the users are putting copyright cleared content on their platform.
When rights holders find evidence of copyright infringement, they have to submit a formal
notice to YouTube for instance to request a copyright takedown. To its credit, YouTube has
a finger printing system called Content ID, which enables labels and artists to identify and
manage their work and entitle them to a share of the advertising revenue (if any).
Why do they matter? Many artists and industry bodies have complained about YouTube’s
use of those safe harbours which give it an unfair advantage in negotiations with rights
holders. For instance, a label which does not sign a licensing deal with YouTube will have
to actively monitor that its content does not appear on YouTube and if so request it to be
removed. YouTube also shares 55% of its music ad revenue with rights holders (according
to Music Business Worldwide “MBW”), with labels receiving 45% and publishers 10%.
This compares to the standard 70% payout rate from other non-regulated platforms (iTunes,
Spotify, etc.), with labels receiving 60% and publishers 10%. This situation has resulted in a
rising “value gap” between the amount of streams consumed on YouTube and their
monetization for rights holders. YouTube accounted for 40% of overall music listening
according to Apple Music’s Jimmy Iovine, with c.90% of the 900 mn ad-supported music
users reported by IFPI, and yet generated only 4% of global recorded music revenues ($634
mn in 2015), which is lower than the revenues from vinyl sales. In contrast, paid streaming
revenues were almost 4x higher at $2.3 bn in 2015 and were generated by only 68 mn
paying users.
What’s next? The EC just came out with its highly anticipated draft Copyright Directive.
The new proposals will require platforms such as YouTube to enter negotiation with rights
holders in good faith and put in place “appropriate and proportionate” measures to
identify and remove unlicensed copyrighted content, therefore putting greater
responsibility on/demanding more proactivity from the platform owners. Previously the
likes of YouTube had to wait for a formal takedown request from rights holders – this will
still be the case, however, if no agreement has been reached. We believe that YouTube
should be less impacted than other services as it already has effective content recognition
and removal processes in place. Nonetheless, as the EC puts it, this should “reinforce the
position of rights holders to negotiate and be remunerated for the online exploitation of
their content on video-sharing platforms such as YouTube or Dailymotion.” These
proposals will still need to go to Parliament and individual member states for approval,
while the effective implementation of such measures remains unclear and is likely to take
time.
Separately, the US Copyright Office is currently reviewing copyright rules including safe
harbour provisions (also called DMCA 512 in the US) with a decision expected in 2017. In
April 2016, 400 artists, songwriters and music bodies sent a letter to the US Copyright
Office pleading for reforms to the DMCA. They were followed by another 180 artists and
songwriters (including Taylor Swift, Lady Gaga, Paul McCartney, etc.) in June.
2. The CRB is currently engaged in proceedings to set the new mechanical
songwriting royalty rates applicable to interactive music services for 2018-2022,
with a decision expected by end-2017.
This review will be much in focus, given Apple’s recent proposal that all interactive
streaming services should pay a statutory rate of $0.091 per 100 streams. Note that this
rate would not apply to Apple given that it has direct deals with publishers in place. The
current rate is set as a percentage of revenue and varies depending on whether the user is

October 4, 2016 Global: Media
Goldman Sachs Global Investment Research 26
a subscriber or non-subscriber – on average it implies around $0.05 per 100 steams
according to Audiam. A move towards a higher, unified rate would be more damaging for
freemium streaming services, although positive for songwriters/publishers.
Exhibit 34: Ad-funded services (mainly YouTube)
generated 4x less revenue than paid streaming despite
13x more users
Exhibit 35: The value gap: YouTube accounts for 40% of
music listening but 4% of recorded music revenue
Source: IFPI.
Source: Apple, IFPI.
Exhibit 36: Labels receive a lower share of royalties from YouTube than from other digital
services Estimated split of YouTube vs. industry standard music royalties
Source: Music Business Worldwide, Press reports, Goldman Sachs Global Investment Research.
3. Potential changes to copyright protection of pre-1972 sound recordings.
Songs recorded before February 15, 1972, are currently not protected by US federal
copyright law, but are protected under state law in some jurisdictions. This resulted in CRB-
regulated entities such as Pandora and Sirius XM not paying royalties for their use. In 2015,
Pandora and Sirius XM both agreed to settle with the major labels for $90 mn and $210 mn,
respectively, for the use of such rights until end-2016 for Pandora and end-2017 for Sirius
XM. Unless regulation evolves to include pre-1972 recordings in US federal law, the two
players will need to extend their deals with labels to keep playing those songs.
4. The CRB has commenced proceedings to set new royalties for digital
performance of sound recordings to be paid by satellite radio service Sirius XM
for 2018-2022.
0
5
10
15
20
25
30
35
0
500
1,000
1,500
2,000
2,500
Subscription Ad‐supported
Users (m, LHS) Revenue ($m, LHS) ARPU ($)
0%
5%
10%
15%
20%
25%
30%
35%
40%
45%
Youtube proportion of musicconsumption
Youtube proportion of recorded musicrevenue
Youtube Music revenue split Standard revenue split (iTunes, Spotify etc)
Labels, 45%
Publishers, 10%
Youtube, 45%
Labels, 60%
Publishers, 10%
Platform, 30%

October 4, 2016 Global: Media
Goldman Sachs Global Investment Research 27
An interview on EU music regulation with…
An interview with…
John Enser, Head of Music and Partner, Olswang
John is Head of Music and a
Partner in the Media Team at
international law firm Olswang
LLP. Acknowledged as an expert in
all of the leading directories of
lawyers, his client-base includes
record companies, broadcasters,
other content aggregators and
distributors and mobile operators
as well as companies that invest in and lend to the sector.
What are the main regulatory intricacies in Europe?
One of the key challenges is fragmentation: whilst on the
recording side you can do deals that cover the entire
European landscape by doing deals with the majors and
Merlin (which represents the indie labels), on the publishing
side, it is exceedingly complex and an ever moving picture
because of the role of the collecting societies, who control
both the performing right and, often, also the copying right,
both of which are needed for digital exploitation. In many
countries, a collecting society is granted exclusive rights
directly from the composers, so music publishers aren’t in a
position to aggregate rights. That leaves a pretty messy
picture where, to launch a pan-European service you need to
do around 30 deals on the publishing side – and realistically
you can't launch a service without getting the vast majority
of the repertoire. That clearly is good for the big players and
gives a significant barrier to entry. This is part of the reason
why Pandora packed up and went home some years ago.
How are royalties set in Europe?
Contrary to the US, in Europe it is more of a free market, but
it does vary from country to country. In some countries there
are tribunals, arbitration bodies, like the CRB in the US
although not as powerful, that set the rates. The UK is
probably the closest structure to the US. In most of
continental Europe, the collecting societies often have some
degree of royalty rates review by some form of government
agency with various degrees of rigour and independence.
How does the safe harbour regime work and how does
that benefit YouTube?
The way it works effectively is that, because YouTube
doesn’t have editorial control, if somebody else posts a
video onto YouTube, their only obligation is to take it down
once they’re on notice. They don’t have to do anything until
then and they don’t have to stop that going back up again.
So, they have the Content ID tool which enables rights
holders to make their own choices based on whether the
rights holder wants the material removed or is willing for
it to be left in return for a revenue share. But the problem
is that if you choose not to be part of the Content ID
scheme, all that you can do is to have your material taken
down and it keeps coming back up again. YouTube argues
that they do license their rights, but, from the label
perspective, it is always with one hand tied behind their
back, as it is under the threat that YouTube will just use
the safe harbour. Sure, they do have deals with all the
majors, but the economics of those deals are different
from what they would be if there was no safe harbour
regime.
The safe harbour works in a similar way in respect of true
pirate sites, Pirate Bay and the like, where the music
industry want to make it harder for people to find those
sites. For that reason, the music industry has sent billions
of take down notices to Google – that’s about the search
engine, rather than YouTube – if you search for the newest
Rihanna single, the chances are that 4 out of the top 10
research results will be pirate pages. So, the debate is
partly about Google and search engines, about them
taking more responsibility to get rid of links to pirate sites
and to keep those links down. The YouTube issue is
slightly different but it is very similar because the
argument is if you don’t play along with YouTube’s way of
doing things, the only thing you can do is send DMCA
complaint notices and have the material disappear only to
pop back up again. So your choices are to either get rid of
it or monetize it on their terms.
The EC just released its draft copyright package - what
could the implications be?
Platforms making available large amounts of copyright
material which is uploaded by users will be required to
enter into negotiations with rights owners in good faith
and to put in place "appropriate and proportionate"
measures to ensure the functioning of those agreements
with rights-holders in relation to the use of their works.
Some platforms, like YouTube, have these processes in
place already but not all do and even those that do are
subject to on-going criticism for not ensuring that
infringing content stays down. The Commission believes
that the fact that many platforms benefit from the safe

October 4, 2016 Global: Media
Goldman Sachs Global Investment Research 28
harbour, meaning effectively that they are not the ones
responsible for communicating the copyright works to the
public, makes for an uneven negotiation between platform
and rights-holder. The notice and take down procedures that
emanate from the E-Commerce Directive will continue to
apply if no agreement is in place or the content cannot be
identified using "appropriate and proportionate"
measures. This will clearly impact on the Google search
example mentioned above, but how far it would move the
balance of power between the labels and YouTube is not
very clear. Judging by the welcome the draft received from
the music industry, it is seen as a move in the right direction.
The draft package now falls to be considered by the so-called
Council of Ministers (the representatives of the governments
of each Member State) and the European Parliament. Both
processes are likely to lead to extensive amendments to the
draft. The Parliament is likely to want to protect the
platforms, in what they see as the consumer interest, while
the Member States are more inclined to support the industry
(and that mostly means the indigenous content industries
who are seen to be threatened by the largely US-
headquartered platform operators).
We are therefore talking about a period from 18 months to
up to 3 years before these things actually become law in
individual member states. It is hard to see YouTube or other
intermediaries doing very much ahead of any change in the
law, unless they think that by doing so, they might stave off
a more onerous regime.
Can artists force transparency to be able to show the
economics and flow of payments?
To some extent I think it will happen. Again, the draft
proposals of the European Commission include specific
obligations which will increase transparency (if they survive
the legislative process). There has been a lot said by artists
about this, which isn’t always necessarily reflective of the
way deals work. As an example, if you have a deal let’s say
between Spotify and a major label, there will be a pot of
money that Spotify allocates to rights holders. The label will
get a share of that based upon the usage and plays of that
label’s repertoire. The area where the artists get very excited
about is the chunks of money that the labels get that are not
directly allocated to plays – whether that’s a marketing
advance or other fees. The transparency concern is about
how much of that is really money that is being paid in
respect of artists' repertoire that the artists are not getting
their share of.
Labels will say that they are being transparent with their
artists and the artists just don’t trust them. Part of it is the
perception that the amount of money flowing through
from streaming services is just not big enough. It is not
about the labels hiding money, it is about labels trying to
support the migration of their business model and
recognizing that, for them in order to do that, they will not
get the like-for-like amount they were getting for an iTunes
sale.
How easy is it for an artist to change labels or go direct
to a streaming service?
Typically artist deals don’t last more than 3 or 4 albums,
that’s down from in the worst days 7 albums. Subject to
the fact that once you’ve recorded the first two, you
renegotiate the terms and you give the label another two
so you’re always 4 albums away from the end of your
deal. But it also means that there is an end in sight, if you
decide you don’t like your label, you don’t want to
renegotiate after two years, you let it run and then you go
away. The difficulty with that is that your old label gets to
keep the existing material. So the challenge you then get
is that your new material is going out with a different
label, but the old label is sitting on the stuff that made you
successful in the first place. What also tends to happen is
that you’ll put out your new album and then 6 months
later your old label puts out your greatest hits.
What have been the mistakes that the industry made
in the past?
Some of the mistakes of the past have been overstated.
There has been a lot of criticism about labels not moving
fast enough to licensed download services. It is slightly
unfair because part of the problem was that that they
didn’t have the rights in place. Piracy got out of the bag at
the same time. You could argue that the biggest mistake
was the introduction of the CD format without robust
rights protection mechanisms. I do think that allowing
Apple to become virtually the single major download
retailer was a mistake that they have learned from and
they will make sure that choice remains in the streaming
market. There are still things that they can learn from – the
reluctance to explore different business models – one
example would be that there are people who won't pay
$9.99 a month for access to 40m tracks; but would they
pay for access to a more limited, more curated service at a
different price point? Will the labels be flexible enough to
allow a service to introduce that?

October 4, 2016 Global: Media
Goldman Sachs Global Investment Research 29
An interview on US music regulation with…
An interview with…
Leslie Jose Zigel, Chair of Entertainment Practice, Greenspoon Marder
Leslie José Zigel is a shareholder
and Chair of Greenspoon Marder’s
Entertainment Practice, focusing
on both the creative and business
sides of the entertainment
industries in the music, TV, film
and new technology sectors. Mr.
Zigel is known for representing
Pitbull and other Latin stars
including Colombia's Carlos Vives
and urban hitmaker Wisin.
Do you think there is potential for broader music
regulatory reform globally, including intervention on
radio’s right to free plays in certain markets?
There is an opportunity, but it will depend on a lot of factors.
I don’t think anything will happen before the presidential
election in the US. There are very strong lobbying and
interest groups that will drive the legislative discussion. Take
the example of US terrestrial radio that, unlike its European
counterparts, has managed to avoid paying neighbouring
rights royalties. In 1995 when the Copyright Act was
amended, digital transmission neighbouring rights were
introduced (and later further codified under the Digital
Millennium Copyright Act when Sound Exchange was set
up), and webcasting services like Internet radio stations (and
more recently, Pandora), along with Sirius and XM satellite
radio (the two later merged into what is now known as Sirius
XM) became obligated to pay the US equivalent of
neighbouring rights royalties. I do think there is potential for
legislative action, but in what direction it will go is anybody’s
guess.
How does streaming change the way royalty rates are
being set? How does that affect the various parties?
Economically, streaming pays a percentage of revenues
versus a per unit royalty as is the case with physical and
digital sales. I like to look at this revenue stream from a
business perspective. It is easy to say that streaming
services like Spotify pay very little per stream, but to be
intellectually honest, one needs to look at the overall
business model. Of the 100% revenue pie, Spotify keeps 30%
and pays 70% to rights owners. Within that 70%, labels and
publishers have to split the amount among them. Labels
generally take a higher percentage of that pie than
publishers, as is the case with physical and digital sales.
This harkens back to the industry perspective that labels
invest much more to sell the “single” than publishers so
they are entitled to more. In terms of impact, there is a
constant fight for publishers to receive more money and
the labels want to maintain their larger share. It is a
complex proposition. How we get there is a question for
the future – one should take a step back and think about
the right split and value proposition of each party. Having
too many entrenched lobbyists doesn’t help either.
What is the debate around the “safe harbour” rules?
The safe harbour provision says that the ISPs and
platforms like YouTube are not responsible for vetting
whether or not the users are putting copyright cleared
content on their platforms. Their only obligation is to take
down content if they receive a notice from the content
owner that something on their site is a copyright violation.
To give you an example, in 2007 Viacom sent a take-down
notice to YouTube claiming that over 150,000 Viacom clips
were illegally being hosted on YouTube. YouTube
promptly took the clips down and claimed safe harbour
protection. This still occurs today and the copyright
owners have to notify YouTube each time they see a new
clip of their content. It’s like a game of Whack-a-mole
where they take down one infringer only for 5 more to pop
up. So content owners feel the safe harbour rules don’t go
far enough to impose an obligation on YouTube and
others to vet the content uploaded to their sites. By
contrast, on television, TV networks and show producers
have to clear all musical content before it is aired – there is
no safe harbour and as a result networks and producers
are very vigilant about clearing music cues and rights
owners make significant amounts in licensing fees as a
result. To its credit, YouTube has a finger printing system
that identifies music on user generated content and helps
labels and publishers receive a share of the advertising on
the videos that YouTube identifies on the YouTube
platform. One effective change could be to enact a “take
down and stay down” approach whereby the ISP could
add the digital fingerprint of non-licensed content they are
told to take down into a database which would then be
used to prevent the same user (or another) from re-
uploading the work to the service.
October 4, 2016 Global: Media
Goldman Sachs Global Investment Research 30
What could be done to improve music monetization?
My view is we should look at music as a utility. If you look at
all the traffic on internet service providers (ISPs). – music
drives a significant percentage of their traffic and thus their
income. However, it is difficult to ascribe precisely how
music fits into each user interaction on these sites. These
sites work on subscription-based business models and
collect advertising dollars based on eye balls and not a one-
for-one commercial exchange of music to listener for a fee. If
40% of these sites’ traffic is related to music in some
tangential way, why not create a pool of a few percentage
points of their gross revenues to be paid to the rights owners
much like radio stations pay into BMI and ASCAP? Of course
there will be a fight between labels and publishers as to how
to carve up the pie, but this scenario would provide a much
needed cash infusion to rights owners who help ultimately
drive significant traffic (and value) to these sites.
What is your view on the global state of piracy
regulation/ enforcement?
Global piracy regulation can be better. What will change
piracy is the advent of services that pay artists. Take the
example of Sweden that saw a dramatic decline in piracy in
early 2000s with the launch of Spotify from 90% piracy to
approximately 5% piracy today. I think people will ultimately
pay if you give them a service where they can watch/listen to
what they want, when they want, on a device/medium of
their choosing at a reasonable price. If the service and the
experience are good, people will pay. Government
regulation can only go so far to combat piracy.
We’ve recently seen Pandora and Sirius settling with
labels on pre-1972 recordings – do you see scope for
these recordings to be included in federal copyright law?
These recordings should be part of what these services pay
for in the future. The law says they don’t have to, but players
like Sirius or Pandora make revenues on those rights so it is
only fair that they should pay for it. I think the law should
change, but there are strong lobbyists against this
proposition. From an artist’s point of view, if they have
enough leverage they can renegotiate. Otherwise, it doesn’t
really happen. As a general principal, if the copyright in the
recordings is still valid, those recordings should receive the
same protection as their brethren recorded post-1972.
What are the implications from a royalty’s point of
view of Pandora’s recent move into paid streaming?
Pandora accounted for around 60% of Sound Exchange’s
total royalty collections of about $1bn in 2015 for what is
known as non-interactive streaming. The change in
Pandora’s business model to now include interactive
streaming (like Spotify and Apple Music where you can
select the songs you want to hear on-demand) has a
massive impact from an artist’s perspective. Artists enjoy
getting their money from SoundExchange rather than
through a label. The fear is Pandora will now pay the
labels directly (like Spotify and Apple Music) meaning
artists will be subject to their record royalty of 15% that
could be cross-collateralized against their royalty account
instead of being paid 45% of each dollar of Pandora’s
overall recording-related royalties directly each month. As
the new Pandora on-demand interactive streaming model
siphons off users from its non-interactive streaming
platform, SoundExchange royalties could go down
significantly.
How do you think of exclusivity and windowing in
terms of its impact on the industry as a whole?
I’m not in favor of exclusives. I believe ubiquity is best for
an artist. Why would an artist want to alienate their fan
base and not allow them to listen to their songs from week
one? Artists should not be in the business of forcing
consumers to adopt one platform or another.
To put this into perspective, this would be akin to artists
saying you can only play your album on a Panasonic
turntable instead of a Sony turntable so buy a Panasonic
to listen to my music! This only benefits Panasonic, or in
today’s world Apple, Tidal or Spotify. I think the
windowing will be good in the short term for the
streaming services but bad ultimately for artists and worst
of all for consumers.

October 4, 2016 Global: Media
Goldman Sachs Global Investment Research 31
Streaming drives greater monetization for music owners
The music industry faces the paradox of an ever growing demand for music consumption
and a low propensity to pay for it. Some 93% of the US population listens to music and
spends more than 25 hours a week doing so according to Nielsen. Yet, less than half of the
population in developed markets pays for music – YouTube even estimates only 20% of the
global population has been a buyer of music. Moreover, the average spend per person on
recorded music is only around $15 in developed markets and $1 in EM in 2015, based on
IFPI data. This compares to an average spend per person on entertainment of around
$1,095 in developed markets based on Euromonitor data.
The monetization potential for the music industry is therefore huge we believe, but much
of this potential is still being hindered by piracy and cultural factors. How and why could
consumer propensity to pay for music change?
We see two distinct types of consumers and ways to address them: a) paid streaming
addresses the portion of consumers who are willing to pay for better access and
convenience, and b) ad-funded streaming helps address those who are not willing to pay
(partly because of piracy) or cannot afford it by shifting illegal streaming to legal, better
quality, more convenient streaming services which are equally free for the user. This could
have significant implications in EM where up to 90% of music content is pirated according
to IIPA (International Intellectual Property Alliance).
Exhibit 37: The shift to legal streaming has the potential to improve monetization for all types of music users Breakdown of average spend and type of users based on French data – four scenarios
Source: SNEP, Goldman Sachs Global Investment Research.
Heavy buyers (>€100)
Medium buyers (€30‐
€100)
Small buyers (€1‐€30)
Non‐buyers (€0)
More likely to shift to ad‐funded – all incremental
More likely to shift to mix paid streaming/ ad funded
More likely to shift to ad funded
More likely to shift to paid streaming
0% 1% 2% 3% 4% 5%
0% ‐€ 1.2€ 2.4€ 3.6€ 4.8€ 6.0€
20% 2.8€ 4.0€ 5.2€ 6.4€ 7.6€ 8.8€
40% 5.6€ 6.8€ 8.0€ 9.2€ 10.4€ 11.6€
60% 8.4€ 9.6€ 10.8€ 12.0€ 13.2€ 14.4€
80% 11.2€ 12.4€ 13.6€ 14.8€ 16.0€ 17.2€
100% 14.0€
% Ad funded
% paid streaming0% 2% 4% 6% 8% 10%
10% 1.4€ 3.8€ 6.2€ 8.6€ 11.0€ 13.4€
20% 2.8€ 5.2€ 7.6€ 10.0€ 12.4€ 14.8€
30% 4.2€ 6.6€ 9.0€ 11.4€ 13.8€ 16.2€
40% 5.6€ 8.0€ 10.4€ 12.8€ 15.2€ 17.6€
50% 7.0€ 9.4€ 11.8€ 14.2€ 16.6€ 19.0€
60% 8.4€ 10.8€ 13.2€ 15.6€ 18.0€ 20.4€
% paid streaming
% Ad funded
20% 30% 40% 50% 60% 70%
20% 26.8€ 38.8€ 50.8€ 62.8€ 74.8€ 86.8€
30% 28.2€ 40.2€ 52.2€ 64.2€ 76.2€ 88.2€
40% 29.6€ 41.6€ 53.6€ 65.6€ 77.6€
50% 31.0€ 43.0€ 55.0€ 67.0€
60% 32.4€ 44.4€ 56.4€
70% 33.8€ 45.8€
% Ad funded
% paid streaming
50% 60% 70% 80% 90% 100%
0% 60.0€ 72.0€ 84.0€ 96.0€ 108.0€ 120.0€
10% 61.4€ 73.4€ 85.4€ 97.4€ 109.4€
20% 62.8€ 74.8€ 86.8€ 98.8€
30% 64.2€ 76.2€ 88.2€
40% 65.6€ 77.6€
50% 67.0€
% paid streaming
% Ad funded

October 4, 2016 Global: Media
Goldman Sachs Global Investment Research 32
1. Greater consumer willingness to pay for convenience and access
Streaming has totally revolutionized the way people listen to music, offering seamless
access to a near-infinite library of songs (compare Walmart’s estimated 21,000 tracks on
shelves to Spotify’s 30 mn), anywhere and anytime, and enabling greater personalization
through curated playlists and more interactivity. This has led to a strong surge in
consumption of online music and, in particular, on mobile devices. The US population
alone consumed c.114 bn audio streams during 1H16, representing a 97% yoy jump
according to Nielsen, which implies around 630 mn streams per day. This trend is likely to
grow from here, driven by:
Further improvement of fixed and mobile broadband infrastructure, especially roll out
of 4G (and later 5G) enabling 6x more data consumption as compared to non 4G
connection.
The proliferation of connected devices, especially smartphones, and the growing share
of time spent on mobile devices. A March 2016 study from Parks Associates found that
68% of smartphone owners listen to streaming music at least once a day in the US and
that average time spent is 45 minutes.
The proliferation of streaming services – IFPI counted c.400 platforms globally and 57
interactive streaming services in the US alone.
Exhibit 38: Smartphone penetration continues to rise Smartphone subscribers, % of total handsets
Exhibit 39: 4G is expected to reach 43% device share by
2020… Global mobile devices by 2G, 3G, 4G
Source: Gartner, Goldman Sachs Global Investment Research.
Source: Cisco VNI Mobile.
Exhibit 40: …driving 6x more traffic than a non-4G
connection Global mobile traffic by connection type
Exhibit 41: US on-demand music streams have risen 3x
over the last two years US audio and video streams (bn)
Source: Cisco VNI Mobile.
Source: Cisco VNI Mobile.
‐10%
0%
10%
20%
30%
40%
50%
60%
70%
80%
90%
100%
2003
2004
2005
2006
2007
2008
2009
2010
2011
2012
2013
2014
2015
2016E
2017E
North America Western Europe South KoreaJapan China IndiaRussia Brazil
0
0.5
1
1.5
2
2.5
3
3.5
4
4.5
2015 2016 2017 2018 2019 2020
Billions of Devices or Connections
2G 3G 4G
43%
14%
53%
33%
14%
2015 2016 2017 2018 2019 2020
2G 3G 4G
27%
<1%
47%
43%
10%
72%
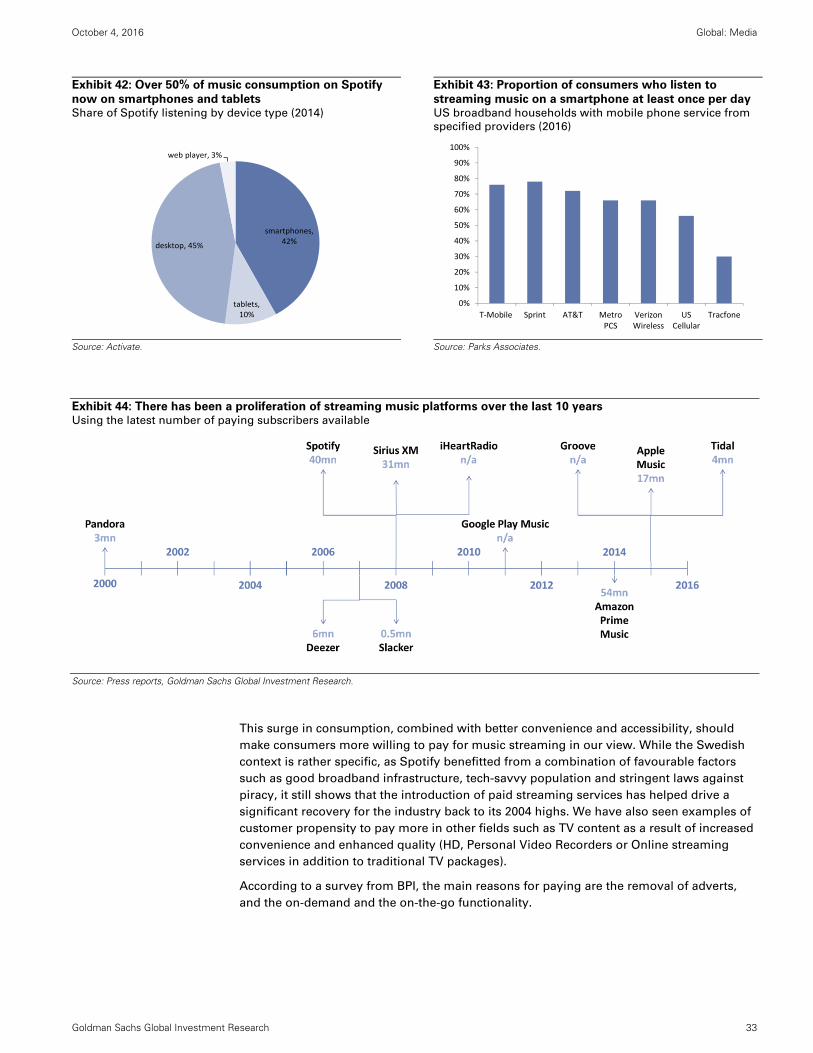
October 4, 2016 Global: Media
Goldman Sachs Global Investment Research 33
Exhibit 42: Over 50% of music consumption on Spotify
now on smartphones and tablets Share of Spotify listening by device type (2014)
Exhibit 43: Proportion of consumers who listen to
streaming music on a smartphone at least once per dayUS broadband households with mobile phone service from
specified providers (2016)
Source: Activate.
Source: Parks Associates.
Exhibit 44: There has been a proliferation of streaming music platforms over the last 10 years Using the latest number of paying subscribers available
Source: Press reports, Goldman Sachs Global Investment Research.
This surge in consumption, combined with better convenience and accessibility, should
make consumers more willing to pay for music streaming in our view. While the Swedish
context is rather specific, as Spotify benefitted from a combination of favourable factors
such as good broadband infrastructure, tech-savvy population and stringent laws against
piracy, it still shows that the introduction of paid streaming services has helped drive a
significant recovery for the industry back to its 2004 highs. We have also seen examples of
customer propensity to pay more in other fields such as TV content as a result of increased
convenience and enhanced quality (HD, Personal Video Recorders or Online streaming
services in addition to traditional TV packages).
According to a survey from BPI, the main reasons for paying are the removal of adverts,
and the on-demand and the on-the-go functionality.
smartphones, 42%
tablets, 10%
desktop, 45%
web player, 3%
0%
10%
20%
30%
40%
50%
60%
70%
80%
90%
100%
T‐Mobile Sprint AT&T MetroPCS
VerizonWireless
USCellular
Tracfone

October 4, 2016 Global: Media
Goldman Sachs Global Investment Research 34
Exhibit 45: Streaming helped the Swedish recorded market recover in seven years the
value it had lost in five years Sweden music sales revenues (Skr mn)
Source: IFPI.
Exhibit 46: Sky customers have been paying more for add-on products and services Estimated Sky UK Pay TV ARPU breakdown
Source: Company data, Goldman Sachs Global Investment Research.
SEK 0 mn
SEK 200 mn
SEK 400 mn
SEK 600 mn
SEK 800 mn
SEK 1,000 mn
SEK 1,200 mn
SEK 1,400 mn
SEK 1,600 mn
SEK 1,800 mn
2002 2003 2004 2005 2006 2007 2008 2009 2010 2011 2012 2013 2014 2015
CD Single CD Album Video Streaming Downloads
Pirate Bay launched in Sep‐03
Spotify launched in Oct‐08
iTunes launch
0
50
100
150
200
250
300
350
400
450
500
2009 2010 2011 2012 2013 2014 2015
Core pay TV HD Multiroom Transactional

October 4, 2016 Global: Media
Goldman Sachs Global Investment Research 35
Exhibit 47: Users are willing to pay for greater
convenience and accessibility Reasons for Paying for Music Streaming
Exhibit 48: Streaming users value the vast library,
discoverability and seamless experience the most How important are the following to you?
Source: BPI.
Source: BPI.
A lot of questions have been raised about the propensity of consumers to move to a 120
per annum price point (local currency) subscription, given the annual average spend of a
music buyer is on average €36.8 in France and £52.42 in the UK, with a wide dispersion of
spend per person. In France, 7% of the overall population spends more than €100, 24%
spends €30-€100 and 23% less than €30, with 46% not paying anything. In the UK, we
calculate that 8% of the population spends £170, 8% spends £49, and 24% spends between
£4 and £25 on average, with 60% of the population not spending anything. We see
opportunities to address these different needs and budgets through more segmented
offerings and price points.
The full, “all you can eat” on-demand service typically has a monthly 9.99 price point
(in local currency) in DM. We believe this will be appealing for the c.10% of the
population who are already heavy buyers (>€120 in France, £170 in the UK), but also to
a portion of the 15%-20% of medium buyers who spend on average €30-100 in France
and £25-49 in the UK.
For the light to medium buyers, we believe lower price points could be attractive
including telecom bundles, student plans (50% discount to standard price) and also
family plans (Apple Music has a $14.99 plan which can be shared by up to six family
members). We believe more price points will be introduced with varying degrees of
functionality and content availability in the future to better segment customers.
Amazon is reportedly planning to launch a $4-5 monthly on-demand service that would
be streamed solely on Echo, its voice-controlled speaker and digital assistant. Pandora
is also reportedly introducing multiple price tiers for its new on demand service,
including one at $5 which allows users to soft-download a limited number of tracks.
In Emerging Markets, most “all you can eat” services have a price point of c.$4 for the
likes of Apple Music or Spotify.
2. Ad-funded streaming helps address users who do not want or
cannot afford to pay for music
We believe people currently not paying anything for music (including many piracy users)
could be attracted to streaming services via: 1) free, ad-funded tiers (which have lower
functionality than the paid tier), 2) free trials (e.g., Apple Music’s 3-month free trial), and 3)
subsidies (student plans, telecom bundles or family plans). We believe these are powerful
marketing tactics that would give the opportunity to discover the service, appreciate the
3%
9%
19%
21%
22%
24%
27%
29%
42%
0% 10% 20% 30% 40% 50%
Don't know / Not sure
Saw it advertised and liked the look of it
Was using the free version but wanted to listen offline
Came bundled with another product/service (e.g. speaker ormobile)
Recommendation from friends/family
Was using the free version but wanted to choose exactly whatI was listening to
Wanted use on my mobile device
Was using the free version but wanted to remove adverts
Converted from free trial period to paid full version
0% 10% 20% 30% 40% 50% 60% 70% 80% 90% 100%
Having access to millions of tracks
Discovering lots of new music easily
Ability to listen on different devices/differentlocations
Streaming music helps to support the artists
To keep up with the latest hits
Having access to reccommendations/curatedcontent
Watching music videos/visuals whilst listening tothe music
Building my streaming playlists/collections
Creating streaming playlists/collections to sharewith my friends
Very Fairly Not that Not at all

October 4, 2016 Global: Media
Goldman Sachs Global Investment Research 36
convenience and curation capabilities and ultimately hook the consumer and drive
conversion to paid streaming. Recent data have been encouraging in this regard, with
Spotify’s proportion of paid users rising from 7% in 2010 to c.25%-30% in 2012-15 and
more recently to 33% following the introduction of a $0.99 promotion for three months
subscription in several territories. We examine in a later section how streaming could have
an even bigger impact in emerging markets where piracy usage is as high as 90%.
Streaming has proven to reduce illegal downloads…
Piracy has long been one of the major challenges in the music industry either in its digital
or physical form, and the principal driver of the collapse of the recording music industry in
the 2000s. IFPI estimates that there were tens of billions of files downloaded illegally in
2014. The Social Science Research Council estimates that piracy costs the US music
industry alone $12 bn compared to the actual $7 bn US retail recorded music market (RIAA).
A number of actions have been taken in the last decade either technological (e.g.
automating large-scale takedowns of infringing links and mobile applications), educational
(e.g. adverts) or legal (lawsuits, anti-piracy legislation). While these efforts will continue to
be important, we believe the proliferation of online streaming services could be a more
potent incentive to curb piracy. Multiple studies have demonstrated the positive impact of
legal streaming:
The proportion of internet users worldwide regularly accessing unlicensed services on
desktop-based devices went down to 20% in 2015 from 30% in 2012
(IFPI/ComScore/Nielsen).
An IPSOS MMI report found that the number of illegally copied songs in Norway
plummeted to 210 mn in 2012 from 1.2 bn in 2008 (the year of Spotify’s launch in the
country), while in the meantime legal streaming penetration increased to 10.3% in 2012
from 4.5% in 2011.
A study from the European Commission in 2015 revealed that the number of illegal
downloads decreases by one for every 47 Spotify streams.
A Spotify study showed that overall music piracy volume fell by over 20% between
December 2012 and December 2013, with casual pirates being converted to legal
services but hard core pirates persisting.
Exhibit 49: 55% of 18-29 year olds in Spotify’s markets
are pirating less now that they have a free alternative Respondents choosing to “pirate less” when given a free and
legal alternative
Exhibit 50: Spotify’s growth has coincided with declines
in peer-to-peer download sites following recent tougher
regulation Online use of Spotify vs. The Pirate Bay in the Netherlands
Source: Columbia University ‘Copyright Infringement and Enforcement in the US’.
Source: ComScore.
55%pirateless
40%
40%16%
0%
10%
20%
30%
40%
50%
60%
70%
18‐29 30‐49 50‐64 65+
0.0 mn
0.5 mn
1.0 mn
1.5 mn
2.0 mn
2.5 mn
3.0 mn
Dec‐11
Jan‐12
Feb‐12
Mar‐12
Apr‐12
May‐12
Jun‐12
Jul‐12
Aug‐12
Sep‐12
Oct‐12
Nov‐12
Dec‐12
Spotify
The Pirate Bay

October 4, 2016 Global: Media
Goldman Sachs Global Investment Research 37
… but many challenges remain, putting YouTube at the center of the debate
With YouTube being the most accessed platform for free online and mobile music
consumption, there has unsurprisingly been a growing debate and scrutiny over
YouTube’s role in fighting piracy. An IPSOS survey in 13 key markets revealed that 82% of
YouTube’s 1.3 bn users listen to music, and that 57% of internet users have accessed music
through video sites such as YouTube in the past six months, compared to 38% for
streaming services such as Spotify and 26% for digital stores such as iTunes.
YouTube-based stream ripping the new form of music piracy replacing torrent
sites. Stream-ripping essentially means illegally converting legal streams into
downloads through ripper sites. IFPI reckons stream-ripping has become the most
popular form of piracy, with almost half of 16-24 year olds engaging in such activities.
Anti-piracy tech company Muso also found that stream-ripping makes up 18% of all
visits to piracy sites for music content and that torrent sites have been partly displaced
by YouTube ripper sites. We believe this will remain a challenge for the future
monetization of music.
Exhibit 51: There are fewer people using torrent sites… Global monthly visits to public torrent sites (bn)
Exhibit 52: …as more people are directly downloading
music videos from YouTube Global monthly visits to YouTube ripper sites (mn)
Source: Muso.
Source: Muso.
The debate about efficiency of YouTube’s Content ID. As a passive and neutral
hosting service under EU and US copyright laws, YouTube is not liable for copyright
infringement taking place on its platform. It is up to the rights holders to submit
takedown notice claims and manage their content through Content ID, a copyright-
management system that allows them to track and then choose to block or monetise
user-generated content that uses their IP. This creates a disconnect between the
amount of copyrighted content being consumed and its monetization (see section
Regulation sets the stage). Music rights holders argue that Content ID is not efficient
enough in preventing copyright infringement and fails to identify 20%-40% of their
recordings (IFPI). YouTube responded that it solves 98% of copyright issues and that
music rights holders choose to monetise more than 95% of their Content ID claims
rather than get the videos removed from YouTube.
3. Streaming increases the value of catalogues
Streaming improves discoverability and monetization of back catalogues, thus turning a
one-off transaction into an annuity of cash flows. Catalogue songs (i.e., older than 18
months) accounted for 70% of all streaming volume in 2015, compared to 50% of overall
physical and digital album sales (Nielsen). This comes at a time when physical sales of
2.0
2.5
3.0
3.5
Jan‐15
Feb‐15
Mar‐15
Apr‐15
May‐15
Jun‐15
Jul‐15
Aug‐15
Sep‐15
Oct‐15
Nov‐15
Dec‐15 400
420
440
460
480
500
520
540
560
580
600
Jan‐15
Feb‐15
Mar‐15
Apr‐15
May‐15
Jun‐15
Jul‐15
Aug‐15
Sep‐15
Oct‐15
Nov‐15
Dec‐15
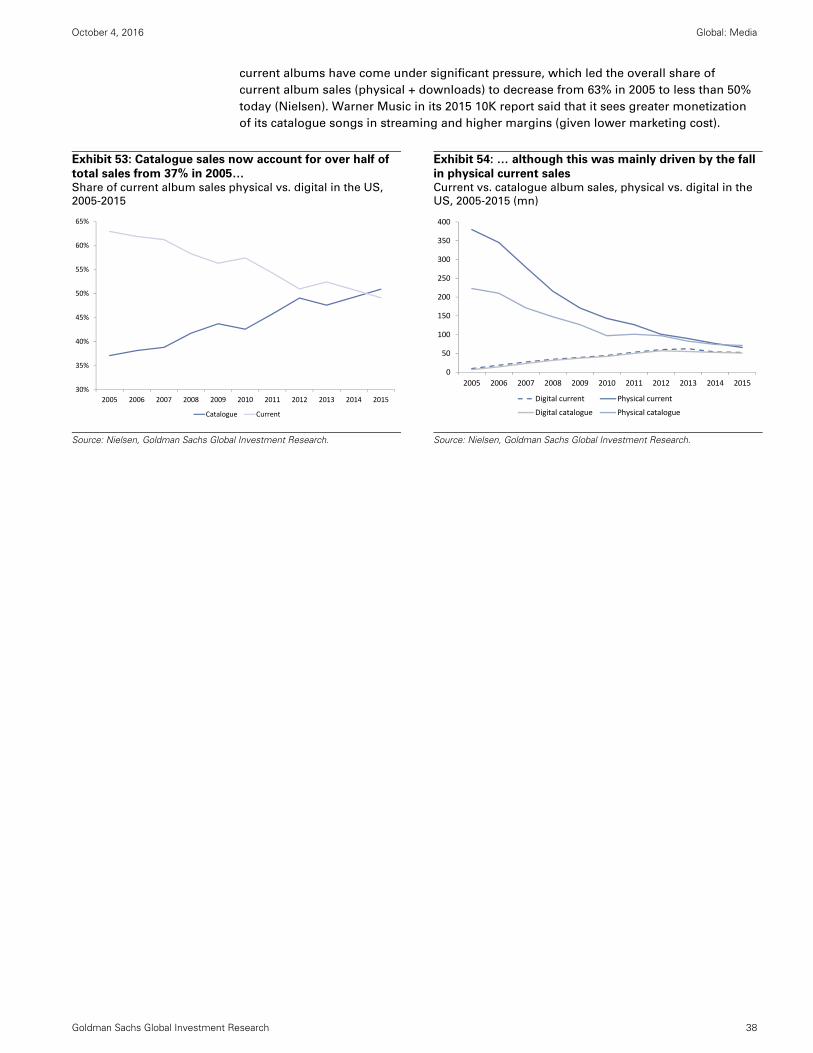
October 4, 2016 Global: Media
Goldman Sachs Global Investment Research 38
current albums have come under significant pressure, which led the overall share of
current album sales (physical + downloads) to decrease from 63% in 2005 to less than 50%
today (Nielsen). Warner Music in its 2015 10K report said that it sees greater monetization
of its catalogue songs in streaming and higher margins (given lower marketing cost).
Exhibit 53: Catalogue sales now account for over half of
total sales from 37% in 2005… Share of current album sales physical vs. digital in the US,
2005-2015
Exhibit 54: … although this was mainly driven by the fall
in physical current sales Current vs. catalogue album sales, physical vs. digital in the
US, 2005-2015 (mn)
Source: Nielsen, Goldman Sachs Global Investment Research.
Source: Nielsen, Goldman Sachs Global Investment Research.
30%
35%
40%
45%
50%
55%
60%
65%
2005 2006 2007 2008 2009 2010 2011 2012 2013 2014 2015
Catalogue Current
0
50
100
150
200
250
300
350
400
2005 2006 2007 2008 2009 2010 2011 2012 2013 2014 2015
Digital current Physical current
Digital catalogue Physical catalogue

October 4, 2016 Global: Media
Goldman Sachs Global Investment Research 39
Streaming benefits from a growing and captive audience
1. Growing penetration of paid subscription services led by DMs
With 90% of the recorded music revenue globally being concentrated in DMs, and an
average ARPU of $120 in subscription streaming compared to around $50 for the average
music buyer, the future take-up of paid streaming services in those markets will be a key
driver of the overall recovery of the music industry. We see plenty of room to improve the
penetration rate (currently at 3% on average) in DMs and catch up with the most advanced
markets (the Nordics) which are already over 20%.
Paid streaming penetration growth has been accelerating
Streaming services have been available over the past 10 years, but we have observed a
material acceleration in adoption over the past four years. The number of paying users
grew to 68 mn in 2015 from 8 mn in 2010 (virtually all in DMs), driving a revenue increase
to $2.3 bn in 2015 (15% of recorded music revenue) from $0.3 bn in 2010 based on IFPI data.
We still see plenty of room for growth, with total population penetration only at 0.9% in
2015 or 2% of smartphone users.
Exhibit 55: The number of paying users increased to 68
mn in 2015 (2% of smartphone users) from 8 mn in 2010Paid interactive streaming users (mn) worldwide and
penetration of smartphone/ total population
Exhibit 56: Paid streaming now accounts for 15% of total
music revenue Paid streaming revenue ($ bn, LHS) vs. % share of recorded
music revenues (RHS)
Source: IFPI, Goldman Sachs Global Investment Research.
Source: IFPI.
We calculate that the top 10 streaming markets were already at 8% of the population in
2015, with Sweden and Norway the most advanced markets at over 20% in 2015 (Deezer
reckons that Sweden was close to 30% as of September 2016). The next 10 markets were
still at 2% and the rest of the world only 0.2%. Encouragingly, penetration growth has been
accelerating, up 36 bp globally in 2015 vs. +16 bp pa over 2011-14. This was also the case in
the 10 most advanced markets, up 190 bp in 2015 vs. 160 bp pa over 2011-14. The next 10
markets grew 80 bp in 2015 vs. 30 bp and the rest of the world 10 bp vs. 2 bp.
0.0%
0.5%
1.0%
1.5%
2.0%
2.5%
0
10
20
30
40
50
60
70
80
2010 2011 2012 2013 2014 2015
Paid users (mn, LHS) % of smartphone users % of population
0%
2%
4%
6%
8%
10%
12%
14%
16%
0.0
0.5
1.0
1.5
2.0
2.5
3.0
3.5
2005 2006 2007 2008 2009 2010 2011 2012 2013 2014 2015
Paid streaming revenue (LHS) Paid streaming as % of total revenue

October 4, 2016 Global: Media
Goldman Sachs Global Investment Research 40
Exhibit 57: A wide disparity of paid streaming adoption Paid streaming penetration, 2015
Exhibit 58: Growth in penetration has been acceleratingPaid streaming penetration growth (absolute)
Source: IFPI, Goldman Sachs Global Investment Research.
Source: IFPI, Goldman Sachs Global Investment Research.
Exhibit 59: Extrapolating 2015 penetration growth rates would result in 18% penetration
on average in the top 10 markets vs. 8% today, 6% in the next 10 vs. 2% today Top 20 markets in terms of subscription streaming penetration
Source: IFPI, Goldman Sachs Global Investment Research.
Improving free-to-paid conversion rates
Underpinning this is the improved free-to-paid conversion rates seen across the industry in
the past few years, with the ratio of paid users vs. total users rising from 15% in 2010 to
33% in 2015, based on IFPI data and our estimates. For instance, the proportion of paid
users at Spotify increased from 7% in 2010 to 28% at the end of 2015 and 33% as of August
2016 following the introduction of a $0.99 promotion for three months in several territories.
Although not a direct comparison, Apple reported that its streaming service had 15 mn
users of which 6.5 mn were paying and the remainder on the free trial as of October 2015,
implying a conversion rate of 43%. Since then, Apple has not given any split, but
commented that it has not changed much. Eddie Cue: “We’re not giving out any numbers,
but we’ve been very happy with the results we’ve seen. And it’s stayed very consistent - it
hasn’t really changed at all, which I thought was interesting.” (Billboard, June 15, 2016).
0%
2%
4%
6%
8%
10%
12%
14%
16%
18%
20%
Sweden
Norw
ay
Den
mark
South Korea
Finland
New
Zealand
Netherlands
USA UK
Australia
Switzerland
France
Hong Kong
Germ
any
Japan
Belgium
Taiwan
Can
ada
Spain
Singapore
Italy
Emerging markets 0.0%
0.5%
1.0%
1.5%
2.0%
2012 2013 2014 2015
Top 10 markets Next 10 markets Rest
0.0%
5.0%
10.0%
15.0%
20.0%
25.0%
30.0%
2011 2012 2013 2014 2015 2016E 2017E 2018E 2019E 2020E
Sweden
Norway
Denmark
South Korea
Finland
New Zealand
Netherlands
USA
UK
Australia
Switzerland
France
Hong Kong
Germany
Japan
Belgium
Taiwan
Canada
Spain
Singapore

October 4, 2016 Global: Media
Goldman Sachs Global Investment Research 41
We expect that ratio to continue to rise and reach 37% by 2020 as consumers increasingly
value the convenience of the service and streaming players focus more on the paid model
(note all recent launches have been paid only such as Apple Music, Deezer in the US,
YouTube Red, with Amazon, Pandora and iHeartRadio also entering the space).
Exhibit 60: The proportion of paid as % of total streaming users increased to 33% in 2015
from 15% in 2010 across all services Total streaming users: paid vs. ad supported (mn, LHS)
Source: IFPI, Goldman Sachs Global Investment Research.
Exhibit 61: Conversion rates have improved for Spotify Spotify total subscribers: ad-based and paying (mn, LHS) vs.
paying subs as % of total subscribers (%, RHS)
Exhibit 62: 43% of Apple Music users were paying as of
October 2015 Apple Music total subscribers: free trial and paying (mn)
Source: Spotify, Press reports.
Source: Apple, Press reports.
0%
5%
10%
15%
20%
25%
30%
35%
40%
0
100
200
300
400
500
600
700
800
2010
2011
2012
2013
2014
2015
2016E
2017E
2018E
2019E
2020E
Paid users Ad‐funded users Paid / total streaming users (RHS)
35
7
15
20
28 30 35
39
7%
21%
25% 25% 25%27%
28%30%
35%33%
0%
5%
10%
15%
20%
25%
30%
35%
0
20
40
60
80
100
120
2010 2011 2012 2013 2014 Jun‐15 Dec‐15 Mar‐16 Jun‐16 Aug‐16
Advertising based users (m) Paying Subs (m) Paying Subs/Total Subs (RHS)
6.5
10.011.0
13.015.0
17.0
8.5
0.0
2.0
4.0
6.0
8.0
10.0
12.0
14.0
16.0
18.0
Oct‐15 Dec‐15 Feb‐16 Apr‐16 Jun‐16 Sep‐16
Paying Subs (m) Free Trial Subs (m)
43% paid users
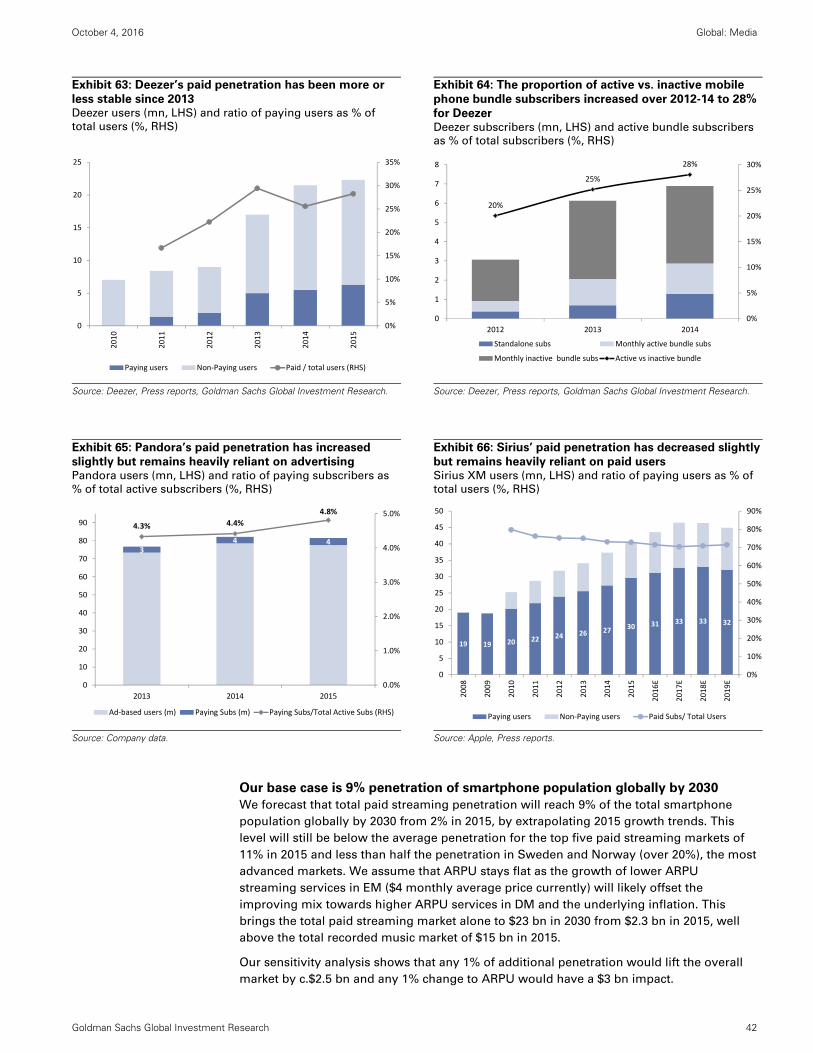
October 4, 2016 Global: Media
Goldman Sachs Global Investment Research 42
Exhibit 63: Deezer’s paid penetration has been more or
less stable since 2013 Deezer users (mn, LHS) and ratio of paying users as % of
total users (%, RHS)
Exhibit 64: The proportion of active vs. inactive mobile
phone bundle subscribers increased over 2012-14 to 28%
for Deezer Deezer subscribers (mn, LHS) and active bundle subscribers
as % of total subscribers (%, RHS)
Source: Deezer, Press reports, Goldman Sachs Global Investment Research. Source: Deezer, Press reports, Goldman Sachs Global Investment Research.
Exhibit 65: Pandora’s paid penetration has increased
slightly but remains heavily reliant on advertising Pandora users (mn, LHS) and ratio of paying subscribers as
% of total active subscribers (%, RHS)
Exhibit 66: Sirius’ paid penetration has decreased slightly
but remains heavily reliant on paid users Sirius XM users (mn, LHS) and ratio of paying users as % of
total users (%, RHS)
Source: Company data. Source: Apple, Press reports.
Our base case is 9% penetration of smartphone population globally by 2030
We forecast that total paid streaming penetration will reach 9% of the total smartphone
population globally by 2030 from 2% in 2015, by extrapolating 2015 growth trends. This
level will still be below the average penetration for the top five paid streaming markets of
11% in 2015 and less than half the penetration in Sweden and Norway (over 20%), the most
advanced markets. We assume that ARPU stays flat as the growth of lower ARPU
streaming services in EM ($4 monthly average price currently) will likely offset the
improving mix towards higher ARPU services in DM and the underlying inflation. This
brings the total paid streaming market alone to $23 bn in 2030 from $2.3 bn in 2015, well
above the total recorded music market of $15 bn in 2015.
Our sensitivity analysis shows that any 1% of additional penetration would lift the overall
market by c.$2.5 bn and any 1% change to ARPU would have a $3 bn impact.
0%
5%
10%
15%
20%
25%
30%
35%
0
5
10
15
20
25
2010
2011
2012
2013
2014
2015
Paying users Non‐Paying users Paid / total users (RHS)
20%
25%
28%
0%
5%
10%
15%
20%
25%
30%
0
1
2
3
4
5
6
7
8
2012 2013 2014
Standalone subs Monthly active bundle subs
Monthly inactive bundle subs Active vs inactive bundle
34 4
4.3% 4.4%
4.8%
0.0%
1.0%
2.0%
3.0%
4.0%
5.0%
0
10
20
30
40
50
60
70
80
90
2013 2014 2015
Ad‐based users (m) Paying Subs (m) Paying Subs/Total Active Subs (RHS)
19 19 20 22 24 26 27 30 31 33 33 32
0%
10%
20%
30%
40%
50%
60%
70%
80%
90%
0
5
10
15
20
25
30
35
40
45
50
2008
2009
2010
2011
2012
2013
2014
2015
2016E
2017E
2018E
2019E
Paying users Non‐Paying users Paid Subs/ Total Users
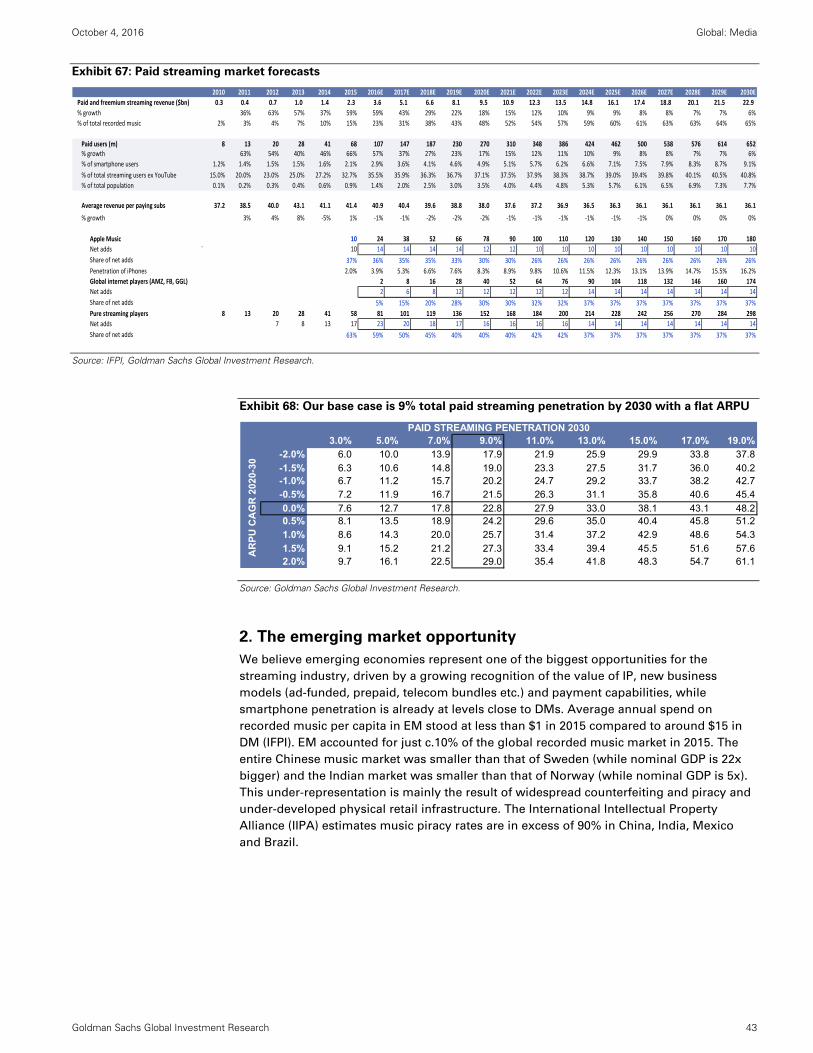
October 4, 2016 Global: Media
Goldman Sachs Global Investment Research 43
Exhibit 67: Paid streaming market forecasts
Source: IFPI, Goldman Sachs Global Investment Research.
Exhibit 68: Our base case is 9% total paid streaming penetration by 2030 with a flat ARPU
Source: Goldman Sachs Global Investment Research.
2. The emerging market opportunity
We believe emerging economies represent one of the biggest opportunities for the
streaming industry, driven by a growing recognition of the value of IP, new business
models (ad-funded, prepaid, telecom bundles etc.) and payment capabilities, while
smartphone penetration is already at levels close to DMs. Average annual spend on
recorded music per capita in EM stood at less than $1 in 2015 compared to around $15 in
DM (IFPI). EM accounted for just c.10% of the global recorded music market in 2015. The
entire Chinese music market was smaller than that of Sweden (while nominal GDP is 22x
bigger) and the Indian market was smaller than that of Norway (while nominal GDP is 5x).
This under-representation is mainly the result of widespread counterfeiting and piracy and
under-developed physical retail infrastructure. The International Intellectual Property
Alliance (IIPA) estimates music piracy rates are in excess of 90% in China, India, Mexico
and Brazil.
2010 2011 2012 2013 2014 2015 2016E 2017E 2018E 2019E 2020E 2021E 2022E 2023E 2024E 2025E 2026E 2027E 2028E 2029E 2030E
Paid and freemium streaming revenue ($bn) 0.3 0.4 0.7 1.0 1.4 2.3 3.6 5.1 6.6 8.1 9.5 10.9 12.3 13.5 14.8 16.1 17.4 18.8 20.1 21.5 22.9
% growth 36% 63% 57% 37% 59% 59% 43% 29% 22% 18% 15% 12% 10% 9% 9% 8% 8% 7% 7% 6%
% of total recorded music 2% 3% 4% 7% 10% 15% 23% 31% 38% 43% 48% 52% 54% 57% 59% 60% 61% 63% 63% 64% 65%
Paid users (m) 8 13 20 28 41 68 107 147 187 230 270 310 348 386 424 462 500 538 576 614 652% growth 63% 54% 40% 46% 66% 57% 37% 27% 23% 17% 15% 12% 11% 10% 9% 8% 8% 7% 7% 6%
% of smartphone users 1.2% 1.4% 1.5% 1.5% 1.6% 2.1% 2.9% 3.6% 4.1% 4.6% 4.9% 5.1% 5.7% 6.2% 6.6% 7.1% 7.5% 7.9% 8.3% 8.7% 9.1%
% of total streaming users ex YouTube 15.0% 20.0% 23.0% 25.0% 27.2% 32.7% 35.5% 35.9% 36.3% 36.7% 37.1% 37.5% 37.9% 38.3% 38.7% 39.0% 39.4% 39.8% 40.1% 40.5% 40.8%
% of total population 0.1% 0.2% 0.3% 0.4% 0.6% 0.9% 1.4% 2.0% 2.5% 3.0% 3.5% 4.0% 4.4% 4.8% 5.3% 5.7% 6.1% 6.5% 6.9% 7.3% 7.7%
Average revenue per paying subs 37.2 38.5 40.0 43.1 41.1 41.4 40.9 40.4 39.6 38.8 38.0 37.6 37.2 36.9 36.5 36.3 36.1 36.1 36.1 36.1 36.1
% growth 3% 4% 8% ‐5% 1% ‐1% ‐1% ‐2% ‐2% ‐2% ‐1% ‐1% ‐1% ‐1% ‐1% ‐1% 0% 0% 0% 0%
Apple Music 10 24 38 52 66 78 90 100 110 120 130 140 150 160 170 180
Net adds ` 10 14 14 14 14 12 12 10 10 10 10 10 10 10 10 10
Share of net adds 37% 36% 35% 35% 33% 30% 30% 26% 26% 26% 26% 26% 26% 26% 26% 26%
Penetration of iPhones 2.0% 3.9% 5.3% 6.6% 7.6% 8.3% 8.9% 9.8% 10.6% 11.5% 12.3% 13.1% 13.9% 14.7% 15.5% 16.2%
Global internet players (AMZ, FB, GGL) 2 8 16 28 40 52 64 76 90 104 118 132 146 160 174
Net adds 2 6 8 12 12 12 12 12 14 14 14 14 14 14 14
Share of net adds 5% 15% 20% 28% 30% 30% 32% 32% 37% 37% 37% 37% 37% 37% 37%
Pure streaming players 8 13 20 28 41 58 81 101 119 136 152 168 184 200 214 228 242 256 270 284 298
Net adds 7 8 13 17 23 20 18 17 16 16 16 16 14 14 14 14 14 14 14
Share of net adds 63% 59% 50% 45% 40% 40% 40% 42% 42% 37% 37% 37% 37% 37% 37% 37%
23 3.0% 5.0% 7.0% 9.0% 11.0% 13.0% 15.0% 17.0% 19.0%-2.0% 6.0 10.0 13.9 17.9 21.9 25.9 29.9 33.8 37.8
-1.5% 6.3 10.6 14.8 19.0 23.3 27.5 31.7 36.0 40.2-1.0% 6.7 11.2 15.7 20.2 24.7 29.2 33.7 38.2 42.7-0.5% 7.2 11.9 16.7 21.5 26.3 31.1 35.8 40.6 45.4
0.0% 7.6 12.7 17.8 22.8 27.9 33.0 38.1 43.1 48.20.5% 8.1 13.5 18.9 24.2 29.6 35.0 40.4 45.8 51.21.0% 8.6 14.3 20.0 25.7 31.4 37.2 42.9 48.6 54.3
1.5% 9.1 15.2 21.2 27.3 33.4 39.4 45.5 51.6 57.62.0% 9.7 16.1 22.5 29.0 35.4 41.8 48.3 54.7 61.1
AR
PU
CA
GR
202
0-30
PAID STREAMING PENETRATION 2030

October 4, 2016 Global: Media
Goldman Sachs Global Investment Research 44
Exhibit 69: Music spend per capita shows a clear divide
between DM and EM Music spend per capita ($, 2015)
Exhibit 70: Music spend per capita is around $1 in EM vs.
$15 in DM Music spend per capita ($, 2015)
Source: IFPI.
Source: IFPI, Goldman Sachs Global Investment Research.
Exhibit 71: EMs accounted for just 10% of the global
recorded music market in 2015 Music revenues – market share by geography
Exhibit 72: BRICs show significant revenue growth
potential with smartphone penetration close to DMs Music spend per capita ($) vs. smartphone penetration
Source: IFPI, Goldman Sachs Global Investment Research.
Source: IFPI, Goldman Sachs Global Investment Research.
We believe the launch of convenient, better quality, legal streaming alternatives with a free
tier could reduce piracy rates and therefore generate new revenue streams for the music
industry. This transition should also be supported by the high level of digital penetration
already present in many EM music markets and a growing recognition of the value of IP.
Many emerging markets, which historically have not been big spenders on music, have
seen a resurgence of their music industry thanks to the launch of streaming services and
more innovative payment capabilities (paying for music using the phone number/email
address instead of credit card details for example); nine of the top 10 fastest growing
markets in 2015 were EMs.
0
2
4
6
8
10
12
14
16
18
20
22
UK
Norw
ayJapan
Swed
en
Den
mark
Germ
any
USA
Australia
Switzerland
Netherlands
Austria
France
Finland
New
Zealand
Belgium
Canada
Ireland
South Korea
Hong Kong
Italy
Spain
Argentina
Croatia
Czech Rep
ublic
Taiwan
Singapore
Hungary
Poland
Greece
Uruguay
Slovakia
Chile
Brazil
Malaysia
Mexico
South Africa
Colombia
Turkey
Bulgaria
Thailand
Peru
Cen
tral America
Russia
Ecuador
Philippines
China
Indonesia
Venezuela
India
02468
101214161820
Japan
North America
Australasia
Western EU
Latin America
Eastern EU
Asia ex Japan
North America, 36%
Western EU, 33%
Japan, 16%
Asia ex Japan, 5%
Latin America, 4%
Australasia, 3% Eastern EU, 2%
Other, 1%
30%
40%
50%
60%
70%
80%
90%
100%
0.0 5.0 10.0 15.0 20.0
Smartphone pen
etration (%)
Music revenue per capita ($)
South KoreaJapan
Brazil
Russia
India
China
North America
Western Europe
Eastern Europe

October 4, 2016 Global: Media
Goldman Sachs Global Investment Research 45
Exhibit 73: Nine of the top 10 fastest growing markets in
2015 were EMs Average music revenues growth, 2012-2015
Exhibit 74: Many EM music markets are already highly
digital Digital music share of total recorded music (broken down by
genres)
Source: IFPI, Goldman Sachs Global Investment Research. Source: IFPI, Goldman Sachs Global Investment Research.
We see various routes available to tap into the EM opportunity such as pre-paid models,
low ARPU subscriptions, ad-funded models or telecom bundles. The importance of local
content also paves the way for the emergence of indigenous companies, such as QQ Music
(China), KKBOX (Taiwan), MelOn (South Korea) and Saavn (India). In China for instance,
local repertoire accounts for 80% of music consumption, Korean and Japanese pop another
10% and international only 10%, according to IFPI.
We calculate that a 1% increase in paid penetration assuming a monthly price of $4 (the
current average price of an Apple Music or Spotify subscription in EM) would generate
$1.5 bn of additional revenue or a 10% uplift to the current global recorded market.
Exhibit 75: A 1% increase in paid streaming penetration could bring an incremental
c.$360 mn revenue assuming $1 ARPU and $1.5 bn revenue assuming $4 ARPU Global paid streaming penetration vs. ARPU – scenario analysis
Source: Goldman Sachs Global Investment Research.
China case study: Local tech giants drive greater monetization of music content
China offers a useful case study of a large, under-monetised music market plagued by
piracy where streaming is opening up sizeable new monetization avenues at a time when
the value of IP is being increasingly recognized. Streaming drove a 64% yoy increase in the
Chinese recorded music market in 2015. However, at $169.7 mn, it remains the 14th largest
market globally behind Sweden (despite boasting a GDP that is 22x larger).
0%
10%
20%
30%
40%
50%
60%
Ven
ezuela
Argentina
China
Peru
Colombia
Cen
tral America
Chile
Greece
Russia
Brazil
South Korea
Croatia
Swed
en
Poland
Uruguay
0%
10%
20%
30%
40%
50%
60%
70%
80%
90%
100%
Paid streaming Ad funded Downloads Other
EM
0.20% 0.5% 1.0% 2.0% 3.0% 4.0% 5.0%
1.0 0.073 0.181 0.363 0.726 1.089 1.452 1.814
2.0 0.145 0.363 0.726 1.452 2.177 2.903 3.629
3.0 0.218 0.544 1.089 2.177 3.266 4.355 5.443
4.0 0.290 0.726 1.452 2.903 4.355 5.806 7.258
5.0 0.363 0.907 1.814 3.629 5.443 7.258 9.072
6.0 0.435 1.089 2.177 4.355 6.532 8.709 10.886
Paid streaming penetration
Monthly price

October 4, 2016 Global: Media
Goldman Sachs Global Investment Research 46
We see significant growth potential with the Chinese online music industry already
counting 501 mn users in 2015 according to iResearch, which is the largest user base in the
world and more than the entire population of the US. The market is estimated to be worth
RMB9.6 bn in 2016 (China Economic Net). The three major local internet players or BAT
(Baidu, Alibaba, Tencent) play a crucial role in driving music growth by:
Signing licensing deals with various international and regional record labels
therefore helping enforce IP protection. Baidu paved the way for monetization of
digital music in China in 2011, when it signed an agreement with One-Stop China, a JV
between UMG, Warner Music and Sony. Since then, Alibaba has signed deals with
Universal Music Group and BMG, and Tencent sealed exclusive agreements with Sony,
Warner Music and South Korea's YG Entertainment. Meanwhile, government
regulation has been tighter against piracy with China’s National Copyright
Administration (NCA) last year ruling that all unlicensed content be removed from
music platforms.
Leveraging their massive reach to attract customers. Baidu Music had 150 mn
monthly active users (both free and paid) as of December 2015. Tencent’s QQ Music
has nearly 100 mn daily active users and 400 mn monthly active users. Following the
merger with China Music Corporation (CMC)’s music streaming services Kugou and
Kuwo, iResearch estimates that QQ Music now has 800 mn users, 56% of the Chinese
mobile-music market and 60% of all available music rights in China.
Offering users an easy way to pay for music subscriptions through their own
wallets (e.g. Alipay, WeChat wallet). While the main route to monetization will remain
ad supported streaming in our view, we see encouraging evidence of greater
consumer willingness to pay for music: 10 mn of Tencent’s 400 mn monthly active
users are paying (source: Mashable). In December 2015, Singaporean artist JJ Lin sold
610,000 copies of his single ‘Twilight’ on QQ Music in just one week for as little as
RMB2 per download. A survey from iResearch found that nearly 57% of QQ Music's
users in China would have paid for something on their music apps this year while a
further fifth are open to paying in the future.
Interestingly, QQ Music is reportedly profitable (Digital Music News, August 2) which could
be credited to Tencent’s capacity to cross sell various products such as concert tickets as
well as more favourable licensing deals with labels (according to Mashable).
Exhibit 76: Chinese online music users expected to reach
c.569 mn by 2018 China's online music users 2010-2018
Exhibit 77: A large proportion of users listen to music on
mobile in China Penetration of China's online & mobile Music 2010-2018
Source: iResearch, CNNIC.
Source: iResearch, CNNIC.
362.2385.9
435.9453.1
478.1501.4
527.0548.9
568.7
6.5%
13.0%
4.0%
5.5%4.9% 5.1%
4.2%3.6%
0%
2%
4%
6%
8%
10%
12%
14%
16%
18%
20%
0
100
200
300
400
500
600
2010 2011 2012 2013 2014 2015 2016E 2017E 2018E
MAU of China's online music (mn) Growth (%)
79.2%75.2%
77.3%73.4% 73.7% 72.8% 73.1%
73.5% 73.9%
46.2% 45.7%
50.9%
58.2%
65.8%67.2%
72.0%
75.6%78.3%
30%
40%
50%
60%
70%
80%
90%
2010 2011 2012 2013 2014 2015 2016E 2017E 2018E
Share of online music users in internet users (%)
Share of mobile online music users in mobile internet users (%)
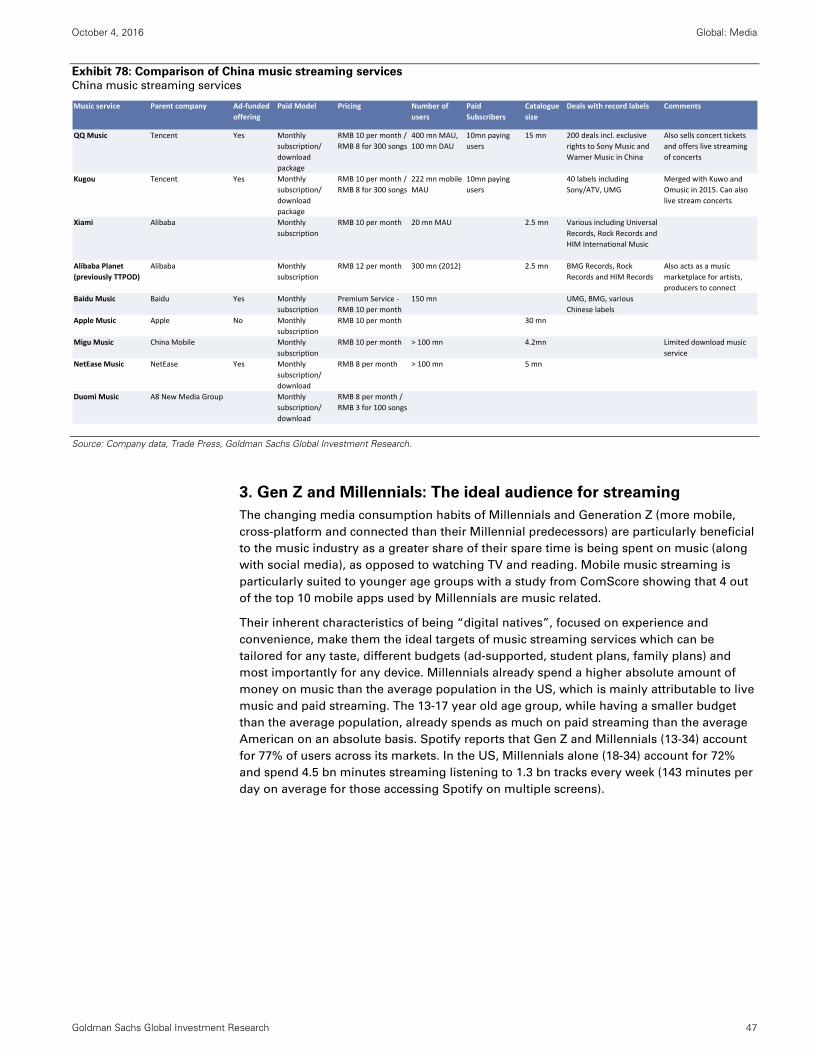
October 4, 2016 Global: Media
Goldman Sachs Global Investment Research 47
Exhibit 78: Comparison of China music streaming services China music streaming services
Source: Company data, Trade Press, Goldman Sachs Global Investment Research.
3. Gen Z and Millennials: The ideal audience for streaming
The changing media consumption habits of Millennials and Generation Z (more mobile,
cross-platform and connected than their Millennial predecessors) are particularly beneficial
to the music industry as a greater share of their spare time is being spent on music (along
with social media), as opposed to watching TV and reading. Mobile music streaming is
particularly suited to younger age groups with a study from ComScore showing that 4 out
of the top 10 mobile apps used by Millennials are music related.
Their inherent characteristics of being “digital natives”, focused on experience and
convenience, make them the ideal targets of music streaming services which can be
tailored for any taste, different budgets (ad-supported, student plans, family plans) and
most importantly for any device. Millennials already spend a higher absolute amount of
money on music than the average population in the US, which is mainly attributable to live
music and paid streaming. The 13-17 year old age group, while having a smaller budget
than the average population, already spends as much on paid streaming than the average
American on an absolute basis. Spotify reports that Gen Z and Millennials (13-34) account
for 77% of users across its markets. In the US, Millennials alone (18-34) account for 72%
and spend 4.5 bn minutes streaming listening to 1.3 bn tracks every week (143 minutes per
day on average for those accessing Spotify on multiple screens).
Music service Parent company Ad‐funded
offering
Paid Model Pricing Number of
users
Paid
Subscribers
Catalogue
size
Deals with record labels Comments
QQ Music Tencent Yes Monthly
subscription/
download
package
RMB 10 per month /
RMB 8 for 300 songs
400 mn MAU,
100 mn DAU
10mn paying
users
15 mn 200 deals incl. exclusive
rights to Sony Music and
Warner Music in China
Also sells concert tickets
and offers live streaming
of concerts
Kugou Tencent Yes Monthly
subscription/
download
package
RMB 10 per month /
RMB 8 for 300 songs
222 mn mobile
MAU
10mn paying
users
40 labels including
Sony/ATV, UMG
Merged with Kuwo and
Omusic in 2015. Can also
live stream concerts
Xiami Alibaba Monthly
subscription
RMB 10 per month 20 mn MAU 2.5 mn Various including Universal
Records, Rock Records and
HIM International Music
Alibaba Planet
(previously TTPOD)
Alibaba Monthly
subscription
RMB 12 per month 300 mn (2012) 2.5 mn BMG Records, Rock
Records and HIM Records
Also acts as a music
marketplace for artists,
producers to connect
Baidu Music Baidu Yes Monthly
subscription
Premium Service ‐
RMB 10 per month
150 mn UMG, BMG, various
Chinese labels
Apple Music Apple No Monthly
subscription
RMB 10 per month 30 mn
Migu Music China Mobile Monthly
subscription
RMB 10 per month > 100 mn 4.2mn Limited download music
service
NetEase Music NetEase Yes Monthly
subscription/
download
RMB 8 per month > 100 mn 5 mn
Duomi Music A8 New Media Group Monthly
subscription/
download
RMB 8 per month /
RMB 3 for 100 songs

October 4, 2016 Global: Media
Goldman Sachs Global Investment Research 48
Exhibit 79: 77% of Spotify’ customers are Gen Z &
Millennials
Exhibit 80: Millennials spend 4.5 bn minutes listening to
1.3 bn tracks every week on Spotify in the US
Source: Spotify
Source: Spotify/ AdWeek.
Exhibit 81: Gen Z and Millennials spend a higher
proportion of their spare time listening to music Top 5 spare-time activities, by generation (percentage
selecting each as one of their top 3)
Exhibit 82: 4 out of top 10 mobile apps used by
Millennials are music-related Top mobile apps among Millennials (18-34) by time spent
(US, June 2015 – before Apple Music launch)
Source: Deloitte.
Source: ComScore.
Exhibit 83: Millennials spend 16% of their entertainment
budget on music in North America Breakdown of entertainment spend
Exhibit 84: In the US, Millennials spend more money on
music than the average person and more on live music
and paid streaming Breakdown of music spend by genre
Source: Deloitte.
Source: Nielsen.
0‐12, 0%
13‐17, 12%
18‐24, 37%
25‐34, 28%
35‐44, 14%
45‐54, 8%
55+, 3%
0.0
0.5
1.0
1.5
2.0
2.5
3.0
3.5
4.0
4.5
5.0
tracks per week streamed minutes per week
37%27%
21% 19%
0%
10%
20%
30%
40%
50%
60%
70%
80%
90%
100%
Generation Z (15‐20) Millenials (21‐34) Generation X (35‐49) Boomers (50‐64)
Listen to Music Read Watch TV Connect with family/friends
41.5%
1.5%
1.5%
1.6%
2.6%
3.1%
3.2%
3.9%
5.6%
14.3%
21.2%
0.0% 10.0% 20.0% 30.0% 40.0% 50.0%
All others
Netflix
Google Search
SoundCloud
Snapchat
Facebook Messenger
Spotify
YouTube
Pandora Radio
Top mobile apps among millennials by time spent (June 2015)
Pay TV, 41.6%
Music, 16.4%
Games, 13.2%
Movies,9.9%
Books, 7.9%
VOD, 5.3%
Sports, 3.3%
Press, 2.5%
0
20
40
60
80
100
120
140
160
180
13‐17 18‐34 All
Satellite radio Paid streaming Physical Downloads Live Gift cards

October 4, 2016 Global: Media
Goldman Sachs Global Investment Research 49
4. Telecom and tech companies leveraging music content
With the proliferation of premium data plans and smartphones, mobile carriers are now
increasingly seeking out streaming music and video services as a means of driving
upgrading and upselling opportunities as well as differentiation. Almost non-existent in
2011, there are now 11.5 mn telco bundled music subscribers globally according to MIDiA.
Telecom operators’ large marketing budgets and sizeable existing billing relationships
make them ideal partners to (1) enter a new market at little cost, especially in EM where
subscription ARPUs are lower and credit card penetration remains low, and (2) reach
younger demographics (whose bills are paid by parents). While such deals are dilutive
from an ARPU perspective (27% according to Deezer), we believe that margins are broadly
similar given lower marketing and customer acquisition/retention costs.
In parallel, large tech companies have also made a major foray into music streaming over
the last three years as a way to better lock users into their ecosystem and sell more
advertising (Google), devices (Apple) and products (Amazon).
Google launched a dedicated music streaming service in 2011, Google Play Music,
which includes a $9.99 “all you can eat” subscription option (since 2013) and an ad-
supported free tier (since 2015). It presents a number of additional features such as
free online music storage (up to 50,000 songs), a self-publishing platform Artist Hub for
artists and music sharing via Google +. In 2015, it launched YouTube Red, which
enables users to access all YouTube content free of ads and includes the premium
version of Google Play Music for $9.99 a month ($12.99 for iOS users).
Apple bought headphone maker and music streaming service Beats for $3 bn in May
2014 and launched a paid only subscription service Apple Music in June 2015 in a
move to compensate declining digital music sales at iTunes.
Amazon launched a free music streaming service in 2014 with over one million songs
for Prime customers (“Prime Music”) and is reported to be launching soon a paid
music subscription service that would cost $10 pm for unlimited access on any device
and $4-5 for unlimited access exclusively on Amazon’s Echo Player (MBW, September
2, 2016).

October 4, 2016 Global: Media
Goldman Sachs Global Investment Research 50
Exhibit 85: Selected streaming services/ telecoms partnerships
Source: Press reports.
Telecoms
CompanyCountry Partnership Launch date Price Package details Firm Rationale Additional Details
EE UK Apple Music Aug 20166 months free, £9.99
thereafter
‐ Offered both to new EE customers, and those renewing their
contracts
‐ Increase the amount of music streamed over
its network
Bouygues France Spotify Jan 2015 Free ‐ Bonus for subscribers to Sensation 3GB plans and above‐ Enhance customer experience by expanding
services and content
‐ Unlimited smartphone, tablet or computer
access to Premium offer of <30m titles, with
offline listening.
Orange France Deezer Dec 2014
€2.99/month for 3 months
(or €1/month for 6 months if
you are a Play or Jet
customer);
€9.99 thereafter
‐ Standalone offering through Orange platform‐ Importance of new digital services to attract
customers
‐ Unlimited music listening, ad‐free
‐ On your mobile, tablet, PC or TV
‐ Listen without network (offline)
Sprint
(SoftBank)US Spotify May 2014 Free trial of Spotify
‐ Sprint subscribers on its tiered "family plan" will get discounts to
Spotify subscriptions once the trial period ends
‐ Family (1‐5 people): 6 months free; $7.99/month onwards
‐ Family (6‐10 people): 6 months free; $4.99/month onwards
‐ All other customers: 3 months free; $9.99/month onwards
‐ Sprint gets cachet with the cool kids from an
association with the market‐leading music
streaming service – and, assuming its
customers appreciate access to a large library
of music, a valuable tool to reduce customer
churn.
‐ Coincide with the Spotify partnership, Sprint
also unveiled a special version of HTC’S One M8
handset featuring HD audio technology supplied
by Harmon Kardon.
Globe
TelecomPhilippines Spotify Apr 2014 Free for prepaid subscribers
‐ Globe Telecom customers to get Spotify Premium with new
GoSURF mobile plan ‐ mobile internet access and Spotify for P10/
day Spotify premium P129/ month
‐ Strengthens its vision to provide an enriched
online experience and access to free online
content.
‐ Exclusive partnership with Globe Telecom, the
best free music experience in the history of the
smartphone ‐ available now Instant access to
over 30m songs
Telefónica
Spain,
Germany,
LatAm
Napster Oct 2013 $4.90/month
‐ Speedy fixed broadband and Movistar mobile broadband
products
‐ Available as Napster Web & Napster Premium
‐ Increase attractiveness of mobile packages
to operators in Europe and Latin America
‐ Bolster the launch of 4G networks globally
‐ First carrier to release Firefox OS‐based
smartphone
SFR France Napster Sep 2013Free add‐on for 4G SFR
customers
‐ "Napster Decouverte" package: 2 hours of calls, unlimited
SMS/MMS & 2 GB of mobile data/ month
‐ Premium music service offered for €9.95/ month as an Extra
service
‐ Add innovative content to provide a better
experience of 4G
‐ Five Napster options on monthly basis & access
<20 million songs – online and offline – using
smartphones and tablets.
‐ Available for iPhone, iPad and iPod Touch &
smartphones using Android operating system
Vodafone UK Spotify Aug 2013Free for 6 months, £4.99/
month thereafter
‐ Red 4G plan priced at £26 or more/ month
‐ Spotify unlimited: £4.99/ month
‐ Spotify Premium: £9.99/ month
‐ Emphasize worth of 4G offering ‐ Spotify can be chosen as content option
‐ Available on multiple compatible devices
Telenor
Norway,
Thailand,
Hungary
Deezer Oct 2012Free for three months, HUF
1390/ month thereafter
‐ Content add‐on for customers with existing packages
‐ Five different 'Hipernet' price plans: Start, Active, Medium, Heavy
& Pro offering download speeds of 5/1‐60/10 Mbps, data
allowance of 3‐30GB & extra service allowance.
‐ Capitalize on their position as a provider of a
legal alternative to pirated music
‐ Access to 18m tracks on phones, PCs or tablets
at any time.
Deutsche
TelekomGermany Spotify Aug 2012
£4.99/month: Spotify
Unlimited
£9.99/month: Spotify
Premium
‐ Special Complete Mobile Music Tariff: €29.95 (£23.95)/month
‐ Add Spotify Premium for €9.95 (£7.95)/month
‐ €39.95/month with new Smartphone
‐ Claiming the platform’s integration with
Facebook and other social networks was a
major driver behind the deal and indicative of
where the industry is heading.
‐ Gives operator exposure to new audiences
‐ Consumers able to listen to more than 19m
songs on their smartphone, tablets, or PCS, both
online and offline without impact on their data
limits.
‐ All tariff bundles include call flat, data flat and
SMS allnet flat besides the Spotify Premium.
Virgin Media UK Spotify Jul 2011
Spotify Premium free for
three months with Premiere
& VIP collections
‐ Premiere: unlimited broadband, 60Mb download speeds, free
wireless Super Hub, free connection, 200 channels (43 HD) 2x
500GB Tivo boxes: £25/month for 6 months & £52/month
thereafter
‐ VIP: 225 channels, 2x 1TB TiVo boxes, anywhere Virgin TV access:
£50/ month for 6 months, rising to £104.45/ month thereafter
‐ Catch Up TV services & Virgin TV On Demand
‐ Boost appeal of Virgin Media's bundled TV,
broadband and telephone services.
‐ Access millions of tracks from thousands of
artists, online, on mobile or through exclusive
Spotify app on Virgin Media’s TiVo‐powered
digital TV service
KPN Netherlands Spotify ‐ Streaming service comes free as part of a bundle package
Mobilcom‐
DebitelGermany Juke
‐ The streaming service will now come bundled on the telecom's
mobile platforms
‐ New customers of mobilcom‐debitel will have
access to different tiers of the service, incl. a
subscription service with unlimited access to
Juke's library of more than 20m songs or access
to the library for a fee added to their service
contract.

October 4, 2016 Global: Media
Goldman Sachs Global Investment Research 51
A rising tide lifts (almost) all boats
In addition to the structural and regulatory tailwinds highlighted above, we believe industry
responses will be critical in shaping the future growth of the industry which only started to
recover in 2015 after almost two decades of decline. We would expect some level of
coordination among labels and platforms to maximize that growth potential. As a result,
we believe the split of revenue pools will remain broadly unchanged in the near to medium
term.
Labels have the most to gain from the growth of streaming and
growing competition among distributors
Recorded music companies or labels perform a vast array of functions from the discovery
and development of artists to the marketing, sale and licensing of their recorded music in
various formats. Labels also increasingly engage in ancillary activities such as
merchandising, sponsorship, live performance, artist management, etc., which are often
referred to as “artist services and expanded rights” agreed as part of “expanded rights
deals” or “360° deals.”
The recorded music industry is dominated by three companies (Universal Music, Sony
Music, Warner Music) which commanded 73% market share in 2015 according to Music &
Copyright. The industry has experienced a wave of consolidation over the past few
decades, the most recent sizeable deal being the acquisition of EMI Recorded Music by
UMG in 2012 for €1.4 bn. The remaining 27% of the market is extremely fragmented, made
up of thousands of independent labels. This concentration helps the labels maintain a
strong negotiating power with the platforms – note that the distributors’ cut of c.30% has
hardly moved over the past 15 years despite the launch of downloads and streaming
services by large players including Apple.
Exhibit 86: The recorded market is dominated by three
majors Global recorded music market revenues, % market share
Exhibit 87: Major three labels compared
Source: Music & Copyright. Source: Company data, Goldman Sachs Global Investment Research.
As highlighted earlier, we see greatest value growth potential in the recorded segment as
streaming improves the monetization of music content (reduction in piracy rates, more
favourable royalty structure notably in the US, higher ARPU when migrating customers
onto the paying tier) and creates new revenue streams.
0%
5%
10%
15%
20%
25%
30%
35%
40%
2010 2011 2012 2013 2014 2015
EMI SME UMG WMG Independents
Universal Music Group
(UMG)
Sony Music Entertainment
(SME)
Warner Music Group
(WMG)
Presence >60 countries 30 countries >50 countries
Employees 6,967 c.3,000 c. 4,200
Labels >100 >20 >200
Record labels
Interscope Geffen
Capitol Music Group
Republic Records
Def Jam Recordings
Polydor
Island Records
Columbia Records
Warner Bros. Records
Epic Records
RCA Records
Arista Nashville
Legacy Recordings
Atlantic Records
Asylum
Big Beat
East West
Electra
Erato
Publishers
Copyrights managed
UMPG
3.2m copyrights
Sony/ATV
4m copyrights
Warner/Chappell
> 1.2m copyrights
Top artists
2015
Taylor Swift
Justin Bieber
Sam Smith
The Weeknd
Drake
Adele
One Direction
David Bowie
Meghan Trainor
Sia
Ed Sheeran
Coldplay
Wiz Khalifa
Mark Ronson
Jason Derulo
Other major artists
ABBA
Louis Armstrong
The Beatles
Andrea Bocelli
Elton John
Beyonce
Mariah Carey
Celine Dion
The Fray
Michael Jackson
Linkin Park
Michael Buble
Bruno Mars
David Guetta
Prince

October 4, 2016 Global: Media
Goldman Sachs Global Investment Research 52
The recorded music industry has recently turned a corner, with the proliferation of
subscription streaming driving an improvement in global recorded music revenues from a
6% pa decline over 2007-2010 to a 1% pa decline over 2011-14, and 3% yoy growth in 2015,
the fastest growth recorded since 1998. We expect growth to accelerate further from here,
as confirmed by 1H16 trends. Three of the top 5 markets that have reported so far (the US,
Germany, France) posted c.6% revenue growth on average in 1H16, following flat
performance in FY15. Even the most advanced markets in terms of paid streaming
penetration such as Sweden and Norway (over 20% penetration - Deezer even estimates
Sweden is close to 30% as of September 2016) saw an acceleration to c.8% in 1H16 after
+5% growth in FY15. We forecast the recorded music market to grow 4% in 2016, 5% in
2017 and pick up to 6% pa after 2018. Overall, we believe the recorded music segment
should return to its 1999 peak of $29 bn by 2027, from $15 bn today.
Exhibit 88: Recent music data points confirm the recorded music industry turnaround Recorded music revenue growth by market, % yoy change
Source: RIAA (US), IFPI, unless local data available.
We believe labels have the most to gain within the value chain, given they receive
55%-60% of a platforms’ revenue as royalties which is the same across streaming, physical
or downloads. We do not foresee a major change in this share in the near term as
distribution fragments and digital increases the complexity of the industry. Labels will have
a vested interest in keeping a minimum level of competitive tension among platforms,
assuming they have learnt from past mistakes such as allowing the formation of a
monopoly in distribution. The outcome of their (re)negotiations with YouTube, Spotify or
Amazon in the coming months and regulatory changes will be key in this regard. That said,
we believe streaming platforms will be able to increasingly leverage the vast amount of
user data to cut better deals with labels over time.
As such, we estimate that streaming will represent a $28 bn market by 2030 and will enable
the overall revenue pie for labels (i.e., recorded music market) to return to its 1999 peak of
$29 bn by 2027 and reach $36 bn in 2030. This compares to the current revenue pool of
$15 bn, of which $9 bn is at risk (physical and download sales).
Recorded music FY 14 1H 15 2H 15 FY 15 1H 16
TOP 5 Markets
US ‐0.7% ‐0.5% 2.4% 0.9% 8.1%
UK ‐2.8% ‐5.0% 6.1% 0.6%
Japan ‐2.6% 1.1% 4.9% 3.0%
Germany 1.8% 4.4% 4.8% 4.6% 3.6%
France ‐5.3% ‐7.0% ‐2.4% ‐4.7% 6.0%
Nordics
Sweden 0.0% 4.2% 11.1% 7.6% 8.6%
Finland ‐9.0% 0.5% 5.0% 2.7%
Denmark 3.8% 0.4% 2.6% 1.5%
Norway ‐2.5% 7.0% ‐1.8% 2.6% 7.8%
Southern Europe
Spain 5.4% 10.9% 9.0% 10.0% 4.0%
Italy 1.5% 22.3% 27.9% 25.1%

October 4, 2016 Global: Media
Goldman Sachs Global Investment Research 53
Exhibit 89: Streaming: A $28 bn market opportunity by 2030 Global recorded music market revenues ($ bn, LHS) vs. global revenues growth (%, RHS)
Source: IFPI, Goldman Sachs Global Investment Research.
The potential expansion of the profit pool is even more meaningful as labels generate
higher margins in digital where the cost of manufacturing, distribution, inventory and
returns is removed. We estimate that labels currently generate around 15% EBITA margins
in both streaming and download compared to 8% in physical. Over time, we believe
streaming margin could grow to 20%-25% given (1) more cost-effective marketing, (2)
higher profitability of catalogue sales where development and marketing costs are lower
than new releases, and (3) ongoing adaptation of the cost structure to a streaming world
(conversion of fixed to variable costs, IT systems upgrade enabling greater efficiencies etc.).
We expect however, disruptive forces such as the emergence of alternative labels to lead to
a greater redistribution of profits to artists (artists and repertoire costs currently account for
30%-35% of labels’ revenue netted of payments to publishers). Based on a streaming EBITA
range of 15%-25%, we forecast $2-3 bn of additional profit to be unlocked from streaming,
compared to current profit pool of $1 bn generated from physical and downloads.
‐5%
‐1%
1%
‐2%
0%
3%
4%
5%
7% 7% 7% 7%6%
6% 6%6%
6% 6% 6% 5%
‐6%
‐4%
‐2%
0%
2%
4%
6%
8%
$0
$5
$10
$15
$20
$25
$30
$35
$40
2010
2011
2012
2013
2014
2015
2016E
2017E
2018E
2019E
2020E
2021E
2022E
2023E
2024E
2025E
2026E
2027E
2028E
2029E
2030E
Physical Download Other Streaming Global market growth

October 4, 2016 Global: Media
Goldman Sachs Global Investment Research 54
Exhibit 90: Warner Music breakdown of recorded music
costs Warner Music breakdown of recorded music costs
Exhibit 91: Warner Music and UMG generate around 14%
recorded EBITDA margin Warner Music and UMG Recorded EBITDA margin
Source: Company data. Source: Company data, Goldman Sachs Global Investment Research
Exhibit 92: We estimate labels generate 15% EBITA margins in digital compared to 8% in physical; paid streaming is
particularly attractive, commanding a profit per person that is 2-3x higher than other formats Note: The publishers/songwriters receive their royalties via the labels in physical and downloads, but directly from the
streaming services
Source: Goldman Sachs Global Investment Research.
Exhibit 93: The recorded music profit pool growth is even more substantial Recorded music profit pool ($ bn, LHS) vs. EBITA margin (%,
RHS)
Source: Goldman Sachs Global Investment Research.
Artist and repertoire costs
33%
Product costs25%
General and administrative
expense19%
Selling and marketing expense20%
Distribution expense
3%
0%
2%
4%
6%
8%
10%
12%
14%
16%
18%
2005 2006 2007 2008 2009 2010 2011 2012 2013 2014 2015
Warner Music UMG
Physical Downloads Streaming ‐ ad funded + subscription Streaming ‐ subscription
Average spend per person 55.0$ % of gross revenue Average spend per person 48.0$ % of gross revenue Average revenue per user 41.0$ % of gross revenue Average spend per person 120.0$ % of gross revenue
VAT 11.0$ 20% VAT 9.6$ 20% VAT 8.2$ 20% VAT 24.0$ 20%
Net revenue 44.0$ Net revenue 38.4$ Net revenue 32.8$ Net revenue 96.0$
Split: % of net revenue Split: % of net revenue Split: % of net revenue Split: % of net revenue
Distributor revenue 13.2$ 30% Distributor revenue 11.5$ 30% Distributor revenue 9.8$ 30% Distributor revenue 28.8$ 30%
Record company revenue 30.8$ 70% Record company revenue 26.9$ 70% Content pool 23.0$ 70% Content pool 67.2$ 70%
Split Publishing 3.3$ 10% Split Publishing 9.6$ 10%
Split Record company 19.7$ 60% Split Record company 57.6$ 60%
Record company costs % of record revenue Record company costs % of record revenue Record company costs % of record revenue Record company costs % of record revenue
Pay away to publishers 4.4$ 14% Pay away to publishers 3.5$ 13%
Artists & Repertoire 5.5$ 18% Artists & Repertoire 5.9$ 22% Artists & Repertoire 7.5$ 38% Artists & Repertoire 21.9$ 38%
Production & Distribution 4.3$ 14% Production & Distribution ‐$ 0% Production & Distribution ‐$ 0% Production & Distribution ‐$ 0%
Other Product Costs 1.5$ 5% Other Product Costs 2.7$ 10% Other Product Costs 4.6$ 20% Other Product Costs 13.4$ 20%
Gross margin 15.0$ 49% Gross margin 14.8$ 55% Gross margin 10.9$ 55% Gross margin 31.9$ 55%
Selling & Marketing 7.1$ 23% Selling & Marketing 6.2$ 23% Selling & Marketing 4.5$ 23% Selling & Marketing 13.2$ 23%
G&A 4.7$ 15% G&A 4.0$ 15% G&A 3.0$ 15% G&A 8.6$ 15%
EBITDA Margin 3.2$ 10% EBITDA Margin 4.6$ 17% EBITDA Margin 3.4$ 17% EBITDA Margin 10.0$ 17%
Depreciation 0.77$ 3% Depreciation 0.67$ 3% Depreciation 0.49$ 3% Depreciation 1.44$ 3%
EBITA Margin 2.4$ 8% EBITA margin 3.9$ 15% EBITA margin 2.9$ 15% EBITA margin 8.5$ 15%
+63%
+21% +118%
‐26%
0.0%
5.0%
10.0%
15.0%
20.0%
25.0%
30.0%
0.0
1.0
2.0
3.0
4.0
5.0
6.0
7.0
8.0
9.0
10.0
201
0
201
2
201
4
2016E
2018E
2020E
2022E
2024E
2026E
2028E
2030E
EBITA EBITA margin (RHS)

October 4, 2016 Global: Media
Goldman Sachs Global Investment Research 55
Quotes from WMG CFO on the outlook for the music industry and the impact of streaming
Eric Levin is Executive Vice President and Chief Financial Officer, Warner Music Group, a role in which he is responsible
for the company’s worldwide financial operations. He joined the company in 2014, having held a number of senior
executive posts in the US and Greater China.
It seems like we’ve reached a tipping point for the recorded music industry – how do you see the growth path
from here?
“We are optimistic about the long-term growth potential of the music business and for Warner in particular. Recent
industry data is improving with real growth worldwide, led by subscription streaming. This is more than offsetting
declines in physical and downloads.”
How do you see the role of the labels in shaping this future recovery?
“We are laser focused on executing against our strategic priorities, which include having a steady stream of great new
music, expanding our global presence, and embracing commercial innovation, including the shift to streaming. Every
region around the world is at a different stage of transition to digital formats. It is our job as an industry leader to help
our artists and songwriters navigate the complexity across countries to maximize potential globally.”
How do you think the streaming distribution landscape will evolve?
“We are seeing heightened commitment to streaming from a myriad of large players, which is aiding consumer
awareness and yielding higher adoption. Having many players is good for us as it creates competition for consumers’
share of wallet which in turn benefits the entire industry. ”
A lot more music is being consumed yet only a small portion of people pay for it – how can we address the issue
of music monetization?
“It is imperative that monetization continues to improve and that artists, songwriters, labels and publishers are all fully
and fairly compensated for their work. We have seen some encouraging signs from the EU but there is still a long way
to go, as the value of music is still not being fully recognized.”

October 4, 2016 Global: Media
Goldman Sachs Global Investment Research 56
Music publishers should benefit from streaming growth but to a
lesser extent than labels
Music Publishing companies work for songwriters – they exploit and market musical
compositions (of which they own/share the rights with songwriters) and receive royalties
or fees for their use. Publishers derive royalty income (mechanical, public performance,
synchronization royalties and other licenses) which they generally share 50/50 with the
songwriters.
Exhibit 94: Mechanical (digital & physical) and
Performance royalties each account for c.40% of revenueWarner/Chappell breakdown of revenue
Exhibit 95: Publishing in Japan is dominated by
Mechanical (38%) and synchronisation (33%) royalties JASRAC 2015 royalties collected
Source: Warner Music Group company data.
Source: JASRAC.
Similarly to recording, the publishing market is highly concentrated with the three majors
commanding 66% market share and the top five companies commanding 75%. The
industry has also seen a lot of M&A activity, the most recent being the Sony/MJ deal
(approved in 2016) and the acquisition of EMI Publishing by Sony in 2012.
Exhibit 96: The publishing market is dominated by 5
players Publishing market share, 2014
Exhibit 97: … who control/ administer a large number of
copyrights Number of administered music copyrights
Source: Music Business Research.
Source: Music Business Research.
Mechanical18%
Performance38%
Synchronisation21%
Digital21%
Other2%
Performance, ¥21,161 , 19%
Synchronization, ¥37,214 , 33%
Physical mechanical,
¥32,175 , 29%
Digital mechanical, ¥9,844 , 9%
Other, ¥11,276 , 10%
JASRAC total royalties collected:
¥111,670 mn
Sony/ATV, 30%
UMG, 23%Warner/ Chappell, 13%
BMG Rights Management,
5%
Kobalt Music Group, 4%
Other independent
publishers, 26%
0500,000
1,000,0001,500,0002,000,0002,500,0003,000,0003,500,0004,000,0004,500,000
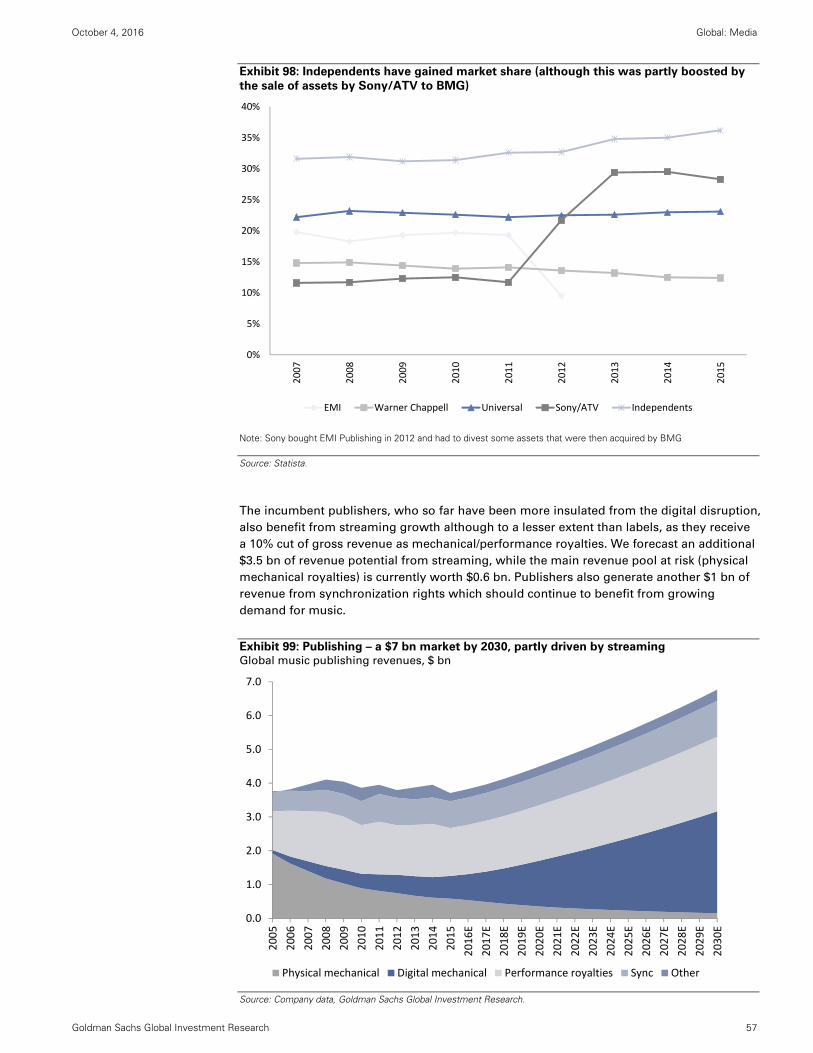
October 4, 2016 Global: Media
Goldman Sachs Global Investment Research 57
Exhibit 98: Independents have gained market share (although this was partly boosted by
the sale of assets by Sony/ATV to BMG)
Note: Sony bought EMI Publishing in 2012 and had to divest some assets that were then acquired by BMG
Source: Statista.
The incumbent publishers, who so far have been more insulated from the digital disruption,
also benefit from streaming growth although to a lesser extent than labels, as they receive
a 10% cut of gross revenue as mechanical/performance royalties. We forecast an additional
$3.5 bn of revenue potential from streaming, while the main revenue pool at risk (physical
mechanical royalties) is currently worth $0.6 bn. Publishers also generate another $1 bn of
revenue from synchronization rights which should continue to benefit from growing
demand for music.
Exhibit 99: Publishing – a $7 bn market by 2030, partly driven by streaming Global music publishing revenues, $ bn
Source: Company data, Goldman Sachs Global Investment Research.
0%
5%
10%
15%
20%
25%
30%
35%
40%
2007
2008
2009
2010
2011
2012
2013
2014
2015
EMI Warner Chappell Universal Sony/ATV Independents
0.0
1.0
2.0
3.0
4.0
5.0
6.0
7.0
2005
2006
2007
2008
2009
2010
2011
2012
2013
2014
2015
2016E
2017E
2018E
2019E
2020E
2021E
2022E
2023E
2024E
2025E
2026E
2027E
2028E
2029E
2030E
Physical mechanical Digital mechanical Performance royalties Sync Other

October 4, 2016 Global: Media
Goldman Sachs Global Investment Research 58
We estimate EBITA margins to be broadly stable at 26%-28%, implying c.$1 bn of
additional profit to be generated over the next 15 years. The upside to margins could
however come from a better leveraging of new digital technologies that can improve the
monitoring and tracking of copyrighted music, and collection and onward payment of
royalties. A shift towards more direct deals, thus circumventing the fragmented landscape
of collection societies, could also present further upside. Against this, we expect publishers
to redistribute a greater share of their profits to songwriters (to 55%-60% from 50% today)
as a result of the pressure from alternative publishers.
Exhibit 100: Author royalties and repertoire account for
the bulk of publishers’ expenses Warner/Chappell breakdown of costs
Exhibit 101: Major publishers generate around 28%-30%
EBITDA margins (pre-corporate costs) Warner/Chappell vs. UMG Publisher EBITDA margin
Source: WMG company data. Source: Company data, Goldman Sachs Global Investment Research.
Exhibit 102: We estimate publishers generate 26% EBITA margins across all formats
Source: Goldman Sachs Global Investment Research.
Artist and repertoire costs
79%
General and administrative
expense20%
Selling and marketing expense
1%
0%
5%
10%
15%
20%
25%
30%
35%
2005 2006 2007 2008 2009 2010 2011 2012 2013 2014 2015
Warner Music UMG
Physical Downloads Streaming ‐ ad funded + subscription Streaming ‐ subscription
Average spend per person 55.0$ % of gross revenue Average spend per person 48.0$ % of gross revenue Average revenue per user 41.0$ % of gross revenue Average spend per person 120.0$ % of gross revenue
VAT 11.0$ 20% VAT 9.6$ 20% VAT 8.2$ 20% VAT 24.0$ 20%
Net revenue 44.0$ Net revenue 38.4$ Net revenue 32.8$ Net revenue 96.0$
Split: % of net revenue Split: % of net revenue Split: % of net revenue Split: % of net revenue
Distributor revenue 13.2$ 30% Distributor revenue 11.5$ 30% Distributor revenue 9.8$ 30% Distributor revenue 28.8$ 30%
Record company revenue 30.8$ 70% Record company revenue 26.9$ 70% Content pool 23.0$ 70% Content pool 67.2$ 70%
Split Record company 19.7$ 60% Split Record company 57.6$ 60%
Publisher revenue (paid by labels) 4.4$ 10% Publisher revenue (paid by labels) 3.5$ 9% Split Publishing 3.3$ 10% Split Publishing 9.6$ 10%
% of publisher
revenue
% of publisher
revenue
% of publisher
revenue
% of publisher
revenue
Songwriters & Repertoire 2.4$ 55% Songwriters & Repertoire 1.9$ 55% Songwriters & Repertoire 1.8$ 55% Songwriters & Repertoire 5.3$ 55%
Gross margin 2.0$ 45% Gross margin 1.6$ 45% Gross margin 1.5$ 45% Gross margin 4.3$ 45%
Admin and other 0.7$ 17% Admin and other 0.6$ 17% Admin and other 0.6$ 17% Admin and other 1.6$ 17%
EBITDA Margin 1.2$ 28% EBITDA Margin 1.0$ 28% EBITDA Margin 0.9$ 28% EBITDA Margin 2.7$ 28%
Depreciation 0.09$ 2% Depreciation 0.07$ 2% Depreciation 0.07$ 2% Depreciation 0.19$ 2%
EBITA margin 1.1$ 26% EBITA margin 0.9$ 26% EBITA margin 0.9$ 26% EBITA margin 2.5$ 26%

October 4, 2016 Global: Media
Goldman Sachs Global Investment Research 59
An interview on music publishing with…
An interview with…
Jane Dyball, CEO of UK Music Publishing Association
After spending 6 years at indie
publisher Virgin Music in
international copyright and
licensing, Jane Dyball joined
Warner/Chappell Music’s
Business Affairs Department.
She eventually became SVP
International Legal & Business
Affairs in 2005 assuming responsibility for all WCM’s
business affairs worldwide ex US & Canada, alongside
strategic issues such as collective rights management and
digital rights. In October 2015, Jane was appointed CEO of
the MPA Group of companies.
What is the role of a collection society?
The music publishers association that I run has a collection
society called MCPS and that is collecting money on behalf
of its publisher members. From a commercial point of view,
almost all publishers use MCPS for broadcast licensing and
for collecting monies from record sales, but not all
publishers use MCPS for online licensing as this tends to be
licensed on a multi-territory basis. The main sources of
income at MCPS are therefore record sales, online and
broadcast. Online income is increasing, album sales seem to
have stabilised and broadcast is stable as well. MCPS is a
mechanical right society that is administering reproduction
rights as opposed to PRS in the UK, or ASCAP and BMI in
the US, which are performing rights societies. In the UK, if
you are a writer or a publisher you need to be a member of
the performing rights society and you give PRS exclusive
rights across all pretty much all types of performance
income.
How does streaming impact the music publishers…?
Firstly, it is important to separate the paid subscription from
the ad-supported streaming model. I think the ad supported
model is a challenge to music publishers while the
subscription model is an opportunity. As with any new
business models, it is difficult to tell what your revenues are
going to be. Under the traditional model, publishers are used
to think in terms of record sales. They know that they would
generate about 50p per album sold and they can therefore
estimate how many albums they need to sell in order to
recoup their advances. We are still struggling with the
technology required to be able to easily process trillions of
lines of data (vs. millions of lines before) that come with
streaming. So there is a technical challenge, the flow is not
yet real time, making it much more difficult for a publisher
to know what a song that is streamed on Spotify is going
to pay out.
… and songwriters?
You can look at that in a number of ways. Songwriting is a
career you can pursue whether or not you are an artist. If
you are an artist you have got access to other revenue
streams like touring fees and endorsements. If you are a
songwriter it is hard because you have a very speculative
career based around having to pay for yourself, going to
studio sessions not knowing whether you’ve got a song or
a cut and that applies whether you are an unheard of
songwriter or whether you are the most successful
songwriter in the world. So if your income is dependent
on ad supported streaming services it is very hard to get
proper compensation for your revenues - that’s one issue.
The next issue is the amount of time it is taking to get the
money through the pipes as it gives current songwriters a
false impression of how much money they are earning
from services. So there is a delay, there is the processing
time, there are all sorts of problems with how ad-funded
services want to account and how the societies want the
latter to account. It is very likely that the money
songwriters are seeing on their royalty statements is less
than it should be. So what does a steady state look like?
Once all that money is getting through, will they still be
making enough money from streaming services? We are
currently in a market where you cannot take any figures
with any accuracy. However, another way to look at it is
to say, overall, is the business growing or in decline? And
overall the business is growing slightly.
What do you think could be done to address these
inefficiencies?
To work properly the system requires invoicing protocols
to be agreed between collection societies, and for societies
to have the ability, preferably working together, to develop
systems which can process and distribute many billions of
lines of data in a timely and accurate manner.
Do you think the recent EC copyright draft directive
could have any impact on the monetization of music
content?
It is draft legislation at this stage so it’s a step in the right
direction, but could change significantly one way or
another before it comes out. It doesn’t put much

October 4, 2016 Global: Media
Goldman Sachs Global Investment Research 60
requirement on YouTube to do anything other than behave
commercially which I expect YouTube would say they are
doing anyway. I think it’s too early to tell really but it is
certainly a step in the right direction.
How are royalties set for publishers?
Subscription services are paying a share of the monthly
subscription as royalties, but you don’t know what your
share of that is going to be as royalties are paid out on a
basis of all of that money going into a big pot and being
divided by the number of plays. So you don’t know in
advance the amount that will be paid out per play. If more
people listen to the service during a particular accounting
period then the per-play payment is going to reduce because
it is a finite pot of money. So it is not going to be a straight
line increase against the number of plays and the royalties
that come out. In the case of an ad-funded service, the only
source of income is advertising and therefore it is completely
dependent on the strength of the advertising business.
What is your view on Apple’s proposal to change the
way songwriters are getting paid in the US for digital
services? Any read across for Europe?
Things work very differently in Europe and all of the
negotiations in Europe are happening individually with
different companies behaving differently in the market. It
would be great if there was a sensible per stream rate paid
by all services. Certainly it is our hope that over time we will
be able to drive up the rates so they properly reward the
creative endeavors of those whose content it is, but that will
be a slow process.
Do you expect the publishers’ role to evolve to a more
administrative role over time?
If you are a publisher, you are not in the business of setting
up an administration office, you are in it to discover talent
and invest in talent and see that talent become successful.
However, it is essential that you have strong administration
in order to properly collect all monies due.
How do the 3 major publishers differentiate from one
another?
All three companies are run differently because they have
different requirements at the executive level, but they
largely perform the same job.
Will writers still need publishers and how easy is it for
songwriters to change publishers?
If you are a kid and you put your songs on YouTube and
your songs are successful you will start to earn money
from YouTube and you won’t necessarily think about
getting a publisher because you’ll be getting some money
from YouTube. However sooner or later you will think you
are not getting any money from the BBC or television or
someone has asked to use your song in a film and you
don’t know what to do…So sooner or later you will go
looking for a publisher. How easy is it to change
publisher? There have been lots of law suits over the
years - Elton John was one of the first writers in the 70’s
who filed lawsuits because they’d been tied to publishing
agreements for their whole career and those agreements
started to be overturned. But now, it would be standard to
do a deal that has 4 contract periods. The first contract
period could last anything from 1 to 3 years and there is
an option after that for the publisher to continue. Then
usually when they exercise the option then money is paid
out and maybe the deal terms improve slightly and that’s
all agreed at the beginning when you do your agreement
and all publishers usually insist that writer have proper
representation in that early negotiation. Usually, if they
have been successful songwriters are not tied to a
publisher for more than around 12 years.

October 4, 2016 Global: Media
Goldman Sachs Global Investment Research 61
Subscription streaming platforms have significant growth potential
but also face growing competition
We see strong growth prospects for streaming services with the growth in smartphone
penetration and improvement in connectivity enabling greater convenience and access on
the one hand, the proliferation of online music services and bundles driving greater
awareness and adoption on the other. We identify the main growth drivers below:
1) Market penetration is currently low, with 2% of smartphone owners subscribing
to a paid streaming service globally and another 4% using a freemium, ad funded
service excluding YouTube (140 mn). As discussed earlier, we forecast the
subscription and non-subscription base to grow to 9% and 13% of smartphone
users respectively by 2030.
Exhibit 103: We forecast global paid streaming
penetration to reach 9% by 2030, slightly below the top
five markets today and half of the rate attained in
Sweden Paid streaming penetration as % of smartphone subscribers
Exhibit 104: Streaming penetration stands at 2% globally
compared to 6% for SVOD and 48% for Pay TV Paid streaming penetration as % of smartphone subscribers,
SVOD penetration as % of broadband homes, Pay TV
penetration as % of TV homes, Smartphone penetration as %
of total population
Source: IFPI, ZenithOptimedia, Goldman Sachs Global Investment Research. Source: IFPI, Digital TV Research, ZenithOptimedia, Goldman Sachs Global Investment Research.
2) The opportunity to segment the market to tailor to different tastes (local vs. global
content, genres, etc.) and financial conditions (family vs. student plans, EM vs. DM), means
that multiple players can co-exist and grow in our view.
Spotify is the incumbent and leading music streaming service in the world with
around 80 mn ad-funded users and 40 mn paid users across 58 countries (source: The
Verge/Spotify). Relative to other streaming services, Spotify appears more mainstream
and has a greater emphasis on younger demographics given the availability of
discounted student plans and telecom bundled deals (Spotify reported that 77% of its
users are Gen Z/ Millennials). Spotify’s ad-funded freemium tier helps it reach a wider
audience (basically anyone with a broadband/ mobile access and a connected device)
which it then aims to switch onto its paid subscription service. The proportion of paid
users increased from 7% in 2010 to 33% as of August 2016. Despite being the
incumbent player, Spotify has hardly been affected by the launch of other streaming
services, including Apple Music in June 2015. Spotify added 15 mn paid customers
between June 2015 and June 2016, as many as the number of paid users it added
between 2012 and June 2015 or even more than the number of paid subscribers it had
cumulated since inception in 2008 until the end of 2014. This is an encouraging sign
that multiple streaming services (with different market segmentations) can co-exist,
and that the proliferation of new services contributes to awareness of such services
and growth of the overall market.
0%
5%
10%
15%
20%
25%
2008
2009
2010
2011
2012
2013
2014
2015
2016E
2017E
2018E
2019E
2020E
2021E
2022E
2023E
2024E
2025E
2026E
2027E
2028E
2029E
2030E
Sweden Top 5 markets Western Europe Global
0%
10%
20%
30%
40%
50%
60%
70%
80%
90%
World Japan Germany US WesternEurope
Sweden
Music SVOD Pay TV Smartphone
October 4, 2016 Global: Media
Goldman Sachs Global Investment Research 62
Like Spotify, Deezer offers a freemium and a paid tier, but with the particularity of
deriving a large portion of its subscribers from telecom partnerships (50% in 2016 from
80% in 2014 although 60% were then inactive bundled users). Deezer recently launched
a paid only streaming service in the US.
Apple Music operates a paid only service with no ad-funded free tier. It has a greater
bias towards families (with its $14.99 family plans) and iTunes accounts giving it an
enviable access to 800 mn credit cards on file. Apple has also made its service
available to Android smartphones. Launched in June 2015, the service counted 17 mn
paid subscribers as of September 2016.
Tidal operates a more niche, high end paid-only service with a greater focus on
exclusivity (nine exclusive album releases) and high sound quality. As of March 2016,
45% of subscribers were on the $19.99 hi-fidelity, lossless audio/video tier, despite
costing twice as much as the standard tier (source: Billboard). Unlike other platforms it
is also backed by a number of renowned artists, counting 16 artist-owners at launch
who each received a 3% stake in the company (incl. Jay Z, Beyonce, Rihanna, Madonna,
Kanye West, etc.). The launch of exclusives has had a clearly favourable impact with
the number of subscribers jumping to 2.5 mn from 1 mn after the exclusive release of
‘The Life of Pablo’ by Kanye West in February 2016 (source: TMZ). Tidal said it added
another 1.2 mn subscribers after the release of Beyonce’s ‘Lemonade’ in April 2016
(NYT, May 13, 2016).
YouTube Red is a paid-only service launched in October 2015 that gives access to all
YouTube video content free of ads as well as Google Play Music. It also includes
exclusive access to YouTube Red Originals which are new, original shows produced by
some of YouTube’s biggest creators. The service is so far only available in the US,
Australia and New Zealand, with no subscriber figures having been made available as
yet.
Amazon offers over one million songs for free for its Prime customers (“Prime Music”)
and is reported to be soon launching a paid music subscription service that would cost
the usual $9.99 pm for unlimited access on any device and $4-5 for unlimited access
exclusively on Amazon’s Echo Player (MBW, September 2, 2016). Amazon currently
counts over 300 mn active customer accounts.
Pandora recently signed a direct licensing agreement with the major labels to launch
an on-demand paid service with multiple price tiers in the US later this year, alongside
its existing internet radio service (which has a base of 78 mn active users). MBW
(September 19, 2016) suggested that Pandora will launch three tiers including a $5 on-
demand service with more limited functionality (which only allows users to soft-
download a limited number of tracks) and an $9.99 unlimited on-demand service.
iHeartRadio recently announced plans to enter the on-demand market in January 2017
with two new packages - iHeartRadio All Access, a $10 per month full on-demand
music subscription similar to Spotify Premium or Apple Music, and iHeartRadio Plus, a
$5 per month ad-free radio listening offer according to MBW. iHeartRadio already
signed all three major labels ahead of the planned launch. IHRT digital radio service,
iHeartRadio, currently counts c.90 mn users.
Local services such as Saavn in India or QQ Music in China are more focused on local
repertoire and have their own specific features.

October 4, 2016 Global: Media
Goldman Sachs Global Investment Research 63
Exhibit 105: Streaming platforms libraries compared Number of tracks available on digital streaming services (mn)
Exhibit 106: The launch of new streaming services has
not had any major cannibalisation effect Number of paid subscribers (mn)
Source: Activate, press reports. Source: Spotify, Billboard, Napster.
Exhibit 107: Spotify leads among streaming services both in terms of paying and total
subscribers * Dark blue: interactive streaming services; paying and total subscribers (m)
Source: Company data, press reports.
~1.530 30 30
4020
50
100
120
0
20
40
60
80
100
120
140
160
180
Pandora Tidal Apple Music Spotify Deezer Soundcloud YouTube
Label Content Off‐Label Content
0
5
10
15
20
25
30
35
40
45
2010 2011 2012 2013 2014 Jun‐15 Dec‐15 Apr‐16 Jun‐16 Sep‐16
Tidal Apple Music Spotify Napster/ Rhapsody
Apple Music
Spotify
Tidal
Deezer
SiriusXM
Pandora
0
5
10
15
20
25
30
35
40
0 20 40 60 80 100 120 140
Paying Subscribers
Total Subscribers

October 4, 2016 Global: Media
Goldman Sachs Global Investment Research 64
Exhibit 108: Key platforms and their differentiating features
Source: Company websites, press reports.
3) Opportunity to better leverage their promotion capabilities (e.g. playlists), user
data and customer relationships to (1) help in their future negotiations with labels, (2)
drive more advertising revenue on the freemium tier (cf Spotify partnership with the
Rubicon Project), and (3) create new adjacent revenues such as ticketing sales (cf Pandora’s
purchase of TicketFly). In particular, streaming services are becoming a much more
important partner for labels and artists as their data analytics fundamentally change the
way music consumption is measured and promoted and how new artists are being
discovered:
Promotion capabilities: we believe playlists will become an increasingly important
promotion tool for artists with one in five plays on Spotify now occurring inside a
playlist. Algorithms would even amplify the loudest voices as the highest trending
artists will be brought forward in the suggested lists. Spotify’s Discovery Weekly
playlist of 30 tracks generated over half of the monthly streams for 8,000 artists in June
2016 according to the company and 40% of Spotify users listen to it.
User engagement: while labels have never had control over the distribution and direct
access to consumers, it has become much easier for artists to directly engage with
their fans on streaming and social media platforms. Apple Music’s Connect platform,
for example, allows artists to directly reach their fans offering them the ability to post
music, videos, photos and status updates in real time.
User data informs better decisions: Labels can use the data to track digital sales and
streams on different platforms. Artists can leverage social network statistics and
listener data to adapt to their fans’ ever changing tastes and even inform their tour
Streaming
Service
Total
Users
Paying
SubsType of Streaming Free Version? Paid Version Exclusives Defining Features Target Audience
Apple Music 17 mn 17 mn Interactive Yes: 3 month trial
$9.99/month
$14.99/month: family plan (up to 6 people, each with
their own account)
Taylor Swift
Drake
Frank Ocean
Chance the Rapper
Simple interactive streaming
Curated playlists
Beats 1 radio
Music available offline
Higher‐end and users
of Apple Products
(focus on families)
Spotify 120 mn 40 mn InteractiveYes: ads, limited
listening time
$4.99/month for desktop & laptop, no ads.
$9.99/month lets you use all devices, no ads
(1‐month free trial)
‐
Simple interactive streaming
Curated playlists
Music available offline
Main‐stream
(especially Students)
Tidal 4.2 mn 4 mn Interactive Yes: free for 30 days
Tidal Premium (standard sound quality) ‐ $9.99
standard plan/ $8.49 value plan.
Tidal HiFi (hifi sound) ‐ $19.99 standard plan/$16.99
value plan
Family Plan: Gives other members (up to 4) their own
logins for 50% of normal fee
Kayne West
Beyonce
Prince
Jay‐Z
Rihanna
Simple interactive streaming
Ability to import playlists from other
streaming devices through Soundiiz.com
Music enthusiasts
(through high quality
sound & exclusives)
Deezer 16 mn 6.3 mn Interactive
Yes: ads, unlimited
music on computer &
tablet
$9.99/month (ad‐free, 1‐month free trial)
$20/month, high quality audio experience
Deezer Elite (CD quality audio): £14.99/ month for 12
months & £9.99/ month for a year (£120 paid upfront),
£9.99/ month for 2 years (£240 paid upfront)
‐
Simple interactive streaming
Curated playlists
Music available offline
Main‐stream & use in
telco bundles
Sirius XM 30.6 mn 25.1 mnNon‐Interactive
(Satellite Radio)Yes: 7 day trial
Sirius Select: $14.99/month for over 140 channels.
Sirius All Access: $19.99/month for 150+ channels and
online listening.
Sirius Mostly Music: $10.99/month 80+ channels ($4
extra to listen online)
‐ Satellite RadioMain‐stream & use in
cars
Pandora 78.1 mn 3.3 mn
Non‐Interactive
(Webcasting)
Interactive service
launching soon
Yes: limited skips,
ads, reduced quality
PandoraOne: $4.99/month for new subscribers (from
May '14); $3.99/month for existing subscribers
Pandora Plus: $5/month update of PandoraOne,
unlimited skips, no ads, replays, offline listening (4Q16
launch)
$10/month full on‐demand streaming service (4Q16
launch)
‐
Users create their own radio station
The Music Genome project generates
recommendations
Main‐stream
iHeartRadio 90 mn
Non‐Interactive
(Webcasting)
Interactive service
launching soon
Yes: limited skips,
ads
iHeartRadio Plus $5/month ad‐free offering (Jan 2017
launch)
iHeartRadio All Access $10/month full on demand
service (Jan 2017 launch)
‐Users create their own radio station or
listen to live radioMain‐stream
Amazon Interactive No$9.99/ month
$4/$5/month for streaming on Echo‐ Standalone from Prime Main‐stream
YouTube Red Interactive Yes: YouTube$9.99/month
$12.99/month for iOS users‐
Watch videos ad free
Offline viewing
Listen to videos with the screen off
Users of YouTube

October 4, 2016 Global: Media
Goldman Sachs Global Investment Research 65
decisions. Social media in particular has become a critical tool for artists to ensure they
stay relevant.
Artists are more easily discovered: Labels are increasingly following the trending
artists on SoundCloud or YouTube and the number of followers they have on social
media platforms to sign up new artists.
4) Execution and innovation will become increasingly important. As having a
comprehensive music library becomes a prerequisite, differentiation through data
analytics and curation capabilities among the streaming platforms will become
increasingly important to drive customer growth. This puts incumbent streaming platforms
such as Pandora or Spotify at somewhat of an advantage as they have already
accumulated a vast database.
The importance of personalized curation: Consumers have never had it better in
terms of convenience, discoverability and personalization of their music thanks to
technology that is powering selection algorithms and integrating social network
relationships. Spotify’s “Discover Weekly” introduced in July 2015, which
automatically generates a tailored two-hour playlist every week, is internet-scale
curation demonstrating that algorithms can tailor a playlist to someone’s tastes. It now
has 40 mn users among the more than 100 mn Spotify subscribers (IEEE Spectrum,
September 2016). Apple Music, on the other hand, has chosen a more human
approach whereby leading music experts curate the music. Apple’s Jimmy Iovine
stated that “Algorithms alone can’t do that emotional task. You need a human touch.”
Reports suggest that both Spotify and Apple Music hired radio veterans to help with
their programming and curation capabilities (MBW, July 16, 2016), proving that a mix
of the two approaches might bring the best results.
Platforms build brand loyalty: The fact that the streaming services allow subscribers
to create their own playlists, follow friends and engage with a community of followers
ensures customers are committed to a service with little incentive to switch as song
libraries are not typically transferrable from one service to another (exc. Apple Music
allowing the transfer of the iTunes library).
Spotify’s “Discover Weekly” – who said algorithm driven playlists can’t read your mind?
“Discover Weekly” defined… It is a Spotify feature that generates a personalized 30-song playlist for each of the more
than 100 mn users every Monday based on their listening habits and other playlists using algorithms.
First steps… Spotify introduced the “Discover Weekly” playlists in July 2015. The idea behind it came from the team
that was working on Spotify’s Discover page that did not take off with consumers. Once powered with – at that time – an
algorithm prototype aimed at putting recommendations in a playlist, it gave birth to the “Discover Weekly” feature.
Becoming a major success… The personalization and curation capabilities have been a major success with consumers
as witnessed by Spotify’s search for feedback on Twitter: “At this point @Spotify’s Discover Weekly knows me so well
that if it proposed I’d say yes”. Because of high demand, Spotify even suffered a service outage in September 2015. As
of August 2016, the playlists are listened to by more than 40 mn people with more than 6-7 bn tracks having been
streamed (AdWeek, August 28, 2016). In May 2016, Spotify reported that more than half of Discover Weekly's listeners
streamed at least 10 tracks from their personalized playlist, while more than half of listeners came back again the
following week.
A competitive advantage… We argue that as major streaming services have similar catalogues, knowing the customer
base and offering them the most convenient service becomes a source of differentiation. This gives Spotify an
advantage over the services that are still to launch in our view.

October 4, 2016 Global: Media
Goldman Sachs Global Investment Research 66
5) Scale will become more important. The streaming industry has relatively high barriers
to entry given the need to meet rights holders’ minimum revenue requirements and secure
a broad catalogue based on multi-year agreements with labels. A new streaming service
has to sign 30 different licensing deals in order to launch on a pan-European basis for
instance.
We identify two key risks however for streaming players (for further detail, see second of
the double album: “Paint It Black”):
The growth potential of the streaming market and the strategic importance of
such services (interactions with users) attract a plethora of players, which will
likely lead to intense competitive pressure. Among the main risks for streaming
services (and ultimately for rights owners) is the pursuit of greater differentiation
through exclusivity and windowing to the detriment of the user experience. A recent
move from leading label UMG, which reportedly ordered its labels to ban any
exclusives with streaming services, could help curb the growth of this practice in the
industry. Another source of disruption could come from tech giants (Google or
Amazon) who are ruled by a different set of economics and can use music as a loss-
leader. Apple’s recent proposal to the CRB to shift to a statutory rate of $0.091 per 100
streams for songwriting royalties applicable to all interactive streaming services in the
US (except Apple which has a direct deal with publishers) seems to be intended as a
competitive move against pure streaming players. That said, we believe labels will be
careful to keep a minimum level of competitive tension among the distributors
and therefore ensure the economics work for pure streaming players. We note that the
major labels also own stakes in the major streaming services such as Spotify (UMG,
Warner, Sony) and Deezer (Warner).
With no interactive streaming service currently being profitable, the economic
viability of such business models is yet to be proven. Internet radio or online
streaming platforms are still trying to find the right balance between freemium and
subscription revenues to fund growing royalty payments and, in the case of interactive
services, minimum guarantees. Recent developments point to a greater emphasis on
the paid model given growing complaints from artists about the free window – cf.
Taylor Swift’s decision to remove her entire back catalogue from Spotify in 2014. Most
new services now only offer a paid tier such as Apple Music and Deezer in the US, with
Pandora set to launch its on-demand service later this year and Amazon reportedly
doing the same. Spotify is also said to be introducing its premium-only music
windowing later this year (MBW, September 5, 2016).
Streaming services currently redirect around 70% of their revenues to rights owners
(70% for Spotify; 71.5% for Apple Music in the US/73% outside of the US according to
Recode), and we estimate they have to incur another 10%-15% of costs of goods sold.
Producing original videos and other content, pursuing new revenue streams such as
ticketing (Spotify recently partnered with Songkick and Pandora acquired Ticketfly),
seeking partnerships with telecom operators (to lower customer acquisition cost) and
the ongoing improvement in paid user conversion rates could help improve their
profitability. Encouragingly, Deezer reported that it generated a 13% EBITDA margin in
France in 1H15, its most mature market. Spotify’s UK accounts showed that it
generated a 16% operating profit margin in 2013 which however fell to 2% in 2014
owing to higher cost of sales and administrative expenses.
Over time, we expect to see more consolidation in the space. A few streaming services
have already been discontinued (Rdio, Beatport, Zune, etc.). Apple has been reported to be
interested in acquiring Tidal (Wall Street Journal, June 30, 2016). Sirius XM’s owner Liberty
Media was recently reported to have made an offer to buy Pandora which the latter
rejected (Wall Street Journal, July 21, 2016).
As a result of these conflicting trends, we believe streaming platforms’ distributor cut
will remain at around 30%. This would leave them with a revenue (net of royalty payment) pool of $14 bn in 2030E, from $1 bn in 2015, and a profit pool of $4-6 bn

October 4, 2016 Global: Media
Goldman Sachs Global Investment Research 67
based on long-term operating margins of 10%-15%. We expect the large tech entrants (Google, Amazon, BAT, etc.) to increase their market share of net adds to 30% by 2020 (from nil in 2015), meaning pure-play services (Spotify, Deezer, Pandora, etc.) will decrease from 63% in 2015 to 40% and Apple Music from 37% to 30%.
Exhibit 109: Future subscriber growth to be divided among three major groups of
streaming players Number of subscribers (mn)
Source: Goldman Sachs Global Investment Research.
0
100
200
300
400
500
600
700
2010
2011
2012
2013
2014
2015
2016
E
2017
E
2018
E
2019
E
2020
E
2021
E
2022
E
2023
E
2024
E
2025
E
2026
E
2027
E
2028
E
2029
E
2030
E
Pure streaming players Global internet players (AMZ, FB, GGL) Apple Music

October 4, 2016 Global: Media
Goldman Sachs Global Investment Research 68
An interview on music streaming with…
An interview with…
Dr. Hans-Holger Albrecht, CEO of Deezer
Dr. Hans-Holger Albrecht is the CEO of
Deezer and a member of the company’s
board of directors. Prior to assuming his
current role in February 2015, Albrecht
served as president and CEO of media
groups Millicom and Modern Times
Group.
Deezer was one of the first streaming services to be
launched in 2007. A number of new streaming services
have launched since. Is there room for everyone? How
can you differentiate yourself?
There is no one single streaming model fitting all countries
in the world. We are just in the early days of streaming
growth with global penetration being only 3%-4% in mature
markets with plenty of opportunity for players to define their
niche. In 2015, there were 68 mn streaming subscribers
worldwide – which give a much lower penetration of the
population. The biggest challenge for the new entrants is to
build a compelling product – some of the incumbents,
including Deezer, have spent years in acquiring content,
building a multi-local product (languages, currencies, etc.)
and developing the algorithms and data analytics that are
hard to replicate – it takes time and significant funding. We
also differentiate ourselves through the Flow product that
creates an individually personalised listening experience the
moment you press the button. It is much more responsive
than a playlist that is updated every week. Another
differentiation point lies in our go to market strategy – we
have cultivated a partnership model that helped us build a
strong position in Europe and expand in emerging markets.
Regarding your go to market strategy, you’ve been more
reliant on telecom partnerships than others; do you still
think this is the best strategy?
It really depends on the cycle of the market you are entering.
It certainly has its limits, but it has proven to be the best
strategy so far in entering emerging markets, but not only.
It’s a great way to scale quickly in a very cost efficient
manner as you can leverage telecom operators’ brand and
marketing capabilities. However, we do realise the
importance of direct customer acquisition and that is why we
have gradually shifted our model from 80% of revenues
being telco partnership driven five years ago, to less than
50% currently.
How do you view the competition from the larger
internet players and what’s the role of labels in
ensuring competition is balanced?
Take Apple for example, it has around 20% of the global
smartphone market, meaning there are still 80% of people
who do not use Apple devices, creating room for other
players and strategies to succeed as well. It is not easy to
compete against the likes of Amazon, Google, Apple, but
there are alternative strategies and competitive
advantages you can rely on. Regarding the role of labels, I
think they learned from their experience of iTunes that
dominated 80% of the download market. Their role is to
make sure that music has its price while maintaining some
competitive pressure in the market.
Is there anything that a label does today that a
streaming service can do better?
Labels’ core competencies are around research and
development, promotion and talent funding. I think
streaming services will be able to take over the promotion
capability from radio over time. On the funding side, there
are artists that want and can do it on their own. But that
doesn’t mean we are competing against labels at this
stage, it is more of a partnership and we are exploring
opportunities together.
What do you think of exclusivity and windowing? Is it
something you might be tempted to explore as well?
We could do that if we wanted to, but we see it as a major
risk to the industry as a whole. The biggest competitor we
have is piracy still – the moment we make the experience
more complicated, the consumer will shift back to piracy.
Look at what happened with Frank Ocean’s exclusive that
was illegally downloaded 750k times in a week and that
probably meant a lot of money was lost. It is very naïve to
think that people will go to different streaming services for
different artists. Windowing, on the other hand, is
interesting, but unlike sports events, it is really difficult to
drive conversion from windowing while piracy remains a
risk. Consumers join Deezer for the convenience and the
music experience. Exclusivity and windowing risk
destroying the model.

October 4, 2016 Global: Media
Goldman Sachs Global Investment Research 69
There are a lot of complaints from artists and labels
against streaming services’ free tier. Do you believe there
is a future for freemium?
As long as the freemium model demonstrates that it
converts people to pay, I do think there is a way forward. I
also think that if artists complain about not being paid
enough by the freemium tier they should be at least twice as
angry against YouTube that directly competes against the
free tier. YouTube has around 900 mn users and pays only
30% of the fees paid by subscription streaming companies to
the labels and generates 20 times lower revenue per user.
There is a huge value gap in that respect and labels will have
to do something about it.
Will we see a streaming-only future and when? What
level of paid penetration do you think we could get to?
I can’t see any reason why other markets wouldn’t get to
Sweden or Norway’s level of paid streaming penetration at
around 25% of total population over time. Factors that can
affect that trajectory are consumer behaviour around music –
look at the Germans that are shifting to streaming very
slowly or Japan that has a peculiar way of bundling CDs –
and also further integration of streaming services (in cars, at
home, etc.). Consumer education will play an important role
as people are used to having music for free and a lot of them
still like the ownership model. We have to explain to them
the value proposition and the fact that we are not simply
replacing download with streaming but rather offer them a
completely new experience. Another factor will be the level
of market development – emerging markets will shift to
streaming right away for example. I think the potential is
there, it is more a question of how fast we’ll get there and
what will be the trigger to accelerating growth.
How does Deezer pay labels/songwriters?
A couple of years ago we paid over 90% our revenues to
labels and that has come down to 75%. We are negotiating
with labels on a daily basis and the rates tend to come down
over time, but the absolute amount is going up, so it is a
win-win situation. One of the reasons why the royalties are
coming down is because we can provide labels with data
around the end customer.
None of the streaming services are currently profitable –
what’s your breakeven horizon and where do you think
you can get to in terms of margins?
The business model is driven by three cost components:
royalty payments to rights owners that are structurally
coming down; product development and overhead costs that
are currently high because we are in a start-up mode but will
come down as percentage of sales as we gain scale; and
finally marketing costs that are at our discretion. I’m not
concerned about profitability as such as it would mean we
miss out growth opportunities. The question is more what
sort of operating margins we believe the industry will have
and that’s a wide range from single digit up to 20%.
Streaming services, labels, artists: how do you see the
balance of power evolve in the future?
I wouldn’t say it is all about a power shift, but rather about
the opportunities we have by bringing more transparency
to artists and more convenience to customers. Currently,
c.90% of music industry revenues are coming from six or
seven markets. And all of a sudden, we can build a model
that brings double digit millions revenue from Colombia
for example. Deezer is in a favourable position as it has
the relationship with the end consumer and the data
around it. That is why the labels have invested in us, they
have to adapt and I can say they have been doing ok so far.
What do you think of the ad revenue opportunity in
streaming given how large the radio market is?
When you consider that half of the usage on Deezer is a
radio-like experience, i.e., in lean back mode, it gives you
an idea of the impact it can have on radio. It is definitely
an opportunity for streaming services to tap into the radio
advertising market. It is difficult to say at this stage
whether this will be done through acquisitions or
organically, but the opportunity is definitely there.
What do you think of the current promotional activity
in the market and how sustainable is the $9.99 price?
Promotion is a tactical thing that you do in every
subscription model as you try to get the customer over the
finish line. They are normally locked in for three months or
so and that’s fine. The 9.99 is a given price by the label,
but to be fair, if you look around the world we have more
pricing points already – we have the family packages
where you can sign up to six people for 14.99, we have
different pricing points in the emerging markets, with the
telco partnerships sometimes – so the 9.99 is not set in
stone and we all adapt. I think the key point is that music is
not cheap. With most of our costs being variable, if the
price point goes down or royalties go down our margin as
a percentage of revenues does not change.
You mentioned data analytics being a key
differentiator for Deezer. Can you elaborate on that?
Today we collect around 10 bn customer data points every
month and we have been using data for the past 10 years.
This gives us a deep understanding of the individual
customers in terms of what they listen to, where, how,
their music tastes, etc. It then helps us build the consumer
experience – we bring the over 40 mn tracks into
personalised playlists or adapt it to the consumer’s own
music consumption style. I think people underestimate
how difficult it is to launch a new streaming service, that
will have to build the data analytics from scratch. Through
our partnership with the labels, for the first time they have
access to that data. Once you know the customer, you can
build adjacent revenue streams such as ticketing for
example. But we have to be careful not to ruin the
experience.

October 4, 2016 Global: Media
Goldman Sachs Global Investment Research 70
Ad funded streaming to eat into terrestrial radio
We believe ad-funded streaming (on YouTube, Pandora, Spotify, etc.) will become
increasingly relevant and appealing for advertisers given the exponential growth in online
audio and video consumption especially on mobile devices, the ability to better target and
interact with consumers, and the opportunity to do so by leveraging programmatic
advertising technologies.
We estimate the current ad funded market to be worth $1.5 bn globally and expect this to
rise to $7 bn in 2030 – this includes revenues from purely ad funded websites (YouTube,
etc.), advertising revenues from freemium services (Spotify, Deezer, etc.) and advertising
revenues from digital radio services (Pandora, etc.). Note that these three items are
reported under different definitions in the IFPI data (IFPI’s ad funded revenues only refer to
websites such as YouTube, freemium revenues are included in paid streaming and online
radio in other digital revenue). We see a huge addressable market with the global
advertising market worth $456 bn, global radio market $30 bn and programmatic
advertising $10 bn in 2015 (MAGNA Global).
In the US, we see online radio as a substitute for terrestrial radio services and this shift is
particularly positive for labels and artists who currently do not get paid performance
royalties from analogue radio. Consumption of radio under its analogue form remains
dominant at 54% (4Q2015, Edison Research) but is decreasing: the US Radio Advertising
Bureau reported that average listening hours has decreased from 20 hours a week in 2007
to nearly 14 hours a week. A survey from Edison Research shows that nearly half of digital
radio listeners are using those services as a replacement for AM/FM.
The US ad-funded streaming market was worth $385 mn and digital radio around $803 mn
in 2015 as per RIAA data and we believe this has the potential to rise to $2.3 bn and $1.5 bn
respectively by 2030. This compares to a radio market worth $14 bn in 2015 (MAGNA
Global). With half of terrestrial radio consumption still happening in the car in the US, we
believe the replacement with newer cars with more advanced dashboards, that are
compatible with smartphones or have internet connectivity, will drive greater shifts
towards streaming services.
Exhibit 110: The global addressable market for
advertising-funded streaming is huge Advertising spend by category, $ bn
Exhibit 111: We expect digital radio and streaming
services to eat into the terrestrial radio ad market in the
US Advertising spend by category, $ mn
Source: MAGNA Global, IFPI. Source: MAGNA Global, IFPI, Goldman Sachs Global Investment Research.
1.5 10.029.5
456.4
0
50
100
150
200
250
300
350
400
450
500
Total ad supportedstreaming
Programmaticadvertising
Global radioadvertising
Global advertising
0
5000
10000
15000
20000
25000
2003
2005
2007
2009
2011
2013
2015
2017E
2019E
2021E
2023E
2025E
2027E
2029E
US radio advertising Ad supported streaming SoundExchange Distributions

October 4, 2016 Global: Media
Goldman Sachs Global Investment Research 71
Exhibit 112: 44% of digital radio listening is replacing
analogue Daily listening to streaming service vs. AM/FM by age group,
US, 2014
Exhibit 113: Young listeners spend more time listening
through streaming, although AM/FM radio remains the
largest overall Daily listening to streaming service vs. AM/FM by age group,
US, 2014
Source: Edison Research Streaming Audio Task Force, Summer 2013/ IAB. Source: Activate.
Exhibit 114: AM/FM remains dominant in the car, but
decreasing % currently using medium in primary car
Exhibit 115: Penetration of connected cars is rising and
expected to reach 80% in 10 years’ time % of new cars sold with CD players and smartphone
integration in Europe
Source: Edison Research, Triton Digital, Gartner. Source: BPI.
Purely ad-funded services (mainly YouTube) have plenty of growth opportunity ahead, but face greater pressure to improve monetisation for rights holders
The pure ad-funded landscape is currently dominated by YouTube which accounts for
c.90% of users according to IFPI. We see room for YouTube’s revenue from music to
grow as:
1. Online video is still c.3% of overall ad spend globally but has been the main driver of
online advertising growth (together with social media), growing at a CAGR of 42% over
the past five years (as per MAGNA Global). We expect this strong growth to continue;
MAGNA Global forecasts a 2015-29 CAGR of 29%. We believe this will continue to be
funded by a shift in advertising budgets from other digital formats such as display and
also TV.
44%
30%
26% Mostly replacing local"over‐the‐air" AM/FMradio stations
Mostly replacing yourCDs/MP3 collection
It's new time; not timetaken from radio orCDs/MP3s
55%
35%
17%
6%
45%
65%
83%
94%
0% 20% 40% 60% 80% 100%
13‐17
17‐34
34‐55
55+
Age
Streaming Services AM/FM
84%
63%
23%
12%
15%
86%
61%
31%
14%
17%
81%
55%
38%
21%
17%
0% 10% 20% 30% 40% 50% 60% 70% 80% 90% 100%
AM/FM Radio
CD Player
MP3 Player/Owned Digital Music
Online Radio
Satellite Radio
2013
2014
2015
0%
10%
20%
30%
40%
50%
60%
70%
80%
90%
2014 2015 2016 2017 2018 2019 2020 2021 2022 2023 2024 2025
Smartphone Integration CD Player

October 4, 2016 Global: Media
Goldman Sachs Global Investment Research 72
Exhibit 116: Online video advertising is to reach 8.5% of overall ad spend by 2020E Global online video ad spend
Source: MAGNA Global, Goldman Sachs Global Investment Research.
2. YouTube is particularly well placed to benefit as we estimate the platform accounted
for c.40% of the online video market in 2015. We estimate that YouTube revenues grew
at a 50% CAGR over 2010-15 and forecast c.30% CAGR over 2015-18, driven by further
growth in YouTube consumption and improved monetization as more innovative ad
formats are introduced.
3. We see music as an important driver of traffic – around 35% of YouTube viewing is on
music artist/label channels, second only after channels of YouTube natives according
to FT. IFPI also found that 82% of YouTube users access music content through the
service in the top 13 music markets. We calculate that music accounted for around 18%
of YouTube revenues in 2015, based on the global ad-funded streaming revenue
reported by IFPI and YouTube’s 45% cut (according to MBW), and forecast that share to
reduce slightly to 15% of YouTube revenue in 2018.
Exhibit 117: 35% of video views on YouTube are on music
artist/label channels YouTube most viewed channels for last 90 days, Dec 2015
Exhibit 118: We expect YouTube revenues to reach
almost $14 bn in 2018E with c.15% coming from music YouTube revenues, 2007-18E
Source: FT.
Source: Company data, Goldman Sachs Global Investment Research.
0.0%
1.0%
2.0%
3.0%
4.0%
5.0%
6.0%
7.0%
8.0%
9.0%
0
10000
20000
30000
40000
50000
60000
2007
2008
2009
2010
2011
2012
2013
2014
2015
2016E
2017E
2018E
2019E
2020E
Online video ad spend (in $mn ‐ LHS) Online video as % of total ad spend (RHS)
Native YouTubers, 45%
Music artist/label
channels, 35%
Other, 20%
0%
5%
10%
15%
20%
25%
30%
35%
40%
0
2000
4000
6000
8000
10000
12000
14000
2007 2008 2009 2010 2011 2012 2013 2014 2015 2016E 2017E 2018E
YouTube total revenues ($ mn) Youtube Music as % of total

October 4, 2016 Global: Media
Goldman Sachs Global Investment Research 73
We believe however that YouTube will face ever growing pressure from regulators
and content owners to improve the monetization of its videos and redistribute a
greater share of its gross revenues. The outcome of the US review of safe harbour rules
and implications of the recent EU Copyright proposal will be important in addressing the
perceived value gap between the usage and monetization of music on platforms such as
YouTube (see section Future regulatory change could present upside for rights holders).
Exhibit 119: There are 13x more ad-funded users (of
which 90% is YouTube) than paid users, yet ad-funded
generate 3x less revenue
Exhibit 120: YouTube accounts for 40% of music listening
but 4% of recorded music revenue Total streams by service, 1Q-2Q, 2014 vs. 2015 (bn)
Source: IFPI. Source: Apple, IFPI.
Exhibit 121: YouTube’s distributor cut is 45% compared to 30% for music platforms Estimated split of YouTube vs. industry standard music royalties
Source: Music Business Worldwide, Press reports, Goldman Sachs Global Investment Research.
VEVO aims to become less reliant on YouTube
VEVO is the leading music channel on YouTube, with more than 18 bn of music video
views per month and 850 mn hours of viewed content, of which 60% from mobile. VEVO
also claimed 17 of the top 23 YouTube videos with more than 1 bn views to date (April
2016). Recent press reports suggest that VEVO aims to reduce its dependence on YouTube
following the re-launch of its app and website and ahead of the launch of a paid
subscription service by the end of the year (FT, August 19, 2016). VEVO’s CEO, Erik
Huggers, stated that he wanted to position VEVO more as a specialty record store as
opposed to YouTube that is more of a “one size fits all” model, while recognizing that there
is room for both services to grow and that YouTube will remain an important partner (FT,
August 2016). We note that VEVO has just signed a distribution deal to include for the first
time WMG videos on its apps and website but not on its YouTube pages. VEVO is currently
owned by SME and UMG (40% stake each) with Abu Dhabi Media and Alphabet also
owning small stakes.
0
5
10
15
20
25
30
0
500
1000
1500
2000
2500
Subscription Ad‐supported
Users (m, LHS) Revenue ($m, LHS) ARPU ($)
0%
5%
10%
15%
20%
25%
30%
35%
40%
45%
Youtube proportion of musicconsumption
Youtube proportion of recorded musicrevenue
Youtube Music revenue split Standard revenue split (iTunes, Spotify etc)
Labels, 45%
Publishers, 10%
Youtube, 45%
Labels, 60%
Publishers, 10%
Platform, 30%
October 4, 2016 Global: Media
Goldman Sachs Global Investment Research 74
Pandora
In the US, Pandora has rapidly grown to 78 mn active users of which 4 mn are paid
subscribers, and we forecast total active users to grow to 90 mn by 2020, a 2% CAGR.
Pandora reported 10.1% share of total US radio listener hours in 2Q16, which we forecast
to grow to 12.4% by 2020. We believe that the leverage in Pandora’s model lies in the
company’s ability to shift its advertising from national and remnant to a majority local mix,
similar to the majority local mix of terrestrial radio. Local is the fastest growing part of
Pandora’s advertising revenue, accounting for 28% of ad revenue in 2Q16 (up from 20%
just two years prior), while local commands eCPMs that are 2.5-3x greater than national
ads. BIA/Kelsey forecasts location targeted mobile ad spend to grow from $9.8 bn last year
to $29.5 bn in 2020, though that figure does include some national brand advertising.
While local sales dollars are more expensive to acquire as they take more investment in
both people and time, the leverage they generate from superior pricing more than makes
up for the increased cost of sales on that revenue. Importantly, driving incremental local ad
sales is more accretive to Pandora’s bottom line than selling more national ads. Pandora
believes the combination of local audience reach, local ad sales teams, and technology
integration has resulted in increased momentum in local advertising revenue. Pandora
currently has local sales teams in 39 markets. The company noted in 2Q16 that 154 of its
508 sales reps were specifically focused on local markets.
Pandora also intends to use its ad-supported service as a user acquisition channel for its
proposed on-demand offering, which we believe creates a competitive advantage as its
free, ad-supported product has shown the potential to be profitable (positive GAAP EBITDA
in 3Q14 and 4Q15, and positive operating cash flow in 2014). Customer acquisition costs
have generated large upfront losses for online streaming competitors, and being able to
offset those costs with a potentially profitable user acquisition channel creates a unique
advantage for Pandora, in our view. We also see potential for Pandora to move more local
sales to a lower-cost self-service model over time, which would further increase profit
potential for that product.
Spotify
Spotify’s advertising revenues grew strongly from €21 mn in 2010 to €196 mn in 2015 (98%
growth in 2015 alone) while freemium users grew from 6 mn at end-2010 to 71 mn at end-
2015 (MBW); this implies average revenue per ad funded user of €3.6 throughout the
period. Going forward, Spotify sees programmatic as a key growth driver for the ad-
supported business and aims to open up all its audio inventory to programmatic within the
next five years (Adage interview). Spotify introduced its programmatic offering in
November 2015 and opened up its audio ad inventory for programmatic media buyers by
signing a deal with Rubicon Project, App Nexus and the Trade Desk in July 2016. This
enables Spotify to sell its ad inventory in near real time through private digital exchanges
and in a highly targeted way, based on devices and demographics but also first-party
playlist data that reflect the person’s interests. Moreover, Spotify’s ads are 100% viewable
as they are shown in-app and only when the user is active. Spotify counted 70 mn ad-
supported listeners globally in 2015 and reported that around 70% of streams were mobile.

October 4, 2016 Global: Media
Goldman Sachs Global Investment Research 75
Exhibit 122: Spotify’s advertising revenue has increased
in line with the number of freemium users
Exhibit 123: Spotify’s ad revenue per user has hardly
moved over the last five years Spotify advertising revenues per free user (€)
Source: Spotify.
Source: Spotify.
Sync revenues: An additional growth opportunity for rights holders
Synchronisation revenues refer to flat fees or royalties generated by the use of sound
recordings in TV, films, games and advertising as background sound.
Sync remains small at $360 mn or 2% of the global recorded music industry in 2015 (IFPI)
but it is a growing source of recurring revenues for which we forecast a 2015-30 CAGR of
c.4% after 7% over 2013-15, driven by a rising consumption of content – be it TV, films,
adverts or games, especially in markets outside of the US. The US is the largest sync
market accounting for 57% of the total in 2015, far ahead of the UK at 9% and France at 8%.
Not only is this becoming a more important source of revenue for rights holders, but it is
also becoming a more important source of discoverability of artists with 26% of people
discovering artists through sync according to a 2015 Ipsos study conducted across 13
major music markets.
We see Vivendi and Sony as well positioned to leverage their other media assets to
increase sync revenues and turn artists into brands such as: TV/movies (StudioCanal, Sony
Pictures), video games (Gameloft, Playstation), online video (Dailymotion, VEVO) or
advertising (through the partnership with Vivendi' sister company Havas). We believe this
will improve relationship with artists and strengthen their competitive advantage over time.
0
10
20
30
40
50
60
70
80
0
50,000
100,000
150,000
200,000
250,000
2010 2011 2012 2013 2014 2015
Advertising revenue (€ '000) Freemium users (mn, RHS)0.0
0.5
1.0
1.5
2.0
2.5
3.0
3.5
4.0
4.5
2011 2012 2013 2014 2015

October 4, 2016 Global: Media
Goldman Sachs Global Investment Research 76
Vivendi: Exploiting synergies across its asset portfolio to boost sync revenue
TV production: Vivendi has identified c.40 potential collaborations between UMG and StudioCanal such as
documentaries, musical movies and biopics. The film “Legend”, for example, was the best British box-office launch
ever posted by StudioCanal whose soundtrack was produced by one of UMG’s artists – Duffy. Vivendi's Studio+ will
produce digital mini-series for mobile in cooperation with both UMG and StudioCanal. UMG CEO and Chairman,
Lucian Grainge, was appointed on the board of Lionsgate (September 14, 2016) and was reported to have
strengthened the relationship between UMG and other US entertainment companies in recent years.
Video games: UMG music can be used in Vivendi’s gaming assets (Gameloft, potentially Ubisoft) as soundtracks.
Online video: Dailymotion and VEVO (of which Vivendi owns 40%) are among the most viewed online video
platforms globally with 3.5 bn and 18 bn monthly video views and can therefore improve the visibility of UMG's
artists and the monetisation of its music videos.
Advertising: Vivendi's sister company Havas and UMG announced the formation of the Global Music Data Alliance
(GMDA) in January 2015 in order to leverage UMG’s proprietary data across multiple artists and genres by
combining it with Havas’ analytical capabilities to reach a holistic view of music consumption across a range of
platforms. This can help provide new revenue opportunities for UMG artists and labels by creating marketing
opportunities for brands. Examples of potential opportunities include driving sponsorship for live events or album
tie-in promotions. There is also scope for advertisers to utilise a particular artist or tune for a campaign based on
data about consumer preferences. UMG added another layer to its relationship with Havas in September 2015 by
teaming up with BETC (owned by Havas) to launch a jointly-run record label called POP Records since September
2015 with an aim to launch new artists and use BETC’s pop culture expertise to create content for artists.
Touring: Vivendi can also leverage its ticketing businesses (Digitick, See Tickets) and concert halls (Olympia) to
promote artists and boost performance income
Live entertainment will become more important and a growth
opportunity for streaming platforms
Unlike recorded music, live music has been relatively immune to the online transition and
resulting piracy over the past decade. With recorded music sales declining, artists also
became more dependent on live music performance which in turn led record companies to
expand into that segment. Live music has indeed been the fastest growing area of the
music industry worth another $25 bn of revenue in 2015 according to IFPI.
We forecast $14 bn of additional revenue opportunity by 2030 as the segment will benefit
from favourable demographic shifts (greater preference for experiences among Millennials
and Gen Z) and optimization of vacancy rates enabled by new technologies and data.
Streaming services are particularly well placed to leverage listening data for the marketing
and promotion of live events and the possibility to connect directly with fans. It is
estimated that 40%-50% of tickets are currently unsold in the US (Billboard, September 4,
2010). According to our analysis of over 5,000 live events in the United States (data from
global concert industry trade publication, Pollstar), average vacancy was 26%, with venues
with fewer than 1k seats seeing vacancy rates of 30%. This explains the move of various
music players such as Pandora, Vivendi (owner of UMG) and Access Industries (owner of
WMG) to acquire ticketing companies.

October 4, 2016 Global: Media
Goldman Sachs Global Investment Research 77
Exhibit 124: Vacancy rates have tended to be higher for shows at smaller venues, typically
featuring lesser-known artists with smaller promotion budgets Average vacancy rate, by venue size (maximum seat capacity)
Source: Pollstar.
Pandora’s October 2015 acquisition of Ticketfly should enable it to leverage its user data,
especially listening history and location data, to drive down vacancy rates at some venues.
One key driver of high vacancy rates is a lack of awareness of smaller acts which do not
have national marketing campaigns. Many of the largest venues in the United States
(stadiums, arenas, etc.) are booked in partnership with LiveNation for ticketing and
promotion. Pandora has noted that its target market for Ticketfly is outside of those mega
venues, and more focused on Tier 2 events. Pandora has deep insight into its users’
listening habits and artist preferences – the company knows where its users live and which
artists they like based on station creation and thumb data (which songs a user has
“thumbed up” or “thumbed down”). Given this data, Pandora believes it can help drive
awareness of local events among known fans of a given artist, and more effectively fill
venues. Better matching the supply and demand could save up to $2 bn of revenues for the
US live industry alone assuming 24 mn tickets are unsold every year in the US at an
average price of $67.33.
30%
27%
21% 20%
13%
21%
11%
0%
5%
10%
15%
20%
25%
30%
35%
<1k 1k‐2.5k 2.5k‐5k 5k‐10k 10k‐20k 20k‐50k 50k+
Avg. Vacancy

October 4, 2016 Global: Media
Goldman Sachs Global Investment Research 78
Stock implications
Vivendi (CL-Buy)
We see Vivendi as a main beneficiary of the recovery in the music industry through UMG,
the world’s largest record company and second largest music publisher. UMG accounted
for 47% of 2015 group revenue and 63% of EBITA. We believe UMG will not only benefit
from overall music market growth, especially in the recorded segment, but will also drive
new revenue streams and synergies in synchronization and live though greater integration
with Vivendi’s other businesses and partners: leading online video services Dailymotion
and VEVO, TV, video games, ticketing and telecom partnerships (Telefonica, Telecom Italia,
Orange). UMG should also increasingly benefit from the marketing/branding/PR expertise
brought from its partnership with Vivendi’s sister company Havas, the world’s sixth largest
advertising agency.
We increase our UMG revenue by 3.2% and EBITA by 6.5% on average over 2016-2020E to
reflect our new global industry forecasts. We now forecast revenue to grow 4.4% (2015-20E
CAGR) and margins to expand to 15.2% in 2020 from 11.6% in 2015 thanks to streaming.
This drives a 3% average increase in our Vivendi EPS forecasts over 2016-20. Our UMG
DCF-based valuation increases by 5% to €13.1 bn leading us to raise Vivendi’s 12-month
SOTP-based target price to €21.5 from €21.1. We reiterate our Buy rating, and the stock
remains on the Conviction List.
Sony (CL-Buy)
Music is the cornerstone in Sony’s transition to becoming a global entertainment giant.
We believe Sony is one of key beneficiaries of recovery in the music industry alongside
Vivendi, and reiterate our Conviction List-Buy. Sony is the world’s second largest record
company and the largest music publisher. We estimate the music segment will account for
8% of group revenue and 23% of operating profits in FY16 (30% in FY2015). We believe
Sony Music will benefit from two structural advantages which should enable it to
outperform the overall music market: 1) large song catalogue, with Sony’s main label
Columbia Records founded in 1887, the oldest surviving record label in the world. The
growth of streaming increases consumption and monetization of its catalogue. 2) Cross-
media synchronization opportunity and improved discoverability, with Sony being a large
media conglomerate with strong TV production activity in North America, unprofitable yet
large-scale motion pictures studios and the world’s most successful video game platform,
PlayStation.
We raise our Sony estimates slightly (+1%) and build a more detailed growth outlook for
the music business. We now assume a negative 10% CAGR (2015-20) for the physical
recording business and assume a CAGR for the streaming business of +29% over the same
period. We assume the recording business will grow at 7% in aggregate, with a 5% CAGR
in music publishing. We also assume margins will improve as we believe digital has 7-
10 pp higher operating profit margin vs. the physical business. We forecast Sony’s music
business operating profit margin to improve from 12.2% in FY16 to 15.7% by FY20.
Pandora (CL-Buy)
We believe Pandora’s leadership in internet radio, combined with the data generated by its
100 mn+ quarterly logged-in users and nearly 6 bn hours of quarterly listening, provides a
strong competitive platform, which we expect to continue taking share of listening hours
from terrestrial radio in the US. Pandora has more than doubled its share of US radio
listener hours from 4% in 2011 to 10% in 2015. Pandora’s cost structure has also stabilized
now that it has signed direct deals with all major record labels. Licensing cost for its ad-
supported product will be in the region of $33 per thousand hours, modestly above the $31
it had been paying prior to the deals. With secular tailwinds from the proliferation of
connected devices, including autos, mobile devices, and in-home entertainment, we expect
Pandora to surpass 23 bn listener hours in 2017, excluding the potential impact of any on-

October 4, 2016 Global: Media
Goldman Sachs Global Investment Research 79
demand offering. We believe Pandora’s move into interactive streaming will significantly
expand its addressable market and monetisation of its listeners. Its unique database, long-
standing brand and strong customer relationships put it in a favourable position to upsell
its on-demand service to its c.80 mn ad-funded radio customers and better segment its
customer base through multiple price points. We recently added Pandora to the Conviction
List (see Adding Pandora to CL ahead of subscription driven product cycle, October 4, 2016)
Apple (Buy)
Apple is a leading provider of smartphones, tablets, and PCs with proprietary operating
systems across mobile devices (iOS) and general purpose computers (Mac OS). Apple’s
platforms attract a robust user base with nearly 800 mn iTunes accounts, over 590mn
iPhone users (GSe), and a Mac installed base of 80 mn. As we expect core device sales to
slow, we believe Apple will increasingly focus on its services stream with the
iTunes/Software/Services segment which we forecast to growth to $29.9 bn of revenue in
FY18 (12.8% of revenue) from $19.9 bn of revenue in FY15 (8.5% of total). Within this, Apple
should increasingly benefit from the growth of music streaming through its subscription
service Apple Music which it can upsell to its large installed base of iPhones. We forecast
Apple Music users as a percentage of iPhone users to increase from 2% in 2016E to 14% in
2030E. This implies that Apple will account for around 35% of global net subscriber
additions over the next five years and 27% over 2020-30 (as more rival services launch).
This gives revenue of US$1.2 bn in 2016E growing to US$13 bn in 2030. While Apple’s
iTunes remains a dominant player in the structurally declining downloads business, we
expect the growth from streaming to more than offset the decline in downloads by 2017.
Alphabet (CL-Buy)
As the dominant online video platform for music, we view YouTube as particularly well
positioned to benefit from the strong growth in music video consumption and online video
advertising especially on mobile devices. We estimate the platform accounted for ~40% of
the online video market in 2015. We estimate that YouTube revenues grew at a 50% CAGR
over 2010-15 and forecast c.30% CAGR over 2015-18, with around 15%-20% coming from
music. We believe however that YouTube will be under greater pressure to improve
monetisation for rights holders amid greater regulatory scrutiny and as competition for
online audiences intensifies. We estimate that YouTube accounted for 9% of Alphabet’s
revenue in 2015 and we forecast its share to rise to 12% by 2018.
iHeart (Not Covered)
While the overall US terrestrial radio industry is likely to lose share to digital alternatives
and will need to adapt to change, we believe IHRT will continue to outperform peers by a
healthy margin for years, given 1) it is the largest station and benefits from scale,
particularly as it relates to national advertising, 2) it has a credible digital platform that
others lack, which therefore allows it to recapture more of the terrestrial pie that is
migrating to digital, and 3) it is the biggest player but is still c.20% of the industry at c.$3 bn
in radio revenues vs. a $15 bn pie.
Sirius XM (Neutral)
Sirius XM (SIRI) is the leading subscription-based satellite radio broadcaster in the United
States with over 30 mn paid subscribers. The company is best known for its curated
commercial free music, live sports and talk radio content. We believe SIRI will continue to
maintain its competitive advantage and market share in the in-car radio market given its (1)
exclusive content portfolio (most notably major sports leagues and Howard Stern), (2)
established distribution platform via +23k auto dealerships, and (3) ease of use via its driver
friendly interface. SIRI is also making strides to participate in the connected car and
streaming music universe via the upcoming launch of its “360L” platform. This platform
looks to incorporate the economics of linear satellite distribution with interactive music
streaming, customizable user interfaces and analytic abilities of two-way data networks.

October 4, 2016 Global: Media
Goldman Sachs Global Investment Research 80
We believe the launch of 360L will better position SIRI to compete with both IP radio and
on-demand streamers while maintaining its industry leasing cost structure.
Our Neutral rating represents a balance of a few key factors. Key positives are (1) superior
cost structure and margins when compared with streaming counterparts, (2) an expanding
addressable market of Sirius-enabled vehicles within the used car market, and (2) growing
FCF that we expect to fund material share repurchases over the next 3-6 years. These are
balanced, in our view, by (1) potential moderation in new car sales (SIRI’s key subscriber
acquisition ‘funnel’), (2) emerging competition as connected car sales ramp, and (3)
valuation that continues to remain in-line with peers’, even if we account for SIRI’s strong
FCF growth.
Exhibit 125: Summary of price target methodologies and risks
Source: Goldman Sachs Global Investment Research.
Company Ticker Rating Price12M Price
targetValuation methodology Risks
Alphabet GOOGL * Buy $ 800.4 930.0
Price target is derived from a three‐way equal‐weighted valuation
approach, which includes a five‐year traditional discounted cash flow
(DCF) analysis, an EV/EBITDA multiple analysis, and a P/E analysis.
‐ On EV/EBITDA, we use a multiple of 13x
‐ On P/E, we use a multiple of 22x
‐ DCF assumptions are a discount rate of 7% and a FCF perpetuity growth
rate of 4%.
(‐) Weaker‐than‐expected cost discipline,
competition, dilutive M&A
Apple AAPL Buy $ 112.5 124.0 Our 12‐month price target is based on a 12.5X CY17 P/E(‐) Product cycle execution, end demand, and a
slower pace of innovation
Pandora P * Buy $ 14.2 19.012m price target is based on a 70% / 30% blend of the DCF midpoint of
the range of outcomes for the business over the next 5 years and 3X
2017E EV/Sales M&A valuation
(‐) Competition, content costs, failure to grow
monetization/engagement.
Sirius XM SIRI Neutral $ 4.2 4.512‐month price target is based on a blend of three methods 1/2 FCF
(15x), 1/4 EV/EBITDA (13x), and 1/4 DCF (7.9% WACC, 3.0% Term).
(+) Strong new car sales, higher uptake in the used
car segment, increased share repurchases.
(‐) Competition from streaming services, loss of key
content, weak auto sales.
Sony 6758.T * Buy ¥ 3371.0 4400.0 Our 12m price target is based on a SOTP valuation(‐) Delays rebuilding the movie business, stronger
yen, weak consumption.
Vivendi VIV.PA * Buy € 17.7 21.5 Our 12m price target is based on a SOTP valuation(‐) Lack of recovery in Music, worse trends at Canal+
France, M&A.
* Denotes Conviction List membership

October 4, 2016 Global: Media
Goldman Sachs Global Investment Research 81
Appendix
Exhibit 126: Vivendi: changes to our estimates
Source: Goldman Sachs Global Investment Research.
Exhibit 127: Sony: changes to our estimates
Source: Goldman Sachs Global Investment Research.
2016E 2017E 2018E 2019E 2020E 2016E 2017E 2018E 2019E 2020E 2016E 2017E 2018E 2019E 2020E
Sales
UMG 5,147 5,369 5,630 5,950 6,334 5,121 5,285 5,463 5,690 5,964 0.5% 1.6% 3.1% 4.6% 6.2%
Canal + 5,371 5,413 5,541 5,682 5,836 5,371 5,413 5,541 5,682 5,836 0.0% 0.0% 0.0% 0.0% 0.0%
Vivendi Village 349 529 582 640 704 349 529 582 640 704 0.0% 0.0% 0.0% 0.0% 0.0%
Others (22) (20) (20) (20) (20) (22) (20) (20) (20) (20) 0.0% 0.0% 0.0% 0.0% 0.0%
Total 10,844 11,292 11,734 12,253 12,854 10,819 11,208 11,567 11,992 12,484 0.2% 0.8% 1.4% 2.2% 3.0%
EBITA
UMG 643 725 800 881 963 640 713 754 797 847 0.5% 1.6% 6.0% 10.6% 13.7%
Canal + 375 530 668 743 768 375 530 668 743 768 0.0% 0.0% 0.0% 0.0% 0.0%
Vivendi Village + new initiatives (50) (20) ‐ 5 10 (50) (20) ‐ 5 10 0.0% 0.0% 0.0% 0.0% 0.0%
Holding & Corporate (95) (95) (95) (95) (95) (95) (95) (95) (95) (95) 0.0% 0.0% 0.0% 0.0% 0.0%
Total 874 1,140 1,373 1,534 1,646 871 1,129 1,327 1,450 1,530 0.4% 1.0% 3.4% 5.8% 7.6%
% margin 8.1% 10.1% 11.7% 12.5% 12.8% 8.0% 10.1% 11.5% 12.1% 12.3%
Income from Operations
UMG 683 760 835 916 998 685 723 764 807 857 ‐0.3% 5.0% 9.2% 13.5% 16.4%
Canal + 398 533 671 746 771 398 533 671 746 771 0.0% 0.0% 0.0% 0.0% 0.0%
Vivendi Village + new initiatives (50) (20) ‐ 5 10 (50) (20) ‐ 5 10 0.0% 0.0% 0.0% 0.0% 0.0%
Holding & Corporate (95) (95) (95) (95) (95) (95) (95) (95) (95) (95) 0.0% 0.0% 0.0% 0.0% 0.0%
Total 937 1,178 1,411 1,572 1,684 939 1,142 1,340 1,463 1,543 ‐0.2% 3.2% 5.3% 7.5% 9.1%
Associates 128 174 201 201 201 128 174 201 201 201 0.0% 0.0% 0.0% 0.0% 0.0%
Net Interest (42) (30) (35) (35) (35) (42) (30) (35) (35) (35) 0.0% 0.0% 0.0% 0.0% 0.0%
Income from investments 38 38 38 41 44 38 38 38 41 44 0.0% 0.0% 0.0% 0.0% 0.0%
Tax (259) (314) (373) (416) (445) (258) (311) (361) (394) (415) 0.3% 1.0% 3.3% 5.6% 7.3%
Minorities (30) (32) (34) (36) (38) (30) (32) (34) (36) (38) 0.0% 0.0% 0.0% 0.0% 0.0%
Adjusted Net Income (continued) 709 977 1,170 1,290 1,372 707 969 1,136 1,228 1,287 0.3% 0.9% 3.0% 5.1% 6.7%
Adjusted EPS (continued) 0.56 0.77 0.92 1.01 1.08 0.56 0.76 0.89 0.96 1.01 0.3% 0.9% 3.0% 5.1% 6.7%
€mnNew Old % change
2016E 2017E 2018E 2019E 2020E 2016E 2017E 2018E 2019E 2020E 2016E 2017E 2018E 2019E 2020E
Revenue 7,823,182 8,199,058 8,471,616 8,705,913 8,978,869 7,821,132 8,182,528 8,435,524 8,654,208 8,905,035 0.03% 0.20% 0.43% 0.60% 0.83%
EBITDA 758,709 952,082 1,018,089 1,065,030 1,144,981 758,554 950,473 1,018,924 1,061,638 1,139,750 0.02% 0.17% ‐0.08% 0.32% 0.46%
Operating profit 338,114 527,487 591,244 665,435 759,386 337,959 525,878 592,079 662,043 754,155 0.05% 0.31% ‐0.14% 0.51% 0.69%
Net Income 119,087 308,904 344,309 407,551 476,576 119,009 308,100 344,726 405,685 473,698 0.07% 0.26% ‐0.12% 0.46% 0.61%
EPS (¥) 94 245 273 323 378 94 244 273 322 375 0.07% 0.26% ‐0.12% 0.46% 0.61%
BPS (¥) 2,003 2,198 2,421 2,694 3,022 2,003 2,197 2,420 2,692 3,017 0.00% 0.03% 0.02% 0.07% 0.14%
JPY, mnNew Old % change

October 4, 2016 Global: Media
Goldman Sachs Global Investment Research 82
Disclosure Appendix
Reg AC
We, Lisa Yang, Heath P. Terry, CFA, Masaru Sugiyama, Simona Jankowski, CFA, Heather Bellini, CFA, Robert D. Boroujerdi, Piyush Mubayi, Brett
Feldman, Drew Borst, Mark Grant, Otilia Bologan, Stephen Laszczyk, Yusuke Noguchi and Matthew Cabral, hereby certify that all of the views
expressed in this report accurately reflect our personal views about the subject company or companies and its or their securities. We also certify that
no part of our compensation was, is or will be, directly or indirectly, related to the specific recommendations or views expressed in this report.
Unless otherwise stated, the individuals listed on the cover page of this report are analysts in Goldman Sachs' Global Investment Research division.
Investment Profile
The Goldman Sachs Investment Profile provides investment context for a security by comparing key attributes of that security to its peer group and
market. The four key attributes depicted are: growth, returns, multiple and volatility. Growth, returns and multiple are indexed based on composites
of several methodologies to determine the stocks percentile ranking within the region's coverage universe.
The precise calculation of each metric may vary depending on the fiscal year, industry and region but the standard approach is as follows:
Growth is a composite of next year's estimate over current year's estimate, e.g. EPS, EBITDA, Revenue. Return is a year one prospective aggregate
of various return on capital measures, e.g. CROCI, ROACE, and ROE. Multiple is a composite of one-year forward valuation ratios, e.g. P/E, dividend
yield, EV/FCF, EV/EBITDA, EV/DACF, Price/Book. Volatility is measured as trailing twelve-month volatility adjusted for dividends.
Quantum
Quantum is Goldman Sachs' proprietary database providing access to detailed financial statement histories, forecasts and ratios. It can be used for
in-depth analysis of a single company, or to make comparisons between companies in different sectors and markets.
GS SUSTAIN
GS SUSTAIN is a global investment strategy aimed at long-term, long-only performance with a low turnover of ideas. The GS SUSTAIN focus list
includes leaders our analysis shows to be well positioned to deliver long term outperformance through sustained competitive advantage and
superior returns on capital relative to their global industry peers. Leaders are identified based on quantifiable analysis of three aspects of corporate
performance: cash return on cash invested, industry positioning and management quality (the effectiveness of companies' management of the
environmental, social and governance issues facing their industry).
Disclosures
Coverage group(s) of stocks by primary analyst(s)
Lisa Yang: Europe-Media. Heath P. Terry, CFA: America-Internet. Masaru Sugiyama: Japan Internet and Games, Japan-Consumer Electronics, Japan-
Media. Simona Jankowski, CFA: America-Consumer Hardware & Mobility, America-IT Hardware, America-Telecom Equipment. Heather Bellini, CFA:
America-Software. Piyush Mubayi: Asia Pacific Media, Asia Pacific Telecoms. Brett Feldman: America-Telco, Cable & Satellite, America-Towers. Drew
Borst: America-Media and Entertainment. Matthew Cabral: America-IT Hardware.
America-Consumer Hardware & Mobility: Apple Inc., BlackBerry Ltd., BlackBerry Ltd., Corning Inc., Garmin Ltd., GoPro Inc., Qualcomm Inc..
America-IT Hardware: Aerohive Networks Inc., Arista Networks Inc., Brocade Communications Systems, CDW Corp., Cisco Systems Inc., F5 Networks
Inc., Hewlett Packard Enterprise Co., HP Inc., Motorola Solutions Inc., NetApp Inc., Nimble Storage Inc., Pure Storage Inc., Xerox Corp., Zebra
Technologies Corp.
America-Internet: Amazon.com Inc., Bankrate Inc., Criteo SA, eBay Inc., Endurance International Group, Etsy Inc., Expedia Inc., Groupon Inc.,
GrubHub Inc., IAC/InterActiveCorp, LendingClub Corp., LinkedIn Corp., Match Group, Netflix Inc., Pandora Media Inc., PayPal Holdings, Priceline.com
Inc., Shutterfly Inc., TripAdvisor Inc., TrueCar, Twitter Inc., WebMD Health Corp., Yahoo! Inc., Yelp Inc., Zillow Group, Zynga Inc..
America-Media and Entertainment: AMC Entertainment Holdings, AMC Networks Inc., CBS Corp., Cinemark Holdings, Discovery Communications
Inc., IMAX Corp., Interpublic Group of Co., Lamar Advertising Co., Lions Gate Entertainment Corp., Omnicom Group, Outfront Media Inc., Regal
Entertainment Group, Scripps Networks Interactive Inc., Starz, Time Warner Inc., Tribune Media Co., Twenty-First Century Fox Inc., Twenty-First
Century Fox Inc., Viacom Inc., Walt Disney Co..
America-Software: Adobe Systems Inc., Akamai Technologies Inc., Alarm.com Holdings, Alphabet Inc., ANSYS Inc., Atlassian Corp., Autodesk Inc.,
Citrix Systems Inc., Facebook Inc., Microsoft Corp., Mimecast Ltd., MobileIron Inc., Oracle Corp., Rackspace Hosting Inc., Red Hat Inc., RingCentral,
Salesforce.com Inc., Twilio, VMware Inc., Workday Inc..
America-Telco, Cable & Satellite: AT&T Inc., CenturyLink Inc., Charter Communications Inc., Comcast Corp., Communications Sales & Leasing Inc.,
DISH Network Corp., Frontier Communications Corp., Intelsat SA, Level 3 Communications Inc., Sirius XM Holdings, Sprint Corp., T-Mobile US Inc.,
Verizon Communications, Windstream Holdings, Zayo Group.
America-Telecom Equipment: Acacia Communications Inc., ADTRAN Inc., ARRIS International Plc, Ciena Corp., Finisar Corp., Infinera Corp., Juniper
Networks Inc., Lumentum Holdings.
America-Towers: American Tower Corp., Crown Castle International Corp., SBA Communications Corp..
Asia Pacific Media: 58.com Inc., Alibaba Group, Astro Malaysia Holdings, Baidu.com Inc., Ctrip.com International, JD.com Inc., Kakao Corp., Naver
Corp., NCSOFT Corp., NetEase Inc., New Oriental Education & Technology, SINA Corp., TAL Education Group, Tencent Holdings, Vipshop Holdings,
Weibo Corp., Zee Entertainment Enterprises.
Asia Pacific Telecoms: Advanced Info Service PCL, Axiata Group, Bharti Airtel, Bharti Infratel Ltd., Chunghwa Telecom, Digi.com, Dish TV India, Far
EasTone, HKT Trust, Hong Kong Broadband Network Ltd., Idea Cellular, Indosat, Intouch Holdings, KT Corp., KT Corp. (ADR), LG UPlus, M1 Ltd.,
Maxis Bhd, PCCW Ltd., PT Link Net Tbk, PT Sarana Menara Nusantara, PT XL Axiata, Reliance Communications, Singapore Telecommunications, SK
Telecom, SK Telecom (ADR), SmarTone, StarHub, Taiwan Mobile, Telekom Malaysia, Telekomunikasi Indonesia, Total Access Communications,
Tower Bersama Infrastructure Tbk, True Corp.
Europe-Media: Ascential Plc, Atresmedia, Auto Trader Group, Axel Springer AG, Daily Mail and General Trust, Havas, Informa, ITV Plc, JCDecaux,
Lagardere, M6 - Metropole Television, Mediaset, Mediaset Espana, Modern Times Group, Pearson, ProSiebenSat.1, Publicis, RELX NV, RELX Plc,
Rightmove Plc, RTL Group, Schibsted ASA, Scout24 AG, Sky Plc, TF1, UBM Plc, Vivendi, Wolters Kluwer, WPP Plc, Zoopla Property Group.
Japan Internet and Games: Bandai Namco Holdings, Capcom, CyberAgent, DeNA Co., Gree, Kakaku.com, Konami, LINE Corp., mixi, Nexon, Nintendo,
Rakuten, Sega Sammy Holdings, Square Enix Holdings, Yahoo Japan.

October 4, 2016 Global: Media
Goldman Sachs Global Investment Research 83
Japan-Consumer Electronics: Panasonic Corp., Sony.
Japan-Media: Dentsu, Hakuhodo DY Holdings.
Company-specific regulatory disclosures
Compendium report: please see disclosures at http://www.gs.com/research/hedge.html. Disclosures applicable to the companies included in this
compendium can be found in the latest relevant published research
Distribution of ratings/investment banking relationships
Goldman Sachs Investment Research global Equity coverage universe
Rating Distribution Investment Banking Relationships
Buy Hold Sell Buy Hold Sell
Global 31% 54% 15% 66% 60% 50%
As of July 1, 2016, Goldman Sachs Global Investment Research had investment ratings on 2,963 equity securities. Goldman Sachs assigns stocks as
Buys and Sells on various regional Investment Lists; stocks not so assigned are deemed Neutral. Such assignments equate to Buy, Hold and Sell for
the purposes of the above disclosure required by the FINRA Rules. See 'Ratings, Coverage groups and views and related definitions' below. The
Investment Banking Relationships chart reflects the percentage of subject companies within each rating category for whom Goldman Sachs has
provided investment banking services within the previous twelve months.
Price target and rating history chart(s)
Compendium report: please see disclosures at http://www.gs.com/research/hedge.html. Disclosures applicable to the companies included in this
compendium can be found in the latest relevant published research
Regulatory disclosures
Disclosures required by United States laws and regulations
See company-specific regulatory disclosures above for any of the following disclosures required as to companies referred to in this report: manager
or co-manager in a pending transaction; 1% or other ownership; compensation for certain services; types of client relationships; managed/co-
managed public offerings in prior periods; directorships; for equity securities, market making and/or specialist role. Goldman Sachs trades or may
trade as a principal in debt securities (or in related derivatives) of issuers discussed in this report.
The following are additional required disclosures: Ownership and material conflicts of interest: Goldman Sachs policy prohibits its analysts,
professionals reporting to analysts and members of their households from owning securities of any company in the analyst's area of
coverage. Analyst compensation: Analysts are paid in part based on the profitability of Goldman Sachs, which includes investment banking
revenues. Analyst as officer or director: Goldman Sachs policy prohibits its analysts, persons reporting to analysts or members of their
households from serving as an officer, director, advisory board member or employee of any company in the analyst's area of coverage. Non-U.S. Analysts: Non-U.S. analysts may not be associated persons of Goldman, Sachs & Co. and therefore may not be subject to FINRA Rule 2241 or FINRA
Rule 2242 restrictions on communications with subject company, public appearances and trading securities held by the analysts.
Distribution of ratings: See the distribution of ratings disclosure above. Price chart: See the price chart, with changes of ratings and price targets in
prior periods, above, or, if electronic format or if with respect to multiple companies which are the subject of this report, on the Goldman Sachs
website at http://www.gs.com/research/hedge.html.
Additional disclosures required under the laws and regulations of jurisdictions other than the United States
The following disclosures are those required by the jurisdiction indicated, except to the extent already made above pursuant to United States laws
and regulations. Australia: Goldman Sachs Australia Pty Ltd and its affiliates are not authorised deposit-taking institutions (as that term is defined in
the Banking Act 1959 (Cth)) in Australia and do not provide banking services, nor carry on a banking business, in Australia. This research, and any
access to it, is intended only for "wholesale clients" within the meaning of the Australian Corporations Act, unless otherwise agreed by Goldman
Sachs. In producing research reports, members of the Global Investment Research Division of Goldman Sachs Australia may attend site visits and
other meetings hosted by the issuers the subject of its research reports. In some instances the costs of such site visits or meetings may be met in part
or in whole by the issuers concerned if Goldman Sachs Australia considers it is appropriate and reasonable in the specific circumstances relating to
the site visit or meeting. Brazil: Disclosure information in relation to CVM Instruction 483 is available at
http://www.gs.com/worldwide/brazil/area/gir/index.html. Where applicable, the Brazil-registered analyst primarily responsible for the content of this
research report, as defined in Article 16 of CVM Instruction 483, is the first author named at the beginning of this report, unless indicated otherwise at
the end of the text. Canada: Goldman Sachs Canada Inc. is an affiliate of The Goldman Sachs Group Inc. and therefore is included in the company
specific disclosures relating to Goldman Sachs (as defined above). Goldman Sachs Canada Inc. has approved of, and agreed to take responsibility for,
this research report in Canada if and to the extent that Goldman Sachs Canada Inc. disseminates this research report to its clients. Hong Kong: Further information on the securities of covered companies referred to in this research may be obtained on request from Goldman Sachs
(Asia) L.L.C. India: Further information on the subject company or companies referred to in this research may be obtained from Goldman Sachs
(India) Securities Private Limited, Research Analyst - SEBI Registration Number INH000001493, 951-A, Rational House, Appasaheb Marathe Marg,
Prabhadevi, Mumbai 400 025, India, Corporate Identity Number U74140MH2006FTC160634, Phone +91 22 6616 9000, Fax +91 22 6616 9001. Goldman
Sachs may beneficially own 1% or more of the securities (as such term is defined in clause 2 (h) the Indian Securities Contracts (Regulation) Act,
1956) of the subject company or companies referred to in this research report. Japan: See below. Korea: Further information on the subject
company or companies referred to in this research may be obtained from Goldman Sachs (Asia) L.L.C., Seoul Branch. New Zealand: Goldman
Sachs New Zealand Limited and its affiliates are neither "registered banks" nor "deposit takers" (as defined in the Reserve Bank of New Zealand Act
1989) in New Zealand. This research, and any access to it, is intended for "wholesale clients" (as defined in the Financial Advisers Act 2008) unless
otherwise agreed by Goldman Sachs. Russia: Research reports distributed in the Russian Federation are not advertising as defined in the Russian
legislation, but are information and analysis not having product promotion as their main purpose and do not provide appraisal within the meaning of
the Russian legislation on appraisal activity. Singapore: Further information on the covered companies referred to in this research may be obtained
from Goldman Sachs (Singapore) Pte. (Company Number: 198602165W). Taiwan: This material is for reference only and must not be reprinted
without permission. Investors should carefully consider their own investment risk. Investment results are the responsibility of the individual
investor. United Kingdom: Persons who would be categorized as retail clients in the United Kingdom, as such term is defined in the rules of the
Financial Conduct Authority, should read this research in conjunction with prior Goldman Sachs research on the covered companies referred to
herein and should refer to the risk warnings that have been sent to them by Goldman Sachs International. A copy of these risks warnings, and a
glossary of certain financial terms used in this report, are available from Goldman Sachs International on request.
October 4, 2016 Global: Media
Goldman Sachs Global Investment Research 84
European Union: Disclosure information in relation to Article 4 (1) (d) and Article 6 (2) of the European Commission Directive 2003/125/EC is available
at http://www.gs.com/disclosures/europeanpolicy.html which states the European Policy for Managing Conflicts of Interest in Connection with
Investment Research.
Japan: Goldman Sachs Japan Co., Ltd. is a Financial Instrument Dealer registered with the Kanto Financial Bureau under registration number Kinsho
69, and a member of Japan Securities Dealers Association, Financial Futures Association of Japan and Type II Financial Instruments Firms
Association. Sales and purchase of equities are subject to commission pre-determined with clients plus consumption tax. See company-specific
disclosures as to any applicable disclosures required by Japanese stock exchanges, the Japanese Securities Dealers Association or the Japanese
Securities Finance Company.
Ratings, coverage groups and views and related definitions
Buy (B), Neutral (N), Sell (S) -Analysts recommend stocks as Buys or Sells for inclusion on various regional Investment Lists. Being assigned a Buy
or Sell on an Investment List is determined by a stock's return potential relative to its coverage group as described below. Any stock not assigned as
a Buy or a Sell on an Investment List is deemed Neutral. Each regional Investment Review Committee manages various regional Investment Lists to a
global guideline of 25%-35% of stocks as Buy and 10%-15% of stocks as Sell; however, the distribution of Buys and Sells in any particular coverage
group may vary as determined by the regional Investment Review Committee. Regional Conviction Buy and Sell lists represent investment
recommendations focused on either the size of the potential return or the likelihood of the realization of the return.
Return potential represents the price differential between the current share price and the price target expected during the time horizon associated
with the price target. Price targets are required for all covered stocks. The return potential, price target and associated time horizon are stated in each
report adding or reiterating an Investment List membership.
Coverage groups and views: A list of all stocks in each coverage group is available by primary analyst, stock and coverage group at
http://www.gs.com/research/hedge.html. The analyst assigns one of the following coverage views which represents the analyst's investment outlook
on the coverage group relative to the group's historical fundamentals and/or valuation. Attractive (A). The investment outlook over the following 12
months is favorable relative to the coverage group's historical fundamentals and/or valuation. Neutral (N). The investment outlook over the
following 12 months is neutral relative to the coverage group's historical fundamentals and/or valuation. Cautious (C). The investment outlook over
the following 12 months is unfavorable relative to the coverage group's historical fundamentals and/or valuation.
Not Rated (NR). The investment rating and target price have been removed pursuant to Goldman Sachs policy when Goldman Sachs is acting in an
advisory capacity in a merger or strategic transaction involving this company and in certain other circumstances. Rating Suspended (RS). Goldman
Sachs Research has suspended the investment rating and price target for this stock, because there is not a sufficient fundamental basis for
determining, or there are legal, regulatory or policy constraints around publishing, an investment rating or target. The previous investment rating and
price target, if any, are no longer in effect for this stock and should not be relied upon. Coverage Suspended (CS). Goldman Sachs has suspended
coverage of this company. Not Covered (NC). Goldman Sachs does not cover this company. Not Available or Not Applicable (NA). The
information is not available for display or is not applicable. Not Meaningful (NM). The information is not meaningful and is therefore excluded.
Global product; distributing entities
The Global Investment Research Division of Goldman Sachs produces and distributes research products for clients of Goldman Sachs on a global
basis. Analysts based in Goldman Sachs offices around the world produce equity research on industries and companies, and research on
macroeconomics, currencies, commodities and portfolio strategy. This research is disseminated in Australia by Goldman Sachs Australia Pty Ltd
(ABN 21 006 797 897); in Brazil by Goldman Sachs do Brasil Corretora de Títulos e Valores Mobiliários S.A.; in Canada by either Goldman Sachs
Canada Inc. or Goldman, Sachs & Co.; in Hong Kong by Goldman Sachs (Asia) L.L.C.; in India by Goldman Sachs (India) Securities Private Ltd.; in
Japan by Goldman Sachs Japan Co., Ltd.; in the Republic of Korea by Goldman Sachs (Asia) L.L.C., Seoul Branch; in New Zealand by Goldman Sachs
New Zealand Limited; in Russia by OOO Goldman Sachs; in Singapore by Goldman Sachs (Singapore) Pte. (Company Number: 198602165W); and in
the United States of America by Goldman, Sachs & Co. Goldman Sachs International has approved this research in connection with its distribution in
the United Kingdom and European Union.
European Union: Goldman Sachs International authorised by the Prudential Regulation Authority and regulated by the Financial Conduct Authority
and the Prudential Regulation Authority, has approved this research in connection with its distribution in the European Union and United Kingdom;
Goldman Sachs AG and Goldman Sachs International Zweigniederlassung Frankfurt, regulated by the Bundesanstalt für
Finanzdienstleistungsaufsicht, may also distribute research in Germany.
General disclosures
This research is for our clients only. Other than disclosures relating to Goldman Sachs, this research is based on current public information that we
consider reliable, but we do not represent it is accurate or complete, and it should not be relied on as such. The information, opinions, estimates and
forecasts contained herein are as of the date hereof and are subject to change without prior notification. We seek to update our research as
appropriate, but various regulations may prevent us from doing so. Other than certain industry reports published on a periodic basis, the large
majority of reports are published at irregular intervals as appropriate in the analyst's judgment.
Goldman Sachs conducts a global full-service, integrated investment banking, investment management, and brokerage business. We have
investment banking and other business relationships with a substantial percentage of the companies covered by our Global Investment Research
Division. Goldman, Sachs & Co., the United States broker dealer, is a member of SIPC (http://www.sipc.org).
Our salespeople, traders, and other professionals may provide oral or written market commentary or trading strategies to our clients and principal
trading desks that reflect opinions that are contrary to the opinions expressed in this research. Our asset management area, principal trading desks
and investing businesses may make investment decisions that are inconsistent with the recommendations or views expressed in this research.
The analysts named in this report may have from time to time discussed with our clients, including Goldman Sachs salespersons and traders, or may
discuss in this report, trading strategies that reference catalysts or events that may have a near-term impact on the market price of the equity
securities discussed in this report, which impact may be directionally counter to the analyst's published price target expectations for such stocks. Any
such trading strategies are distinct from and do not affect the analyst's fundamental equity rating for such stocks, which rating reflects a stock's
return potential relative to its coverage group as described herein.
We and our affiliates, officers, directors, and employees, excluding equity and credit analysts, will from time to time have long or short positions in,
act as principal in, and buy or sell, the securities or derivatives, if any, referred to in this research.
The views attributed to third party presenters at Goldman Sachs arranged conferences, including individuals from other parts of Goldman Sachs, do
not necessarily reflect those of Global Investment Research and are not an official view of Goldman Sachs.
Any third party referenced herein, including any salespeople, traders and other professionals or members of their household, may have positions in
the products mentioned that are inconsistent with the views expressed by analysts named in this report.
This research is not an offer to sell or the solicitation of an offer to buy any security in any jurisdiction where such an offer or solicitation would be
illegal. It does not constitute a personal recommendation or take into account the particular investment objectives, financial situations, or needs of

October 4, 2016 Global: Media
Goldman Sachs Global Investment Research 85
individual clients. Clients should consider whether any advice or recommendation in this research is suitable for their particular circumstances and, if
appropriate, seek professional advice, including tax advice. The price and value of investments referred to in this research and the income from them
may fluctuate. Past performance is not a guide to future performance, future returns are not guaranteed, and a loss of original capital may occur.
Fluctuations in exchange rates could have adverse effects on the value or price of, or income derived from, certain investments.
Certain transactions, including those involving futures, options, and other derivatives, give rise to substantial risk and are not suitable for all investors.
Investors should review current options disclosure documents which are available from Goldman Sachs sales representatives or at
http://www.theocc.com/about/publications/character-risks.jsp. Transaction costs may be significant in option strategies calling for multiple purchase
and sales of options such as spreads. Supporting documentation will be supplied upon request.
All research reports are disseminated and available to all clients simultaneously through electronic publication to our internal client websites. Not all
research content is redistributed to our clients or available to third-party aggregators, nor is Goldman Sachs responsible for the redistribution of our
research by third party aggregators. For research, models or other data available on a particular security, please contact your sales representative or
go to http://360.gs.com.
Disclosure information is also available at http://www.gs.com/research/hedge.html or from Research Compliance, 200 West Street, New York, NY
10282.
© 2016 Goldman Sachs.
No part of this material may be (i) copied, photocopied or duplicated in any form by any means or (ii) redistributed without the prior written consent of The Goldman Sachs Group, Inc.
Related Documents