FACULTY OF MEDICINE AND HEALTH SCIENCES Department of Movement and Sports Sciences Metabolic syndrome risk and mental health: Relationship with physical activity and physical fitness in Flemish adults by Katrien Wijndaele Supervisor: Prof. Dr. R. Philippaerts Co-supervisor: Prof. Dr. J. Lefevre Thesis submitted in fulfilment of the requirements for the degree of Doctor of Physical Education GENT 2007

Welcome message from author
This document is posted to help you gain knowledge. Please leave a comment to let me know what you think about it! Share it to your friends and learn new things together.
Transcript
FACULTY OF MEDICINE AND
HEALTH SCIENCES
Department of Movement and Sports Sciences
Metabolic syndrome risk and mental health: Relationship with physical activity and physical fitness
in Flemish adults
by Katrien Wijndaele
Supervisor: Prof. Dr. R. Philippaerts
Co-supervisor: Prof. Dr. J. Lefevre
Thesis submitted in fulfilment of
the requirements for the degree
of Doctor of Physical Education
GENT 2007

Supervisor: Prof. Dr. R. Philippaerts (UGent) Co-supervisor: Prof. Dr. J. Lefevre (KULeuven) Supervisory board: Prof. Dr. R. Philippaerts (UGent)
Prof. Dr. J. Lefevre (KULeuven) Prof. Dr. J. Bouckaert (UGent) Prof. Dr. G. De Backer (UGent) Prof. Dr. W. Duquet (VUB) Examination board:
Dr. U. Ekelund (MRC Epidemiology Unit, Cambridge, UK) Prof. Dr. F. Boen (KULeuven) Prof. Dr. S. De Henauw (UGent) Prof. Dr. G. Cardon (UGent)
Prof. Dr. R. Philippaerts (UGent) Prof. Dr. J. Lefevre (KULeuven)
Prof. Dr. J. Bouckaert (UGent) Prof. Dr. G. De Backer (UGent)
Prof. Dr. W. Duquet (VUB) Prof. Dr. I. De Bourdeaudhuij (UGent)
This thesis was part of a broader research project entitled Sport, Physical activity and Health, carried out by the Policy Research Centre, and funded by the Flemish Government. Dit proefschrift kwam tot stand als onderdeel van de opdracht van het Steunpunt Sport, Beweging en Gezondheid, verricht met de steun van de Vlaamse Gemeenschap.
Cover design: Steven Theunis Printed by Plot-it Graphics, Merelbeke. www.plot-it.be © 2007 Ghent University, Faculty of Medicine and Health Sciences, Department of Movement and Sports Sciences, Watersportlaan 2, 9000 Ghent ISBN 9789078836018 All rights reserved. No part of this book may be reproduced, or published, in any form or in any way, by print, photo print, microfilm, or any other means without prior permission from the publisher.

CONTENTS
SAMENVATTING 1
1. GENERAL INTRODUCTION AND OUTLINE OF THE THESIS 3
1. Introduction 5
1.1. Metabolic syndrome 5
1.1.1. Defining the metabolic syndrome 6
1.1.2. Epidemiology of the metabolic syndrome 9
1.1.3. Risks associated with the metabolic syndrome 11
1.1.4. Metabolic syndrome in epidemiological analyses: binary or continuous? 12
1.2. Stress and stress-related health problems 14
1.3. Problem analysis 17
2. Frame of reference 19
2.1. Consensus model of Bouchard and Shephard 19
2.2. Aims of the association studies 22
2.2.1. Physical activity and stress-related mental health problems 23
2.2.2. Physical activity and metabolic syndrome risk 24
2.2.3. Health-related fitness and metabolic syndrome risk 26
2.2.4. Health-related lifestyle, fitness, distress and metabolic syndrome risk 28
3. Outline of the thesis 30
4. Study sample 31
5. References 35
2. ORIGINAL RESEARCH 51
Part 1: Methodological studies on mental health and metabolic syndrome risk 53
Chapter 2.1.1. Reliability, equivalence and respondent preference of 55
computerized versus paper-and-pencil mental health
questionnaires
K Wijndaele, L Matton, N Duvigneaud, J Lefevre, W Duquet,
M Thomis, I De Bourdeaudhuij, RM Philippaerts

Computers in Human Behavior 2007, 23: 1958-1970
Advance Access: http://dx.doi.org/10.1016/j.chb.2006.02.005
Chapter 2.1.2. A continuous metabolic syndrome risk score: utility for 75
epidemiological analyses
K Wijndaele, G Beunen, N Duvigneaud, L Matton, W Duquet,
M Thomis, J Lefevre, RM Philippaerts
Diabetes Care 2006, 29: 2329 (letter to the editor)
Part 2: Association studies on physical activity, physical fitness, stress-related 79
mental health and metabolic syndrome risk
Chapter 2.2.1. Association between leisure time physical activity and stress, 81
social support and coping: a cluster-analytical approach
K Wijndaele, L Matton, N Duvigneaud, J Lefevre,
I De Bourdeaudhuij, W Duquet, M Thomis, RM Philippaerts
Psychology of Sport and Exercise, in press
Chapter 2.2.2. Sedentary behaviour, physical activity and a continuous 105
metabolic syndrome risk score in adults
K Wijndaele, N Duvigneaud, L Matton, W Duquet, M Thomis,
G Beunen, J Lefevre, RM Philippaerts
European Journal of Clinical Nutrition, submitted
Chapter 2.2.3. Muscular strength, aerobic fitness and metabolic syndrome 121
risk in Flemish adults
K Wijndaele, N Duvigneaud, L Matton, W Duquet, M Thomis,
G Beunen, J Lefevre, RM Philippaerts
Medicine & Science in Sports & Exercise 2007, 39: 233-240
Chapter 2.2.4. A path model of health-related lifestyle, physical fitness, 141
distress and metabolic syndrome risk factors in adults
K Wijndaele, M Thomis, L Matton, N Duvigneaud, W Duquet,
G Beunen, J Lefevre, HH Maes, RM Philippaerts
Psychosomatic Medicine, submitted
3. GENERAL DISCUSSION AND CONCLUSIONS 163
1. Main findings 165
1.1. Methodological studies on mental health and metabolic syndrome risk 165
1.2. Association studies on stress-related mental health, metabolic syndrome 167
risk, physical activity and physical fitness
2. Reflection, limitations and recommendations for further research 172
2.1. Bias, confounding and chance 172
2.1.1. Bias 172
2.1.2. Confounding 175
2.1.3. Chance 175
2.2. Reliability and validity of exposure and outcome variables 176
2.2.1. Physical activity and sedentary behaviour 176
2.2.2. Mental health 180
2.2.3. Metabolic syndrome risk 181
2.3. Causality 181
2.4. Other limitations and recommendations for further research 183
3. Practical implications 184
4. References 186
DANKWOORD – ACKNOWLEDGEMENT 191

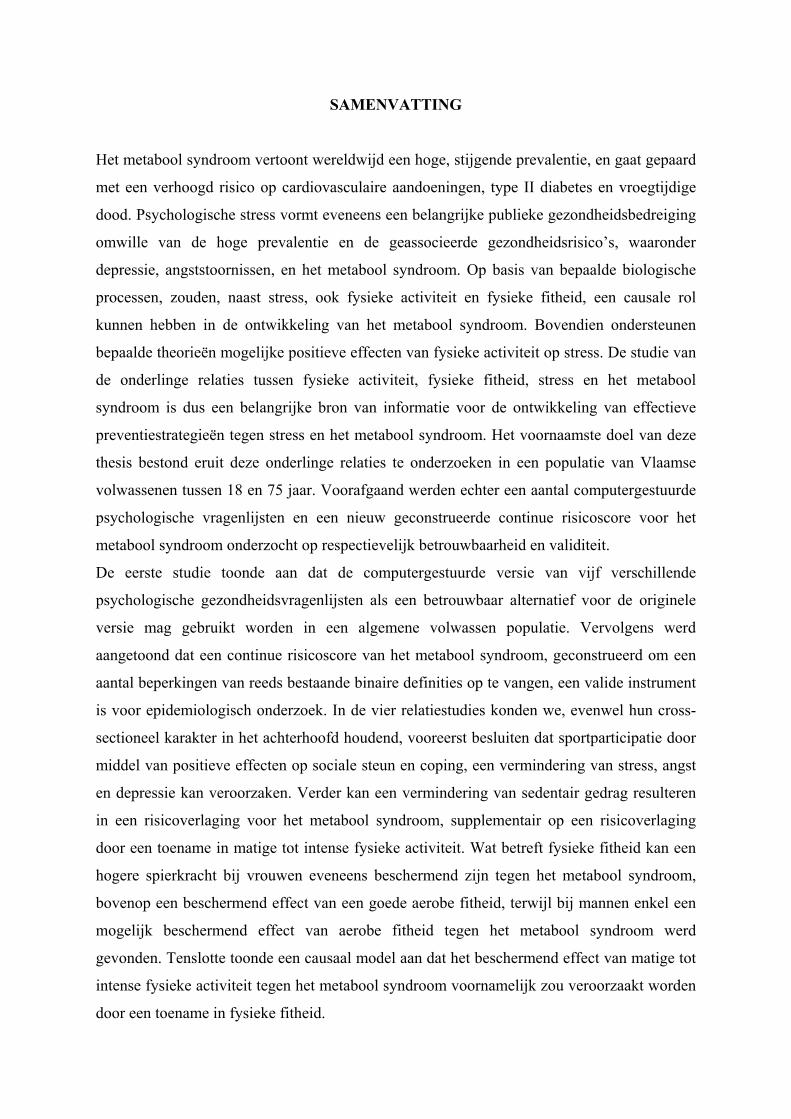
SAMENVATTING
Het metabool syndroom vertoont wereldwijd een hoge, stijgende prevalentie, en gaat gepaard
met een verhoogd risico op cardiovasculaire aandoeningen, type II diabetes en vroegtijdige
dood. Psychologische stress vormt eveneens een belangrijke publieke gezondheidsbedreiging
omwille van de hoge prevalentie en de geassocieerde gezondheidsrisico’s, waaronder
depressie, angststoornissen, en het metabool syndroom. Op basis van bepaalde biologische
processen, zouden, naast stress, ook fysieke activiteit en fysieke fitheid, een causale rol
kunnen hebben in de ontwikkeling van het metabool syndroom. Bovendien ondersteunen
bepaalde theorieën mogelijke positieve effecten van fysieke activiteit op stress. De studie van
de onderlinge relaties tussen fysieke activiteit, fysieke fitheid, stress en het metabool
syndroom is dus een belangrijke bron van informatie voor de ontwikkeling van effectieve
preventiestrategieën tegen stress en het metabool syndroom. Het voornaamste doel van deze
thesis bestond eruit deze onderlinge relaties te onderzoeken in een populatie van Vlaamse
volwassenen tussen 18 en 75 jaar. Voorafgaand werden echter een aantal computergestuurde
psychologische vragenlijsten en een nieuw geconstrueerde continue risicoscore voor het
metabool syndroom onderzocht op respectievelijk betrouwbaarheid en validiteit.
De eerste studie toonde aan dat de computergestuurde versie van vijf verschillende
psychologische gezondheidsvragenlijsten als een betrouwbaar alternatief voor de originele
versie mag gebruikt worden in een algemene volwassen populatie. Vervolgens werd
aangetoond dat een continue risicoscore van het metabool syndroom, geconstrueerd om een
aantal beperkingen van reeds bestaande binaire definities op te vangen, een valide instrument
is voor epidemiologisch onderzoek. In de vier relatiestudies konden we, evenwel hun cross-
sectioneel karakter in het achterhoofd houdend, vooreerst besluiten dat sportparticipatie door
middel van positieve effecten op sociale steun en coping, een vermindering van stress, angst
en depressie kan veroorzaken. Verder kan een vermindering van sedentair gedrag resulteren
in een risicoverlaging voor het metabool syndroom, supplementair op een risicoverlaging
door een toename in matige tot intense fysieke activiteit. Wat betreft fysieke fitheid kan een
hogere spierkracht bij vrouwen eveneens beschermend zijn tegen het metabool syndroom,
bovenop een beschermend effect van een goede aerobe fitheid, terwijl bij mannen enkel een
mogelijk beschermend effect van aerobe fitheid tegen het metabool syndroom werd
gevonden. Tenslotte toonde een causaal model aan dat het beschermend effect van matige tot
intense fysieke activiteit tegen het metabool syndroom voornamelijk zou veroorzaakt worden
door een toename in fysieke fitheid.


1.
GENERAL INTRODUCTION AND
OUTLINE OF THE THESIS

General introduction and outline of the thesis
5
1. Introduction
1.1. Metabolic syndrome
A central health outcome within the scope of this thesis is the metabolic syndrome. The
metabolic syndrome represents a constellation of metabolic abnormalities that co-occur in
individuals more often than might be expected by chance. In a Consensus Statement from the
International Diabetes Federation,2 the general features of the metabolic syndrome were
defined to be 1) abnormal body fat distribution, 2) insulin resistance, 3) atherogenic
dyslipidaemia, 4) elevated blood pressure, 5) proinflammatory state, and 6) prothrombotic
state. When clustering, they are associated with an increased risk for cardiovascular
morbidity36, 101, 104, 116, 122, 128, 155, 179 and mortality,88, 89, 93, 108, 118, 169 type 2 diabetes83, 101, 105, 128,
155, 179 and all-cause mortality.88, 89, 108, 118, 169
The concept of the metabolic syndrome has already been described in the 1920's.27 However,
it was Reaven's Banting Medal award lecture in 1988145 that served as a landmark
publication, and was followed by intensive investigation on the metabolic syndrome,
formerly also described as "syndrome X",145 "insulin resistance syndrome",48 or "the deadly
quartet".99
The pathogenesis of the metabolic syndrome and of its components is complex and remains
unclear. However, two features appear to stand out as potential causative factors: abnormal
fat distribution (central obesity) and insulin resistance. Other important factors also influence
the development of the metabolic syndrome, including genetic profile, physical inactivity,
ageing, a proinflammatory state and hormonal dysregulation. The role of all these causal
factors may vary depending on ethnic group.2 One hypothesis concerning hormonal changes
suggests that elevated levels of serum cortisol, caused by chronic stress, may contribute to the
development of visceral obesity, insulin resistance and dyslipidemia.47, 153
As mentioned above, a first potentially important causative factor is abnormal fat distribution
(central obesity). General obesity contributes to hyperglycemia, hypertension, high serum
triglycerides, low HDL cholesterol and insulin resistance. However, it has been documented
that individuals with a normal BMI may nevertheless be characterized by an excess of
visceral adipose tissue and show the features of the metabolic syndrome. Therefore,
abdominal obesity in particular and more specifically an excess of visceral fat may have a
General introduction and outline of the thesis
6
pathophysiological role. In a recent study, visceral fat has been independently associated with
each of the metabolic syndrome components.30 Although much further research is needed to
elucidate the association between central obesity and the other metabolic syndrome
components, it is hypothesized that adipose tissue (particularly visceral adipose tissue) is a
source of several molecules that induce insulin resistance, including excess nonesterified fatty
acids and tumor necrosis factor-α. Furthermore, excessive adipose tissue is associated with a
decreased production of adiponectin, a molecule that is found to have anti-diabetic, anti-
atherosclerotic and anti-inflammatory functions.2, 80
Insulin resistance is widely believed to be a central feature of the metabolic syndrome,
although the mechanistic link between insulin resistance and most of the metabolic syndrome
components is not fully understood. It is strongly associated with atherogenic dyslipidemia
and a proinflammatory state. However, its associations with hypertension and the
prothrombotic state are less tight and remain unclear. Further research is needed examining
these associations.2, 80
1.1.1. Defining the metabolic syndrome
The concept of the metabolic syndrome has existed for at least 80 years.27 However, before
1998, there had been no initiative to develop an internationally recognized definition. The
first proposal was made by an expert panel of the World Health Organization (WHO) as a
working definition to be improved upon in the future.180 This definition was designed based
on the assumption that insulin resistance may be the common etiological factor for the
individual risk factors of the metabolic syndrome. Therefore, the presence of diabetes
mellitus, impaired fasting glycaemia, impaired glucose tolerance or insulin resistance was a
sine qua non for the diagnosis to be made, together with two or more of the other risk factors
shown in Table 1.
In 1999, the European Group for the Study of Insulin Resistance (EGIR) suggested a
modified version of the WHO definition, which was simpler to use in epidemiological studies
since it did not require an euglycaemic clamp to measure insulin sensitivity.8 EGIR proposed
the use of fasting insulin levels to estimate insulin resistance and impaired fasting glucose as
a substitute for impaired glucose tolerance. Waist circumference only was used as a measure
of central obesity, and microalbuminuria was omitted from the definition. They also preferred
General introduction and outline of the thesis
7
the term "insulin resistance syndrome", and restricted their definition to non-diabetic
individuals. The WHO and EGIR definition however agree in that they both focus on the trait
of insulin resistance/hyperglycemia as an essential component (Table 1).
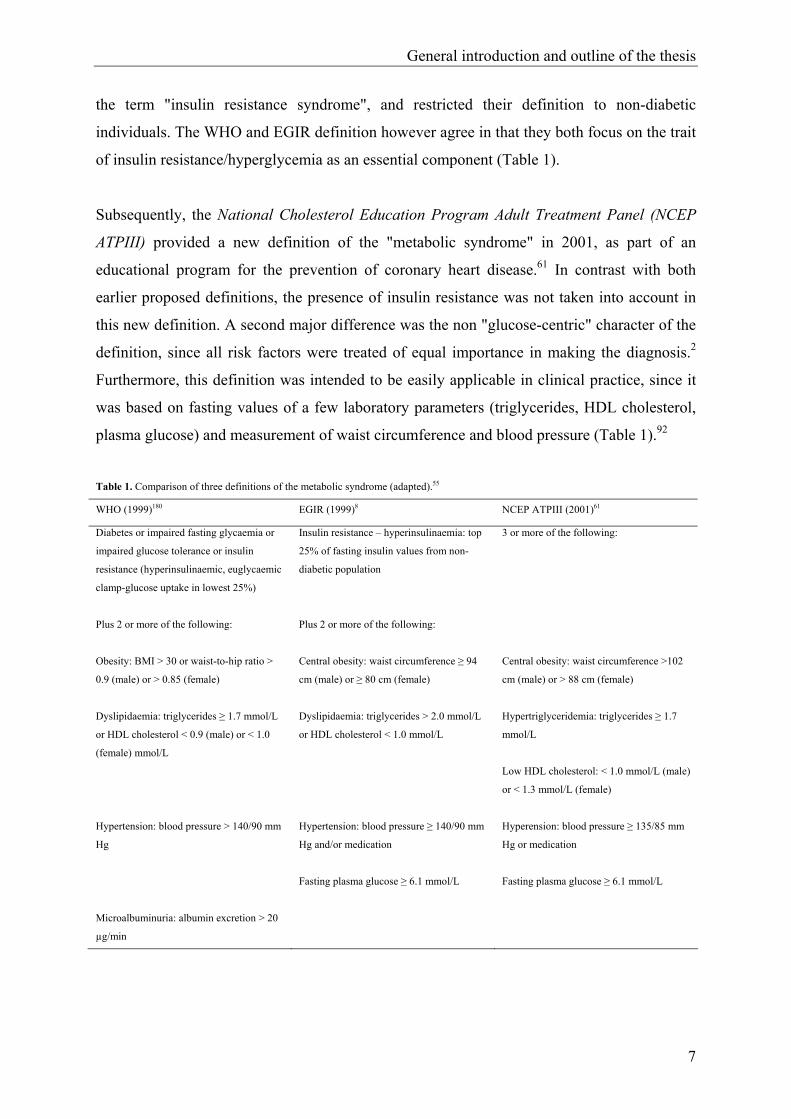
Subsequently, the National Cholesterol Education Program Adult Treatment Panel (NCEP
ATPIII) provided a new definition of the "metabolic syndrome" in 2001, as part of an
educational program for the prevention of coronary heart disease.61 In contrast with both
earlier proposed definitions, the presence of insulin resistance was not taken into account in
this new definition. A second major difference was the non "glucose-centric" character of the
definition, since all risk factors were treated of equal importance in making the diagnosis.2
Furthermore, this definition was intended to be easily applicable in clinical practice, since it
was based on fasting values of a few laboratory parameters (triglycerides, HDL cholesterol,
plasma glucose) and measurement of waist circumference and blood pressure (Table 1).92
Table 1. Comparison of three definitions of the metabolic syndrome (adapted).55 WHO (1999)180 EGIR (1999)8 NCEP ATPIII (2001)61
Diabetes or impaired fasting glycaemia or
impaired glucose tolerance or insulin
resistance (hyperinsulinaemic, euglycaemic
clamp-glucose uptake in lowest 25%)
Plus 2 or more of the following:
Obesity: BMI > 30 or waist-to-hip ratio >
0.9 (male) or > 0.85 (female)
Dyslipidaemia: triglycerides ≥ 1.7 mmol/L
or HDL cholesterol < 0.9 (male) or < 1.0
(female) mmol/L
Hypertension: blood pressure > 140/90 mm
Hg
Microalbuminuria: albumin excretion > 20
µg/min
Insulin resistance – hyperinsulinaemia: top
25% of fasting insulin values from non-
diabetic population
Plus 2 or more of the following:
Central obesity: waist circumference ≥ 94
cm (male) or ≥ 80 cm (female)
Dyslipidaemia: triglycerides > 2.0 mmol/L
or HDL cholesterol < 1.0 mmol/L
Hypertension: blood pressure ≥ 140/90 mm
Hg and/or medication
Fasting plasma glucose ≥ 6.1 mmol/L
3 or more of the following:
Central obesity: waist circumference >102
cm (male) or > 88 cm (female)
Hypertriglyceridemia: triglycerides ≥ 1.7
mmol/L
Low HDL cholesterol: < 1.0 mmol/L (male)
or < 1.3 mmol/L (female)
Hyperension: blood pressure ≥ 135/85 mm
Hg or medication
Fasting plasma glucose ≥ 6.1 mmol/L
General introduction and outline of the thesis
8
In 2002, the American Association of Clinical Endocrinology (AACE) released a position
statement on the "insulin resistance syndrome", deliberately not providing a specific
definition but allowing the diagnosis to rely on clinical judgement.57 This position statement,
together with the EGIR definition, were the least frequently used, although they contributed
to the creation of an ICD-9 code (International Classification of Diseases) for the metabolic
syndrome (code 277.7 Dysmetabolic syndrome X).1
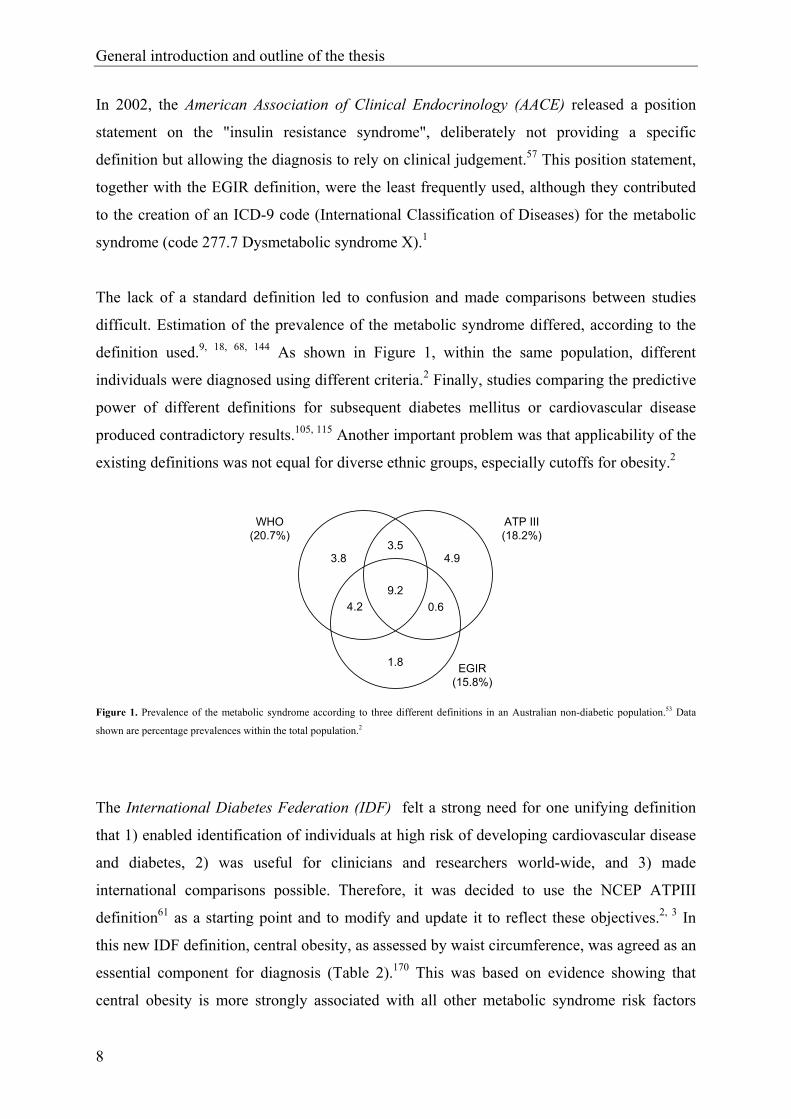
The lack of a standard definition led to confusion and made comparisons between studies
difficult. Estimation of the prevalence of the metabolic syndrome differed, according to the
definition used.9, 18, 68, 144 As shown in Figure 1, within the same population, different
individuals were diagnosed using different criteria.2 Finally, studies comparing the predictive
power of different definitions for subsequent diabetes mellitus or cardiovascular disease
produced contradictory results.105, 115 Another important problem was that applicability of the
existing definitions was not equal for diverse ethnic groups, especially cutoffs for obesity.2
3.83.5
4.9
9.20.64.2
1.8
WHO(20.7%)
ATP III(18.2%)
EGIR(15.8%)
Figure 1. Prevalence of the metabolic syndrome according to three different definitions in an Australian non-diabetic population.53 Data
shown are percentage prevalences within the total population.2
The International Diabetes Federation (IDF) felt a strong need for one unifying definition
that 1) enabled identification of individuals at high risk of developing cardiovascular disease
and diabetes, 2) was useful for clinicians and researchers world-wide, and 3) made
international comparisons possible. Therefore, it was decided to use the NCEP ATPIII
definition61 as a starting point and to modify and update it to reflect these objectives.2, 3 In
this new IDF definition, central obesity, as assessed by waist circumference, was agreed as an
essential component for diagnosis (Table 2).170 This was based on evidence showing that
central obesity is more strongly associated with all other metabolic syndrome risk factors
General introduction and outline of the thesis
9
than any other parameter, and is highly correlated with insulin resistance.30 Although it was
recognized that insulin resistance is an important component of the metabolic syndrome, its
measurement was not seen as essential to this new definition, given the latter findings and the
fact that central obesity is much easier to measure than insulin resistance. The definition was
optimized by providing ethnic-specific cutoffs for waist circumference. Furthermore, a
number of additional parameters (e.g. tomographic assessment of visceral adiposity and liver
fat, inflammatory markers, thrombotic markers) were highlighted by the IDF to be included
in research studies, in order to further optimize the definition in the future.2, 3
Table 2. International Diabetes Federation metabolic syndrome definition (adapted)170
Central obesity: waist circumference ≥ 94 cm for Europid men or ≥ 80 cm for Europid women, with ethnicity specific values for other
groups
Plus 2 or more of the following:
Triglycerides > 1.7 mmol/L, or specific treatment for this lipid abnormality
HDL cholesterol < 1.0 mmol/L (male) or < 1.3 mmol/L (female), or specific treatment for this lipid abnormality
Systolic blood pressure ≥ 130 mm Hg or diastolic blood pressure ≥ 85 mm Hg, or treatment of previously diagnosed hypertension
Fasting plasma glucose ≥ 5.6 mmol/L, or previously diagnosed type 2 diabetes
1.1.2. Epidemiology of the metabolic syndrome
The lack of a standard definition of the metabolic syndrome until 2005 does not facilitate
comparison of prevalence rates between studies. Furthermore, studies from various countries
differ in study design, sample selection, year that they were undertaken, and age and sex
structure of the population. Although the obesity criteria in the NCEP-ATPIII definition61
may not be appropriate for Asian populations3, Figure 2 provides an overview of world-wide
prevalence rates based on this definition.27
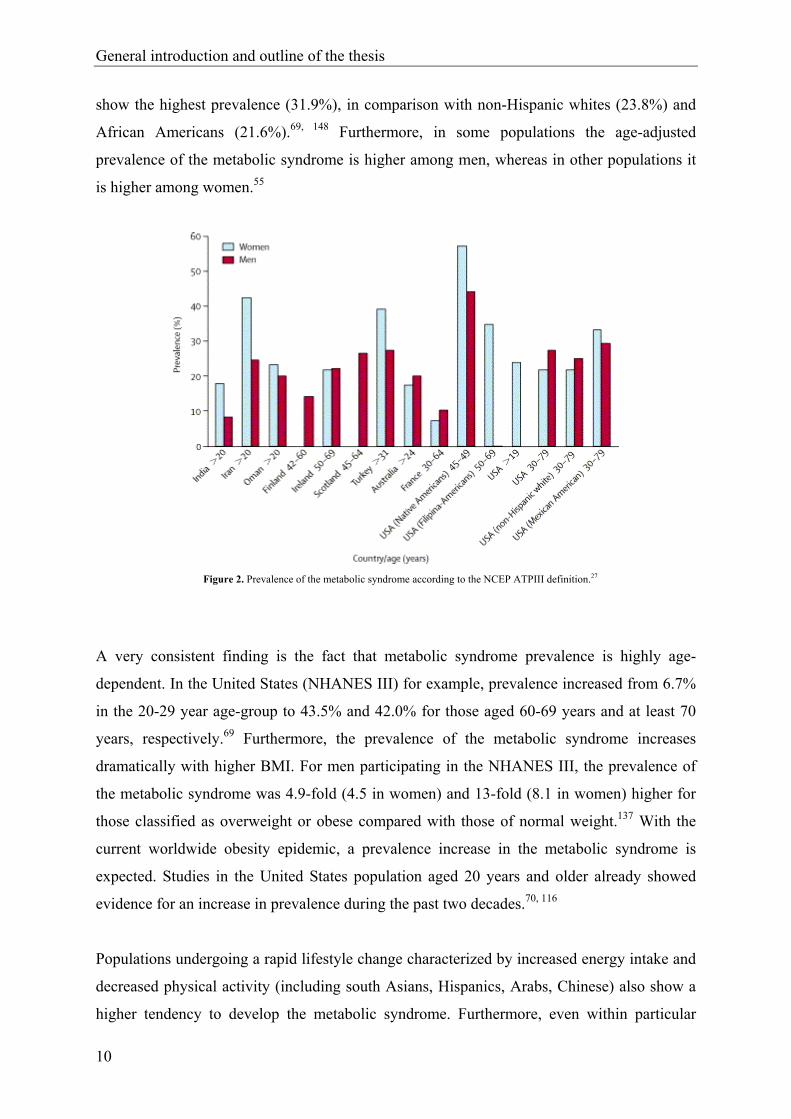
Despite methodological differences between these studies, some interesting trends can be
found.55 First of all, as can be seen in Figure 2, prevalence rates vary widely across
populations. For example, in studies including subjects 20-25 years and older, prevalence
varies from 8% (India) to 24% (USA) in men, and from 7% (France) to 43% (Iran) in
women. Within the same country prevalence rates also differ substantially between
race/ethnic groups. In a large representative sample of the United States population (National
Health and Nutrition Examination Survey (NHANES III)) for example, Mexican Americans
General introduction and outline of the thesis
10
show the highest prevalence (31.9%), in comparison with non-Hispanic whites (23.8%) and
African Americans (21.6%).69, 148 Furthermore, in some populations the age-adjusted
prevalence of the metabolic syndrome is higher among men, whereas in other populations it
is higher among women.55
Figure 2. Prevalence of the metabolic syndrome according to the NCEP ATPIII definition.27
A very consistent finding is the fact that metabolic syndrome prevalence is highly age-
dependent. In the United States (NHANES III) for example, prevalence increased from 6.7%
in the 20-29 year age-group to 43.5% and 42.0% for those aged 60-69 years and at least 70
years, respectively.69 Furthermore, the prevalence of the metabolic syndrome increases
dramatically with higher BMI. For men participating in the NHANES III, the prevalence of
the metabolic syndrome was 4.9-fold (4.5 in women) and 13-fold (8.1 in women) higher for
those classified as overweight or obese compared with those of normal weight.137 With the
current worldwide obesity epidemic, a prevalence increase in the metabolic syndrome is
expected. Studies in the United States population aged 20 years and older already showed
evidence for an increase in prevalence during the past two decades.70, 116
Populations undergoing a rapid lifestyle change characterized by increased energy intake and
decreased physical activity (including south Asians, Hispanics, Arabs, Chinese) also show a
higher tendency to develop the metabolic syndrome. Furthermore, even within particular
General introduction and outline of the thesis
11
ethnic groups, prevalence of the metabolic syndrome appears to be higher in urban regions.
Therefore, with increasing urbanization in developing countries like India, the prevalence of
the metabolic syndrome is expected to increase several-fold in the coming years.142
1.1.3. Risks associated with the metabolic syndrome
An increasing number of longitudinal studies provide evidence for certain health risks
associated with the metabolic syndrome. The metabolic syndrome is predictive for the
development of cardiovascular morbidity36, 101, 104, 116, 122, 128, 155, 179 and mortality,88, 89, 93, 108,
118, 169 type 2 diabetes83, 101, 105, 128, 155, 179 and all-cause mortality.88, 89, 108, 118, 169 Since the
definitions of the metabolic syndrome comprise established cardiovascular disease risk
factors and impaired fasting glucose/impaired glucose tolerance, this might not be
unexpected. Although evidence is still poor, presence of the metabolic syndrome might also
be associated with a higher risk for other co-morbidities, including chronic kidney disease37,
46 and prostate cancer.111
In the Diabetes Epidemiology: Collaborative Analysis of Diagnostic Criteria in Europe
(DECODE) study88 for example, 6156 men and 5356 women from 11 prospective European
cohort studies, aged 30 through 89 years and all non-diabetic at baseline, participated with a
mean duration of follow-up of 8.8 years. In individuals with the metabolic syndrome
(modified WHO definition) compared with individuals without it, the overall hazard ratios
for all-cause and cardiovascular mortality were 1.4 and 2.3 (P < 0.05) respectively in men
and 1.4 and 2.8 (P < 0.05) respectively in women, after adjustment for age, blood cholesterol
levels, and smoking. In a population of 958 middle-aged Finnish men, participating in a four-
year follow-up study, Laaksonen et al.105 found odds ratios ranging between 5.0 and 8.8 (P <
0.05) depending on the definition used, for the development of type II diabetes in subjects
with the metabolic syndrome at baseline versus those without, after adjustment for age.
Moreover, a number of studies provided evidence for an increased risk of incident
cardiovascular disease and type 2 diabetes, as a function of the number of metabolic
syndrome risk factors present at baseline.101, 118, 122, 128, 155
Depending on the choice of metabolic syndrome definition, population studied and exclusion
criteria used, length of follow-up and variables adjusted for, different risk estimates are found

General introduction and outline of the thesis
12
between studies (e.g. for cardiovascular disease, increased risk ranges from 30 to 400%).
Ford67 made a critical review and meta-analysis of studies using the exact or modified
versions of the NCEP ATPIII61 or WHO definition,180 to determine summary risk estimates
for all-cause mortality, cardiovascular disease, and type II diabetes. He concluded that these
definitions were modestly associated with incident all-cause mortality and cardiovascular
disease, and more strongly with diabetes incidence. The binary character of the definitions
was suggested as a possible explanation for the rather low estimates of relative risk.
Individuals not diagnosed as having the metabolic syndrome, but being obese or having
hypertension, dyslipidemia or hyperglycemia, are included in the reference group, and
potentially raise the incidence rate in the reference group, thereby lowering the relative risk
estimates. This might also partially explain why multivariate score systems based on
continuous variables (e.g. Framingham risk model) outperform the metabolic syndrome in
predicting cardiovascular disease, diabetes or mortality.97
1.1.4. Metabolic syndrome in epidemiological analyses: binary or continuous?
Although for clinical settings, a binary definition of the metabolic syndrome enabling a yes or
no diagnosis is useful, increasing evidence and arguments exist for a more gradual or even
continuous approach of the metabolic syndrome in epidemiological analyses.97 From a pure
methodological point of view, it is clear that dichotomizing a continuous outcome variable
reduces the statistical power of the analysis to detect associations with this outcome
variable.143 So when there is no real need to dichotomize a continuous outcome variable, this
should be avoided. In the currently used definitions of the metabolic syndrome,8, 61, 170, 180 a
dichotomization has been made on two different levels: 1) every individual risk factor is
dichotomized using thresholds (e.g. systolic blood pressure ≥ 130 mmHg); and 2) the
diagnosis of the metabolic syndrome is made in case a certain number of risk factor is present
(e.g. in case of ≥ 3 risk factors, with or without a certain risk factor as a sine qua non). For
epidemiological analyses, the necessity of both forms of dichotomization can be countered.
First of all, cardiovascular disease risk increases progressively with higher levels of several
metabolic syndrome risk factors,168 or as stated by Kahn97: “Risk is a progressive function of,
for example, hyperglycemia and hypertension and cannot simply be regarded as present or
absent, depending on whether thresholds are exceeded or not.”. Second, cardiovascular and
General introduction and outline of the thesis
13
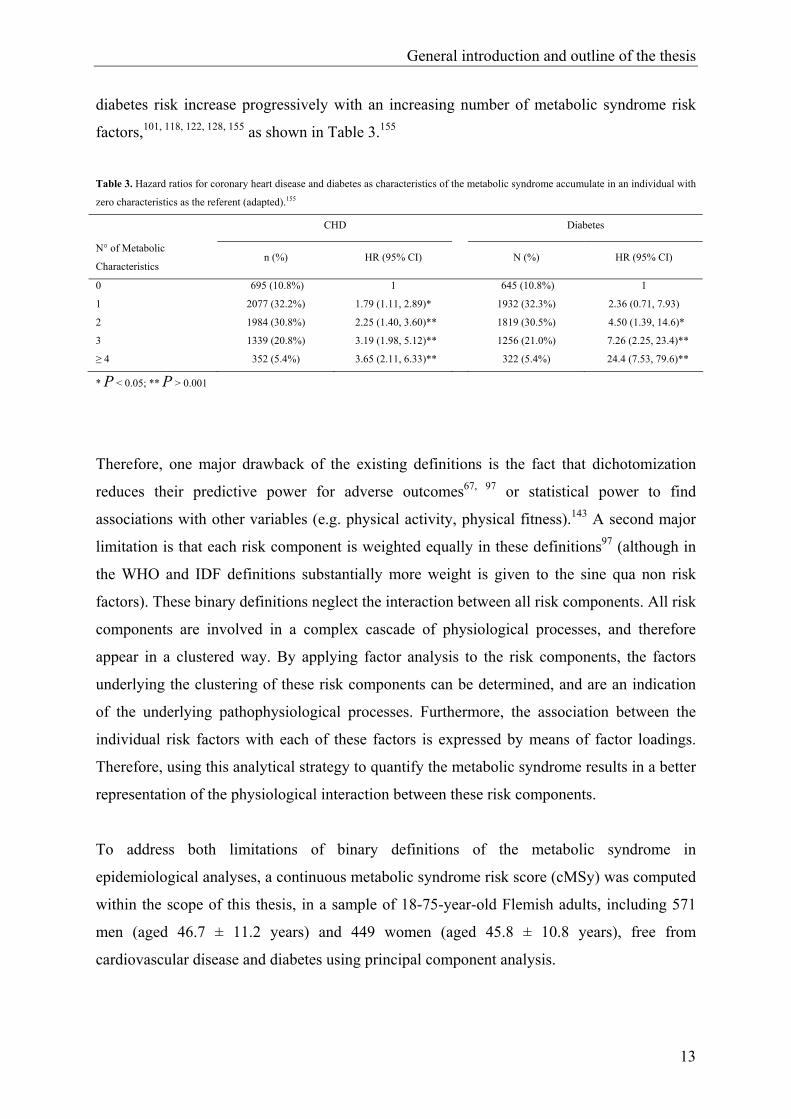
diabetes risk increase progressively with an increasing number of metabolic syndrome risk
factors,101, 118, 122, 128, 155 as shown in Table 3.155
Table 3. Hazard ratios for coronary heart disease and diabetes as characteristics of the metabolic syndrome accumulate in an individual with
zero characteristics as the referent (adapted).155
CHD Diabetes
N° of Metabolic
Characteristics n (%) HR (95% CI) N (%) HR (95% CI)
0 695 (10.8%) 1 645 (10.8%) 1
1 2077 (32.2%) 1.79 (1.11, 2.89)* 1932 (32.3%) 2.36 (0.71, 7.93)
2 1984 (30.8%) 2.25 (1.40, 3.60)** 1819 (30.5%) 4.50 (1.39, 14.6)*
3 1339 (20.8%) 3.19 (1.98, 5.12)** 1256 (21.0%) 7.26 (2.25, 23.4)**
≥ 4 352 (5.4%) 3.65 (2.11, 6.33)** 322 (5.4%) 24.4 (7.53, 79.6)**
* P < 0.05; ** P > 0.001
Therefore, one major drawback of the existing definitions is the fact that dichotomization
reduces their predictive power for adverse outcomes67, 97 or statistical power to find
associations with other variables (e.g. physical activity, physical fitness).143 A second major
limitation is that each risk component is weighted equally in these definitions97 (although in
the WHO and IDF definitions substantially more weight is given to the sine qua non risk
factors). These binary definitions neglect the interaction between all risk components. All risk
components are involved in a complex cascade of physiological processes, and therefore
appear in a clustered way. By applying factor analysis to the risk components, the factors
underlying the clustering of these risk components can be determined, and are an indication
of the underlying pathophysiological processes. Furthermore, the association between the
individual risk factors with each of these factors is expressed by means of factor loadings.
Therefore, using this analytical strategy to quantify the metabolic syndrome results in a better
representation of the physiological interaction between these risk components.
To address both limitations of binary definitions of the metabolic syndrome in
epidemiological analyses, a continuous metabolic syndrome risk score (cMSy) was computed
within the scope of this thesis, in a sample of 18-75-year-old Flemish adults, including 571
men (aged 46.7 ± 11.2 years) and 449 women (aged 45.8 ± 10.8 years), free from
cardiovascular disease and diabetes using principal component analysis.
General introduction and outline of the thesis
14
As this score is a continuous indicator for metabolic syndrome risk, the term “metabolic
syndrome risk” will be used in studies including this risk score in analyses, instead of the
term “metabolic syndrome”, which is generally used in case this syndrome is diagnosed by
means of an internationally recognized binary definition.8, 61, 170, 180
1.2. Stress and stress-related health problems
A secondary health outcome discussed in this thesis includes stress and (mental) health
problems related to stress. Stress has been defined by Lazarus and Folkman112 as “the
perception that events or circumstances have challenged or exceeded one’s ability to cope”.
Coping is defined as “the person’s constantly changing cognitive and behavioral efforts to
manage specific external and/or internal demands that are appraised as taxing or exceeding
the person’s resources”.112 According to Lazarus and Folkman,112 perceiving stress is the
result of two processes. When an individual is confronted with a certain stimulus or situation,
a primary appraisal (first process) occurs, in which this stimulus is defined as
irrelevant/benign or as a potentially stressful stimulus. In case of a potentially stressful
stimulus, a secondary appraisal (second process) occurs in which the individual evaluates his
coping resources. If the individual perceives his coping resources as adequate, no stress
response occurs. However, if the individual perceives that he won’t be able to cope with the
potentially stressful stimulus, he will experience stress. The stress-buffering theory introduces
the role of social support in the perception of stress. Social support is defined as “a
multidimensional construct that refers to the psychological and material resources available
to individuals through their interpersonal relationships”.151 An individual’s perception that
social support is available may contribute to a less negative primary and secondary
appraisal.107 To explain this theory, the example can be used of an overweight middle-aged
woman, who’s physician strongly recommends to start doing some exercise. A threatening
primary appraisal for this women might be: “My health is in serious danger if I don’t loose
some pounds.”. A negative secondary appraisal might be: “I’m not the sporty type, I will
never be able to start or maintain this exercise schedule.”. However, if she perceived that she
was surrounded by a group of loving, helpful and committed people, the primary appraisal
might be modified to: “No matter how obese or ill I will be, I will always receive the love and
commitment of my caring family.”. The secondary appraisal might be changed to: “I have
several friends who will want to accompany me to the gym every week. Then my chances to
General introduction and outline of the thesis
15
maintain the program will be higher.”. According to the theory of Lazarus and Folkman,112
these revised appraisals should lead to less perceived stress. The above mentioned theories
show strong interrelationships between perceived stress, coping and social support,
suggesting that inclusion of coping and social support in studies on perceived stress might
provide more profound insights in the associations between perceived stress and other
variables (e.g. physical activity). To indicate that stress is not always associated with negative
consequences, Selye160 introduced the terms eustress versus distress. Eustress (“good stress”),
refers to stressful situations perceived as challenges which are met successfully and therefore
are a source of self-esteem, pride, and greater ability to cope with future stressors.
Conversely, distress (“bad stress”) is stress leading to organismic breakdown and is most
often just referred to as “stress”.
Prevalence rates of perceived stress are high. In a United States National Health Interview
Survey for example, about half of the adult population admitted feeling under at least
moderate stress during the previous two weeks.163 Moreover, stress often results in different
negative health outcomes. Physical diseases which may be caused by stress include
cardiovascular disease, cancer, infectious diseases and auto-immune diseases.41 Furthermore,
stress is the most common underlying condition leading to depression and anxiety,98 two
important public health concerns, because of their high prevalence and detrimental impact on
the quality of life.132, 133 The WHO Collaborative Study of Psychological Problems in
General Health Care screened nearly 26,000 subjects, who attended primary care facilities in
14 countries and reported that 10.4% of patients had current depression or stress-related
anxiety. In Europe, the Depression Research in European Society (DEPRES) survey,
involving 78,463 adults, showed a 6-month prevalence rate of 17% for depression. The WHO
Global Burden of Disease survey estimates that by the year 2020, depression and anxiety
disorders, including stress-related mental health conditions will be highly prevalent and will
be second only to ischemic heart disease in the scope of disabilities experienced by
sufferers.98
The human body can survive by several complex mechanisms aiming to maintain a constant
equilibrium, or homeostatis, which is continuously threatened by several stressors. Allostasis
is a controlled deviation from homeostasis, and refers to the ability to achieve stability
through change. Through allostasis, the body is protected for internal and external stressors
by controlled responses of the autonomic nervous system, the hypothalamo-pituitary adrenal
General introduction and outline of the thesis
16
axis, and the cardiovascular, metabolic and immune systems.121, 159 Acute stress is the
reaction to acute, stressful stimuli such as major life events or fight or flight stimuli. Chronic
stress is the cumulative load of minor, day-to-day stresses,121 or the long-term repeated
disruption of a homeostatic system.153 Chronic stress may result in allostatic load, which is
the wear and tear resulting from chronic overactivity of allostatic systems. Furthermore, it is
speculated that long term allostatic load may cause the allostatic system to become exhausted,
resulting in underactivity.121, 159 Both overactivity and underactivity of the allostatic system
may lead to a diverse spectrum of disorders, such as severe chronic disease, anorexia nervosa,
(melancholic) depression, alcoholism, malnutrition, hyper- or hypothyroidism, Cushing’s
syndrome, chronic fatigue syndrome and others.38, 81
Recently, hypotheses have been made linking stress to the development of the metabolic
syndrome.14-16, 153, 159 An acute stress stimulus evokes a set of stereotype neuroendocrine
responses, including activation of the hypothalamo-pituitary adrenal axis and of the
sympathetic nervous system, resulting in secretion of cortisol and catecholamines,
respectively. The combined effects of these neuroendocrine alterations allow a fight or flight
response (including a mobilization of lipids from the adipose tissue and glucose from hepatic
glycogen, together with an acute state of insulin resistance, vasoconstriction in the splanchic
area and vasodilation in skeletal muscle), an essential reaction in ancient times to escape from
predators. Although this threat has now disappeared, these responses remain an important
defence against acute trauma or severe infection. However, in case of repeated mental stress
or chronic stress, chronic increases in cortisol and catecholamines may appear, which lead to
a number of adverse health effects. These include insulin resistance, dyslipidemia, visceral
obesity and hypertension. It is not possible to describe all possible physiological pathways
explaining the effects of chronic increases in catecholamines and cortisol on these adverse
health outcomes, because they affect many complex physiological processes and some
processes still need more conclusive evidence. However, those leading to insulin resistance
and visceral obesity, two central features of the metabolic syndrome will be mentioned here
in a simplified way. Excess cortisol may cause a state of insulin resistance through different
processes. Cortisol inhibits insulin secretion from pancreatic ß-cells, it may induce insulin
resistance in adipocytes, it may increase hepatic glucose metabolism and inhibit glycogen
synthase in skeletal muscle. These processes may lead to hyperglycemia, which is initially
tackled by an increased insulin response. Eventually however, ß-cell response becomes
insufficient, and the unopposed effects of cortisol further increase metabolic disturbances.
General introduction and outline of the thesis
17
Excess cortisol may also cause visceral obesity. Excess cortisol promotes the activity of
lipoprotein lipase, resulting in higher levels of free fatty acids and accumulation of
triglycerides in adipocytes. Moreover, glucocorticoid receptors are much more dense in
visceral adipose tissue as compared to other regions, resulting in predominantly visceral
obesity.153 Furthermore, acute and chronic stress have also been demonstrated to stimulate the
production of pro-infammatory cytokines, probably through activation of the sympathetic
nervous system. Eventually, all these factors may result in the development of the metabolic
syndrome.153, 159
A number of studies found evidence for associations between stress and the metabolic
syndrome, using a cross-sectional or prospective design.35, 79, 149, 174 In a large prospective
cohort study (Whitehall II) for example, Chandola et al.35 investigated the association
between chronic stress at work and the metabolic syndrome (NCEP ATPIII definition),
involving 10,308 men and women, aged 35-55, with a mean duration of follow-up of 14
years. They found a dose-response relation between exposure to work stressors over 14 years
(1 exposure, 2 exposures, ≥ 3 exposures) and risk of the metabolic syndrome, independent of
other relevant risk factors (P for linear trend < 0.01). Adjusting for age and employment
grade, employees with chronic work stress (≥ 3 exposures) were more than twice as likely to
develop the metabolic syndrome (odds ratio: 2.25, P < 0.05).
A large intervariability exists in stress hormone response, so that not all individuals
perceiving (the same level of) stress develop these metabolic abnormalities (to the same
extent). Gender appears to be an important moderator variable. The stimulation of
glucocorticoïds and the adrenergic system seems to be less in women than men, maybe
because of a suppressive effect of oestrogen. Moreover, heredity, personality, and ability to
cope are also important moderating factors.153, 159
1.3. Problem analysis
Based on the prevalence rates and associated risks for comorbidities described above, it is
clear that both the metabolic syndrome and stress are large-scale public health problems. The
metabolic syndrome already shows a high prevalence world-wide. In 2000, an estimated 55
million adults in the United States had the metabolic syndrome.70 The rising epidemic of
General introduction and outline of the thesis
18
obesity will fuel a rapid increase in prevalence rates of the metabolic syndrome in the future.
For the US population, that is ageing and in which more than one half of adults are
overweight or obese, it has been estimated that the metabolic syndrome soon will overtake
cigarette smoking as the primary risk factor for cardiovascular disease.56 Because of the
associated increased risk for type 2 diabetes, cardiovascular disease (and possibly other co-
morbidities such as kidney disease), it is expected that the metabolic syndrome will have a
large burden on world economies, without effective interventions.148
Estimates for the economic impact of stress have already been made. For the case of the
United States, stress-related disorders cost the nation more than $42 billion per year.
Furthermore, $150 billion of revenue is lost to stress annually in lost productivity,
absenteeism, poor decision-making, stress-related mental illness, and substance abuse. In the
United Kingdom, costs related to stress for the British industry are estimated to be 3 billion
pounds per year.98
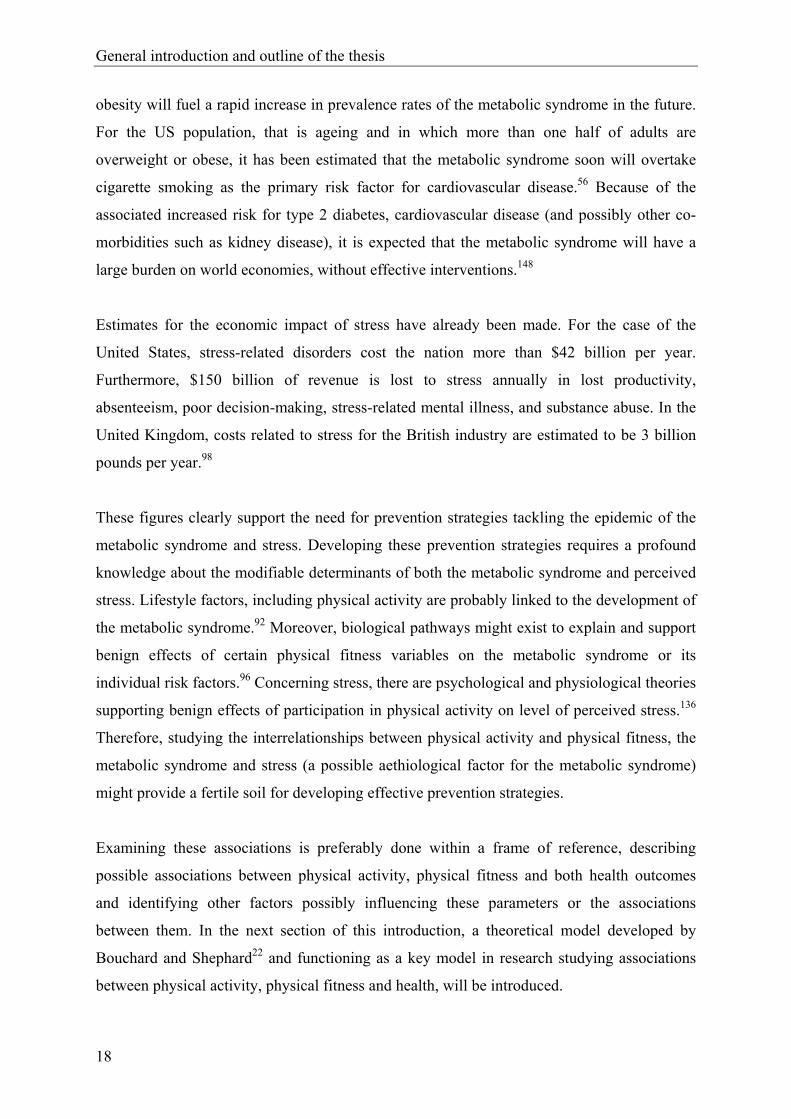
These figures clearly support the need for prevention strategies tackling the epidemic of the
metabolic syndrome and stress. Developing these prevention strategies requires a profound
knowledge about the modifiable determinants of both the metabolic syndrome and perceived
stress. Lifestyle factors, including physical activity are probably linked to the development of
the metabolic syndrome.92 Moreover, biological pathways might exist to explain and support
benign effects of certain physical fitness variables on the metabolic syndrome or its
individual risk factors.96 Concerning stress, there are psychological and physiological theories
supporting benign effects of participation in physical activity on level of perceived stress.136
Therefore, studying the interrelationships between physical activity and physical fitness, the
metabolic syndrome and stress (a possible aethiological factor for the metabolic syndrome)
might provide a fertile soil for developing effective prevention strategies.
Examining these associations is preferably done within a frame of reference, describing
possible associations between physical activity, physical fitness and both health outcomes
and identifying other factors possibly influencing these parameters or the associations
between them. In the next section of this introduction, a theoretical model developed by
Bouchard and Shephard22 and functioning as a key model in research studying associations
between physical activity, physical fitness and health, will be introduced.
General introduction and outline of the thesis
19
2. Frame of reference
2.1. Consensus model of Bouchard and Shephard
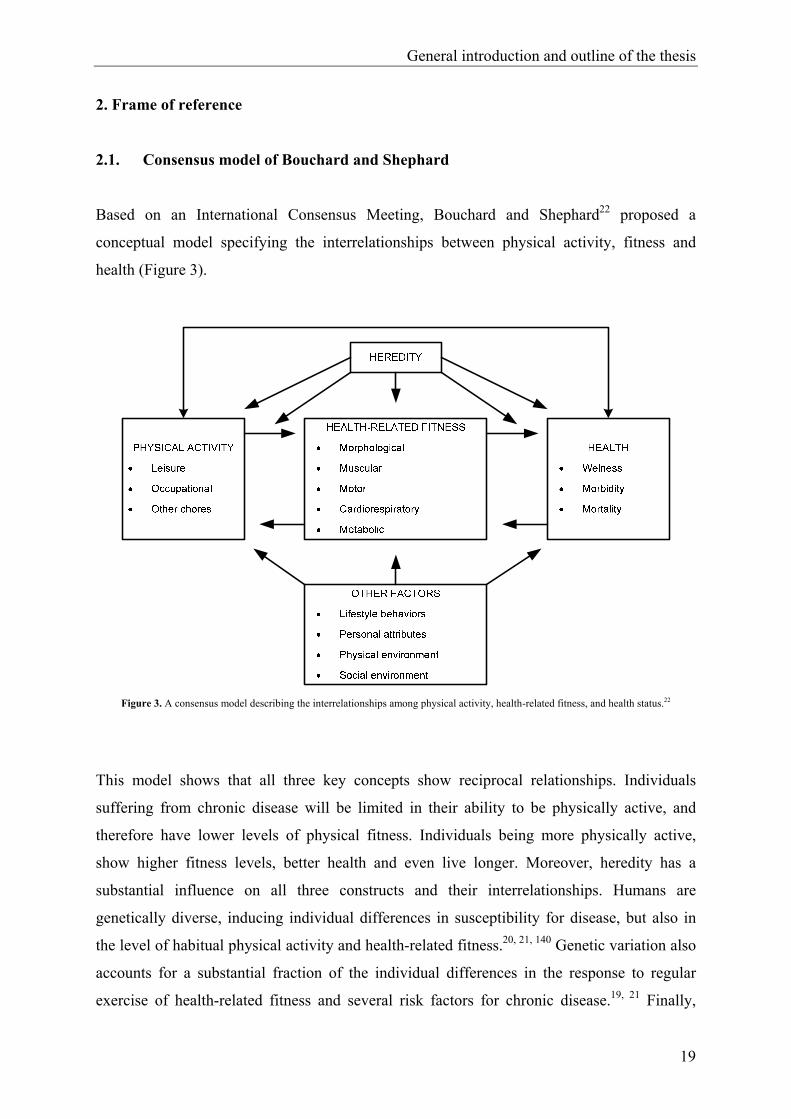
Based on an International Consensus Meeting, Bouchard and Shephard22 proposed a
conceptual model specifying the interrelationships between physical activity, fitness and
health (Figure 3).
Figure 3. A consensus model describing the interrelationships among physical activity, health-related fitness, and health status.22
This model shows that all three key concepts show reciprocal relationships. Individuals
suffering from chronic disease will be limited in their ability to be physically active, and
therefore have lower levels of physical fitness. Individuals being more physically active,
show higher fitness levels, better health and even live longer. Moreover, heredity has a
substantial influence on all three constructs and their interrelationships. Humans are
genetically diverse, inducing individual differences in susceptibility for disease, but also in
the level of habitual physical activity and health-related fitness.20, 21, 140 Genetic variation also
accounts for a substantial fraction of the individual differences in the response to regular
exercise of health-related fitness and several risk factors for chronic disease.19, 21 Finally,

General introduction and outline of the thesis
20
other lifestyle behaviours (e.g. smoking habits, alcohol and dietary intake), environmental
factors including social environment (e.g. social network) and physical environment (e.g.
temperature, air quality) and personal attributes (e.g. age, gender, socio-economic status,
personality characteristics) influence physical activity, fitness and health. A thorough
understanding of this model requires a short introduction of its three main constructs.
Physical activity comprises "any body movement produced by the skeletal muscles that
results in a substantial increase over the resting energy expenditure".33 It is subdivided in
categories such as leisure time physical activity, including "exercise", which is "a form of
physical activity that is planned, structured, repetitive, and purposive in the sense that
improvement or maintenance of one or more components of physical fitness is an objective".
Other categories include physical activity during occupation and physical activity during
household and other chores.22 During the past several years, the concept of health-related
physical activity or health-enhancing physical activity (HEPA) has received a lot of attention.
A large body of evidence has been found for health benefits of regular physical activity.171
However, how much physical activity is needed has been the object of discussion during the
past decades. The first physical activity recommendations mainly focused on the
improvement and maintenance of physical fitness.5 They were demanding, promoting high
intensity physical activity, and were rather discouraging for sedentary people to become more
active. Moreover, accumulating evidence was found for significant health benefits resulting
from regular physical activity of moderate intensity. Therefore, in 1995, the Centers for
Disease Control and Prevention and the American College of Sports Medicine (CDC/ACSM)
recommended to accumulate 30 minutes or more of moderate-intensity physical activity on
most, preferably all, days of the week.139 This position statement was followed by similar
position statements of other American and European scientific associations.59, 131, 171, 175
Generally, they all agree on the fact that moderate intensity physical activity provides
sufficient health benefits. Furthermore, physical activity should be incorporated in daily
living, and can be accumulated during the day. Additional health benefits can be achieved
through greater amounts of physical activity. People who can maintain a regular regime of
activity that is of long duration or of vigorous intensity are likely to derive greater benefits.
The different types of physical activity assessment methods reflect the complex character of
the concept. As physical activity is defined as bodily movement resulting in energy
expenditure, in principle “direct calorimetry” (measuring energy expenditure by measuring
heat production or heat loss) is the gold standard for physical activity assessment. However,

General introduction and outline of the thesis
21
this technique is not feasible in most research settings due to practical reasons (financial
costs, invasiveness, limitation to laboratory situations). Other highly reliable and valid
techniques include indirect calorimetry, the doubly labelled water method, and direct
observation. These techniques are also used as criterion measurements for validation of other
objective and subjective physical activity assessment methods. Objective techniques include
activity monitors (pedometers and motion sensors) and heart rate monitoring. Questionnaires
and activity diaries are considered subjective methods.126, 173
Physical fitness also is a multi-dimensional concept and has been defined in several ways.
One of the most frequently cited definitions describes physical fitness as “the ability to carry
out daily tasks with vigor and alertness, without undue fatigue and with ample energy to
engage in leisure time pursuits and to meet the above average physical stress encountered in
emergency situations”.40 Since the beginning of the 1980’s, the concept is operationalized
with a focus on two goals: performance and health. Performance-related fitness refers to
those fitness components that are necessary for optimal work or sport performance. Health-
related fitness, the concept of interest for the present discussion, has been defined as “a state
characterized by (a) an ability to perform daily activities with vigor and (b) a demonstration
of traits and capacities that are associated with a low risk of premature development of
hypokinetic diseases and conditions”.22, 138 It refers to those components that are affected
favorably or unfavorably by habitual physical activity and relate to health status. These
include five components: (1) morphological (body mass for height, body composition,
subcutaneous fat distribution, abdominal visceral fat, bone density, flexibility); (2) muscular
(power, strength, endurance); (3) motor (agility, balance, coordination, speed of movement);
(4) cardiorespiratory (submaximal exercise capacity, maximal aerobic power, heart functions,
lung functions, blood pressure); and (5) metabolic fitness (glucose tolerance, insulin
sensitivity, lipid and lipoprotein metabolism, substrate oxidation characteristics).
Several laboratory and field tests have been designed to measure physical fitness in adults.166
The Eurofit for Adults is an example of a field test battery to assess health-related fitness in
adults aged 18 to 65 years.44, 173
Health was defined at the Consensus Conference in Toronto in 1988 as “a human condition
with physical, social, and psychological dimensions, each characterized on a continuum with
positive and negative poles. Positive health is associated with a capacity to enjoy life and to
withstand challenges; it is not merely the absence of disease. Negative health is associated
General introduction and outline of the thesis
22
with morbidity and, in the extreme, with premature mortality”. Morbidity can be defined as
“any departure, subjective or objective, from a state of physical or psychological well-being,
short of death”. Wellness is a holistic concept, describing “a state of positive health in the
individual, and compromising physical, social and psychological well-being”.22
Within the scope of this thesis, perceived stress and metabolic syndrome risk will be
discussed as two different health outcomes. Strictly following the definitions of Bouchard
and Shepard,22 the individual risk factors used in the continuous metabolic syndrome risk
score, which were based on existing definitions of the syndrome61, 170 are categorized as
morphological (waist circumference), cardiorespiratory (blood pressure) or metabolic (fasting
plasma glucose, HDL cholesterol and triglyceride levels) health-related fitness variables.
However, since the metabolic syndrome has received an ICD-9 code (International
Classification of Diseases), it will be discussed as a morbidity in the scope of this thesis.
Although genetic structure is a determinant of metabolic syndrome risk7, 28, 86, 114, 124 and
perceived stress,153 and has a significant impact on physical activity, physical fitness22 and
possibly on the associations between them, it is beyond the scope of this thesis to measure the
impact of heredity. However, other factors, including lifestyle factors and personal attributes,
will be included in analyses.
2.2. Aims of the association studies
In this thesis, six original research studies are included. The first two studies (chapters 2.1.1.
and 2.1.2.) are methodological studies on mental health and metabolic syndrome risk. The
last four studies (chapters 2.2.1, 2.2.2., 2.2.3. and 2.2.4) examined the associations between
physical activity, physical fitness, metabolic syndrome risk and stress using a cross-sectional
design in a population-based sample of male and female Flemish adults, aged 18 to 75. In the
next section, the aims of these four studies will be introduced, applying the consensus model
of Bouchard and Shephard22 to each of them.

General introduction and outline of the thesis
23
2.2.1. Physical activity and stress-related mental health problems
As perceived stress is an important determinant in the development of anxiety, depression
and other mental and physical disorders,41, 98 the knowledge necessary to develop effective
prevention and treatment strategies for stress is valuable. The association between physical
activity and perceived stress has been the object of several studies, of which some have
shown benign effects of exercise for primary or secondary stress prevention.26, 158 In general,
two different approaches have been made to explain these benign effects, more specifically a
physiological and a psychological approach. Physiological theories mainly focused on the
benign effects of regular aerobic exercise. However, as these theories alone were unable to
adequately explain the complex relationship between physical activity and stress (e.g. similar
health gains achieved by aerobic and anaerobic exercise), it was assumed that psychological
processes might also be involved.141, 172, 177
In order to investigate the psychosocial processes through which exercise can result in stress-
reduction, the multidimensional, dynamic and complex nature of stress has to be taken into
consideration.113 According to the theories described in paragraph 1.2.,107, 112 level of
perceived stress is strongly associated with coping and perceived social support. Moreover,
other psychological theories suggest mechanisms through which certain types of physical
activity may promote the use of more active, problem-focused coping strategie66, 113 and
enhance the level of perceived social support,43 which are both associated with lower
perceived stress.127 Therefore, taking into consideration the concepts of coping and social
support can result in a more comprehensive understanding of the complex relationship
between physical activity and stress. However, until now only a limited number of studies
used this approach, by examining the association between stress, coping, social support and
leisure activities in general, including physical activity, in certain subpopulations.23, 34
In chapter 2.2.1., we study the association between several types of physical activity and
stress in a population-based sample of 18- to 75-year-old Flemish adults, by taking into
consideration social support and coping, using a cluster-analytical approach. The second
objective consists of investigating whether these subgroups of individuals also differ in
anxiety and depression and in different types of physical activity. These objectives are based
on the hypothesis that certain types of leisure time physical activity have a stress-reducing effect,
because they result in higher perceived social support, and more active, problem focused coping,
General introduction and outline of the thesis
24
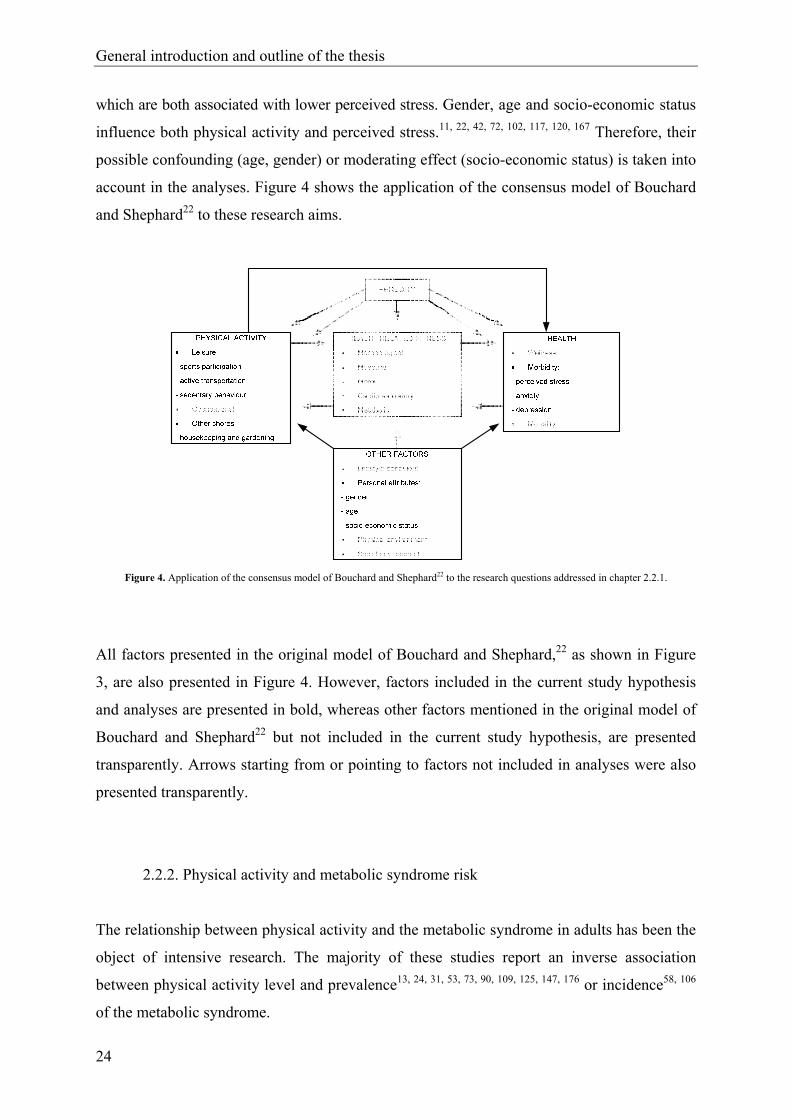
which are both associated with lower perceived stress. Gender, age and socio-economic status
influence both physical activity and perceived stress.11, 22, 42, 72, 102, 117, 120, 167 Therefore, their
possible confounding (age, gender) or moderating effect (socio-economic status) is taken into
account in the analyses. Figure 4 shows the application of the consensus model of Bouchard
and Shephard22 to these research aims.
Figure 4. Application of the consensus model of Bouchard and Shephard22 to the research questions addressed in chapter 2.2.1.
All factors presented in the original model of Bouchard and Shephard,22 as shown in Figure
3, are also presented in Figure 4. However, factors included in the current study hypothesis
and analyses are presented in bold, whereas other factors mentioned in the original model of
Bouchard and Shephard22 but not included in the current study hypothesis, are presented
transparently. Arrows starting from or pointing to factors not included in analyses were also
presented transparently.
2.2.2. Physical activity and metabolic syndrome risk
The relationship between physical activity and the metabolic syndrome in adults has been the
object of intensive research. The majority of these studies report an inverse association
between physical activity level and prevalence13, 24, 31, 53, 73, 90, 109, 125, 147, 176 or incidence58, 106
of the metabolic syndrome.
General introduction and outline of the thesis
25
A few years ago, it has been acknowledged that in finding ways to influence important health
outcomes, the study of sedentary behaviour may be as important as the study of physical
activity. Sedentary behaviour is a distinct class of behaviours that can coexist and compete
with physical activity.135 Studies including both sedentary behaviour and physical activity
have indicated that both factors may have independent effects on several health outcomes.
Television watching, a common form of sedentary behaviour, has been associated with
elevated risk for type 2 diabetes, obesity87 and cardiovascular disease markers,94 all
independently of physical activity level. Therefore, finding independent associations for
sedentary behaviour and physical activity level with metabolic syndrome risk may provide
support for prevention strategies including efforts to decrease sedentary behaviour, besides
promotion of physical activity, since both behavioral changes might show additional effects
in reducing metabolic syndrome risk. So far, a limited number of studies simultaneously
investigated the association between both behavioral parameters and the metabolic syndrome
in adults.13, 53, 71 Moreover, a binary definition of the metabolic syndrome was used in these
studies, which may include some methodological limitations, as described in paragraph 1.1.4.
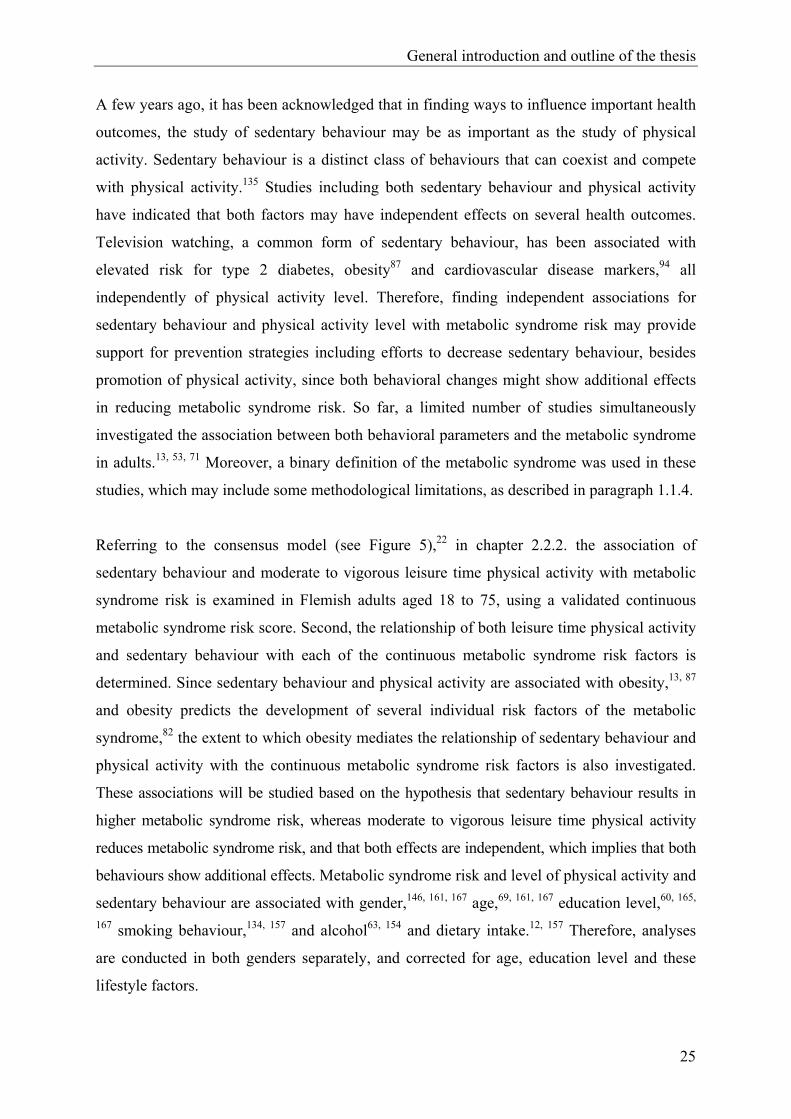
Referring to the consensus model (see Figure 5),22 in chapter 2.2.2. the association of
sedentary behaviour and moderate to vigorous leisure time physical activity with metabolic
syndrome risk is examined in Flemish adults aged 18 to 75, using a validated continuous
metabolic syndrome risk score. Second, the relationship of both leisure time physical activity
and sedentary behaviour with each of the continuous metabolic syndrome risk factors is
determined. Since sedentary behaviour and physical activity are associated with obesity,13, 87
and obesity predicts the development of several individual risk factors of the metabolic
syndrome,82 the extent to which obesity mediates the relationship of sedentary behaviour and
physical activity with the continuous metabolic syndrome risk factors is also investigated.
These associations will be studied based on the hypothesis that sedentary behaviour results in
higher metabolic syndrome risk, whereas moderate to vigorous leisure time physical activity
reduces metabolic syndrome risk, and that both effects are independent, which implies that both
behaviours show additional effects. Metabolic syndrome risk and level of physical activity and
sedentary behaviour are associated with gender,146, 161, 167 age,69, 161, 167 education level,60, 165,
167 smoking behaviour,134, 157 and alcohol63, 154 and dietary intake.12, 157 Therefore, analyses
are conducted in both genders separately, and corrected for age, education level and these
lifestyle factors.

General introduction and outline of the thesis
26
Figure 5. Application of the consensus model of Bouchard and Shephard22 to the research questions addressed in chapter 2.2.2.
2.2.3. Health-related fitness and metabolic syndrome risk
Besides physical activity, aerobic fitness has also been frequently associated with the
prevalence31, 39, 64, 90, 96, 103, 109, 176, 178 and incidence29, 65, 110 of the metabolic syndrome. The
inverse association found in these studies support promotion of aerobic exercise, resulting in
higher aerobic fitness, as a prevention strategy for the metabolic syndrome. Furthermore,
biological pathways might exist to explain and support protective effects of resistance
training and muscular strength on the development and treatment of the metabolic syndrome.
This assumption is based on the results of some intervention studies, showing benign effects
of resistance training on whole body insulin action,6 central obesity and body composition,10
blood pressure,32 triglycerides and HDL cholesterol blood levels.62 However, so far, only two
studies investigated the association between muscular strength and the metabolic syndrome,
both in a population of adult men.95, 96 The first (cross-sectional) study provided evidence for
an inverse association between muscular strength and prevalence of the metabolic syndrome,
independent of aerobic fitness and several confounding variables.96 In further longitudinal
analyses, muscular strength was inversely associated with incidence of the metabolic
syndrome after extensive adjustment for confounders. This association was marginally
nonsignificant after additional adjustment for aerobic fitness.95 These findings might be
General introduction and outline of the thesis
27
indicative for a protective effect of strength in the development of the metabolic syndrome,
that is additional to the benign effect of aerobic fitness. However, both studies showed some
limitations. The population studied consisted of males only, so until now, no studies have
investigated the independent and combined association of muscular strength and aerobic
fitness with metabolic syndrome risk in women. Furthermore, both previous studies used a
binary definition of the metabolic syndrome, which may be associated with reduced statistical
power (see paragraph 1.1.4).
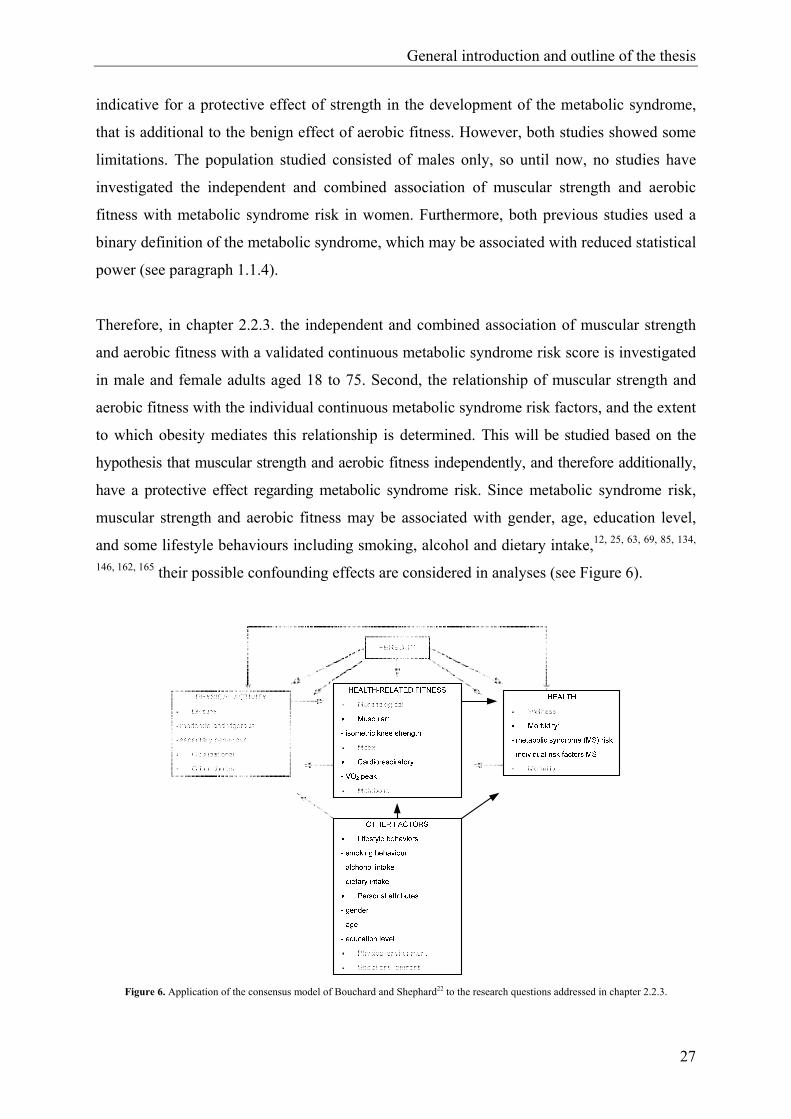
Therefore, in chapter 2.2.3. the independent and combined association of muscular strength
and aerobic fitness with a validated continuous metabolic syndrome risk score is investigated
in male and female adults aged 18 to 75. Second, the relationship of muscular strength and
aerobic fitness with the individual continuous metabolic syndrome risk factors, and the extent
to which obesity mediates this relationship is determined. This will be studied based on the
hypothesis that muscular strength and aerobic fitness independently, and therefore additionally,
have a protective effect regarding metabolic syndrome risk. Since metabolic syndrome risk,
muscular strength and aerobic fitness may be associated with gender, age, education level,
and some lifestyle behaviours including smoking, alcohol and dietary intake,12, 25, 63, 69, 85, 134,
146, 162, 165 their possible confounding effects are considered in analyses (see Figure 6).
Figure 6. Application of the consensus model of Bouchard and Shephard22 to the research questions addressed in chapter 2.2.3.
General introduction and outline of the thesis
28
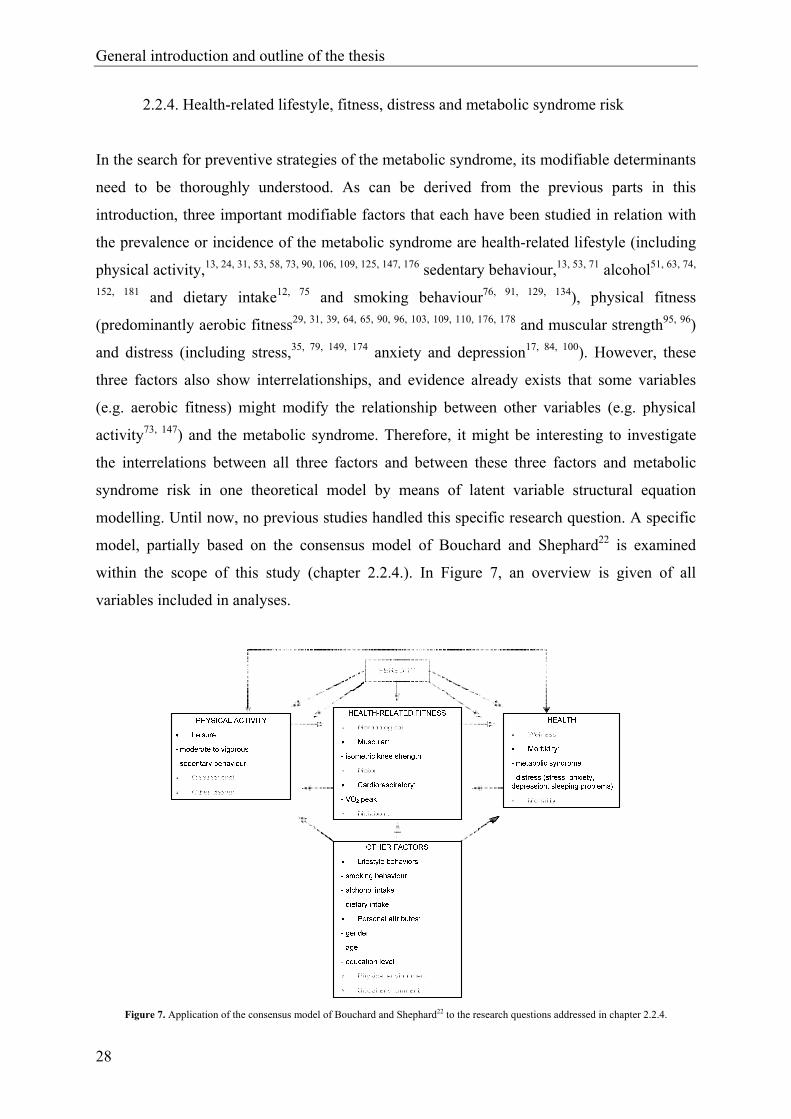
2.2.4. Health-related lifestyle, fitness, distress and metabolic syndrome risk
In the search for preventive strategies of the metabolic syndrome, its modifiable determinants
need to be thoroughly understood. As can be derived from the previous parts in this
introduction, three important modifiable factors that each have been studied in relation with
the prevalence or incidence of the metabolic syndrome are health-related lifestyle (including
physical activity,13, 24, 31, 53, 58, 73, 90, 106, 109, 125, 147, 176 sedentary behaviour,13, 53, 71 alcohol51, 63, 74,
152, 181 and dietary intake12, 75 and smoking behaviour76, 91, 129, 134), physical fitness
(predominantly aerobic fitness29, 31, 39, 64, 65, 90, 96, 103, 109, 110, 176, 178 and muscular strength95, 96)
and distress (including stress,35, 79, 149, 174 anxiety and depression17, 84, 100). However, these
three factors also show interrelationships, and evidence already exists that some variables
(e.g. aerobic fitness) might modify the relationship between other variables (e.g. physical
activity73, 147) and the metabolic syndrome. Therefore, it might be interesting to investigate
the interrelations between all three factors and between these three factors and metabolic
syndrome risk in one theoretical model by means of latent variable structural equation
modelling. Until now, no previous studies handled this specific research question. A specific
model, partially based on the consensus model of Bouchard and Shephard22 is examined
within the scope of this study (chapter 2.2.4.). In Figure 7, an overview is given of all
variables included in analyses.
Figure 7. Application of the consensus model of Bouchard and Shephard22 to the research questions addressed in chapter 2.2.4.

General introduction and outline of the thesis
29
In this figure, arrows between boxes are presented transparently, as this figure cannot be used
to present all associations between the variables examined within this study.
The path model studied in chapter 2.2.4. is shown in Figure 8. This model causally links
psychological distress, health-related lifestyle, physical fitness and a metabolic syndrome factor.
Health-related lifestyle is based on measurements of physical activity, sedentary behaviour,
alcohol intake and dietary fat intake. Physical fitness is based on measurements of aerobic
fitness and muscular strength. Distress is based on measurements of perceived stress, depression,
anxiety and sleeping problems. The metabolic syndrome factor is based on measurements of
waist circumference, triglycerides, HDL cholesterol, blood pressure and plasma glucose. This
model is based on the following hypotheses:
- A higher (lower) level of physical fitness is causally associated with a lower (higher)
metabolic risk, independent of health-related lifestyle.
- A lower (higher) level of distress is causally associated with a lower (higher) metabolic risk,
independent of health-related lifestyle.
- A healthier (unhealthier) lifestyle is causally associated with a lower (higher) metabolic risk.
This effect can be subdivided in an effect that is independent of physical fitness and of
distress, an effect that is mediated by physical fitness, and an effect that is mediated by
distress.
Figure 8. Path model causally linking psychological distress, health-related lifestyle and physical fitness with a metabolic syndrome
factor.

General introduction and outline of the thesis
30
3. Outline of the thesis
This thesis is primarily a collection of manuscripts that are published, in press, under editorial
review or submitted for publication. All articles were written to stand alone, which may lead
to some repetition, mainly in the description of the methods applied.
The next section incorporates original research findings and comprises of two parts. Part 1
exists of two methodological studies. The purpose of the first study (chapter 2.1.1.) was to
examine the reliability, equivalence and respondent preference of a computerized version of
the General Health Questionnaire (GHQ-12),78 Symptom Checklist (SCL-90-R),50 Medical
Outcomes Study Social Support Survey (MOSSSS),164 Perceived Stress Scale (PSS)42 and
Utrecht Coping List (UCL)156 in comparison with the original version in a general adult
population. Since the computerized versions of these questionnaires were developed within
the setting of the Policy Research Centre Sport, Physical Activity and Health (see below),
their psychometric properties first needed evaluation, before they could be implemented in
the different association studies. In the second study, the calculation and validation of the
continuous metabolic syndrome risk score is described (chapter 2.1.2.). Part 2 includes the
four studies examining the associations between physical activity, physical fitness, stress and
metabolic syndrome risk (chapters 2.2.1., 2.2.2., 2.2.3. and 2.2.4.). An overview of the
objectives of all six studies presented in the second section of this thesis is provided below:
Part 1. Methodological studies on mental health and metabolic syndrome risk
Objective 1: to evaluate the reliability, equivalence and respondent preference of a
computerized version of five mental health questionnaires42, 50, 78, 156, 164 in
comparison with the original paper-and-pencil version (chapter 2.1.1.).
Objective 2: to validate a continuous metabolic syndrome risk score based on the risk
factors of the International Diabetes Federation definition170 (chapter 2.1.2.).
Part 2. Association studies on physical activity, physical fitness, stress-related mental health,
and metabolic syndrome risk
Objective 3: to examine the association between leisure time physical activity and stress,
social support and coping, using a cluster analytical approach (chapter 2.2.1.).

General introduction and outline of the thesis
31
Objective 4: to examine the association of sedentary behaviour and moderate to vigorous
leisure time physical activity with a validated continuous metabolic syndrome
risk score (chapter 2.2.2.).
Objective 5: to examine the association of muscular strength and aerobic fitness with a
validated continuous metabolic syndrome risk score (chapter 2.2.3.).
Objective 6: to examine the association between health-related lifestyle, physical fitness,
distress and the metabolic syndrome using latent variable structural equation
modeling (chapter 2.2.4.).
Finally, in the third section of this thesis general conclusions, limitations, directions for
further research and practical implications are formulated.
4. Study sample
All data analyzed in this thesis were collected within the research scope of the Flemish Policy
Research Centre Sport, Physical Activity and Health. This policy research centre was
established in 2001 and is funded by the Flemish Government. It consists of a consortium of
three different university departments, more specifically the Department of Movement and
Sports Sciences (Ghent University), the Faculty of Kinesiology and Rehabilitation Sciences
(KULeuven) and the Faculty of Physical Education and Physical Therapy (Vrije Universiteit
Brussel). The main purpose of the Flemish Policy Research Centre Sport, Physical Activity
and Health is to provide scientific support to the Flemish Government regarding sports
participation, physical activity, physical fitness and health in the Flemish part of Belgium.
Four main themes were set up to accomplish this purpose. Data analyzed in this thesis
originate from the first two themes.
Theme 1 was designed to investigate the current quantitative and qualitative pattern of
physical activity, physical fitness and general health of the Flemish population. For this
purpose, the National Institute of Statistics randomly selected a community sample of 18 to
75 year old adults in 46 randomly chosen municipalities in the Flemish region of Belgium. Of
all randomly selected individuals invited to participate in the study, 28% agreed to participate
(N = 5170), after they were contacted by letter and telephone respectively. A subsample
(16%) of individuals not willing to participate in the study completed a questionnaire on

General introduction and outline of the thesis
32
demographic characteristics, height, weight, socio-economic status, physical activity and
their reasons for not taking part in the study. For these non-responders, the main reasons for
not participating in the study were lack of time (25.9%), health problems (23.2%), work
obligations (14.6%), previous engagements (14.1%), other reasons (22.2%). In a municipal
(sports) hall in their neighbourhood, participants were asked to give their written informed
consent and to complete a medical checklist4 and a short paper-and-pencil physical activity
questionnaire (IPAQ).45 Subsequently, resting heart rate, blood pressure, spirometric and
anthropometric characteristics were measured, following standardized procedures. Physical
fitness was measured using the Eurofit for Adults44 or the Senior Fitness Test Kit.150 Finally,
participants were asked to complete a computerized physical activity questionnaire
(FPACQ),119 and computerized general health and mental health questionnaires. At the end of
this test session, subjects were asked to take part in a second, more extensive investigation in
the lab of the Policy Research Centre, more specifically the theme 2 study.
Theme 2 was set up to study the relationship of physical activity and physical fitness with
health in the Flemish population. For this purpose, laboratory measurements were executed in
a subsample of the theme 1 study. At the beginning of this test session, a fasting blood
sample was taken, and subjects went through a medical screening by a physician.
Subsequently, more extensive anthropometric measurements were performed, including bio-
electrical impedance analyses.77 A Neurocom device130 was used, to measure postural
control. Aerobic fitness and muscular strength were successively determined by means of a
maximal test on an electrically braked Lode Excalibur cycle ergometer,123 and a test battery
measuring knee strength on a calibrated Biodex System Pro 3 dynamometer,52 respectively.
Physical activity during adolescence and adulthood were determined by means of a
retrospective questionnaire. Finally, at the end of this session, subjects were asked to
complete a three-day diet record at home.49
For clarity, a short overview of the samples used in the different studies is given below:
Chapter 2.1.1. Reliability, equivalence and respondent preference of computerized versus
paper-and-pencil mental health questionnaires
A number of 245 adults, aged 18 to 75 participated in this study, and were divided into two
groups: (1) internal consistency, equivalence and preference for computerized and/or paper-
and-pencil administration formats of the mental health questionnaires were analyzed in group

General introduction and outline of the thesis
33
I (n = 130); (2) test-retest reliability of the computerized administration was measured in
group II (n = 115). Group I was a smaller subset of theme 1, who completed the paper-and-
pencil version of the questionnaires at home. Subjects of group II were part of the theme 2
study, and performed the computerized administration for the second time during their lab-
visit.
Chapter 2.1.2. A continuous metabolic syndrome risk score: utility for epidemiological
analyses
Theme 2 participants with complete data for all metabolic syndrome risk factors took part in
the study of chapter 2.1.2. Subjects were excluded in case of a history or evidence of
cardiovascular disease or diabetes. As a result, 1020 adults (571 men, 449 women) aged 18 to
75 were included in the analyses.
Chapter 2.2.1. Association between leisure time physical activity and stress, social support
and coping: a cluster-analytical approach
All theme 1 subjects with complete data of the computerized mental health and physical
activity questionnaires used for these analyses were included in the study of chapter 2.2.1.
This resulted in a total number of 2616 Flemish 18-to75-year-olds, of which 1430 were male
and 1186 were female.
Chapter 2.2.2. Sedentary behaviour, physical activity and a continuous metabolic syndrome
risk score in adults
For the analyses performed in chapter 2.2.2., only theme 2 participants with complete data for
all metabolic syndrome risk factors, sedentary behaviour, leisure time physical activity and
for all confounding variables were included. Furthermore, participants were excluded in case
of a history or evidence of cardiovascular disease or diabetes. The resulting number of
participants were 559 men and 433 women, aged 18 to 75.
Chapter 2.2.3. Muscular strength, aerobic fitness and metabolic syndrome risk in Flemish
adults
Similar as in the study of chapter 2.2.2., subjects for this study originated from theme 2. A
total of 1019 adults (571 men, 448 women), free from cardiovascular disease and diabetes
and with complete data for all (confounding) variables were included in the analyses.
General introduction and outline of the thesis
34
Chapter 2.2.4. A path model of health-related lifestyle, physical fitness, distress and
metabolic syndrome risk factors in adults
For the study in chapter 2.2.4., theme 2 subjects with complete data for all mental health,
physical activity, physical fitness, metabolic syndrome risk and confounding variables were
included. Similar as in both previous studies, individuals with a history or evidence of
cardiovascular disease or diabetes were excluded. This resulted in a number of 965 subjects
(549 men, 416 women), aged 18 to 75.
General introduction and outline of the thesis
35
5. References
1. Aguilar-Salinas CA, Rojas R, Gomez-Perez FJ, Mehta R, Franco A, Olaiz G, Rull JA.
The metabolic syndrome: A concept hard to define. Archives of Medical Research
2005;36:223-31.
2. Alberti KGMM, Zimmet P, Shaw J. Metabolic syndrome - A new worldwide
definition. A consensus statement from the International Diabetes Federation.
Diabetic Medicine 2006;23:469-80.
3. Alberti KGM, Zimmet P, Shaw J. The metabolic syndrome - A new worldwide
definition. The Lancet 2005;366:1059-62.
4. American College of Sports Medicine. ACSM's guidelines for exercise testing and
prescription, 6th Ed. Baltimore: Williams & Wilkins; 2000.
5. American College of Sports Medicine. The recommended quantity and quality of
exercise for developing and maintaining fitness in healthy adults. Medicine and
Science in Sports and Exercise 1978;10:vii-x.
6. Andersen JL, Schjerling P, Andersen LL, Dela F. Resistance training and insulin
action in humans: Effects of detraining. The Journal of Physiology 2003;15;551:1049-
58.
7. Arya R, Blangero J, Williams K, Almasy L, Dyer TD, Leach RJ, O'Connell P, Stern
MP, Duggirala R. Factors of insulin resistance syndrome-related phenotypes are
linked to genetic locations on chromosomes 6 and 7 in nondiabetic Mexican-
Americans. Diabetes 2002;51:841-7.
8. Balkau B, Charles MA. Comment on the provisional report from the WHO
consultation. Diabetic Medicine 1999;16:442-3.
9. Balkau B, Charles MA, Drivsholm T, Borch-Johnsen K, Wareham N, Yudkin JS,
Morris R, Zavaroni I, van Dam R, Feskens E, Gabriel R, Nilsson P, Hedblad B.
Frequency of the WHO metabolic syndrome in European cohorts, and an alternative
definition of an insulin resistance syndrome. Diabetes & Metabolism 2002;28:364-76.
10. Banz WJ, Maher MA, Thompson WG, Bassett DR, Moore W, Ashraf M, Keefer DJ,
Zemel MB. Effects of resistance versus aerobic training on coronary artery disease
risk factors. Experimental Biology and Medicine 2003;228:434-40.
11. Baum A, Garofalo JP, Yali AM. Socioeconomic status and chronic stress - Does
stress account for SES effects on health? Annals of the New York Academy of Sciences
1999;896:131-44.

General introduction and outline of the thesis
36
12. Baxter AJ, Coyne T, McClintock C. Dietary patterns and metabolic syndrome - A
review of epidemiologic evidence. Asia Pacific Journal of Clinical Nutrition
2006;15:134-42.
13. Bertrais S, Beyeme-Ondoua JP, Czernichow S, Galan P, Hercberg S, Oppert JM.
Sedentary behaviors, physical activity, and metabolic syndrome in middle-aged
French subjects. Obesity Research 2005;13:936-44.
14. Bjorntorp P, Holm G, Rosmond R, Folkow B. Hypertension and the metabolic
syndrome: Closely related central origin? Blood Pressure 2000;9:71-82.
15. Bjorntorp P, Rosmond R. The metabolic syndrome - A neuroendocrine disorder?
British Journal of Nutrition 2000;83:S49-S57.
16. Black PH. The inflammatory response is an integral part of the stress response:
Implications for atherosclerosis, insulin resistance, type II diabetes and metabolic
syndrome X. Brain Behavior and Immunity 2003;17:350-64.
17. Bonnet F, Irving K, Terra JL, Nony P, Berthezene F, Moulin P. Depressive symptoms
are associated with unhealthy lifestyles in hypertensive patients with the metabolic
syndrome. Journal of Hypertension 2005;23:611-7.
18. Boronat M, Chirino R, Varillas VF, Saavedra P, Marrero D, Fabregas M, Novoa FJ.
Prevalence of the metabolic syndrome in the island of Gran Canaria: Comparison of
three major diagnostic proposals. Diabetic Medicine 2005;22:1751-6.
19. Bouchard C. Discussion: Heredity, fitness, and health. In: Bouchard C, Shephard RJ,
Stephens T, Sutton JR, McPherson BD, editors. Exercise, fitness, and health: A
consensus of current knowledge. Champaign: Human Kinetics; 1990. p. 147-53.
20. Bouchard C. Genetic determinants of endurance performance. In: Shephard RJ,
Astrand PO, editors. Endurance in sports. Oxford: Blackwell Scientific; 1992. p. 149-
59.
21. Bouchard C, Dionne FT, Simoneau JA, Boulay MR. Genetics of aerobic and
anaerobic performances. Exercise and Sport Sciences Reviews 1992;20:27-58.
22. Bouchard C, Shephard RJ. Physical activity, fitness, and health: The model and key
concepts. In: Bouchard C, Shephard RJ, Stephens T, editors. Physical activity, fitness,
and health: International proceedings and consensus statement. Champaign: Human
Kinetics; 1994. p. 77-88.
23. Bradr I, Loncaric D. Coping with academic stress in relation to leisure activities of
elementary and high-school pupils. Drustvena Istrazivanja 2004;13:967-88.
General introduction and outline of the thesis
37
24. Brien SE, Katzmarzyk PT. Physical activity and the metabolic syndrome in Canada.
Applied Physiology Nutrition and Metabolism-Physiologie Appliquee Nutrition et
Metabolisme 2006;31:40-7.
25. Brodney S, McPherson RS, Carpenter RA, Welten D, Blair SN. Nutrient intake of
physically fit and unfit men and women. Medicine and Science in Sports and Exercise
2001;33:459-67.
26. Buckworth J, Dishman RK. Exercise Psychology. Champaign: Human Kinetics; 2002.
27. Cameron AJ, Shaw JE, Zimmet PZ. The metabolic syndrome: prevalence in
worldwide populations. Endocrinology and Metabolism Clinics of North America
2004;33:351-75.
28. Carmelli D, Cardon LR, Fabsitz R. Clustering of hypertension, diabetes, and obesity
in adult male twins - Same genes or same environments. American Journal of Human
Genetics 1994;55:566-73.
29. Carnethon MR, Gidding SS, Nehgme R, Sidney S, Jacobs DR, Liu K.
Cardiorespiratory fitness in young adulthood and the development of cardiovascular
disease risk factors. Journal of the American Medical Association 2003;290:3092-
100.
30. Carr DB, Utzschneider KM, Hull RL, Kodama K, Retzlaff BM, Brunzell JD, Shofer
JB, Fish BE, Knopp RH, Kahn SE. Intra-abdominal fat is a major determinant of the
National Cholesterol Education Program Adult Treatment Panel III criteria for the
metabolic syndrome. Diabetes 2004;53:2087-94.
31. Carroll S, Cooke CB, Butterly RJ. Metabolic clustering, physical activity and fitness
in nonsmoking, middle-aged men. Medicine and Science in Sports and Exercise
2000;32:2079-86.
32. Carter JR, Ray CA, Downs EM, Cooke WH. Strength training reduces arterial blood
pressure but not sympathetic neural activity in young normotensive subjects. Journal
of Applied Physiology 2003;94:2212-6.
33. Caspersen CJ, Powell KE, Christenson GM. Physical-activity, exercise, and physical-
fitness - Definitions and distinctions for health-related research. Public Health
Reports 1985;100:126-31.
34. Cassidy T. Leisure, coping and health: The role of social, family, school and peer
relationship factors. British Journal of Guidance & Counselling 2005;33:51-66.
35. Chandola T, Brunner E, Marmot M. Chronic stress at work and the metabolic
syndrome: Prospective study. British Medical Journal 2006;332:521-4.

General introduction and outline of the thesis
38
36. Chen HJ, Bai CH, Yeh WT, Chiu HC, Pan WH. Influence of metabolic syndrome and
general obesity on the risk of ischemic stroke. Stroke 2006;37:1060-4.
37. Chen J, Muntner P, Hamm LL, Jones DW, Batuman V, Fonseca V, Whelton PK, He
J. The metabolic syndrome and chronic kidney disease in US adults. Annals of
Internal Medicine 2004;140:167-74.
38. Chrousos GP, Gold PW. The concepts of stress and stress system disorders: Overview
of physical and behavioural homeostasis. Journal of the American Medical
Association 1992;267:1244-52.
39. Church TS, Finley CE, Earnest CP, Kampert JB, Gibbons LW, Blair SN. Relative
associations of fitness and fatness to fibrinogen, white blood cell count, uric acid and
metabolic syndrome. International Journal of Obesity 2002;26:805-13.
40. Clarke HH. Academy approves physical fitness definition. Physical Fitness
Newsletter 1979;25:1.
41. Cohen S, Kessler RC, Underwood L. Strategies for measuring stress in studies of
psychiatric and physical disorders. In: Cohen S, Kessler R, Underwood L, editors.
Measuring stress: a guide for health and social scientists. New York: Oxford; 1995.
p. 3-26.
42. Cohen S, Williamson G. Perceived stress in a probability sample of the United States.
In: Spacapan S, Oskamp S, editors. The social psychology of health: Claremont
symposium on applied social psychology. Newbury Park, CA: Sage; 1988. p. 31-67.
43. Coleman D, Isoahola SE. Leisure and health - The role of social support and self-
determination. Journal of Leisure Research 1993;25:111-28.
44. Council of Europe. Eurofit for adults: Assessment of health-related fitness.
Strassbourg: Council of Europe; 1995.
45. Craig CL, Marshall AL, Sjostrom M, Bauman AE, Booth ML, Ainsworth B, et al.
International Physical Activity Questionnaire (IPAQ): 12-country reliability and
validity. Medicine & Science in Sports & Exercise 2003;35:1381-95.
46. De Cosmo S, Trevisan R, Minenna A, Vedovato M, Viti R, Santini SA, Dodesini AR,
Fioretto P, Trischitta V. Insulin resistance and the cluster of abnormalities related to
the metabolic syndrome are associated with reduced glomerular filtration rate in
patients with type 2 diabetes. Diabetes Care 2006;29:432-4.
47. Deen D. Metabolic syndrome: Time for action. American Family Physician
2004;69:2875-82.
General introduction and outline of the thesis
39
48. Defronzo RA, Ferrannini E. Insulin resistance - A multifaceted syndrome responsible
for NIDDM, obesity, hypertension, dyslipidemia, and atherosclerotic cardiovascular
disease. Diabetes Care 1991;14:173-94.
49. Deriemaeker P, Aerenhouts D, Hebbelinck M, Clarys P. Validation of a 3-day diet
diary: Comparison with a 7-day diet diary and a FFQ. Medicine & Science in Sports
& Exercise 2006;38:S28.
50. Derogatis LR, Lippman RS, Covi L. SCL-90-R, an outpatient psychiatric rating scale-
preliminary report. Psychopharmacology Bulletin 1973;9:13-28.
51. Djousse L, Arnett DK, Eckfeldt JH, Province MA, Singer MR, Ellison RC. Alcohol
consumption and metabolic syndrome: Does the type of beverage matter? Obesity
Research 2004;12:1375-85.
52. Drouin JM, Valovich-mcLeod TC, Shultz SJ, Gansneder BM, Perrin DH. Reliability
and validity of the Biodex system 3 pro isokinetic dynamometer velocity, torque and
position measurements. European Journal of Applied Physiology 2004;91:22-9.
53. Dunstan D, Salmon J, Owen N, Armstrong T, Zimmet P, Welborn T, Cameron A,
Dwyer T, Jolley D, Shaw J, on behalf of the AusDiab Steering Committee.
Associations of TV viewing and physical activity with the metabolic syndrome in
Australian adults. Diabetologia 2005;48:2254-61.
54. Dunstan DW, Zimmet PZ, Welborn TA, de Court, Cameron AJ, Sicree RA, Dwyer T,
Colagiuri S, Jolley D, Knuiman M, Atkins R, Shaw JE. The rising prevalence of
diabetes and impaired glucose tolerance - The Australian diabetes, obesity and
lifestyle study. Diabetes Care 2002;25:829-34.
55. Eckel RH, Grundy SM, Zimmet PZ. The metabolic syndrome. Lancet 2005;365:1415-
28.
56. Eckel RH, Krauss RM. American Heart Association call to action: Obesity as a major
risk factor for coronary heart disease. Circulation 1998;97:2099-100.
57. Einhorn D, Reaven GM, Cobin RH, Ford E, Ganda OP, Handelsman Y, Hellman R,
Jellinger PS, Kendall D, Krauss RM, Neufeld ND, Petak SM, Rodbard HW, Seibel
JA, Smith DA, Wilson PW. American College of Endocrinology position statement
on the insulin resistance syndrome. Endocrine practice: Official journal of the
American College of Endocrinology and the American Association of Clinical
Endocrinologists. 2003;9:237-52.
58. Ekelund U, Brage S, Franks PW, Hennings S, Emms S, Wareham NJ. Physical
activity energy expenditure predicts progression toward the metabolic syndrome
General introduction and outline of the thesis
40
independently of aerobic fitness in middle-aged healthy Caucasians: The Medical
Research Council Ely Study. Diabetes Care 2005;28:1195-200.
59 Eurodiet. Nutrition & diet for healthy lifestyles in Europe, science & policy
implications. Core report. Public Health Nutrition 2001 (supplement);4.2(A) and
2(B).
60. European Commission. A PAN-EU survey on consumer attitudes to physical activity,
body-weight and health. Luxembourg: Office for Official Publications of the
European Communities; 1999.
61. Expert Panel on Detection Evaluation, and Treatment of High Blood Cholesterol in
Adults. Executive summary of the Third Report of the National Cholesterol Education
Program (NCEP) Expert Panel on Detection, Evaluation, and Treatment of High
Blood Cholesterol in Adults (Adult Treatment Panel III). Journal of the American
Medical Association 2001;285:2486-97.
62. Fahlman MM, Boardley D, Lambert CP, Flynn MG. Effects of endurance training and
resistance training on plasma lipoprotein profiles in elderly women. The journals of
gerontology. Series A, Biological sciences and medical sciences 2002;57:B54-B60.
63. Fan AZ, Russell M, Dorn J, Freudenheim JL, Nochajski T, Hovey K, Trevisan M.
Lifetime alcohol drinking pattern is related to the prevalence of metabolic syndrome.
The Western New York Health Study (WNYHS). European Journal of Epidemiology
2006;21:129-38.
64. Farrell SW, Cheng YLJ, Blair SN. Prevalence of the metabolic syndrome across
cardiorespiratory fitness levels in women. Obesity Research 2004;12:824-30.
65. Ferreira I, Twisk JWR, van Mechelen W, Kemper HCG, Stehouwer CDA.
Development of fatness, fitness, and lifestyle from adolescence to the age of 36 years
- Determinants of the metabolic syndrome in young adults: The Amsterdam growth
and health longitudinal study. Archives of Internal Medicine 2005;165:42-8.
66. Fleishman JA. Personality-Characteristics and coping patterns. Journal of Health and
Social Behavior 1984;25:229-44.
67. Ford ES. Risks for all-cause mortality, cardiovascular disease, and diabetes associated
with the metabolic syndrome - A summary of the evidence. Diabetes Care
2005;28:1769-78.
68. Ford ES, Giles WH. A comparison of the prevalence of the metabolic syndrome using
two proposed definitions. Diabetes Care 2003;26:575-81.
General introduction and outline of the thesis
41
69. Ford ES, Giles WH, Dietz WH. Prevalence of the metabolic syndrome among US
adults - Findings from the Third National Health and Nutrition Examination Survey.
Journal of the American Medical Association 2002;287:356-9.
70. Ford ES, Giles WH, Mokdad AH. Increasing prevalance of the metabolic syndrome
among U.S adults. Diabetes Care 2004;27:2444-9.
71. Ford ES, Kohl HW, Mokdad AH, Ajani UA. Sedentary behavior, physical activity,
and the metabolic syndrome among US adults. Obesity Research 2005;13:608-14.
72. Ford ES, Merritt RK, Heath GW, Powell KE, Washburn RA, Kriska A, Haile G.
Physical activity behaviors in lower and higher socioeconomic-status populations.
American Journal of Epidemiology 1991;133:1246-56.
73. Franks PW, Ekelund U, Brage S, Wong MY, Wareham NJ. Does the association of
habitual physical activity with the metabolic syndrome differ by level of
cardiorespiratory fitness? Diabetes Care 2004;27:1187-93.
74. Freiberg MS, Cabral HJ, Heeren TC, Vasan RS, Ellison RC. Alcohol consumption
and the prevalence of the metabolic syndrome in the US - A cross-sectional analysis
of data from the Third National Health and Nutrition Examination Survey. Diabetes
Care 2004;27:2954-9.
75. Freire RD, Cardoso MA, Gimeno SGA, Ferreira SRG. Dietary fat is associated with
metabolic syndrome in Japanese Brazilians. Diabetes Care 2005;28:1779-85.
76. Geslain-Biquez C, Vol S, Tichet J, Caradec A, D'Hour A, Balkau B. The metabolic
syndrome in smokers. The DESIR study. Diabetes & Metabolism 2003;29:226-34.
77. Ghosh S, Meister D, Cowen S, Hannan WJ, Ferguson A. Body composition at the
bedside. European Journal of Gastroenterology & Hepatology 1997;9:783-8.
78. Goldberg DP, Williams P. A users guide to the general health questionnaire.
Windsor: Nfer Nelson; 1988.
79. Goldman N, Glei DA, Seplaki C, Liu IW, Weinstein M. Perceived stress and
physiological dysregulation in older adults. Stress - The International Journal on the
Biology of Stress 2005;8:95-105.
80. Grundy SM, Hansen B, Smith SC, Jr., Cleeman JI, Kahn RA. Clinical management of
metabolic syndrome: Report of the American Heart Association/National Heart,
Lung, and Blood Institute/American Diabetes Association Conference on Scientific
Issues Related to Management. Circulation 2004;109:551-6.
81. Habib KE, Gold PW, Chrousos GP. Neuroendocrinology of stress. Endocrinology and
Metabolism Clinics of North America 2001;30:695-727.

General introduction and outline of the thesis
42
82. Han TS, Williams K, Sattar N, Hunt KJ, Lean MEJ, Haffner SM. Analysis of obesity
and hyperinsulinemia in the development of metabolic syndrome: San Antonio Heart
Study. Obesity Research 2002;10:923-31.
83. Hanley AJG, Karter AJ, Williams K, Festa A, D'Agostino RB, Wagenknecht LE,
Haffner SM. Prediction of type 2 diabetes mellitus with alternative definitions of the
metabolic syndrome - The Insulin Resistance Atherosclerosis Study. Circulation
2005;112:3713-21.
84. Herva A, Rasanen P, Miettunen J, Timonen M, Laksy K, Veijola J, Laitinen J,
Ruokonen A, Joukamaa M. Co-occurrence of metabolic syndrome with depression
and anxiety in young adults: The Northern Finland 1966 Birth Cohort Study.
Psychosomatic Medicine 2006;68:213-6.
85. Hirai T, Kusaka Y, Suganuma N, Seo A, Tobita Y. Physical work load affects the
maximum oxygen uptake. Industrial Health 2006;44:250-7.
86. Hong Y, Pedersen NL, Brismar K, De Faire U. Genetic and environmental
architecture of the features of the insulin-resistance syndrome. American Journal of
Human Genetics 1997;60:143-52.
87. Hu FB, Li TY, Colditz GA, Willett WC, Manson JE. Television watching and other
sedentary behaviors in relation to risk of obesity and type 2 diabetes mellitus in
women. Journal of the American Medical Association 2003;289:1785-91.
88. Hu G, Qiao Q, Tuomilehto J, Balkau B, Borch-Johnsen K, Pyorala K. Prevalence of
the metabolic syndrome and its relation to all-cause and cardiovascular mortality in
nondiabetic European men and women. Archives of Internal Medicine
2004;164:1066-76.
89. Hunt KJ, Resendez RG, Williams K, Haffner SM, Stern MP. National Cholesterol
Education Program versus World Health Organization metabolic syndrome in relation
to all-cause and cardiovascular mortality in the San Antonio Heart Study. Circulation
2004;110:1251-7.
90. Irwin ML, Ainsworth BE, Mayer-Davis EJ, Addy CL, Pate RR, Durstine JL. Physical
activity and the metabolic syndrome in a tri-ethnic sample of women. Obesity
Research 2002;10:1030-7.
91. Ishizaka N, Ishizaka Y, Toda EI, Hashimoto H, Nagai R, Yamakado M. Association
between cigarette smoking, metabolic syndrome, and carotid arteriosclerosis in
Japanese individuals. Atherosclerosis 2005;181:381-8.
General introduction and outline of the thesis
43
92. Isomaa B. A major health hazard: The metabolic syndrome. Life Sciences
2003;73:2395-411.
93. Isomaa B, Almgren P, Tuomi T, Forsen B, Lahti K, Nissen M, Taskinen MR, Groop
L. Cardiovascular morbidity and mortality associated with the metabolic syndrome.
Diabetes Care 2001;24:683-9.
94. Jakes RW, Day NE, Khaw KT, Luben R, Oakes S, Welch A, Bingham S, Wareham
NJ. Television viewing and low participation in vigorous recreation are independently
associated with obesity and markers of cardiovascular disease risk: EPIC-Norfolk
population-based study. European Journal of Clinical Nutrition 2003;57:1089-96.
95. Jurca R, LaMonte MJ, Barlow CE, Kampert JB, Church TS, Blair SN. Association of
muscular strength with incidence of metabolic syndrome in men. Medicine and
Science in Sports and Exercise 2005;37:1849-55.
96. Jurca R, LaMonte MJ, Church TS, Earnest CP, Fitzgerald SJ, Barlow CE, Jordan AN,
Kampert JB, Blair SN. Associations of muscle strength and aerobic fitness with
metabolic syndrome in men. Medicine and Science in Sports and Exercise
2004;36:1301-7.
97. Kahn R, Buse J, Ferrannini E, Stern M. The metabolic syndrome: Time for a critical
appraisal. Diabetologia 2005;48:1684-99.
98. Kalia M. Assessing the economic impact of stress - The modern day hidden epidemic.
Metabolism-Clinical and Experimental 2002;51:49-53.
99. Kaplan NM. The deadly quartet – Upper-body obesity, glucose-intolerance,
hypertriglyceridemia, and hypertension. Archives of Internal Medicine
1989;149:1514-20.
100. Kinder LS, Carnethon MR, Palaniappan LP, King AC, Fortmann SP. Depression and
the metabolic syndrome in young adults: Findings from the third national health and
nutrition examination survey. Psychosomatic Medicine 2004;66:316-22.
101. Klein BEK, Klein R, Lee KE. Components of the metabolic syndrome and risk of
cardiovascular disease and diabetes in Beaver Dam. Diabetes Care 2002;25:1790-4.
102. Krieger N. Theories for social epidemiology in the 21st century: An ecosocial
perspective. International Journal of Epidemiology 2001;30:668-77.
103. Kullo IJ, Hensrud DD, Allison TG. Relation of low cardiorespiratory fitness to the
metabolic syndrome in middle-aged men. American Journal of Cardiology
2002;90:795-7.
General introduction and outline of the thesis
44
104. Kurl S, Laukkanen JA, Niskanen L, Laaksonen D, Sivenius J, Nyyssonen K, Salonen
JT. Metabolic syndrome and the risk of stroke in middle-aged men. Stroke
2006;37:806-11.
105. Laaksonen DE, Lakka HM, Niskanen LK, Kaplan GA, Salonen JT, Lakka TA.
Metabolic syndrome and development of diabetes mellitus: Application and
validation of recently suggested definitions of the metabolic syndrome in a
prospective cohort study. American Journal of Epidemiology 2002;156:1070-7.
106. Laaksonen DE, Lakka HM, Salonen JT, Niskanen LK, Rauramaa R, Lakka TA. Low
levels of leisure-time physical activity and cardiorespiratory fitness predict
development of the metabolic syndrome. Diabetes Care 2002;25:1612-8.
107. Lakey B, Cohen S. Social support theory and measurement. In: Cohen S, Underwood
L, Gotlieb B, editors. Social support measurement and interventions: a guide for
health and social scientists. New York: Oxford; 2000. p. 29-52.
108. Lakka HM, Laaksonen DE, Lakka TA, Niskanen LK, Kumpusalo E, Tuomilehto J,
Salonen JT. The metabolic syndrome and total and cardiovascular disease mortality in
middle-aged men. Journal of the American Medical Association 2002;288:2709-16.
109. Lakka TA, Laaksonen DE, Lakka HM, Mannikko N, Niskanen LK, Rauramaa R,
Salonen JT. Sedentary lifestyle, poor cardiorespiratory fitness, and the metabolic
syndrome. Medicine and Science in Sports and Exercise 2003;35:1279-86.
110. LaMonte MJ, Barlow CE, Jurca R, Kampert JB, Church TS, Blair SN.
Cardiorespiratory fitness is inversely associated with the incidence of metabolic
syndrome - A prospective study of men and women. Circulation 2005;112:505-12.
111. Laukkanen JA, Laaksonen DE, Niskanen L, Pukkala E, Hakkarainen A, Salonen JT.
Metabolic syndrome and the risk of prostate cancer in Finnish men: A population-
based study. Cancer Epidemiology Biomarkers & Prevention 2004;13:1646-50.
112. Lazarus RS, Folkman S. Stress, Appraisal and Coping. New York: Springer
Publishing Co; 1984.
113. Long BC. A cognitive perspective on the stress-reducing effects of physical exercise.
In: Seraganian P, editor. Exercise psychology, the influence of physical exercise on
psychological processes. New York: Wiley; 1993. p. 339-57.
114. Loos RJ, Katzmarzyk PT, Rao DC, Rice T, Leon AS, Skinner JS, Wilmore JH,
Rankinen T, Bouchard C. Genome-wide linkage scan for the metabolic syndrome in
the HERITAGE Family Study. The Journal of Clinical Endocrinology & Metabolism
2003;88:5935-43.

General introduction and outline of the thesis
45
115. Lorenzo C, Okoloise M, Williams K, Stern MP, Haffner SM. The metabolic
syndrome as predictor of type 2 diabetes: The San Antonio Heart Study. Diabetes
Care 2003;26:3153-9.
116. Lorenzo C, Williams K, Hunt KJ, Haffner SM. Trend in the prevalence of the
metabolic syndrome and its impact on cardiovascular disease incidence: The San
Antonio Heart Study. Diabetes Care 2006;29:625-30.
117. Lynch JW, Kaplan GA, Salonen JT. Why do poor people behave poorly? Variation in
adult health behaviours and psychosocial characteristics by stages of the
socioeconomic lifecourse. Social Science & Medicine 1997;44:809-19.
118. Malik S, Wong ND, Franklin SS, Kamath TV, L'Italien GJ, Pio JR, Williams GR.
Impact of the metabolic syndrome on mortality from coronary heart disease,
cardiovascular disease, and all causes in United States adults. Circulation
2004;110:1245-50.
119. Matton L, Wijndaele K, Duvigneaud N, Duquet W, Philippaerts R, Thomis M,
Lefevre J. Reliability and validity of the Flemish Physical Activity Computerized
Questionnaire (FPACQ) in adults. Research Quarterly for Exercise and Sport. In
press.
120. Matud MP. Gender differences in stress and coping styles. Personality and Individual
Differences 2004;37:1401-15.
121. Mc Ewen BS. Protective and damaging effects of stress mediators. The New England
Journal of Medicine 1998;338:171-9.
122. McNeill AM, Schmidt MI, Rosamond WD, East HE, Girman CJ, Ballantyne CM,
Golden SH, Heiss G. The metabolic syndrome and 11-year risk of incident
cardiovascular disease in the atherosclerosis risk in communities study. Diabetes Care
2005;28:385-90.
123. Meyer T, Georg T, Becker C, Kindermann W. Reliability of gas exchange
measurements from two different spiroergometry systems. International Journal of
Sports Medicine 2001;22:593-7.
124. Mitchell BD, Kammerer CM, Mahaney MC, Blangero J, Comuzzie AG, Atwood LD,
Haffner SM, Stern MP, MacCluer JW. Genetic analysis of the IRS - Pleiotropic
effects of genes influencing insulin levels on lipoprotein and obesity measures.
Arteriosclerosis Thrombosis and Vascular Biology 1996;16:281-8.
125. Mohan V, Gokulakrishnan K, Deepa R, Shanthirani CS, Datta M. Association of
physical inactivity with components of metabolic syndrome and coronary artery
General introduction and outline of the thesis
46
disease-the Chennai Urban Population Study (CUPS no. 15). Diabetic Medicine
2005;22:1206-11.
126. Montoye HJ, Kemper HCG, Saris WHM, Washburn RA. Measuring physical activity
and energy expenditure. Champaign: Human Kinetics; 1996.
127. Muller L, Spitz E. Multidimensional assessment of coping: validation of the Brief
COPE among french population. Encephale-Revue de Psychiatrie Clinique
Biologique et Therapeutique 2003;29:507-18.
128. Nakanishi N, Takatorige T, Fukuda H, Shirai K, Li WJ, Okamoto M, Yoshida H,
Matsuo Y, Suzuki K, Tatara K. Components of the metabolic syndrome as predictors
of cardiovascular disease and type 2 diabetes in middle-aged Japanese men. Diabetes
Research and Clinical Practice 2004;64:59-70.
129. Nakanishi N, Takatorige T, Suzuki K. Cigarette smoking and the risk of the metabolic
syndrome in middle-aged Japanese male office workers. Industrial Health
2005;43:295-301.
130. Neurocom Equitest System operator's manual. Clackamas: Neurocom International,
Inc.; 2002.
131. NIH Consensus Development Panel on Physical Activity and Cardiovascular Health.
Physical activity and cardiovascular health. Journal of the American Medical
Association 1996;276:241-6.
132. O'Connor PJ, Raglin JS, Martinsen EW. Physical activity, anxiety and anxiety
disorders. International Journal of Sport Psychology 2000;31:136-55.
133. O'Neal HA, Dunn AL, Martinsen EW. Depression and exercise. International Journal
of Sport Psychology 2000;31:110-35.
134. Oh SW, Yoon YS, Lee ES, Kim WK, Park C, Lee S, Jeong EK, Yoo T. Association
between cigarette smoking and metabolic syndrome: The Korea National Health and
Nutrition Examination Survey. Diabetes Care 2005;28:2064-6.
135. Owen N, Leslie E, Salmon J, Fotheringham MJ. Environmental determinants of
physical activity and sedentary behavior. Exercise and Sport Sciences Reviews
2000;28:153-8.
136. Paluska SA, Schwenk TL. Physical activity and mental health - Current concepts.
Sports Medicine 2000;29:167-80.
137. Park YW, Zhu SK, Palaniappan L, Heshka S, Carnethon MR, Heymsfield SB. The
metabolic syndrome - Prevalence and associated risk factor findings in the US
General introduction and outline of the thesis
47
population from the Third National Health and Nutrition Examination Survey, 1988-
1994. Archives of Internal Medicine 2003;163:427-36.
138. Pate RR. The Evolving Definition of Physical-Fitness. Quest 1988;40:174-9.
139. Pate RR, Pratt M, Blair SN, Haskell WL, Macera CA, Bouchard C, Buchner D,
Ettinger W, Heath GW, King AC, Kriska A, Leon AS, Marcus BH, Morris J,
Paffenbarger RS, Patrick K, Pollock ML, Rippe JM, Sallis J, Wilmore JH. Physical
activity and public health, a recommendation from the Centers for Disease Control
and Prevention and the American College of Sports Medicine. Journal of the
American Medical Association 1995;273: 402-7.
140. Perusse L, Tremblay A, Leblanc C, Bouchard C. Genetic and environmental-
influences on level of habitual physical-activity and exercise participation. American
Journal of Epidemiology 1989;129:1012-22.
141. Plante TG, Rodin J. Physical-fitness and enhanced psychological health. Current
Psychology-Research & Reviews 1990;9:3-24.
142. Prabhakaran D, Anand SS. The metabolic syndrome: an emerging risk state for
cardiovascular disease. Vascular Medicine 2004;9:55-68.
143. Ragland DR. Dichotomizing continuous variables – Dependence of the magnitude of
association and statistical power on the cutpoint. Epidemiology 1992;3:434-40.
144. Rathmann W, Haastert B, Icks A, Giani G, Holle R, Koenig W, Lowel H, Meisinger
C. Prevalence of the metabolic syndrome in the elderly population according to IDF,
WHO, and NCEP definitions and associations with C-reactive protein: The KORA
Survey 2000. Diabetes Care 2006;29:461.
145. Reaven GM. Banting lecture 1988. Role of insulin resistance in human disease.
Diabetes 1988;37:1595-607.
146. Regitz-Zagrosek V, Lehmkuhl E, Weickert MO. Gender differences in the metabolic
syndrome and their role for cardiovascular disease. Clinical Research in Cardiology
2006;95:136-47.
147. Rennie KL, McCarthy N, Yazdgerdi S, Marmot M, Brunner E. Association of the
metabolic syndrome with both vigorous and moderate physical activity. International
Journal of Epidemiology 2003;32:600-6.
148. Reynolds K, He J. Epidemiology of the metabolic syndrome. American Journal of the
Medical Sciences 2005;330:273-9.
General introduction and outline of the thesis
48
149. Reynolds RM, Fischbacher C, Bhopal R, Byrne CD, White M, Unwin N, Walker BR.
Differences in cortisol concentrations in South Asian and European men living in the
United Kingdom. Clinical Endocrinology 2006;64:530-4.
150. Rikli RE, Jones CJ. Senior fitness test manual. Champaign: Human Kinetics; 2001.
151. Rodriguez M, Cohen S. Social support. In: Friedman H, editor. Encyclopedia of
Mental Health. New York: Academic Press; 1998. p. 535-44.
152. Rosell M, de Faire U, Hellenius ML. Low prevalence of the metabolic syndrome in
wine drinkers - Is it the alcohol beverage or the lifestyle? European Journal of
Clinical Nutrition 2003;57:227-34.
153. Rosmond R. Role of stress in the pathogenesis of the metabolic syndrome.
Psychoneuroendocrinology 2005;30:1-10.
154. Rouillier P, Boutron-Ruault MC, Bertrais S, Arnault N, Daudin JJ, Bacro JN,
Hercberg S. Drinking patterns in French adult men - A cluster analysis of alcoholic
beverages and relationship with lifestyle. European Journal of Nutrition 2004;43:69-
76.
155. Sattar N, Gaw A, Scherbakova O, Sattar N, Gaw A, Scherbakova O, Ford I, O'Reilly
DS, Haffner SM, Isles C, Macfarlane PW, Packard CJ, Cobbe SM, Shepherd J.
Metabolic syndrome with and without C-reactive protein as a predictor of coronary
heart disease and diabetes in the West of Scotland Coronary Prevention Study.
Circulation 2003;108:414-9.
156. Schreurs PJG, Van De Willige G, Brosschot JF, Tellegen B, Graus GMH. De
Utrechtse Coping Lijst: UCL, omgaan met problemen en gebeurtenissen, herziene
handleiding (manual of the Utrecht Coping List). Lisse: Swets and Zeitlinger; 1993.
157. Schuit AJ, van Loon AJM, Tijhuis M, Ocke MC. Clustering of lifestyle risk factors in
a general adult population. Preventive Medicine 2002;35:219-24.
158. Scully D, Kremer J, Meade MM, Graham R, Dudgeon K. Physical exercise and
psychological well being: a critical review. British Journal of Sports Medicine
1998;32:111-20.
159. Seematter G, Binnert C, Martin JL, Tappy L. Relationship between stress,
inflammation and metabolism. Current Opinion in Clinical Nutrition and Metabolic
Care 2004;7:169-73.
160. Selye H. The stress of life. New York: McGraw-Hill; 1978.
General introduction and outline of the thesis
49
161. Shapo L, Pomerleau J, Mckee M. Physical inactivity in a country in transition: A
population-based survey in Tirana City, Albania. Scandinavian Journal of Public
Health 2004;32:60-7.
162. Shephard RJ. Demography of health-related fitness levels within and between
populations. In: Bouchard C, Shephard RJ, Stephens T, editors. Physical activity,
fitness, and health: International proceedings and consensus statement. Champaign:
Human Kinetics; 1994. p. 239-56.
163. Shephard RJ. Exercise and relaxation in health promotion. Sports Medicine
1997;23:211-7.
164. Sherbourne CD, Stewart AL. The MOS Social Support Survey. Social Science and
Medicine 1991;32:705-14.
165. Silventoinen K, Pankow J, Jousilahti P, Hu G, Tuomilehto J. Educational inequalities
in the metabolic syndrome and coronary heart disease among middle-aged men and
women. International Journal of Epidemiology 2005;34:327-34.
166. Skinner JS, Oja P. Laboratory and field tests for assessing health-related fitness. In:
Bouchard C, Shephard RJ, Stephens T, editors. Physical activity, fitness, and health:
International proceedings and consensus statement. Champaign: Human Kinetics;
1994. p. 160-79.
167. Stephens T, Caspersen CJ. The demography of physical activity. In: Bouchard C,
Shephard RJ, Stephens T, editors. Physical activity, fitness, and health: International
proceedings and consensus statement. Champaign: Human Kinetics; 1994. p. 204-13.
168. Stern SE, Williams K, Ferrannini E, DeFronzo RA, Bogardus C, Stern MP.
Identification of individuals with insulin resistance using routine clinical
measurements. Diabetes 2005;54:333-9.
169. Sundstrom J, Riserus U, Byberg L, Zethelius B, Lithell H, Lind L. Clinical value of
the metabolic syndrome for long term prediction of total and cardiovascular mortality:
Prospective, population based cohort study. British Medical Journal 2006;332:878-
81.
170. The IDF consensus worldwide definition of the metabolic syndrome [article online],
2005. http://www idf org/webdata/docs/Metabolic_syndrome_definition pdf 2005.
Accessed May 5, 2005.
171. US Department of Health and Human Services. Physical Activity and Health: A
Report of the Surgeon General. Atlanta, GA, USDHSS: Centers for Disease Control
General introduction and outline of the thesis
50
and Prevention, National Center for Chronic Disease Prevention and Health
Promotion; 1996.
172. Van Doornen LJP, De Geus JCN, Orlebeke JF. Aerobic fitness and the physiological
stress response: A critical evaluation. Social Science and Medicine 1988;26:303-7.
173. Vanhees L, Lefevre J, Philippaerts R, Martens M, Huygens W, Troosters T, Beunen
G. How to assess physical activity? How to assess physical fitness? European Journal
of Cardiovascular Prevention & Rehabilitation 2005;12:102-14.
174. Vitaliano PP, Scanlan JM, Zhang JP, Savage MV, Hirsch IB, Siegler IC. A path
model of chronic stress, the metabolic syndrome, and coronary heart disease.
Psychosomatic Medicine 2002;64:418-35.
175. Vuori I, Oja P, Stahl T. Promotion of health-enhancing physical activity - a
preparatory European meeting. Tampere: the UKK Institute for Health Promotion
Research; 1996.
176. Wareham NJ, Hennings SJ, Byrne CD, Hales CN, Prentice AM, Day NE. A
quantitative analysis of the relationship between habitual energy expenditure, fitness
and the metabolic cardiovascular syndrome. British Journal of Nutrition 1998;80:235-
41.
177. Weyerer S, Kupfer B. Physical exercise and psychological health. Sports Medicine
1994;17:108-16.
178. Whaley MH, Kampert JB, Kohl HW, Blair SN. Physical fitness and clustering of risk
factors associated with the metabolic syndrome. Medicine and Science in Sports and
Exercise 1999;31:287-93.
179. Wilson PWF, D'Agostino RB, Parise H, Sullivan L, Meigs JB. Metabolic syndrome as
a precursor of cardiovascular disease and type 2 diabetes mellitus. Circulation
2005;112:3066-72.
180. World Health Organization. Definition, diagnosis and classification of diabetes
mellitus and its complications. Report of a WHO consultation. Geneva: World Health
Organization; 1999.
181. Yoon YS, Oh SW, Baik HW, Park HS, Kim WY. Alcohol consumption and the
metabolic syndrome in Korean adults: the 1998 Korean National Health and Nutrition
Examination Survey. American Journal of Clinical Nutrition 2004;80:217-24.
2.
ORIGINAL RESEARCH

Part 1
Methodological studies on mental health and
metabolic syndrome risk

CHAPTER 2.1.1.
RELIABILITY, EQUIVALENCE AND RESPONDENT PREFERENCE
OF COMPUTERIZED VERSUS PAPER-AND-PENCIL
MENTAL HEALTH QUESTIONNAIRES
K Wijndaele, L Matton, N Duvigneaud, J Lefevre, W Duquet, M Thomis, I De Bourdeaudhuij, R Philippaerts
Computers in Human Behavior, 2007, 23: 1958-1970
Advance Access: http://dx.doi.org/10.1016/j.chb.2006.02.005

Computerized mental health questionnaires
57
Abstract
The purpose of this study was to examine the reliability, equivalence and respondent
preference of a computerized version of the General Health Questionnaire (GHQ-12),
Symptom Checklist (SCL-90-R), Medical Outcomes Study Social Support Survey
(MOSSSS), Perceived Stress Scale (PSS) and Utrecht Coping List (UCL) in comparison with
the original version in a general adult population. Internal consistency, equivalence and
preference between both administration modes was assessed in a group of participants
(n=130) who first completed the computerized questionnaire, followed by the traditional
questionnaire and a post-assessment evaluation measure. Test-retest reliability was measured
in a second group of participants (n=115), who completed the computerized questionnaire
twice. In both groups, the interval between first and second administration was set at one
week. Reliability of the PC versions was acceptable to excellent; internal consistency ranged
from alpha=0.52 to 0.98, ICC’s for test-retest reliability ranged from 0.58 to 0.92.
Equivalence was fair to excellent with ICC’s ranging from 0.54 to 0.91. Interestingly, more
subjects preferred the computerized instead of the traditional questionnaires (computerized:
39.2%, traditional: 21.6%, no preference: 39.2%). These results support the use of
computerized assessment for these five instruments in a general population of adults.
Key words: computer, paper-and-pencil, assessment, reliability, equivalence, questionnaire
Chapter 2.1.1.
58
Introduction
For more than two decades, there is a worldwide incremental use of computer-administered
questionnaires in a wide range of disciplines, including psychological assessment
(Schulenberg & Yutrzenka, 1999; Booth-Kewley, Edwards & Rosenfeld, 1992). This is
associated with the numerous advantages of computerized assessment for the clinician,
researcher and respondent. These include immediacy of data entry avoiding coding errors
(Schmitz, Hartkamp, Brinschwitz, Michalek & Tress, 2000; Klein & Sobol, 1996); possibility
of direct scoring, reporting and interpreting of results (Vispoel, Boo & Bleiler, 2001);
possibility of branching between questions based on the respondents’ prior answers (Webb,
Zimet, Fortenberry & Blythe, 1999); reduction of research time and costs (Lukin, Dowd,
Plake & Kraft, 1985); increase in flexibility e.g. by adding explanatory messages, error
corrections and prompts (Kiesler & Sproull, 1986); protection of respondents’ confidentiality
because no written record exists (Navaline, Snider, Petro, Tobin, Metzger, Alterman et al.,
1994); greater motivation and enjoyment among respondents in comparison with those
completing paper-and-pencil surveys (Rosenfeld, Booth-Kewley & Edwards, 1996). These
plus-points will undoubtedly help to maintain the growth in number of instruments being
computerized.
Some studies, discussing the equivalence between computerized and paper-and-pencil
versions of psychological instruments, support the ‘common assumption’ that both
administration modes yield similar results. Others however demonstrate the opposite
(overview in Ford, Vitelli, & Stuckless, 1996; Booth-Kewley et al., 1992). This contradiction
strongly grounds the American Psychological Association’s (1986) recommendation to
investigate the equivalence between both versions of a psychological questionnaire in every
case. Moreover, equivalence is a sine qua non when norms from a paper-and-pencil version
are to be adapted to the computerized one (Schulenberg & Yutrzenka, 2001; King & Miles,
1995; Hofer, 1985). As stated by Ford et al. (1996), equivalence has to be examined for every
population (clinical, non-clinical,…) separately. Additionally, one can argue that equivalence
also has to be investigated in certain subpopulations (gender, age groups,…) since
respondents’ characteristics such as gender, age, education level and computer experience
appear to act as moderators of administration mode effects (King & Miles, 1995; Wright,
Aquilino & Supple, 1998).
The General Health Questionnaire-12 (Goldberg & Williams, 1988), the Symptom
Checklist (Derogatis, Lippman & Covi, 1973), the Medical Outcomes Study Social Support
Computerized mental health questionnaires
59
Survey (Sherbourne & Stewart, 1991), the Perceived Stress Scale (Cohen & Williamson,
1988) and the Utrecht Coping List (Schreurs, Van De Willige, Brosschot, Tellegen & Graus,
1993) are five psychological instruments used extensively in different kinds of settings,
including epidemiological research in the general population. Literature only reveals two
equivalence studies concerning the computerized and traditional versions of one of these
questionnaires. One study (Franke, 1999), examining the Symptom Checklist, involved 400
university students (24.3 ± 5 years of age) randomly assigned to one out of two groups: a
computer-administered group or a paper-and-pencil administered group. Schmitz et al. (2000)
also studied the equivalence between both administration methods for the Symptom Checklist,
using a similar design in 282 psychosomatic outpatients. Both previous studies used a
randomized design, with subjects only completing one version of the questionnaire. A
disadvantage of this design is the potential bias caused by sampling error, induced by inter-
individual differences between subjects of different administration groups. Furthermore, they
involve two specific populations, which may limit generalizability of the results.
The purpose of the present study was to investigate the reliability and equivalence of
the computerized and traditional versions of the General Health Questionnaire-12, Symptom
Checklist, Medical Outcomes Study Social Support Survey, Perceived Stress Scale and
Utrecht Coping List in a general adult population, using a test-retest design. Furthermore,
respondents’ general preference between both administration modes was examined. It was
hypothesized that the computerized versions of these five psychological questionnaires can
serve as a useful alternative for the original paper-and-pencil versions, and that a general
preference goes out to the computerized version.
Material and methods
Subjects
In this study, 245 adults (18-75 years of age) participated. They were all part of a larger
community sample, randomly selected by the National Institute of Statistics (NIS) for an
epidemiological survey on physical activity, physical fitness and health, carried out by the
Policy Research Centre Sport, Physical Activity and Health in the Flemish part of Belgium.
All subjects were native Dutch speakers and signed an informed consent statement approved
by the Ghent University Hospital Ethics Committee before allocation to the study group.

Chapter 2.1.1.
60
Design
To accomplish the research purpose, subjects were divided into two groups: 1) internal
consistency, equivalence and preference for computerized and/or paper-and-pencil
administration formats were analyzed in group I (n=130); 2) test-retest reliability of the
computerized administration was measured in group II (n=115). In both subsets, the interval
between first and second administration was set at one week, to prevent memory bias. Table 1
presents an overview of the composition of both study samples.
Table 1. Composition of both study samples, according to gender, age, education level and computer experience
Group I (n=130)
Group II (n=115)
Gender (%)
males females
49.2 50.8
51.3 48.7
Age (%)
18-40 years of age 41-60 years of age 61-75 years of age
31.5 41.5 27.0
32.2 34.8 33.0
Education level (%)
low (secondary school or lower) high (university or college)
56.2 43.8
45.2 54.8
Computer experience (%)
low (‘totally disagree’ or ‘disagree’) high (‘agree’ or ‘totally agree’)
25.0 75.0
Procedures
Both groups received the computerized administration of the instruments, without the
knowledge of a possible second administration. This happened in a municipal (sports) hall in
their neighborhood. At the end of this session, subjects were asked to take part in a second,
more extensive investigation in the lab of the Policy Research Centre. Based on their
willingness to visit the lab, they were allocated to one of both groups. Group I, not visiting our
lab, was asked to fill out a few additional paper-and-pencil questionnaires (without further
specification) at home, which would take one hour at most. They received a sealed envelop
and were instructed not to open it during the first seven days and to complete and send back
all questionnaires immediately at the end of this interval. Group II received the computerized
administration for the second time during their lab-visit.
To avoid possible confounding factors, equality between both administration formats
was aimed for as much as possible. The psychological instruments were presented in the same
order (General Health Questionnaire-12, Symptom Checklist, Medical Outcomes Study Social
Computerized mental health questionnaires
61
Support Survey, Perceived Stress Scale and Utrecht Coping List). Font styles were identical,
large and easy to read in both modes. Back-tracking and changing previous answers in the
computerized questionnaire was possible, as is in the paper-and-pencil mode. A progression
indicator, expressed in percentages, at the left bottom side of each screen imitated subjects’
possibility to count the number of items left to fill out in a traditional questionnaire. Both
computerized and paper-and-pencil administration were initiated with the same introductory
text, informing subjects about the anonymity of their answers and instructing them to answer
as correct and honest as possible. Finally, wording was identical for both formats, except for
some mode specific terms (screen, button,…).
The computerized format was developed using Borland Delphin 6 and can be used in
computers with operating system Windows98 and higher. Much attention was paid to user-
friendliness, so that computer-illiterate subjects were able to fill out the questionnaire
independently as well. Items were answered by clicking with the computer mouse on the
appropriate choice field. All items had to be completed, otherwise subjects received an
instruction message and could not pass on to the next screen. For back-tracking and paging
further, two command buttons (‘previous screen’, ‘next screen’) were provided at the bottom
of each screen. Depending on their length, one to five items were presented per screen. After
finishing all items, a final instruction screen appeared, asking subjects to call in a scientific
staff member to save their answers.
The paper-and-pencil package included four items, presented in the sealed envelop in a
well defined order: an instruction paper, the five psychological instruments, a post-assessment
instrument and a stamped and addressed envelop.
Instruments
The instruments applied in this study included the five psychological questionnaires and one
post-assessment measure. Demographic data concerning participants’ gender, age and
education level were obtained through a questionnaire they received during the first testing
session.
General Health Questionnaire (GHQ-12). The GHQ-12 (Goldberg & Williams, 1988) is a
valid, self-report instrument for the detection of mental disorders in the community and non-
psychiatric clinical settings, consisting of 12 items. Since its development, it has been used
extensively all over the world and translated in many languages. Typically for the GHQ-12,
an item is scored as pathologic in case of a change in an individuals’ own normal functioning.
Accordingly, the questionnaire has the following four-point response scale: ‘not at all’, ‘same
Chapter 2.1.1.
62
as usual’, ‘rather more than usual’, or ‘much more than usual’. In this study the bimodal
GHQ-scoring method (0-0-1-1) was applied, as recommended by Goldberg & Williams
(1988). The resulting total scores range from 0 to 12, with higher scores indicating higher
probability of mental health problems. Psychometric literature concerning the GHQ-12
revealed Cronbach’s alpha coefficients, ranging from 0.78 to 0.97 (Koeter & Ormel, 1991;
Goldberg, Gater, Sartorius, Ustun, Piccinelli, Gureje et al., 1997; Schmitz, Kruse & Tress,
1999).
Symptom Checklist (SCL-90-R). A second psychological instrument is the Symptom
Checklist (Derogatis et al., 1973). This worldwide applied instrument is a valid multi-
dimensional self-report scale containing the most important psychopathological complaints in
adolescents, adults and psychiatric (out)patients. Factor-analysis of all 90-items in diverse
normal and psychopathological samples in the Netherlands revealed a different dimensional
structure in the Dutch version of the SCL-90-R (Arrindell & Ettema, 1986). Four scales
remained identically the same, namely phobic anxiety (defined as agoraphobia in the Dutch
version), anxiety, somatization and hostility. Sleeping problems was adopted as a new
dimension, based on high correlations between the items 44, 64 and 66. The depression scale
was modified in the way that four items were added (items 3, 19, 51 and 59) and one item
(item 71) was omitted. In the obsessive-compulsive dimension (defined as insufficiency of
thinking and acting in the Dutch version) item 71 was added and items 3 and 51 were omitted.
Distrust and interpersonal sensitivity (items 6, 7, 8, 18, 21, 34, 35, 36, 37, 41, 43, 61, 68, 69,
73, 76, 83 and 88) was a conglomerate of three factors from the original American
dimensional structure, namely interpersonal sensitivity, paranoid ideation and psychoticism.
Adding scores on all 90 items resulted in a total score, defined as psychoneuroticism. These
newly formed scales strongly resemble those reported in surveys in several American
community samples. All items are rated on a five-point Likert scale of distress, ranging from
‘not at all’ (1) to ‘extremely’ (5). Cronbach’s alphas in the general Dutch population range
from 0.76 (hostility) to 0.97 (psychoneuroticism) (Arrindell & Ettema, 1986).
Medical Outcomes Study Social Support Survey (MOSSSS). The third instrument included
in this study is a 20-item self-administered social support survey incorporating four social
support scales (emotional/informational, tangible, positive interaction, affectionate), one
overall support index and one item concerning the size of social network (Sherbourne &
Stewart, 1991). Although this instrument was originally developed for chronic patients, it has
been used in healthy community samples as well (Allen, Manuel, Legault, Naughton, Pivor &
O’Shea, 2004). Items are rated on a five-point Likert scale of support availability, ranging
Computerized mental health questionnaires
63
from ‘none of the time’ (1) to ‘all the time’ (5), except for the first item concerning the
number of close friends and relatives. Sherbourne & Stewart (1991) reported very high
Cronbach’s alphas, exceeding 0.90 for all support scales.
Perceived Stress Scale (PSS). The PSS is a 10-item instrument developed to measure the
degree to which situations are appraised as stressful (Cohen & Williamson, 1988). It was
designed for use in community samples and assesses to what extent individuals see their lives
as unpredictable, uncontrollable and overloaded. In each case, respondents were asked to
point out how often they felt a certain way on a five-point Likert scale ranging from ‘never’
(1) to ‘very often’ (5). A total score is obtained by adding up all scores after reversion of
response scores on four positively stated items. Cohen & Williamson (1988) reported a
Cronbach’s alpha coefficient of 0.78.
Utrecht Coping List (UCL). The fifth and last psychological measure included in this trial is
the UCL, used to determine coping style. Subjects were asked to rate how frequently they
adopt each of 47 possible ways of coping behavior on a four-point Likert scale ranging from
‘rarely if never’ (1) to ‘very often’ (4). Items are clustered in seven coping scales, namely
Active Dealing, Palliative Reaction, Avoidance, Social Support Seeking, Passive Reaction,
Expression of Emotions and Comforting Thoughts. Cronbach’s alphas in the general Dutch
population range from 0.55 (expression of emotions) to 0.79 (active dealing and social
support seaking) (Schreurs et al., 1993).
Post-assessment measure. A self-constructed post-assessment measure, consisting of two
items was implemented to measure former computer experience and preference between both
administration formats. In the first item, subjects were asked to indicate their level of
agreement (‘totally disagree’, ‘disagree’, ‘agree’, ‘totally agree’) with the following
proposition: ‘I’m familiar with using a computer.’. The second item (‘Which version of the
questionnaire did you like most to complete?’) consisted of two parts. Firstly, subjects had to
check one of the following possibilities: 1) computerized, 2) paper-and-pencil and 3) no
preference. Secondly, a few lines were provided to write down all reasons supporting their
choices.
Statistical analysis
All statistical analyses were performed using the SPSS 12.0 statistical software package
(SPSS, Inc., Chicago, IL). Answers to all 179 items were reduced to 23 scales and one item
(size of social network). For the traditional administration, a scale was not computed if one or
more corresponding items were omitted. Since 10 subjects in group I forgot to send back the
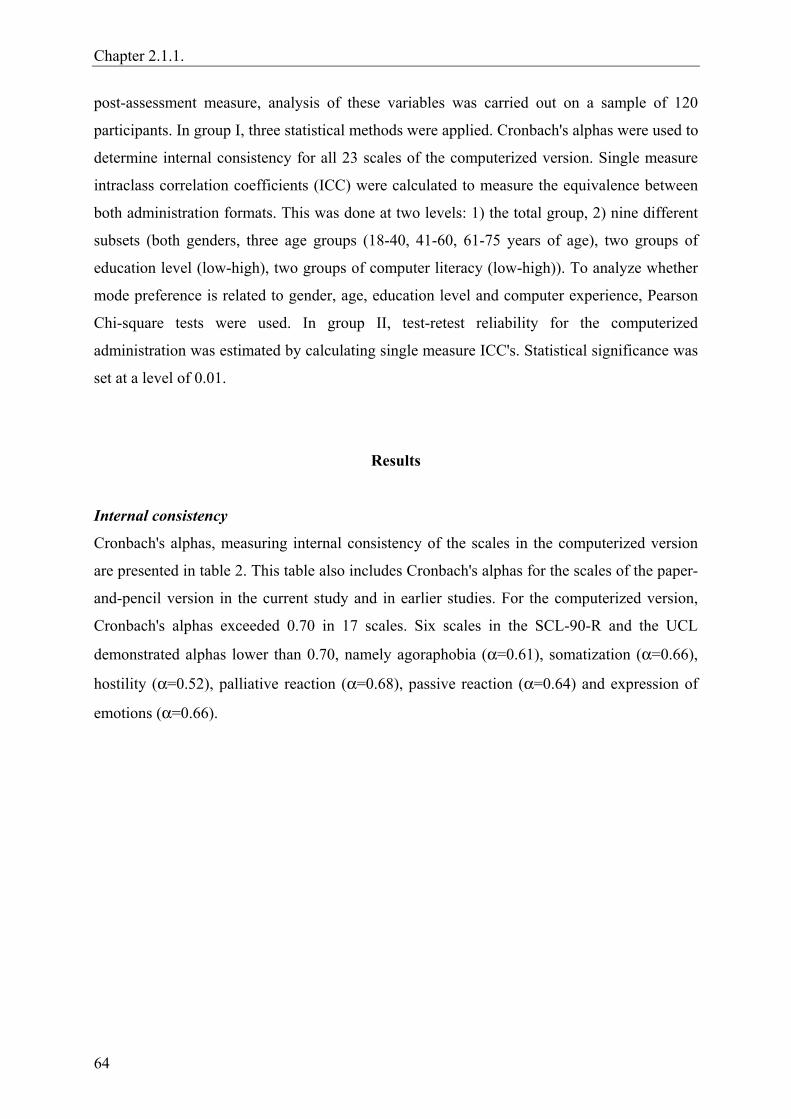
Chapter 2.1.1.
64
post-assessment measure, analysis of these variables was carried out on a sample of 120
participants. In group I, three statistical methods were applied. Cronbach's alphas were used to
determine internal consistency for all 23 scales of the computerized version. Single measure
intraclass correlation coefficients (ICC) were calculated to measure the equivalence between
both administration formats. This was done at two levels: 1) the total group, 2) nine different
subsets (both genders, three age groups (18-40, 41-60, 61-75 years of age), two groups of
education level (low-high), two groups of computer literacy (low-high)). To analyze whether
mode preference is related to gender, age, education level and computer experience, Pearson
Chi-square tests were used. In group II, test-retest reliability for the computerized
administration was estimated by calculating single measure ICC's. Statistical significance was
set at a level of 0.01.
Results
Internal consistency
Cronbach's alphas, measuring internal consistency of the scales in the computerized version
are presented in table 2. This table also includes Cronbach's alphas for the scales of the paper-
and-pencil version in the current study and in earlier studies. For the computerized version,
Cronbach's alphas exceeded 0.70 in 17 scales. Six scales in the SCL-90-R and the UCL
demonstrated alphas lower than 0.70, namely agoraphobia (α=0.61), somatization (α=0.66),
hostility (α=0.52), palliative reaction (α=0.68), passive reaction (α=0.64) and expression of
emotions (α=0.66).

Computerized mental health questionnaires
65
Table 2. Internal consistency (Cronbach's α) of the computerized (PC) and paper-and-pencil (PP) administration modes of five psychological instruments in comparison with internal consistency of the paper-and-pencil mode found in earlier research
Cronbach’s α
Group I
Literature Scales
PC PP PP Reference
GHQ-12
Total score 0.79 0.78 0.78 - 0.97 Koeter & Ormel, 1991; Goldberg et al., 1997; Schmitz et
al., 1999
SCL-90-R
Agoraphobia 0.61 0.69 0.51 - 0.83 Arrindell & Ettema, 1986; Franke & Stäcker, 1995
Anxiety 0.77 0.82 0.75 - 0.88 Arrindell & Ettema, 1986; Franke & Stäcker, 1995
Depression 0.85 0.86 0.91 Arrindell & Ettema, 1986
Somatization 0.66 0.68 0.70 - 0.83 Arrindell & Ettema, 1986; Franke & Stäcker, 1995
Insufficiency 0.79 0.78 0.83 Arrindell & Ettema, 1986
Distrust 0.85 0.86 0.91 Arrindell & Ettema, 1986
Hostility 0.52 0.40 0.62 - 0.76 Arrindell & Ettema, 1986; Franke & Stäcker, 1995
Sleeping problems 0.75 0.81 0.78 Arrindell & Ettema, 1986
Psychoneuroticism 0.94 0.95 0.97 Arrindell & Ettema, 1986
MOSSSS
Tangible 0.88 0.95 0.92 Sherbourne & Stewart, 1991
Affection 0.93 0.93 0.91 Sherbourne & Stewart, 1991
Positive interaction 0.93 0.95 0.94 Sherbourne & Stewart, 1991
Emotional/informational 0.95 0.98 0.96 Sherbourne & Stewart, 1991
Overall support index 0.98 0.98 0.97 Sherbourne & Stewart, 1991
PSS
Total score 0.79 0.83 0.78 Cohen & Williamson, 1988
UCL
Active dealing 0.85 0.87 0.78 - 0.79 Schreurs et al., 1993
Palliative reaction 0.68 0.76 0.71 - 0.76 Schreurs et al., 1993
Avoidance 0.75 0.79 0.65 - 0.74 Schreurs et al., 1993
Social support seeking 0.83 0.88 0.79 Schreurs et al., 1993
Passive reaction 0.64 0.62 0.74 Schreurs et al., 1993
Expression of emotions 0.66 0.74 0.55 - 0.64 Schreurs et al., 1993
Comforting thoughts 0.74 0.70 0.60 - 0.68 Schreurs et al., 1993
Test-retest reliability
Table 3 includes the single measure ICC’s, estimating test-retest reliability of the
computerized questionnaire. They ranged from 0.58 to 0.92. Lowest ICC’s were found for the
SCL-90-R scales, ranging from 0.58 to 0.85. The only scale below 0.60 was the hostility scale

Chapter 2.1.1.
66
Tab
le 3
. Int
racl
ass
corre
latio
n co
effic
ient
s (IC
C) f
or te
st-re
test
relia
bilit
y of
the
com
pute
rized
adm
inist
ratio
n m
ode
(PC
) and
equ
ival
ence
bet
wee
n th
e co
mpu
teriz
ed a
nd p
aper
-and
-pen
cil (
PP) a
dmin
istra
tion
mod
es o
f fiv
e ps
ycho
logi
cal i
nstru
men
ts
E
quiv
alen
ce P
C-P
P IC
C
Gro
up I
Gen
der
A
ge
Educ
atio
n le
vel
Com
pute
r exp
erie
nce
Scal
es/I
tem
Tes
t-re
test
re
liabi
lity
PC
ICC
G
roup
II
Tota
l Sa
mpl
e
Mal
es
Fem
ales
18-4
0 41
-60
61-7
5
Lo
w
Hig
h Lo
w
Hig
h
G
HQ
-12
To
tal s
core
0.
76
0.
75
0.
68
0.79
0.83
0.
71
0.62
0.72
0.
78
0.64
0.
71
SCL
-90-
R
A
gora
phob
ia
0.64
0.59
0.56
0.
59
0.
33
0.33
0.
68
0.
62
0.46
0.
71
0.50
A
nxie
ty
0.67
0.70
0.72
0.
69
0.
71
0.67
0.
72
0.
65
0.74
0.
65
0.75
D
epre
ssio
n 0.
72
0.
70
0.
63
0.71
0.66
0.
77
0.73
0.76
0.
65
0.75
0.
64
Som
atiz
atio
n 0.
67
0.
72
0.
75
0.70
0.71
0.
73
0.74
0.84
0.
60
0.74
0.
75
Insu
ffici
ency
0.
80
0.
79
0.
83
0.75
0.84
0.
74
0.77
0.80
0.
78
0.76
0.
80
Dis
trust
0.77
0.75
0.61
0.
83
0.
81
0.73
0.
69
0.
76
0.73
0.
62
0.72
H
ostil
ity
0.58
0.54
0.67
0.
45
0.
50
0.59
0.
51
0.
67
0.44
0.
49
0.55
Sl
eepi
ng p
robl
ems
0.78
0.80
0.82
0.
80
0.
81
0.82
0.
77
0.
80
0.81
0.
76
0.80
Ps
ycho
neur
otic
ism
0.85
0.81
0.80
0.
80
0.
82
0.88
0.
75
0.
84
0.78
0.
72
0.85
M
OSS
SS
So
cial
net
wor
k si
ze
0.92
0.91
0.85
0.
94
0.
86
0.94
0.
92
0.
90
0.94
0.
80
0.94
Ta
ngib
le
0.83
0.82
0.81
0.
81
0.
77
0.87
0.
76
0.
84
0.71
0.
81
0.81
A
ffec
tion
0.90
0.87
0.85
0.
88
0.
92
0.88
0.
80
0.
88
0.85
0.87
0.
86
Posi
tive
inte
ract
ion
0.87
0.87
0.82
0.
88
0.
87
0.86
0.
87
0.
91
0.76
0.
89
0.87
Em
otio
nal/i
nfor
mat
iona
l 0.
90
0.
86
0.
83
0.88
0.84
0.
87
0.87
0.90
0.
74
0.78
0.
89
Ove
rall
supp
ort i
ndex
0.
92
0.
90
0.
87
0.91
0.89
0.
90
0.91
0.94
0.
78
0.87
0.
91
PSS
To
tal s
core
0.
87
0.
75
0.
67
0.80
0.81
0.
74
0.63
0.72
0.
78
0.67
0.
75
UC
L
A
ctiv
e de
alin
g 0.
78
0.
76
0.
75
0.76
0.84
0.
74
0.72
0.69
0.
83
0.
63
0.80
Pa
lliat
ive
reac
tion
0.74
0.70
0.63
0.
71
0.
72
0.69
0.
73
0.
56
0.77
0.
83
0.65
A
void
ance
0.
73
0.
74
0.
79
0.67
0.83
0.
76
0.62
0.63
0.
87
0.70
0.
75
Soci
al su
ppor
t see
king
0.
83
0.
81
0.
81
0.79
0.74
0.
86
0.73
0.79
0.
81
0.78
0.
80
Pass
ive
reac
tion
0.82
0.77
0.74
0.
79
0.
79
0.77
0.
85
0.
74
0.79
0.
81
0.76
Ex
pres
sion
of e
mot
ions
0.
74
0.
69
0.
62
0.73
0.65
0.
72
0.57
0.59
0.
71
0.75
0.
68
Com
forti
ng th
ough
ts 0.
76
0.
69
0.
72
0.66
0.62
0.
77
0.53
0.65
0.
74
0.63
0.
71
Computerized mental health questionnaires
67
with an ICC of 0.58. Highest ICC’s were for the MOSSSS scales, ranging from 0.83 to 0.92.
In the GHQ-12, MOSSSS and PSS, coefficients all exceeded 0.75.
Equivalence
Equivalence between both administration modes was measured by calculating single measure
ICC’s between corresponding scales at two levels: the total study sample and gender, age,
education and computer experience level subsamples. These results are also shown in table 3.
ICC’s in the total sample were similar with the test-retest coefficients for the PC version in
group II, ranging from 0.54 to 0.91. Lowest ICC’s were again found in two SCL-90-R scales,
namely agoraphobia (ICC=0.59) and hostility (ICC=0.54). All other coefficients had values of
0.69 or higher. In general, the ICC’s determined in the nine different subsamples were very
similar to those in the total group. For the agoraphobia scale, higher ICC’s were found for 61-
75 year old, lower educated and lower computer experienced subjects. For the hostility scale,
higher ICC’s were found for males and lower educated individuals. For palliative reaction and
expression of emotions, a higher ICC was found for high educated participants. No specific
trends between subgroups, were found for any of the instruments studied.
Preference
Participants in group I were asked to complete a post-assessment instrument concerning their
level of familiarity with using a computer and their preference between both administration
modes. Preference to the computerized administration was given by 39.2% of all subjects.
Most important reasons grounding this choice were (in order of frequency): ‘faster’, ‘more
progressive’, ‘more ecological’ and ‘easier’. An equal percentage (39.2%) had no preference,
and 21.6% liked to complete the paper-and-pencil version most. Some of their reasons were:
‘no computer knowledge’, ‘more surveyable’, ‘faster’ and ‘more personal’.
Pearson Chi-squares, testing the relationship of mode preference with gender and
education level, were not significant (gender: χ²=1.849, df=2, P=0.397; education level:
χ²=2.957, df=2, P=0.228). A significant Chi-square was found for age (χ²=16.514, df=4,
P=0.002). Most (62.9%) younger adults (18-40 years of age) preferred the computerized
method (no preference: 31.4%, PP: 5.7%). In the 41-60 year old participants, 49.0% had no
preference, 27.5% chose the computerized mode and 23.5% the paper-and-pencil mode. In the
senior subsample (61-75 years of age) a small majority preferred the paper-and-pencil mode
(PP: 35.2%, PC and no preference: 32.4%). Computer experience was also found to be
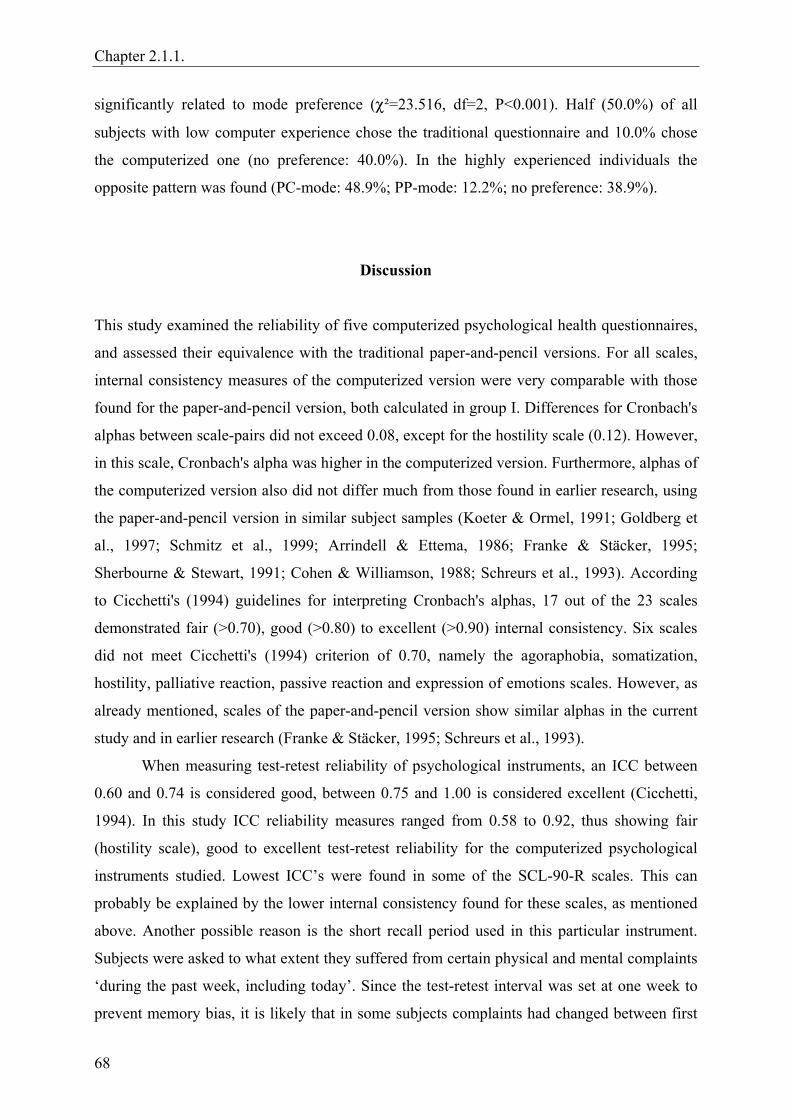
Chapter 2.1.1.
68
significantly related to mode preference (χ²=23.516, df=2, P<0.001). Half (50.0%) of all
subjects with low computer experience chose the traditional questionnaire and 10.0% chose
the computerized one (no preference: 40.0%). In the highly experienced individuals the
opposite pattern was found (PC-mode: 48.9%; PP-mode: 12.2%; no preference: 38.9%).
Discussion
This study examined the reliability of five computerized psychological health questionnaires,
and assessed their equivalence with the traditional paper-and-pencil versions. For all scales,
internal consistency measures of the computerized version were very comparable with those
found for the paper-and-pencil version, both calculated in group I. Differences for Cronbach's
alphas between scale-pairs did not exceed 0.08, except for the hostility scale (0.12). However,
in this scale, Cronbach's alpha was higher in the computerized version. Furthermore, alphas of
the computerized version also did not differ much from those found in earlier research, using
the paper-and-pencil version in similar subject samples (Koeter & Ormel, 1991; Goldberg et
al., 1997; Schmitz et al., 1999; Arrindell & Ettema, 1986; Franke & Stäcker, 1995;
Sherbourne & Stewart, 1991; Cohen & Williamson, 1988; Schreurs et al., 1993). According
to Cicchetti's (1994) guidelines for interpreting Cronbach's alphas, 17 out of the 23 scales
demonstrated fair (>0.70), good (>0.80) to excellent (>0.90) internal consistency. Six scales
did not meet Cicchetti's (1994) criterion of 0.70, namely the agoraphobia, somatization,
hostility, palliative reaction, passive reaction and expression of emotions scales. However, as
already mentioned, scales of the paper-and-pencil version show similar alphas in the current
study and in earlier research (Franke & Stäcker, 1995; Schreurs et al., 1993).
When measuring test-retest reliability of psychological instruments, an ICC between
0.60 and 0.74 is considered good, between 0.75 and 1.00 is considered excellent (Cicchetti,
1994). In this study ICC reliability measures ranged from 0.58 to 0.92, thus showing fair
(hostility scale), good to excellent test-retest reliability for the computerized psychological
instruments studied. Lowest ICC’s were found in some of the SCL-90-R scales. This can
probably be explained by the lower internal consistency found for these scales, as mentioned
above. Another possible reason is the short recall period used in this particular instrument.
Subjects were asked to what extent they suffered from certain physical and mental complaints
‘during the past week, including today’. Since the test-retest interval was set at one week to
prevent memory bias, it is likely that in some subjects complaints had changed between first

Computerized mental health questionnaires
69
and second administration, resulting in lower ICC’s. Stability coefficients for the SCL-90-R
found in this study are comparable with those reported by Arrindell & Ettema (1986), ranging
from 0.68 to 0.85.
Equivalence results for the total group were very promising, ranging from good
(>0.60) to excellent (>0.75) (Cicchetti, 1994). As expected, equivalence in the agoraphobia
and hostility scales was fair, which is probably due to the same factors already mentioned,
namely a lower internal consistency and a short recall period. The majority of studies does not
report separate equivalence results for subgroups. However, since some subgroups were
rather small, these results should be interpreted with caution. In all scales, equivalence level
in the subgroups was similar to that in the total group. A few noticeable differences in
equivalence level between subgroups were found for agoraphobia, hostility, palliative reaction
and expression of emotions. Again the somewhat lower reliability of these scales can
probably account for this. These results support the equivalence of the computerized and hard
copy versions of these questionnaires, not only at the total group but also at the subgroup
level.
Another goal consisted of determining individuals’ preference between both
administration modes. A majority of subjects preferred completing the computerized in
comparison with the traditional questionnaire, which is in line with previous study results
(Lukin et al., 1985; Schulenberg & Yutrzenka, 2001; Vispoel et al., 2001). Remarkable is the
high percentage (39.2%) of participants not able to choose between both modes. A possible
explanation for this could be the fact that the paper-and-pencil questionnaires were completed
in a different, more quiet environment, namely at home. In this way some subjects, not
preferring the computerized administration mode, could have made their choice based on the
association they made between the more quiet environment and the traditional administration
mode, instead of judging the administration mode itself. This hypothesis can be supported by
the relatively high number of environment-related reasons (‘more at ease’, ‘more time to
think’, ‘less cold accommodation’, ‘able to complete at home’) these subjects gave (34%
environment-related versus 66% method-related reasons). Mode preference was not found to
be related with education level or gender, as already proven by Schulenberg & Yutrzenka
(2001) for the Beck Depression Inventory-II. In the literature, arguments exist to support the
positive relationship of computer experience with computer attitudes (Dyck & Smither,
1994). Moreover, it is presumed that a high level of computer experience is the most
determining factor for having positive computer attitudes (Smith, Caputi, Crittenden,
Jayasuriya & Rawstorne, 1999). Our data support this assumption, as individuals showing
Chapter 2.1.1.
70
high levels of computer experience strongly prefer completing the computerized
questionnaires, as opposed to their counterparts who choose the traditional one. Age was also
related to computer preference, however in a negative and gradual way. Generally, the
youngest group was in favor of the PC administered questionnaire, the middle-aged group had
no preference and the oldest group still preferred the traditional questionnaire. In earlier
research (Couper & Rowe, 1996) it has already been shown that the older individuals are, the
less comfortable they are with completing computerized questionnaires. However, it seems
reasonable that in the future computer usage in seniors will be as common as it is now in
younger and middle-aged adults (Cutler, Hendricks & Guyer, 2003). This could indicate that
within a few years computerized psychological assessment may be favorable not only for
clinicians, researchers and younger subjects, but also for middle-aged and senior subjects.
The current study offers several important strengths in comparison with previous
studies. First of all, reliability and equivalence was assessed for five extensively used
psychological health instruments. Until now, four of them had never been an object of
equivalence study. The fifth one had only been studied in a population of students and
psychosomatic outpatients, which leads us to the second major advantage, namely the study
sample. The use of a general population sample aged 18 to 75, with a well-balanced
composition according to age, gender and education level, allows a high level of
generalization of these results.
However, this study also has some limitations. As hypothesized above, the fact that the
traditional questionnaire sets were completed at home could have influenced subjects’
preference choice. The next logical question to be asked is whether equivalence results could
have been affected. This is highly doubtable, since they closely resemble the test-retest
results, measured in group II. A second possible restriction is the concise character of the
instrument used for measuring computer experience. Existing instruments (Potosky & Bobko,
1998; Smith et al., 1999) were not used to avoid subjects being overloaded with
questionnaires, since they already had to fill out five other instruments.
In conclusion, the results in this study indicate that the computerized versions of the
GHQ-12, SCL-90-R, MOSSSS, PSS and UCL are reliable psychological health instruments
that can be used as a practical alternative for the traditional versions in a general population of
adults. Additional research should be conducted to determine their reliability and equivalence
in other (clinical) populations.
Computerized mental health questionnaires
71
Acknowledgements
The Policy Research Centre Sport, Physical Activity and Health is supported by the Flemish
Government.
References
Allen, E.C., Manuel, J.C., Legault, C., Naughton, M.J., Pivor, C., & O’Shea, T.M. (2004).
Perception of child vulnerability among mothers of former premature infants. Pediatrics
113 (2), 267-273.
American Psychological Association (1986). Guidelines for computer based tests and
interpretations. Washington, DC: APA.
Arrindell, W.A., & Ettema, H. (1986). Symptom Checklist, Handleiding bij een
multidimensionele psychopathologie-indicator. Lisse: Swets and Zeitlinger. (Dutch
manual of the SCL-90-R).
Booth-Kewley S., Edwards, J.E., & Rosenfeld P. (1992). Impression management, social
desirability, and computer administration of attitude questionnaires: does the computer
make a difference? Journal of Applied Psychology 77 (4), 562-566.
Cicchetti, D.V. (1994). Guidelines, criteria, and rules of thumb for evaluating normed and
standardized assessment instruments in psychology. Psychological Assessment 6 (4),
284-290.
Cohen, S., & Williamson, G. (1988). Perceived stress in a probability sample of the United
States. In S. Spacapan & S. Oskamp. The social psychology of health: Claremont
Symposium on applied social psychology (pp. 31-67). Newbury Park, CA: Sage.
Couper, M.P., & Rowe, B. (1996). Evaluation of a computer-assisted self-interview
component in a computer-assisted personal interview survey. Public Opinion Quarterly
60, 89-105.
Cutler, S.J., Hendricks, J., & Guyer, A. (2003). Age differences in home computer availability
and use. Journal of Gerontology 58B (5), S271-S280.
Derogatis, L.R., Lippman, R.S., & Covi, L. (1973). SCL-90-R, an outpatient psychiatric
rating scale-preliminary report. Psychopharmacology Bulletin 9, 13-28.
Chapter 2.1.1.
72
Dyck, J.L., & Smither, J.A. (1994). Age differences in computer anxiety: the role of computer
experience, gender and education. Journal of Educational Computing Research 10 (3),
239-248.
Ford, B.D., Vitelli, R., & Stuckless, N. (1996). The effects of computer versus paper-and
pencil administration on measures of anger and revenge with an inmate population.
Computers in Human Behavior 12 (1), 159-166.
Franke, G.H., & Stäcker, K.H. (1995). Reliability and validity of the Symptom Checklist
(SCL-90-R, Derogatis, 1986) in standardized versus homogenous item-blocked
sequence. Diagnostica 41 (4), 349-373.
Franke, G.H. (1999). Effects of computer administration on the Symptom Checklist (SCL-90-
R) with a special focus on the item sequence. Diagnostica 45 (3), 147-153.
Goldberg, D.P., & Williams, P. (1988). A users guide to the General Health Questionnaire.
Windsor: Nfer Nelson.
Goldberg, D.P., Gater, R., Sartorius, N., Ustun, T.B., Piccinelli, M., Gureje, O., & Rutter, C.
(1997). The validity of two versions of the GHQ in the WHO study of mental illness in
general health care. Psychological Medicine 27, 191-197.
Hofer, P.J. (1985). Developing standards for computerized psychological testing. Computers
in Human Behavior 1, 301-315.
Kiesler, S., & Sproull, S. (1986). Response effects in the electronic survey. Public Opinion
Quarterly 50, 402-413.
King, W.C., & Miles, E.W. (1995). A quasi-experimental assessment of the effect of
computerizing noncognitive paper-and-pencil measurements: a test of measurement
equivalence. Journal of Applied Psychology 80 (6), 643-651.
Klein, G., & Sobol, G. (1996). Bias in computer-assisted surveys. IEEE Transactions on
Systems, Man, and Cybernetics – part A: Systems and Humans 26 (5), 566-571.
Koeter, M.W.J., & Ormel, J. (1991). General Health Questionnaire, Nederlandse bewerking,
Handleiding. Lisse: Swets and Zeitlinger. (Dutch manual of the GHQ).
Lukin, M.E., Dowd, E.T., Plake, B.S., & Kraft, R.G. (1985). Comparing computerized versus
traditional psychological assessment. Computers in Human Behavior 1, 49-58.
Navaline, H.A., Snider, E.C., Petro, C.J., Tobin, D., Mezger, D., Alterman, A.I., & Woody,
G.E. (1994). An automated version of the risk assessment battery (RAB): enhancing the
assessment of risk behaviors. AIDS Research and Human Retroviruses 10, supplement
2.

Computerized mental health questionnaires
73
Potosky, D., & Bobko, P. (1998). The computer understanding and experience scale: a self-
report measure of computer experience. Computers in Human Behavior 14 (2), 337-348.
Rosenfeld, P., Booth-Kewley, S., & Edwards, J.E. (1996). Responses on computer surveys:
impression management, social desirability, and the big brother syndrome. Computers in
Human Behavior 12 (2), 263-274.
Schmitz, N., Kruse, J., Tress, W. (1999). Psychometric properties of the General Health
Questionnaire (GHQ-12) in a German primary care sample. Acta Psychiatrica
Scandinavica 100, 462-468.
Schmitz, N., Hartkamp, N., Brinschwitz, C., Michalek, S., & Tress, W. (2000). Comparison
of the standard and the computerized versions of the Symptom Check List (SCL-90-R):
a randomized trial. Acta Psychiatrica Scandinavica 102, 147-152.
Schreurs, P.J.G., Van De Willige, G., Brosschot J.F., Tellegen, B., & Graus, G.M.H. (1993).
De Utrechtse Coping Lijst: UCL, omgaan met problemen en gebeurtenissen, herziene
handleiding. Lisse: Swets and Zeitlinger. (Manual of the Utrecht Coping List).
Schulenberg, S.E., & Yutrzenka, B.A. (1999). The equivalence of computerized and paper-
and-pencil psychological instruments: implications for measures of negative affect.
Behavior Research Methods, Instruments, & Computers 31 (2), 315-321.
Schulenberg, S.E., & Yutrzenka, B.A. (2001). Equivalence of computerized and conventional
versions of the Beck Depression Inventory-II (BDI-II). Current Psychology 20 (3), 216-
230.
Sherbourne, C.D., & Stewart, A.L. (1991). The MOS Social Support Survey. Social Science
and Medicine 32 (6), 705-714.
Smith, B., Caputi, P., Crittenden, N., Jayasuriya, R., & Rawstorne, P. (1999). A review of the
construct of computer experience. Computers in Human Behavior 15, 227-242.
Vispoel, W.P., Boo, J., & Bleiler, T. (2001). Computerized and paper-and-pencil versions of
the Rosenberg Self-Esteem Scale: a comparison of psychometric features and
respondent preferences. Educational and Psychological Measurement 61 (3), 461-474.
Webb, P.M., Zimet, G.D., Fortenberry J.D., & Blythe M.J. (1999). Comparability of a
computer-assisted versus written method for collecting health behavior information
from adolescent patients. Journal of Adolescent Health 24, 383-388.
Wright, D.L., Aquilino, W.S., & Supple, A.J. (1998). A comparison of computer-assisted and
paper-and-pencil self-administered questionnaires in a survey on smoking, alcohol, and
drug use. Public Opinion Quarterly 62, 331-353.

CHAPTER 2.1.2.
A CONTINUOUS METABOLIC SYNDROME RISK SCORE:
UTILITY FOR EPIDEMIOLOGICAL ANALYSES
K Wijndaele, G Beunen, N Duvigneaud, L Matton, W Duquet, M Thomis, J Lefevre, RM Philippaerts
Diabetes Care 2006, 29: 2329 (letter to the editor)

Continuous metabolic syndrome risk score
77
This study was designed to validate a continuous metabolic syndrome risk score (cMSy) using
the International Diabetes Federation (IDF) risk factors (1). Increasing evidence supports
using a cMSy instead of a binary definition for epidemiological analyses: a) dichotomizing
continuous outcome variables reduces statistical power (2); b) cardiovascular risk is a
progressive function of several metabolic syndrome (MSy) risk factors, eliminating the need
to dichotomize these factors (3); c) cardiovascular and diabetes risk increase progressively
with increasing numbers of MSy risk factors, eliminating the need to dichotomize MSy (3-4).
The National Institute of Statistics randomly selected a community sample of 18- to 75-
year-old Flemish adults. In total, 571 men (46.7 ± 11.2y) and 449 women (45.8 ± 10.8y),
tested between October 2002-April 2004, without cardiovascular disease and diabetes, were
included.
Calculation of cMSy involved 2 steps. First, principal component (PC) analysis
(varimax rotation) was applied to the normalized risk factors, to derive PCs representing large
fractions of MSy variance, revealing 2 PCs (eigenvalue ≥1.0). In men, PC1 and PC2
explained 33% and 28% variance respectively (loadings PC1 (PC2): waist circumference:
0.51 (0.55); triglycerides: 0.82 (0.16); HDL-C: -0.85 (0.09); blood pressure: 0.12 (0.72);
glucose: -0.08 (0.73)). In women, PC1 and PC2 explained 33% and 27% variance respectively
(loadings PC1 (PC2): waist circumference: 0.61 (0.54); triglycerides: 0.42 (0.49); HDL-C:
0.12 (-0.90); blood pressure: 0.83 (0.01); glucose: 0.62 (0.04)). Second, cMSy was computed
by summing both individual PC scores, each weighted for the relative contribution of PC1 and
PC2 in the explained variance. Resulting cMSy was 0 ± 1.42 in men and 0 ± 1.41 in women.
cMSy was higher (P<0.001) in subjects with IDF-MSy (men (12.8%): 2.03 ± 1.00;
women (8.5%): 2.63 ± 1.28) versus subjects without (men: -0.30 ± 1.21; women: -0.24 ±
1.16). Moreover, cMSy increased progressively (Tukey-HSD, P<0.001) with increasing
numbers of risk factors in men: 0 (30.1%): -1.21 ± 0.96; 1 (33.8%): -0.26 ± 0.87; 2 (21.2%):
0.67 ± 0.84; 3 (11.2%): 1.76 ± 0.73; ≥4 (3.7%): 3.04 ± 0.94; and women: 0 (47.7%): -0.96 ±
0.79; 1 (28.3%): 0.16 ± 0.82; 2 (16.3%): 1.21 ± 0.82; 3 (5.3%): 2.17 ± 0.81; ≥4 (2.4%): 4.09 ±
0.99.
cMSy is a more appropriate (2-4) and valid alternative for epidemiological analyses,
although the binary definition (1) remains useful for clinical practice.

Chapter 2.1.2.
78
Acknowledgement
The Policy Research Centre SPAH is supported by the Flemish Government.
References
1. The IDF consensus worldwide definition of the metabolic syndrome [article online], 2005.
Available from http://www.idf.org/webdata/docs/Metabolic_syndrome_definition.pdf.
Accessed 5 May 2005
2. Ragland DR: Dichotomizing continuous outcome variables - dependence of the magnitude
of association and statistical power on the cutpoint. Epidemiology 3:434-440, 1992
3. Kahn R, Buse J, Ferrannini E, Stern M: The Metabolic Syndrome: Time for a Critical
Appraisal: Joint statement from the American Diabetes Association and the European
Association for the Study of Diabetes. Diabetes Care 28:2289-2304, 2005
4. Klein BEK, Klein R, Lee KE: Components of the Metabolic Syndrome and Risk of
Cardiovascular Disease and Diabetes in Beaver Dam. Diabetes Care 25:1790-1794, 2002
Part 2
Association studies on physical activity, physical fitness,
stress-related mental health and metabolic syndrome risk

CHAPTER 2.2.1.
ASSOCIATION BETWEEN LEISURE TIME PHYSICAL ACTIVITY
AND STRESS, SOCIAL SUPPORT AND COPING:
A CLUSTER-ANALYTICAL APPROACH
K Wijndaele, L Matton, N Duvigneaud, J Lefevre, I De Bourdeaudhuij, W Duquet, M Thomis, RM Philippaerts
Psychology of Sport and Exercise, in press


Physical activity and stress
83
Abstract
Objectives: Identifying risk clusters of stress, anxiety and depression, taking into
consideration social support and coping, 2 important factors through which leisure time
physical activity may have stress-reducing effects, may lead to more effective exercise
treatment strategies for stress. The aim of this study was to investigate whether stress, social
support and coping cluster in meaningful ways in the general adult population, and whether
individuals of these clusters also differ in anxiety, depression and different types of leisure
time physical activity.
Method: A sample of 2616 Flemish adults, aged 18 to 75, completed 2 self-report
computerized questionnaires on mental health, physical activity and demographic
characteristics in the presence of a scientific staff member.
Results: Three reliable clusters were identified in both males and females. The first cluster
showed high levels of stress and ineffective coping and low levels of social support. The
second one showed the opposite, and the third one an intermediate profile. Anxiety and
depression were highest in persons of the stressed cluster and diminished gradually over the
intermediate and the nonstressed ones. Sports participation and not other types of leisure
time physical activity was significantly lower in the stressed cluster.
Conclusions: By means of cluster analysis, risk groups of stress, anxiety and depression in
adult males and females can be identified. Sports participation may have a beneficial effect
in these at-risk groups.
Key Words: mental health, sports, exercise, anxiety, depression, risk groups
Chapter 2.2.1.
84
Introduction
There is ample evidence to support the beneficial effects of regular physical activity on
health (Paffenbarger, Hyde, Wing, & Hsieh, 1986; U.S. Department of Health and Human
Services, 1996). A sedentary lifestyle increases the risk for physical disorders such as
coronary heart disease, hypertension, colon cancer, diabetes, obesity and stroke (Powell &
Blair, 1994). Furthermore, exercise benefits mental health (Paluska & Schwenk, 2000;
Weyerer & Kupfer, 1994).
Some studies examining the relationship between exercise and stress, showed
evidence for preventive or stress-reducing effects of physical activity (Buckworth &
Dishman, 2002; Scully, Kremer, Meade, Graham, & Dudgeon, 1998). To explain these
effects, different physiological mechanisms are proposed, which mainly focus on the benign
effects of regular aerobic exercise (Weyerer & Kupfer, 1994). However, these physiological
theories alone cannot adequately explain the complex relationship between physical activity
and stress. For example they cannot account for the similar mental health gains that can be
achieved through either aerobic and anaerobic exercise (Plante & Rodin, 1990). This resulted
in the assumption that the benign effects of exercise on stress may also be explained by
psychological processes (Van Doornen, De Geus, & Orlebeke, 1988). However, more
research is needed to fully understand these mechanisms (Plante & Rodin, 1990).
In order to investigate the psychosocial processes through which exercise can result
in stress-reduction, the multidimensional, dynamic and complex nature of stress has to be
taken into consideration (Long, 1993). One mechanism through which physical activity is
thought to have stress-reducing effects is by being able to master difficult exercise tasks.
This results in psychological processes which enhance self-esteem, self-efficacy and energy.
First of all, this may evoke feelings of competence and mastery, through which individuals
appraise a stressor as less threatening or harmful, and as a result perceive less stress (Long,
1993). Secondly, individuals with a higher self-esteem and energy are also believed to use
more active, problem-focused coping strategies (Fleishman, 1984), which are also associated
with lower perceived stress (Muller & Spitz, 2003). This emphasizes the construct of coping
as an important mechanism in the exercise-stress relationship. Furthermore, leisure time
physical activity can be an important source of social support (Ewart, 1985; Mills, 1985).
Evidence exists that leisure-generated social support can have stress-reducing effects. By
engaging in leisure activities that enable social interaction, people develop larger social
Physical activity and stress
85
networks and closer friendships, and hence are more likely to perceive that they will be
supported in case of problems (Coleman & Iso-Ahola, 1993). So, taking into consideration
the concepts of coping and social support can result in a more comprehensive understanding
of the complex relationship between leisure time physical activity and stress. Furthermore, it
is very likely that certain types of leisure physical activity, that can provide social support
and/or can result in a higher self-esteem and self-efficacy, will be more strongly associated
with lower levels of perceived stress than others. Stephens (1988) also found that
recreational physical activity instead of household chores resulted in a better psychological
well-being in four population surveys in the United States and Canada. He concluded that
choice of activity or quality of time may be an important element in achieving psychological
benefits from physical activity. In addition, besides leisure time physical activity, low socio-
economic status may also be related with stress, depression, anxiety and other pathologies
(Baum, Garofalo, & Yali, 1999; Krieger, 2001). Furthermore, evidence exists for an inverse
association between socio-economic status and participation in physical activity (Ford, et al.,
1991; Lynch, Kaplan, & Salonen, 1997). Therefore, the association between physical activity
and stress may be influenced by socio-economic status.
Stress often results in different negative physical and psychological health outcomes
(Carmack, Boudreaux, Amaral-Melendez, Brantley, & de Moor, 1999). Identifying risk
groups showing high levels of perceived stress in the general adult population is therefore a
necessity for the primary and secondary prevention of several (mental) health problems. Two
often described psychological disorders which may originate from stress are depression and
anxiety (Cohen, Kessler, & Underwood, 1995; Lovallo, 1997). Both remain important public
health concerns, because of their high prevalence, large financial burden and detrimental
impact on the quality of life (O'Connor, Raglin, & Martinsen, 2000; O'Neal, Dunn, &
Martinsen, 2000).
Cluster analysis enables us to investigate what levels of perceived stress, social
support and different coping behaviours naturally coexist. An advantage of this technique is
that it can provide new insights in the interactive processes between stress, social support
and coping, through the possible appearance of subgroups with unique or unexpected
profiles. Moreover, the possibility of identifying risk groups for perceived stress by means of
cluster analysis also including social support and coping, may lead to more effective exercise
treatment strategies for stress, because social support and coping are two factors through
which exercise can alter the process of actually perceiving stress.

Chapter 2.2.1.
86
The aim of our study was twofold: (a) firstly, we examined whether perceived stress,
social support and coping cluster in meaningful ways in a large population-based sample of
adult males and females; (b) secondly, we investigated whether these subgroups of
individuals also differ in anxiety, depression and different types of leisure time physical
activity. We also examined whether differences in leisure time physical activity between
clusters of individuals are dependent on socio-economic status.
Method
Participants and Procedure
This study is based on research data collected by the Flemish Policy Research Centre Sport,
Physical Activity and Health (SPAH) between 2002 and 2004. The sample consisted of 2616
adults aged 18 to 75. They were respondents of an epidemiological study of the SPAH,
aiming to investigate the relationship of physical activity, sports participation and physical
fitness with general health parameters in adults. Therefore the National Institute of Statistics
(NIS) randomly selected a community sample of 18- to 75-year-olds in 46 randomly chosen
municipalities in the Flemish part of Belgium. Of all randomly selected individuals invited
to participate in the study, 28% agreed to participate. For the non-responders, the main
reasons for not participating in the study were lack of time (25.9%), health problems
(23.2%), work obligations (14.6%), previous engagements (14.1%), other reasons (22.2%).
This participation rate and the reasons for not participating in the study can probably be
explained by the fact that the test battery was quite comprehensive (given the context of a
large epidemiological study), also including physical measurements of anthropometric,
fitness, and health parameters, besides questionnaires.
Responders included 1430 males (49.3 ± 13.0 yrs of age) and 1186 females (47.8 ±
12.3 yrs of age). The proportion of participants with high education level (university or
college) was 49.6% in males, and 51.4% in females. Concerning occupation status, 68.3% of
males and 62.8% of females were employed. All respondents signed an informed consent
statement approved by the Ethics Committee of the Ghent University. We collected the data
by means of two self-report computerized questionnaires, one on mental health and another
one on physical (in)activity and demographic characteristics. Participants completed them
either in the Policy Research Centre lab or in a municipal (sports) hall in their
neighbourhood, in the presence of a scientific staff member.
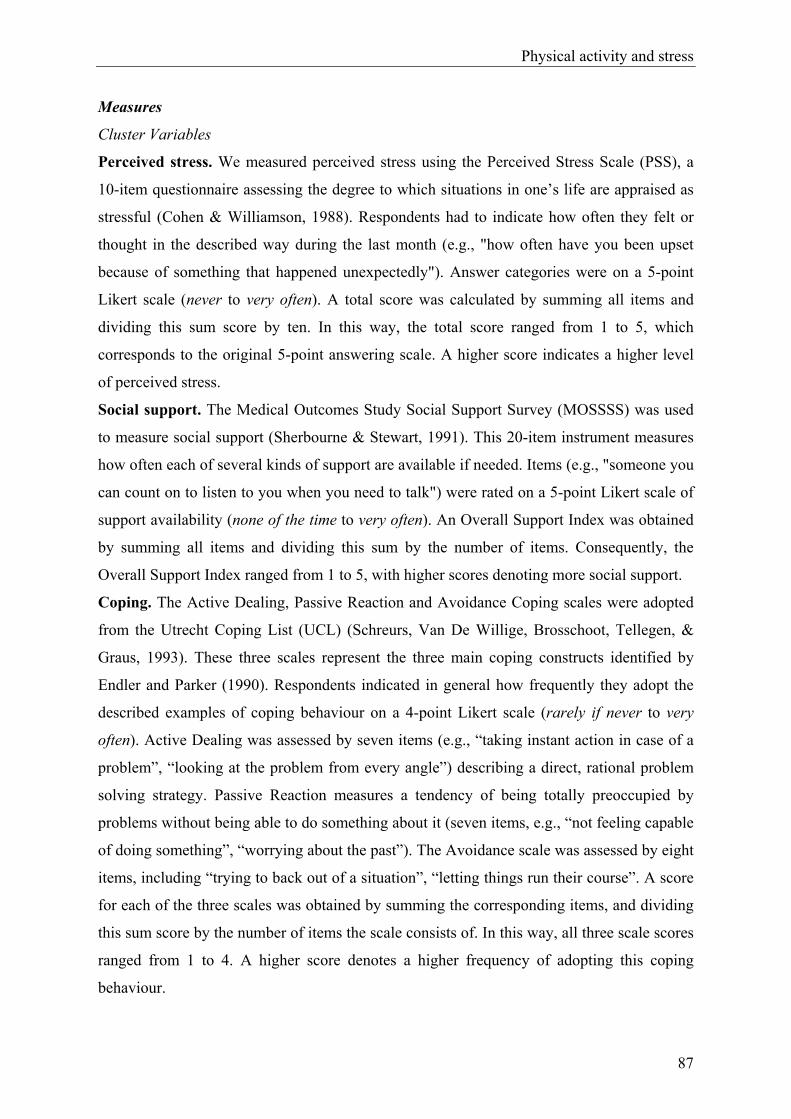
Physical activity and stress
87
Measures
Cluster Variables
Perceived stress. We measured perceived stress using the Perceived Stress Scale (PSS), a
10-item questionnaire assessing the degree to which situations in one’s life are appraised as
stressful (Cohen & Williamson, 1988). Respondents had to indicate how often they felt or
thought in the described way during the last month (e.g., "how often have you been upset
because of something that happened unexpectedly"). Answer categories were on a 5-point
Likert scale (never to very often). A total score was calculated by summing all items and
dividing this sum score by ten. In this way, the total score ranged from 1 to 5, which
corresponds to the original 5-point answering scale. A higher score indicates a higher level
of perceived stress.
Social support. The Medical Outcomes Study Social Support Survey (MOSSSS) was used
to measure social support (Sherbourne & Stewart, 1991). This 20-item instrument measures
how often each of several kinds of support are available if needed. Items (e.g., "someone you
can count on to listen to you when you need to talk") were rated on a 5-point Likert scale of
support availability (none of the time to very often). An Overall Support Index was obtained
by summing all items and dividing this sum by the number of items. Consequently, the
Overall Support Index ranged from 1 to 5, with higher scores denoting more social support.
Coping. The Active Dealing, Passive Reaction and Avoidance Coping scales were adopted
from the Utrecht Coping List (UCL) (Schreurs, Van De Willige, Brosschoot, Tellegen, &
Graus, 1993). These three scales represent the three main coping constructs identified by
Endler and Parker (1990). Respondents indicated in general how frequently they adopt the
described examples of coping behaviour on a 4-point Likert scale (rarely if never to very
often). Active Dealing was assessed by seven items (e.g., “taking instant action in case of a
problem”, “looking at the problem from every angle”) describing a direct, rational problem
solving strategy. Passive Reaction measures a tendency of being totally preoccupied by
problems without being able to do something about it (seven items, e.g., “not feeling capable
of doing something”, “worrying about the past”). The Avoidance scale was assessed by eight
items, including “trying to back out of a situation”, “letting things run their course”. A score
for each of the three scales was obtained by summing the corresponding items, and dividing
this sum score by the number of items the scale consists of. In this way, all three scale scores
ranged from 1 to 4. A higher score denotes a higher frequency of adopting this coping
behaviour.
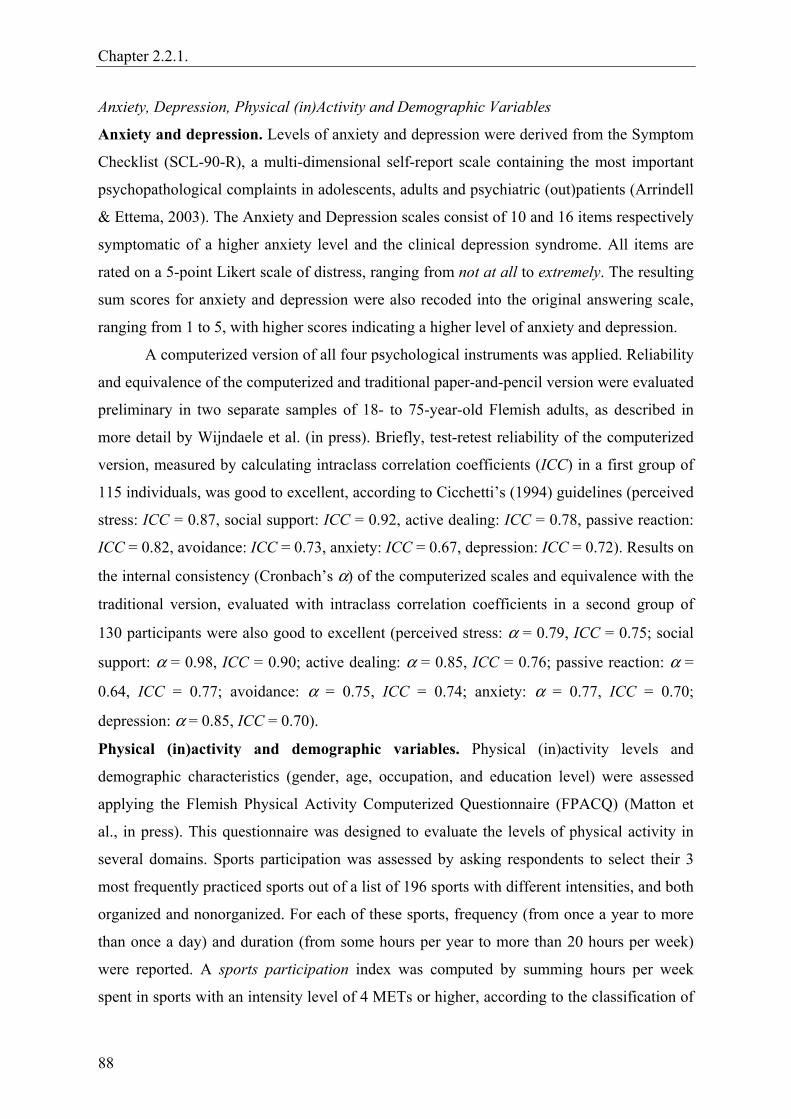
Chapter 2.2.1.
88
Anxiety, Depression, Physical (in)Activity and Demographic Variables
Anxiety and depression. Levels of anxiety and depression were derived from the Symptom
Checklist (SCL-90-R), a multi-dimensional self-report scale containing the most important
psychopathological complaints in adolescents, adults and psychiatric (out)patients (Arrindell
& Ettema, 2003). The Anxiety and Depression scales consist of 10 and 16 items respectively
symptomatic of a higher anxiety level and the clinical depression syndrome. All items are
rated on a 5-point Likert scale of distress, ranging from not at all to extremely. The resulting
sum scores for anxiety and depression were also recoded into the original answering scale,
ranging from 1 to 5, with higher scores indicating a higher level of anxiety and depression.
A computerized version of all four psychological instruments was applied. Reliability
and equivalence of the computerized and traditional paper-and-pencil version were evaluated
preliminary in two separate samples of 18- to 75-year-old Flemish adults, as described in
more detail by Wijndaele et al. (in press). Briefly, test-retest reliability of the computerized
version, measured by calculating intraclass correlation coefficients (ICC) in a first group of
115 individuals, was good to excellent, according to Cicchetti’s (1994) guidelines (perceived
stress: ICC = 0.87, social support: ICC = 0.92, active dealing: ICC = 0.78, passive reaction:
ICC = 0.82, avoidance: ICC = 0.73, anxiety: ICC = 0.67, depression: ICC = 0.72). Results on
the internal consistency (Cronbach’s α) of the computerized scales and equivalence with the
traditional version, evaluated with intraclass correlation coefficients in a second group of
130 participants were also good to excellent (perceived stress: α = 0.79, ICC = 0.75; social
support: α = 0.98, ICC = 0.90; active dealing: α = 0.85, ICC = 0.76; passive reaction: α =
0.64, ICC = 0.77; avoidance: α = 0.75, ICC = 0.74; anxiety: α = 0.77, ICC = 0.70;
depression: α = 0.85, ICC = 0.70).
Physical (in)activity and demographic variables. Physical (in)activity levels and
demographic characteristics (gender, age, occupation, and education level) were assessed
applying the Flemish Physical Activity Computerized Questionnaire (FPACQ) (Matton et
al., in press). This questionnaire was designed to evaluate the levels of physical activity in
several domains. Sports participation was assessed by asking respondents to select their 3
most frequently practiced sports out of a list of 196 sports with different intensities, and both
organized and nonorganized. For each of these sports, frequency (from once a year to more
than once a day) and duration (from some hours per year to more than 20 hours per week)
were reported. A sports participation index was computed by summing hours per week
spent in sports with an intensity level of 4 METs or higher, according to the classification of

Physical activity and stress
89
Ainsworth, Haskell, and Whitt (2000). An active transportation in leisure time index was
obtained by asking the amount of time spent in walking and cycling as transportation in
leisure time, during an average week. A housekeeping and gardening index was calculated
by summing the time spent in low (e.g., cooking, doing the dishes), moderate (e.g.,
hoovering, mowing the lawn) and vigorous intensity (e.g., scrubbing the floor, digging)
activities. A total active leisure time index was composed by summing up the sports
participation, active transportation in leisure time and housekeeping and gardening indices.
A sedentary behaviour index was calculated by summation of the time spent on watching
television or video or playing computer games during an average week day and during an
average weekend day. All (in)activity indices were expressed in hours per week. To classify
respondents based on reaching the norm of engaging in at least 30 minutes of moderate
activity/day (Pate et al., 1995), the sports participation index, time spent in cycling as
transportation in leisure time, and time spent in gardening and housekeeping of vigorous
intensity were summed.
Statistical Analyses
Analyses were carried out using the SPSS 12.0 statistical software package (SPSS, Inc.,
Chicago, IL). In order to evaluate the necessity of gender specific analysis, differences in
mental health (perceived stress, social support, coping behaviour, anxiety and depression)
and physical (in)activity between men and women were evaluated using the independent
samples t test. Pearson bivariate correlation coefficients were calculated between all mental
health variables.
To identify and classify naturally occurring patterns of perceived stress, social
support and coping, we used cluster analysis after transforming scores into standardized z-
scores. This cluster analysis involved three successive steps: (a) K-means cluster analysis
classified cases into n = k clusters by maximizing between-cluster differences and
minimizing within-cluster variance in perceived stress, social support, active dealing, passive
reaction and avoidant coping behaviour scores (Hartigan, 1975); (b) the reliability of the
resulting cluster solution was evaluated by randomly splitting the sample into two
complementary subgroups of 50 % each, and repeating the same clustering procedure in
these subgroups. The level of agreement for cluster allocation of subjects between the total
group and each of the subgroups, was measured by means of the kappa statistic; (c)
multivariate analysis of variance (MANOVA) and one-way analysis of variance (ANOVA)

Chapter 2.2.1.
90
with Tukey’s honestly significant difference (HSD) post hoc test was used to confirm
whether individuals of clusters differed significantly for all variables included in the cluster
analysis.
Differences in anxiety, depression, physical (in)activity and demographic
characteristics between subjects of clusters were analyzed by means of one-way ANOVA,
analysis of covariance (ANCOVA) with age as covariate and the HSD post hoc test, and the
chi-square (χ²) test. Data on occupation status were reduced from five to two levels, namely
being employed (“I have a job”) and being unemployed (“I’m out of work”, “I consciously
do not work”, “I do not work because of a handicap”, “I’m retired”). For education level,
data were reduced from 13 to 2 levels, namely low (secondary school and lower) and high
(university or college) education level.
To examine whether differences in leisure time physical activity between subjects of
clusters are dependent on socio-economic status, two-way ANOVA were executed,
including socio-economic status as one of both categorical factors. In a first set of analyses,
education level was included as a measure of socio-economic status, in a second set of
analyses, occupation status was included as a measure of socio-economic status.
To improve the normality of the distribution of positively skewed variables (anxiety,
depression, sports participation and active transportation) a logistic transformation (log10)
was used. Social support was normalized by raising it to the 5th power. Minimal statistical
significance was set at a level of p < .05.
Results
Gender Differences
As shown in Table 1, men reported significantly more social support, t(2614) = 2.87, p < .01,
and active dealing, t(2614) = 9.27, p < .001, than women did. The latter reported
significantly higher levels of perceived stress, t(2614) = -9.24, p < .001, passive reaction,
t(2614) = -4.18, p < .001, avoidance, t(2614) = -3.93, p < .001, anxiety, t(2614) = -6.32, p <
.001, and depression, t(2614) = -8.05, p < .001. When looking at the differences in physical
activity, men participated significantly more in sports, t(3613) = 8.88, p < .001, and in active
transportation in leisure time, t(2270.46) = 28.08, p < .001. Women however spent more
time in housekeeping and gardening, t(2567) = -19.60, p < .001, and total active leisure time,
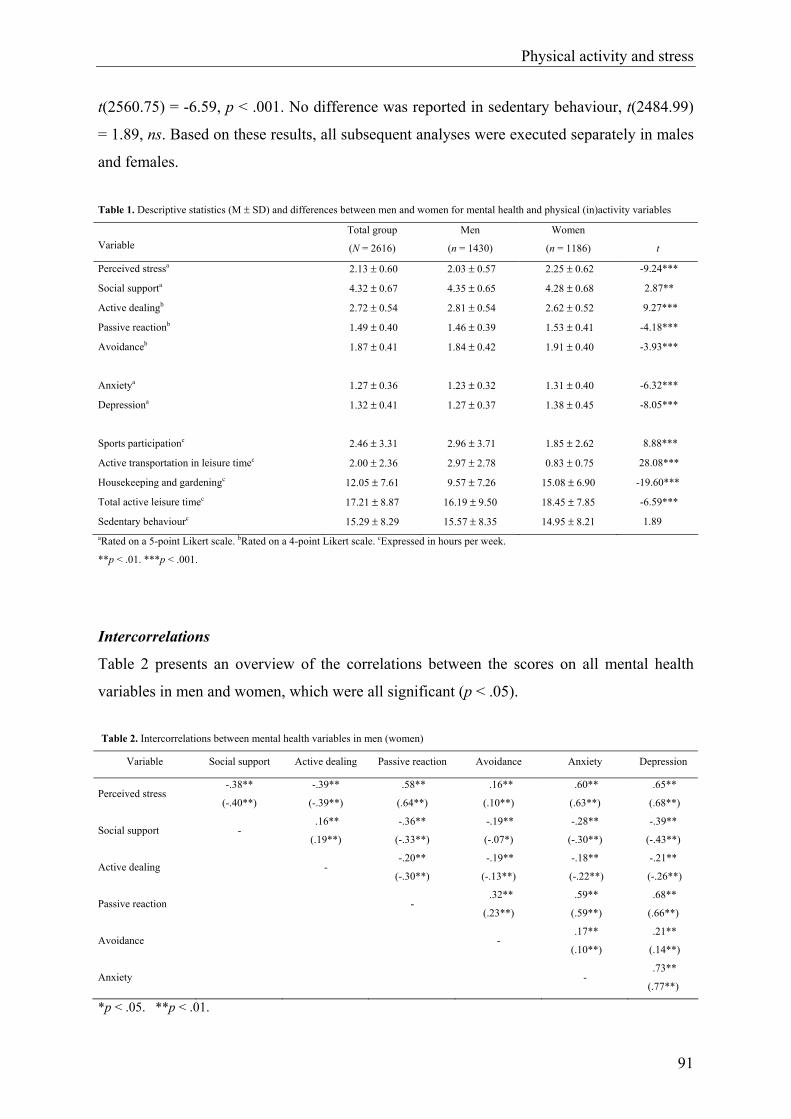
Physical activity and stress
91
t(2560.75) = -6.59, p < .001. No difference was reported in sedentary behaviour, t(2484.99)
= 1.89, ns. Based on these results, all subsequent analyses were executed separately in males
and females. Table 1. Descriptive statistics (M ± SD) and differences between men and women for mental health and physical (in)activity variables
Variable Total group
(N = 2616)
Men
(n = 1430)
Women
(n = 1186)
t
Perceived stressa 2.13 ± 0.60 2.03 ± 0.57 2.25 ± 0.62 -9.24***
Social supporta 4.32 ± 0.67 4.35 ± 0.65 4.28 ± 0.68 2.87**
Active dealingb 2.72 ± 0.54 2.81 ± 0.54 2.62 ± 0.52 9.27***
Passive reactionb 1.49 ± 0.40 1.46 ± 0.39 1.53 ± 0.41 -4.18***
Avoidanceb 1.87 ± 0.41 1.84 ± 0.42 1.91 ± 0.40 -3.93***
Anxietya 1.27 ± 0.36 1.23 ± 0.32 1.31 ± 0.40 -6.32***
Depressiona 1.32 ± 0.41 1.27 ± 0.37 1.38 ± 0.45 -8.05***
Sports participationc 2.46 ± 3.31 2.96 ± 3.71 1.85 ± 2.62 8.88***
Active transportation in leisure timec 2.00 ± 2.36 2.97 ± 2.78 0.83 ± 0.75 28.08***
Housekeeping and gardeningc 12.05 ± 7.61 9.57 ± 7.26 15.08 ± 6.90 -19.60***
Total active leisure timec 17.21 ± 8.87 16.19 ± 9.50 18.45 ± 7.85 -6.59***
Sedentary behaviourc 15.29 ± 8.29 15.57 ± 8.35 14.95 ± 8.21 1.89 aRated on a 5-point Likert scale. bRated on a 4-point Likert scale. cExpressed in hours per week.
**p < .01. ***p < .001.
Intercorrelations
Table 2 presents an overview of the correlations between the scores on all mental health
variables in men and women, which were all significant (p < .05). Table 2. Intercorrelations between mental health variables in men (women)
Variable Social support Active dealing Passive reaction Avoidance Anxiety Depression
Perceived stress -.38**
(-.40**)
-.39**
(-.39**)
.58**
(.64**)
.16**
(.10**)
.60**
(.63**)
.65**
(.68**)
Social support - .16**
(.19**)
-.36**
(-.33**)
-.19**
(-.07*)
-.28**
(-.30**)
-.39**
(-.43**)
Active dealing - -.20**
(-.30**)
-.19**
(-.13**)
-.18**
(-.22**)
-.21**
(-.26**)
Passive reaction - .32**
(.23**)
.59**
(.59**)
.68**
(.66**)
Avoidance - .17**
(.10**)
.21**
(.14**)
Anxiety - .73**
(.77**)
*p < .05. **p < .01.

Chapter 2.2.1.
92
For the variables included in the cluster analysis, the highest correlations were found
in both genders between perceived stress and passive reaction, perceived stress and active
dealing and finally perceived stress and social support (r between .38 and .64, p < .01). All
other intercorrelations were .36 and lower. Correlations between the coping scales were .32
and lower. For anxiety and depression, strong intercorrelations were found in both genders
with perceived stress and passive reaction (r between .59 and .68, p < .01).
Cluster Analyses
The three-cluster solution was identified as the most reliable and adequate representation of
the naturally occurring patterns of perceived stress, social support and the three different
coping behaviours among both male and female participants. After repeating the same
clustering procedure in two randomly selected complementary subgroups of 50% each, the
level of agreement for cluster allocation of subjects between the total group and each of the
subgroups, measured by the kappa statistic, was .87 and .92. in males and .89 and .87 in
females. A significant MANOVA, F (10, 2846) = 369.83, p < .001, F(10, 2358) = 313.83, p
< .001, was found for men and women respectively. Figures 1 and 2 show the cluster profiles
expressed in standardized scores among both genders.
-2-1,5
-1-0,5
00,5
11,5
2
perceivedstress
socialsupport
active dealing passivereaction
avoidance
z-va
lues
Stressed
Nonstressed
Intermediate
Figure 1. Standard scores of clusters on perceived stress, social support and three coping styles in 18- to 75-year old men (n = 1430)
-2-1,5
-1-0,5
00,5
11,5
2
perceivedstress
socialsupport
active dealing passivereaction
avoidance
z-va
lues
Stressed
Nonstressed
Intermediate
Figure 2. Standard scores of clusters on perceived stress, social support and three coping styles in 18- to 75-year old women (n = 1186)

Physical activity and stress
93
Actual values and test statistics are presented in Table 3. The one-way ANOVA with
HSD test revealed that all clusters were significantly different (p < .001) for all five cluster
variables. However when comparing Figure 1 and 2, it shows that similar clusters were
found for men and women. Cluster 1 was labeled stressed ones with low social support and
high passive and avoidant coping behaviour, abbreviated to stressed (15.2% and 22.8% in
men and women respectively). Individuals in Cluster 2 (46.7% and 32.2% in men and
women respectively) were labeled nonstressed ones with high social support and active
coping behaviour, abbreviated to nonstressed. Respondents in Cluster 3 were labeled
intermediates (38.1% and 45.0% in men and women respectively), because they reported
intermediate levels of perceived stress, social support and the three coping behaviours.
Table 3. Actual values (M ± SD) and differences between clusters for cluster variables, anxiety and depression in men and women
Men Women
Variable Stressed
(n = 217)
Nonstressed
(n = 668)
Intermediate
(n = 545) F Stressed
(n = 271)
Nonstressed
(n = 381)
Intermediate
(n = 534) F
Perceived stressa 2.81 ± 0.50a 1.67 ± 0.38b 2.16 ± 0.40c 697.13*** 2.94 ± 0.52a 1.72 ± 0.38b 2.27 ± 0.41c 641.17***
Social supporta 3.75 ± 0.81a 4.69 ± 0.34b
4.18 ± 0.63c 273.71*** 3.51 ± 0.76a 4.57 ± 0.46b 4.46 ± 0.44c 366.95***
Active dealingb 2.46 ± 0.50a 3.14 ± 0.42b 2.55 ± 0.45c 336.89*** 2.33 ± 0.45a 3.09 ± 0.41b 2.43 ± 0.37c 384.76***
Passive reactionb 2.13 ± 0.34a 1.27 ± 0.23b 1.42 ± 0.26c 896.82*** 2.02 ± 0.39a 1.23 ± 0.22b 1.49 ± 0.28c 576.68***
Avoidanceb 2.14 ± 0.42a 1.67 ± 0.34b 1.94 ± 0.38c 160.30*** 2.05 ± 0.41a 1.75 ± 0.38b 1.94 ± 0.37c 50.64***
Anxietya 1.62 ± 0.54a 1.11 ± 0.16b 1.21 ± 0.23c 290.38*** 1.70 ± 0.55a 1.13 ± 0.19b 1.25 ± 0.27c 283.49***
Depressiona 1.80 ± 0.60a 1.12 ± 0.15b 1.24 ± 0.23c 495.52*** 1.88 ± 0.59a 1.14 ± 0.16b 1.30 ± 0.28c 431.13***
Note. Means in the same row that do not share subscripts differ at p < .001 in the Tukey honestly significant difference comparison. aRated on a 5-point Likert scale. bRated on a 4-point Likert scale.
***p < .001.
Differences in Anxiety and Depression Between Clusters
The one-way ANOVA with Tukey’s HSD test revealed that individuals of all three
clusters demonstrated significantly different levels of anxiety, F(2, 1427) = 290.38, p <.001,
F(2, 1183) = 283.49, p < .001, and depression, F(2, 1427) = 495.52, p < .001, F(2, 1183) =
431.13, p < .001, in men and women respectively (see Table 3). The same pattern was found
for both variables among clusters. Subjects in the stressed cluster reported the highest levels
of anxiety and depression, followed by the intermediates, and finally the nonstressed ones,
who were the least anxious and depressed.
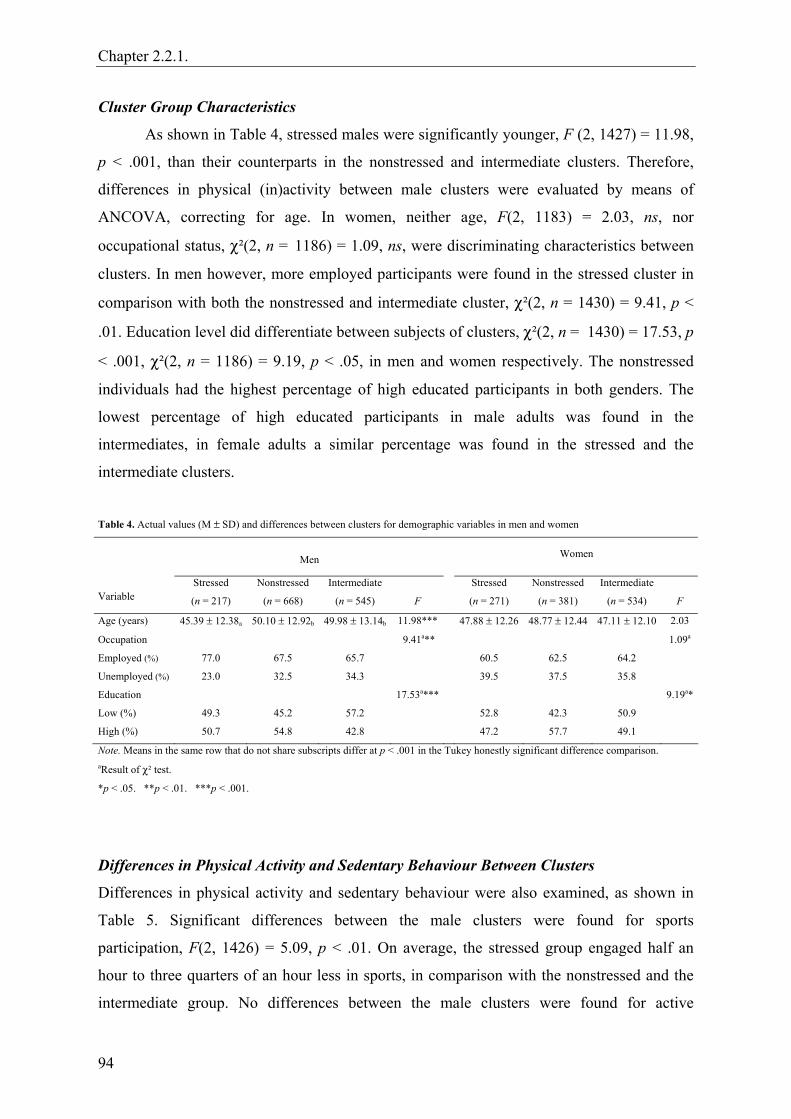
Chapter 2.2.1.
94
Cluster Group Characteristics
As shown in Table 4, stressed males were significantly younger, F (2, 1427) = 11.98,
p < .001, than their counterparts in the nonstressed and intermediate clusters. Therefore,
differences in physical (in)activity between male clusters were evaluated by means of
ANCOVA, correcting for age. In women, neither age, F(2, 1183) = 2.03, ns, nor
occupational status, χ²(2, n = 1186) = 1.09, ns, were discriminating characteristics between
clusters. In men however, more employed participants were found in the stressed cluster in
comparison with both the nonstressed and intermediate cluster, χ²(2, n = 1430) = 9.41, p <
.01. Education level did differentiate between subjects of clusters, χ²(2, n = 1430) = 17.53, p
< .001, χ²(2, n = 1186) = 9.19, p < .05, in men and women respectively. The nonstressed
individuals had the highest percentage of high educated participants in both genders. The
lowest percentage of high educated participants in male adults was found in the
intermediates, in female adults a similar percentage was found in the stressed and the
intermediate clusters.
Table 4. Actual values (M ± SD) and differences between clusters for demographic variables in men and women
Men Women
Variable Stressed
(n = 217)
Nonstressed
(n = 668)
Intermediate
(n = 545)
F
Stressed
(n = 271)
Nonstressed
(n = 381)
Intermediate
(n = 534)
F
Age (years) 45.39 ± 12.38a 50.10 ± 12.92b 49.98 ± 13.14b 11.98*** 47.88 ± 12.26 48.77 ± 12.44 47.11 ± 12.10 2.03
Occupation 9.41a** 1.09a
Employed (%) 77.0 67.5 65.7 60.5 62.5 64.2
Unemployed (%) 23.0 32.5 34.3 39.5 37.5 35.8
Education 17.53a*** 9.19a*
Low (%) 49.3 45.2 57.2 52.8 42.3 50.9
High (%) 50.7 54.8 42.8 47.2 57.7 49.1
Note. Means in the same row that do not share subscripts differ at p < .001 in the Tukey honestly significant difference comparison. aResult of χ² test.
*p < .05. **p < .01. ***p < .001.
Differences in Physical Activity and Sedentary Behaviour Between Clusters
Differences in physical activity and sedentary behaviour were also examined, as shown in
Table 5. Significant differences between the male clusters were found for sports
participation, F(2, 1426) = 5.09, p < .01. On average, the stressed group engaged half an
hour to three quarters of an hour less in sports, in comparison with the nonstressed and the
intermediate group. No differences between the male clusters were found for active

Physical activity and stress
95
transportation in leisure time, housekeeping and gardening, and total active leisure time.
However sedentary behaviour was reported less in the nonstressed males, F(2, 1407) = 5.19,
p < .01, in comparison with their counterparts in both other clusters.
In females, significant differences were found for sports participation, F(2, 1182) =
3.68, p < .05. The pattern found in males reoccurred, with stressed females doing less sports
in comparison with both other clusters. No other differences in physical (in)activity between
subjects of clusters were found in females.
The percentage of participants reaching the norm of at least 30 minutes of moderate
activity/day was not significantly different among the three clusters for men, χ²(2, n = 1429)
= 4.40, ns, nor for women, χ²(2, n = 1184) = 5.13, ns.
Table 5. Actual values (M ± SD) and differences between clusters for physical activity and sedentary behaviour in men and women
Men Women
Variable Stressed
(n = 217)
Nonstressed
(n = 668)
Intermediate
(n = 545)
F
Stressed
(n = 271)
Nonstressed
(n = 381)
Intermediate
(n = 534)
F
Sports participationa 2.48 ± 3.45a 2.94 ± 3.64b 3.17 ± 3.88b 5.09** 1.67 ± 2.88a 1.87 ± 2.32b 1.94 ± 2.68b 3.68*
Active transportation
in leisure timea 2.74 ± 2.42 2.93 ± 2.86 3.10 ± 2.81 1.37 0.78 ± 0.76 0.84 ± 0.73 0.85 ± 0.77 1.37
Housekeeping and
gardeninga 9.57 ± 7.37 9.58 ± 7.35 9.54 ± 7.12 0.25 15.72 ± 6.87 14.45 ± 6.71 15.21 ± 7.01 2.81
Total active leisure
timea 15.28 ± 8.67 16.17 ± 9.76 16.58 ± 9.49 0.39 18.78 ± 7.52 17.96 ± 7.72 18.64 ± 8.10 1.10
Sedentary behavioura 15.96 ± 8.59a 14.93 ± 8.32b 16.19 ± 8.24a 5.19** 15.40 ± 8.83 14.13 ± 7.86 15.30 ± 8.11 2.73
≥ 30 min moderate
activity/day 4.50b 5.13b
Yes (%) 53.9 61.4 61.8 42.4 44.9 50.2
No (%) 46.1 38.6 38.2 57.6 55.1 49.8
Note. Means in the same row that do not share subscripts differ at p < .01 in the Tukey honestly significant difference comparison. aExpressed in hours per week. bResult of χ² test.
*p < .05. **p < .01.
The two-way ANOVA, did not reveal a significant interaction effect of education
level and cluster membership, or occupation status and cluster membership, on any of the
physical activity indexes, in men nor women.

Chapter 2.2.1.
96
Discussion
This study examined whether perceived stress, social support and coping behaviour cluster
in meaningful ways in a population-based sample of 2616 adults aged 18 to 75. Furthermore,
we investigated whether these subgroups of individuals differed in anxiety, depression and
different types of leisure time physical (in)activity. The use of cluster analysis allowed to
take into consideration social support and coping behaviour in the investigation of the
physical activity-stress relationship. By identifying risk groups of stress and mental health
and evaluating their physical (in)activity level, they may be the focus of future exercise
interventions, that are based on the mechanisms of coping and social support.
The bivariate correlation coefficients between all mental health variables were similar
for men and women. For the cluster variables, a strong positive correlation was found
between perceived stress and passive reaction. Active dealing and perceived stress on the
contrary showed a strong negative correlation. Both results are consistent with the findings
of Muller and Spitz (2003) that functional coping strategies (e.g., active coping) are linked to
lower perceived stress, whereas less functional strategies (e.g., denial) are linked to high
perceived stress. Social support also showed a strong negative correlation with perceived
stress, which can be supported by the stress-reducing effect social support is believed to have
(Cohen, Gottlieb, & Underwood, 2000). A very strong positive relation was found between
perceived stress, anxiety and depression. The fact that both mental disorders may originate
from perceived stress, can probably account for this (Cohen et al., 1995; Lovallo, 1997).
Similar high and positive correlation coefficients were seen between passive reaction and
anxiety and depression, as found by Arrindell and Ettema (2003).
An important finding of this study is that three meaningful clusters of stress, social
support and coping can be found in the general adult population. Moreover, repeated cluster
analysis in two randomly selected, complementary subgroups of 50% each, confirmed that
this three-cluster solution is reliable (Landis & Koch, 1977). These three clusters, appearing
in both genders, consisted of: (a) the stressed ones with low social support and high passive
and avoidant coping behaviour; (b) the intermediates; (c) and the nonstressed ones with high
social support and active coping behaviour. Although these clusters are significantly
different, they do show a high level of homogeneity when looking at the way stress, social
support and the three coping behaviours appear together in each cluster. For example, we did
not find any clusters simultaneously showing a high level of stress and social support, or a
Physical activity and stress
97
high level of stress and active coping. The stressed adults display the most negative profile,
followed by the intermediates and the nonstressed adults, who showed the most positive
profile. In addition, subjects in the stressed cluster reported the highest level of anxiety and
depression, which decreased gradually over those in the intermediate and the nonstressed
clusters respectively. This indicates that by making use of cluster analysis based on
perceived stress, social support and coping, risk groups for anxiety and depression can be
identified.
A central question in this study was whether these clusters differed significantly for
several types of leisure physical (in)activity. Sports participation was the only type that could
discriminate between the three subgroups in both men and women. A first important
characteristic of sports participation is that in many cases it is a social activity (Ewart, 1985;
Mills, 1985). Social relationships generated through sports participation and other leisure
time activities can reduce stress, because people become embedded in a larger and stronger
social network and are more likely to perceive that they will be supported in case of
problems (Coleman & Iso-Ahola, 1993). The present results support this idea. The subgroup
with the least sports participation also experienced the lowest level of social support and the
highest level of stress. Moreover, time spent in household chores and active transportation,
two activities with a less social character, did not differ between subgroups. A second feature
of sports activities is that they are generally much more challenging and often show graded
increments of difficulty when practiced regularly in comparison with active transportation or
housekeeping and gardening. In this way, our results may also be supportive of the theory
that individuals who master a difficult exercise task, develop a higher self-esteem and self-
efficacy for strenuous tasks in general. They experience feelings of mastery and competence
through which a potential stressful situation will look less threatening, and lower levels of
perceived stress occur (Long, 1993). Additionally, because feelings of mastery and
competence have to be reinforced frequently (Long, 1993), the continuously challenging
aspect of sports participation also has a major advantage over other types of physical
activity. Furthermore, a higher self-esteem is also associated with greater active, problem-
focused coping, through which coping effectiveness is increased as well (Fleishman, 1984).
In our study, the subgroup with the least sports participation also shows the least active
coping behaviour. Instead, they display a passive and avoidant coping style. Clusters did not
differ in percentage of participants achieving the norm of at least 30 minutes of moderate
activity/day. This was not completely unexpected as this norm is rather based on the

Chapter 2.2.1.
98
physiological benefits of exercise on health (Pate et al., 1995), while the categorization of
our individuals is based on the possible psychosocial mechanisms through which exercise
can result in a better psychological health.
Low socio-economic status is an important predictor of stress, anxiety, depression
and other illness outcomes (Baum et al., 1999; Krieger, 2001). Furthermore, men and women
of a higher socio-economic status in childhood or adulthood spend significantly more time in
leisure time physical activity as an adult (Ford et al., 1991; Lynch, 1997). Therefore, the
association between leisure time physical activity and cluster membership may depend on
socio-economic status. In the present study, no significant interaction effects between socio-
economic status and cluster membership on level of physical activity were found. This
indicates that the association between leisure time physical activity and cluster membership
was similar in low and high socio-economic status subjects, as measured by education level
or occupation status, and therefore independent of socio-economic status. However, since
both socio-economic status indicators were measured in a rather rudimental way, this result
should be interpreted with caution.
Consistent with the literature, women in our study perceived significantly more stress
(Cohen & Williamson, 1988; Matud, 2004), anxiety and depression (Angst et al., 2002;
Bebbington, 1998; Kessler et al., 1994), compared to men. They also reported significantly
less social support and more passive and avoidant coping in comparison with men, who
reported significantly more active dealing (Matud, 2004; Ptacek, Smith, & Zanas, 1992).
This is also reflected by the higher percentage of females in the stressed cluster in
comparison with the corresponding percentage in males. On average, women report one hour
less of sports participation per week in comparison with men, which may partly account for
the higher percentage of stressed women.
Clusters were also compared for demographic characteristics. The stressed males
were significantly younger in comparison with both other subgroups. Cohen and Williamson
(1988) also found a small but significant negative correlation between perceived stress and
age in a sample of adult Americans. Secondly, stressed males showed the highest level of
employment in comparison with both other subgroups, whereas the female clusters did not
differ in employment status. Earlier research revealed that women experience more stressful
events associated with health and family, and men report more stressful events associated
with work and finance (Billings & Moos, 1984), which could explain these results. Finally,
the negative correlation between education level and perceived stress found in earlier
Physical activity and stress
99
research (Cohen & Williamson, 1988) rather consistently reappears in our results, showing
the highest percentage of high educated individuals in the least stressed cluster.
This study shows some important strengths. First of all, the large population-based
sample covered a wide age range (18 to 75 years old) and analyses were carried out in both
genders separately. Secondly, no earlier studies investigated the physical activity-stress
relationship by means of cluster analysis including social support and coping. The use of this
technique offers some promising results. First of all, risk groups of stress, anxiety and
depression can be identified in adult males and females. Furthermore, sports participation
instead of other types of leisure time physical activity can discriminate between these
subgroups. This may be affirmative for the present knowledge of social support and coping
as mechanisms for the psychological benefits of exercise on stress. Based on this
information, it is possible that sports participation and other types of physical activity,
providing sources of higher social support, self-esteem and self-efficacy, could be effective
intervention strategies to deal with stress, anxiety and depression.
However, one limitation of this study is the use of self-report measures. Second,
given the participation rate and the reasons of the non-responders for not participating in the
study, it is possible that the present study sample has a somewhat selective character for both
mental health and participation in leisure time physical activity, which may partially limit
external validity of the results. A more heterogeneous sample, reporting more extreme values
for mental health and leisure time physical activity would probably yield stronger
associations. A third limitation of this study is the cross-sectional design, through which we
cannot make assumptions about temporal sequence. In this study, we present and possibly
found support for theories in literature, suggesting that leisure time physical activity, and
more specifically sports participation, beneficially effect social support and coping
strategies, and consequently stress, anxiety and depression. However, it is possible that the
effects found operate in the opposite direction, because bidirectional relationships can exist
among the variables. First, as suggested by Cohen et al. (1995), individuals perceiving more
stress tend to engage in poor health behaviours, including less frequent physical activity.
Second and consequently, social support and coping behaviour may, indirectly via perceived
stress, influence physical activity participation. Because social support is thought to have a
stress-buffering role (Cohen et al., 2000), individuals lacking social support may perceive
more stress and consequently engage less in physical activity. Similarly, subjects showing
low levels of active coping and high levels of passive and avoidant coping may experience
Chapter 2.2.1.
100
higher levels of stress (Muller & Spitz, 2003) and consequently be more physically inactive.
Third, social support may have a direct, also known as main effect, which includes that
social relationships beneficially influence health-related behaviours, including physical
activity, through mechanisms such as social control; causing positive psychological states
resulting in greater motivation to care for oneself; and providing informational, tangible and
economic services promoting health-enhancing behaviours (Cohen et al., 2000). Therefore,
given the cross-sectional design of this study, the direction of causality of the present results
can probably not be taken for granted. Future longitudinal and intervention studies in
nonclinical and clinical populations are needed to investigate the efficacy of sports
participation as an intervention method. Finally, it would also be useful to further examine
whether some (sports) activities are more efficacious than others.
Acknowledgement
The Policy Research Centre Sport, Physical Activity and Health is supported by the Flemish
Government.
References
Ainsworth, B. E., Haskell, W. L., & Whitt, M. C. (2000). Compendium of physical activity:
An update of activity codes and MET intensities. Medicine and Science in Sports and
Exercise, 32(Suppl.), S498-S516.
Angst, J., Gamma, A., Gastpar, M., Lépine, J. P., Mendlewicz, J., & Tylee, A. (2002).
Gender differences in depression, epidemiological findings from the European
DEPRES I and II studies. European Archives of Psychiatry and Clinical Neuroscience,
252, 201-209.
Arrindell, W. A., & Ettema, H. (2003). Symptom Checklist, manual of a multidimensional
psychopathology indicator. Lisse: Swets and Zeitlinger.
Baum, A., Garofalo, J.P., & Yali A.M. (1999). Socioeconomic status and chronic stress,
does stress account for SES effects on health? Annals of the New York Academy of
Sciences, 869, 131-144.
Bebbington, P. E. (1998). Sex and depression. Psychological Medicine, 28, 1-8.
Physical activity and stress
101
Billings, A. G., & Moos, R. H. (1984). Coping, stress and social resources among adults
with unipolar depression. Journal of Personality and Social Psychology, 46, 877-891.
Buckworth, J., & Dishman, R. K. (2002). Exercise Psychology. Champaign, IL: Human
Kinetics.
Carmack, C. L., Boudreaux, E., Amaral-Melendez, M., Brantley, P. J., & de Moor, C.
(1999). Aerobic fitness and leisure physical activity as moderators of the stress-illness
relation. Annals of Behavioral Medicine, 21, 251-257.
Cicchetti, D. V. (1994). Guidelines, criteria, and rules of thumb for evaluating normed and
standardized assessment instruments in psychology. Psychological Assessment, 6, 284-
290.
Cohen, S., Gottlieb, B. H., & Underwood, L. G. (2000). Social support measurements and
interventions: A guide for health and social scientists. New York: Oxford University
Press.
Cohen, S., Kessler, R. C., & Underwood, L. G. (1995). Measuring stress: A guide for health
and social scientists. New York: Oxford University Press.
Cohen, S., & Williamson, G. (1988). Perceived stress in a probability sample of the United
States. In S. Spacapan, & S. Oskamp (Eds.), The social psychology of health:
Claremont Symposium on applied social psychology (pp. 31-67). Newbury Park, CA:
Sage.
Coleman, D., & Iso-Ahola, S. E. (1993). Leisure and health: The role of social support and
self-determination. Journal of Leisure Research, 25, 111-128.
Endler, N. S., & Parker, J. D. A. (1990). Multidimensional assessment of coping: A critical
evaluation. Journal of Personality and Social Psychology, 58, 844-854.
Ewart, A. (1985). Why people climb: The relationship of participant motives and experience
level to mountaineering. Journal of Leisure Research, 17, 241-250.
Fleishman, J. A. (1984). Personality characteristics and coping patterns. Journal of Health
and Social Behaviour, 37, 229-244.
Ford, E.S., Merritt, R.K., Heath, G.W., et al. (1991). Physical activity behaviors in lower and
higher socioeconomic status populations. American Journal of Epidemiology, 133,
1246-1256.
Hartigan, J. A. (1975). Clustering algorithms. New York: Wiley.

Chapter 2.2.1.
102
Kessler, R. C., Mc Gonagle, K. A., Zhao, S., et al. (1994). Lifetime and 12-month prevalence
of DSM-III-R psychiatric disorders in the United States: Results from the National
Comorbidity Survey. Archives of General Psychiatry, 51, 8-19.
Krieger, N. (2001). Theories for social epidemiology in the 21st century: an ecological
perspective. International Journal of Epidemiology, 30, 668-677.
Landis, R. J., & Koch, G. G. (1977). The measurement of observer agreement for categorical
data. Biometrics, 33, 159-174.
Long, B. C. (1993). A cognitive perspective on the stress-reducing effects of physical
exercise. In P. Seraganian (Ed.), Exercise psychology, the influence of physical
exercise on psychological processes (pp.339-357). New York: Wiley.
Lovallo, W. R. (1997). Stress & health, biological and psychological interactions. Thousand
Oaks: Sage.
Lynch, J.W., Kaplan, G.A., & Salonen, J.T. (1997). Why do poor people behave poorly?
Variation in adult health behaviours and psychosocial characteristics by stages of the
socioeconomic lifecourse. Social Science and Medicine, 44, 809-819.
Matton L, Wijndaele K, Duvigneaud N, Duquet W, Philippaerts R, Thomis M, Lefevre J.
Reliability and validity of the Flemish Physical Activity Computerized Questionnaire
(FPACQ) in adults. Research Quarterly for Exercise and Sport, in press.
Matud, M. P. (2004). Gender differences in stress and coping styles. Personality and
Individual Differences, 37, 1401-1415.
Mills, A. S. (1985). Participation motivations for outdoor recreation: A test of Maslow’s
theory. Journal of Leisure Research, 17, 184-199.
Muller, L., & Spitz, E. (2003). Multidimensional assessment of coping: Validation of the
Brief COPE among French population [French]. Encéphale-Revue de Psychiatrie
Clinique Biologique et Thérapeutique, 29, 507-518.
O’Connor, P. J., Raglin, J. S., & Martinsen, E. W. (2000). Physical activity, anxiety and
anxiety disorders. International Journal of Sport Psychology, 31, 136-155.
O’Neal, H. A., Dunn, A. L., & Martinsen, E. W. (2000). Depression and exercise.
International Journal of Sport Psychology, 31, 110-135.
Paffenbarger, R. S., Hyde, R. T., Wing, A. L., & Hsieh, C. C. (1986). Physical activity, all-
cause mortality, and longevity of college alumni. New England Journal of Medicine,
314, 605-613.

Physical activity and stress
103
Paluska, S. A., & Schwenk, T. L. (2000). Physical activity and mental health: Current
concepts. Sports Medicine, 29, 167-180.
Pate, R. R., Pratt, M., Blair S. N., et al. (1995). Physical activity and public health. Journal
of the American Medical Association, 273, 402-407.
Plante, T. G., & Rodin, J. (1990). Physical fitness and enhanced psychological health.
Current Psychology: Research & Reviews, 9, 3-24.
Powell, K. E., & Blair, S. N. (1994). The public health burdens of sedentary living habits:
Theoretical but realistic estimates. Medicine and Science in Sports and Exercise, 26,
851-856.
Ptacek, J. T., Smith, R. E., & Zanas, J. (1992). Gender, appraisal, and coping: A longitudinal
analysis. Journal of Personality, 60, 747-770.
Schreurs, P. J. G., Van De Willige, G., Brosschot, J. F., Tellegen, B., & Graus, G. M. H.
(1993). The Utrecht Coping List: UCL, coping with problems and events, revised
manual. Lisse: Swets and Zeitlinger.
Scully, D., Kremer, J., Meade, M. M., Graham, R., & Dudgeon, K. (1998). Physical exercise
and psychological well being: A critical review. British Journal of Sports Medicine,
32, 111-120.
Sherbourne, C. D., & Stewart, A. L. (1991). The MOS Social Support Survey. Social
Science and Medicine, 32, 705-714.
Stephens, T. (1988). Physical activity and mental health in the United States and Canada:
Evidence from four population surveys. Preventive Medicine, 17, 35-47.
U.S. Department of Health and Human Services. (1996). Physical Activity and Health: A
Report of the Surgeon General. Atlanta, GA: Centers for Disease Control and
Prevention, National Center for Chronic Disease Prevention and Health Promotion.
Van Doornen, L. J. P., De Geus, J. C. N., & Orlebeke, J.F. (1988). Aerobic fitness and the
physiological stress response: A critical evaluation. Social Science and Medicine, 26,
303-307.
Weyerer, S., & Kupfer, B. (1994). Physical exercise and psychological health. Sports
Medicine, 17, 108-116.
Wijndaele, K., Matton, L., Duvigneaud, N., et al. (in press). Reliability, equivalence and
respondent preference of computerized versus paper-and-pencil mental health
questionnaires. Computers in Human Behavior.

CHAPTER 2.2.2.
SEDENTARY BEHAVIOUR, PHYSICAL ACTIVITY AND
A CONTINUOUS METABOLIC SYNDROME RISK SCORE
IN ADULTS
K Wijndaele, N Duvigneaud, L Matton, W Duquet, M Thomis, G Beunen, J Lefevre, RM Philippaerts
European Journal of Clinical Nutrition, submitted

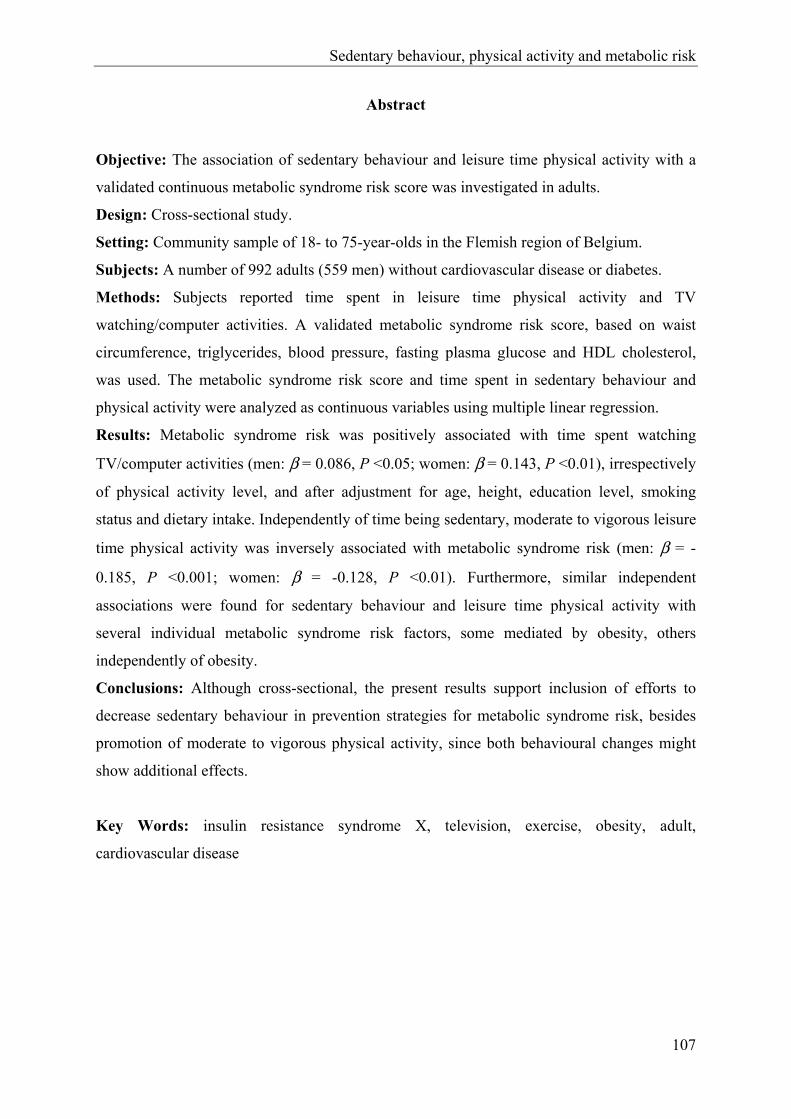
Sedentary behaviour, physical activity and metabolic risk
107
Abstract
Objective: The association of sedentary behaviour and leisure time physical activity with a
validated continuous metabolic syndrome risk score was investigated in adults.
Design: Cross-sectional study.
Setting: Community sample of 18- to 75-year-olds in the Flemish region of Belgium.
Subjects: A number of 992 adults (559 men) without cardiovascular disease or diabetes.
Methods: Subjects reported time spent in leisure time physical activity and TV
watching/computer activities. A validated metabolic syndrome risk score, based on waist
circumference, triglycerides, blood pressure, fasting plasma glucose and HDL cholesterol,
was used. The metabolic syndrome risk score and time spent in sedentary behaviour and
physical activity were analyzed as continuous variables using multiple linear regression.
Results: Metabolic syndrome risk was positively associated with time spent watching
TV/computer activities (men: β = 0.086, P <0.05; women: β = 0.143, P <0.01), irrespectively
of physical activity level, and after adjustment for age, height, education level, smoking
status and dietary intake. Independently of time being sedentary, moderate to vigorous leisure
time physical activity was inversely associated with metabolic syndrome risk (men: β = -
0.185, P <0.001; women: β = -0.128, P <0.01). Furthermore, similar independent
associations were found for sedentary behaviour and leisure time physical activity with
several individual metabolic syndrome risk factors, some mediated by obesity, others
independently of obesity.
Conclusions: Although cross-sectional, the present results support inclusion of efforts to
decrease sedentary behaviour in prevention strategies for metabolic syndrome risk, besides
promotion of moderate to vigorous physical activity, since both behavioural changes might
show additional effects.
Key Words: insulin resistance syndrome X, television, exercise, obesity, adult,
cardiovascular disease
Chapter 2.2.2.
108
Introduction
The clustering of risk factors, known as the metabolic syndrome, predicts the development of
type 2 diabetes (Laaksonen et al, 2002), cardiovascular disease and all-cause mortality
(Lakka et al, 2002) in nondiabetic individuals, and is highly prevalent worldwide (Cameron
et al, 2004). To develop effective primary and secondary prevention strategies for this global
health problem, its modifiable determinants need to be thoroughly understood.
Earlier research revealed an inverse association between physical activity and
metabolic syndrome risk in adults (Ekelund et al, 2005). Furthermore, Owen et al. (2000)
urged the need to study physical activity and sedentary behaviour as 2 distinct classes of
behaviour in finding ways to influence health outcomes, since they may have independent
effects on these health outcomes. Television watching, a common form of sedentary
behaviour, has been associated with elevated risk for type 2 diabetes, obesity (Hu et al, 2003)
and cardiovascular disease markers (Jakes et al, 2003), all independently of physical activity
level. Until now, in a limited number of studies the associations of physical activity and
sedentary behaviour with the metabolic syndrome were simultaneously investigated in adults.
In these studies, a binary definition of the metabolic syndrome was used (Bertrais et al, 2005;
Dunstan et al, 2005; Ford et al, 2005).
However, increasing evidence supports the use of a continuous metabolic syndrome
risk score in epidemiological analyses, instead of a binary definition (Kahn et al, 2005): a)
dichotomizing continuous outcome variables reduces statistical power to detect associations
(Ragland, 1992); b) cardiovascular disease risk is a progressive function of several metabolic
syndrome risk factors, eliminating the need to dichotomize these risk factors using cut points
(Kahn et al, 2005); c) cardiovascular disease and diabetes risk increase progressively with an
increasing number of metabolic syndrome risk factors (Klein et al., 2002), eliminating the
need to dichotomize the presence of the syndrome, e.g. in case of 3 or more present risk
factors (Kahn et al, 2005).
Sedentary behaviour is inversely and physical activity is directly associated with
obesity (Bertrais et al, 2005; Hu et al, 2003). Furthermore, obesity predicts the development
of several individual risk factors of the metabolic syndrome and of type 2 diabetes (Han et al,
2002). Therefore, the association of sedentary behaviour and physical activity with the
individual metabolic syndrome risk factors may (partially) be mediated by obesity.
The aims of the present study were a) to investigate the cross-sectional association of
sedentary behaviour and leisure time physical activity with a validated continuous metabolic

Sedentary behaviour, physical activity and metabolic risk
109
syndrome risk score (Wijndaele et al, 2006) in Flemish adults, aged 18 to 75, and b) to
determine the relationship of sedentary behaviour and leisure time physical activity with each
of the continuous metabolic syndrome risk factors, and the extent to which obesity mediates
this relationship.
Methods
Subjects
Data for this study were collected by the Flemish Policy Research Centre Sport, Physical
Activity and Health (SPAH) between October 2002 and April 2004, in a cross-sectional
survey on the relationship between physical activity, physical fitness and several health
parameters. For this purpose, the National Institute of Statistics randomly selected a
community sample of 18- to 75-year-olds in the Flemish region of Belgium. Subjects were
asked to visit the SPAH examination centre to provide a fasting blood sample, to go through
a medical examination, anthropometric measurements, physical tests, and some
questionnaires. For the present study, participants with complete data for all metabolic
syndrome risk factors, sedentary behaviour, leisure time physical activity, and for all
confounding variables used in the analyses, were included. Participants were excluded in case
of a history or evidence of cardiovascular disease (abnormal heart auscultation or rest
electrocardiogram; sudden death of father or brother before the age of 45, or of mother or
sister before the age of 55; systolic blood pressure >150 mm Hg or diastolic blood pressure
>100 mm Hg; use of antihypertensive or lipid-lowering drugs) or diabetes mellitus.
Consequently, results are based on data of 559 men and 433 nonpregnant women, aged 18 to
75. Prior to participation, subjects gave their written informed consent. The study was
approved by the Ghent University Ethics Committee and performed in accordance with the
Helsinki Declaration.
Data collection
Blood samples. Subjects were asked to fast from 11:00 P.M. the evening before visiting the
laboratory. A sample of fasting blood was taken from an antecubital vein of subjects in
supine position. All samples were stored at 4°C before they were transferred to the lab at
11:00 A.M. They were analyzed before 5:00 P.M. the same day. Triglyceride was analyzed
using the lipase/glycerol kinase/glycerol phosphate oxidase enzymatic method. HDL
Chapter 2.2.2.
110
cholesterol was analyzed using the homogeneous polyanion/cholesterol esterase/oxidase
enzymatic method. Glucose was analyzed using the hexokinase method. Triglycerides, HDL
cholesterol and glucose were measured on an Olympus AU5400 analyzer (Olympus
Diagnostica, Hamburg, Germany). The coefficients of variation between days were 1.4% (at
2.07 mmol/l) for triglycerides, 3.9% (at 2.04 mmol/l) for HDL cholesterol and 2.0% (at 16.71
mmol/l) for glucose.
Blood pressure. A physician measured blood pressure at the left arm of subjects who had
been seated for 10 minutes, using a NOVA Presameter mercury sphygmomanometer (Riester,
Jungingen, Germany). Systolic and diastolic blood pressure were measured 3 times with 1-
minute intervals, and the mean of these 3 measurements was used in analyses.
Anthropometric measurements. Anthropometric measurements were taken by trained staff
with participants barefoot and in underwear. Height was measured using a stadiometer
(Holtain, Crymych, UK) to the nearest 0.1 cm. Waist circumference was measured using a
metal tape (Rosscraft, Surrey, BC, Canada) to the nearest 0.1 cm, at the narrowest level
between lowest ribs and iliac crests, in standing position.
Continuous metabolic syndrome risk score (cMSy). A validated cMSy was calculated as
described in more detail by Wijndaele et al. (2006). In short, cMSy is based on the 5 risk
factors in the definitions of the National Cholesterol Education Program Expert Panel on
Detection, Evaluation, and Treatment of High Blood Cholesterol in Adults (2001) and the
International Diabetes Federation (2005), namely waist circumference, triglycerides, HDL
cholesterol, blood pressure (systolic and diastolic) and fasting plasma glucose. Calculation
involved 3 successive steps: a) all variables were normalized (log10) because of their non-
normal distribution. A blood pressure index was computed by averaging systolic and diastolic
blood pressure; b) principal component analysis with varimax rotation was applied to the
individual risk factors in order to derive components that represent large fractions of the
metabolic syndrome variance, and consequently to give each risk factor the most appropriate
weight in calculating cMSy. This analysis revealed 2 principal components with eigenvalue
≥1.0 in both genders; c) cMSy was computed by summing both individual principal
component scores, each weighted for the relative contribution of principal component 1 and 2
in the explained variance. The resulting cMSy was 0 ± 1.42 in men and 0 ± 1.41 in women.
This score showed high validity in both genders (Wijndaele et al, 2006).
Sedentary behaviour and leisure time physical activity. Sedentary behaviour and leisure
time physical activity were assessed using the Flemish Physical Activity Computerized
Sedentary behaviour, physical activity and metabolic risk
111
Questionnaire (FPACQ). The FPACQ was found to be a reliable and valid questionnaire for
the assessment of different dimensions of physical activity in adults (Matton et al, in press).
Participants were asked to indicate time spent watching television/video or playing
computer games during an average week day and weekend day (from 0 to ≥6 h/day).
Sedentary behaviour time was then calculated by multiplying average week day and weekend
day scores by 5 and 2 respectively, and summing both products.
Levels of leisure time physical activity were evaluated in several domains. Sports
participation was assessed by asking subjects to select their 3 most frequently practiced sports
out of a list of 196 sports. For each of these sports, frequency (from 1 week/year to more than
7 times/week) and duration (from <1 h/week to >20 h/week) were reported. Active
transportation in leisure time was determined by asking time spent in walking and cycling as
transportation in leisure time, during an average week day and weekend day (from 0 to >60
min/day). Furthermore, time spent in housekeeping and gardening activities was assessed
(from 0 to >14 h/week). Intensity level of all activities, expressed in metabolic equivalent
tasks (METs), was defined according to the classification of Ainsworth et al. (2000). Because
of the wide age range of this study population, age-specific MET value cut points (US
Department of Health and Human Services, 1996) were used to calculate 2 different intensity
indexes. Moderate leisure time physical activity was computed by summing the number of
hours per week spent in activities of the following intensity: aged 18-39: 4.8≤ METs ≤7.1;
aged 40-64: 4.5≤ METs ≤5.9; aged 65-75: 3.6≤ METs ≤4.7. Activities of a higher intensity
were included in the vigorous leisure time physical activity index, i.e. aged 18-39: METs
≥7.2; aged 40-64: METs ≥6.0; aged 65-75: METs ≥4.8 (US Department of Health and
Human Services, 1996). Consequently, with these indices the association between cMSy and
moderate and vigorous leisure time physical activity could be analyzed separately, since
vigorous activity entails additional health benefits in comparison with moderate activity (US
Department of Health and Human Services, 1996). By summation of moderate and vigorous
leisure time physical activity, total leisure time physical activity was computed, thus
including activities of at least moderate intensity, as proposed in the current physical activity
recommendations (US Department of Health and Human Services, 1996).
Confounding variables. Several confounding variables were included in analyses, more
specifically age (years), height (cm), education level (low, high), smoking status (current,
former, never), and dietary intake (total energy (kcal), saturated fat (%), sugars (%), fibre
(g/1000kcal), alcohol (%)). Education level was assessed using the FPACQ (Matton et al., in
Chapter 2.2.2.
112
press). Data were reduced from 13 to 2 levels, more specifically secondary school or lower
and university or college. Smoking status was determined by means of the WHO Monica
Smoking Questionnaire (World Health Organization, 1997). To assess dietary intake, subjects
completed a validated 3 day diet record (Deriemaeker et al, 2006). Diet records were
analysed using Becel Nutrition software (Unilever Co., Rotterdam, the Netherlands).
Statistical methods
All analyses were carried out using the SPSS 12.0 statistical software package (SPSS, Inc.,
Chicago, IL). The metabolic syndrome risk factors were logarithmically transformed (log10),
owing to their positively skewed distribution, as shown by the Shapiro-Wilk test for
normality. Differences between sexes were analyzed by means of independent samples t-tests
and Pearson Chi²-tests. All further analyses were carried out in both genders separately.
Separate multiple linear regression models were used to assess the association for the
predictor variables sedentary behaviour and total leisure time physical activity with cMSy.
Model A contained sedentary behaviour or total leisure time physical activity and was
adjusted for all confounding variables, more specifically age, height, education level,
smoking status and dietary intake. Model B was additionally adjusted for the other predictor
variable. In addition, the interaction effect of sedentary behaviour and total leisure time
physical activity with cMSy was verified, adjusted for the same confounding variables. Using
these models, the independent association of both predictor variables with cMSy and their
interaction on cMSy was tested.
To examine the association of moderate leisure time physical activity with cMSy,
participants who reported vigorous leisure time physical activity (men: 57.4%, women:
41.3%) were excluded to minimize the potential confounding effect of vigorous activity.
Subjects reporting moderate leisure time physical activity (men: 63.0%, women: 55.9%) were
excluded in analyzing the association of vigorous leisure time physical activity with cMSy.
Consequently, analyses for moderate leisure time physical activity were executed in 238 men
and 254 women, and analyses for vigorous leisure time physical activity included 207 men
and 191 women. Again, 2 multiple linear regression models were used, more specifically
Model A containing moderate leisure time physical activity or vigorous leisure time physical
activity and adjusted for all confounding variables, and Model B additionally adjusted for
sedentary behaviour.
In assessing the association of sedentary behaviour and total leisure time physical
activity with the individual metabolic syndrome risk factors, 2 models were applied. Model A
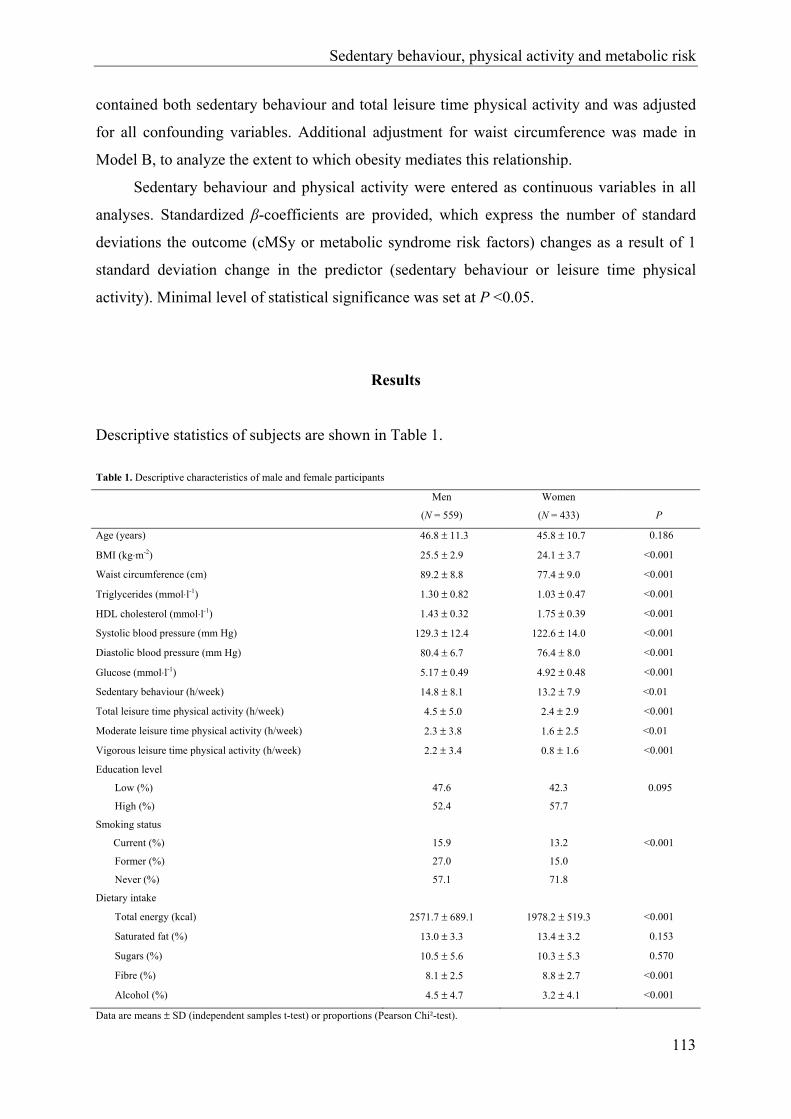
Sedentary behaviour, physical activity and metabolic risk
113
contained both sedentary behaviour and total leisure time physical activity and was adjusted
for all confounding variables. Additional adjustment for waist circumference was made in
Model B, to analyze the extent to which obesity mediates this relationship.
Sedentary behaviour and physical activity were entered as continuous variables in all
analyses. Standardized β-coefficients are provided, which express the number of standard
deviations the outcome (cMSy or metabolic syndrome risk factors) changes as a result of 1
standard deviation change in the predictor (sedentary behaviour or leisure time physical
activity). Minimal level of statistical significance was set at P <0.05.
Results
Descriptive statistics of subjects are shown in Table 1.
Table 1. Descriptive characteristics of male and female participants
Men
(N = 559)
Women
(N = 433)
P
Age (years) 46.8 ± 11.3 45.8 ± 10.7 0.186
BMI (kg⋅m-2) 25.5 ± 2.9 24.1 ± 3.7 <0.001
Waist circumference (cm) 89.2 ± 8.8 77.4 ± 9.0 <0.001
Triglycerides (mmol⋅l-1) 1.30 ± 0.82 1.03 ± 0.47 <0.001
HDL cholesterol (mmol⋅l-1) 1.43 ± 0.32 1.75 ± 0.39 <0.001
Systolic blood pressure (mm Hg) 129.3 ± 12.4 122.6 ± 14.0 <0.001
Diastolic blood pressure (mm Hg) 80.4 ± 6.7 76.4 ± 8.0 <0.001
Glucose (mmol⋅l-1) 5.17 ± 0.49 4.92 ± 0.48 <0.001
Sedentary behaviour (h/week) 14.8 ± 8.1 13.2 ± 7.9 <0.01
Total leisure time physical activity (h/week) 4.5 ± 5.0 2.4 ± 2.9 <0.001
Moderate leisure time physical activity (h/week) 2.3 ± 3.8 1.6 ± 2.5 <0.01
Vigorous leisure time physical activity (h/week) 2.2 ± 3.4 0.8 ± 1.6 <0.001
Education level
Low (%) 47.6 42.3 0.095
High (%) 52.4 57.7
Smoking status
Current (%) 15.9 13.2 <0.001
Former (%) 27.0 15.0
Never (%) 57.1 71.8
Dietary intake
Total energy (kcal) 2571.7 ± 689.1 1978.2 ± 519.3 <0.001
Saturated fat (%) 13.0 ± 3.3 13.4 ± 3.2 0.153
Sugars (%) 10.5 ± 5.6 10.3 ± 5.3 0.570
Fibre (%) 8.1 ± 2.5 8.8 ± 2.7 <0.001
Alcohol (%) 4.5 ± 4.7 3.2 ± 4.1 <0.001
Data are means ± SD (independent samples t-test) or proportions (Pearson Chi²-test).
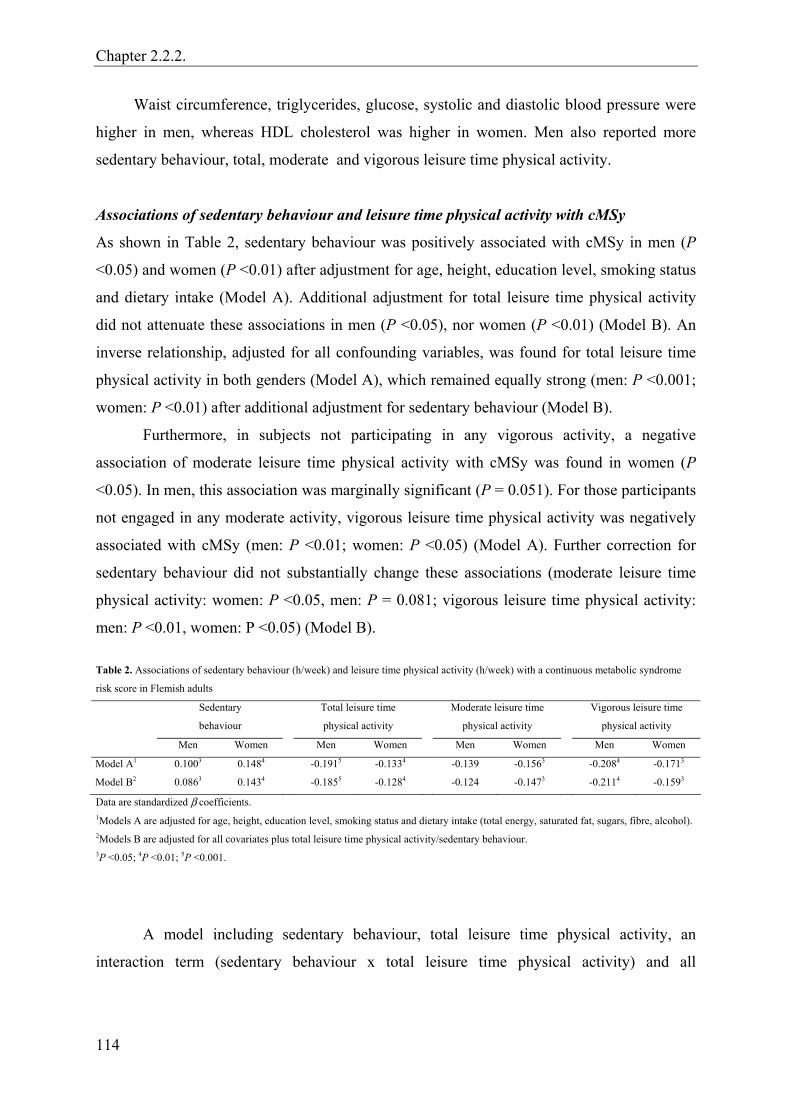
Chapter 2.2.2.
114
Waist circumference, triglycerides, glucose, systolic and diastolic blood pressure were
higher in men, whereas HDL cholesterol was higher in women. Men also reported more
sedentary behaviour, total, moderate and vigorous leisure time physical activity.
Associations of sedentary behaviour and leisure time physical activity with cMSy
As shown in Table 2, sedentary behaviour was positively associated with cMSy in men (P
<0.05) and women (P <0.01) after adjustment for age, height, education level, smoking status
and dietary intake (Model A). Additional adjustment for total leisure time physical activity
did not attenuate these associations in men (P <0.05), nor women (P <0.01) (Model B). An
inverse relationship, adjusted for all confounding variables, was found for total leisure time
physical activity in both genders (Model A), which remained equally strong (men: P <0.001;
women: P <0.01) after additional adjustment for sedentary behaviour (Model B).
Furthermore, in subjects not participating in any vigorous activity, a negative
association of moderate leisure time physical activity with cMSy was found in women (P
<0.05). In men, this association was marginally significant (P = 0.051). For those participants
not engaged in any moderate activity, vigorous leisure time physical activity was negatively
associated with cMSy (men: P <0.01; women: P <0.05) (Model A). Further correction for
sedentary behaviour did not substantially change these associations (moderate leisure time
physical activity: women: P <0.05, men: P = 0.081; vigorous leisure time physical activity:
men: P <0.01, women: P <0.05) (Model B).
Table 2. Associations of sedentary behaviour (h/week) and leisure time physical activity (h/week) with a continuous metabolic syndrome
risk score in Flemish adults
Sedentary
behaviour
Total leisure time
physical activity
Moderate leisure time
physical activity
Vigorous leisure time
physical activity
Men Women Men Women Men Women Men Women
Model A1 0.1003 0.1484 -0.1915 -0.1334 -0.139 -0.1563 -0.2084 -0.1713
Model B2 0.0863 0.1434 -0.1855 -0.1284 -0.124 -0.1473 -0.2114 -0.1593
Data are standardized β coefficients. 1Models A are adjusted for age, height, education level, smoking status and dietary intake (total energy, saturated fat, sugars, fibre, alcohol). 2Models B are adjusted for all covariates plus total leisure time physical activity/sedentary behaviour. 3P <0.05; 4P <0.01; 5P <0.001.
A model including sedentary behaviour, total leisure time physical activity, an
interaction term (sedentary behaviour x total leisure time physical activity) and all
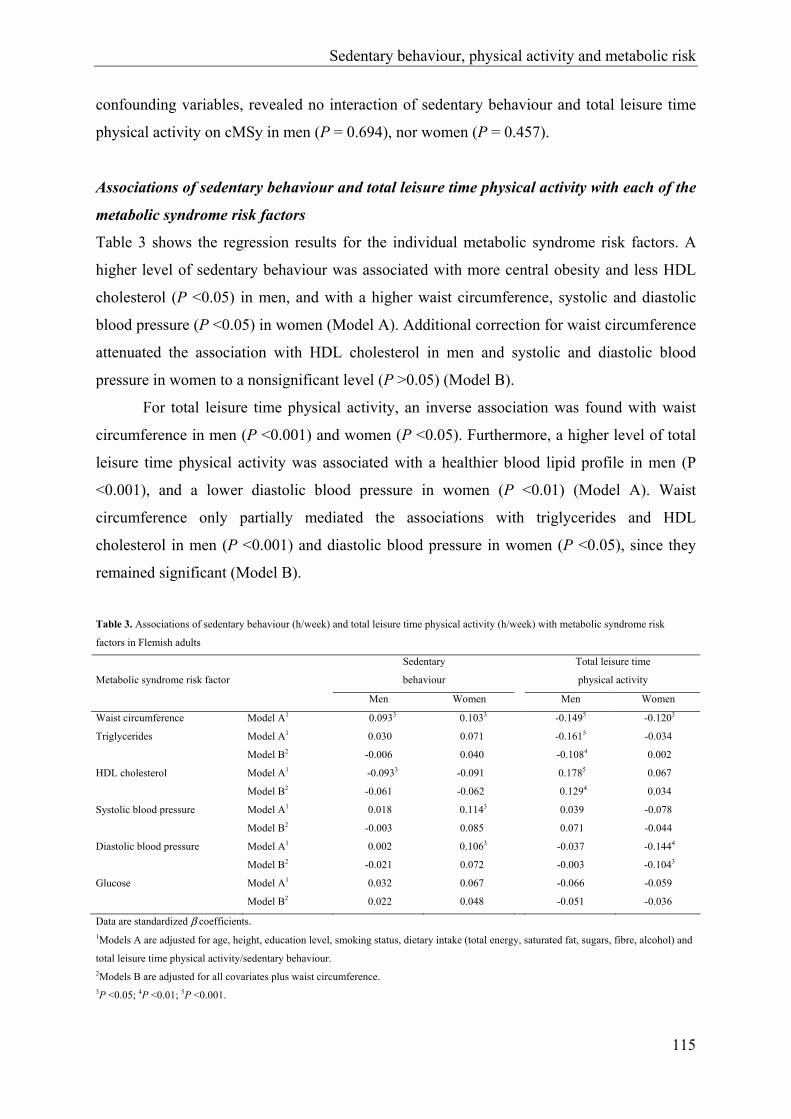
Sedentary behaviour, physical activity and metabolic risk
115
confounding variables, revealed no interaction of sedentary behaviour and total leisure time
physical activity on cMSy in men (P = 0.694), nor women (P = 0.457).
Associations of sedentary behaviour and total leisure time physical activity with each of the
metabolic syndrome risk factors
Table 3 shows the regression results for the individual metabolic syndrome risk factors. A
higher level of sedentary behaviour was associated with more central obesity and less HDL
cholesterol (P <0.05) in men, and with a higher waist circumference, systolic and diastolic
blood pressure (P <0.05) in women (Model A). Additional correction for waist circumference
attenuated the association with HDL cholesterol in men and systolic and diastolic blood
pressure in women to a nonsignificant level (P >0.05) (Model B).
For total leisure time physical activity, an inverse association was found with waist
circumference in men (P <0.001) and women (P <0.05). Furthermore, a higher level of total
leisure time physical activity was associated with a healthier blood lipid profile in men (P
<0.001), and a lower diastolic blood pressure in women (P <0.01) (Model A). Waist
circumference only partially mediated the associations with triglycerides and HDL
cholesterol in men (P <0.001) and diastolic blood pressure in women (P <0.05), since they
remained significant (Model B).
Table 3. Associations of sedentary behaviour (h/week) and total leisure time physical activity (h/week) with metabolic syndrome risk
factors in Flemish adults
Sedentary
behaviour
Total leisure time
physical activity Metabolic syndrome risk factor
Men Women Men Women
Waist circumference Model A1 0.0933 0.1033 -0.1495 -0.1203
Triglycerides Model A1 0.030 0.071 -0.1615 -0.034
Model B2 -0.006 0.040 -0.1084 0.002
HDL cholesterol Model A1 -0.0933 -0.091 0.1785 0.067
Model B2 -0.061 -0.062 0.1294 0.034
Systolic blood pressure Model A1 0.018 0.1143 0.039 -0.078
Model B2 -0.003 0.085 0.071 -0.044
Diastolic blood pressure Model A1 0.002 0.1063 -0.037 -0.1444
Model B2 -0.021 0.072 -0.003 -0.1043
Glucose Model A1 0.032 0.067 -0.066 -0.059
Model B2 0.022 0.048 -0.051 -0.036
Data are standardized β coefficients. 1Models A are adjusted for age, height, education level, smoking status, dietary intake (total energy, saturated fat, sugars, fibre, alcohol) and
total leisure time physical activity/sedentary behaviour. 2Models B are adjusted for all covariates plus waist circumference. 3P <0.05; 4P <0.01; 5P <0.001.

Chapter 2.2.2.
116
Discussion
This study investigated the combined association of television watching or playing computer
games, as a parameter of sedentary behaviour, and leisure time physical activity with a
validated continuous metabolic syndrome risk score (Wijndaele et al, 2006). After adjustment
for confounding factors, sedentary behaviour was associated with a higher metabolic
syndrome risk, independently of total leisure time physical activity, in both genders.
Furthermore, being active in leisure time was related to a lower metabolic syndrome risk in
men and women, independently of sedentary behaviour. These results support the importance
of being moderately to vigorously active in relation with metabolic syndrome risk (Bertrais et
al, 2005; Dunstan et al, 2005). Moreover, both men and women could benefit from spending
less time watching television, and possibly other types of sedentary behaviour, irrespective of
their physical activity level. These additive effects might include major opportunities in order
to reduce metabolic syndrome risk and related disorders. However, further longitudinal
studies or intervention studies are needed to confirm these additive effects. Earlier studies
simultaneously examining these relationships (Dunstan et al, 2005; Ford et al, 2005), which
all used a cross-sectional design, could not reveal a significant association of sedentary
behaviour with the metabolic syndrome, independently of all confounders and total leisure
time physical activity in men. However, Dunstan et al. (2005) did reveal independent
associations for sedentary behaviour and total leisure time physical activity in women.
Differences in results with the present study may partially be explained by the use of a binary
definition of the metabolic syndrome in earlier studies, through which statistical power was
reduced. In addition, Dunstan et al. (2005) did not include domestic activities, of which
exclusion might distort (sex-specific) associations of leisure time physical activity with
cMSy.
After extensive adjustment and exclusion of subjects reporting vigorous activity, the
metabolic syndrome risk score was negatively related to activities of moderate intensity in
women, independently of sedentary behaviour. Furthermore, men and women participating in
vigorous intensity activities only, showed a lower metabolic syndrome risk, independently of
their time being sedentary. Similar results were found by Bertrais et al. (2005), Dunstan et al.
(2005) however did not find significant associations for moderate or vigorous leisure time
physical activity in men.
Since watching television or playing computer games is associated with a higher
metabolic syndrome risk independently of leisure time physical activity, the effect of
Sedentary behaviour, physical activity and metabolic risk
117
sedentary behaviour cannot be explained by the hypothesis that time spent in sedentary
behaviour displaces time spent in moderate to vigorous leisure time physical activity. An
alternative hypothesis suggests that high exposure to high-calory food advertisements
stimulates people eating unhealthy foods while watching television and even increases
overall amount of food consumed a day (Foster et al, 2006). However, the present study
shows an association of sedentary behaviour which is independent of dietary intake. Part of
the physiological basis to explain the independent risk of sedentary behaviour for metabolic
disorders including poor lipid metabolism, might have been found in a high sensitivity of
skeletal muscle lipoprotein lipase to be suppressed by muscle inactivity, a process that does
not seem to occur in even low-intensity activities such as walking (Bey & Hamilton, 2003;
Zderic & Hamilton, 2006).
Sedentary behaviour was associated with unhealthier profiles for waist circumference
and HDL cholesterol in men and waist circumference and blood pressure in women,
independently of total leisure time physical activity. Since obesity predicts the development
of low HDL cholesterol, hypertriglyceridemia, hypertension and type 2 diabetes (Han et al,
2002), additional adjustment for waist circumference was made. Both the association with
HDL cholesterol in men and blood pressure in women was mediated by waist circumference,
which may suggest a central role of obesity in the pathway between sedentary behaviour and
these individual metabolic syndrome risk factors.
This is the first study to examine the combined association of sedentary behaviour and
leisure time physical activity with a continuous metabolic syndrome risk score. Although the
use of cMSy implies population-specific results, it is more appropriate than using categorical
definitions of the metabolic syndrome for epidemiological analyses (Kahn et al, 2005;
Ragland, 1992; Wijndaele et al, 2006). Additional strengths of this study are the gender-
specific analyses, covering a wide age range. Furthermore, extensive adjustment was made
for confounding variables, including dietary intake. Finally, leisure time physical activity was
assessed in different domains, including household-related activities.
However, some limitations of this study should be addressed. First of all, because of
the cross-sectional design, causality of relationships cannot be determined. However, the
exclusion of subjects with a history/evidence of CVD and diabetes reduced the confounding
influence of health status on time spent in sedentary behaviour and leisure time physical
activity. Secondly, data on sedentary behaviour and leisure time physical activity are reported
instead of objectively measured, through which (gender differences in) report imprecision
might have influenced the results. Future longitudinal studies, applying objective physical
Chapter 2.2.2.
118
(in)activity measures are needed to confirm a cause and effect relationship between sedentary
behaviour, leisure time physical activity and cMSy.
In conclusion, the present study indicates that high amounts of sedentary behaviour
are associated with a higher metabolic syndrome risk in both genders, whereas being
moderately to vigorously active is related with a lower risk. Moreover, these associations are
independent, which may indicate that both behaviours show additional effects. Furthermore,
similar independent relationships exist with several individual metabolic syndrome risk
factors. Although cross-sectional, the present results support inclusion of efforts to decrease
television watching and playing computer games in prevention strategies for metabolic
syndrome risk, besides encouragement to increase moderate to vigorous leisure time physical
activity, since both behavioural changes may show additional effects in adult men and
women.
Acknowledgement
The Flemish Policy Research Centre Sport, Physical Activity and Health is supported by the
Flemish Government.
References
Ainsworth BE, Haskell WL and Whitt MC (2000): Compendium of physical activity: an
update of activity codes and MET intensities. Med. Sci. Sports Exerc. 32, S498-S516.
Bertrais S, Beyeme-Ondoua JP, Czernichow S, Galan P, Hercberg S and Oppert JM (2005):
Sedentary behaviors, physical activity, and metabolic syndrome in middle-aged French
subjects. Obes. Res. 13, 936-944.
Bey L and Hamilton MT (2003): Suppression of skeletal muscle lipoprotein lipase activity
during physical inactivity: a molecular reason to maintain daily low-intensity activity. J.
Physiol. 551, 673-682.
Cameron AJ, Shaw JE and Zimmet PZ (2004): The metabolic syndrome: prevalence in
worldwide populations. Endocrinol. Metab. Clin. North Am. 33, 351-375.
Sedentary behaviour, physical activity and metabolic risk
119
Deriemaeker P, Aerenhouts D, Hebbelinck M and Clarys P (2006): Validation of a 3-day diet
diary: comparison with a 7-day diet diary and a FFQ. Med. Sci. Sports Exerc. 38, S328
(abstract).
Dunstan D, Salmon J, Owen N, Armstrong T, Zimmet P, Welborn T, Cameron A, Dwyer T,
Jolley D and Shaw J (2005): Associations of TV viewing and physical activity with the
metabolic syndrome in Australian adults. Diabetologia 48, 2254-2261.
Ekelund U, Brage S, Franks PW, Hennings S, Emms S and Wareham NJ (2005): Physical
activity energy expenditure predicts progression toward the metabolic syndrome
independently of aerobic fitness in middle-aged healthy Caucasians: The Medical
Research Council Ely Study. Diabetes Care 28, 1195-1200.
Expert Panel on the Detection, Evaluation, and Treatment of High Blood Cholesterol in
Adults (2001): Executive summary of the Third Report of the National Cholesterol
Education Program (NCEP) Expert Panel on Detection, Evaluation, and Treatment of
High Blood Cholesterol in Adults (Adult Treatment Panel III). JAMA 285, 2486-2497.
Ford ES, Kohl HW, Mokdad AH and Ajani UA (2005): Sedentary behavior, physical
activity, and the metabolic syndrome among US adults. Obes. Res. 13, 608-614.
Foster JA, Gore SA and West DS (2006): Altering TV viewing habits: An unexplored
strategy for adult obesity intervention. Am. J. Health Behav. 30, 3-14.
Han TS, Williams K, Sattar N, Hunt KJ, Lean MEJ and Haffner SM (2002): Analysis of
obesity and hyperinsulinemia in the development of metabolic syndrome: San Antonio
Heart Study. Obes. Res. 10, 923-931.
Hu FB, Li TY, Colditz GA, Willett WC and Manson JAE (2003): Television watching and
other sedentary behaviors in relation to risk of obesity and type 2 diabetes mellitus in
women. JAMA 289, 1785-1791.
International Diabetes Federation (2005): The IDF consensus worldwide definition of the
metabolic syndrome: Available at:
http://www.idf.org/webdata/docs/Metabolic_syndrome_definition.pdf. Accessed May
5, 2005 (article online).
Jakes RW, Day NE, Khaw KT, Luben R, Oakes S, Welch A, Bingham S and Wareham NJ
(2003): Television viewing and low participation in vigorous recreation are
independently associated with obesity and markers of cardiovascular disease risk:
EPIC-Norfolk population-based study. Eur. J. Clin. Nutr. 57, 1089-1096.
Chapter 2.2.2.
120
Kahn R, Buse J, Ferrannini E and Stern M (2005): The metabolic syndrome: Time for a
critical appraisal: Joint statement from the American Diabetes Association and the
European Association for the Study of Diabetes. Diabetes Care 28, 2289-2304.
Klein BEK, Klein R and Lee KE (2002): Components of the metabolic syndrome and risk of
cardiovascular disease and diabetes in Beaver Dam. Diabetes Care 25, 1790-1794.
Laaksonen DE, Lakka HM, Niskanen LK, Kaplan GA, Salonen JT and Lakka TA (2002):
Metabolic syndrome and development of diabetes mellitus: Application and validation
of recently suggested definitions of the metabolic syndrome in a prospective cohort
study. Am. J. Epidemiol. 156, 1070-1077.
Lakka HM, Laaksonen DE, Lakka TA, Niskanen LK, Kumpusalo E, Tuomilehto J and
Salonen JT (2002): The metabolic syndrome and total and cardiovascular disease
mortality in middle-aged men. JAMA 288, 2709-2716.
Matton L, Wijndaele K, Duvigneaud N, Duquet W, Philippaerts R, Thomis M and Lefevre J
(In Press): Reliability and Validity of the Flemish Physical Activity Computerized
Questionnaire (FPACQ) in Adults. Res. Q. Exerc. Sport.
Owen N, Leslie E, Salmon J and Fotheringham MJ (2000): Environmental determinants of
physical activity and sedentary behaviour. Exerc. Sport Sci. Rev. 28, 153-158.
Ragland DR (1992): Dichotomizing continuous outcome variables - dependence of the
magnitude of association and statistical power on the cutpoint. Epidemiology 3, 434-
440.
US Department of Health and Human Services (1996): Physical Activity and Health: A
Report of the Surgeon General. Atlanta, GA, USDHSS: Centers for Disease Control
and Prevention, National Center for Chronic Disease Prevention and Health Promotion.
Wijndaele K, Beunen G, Duvigneaud N, Matton L, Duquet W, Thomis M, Lefevre J, and
Philippaerts RM (2006): A continuous metabolic syndrome risk score: utility for
epidemiological analyses. Diabetes Care 29: 2329.
World Health Organization (1997): WHO MONICA Project: MONICA Manual. Part III:
Population Survey. Section 1: Population survey data component. Available at:
http://www.ktl.fi/publications/monica/manual.part3/iii-htm. Accessed June 3, 2002
(manual online).
Zderic TW and Hamilton MT (2006): Physical inactivity amplifies the sensitivity of skeletal
muscle to the lipid-induced downregulation of lipoprotein lipase activity. J. Appl.
Physiol. 100, 249-257.
CHAPTER 2.2.3.
MUSCULAR STRENGTH, AEROBIC FITNESS AND
METABOLIC SYNDROME RISK IN FLEMISH ADULTS
K Wijndaele, N Duvigneaud, L Matton, W Duquet, M Thomis, G Beunen, J Lefevre, RM Philippaerts
Medicine & Science in Sports & Exercise, 2007, 39: 233-240

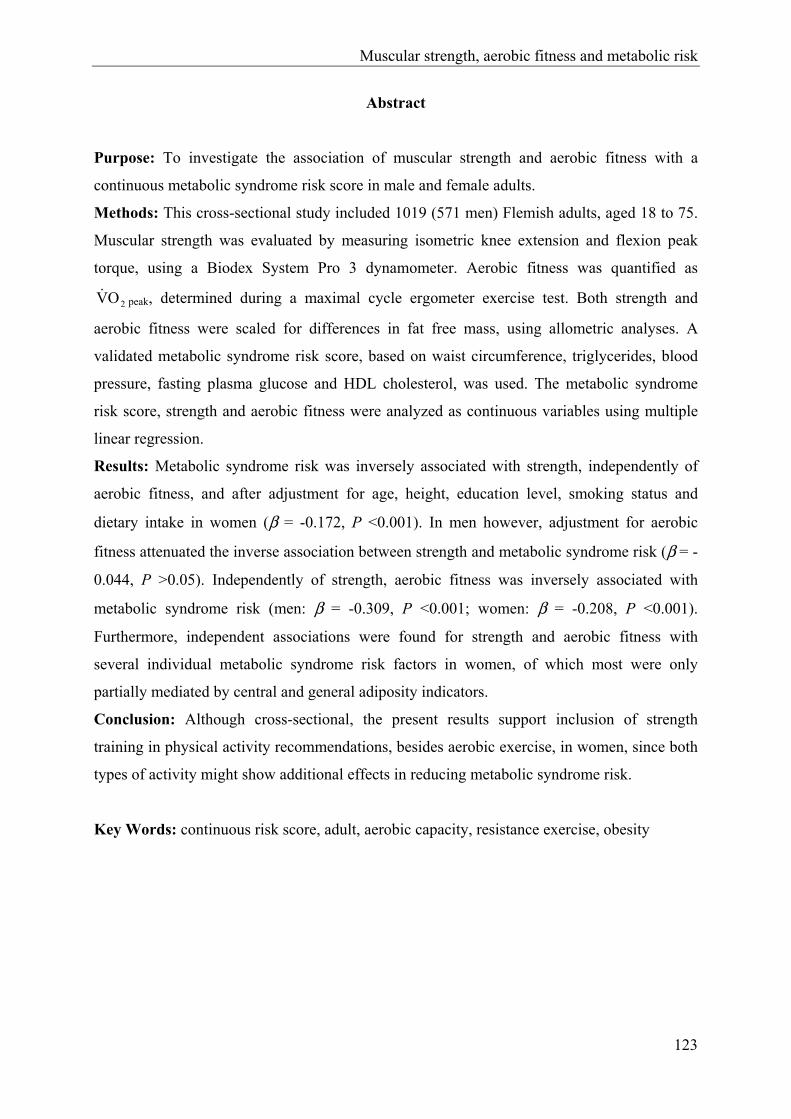
Muscular strength, aerobic fitness and metabolic risk
123
Abstract
Purpose: To investigate the association of muscular strength and aerobic fitness with a
continuous metabolic syndrome risk score in male and female adults.
Methods: This cross-sectional study included 1019 (571 men) Flemish adults, aged 18 to 75.
Muscular strength was evaluated by measuring isometric knee extension and flexion peak
torque, using a Biodex System Pro 3 dynamometer. Aerobic fitness was quantified as
2OV& peak, determined during a maximal cycle ergometer exercise test. Both strength and
aerobic fitness were scaled for differences in fat free mass, using allometric analyses. A
validated metabolic syndrome risk score, based on waist circumference, triglycerides, blood
pressure, fasting plasma glucose and HDL cholesterol, was used. The metabolic syndrome
risk score, strength and aerobic fitness were analyzed as continuous variables using multiple
linear regression.
Results: Metabolic syndrome risk was inversely associated with strength, independently of
aerobic fitness, and after adjustment for age, height, education level, smoking status and
dietary intake in women (β = -0.172, P <0.001). In men however, adjustment for aerobic
fitness attenuated the inverse association between strength and metabolic syndrome risk (β = -
0.044, P >0.05). Independently of strength, aerobic fitness was inversely associated with
metabolic syndrome risk (men: β = -0.309, P <0.001; women: β = -0.208, P <0.001).
Furthermore, independent associations were found for strength and aerobic fitness with
several individual metabolic syndrome risk factors in women, of which most were only
partially mediated by central and general adiposity indicators.
Conclusion: Although cross-sectional, the present results support inclusion of strength
training in physical activity recommendations, besides aerobic exercise, in women, since both
types of activity might show additional effects in reducing metabolic syndrome risk.
Key Words: continuous risk score, adult, aerobic capacity, resistance exercise, obesity
Chapter 2.2.3.
124
Introduction
The metabolic syndrome, representing the constellation of metabolic abnormalities including
central obesity, dyslipidaemia, hypertension, insulin resistance and glucose intolerance, has
become one of the major global public-health challenges. The syndrome has a high
worldwide prevalence, after a severe increase during the past 2 decades (9). In addition, it
predicts the development of type 2 diabetes (18), cardiovascular disease (CVD) and all-cause
mortality (19) in nondiabetic individuals. Consequently, there is an urgent need for strategies
to prevent an emerging global epidemic of the metabolic syndrome.
The first-line therapy for treatment of the metabolic syndrome is lifestyle
modification, including an increase in physical activity (9). Previous cross-sectional studies
suggest an inverse association between aerobic fitness, and several risk factors associated
with the metabolic syndrome (21, 28). Furthermore, a high level of aerobic fitness in
adolescence is protective for the development of diabetes, hypertension,
hypercholesterolemia (5) and obesity (10) in adulthood. In addition, aerobic fitness is a strong
and independent predictor of metabolic syndrome incidence (5, 20). Therefore, aerobic
exercise, resulting in higher levels of aerobic fitness, might play an important role in the
primary and secondary prevention of the metabolic syndrome and the associated chronic
diseases.
Resistance training has also become part of physical activity recommendations for
preventing chronic diseases in adults (2). Some intervention studies suggest beneficial effects
of resistance training on whole body insulin action (1), body composition and central obesity
(2), blood pressure (6), triglycerides and HDL cholesterol blood levels (12). Consequently,
biological pathways might exist to explain and support protective effects of resistance
training and muscular strength on the development and treatment of the metabolic syndrome.
Nevertheless, until now few studies have examined the association between muscular
strength and the metabolic syndrome.
Jurca et al. (15) examined this association in adult men using a cross-sectional design.
They found that muscular strength was inversely associated with prevalence of the metabolic
syndrome, independently of aerobic fitness and several confounding variables. Further
longitudinal analyses in adult men yielded rather comparable results (14). Muscular strength
was inversely associated with incidence of the metabolic syndrome after extensive
adjustment for confounders. This association was marginally nonsignificant after additional
adjustment for aerobic fitness. These findings might be indicative for a protective effect of
Muscular strength, aerobic fitness and metabolic risk
125
strength in the development of the metabolic syndrome, that is additional to the benign effect
of aerobic fitness in men. Untill now, no studies have investigated the independent and
combined association of muscular strength and aerobic fitness with metabolic syndrome risk
in women.
Studies examining the association between muscular strength, aerobic fitness and the
metabolic syndrome often use a binary definition of the syndrome (5, 20, 14, 15). However,
increasing evidence supports the use of a continuous metabolic syndrome risk score in
epidemiological analyses, instead of a binary definition (16): a) dichotomizing continuous
outcome variables reduces statistical power to detect associations (25); b) CVD risk is a
progressive function of several metabolic syndrome risk factors, eliminating the need to
dichotomize these risk factors using cut points (16); c) CVD and diabetes risk increase
progressively with an increasing number of metabolic syndrome risk factors (17), eliminating
the need to dichotomize the presence of the syndrome, e.g. in case of 3 or more present risk
factors (16).
Aerobic fitness and muscular strength are both inversely associated with central and
general obesity (2, 10). Furthermore, obesity predicts the development of several individual
metabolic syndrome risk factors and of type 2 diabetes (13). Therefore, the association of
aerobic fitness and muscular strength with the individual metabolic syndrome risk factors
may (partially) be mediated by obesity indicators.
The aim of the present study was twofold. First, the independent and combined
association of muscular strength and aerobic fitness with a validated continuous metabolic
syndrome risk score (30) was examined in both male and female adults aged 18 to 75.
Second, the relationship of muscular strength and aerobic fitness with the individual
continuous metabolic syndrome risk factors, and the extent to which obesity mediates this
relationship was determined.
Methods
Subjects
Data for this study were collected by the Flemish Policy Research Centre Sport, Physical
Activity and Health (SPAH) between October 2002 and April 2004, for a cross-sectional
survey on the relationship between physical activity, physical fitness and several health

Chapter 2.2.3.
126
parameters. For this purpose, the National Institute of Statistics randomly selected a
community sample of 18- to 75-year-old men and women in the Flemish part of Belgium.
Subjects were asked to visit the SPAH examination center to provide a fasting blood sample,
to go through a medical examination, anthropometric measurements, physical fitness tests,
and some questionnaires. Participants with complete data for all metabolic syndrome risk
factors, muscular strength, aerobic fitness, and for all confounding variables used in the
analyses, were included in the current study. Participants were excluded in case of a history
or evidence of cardiovascular disease (abnormal heart auscultation or rest electrocardiogram;
sudden death of father or brother before the age of 45, or of mother or sister before the age of
55; systolic blood pressure > 150 mm Hg or diastolic blood pressure > 100 mm Hg; use of
antihypertensive or lipid-lowering drugs), diabetes mellitus, or in case they did not achieve at
least 85% of the age-predicted maximal heart rate during a maximal cycle ergometer test.
Consequently, results are based on data of 571 men and 448 nonpregnant women, aged 18 to
75. The study was approved by the Ghent University Ethics Committee. Prior to
participation, the purpose and procedures of the study were explained and subjects gave their
written informed consent.
Data collection
Blood samples. Subjects were asked to fast from 11:00 P.M. the evening before visiting the
laboratory. A sample of fasting blood was taken from an antecubital vein of subjects in
supine position. All samples were stored at 4°C before they were transferred to the lab at
11:00 A.M. They were analyzed before 5:00 P.M. the same day. Triglyceride was analyzed
using the lipase/glycerol kinase/glycerol phosphate oxidase enzymatic method. HDL
cholesterol was analyzed using the homogeneous polyanion/cholesterol esterase/oxidase
enzymatic method. Glucose was analyzed using the hexokinase method. Triglycerides, HDL
cholesterol and glucose were measured on an Olympus AU5400 analyzer (Olympus
Diagnostica, Hamburg, Germany). The coefficients of variation between days were 1.4% (at
2.07 mmol/l) for triglycerides, 3.9% (at 2.04 mmol/l) for HDL cholesterol and 2.0% (at 16.71
mmol/l) for glucose.
Blood pressure. A physician measured blood pressure at the left arm of subjects who had
been seated for 10 minutes, using a NOVA Presameter mercury sphygmomanometer (Riester,
Jungingen, Germany). Systolic and diastolic blood pressure were measured 3 times with 1-
minute intervals, and the mean of these 3 measurements was used in analyses.

Muscular strength, aerobic fitness and metabolic risk
127
Anthropometric measurements. Anthropometric measurements were taken by trained staff
with participants barefoot and in underwear. Waist circumference was measured using a
metal tape (Rosscraft, Surrey, BC, Canada) to the nearest 0.1 cm, at the narrowest level
between lowest ribs and iliac crests, in standing position. Body weight was recorded with a
digital scale (Seca 841, Seca GmbH, Hamburg, Germany) to the nearest 0.1 kg. Height was
measured using a stadiometer (Holtain, Crymych, UK) to the nearest 0.1 cm. Body mass
index (BMI) was calculated as [body weight (kg)/(height (m))²]. Percentage body fat (%BF)
was evaluated by means of bioelectrical impedance analysis (BIA) on the right side of the
body with a tetrapolar BIA analyser (Bodystat 1500, Bodystat Ltd, Isle of Man, UK), in
subjects who had been in supine position for 5 minutes with the arms and legs in abduction.
Fat free mass (FFM, kg) was calculated based on the %BF measured by means of BIA.
Continuous metabolic syndrome risk score (cMSy). A validated cMSy was calculated as
described in more detail by Wijndaele et al. (30). In short, cMSy is based on the 5 risk factors
in the National Cholesterol Education Program definition (11), namely waist circumference,
triglycerides, HDL cholesterol, blood pressure (systolic and diastolic) and fasting plasma
glucose. Calculation involved 3 successive steps: a) all variables were normalized (log10)
because of their non-normal distribution. A blood pressure index was computed by averaging
systolic and diastolic blood pressure; b) principal component analysis with varimax rotation
was applied to the individual risk factors in order to derive components that represent large
fractions of the metabolic syndrome variance, and consequently to give each risk factor the
most appropriate weight in calculating cMSy. This analysis revealed 2 principal components
with eigenvalue ≥ 1.0 in both genders; c) cMSy was computed by summing both individual
principal component scores, each weighted for the relative contribution of principal
component 1 and 2 in the explained variance. The resulting cMSy was 0 ± 1.42 in men and 0
± 1.41 in women. This score showed high validity in both genders (30).
Muscular Strength. A calibrated Biodex System Pro 3 dynamometer (Biodex Medical
Systems, Inc., Shirley, NY) was used to measure isometric strength of the knee. Isometric
measurements using this device are found to be reliable and valid (8). Strength of the right
knee was measured in a standardized manner. In some subjects with a history of injury in the
right knee however, strength of the left knee was evaluated. Subjects were seated upright on
the Biodex chair with the axis of the dynamometer corresponding to the knee joint axis. Once
positioned, the shoulder, waist, thigh and lower right leg, 2 cm above malleolus medialis,
were secured with straps. Participants were asked to cross arms in front of the thorax during
Chapter 2.2.3.
128
each exercise, in order to avoid compensatory movements. To measure peak torque of
isometric extension at an angle of 60° flexion (0° is straight leg), subjects were instructed to
extend their lower leg as hard as possible, regardless its fixed position. For peak torque of
isometric flexion at an angle of 60° flexion, they were asked to maximally flex their knee.
During exercise, both subject and instructor were able to see the strength curve on the
monitor. Subjects were given verbal encouragement in generating the highest possible
plateau. Both the extension and flexion exercise were performed twice, and for each exercise
the highest torque measurement of both trials during plateau was included in analyses. Peak
torque values were corrected for the effects of gravity.
Total knee strength was defined as the sum of peak torque of isometric extension and
flexion at 60°, divided by FFM, since Pearson correlation coefficients between FFM and
absolute total knee strength were higher compared to Pearson correlation coefficients found
between body weight and absolute total knee strength in men (r = 0.56, P < 0.001 for FFM; r
= 0.45, P < 0.001 for body weight) and women (r = 0.54, P < 0.001 for FFM; r = 0.26, P <
0.001 for body weight). To optimally scale absolute total knee strength for differences in fat
free mass, allometric analyses were performed using log-linear adjustment models, to identify
the most appropriate exponent for FFM in dividing absolute total knee strength by FFM (27).
These analyses revealed an FFM exponent of b = 1.014 ± 0.061 in men and of b = 0.975 ±
0.069 in women. Consequently, muscular strength was quantified as (absolute total knee
strength)⋅FFM-1.014 (N⋅m⋅kgFFM-1.014) in men and as (absolute total knee strength)⋅FFM-0.975
(N⋅m⋅kgFFM-0.975) in women.
Aerobic fitness. Aerobic fitness was determined by means of a maximal exercise test on an
electrically braked Lode Excalibur cycle ergometer (Lode, Groningen, the Netherlands). The
standardized exercise protocol started with a workload of 20 W, which was increased
stepwise by 20 W⋅min-1. Participants were instructed to continuously cycle at approximately
70 revolutions per minute. They were verbally encouraged to reach a maximal level of
exertion. Oxygen consumption was measured directly with breath-by-breath respiratory gas
exchange analysis, using a Cortex Metalyser 3B analyzer (Cortex Biophysic GmbH, Leipzig,
Germany), which generates highly reliable results (22). Heart rate was registered
continuously with a Polar Smart Heart Rate Monitor Set (Polar Electro Oy, Kempele,
Finland). Cardiac function during the test was monitored by means of a 12-channel
electrocardiogram (Cardiolyzer Ultra, Cortex Biophysic GmbH, Leipzig, Germany). The
exercise test was terminated when subjects where exhausted or when the physician stopped
Muscular strength, aerobic fitness and metabolic risk
129
the test for medical reasons. A high correlation was found between peak oxygen uptake
( 2OV& peak) and exercise duration (men: Pearson r = 0.85, P < 0.001; women: r = 0.87, P <
0.001).
For the current analyses, aerobic fitness was quantified as peak oxygen uptake divided
by FFM, since Pearson correlation coefficients between FFM and absolute 2OV& peak were
higher in comparison with those found between body weight and absolute 2OV& peak in both
genders (men: r = 0.39, P < 0.001 for FFM; r = 0.17, P < 0.001 for body weight; women: r =
0.50, P < 0.001 for FFM; r = 0.20, P < 0.001 for body weight). Allometric analyses (27)
revealed an FFM exponent of b = 0.820 ± 0.079 in men and of b = 0.973 ± 0.072 in women.
Therefore, aerobic fitness was quantified as 2OV& peak⋅FFM-0.820 (mL⋅kgFFM-0.820⋅min-1) in men
and as 2OV& peak⋅FFM-0.973 (mL⋅kgFFM-0.973⋅min-1) in women.
Confounding variables. Several confounding variables were included in analyses, more
specifically age (years), height (cm), education level (low, high), smoking status (current,
former, never) and dietary intake (total energy (kcal), saturated fat (%), sugars (%), fibre
(g/1000kcal), alcohol (%)). Education level was assessed using the Flemish Physical Activity
Computerized Questionnaire (24), and data were reduced from 13 to 2 levels, more
specifically secondary school or lower and university or college. Smoking status was
determined by means of the WHO Monica Smoking Questionnaire (29). To assess dietary
intake, subjects completed a validated 3-day diet record (7). Diet records were analysed using
Becel Nutrition software (Unilever Co., Rotterdam, the Netherlands).
Statistical analyses
All analyses were carried out using the SPSS 12.0 statistical software package (SPSS, Inc.,
Chicago, IL). The metabolic syndrome risk factors were logarithmically transformed (log10),
owing to their positively skewed distribution, as shown by the Shapiro-Wilk test for
normality. Differences between sexes were analyzed by means of independent samples t-tests
and Pearson Chi²-tests. All further analyses were carried out in both genders separately.
Separate multiple linear regression models were used to assess the association of the
predictor variables muscular strength and aerobic fitness with cMSy. Model A contained
muscular strength or aerobic fitness and was adjusted for all confounding variables, more
specifically age, height, education level, smoking status and dietary intake. Model B was
additionally adjusted for the other predictor variable to test the independent association of
Chapter 2.2.3.
130
both predictor variables with cMSy. Moreover, the interaction between muscular strength and
aerobic fitness on cMSy, adjusted for the same confounding variables, was verified. To
evaluate this interaction effect, muscular strength and aerobic fitness were mean centered and
the product of both mean centered variables was computed for each subject. No further
adjustment for adiposity was made in assessing the association between metabolic syndrome
risk and muscular strength and aerobic fitness, since waist circumference is integral to the
metabolic syndrome risk score.
In assessing the association of muscular strength and aerobic fitness with the
individual metabolic syndrome risk factors, 2 models were applied. Model C contained both
muscular strength and aerobic fitness and was adjusted for all confounding variables.
Additional adjustment for obesity was made in Model D, to analyze the extent to which
obesity mediates this relationship. Two measures of obesity were successively included in
Model D, more specifically waist circumference for central adiposity, and body mass index
for general adiposity.
Muscular strength and aerobic fitness were entered as continuous variables in all
analyses. Standardized β-coefficients are provided, which express the number of standard
deviations the outcome (cMSy or metabolic syndrome risk factors) changes as a result of 1
standard deviation change in the predictor (muscular strength or aerobic fitness). Since all of
the standardized β values are measured in standard deviation units, they facilitate the
comparison of the (relative) contribution of each predictor in the model. Minimal level of
statistical significance was set at P < 0.05. A priori power analyses were conducted in order
to create a strong study design. The analyses showed that an N = 168 and an N = 156 in males
and females respectively was sufficient to power the study at 0.8 for a detectable β of 0.15 for
muscular strength and aerobic fitness, given the 0.05 level of significance, which confirms
the adequacy of the present sample size of males (N = 571) and females (N = 448).
Results
Descriptive statistics of subjects are shown in Table 1. Men showed higher BMI in
comparison with women (P < 0.001). However, men also displayed higher FFM (P < 0.001).
Furthermore, waist circumference, triglycerides, glucose, systolic and diastolic blood
pressure were higher in men (P < 0.001), whereas HDL cholesterol was higher in women (P
< 0.001). Finally, sex differences were found for muscular strength and aerobic fitness,

Muscular strength, aerobic fitness and metabolic risk
131
expressed in absolute terms, both being higher in men (P < 0.001). After scaling both
variables for FFM, mean values for muscular strength and aerobic fitness in men were 4.50 ±
0.77 N⋅m⋅kgFFM-1.014 and 98.14 ± 20.19 mL⋅kgFFM
-0.820⋅min-1, respectively. In women, scaled
mean values were 4.84 ± 0.88 N⋅m⋅kgFFM-0.975 for muscular strength and 44.76 ± 8.64
mL⋅kgFFM-0.973⋅min-1 for aerobic fitness. No comparison between men and women was made
for these scaled values, given the different FFM exponents between sexes for both variables.
Table 1. Descriptive characteristics of male and female participants.
Men
(N = 571)
Women
(N = 448)
P
Age (years) 46.7 ± 11.2 45.8 ± 10.8 0.209
BMI (kg⋅m-2) 25.5 ± 2.9 24.1 ± 3.7 < 0.001
Fat free mass (kg) 62.2 ± 7.0 43.8 ± 5.2 < 0.001
Waist circumference (cm) 89.2 ± 8.8 77.3 ± 8.9 < 0.001
Triglycerides (mmol⋅L-1) 1.31 ± 0.82 1.03 ± 0.47 < 0.001
HDL cholesterol (mmol⋅L-1) 1.43 ± 0.31 1.75 ± 0.40 < 0.001
Systolic blood pressure (mmHg) 129.3 ± 12.4 122.6 ± 14.4 < 0.001
Diastolic blood pressure (mmHg) 80.4 ± 6.8 76.4 ± 8.1 < 0.001
Glucose (mmol⋅L-1) 5.16 ± 0.48 4.91 ± 0.48 < 0.001
Muscular strength (N⋅m) 296.7 ± 61.4 193.0 ± 41.9 < 0.001
Aerobic fitness (L⋅min-1) 2.9 ± 0.6 1.8 ± 0.4 < 0.001
Education level
Low (%) 47.6 42.1 0.077
High (%) 52.4 57.9
Smoking status
Current (%) 15.8 12.9 < 0.001
Former (%) 27.1 15.4
Never (%) 57.1 71.7
Dietary intake
Total energy (kcal) 2562.9 ± 691.0 1984.4 ± 519.3 < 0.001
Saturated fat (%) 13.0 ± 3.3 13.4 ± 3.2 0.088
Sugars (%) 10.4 ± 5.5 10.2 ± 5.3 0.606
Fibre (%) 8.2 ± 2.5 8.8 ± 2.7 < 0.001
Alcohol (%) 4.4 ± 4.7 3.2 ± 4.1 < 0.001
Data are means ± SD (independent samples t-test) or proportions (Pearson Chi²-test).
Associations of muscular strength and aerobic fitness with cMSy
Table 2 presents the individual and combined association of muscular strength and aerobic
fitness with cMSy. Muscular strength was negatively associated with cMSy in men (P <
0.05) and women (P < 0.001) after adjustment for age, height, education level, smoking
status and dietary intake (Model A). Additional adjustment for aerobic fitness (Model B)
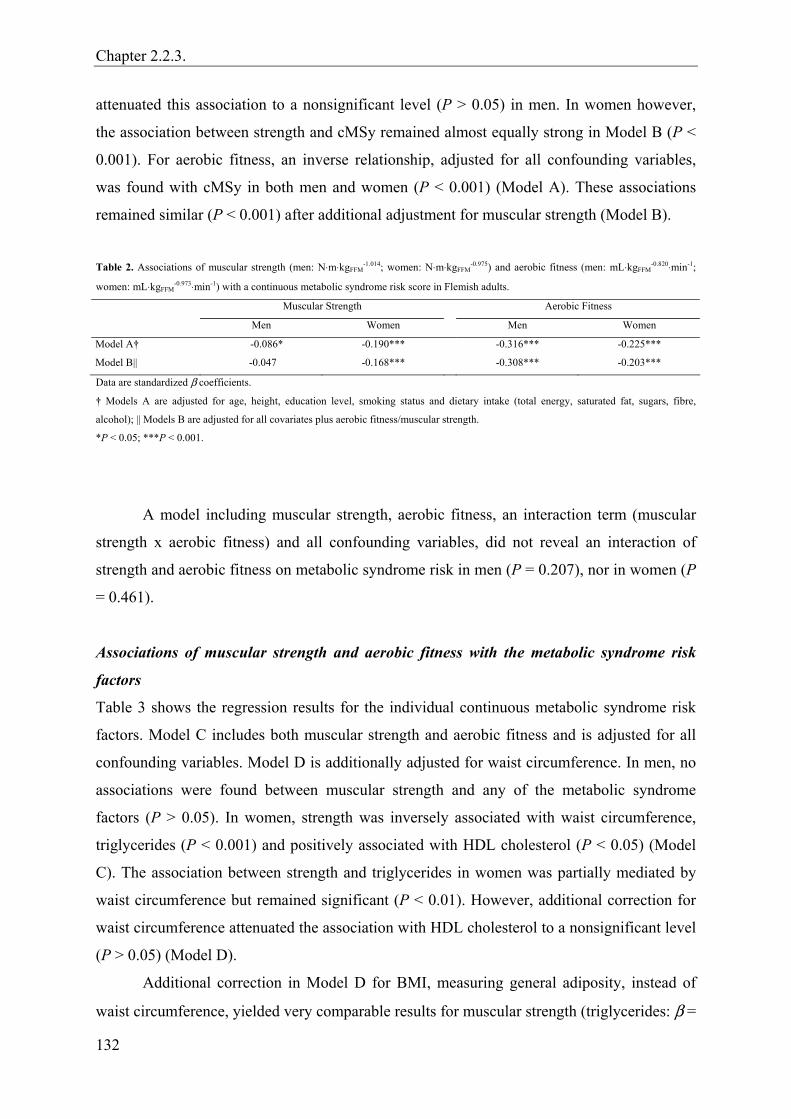
Chapter 2.2.3.
132
attenuated this association to a nonsignificant level (P > 0.05) in men. In women however,
the association between strength and cMSy remained almost equally strong in Model B (P <
0.001). For aerobic fitness, an inverse relationship, adjusted for all confounding variables,
was found with cMSy in both men and women (P < 0.001) (Model A). These associations
remained similar (P < 0.001) after additional adjustment for muscular strength (Model B).
Table 2. Associations of muscular strength (men: N⋅m⋅kgFFM
-1.014; women: N⋅m⋅kgFFM-0.975) and aerobic fitness (men: mL⋅kgFFM
-0.820⋅min-1;
women: mL⋅kgFFM-0.973⋅min-1) with a continuous metabolic syndrome risk score in Flemish adults.
Muscular Strength Aerobic Fitness
Men Women Men Women
Model A† -0.086* -0.190*** -0.316*** -0.225***
Model B|| -0.047 -0.168*** -0.308*** -0.203***
Data are standardized β coefficients.
† Models A are adjusted for age, height, education level, smoking status and dietary intake (total energy, saturated fat, sugars, fibre,
alcohol); || Models B are adjusted for all covariates plus aerobic fitness/muscular strength.
*P < 0.05; ***P < 0.001.
A model including muscular strength, aerobic fitness, an interaction term (muscular
strength x aerobic fitness) and all confounding variables, did not reveal an interaction of
strength and aerobic fitness on metabolic syndrome risk in men (P = 0.207), nor in women (P
= 0.461).
Associations of muscular strength and aerobic fitness with the metabolic syndrome risk
factors
Table 3 shows the regression results for the individual continuous metabolic syndrome risk
factors. Model C includes both muscular strength and aerobic fitness and is adjusted for all
confounding variables. Model D is additionally adjusted for waist circumference. In men, no
associations were found between muscular strength and any of the metabolic syndrome
factors (P > 0.05). In women, strength was inversely associated with waist circumference,
triglycerides (P < 0.001) and positively associated with HDL cholesterol (P < 0.05) (Model
C). The association between strength and triglycerides in women was partially mediated by
waist circumference but remained significant (P < 0.01). However, additional correction for
waist circumference attenuated the association with HDL cholesterol to a nonsignificant level
(P > 0.05) (Model D).
Additional correction in Model D for BMI, measuring general adiposity, instead of
waist circumference, yielded very comparable results for muscular strength (triglycerides: β =
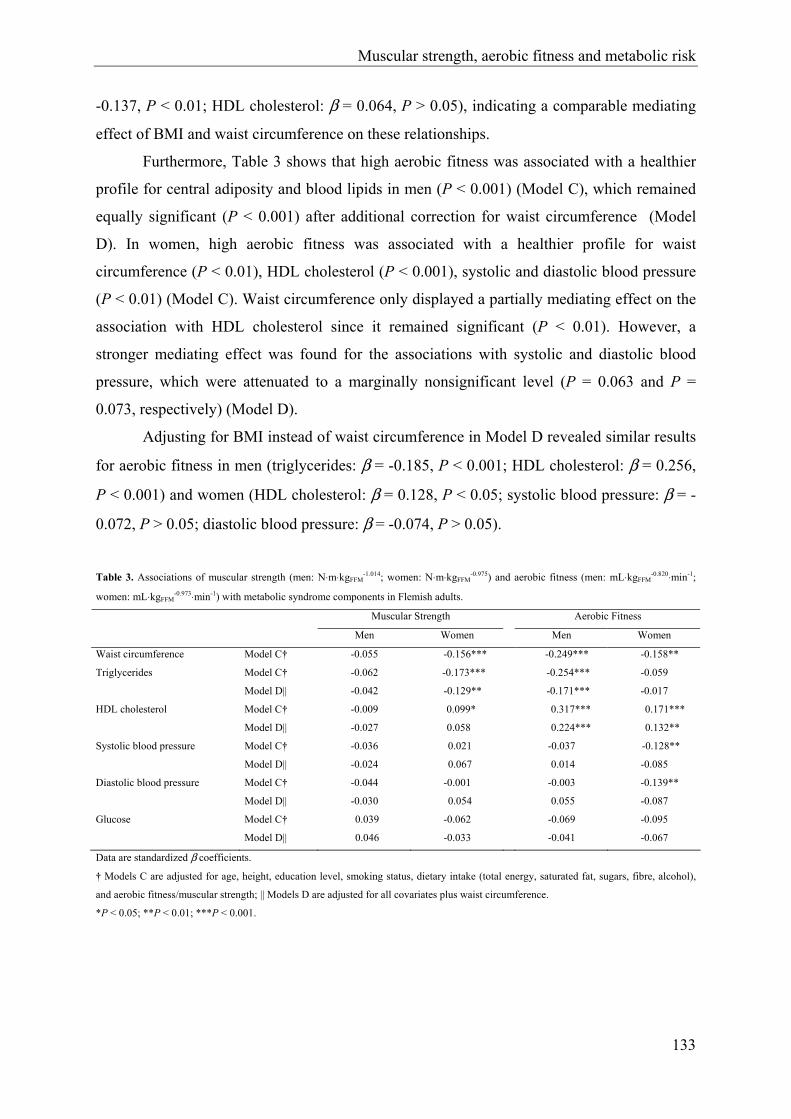
Muscular strength, aerobic fitness and metabolic risk
133
-0.137, P < 0.01; HDL cholesterol: β = 0.064, P > 0.05), indicating a comparable mediating
effect of BMI and waist circumference on these relationships.
Furthermore, Table 3 shows that high aerobic fitness was associated with a healthier
profile for central adiposity and blood lipids in men (P < 0.001) (Model C), which remained
equally significant (P < 0.001) after additional correction for waist circumference (Model
D). In women, high aerobic fitness was associated with a healthier profile for waist
circumference (P < 0.01), HDL cholesterol (P < 0.001), systolic and diastolic blood pressure
(P < 0.01) (Model C). Waist circumference only displayed a partially mediating effect on the
association with HDL cholesterol since it remained significant (P < 0.01). However, a
stronger mediating effect was found for the associations with systolic and diastolic blood
pressure, which were attenuated to a marginally nonsignificant level (P = 0.063 and P =
0.073, respectively) (Model D).
Adjusting for BMI instead of waist circumference in Model D revealed similar results
for aerobic fitness in men (triglycerides: β = -0.185, P < 0.001; HDL cholesterol: β = 0.256,
P < 0.001) and women (HDL cholesterol: β = 0.128, P < 0.05; systolic blood pressure: β = -
0.072, P > 0.05; diastolic blood pressure: β = -0.074, P > 0.05).
Table 3. Associations of muscular strength (men: N⋅m⋅kgFFM
-1.014; women: N⋅m⋅kgFFM-0.975) and aerobic fitness (men: mL⋅kgFFM
-0.820⋅min-1;
women: mL⋅kgFFM-0.973⋅min-1) with metabolic syndrome components in Flemish adults.
Muscular Strength Aerobic Fitness
Men Women Men Women
Waist circumference Model C† -0.055 -0.156*** -0.249*** -0.158**
Triglycerides Model C† -0.062 -0.173*** -0.254*** -0.059
Model D|| -0.042 -0.129** -0.171*** -0.017
HDL cholesterol Model C† -0.009 0.099* 0.317*** 0.171***
Model D|| -0.027 0.058 0.224*** 0.132**
Systolic blood pressure Model C† -0.036 0.021 -0.037 -0.128**
Model D|| -0.024 0.067 0.014 -0.085
Diastolic blood pressure Model C† -0.044 -0.001 -0.003 -0.139**
Model D|| -0.030 0.054 0.055 -0.087
Glucose Model C† 0.039 -0.062 -0.069 -0.095
Model D|| 0.046 -0.033 -0.041 -0.067
Data are standardized β coefficients.
† Models C are adjusted for age, height, education level, smoking status, dietary intake (total energy, saturated fat, sugars, fibre, alcohol),
and aerobic fitness/muscular strength; || Models D are adjusted for all covariates plus waist circumference.
*P < 0.05; **P < 0.01; ***P < 0.001.

Chapter 2.2.3.
134
Discussion
This study examined the combined association of muscular strength and aerobic fitness with
metabolic syndrome risk and the independent metabolic syndrome risk factors in both male
and female 18- to 75 year old adults. The main findings of this study are: 1) muscular
strength and aerobic fitness are independently and inversely associated with metabolic
syndrome risk in women after extensive adjustment for confounding factors. In men, the
inverse association between strength and metabolic syndrome risk was smaller and not
independent of aerobic fitness, for which an independent inverse association with metabolic
syndrome risk was found; 2) muscular strength and aerobic fitness are independently
associated with a better profile for several individual metabolic syndrome risk factors in
women, after extensive adjustment for confounding variables. In men, no independent
associations were found for muscular strength, however aerobic fitness was strongly and
inversely associated with a better profile for central adiposity and for blood lipids; 3) most of
the significant associations with the individual risk factors were only partially mediated by
central and general adiposity indicators.
The inverse association between aerobic fitness and metabolic syndrome risk found in
the present study is in line with the results of previous investigations (5, 15, 20). So far, only
2 studies investigated the combined association between strength, aerobic fitness and the
metabolic syndrome, both in a male adult population. In a first cross-sectional study, Jurca et
al. (15) found an inverse association between muscular strength and prevalence of the
metabolic syndrome in men, independent of aerobic fitness and after adjustment for age and
smoking. In further longitudinal analyses, they found a significant inverse association
between strength and incidence of metabolic syndrome, which was marginally not significant
when further adjusting for aerobic fitness (14). The present study did show an inverse
association in men between strength and metabolic syndrome risk, adjusted for age, height,
education level, smoking status and dietary intake. However, this association was attenuated
(P > 0.05) after further adjustment for aerobic fitness.
Differences in results for men between studies may be attributed to several factors.
First, in both previous studies (14, 15) muscular strength was scaled for differences in total
body weight instead of FFM. FFM however is more strongly correlated with strength. Since
fat mass (FM) is highly correlated with waist circumference (r = 0.88 for men and r = 0.87
for women in the present study, P < 0.001), and to a lesser extent also with several other
metabolic syndrome risk factors (ranging from r = -0.19 for HDL cholesterol in men to r =
Muscular strength, aerobic fitness and metabolic risk
135
0.43 for systolic blood pressure in women of the present study, P < 0.001), dividing strength
by total body weight (including FM and FFM) instead of FFM might (artificially) strengthen
the inverse association found between metabolic syndrome and muscular strength. This
hypothesis was confirmed by reconducting regression analyses in the present study including
muscular strength scaled for total body weight instead of FFM. These analyses revealed
stronger associations between strength and metabolic syndrome risk, which remained
significant after further adjustment for aerobic fitness in both genders (data not shown).
Second, results of the present study were more extensively adjusted for confounding
variables in comparison with those of both previous studies (14, 15). Finally, differences
between studies in defining the metabolic syndrome, in characteristics and size of the study
samples and in measurement procedures for strength, and aerobic fitness might also partially
explain differences in study results.
Aerobic fitness was more strongly associated with metabolic syndrome risk in
comparison with muscular strength, and correction for aerobic fitness did attenuate the
association between strength and metabolic syndrome risk in both genders. However, in
women the inverse association between strength and metabolic syndrome risk remained
significant, after correction for aerobic fitness. This may suggest a possible protective effect
of strength in the development of metabolic syndrome risk, that is additional to the benign
effect of aerobic fitness in women. This protective effect may be a function of muscular
strength, or may be indicative for the benign effects of regular participation in resistance
training, ameliorating both strength and metabolic homeostasis (14). Both hypotheses
however support the promotion of resistance training in addition to aerobic fitness training as
part of physical activity recommendations in lowering metabolic syndrome risk. Nonetheless,
further longitudinal and intervention studies are needed to confirm these assumptions.
Biological pathways through which strength training might lower metabolic syndrome
risk include improvements in triglycerides and HDL blood levels (12), blood pressure (6),
central adiposity and body composition (2), and whole body insulin action and glucose
uptake (1). Insulin resistance is described as a central risk factor in the pathophysiology of the
metabolic syndrome (9). Resistance training might protect against insulin resistance by both
an increase in muscle quantity and an increase in skeletal muscle insulin action and glucose
uptake per unit muscle mass, indicating qualitative muscle adaptations (1). Pathways
explaining the protective effects of endurance training closely resemble those suggested for
resistance training (5). However, the independent associations of strength and aerobic fitness
with metabolic syndrome risk and with several individual risk factors found in women,
Chapter 2.2.3.
136
suggest that both predictors may have unique benefits. Further research is needed to clearly
identify mechanisms explaining these unique benefits.
Adiposity indicators only partially mediated most associations found between
strength, aerobic fitness and the independent metabolic syndrome risk factors. Boulé et al.
(3), examining the association between aerobic fitness and the individual risk factors, found
similar results, except for the association with HDL cholesterol in women that disappeared
after controlling for total and abdominal adiposity in their study. The present results may
indicate that biological pathways other than obesity are also responsible for the associations
found. However, since obesity indicators in the present study depend on anthropometric
measurements rather than imaging techniques such as dual-energy x-ray absorptiometry or
magnetic resonance imaging systems, these results should be interpreted with caution (26).
To our knowledge, this is the first study to report an inverse association between
strength and metabolic syndrome risk in women, and to examine the combined relationship
for muscular strength and aerobic fitness with metabolic syndrome risk in women.
Furthermore, no previous studies examined the association of muscular strength with a
continuous metabolic syndrome risk score. Although the use of cMSy implies population-
specific results, it is more appropriate than using categorical definitions of the metabolic
syndrome for epidemiological analyses (16, 25, 30). Additional strengths of this study
include the objective measurement of both strength and aerobic fitness by means of
standardized maximal test protocols using highly reliable measurement devices (8, 22).
Furthermore, strength and aerobic fitness were corrected for differences in FFM by means of
allometric scaling, the sample studied covered a wide age range, and extensive adjustment in
regression analyses was made for confounding variables, including dietary intake. In previous
epidemiological studies examining the association of aerobic fitness and muscular strength
with the metabolic syndrome, adjustment for dietary intake was rare. However, diet may
influence several metabolic syndrome risk factors, and men and women with higher aerobic
fitness levels have been shown to have healthier diets than their lower fit counterparts (4).
Some limitations of this study should also be addressed. First of all, causality of
relationships cannot be determined because of the cross-sectional design. However, the
confounding influence of health status on level of aerobic fitness and muscular strength may
have been partially eliminated by excluding subjects with a history/evidence of CVD and
type 2 diabetes. Second, the present study sample may represent a more healthy group of
adults, which may partially limit external validity of the results. A more heterogeneous
sample, including more unhealthy individuals and therefore more extreme values for all

Muscular strength, aerobic fitness and metabolic risk
137
metabolic syndrome risk factors would probably yield stronger associations. Finally,
muscular strength was measured by means of lower body strength only. However, a study
comparing knee strength and hand grip strength in predicting mortality found similar risk
estimates for both strength parameters (23). Future longitudinal studies in both genders are
needed to investigate a cause and effect relationship between total body strength and cMSy,
including aerobic fitness and all relevant confounding variables in analyses. Furthermore,
more controlled experimental studies should be conducted to clearly identify the
physiological mechanisms explaining these associations and differences found between men
and women.
In conclusion, results of the present study show that muscular strength and aerobic
fitness are independently and inversely associated with metabolic syndrome risk in women
aged 18 to 75. This may indicate a protective effect of muscular strength on metabolic
syndrome risk, that is additive to the benign effect of aerobic fitness. Furthermore, muscular
strength and aerobic fitness were associated with a better profile of several individual
metabolic syndrome risk factors in women. Most of these associations were only partially
mediated by central and general adiposity indicators.
Although cross-sectional, the present results support the inclusion of strength training
in physical activity recommendations, besides aerobic exercise, since both types of physical
activity may provide unique benefits in the primary and secondary prevention of metabolic
syndrome risk. Moreover, resistance training might be a more attractive type of exercise for
overweight and obese individuals, who are at higher risk for developing high metabolic
syndrome risk and may be aversive from endurance training (1).
Acknowledgements
The Flemish Policy Research Centre Sport, Physical Activity and Health is supported by the
Flemish Government.

Chapter 2.2.3.
138
References
1. Andersen, J.L., P. Schjerling, L.L. Andersen, and F. Dela. Resistance training and insulin
action in humans: effects of de-training. J. Physiol. 551:1049-1058, 2003.
2. Banz W.J., M.A. Maher, W.G. Thompson, et al. Effects of resistance versus aerobic
training on coronary artery disease risk factors. Exp. Biol. Med. 228:434-440, 2003.
3. Boule N.G., C. Bouchard, and A. Tremblay. Physical fitness and the metabolic syndrome
in adults from the Quebec family study. Can. J. Appl. Physiol. 30:140-156, 2005.
4. Brodney S., R.S. McPherson, R.A. Carpenter, D. Welten, and S.N. Blair. Nutrient intake
of physically fit and unfit men and women. Med. Sci. Sports. Exerc. 33:459-467, 2001.
5. Carnethon M.R., S.S. Gidding, R. Nehgme, S. Sidney, D.R. Jacobs, and K. Liu.
Cardiorespiratory fitness in young adulthood and the development of cardiovascular
disease risk factors. JAMA 290:3092-3100, 2003.
6. Carter J.R., C.A. Ray, E.M. Downs, and W.H. Cooke. Strength training reduces arterial
blood pressure but not sympathetic neural activity in young normotensive subjects. J.
Appl. Physiol. 94:2212-2216, 2003.
7. Deriemaeker P., D. Aerenhouts, M. Hebbelinck, and P. Clarys. Validation of a 3-day diet
diary: comparison with a 7-day diet diary and a FFQ. Med. Sci. Sports. Exerc. 38:S328,
2006.
8. Drouin J.M., T.C. Valovich-mcLeod, S.J. Shultz, B.M. Gansneder, and D.H. Perrin.
Reliability and validity of the Biodex system 3 pro isokinetic dynamometer velocity,
torque and position measurements. Eur. J. Appl. Physiol. 91: 22-29, 2004.
9. Eckel R.H., S.M. Grundy, and P.Z. Zimmet. The metabolic syndrome. Lancet 365:1415-
1428, 2005.
10. Eisenmann J.C., E.E. Wickel, G.J. Welk, and S.N. Blair. Relationship between adolescent
fitness and fatness and cardiovascular disease risk factors in adulthood: the Aerobics
Center Longitudinal Study (ACLS). Am. Heart J. 149:46-53, 2005.
11. Expert Panel on the Detection, Evaluation, and Treatment of High Blood Cholesterol in
Adults: Executive summary of the Third Report of the National Cholesterol Education
Program (NCEP) Expert Panel on Detection, Evaluation, and Treatment of High Blood
Cholesterol in Adults (Adult Treatment Panel III). JAMA 285:2486-2497, 2001.
12. Fahlman M.M., D. Boardley, C.P. Lambert, and M.G. Flynn. Effects of endurance
training and resistance training on plasma lipoprotein profiles in elderly women. J.
Gerontol. A. Biol. Sci. Med. Sci. 57:B54-B60, 2002.

Muscular strength, aerobic fitness and metabolic risk
139
13. Han T.S., K. Williams, N. Sattar, K.J. Hunt, M.E.J. Lean, and S.M. Haffner. Analysis of
obesity and hyperinsulinemia in the development of metabolic syndrome: San Antonio
Heart Study. Obes. Res. 10:923-931, 2002.
14. Jurca R., M.J. LaMonte, C.E. Barlow, J.B. Kampert, T.S. Church, and S.N. Blair.
Association of muscular strength with incidence of metabolic syndrome in men. Med. Sci.
Sports Exerc. 37:1849-1855, 2005.
15. Jurca R., M.J. LaMonte, T.S. Church, et al. Associations of muscle strength and aerobic
fitness with metabolic syndrome in men. Med. Sci. Sports Exerc. 36:1301-1307, 2004.
16. Kahn R., J. Buse, E. Ferrannini, and M. Stern. The Metabolic Syndrome: time for a
critical appraisal: joint statement from the American Diabetes Association and the
European Association for the Study of Diabetes. Diabetes Care 28:2289-2304, 2005.
17. Klein B.E.K., R. Klein, K.E. Lee. Components of the metabolic syndrome and risk of
cardiovascular disease and diabetes in Beaver Dam. Diabetes Care 25:1790-1794, 2002.
18. Laaksonen D.E., H.M. Lakka, L.K. Niskanen, G.A. Kaplan, J.T. Salonen, and T.A.
Lakka. Metabolic syndrome and development of diabetes mellitus: application and
validation of recently suggested definitions of the metabolic syndrome in a prospective
cohort study. Am. J. Epidemiol. 156:1070-1077, 2002.
19. Lakka H.M., D.E. Laaksonen, T.A. Lakka, et al. The metabolic syndrome and total and
cardiovascular disease mortality in middle-aged men. JAMA 288:2709-2716, 2002.
20. LaMonte M.J., C.E. Barlow, R. Jurca, J.B. Kampert, T.S. Church, S.N. Blair.
Cardiorespiratory fitness is inversely associated with the incidence of metabolic
syndrome - A prospective study of men and women. Circulation 112:505-512, 2005.
21. LaMonte M.J., P.A. Eisenman, T.D. Adams, B.B. Shultz, B.E. Ainsworth, and F.G.
Yanowitz. Cardiorespiratory fitness and coronary heart disease risk factors - The LDS
Hospital Fitness Institute cohort. Circulation 102:1623-1628, 2000.
22. Meyer T., T. Georg, C. Becker, and W. Kindermann. Reliability of gas exchange
measurements from two different spiroergometry systems. Int. J. Sports Med. 22: 593-
597, 2001.
23. Newman A.B., V. Kupelian, M. Visser, et al. Strength, but not muscle mass, is associated
with mortality in the Health, Aging and Body Composition Study Cohort. J. Gerontol. A.
Biol. Sci. Med. Sci. 61:72-77, 2006.
24. Philippaerts R., L. Matton, K. Wijndaele, A.L. Balduck, I. De Bourdeaudhuij, and J.
Lefevre. Validity of a physical activity computer questionnaire in 12- to 18- year old boys
and girls. Int. J. Sports Med. 27:131-136, 2006.
Chapter 2.2.3.
140
25. Ragland D.R. Dichotomizing continuous outcome variables - dependence of the
magnitude of association and statistical power on the cutpoint. Epidemiology 3:434-440,
1992.
26. Stewart K.J., A.C. Bacher, K. Turner, et al. Exercise and risk factors associated with
metabolic syndrome in older adults. Am. J. Prev. Med. 28:9-18, 2005.
27. Welsman J.R., N. Armstrong, A.M. Nevill, E.M. Winter, and B.J. Kirby. Scaling peak-
2OV& for differences in body size. Med. Sci. Sports Exerc. 28:259-265, 1996.
28. Whaley M.H., J.B. Kampert, H.W. Kohl, and S.N. Blair. Physical fitness and clustering
of risk factors associated with the metabolic syndrome. Med. Sci. Sports Exerc. 31:287-
293, 1999.
29. WHO MONICA Project: MONICA Manual. Part III: Population Survey. Section 1:
Population survey data component, 1997.
30. Wijndaele K., G. Beunen, N. Duvigneaud, et al. A continuous metabolic syndrome risk
score: utility for epidemiological analyses. Diabetes Care. In press.
CHAPTER 2.2.4.
A PATH MODEL OF HEALTH-RELATED LIFESTYLE,
PHYSICAL FITNESS, DISTRESS AND
METABOLIC SYNDROME RISK FACTORS IN ADULTS
K Wijndaele, M Thomis, L Matton, N Duvigneaud, W Duquet, G Beunen, J Lefevre, HH Maes, RM Philippaerts
Psychosomatic Medicine, submitted
The contribution of the first two authors in the present study was equal.

Lifestyle, fitness, distress and metabolic risk
143
Abstract
Objective: To study a model causally linking psychological distress, health-related lifestyle
and physical fitness to a metabolic syndrome (MSy) risk factor structure in adults.
Methods: This cross-sectional study included 965 Flemish adults (549 men), aged 18 to 75,
without cardiovascular disease and diabetes. Latent variable structural equation modeling was
applied to determine factor structure of distress (stress, depression, anxiety, sleeping
problems), health-related lifestyle (physical activity, sedentary behaviour, alcohol intake, fat
intake), physical fitness (aerobic fitness, muscular strength) and MSy (waist, triglycerides,
HDL cholesterol, blood pressure, glucose) and to estimate contribution of distress, health-
related lifestyle and physical fitness in explaining MSy variance.
Results: Factor loadings of indicators on their respective latent variables were significant (p
<.05), except for health-related lifestyle, on which only physical activity loaded significantly
in both genders. Two-group analysis revealed that factor structure of latent variables was sex-
specific, whereas causal paths between latent variables could be equated between sexes. In
total, 39.6% of MSy variance could be accounted for by distress, health-related lifestyle and
physical fitness. Physical fitness contributed the largest part (32.7 %), which was decomposed
in a direct physical fitness effect (22.8 %), and an indirect health-related lifestyle effect (9.9
%). Direct contributions of health-related lifestyle (0.8%) and distress (0.068%) were
negligible, whereas contribution of all possible covariance pathways contributed another
6.0%.
Conclusions: Although cross-sectional, these results support a protective effect of higher
physical fitness and physical activity against the MSy, in which the latter effect is primarily
mediated by resulting higher levels of physical fitness.
Key Words: stress; aerobic fitness; insulin resistance syndrome; structural equation
modeling; adult; physical activity.
Acronyms: -2lnL = -2 times log-likelihood; CVD = cardiovascular disease; df = degrees of
freedom; MSy = metabolic syndrome; FFM = fat free mass; FPACQ = Flemish Physical
Activity Computerized Questionnaire; HDLc = high density lipoprotein cholesterol; HRLS =
health-related lifestyle; HRT = hormone replacement therapy; LVSEM = latent variable
structural equation modeling; METs = metabolic equivalent tasks; SPAH = Sport Physical
Activity and Health; 2OV& peak = peak oxygen uptake; WHO = World Health Organization.
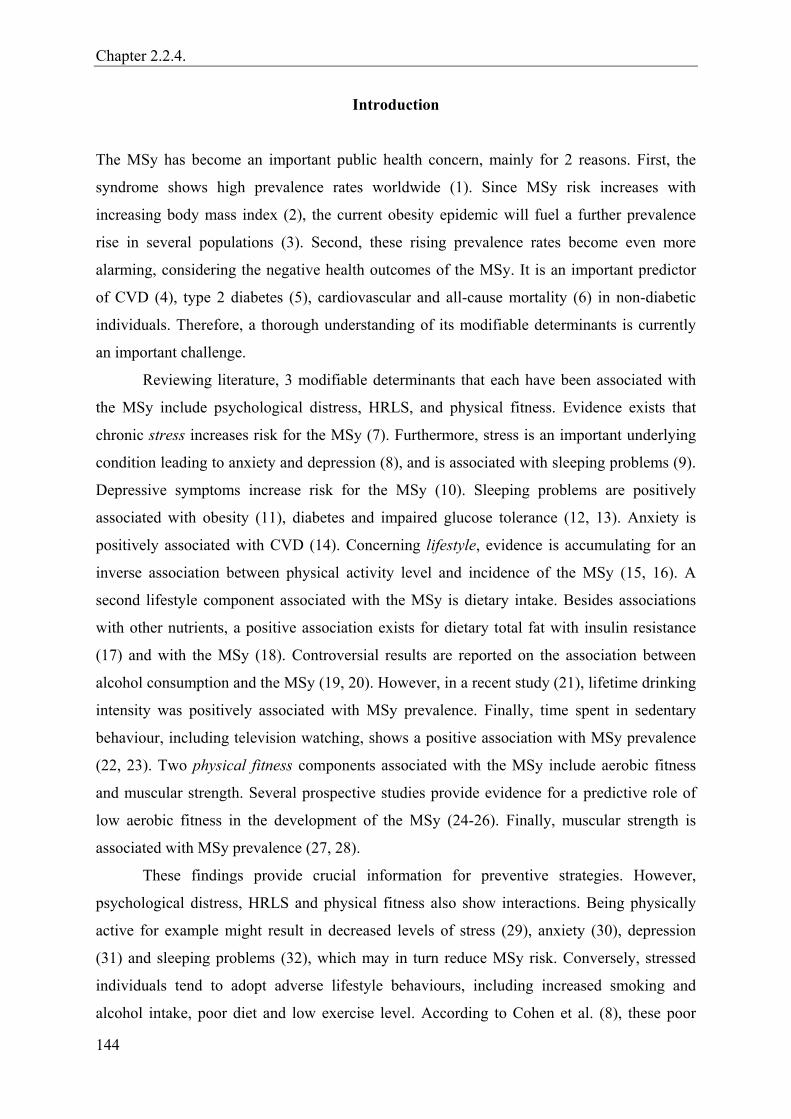
Chapter 2.2.4.
144
Introduction
The MSy has become an important public health concern, mainly for 2 reasons. First, the
syndrome shows high prevalence rates worldwide (1). Since MSy risk increases with
increasing body mass index (2), the current obesity epidemic will fuel a further prevalence
rise in several populations (3). Second, these rising prevalence rates become even more
alarming, considering the negative health outcomes of the MSy. It is an important predictor
of CVD (4), type 2 diabetes (5), cardiovascular and all-cause mortality (6) in non-diabetic
individuals. Therefore, a thorough understanding of its modifiable determinants is currently
an important challenge.
Reviewing literature, 3 modifiable determinants that each have been associated with
the MSy include psychological distress, HRLS, and physical fitness. Evidence exists that
chronic stress increases risk for the MSy (7). Furthermore, stress is an important underlying
condition leading to anxiety and depression (8), and is associated with sleeping problems (9).
Depressive symptoms increase risk for the MSy (10). Sleeping problems are positively
associated with obesity (11), diabetes and impaired glucose tolerance (12, 13). Anxiety is
positively associated with CVD (14). Concerning lifestyle, evidence is accumulating for an
inverse association between physical activity level and incidence of the MSy (15, 16). A
second lifestyle component associated with the MSy is dietary intake. Besides associations
with other nutrients, a positive association exists for dietary total fat with insulin resistance
(17) and with the MSy (18). Controversial results are reported on the association between
alcohol consumption and the MSy (19, 20). However, in a recent study (21), lifetime drinking
intensity was positively associated with MSy prevalence. Finally, time spent in sedentary
behaviour, including television watching, shows a positive association with MSy prevalence
(22, 23). Two physical fitness components associated with the MSy include aerobic fitness
and muscular strength. Several prospective studies provide evidence for a predictive role of
low aerobic fitness in the development of the MSy (24-26). Finally, muscular strength is
associated with MSy prevalence (27, 28).
These findings provide crucial information for preventive strategies. However,
psychological distress, HRLS and physical fitness also show interactions. Being physically
active for example might result in decreased levels of stress (29), anxiety (30), depression
(31) and sleeping problems (32), which may in turn reduce MSy risk. Conversely, stressed
individuals tend to adopt adverse lifestyle behaviours, including increased smoking and
alcohol intake, poor diet and low exercise level. According to Cohen et al. (8), these poor
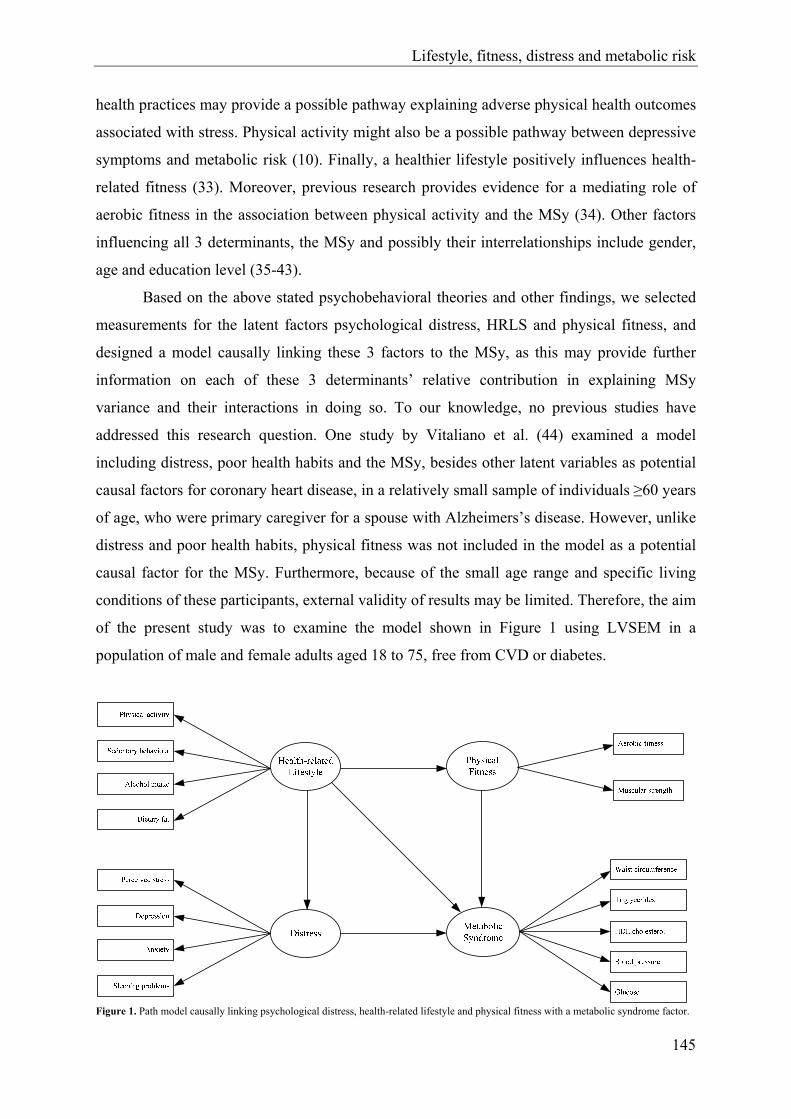
Lifestyle, fitness, distress and metabolic risk
145
health practices may provide a possible pathway explaining adverse physical health outcomes
associated with stress. Physical activity might also be a possible pathway between depressive
symptoms and metabolic risk (10). Finally, a healthier lifestyle positively influences health-
related fitness (33). Moreover, previous research provides evidence for a mediating role of
aerobic fitness in the association between physical activity and the MSy (34). Other factors
influencing all 3 determinants, the MSy and possibly their interrelationships include gender,
age and education level (35-43).
Based on the above stated psychobehavioral theories and other findings, we selected
measurements for the latent factors psychological distress, HRLS and physical fitness, and
designed a model causally linking these 3 factors to the MSy, as this may provide further
information on each of these 3 determinants’ relative contribution in explaining MSy
variance and their interactions in doing so. To our knowledge, no previous studies have
addressed this research question. One study by Vitaliano et al. (44) examined a model
including distress, poor health habits and the MSy, besides other latent variables as potential
causal factors for coronary heart disease, in a relatively small sample of individuals ≥60 years
of age, who were primary caregiver for a spouse with Alzheimers’s disease. However, unlike
distress and poor health habits, physical fitness was not included in the model as a potential
causal factor for the MSy. Furthermore, because of the small age range and specific living
conditions of these participants, external validity of results may be limited. Therefore, the aim
of the present study was to examine the model shown in Figure 1 using LVSEM in a
population of male and female adults aged 18 to 75, free from CVD or diabetes.
Figure 1. Path model causally linking psychological distress, health-related lifestyle and physical fitness with a metabolic syndrome factor.
Chapter 2.2.4.
146
More specifically, we investigated 1) what percentage of MSy variance is explained
by psychological distress, HRLS and/or physical fitness collectively; 2) whether these
relationships are gender-specific; and 3) whether psychological distress, HRLS and/or
physical fitness differ in their relative contribution in explaining MSy variance.
Methods
Subjects
Data for this study were collected by the Flemish Policy Research Centre ‘Sport, Physical
Activity and Health’ (SPAH) between October 2002 and April 2004, as part of a cross-
sectional survey on the relationship between physical activity, physical fitness and several
health parameters. For this purpose, the National Institute of Statistics randomly selected a
community sample of 18- to 75-year-old adults in the Flemish part of Belgium. Subjects were
asked to visit the SPAH examination center to provide a fasting blood sample, to go through
a medical examination, anthropometric measurements, physical fitness tests, and some
questionnaires. Participants with complete data for variables used in analyses, were included
in the current study. Participants were excluded in case of history or evidence of CVD
(abnormal heart auscultation or rest electrocardiogram; sudden death of father/brother <45, or
mother/sister <55 years of age; systolic blood pressure >150 mmHg or diastolic blood
pressure >100 mmHg; use of antihypertensive or lipid-lowering drugs), diabetes mellitus, or
in case they did not achieve at least 85% of the age-predicted maximal heart rate during a
maximal cycle ergometer test. Consequently, results are based on data of 549 men and 416
nonpregnant women. MSy prevalence according to the International Diabetes Federation (45)
was 71 (12.9 %) in males and 35 (8.4 %) in females. The study was approved by the
Katholieke Universiteit Leuven Medical Ethics Committee. Prior to participation, study
purpose and procedures were explained and subjects gave written informed consent.
Data collection
MSy risk factors. The 5 risk factors in the International Diabetes Federation MSy definition
(45) were included in analyses, more specifically waist circumference, triglycerides, HDLc,
blood pressure (systolic and diastolic) and fasting plasma glucose. A detailed description of
measurement procedures of these 5 risk factors is provided elsewhere (28).

Lifestyle, fitness, distress and metabolic risk
147
Measures of physical fitness. The measurement protocols of muscular strength and aerobic
fitness are described in more detail by Wijndaele et al. (28). In short, muscular strength was
evaluated by measuring isometric knee extension and flexion peak torque, using a Biodex
System Pro 3 dynamometer, producing reliable and valid measurements (46). Aerobic fitness
was quantified as 2OV& peak, determined during a maximal cycle ergometer exercise test.
Oxygen consumption was measured directly using a Cortex Metalyser 3B, generating highly
reliable results (47). Both strength and aerobic fitness were scaled for differences in FFM,
using allometric analyses (48).
Measures of HRLS. To assess dietary intake, subjects completed a validated 3-day diet
record (49). Diet records were analysed using Becel Nutrition software (Unilever Co.,
Rotterdam, the Netherlands). Both alcohol and fat intake were expressed as percentage of
total energy intake (%). Sedentary behaviour and leisure time physical activity were assessed
using the validated Flemish Physical Activity Computerized Questionnaire (FPACQ) (50).
Participants were asked to indicate time spent watching television/video or using computer
during a usual weekday and weekendday (from 0 to ≥6 h/day) to calculate an average week
score for sedentary behaviour (h/week). Levels of leisure time physical activity were
evaluated in several domains. Sports participation was assessed by asking subjects to select
their 3 most important sports out of a list of 196 sports. For each of these sports, frequency
(from 1 week/year to >7 times/week) and duration (from <1 to >20 h/week) were reported.
Active transportation in leisure time was determined by asking time spent in walking and
cycling as transportation in leisure time, during a usual weekday and weekendday (from 0 to
>60 min/day). Furthermore, time spent in housekeeping and gardening was assessed (from 0
to >14 h/week). Intensity level of all activities, expressed in METs, was defined according to
the classification of Ainsworth et al. (51). Because of the wide age range of this study
population, age-specific METs cut points were used to include activities of at least moderate
intensity, as proposed in the current physical activity recommendations (52). More
specifically, leisure time physical activity (h/week) was computed by summing time spent in
activities of the following intensity: aged 18-39: METs ≥4.8; aged 40-64: METs ≥4.5; aged
65-75: METs ≥3.6.
Measures of distress. Level of perceived stress was assessed by means of the Perceived
Stress Scale (53). The Symptom Checklist (54) was used to measure level of anxiety,
depression and sleeping problems. A computerized version of both scales was used.
Reliability, internal consistency and equivalence of the computerized and traditional paper-

Chapter 2.2.4.
148
and-pencil version were evaluated in 2 separate samples of 18- to 75-year-old Flemish adults.
A more detailed description of both scales and results on reliability, internal consistency and
equivalence are provided elsewhere (55, 56).
Confounding variables. Three confounding variables were included in analyses, more
specifically age (years), education level (low, high) and smoking status (current, former,
never). Education level was assessed using the FPACQ (50), and data were reduced from 13
to 2 levels, more specifically secondary school or lower and university or college. Smoking
status was determined by means of the WHO Monica Smoking Questionnaire (57).
Statistical analyses
Descriptive statistics and data preparation were performed using SPSS12.0 (SPSS, Inc.,
Chicago, IL). Shapiro-Wilk tests revealed a skewed distribution for some variables. To
improve normality, inverse (depression, anxiety, sleeping problems), logarithmic (waist
circumference, triglycerides, HDLc, blood pressure, glucose, physical activity, alcohol
intake) or square root (perceived stress, sedentary behaviour) transformations were applied.
Differences between sexes were analyzed by means of independent samples t-tests and
Pearson Chi²-tests.
Gender-specific multiple linear regressions were applied to each observed variable to
adjust for the confounding effects of age, education level and smoking status. Variance
explained by age, education level and smoking status collectively ranged from R² = .01
(sleeping problems, anxiety and depression) to .19 (aerobic fitness) in men and from R² = .01
(anxiety and depression) to .20 (blood pressure) in women. Smoking status may theoretically
be considered as part of the HRLS factor. However, its categorical character precluded its
inclusion as an observed variable loading on the HRLS factor. Standardized residuals,
resulting from multiple linear regressions were used in further statistical analyses. Pearson
correlation coefficients were calculated to investigate bivariate associations between
standardized residuals. Subsequently, standardized residuals scores were entered as raw data
into the structural equation models, using maximum likelihood analysis of raw continuous
data in Mx GUI (58). A two-group (males/females) analysis of the model shown in Figure 1
was tested first with all parameters modeled to be gender-specific. A first submodel tested
whether all parameter estimates in males and females could be equated, a second whether
causal paths between latent factors showed gender heterogeneity. Alternative models were
compared by Chi²-ratio tests with Chi² equal to the difference in -2lnL of both models and df
as the difference in degrees of freedom between both models. Furthermore, a model with a
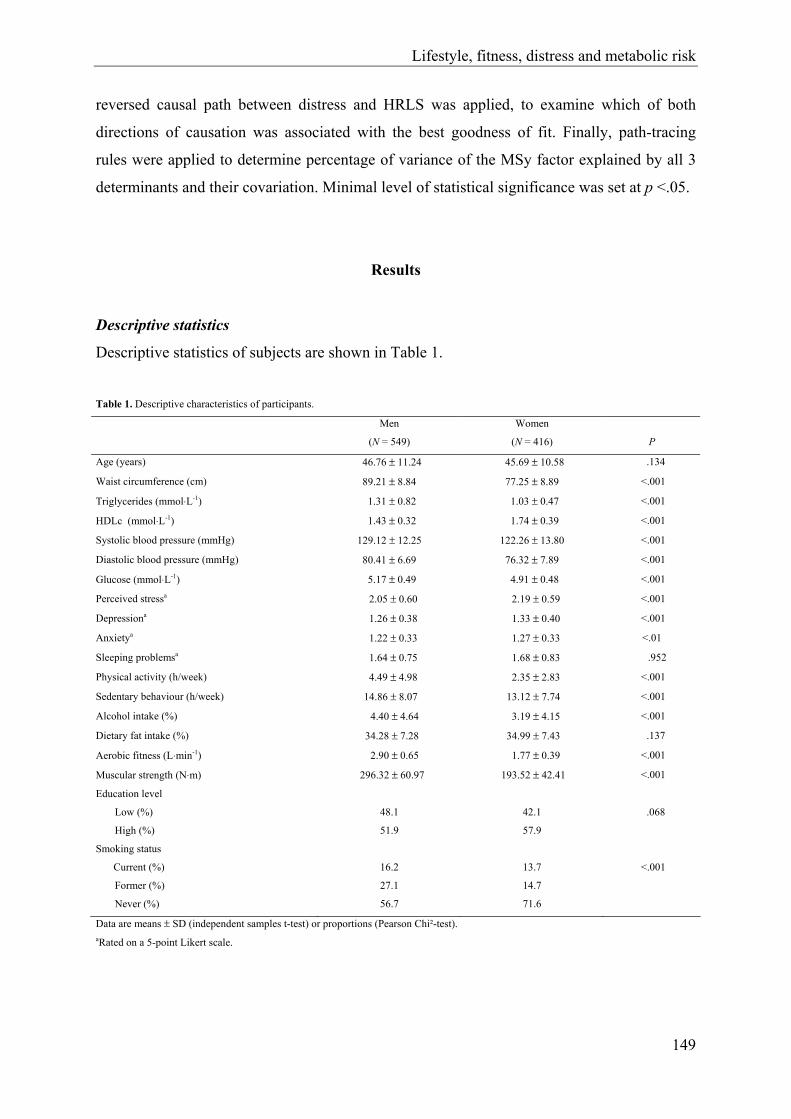
Lifestyle, fitness, distress and metabolic risk
149
reversed causal path between distress and HRLS was applied, to examine which of both
directions of causation was associated with the best goodness of fit. Finally, path-tracing
rules were applied to determine percentage of variance of the MSy factor explained by all 3
determinants and their covariation. Minimal level of statistical significance was set at p <.05.
Results
Descriptive statistics
Descriptive statistics of subjects are shown in Table 1.
Table 1. Descriptive characteristics of participants.
Men
(N = 549)
Women
(N = 416)
P
Age (years) 46.76 ± 11.24 45.69 ± 10.58 .134
Waist circumference (cm) 89.21 ± 8.84 77.25 ± 8.89 <.001
Triglycerides (mmol⋅L-1) 1.31 ± 0.82 1.03 ± 0.47 <.001
HDLc (mmol⋅L-1) 1.43 ± 0.32 1.74 ± 0.39 <.001
Systolic blood pressure (mmHg) 129.12 ± 12.25 122.26 ± 13.80 <.001
Diastolic blood pressure (mmHg) 80.41 ± 6.69 76.32 ± 7.89 <.001
Glucose (mmol⋅L-1) 5.17 ± 0.49 4.91 ± 0.48 <.001
Perceived stressa 2.05 ± 0.60 2.19 ± 0.59 <.001
Depressiona 1.26 ± 0.38 1.33 ± 0.40 <.001
Anxietya 1.22 ± 0.33 1.27 ± 0.33 <.01
Sleeping problemsa 1.64 ± 0.75 1.68 ± 0.83 .952
Physical activity (h/week) 4.49 ± 4.98 2.35 ± 2.83 <.001
Sedentary behaviour (h/week) 14.86 ± 8.07 13.12 ± 7.74 <.001
Alcohol intake (%) 4.40 ± 4.64 3.19 ± 4.15 <.001
Dietary fat intake (%) 34.28 ± 7.28 34.99 ± 7.43 .137
Aerobic fitness (L⋅min-1) 2.90 ± 0.65 1.77 ± 0.39 <.001
Muscular strength (N⋅m) 296.32 ± 60.97 193.52 ± 42.41 <.001
Education level
Low (%) 48.1 42.1 .068
High (%) 51.9 57.9
Smoking status
Current (%) 16.2 13.7 <.001
Former (%) 27.1 14.7
Never (%) 56.7 71.6
Data are means ± SD (independent samples t-test) or proportions (Pearson Chi²-test). aRated on a 5-point Likert scale.
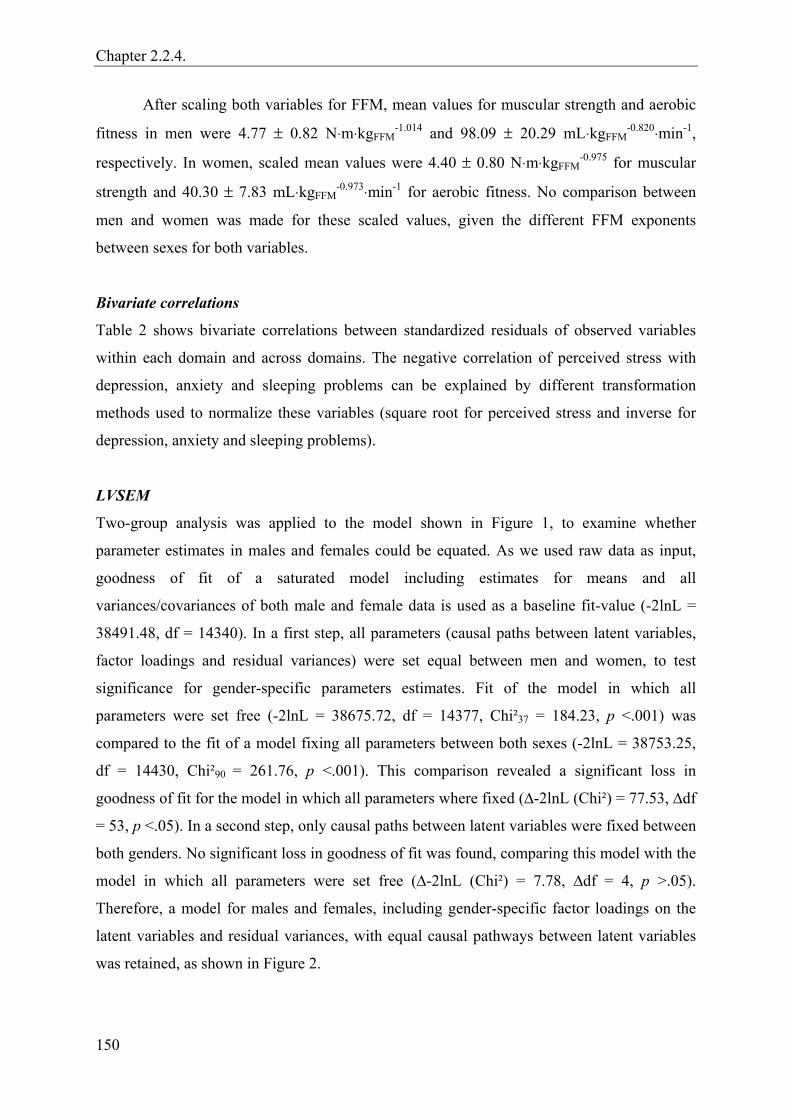
Chapter 2.2.4.
150
After scaling both variables for FFM, mean values for muscular strength and aerobic
fitness in men were 4.77 ± 0.82 N⋅m⋅kgFFM-1.014 and 98.09 ± 20.29 mL⋅kgFFM
-0.820⋅min-1,
respectively. In women, scaled mean values were 4.40 ± 0.80 N⋅m⋅kgFFM-0.975 for muscular
strength and 40.30 ± 7.83 mL⋅kgFFM-0.973⋅min-1 for aerobic fitness. No comparison between
men and women was made for these scaled values, given the different FFM exponents
between sexes for both variables.
Bivariate correlations
Table 2 shows bivariate correlations between standardized residuals of observed variables
within each domain and across domains. The negative correlation of perceived stress with
depression, anxiety and sleeping problems can be explained by different transformation
methods used to normalize these variables (square root for perceived stress and inverse for
depression, anxiety and sleeping problems).
LVSEM
Two-group analysis was applied to the model shown in Figure 1, to examine whether
parameter estimates in males and females could be equated. As we used raw data as input,
goodness of fit of a saturated model including estimates for means and all
variances/covariances of both male and female data is used as a baseline fit-value (-2lnL =
38491.48, df = 14340). In a first step, all parameters (causal paths between latent variables,
factor loadings and residual variances) were set equal between men and women, to test
significance for gender-specific parameters estimates. Fit of the model in which all
parameters were set free (-2lnL = 38675.72, df = 14377, Chi²37 = 184.23, p <.001) was
compared to the fit of a model fixing all parameters between both sexes (-2lnL = 38753.25,
df = 14430, Chi²90 = 261.76, p <.001). This comparison revealed a significant loss in
goodness of fit for the model in which all parameters where fixed (∆-2lnL (Chi²) = 77.53, ∆df
= 53, p <.05). In a second step, only causal paths between latent variables were fixed between
both genders. No significant loss in goodness of fit was found, comparing this model with the
model in which all parameters were set free (∆-2lnL (Chi²) = 7.78, ∆df = 4, p >.05).
Therefore, a model for males and females, including gender-specific factor loadings on the
latent variables and residual variances, with equal causal pathways between latent variables
was retained, as shown in Figure 2.

Lifestyle, fitness, distress and metabolic risk
151
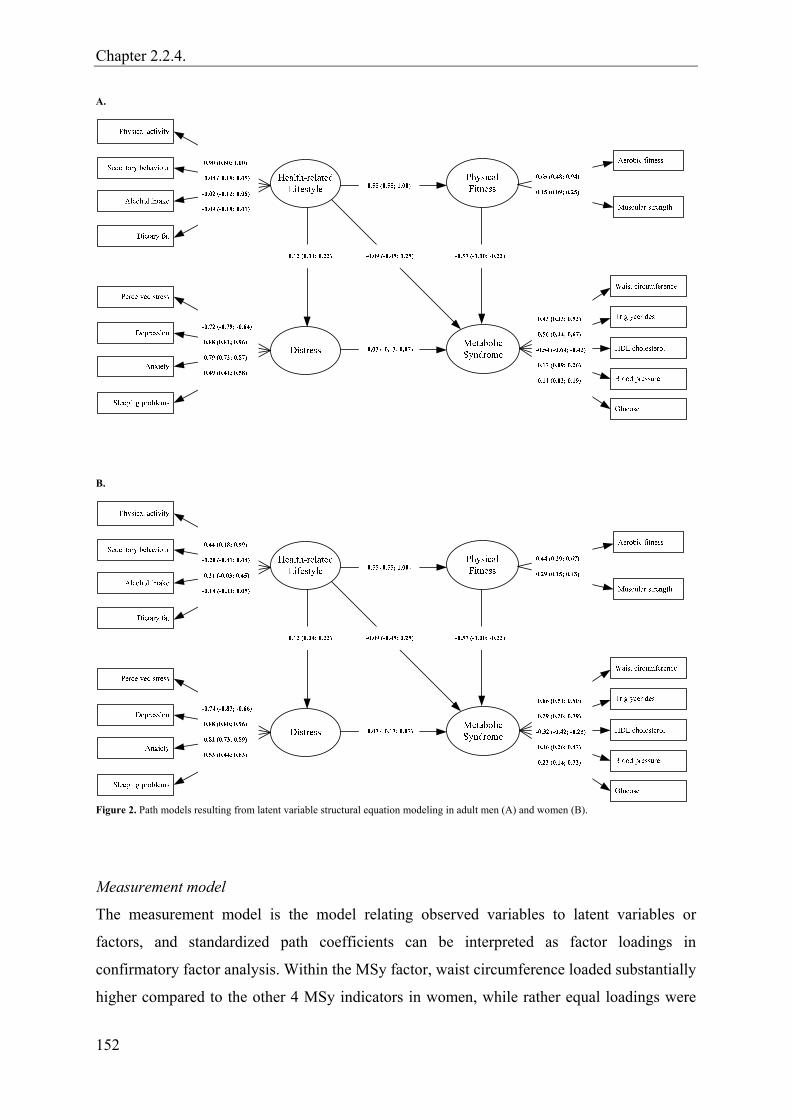
Chapter 2.2.4.
152
A.
B.
Figure 2. Path models resulting from latent variable structural equation modeling in adult men (A) and women (B).
Measurement model
The measurement model is the model relating observed variables to latent variables or
factors, and standardized path coefficients can be interpreted as factor loadings in
confirmatory factor analysis. Within the MSy factor, waist circumference loaded substantially
higher compared to the other 4 MSy indicators in women, while rather equal loadings were

Lifestyle, fitness, distress and metabolic risk
153
found for waist circumference, triglycerides and HDLc in men (see Figure 2). HDLc loaded
negatively on the MSy factor in both genders. Concerning the distress construct, similar
factor loadings were found in both genders (positive loadings for depression, anxiety and
sleeping problems should be interpreted keeping in mind they were inversely transformed).
More divergent results were found for the HRLS factor. In men, this was predominantly a
physical activity factor, as no significant loadings were found for sedentary behaviour,
alcohol intake and dietary fat. More equal loadings were found in women, however physical
activity was still the only variable significantly loading. In the physical fitness construct, a
substantially higher loading was found for aerobic fitness in men, whereas in women loadings
between aerobic fitness and muscular strength were more comparable. Residual variances of
measured variables were highest for alcohol intake (.99), sedentary behaviour (.99) and fat
intake (.98) and lowest for physical activity level (.18) in men. In women, residual variances
were highest for fat intake (.97), sedentary behaviour (.95) and alcohol intake (.94), and
lowest for depression (.21).
Structural model
The structural model is the regression part of latent variable structural equation modeling. As
shown in Figure 2, 3 causal paths between latent variables were significant. The negative
causal path from physical fitness to the MSy was the strongest (ß = -.57, CI = -1.00, -.22).
This path was preceded by a positive path from HRLS to physical fitness (ß = .55, CI = .55,
1.00). Finally, a marginally significant positive path was found between HRLS and distress (ß
= .12, CI = .04, .22). No significant paths were found from HRLS or distress to the MSy.
Reversing direction of causality between distress and HRLS resulted in an equal
overall fit. Causal pathways remained almost unchanged (distress to HRLS: .13; distress to
MSy: -.03; HRLS to MSy: -.09; physical fitness to MSy: -.57; HRLS to physical fitness: .55).
Applying path-tracing rules, explained variance in the MSy factor can be derived by
adding squared path coefficients of direct causal paths to the MSy factor and multiplication of
path coefficients of all possible covariaton paths. For the resulting model, 39.6% of variation
in the MSy factor could be accounted for by the 3 latent factors. Fitness contributed the
largest part with 32.7 %, which could be decomposed in a direct physical fitness effect of
22.8 %, and an indirect HRLS effect of 9.9 %. Direct contributions of HRLS (0.8%) and
distress (0.068%) were negligible, whereas contribution of all possible covariance pathways
contributed another 6.0%.

Chapter 2.2.4.
154
Discussion
In this study, a model hypothesizing causal pathways between psychological distress, HRLS,
physical fitness and a MSy factor was studied using LVSEM in an adult population of males
and females, free from CVD and diabetes. Physical fitness was the only latent variable
showing a significant direct causal path to the MSy factor, as opposed to HRLS and distress,
for which no significant direct paths to the MSy factor were found. In previous research,
Vitaliano et al. (44) hypothesized a model including distress, poor health habits and the MSy
besides other latent variables (not including physical fitness) as potential causal factors for
coronary heart disease. They examined this model using latent variable partial least squares
estimation in a small sample of men and women (2 groups, depending on use of HRT), who
were primary caregiver for a spouse with Alzheimer’s disease (N = 152; ≥ 60 years of age).
In cross-sectional analyses, the path from distress to the MSy was significant in men and
women not using HRT, whereas it was not significant in women using HRT. The path from
poor health habits to the MSy was significant in women but not in men. Longitudinal
analyses (measurement of distress and health habits was performed 15 to 18 months prior to
(new) measurements of MSy risk factors) in men only revealed a significant path between
poor health habits and the MSy, but not between distress and the MSy. Differences between
study results may be due to several factors. First, in the study by Vitaliano et al. (44), the
causal path structure between distress, health habits and the MSy is part of a larger model,
through which path coefficients are influenced by antecedent pathways. Furthermore, in the
present study, physical fitness showed to be an important mediating variable for HRLS, and
was not included in the study of Vitaliano et al. (44). This may explain differences found for
the direct path between HRLS and the MSy. Third, study populations differed substantially.
We adjusted for the confounding effect of age in the present study, whereas the caregiver
sample in the study by Vitaliano et al. (44) shows a specific age structure (≥60 years of age).
Furthermore, it is highly probable that a population of caregivers shows higher levels of
perceived stress and resulting depression, anxiety and sleeping problems, compared to the
population based sample in the present study, possibly explaining different results found for
the direct path between distress and the MSy. Fourth, although the concept of the distress,
HRLS and MSy latent variables was similar, variables used to construct the underlying
factors as well as factor loadings on these latent variables were not completely equal. Finally,
differences in statistical analysis methods and adjustment for confounding factors (e.g.
smoking behaviour) may also account for different study results.
Lifestyle, fitness, distress and metabolic risk
155
Physical fitness contributed the largest part in explaining MSy variance, compared to
HRLS and distress. This is in accordance with results of previous studies showing a strong
negative association between aerobic fitness -loading relatively strong on the physical fitness
factor especially in men- and MSy, which is independent of other possible determinants,
including physical activity (24-26). Furthermore, some studies found evidence for a negative
association between strength and the MSy (27, 28). However, part of the large difference
between physical fitness, HRLS and distress in their contribution to explain MSy variance
may be due to differences in measurement techniques. Measurement error for aerobic fitness
and muscular strength was probably smaller, partly as a consequence of the fact that physical
fitness indicators were measured objectively, as opposed to distress and HRLS indicators,
which were measured by self-report questionnaires.
HRLS mainly contributed in explaining MSy in an indirect way, via physical fitness.
Taking into account the large loadings of physical activity and aerobic fitness on the
respective latent variables, this result is consistent with previous research showing a
mediating role of aerobic fitness in the association between physical activity level and the
MSy (34).
Several reasons may account for the rather low overall fit of the model and small
causal path estimates between latent variables found in the present study. First of all, most
studies applying factor analysis to the different risk factors of the MSy, report at least 2 and
usually 3 to 4 factors to underlie overall correlation between risk factors (59). However, as in
the present study the MSy was represented by 1 factor only (accounting for part of MSy
variance), power to find strong associations with the MSy construct may have been reduced.
Similarly, to promote interpretability of the model, distress, HRLS and physical fitness were
also represented by 1 single factor. However, even without taking into consideration the
conservative representation of all latent factors in the model, measured variables underlying
the latent factors for HRLS, fitness and distress only correlate very moderately (ranging
between .01 and .32) with most of the individual measured variables of the MSy factor.
Second, the HRLS factor, although conceptually derived from 2 MSy-related energy intake
measures (overall fat/alcohol) and 2 energy expenditure measures (physical
activity/inactivity) was found to be a factor predominantly explained by physical activity,
especially in men. Similarly, low associations between health behaviour indicators were
found by Vitaliano et al. (44). Whether the high loading on the causal path from physical
fitness to MSy risk factors represents linked biological (genetic) pathways or other
environmental pathways could not be studied in this sample of unrelated individuals. Also
Chapter 2.2.4.
156
HRLS, as well as distress probably have an underlying biological (genetic) component
besides environmental sources of interindividual variation.
Reversing direction of causal paths between HRLS and distress, did not reveal
different results concerning model fit or path estimates. This may be due to the fact that path
estimates for causal paths from HRLS and distress to the MSy were both low. Furthermore,
although a marginally significant path estimate was found, correlation structure between the
indicators of HRLS and distress did not provide strong indication for a strong causal path
between both latent variables in either direction.
To our knowledge, this is the first study to include 3 possibly important modifiable
determinants of the MSy in 1 model, which enabled to compare relative contributions of all 3
factors in explaining MSy variance. A second major strength of this study was the use of a
large sample of adult males and females covering a wide age range. Although only subjects
free from CVD and diabetes were included, the use of this sample may provide higher
external validity. Furthermore, adjustment was made for confounding variables, including
smoking behaviour as opposed to previous research (44), a variable associated with the MSy
and other variables included in analyses (60-64).
Some limitations of this study should also be addressed. First of all, although causal
paths are estimated using LVSEM, causality of relationships per se cannot be determined
because of the cross-sectional design. MSy or its comorbidities may negatively influence
level of physical fitness, distress or HRLS, suggesting causality in the opposite direction.
However, the possible confounding influence of MSy comorbidities on physical fitness,
distress or HRLS is at least partially eliminated by excluding subjects with history/evidence
of CVD and type 2 diabetes. Second, the present study sample represents a more healthy
group of adults. Although this may render higher external validity of study results, the use of
a more heterogeneous sample, showing a higher variability for characteristics examined,
would probably yield stronger associations. Third, although only applicable to a smaller part
of the study population, the possible modifying effect of HRT on the associations studied was
not accounted for.
In conclusion, results of the present study indicate that almost 40% of MSy variance
can be accounted for by physical fitness, HRLS and psychological distress in men and
women, aged 18 to 75 without CVD or diabetes. In both genders, physical fitness is the most
important contributor, with HRLS (primarily defined by physical activity) showing a smaller
contribution, which is mediated by physical fitness. No significant contribution was found for
psychological distress. Although cross-sectional, these results may support that a higher level

Lifestyle, fitness, distress and metabolic risk
157
of physical fitness and physical activity may be protective against the MSy, and that the
effect of physical activity is primarily mediated by a resulting higher level of physical fitness.
Future longitudinal studies, including all 3 determinants in 1 model are needed to confirm
these causal relationships.
Acknowledgements
The Flemish Policy Research Centre SPAH is supported by the Flemish Government.
References
1. Cameron AJ, Shaw JE, Zimmet PZ. The metabolic syndrome: prevalence in worldwide
populations. Endocrinol Metab Clin North Am 2004;33:351-75.
2. Park YW, Zhu SK, Palaniappan L, Heshka S, Carnethon MR, Heymsfield SB. The
metabolic syndrome - Prevalence and associated risk factor findings in the US
population from the Third National Health and Nutrition Examination Survey, 1988-
1994. Arch Intern Med 2003;163:427-36.
3. Deen D. Metabolic syndrome: time for action. Am Fam Physician 2004;69:2875-82.
4. McNeill AM, Schmidt MI, Rosamond WD, East HE, Girman CJ, Ballantyne CM,
Golden SH, Heiss G. The metabolic syndrome and 11-year risk of incident
cardiovascular disease in the atherosclerosis risk in communities study. Diabetes Care
2005;28:385-90.
5. Hanley AJG, Karter AJ, Williams K, Festa A, D'Agostino RB, Wagenknecht LE,
Haffner SM. Prediction of type 2 diabetes mellitus with alternative definitions of the
metabolic syndrome - The insulin resistance atherosclerosis study. Circulation
2005;112:3713-21.
6. Sundstrom J, Riserus U, Byberg L, Zethelius B, Lithell H, Lind L. Clinical value of the
metabolic syndrome for long term prediction of total and cardiovascular mortality:
prospective, population based cohort study. Br Med J 2006;332:878-81.
7. Chandola T, Brunner E, Marmot M. Chronic stress at work and the metabolic
syndrome: prospective study. Br Med J 2006;332:521-4.

Chapter 2.2.4.
158
8. Cohen S, Kessler RC, Underwood L. Strategies for measuring stress in studies of
psychiatric and physical disorders. In: Cohen S, Kessler R, Underwood L, editors.
Measuring stress: a guide for health and social scientists. New York: Oxford; 1995. p.
3-26.
9. Linton SJ. Does work stress predict insomnia? A prospective study. Br J Health Psychol
2004;9:127-36.
10. McCaffery JM, Niaura R, Todaro JF, Swan GE, Carmelli D. Depressive symptoms and
metabolic risk in adult male twins enrolled in the National Heart, Lung, and Blood
Institute Twin Study. Psychosom Med 2003;65:490-7.
11. Gangwisch JE, Malaspina D, Boden-Albala B, Heymsfield SB. Inadequate sleep as a
risk factor for obesity: Analyses of the NHANES I. Sleep 2005;28:1289-96.
12. Gottlieb DJ, Punjabi NM, Newman AB, Resnick HE, Redline S, Baldwin CM, Nieto
FJ. Association of sleep time with diabetes mellitus and impaired glucose tolerance.
Arch Intern Med 2005;165:863-8.
13. Spiegel K, Leproult R, Van Cauter E. Impact of sleep debt on metabolic and endocrine
function. Lancet 1999;354:1435-9.
14. Smith TW, Ruiz JA. Psychosocial influences on the development and course of
coronary heart disease: current status and implications for research and practice. J
Consult Clin Psychol 2002;70:548-68.
15. Ekelund U, Brage S, Franks PW, Hennings S, Emms S, Wareham NJ. Physical activity
energy expenditure predicts progression toward the metabolic syndrome independently
of aerobic fitness in middle-aged healthy Caucasians: the Medical Research Council Ely
Study. Diabetes Care 2005;28:1195-200.
16. Laaksonen DE, Lakka HM, Salonen JT, Niskanen LK, Rauramaa R, Lakka TA. Low
levels of leisure-time physical activity and cardiorespiratory fitness predict development
of the metabolic syndrome. Diabetes Care 2002;25:1612-8.
17. Mayer EJ, Newman B, Quesenberry CP, Selby JV. Usual dietary-fat intake and insulin
concentrations in healthy women twins. Diabetes Care 1993;16:1459-69.
18. Freire RD, Cardoso MA, Gimeno SGA, Ferreira SRG. Dietary fat is associated with
metabolic syndrome in Japanese Brazilians. Diabetes Care 2005;28:1779-85.
19. Yoon YS, Oh SW, Baik HW, Park HS, Kim WY. Alcohol consumption and the
metabolic syndrome in Korean adults: the 1998 Korean National Health and Nutrition
Examination Survey. Am J Clin Nutr 2004;80:217-24.

Lifestyle, fitness, distress and metabolic risk
159
20. Djousse L, Arnett DK, Eckfeldt JH, Province MA, Singer MR, Ellison RC. Alcohol
consumption and metabolic syndrome: Does the type of beverage matter? Obes Res
2004;12:1375-85.
21. Fan AZ, Russell M, Dorn J, Freudenheim JL, Nochajski T, Hovey K, Trevisan M.
Lifetime alcohol drinking pattern is related to the prevalence of metabolic syndrome.
The Western New York Health Study (WNYHS). Eur J Epidemiol 2006;21:129-38.
22. Bertrais S, Beyeme-Ondoua JP, Czernichow S, Galan P, Hercberg S, Oppert JM.
Sedentary behaviors, physical activity, and metabolic syndrome in middle-aged French
subjects. Obes Res 2005;13:936-44.
23. Dunstan D, Salmon J, Owen N, Armstrong T, Zimmet P, Welborn T, Cameron A,
Dwyer T, Jolley D, Shaw J, on behalf of the AusDiab Steering Committee. Associations
of TV viewing and physical activity with the metabolic syndrome in Australian adults.
Diabetologia 2005;48:2254-61.
24. Ferreira I, Twisk JWR, van Mechelen W, Kemper HCG, Stehouwer CDA.
Development of fatness, fitness, and lifestyle from adolescence to the age of 36 years -
Determinants of the metabolic syndrome in young adults: the Amsterdam growth and
health longitudinal study. Arch Intern Med 2005;165:42-8.
25. LaMonte MJ, Barlow CE, Jurca R, Kampert JB, Church TS, Blair SN.
Cardiorespiratory fitness is inversely associated with the incidence of metabolic
syndrome - A prospective study of men and women. Circulation 2005;112:505-12.
26. Carnethon MR, Gidding SS, Nehgme R, Sidney S, Jacobs DR, Liu K. Cardiorespiratory
fitness in young adulthood and the development of cardiovascular disease risk factors.
JAMA 2003;290:3092-100.
27. Jurca R, LaMonte MJ, Church TS, Earnest CP, Fitzgerald SJ, Barlow CE, Jordan AN,
Kampert JB, Blair SN. Associations of muscle strength and aerobic fitness with
metabolic syndrome in men. Med Sci Sports Exerc 2004;36:1301-7.
28. Wijndaele K, Duvigneaud N, Matton L, Duquet W, Thomis M, Beunen G, Lefevre J,
Philippaerts RM. Muscular strength, aerobic fitness and metabolic syndrome risk in
Flemish adults. Med Sci Sports Exerc. In press.
29. Scully D, Kremer J, Meade MM, Graham R, Dudgeon K. Physical exercise and
psychological well being: a critical review. Br J Sports Med 1998;32:111-20.
30. O'Connor PJ, Raglin JS, Martinsen EW. Physical activity, anxiety and anxiety
disorders. Int J Sport Psychol 2000;31:136-55.
Chapter 2.2.4.
160
31. O'Neal HA, Dunn AL, Martinsen EW. Depression and exercise. Int J Sport Psychol
2000;31:110-35.
32. Fabsitz RR, Sholinsky P, Goldberg J. Correlates of sleep problems among men: the
Vietnam Era Twin Registry. J Sleep Res 1997;6:50-6.
33. Bouchard C, Shephard RJ. Physical activity, fitness, and health: the model and key
concepts. In: Bouchard C, Shephard RJ, Stephens T, editors. Physical activity, fitness,
and health: international proceedings and consensus statement. Champaign: Human
Kinetics; 1994. p. 77-88.
34. Rennie KL, McCarthy N, Yazdgerdi S, Marmot M, Brunner E. Association of the
metabolic syndrome with both vigorous and moderate physical activity. Int J Epidemiol
2003;32:600-6.
35. Regitz-Zagrosek V, Lehmkuhl E, Weickert MO. Gender differences in the metabolic
syndrome and their role for cardiovascular disease. Clin Res Cardiol 2006;95:136-47.
36. Ford ES, Giles WH, Dietz WH. Prevalence of the metabolic syndrome among US
adults - Findings from the Third National Health and Nutrition Examination Survey.
JAMA 2002;287:356-9.
37. Silventoinen K, Pankow J, Jousilahti P, Hu G, Tuomilehto J. Educational inequalities in
the metabolic syndrome and coronary heart disease among middle-aged men and
women. Int J Epidemiol 2005;34:327-34.
38. Stephens T, Caspersen CJ. The demography of physical activity. In: Bouchard C,
Shephard RJ, Stephens T, editors. Physical activity, fitness, and health: international
proceedings and consensus statement. Champaign: Human Kinetics; 1994. p. 204-13.
39. Shapo L, Pomerleau J, Mckee M. Physical inactivity in a country in transition: a
population-based survey in Tirana City, Albania. Scand J Public Health 2004;32:60-7.
40. European Commission. A PAN-EU survey on consumer attitudes to physical activity,
body-weight and health. Luxembourg: Office for Official Publications of the European
Communities; 1999.
41. Casswell S, Pledger M, Hooper R. Socioeconomic status and drinking patterns in young
adults. Addiction 2003;98:601-10.
42. Tepper BJ, Choi YS, Nayga RM. Understanding food choice in adult men: influence of
nutrition knowledge, food beliefs and dietary restraint. Food Quality and Preference
1997;8:307-17.
43. Shephard RJ. Demography of health-related fitness levels within and between
populations. In: Bouchard C, Shephard RJ, Stephens T, editors. Physical activity,

Lifestyle, fitness, distress and metabolic risk
161
fitness, and health: international proceedings and consensus statement. Champaign:
Human Kinetics; 1994. p. 239-56.
44. Vitaliano PP, Scanlan JM, Zhang JP, Savage MV, Hirsch IB, Siegler IC. A path model
of chronic stress, the metabolic syndrome, and coronary heart disease. Psychosom Med
2002;64:418-35.
45. The IDF consensus worldwide definition of the metabolic syndrome [article online],
2005. http://www.idf.org/webdata/docs/Metabolic_syndrome_definition.pdf. 5-5-2005.
46. Drouin JM, Valovich-mcLeod TC, Shultz SJ, Gansneder BM, Perrin DH. Reliability
and validity of the Biodex system 3 pro isokinetic dynamometer velocity, torque and
position measurements. Eur J Appl Physiol 2004;91:22-9.
47. Meyer T, Georg T, Becker C, Kindermann W. Reliability of gas exchange
measurements from two different spiroergometry systems. Int J Sports Med
2001;22:593-7.
48. Welsman JR, Armstrong N, Nevill AM, Winter EM, Kirby BJ. Scaling peak VO2 for
differences in body size. Med Sci Sports Exerc 1996;28:259-65.
49. Deriemaeker P, Aerenhouts D, Hebbelinck M, Clarys P. Validation of a 3-day diet
diary: comparison with a 7-day diet diary and a FFQ. Med Sci Sports Exerc
2006;38:S28.
50. Matton L, Wijndaele K, Duvigneaud N, Duquet W, Philippaerts R, Thomis M, Lefevre
J. Reliability and validity of the Flemish Physical Activity Computerized Questionnaire
(FPACQ) in adults. Res Q Exerc Sport. In press.
51. Ainsworth BE, Haskell WL, Whitt MC. Compendium of physical activity: an update of
activity codes and MET intensities. Med Sci Sports Exerc 2000;32:S498-S516.
52. US Department of Health and Human Services. Physical activity and health: a report of
the Surgeon General. Atlanta: USDHSS, Centers for Disease Control and Prevention,
National Center for Chronic Disease Prevention and Health Promotion; 1996.
53. Cohen S, Williamson GM. Perceived stress in a probability sample of the United States.
In: Spacapan S, Oskamp S, editors. The social psychology of health. Newbury Park,
CA: Sage; 1988. p. 31-67.
54. Arrindell WA, Ettema H. Symptom Checklist, manual of a multidimensional
psychopathology indicator. Lisse: Swets and Zeitlinger; 2003.
55. Wijndaele K, Matton L, Duvigneaud N, Lefevre J, Duquet W, Thomis M, De
Bourdeaudhuij I, Philippaerts R. Reliability, equivalence and respondent preference of
Chapter 2.2.4.
162
computerized versus paper-and-pencil mental health questionnaires. Comput Human
Behav. In press.
56. Wijndaele K, Matton L, Duvigneaud N, Lefevre J, De Bourdeaudhuij I, Duquet W,
Thomis M, Philippaerts RM. Association between leisure time physical activity and
stress, social support and coping: a cluster-analytical approach. Psychology of Sport and
Exercise. In press.
57. WHO MONICA Project. MONICA manual. Part III: Population survey. Section 1:
Population survey data component. 1997.
58. Neale M, Boker S, Xie G, Maes H. Mx: Statistical modeling. 6th ed. VCU Box 900126,
Richmond, VA 23298; 2003.
59. Kahn R, Buse J, Ferrannini E, Stern M. The metabolic syndrome: time for a critical
appraisal: joint statement from the American Diabetes Association and the European
Association for the Study of Diabetes. Diabetes Care 2005;28:2289-304.
60. Oh SW, Yoon YS, Lee ES, Kim WK, Park C, Lee S, Jeong EK, Yoo T. Association
between cigarette smoking and metabolic syndrome: The Korea National Health and
Nutrition Examination Survey. Diabetes Care 2005;28:2064-6.
61. Hirai T, Kusaka Y, Suganuma N, Seo A, Tobita Y. Physical work load affects the
maximum oxygen uptake. Ind Health 2006;44:250-7.
62. John U, Riedel J, Rumpf HJ, Hapke U, Meyer C. Associations of perceived work strain
with nicotine dependence in a community sample. Occup Environ Med 2006;63:207-
11.
63. John U, Meyer C, Rumpf HJ, Hapke U. Smoking, nicotine dependence and psychiatric
comorbidity - A population-based study including smoking cessation after three years.
Drug Alcohol Depend 2004;76:287-95.
64. Chiu HF, Leung T, Lam LCW, Wing YK, Chung DWS, Li SW, Chi I, Law WT, Boey
KW. Sleep problems in Chinese elderly in Hong Kong. Sleep 1999;22:717-26.

3.
GENERAL DISCUSSION AND
CONCLUSIONS

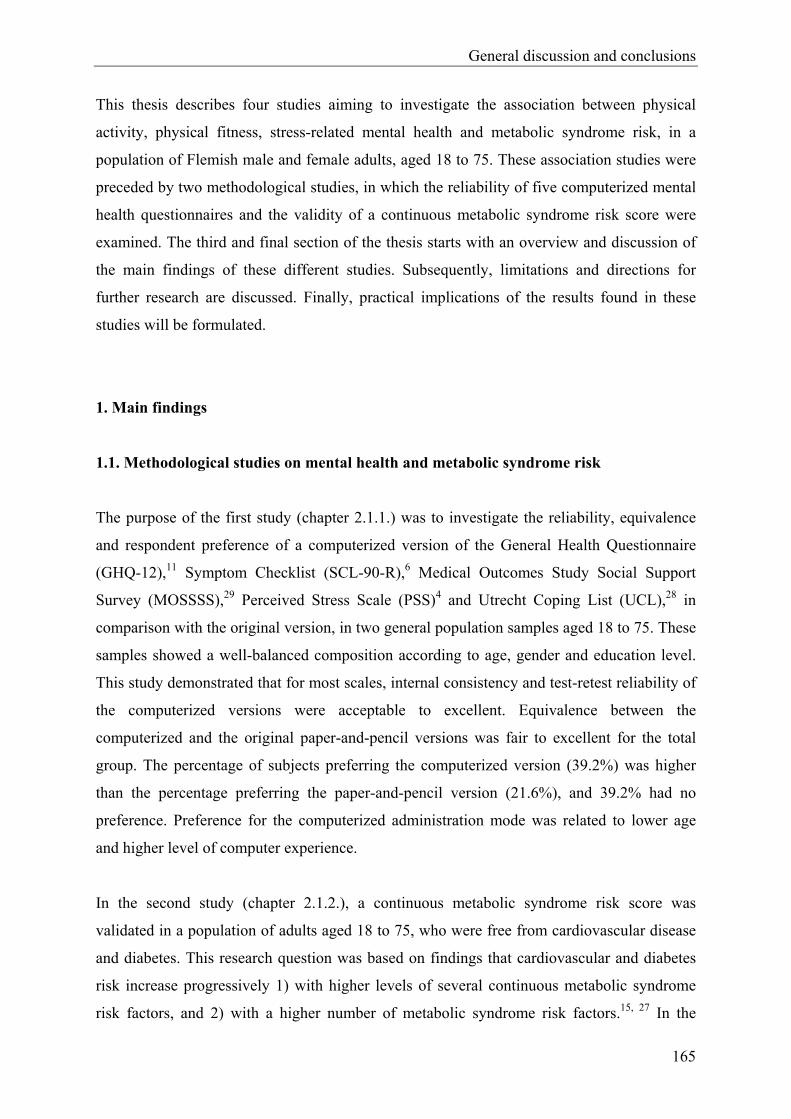
General discussion and conclusions
165
This thesis describes four studies aiming to investigate the association between physical
activity, physical fitness, stress-related mental health and metabolic syndrome risk, in a
population of Flemish male and female adults, aged 18 to 75. These association studies were
preceded by two methodological studies, in which the reliability of five computerized mental
health questionnaires and the validity of a continuous metabolic syndrome risk score were
examined. The third and final section of the thesis starts with an overview and discussion of
the main findings of these different studies. Subsequently, limitations and directions for
further research are discussed. Finally, practical implications of the results found in these
studies will be formulated.
1. Main findings
1.1. Methodological studies on mental health and metabolic syndrome risk
The purpose of the first study (chapter 2.1.1.) was to investigate the reliability, equivalence
and respondent preference of a computerized version of the General Health Questionnaire
(GHQ-12),11 Symptom Checklist (SCL-90-R),6 Medical Outcomes Study Social Support
Survey (MOSSSS),29 Perceived Stress Scale (PSS)4 and Utrecht Coping List (UCL),28 in
comparison with the original version, in two general population samples aged 18 to 75. These
samples showed a well-balanced composition according to age, gender and education level.
This study demonstrated that for most scales, internal consistency and test-retest reliability of
the computerized versions were acceptable to excellent. Equivalence between the
computerized and the original paper-and-pencil versions was fair to excellent for the total
group. The percentage of subjects preferring the computerized version (39.2%) was higher
than the percentage preferring the paper-and-pencil version (21.6%), and 39.2% had no
preference. Preference for the computerized administration mode was related to lower age
and higher level of computer experience.
In the second study (chapter 2.1.2.), a continuous metabolic syndrome risk score was
validated in a population of adults aged 18 to 75, who were free from cardiovascular disease
and diabetes. This research question was based on findings that cardiovascular and diabetes
risk increase progressively 1) with higher levels of several continuous metabolic syndrome
risk factors, and 2) with a higher number of metabolic syndrome risk factors.15, 27 In the

General discussion and conclusions
166
existing definitions of the metabolic syndrome,2, 8, 32, 36 a dichotomization has been applied on
two levels, resulting in a reduced predictive and statistical power. Furthermore, most risk
factors are weighted equally in these definitions. Therefore, to address both limitations, a
metabolic syndrome risk score was developed, applying principal component analysis
(varimax rotation) on the continuous metabolic syndrome risk factors, used in the NCEP8 and
IDF definitions.32 In both genders, two principal components with eigenvalue ≥ 1 were
retained, explaining a similar percentage of metabolic syndrome variance (33% and 28% in
men, 33% and 27% in women). The continuous risk score was calculated by summing both
individual principal component scores, each weighted for the relative contribution of
principal component 1 and 2 in the explained variance. Summing both principal component
scores provides a better representation of the "construct" of the metabolic syndrome since
more metabolic syndrome variance is explained. Only taking into consideration the first
factor for example would be physiologically incorrect, since e.g. variables loading low on the
first factor, but high on the second factor would be insufficiently represented. In a study
published very recently,13 a similar procedure was used to calculate a continuous metabolic
syndrome risk score. In this study, principal component analysis was applied to four
metabolic syndrome variables, more specifically waist circumference, triglycerides, systolic
blood pressure and glucose, and one combined score for men and women was calculated.
This analysis revealed a first principal component with eigenvalue of 2.0 and a second one
with eigenvalue 0.8. Variance explained by the first principal component was 50%.
Therefore, in this study the continuous metabolic syndrome risk score existed of the first
unrotated principal component. These results deviate with the results of chapter 2.1.2. In our
results, both for men and women, the first two principal components showed an eigenvalue >
1.0, indicating that they both explain an important percentage of total metabolic syndrome
variance in this sample of adult men and women (percentage of explained variance before
rotation was respectively 38% and 23% in men and respectively 39% and 20% in women).
Most studies applying factor analysis to metabolic syndrome risk factors report at least 2 and
usually 3 to 4 factors to underlie the overall correlation between risk factors,15 which is in
accordance with our study results. As indicated above, because in our sample both first
principal components explained an important percentage of metabolic syndrome variance,
individual principal component scores of the first and second principal components were
summed. Varimax rotation was applied so that the resulting components were orthogonal,
and therefore independent. Therefore, the continuous risk score calculated in chapter 2.1.2.
explains more metabolic syndrome variance (men: 61%; women: 60%) compared to the risk
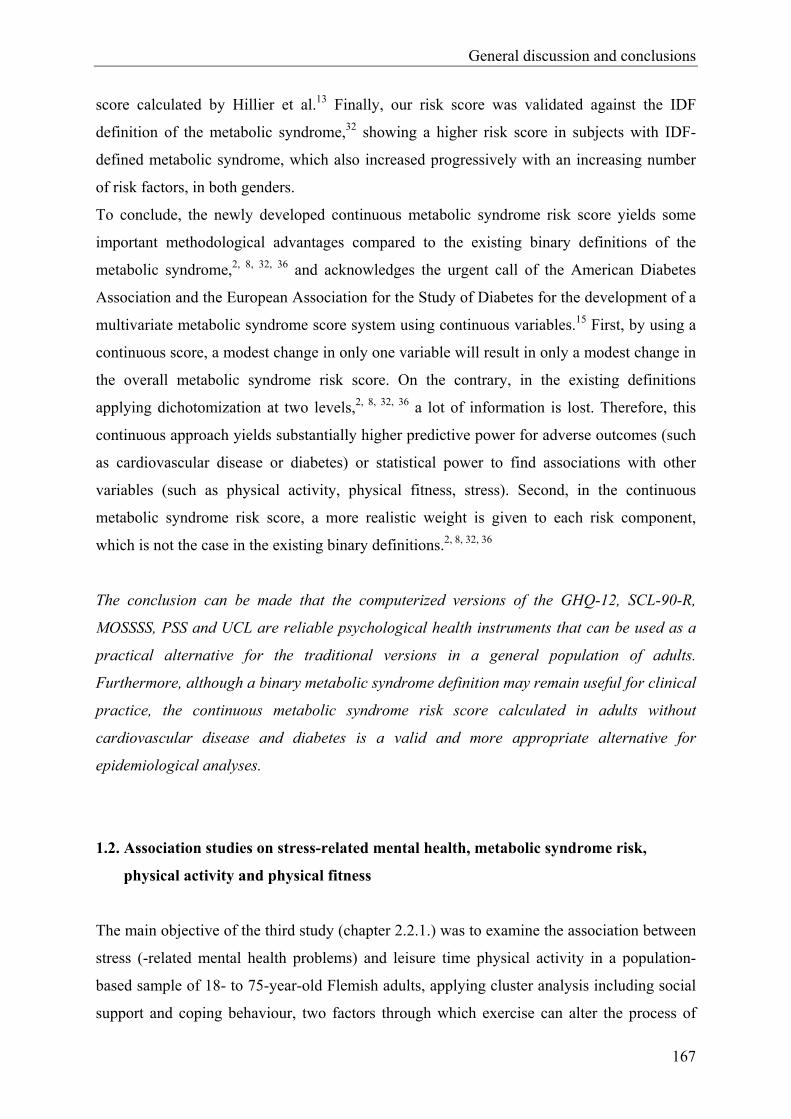
General discussion and conclusions
167
score calculated by Hillier et al.13 Finally, our risk score was validated against the IDF
definition of the metabolic syndrome,32 showing a higher risk score in subjects with IDF-
defined metabolic syndrome, which also increased progressively with an increasing number
of risk factors, in both genders.
To conclude, the newly developed continuous metabolic syndrome risk score yields some
important methodological advantages compared to the existing binary definitions of the
metabolic syndrome,2, 8, 32, 36 and acknowledges the urgent call of the American Diabetes
Association and the European Association for the Study of Diabetes for the development of a
multivariate metabolic syndrome score system using continuous variables.15 First, by using a
continuous score, a modest change in only one variable will result in only a modest change in
the overall metabolic syndrome risk score. On the contrary, in the existing definitions
applying dichotomization at two levels,2, 8, 32, 36 a lot of information is lost. Therefore, this
continuous approach yields substantially higher predictive power for adverse outcomes (such
as cardiovascular disease or diabetes) or statistical power to find associations with other
variables (such as physical activity, physical fitness, stress). Second, in the continuous
metabolic syndrome risk score, a more realistic weight is given to each risk component,
which is not the case in the existing binary definitions.2, 8, 32, 36
The conclusion can be made that the computerized versions of the GHQ-12, SCL-90-R,
MOSSSS, PSS and UCL are reliable psychological health instruments that can be used as a
practical alternative for the traditional versions in a general population of adults.
Furthermore, although a binary metabolic syndrome definition may remain useful for clinical
practice, the continuous metabolic syndrome risk score calculated in adults without
cardiovascular disease and diabetes is a valid and more appropriate alternative for
epidemiological analyses.
1.2. Association studies on stress-related mental health, metabolic syndrome risk,
physical activity and physical fitness
The main objective of the third study (chapter 2.2.1.) was to examine the association between
stress (-related mental health problems) and leisure time physical activity in a population-
based sample of 18- to 75-year-old Flemish adults, applying cluster analysis including social
support and coping behaviour, two factors through which exercise can alter the process of

General discussion and conclusions
168
actually perceiving stress. The results of this study indicated that three different and reliable
clusters could be identified in both genders, more specifically a cluster consisting of stressed
individuals with low social support and high passive and avoidant coping behaviour
(“stressed”), a second cluster labelled “intermediates”, and a third cluster consisting of
nonstressed individuals with high social support and active coping behaviour (“nonstressed”).
These clusters were also discriminative in certain malign psychological health outcomes of
stress, as the lowest level of anxiety and depression was found in the nonstressed cluster, and
increased progressively in the intermediate and stressed cluster. Furthermore, in both genders,
sports participation was higher in the nonstressed and intermediate cluster, compared to the
stressed cluster. As sports activities have a more social and a more challenging character
compared to other types of physical activity (e.g. active transportation, housekeeping and
gardening), sports participation may result in a higher perceived social support, higher self-
esteem and self-efficacy and greater active coping behaviour, which are all associated with
lower levels of stress. The conclusion can be made that by making use of cluster analysis
based on perceived stress, social support and coping in a population-based sample of adults,
risk groups for anxiety and depression can be identified. Furthermore, although cross-
sectional, these results may indicate that sports participation and other types of physical
activity, providing sources of higher perceived social support, self-esteem and self-efficacy,
could be effective primary and secondary prevention strategies for stress, anxiety and
depression.
The purpose of the fourth and fifth study (chapters 2.2.2. and 2.2.3.) was to examine the
associations of sedentary behaviour, moderate to vigorous leisure time physical activity,
muscular strength and aerobic fitness with the continuous metabolic syndrome risk score, in
Flemish adults free from cardiovascular disease and diabetes. In both studies, analyses were
adjusted for the confounding effects of age, height, education level, smoking status and
dietary intake. A higher level of sedentary behaviour was associated with a higher metabolic
syndrome risk, independently of leisure time physical activity, in both genders. Furthermore,
being more active in leisure time was related to a lower metabolic syndrome risk,
independently of time spent in sedentary behaviour. Aerobic fitness was inversely associated
with metabolic syndrome risk, independently of muscular strength in both genders. An
inverse association was found between muscular strength and metabolic syndrome risk in
women, independently of aerobic fitness. In men however, the inverse association between
muscular strength and metabolic syndrome risk was attenuated after adjustment for aerobic

General discussion and conclusions
169
fitness. Moreover, independent associations were found with several individual metabolic
syndrome risk factors for sedentary behaviour and moderate to vigorous leisure time physical
activity in both genders, and for muscular strength and aerobic fitness in women. Some of
these associations were mediated by adiposity, whereas others were not, suggesting that
biological pathways other than obesity are also responsible for the associations found. In
conclusion, a low level of sedentary behaviour and a high level of moderate to vigorous
leisure time physical activity may provide additional protective effects regarding metabolic
syndrome risk in both genders. Furthermore, high levels of aerobic fitness and muscular
strength may also provide additional protective effects in women.
For chapter 2.2.3., the total model, including age, height, education level, smoking status,
dietary intake, muscular strength and aerobic fitness, could explain 18.5% of metabolic
syndrome variance in men and 24.5% in women. In men, variance uniquely explained by
aerobic fitness was 7%. In women, variance uniquely explained by aerobic fitness was 3.1%,
and by muscular strength 2.5%. For chapter 2.2.2., the total model, including age, height,
education level, smoking status, dietary intake, sedentary behaviour and moderate to vigorous
leisure time physical activity could explain 14% of metabolic syndrome variance in men and
21.7% in women. Variance uniquely explained by sedentary behaviour was 1.5% in both
genders. Variance uniquely explained by moderate to vigorous leisure time physical activity
was 3% in men and 1.3% for women. For sedentary behaviour and leisure time physical
activity, these figures indicate rather low effect sizes.
The last study (chapter 2.2.4.) was designed to examine a theoretical model, causally linking
psychological distress, health-related lifestyle and physical fitness with a metabolic syndrome
risk factor in Flemish adults without cardiovascular disease and diabetes, using latent variable
structural equation modeling. In structural equation modelling, a model is tested using
goodness-of-fit tests to determine if the pattern of variances and covariances in the data is
consistent with a structural model, specified by the researcher based on literature and/or
theory. Latent variable structural equation modelling (LVSEM) consists of two main parts,
more specifically the measurement model and the structural model. The measurement model
is that part of the LVSEM model dealing with the latent variables and their observed
variables. Latent variables, are the constructs or factors which are measured by their
respective observed variables. These observed variables, also referred to as manifest
variables, may be scales in a questionnaire, objectively measured characteristics,… The
measurement model is based on confirmatory factor analysis and standardized path
General discussion and conclusions
170
coefficients between latent variables and their respective observed variables can be
interpreted as factor loadings. The structural model is the part of the LVSEM model,
applying path analysis between latent variables. In the structural model, latent variables may
be independent, mediating and dependent variables, depending on the direction of causal
path(s) that can have their origin, end point or both in each latent variable.
Sedentary behaviour and moderate to vigorous leisure time physical activity, as defined in the
fourth study, were included as observed variables loading on the health-related lifestyle
factor, besides alcohol and fat intake. The observed variables within the construct of physical
fitness consisted of aerobic fitness and muscular strength, as defined in the fifth study.
Furthermore, perceived stress, depression, anxiety (included in the third study) and sleeping
problems were the observed variables loading on the psychological distress construct. The
main aim of this study was to investigate the relative contribution of psychological distress,
health-related lifestyle and physical fitness in explaining metabolic syndrome variance, and
their interactions in doing so. This study indicated that 39.6% of the variance of the metabolic
syndrome factor could be accounted for by the physical fitness, health-related lifestyle and
psychological distress factors in both genders. Physical fitness was the most important
contributor (direct effect of 22.8 %), besides health-related lifestyle (primarily defined by
physical activity), showing a smaller contribution (9.9 %), which was mediated by physical
fitness. No significant contribution was found for psychological distress. These results may
indicate that the inverse association between moderate to vigorous leisure time physical
activity and metabolic syndrome risk, found in study four, may be mediated by an increase in
physical fitness (primarily aerobic fitness showing a substantially higher loading compared to
muscular strength). Previous research already showed a mediating effect of aerobic fitness in
the association between physical activity and the metabolic syndrome.24 However, the results
of the sixth study should be interpreted with caution.
First of all, measurement error of both physical fitness indicators is much smaller than
measurement error for the health-related lifestyle (and psychological distress) indicators. In a
prospective study, Ekelund et al.7 showed that objectively measured physical activity energy
expenditure (showing lower measurement error in comparison with self-reported physical
activity) was inversely associated with metabolic syndrome risk, independent of aerobic
fitness and other confounding factors in middle-aged men and women without metabolic
syndrome at baseline. Moreover, aerobic fitness was not an independent predictor toward
metabolic syndrome risk after adjusting for physical activity energy expenditure. Similar
results were found by Franks et al.10 in a cross-sectional study, applying statistical adjustment
General discussion and conclusions
171
for differences in measurement precision between physical activity energy expenditure and
aerobic fitness. These studies suggest that the higher contribution of physical fitness in
explaining metabolic syndrome variance found in study six, may partially be caused by
differences in measurement error between the indicators of physical fitness, health-related
lifestyle and psychological distress.
Second, in study six, metabolic syndrome variance was represented by one factor only,
whereas the results of the second study of this thesis suggest a better representation of the
construct of the metabolic syndrome by taking into consideration two factors. Because of
differences in metabolic syndrome representation and general statistical approach, integrating
the results of study four, five and six should be done with caution. Similarly, although the
significant pathway between health-related lifestyle (or physical activity) and psychological
distress might be considered as supportive for the results of the third study, differences in
study population, statistical approach and quantification of physical activity should be kept in
mind.
From these four studies, the conclusion can be made that cluster analysis, including social
support and coping, enables us to identify risk groups of stress, anxiety and depression in a
population-based sample of adults and that sports participation may exert beneficial effects
in these at-risk groups. Furthermore, avoiding sedentary behaviour may provide additional
benefits in lowering metabolic syndrome risk, besides being moderately to vigorously activity
in adults free from cardiovascular disease and diabetes. In women, high muscular strength
may also exert a positive effect, additional to the benign effect of aerobic exercise. Therefore,
these results may support inclusion of strength training and a reduction of sedentary
behaviour, besides inclusion of moderate to vigorous physical activity and exercise
increasing aerobic fitness in physical activity recommendations to reduce metabolic
syndrome risk. Finally, the effect of moderate to vigorous activity might be mediated by an
increase in physical fitness. However, direction of causality of these associations should not
be taken for granted, given the cross-sectional design of all four studies.

General discussion and conclusions
172
2. Reflection, limitations and recommendations for further research
In the following section, results of the epidemiological association studies of chapter 2.2.1.,
2.2.2., 2.2.3. and 2.2.4. will be more thoroughly evaluated regarding their validity. Therefore,
bias, confounding and chance within these studies will be examined.
2.1. Bias, confounding and chance
2.1.1. Bias
A possible source of bias which may have occurred within these studies, is selection bias,
which is “error due to systematic differences in characteristics between those who take part in
a study and those who do not”.37 Results presented in this thesis were derived from the theme
1 and theme 2 studies of the Flemish Policy Research Centre Sport Physical Activity and
Health. For the purpose of the theme 1 study, the National Institute of Statistics randomly
selected a community sample of 18- to 75-year-olds in 46 randomly chosen municipalities in
the Flemish region of Belgium. However, from those selected individuals, only subjects who
were willing to participate in this “large scale study on physical activity, physical fitness and
health” could be included in the study sample, resulting in a response rate of 28%. Part of the
lower participation rate can probably be explained by the fact that the test battery was rather
comprehensive (given the context of a large epidemiological study), and also included
physical measurements of anthropometric, fitness, and health parameters, besides
questionnaires. The mean duration of a test session was 1.5 hours. This might have put off
individuals to participate in the study. Comparable participation rates have been reported for
other epidemiological studies in which variables were actually measured instead of using
(mailed) questionnaires (e.g., BIRNH study31: Belgian population aged 25-74y, participation
rate = 36.5%).
As individuals e.g. showing a healthier lifestyle, higher level of physical fitness or free from
disease might have been more interested to participate, selection bias might have occurred.
To examine whether selection bias had occurred, two different analyses were executed within
the frame of the theme 1 study. Both analyses were executed in men and women separately,
and age categories with a range of 5 years (e.g. 18-24, 25-29, 30-34) were used.

General discussion and conclusions
173
First, the theme 1 study sample was compared to the general adult Flemish population for two
demographic characteristics, more specifically age and education level (data for the general
adult Flemish population were provided by the National Institute of Statistics). Regarding
age, a significant difference was found between the age structure of the theme 1 study sample
and that of the general adult Flemish population in both genders (P < 0.05). Generally,
individuals 18- to 34 years of age were underrepresented in the theme 1 study sample,
whereas individuals 35- to 70 years of age were overrepresented in the theme 1 study. The
maximal level of underrepresentation was found in women between 18 and 24 years (2.32%).
The maximal level of overrepresentation was found in men between 55 and 59 years of age
(1.95%). Women 70 years of age and older were underrepresented (1.87%), whereas in men
of this age, no under- or overrepresentation was found. Regarding education level (5
categories), generally the lowest education levels (secondary school degree or lower) were
underrepresented, and the highest education levels (college or university degree) were
overrepresented (P < 0.05). Relatively large differences were found in the youngest age
groups. In the older age groups, there was predominantly an underrepresentation of the
lowest education level (no degree/primary school).
Second, a subsample of individuals not willing to participate (non responders) completed a
questionnaire, which provided the opportunity to compare participants of the theme 1 study
and non-responders for certain characteristics of interest. An important reason for this was
that no detailed scientific data on physical activity and physical fitness in Flemish adults were
available before the Flemish Policy Research Centre Sport Physical Activity and Health was
established. These analyses revealed that participants of the theme 1 study spent more time in
sports activities, compared to non responders. This difference was significant (P < 0.05) in
most age groups. Regarding sedentary behaviour, no significant difference was found
between participants and non responders, except for 2 groups. In men aged 25 to 29 and
women aged 40 to 44, more sedentary behaviour was reported by non-responders (P < 0.05).
For body mass index, no significant difference was found between participants and non
responders, except for individuals older than 70 years of age, in which responders showed a
higher body mass index (P < 0.05).
These data indicate that in the theme 1 study, selection bias has probably occurred for age
(although differences were rather small) and education level. Comparing participants of the
theme 1 study with non responders, there is an indication that selection bias may also have
occurred for certain physical activity variables. No indication was found for strong selection
bias regarding sedentary behaviour or body mass index.
General discussion and conclusions
174
The theme 2 study sample consisted of theme 1 participants who were willing to visit our lab
to take part in a more extensive investigation. This investigation comprised a whole-day visit
to the lab on a working day. Therefore, selection bias in the theme 2 study sample was
probably stronger than in the theme 1 sample, although no data are available on this.
Furthermore, we excluded participants with cardiovascular disease and diabetes for analyses
in study two, four, five and six, because this extra exclusion renders important advantages, as
described in the discussion section of chapter 2.2.4. However, by doing this, the study sample
of these studies became even more homogeneous for several metabolic, and probably other
variables of interest.
Therefore, as in many large-scale epidemiological studies, the samples used in the present
thesis probably show smaller variability for several variables of interest compared to the
general population of 18 to 75 year olds. The above stated figures indicate a possible
selection of the study sample for physical activity, so that more active people have
participated in the theme 1 (and probably theme 2) study. Further, although no comparison
analyses with the general adult Flemish population or non responders were possible regarding
physical fitness and mental health, it could be assumed that individuals showing higher
fitness levels and/or showing a better mental health were more willing to participate.
Moreover, exclusion of subjects with cardiovascular disease and diabetes has probably
resulted in a metabolically more healthy study sample. Therefore, it is probable that the study
sample used in each of the association studies only includes subjects representing a certain
part of the entire spectrum of values existing in the general adult Flemish population for the
exposure and outcome variables. This selection probably results in associations that deviate
to some extent from reality, an effect that is known as selection bias. For example, it could be
that the lack of significant contribution of distress in explaining metabolic syndrome variance
found in chapter 2.2.4., could be due to the fact that maybe predominantly mentally and
metabolically healthy individuals were part of the study sample.
Further, it should be noted that in case selection has occurred in the study sample regarding
mental health, the use of the subscales anxiety and depression, may have (partially) caused the
lack of significant contribution of distress in explaining metabolic syndrome variance, found in
chapter 2.2.4. In case predominantly mentally healthy individuals took part in the study, both
scales, which were constructed to detect clinical symptoms in both the general population and
General discussion and conclusions
175
clinical populations, may not be sensitive enough to detect differences in stress-related mental
problems between individuals of this select sample.
2.1.2. Confounding
Several variables may distort the associations examined within the scope of this thesis.
Therefore, in all association studies, statistical adjustment was made for several possibly
confounding variables. In chapter 2.2.1. examining the association between physical activity
and mental health, adjustment was made for age. Models in chapters 2.2.2. and 2.2.3.,
examining the association between sedentary behaviour, physical activity, physical fitness
and metabolic syndrome risk were adjusted for age, height, education level, smoking status
and dietary intake. Finally, analyses in chapter 2.2.4. were adjusted for age, education level
and smoking status. By doing this, the distorting effect of the confounding variable on the
estimated associations is removed. However, residual confounding remains in case the
adjusted results are still distorted by other confounding variables not included in analyses, or
in case the confounding factor was inaccurately measured through which adjustment has not
removed the whole distorting effect of that confounding variable. To some extent, this may
be applicable to the findings presented in this thesis. Some confounding variables included in
analyses may have been crudely measured, such as education level and smoking. Dietary
intake was measured by self-report using a 3 day diet record, which may also be subject of
measurement error. Further, some confounding variables may not have been taken into
account in the current analyses. In the studies considering metabolic syndrome risk as
outcome variable, further adjustment could be made for e.g. certain types of medication. The
use of neuroleptica might induce a higher metabolic syndrome risk and might be associated
with the exposure variables.14, 25
2.1.3. Chance
Finally, because of practical reasons, epidemiological studies must always be executed on a
sample of the entire population, in the case of this doctoral thesis, the Flemish adult population.
Even if there would be no selection bias or confounding, some chance factor may render study
results which do not represent the ultimate true values. However, as variation from the true
General discussion and conclusions
176
values are minimized by the size of the study sample used, the rather high number of
participants in each of the association studies will possibly have reduced the effects of chance.
Furthermore, statistics and probability values (P) were used to determine whether the
associations found were due to chance.
2.2. Reliability and validity of exposure and outcome variables
Validity of exposure and outcome variables is important in epidemiological studies. Therefore,
in the following section, reliability and validity of some self-report measures and validity of the
continuous metabolic syndrome risk score will be more thoroughly discussed.
2.2.1. Physical activity and sedentary behaviour
Test-retest reliability and relative and absolute validity of the FPACQ were examined in a
separate validation study, not included in this thesis. Results will be given on activity variables
that were used within the scope of this thesis. A complete description of the results on reliability
and validity of the FPACQ can be found in the manuscript by Matton et al.19
This study was executed in a subsample of participants of the theme 1 and theme 2 study. As
employed/unemployed and retired people have a different lifestyle structure, which may
possibly influence reliability and validity of the FPACQ, data were analyzed separately for both
groups. For test-retest reliability, subjects completed the FPACQ for the first time during the
theme 1 test session, and for the second time during the theme 2 test session, with an interval of
2 weeks. Reliability analyses were conducted on data of 66 employed/unemployed participants
(31 men, mean age = 39.23 ± 11.65 years; 35 women, mean age = 41.46 ± 12.62 years) and 36
retired participants (20 men, mean age = 63.65 ± 6.05 years; 16 women, mean age = 63.31 ±
3.94 years). For relative and absolute validity, participants wore an RT3 Tri-Axial
accelerometer22, 23 during seven consecutive days, and concurrently kept a written seven-day
activity record for a more comprehensive understanding of the accelerometer data. Participants
for reliability and validity analyses were the same, except for some participants of which data
could not be used for one of both analyses, due to technical problems. Validity analyses were
conducted on data of 62 employed/unemployed participants (32 men, mean age = 39.28 ± 11.72
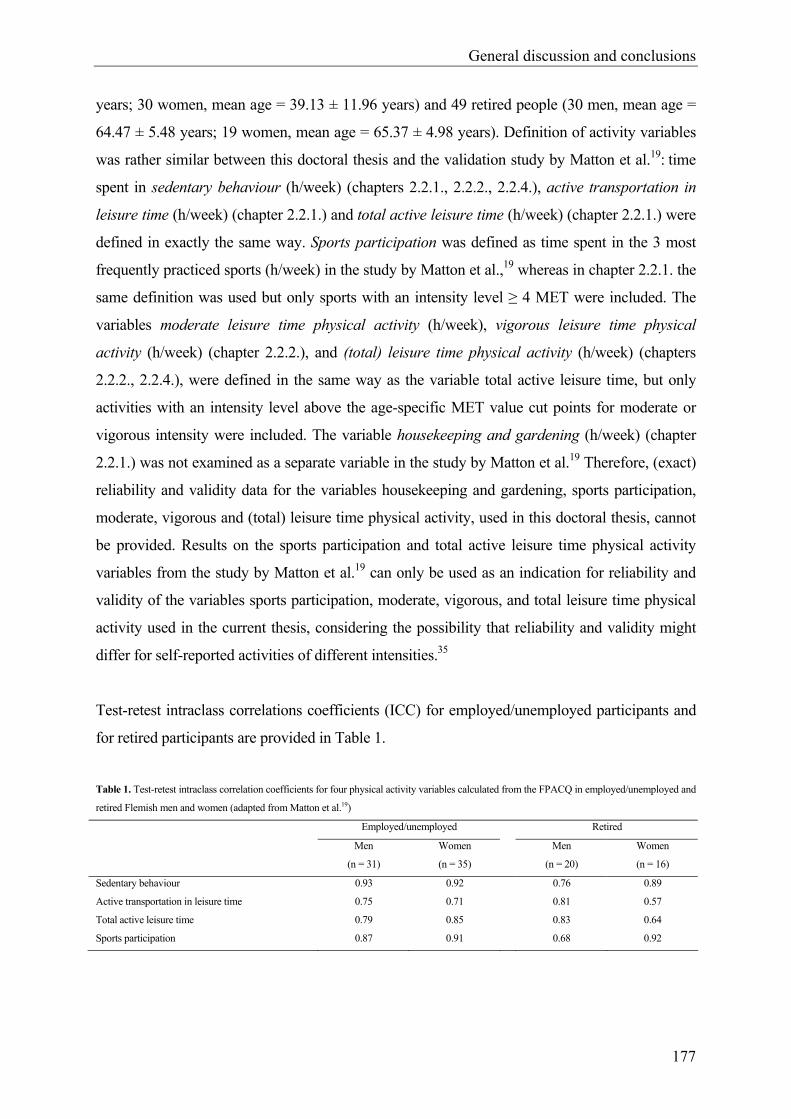
General discussion and conclusions
177
years; 30 women, mean age = 39.13 ± 11.96 years) and 49 retired people (30 men, mean age =
64.47 ± 5.48 years; 19 women, mean age = 65.37 ± 4.98 years). Definition of activity variables
was rather similar between this doctoral thesis and the validation study by Matton et al.19: time
spent in sedentary behaviour (h/week) (chapters 2.2.1., 2.2.2., 2.2.4.), active transportation in
leisure time (h/week) (chapter 2.2.1.) and total active leisure time (h/week) (chapter 2.2.1.) were
defined in exactly the same way. Sports participation was defined as time spent in the 3 most
frequently practiced sports (h/week) in the study by Matton et al.,19 whereas in chapter 2.2.1. the
same definition was used but only sports with an intensity level ≥ 4 MET were included. The
variables moderate leisure time physical activity (h/week), vigorous leisure time physical
activity (h/week) (chapter 2.2.2.), and (total) leisure time physical activity (h/week) (chapters
2.2.2., 2.2.4.), were defined in the same way as the variable total active leisure time, but only
activities with an intensity level above the age-specific MET value cut points for moderate or
vigorous intensity were included. The variable housekeeping and gardening (h/week) (chapter
2.2.1.) was not examined as a separate variable in the study by Matton et al.19 Therefore, (exact)
reliability and validity data for the variables housekeeping and gardening, sports participation,
moderate, vigorous and (total) leisure time physical activity, used in this doctoral thesis, cannot
be provided. Results on the sports participation and total active leisure time physical activity
variables from the study by Matton et al.19 can only be used as an indication for reliability and
validity of the variables sports participation, moderate, vigorous, and total leisure time physical
activity used in the current thesis, considering the possibility that reliability and validity might
differ for self-reported activities of different intensities.35
Test-retest intraclass correlations coefficients (ICC) for employed/unemployed participants and
for retired participants are provided in Table 1.
Table 1. Test-retest intraclass correlation coefficients for four physical activity variables calculated from the FPACQ in employed/unemployed and
retired Flemish men and women (adapted from Matton et al.19)
Employed/unemployed Retired
Men
(n = 31)
Women
(n = 35)
Men
(n = 20)
Women
(n = 16)
Sedentary behaviour 0.93 0.92 0.76 0.89
Active transportation in leisure time 0.75 0.71 0.81 0.57
Total active leisure time 0.79 0.85 0.83 0.64
Sports participation 0.87 0.91 0.68 0.92
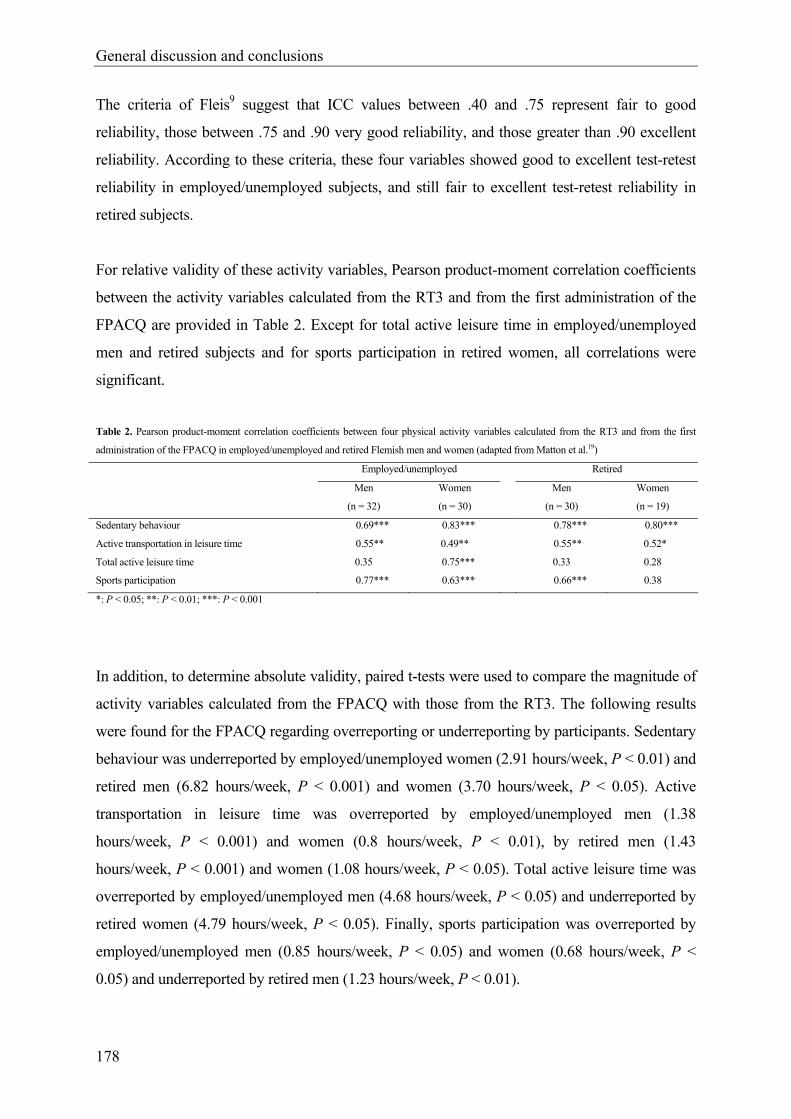
General discussion and conclusions
178
The criteria of Fleis9 suggest that ICC values between .40 and .75 represent fair to good
reliability, those between .75 and .90 very good reliability, and those greater than .90 excellent
reliability. According to these criteria, these four variables showed good to excellent test-retest
reliability in employed/unemployed subjects, and still fair to excellent test-retest reliability in
retired subjects.
For relative validity of these activity variables, Pearson product-moment correlation coefficients
between the activity variables calculated from the RT3 and from the first administration of the
FPACQ are provided in Table 2. Except for total active leisure time in employed/unemployed
men and retired subjects and for sports participation in retired women, all correlations were
significant.
Table 2. Pearson product-moment correlation coefficients between four physical activity variables calculated from the RT3 and from the first
administration of the FPACQ in employed/unemployed and retired Flemish men and women (adapted from Matton et al.19)
Employed/unemployed Retired
Men
(n = 32)
Women
(n = 30)
Men
(n = 30)
Women
(n = 19)
Sedentary behaviour 0.69*** 0.83*** 0.78*** 0.80***
Active transportation in leisure time 0.55** 0.49** 0.55** 0.52*
Total active leisure time 0.35 0.75*** 0.33 0.28
Sports participation 0.77*** 0.63*** 0.66*** 0.38
*: P < 0.05; **: P < 0.01; ***: P < 0.001
In addition, to determine absolute validity, paired t-tests were used to compare the magnitude of
activity variables calculated from the FPACQ with those from the RT3. The following results
were found for the FPACQ regarding overreporting or underreporting by participants. Sedentary
behaviour was underreported by employed/unemployed women (2.91 hours/week, P < 0.01) and
retired men (6.82 hours/week, P < 0.001) and women (3.70 hours/week, P < 0.05). Active
transportation in leisure time was overreported by employed/unemployed men (1.38
hours/week, P < 0.001) and women (0.8 hours/week, P < 0.01), by retired men (1.43
hours/week, P < 0.001) and women (1.08 hours/week, P < 0.05). Total active leisure time was
overreported by employed/unemployed men (4.68 hours/week, P < 0.05) and underreported by
retired women (4.79 hours/week, P < 0.05). Finally, sports participation was overreported by
employed/unemployed men (0.85 hours/week, P < 0.05) and women (0.68 hours/week, P <
0.05) and underreported by retired men (1.23 hours/week, P < 0.01).
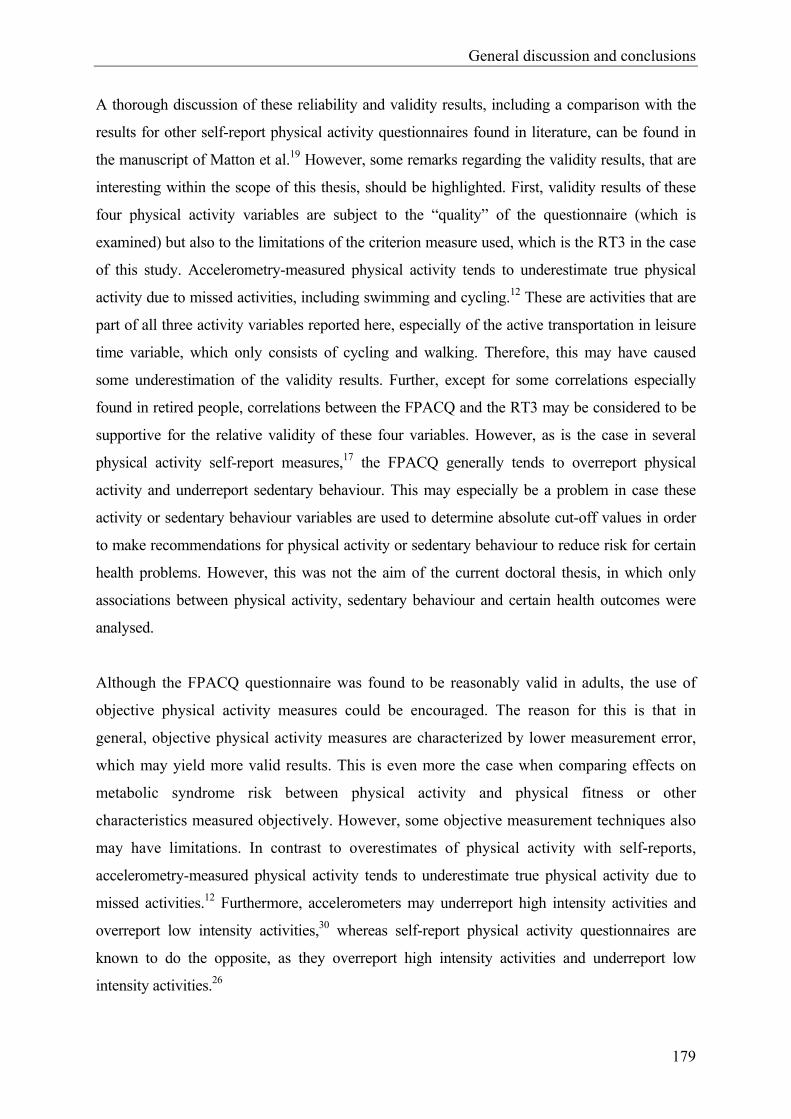
General discussion and conclusions
179
A thorough discussion of these reliability and validity results, including a comparison with the
results for other self-report physical activity questionnaires found in literature, can be found in
the manuscript of Matton et al.19 However, some remarks regarding the validity results, that are
interesting within the scope of this thesis, should be highlighted. First, validity results of these
four physical activity variables are subject to the “quality” of the questionnaire (which is
examined) but also to the limitations of the criterion measure used, which is the RT3 in the case
of this study. Accelerometry-measured physical activity tends to underestimate true physical
activity due to missed activities, including swimming and cycling.12 These are activities that are
part of all three activity variables reported here, especially of the active transportation in leisure
time variable, which only consists of cycling and walking. Therefore, this may have caused
some underestimation of the validity results. Further, except for some correlations especially
found in retired people, correlations between the FPACQ and the RT3 may be considered to be
supportive for the relative validity of these four variables. However, as is the case in several
physical activity self-report measures,17 the FPACQ generally tends to overreport physical
activity and underreport sedentary behaviour. This may especially be a problem in case these
activity or sedentary behaviour variables are used to determine absolute cut-off values in order
to make recommendations for physical activity or sedentary behaviour to reduce risk for certain
health problems. However, this was not the aim of the current doctoral thesis, in which only
associations between physical activity, sedentary behaviour and certain health outcomes were
analysed.
Although the FPACQ questionnaire was found to be reasonably valid in adults, the use of
objective physical activity measures could be encouraged. The reason for this is that in
general, objective physical activity measures are characterized by lower measurement error,
which may yield more valid results. This is even more the case when comparing effects on
metabolic syndrome risk between physical activity and physical fitness or other
characteristics measured objectively. However, some objective measurement techniques also
may have limitations. In contrast to overestimates of physical activity with self-reports,
accelerometry-measured physical activity tends to underestimate true physical activity due to
missed activities.12 Furthermore, accelerometers may underreport high intensity activities and
overreport low intensity activities,30 whereas self-report physical activity questionnaires are
known to do the opposite, as they overreport high intensity activities and underreport low
intensity activities.26
General discussion and conclusions
180
Ideally, in future studies objective measurement techniques, showing low measurement error,
should be used. Within the present study design, no large-scale use of these objective
measurement techniques was made, because of the larger financial and time investment and
the increased burden of participants involved in most of these techniques.
2.2.2. Mental health
Regarding mental health, data of five different self-report mental health questionnaires were
used within the scope of this doctoral thesis, more specifically the GHQ-12, SCL-90-R,
MOSSSS, PSS and UCL.4, 6, 11, 28, 29 Within the frame of the theme 1 and theme 2 studies of the
Flemish Policy Research Centre, the existing paper-and-pencil versions were converted into
computerized versions, as computerized administration of questionnaires may render important
advantages compared to paper-and-pencil administration. As mentioned above, in chapter 2.1.1.
of this doctoral thesis, these advantages are discussed and the test-retest reliability, equivalence
and respondent preference of the computerized versus paper-and-pencil versions were
examined.
Regarding validity, a validated Dutch version of the GHQ-12, SCL-90-R and UCL was used.
Validity results of the Dutch versions of these three questionnaires are presented extensively
in their respective manuals.1, 18, 28 The MOSSSS and the PSS were adopted from the original
English questionnaires. The MOSSSS is also used in the “Health Interview Survey, Belgium”,
which is a large-scale survey on several health topics executed by the Scientific Institute of
Public Health every three or four years in a representative sample of the Belgian population. In
the current doctoral thesis, the Dutch version of this questionnaire, which was translated by the
Scientific Institute of Public Health, was used. The translation of the Perceived Stress Scale
(PSS) was executed using a translate/back-translate protocol executed by the author of this thesis
and an independent native English speaker who immigrated in Belgium and speaks Dutch every
day. However, so far, no validation studies have been made on the Dutch version of the
MOSSSS and the PSS, as opposed to the UCL and the Dutch version of the GHQ-12 and the
SCL-90-R. Although the original English versions of the MOSSSS and the PSS are found to be
valid,4, 29 further validation studies on the Dutch version should be executed in the Flemish
population.

General discussion and conclusions
181
2.2.3. Metabolic syndrome risk
A cross-sectional comparison of the continuous metabolic syndrome risk score with the IDF
metabolic syndrome definition32 provided promising results. However, prospective validation
should be executed, examining the predictive power of this continuous risk score for relevant
clinical outcomes, including incident diabetes and cardiovascular disease. Furthermore, its
predictive power for these relevant clinical outcomes should be compared with that of existing
internationally recognised binary definitions, such as the IDF definition.32 Such prospective
validation studies are needed to determine true validity of this new risk score and (advanced)
utility compared to that of existing definitions. Moreover, studies in other ethnic groups should
be conducted to examine whether factor structure of the metabolic syndrome is different
compared to European populations, and therefore whether different risk scores should be
used in different populations. Clearly, validation studies should also be conducted in these
(ethnically) different populations.
In a 9 year follow-up, Hillier et al.13 revealed that in nondiabetic adults, age-adjusted risk for
incident diabetes and cardiovascular disease increased progressively for every 1-standard
deviation increase in their recently developed continuous metabolic syndrome risk score (P <
.05), which was based on waist circumference, triglycerides, glucose and systolic blood
pressure.
2.3. Causality
A limitation of the four association studies presented in this thesis was the cross-sectional
design. This type of design implies that all measurements were executed at the same moment
in time. Therefore, cause-and-effect relationships cannot be taken for granted. In case of the
metabolic syndrome-related studies, subjects with cardiovascular disease and diabetes were
excluded in an attempt to (at least) partially eliminate the possibility of causality in the
direction opposite of what was hypothesized, as cardiovascular disease and diabetes are two
important metabolic syndrome risk health outcomes that may influence health-related
lifestyle, physical fitness and mental health.
General discussion and conclusions
182
Intervention and longitudinal (prospective) studies should be conducted to confirm causality
of the associations found in our studies. Studies using a prospective design to examine the
research questions of study four, five and six are scarce. In a longitudinal study, subjects
would be measured at (at least) two different moments in time, more specifically at baseline
and at follow-up (e.g. five years later). Baseline measurements would include 1) a medical
examination/measurement of metabolic syndrome risk factors, 2) measurement of all
predictors which are hypothesized to influence the outcome variable, and 3) measurement of
all variables which are hypothesized to confound the association between predictors and the
outcome variable. Follow-up measurements would (at least) include measurement of the
outcome variable. For example, in case of the metabolic syndrome risk related hypotheses
examined in the present thesis using a cross-sectional design, predictors could include
physical activity, sedentary behaviour, aerobic fitness, muscular strength or measures of
distress (i.e. perceived stress, anxiety, depression, sleeping problems). Confounding variables
could include age, height, education level, smoking status and dietary intake. The metabolic
syndrome risk factors could be re-examined at follow-up. Based on the baseline medical
examination, subjects with the metabolic syndrome, cardiovascular disease or diabetes
(including medication use) at baseline could be excluded from analyses. Using multiple linear
regression models and other statistical techniques, the association between baseline values for
the predictor variables and follow-up value for the continuous metabolic syndrome risk score
could be examined, adjusting for age, height, education level, smoking status, dietary intake,
duration of follow-up, and baseline metabolic syndrome risk score.
Intervention studies might be interesting to examine whether certain types of physical activity
or fitness programs are more efficacious than others in lowering metabolic syndrome risk, or
whether certain types of (sports) activities may provide increased benefits in primary or
secondary prevention of stress-related mental health problems, based on the suggested
theories concerning social support and coping. For example, to examine whether resistance
training might provide benefits in lowering metabolic syndrome risk, which are additional to
benefits from aerobic training in women, the following intervention study could be executed.
Participants are subjected to a baseline assessment including 1) a medical
examination/measurement of all metabolic syndrome risk factors, 2) measurement of
maximal muscular strength and aerobic fitness, 3) measurement of confounding variables
age, height, education level, smoking status, dietary intake and physical activity pattern.
Women, who were not involved in an exercise program during the past year, who are free

General discussion and conclusions
183
from diabetes and cardiovascular disease and who do not take any medications for diabetes or
cardiovascular disease could be included in the study. Subjects are divided into two groups,
more specifically an endurance training group and a combined training group. The endurance
training group is only subjected to an endurance training program whereas the combined
training group is subjected to the training program of the endurance training group,
supplemented by a resistance training program. Subjects are randomly designated to one of
both groups, and analyses are adjusted for baseline differences between both groups
regarding aerobic fitness, muscular strength and confounding variables. Furthermore, during
training period, subjects are instructed not to change their normal daily physical activity or
dietary pattern. When the training period is finalized, post-training versus baseline changes
for the metabolic syndrome risk score/individual metabolic syndrome risk factors are
examined for both groups, and compared between both groups.
2.4. Other limitations and recommendations for further research
In study four and six, only physical activity of moderate to vigorous intensity was included in
analyses, based on the current physical activity recommendations.33 However, activities of
lower intensity may also be associated with a decrease in metabolic syndrome risk. A
prospective study in middle-aged men and women without metabolic syndrome at baseline,
measuring physical activity energy expenditure, and therefore including activities of all
intensities performed in everyday life, suggested that an increase in energy expenditure,
necessary to move from the lowest to the second lowest energy expenditure quartile, which
can be achieved by e.g. 1 hour of brisk walking, was associated with a significantly lower
metabolic syndrome risk.7 This result suggests that also lower intensity activities might play
an important role in lowering metabolic syndrome risk. Further large-scale longitudinal
studies are needed to determine whether a specific threshold of physical activity level exists.
Finally, more multivariate studies should be conducted, simultaneously investigating the
association and relative contribution of several possible characteristics or determinants of
metabolic syndrome risk, and preferably showing a longitudinal design. In this context,
international studies, applying similar measurement techniques could provide unique
opportunities for meta-analyses. Such studies provide valuable information for effective
prevention strategies aiming to attack the metabolic syndrome epidemic.
General discussion and conclusions
184
3. Practical implications
Based on the findings of the studies described in this thesis, some implications will be
formulated. However, as regards the association studies, they were all cross-sectionally
designed to investigate whether certain associations exist in rather large population-based
samples. Therefore, the implications formulated based on these four studies should be
interpreted with caution. Moreover, the results should induce further longitudinal and
intervention studies, resulting in more specific implications.
First of all, the computerized versions of five mental health questionnaire were found to be
reliable psychological health measurement instruments that can be used as a practical
alternative for the traditional versions in a general population of adults. Since computerized
assessment is associated with several important advantages, not only for the clinician, but
also for the responder and the researcher, these results should encourage further
computerization and reliability and equivalence testing of (mental health) questionnaires,
certainly when considering that in the future, computer usage will be common in all age
categories, including seniors.5 The Flemish Physical Activity Computerized Questionnaire
(FPACQ) is an example of a reliable and reasonably valid computerized questionnaire,
measuring different dimensions of physical activity in adolescents21 and adults.19 Internet
applications of these questionnaires will probably render supplemental advantages.
Based on several arguments, the use of a continuous metabolic syndrome risk score should be
encouraged, certainly for research purposes. First of all, our results and the results of others13
prove that these (comparable) continuous risk scores can serve as a valid alternative for the
existing binary definitions. Furthermore, because of its continuous character, no information
is lost, as there is using the binary definitions. Moreover, a more realistic weight is given to
the individual risk factors. Based on these strengths, the continuous risk score enables us to
find more valid results. Therefore, it would be interesting if more future studies would apply
a continuous metabolic syndrome risk score.
As sports activities may provide a stronger social network, and may have a beneficial
influence on peoples’ self-esteem and self efficacy, they could provide important primary and
secondary prevention tools for stress, and associated depression and anxiety, based on the
mechanisms of social support and coping. In the United States, stress-related disorders cost
General discussion and conclusions
185
the nation more than $42 billion per year. Furthermore, $150 billion of revenue is lost to
stress annually in lost productivity, absenteeism, poor decision-making, stress-related mental
illness, and substance abuse.16 As medication usage may also be considered as an economic
cost, sports participation should be considered as a an important alternative. Anti-depressive
drugs and especially benzodiazepine drugs should be mentioned here. Benzodiazepine drugs
are often prescribed for anxiety symptoms, sleeping problems and stress. These drugs are
often used chronically, and therefore have become a major concern for policy makers. This is
particularly the case for Belgium, where elevated levels of chronic use have repeatedly been
observed.20 The “Health Interview Survey, Belgium”, executed by the Scientific Institute of
Public Health in 2004, recently presented results on the use of these drugs in the Flemish
region of Belgium.3 About 3.8% and 3.2% of Flemish respondents reported that they had
been using anti-depressive drugs or benzodiazepine drugs respectively during the past 24
hours. In their discussion on the figures on medication use, they presented the use of
benzodiazepine drugs as one of the three most urgent problems that should be tackled, by
stating that “Without any doubt, there is a medicalisation of social problems (stress at work,
familial and matrimonial problems,…) that maybe should better be solved in a different
way.”.
Reducing time spent in sedentary behaviour should become part of future physical activity
recommendations aiming to reduce metabolic syndrome risk and its comorbidities, as this
type of behavioural change might provide benign effects additional to those of increased
physical activity. This might provide unique opportunities for reducing risk in the general
population, showing high levels of sedentary behaviour besides low levels of physical
activity, and for clinical groups (e.g. obese individuals) showing resistance to physical
activity programs. In recommending certain types of physical activity, exercise resulting in
higher aerobic fitness is probably effective. However, based on our results, women might
additionally benefit from resistance training, resulting in higher muscular strength. Resistance
training might also provide a unique tool for certain populations, including obese individuals,
as they might not be very enthusiastic about aerobic exercise. Although the results of our last
study suggest that the effect of physical activity is primarily an indirect effect, mediated by
aerobic fitness and muscular strength, these results should be interpreted with caution and
further research should be executed, examining whether low-intensity physical activities, not
resulting in higher aerobic fitness or muscular strength, also provide protective effects
regarding metabolic syndrome risk.
General discussion and conclusions
186
4. References
1. Arrindell WA, Ettema H. Symptom Checklist, Handleiding bij een multidimensionele
psychopathologie-indicator (manual of the Dutch version of the Symptom Checklist).
Lisse: Swets and Zeitlinger; 1986.
2. Balkau B, Charles MA. Comment on the provisional report from the WHO
consultation. Diabetic Medicine 1999;16:442-3.
3. Bayingana K, Demarest S, Gisle L, Hesse E, Miermans PJ, Tafforeau J, Van der
Heyden J. Gezondheidsenquête België, 2004 (Health Interview Survey Belgium,
2004). D/2006/2505/4; 2006.
4. Cohen S, Williamson GM. Perceived stress in a probability sample of the United
States. In: Spacapan S, Oskamp S, editors. The social psychology of health. Newbury
Park, CA: Sage; 1988. p. 31-67.
5. Cutler SJ, Hendricks J, Guyer A. Age differences in home computer availability and
use. Journals of Gerontology Series B-Psychological Sciences and Social Sciences
2003;58:S271-S280.
6. Derogatis LR, Lippman RS, Covi L. SCL-90-R, an outpatient psychiatric rating scale-
preliminary report. Psychopharmacology Bulletin 1973;9:13-28.
7. Ekelund U, Brage S, Franks PW, Hennings S, Emms S, Wareham NJ. Physical
activity energy expenditure predicts progression toward the metabolic syndrome
independently of aerobic fitness in middle-aged healthy Caucasians: The Medical
Research Council Ely Study. Diabetes Care 2005;28:1195-200.
8. Expert Panel on Detection Evaluation, and Treatment of High Blood Cholesterol in
Adults. Executive summary of the Third Report of the National Cholesterol Education
Program (NCEP) Expert Panel on Detection, Evaluation, and Treatment of High
Blood Cholesterol in Adults (Adult Treatment Panel III). Journal of the American
Medical Association 2001;285:2486-97.
9. Fleiss, J.L. The design and analysis of clinical experiments. New York: John Wiley
and Sons Inc; 1986.
10. Franks PW, Ekelund U, Brage S, Wong MY, Wareham NJ. Does the association of
habitual physical activity with the metabolic syndrome differ by level of
cardiorespiratory fitness? Diabetes Care 2004;27:1187-93.
11. Goldberg DP, Williams P. A users guide to the general health questionnaire.
Windsor: Nfer Nelson; 1988.
General discussion and conclusions
187
12. Hendelman, D, Miller K, Baggett C, Debold E, Freedson P. Validity of accelerometry
for the assessment of moderate intensity physical activity in the field. Medicine and
Science in Sports and Exercise 2000;32:442-9.
13. Hillier TA, Rousseau A, Lange C, Lepinay P, Cailleau M, Novak M, Calliez E,
Ducimetiere P, Balkau B. Practical way to assess metabolic syndrome using a
continuous score obtained from principal components analysis. Diabetologia
2006;49:1528-35.
14. Kahl KG, Schweiger U. The metabolic syndrome and diabetic risk in psychiatric
patients. Epidemiology, risk factors, and monitoring. Psychopharmakotherapie
2006;13:43-6.
15. Kahn R, Buse J, Ferrannini E, Stern M. The metabolic syndrome: time for a critical
appraisal. Diabetologia 2005;48:1684-99.
16. Kalia M. Assessing the economic impact of stress - The modern day hidden epidemic.
Metabolism-Clinical and Experimental 2002;51:49-53.
17. Klesges RC, Eck LH, Mellon MW, Fulliton W, Somes GW, Hanson CL. The
accuracy of self-reports of physical activity. Medicine and Science in Sports and
Exercise 1990;22:690-7.
18. Koeter MWJ, Ormel J. General Health Questionnaire, Nederlandse bewerking,
Handleiding (manual of the Dutch version of the General Health Questionnaire).
Lisse: Swets and Zeitlinger; 1991.
19. Matton L, Wijndaele K, Duvigneaud N, Duquet W, Philippaerts R, Thomis M,
Lefevre J. Reliability and validity of the Flemish Physical Activity Computerized
Questionnaire (FPACQ) in adults. Research Quarterly for Exercise and Sport. In
press.
20. Pelfrene E, Vlerick P, Moreau M, Mak RP, Kornitzer M, De Backer G. Use of
benzodiazepine drugs and perceived job stress in a cohort of working men and women
in Belgium. Results from the BELSTRESS-study. Social Science & Medicine
2004;59:433-42.
21. Philippaerts RM, Matton L, Wijndaele K, Balduck AL, De Bourdeaudhuij I, Lefevre
J. Validity of a physical activity computer questionnaire in 12-to 18-year-old boys and
girls. International Journal of Sports Medicine 2006;27:131-6.
22. Powell SM, Jones DI, Rowlands AV. Technical variability of the RT3 accelerometer.
Medicine and Science in Sports and Exercise 2003;35:1773-8.
General discussion and conclusions
188
23. Powell SM, Rowlands AV. Intermonitor variability of the RT3 accelerometer during
typical physical activities. Medicine and Science in Sports and Exercise 2004;36:324-
30.
24. Rennie KL, McCarthy N, Yazdgerdi S, Marmot M, Brunner E. Association of the
metabolic syndrome with both vigorous and moderate physical activity. International
Journal of Epidemiology 2003;32:600-6.
25. Ryan MCM, Thakore JH. Physical consequences of schizophrenia and its treatment -
The metabolic syndrome. Life Sciences 2002;71:239-57.
26. Sallis JF, Saelens BE. Assessment of physical activity by self-report: Status,
limitations and future directions. Research Quarterly for Exercise and Sport
2000;71:1-14.
27. Sattar N, Gaw A, Scherbakova O, Ford I, O'Reilly DS, Haffner SM, Isles C,
Macfarlane PW, Packard CJ, Cobbe SM, Shepherd J. Metabolic syndrome with and
without C-reactive protein as a predictor of coronary heart disease and diabetes in the
West of Scotland Coronary Prevention Study. Circulation 2003;108:414-9.
28. Schreurs PJG, Van De Willige G, Brosschot JF, Tellegen B, Graus GMH. De
Utrechtse Coping Lijst: UCL, omgaan met problemen en gebeurtenissen, herziene
handleiding (manual of the Utrecht Coping List). Lisse: Swets and Zeitlinger; 1993.
29. Sherbourne CD, Stewart AL. The MOS Social Support Survey. Social Science and
Medicine 1991;32:705-14.
30. Sirard JR, Melanson EL, Li L, Freedson PS. Field evaluation of the Computer Science
and Applications, Inc. physical activity monitor. Medicine and Science in Sports and
Exercise 2000;32:695-700.
31. Stam-Moraga MC, Kolanowski J, Dramaix M, De Henauw S, De Bacquer D, De
Backer G, Komitzer MD. Trends in the prevalence of obesity among Belgian men at
work, 1977-1992. International Journal of Obesity 1998;22:988-92.
32. The IDF consensus worldwide definition of the metabolic syndrome [article online],
2005. http://www idf org/webdata/docs/Metabolic_syndrome_definition pdf 2005.
Accessed May 5, 2005.
33. US Department of Health and Human Services. Physical Activity and Health: A
Report of the Surgeon General. Atlanta; 1996.
34. Vitaliano PP, Scanlan JM, Zhang JP, Savage MV, Hirsch IB, Siegler IC. A path
model of chronic stress, the metabolic syndrome, and coronary heart disease.
Psychosomatic Medicine 2002;64:418-35.
General discussion and conclusions
189
35. Washburn RA, Heath GW, Jackson AW. Reliability and validity issues concerning
large-scale surveillance of physical activity. Research Quarterly for Exercise and
Sport 2000;71:101-13.
36. World Health Organization. Definition, diagnosis and classification of diabetes
mellitus and its complications. Report of a WHO consultation. Geneva: World Health
Organization; 1999.
37. Zaccai JH. How to assess epidemiological studies. Postgraduate Medical Journal
2004;80:140-7.


Dankwoord - Acknowledgement
191
DANKWOORD - ACKNOWLEDGEMENT
Verschillende mensen hebben op een directe of een indirecte manier bijgedragen tot het tot
stand komen van deze doctoraatsthesis. Eindelijk kan ik jullie allemaal eens oprecht
bedanken!
In de eerste plaats wil ik een welgemeend dankwoord richten aan mijn promotor, Prof. Dr. R.
Philippaerts. Renaat, hartelijk dank voor de kans die je me een aantal jaren geleden hebt
gegeven om als doctoraatsbursaal te starten en het vertrouwen dat je me gedurende de
volledige rit hebt geschonken. Ondanks je drukke agenda en vele engagementen, kon ik altijd
je bureau binnenstappen om grote en kleine problemen op te lossen. Mijn co-promotor, Prof.
Dr. J. Lefevre, wil ik eveneens hartelijk danken. Johan, ook bij jou kon ik via een telefoontje
of een mailtje steeds terecht voor (statistisch) advies. Jullie waren beide ook altijd in voor
inhoudelijke discussies, die voor mij zeer leerrijk waren en die ik nog steeds enorm waardeer!
Bedankt voor de fijne samenwerking!
Mijn oprechte dank ook aan de andere leden van mijn begeleidingscommissie, meer bepaald
Prof. Dr. J. Bouckaert, Prof. Dr. G. De Backer en Prof. Dr. W. Duquet. Bedankt voor jullie
interesse in mijn werk, en voor de interessante suggesties die me gedurende het volledige
proces hebben geholpen en me ook wegwijs hebben gemaakt in de wereld van de
epidemiologie.
I would also like to thank Dr. U. Ekelund, Prof. Dr. F. Boen, Prof. Dr. S. De Henauw and
Prof. Dr. G. Cardon, members of the examination committee, for their critical review and
interesting suggestions. These remarks were very helpful in further ameliorating my doctoral
thesis.
Dit proefschrift kwam tot stand als onderdeel van de opdracht van het Steunpunt Sport,
Beweging en Gezondheid, verricht met de steun van de Vlaamse Gemeenschap, waarvoor
mijn dank. Uiteraard ook dank aan alle deelnemers van de studies.
Mijn doctoraatsonderzoek heeft zich zowel in de Vakgroep Bewegings- en
Sportwetenschappen in Gent, als in het Steunpunt Sport, Beweging en Gezondheid gelegen
Dankwoord - Acknowledgement
192
aan de Faculteit Bewegings- en Revalidatiewetenschappen van de KULeuven in Heverlee,
afgespeeld. Na een drietal maanden Gent, boden zich een tweetal jaren Leuven aan, en een
finale periode van ongeveer 2,5 jaar, terug in Gent. Hierdoor kon ik niet alleen de cultuur in
beide universiteitssteden opsnuiven. Het gaf mij ook de unieke kans om samen te werken met
experts van beide universiteiten. Gedurende mijn volledige doctoraatstermijn kon ik vanuit
Leuven, bovenop een fijne samenwerking met mijn co-promotor Prof. Dr. J. Lefevre, ook
steeds een beroep doen op Prof. Dr. M. Thomis en Prof. Dr. Em. G. Beunen. Martine, in de
eerste plaats bedankt voor de intensieve samenwerking bij onze pad analyse, en daarenboven
voor de vele interessante suggesties en adviezen die je steeds gegeven hebt. Gaston, jou wil ik
bedanken voor de inhoudelijke discussies en zeer nuttige tips, onder andere met betrekking tot
de risicoscore, en de tijd die je, desondanks je emeritaat, hieraan wou besteden. In Gent kon ik
genieten van een fijne samenwerking met Prof. Dr. I. De Bourdeaudhuij. Ilse, bedankt voor de
inhoudelijke, en vaak ook zeer praktische suggesties, die je desondanks je drukke agenda,
steeds op korte tijd kon geven, en voor de buitenlandse contacten die ik op congressen of
symposia heb kunnen leggen en me in de toekomst vast en zeker nog van pas zullen komen.
Ik heb ook van jullie drie enorm veel bijgeleerd!
Een speciaal woordje van dank ook aan mijn collega’s in Leuven en Gent!
Lynn en Nathalie, ons verblijf in het Steunpunt was enerzijds intensief, door de vele
proefpersonen die van kop tot teen onderzocht werden, maar tegelijkertijd heel leuk door mijn
samenwerking met jullie! Ik heb nooit met tegenzin naar Leuven gependeld, wat voornamelijk
te danken was aan die twee collega’s waar ik kon op bouwen en de fijne sfeer die er
(bijgevolg) hing! Ook nu nog plegen we regelmatig een telefoon(tje) of mail(tje), al dan niet
werkgerelateerd. Ik ben er dus zeker van dat we dat in de toekomst zullen blijven doen!
Ook de andere collega’s in Leuven, Hilde, Céline, Daan, Dirk, Frank, Goedele, Griet, Guido,
Ilse, Jan, Jelle, Jeroen, Joke, Katalien, Kristel, Leen T., Leen V., Liesbet, Lieven, Lore, Peter
en Vanessa, super bedankt voor de leuke sfeer. Dank ook aan alle artsen en verpleegsters, en
aan de thesisstudenten, die er met vele handen het werk veel lichter maakten.
Bene, Heleen en Leen, bureau- en “container”-genoten in Gent, bedankt voor de fijne
werktijd, leuke congresmomenten, ontspannende babbels en steun! Hopelijk kunnen we in de
toekomst regelmatig skypen en elkaar terugzien! Ook dank aan alle andere collega’s van het
“HILO”! Ik hoop dat ik altijd in een even aangename omgeving zal mogen werken.
Desondanks zal ik de sfeer er sowieso missen!

Dankwoord - Acknowledgement
193
Last but not least, een welgemeende dankjewel aan mijn familie en vrienden! Zonder die
prachtige reizen, citytrips, meidenavonden, etentjes en massa’s andere supermomenten, waar
jullie allemaal van de partij waren, had ik dit doctoraat niet tot een goed einde kunnen
brengen. Mama & papa, Veerle & Guido, Jo & Evy, bedankt voor alle kansen die jullie mij
hebben gegeven en voor jullie onvoorwaardelijke steun, raad en daad. Weet dat ik besef hoe
goed ik het met zo’n familie getroffen heb! Lente, jij was de ideale weekendontspanning voor
“Tatien” in haar laatste drukke doctoraatsweken.
Dankjewel!!!
Katrien Wijndaele,
Gent, 19 februari 2007.
Related Documents