RESEARCH ARTICLE Open Access Muscle ring finger-3 protects against diabetic cardiomyopathy induced by a high fat diet Megan T. Quintana 1† , Jun He 2,3† , Jenyth Sullivan 5 , Trisha Grevengoed 6 , Jonathan Schisler 4,7 , Yipin Han 8 , Joseph A. Hill 9 , Cecelia C. Yates 10 , William E. Stansfield 1 , Rudo F. Mapanga 11 , M. Faadiel Essop 11 , Michael J. Muehlbauer 12 , Christopher B. Newgard 12,13 , James R. Bain 12,13 and Monte S. Willis 2,4* Abstract Background: The pathogenesis of diabetic cardiomyopathy (DCM) involves the enhanced activation of peroxisome proliferator activating receptor (PPAR) transcription factors, including the most prominent isoform in the heart, PPARα. In cancer cells and adipocytes, post-translational modification of PPARs have been identified, including ligand-dependent degradation of PPARs by specific ubiquitin ligases. However, the regulation of PPARs in cardiomyocytes and heart have not previously been identified. We recently identified that muscle ring finger-1 (MuRF1) and MuRF2 differentially inhibit PPAR activities by mono-ubiquitination, leading to the hypothesis that MuRF3 may regulate PPAR activity in vivo to regulate DCM. Methods: MuRF3−/− mice were challenged with 26 weeks 60 % high fat diet to induce insulin resistance and DCM. Conscious echocardiography, blood glucose, tissue triglyceride, glycogen levels, immunoblot analysis of intracellular signaling, heart and skeletal muscle morphometrics, and PPARα, PPARβ, and PPARγ1 activities were assayed. Results: MuRF3−/− mice exhibited a premature systolic heart failure by 6 weeks high fat diet (vs. 12 weeks in MuRF3+/+). MuRF3−/− mice weighed significantly less than sibling-matched wildtype mice after 26 weeks HFD. These differences may be largely due to resistance to fat accumulation, as MRI analysis revealed MuRF3−/− mice had significantly less fat mass, but not lean body mass. In vitro ubiquitination assays identified MuRF3 mono-ubiquitinated PPARα and PPARγ1, but not PPARβ. Conclusions: These findings suggest that MuRF3 helps stabilize cardiac PPARα and PPARγ1 in vivo to support resistance to the development of DCM. MuRF3 also plays an unexpected role in regulating fat storage despite being found only in striated muscle. Keywords: MuRF3, Diabetic cardiomyopathy, Post-translational modification, Multi-ubiquitin, PPAR, Ubiquitin ligase Background The MuRF3 (Trim54) ubiquitin ligase was the first muscle-specific RING-finger (MuRF) protein identified by its interaction with the serum response factor (SRF) transcription factor [1]. The three MuRF family mem- bers: MuRF1 (Trim63), MuRF2 (Trim55), and MuRF3 encode highly homologous proteins that both homo- and hetero-dimerize via their coiled-coil regions [2]. During muscle atrophy, MuRF1 and MuRF2 translocate to the nucleus in cardiomyocytes [3, 4] and act to inhibit gene expression via their regulation of tran- scription factors [5, 6]. MuRF1 and MuRF3 have been localized to the Z-disk [1, 2]. Both MuRF2 and MuRF3 co-localize with stable glutamylated microtubules dur- ing muscle assembly in vitro [1, 4] and in the early stages of cardiomyocyte sarcomere assembly in vivo [7, 8]. The association of MuRF proteins with microtu- bules suggests their potential role in regulating micro- tubule stability. With expression limited to striated muscle, MuRF3 is a required protein for skeletal myoblast differentiation and support of the microtubule network [1]. Experimentally reducing MuRF3 expression during myocyte development * Correspondence: [email protected] † Equal contributors 2 Department of Pathology & Laboratory Medicine, University of North Carolina, Chapel Hill, NC, USA 4 McAllister Heart Institute, University of North Carolina, Chapel Hill, NC, USA Full list of author information is available at the end of the article © 2015 Quintana et al. This is an Open Access article distributed under the terms of the Creative Commons Attribution License (http://creativecommons.org/licenses/by/4.0), which permits unrestricted use, distribution, and reproduction in any medium, provided the original work is properly credited. The Creative Commons Public Domain Dedication waiver (http:// creativecommons.org/publicdomain/zero/1.0/) applies to the data made available in this article, unless otherwise stated. Quintana et al. BMC Endocrine Disorders (2015) 15:36 DOI 10.1186/s12902-015-0028-z

Welcome message from author
This document is posted to help you gain knowledge. Please leave a comment to let me know what you think about it! Share it to your friends and learn new things together.
Transcript
RESEARCH ARTICLE Open Access
Muscle ring finger-3 protects against diabeticcardiomyopathy induced by a high fat dietMegan T. Quintana1†, Jun He2,3†, Jenyth Sullivan5, Trisha Grevengoed6, Jonathan Schisler4,7, Yipin Han8,Joseph A. Hill9, Cecelia C. Yates10, William E. Stansfield1, Rudo F. Mapanga11, M. Faadiel Essop11,Michael J. Muehlbauer12, Christopher B. Newgard12,13, James R. Bain12,13 and Monte S. Willis2,4*
Abstract
Background: The pathogenesis of diabetic cardiomyopathy (DCM) involves the enhanced activation of peroxisomeproliferator activating receptor (PPAR) transcription factors, including the most prominent isoform in the heart,PPARα. In cancer cells and adipocytes, post-translational modification of PPARs have been identified, includingligand-dependent degradation of PPARs by specific ubiquitin ligases. However, the regulation of PPARs incardiomyocytes and heart have not previously been identified. We recently identified that muscle ring finger-1(MuRF1) and MuRF2 differentially inhibit PPAR activities by mono-ubiquitination, leading to the hypothesis thatMuRF3 may regulate PPAR activity in vivo to regulate DCM.
Methods: MuRF3−/− mice were challenged with 26 weeks 60 % high fat diet to induce insulin resistance and DCM.Conscious echocardiography, blood glucose, tissue triglyceride, glycogen levels, immunoblot analysis of intracellularsignaling, heart and skeletal muscle morphometrics, and PPARα, PPARβ, and PPARγ1 activities were assayed.Results: MuRF3−/− mice exhibited a premature systolic heart failure by 6 weeks high fat diet (vs. 12 weeks inMuRF3+/+). MuRF3−/− mice weighed significantly less than sibling-matched wildtype mice after 26 weeks HFD. Thesedifferences may be largely due to resistance to fat accumulation, as MRI analysis revealed MuRF3−/− mice hadsignificantly less fat mass, but not lean body mass. In vitro ubiquitination assays identified MuRF3 mono-ubiquitinatedPPARα and PPARγ1, but not PPARβ.Conclusions: These findings suggest that MuRF3 helps stabilize cardiac PPARα and PPARγ1 in vivo to supportresistance to the development of DCM.MuRF3 also plays an unexpected role in regulating fat storage despite being found only in striated muscle.
Keywords: MuRF3, Diabetic cardiomyopathy, Post-translational modification, Multi-ubiquitin, PPAR, Ubiquitin ligase
BackgroundThe MuRF3 (Trim54) ubiquitin ligase was the firstmuscle-specific RING-finger (MuRF) protein identifiedby its interaction with the serum response factor (SRF)transcription factor [1]. The three MuRF family mem-bers: MuRF1 (Trim63), MuRF2 (Trim55), and MuRF3encode highly homologous proteins that both homo-and hetero-dimerize via their coiled-coil regions [2].During muscle atrophy, MuRF1 and MuRF2 translocate
to the nucleus in cardiomyocytes [3, 4] and act toinhibit gene expression via their regulation of tran-
scription factors [5, 6]. MuRF1 and MuRF3 have beenlocalized to the Z-disk [1, 2]. Both MuRF2 and MuRF3co-localize with stable glutamylated microtubules dur-ing muscle assembly in vitro [1, 4] and in the earlystages of cardiomyocyte sarcomere assembly in vivo[7, 8]. The association of MuRF proteins with microtu-bules suggests their potential role in regulating micro-tubule stability.With expression limited to striated muscle, MuRF3 is a
required protein for skeletal myoblast differentiation andsupport of the microtubule network [1]. Experimentallyreducing MuRF3 expression during myocyte development
* Correspondence: [email protected]†Equal contributors2Department of Pathology & Laboratory Medicine, University of NorthCarolina, Chapel Hill, NC, USA4McAllister Heart Institute, University of North Carolina, Chapel Hill, NC, USAFull list of author information is available at the end of the article
© 2015 Quintana et al. This is an Open Access article distributed under the terms of the Creative Commons AttributionLicense (http://creativecommons.org/licenses/by/4.0), which permits unrestricted use, distribution, and reproduction in anymedium, provided the original work is properly credited. The Creative Commons Public Domain Dedication waiver (http://creativecommons.org/publicdomain/zero/1.0/) applies to the data made available in this article, unless otherwise stated.
Quintana et al. BMC Endocrine Disorders (2015) 15:36 DOI 10.1186/s12902-015-0028-z
results in a severe disruption of sarcomeric Z and M-bandformation, likely due to these effects on tubulin dynamics[7]. MuRF3 expression increases postnatally and is foundin both type I and type II muscle fibers [8]. The struc-tural importance of MuRF3 has been demonstrated inMuRF3−/− mice, where a predisposition to cardiac rup-ture after MI has been reported [9]. Its role in the turn-over of myosin heavy chain has been previously described.MuRF3 ubiquitinates myosin heavy chain, targeting it fordegradation, indicating its role in myosin protein qualitycontrol [10]. The closely related MuRF1 family membersimilarly regulates myosin protein quality control; micelacking both MuRF3 and MuRF1 exhibit the developmentof classic skeletal muscle myopathy, characterized by anaccumulation of myosin [10]. Both diabetes and treat-ment with the chemotherapy doxorubicin increases car-diac MuRF3 expression (http://www.ncbi.nlm.nih.gov/geoprofiles/50107288) [11].Initial studies in our laboratory identified that MuRF1
specifically regulates PPARα, but not PPARβ, or PPARγactivity both in vitro and in vivo [12, 13]. In the presentstudy, we hypothesized that MuRF3−/− hearts wouldsimilarly regulate PPAR isoforms given the overlappingspecificities of MuRF family proteins for specific sub-strates (myosin) and overlapping MuRF1−/−, MuRF2−/−,and MuRF3−/− altered cardiac metabolomics profiles re-cently identified by our laboratory [14]. With preliminaryevidence that MuRF3−/− mice demonstrated increasedlevels of PPAR activity, we challenged them with a high fatdiet model of diabetic cardiomyopathy. Since free fattyacids from the diet are the primary ligands for PPARs andone of the mechanisms driving diabetes induced cardio-myopathy, we hypothesized that MuRF3−/− mice wouldexhibit an enhanced cardiomyopathy and cardiac hyper-trophy given MuRF3’s role in regulating PPARs and poten-tially SRF in vivo.
MethodsAnimals and high fat diet-induced diabeticcardiomyopathy modelAll experiments described used age-matched mice or lit-termates, male and female. All experiments were approvedby the Institutional Animal Care and Use Committee(IACUC) review boards at the University of North Carolinaand were performed in accordance with federal guidelines.MuRF3−/− mice, recently described and characterized[14], with strain-matched wildtype mice ~10 weeks of agewere fed a high fat diet (60 % fat, 20 % protein, and 20 %carbohydrates) for 26 weeks as previously described [15].Baseline body weight, blood glucose, serum insulin, serumtriglyceride, and total cholesterol levels along with cardiacfunction were obtained prior to starting the diet. Micereceiving a high fat diet had body weight, blood glucose,and serum insulin levels measured every two weeks and
echocardiography was performed every three weeks. AnMRI was performed at baseline, 6, 12, and 22 weeks to de-tect body composition changes. After 26 weeks, mice wereanesthetized with isoflurane, euthanized with cervical spinedislocation, and heart, liver, gastrocnemius, soleus, andtibialis anterior muscles were collected in cryovials, flashfrozen, and stored at -80C.
Mouse echocardiographyConscious cardiac transthoracic echocardiography wasperformed on mice at the indicated time points using aVisualSonics Vevo 2100 ultrasound biomicroscopy system(VisualSonics, Inc., Toronto, Ontario, Canada). Investiga-tors were blinded to mouse genotype. Two-dimensionalM-mode echocardiography was performed in the paraster-nal long-axis view at the level of the papillary muscle onloosely restrained mice. Anterior and posterior wall thick-ness was measured as distance from epicardial to endo-cardial leading edges. Left ventricular internal diameterswere also measured. Left ventricular systolic functionwas assessed by ejection fraction (LV EF% = [(LV Vol; d-LV Vol; s/LV Vol; d) × 100] and fractional shortening(%FS = [(LVEDD – LVESD)/LVEDD] × 100). Measure-ments represent the average of three cardiac cycles fromeach mouse.
Body composition measurementConscious low-resolution nuclear magnetic resonanceimaging was used to measure body composition of eachmouse at baseline, 6, 12, and 22 weeks using an EchoMRI3-in-1 Body Composition Analyzer for Live Small Animals(Mice)(EchoMRI, LLC, Houston, TX) [16]. Body fat andlean body mass was then calculated as a proportion oftotal body weight collected just prior to analysis as previ-ously described [17].
Blood collection, serum separation, and methods forglucose, insulin, triglyceride, and total cholesterolmeasurementsAfter overnight fast, ~200 μl whole blood was collected bysubmandibular vein lancet bleed (glucose) or brachial sinuspuncture (remaining assays). One μl whole blood was ana-lyzed via glucometer (PrecisionXtra, Abbott Diabetes CareInc., Alameda, CA, USA) and test strip (Abbott DiabetesCare Ltd., Witney, Oxfordshire, UK). Blood collected inserum separator tubes for the remaining tests was incu-bated on ice for 90 min, and centrifuged at 1600 × g(20 min at 4 °C). Insulin levels were measured using theInsulin Enzyme Immunoassay Kit (Cayman Chemical,Cat.#589501, Ann Arbor, MI 48108) according to themanufacturer’s instructions as previously described [18].Serum triglyceride and cholesterol levels were measuredusing an automated chemical analyzer (Vitro 350, Ortho-Clinical Diagnostics Company, Rochester, NY).
Quintana et al. BMC Endocrine Disorders (2015) 15:36 Page 2 of 18
Fatty acid extraction and triglyceride assayFatty acid extraction and tissue triglyceride concen-trations were determined on flash frozen heart tissue,liver tissue, and skeletal tissue as previously described[19]. Briefly, 25–50 mg of heart, liver and skeletal musclewas homogenized 15–30 s with a bladed homogenizer(Power Gen 125, Cat.#14-261, setting 6, Fisher Scientific,Inc., Pittsburgh, PA) in 10X (v/w) ice cold lysis buffer(20 mM Tris base, 1 % Triton-X100, 50 mM NaCl,250 mM NaF, 5 mM Na4P2O7-10H2O, 1 tablet proteaseinhibitor (Roche Inc., Cat.#11836153)) and incubated at4 °C for 1 h. Two hundred μl of homogenate was trans-ferred to chloroform resistant tubes, mixed with 0.4 mlmethanol and 0.8 ml chloroform, placed on the rockerat 4 °C for at least 30 min. Potassium chloride (0.24 ml0.88 % KCl) was added, samples vortexed, and centri-fuged at 1000 × g for 15 min at 4 °C. The bottom layerof CHCl3 was then transferred and this process was re-peated with another 0.8 ml of chloroform and the com-bined CHCl3 layers were then dried under N2. Onehundred μl of a tert-butanol:methanol:Triton X-100 so-lution (3:1:1, v/v/v) was added to each tube and sampleswere stored at −20 °C. Glycerol standard 2.5 mg/dl(Sigma, Inc., Cat.#G1394), free glycerol reagent (SigmaAldrich, Inc., Cat.#F6428) and triglyceride reagent(Sigma Aldrich, Inc., Cat.#T2449) were used to meas-ure triglyceride concentrations. Five μl of samples wereadded to a 96-well plate. Working reagent was addedto the samples (4 volumes of free glycerol reagent: 1volume of triglyceride reagent). This was left to in-cubate, rocking, at room temperature for 15 min. Thenabsorbance was measured per sample at 540 nm usingthe Clariostar High Performance Multimode MicroplateReader (BMG LABTECH, San Francisco, CA) and normal-ized to tissue weight.
Tissue glycogen assay (Acid Hydrolysis Method)Tissue glycogen was measured from heart, liver and skel-etal muscle using a colorimetric tissue glycogen assay kit(Sigma, Inc., Cat.#G3293) as previously described [20].Briefly, 15–25 mg of tissue was powdered in liquid nitro-gen, collected in a pre-chilled 2 ml tube, 0.5 ml 1 N HCladded, then homogenized with a bladed homogenizer(Fisher Scientific, Power Gen 125, Cat.#14-261, setting 6,Pittsburgh, PA) under a hood. The resulting homogenate(100 μl) was quickly added to 100 μl 1 N NaOH and kepton ice until heated in HCl at 95 °C for 90 min, mixingevery 30 min, cooled to RT and 0.4 ml 1 N NaOH wasadded to neutralize the sample. After the sample wascentrifuged at 14,000 × g for 10 min at RT, the super-natant was used for glucose analysis using a hexokinase-dependent assay kit (Sigma, Inc., Cat.#G3293) accordingto the manufacturer’s instructions. Briefly, 10 μl (liver) or20 μl (heart and gastrocnemius) of supernatant was put
into a 96-well plate, mixed with 200 μl of reagent, incu-bated at room temperature for 15 min, and the absorbancewas measured at 340 nm.
RNA isolation and quantitative PCR analysis ofPPAR-regulated gene expressionTotal RNA was isolated using TRIzol reagent accordingto the manufacturer’s protocols (Life Technologies, Inc.,Cat.#15596-026). About 25 mg of cardiac ventricular tis-sue was put into TRIzol reagent and homogenized onice (Fisher Scientific, Power Gen 125, setting 5). TotalmRNA expression was determined using a two-step re-action. cDNA was made from total RNA using theiScript™ Reverse Transcription Supermix for RT-qPCRkit (Cat.#170-8841, BIO-RAD), with a total volume of20 μl per reaction. The complete reaction mix was incu-bated in an Eppendorf Cycler (Hamburg, Germany)using the following protocol: priming 5 min at 25C, re-verse transcription 30 min at 42C, RT inactivation 5 minat 85C. PCR products were amplified on a Roche Light-cycler 480IIsystem using cDNA, Taqman Probes (AppliedBiosciences™), and Lightcycler 480 Probe Master Mix 2X(Cat.#04 707 494 001). The TaqMan probes used in thisstudy were Mm00430615_m1 (ACC1), Mm00443579_m1(ACOX1), Mm00475794_m1 (ADRP), Mm00599660_m1 (LCAD), Mm00431611_m1 (MCAD), Mm00440939_m1 (PPARα), Mm01305434_m1 (PPARβ), Mm00443325_m1 (PDK4), Mm00487200_m1 (CPT1b), Mm00441480_m1 (Glut1, Slc2a1), Mm01245502_m1 (Glut4, Slc2a4),Mm01309576_m1 (PFK), Mm00432403_m1 (CD36, FAT),Mm01185221_m1 (MuRF1, Trim63), and Mm01292963_g1(MuRF2, Trim55), Mm00491308_m1 (MuRF3, Trim54),Hs99999901_s1(18S), Mm00440359_m1(α-MHC, Myh6),Mm00600555_m1(β-MHC,Myh7), Mm01255747_g1(ANP),Mm00435304_g1(BNP), Mm00808218_g1(SK α-actin) (Ap-plied Biosystems, Inc., Foster City, CA). Assay of PPARγ1was performed using the Roche Universal Probe technol-ogy, including forward primer (gggctgaggagaagtcacac) andreverse primer (gggctgaggagaagtcacac) in conjunction withUPL probe #92 (Roche, Inc., Cat.#04692098001). Sampleswere run in triplicate and relative mRNA expression wasdetermined using 18S as an internal endogenous control.RNase-free water, 2X Master Mix, Taqman Probe or RocheUPL primer and probe, cDNA were used for each reaction.
Western blotWestern analysis of ventricular tissue was performed onlysates created from ~25 mg tissue. Tissue lysates in LysisBuffer (Cell Signaling, Cat.#9803S) with XM β-glycerolphosphate (Sigma, Cat.#G6251), protease inhibitor (Roche,Cat.#11 836 153 001), and phosphatase inhibitor cocktail(Roche Cat.#04 906 837 001) were manually homogenizedon ice (Fisher Scientific, Power Gen 125, setting 5) for 15–20 s. Alternatively, tissue was placed in 8 M Urea Lysis
Quintana et al. BMC Endocrine Disorders (2015) 15:36 Page 3 of 18
Buffer (8 M Urea Sigma, Cat. #U0631, 5 M NaH2PO4
Sigma, Cat. #S3139, 1 M Tris-Cl pH 8.0) at a ratio of 15 μllysis buffer/mg of tissue and was homogenized at 4C(TissueLyser LT, Qiagen, Cat. #85600) for 2 min. Homoge-nates were incubated on ice for 30 min, centrifuged at16,000 × g (4C) for 15 min and the supernatant storedat -80C. Protein concentration was determined using theBio-Rad DC Protein Assay Reagent Package (Bio-Rad La-boratories, Inc., Hercules, CA, Cat.#500-0116). Proteins(30–50 μg/lane) were resolved on NuPAGE Bis-Tris orTris-Acetate 10 well gels. Mouse anti-NFκB p65, rabbitanti-phospho-NFκB p65 (Ser536), rabbit anti-phospho-NFκB p65 (Ser468) were used to measure NFκB signaling(Cell Signaling Technologies, Cat.#4767, each 1:500). IRS-1 signaling was detected using rabbit anti-phospho-IRS-1(Ser1101) and rabbit anti-IRS-1 (Cell Signaling Technolo-gies, Inc. Cat.#2385 and #2383, each 1:500). cJun signalingwas detected by rabbit anti-p-cJun (Ser73), rabbit anti-p-cJun (Thr91) or rabbit anti-cJun 60A8 (Cell SignalingTechnologies, Cat.#9164, #2303, #9165, each 1:500). Pri-mary antibodies were diluted in 4 % BSA/TBS-T and incu-bated at 4 °C overnight. HRP-labeled secondary antibodiesagainst mouse (Sigma #A9917, 1:10,000) and rabbit (Sigma#A9169, 1:5,000) were used to detected the primary anti-bodies diluted in 1X TBS-T and incubated 1 h at roomtemperature. Mouse anti-β-actin (Sigma, Inc., Cat.#A2228,1:4000) was used as a loading control throughout. Secondaryantibody HRP was detected using ECL Select (GE Health-care, Cat.#RPN2235) and imaged using the MultiDoc-itImaging System (UVP, LLC Ultra-violet Products, Ltd.,Upland, CA).
Total O-GlcNAc expressionTotal O-GlcNAc expression was determined by SDS-PAGE as previously described [21], using anti-O-GlcNAc(RL-2, Santa Cruz Biotechnology, Santa Cruz CA) onPVDF blocked with 1 % bovine serum albumin dissolvedin TBS-T solution for 20 min, followed by an overnightincubation with O-GlcNAc antibody (1:1000) at 4 °C.Secondary antibody (goat-anti-mouse IgG-HRP, SantaCruz Biotechnologies, Santa Cruz CA; 1:4000) incubatedfor 1 h at RT, washed with TBS-T, then visualized withenhanced chemiluminescence (ECL) on the ChemiDoc™XRS+ system with Image Lab™ Software v2.0 (Bio-RadLaboratories, Hercules CA). Total O-GlcNAcylation (perlane) was quantified by the adjusted percentage volume -intensity units of pixels of band ×mm2 - after backgroundsubtraction using Quantity One Software v4.6.9 (Bio-RadLaboratories, Hercules CA), and normalized to β-actin(Abcam, Cambridge MA).
In vitro ubiquitination assayHuman recombinant GST-E1 (50 nM, Boston, Biochem,Cambridge, MA, Cat.#E-306), human recombinant UbcH5c/
UBE2D3 (2.5 μM, Boston Biochem, Inc., Cambridge, MA,Cat.#E2-627), human recombinant ubiquitin (250 μM,Boston Biochem, Inc., Cat.#U-100H), human MuRF3recombinant protein (1 mg, LifeSensors, Cat.#UB306,Malvern, PA), human PPAR-α, −β, and -γ recombinantprotein (500 ng, Sigma-Aldrich, Inc., St. Louis, MO,Cat.#SRP2043, Cat.#SRP2044, and Cat.#SRP2045, respect-ively) were added to reaction buffer (50 mM HEPES,pH 7.5) containing 5 mM MgATP solution (BostonBiochem, Inc., Cat.#B-20) and 0.6 mM DTT, then incu-bated at 37 °C for 1 h. The reaction was stopped by addingSDS-PAGE sample buffer and heating, then resolved on a4-12 % Bis-Tris gel with MOPS running buffer (InvitrogenCorp.) and transferred to PVDF membranes for im-munoblotting with goat polyclonal anti-MuRF3 antibody(Cat.#sc-50252, Santa Cruz Biotechnology), rabbit poly-clonal anti-PPARα antibody (Cat.#Ab24509, Abcam),rabbit polyclonal anti-PPARβ antibody (Cat.#AB10094,Millipore), or rabbit polyclonal anti-PPARγ antibody(Cat.#2443, Cell Signaling Technology).
Histology and cross-sectional area analysisHearts were perfused with 4 % paraformaldehyde, fixedfor 24 h, moved to 70 % ethanol, then process and em-bedded in paraffin to be cut in 5 mm sections. Slideswere stained with H&E and Masson’s Trichrome (MT)using standard procedures. Imaging of H&E and MT-stained sections was obtained using Aperio Scanscopeand Aperio Imagescope software (version 10.0.36.1805,Aperio Technologies, Inc., Vista, CA). MT-stained im-ages were taken using Aperio Imagescope (TIFF) andanalyzed using NIH ImageJ using Aperio exported imageruler. Cardiomyocyte cross-sectional area was measuredusing Image J software. A minimum of 25 random fieldsof the left ventricle at × 200 magnification were imagedfrom at least three different sections from three bio-logical replicates per experimental group.
Cross-sectional area analysis and fibrosis (%)determinationSections of the MT-stained tissue were analyzed in fourcross-sectional defined areas for arrangement and collagencontent histologically and quantitatively by using Meta-Morph analysis (Molecular Devices). Controls served toset the threshold against which the MuRF3−/− mouse sec-tions were measured. Immunostaining for vimentin wasperformed as described previously [22–24]. Briefly, cardiacsections were stained with antibodies against Vimentin(1:100, Cat. #SC-6260, Santa Cruz, Dallas, TX) or an ir-relevant isotype mouse IgG (as a negative control) at 4 °Covernight. Section were then treated with Alexa Fluor488-conjugated secondary antibodies and counterstainedwith 4,6-diamidino-2-phenylindole (DAPI)(Vector Labora-tories, Burlingame, CA). Total positive vimentin stain cells
Quintana et al. BMC Endocrine Disorders (2015) 15:36 Page 4 of 18
were identified and counted in each of the four cross-sectional defined areas using Meta-Morph software(Molecular Devices). Images were taken using EVOSXL Core cell imaging system (Life technologies).
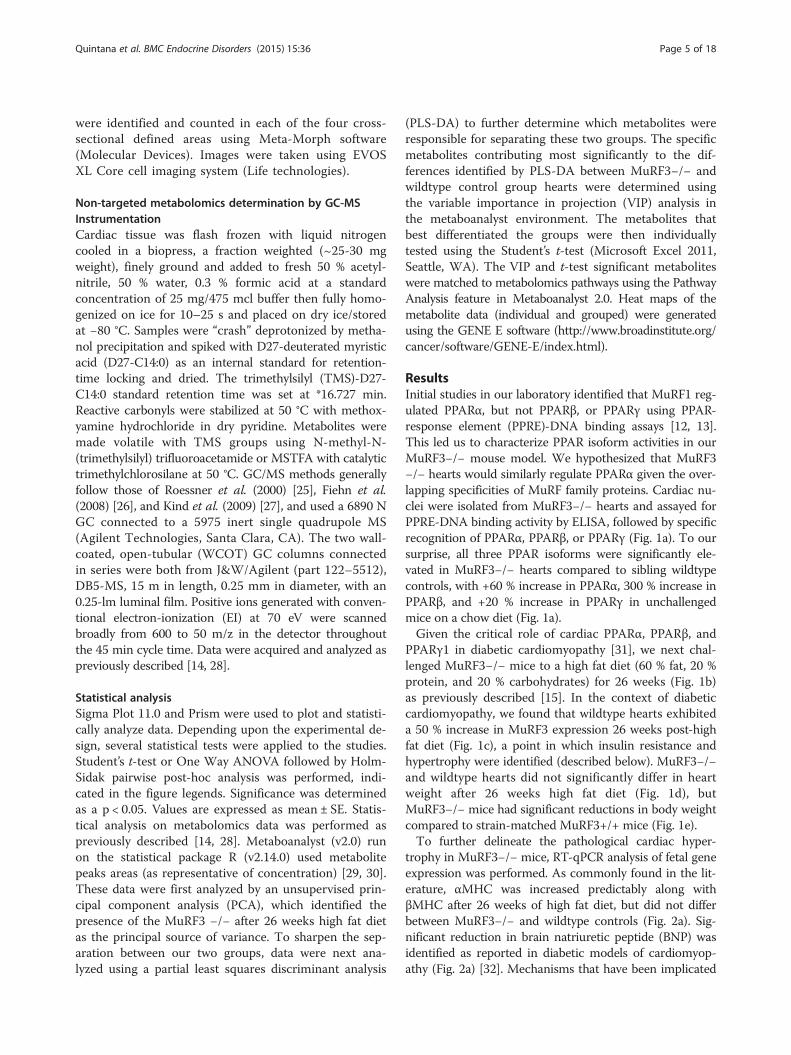
Non-targeted metabolomics determination by GC-MSInstrumentationCardiac tissue was flash frozen with liquid nitrogencooled in a biopress, a fraction weighted (~25-30 mgweight), finely ground and added to fresh 50 % acetyl-nitrile, 50 % water, 0.3 % formic acid at a standardconcentration of 25 mg/475 mcl buffer then fully homo-genized on ice for 10–25 s and placed on dry ice/storedat −80 °C. Samples were “crash” deprotonized by metha-nol precipitation and spiked with D27-deuterated myristicacid (D27-C14:0) as an internal standard for retention-time locking and dried. The trimethylsilyl (TMS)-D27-C14:0 standard retention time was set at *16.727 min.Reactive carbonyls were stabilized at 50 °C with methox-yamine hydrochloride in dry pyridine. Metabolites weremade volatile with TMS groups using N-methyl-N-(trimethylsilyl) trifluoroacetamide or MSTFA with catalytictrimethylchlorosilane at 50 °C. GC/MS methods generallyfollow those of Roessner et al. (2000) [25], Fiehn et al.(2008) [26], and Kind et al. (2009) [27], and used a 6890 NGC connected to a 5975 inert single quadrupole MS(Agilent Technologies, Santa Clara, CA). The two wall-coated, open-tubular (WCOT) GC columns connectedin series were both from J&W/Agilent (part 122–5512),DB5-MS, 15 m in length, 0.25 mm in diameter, with an0.25-lm luminal film. Positive ions generated with conven-tional electron-ionization (EI) at 70 eV were scannedbroadly from 600 to 50 m/z in the detector throughoutthe 45 min cycle time. Data were acquired and analyzed aspreviously described [14, 28].
Statistical analysisSigma Plot 11.0 and Prism were used to plot and statisti-cally analyze data. Depending upon the experimental de-sign, several statistical tests were applied to the studies.Student’s t-test or One Way ANOVA followed by Holm-Sidak pairwise post-hoc analysis was performed, indi-cated in the figure legends. Significance was determinedas a p < 0.05. Values are expressed as mean ± SE. Statis-tical analysis on metabolomics data was performed aspreviously described [14, 28]. Metaboanalyst (v2.0) runon the statistical package R (v2.14.0) used metabolitepeaks areas (as representative of concentration) [29, 30].These data were first analyzed by an unsupervised prin-cipal component analysis (PCA), which identified thepresence of the MuRF3 −/− after 26 weeks high fat dietas the principal source of variance. To sharpen the sep-aration between our two groups, data were next ana-lyzed using a partial least squares discriminant analysis
(PLS-DA) to further determine which metabolites wereresponsible for separating these two groups. The specificmetabolites contributing most significantly to the dif-ferences identified by PLS-DA between MuRF3−/− andwildtype control group hearts were determined usingthe variable importance in projection (VIP) analysis inthe metaboanalyst environment. The metabolites thatbest differentiated the groups were then individuallytested using the Student’s t-test (Microsoft Excel 2011,Seattle, WA). The VIP and t-test significant metaboliteswere matched to metabolomics pathways using the PathwayAnalysis feature in Metaboanalyst 2.0. Heat maps of themetabolite data (individual and grouped) were generatedusing the GENE E software (http://www.broadinstitute.org/cancer/software/GENE-E/index.html).
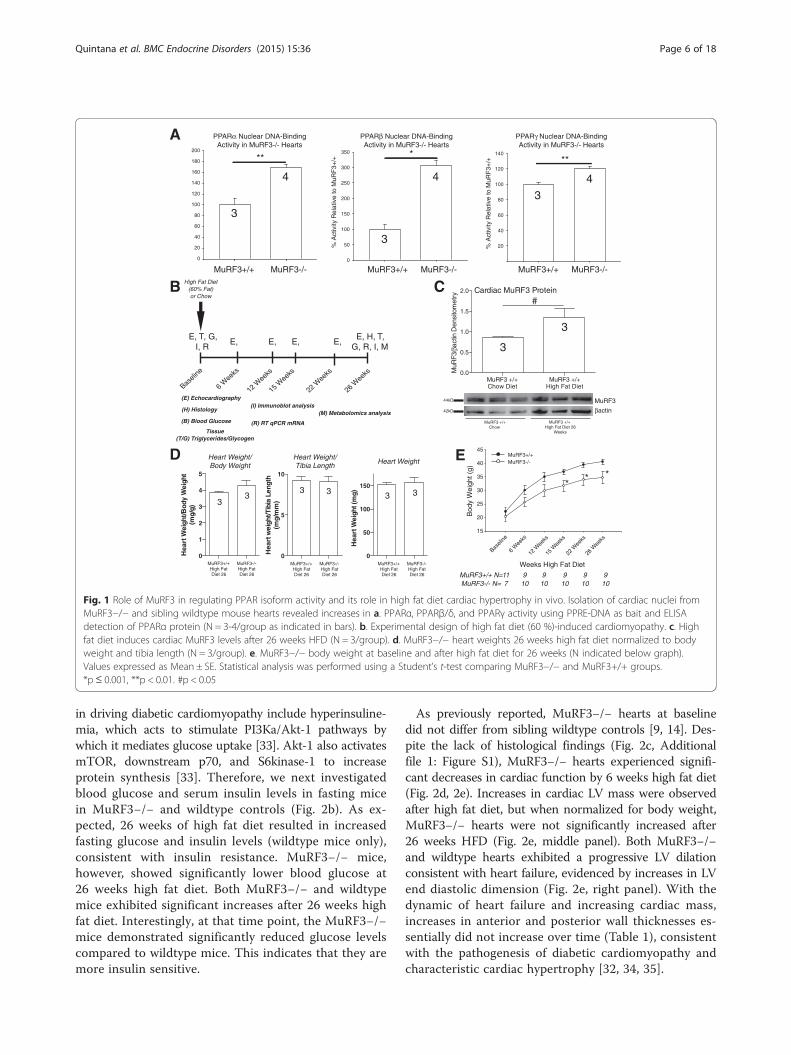
ResultsInitial studies in our laboratory identified that MuRF1 reg-ulated PPARα, but not PPARβ, or PPARγ using PPAR-response element (PPRE)-DNA binding assays [12, 13].This led us to characterize PPAR isoform activities in ourMuRF3−/− mouse model. We hypothesized that MuRF3−/− hearts would similarly regulate PPARα given the over-lapping specificities of MuRF family proteins. Cardiac nu-clei were isolated from MuRF3−/− hearts and assayed forPPRE-DNA binding activity by ELISA, followed by specificrecognition of PPARα, PPARβ, or PPARγ (Fig. 1a). To oursurprise, all three PPAR isoforms were significantly ele-vated in MuRF3−/− hearts compared to sibling wildtypecontrols, with +60 % increase in PPARα, 300 % increase inPPARβ, and +20 % increase in PPARγ in unchallengedmice on a chow diet (Fig. 1a).Given the critical role of cardiac PPARα, PPARβ, and
PPARγ1 in diabetic cardiomyopathy [31], we next chal-lenged MuRF3−/− mice to a high fat diet (60 % fat, 20 %protein, and 20 % carbohydrates) for 26 weeks (Fig. 1b)as previously described [15]. In the context of diabeticcardiomyopathy, we found that wildtype hearts exhibiteda 50 % increase in MuRF3 expression 26 weeks post-highfat diet (Fig. 1c), a point in which insulin resistance andhypertrophy were identified (described below). MuRF3−/−and wildtype hearts did not significantly differ in heartweight after 26 weeks high fat diet (Fig. 1d), butMuRF3−/− mice had significant reductions in body weightcompared to strain-matched MuRF3+/+ mice (Fig. 1e).To further delineate the pathological cardiac hyper-
trophy in MuRF3−/− mice, RT-qPCR analysis of fetal geneexpression was performed. As commonly found in the lit-erature, αMHC was increased predictably along withβMHC after 26 weeks of high fat diet, but did not differbetween MuRF3−/− and wildtype controls (Fig. 2a). Sig-nificant reduction in brain natriuretic peptide (BNP) wasidentified as reported in diabetic models of cardiomyop-athy (Fig. 2a) [32]. Mechanisms that have been implicated
Quintana et al. BMC Endocrine Disorders (2015) 15:36 Page 5 of 18
in driving diabetic cardiomyopathy include hyperinsuline-mia, which acts to stimulate PI3Ka/Akt-1 pathways bywhich it mediates glucose uptake [33]. Akt-1 also activatesmTOR, downstream p70, and S6kinase-1 to increaseprotein synthesis [33]. Therefore, we next investigatedblood glucose and serum insulin levels in fasting micein MuRF3−/− and wildtype controls (Fig. 2b). As ex-pected, 26 weeks of high fat diet resulted in increasedfasting glucose and insulin levels (wildtype mice only),consistent with insulin resistance. MuRF3−/− mice,however, showed significantly lower blood glucose at26 weeks high fat diet. Both MuRF3−/− and wildtypemice exhibited significant increases after 26 weeks highfat diet. Interestingly, at that time point, the MuRF3−/−mice demonstrated significantly reduced glucose levelscompared to wildtype mice. This indicates that they aremore insulin sensitive.
As previously reported, MuRF3−/− hearts at baselinedid not differ from sibling wildtype controls [9, 14]. Des-pite the lack of histological findings (Fig. 2c, Additionalfile 1: Figure S1), MuRF3−/− hearts experienced signifi-cant decreases in cardiac function by 6 weeks high fat diet(Fig. 2d, 2e). Increases in cardiac LV mass were observedafter high fat diet, but when normalized for body weight,MuRF3−/− hearts were not significantly increased after26 weeks HFD (Fig. 2e, middle panel). Both MuRF3−/−and wildtype hearts exhibited a progressive LV dilationconsistent with heart failure, evidenced by increases in LVend diastolic dimension (Fig. 2e, right panel). With thedynamic of heart failure and increasing cardiac mass,increases in anterior and posterior wall thicknesses es-sentially did not increase over time (Table 1), consistentwith the pathogenesis of diabetic cardiomyopathy andcharacteristic cardiac hypertrophy [32, 34, 35].
A
D Heart Weight/Body Weight
Heart Weight/Tibia Length
MuRF3+/+ High Fat Diet 26
MuRF3-/- High Fat Diet 26
0
20
40
60
80
100
120
140
160
180
200
**
% A
ctiv
ity R
elat
ive
to M
uRF
3+/+
0
50
100
150
200
250
300
350 *
% A
ctiv
ityR
elat
i ve
to M
uRF
3+/+
20
40
60
80
100
120
140
**
MuRF3+/+ MuRF3-/- MuRF3+/+ MuRF3-/- MuRF3+/+ MuRF3-/-
PPARα Nuclear DNA-Binding Activity in MuRF3-/- Hearts
PPARβ Nuclear DNA-Binding Activity in MuRF3-/- Hearts
PPARγ Nuclear DNA-Binding Activity in MuRF3-/- Hearts
MuRF3
βactin
44kD
42kD
MuRF3 +/+ Chow
MuRF3 +/+ High Fat Diet 26
Weeks
MuRF3 +/+ Chow Diet
MuRF3 +/+ High Fat Diet
0.0
0.5
1.0
1.5
2.0
MuR
F3/β
actin
Den
sito
met
ry
Cardiac MuRF3 Protein#
E
CB
Baseli
ne
6 Wee
ks
12 W
eeks
15 W
eeks
22 W
eeks
26 W
eeks
High Fat Diet(60% Fat)or Chow
(E) Echocardiography
(H) Histology
(B) Blood Glucose
Tissue(T/G) Triglycerides/Glycogen
(I) Immunoblot analysis
(R) RT qPCR mRNA
(M) Metabolomics analysis
E, T, G, I, R
E, E, E, E,E, H, T,
G, R, I, M
MuRF3+/+ N=MuRF3-/- N=
117
910
910
910
910
910
0
1
2
3
4
5
Hea
rt W
eigh
t/Bod
y W
eigh
t(m
g/g)
0
5
10
Hea
rt w
eigh
t/Tib
ia L
engt
h(m
g/m
m)
0
50
100
150
Hea
rt W
eigh
t (m
g)
MuRF3+/+ High Fat Diet 26
MuRF3-/- High Fat Diet 26
MuRF3+/+ High Fat Diet 26
MuRF3-/- High Fat Diet 26
Heart Weight
15
20
25
30
35
40
45MuRF3+/+MuRF3-/-
Bod
y W
eigh
t (g)
Weeks High Fat Diet
** *
33
3 3 3 3
4
3
4
3
4
3
3
3
Baseli
ne
6 W
eeks
12 W
eeks
22 W
eeks
26 W
eeks
15 W
eeks
Fig. 1 Role of MuRF3 in regulating PPAR isoform activity and its role in high fat diet cardiac hypertrophy in vivo. Isolation of cardiac nuclei fromMuRF3−/− and sibling wildtype mouse hearts revealed increases in a. PPARα, PPARβ/δ, and PPARγ activity using PPRE-DNA as bait and ELISAdetection of PPARα protein (N = 3-4/group as indicated in bars). b. Experimental design of high fat diet (60 %)-induced cardiomyopathy. c. Highfat diet induces cardiac MuRF3 levels after 26 weeks HFD (N = 3/group). d. MuRF3−/− heart weights 26 weeks high fat diet normalized to bodyweight and tibia length (N = 3/group). e. MuRF3−/− body weight at baseline and after high fat diet for 26 weeks (N indicated below graph).Values expressed as Mean ± SE. Statistical analysis was performed using a Student’s t-test comparing MuRF3−/− and MuRF3+/+ groups.*p≤ 0.001, **p < 0.01. #p < 0.05
Quintana et al. BMC Endocrine Disorders (2015) 15:36 Page 6 of 18

To further characterize the cardiac hypertrophy in theMuRF3−/− hearts after 26 weeks high fat diet, we nextdid an analysis of cardiomyocyte cross-sectional areas inperfused fixed histological sections. No differences wereidentified when measurements were taken from multiple
animals across multiple levels (Fig. 3a). The hypergly-cemia of diabetes can contribute to cardiac injury bymultiple mechanisms, including direct and indirect ef-fects on cardiomyocytes and cardiac fibroblasts. Onehallmark of human diabetic cardiomyopathy is fibrosis
B
A βMHC mRNAMuRF3-/- Baseline and 60% High Fat Diet Challenged
E
C MuRF3+/+26 Wks
High Fat Diet
MuRF3-/-26 Wks
High Fat Diet
Atr
ial N
atriu
retic
Fac
tor
(AN
F)
(Fol
d C
hang
e) N
orm
aliz
ed to
18S
ANF mRNA
0.0
0.2
0.4
0.6
0.8
1.0
1.2
1.4
1.6
Ske
leta
l Mus
cle
α-A
ctin
(Fol
d C
hang
e) N
orm
aliz
ed to
18S
Sk. muscle α-actin mRNA
0
2
4
6
8
10
12
14
16
18# #
0
1
2
3
4
5
6
# #
βMH
C (
Fol
d C
hang
e)
Nor
mal
ized
to 1
8S
0.0
0.5
1.0
1.5
2.0
2.5
#
αMHC mRNA
#
0.0
0.2
0.4
0.6
0.8
1.0
1.2
1.4
1.6
1.8 ##
BNP mRNA
BN
P (
Fol
d C
hang
e)
Nor
mal
ized
to 1
8S
αMH
C (
Fol
d C
hang
e)N
orm
aliz
ed to
18S
Fasting Serum Insulin Levels
Ser
um in
sulin
leve
l (ng
/ml)
Fasting Blood Glucose Levels
0
1
2
3
4
5
6 # n.s.
n.s.
n.s.
0
50
100
150
200
250
300
Blo
od G
luco
se (
mg/
dL)
* *
#
MuR
F3+/+
High F
at D
iet
26 W
eeks
MuR
F3-/-
High F
at D
iet
26 W
eeksM
uRF3+
/+
Chow D
iet
MuR
F3-/-
Chow D
iet
EF%
FS%
Eje
ctio
n F
ract
ion
/ F
ract
iona
l Sho
rten
ing
(%)
Baseli
ne
6 W
eeks
12 W
eeks
15 W
eeks
22 W
eeks
26 W
eeks
MuRF3+/+MuRF3-/-
Systolic Function
Weeks High Fat Diet
30
40
50
60
70
80
90
100Left Ventricle Mass
MuRF3+/+MuRF3-/-
LV M
ass
(mg)
Weeks High Fat Diet
MuRF3+/+
MuRF3-/-
26 Wks High Fat Diet
Baseline6 Weeks
High Fat Diet
D
LV End Diasolic Dimension
2.6
2.8
3.0
3.2
3.4
3.6
MuRF3+/+MuRF3-/-
Baseli
ne
6 W
eeks
12 W
eeks
15 W
eeks
22 W
eeks
26 W
eeks
Weeks High Fat Diet
LV E
nd D
iast
olic
Dim
ensi
on (
mm
)
** *
* *
** *
* *
** *
*
80
90
100
110
120
130
140
150
Baseli
ne
6 W
eeks
12 W
eeks
15 W
eeks
22 W
eeks
26 W
eeks
*
**
*
***
*p<0.05 vs. *p<0.05 vs.*p<0.05 vs.
5 5
66
5 5
66
4 4
4
4
5
5
6 6
55
6
6
66
44
6 6
4
4
MuRF3+/+ N=MuRF3-/- N=
910
910
910
910
910
117
MuRF3+/+ N=MuRF3-/- N=
910
910
910
910
910
117
MuRF3+/+ N=MuRF3-/- N=
910
910
910
910
910
117
MuR
F3+/+
High F
at D
iet
26 W
eeks
MuR
F3-/-
High F
at D
iet
26 W
eeksM
uRF3+
/+
Chow D
iet
MuR
F3-/-
Chow D
iet
MuR
F3+/+
High F
at D
iet
26 W
eeks
MuR
F3-/-
High F
at D
iet
26 W
eeksM
uRF3+
/+
Chow D
iet
MuR
F3-/-
Chow D
iet
MuR
F3+/+
High F
at D
iet
26 W
eeks
MuR
F3-/-
High F
at D
iet
26 W
eeksM
uRF3+
/+
Chow D
iet
MuR
F3-/-
Chow D
iet
MuR
F3+/+
High F
at D
iet
26 W
eeks
MuR
F3-/-
High F
at D
iet
26 W
eeksM
uRF3+
/+
Chow D
iet
MuR
F3-/-
Chow D
iet
MuR
F3+/+
High F
at D
iet
26 W
eeks
MuR
F3-/-
High F
at D
iet
26 W
eeksM
uRF3+
/+
Chow D
iet
MuR
F3-/-
Chow D
iet
MuR
F3+/+
High F
at D
iet
26 W
eeks
MuR
F3-/-
High F
at D
iet
26 W
eeksM
uRF3+
/+
Chow D
iet
MuR
F3-/-
Chow D
iet
Fig. 2 MuRF3−/− experience significant deficits in cardiac function after challenge with high fat diet. a qPCR analysis of heart failure associatedfetal gene expression in MuRF3−/− mice at baseline and after 26 weeks high fat diet challenge. b Fasting blood glucose and fasting seruminsulin levels. c Histological analysis of MuRF3−/− and wildtype hearts post-high fat diet challenge. d/e MuRF3−/− mice exhibit an acceleratedheart failure by 6 weeks after the initiation of the high fat diet. Values expressed as Mean ± SE. N indicated in bars (a & b) or below graph (e).The significance of observed differences in grouped mean values was determined using a One Way ANOVA followed by Holm-Sidak pairwisepost hoc analysis. *p < 0.001, #p < 0.05
Quintana et al. BMC Endocrine Disorders (2015) 15:36 Page 7 of 18
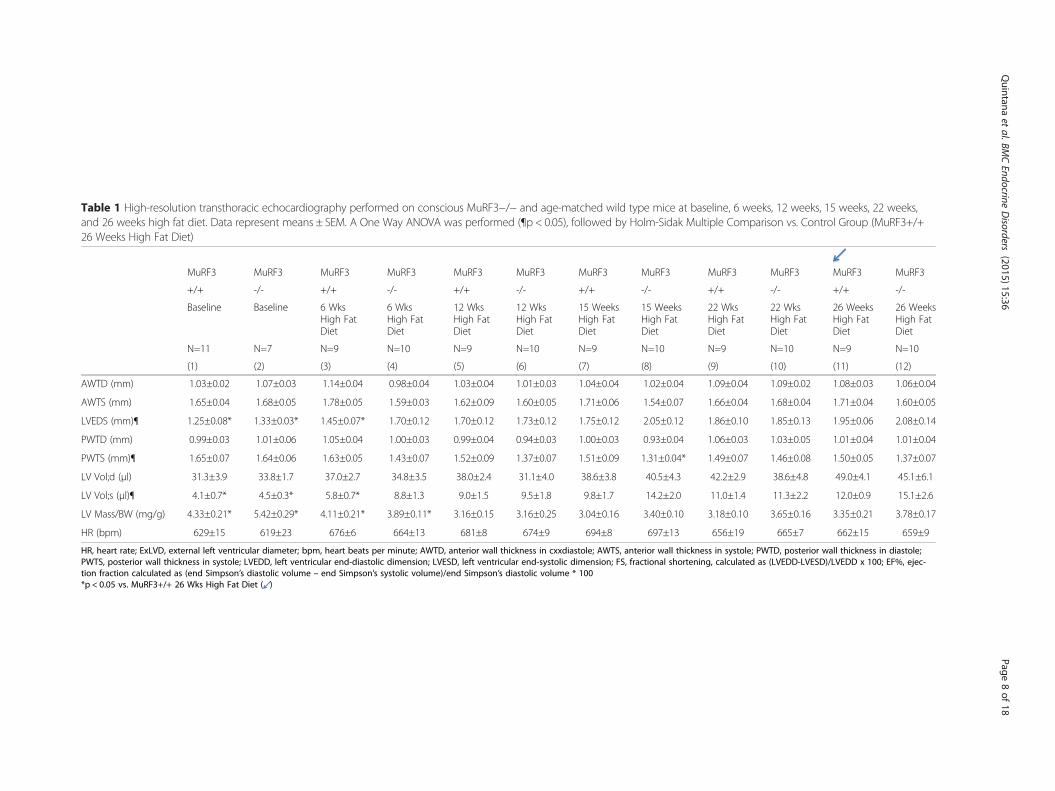
Table 1 High-resolution transthoracic echocardiography performed on conscious MuRF3−/− and age-matched wild type mice at baseline, 6 weeks, 12 weeks, 15 weeks, 22 weeks,and 26 weeks high fat diet. Data represent means ± SEM. A One Way ANOVA was performed (¶p < 0.05), followed by Holm-Sidak Multiple Comparison vs. Control Group (MuRF3+/+26 Weeks High Fat Diet)
MuRF3 MuRF3 MuRF3 MuRF3 MuRF3 MuRF3 MuRF3 MuRF3 MuRF3 MuRF3 MuRF3 MuRF3
+/+ -/- +/+ -/- +/+ -/- +/+ -/- +/+ -/- +/+ -/-
Baseline Baseline 6 WksHigh FatDiet
6 WksHigh FatDiet
12 WksHigh FatDiet
12 WksHigh FatDiet
15 WeeksHigh FatDiet
15 WeeksHigh FatDiet
22 WksHigh FatDiet
22 WksHigh FatDiet
26 WeeksHigh FatDiet
26 WeeksHigh FatDiet
N=11 N=7 N=9 N=10 N=9 N=10 N=9 N=10 N=9 N=10 N=9 N=10
(1) (2) (3) (4) (5) (6) (7) (8) (9) (10) (11) (12)
AWTD (mm) 1.03±0.02 1.07±0.03 1.14±0.04 0.98±0.04 1.03±0.04 1.01±0.03 1.04±0.04 1.02±0.04 1.09±0.04 1.09±0.02 1.08±0.03 1.06±0.04
AWTS (mm) 1.65±0.04 1.68±0.05 1.78±0.05 1.59±0.03 1.62±0.09 1.60±0.05 1.71±0.06 1.54±0.07 1.66±0.04 1.68±0.04 1.71±0.04 1.60±0.05
LVEDS (mm)¶ 1.25±0.08* 1.33±0.03* 1.45±0.07* 1.70±0.12 1.70±0.12 1.73±0.12 1.75±0.12 2.05±0.12 1.86±0.10 1.85±0.13 1.95±0.06 2.08±0.14
PWTD (mm) 0.99±0.03 1.01±0.06 1.05±0.04 1.00±0.03 0.99±0.04 0.94±0.03 1.00±0.03 0.93±0.04 1.06±0.03 1.03±0.05 1.01±0.04 1.01±0.04
PWTS (mm)¶ 1.65±0.07 1.64±0.06 1.63±0.05 1.43±0.07 1.52±0.09 1.37±0.07 1.51±0.09 1.31±0.04* 1.49±0.07 1.46±0.08 1.50±0.05 1.37±0.07
LV Vol;d (μl) 31.3±3.9 33.8±1.7 37.0±2.7 34.8±3.5 38.0±2.4 31.1±4.0 38.6±3.8 40.5±4.3 42.2±2.9 38.6±4.8 49.0±4.1 45.1±6.1
LV Vol;s (μl)¶ 4.1±0.7* 4.5±0.3* 5.8±0.7* 8.8±1.3 9.0±1.5 9.5±1.8 9.8±1.7 14.2±2.0 11.0±1.4 11.3±2.2 12.0±0.9 15.1±2.6
LV Mass/BW (mg/g) 4.33±0.21* 5.42±0.29* 4.11±0.21* 3.89±0.11* 3.16±0.15 3.16±0.25 3.04±0.16 3.40±0.10 3.18±0.10 3.65±0.16 3.35±0.21 3.78±0.17
HR (bpm) 629±15 619±23 676±6 664±13 681±8 674±9 694±8 697±13 656±19 665±7 662±15 659±9
HR, heart rate; ExLVD, external left ventricular diameter; bpm, heart beats per minute; AWTD, anterior wall thickness in cxxdiastole; AWTS, anterior wall thickness in systole; PWTD, posterior wall thickness in diastole;PWTS, posterior wall thickness in systole; LVEDD, left ventricular end-diastolic dimension; LVESD, left ventricular end-systolic dimension; FS, fractional shortening, calculated as (LVEDD-LVESD)/LVEDD x 100; EF%, ejec-tion fraction calculated as (end Simpson’s diastolic volume – end Simpson’s systolic volume)/end Simpson’s diastolic volume * 100*p < 0.05 vs. MuRF3+/+ 26 Wks High Fat Diet ( )
Quintana
etal.BM
CEndocrine
Disorders
(2015) 15:36 Page
8of
18
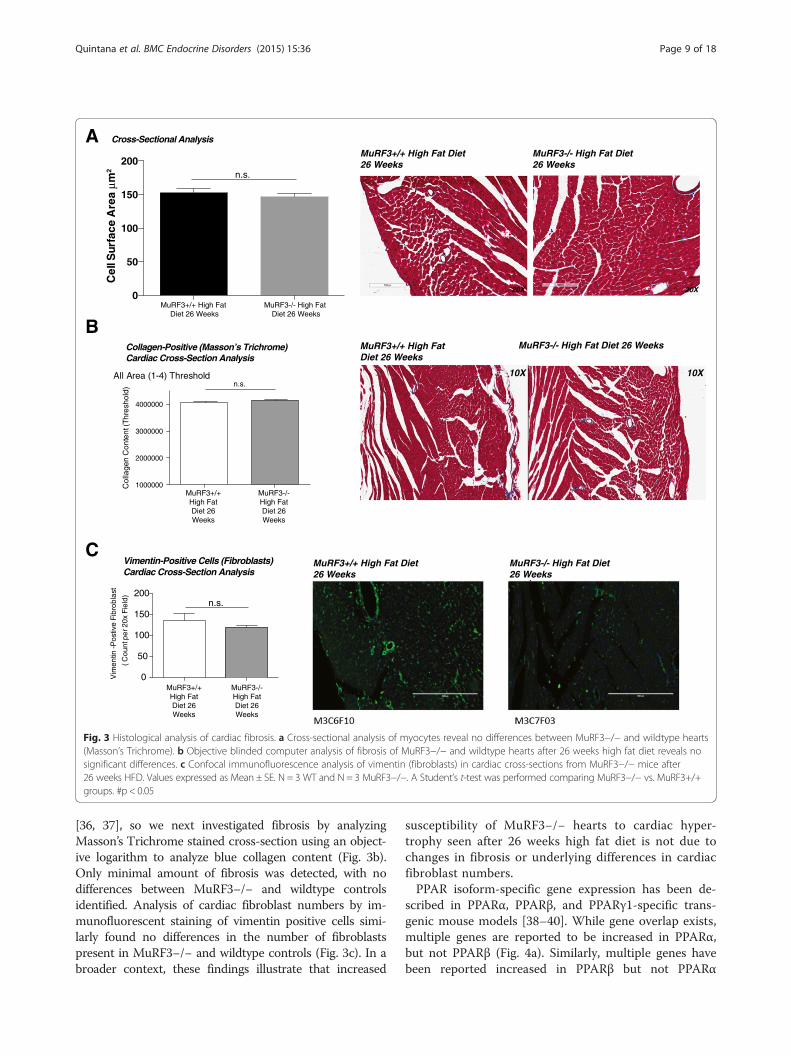
[36, 37], so we next investigated fibrosis by analyzingMasson’s Trichrome stained cross-section using an object-ive logarithm to analyze blue collagen content (Fig. 3b).Only minimal amount of fibrosis was detected, with nodifferences between MuRF3−/− and wildtype controlsidentified. Analysis of cardiac fibroblast numbers by im-munofluorescent staining of vimentin positive cells simi-larly found no differences in the number of fibroblastspresent in MuRF3−/− and wildtype controls (Fig. 3c). In abroader context, these findings illustrate that increased
susceptibility of MuRF3−/− hearts to cardiac hyper-trophy seen after 26 weeks high fat diet is not due tochanges in fibrosis or underlying differences in cardiacfibroblast numbers.PPAR isoform-specific gene expression has been de-
scribed in PPARα, PPARβ, and PPARγ1-specific trans-genic mouse models [38–40]. While gene overlap exists,multiple genes are reported to be increased in PPARα,but not PPARβ (Fig. 4a). Similarly, multiple genes havebeen reported increased in PPARβ but not PPARα
A
B
C
Collagen-Positive (Masson’s Trichrome)Cardiac Cross-Section Analysis
All Area (1-4) Threshold
1000000
2000000
3000000
4000000
Col
lage
n C
onte
nt (T
hres
hold
)
MuRF3+/+High FatDiet 26Weeks
MuRF3-/-High FatDiet 26Weeks
n.s.
MuRF3+/+ High Fat Diet 26 Weeks
MuRF3-/- High Fat Diet 26 Weeks
Cross-Sectional Analysis
Vimentin-Positive Cells (Fibroblasts)Cardiac Cross-Section Analysis
Vim
entin
-Pos
tive
Fibr
obla
st
( Cou
nt p
er 2
0x F
ield
)
n.s.
MuRF3+/+ High Fat Diet26 Weeks
MuRF3-/- High Fat Diet26 Weeks
0
50
100
150
200
MuRF3+/+High FatDiet 26Weeks
MuRF3-/-High FatDiet 26Weeks
10X 10X
0
50
100
150
200
Cel
l Sur
face
Are
a μm
2
MuRF3+/+ High Fat Diet 26 Weeks
MuRF3-/- High Fat Diet 26 Weeks
X02X02
n.s.
MuRF3+/+ High Fat Diet26 Weeks
MuRF3-/- High Fat Diet26 Weeks
Fig. 3 Histological analysis of cardiac fibrosis. a Cross-sectional analysis of myocytes reveal no differences between MuRF3−/− and wildtype hearts(Masson’s Trichrome). b Objective blinded computer analysis of fibrosis of MuRF3−/− and wildtype hearts after 26 weeks high fat diet reveals nosignificant differences. c Confocal immunofluorescence analysis of vimentin (fibroblasts) in cardiac cross-sections from MuRF3−/− mice after26 weeks HFD. Values expressed as Mean ± SE. N = 3 WT and N = 3 MuRF3−/−. A Student’s t-test was performed comparing MuRF3−/− vs. MuRF3+/+groups. #p < 0.05
Quintana et al. BMC Endocrine Disorders (2015) 15:36 Page 9 of 18
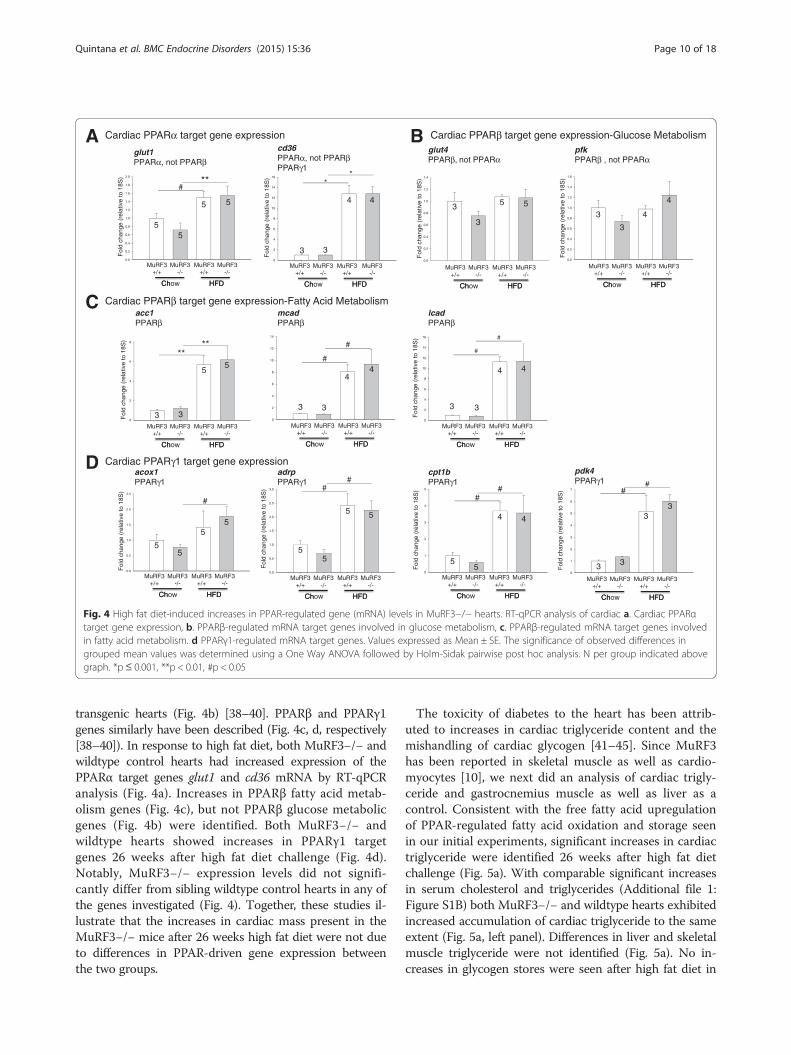
transgenic hearts (Fig. 4b) [38–40]. PPARβ and PPARγ1genes similarly have been described (Fig. 4c, d, respectively[38–40]). In response to high fat diet, both MuRF3−/− andwildtype control hearts had increased expression of thePPARα target genes glut1 and cd36 mRNA by RT-qPCRanalysis (Fig. 4a). Increases in PPARβ fatty acid metab-olism genes (Fig. 4c), but not PPARβ glucose metabolicgenes (Fig. 4b) were identified. Both MuRF3−/− andwildtype hearts showed increases in PPARγ1 targetgenes 26 weeks after high fat diet challenge (Fig. 4d).Notably, MuRF3−/− expression levels did not signifi-cantly differ from sibling wildtype control hearts in any ofthe genes investigated (Fig. 4). Together, these studies il-lustrate that the increases in cardiac mass present in theMuRF3−/− mice after 26 weeks high fat diet were not dueto differences in PPAR-driven gene expression betweenthe two groups.
The toxicity of diabetes to the heart has been attrib-uted to increases in cardiac triglyceride content and themishandling of cardiac glycogen [41–45]. Since MuRF3has been reported in skeletal muscle as well as cardio-myocytes [10], we next did an analysis of cardiac trigly-ceride and gastrocnemius muscle as well as liver as acontrol. Consistent with the free fatty acid upregulationof PPAR-regulated fatty acid oxidation and storage seenin our initial experiments, significant increases in cardiactriglyceride were identified 26 weeks after high fat dietchallenge (Fig. 5a). With comparable significant increasesin serum cholesterol and triglycerides (Additional file 1:Figure S1B) both MuRF3−/− and wildtype hearts exhibitedincreased accumulation of cardiac triglyceride to the sameextent (Fig. 5a, left panel). Differences in liver and skeletalmuscle triglyceride were not identified (Fig. 5a). No in-creases in glycogen stores were seen after high fat diet in
BA
Dacox1PPARγ1
cpt1bPPARγ1
adrpPPARγ1
Cardiac PPARα target gene expression
Cardiac PPARβ target gene expression-Fatty Acid Metabolism
Cardiac PPARγ1 target gene expression
acc1PPARβ
mcadPPARβ
cd36PPARα, not PPARβPPARγ1
pfkPPARβ , not PPARα
lcadPPARβ
pdk4PPARγ1
glut4PPARβ, not PPARα
glut1PPARα, not PPARβ
C
Cardiac PPARβ target gene expression-Glucose Metabolism
0.0
0.2
0.4
0.6
0.8
1.0
1.2
1.4
1.6
1.8
2.0
#**
Chow HFD
+/+ +/+ MuRF3
-/- MuRF3
-/-
Ch HFD
MuRF3 MuRF3
Fol
d ch
ange
(re
lativ
e to
18S
)
0.0
0.2
0.4
0.6
0.8
1.0
1.2
1.4
Chow HFD
+/+ +/+ MuRF3
-/- MuRF3
-/-
Ch HFD
MuRF3 MuRF3
Fol
d ch
ange
(re
lativ
e to
18S
)
0.0
0.5
1.0
1.5
2.0
2.5
3.0 ##
Chow HFD
+/+ +/+ MuRF3
-/- MuRF3
-/-
Ch HFD
MuRF3 MuRF3
Fol
d ch
ange
(re
lativ
e to
18S
)
0
1
2
3
4
5
Fol
d ch
ange
(re
lativ
e to
18S
)
Chow HFD
+/+ +/+ MuRF3
-/- MuRF3
-/-
Ch HFD
MuRF3 MuRF3
##
0
2
4
6
8
10
12
14
16
**
Chow HFD
+/+ +/+ MuRF3
-/- MuRF3
-/-
Ch HFD
MuRF3 MuRF3 F
old
chan
ge (
rela
tive
to 1
8S)
0
1
2
3
4
5
6
7 ##
Fol
d ch
ange
(re
lativ
e to
18S
)
Chow HFD
+/+ +/+ MuRF3
-/- MuRF3
-/-
Ch HFD
MuRF3 MuRF3
0.0
0.2
0.4
0.6
0.8
1.0
1.2
1.4
1.6
Fol
d ch
ange
(re
lativ
e to
18S
)
Chow HFD
+/+ +/+ MuRF3
-/- MuRF3
-/-
Ch HFD
MuRF3 MuRF3
0
2
4
6
8
10
12
14
#
Chow HFD
+/+ +/+ MuRF3
-/- MuRF3
-/-
Ch HFD
MuRF3 MuRF3 0
2
4
6
8
10
12
14
16
#
Chow HFD
+/+ +/+ MuRF3
-/- MuRF3
-/-
Ch HFD
MuRF3 MuRF3
Fol
d ch
ange
(re
lativ
e to
18S
)
0.0
0.5
1.0
1.5
2.0
2.5
#
Fol
d ch
ange
(re
lativ
e to
18S
)
Chow HFD
+/+ +/+ MuRF3
-/- MuRF3
-/-
Ch HFD
MuRF3 MuRF3
**
Fol
d ch
ange
(re
lativ
e to
18S
)
Chow HFD
+/+ +/+ MuRF3
-/- MuRF3
-/-
Ch HFD
0
2
4
6
8 **
MuRF3 MuRF3
55
5 5
3
4 4
3
3
3
5 53 4
4
3
3 3
55
3
44
3 3
4 4
3
55
55
55
5 5
55
4 4
3
33
3
#
#
Fig. 4 High fat diet-induced increases in PPAR-regulated gene (mRNA) levels in MuRF3−/− hearts. RT-qPCR analysis of cardiac a. Cardiac PPARαtarget gene expression, b. PPARβ-regulated mRNA target genes involved in glucose metabolism, c. PPARβ-regulated mRNA target genes involvedin fatty acid metabolism. d PPARγ1-regulated mRNA target genes. Values expressed as Mean ± SE. The significance of observed differences ingrouped mean values was determined using a One Way ANOVA followed by Holm-Sidak pairwise post hoc analysis. N per group indicated abovegraph. *p≤ 0.001, **p < 0.01, #p < 0.05
Quintana et al. BMC Endocrine Disorders (2015) 15:36 Page 10 of 18

the heart, liver, or representative skeletal muscle (Fig. 5b).MRI analysis of fat mass, lean body mass, and total waterof MuRF3−/− and wildtype mice were performed at base-line and after 6, 12, and 22 weeks of high fat diet (Fig. 5c).Consistent with these findings, gastrocnemius, soleus, andtibialis anterior weights did not differ (Additional file 1:Figure S1C). Interestingly, MuRF3−/− mice were resistant
to increases in fat mass resulting from the high fat diet in-take at 6 and 12 weeks, despite recovering these differ-ences by 22 weeks (Fig. 5c). These studies illustrate thatthe MuRF3−/− cardiac hypertrophy and heart failure indiabetic cardiomyopathy cannot be explained by differen-tial storage of cardiac triglyceride or glycogen and that dif-ferences in fat mass were relatively transient.
A
B
C
Car
diac
Trig
lyce
ride
Con
cent
ratio
n (μ
g/m
g tis
sue)
Car
diac
Gly
coge
n C
once
ntra
tion
(μg/
mg
tissu
e)
Gly
coge
n C
once
ntra
tion
(mg/
g tis
sue)
Cardiac Glycogen Concentration
Cardiac Triglyceride Concentration
Live
r T
rigly
cerid
e C
once
ntra
tion
(μg/
g tis
sue)
MuRF3+/+High FatDiet 26Weeks
MuRF3-/-High FatDiet 26Weeks
Trig
lyce
ride
Con
cent
ratio
n (μ
g/g
tissu
e)
Time (on High Fat Diet)
ssaMydoBnaeLssaMtaF Total Water
MuRF3+/+High FatDiet 26Weeks
MuRF3-/-High FatDiet 26Weeks
MuRF3+/+High FatDiet 26Weeks
MuRF3-/-High FatDiet 26Weeks
MuRF3+/+High FatDiet 26Weeks
MuRF3-/-High FatDiet 26Weeks
MuRF3+/+Chow
MuRF3-/-Chow
MuRF3+/+High FatDiet 26Weeks
MuRF3-/-High FatDiet 26Weeks
0
20
40
60
80
100
120
140
160
180 n.s., p=0.184
0
20
40
60
80
100
120
140
160
180
0
20
40
60
80
100
120
#
* *
0
10
20
30
40
50
MuRF3+/+Chow
MuRF3-/-Chow
MuRF3+/+High FatDiet 26Weeks
MuRF3-/-High FatDiet 26Weeks
Baseli
ne
6 Wee
ks
12 W
eeks
22 W
eeks
0
5
10
15
20
25
Fat M
ass
(%)
MuRF3+/+MuRF3-/-
* *
Baseli
ne
6 Wee
ks
12 W
eeks
22 W
eeks
0
5
10
15
20
25
Lean
Bod
y M
ass
(%) MuRF3+/+
MuRF3-/-
Time (on High Fat Diet)
Baseli
ne
6 Wee
ks
12 W
eeks
22 W
eeks
0
5
10
15
20
Free
Wat
er (%
)
MuRF3+/+MuRF3-/-
Time (on High Fat Diet)
0
20
40
60
80
Live
r T
rigly
cerid
e C
once
ntra
tion
(μg/
g tis
sue)
0
5
10
15
20
25
6
6
6
6
3 3
3
3
Skeletal Muscle (Gastrocnemius)Glycogen Concentration 26 Wks
Skeletal Muscle (Gastocnemius) Triglyceride Concentration 26 Wks
Liver Glycogen Concentration 26 Wks
Liver Triglyceride Concentration 26 Wks
4
3
56
44
6
6
MuRF3+/+ N= 3
4
3
3
3
3
9
10MuRF3-/- N=
MuRF3+/+ N= 3
4
3
3
3
3
9
10MuRF3-/- N=
MuRF3+/+ N= 3
4
3
3
3
3
9
10MuRF3-/- N=
n.s., p=0.089
Fig. 5 Analysis of tissue triglyceride, glycogen, and fat mass in MuRF3−/− mice after high fat diet challenge. a Triglyceride analysis of cardiac leftventricle (LV), liver, and skeletal muscle (gastrocnemius). b Glycogen analysis of cardiac LV, liver, and skeletal muscle (gastrocnemius). c Magneticresonance imaging (MRI) analysis of fat mass, lean body mass, and free water at baseline, 6, 12, and 22 weeks HFD. Values expressed as Mean ±SE. A one-way ANOVA was performed to determine significance of cardiac LV triglyceride and glycogen concentrations, followed by a Holm-Sidakpairwise comparison to determine significance between groups. A Student’s t-test was performed comparing MuRF3−/− vs. MuRF3+/+ groups.Numbers above bars represent number of animals (N) included in each experiment (N =MuRF3+/+, MuRF3−/− in c). n.s. = not significant.*p < 0.001, **p < 0.01, #p < 0.05
Quintana et al. BMC Endocrine Disorders (2015) 15:36 Page 11 of 18

Recent studies have implicated the generation of ROSand activation of NF-κB signaling in the pathogenesis ofdiabetic cardiomyopathy [34, 46, 47]. To determine if in-flammatory signaling or differences in insulin resistancewere present to a different degree in MuRF3−/− hearts,we quantified cardiac phospho-p65 indicative of acti-vated NF-κB, pIRS-1, indicative of insulin signaling, andphospho-cJun as a measure of downstream JNK signal-ing resulting from oxidative stress [48]. While high fatdiet clearly increased NF-κB activation (phospho-p65/total p65 protein levels) in both MuRF3+/+ and MuRF3−/−mice compared to chow diet (Fig. 6a, right two groups(chow) increased vs. left two groups (HFD challenged),MuRF3−/− cardiac phospho-p65 levels increased to thesame level as wildtype hearts (Fig. 6a, far right group vs.MuRF3 +/+ high fat diet). No differences in phospho-IRS-1or p-cJun were identified after 26 weeks high fat diet chal-lenge in the present study (Fig. 6b, c, respectively).Post-translational modification of intracellular proteins
by O-linked N-acetylglucosamine (O-GlcNAc) in diabetesis a result of the excess glucose that drives the reaction. O-GlcNAc, in concert with ubiquitin, mediates several aspectsof diabetic cardiomyopathy [49–53]. Therefore, we mea-sured the amount of O-GlcNAc proteins in MuRF3−/−hearts, hypothesizing that the loss of MuRF3 cleared fewerO-GlcNAc-modified proteins to mediate the enhanced car-diomyopathy seen in vivo. Immunoblot analysis of O-GlcNAc-modified proteins in MuRF3−/− hearts dem-onstrated no differences from wildtype hearts whenmice were fed a chow diet or 26 weeks of high fat diet(Additional file 2: Figure S2). While modest increases
in O-GlcNAc levels were identified after 26 weeks of highfat diet, as expected with the observed hyperglycemia, dif-ferences in O-GlcNAc could did not appear to contributeto exaggerated MuRF3−/− cardiac dysfunction.As a ubiquitin ligase, MuRF3 has been shown to ubi-
quitinate and degrade specific substrates in vivo and invitro [10]. In mice with both MuRF1 and MuRF3knocked out, accumulation of protein was identified his-tologically, later identified by mass spectrometry as beta/slow myosin [10]. Both MuRF1 and MuRF3 were thenfound to poly-ubiquitinate beta/slow myosin targeting itfor degradation by the proteasome. One hypothesis wehad in our current model of diabetic cardiomyopathywas that MuRF3 regulated cardiac PPAR activity bypost-translationally modifying PPAR isoforms. To inves-tigate this, we first determined the steady state levels ofPPARα, PPARβ, and PPARγ1 in MuRF3−/− hearts bywestern blot analysis. Control MuRF3−/− hearts frommice on a chow diet did not have significantly differentsteady state protein levels of PPARα or PPARγ1 (Fig. 7a).Unexpectedly, PPARβ protein was significantly decreasedin MuRF3−/− hearts. RT-qPCR analysis of PPARα, PPARβ,and PPARγ1 mRNA in MuRF3−/− hearts revealed thatthis baseline decrease in PPARβ could be explained by de-creased PPARβ mRNA, suggesting that MuRF3 supportedPPARβ through transcriptional regulation (Additionalfile 3: Figure S3A). After 26 weeks of high fat diet,MuRF3−/− hearts showed significantly decreased PPARαprotein (Fig. 7a, left panel). However, no differences inPPARα mRNA were found (Additional file 3: Figure S3A).An alternative possibility is that compensatory expression
BPhospho-p65 (NF-kB subunit) / Total p6526 Weeks High Fat Diet
pIRS-1/Total IRS-1 Protein26 Weeks High Fat Diet
p-cJun/cJun Protein26 Weeks High Fat Diet
IB: βactin
IB: Total p65
IB: Phospho-p65 65 kDa
65 kDa
42 kDa
IB: Total cJun
IB: Phospho- cJun
35.7 kDa
35.7 kDa
42 kDa IB: βactin IB: βactin
IB: Total IRS-1
IB: Phospho- IRS-1
180 kDa
180 kDa
42 kDa
MuR
F3+/+
High F
at D
iet0
1
2
3
4
p-IR
S-1
/ To
tal I
RS
-1 D
ensi
tom
etry
MuR
F3-/-
High F
at D
iet
MuR
F3+/+
Chow D
iet
MuR
F3-/-
Chow D
iet
0
1
2
3
4
p-cJ
un /T
otal
cJu
nD
ensi
tom
etry
MuR
F3+/+
High F
at D
iet
MuR
F3-/-
High F
at D
iet
MuR
F3+/+
Chow D
iet
MuR
F3-/-
Chow D
iet
n.s. n.s.
0.00
0.05
0.10
0.15 ##
MuR
F3+/+
High F
at D
iet
MuR
F3-/-
High F
at D
iet
MuR
F3+/+
Chow D
iet
MuR
F3-/-
Chow D
iet
Pho
spho
-p65
/ To
tal p
65 D
ensi
tom
etry
CA
3 3
33
33 3 3
33
3 3
Fig. 6 Western analysis of MuRF3−/− cardiac NF-κB, IRS-1, and cJun signaling. Immunoblot analysis of a. NF-κB, b. IRS-1, and c. cJun reveal nodifferences in MuRF3−/− and sibling wildtype mice. Values expressed as Mean ± SE. Statistical analysis was performed using a Student’s t-test.N = 3/group. n.s. = not significant. #p < 0.05
Quintana et al. BMC Endocrine Disorders (2015) 15:36 Page 12 of 18
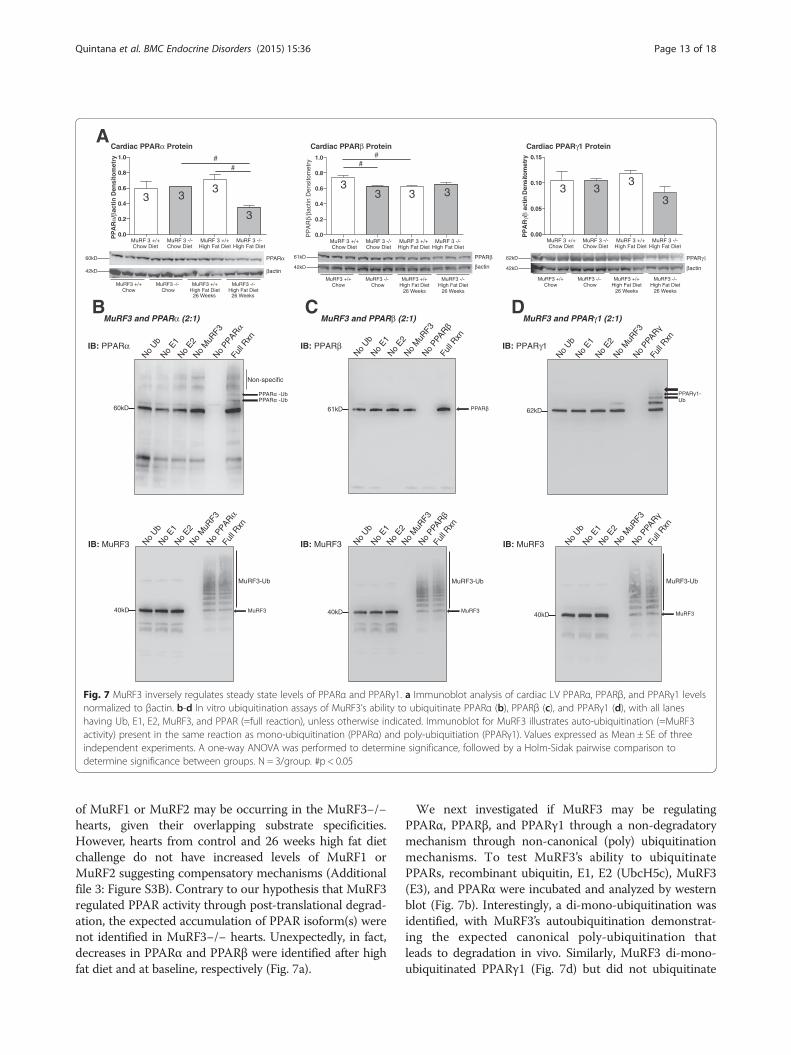
of MuRF1 or MuRF2 may be occurring in the MuRF3−/−hearts, given their overlapping substrate specificities.However, hearts from control and 26 weeks high fat dietchallenge do not have increased levels of MuRF1 orMuRF2 suggesting compensatory mechanisms (Additionalfile 3: Figure S3B). Contrary to our hypothesis that MuRF3regulated PPAR activity through post-translational degrad-ation, the expected accumulation of PPAR isoform(s) werenot identified in MuRF3−/− hearts. Unexpectedly, in fact,decreases in PPARα and PPARβ were identified after highfat diet and at baseline, respectively (Fig. 7a).
We next investigated if MuRF3 may be regulatingPPARα, PPARβ, and PPARγ1 through a non-degradatorymechanism through non-canonical (poly) ubiquitinationmechanisms. To test MuRF3’s ability to ubiquitinatePPARs, recombinant ubiquitin, E1, E2 (UbcH5c), MuRF3(E3), and PPARα were incubated and analyzed by westernblot (Fig. 7b). Interestingly, a di-mono-ubiquitination wasidentified, with MuRF3’s autoubiquitination demonstrat-ing the expected canonical poly-ubiquitination thatleads to degradation in vivo. Similarly, MuRF3 di-mono-ubiquitinated PPARγ1 (Fig. 7d) but did not ubiquitinate
A
B C
PPARγ1
βactin
62kD
42kD
MuRF3 +/+ Chow
MuRF3 +/+ High Fat Diet
26 Weeks
MuRF3 -/- Chow
MuRF3 -/- High Fat Diet
26 Weeks
MuRF 3 +/+Chow Diet
MuRF 3 -/-Chow Diet
MuRF 3 +/+High Fat Diet
MuRF 3 -/-High Fat Diet
0.00
0.05
0.10
0.15
PP
AR
/ac
tin D
ensi
tom
e tr y
Cardiac PPARγ1 Protein
PPARα60kD
42kD
MuRF3 +/+ Chow
MuRF3 +/+ High Fat Diet
26 Weeks
MuRF3 -/- Chow
MuRF3 -/- High Fat Diet
26 Weeks
PP
AR
α/β a
ctin
Den
sito
met
ry
Cardiac PPARα Protein
MuRF 3 +/+Chow Diet
MuRF 3 -/-Chow Diet
MuRF 3 +/+High Fat Diet
MuRF 3 -/-High Fat Diet
0.0
0.2
0.4
0.6
0.8
1.0 ##
βactin
PPARβ61kD
42kD
MuRF3 +/+ Chow
MuRF3 +/+ High Fat Diet
26 Weeks
MuRF3 -/- Chow
MuRF3 -/- High Fat Diet
26 Weeks
0.0
0.2
0.4
0.6
0.8
1.0
PP
AR
β/βa
ctin
Den
sito
met
ry
Cardiac PPARβ Protein
βactin
MuRF 3 +/+Chow Diet
MuRF 3 -/-Chow Diet
MuRF 3 +/+High Fat Diet
MuRF 3 -/-High Fat Diet
No Ub
No E1
No E2
No M
uRF3
Fu
ll Rxn
60kD
PPAR -UbPPAR -Ub
No PPARα
No Ub
No E1
No E2
No M
uRF3
Fu
ll Rxn
IB: MuRF3
40kD
MuRF3-Ub
MuRF3
No PPARα
No Ub
No E1
No E2
No M
uRF3
No
PPAR
Full R
xn
40kD
MuRF3-Ub
MuRF3
No Ub
No E1
No E2
No M
uRF3
No
PPAR
Full R
xn
61kD PPAR
MuRF3 and PPARγ1 (2:1)
No Ub
No E1
No E2
No M
uRF3
No
PPAR
Full R
xn
62kD
PPAR 1-Ub
No Ub
No E1
No E2
No M
uRF3
No
PPAR
Full R
xn
40kD
MuRF3-Ub
MuRF3
MuRF3 and PPARβ (2:1)MuRF3 and PPARα (2:1)D
IB: MuRF3 IB: MuRF3
IB: PPARα IB: PPARβ IB: PPARγ1
Non-specific
3 33
3
33 3 3 3 3
3
3
##
Fig. 7 MuRF3 inversely regulates steady state levels of PPARα and PPARγ1. a Immunoblot analysis of cardiac LV PPARα, PPARβ, and PPARγ1 levelsnormalized to βactin. b-d In vitro ubiquitination assays of MuRF3’s ability to ubiquitinate PPARα (b), PPARβ (c), and PPARγ1 (d), with all laneshaving Ub, E1, E2, MuRF3, and PPAR (=full reaction), unless otherwise indicated. Immunoblot for MuRF3 illustrates auto-ubiquitination (=MuRF3activity) present in the same reaction as mono-ubiquitination (PPARα) and poly-ubiquitiation (PPARγ1). Values expressed as Mean ± SE of threeindependent experiments. A one-way ANOVA was performed to determine significance, followed by a Holm-Sidak pairwise comparison todetermine significance between groups. N = 3/group. #p < 0.05
Quintana et al. BMC Endocrine Disorders (2015) 15:36 Page 13 of 18

PPARβ to any extent (Fig. 7c) with robust positive controls(MuRF3 autoubiquitination). Together, these studies sug-gest that MuRF3 has the ability to add two single ubiquitinmoieties to PPARα and PPARγ1, but not PPARβ, whichmay regulate PPAR activity in vivo.By non-targeted metabolomics analysis, MuRF3−/− hearts
after 26 weeks high fat diet clearly separated using Princi-pal Components analysis (PCA) (Fig. 8a). Analysis of in-dividual components (Fig. 8b) by T-test and VariableInterdependent Parameters (VIP) analysis identified spe-cific metabolites that statistically were different from sib-ling wildtype control hearts (Fig. 8a, lower two panels).Further analysis of the T-test and VIP significant
metabolites demonstrated enrichment for the peroxisomeand mitochondria (Additional File 4: Figure 4Sa.), involvingglutathione metabolism, taurine and hypotaurine metabol-ism, and the synthesis and degradation of ketone bodies(Additional File 4: Figure 4Sb.). The significant metaboliteswere enriched for pyruvate carboxylase deficiency, cardio-genic shock, non-insulin-dependent diabetes mellitus, andheart failure (Additional File 4: Figure 4Sc.).
DiscussionWe determined a role for MuRF3 in the development ofdiabetic cardiomyopathy characterized by the early develop-ment of heart failure and cardiac hypertrophy. Correlating
Fig. 8 Non-targeted cardiac metabolomics of MuRF3−/− mice after 26 Weeks challenge with high fat diet. a Principal components analysis, t-test,and Variable Importance in the Projection Analysis/Partial Least Squares-Discriminant Analysis (PLS-DA), b Heat map of metabolites identified bynon-targeted GC/MS analysis of cardiac tissue. N = 3/group. Significance determined as p < 0.05
Quintana et al. BMC Endocrine Disorders (2015) 15:36 Page 14 of 18
with MuRF3−/− enhanced PPARα and PPARγ1 activities,MuRF3 ubiquitinated PPARα and PPARγ with di-mono-ubiquitin moieties. These non-canonical post-translationalmodifications do not result in substrate degradation, con-sistent with unaltered levels in the MuRF3−/− mice.Non-targeted metabolomics analysis further identifieddefects in MuRF3−/− hearts where altered metaboliteswere enriched similarly to those found in pyruvatedecarboxylase deficiency, an enzyme with a PPAR-response controlling element [54].The role of MuRF3 to date has focused on its struc-
tural role supporting the microtubule network [1], sec-ondarily affecting its maintenance of sarcomeric Z andM-band formation due to these effects on tubulin dy-namics [7]. MuRF3−/− mice challenged with myocardialinfarction have shown a predisposition to cardiac rup-ture after MI [9]. Since microtubule stability is reportedto contribute directly to the cardiac dysfunction ob-served in diabetic cardiomyopathy, loss of MuRF3 maycontribute to the observed cardiac dysfunction in thecurrent model [55–57]. Recent studies have implicatedthe activation of SRF in regulating growth during dia-betic cardiomyopathy [58, 59]. Since MuRF3 interactswith SRF to inhibit its activity much in the same way itshighly homologous MuRF1 and MuRF2 family membersdo [3, 5], we anticipated MuRF3−/− hearts would exhibitan exaggerated hypertrophy (HW/BW, LV Mass, etc.).To our surprise, MuRF3−/− hearts hypertrophied to thesame degree as wildtype controls over time (Fig. 1d,Fig. 2e, Table 1), illustrating either MuRF3 minimal con-tribution to regulating SRF during the development ofdiabetic cardiomyopathy or potentially its redundantregulation of SRF with other MuRF family members.This is the first published report of MuRF3’s upregula-
tion during diabetic cardiomyopathy (Fig. 1c). Analysis ofMuRF3’s promoter regulatory elements 10–20 kb up-stream and 10 kb downstream have revealed multiple re-gions for the glucocorticoid receptor (GR), AML1, Lmo2,POU3F2, CREB, E2F, and E2F-1 (SAB Biosciences, http://www.genecards.org/cgi-bin/carddisp.pl?gene=TRIM54).Disease modeling and phenotypic drug screening for dia-betic cardiomyopathy has revealed the potential forglucocorticoid receptor involvement [60], diabetic car-diomyopathy upregulation of CREB [61], and the E2Ffamily transcription factors, including E2F1 [62]. Giventhe detrimental effects of inadequate MuRF3 during thedevelopment of type 2 diabetes seen in the MuRF3−/−mice, the upregulation of MuRF3 may be investigatedfurther for its therapeutic potential suggested in thecurrent studies.The non-canonical ubiquitination with mono-ubiquitin
moieties in the current study is distinctly different thanpreviously reported canonical ubiquitination of PPARs incancer cells (recently reviewed [63]). The canonical
ubiquitination (non-Lys63 linked poly-ubiquitin chains)associated with mediating proteasome dependent degrad-ation was not found in the present study. This non-degradatory ubiquitin mediated regulation of PPARs hasnot been reported in any system previously, including theheart. Similarly, specific ubiquitin ligases have not beenidentified in these processes prior to this identification ofMuRF3. Contrasting to the current literature in cancercells whereby poly-ubiquitination and/or degradation ofsubstrate has been reported, the lack of degradation ofPPARα and PPARγ1 despite mono-di-ubiquitination(Fig. 7b, 7D) differs significantly. The ubiquitin ligase14ARF has been reported to di-ubiquitinate p53 in cancercells in a manner which inhibits MDM2, another 14ARFsubstrate [64]. Like previous reports of multi-ubiquitinated(e.g., mono- and di-ubiquitination) substrates [65–67],MuRF3 does not lead to PPAR degradation in the physio-logical conditions. MuRF3’s multi-ubiquitination may offeradditional clues into the complex regulation of cardiacPPAR isoforms previously unknown. Another novel findingin the present study is that cardiac MuRF3 supports theexpression of PPARβ protein (Fig. 7a) at baseline throughsupporting its transcription (PPARβ mRNA, Additionalfile 3: Figure S3).In our initial studies, we identified that nuclear PPARβ
activity was increased 3 fold in MuRF3−/− hearts (Fig. 1a),but steady state protein levels were decreased (Fig. 7a)along with decreased PPARβ mRNA. Curiously, MuRF3did not ubiquitinate PPARβ in vitro (Fig. 7c). Since thePPAR transcription factor involves a number of additionalproteins, including RXRα and co-activators such as PGC-1, in addition to inhibitors, such as NCoR and SMRT, allof which can be SUMOylated and/or ubiquitinated [68],the answer may lie in the complexity and interactivity ofthe system. MuRF3−/− hearts may not be degrading aPPARβ enhancing co-factor, for example, to result in theenhanced PPARβ binding activity assayed in these studies.In this case, even the small decrease in PPARβ may not beenough to counteract the large increases in PPRE affinitythis unknown factor may afford, giving us the results inthe present study. Further molecular characterization ofthe PPARβ complex is warranted, given MuRF3’s interest-ing regulation of it both transcriptionally and through cur-rently unknown activating factor(s).Non-targeted metabolomics analysis of baseline MuRF3−/−
hearts recently identified differences [14]. While few dif-ferences were seen in MuRF3−/− hearts compared to sib-ling wildtype controls, with significant overlap in PCAanalysis, VIP significance identified taurine, α-monostearin,aldohexose1, and glutamic acid [14]. In contrast, we identi-fied clear differences in the MuRF3−/− cardiac metabolo-mics signature compared to wildtype mice (Fig. 8a). Whilethe taurine signature was again identified after high fat dietas it was on a chow diet, a broader array of metabolites
Quintana et al. BMC Endocrine Disorders (2015) 15:36 Page 15 of 18
were identified differentially in MuRF3−/− hearts (see VIPanalysis metabolites and T-test summary, Fig. 8a).In the diabetic heart, impaired glycolysis and facilita-
tion of the pentose phosphate pathway has recently beendescribed [69]. In a type 2 diabetes mellitus model(OLETF), pressure overloading has identified acutechanges in inosine 5-monophosphate and adenosine,consistent with higher cardiac AMP deaminase activityand ATP depletion [69]. While such distinctive conclu-sions cannot be made based solely on the metabolomicsfindings, the altered inosine and adenosine has beenidentified in critically ICU patients [70] and may indicateunderlying processes leading to the MuRF3−/− cardiacphenotype in the present study. Alternations in acetoa-cetate have been described in the heart, which has sig-nificance given the hearts ability to utilize acetoacetateby anaplerosis. The substitution of acetoacetate for glu-cose by anaplerosis, whereby TCA intermediates fill in,has been tested as an alternate pathway to form 2-oxoglutarate ex vivo [71]. This may be relevant to theMuRF3−/− phenotype, if applicable, as heart oxidizingacetoacetate resulted in decreased flux through 2-oxoglutarate dehydrogenase prior to contractile failure,therefore thought to be directly contributing to thechanges in cardiac work [71].
ConclusionsThe present study suggests a protective role for MuRF3in diabetic cardiomyopathy and an unexpected role inregulating fat storage despite being found only in stri-ated muscle. MuRF3 is identified as an ubiquitin ligasethat mono-ubiquitinates cardiac PPARα and PPARγ1 ac-tivities in vivo via post-translational modification, whichappears to support PPAR stability in the context of dia-betic cardiomyopathy.
Additional files
Additional file 1: Figure S1. Analysis of circulating total cholesteroland triglyceride and histology in MuRF3−/− mice after high fat diet.A. Representative H&E analysis of MuRF2−/− and MuRF2+/+ tissue.B. Fasting total cholesterol and fasting serum triglyceride levels.C. Organ weights at 26 weeks high fat diet of gastrocnemius, soleus,and tibialis anterior. Values represent the mean ± SE (N indicated in bars).Values expressed as Mean ± SE. A one-way ANOVA was performed todetermine significance followed by an all pairwise multiple comparisonprocedure (Holm-Sidak method). #p < 0.05.
Additional file 2: Figure S2. Detection of cardiac O-GlcNac Proteinmodifications in MuRF3−/− mice after 26 weeks HFD challenge.A. Densitometric analysis of O-GlcNac/βactin immunoblot (B).N = 3/group. Values expressed as Mean ± SE. A one-way ANOVA wasperformed to determine significance followed by an All Pairwise MultipleComparison Procedure (Holm-Sidak method). #p < 0.05.
Additional file 3: Figure S3. mRNA analysis of cardiac PPAR isoformexpression in MuRF3 −/− mice. Quantitative RT qPCR analysis of cardiacA. PPARα mRNA, PPARβ mRNA, and PPARγ1 mRNA and B. MuRF1 mRNAand MuRF2 mRNA at baseline and 26 weeks after high fat diet compared to
sibling-matched wildtype hearts. N indicated in bars. A one-way ANOVA wasperformed to determine significance followed by an All Pairwise MultipleComparison Procedure (Holm-Sidak method). #p < 0.05.
Additional file 4: Figure S4. Enrichment Analysis of Significantlydifferent Metabolits Sets. A. Enrichment by Location-Associated Metabol-ite Sets B. Pathway Analysis of Metabolite Sets, and C. Disease-AssociatedMetabolite sets determined from VIP significant and t-test significantmetabolites identified. N = 3/group.
AbbreviationsEF%: Ejection fraction %; FS%: Fractional shortening %; LV: Left ventricular;LV Vol: Left ventricular volume; LVESD: Left ventricular end systolic dimension;LVEDD: Left ventricular end diastolic dimension; MuRF1/MuRF2/MuRF3: Musclering finger-1 (−2/-3); O-GlcNAc: O-linked N-acetylglucosamine; PCA:Principal components analysis; PLS-DA: Partial least squares discriminantanalysis; PPAR: Peroxisome proliferator activating receptor; SRF: Serumresponse factor; VIP: Variable interdependent parameters.
Competing interestsThe authors declare that they have no competing interests.
Authors’ contributionsMQ, J He, J Hill, and MW conceived the experimental approach, coordinatedand performed the animal experiments (husbandry, feeding, breeding, colonymanagement). JH, MQ performed western blots, blood collection and insulinanalyses in addition to molecular in vitro tests. MW and MQ performed theechocardiography and harvested the tissues for metabolomics. JH, J Schisler,and WS assisted with the design of the high fat diet and interpretation of thecardiac function and morphometric data. YH performed DNA genotyping ofthe mouse colony to confirm identification after harvesting and contributed toanalysis and interpretation of molecular studies. J Sullivan and TG performedand assisted J He and MQ with determining glycogen and triglyceride levels inskeletal muscle, liver, and heart. CY performed histological analysis of fibrosisand vimentin staining. RM and MFE designed the O-Glc-NAC studies, performedthe immunoblots, and wrote the interpretation of the results. JB, CN, and MMperformed the non-targeted metabolomics studies and identified the peaks;MW performed the Metaboanalyst presentation and interpretation of themetabolomics results. MW, MQ, and JH designed, performed, and interpretedexperiments delineating MuRF3’s post-translational modification of PPARisoforms. All authors read and approved the final manuscript.
AcknowledgementsThe authors wish to thank the UNC Animal Histopathology Laboratory forassistance in preparing histological specimens and Dr. Bob Bagnell for hissupport and guidance with the confocal microscopy studies. Lastly, we thankDr. Hyung-Suk Kim of the UNC Animal Clinical Chemistry and Gene ExpressionLaboratories for his assistance in analyzing serum for triglyceride and cholesterolmeasurements. This work was supported by the National Institutes of Health(R01HL104129 to M.W.) the Jefferson-Pilot Corporation (Fellowship to M.W.), theLeducq Foundation Transatlantic Networks (to M.W.). MRI analyses of fat andbody mass were supported by the UNC Nutrition Obesity Research Center(DK056350). Proofreading and editing were provided by Dr. Ashley G. Rivenbark.
Author details1Department of Surgery, University of North Carolina, Chapel Hill, NC, USA.2Department of Pathology & Laboratory Medicine, University of NorthCarolina, Chapel Hill, NC, USA. 3General Hospital of Ningxia MedicalUniversity, Yinchuan, Ningxia, People’s Republic of China. 4McAllister HeartInstitute, University of North Carolina, Chapel Hill, NC, USA. 5Department ofBiology, University of North Carolina, Chapel Hill, NC, USA. 6Department ofNutrition, University of North Carolina, Chapel Hill, NC, USA. 7Department ofPharmacology, University of North Carolina, Chapel Hill, NC, USA. 8NorthCarolina State University, Department of Engineering, Raleigh, NC, USA.9Department of Internal Medicine (Cardiology), University of TexasSouthwestern Medical Center, Dallas, TX, USA. 10Department of HealthPromotions and Development, School of Nursing, University of Pittsburgh,Pittsburgh, PA, USA. 11Cardio-Metabolic Research Group (CMRG), Departmentof Physiological Sciences, Stellenbosch University, Stellenbosch 7600, SouthAfrica. 12Sarah W. Stedman Nutrition and Metabolism Center, Duke MolecularPhysiology Institute, Duke University Medical Center, Durham, NC, USA.
Quintana et al. BMC Endocrine Disorders (2015) 15:36 Page 16 of 18
13Division of Endocrinology, Metabolism, and Nutrition, Department ofMedicine, Duke University Medical Center, Durham, NC, USA.
Received: 2 April 2015 Accepted: 1 June 2015
References1. Spencer JA, Eliazer S, Ilaria Jr RL, Richardson JA, Olson EN. Regulation of
microtubule dynamics and myogenic differentiation by MURF, a striatedmuscle RING-finger protein. J Cell Biol. 2000;150(4):771–84.
2. Centner T, Yano J, Kimura E, McElhinny AS, Pelin K, Witt CC, et al.Identification of muscle specific ring finger proteins as potential regulatorsof the titin kinase domain. J Mol Biol. 2001;306(4):717–26.
3. Lange S, Xiang F, Yakovenko A, Vihola A, Hackman P, Rostkova E, et al.The kinase domain of titin controls muscle gene expression and proteinturnover. Science. 2005;308(5728):1599–603.
4. Pizon V, Iakovenko A, Van Der Ven PF, Kelly R, Fatu C, Furst DO, et al.Transient association of titin and myosin with microtubules in nascentmyofibrils directed by the MURF2 RING-finger protein. J Cell Sci.2002;115(Pt 23):4469–82.
5. Willis MS, Ike C, Li L, Wang DZ, Glass DJ, Patterson C. Muscle ring finger 1,but not muscle ring finger 2, regulates cardiac hypertrophy in vivo. Circ Res.2007;100(4):456–9.
6. Willis MS, Wadosky KM, Rodriguez JE, Schisler JC, Lockyer P, Hilliard EG, et al.Muscle ring finger 1 and muscle ring finger 2 are necessary but functionallyredundant during developmental cardiac growth and regulate E2F1-mediated gene expression in vivo. Cell Biochem Funct. 2014;32(1):39–50.
7. Perera S, Holt MR, Mankoo BS, Gautel M. Developmental regulation of MURFubiquitin ligases and autophagy proteins nbr1, p62/SQSTM1 and LC3during cardiac myofibril assembly and turnover. Dev Biol. 2011;351(1):46–61.
8. Perera S, Mankoo B, Gautel M. Developmental regulation of MURF E3ubiquitin ligases in skeletal muscle. J Muscle Res Cell Motil.2012;33(2):107–22.
9. Fielitz J, van Rooij E, Spencer JA, Shelton JM, Latif S, van der Nagel R, et al. Lossof muscle-specific RING-finger 3 predisposes the heart to cardiac rupture aftermyocardial infarction. Proc Natl Acad Sci U S A. 2007;104(11):4377–82.
10. Fielitz J, Kim MS, Shelton JM, Latif S, Spencer JA, Glass DJ, et al. Myosinaccumulation and striated muscle myopathy result from the loss of muscleRING finger 1 and 3. J Clin Invest. 2007;117(9):2486–95.
11. da Silva MG, Mattos E, Camacho-Pereira J, Domitrovic T, Galina A, CostaMW, et al. Cardiac systolic dysfunction in doxorubicin-challenged rats isassociated with upregulation of MuRF2 and MuRF3 E3 ligases. Exp ClinCardiol. 2012;17(3):101–9.
12. Rodríguez JE, Li L, Willis MS. Muscle ring finger-1 regulates cardiac fatty acidand glucose metabolism via its interaction with PPARalpha. FASEB J.2010;24:38.33.
13. Rodríguez JE, Li L, Willis MS. Muscle Ring Finger-1 (MuRF1), MuRF2, andMuRF3 Differentially Regulate the transcription factors PPARα, PPARγ, andPPARβ/δ, respectively, in vivo. FASEB J. 2011;25:365.362.
14. Banerjee R, He J, Spaniel C, Quintana MT, Wang Z, Bain JR, Newgard CB,Muehlbauer MJ, Willis MS. Non-targeted metabolomics analysis of cardiacMuscle Ring Finger-1 (MuRF1), MuRF2, and MuRF3 in vivo reveals novel andredundant metabolic changes. Metabolomics. 2014, doi:10.1007/s11306-014-0695-1.
15. Battiprolu PK, Hojayev B, Jiang N, Wang ZV, Luo X, Iglewski M, et al.Metabolic stress-induced activation of FoxO1 triggers diabeticcardiomyopathy in mice. J Clin Invest. 2012;122(3):1109–18.
16. Makowski L, Zhou C, Zhong Y, Kuan PF, Fan C, Sampey BP, et al. Obesityincreases tumor aggressiveness in a genetically engineered mouse modelof serous ovarian cancer. Gynecol Oncol. 2014;133(1):90–7.
17. Vaitheesvaran B, LeRoith D, Kurland IJ. MKR mice have increased dynamicglucose disposal despite metabolic inflexibility, and hepatic and peripheralinsulin insensitivity. Diabetologia. 2010;53(10):2224–32.
18. Xin-Long C, Zhao-Fan X, Dao-Feng B, Jian-Guang T, Duo W. Insulinresistance following thermal injury: an animal study. Burns. 2007;33(4):480–3.
19. Li LO, Ellis JM, Paich HA, Wang S, Gong N, Altshuller G, et al. Liver-specificloss of long chain acyl-CoA synthetase-1 decreases triacylglycerol synthesisand beta-oxidation and alters phospholipid fatty acid composition. J BiolChem. 2009;284(41):27816–26.
20. Furuichi Y, Goto-Inoue N, Manabe Y, Setou M, Masuda K, Fujii NL. Imagingmass spectrometry reveals fiber-specific distribution of acetylcarnitine and
contraction-induced carnitine dynamics in rat skeletal muscles. BiochimBiophys Acta. 2014;1837(10):1699–706.
21. Mapanga RF, Rajamani U, Dlamini N, Zungu-Edmondson M, Kelly-LaubscherR, Shafiullah M, et al. Oleanolic Acid: a novel cardioprotective agent thatblunts hyperglycemia-induced contractile dysfunction. PLoS One.2012;7(10):e47322.
22. Xu L, Yates CC, Lockyer P, Xie L, Bevilacqua A, He J, et al. MMI-0100 inhibitscardiac fibrosis in myocardial infarction by direct actions on cardiomyocytesand fibroblasts via MK2 inhibition. J Mol Cell Cardiol. 2014;77:86–101.
23. Yates CC, Krishna P, Whaley D, Bodnar R, Turner T, Wells A. Lack of CXCchemokine receptor 3 signaling leads to hypertrophic and hypercellularscarring. Am J Pathol. 2010;176(4):1743–55.
24. Yates CC, Whaley D, Wells A. Transplanted fibroblasts prevents dysfunctionalrepair in a murine CXCR3-deficient scarring model. Cell Transplant.2012;21(5):919–31.
25. Roessner U, Wagner C, Kopka J, Trethewey RN, Willmitzer L. Technicaladvance: simultaneous analysis of metabolites in potato tuber by gaschromatography–mass spectrometry. Plant J. 2000;23(1):131–42.
26. Fiehn O, Wohlgemuth G, Scholz M, Kind T, Lee Do Y, Lu Y, et al. Qualitycontrol for plant metabolomics: reporting MSI-compliant studies. Plant J.2008;53(4):691–704.
27. Kind T, Wohlgemuth G, Lee Do Y, Lu Y, Palazoglu M, Shahbaz S, et al.FiehnLib: mass spectral and retention index libraries for metabolomicsbased on quadrupole and time-of-flight gas chromatography/massspectrometry. Anal Chem. 2009;81(24):10038–48.
28. Banerjee R, Bultman SJ, Holley D, Hillhouse C, Bain JR, Newgard CB,Muehlbauer MJ, Willis MS. Non-targeted metabolomics of Brg1/Brmdouble-mutant cardiomyocytes reveals a novel role for SWI/SNF complexesin metabolic homeostasis. Metabolomics. 2015; doi:10.1007/s11306-015-0786-7.
29. Xia J, Mandal R, Sinelnikov IV, Broadhurst D, Wishart DS. MetaboAnalyst2.0–a comprehensive server for metabolomic data analysis. Nucleic AcidsRes. 2012;40(Web Server issue):W127–33.
30. Xia J, Psychogios N, Young N, Wishart DS. MetaboAnalyst: a web server formetabolomic data analysis and interpretation. Nucleic Acids Res.2009;37(Web Server issue):W652–60.
31. Lee TI, Kao YH, Chen YC, Huang JH, Hsiao FC, Chen YJ. Peroxisomeproliferator-activated receptors modulate cardiac dysfunction in diabeticcardiomyopathy. Diabetes Res Clin Pract. 2013;100(3):330–9.
32. Cox EJ, Marsh SA. A systematic review of fetal genes as biomarkers ofcardiac hypertrophy in rodent models of diabetes. PLoS One.2014;9(3):e92903.
33. Poornima IG, Parikh P, Shannon RP. Diabetic cardiomyopathy: the search fora unifying hypothesis. Circ Res. 2006;98(5):596–605.
34. Isfort M, Stevens SC, Schaffer S, Jong CJ, Wold LE. Metabolic dysfunction indiabetic cardiomyopathy. Heart Fail Rev. 2014;19(1):35–48.
35. Eguchi K, Boden-Albala B, Jin Z, Rundek T, Sacco RL, Homma S, et al.Association between diabetes mellitus and left ventricular hypertrophy in amultiethnic population. Am J Cardiol. 2008;101(12):1787–91.
36. Sacre JW, Jellis CL, Jenkins C, Haluska BA, Baumert M, Coombes JS, et al. Asix-month exercise intervention in subclinical diabetic heart disease: effectson exercise capacity, autonomic and myocardial function. Metabolism.2014;63(9):1104–14.
37. Nakanishi T, Kato S. Impact of diabetes mellitus on myocardial lipiddeposition: an autopsy study. Pathol Res Pract. 2014;210(12):1018–25.
38. Burkart EM, Sambandam N, Han X, Gross RW, Courtois M, Gierasch CM, et al.Nuclear receptors PPARbeta/delta and PPARalpha direct distinct metabolicregulatory programs in the mouse heart. J Clin Invest. 2007;117(12):3930–9.
39. Son NH, Park TS, Yamashita H, Yokoyama M, Huggins LA, Okajima K, et al.Cardiomyocyte expression of PPARgamma leads to cardiac dysfunction inmice. J Clin Invest. 2007;117(10):2791–801.
40. Liu S, Hatano B, Zhao M, Yen CC, Kang K, Reilly SM, et al. Role ofperoxisome proliferator-activated receptor {delta}/{beta} in hepaticmetabolic regulation. J Biol Chem. 2011;286(2):1237–47.
41. Okere IC, Chandler MP, McElfresh TA, Rennison JH, Sharov V, Sabbah HN,et al. Differential effects of saturated and unsaturated fatty acid diets oncardiomyocyte apoptosis, adipose distribution, and serum leptin. Am JPhysiol Heart Circ Physiol. 2006;291(1):H38–44.
42. Wang H, Sreenivasan U, Hu H, Saladino A, Polster BM, Lund LM, et al.Perilipin 5, a lipid droplet-associated protein, provides physical andmetabolic linkage to mitochondria. J Lipid Res. 2011;52(12):2159–68.
Quintana et al. BMC Endocrine Disorders (2015) 15:36 Page 17 of 18
43. Son NH, Yu S, Tuinei J, Arai K, Hamai H, Homma S, et al. PPARgamma-induced cardiolipotoxicity in mice is ameliorated by PPARalpha deficiencydespite increases in fatty acid oxidation. J Clin Invest. 2010;120(10):3443–54.
44. Stanley WC, Recchia FA. Lipotoxicity and the development of heart failure:moving from mouse to man. Cell Metab. 2010;12(6):555–6.
45. Reichelt ME, Mellor KM, Curl CL, Stapleton D, Delbridge LM. Myocardialglycophagy - a specific glycogen handling response to metabolic stress isaccentuated in the female heart. J Mol Cell Cardiol. 2013;65:67–75.
46. Luo B, Li B, Wang W, Liu X, Xia Y, Zhang C, et al. NLRP3 gene silencingameliorates diabetic cardiomyopathy in a type 2 diabetes rat model.PLoS One. 2014;9(8):e104771.
47. Thomas CM, Yong QC, Mattar Rosa R, Seqqat R, Gopal S, Casarini DE,Jones WK, Gupta S, Baker KM, Kumar R: Cardiac-specific Suppression ofNF-kappaB Signaling Prevents Diabetic Cardiomyopathy via Inhibition ofthe Renin-Angiotensin System. Am J Physiol Heart Circ Physiol.2014;307(7):H1036-45.
48. Wang Y, Zhou S, Sun W, McClung K, Pan Y, Liang G, et al. Inhibition of JNKby novel curcumin analog C66 prevents diabetic cardiomyopathy with apreservation of cardiac metallothionein expression. Am J Physiol EndocrinolMetab. 2014;306(11):E1239–47.
49. Aguilar H, Fricovsky E, Ihm S, Schimke M, Maya-Ramos L, Aroonsakool N,et al. Role for high-glucose-induced protein O-GlcNAcylation in stimulatingcardiac fibroblast collagen synthesis. Am J Physiol Cell Physiol.2014;306(9):C794–804.
50. Marsh SA, Powell PC, Dell’italia LJ, Chatham JC. Cardiac O-GlcNAcylationblunts autophagic signaling in the diabetic heart. Life Sci.2013;92(11):648–56.
51. Kim HS, Woo JS, Joo HJ, Moon WK. Cardiac transcription factor Nkx2.5 isdownregulated under excessive O-GlcNAcylation condition. PLoS One.2012;7(6):e38053.
52. Ruan HB, Nie Y, Yang X. Regulation of protein degradation byO-GlcNAcylation: crosstalk with ubiquitination. Mol Cell Proteomics.2013;12(12):3489–97.
53. Yokoe S, Asahi M, Takeda T, Otsu K, Taniguchi N, Miyoshi E, et al. Inhibitionof phospholamban phosphorylation by O-GlcNAcylation: implications fordiabetic cardiomyopathy. Glycobiology. 2010;20(10):1217–26.
54. Srivastava RA, Jahagirdar R, Azhar S, Sharma S, Bisgaier CL. Peroxisomeproliferator-activated receptor-alpha selective ligand reduces adiposity,improves insulin sensitivity and inhibits atherosclerosis in LDLreceptor-deficient mice. Mol Cell Biochem. 2006;285(1–2):35–50.
55. Shiels H, O’Connell A, Qureshi MA, Howarth FC, White E, Calaghan S.Stable microtubules contribute to cardiac dysfunction in thestreptozotocin-induced model of type 1 diabetes in the rat. Mol CellBiochem. 2007;294(1–2):173–80.
56. Howarth FC, Qureshi MA, White E, Calaghan SC. Cardiac microtubules aremore resistant to chemical depolymerisation in streptozotocin-induceddiabetes in the rat. Pflugers Arch. 2002;444(3):432–7.
57. Shimoni Y, Rattner JB. Type 1 diabetes leads to cytoskeleton changes thatare reflected in insulin action on rat cardiac K(+) currents. Am J PhysiolEndocrinol Metab. 2001;281(3):E575–85.
58. Shan ZX, Lin QX, Deng CY, Zhu JN, Mai LP, Liu JL, et al. miR-1/miR-206regulate Hsp60 expression contributing to glucose-mediated apoptosis incardiomyocytes. FEBS Lett. 2010;584(16):3592–600.
59. Madonna R, Geng YJ, Bolli R, Rokosh G, Ferdinandy P, Patterson C, et al.Co-activation of nuclear factor-kappaB and myocardin/serum responsefactor conveys the hypertrophy signal of high insulin levels in cardiacmyoblasts. J Biol Chem. 2014;289(28):19585–98.
60. Drawnel FM, Boccardo S, Prummer M, Delobel F, Graff A, Weber M, et al.Disease modeling and phenotypic drug screening for diabeticcardiomyopathy using human induced pluripotent stem cells. Cell Rep.2014;9(3):810–21.
61. Chiu J, Farhangkhoee H, Xu BY, Chen S, George B, Chakrabarti S. PARPmediates structural alterations in diabetic cardiomyopathy. J Mol CellCardiol. 2008;45(3):385–93.
62. Vara D, Bicknell KA, Coxon CH, Brooks G. Inhibition of E2F abrogates thedevelopment of cardiac myocyte hypertrophy. J Biol Chem.2003;278(24):21388–94.
63. Wadosky KM, Willis MS. The story so far: post-translational regulation ofperoxisome proliferator-activated receptors by ubiquitination andSUMOylation. Am J Physiol Heart Circ Physiol. 2012;302(3):H515–26.
64. den Besten W, Kuo ML, Tago K, Williams RT, Sherr CJ. Ubiquitination of, andsumoylation by, the Arf tumor suppressor. Isr Med Assoc J. 2006;8(4):249–51.
65. Thrower JS, Hoffman L, Rechsteiner M, Pickart CM. Recognition of thepolyubiquitin proteolytic signal. EMBO J. 2000;19(1):94–102.
66. Buchberger A. From UBA to UBX: new words in the ubiquitin vocabulary.Trends Cell Biol. 2002;12(5):216–21.
67. Jackman RW, Kandarian SC. The molecular basis of skeletal muscle atrophy.Am J Physiol Cell Physiol. 2004;287(4):C834–43.
68. Plutzky J. The PPAR-RXR transcriptional complex in the vasculature: energyin the balance. Circ Res. 2011;108(8):1002–16.
69. Kouzu H, Miki T, Tanno M, Kuno A, Yano T, Itoh T, et al. Excessivedegradation of adenine nucleotides by up-regulated AMP deaminaseunderlies afterload-induced diastolic dysfunction in the type 2 diabeticheart. J Mol Cell Cardiol. 2015;80:136–45.
70. Jabs CM, Sigurdsson GH, Neglen P. Plasma levels of high-energycompounds compared with severity of illness in critically ill patients in theintensive care unit. Surgery. 1998;124(1):65–72.
71. Russell 3rd RR, Taegtmeyer H. Changes in citric acid cycle flux andanaplerosis antedate the functional decline in isolated rat hearts utilizingacetoacetate. J Clin Invest. 1991;87(2):384–90.
Submit your next manuscript to BioMed Centraland take full advantage of:
• Convenient online submission
• Thorough peer review
• No space constraints or color figure charges
• Immediate publication on acceptance
• Inclusion in PubMed, CAS, Scopus and Google Scholar
• Research which is freely available for redistribution
Submit your manuscript at www.biomedcentral.com/submit
Quintana et al. BMC Endocrine Disorders (2015) 15:36 Page 18 of 18
Related Documents


