J Physiol 581.3 (2007) pp 1247–1258 1247 Muscle metabolism during graded quadriceps exercise in man Jørn W. Helge 1 , Bente Stallknecht 1 , Erik A. Richter 2 , Henrik Galbo 1 and Bente Kiens 2 1 Copenhagen Muscle Research Centre, Department of Biomedical Sciences, Panum Institute and 2 Department of Human Physiology, Institute of Exercise and Sport Sciences, University of Copenhagen, Denmark The aim of the study was to examine local muscle metabolism in response to graded exercise when the involved muscle mass is too small to elicit marked hormonal changes and local blood flow restriction. Nine healthy overnight fasted male subjects performed knee extension exercise with both thighs kicking at 25% of maximal power (W max ) for 45 min (23 ± 1% of pulmonary ˙ V O 2 ,max ) followed by 35 min of kicking with one thigh at 65% and the other at 85% W max (40 ± 1% ˙ V O 2 ,max ). Primed constant infusion of [U- 13 C] palmitate and [ 2 H 5 ]glycerol was carried out. Blood was sampled from a femoral artery and both femoral veins, and thigh blood flow was determined by thermodilution. Muscle biopsies were obtained from m. vastus lateralis of both thighs. From rest through exercise at 25, 65 and 85% W max the thigh blood flow (0.3 ± 0.1, 2.5 ± 0.2, 3.5 ± 0.2, 4.1 ± 0.3 l min −1 ) and oxygen uptake (0.02 ± 0.01, 0.27 ± 0.03, 0.48 ± 0.04, 0.55 ± 0.05 l min −1 ) increased (P < 0.05). The plasma fatty acids oxidized in the thigh (5 ± 1, 114 ± 15, 162 ± 30, 180 ± 31 μmol min −1 ) increased (P < 0.05) with exercise intensity, whereas the total thigh fat oxidation (19 ± 6, 312 ± 64, 356 ± 93, 323 ± 120 μmol min −1 ) increased (P < 0.05) from rest, but remained unchanged through exercise. The thigh glycerol uptake (1 ± 1, 16 ± 4, 24 ± 10, 39 ± 8 μmol min −1 ) increased significantly from rest through exercise at 25–65 and 85% W max , respectively. Glucose uptake and glycogen breakdown always increased with exercise intensity. In conclusion, in the presence of a high blood flow and oxygen supply and only small hormonal changes, total fat oxidation in muscle increases from rest to light exercise, but then remains constant with exercise intensity up to heavy exercise. However, with increasing exercise intensity, oxidation of plasma free fatty acids increases and accordingly oxidation of other fat sources decreases. These findings are in contrast to whole body measurements performed during graded exercise involving a large muscle mass during which fat oxidation peaks at around 60% of ˙ V O 2 ,max . (Received 16 January 2007; accepted after revision 19 March 2007; first published online 23 March 2007) Corresponding author J. W. Helge: Section of Systems Biology, Dept. of Biomedical Sciences, Panum Institute, Blegdamsvej 3, Dk 2200 n, Copenhagen, Denmark. Email: jhelge@mfi.ku.dk Apart from in extreme conditions, substrate utilized by skeletal muscle is derived from carbohydrate and fat originating from extramuscular and intramuscular sources. During exercise the choice of muscle substrate is primarily affected by exercise intensity and duration, substrate storage prior to exercise and state of training (Saltin & Gollnick, 1983; Galbo, 1983). During whole body exercise, utilization of carbohydrate, derived both from plasma glucose and from muscle glycogen, increases as exercise intensity increases (Wahren, 1970; Saltin & Karlsson, 1971; Romijn et al. 1993; van Loon et al. 2001). In contrast, whole body fat oxidation reaches its maximum at moderate exercise intensities ranging between 55 and 65% of maximal oxygen uptake (Galbo, 1992; Achten et al. 2002). The higher fat oxidation at moderate versus both higher and lower exercise intensities has been ascribed to a higher contribution of fat recruited from both plasma fatty acids (FA) and other fat sources including plasma derived and muscle derived triacylglycerol (Romijn et al. 1993; van Loon et al. 2001). During whole body exercise the autonomic neuroendocrine response is markedly increased as exercise intensity is increased and this influences the muscle substrate delivery through a change in exogenous substrate mobilization and a change in blood flow distribution (Galbo, 1983). Consequently, when exercise intensity is high, the muscle delivery of plasma FA may actually decline due to adipose tissue blood flow restriction and/or increased fatty acid reesterification (Bulow & Madsen, 1981; Romijn et al. 1995), which C 2007 The Authors. Journal compilation C 2007 The Physiological Society DOI: 10.1113/jphysiol.2007.128348

Welcome message from author
This document is posted to help you gain knowledge. Please leave a comment to let me know what you think about it! Share it to your friends and learn new things together.
Transcript

J Physiol 581.3 (2007) pp 1247–1258 1247
Muscle metabolism during graded quadriceps exercisein man
Jørn W. Helge1, Bente Stallknecht1, Erik A. Richter2, Henrik Galbo1 and Bente Kiens2
1Copenhagen Muscle Research Centre, Department of Biomedical Sciences, Panum Institute and 2Department of Human Physiology,
Institute of Exercise and Sport Sciences, University of Copenhagen, Denmark
The aim of the study was to examine local muscle metabolism in response to graded exercise
when the involved muscle mass is too small to elicit marked hormonal changes and local
blood flow restriction. Nine healthy overnight fasted male subjects performed knee extension
exercise with both thighs kicking at 25% of maximal power (W max) for 45 min (23 ± 1% of
pulmonary VO2,max) followed by 35 min of kicking with one thigh at 65% and the other at
85% W max (40 ± 1% VO2,max). Primed constant infusion of [U-13C] palmitate and [2H5]glycerol
was carried out. Blood was sampled from a femoral artery and both femoral veins, and
thigh blood flow was determined by thermodilution. Muscle biopsies were obtained from m.
vastus lateralis of both thighs. From rest through exercise at 25, 65 and 85% W max the thigh
blood flow (0.3 ± 0.1, 2.5 ± 0.2, 3.5 ± 0.2, 4.1 ± 0.3 l min−1) and oxygen uptake (0.02 ± 0.01,
0.27 ± 0.03, 0.48 ± 0.04, 0.55 ± 0.05 l min−1) increased (P < 0.05). The plasma fatty acids
oxidized in the thigh (5 ± 1, 114 ± 15, 162 ± 30, 180 ± 31 μmol min−1) increased (P < 0.05)
with exercise intensity, whereas the total thigh fat oxidation (19 ± 6, 312 ± 64, 356 ± 93,
323 ± 120 μmol min−1) increased (P < 0.05) from rest, but remained unchanged through
exercise. The thigh glycerol uptake (1 ± 1, 16 ± 4, 24 ± 10, 39 ± 8 μmol min−1) increased
significantly from rest through exercise at 25–65 and 85% W max, respectively. Glucose uptake
and glycogen breakdown always increased with exercise intensity. In conclusion, in the presence
of a high blood flow and oxygen supply and only small hormonal changes, total fat oxidation in
muscle increases from rest to light exercise, but then remains constant with exercise intensity up
to heavy exercise. However, with increasing exercise intensity, oxidation of plasma free fatty acids
increases and accordingly oxidation of other fat sources decreases. These findings are in contrast
to whole body measurements performed during graded exercise involving a large muscle mass
during which fat oxidation peaks at around 60% of VO2,max.
(Received 16 January 2007; accepted after revision 19 March 2007; first published online 23 March 2007)
Corresponding author J. W. Helge: Section of Systems Biology, Dept. of Biomedical Sciences, Panum Institute,
Blegdamsvej 3, Dk 2200 n, Copenhagen, Denmark. Email: [email protected]
Apart from in extreme conditions, substrate utilizedby skeletal muscle is derived from carbohydrate andfat originating from extramuscular and intramuscularsources. During exercise the choice of muscle substrateis primarily affected by exercise intensity and duration,substrate storage prior to exercise and state of training(Saltin & Gollnick, 1983; Galbo, 1983). During wholebody exercise, utilization of carbohydrate, derived bothfrom plasma glucose and from muscle glycogen, increasesas exercise intensity increases (Wahren, 1970; Saltin &Karlsson, 1971; Romijn et al. 1993; van Loon et al. 2001). Incontrast, whole body fat oxidation reaches its maximumat moderate exercise intensities ranging between 55 and65% of maximal oxygen uptake (Galbo, 1992; Achten et al.2002). The higher fat oxidation at moderate versus both
higher and lower exercise intensities has been ascribed to ahigher contribution of fat recruited from both plasma fattyacids (FA) and other fat sources including plasma derivedand muscle derived triacylglycerol (Romijn et al. 1993; vanLoon et al. 2001).
During whole body exercise the autonomicneuroendocrine response is markedly increased asexercise intensity is increased and this influences themuscle substrate delivery through a change in exogenoussubstrate mobilization and a change in blood flowdistribution (Galbo, 1983). Consequently, when exerciseintensity is high, the muscle delivery of plasma FAmay actually decline due to adipose tissue blood flowrestriction and/or increased fatty acid reesterification(Bulow & Madsen, 1981; Romijn et al. 1995), which
C© 2007 The Authors. Journal compilation C© 2007 The Physiological Society DOI: 10.1113/jphysiol.2007.128348

1248 J. W. Helge and others J Physiol 581.3
in turn may lead to a decreased plasma FA uptake andoxidation compared to that observed at a moderateexercise intensity (van Loon et al. 2001). Thus duringwhole body exercise, muscle substrate utilization athigher intensities is a reflection of both systemic and localmuscle factors, and it is not clear how exercise intensitywithout the concomitant intensity-dependent whole bodyautonomic neuroendocrine response will affect musclesubstrate utilization. In addition, we and others havepreviously shown that oxidation of plasma long chain fattyacids in the legs during bicycle exercise only represents25–45% of whole body plasma fatty acid oxidation(Burguera et al. 2000; Helge et al. 2001; Roepstorff et al.2002; Kiens, 2006). Thus, lipid oxidation based on wholebody measurements may not be an accurate reflection oflipid metabolism in working muscle. This was recentlyconfirmed by Friedlander et al. (2007).
To address these issues we used the two-legged kneeextension exercise model, which elicits a markedly lowerincrease in the autonomic neuroendocrine response thanthat observed during whole body exercise. With thismodel oxygen delivery for contracting muscle and musclesubstrate metabolism is also not restricted by centralcirculatory capacity (Andersen et al. 1985), becauseno more than 6–6.5 kg of muscle is fully recruitedduring contractions (Andersen & Saltin, 1985) andmuscle metabolism can be directly quantified. Thus, thepresent study aimed to investigate the effect of contractionintensity per se on human thigh muscle substrateutilization studied directly by the leg balance technique,stable isotopes and muscle biopsies.
Methods
Subjects
Nine untrained healthy male subjects, age 25 ± 1 year,height 182 ± 2 cm, weight 76 ± 3 kg and maximal oxygenuptake 3.9 ± 0.2 l O2 min−1 (mean ± s.e.m.) participatedin the study. Subjects were fully informed of the natureand the possible risks associated with the study before theyvolunteered to participate. The study was approved by theEthics Committee for Medical Research in Copenhagenand adhered to the declaration of Helsinki II.
Experimental protocol
Prior to the experiment subjects were accustomed toexercise in the knee extension ergometer, and maximalwork capacity (W max) was determined for each leg(Andersen et al. 1985). In brief an incremental one legexercise test was performed and pulmonary oxygen uptake,carbon dioxide excretion and heart rate were measured.When the incremental exercise could be performed
using only the quadriceps muscle, additional muscle wasrecruited to support the quadriceps muscle, such as gluteal,hamstring and stomach muscle. The one leg W max wasthen established as the maximal work capacity that can beperformed without other muscle involvement. In additionthe experimental exercise protocol was rehearsed for eachsubject, namely 45 min kicking with both legs at 25%W max followed by 35 min of kicking with one leg at 65%and one leg at 85% W max. In particular the synchronizedkicking with two legs with different workloads waspracticed. Selection of the leg eligible for high (85%W max) versus moderate (65% W max) intensity was doneby randomised stratification, such that the dominant andnon-dominant leg were similarly represented. Also prior tothe experimental day, whole body maximal oxygen uptakewas determined on a Krogh bicycle ergometer using aprogressive incremental exercise test.
For 2 days prior to the experiment, subjects were askedto consume a diet low in foods containing 13C such ascane sugar and maize (corn) and furthermore to refrainfrom vigorous physical activity. The subjects reported tothe laboratory in the morning at 8 a.m. after a 10 h fast.Initially subjects were placed for 15–30 min in a supineposition. After this, catheters were placed in the femoralartery and both femoral veins under local anaesthesia byan aseptic technique, and the tips were advanced to ∼2 cmabove and below the inguinal ligament in the retrogradeand antegrade direction, respectively. A thermistor (EdslabProbe 94-030-2.5-F, Baxter Healthcare) for measuringvenous blood temperature was advanced 8 cm proximal tothe catheter tip in both veins. A catheter was also insertedinto an antecubital vein for the infusion of stable isotopetracer. The catheters were kept patent by intermittentflushing with sterile sodium citrate. Subjects were thenplaced in a semi-supine position and rested for half anhour. Then blood was sampled simultaneously from thefemoral artery and veins, and thigh venous blood flowwas measured by the thermodilution method by use ofbolus injections of 5 ml ice-cold isotonic saline (Andersenet al. 1985); the average of three sequential determinationsperformed with 2–3 min intervals was used.
Prior to exercise two incisions were made in both thighsunder local analgesia (2–3 ml lidocaine, 20 mg ml−1)and a needle biopsy was obtained with suction fromboth vastus lateralis muscles approximately 12–18 cmabove the knee. At this point the bicarbonate poolwas primed with a bolus of NaH13CO3 (0.1 mg kg−1,99% enriched) and the glycerol pool with a bolus of[1,1,2,3,3-2H5]glycerol (1.5 mg kg−1, 99% enriched). Afterthis a continuous infusion of [U-13C]palmitate using acalibrated syringe pump (Vial Medical SE 200B, Simonsen& Weel, Copenhagen, Denmark) set at a constant rateof 0.015 μmol kg−1 min−1 and a continuous infusion of[1,1,2,3,3-2H5]glycerol using a calibrated syringe pump(Harward Apparatus, Plymouth Meeting, PA, USA) set at
C© 2007 The Authors. Journal compilation C© 2007 The Physiological Society

J Physiol 581.3 Muscle fat utilization during graded exercise 1249
a rate of 0.1 mg kg −1 min−1 through the 90 min of rest andat 0.2 mg kg−1 min−1 through the 80 min of exercise wereinitiated. After 80 and 85 min of rest, blood was sampledand blood flow measured. Prior to each blood sample andblood flow measurement a cuff placed just below eachknee was inflated to suprasystolic pressure to minimizecontribution from the lower leg. After 90 min, subjectsstarted to perform knee extension exercise at 25% of W max
with both legs kicking simultaneously in two independentknee extension ergometers at a frequency of 60 kicksmin−1. During the 45 min of exercise blood samples weretaken at 15, 30 and 40 min. After blood was sampled,blood flow was measured in both thighs by continuousinfusions of ice-cold isotonic saline (15–20 s) accordingto the thermodilution principle (Andersen et al. 1985).After 45 min, exercise was stopped shortly, approximately2–3 min, and a muscle biopsy was obtained from the vastuslateralis muscle of both thighs. In each thigh the biopsy wasobtained through the same incision as the first biopsy, butin the opposite direction, distal – proximal, of the firstbiopsy. Subsequently exercise was continued for 35 min,one leg exercising at 65% of W max and the other leg at 85%of W max. After 15, 30 and 35 min blood was sampled, andblood flow was measured at 15 and 30 min as describedabove. Immediately after exercise termination a biopsywas taken from the vastus lateralis muscle of both thighsthrough the second incision. Heart rate was recordedcontinuously during exercise with a PE 3000 SportsTester (Polar Electro, Finland). Throughout the exercisesubjects had free access to water. Two subjects were not ableto fully complete the second exercise period; one subjectmissed the last 30 min of exercise and the other subject onlythe very last blood sample and blood flow measurement.Therefore all data points including moderate and highintensity have n = 8 except for the last data point wheren = 7.
Pulmonary oxygen uptake and carbon dioxide excretionat rest and during exercise were measured using theDouglas bag technique as previously described (Helge et al.1996). Throughout the exercise, just prior to each bloodsample, expired air was sampled into Douglas bags andsubsequently small aliquots were collected into evacuatedglass tubes (Vacutainer, Becton Dickinson, Meylan, Cedex,France) for the analysis of 13CO2 enrichment.
On a separate day two of the subjects volunteeredto do an acetate recovery experiment. The experimentalprotocol was similar to that described above, but withoutthe infusion of the fatty acid and glycerol tracers as wellas muscle biopsies. After the initial preparations andplacement of the arterial and venous femoral cathetersa NaH13CO3 (0.085 mg kg−1, 99% enriched) prime wasfollowed by a constant infusion of [1,2-13C]acetate(0.075 μmol kg−1min−1) for 90 min followed by 45and 35 min of knee extension exercise performed withboth legs simultaneously as described above. Blood flow
measurements and blood sampling were performed asdescribed above.
Materials
[U-13C]Palmitate, [1,1,2,3,3-2H5]glycerol, [1,2-13C]acetate and sodium[13C]bicarbonate (99% enriched)were purchased from Cambridge Isotope Laboratories,Andover, MA, USA. Preparation of the tracers for infusionhas been described elsewhere (Roepstorff et al. 2002). Inbrief the palmitic acid tracer in solution was added tomethanolic potassium hydroxide to form the potassiumsalt, dried under nitrogen, redissolved in sterile water,passed through a 0.22 μm sterile filter and added andthereby complexed to sterile 20% (w/v) human albumin(State Serum Institute, Copenhagen, Denmark). The[1,1,2,3,3-2H5]glycerol tracer and the [1,2-13C]acetatewere dissolved in sterile isotonic saline and passed througha sterile 0.22 μm filter immediately prior to infusion.
Analytical procedures
Arterial and venous plasma palmitate concentration andenrichment were determined by gas chromatograph–massspectrometry (GC-MS, Automass II, Finnigan France)as previously described (Roepstorff et al. 2002; vanHall et al. 2002c). The enrichment of 13CO2 inexpired air and in arterial and venous blood wasanalysed by gas chromatograph isotope ratio–massspectrometry; GC-IRMS (GC-IRMS, Deltaplus, FinniganMatt, Germany) as previously described (Roepstorff et al.2002; van Hall et al. 2002c). Plasma glycerol and acetateconcentrations and enrichments were determined by gaschromatography–mass spectrometry (GC-MS, AutomassII, Finnigan, France) as recently described (van Hall et al.2002a,b; Roepstorff et al. 2004).
Blood glucose and lactate were analysed on a glucoseand lactate analyser (Yellow Springs Instruments, YellowSprings, OH, USA). Plasma glycerol was analysedas described in Wieland (1974). Insulin in arterialplasma was determined using a radio immunoassay kit(Insulin RIA100, Pharmacia, Sweden) and catecholaminesin arterial plasma were determined by a radio-enzymatic procedure (Christensen et al. 1980). Bloodoxygen saturation, haematocrit, PCO2
, PO2and pH
were measured with the Astrup technique (ABL 30,Radiometer, Copenhagen, Denmark). Haemoglobin wasdetermined spectrophotometrically on the haemoximeterby the cyan-methaemoglobin method (Drabkin & Austin,1935).
The biopsies were frozen in liquid nitrogen within10–15 s of sampling and were stored at −80◦C until furtheranalysis. Before biochemical analysis, muscle biopsysamples were freeze dried and dissected free of connective
C© 2007 The Authors. Journal compilation C© 2007 The Physiological Society

1250 J. W. Helge and others J Physiol 581.3
tissue, visible fat and blood using a stereomicroscope.Muscle glycogen concentration was determined as glucoseresidues after hydrolysis of the muscle sample in 1 m HCLat 100◦C for 2 h (Lowry & Passonneau, 1972).
Calculations
Thigh volume was determined from measurements of thelength, circumference and skinfold at three sites of thethigh and subsequently this volume was used to calculatethe quadriceps femoris muscle mass as described by Kienset al. (1993) and modified by Radegran et al. (1999).Uptake and release of substrates and metabolites over thethigh were calculated from femoral arterial and venousdifferences multiplied by plasma or blood flow, accordingto the Fick principle. The oxygen and carbon dioxidecontent in the blood was calculated (Siggaard-Andersenet al. 1988) and from this the respiratory quotient (RQ)across the thigh was calculated (Helge et al. 2001). Indirectcalorimetry calculations were performed according to thestoichiometric equations given by Frayn (1983). Fatty acid(FA) oxidation was determined by converting the rate of fatoxidation (g kg−1 min−1) to its molar equivalent, assumingan average molecular weight of fatty acids to be 286 g mol−1
(Frayn, 1983).The thigh fatty acid (FA) extraction was calculated using
the tissue balance approach:
Cpalm,art × Epalm,art − Cpalm,vein × Epalm,vein
Fractional Extraction = Cpalm,art × Epalm,art
where Cpalm is concentration of palmitate in artery (art)and vein, and Epalm is enrichment of palmitate in arteryand vein.
As palmitate kinetics are assumed to be representativefor all fatty acids, the thigh FA uptake, FA release andplasma FA oxidation were calculated according to thefollowing equations:
Thigh FA uptake = fractional palmitate extraction
× arterial FA delivery
Arterial FA delivery = arterial plasma FA concentration
× plasma flow
Thigh FA release = thigh FA uptake − net thigh
× FA uptake
Plasma FA oxidation = thigh FA uptake
× %tracer oxidized
where C is the acetate correction factor calculated asdescribed below. The percentage of tracer taken up by the
thigh which was oxidized was calculated as:
% tracer oxidized = 16
× CV,CO2× EV,CO2
− Ca,CO2× Ea,CO2
Cpalm,art × Epalm,art − Cpalm,vein × Epalm,vein
× C−1 × 100%
where CV,CO2is concentration of CO2 in artery (art) and
vein, and Epalm is enrichment of CO2 in artery (art) andvein.
The estimated oxidation of fatty acids in the thighoriginating from sources other than plasma FA wascalculated as:
Non-plasma FA oxidation = total fat oxidation
− plasma FA oxidation
The acetate correction factor across the leg was calculatedas described by van Hall et al. (2002b). The glycerol tracercalculations were carried out as described by van Hallet al. (2002c). In both cases leg balance equations wereapplied with the underlying principle being similar to thecalculations for the palmitate tracer outlined above.
Whole body fatty acid rate of appearance (Ra) andrate of disappearance (Road) were calculated using thesteady state equations at rest (Wolfe, 1992). Non-steadystate Steele equations (Steele, 1959) modified for usewith stable isotope methodology were applied duringexercise (Romijn et al. 1993; Roepstorff et al. 2002).Plasma fatty acid oxidation and percentage oxidized ofRa were calculated as described in Roepstorff et al. (2002).In addition the contribution of thigh plasma fatty acidoxidation to whole body plasma fatty oxidation wascalculated.
Statistics
The statistical analysis was performed with SigmaStat2.03 (SPSS Inc., Chicago, IL, USA) and data are given asmeans ± s.e.m., if not otherwise stated. If data were notnormally distributed a log transformation was performedprior to the analysis of variance (ANOVA). One-wayand two-way ANOVAs with repeated measures for thetime factor were performed to test for changes from restto exercise and subsequently between exercise intensitiesand/or times. In the presence of significant effects orinteractions the Student–Newman–Keuls test was used asa post hoc test to discern statistical differences. In all cases,an α of 0.05 in two-tailed testing was taken as the level ofsignificance.
Results
Knee extension exercise was performed for 45 min at25% W max (13 ± 1 W) and for 35 min at 65% and 85%
C© 2007 The Authors. Journal compilation C© 2007 The Physiological Society

J Physiol 581.3 Muscle fat utilization during graded exercise 1251
Table 1. Thigh fatty acid (FA) kinetics during graded knee extension exercise
ANOVA ANOVARest 25% Wmax 65% Wmax 85% Wmaz Rest & Ex. Intensity
Femoral arterial FA concentration (μmol l−1) 615 ± 54 ∗ 687 ± 80 720 ± 111 720 ± 111 †FA delivery (μmol min−1) 85 ± 11 ∗ 902 ± 86 # 1369 ± 155 1612 ± 169 † ‡Femoral venous FA concentration (μmol l−1) 651 ± 38 638 ± 44 673 ± 59 679 ± 58Net thigh FA uptake (μmol min−1) 0 ± 3 ∗ 59 ± 15 71 ± 11 81 ± 18 †Fractional extraction (%) 38 ± 2 ∗ 21 ± 2 # 16 ± 2 14 ± 2 † ‡Total thigh FA uptake (μmol min−1) 31 ± 4 ∗ 183 ± 16 206 ± 23 224 ± 25 †Thigh FA release (μmol min−1) 31 ± 2 ∗ 124 ± 14 136 ± 16 142 ± 19 †% FA uptake oxidized 17 ± 21 ∗ 66 ± 10 76 ± 16 80 ± 14 †Thigh plasma FA oxidation (μmol min−1) 5 ± 1 ∗ 114 ± 15 162 ± 30 180 ± 31 $ † ‡Non-corrected thigh plasma FA oxidation (μmol min−1) 1 ± 5 ∗ 67 ± 5 81 ± 15 91 ± 15 †
Tracer data are averaged across the last 15 min of rest, the last 30 min during the initial 45 min of exercise and the last 20 min duringthe final 35 min of exercise. Other data are averaged across the measurement period. Values are means ± S.E.M. ∗P < 0.05 Rest versus25, 65 & 85% Wmax; †: ANOVA effect of exercise intensity including rest. ‡P < 0.05 ANOVA effect of exercise intensity; #P < 0.05 25%Wmax versus 65% Wmax and 85% Wmax; $P < 0.05 25% and 65% Wmax versus 85% Wmax.
of W max (32 ± 3 and 44 ± 3 W), respectively. At restwhole body oxygen uptake was 0.3 ± 0.1 l min−1. Duringthe initial 45 min of exercise whole body oxygen uptakeincreased (P < 0.05) to 0.9 ± 0.1 l min−1 and during thelast 35 min a further increase (P < 0.05) was noted to1.5 ± 0.1 l min−1. This was equivalent to a workloadof 23 ± 1% and 40 ± 1%, respectively, of whole bodymaximal oxygen uptake. Whole body respiratory exchangeratio was similar at rest and during the initial 45 min ofexercise, 0.83 ± 0.02 and 0.84 ± 0.01, respectively. Duringthe following 35 min an increase (P < 0.05) to 0.90 ± 0.01was noted. Prior to exercise heart rate was 62 ± 2 b.p.m.Heart rate increased from rest to 95 ± 2 b.p.m. after 10 minof exercise and no further increase was observed throughthe first 45 min, whereas during the following 35 min ofexercise a continuous increase (P < 0.05) was observed to141 ± 4 b.p.m.
Through the initial 45 min both thighs were exposedto a workload of 25% W max, and since similar datawere observed (P > 0.05), the 25% W max data will bepresented as an average of the values from the two thighs.The thigh blood flow (0.3 ± 0.1, 2.5 ± 0.2, 3.5 ± 0.2,4.1 ± 0.3 l min−1) and also oxygen uptake (0.02 ± 0.01,0.27 ± 0.03, 0.48 ± 0.04, 0.55 ± 0.05 l min−1) increased(P < 0.05) with exercise intensity from rest throughexercise at 25, 65 and 85% W max, respectively. Thecalculated thigh RQ also increased (P < 0.05) withexercise intensity (0.82 ± 0.04, 0.83 ± 0.03, 0.88 ± 0.03,0.91 ± 0.03) from rest through exercise at 25, 65 and 85%of W max, respectively.
Thigh FA kinetics
From rest through the initial 45 min of exercise arterialplasma FA concentration increased (P < 0.05) from612 ± 51 to 723 ± 108 μmol l−1. After 15 min of the next
35 min of exercise the arterial plasma FA concentrationwas 610 ± 68 μmol l−1 and it increased (P < 0.05) to804 ± 136 μmol l−1 at the end of exercise (Table 1). TheFA delivery to the thighs increased (P < 0.05) with exerciseintensity from rest to exercise at 85% W max (Table 1). Thefemoral venous FA concentration remained unchangedfrom rest through the graded exercise (Table 1). Thenet thigh FA uptake increased (P < 0.05) with exerciseintensity (Table 1). After 15 min of exercise the plasmapalmitate enrichment was lower (P < 0.05) than at restand it remained at this level through the remainderof the exercise at 25% W max (Fig. 1). During the last35 min the arterial palmitate enrichment only decreasedinsignificantly compared to that observed at the priorexercise level (Fig. 1A). The arterial and venous blood13CO2 enrichment increased (P < 0.05) from rest to15 min of exercise and no further changes were observed(Fig. 1B). The acetate correction factor (n = 2) is shownin Fig. 1C. The acetate correction factor is somewhat lowduring the moderate and high intensity exercise and thismay be due to the 2–3 min of inactivity before continuationof exercise (Van Loon et al. 2003). The thigh FA uptakeand the thigh FA release both increased (P < 0.05) withincreasing exercise intensity (Table 1). The fractionalextraction of FA decreased (P < 0.05) with increasingexercise intensity (Table 1), and the percentage FA uptakeoxidized increased (P < 0.05) from rest to exercise (Table1). Thigh plasma FA oxidation increased (P < 0.05) asexercise intensity was increased (Table 1). If the acetatecarbon recovery factor is not applied in the calculations anon-corrected thigh plasma FA oxidation shows a similartrend as the corrected values (Table 1). Total thigh fatoxidation calculated from leg RQ was higher (P < 0.05)during exercise than at rest, but there was no differencein total thigh fat oxidation between exercise intensities(Fig. 2).
C© 2007 The Authors. Journal compilation C© 2007 The Physiological Society

1252 J. W. Helge and others J Physiol 581.3
Thigh glycerol kinetics
From rest through the initial 45 min of exercise arterialplasma glycerol concentration increased (P < 0.05) from56 ± 5 to 105 ± 13 μmol l−1. Subsequently, after 35 min ofexercise a further increase (P < 0.05) to 147 ± 13 μmol l−1
was noted (Table 2). The thigh glycerol delivery increased(P < 0.05) with exercise intensity from rest to 85% W max
(Table 2). Also the femoral venous glycerol concentrationwas higher (P < 0.05) during exercise at 65 and 85% W max
than at rest and during exercise at 25% W max (Table 2). Atrest the arterial glycerol enrichment was higher (P < 0.05)than the venous glycerol enrichment. The infusion rate oflabelled glycerol was doubled from rest to exercise and thearterial glycerol enrichment did not change significantlywith exercise, whereas the venous glycerol enrichmentincreased (P < 005, Fig. 1D). The glycerol uptake was
A
Time, min
-15 0 15 30 45 60 75
Palm
itate
en
rich
ment
Tra
cer/
trace
e
6×10⁻³
5×10⁻³
4×10⁻³
3×10⁻³
2×10⁻³
1×10⁻³
2.5×10⁻⁴
2.0×10⁻⁴
1.5×10⁻⁴
1.0×10⁻⁴
5.0×10⁻⁵
Artery
Vein 65 % Wmax
Vein 85 % Wmax
25 & 25 65 & 85
*
B
Time, min
-15 0 15 30 45 60 75
Blo
od 1
3C
O2-e
nri
chm
en
t
T T
R-1
Artery
Vein 65 % Wmax
Vein 85 % Wmax
25 & 25 65 & 85
C
Time, min
-15 0 15 30 45 60 75
Ace
tate
co
rre
ctio
n,
%
0
10
20
30
40
50
60
70
80
25 % Wmax55 % Wmax
85 % Wmax
25 & 25 65 & 85
D
Time, min
-15 0 15 30 45 60 75
Gly
cero
l en
rich
men
tT
race
r/tr
ace
e
5×10⁻²
4×10⁻²
3×10⁻²
2×10⁻²
1×10⁻²
6×10⁻²
Artery
Vein 65 % Wmax
Vein 85 % Wmax
25 & 25 65 & 85
Figure 1. Arterial and venous plasma palmitate enrichment (A), blood enrichment of 13CO2 (B), acetatecorrection factor (C) and arterial and venous blood glycerol enrichment (D) during rest and kneeextension exercise at 25, 65 and 85% Wmax
Tracer glycerol infusion was increased from 0.1 mg kg −1 min−1 at rest to 0.2 mg kg −1 min−1 during exercise.Values are means ± S.E.M., n = 9. ∗P < 0.05 Rest versus 15 min.
lower (P < 0.05) at rest and during exercise at 25% W max
than during exercise at 65 and 85% W max (Table 2).The total glycerol release increased (P < 0.05) as exerciseintensity was increased (Table 2). The net thigh glycerolrelease remained unchanged from rest through the gradedexercise (Table 2).
Thigh carbohydrate metabolism
The femoral arterial and venous glucose concentrationswere higher (P < 0.05) during exercise than at rest(Table 3). The thigh glucose uptake increased (P < 0.05)with exercise intensity from rest to exercise at 85%W max (Table 3). The thigh glucose extraction waslower (P < 0.05) at 25% W max than at rest or duringexercise at 65 and 85% W max. Arterial blood lactate
C© 2007 The Authors. Journal compilation C© 2007 The Physiological Society

J Physiol 581.3 Muscle fat utilization during graded exercise 1253
Table 2. Thigh glycerol kinetics during graded knee extension exercise
ANOVA ANOVARest 25% Wmax 65% Wmax 85% Wmax Rest & Ex. Intensity
Femoral arterial glycerol concentration (μmol l−1) 56 ± 5 ∗ 100 ± 6 # 147 ± 13 147 ± 13 † ‡Glycerol delivery (μmol min−1) 8 ± 1 ∗ 132 ± 13 # 264 ± 38 301 ± 37 † ‡Femoral venous glycerol concentration (μmol l−1) 81 ± 7 ∗ 107 ± 7 # 155 ± 14 155 ± 13 † ‡Net thigh glycerol release (μmol min−1) 3.8 ± 1.1 11.2 ± 2.0 9.4 ± 7.5 10.9 ± 6.0Fractional extraction (%) 21.0 ± 9.8 11.6 ± 3.2 7.9 ± 3.6 10.8 ± 1.7Thigh glycerol uptake (μmol min−1) 1.4 ± 1.1 ∗ 15.1 ± 3.6 24.3 ± 9.7 39.3 ± 8.0 $ † ‡Total glycerol release (μmol min−1) 5.2 ± 1.0 ∗ 26.5 ± 3.9 33.7 ± 7.4 50.1 ± 7.8 $ † ‡
Tracer data are averaged across the last 15 min of rest, the last 30 min of the initial 45 min of exercise and the last 20 min during thefinal 35 min of exercise. Other data are averaged across the measurement period. Values are means ± S.E.M. ∗P < 0.05 Rest versus 25,65 and 85% Wmax; †: ANOVA effect of exercise intensity including rest. ‡P < 0.05 ANOVA effect of exercise intensity; #P < 0.05 25%Wmax versus 65% Wmax and 85% Wmax; $P < 0.05 25% and 65% Wmax versus 85% Wmax.
concentration was identical at rest and during exercise at25% W max, 0.5 ± 0.1 and 0.5 ± 0.1 mmol l−1, respectively.During the last 35 min of knee extension exercise thearterial lactate concentration was increased (P < 0.05)to1.3 ± 0.3 mmol l−1. The femoral arterial and venouslactate concentrations were higher (P < 0.05) duringexercise at 65 and 85% than during rest and exercise at25% W max (Table 3). The net thigh lactate release washigher (P < 0.05) during exercise at 85% W max than atrest and during exercise at 25 and 65% of W max (Table 3).The femoral venous pH was significantly decreased fromrest and across the exercise intensities (Table 3).
Before exercise muscle glycogen concentration wassimilar in the two thighs 496 ± 32 and 516 ± 28 mmol (kgd.w.)−1. After 45 min of exercise at 25% W max, muscleglycogen concentration had decreased (P < 0.05) similarlyin both thighs by 10 ± 3%. After the following 35 min,muscle glycogen concentration was reduced (P < 0.05)to 329 ± 36 and 284 ± 40 mmol (kg d.w.)−1 in the thighsthat exercised at 65 and at 85% W max, respectively. Themuscle glycogen breakdown and the breakdown rate bothincreased (P < 0.05) as exercise intensity was increased(Table 3).
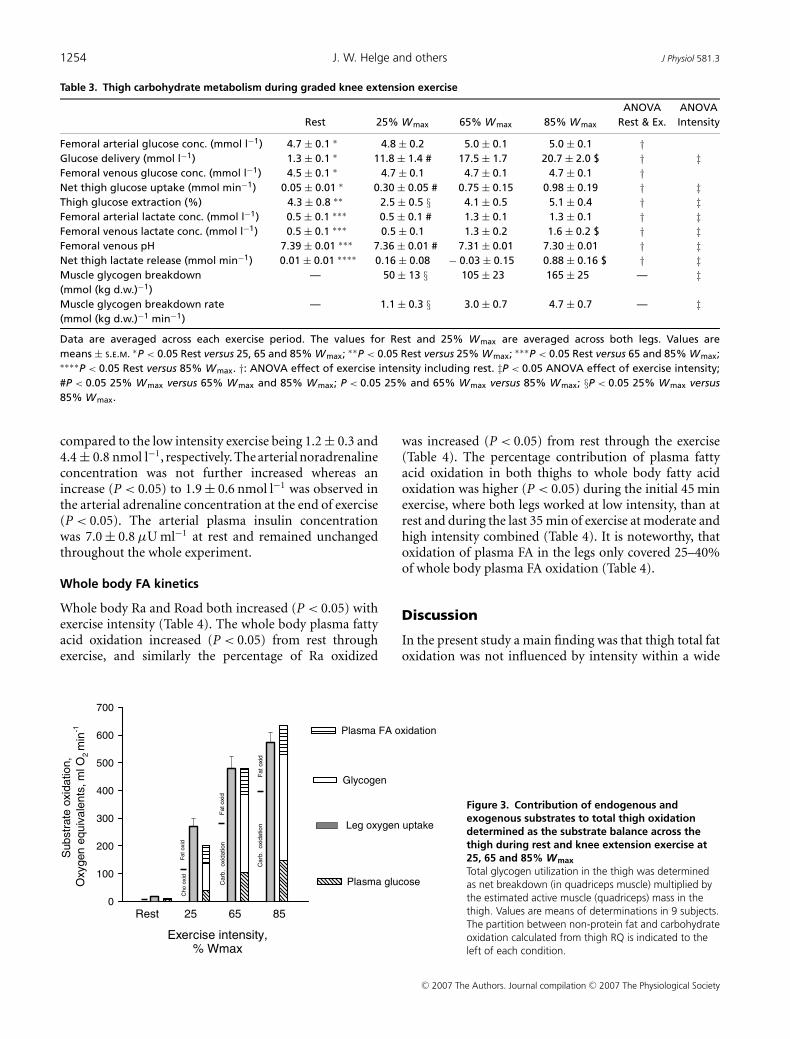
Thigh substrate utilization
Total thigh substrate utilization was calculated as thepercentage contribution in oxygen equivalents derivedfrom the measured substrates, e.g. glycogen, glucose,lactate, glycerol and oxidized plasma FA (Fig. 3). Atrest and during exercise at 25% W max, 34 and 20%of the substrate utilized could not be accounted for,respectively. In contrast at 65 and 85% W max the energycorresponding with the oxygen utilized could be fullyaccounted for. Both at rest and during exercise at 25%W max the utilization of carbohydrate determined byindirect calorimetry (leg RQ) was very similar to themetabolism of carbohydrate determined by the substratebalance approach (Fig. 3). In contrast, during exerciseat 65 and 85% W max the carbohydrate oxidation
determined by indirect calorimetry was lower thancarbohydrate metabolism determined by the substratebalance approach. Accordingly, lipid oxidation was lowercalculated from substrate utilization than calculated fromleg RQ, and lipid oxidation at 65 and 85% W max wascovered entirely by FA oxidation when calculated fromsubstrate balance (Fig. 3).
Hormones
The arterial adrenaline and noradrenaline concentrationsremained unchanged from rest through the first45 min of exercise at 25% W max being 0.73 ± 0.15and 1.3 ± 0.3 nmol l−1, respectively. After 15 min ofthe last 35 min of exercise the arterial adrenaline andnoradrenaline concentration had increased (P < 0.05)
Th
igh
fa
t oxid
ation
, μm
ol m
in-1
0
50
100
150
200
250
300
350
400
450
Exercise intensity,% Wmax
Rest 25 65 85
Plasma FA oxidation
Non plasma FA oxidation
*
* *
†
Figure 2. Contribution of plasma and non-plasma FA to totalthigh fat oxidation during rest and knee extension exercise at25, 65 and 85% Wmax
Data were calculated from leg oxygen uptake and RQ and stableisotope determined plasma fatty acid oxidation. Values aremeans ± S.E.M., n = 9. ∗P < 0.05, Rest versus Exercise. †P < 0.05,ANOVA effect of exercise intensity on plasma palmitate oxidation. SeeTable 1 for further details.
C© 2007 The Authors. Journal compilation C© 2007 The Physiological Society
1254 J. W. Helge and others J Physiol 581.3
Table 3. Thigh carbohydrate metabolism during graded knee extension exercise
ANOVA ANOVARest 25% Wmax 65% Wmax 85% Wmax Rest & Ex. Intensity
Femoral arterial glucose conc. (mmol l−1) 4.7 ± 0.1 ∗ 4.8 ± 0.2 5.0 ± 0.1 5.0 ± 0.1 †Glucose delivery (mmol l−1) 1.3 ± 0.1 ∗ 11.8 ± 1.4 # 17.5 ± 1.7 20.7 ± 2.0 $ † ‡Femoral venous glucose conc. (mmol l−1) 4.5 ± 0.1 ∗ 4.7 ± 0.1 4.7 ± 0.1 4.7 ± 0.1 †Net thigh glucose uptake (mmol min−1) 0.05 ± 0.01 ∗ 0.30 ± 0.05 # 0.75 ± 0.15 0.98 ± 0.19 † ‡Thigh glucose extraction (%) 4.3 ± 0.8 ∗∗ 2.5 ± 0.5 § 4.1 ± 0.5 5.1 ± 0.4 † ‡Femoral arterial lactate conc. (mmol l−1) 0.5 ± 0.1 ∗∗∗ 0.5 ± 0.1 # 1.3 ± 0.1 1.3 ± 0.1 † ‡Femoral venous lactate conc. (mmol l−1) 0.5 ± 0.1 ∗∗∗ 0.5 ± 0.1 1.3 ± 0.2 1.6 ± 0.2 $ † ‡Femoral venous pH 7.39 ± 0.01 ∗∗∗ 7.36 ± 0.01 # 7.31 ± 0.01 7.30 ± 0.01 † ‡Net thigh lactate release (mmol min−1) 0.01 ± 0.01 ∗∗∗∗ 0.16 ± 0.08 − 0.03 ± 0.15 0.88 ± 0.16 $ † ‡Muscle glycogen breakdown — 50 ± 13 § 105 ± 23 165 ± 25 — ‡(mmol (kg d.w.)−1)Muscle glycogen breakdown rate — 1.1 ± 0.3 § 3.0 ± 0.7 4.7 ± 0.7 — ‡(mmol (kg d.w.)−1 min−1)
Data are averaged across each exercise period. The values for Rest and 25% Wmax are averaged across both legs. Values aremeans ± S.E.M. ∗P < 0.05 Rest versus 25, 65 and 85% Wmax; ∗∗P < 0.05 Rest versus 25% Wmax; ∗∗∗P < 0.05 Rest versus 65 and 85% Wmax;∗∗∗∗P < 0.05 Rest versus 85% Wmax. †: ANOVA effect of exercise intensity including rest. ‡P < 0.05 ANOVA effect of exercise intensity;#P < 0.05 25% Wmax versus 65% Wmax and 85% Wmax; P < 0.05 25% and 65% Wmax versus 85% Wmax; §P < 0.05 25% Wmax versus85% Wmax.
compared to the low intensity exercise being 1.2 ± 0.3 and4.4 ± 0.8 nmol l−1, respectively. The arterial noradrenalineconcentration was not further increased whereas anincrease (P < 0.05) to 1.9 ± 0.6 nmol l−1 was observed inthe arterial adrenaline concentration at the end of exercise(P < 0.05). The arterial plasma insulin concentrationwas 7.0 ± 0.8 μU ml−1 at rest and remained unchangedthroughout the whole experiment.
Whole body FA kinetics
Whole body Ra and Road both increased (P < 0.05) withexercise intensity (Table 4). The whole body plasma fattyacid oxidation increased (P < 0.05) from rest throughexercise, and similarly the percentage of Ra oxidized
Sub
str
ate
oxid
atio
n,
Oxyg
en
equ
iva
lents
, m
l O
2m
in-1
0
100
200
300
400
500
600
700
Exercise intensity,% Wmax
Rest 25 65 85
Plasma glucose
Glycogen
Plasma FA oxidation
Fa
t o
xid
Ch
o o
xid
Carb
. o
xid
ation
Fat o
xid
Fat
oxid
Ca
rb. o
xid
atio
n Leg oxygen uptake
Figure 3. Contribution of endogenous andexogenous substrates to total thigh oxidationdetermined as the substrate balance across thethigh during rest and knee extension exercise at25, 65 and 85% Wmax
Total glycogen utilization in the thigh was determinedas net breakdown (in quadriceps muscle) multiplied bythe estimated active muscle (quadriceps) mass in thethigh. Values are means of determinations in 9 subjects.The partition between non-protein fat and carbohydrateoxidation calculated from thigh RQ is indicated to theleft of each condition.
was increased (P < 0.05) from rest through the exercise(Table 4). The percentage contribution of plasma fattyacid oxidation in both thighs to whole body fatty acidoxidation was higher (P < 0.05) during the initial 45 minexercise, where both legs worked at low intensity, than atrest and during the last 35 min of exercise at moderate andhigh intensity combined (Table 4). It is noteworthy, thatoxidation of plasma FA in the legs only covered 25–40%of whole body plasma FA oxidation (Table 4).
Discussion
In the present study a main finding was that thigh total fatoxidation was not influenced by intensity within a wide
C© 2007 The Authors. Journal compilation C© 2007 The Physiological Society

J Physiol 581.3 Muscle fat utilization during graded exercise 1255
Table 4. Whole body fatty acid (FA) kinetics during graded knee extension exercise
ANOVA ANOVARest 15–45 min 60–80 min Rest & Ex. Intensity
Ra FA (mmol min−1) 1.22 ± 0.17 ∗ 1.43 ± 0.09 1.63 ± 0.15 † ‡Road FA (mmol min−1) 1.21 ± 0.17 ∗ 1.42 ± 0.09 1.61 ± 0.15 † ‡FA oxidation (μmol min−1) 68.2 ± 14.7 ∗$ 535 ± 68 # 1285 ± 180 † ‡% Ra FA oxidized 6 ± 1 ∗$ 36 ± 4 # 88 ± 11 † ‡% FA ox. in thighs in whole body 15 ± 2 ∗ 40 ± 5 # 25 ± 5 † ‡
Whole body tracer data are averaged across the last 15 min of rest, the last 30 min during the initial 45 min of exercise and the last20 min during the final 35 min of exercise. Values are means ± S.E.M. †: ANOVA effect of exercise intensity including rest; ‡: ANOVAeffect of exercise intensity; ∗P < 0.05 Rest versus 60–80 min; $P < 0.05 Rest versus 15–45 min; #P < 0.05) 15–45 min versus 60–80 min.
range of intensities from 25 to 85% of maximal poweroutput. However, as contraction intensity was increased aprogressive increase in thigh plasma fatty acid oxidationwas observed and, accordingly, oxidation of fat fromother sources must have decreased. These findings differfrom findings during whole body exercise involving alarger muscle mass, a fact which points at the importanceof extramuscular factors in regulation of musclemetabolism. Alternatively, whole body measurements donot accurately reflect muscle metabolism. Finally, wealso observed an increase in muscle glycerol uptake ascontraction intensity and arterial glycerol concentrationsincreased.
In earlier studies, when progressive graded wholebody exercise was performed, fat oxidation determinedby indirect calorimetry increased from rest and peakedat about 60% of maximal oxygen uptake (VO2,max); itthen decreased at higher exercise intensities (Galbo,1992; Achten et al. 2002). This pattern of fat utilizationduring exercise is consistent with the substrate utilizationstipulated by some of the early Scandinavian work (Krogh& Lindhard, 1920; Christensen & Hansen, 1939) as wellas the cross-over concept (Brooks & Mercier, 1994). Alsowhen whole body exercise was studied on three separatedays, Romijn et al. (1993) found that total fat oxidation washigher at moderate exercise at 65% VO2,max compared toexercise performed at 25 and 85% VO2,max. Furthermore, inthat study stable isotope tracers were used to demonstratethat whole body plasma fatty acid rate of disappearancepeaked at moderate compared to the higher as well asthe lower exercise intensity (Romijn et al. 1993). Thesefindings were extended by van Loon et al. (2001) whoduring incremental exercise directly measured plasma FAoxidation from 13CO2 in expired air and confirmed adecline in the oxidation rate of both plasma FA and otherlipid sources at the highest work intensity (72% of VO2,max)compared to 57% and 44 of VO2,max. The decline in plasmaFA and total fat oxidation was found both relative tototal energy expenditure as well as in absolute numbers.Finally, it was recently shown that leg lipid oxidation in fedpostabsorptive subjects decreased when they performedcycle ergometer exercise at 65% of VO2,max compared to
when they exercised at 45% of VO2,max (Friedlander et al.2007).
In contrast , in the present study where fat metabolismand plasma FA kinetics were measured directly acrossa limited muscle mass, we observed that thigh total fatoxidation calculated from RQ values (Fig. 2) was notinfluenced by exercise intensity within a wide range ofintensities from 25 to 85% of maximal one leg workcapacity (W max). In this study we did not investigate thefat oxidation pattern during exercise at workloads between85 and 100% W max and further studies are needed todetermine the contribution of fat to total oxidation at thesevery high intensities, at which, however, measurementsare rendered difficult by the possible lack of steady state.When exercise intensity was increased in this study, aprogressive increase in thigh plasma fatty acid oxidation(Table 1, Fig. 2) was observed and, accordingly, oxidationof fat from other sources must have decreased. Intensewhole body exercise induces sympathoadrenal activity andplasma catecholamine concentrations that are higher thanwhen exercise is performed with a limited muscle massas in the present study, although a modest increase inplasma catecholamine concentrations was noted at thehigh exercise intensity. Therefore, our findings point tothe importance of extramuscular factors in regulation ofmuscle lipid metabolism. One such extramuscular factorcould be the plasma FA delivery to the exercising muscles.The high sympatho-adrenal response during whole bodyexercise involving a large muscle mass impairs bloodflow in adipose tissue and, in turn, FA release (Bulow& Madsen, 1981) leading to a decrease in plasma FAconcentrations and accordingly a reduction in cellularplasma fatty acid uptake and oxidation. Recent studieshave, however, indicated that other factors than deliveryand uptake of plasma fatty acids also are involved inregulation of cellular fatty acid oxidation. Thus, elevationof plasma FA concentration by infusion of Intralipidand heparin during exercise at 85% of VO2,max onlyslightly restored fat oxidation compared with the levelsobserved during exercise at 65% of VO2,max (Romijn et al.1995). Similarly, in the study by van van Loon et al.(2001) the reduction in plasma FA oxidation rate at the
C© 2007 The Authors. Journal compilation C© 2007 The Physiological Society

1256 J. W. Helge and others J Physiol 581.3
highest work intensity was observed even when plasmaFA concentrations did not decrease. Furthermore, Kienset al. (1999) observed an increase in intramyocellular FAconcentrations concomitantly with a decrease in plasmaFA concentrations when whole body exercise intensitywas increased from 65% to 90% of VO2,max indicating thatintramuscular FA availability was not limiting fat oxidationduring intense whole body exercise.
These findings perhaps suggest that thigh versus wholebody exercise exerts a different effect on intramuscularfactors, which may influence regulation of fat oxidation.During high intensity exercise, lactate is producedand accumulated in muscle and Starritt et al. (2000)proposed that a reduced muscle pH, as a consequenceof muscle lactate accumulation, may decrease CPT-1activity and thus impair transport of fatty acids acrossthe mitochondrial membrane. Albeit we did find a minorincrease in lactate release and a lower venous pH at thehigh compared to low and moderate intensity exercise,the femoral venous plasma lactate concentration was mostlikely too low to reflect anything but a small intramuscularlactate accumulation in the present study. While it cannotbe excluded that such lactate accumulation contributedto the observed decrease in fractional extraction of FAwith exercise intensity, it obviously did not prevent aprogressive increase in plasma FA uptake in exercisingmuscle. Furthermore, the fact that intramuscular lactateaccumulation may be higher during whole body exercisethan during exercise with a smaller muscle groupmay reflect catecholamine mediated muscle blood flowrestriction and enhancement of glycogenolysis (Saltin,1988; Richter et al. 1982), rather than differences in purelyintracellular, contraction mediated mechanisms. Highermuscle glycogeneolysis during whole body exercise thanduring exercise with a small muscle mass may also increaseacetylcarnitine and decrease free carnitine concentrationin muscle leading to inhibited lipid oxidation due toa relative lack of free carnitine as substrate for CPT-1(Roepstorff et al. 2004).
During exercise plasma FA oxidation could not coverthe entire fat oxidation implying that other fat sourcescontribute to fat oxidation as found in many previousstudies. The other likely fat sources are the intramusculartriacylglycerols and the plasma VLDL triacylglycerols.In a prior publication using the same subjects andprotocol as the present paper, we did not observeany significant changes in biochemically determinedmuscle triacylglycerol stores during exercise (Stallknechtet al. 2004) as also found previously during one-leggedknee-extensor exercise (Kiens et al. 1993). However,measured by the microdialysis technique, glycerol releasefrom muscle was detected during exercise at 25% W max,whereas this was not the case at 65 and 85% W max
suggesting that muscle triacylglycerol was contributing tofat utilization during exercise at 25% W max. Nevertheless,
the relative role of muscle and plasma triacylglycerol,respectively, as fuel sources in the present study remainselusive.
Another novel finding in the present study was that legglycerol uptake increased with increasing exercise intensity.Whereas no net glycerol exchange could be detected acrossthe thigh during exercise, the use of a glycerol tracerallowed us to measure the simultaneous uptake and releaseof glycerol. Leg tracer-determined glycerol uptake haspreviously been demonstrated during constant lowintensity one-legged knee-extensions (van Hall et al.2002c), and it was found that uptake increased with timeas did the arterial glycerol concentration. Similarly, in thepresent study the increase in glycerol uptake paralleledthe increase in glycerol delivery (Table 2). Taken together,these data indicate that the main regulator of muscleglycerol uptake during exercise is the glycerol delivery.The observation of leg glycerol release during exercise is inagreement with data published by Bergman et al. (1999)and van Hall et al. (2002c) and is probably due to releasefrom adipose tissue draining to the femoral vein.
It may be argued that the high exercise load inthe present study was not comparable to the muscleload during whole body high intensity exercise. Weconsider this unlikely for the following reasons. First, inthe present study thigh muscle mass and thigh oxygenuptake at the high intensity averaged 2.88 ± 0.11 kg and0.55 ± 0.05 l O2 min−1, respectively. It follows that peakoxygen utilization was approximately 0.19 l O2 min−1 perkg of active muscle. Assuming that intense whole bodyexercise requires activation of approximately 15 kg ofmuscle and the same oxygen utilization, the oxygendemand of the active muscle would be 15 kg ×0.19 l min−1 kg−1 = 2.85 l O2 min−1. Assuming an oxygenrequirement of non-muscle tissue, of 0.5 l O2 min−1, thetotal oxygen utilization would amount to 3.35 l O2 min−1,which is 86% of VO2,max for the subjects of the presentstudy and, accordingly, in relative terms similar to thehighest thigh exercise intensity. Secondly, we found that thecontribution of glucose derived from the circulation andfrom muscle glycogen were increased as exercise intensityincreased. This is similar to the observations in theearlier studies mentioned above, and other evidence in theliterature (Wahren, 1970; Saltin & Karlsson, 1971). Basedon these arguments we consider the high intensity exerciseapplied in the present study to be in good agreement withthe load skeletal muscle experiences during intense wholebody exercise.
Finally, it may be worth noting that plasma FAoxidation in working skeletal muscle accounted for only25–40% of whole body plasma FA oxidation (Table 4).This is in line with previous observations during bicycleexercise (Burguera et al. 2000; Helge et al. 2001; Roepstorffet al. 2002) and indicates that whole body plasmaFA oxidation during exercise only to a limited extent
C© 2007 The Authors. Journal compilation C© 2007 The Physiological Society

J Physiol 581.3 Muscle fat utilization during graded exercise 1257
reflects leg FA oxidation. Recently this conclusion wassupported by (Friedlander et al. 2007). The findingunderscores the importance of measurements using theleg balance technique compared to extrapolating wholebody measurements to muscle during exercise.
Conclusion
In the present study an attempt was made to directly studythe effect of contraction intensity on muscle substraterecruitment and oxidation under very limited influenceof autonomic neurohumoral stimulation. Under theseconditions muscle total fat oxidation remains unchangedfrom low to high exercise intensities, while uptake andoxidation of plasma free fatty acids increase progressively.These findings differ from whole body measurementsduring whole body exercise in which fat oxidation peaksat around 60% of VO2,peak and is lower at both lowerand higher exercise intensities. Whole body exerciseelicits a marked neurohumoral response suggesting thatautonomic neurohumoral mechanisms may modulatelocal contraction mediated regulation of musclemetabolism. Furthermore, whole body measurementsmay not accurately reflect local muscle metabolism.Finally, thigh glycerol uptake increases with increasingexercise intensity and arterial glycerol concentration,suggesting that glycerol may be oxidized in exercisingmuscle.
References
Achten J, Gleeson M & Jeukendrup AE (2002). Determinationof the exercise intensity that elicits maximal fat oxidation.Med Sci Sports Exerc 34, 92–97.
Andersen P, Adams RP, Sj′gaard G, Thorboe A & Saltin B(1985). Dynamic knee extension as model for study ofisolated exercising muscle in humans. J Appl Physiol 59,1647–1653.
Andersen P & Saltin B (1985). Maximal perfusion of skeletalmuscle in man. J Physiol 366, 233–249.
Bergman BC, Butterfield GE, Wolfel EE, Casazza GA,Lopaschuk GD & Brooks GA (1999). Evaluation of exerciseand training on muscle lipid metabolism. Am J PhysiolEndocrinol Metab 276, E106–E117.
Brooks GA & Mercier J (1994). Balance of carbohydrate andlipid utilization during exercise: the ‘crossover’ concept.J Appl Physiol 76, 2253–2261.
Bulow J & Madsen J (1981). Influence of blood flow on fattyacid mobilization from lipolytically active adipose tissue.Pflugers Arch 390, 169–174.
Burguera B, Proctor D, Dietz N, Guo Z, Joyner M & Jensen MD(2000). Leg free fatty acid kinetics during exercise in menand women. Am J Physiol Endocrinol Metab 278,E113–E117.
Christensen EH & Hansen O (1939). Untersuchungen uber dieverbrennungsvorgange bei langdaurnder, schwerermuskelarbeit. Skand Arch Physiol 81, 153–159.
Christensen NJ, Vestergaard P, Sorensen T & Rafaelsen OJ(1980). Cerebrospinal fluid adrenaline and noradrenaline indepressed patients. Acta Psych Scand 61, 178–182.
Drabkin DL & Austin FH (1935). Spectrophotometricstudies II. Preparations from washed blood cells, nitric oxidehemoglobin and sulfhemoglobin. J Biol Chem 122, 51–65.
Frayn K (1983). Calculation of substrate oxidation ratesin vivo from gaseous exchange. J Appl Physiol 55, 628–634.
Friedlander AL, Jacobs KA, Fattor JA, Horning MA, HagobianTA, Bauer TA, Wolfel EE & Brooks GA (2007). Contributionsof working muscle to whole body lipid metabolism arealtered by exercise intensity and training. Am J PhysiolEndocrinol Metab 292, E107–E116.
Galbo H (1983). Hormonal and Metabolic Adaptation toExercise, pp. 1–116. Georg Thieme, New York.
Galbo H (1992). Exercise physiology: Humoral function. SportSci Rev 1, 65–93.
Helge JW, Richter EA & Kiens B (1996). Interaction of trainingand diet on metabolism and endurance during exercise inman. J Physiol 292, 293–306.
Helge JW, Watt PW, Richter EA, Rennie MJ & Kiens B (2001).Fat utilization during exercise; adaptation to fat rich dietincreases utilization of plasma FA and VLDL-TG. J Physiol537, 1009–1020.
Kiens B (2006). Skeletal muscle lipid metabolism in exerciseand insulin resistance. Physiol Rev 86, 205–243.
Kiens B, Essen-Gustavsson B, Christensen NJ & Saltin B (1993).Skeletal muscle substrate utilization during submaximalexercise in man: Effect of endurance training. J Physiol 469,459–478.
Kiens B, Roemen TH & Van der Wusse GJ (1999). Muscularlong-chain fatty acid content during graded exercise inhumans. Am J Physiol Endocrinol Metab 276, E352–E357.
Krogh A & Lindhard J (1920). The relative value of fat andcarbohydrate as sources of muscular energy. Biochem J 14,290–363.
Lowry OH & Passonneau JV (1972). A Flexible System ofEnzymatic Analysis. Academic Press, New York.
Radegran G, Blomstrand E & Saltin B (1999). Peak muscleperfusion and oxygen uptake in humans: importance ofprecise estimates of muscle mass. J Appl Physiol 87,2375–2380.
Richter EA, Ruderman NB, Gavras H, Belur ER & Galbo H(1982). Muscle glycogenolysis during exercise: dual controlby epinephrine and contractions. Am J Physiol EndocrinolMetab 242, E25–E32.
Roepstorff C, Halberg N, Hillig T, Saha AK, Ruderman NB,Wojtaszewski JF, Richter EA & Kiens B (2004). Malonyl-CoAand carnitine in regulation of fat oxidation in human skeletalmuscle during exercise. Am J Physiol Endocrinol Metab 288,E133–E142.
Roepstorff C, Steffensen CH, Madsen M, Stallknecht B,Kanstrup IL, Richter EA & Kiens B (2002). Genderdifferences in substrate utilization during submaximalexercise in endurance-trained subjects. Am J PhysiolEndocrinol Metab 282, E435–E447.
Romijn JA, Coyle EF, Sidossis LS, Gastadelli A, Horowitz JF,Endert E & Wolfe RR (1993). Regulation of endogenous fatand carbohydrate metabolism in relation to exercise intensityand duration. Am J Physiol Endocrinol Metab 265,E380–E391.
C© 2007 The Authors. Journal compilation C© 2007 The Physiological Society

1258 J. W. Helge and others J Physiol 581.3
Romijn JA, Coyle EF, Sidossis LS, Zhang XJ & Wolfe RR (1995).Relationship between fatty acid delivery and fatty acidoxidation during strenuos exercise. J Appl Physiol 79,1939–1945.
Saltin B (1988). Capacity of blood flow delivery to exercisingskeletal muscle in humans. Am J Cardiol 62, 30E–35E.
Saltin B & Gollnick P (1983). Skeletal muscle adaptability:significance for metabolism and performance. In Handbookof Physiology, section 10, Skeletal Muscle, ed. Peachey LD, pp.555–631. American Physiological Society, Bethesda, MD,USA.
Saltin B & Karlsson J (1971). Muscle glycogen utilization duringwork at different intensities. Adv Exp Med Biol 11, 289–299.
Siggaard-Andersen O, Wimberley PD & Fogh-Andersen N(1988). Measured and derived quantities with mdern pH andblood gas equipment: calculation algorithms with 54equations. Scand J Clin Lab Invest 48, 7–15.
Stallknecht B, Kiens B, Helge JW, Richter EA & Galbo H(2004). Interstitial glycerol concentrations in human skeletalmuscle and adipose tissue during graded exercise. ActaPhysiol Scand 180, 367–377.
Starritt EC, Howlett RA, Heigenhauser GJ & Spriet LL (2000).Sensitivity of CPT I to malonyl-CoA in trained anduntrained human skeletal muscle. Am J Physiol EndocrinolMetab 278, E462–E468.
Steele R (1959). Influences of glucose loading and of injectedinsulin on hepatic glucose output. Ann N Y Acad Sci 82,420–432.
van Hall G, Bulow J, Sacchetti M, AlMulla N, Lyngso D &Simonsen L (2002a). Regional fat metabolism in humansplanchnic and adipose tissues; the effect of exercise. J Physiol543, 1033–1046.
van Hall G, Sacchetti M & Radegran G (2002b). Whole bodyand leg acetate kinetics at rest, during exercise and recoveryin humans. J Physiol 542, 263–272.
van Hall G, Sacchetti M, Radegran G & Saltin B (2002c).Human skeletal muscle fatty acid and glycerol metabolismduring rest, exercise and recovery. J Physiol 543,1047–1058.
van Loon LJC, Greenhaff PL, Constantin-Teodosiu D, SarisWHM & Wagenmakers AJM (2001). The effects ofincreasing exercise intensity on muscle fuel utilisation inhumans. J Physiol 536, 295–304.
Van Loon LJ, Koopman R, Schrauwen P, Stegen J &Wagenmakers AJ (2003). The use of the [1,2-13C]acetaterecovery factor in metabolic research. Eur J Appl Physiol 89,377–383.
Wahren J (1970). Human forearm muscle metabolism duringexercise. IV. Glucose uptake at different work intensities.Scand J Clin Lab Invest 25, 129–135.
Wieland O (1974). Glycerol assay. In Methods of EnzymaticAnalysis, ed. Bergmeyer HV, pp. 1404–1406. Academic Press,New York.
Wolfe RR. Radioactive and Stable Isotope Tracers in Biomedicine(1992). Wiley-Liss, New York.
Acknowledgements
The skilled technical assistance of Irene Beck Nielsen, Betina
Bolmgren, Winnie Taagerup, Heidi Storgaard, Birgitte Jessen
and Nina Pluszek is acknowledged. The study was supported
by grants from the Danish National Research Foundation grant
no. 504-14, the Danish Sports Research Council (J.nr. 981001-19
and 980501-20), the Copenhagen Muscle Research Centre, the
Danish Medical and Natural Science Research Council and
an integrated project (LSHM-CT-2004-005272) funded by the
European Commission.
C© 2007 The Authors. Journal compilation C© 2007 The Physiological Society
Related Documents