i An Examination of the Social and Community Context of Substance Use Disorder Recovery Support Services in Rutherford County, Tennessee by Sarah Tomlinson Murfree A Dissertation Submitted in Partial Fulfillment of the Requirements for the Degree of Doctor of Philosophy in Human Performance with a Specialization in Health Middle Tennessee State University May 2021 Dissertation Committee: Dr. Bethany A. E. Wrye, Chair Dr. Angela Bowman Dr. DeAnne Priddis

Welcome message from author
This document is posted to help you gain knowledge. Please leave a comment to let me know what you think about it! Share it to your friends and learn new things together.
Transcript
i
An Examination of the Social and Community Context of Substance Use
Disorder Recovery Support Services in Rutherford County, Tennessee
by
Sarah Tomlinson Murfree
A Dissertation Submitted in Partial Fulfillment of the Requirements for the Degree
of Doctor of Philosophy in Human Performance with a Specialization in Health
Middle Tennessee State University
May 2021
Dissertation Committee:
Dr. Bethany A. E. Wrye, Chair
Dr. Angela Bowman
Dr. DeAnne Priddis
ii
ACKNOWLEGEMENTS
I would like to thank my dissertation committee, Dr. Bethany Wrye, Dr.
Angie Bowman, and Dr. Dee Priddis for their guidance during this project. Their
feedback and input were critical to development of this final product.
This project would not be possible without the knowledge gained from all
professors I worked with throughout my graduate programs at MTSU. The
knowledge of substance misuse prevention, treatment, and recovery from Dr.
Doug Winborn was an inspiration for this project. The knowledge I gained about
the importance of program evaluation from Dr. Norman Weatherby provided the
foundation for this project.
The most important acknowledgement goes to those struggling with
substance use disorder and their families. My hope is that this project contributes
to reducing the stigma surrounding substance use disorder and increasing the
services needed to sustain recovery.
iii
ABSTRACT
Substance use disorder causes significant morbidity and mortality in the
United States. An estimated 20.1 million persons age 12 or older had a diagnosis
of substance use disorder in 2016. Approximately 95,000 lives are lost due to
alcohol-related causes yearly. A public health emergency was declared in 2017
due to increasing opioid overdoses. In 2018 in Rutherford County, Tennessee,
overdoses resulted in 89 deaths or 27.6 per 100,000 persons.
Many barriers prevent access to treatment services resulting in less than
20% of adults with substance use disorder receiving treatment. Recovery support
services are needed to build recovery capital to promote and sustain recovery.
Mutual aid and 12-step programs are peer recovery support services available at
no cost to participants. Faith-based organizations often provide meeting space
for these groups. The purpose of this project is to examine these services
including the capacity of a recovery congregation program and program
accessibility by population demographics.
Enhancing interorganizational network capacity to increase the transfer of
resources is a strategy to improve social programs. For a certified recovery
congregation program, community capacity is necessary to achieve the
certification best practices including providing visible outreach, disseminating
recovery information, and hosting or referring individuals to recovery support
groups. A social network analysis including 12 community partners examined the
capacity of a recovery congregation program. Sociograms provided visual
iv
diagrams of the network’s collaboration frequency and collaboration level. Areas
for capacity building were identified including unreciprocated relationships.
Increasing capacity by leveraging collaborating cliques and dyads was one of the
strategies identified to increase the density of the network. A one-year follow-up
is needed to examine change in capacity over time.
A spatial study utilizing geographic information system (GIS) mapping and
logistic regression examined accessibility of mutual aid groups by census tract
population demographics. In Rutherford County, an uneven distribution was
identified with services located in census tracts of smaller square mileage with
higher population density. GIS maps provided a visual of location of the services
with overlays of poverty level and population density. More research is needed to
better understand the accessibility of these important peer recovery support
services.
v
Table of Contents
ACKNOWLEGEMENTS ........................................................................................ii
ABSTRACT .......................................................................................................... iii
List of Figures ...................................................................................................... vii
List of Tables ...................................................................................................... viii
CHAPTER I: A Social Network Analysis of a Recovery Congregation Program ... 1
Background ....................................................................................................... 1
Substance Use Disorder ................................................................................ 1
Treatment and Recovery ................................................................................ 4
Recovery Support Services ............................................................................ 5
Faith-Based Organizations ............................................................................. 8
Theoretical Framework .................................................................................... 14
Methods .......................................................................................................... 16
Results ............................................................................................................ 19
Discussion ....................................................................................................... 37
REFERENCES ................................................................................................ 40
CHAPTER II: A Spatial Study of Recovery Support Service Location Accessibility
and Socioeconomic Characteristics in Rutherford County, Tennessee .............. 49
Background ..................................................................................................... 49
Substance Use Disorder .............................................................................. 49
vi
Recovery Support Services .......................................................................... 51
Place-Based Framework .............................................................................. 53
Theoretical Framework .................................................................................... 57
Methods .......................................................................................................... 57
Descriptive Spatial Study ............................................................................. 58
Logistic Regression Analysis ....................................................................... 58
Results ............................................................................................................ 61
Geographic Information Systems (GIS) Maps .............................................. 61
Logistic Regression Analysis ....................................................................... 67
Discussion ....................................................................................................... 74
REFERENCES ................................................................................................ 80
APPENDICES .................................................................................................... 87
APPENDIX A ...................................................................................................... 88
APPENDIX B ...................................................................................................... 89
APPENDIX C ...................................................................................................... 91
APPENDIX D .................................................................................................... 103
APPENDIX E .................................................................................................... 104
vii
List of Figures
Figure 1. The Continuum of Care Model developed by the Substance Abuse and
Mental Health Services Administration (SAMHSA) ............................................... 4
Figure 2. Four Dimensions of Recovery ............................................................... 6
Figure 3. Recovery Congregation Network Frequency ....................................... 30
Figure 4. Recovery Congregation Network Collaboration Level ......................... 31
Figure 5. ArcGIS Map of Recovery Support Services ......................................... 63
Figure 6. ArcGIS Map of Recovery Support Services with 0.5 Mile Boundaries . 64
Figure 7. ArcGIS Map of Recovery Support Services and Poverty Rates .......... 65
Figure 8. ArcGIS Map of Recovery Support Services and Population Density ... 66
viii
List of Tables
Table 1. Recovery Congregation collaboration frequency and level network ….24
Table 2. Recovery Congregation frequency of collaboration, density, and degree
centrality ............................................................................................................. 28
Table 3. Results of question “What is your organization’s most important
contribution to the recovery congregation program?” ......................................... 33
Table 4. Results of the question “Outcomes of the recovery congregation include
or could potentially include (choose all that apply).”…. ....................................... 34
Table 5. Results of the question “What aspects of the collaboration contribute to
the desired outcomes of the recovery congregation program (choose all that
apply)?” ……..……………………………………….…………………………………35
Table 6. Results of the question “What benefits have occurred or could occur
from cooperating or collaborating with other organizations on initiatives related to
substance use disorder recovery support services (choose all that apply)?........36
Table 7. Results of the question “What drawbacks have occurred or could occur
from cooperating or collaborating with other organizations on initiatives related to
substance use disorder recovery support services (Choose all that apply)?.......37
Table 8. Rutherford County, TN Population Demographic Characteristics ......... 67
Table 9. Rutherford County, TN Population Demographic Characteristics of
Census Tracts by Recovery Support Service ..................................................... 68
Table 10. Logistic Regression with Continuous Independent Variables
Classification Table ............................................................................................ 69
ix
Table 11. Logistic Regression with Continuous Independent Variables Results
(n= 49) ................................................................................................................ 70
Table 12. Re-coded Independent Variables ....................................................... 71
Table 13. Logistic Regression Classification Table with Categorical Independent
Variables ............................................................................................................ 72
Table 14. Logistic Regression with Categorical Independent Variables Results
(n = 49) ............................................................................................................... 73
1
1
CHAPTER I: A Social Network Analysis of a Recovery Congregation
Program
Background
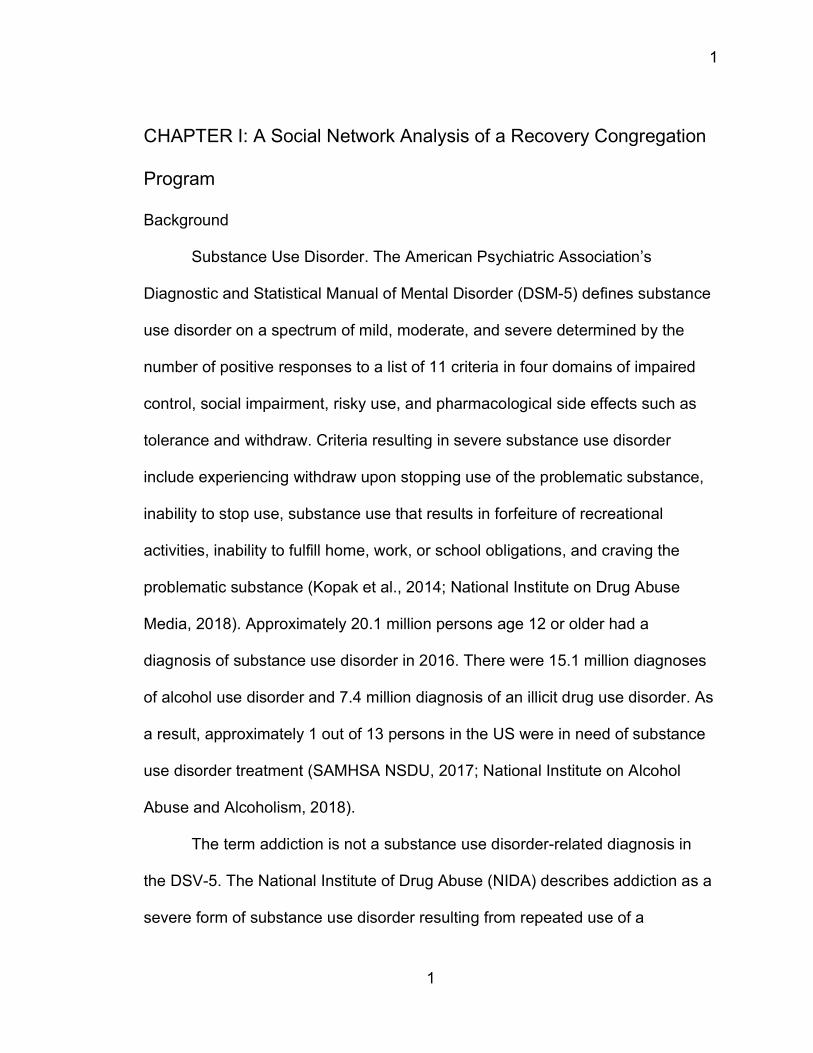
Substance Use Disorder. The American Psychiatric Association’s
Diagnostic and Statistical Manual of Mental Disorder (DSM-5) defines substance
use disorder on a spectrum of mild, moderate, and severe determined by the
number of positive responses to a list of 11 criteria in four domains of impaired
control, social impairment, risky use, and pharmacological side effects such as
tolerance and withdraw. Criteria resulting in severe substance use disorder
include experiencing withdraw upon stopping use of the problematic substance,
inability to stop use, substance use that results in forfeiture of recreational
activities, inability to fulfill home, work, or school obligations, and craving the
problematic substance (Kopak et al., 2014; National Institute on Drug Abuse
Media, 2018). Approximately 20.1 million persons age 12 or older had a
diagnosis of substance use disorder in 2016. There were 15.1 million diagnoses
of alcohol use disorder and 7.4 million diagnosis of an illicit drug use disorder. As
a result, approximately 1 out of 13 persons in the US were in need of substance
use disorder treatment (SAMHSA NSDU, 2017; National Institute on Alcohol
Abuse and Alcoholism, 2018).
The term addiction is not a substance use disorder-related diagnosis in
the DSV-5. The National Institute of Drug Abuse (NIDA) describes addiction as a
severe form of substance use disorder resulting from repeated use of a
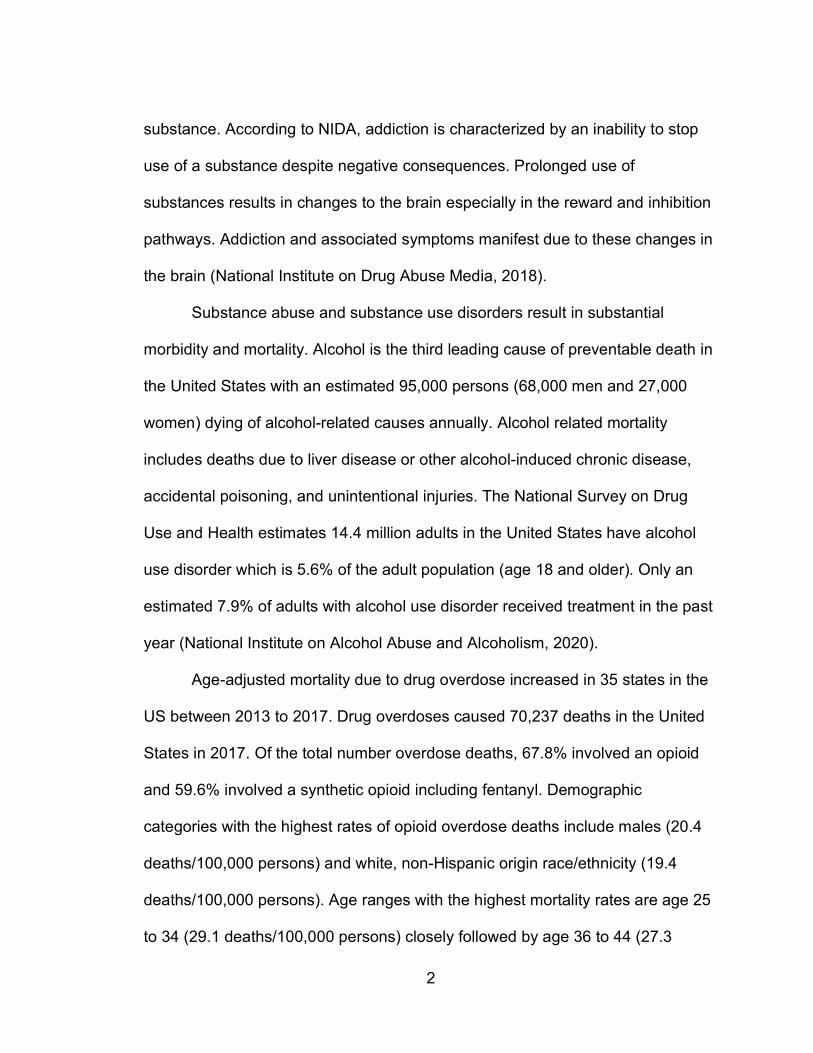
2
substance. According to NIDA, addiction is characterized by an inability to stop
use of a substance despite negative consequences. Prolonged use of
substances results in changes to the brain especially in the reward and inhibition
pathways. Addiction and associated symptoms manifest due to these changes in
the brain (National Institute on Drug Abuse Media, 2018).
Substance abuse and substance use disorders result in substantial
morbidity and mortality. Alcohol is the third leading cause of preventable death in
the United States with an estimated 95,000 persons (68,000 men and 27,000
women) dying of alcohol-related causes annually. Alcohol related mortality
includes deaths due to liver disease or other alcohol-induced chronic disease,
accidental poisoning, and unintentional injuries. The National Survey on Drug
Use and Health estimates 14.4 million adults in the United States have alcohol
use disorder which is 5.6% of the adult population (age 18 and older). Only an
estimated 7.9% of adults with alcohol use disorder received treatment in the past
year (National Institute on Alcohol Abuse and Alcoholism, 2020).
Age-adjusted mortality due to drug overdose increased in 35 states in the
US between 2013 to 2017. Drug overdoses caused 70,237 deaths in the United
States in 2017. Of the total number overdose deaths, 67.8% involved an opioid
and 59.6% involved a synthetic opioid including fentanyl. Demographic
categories with the highest rates of opioid overdose deaths include males (20.4
deaths/100,000 persons) and white, non-Hispanic origin race/ethnicity (19.4
deaths/100,000 persons). Age ranges with the highest mortality rates are age 25
to 34 (29.1 deaths/100,000 persons) closely followed by age 36 to 44 (27.3
3
deaths/100,000 persons) (Scholl et al., 2019). The demographic statistics related
to mortality due to opioid overdose in Tennessee are similar to the national data
with the highest rate in males (25 deaths/100,000 persons) and non-Hispanic
whites. Age ranges with the highest mortality rates are age range 35 to 44 (39
deaths/100,000 persons) and age range 25 to 34 (38 deaths/100,000 persons)
(Tennessee Department of Health, 2020). In 2017, the Department of Health and
Human Services (HHS) declared a public health emergency due to the rapid rise
of misuse of opioids and overdoses caused by opioids (HHS, 2019). A meta-
analysis by Brady et al. (2017), found that strong risk factors for prescription drug
overdose death include a diagnosis of substance use disorder as well as
increased risk with a psychiatric disorder diagnosis. Demographic risk factors for
prescription drug overdose include white race, age group of 35 to 44 years, and
male sex (Brady et al., 2017).
The causes of substance misuse are varied and complex. In addition to
genetic predisposing factors, research is increasingly focused on the role of
adverse childhood experiences (ACEs), trauma, mental health diagnoses, and
other environmental factors in substance use disorder. A seminal study known as
The ACEs Study conducted by the CDC and Kaiser Permanente, found that
persons reporting four or more adverse childhood experiences were 7.4 times
more likely to be an alcoholic, 4.7 times more likely to use illicit drugs, and 10.3
more likely to use injected drugs when compared to persons reporting no
adverse childhood experiences (Felitti et al., 1998). A follow-up study concluded
4
that adverse childhood experiences account for one half to up to two thirds of
problematic drug use (Dube et al., 2003).
Treatment and Recovery. Although the terms treatment and recovery are
often used simultaneously or even interchangeably, treatment and recovery are
not the same. Treatment involves an intervention that may include medication
and behavioral therapy which can be delivered in various settings over time
(NIDA, 2018). Treatment is one path to recovery. Recovery can occur naturally
as well without any clinic intervention (Granfield and Cloud, 2001). The Institute
of Medicine developed the first version of the behavioral health continuum of
care. The model was updated by the Substance Abuse and Mental Health
Services Administration to reflect the spectrum of prevention, treatment, and
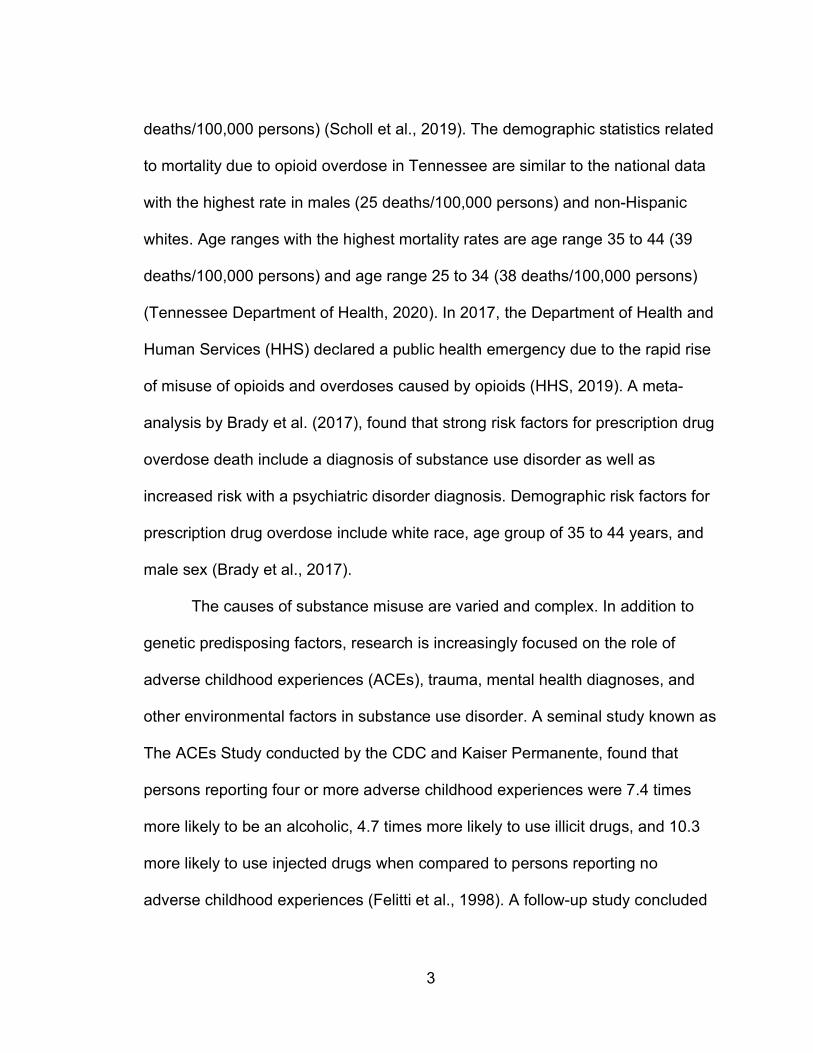
recovery (Figure 1). This is an important model distinguishing prevention,
treatment, and recovery. Treatment and recovery are two separate sections of
the continuum with a goal in recovery as a “reduction in relapse and recurrence.”
Figure 1
The Continuum of Care Model developed by the Substance Abuse and Mental Health Services Administration (SAMHSA)
5
The majority of persons with a substance use disorder never receive
treatment. The Substance Abuse and Mental Health Services Administration
(SAMHSA) estimates in 2016 that 3.8 million individuals age 12 and older
received treatment for substance abuse whereas approximately 21 million
individuals were in need of treatment. Young adults age 18 to 25 are an age
group with the highest rates of substance abuse but also have low treatment
rates. Approximately 5.3 million young adults needed treatment for substance
use but only an estimated 624,000 received treatment (SAMHSA NSDUH, 2017).
Barriers in the healthcare system such as limitations on insurance
coverage, treatment accessibility, and societal factors including stigmatizing
attitudes and beliefs about persons with substance use disorder reduce access
to treatment services (Hazelton Betty Ford, 2019; McLellen, 2017). Kelly et al.
(2016) estimate stigma is the main barrier resulting in only 10% of persons
receiving substance use disorder treatment services. Stigma is related to the
perception of the level of cause and controllability of a health conditions.
Conditions seen as highly controllable and caused by a personal choice are more
highly stigmatized. Persons with substance use disorder are often perceived as
making poor personal choices resulting in addiction (Kelly et al., 2016). The
National Academies of Science states that mental health and substance use
disorder are among the most highly stigmatized disorders in the United States
(National Academies of Science, 2016).
Recovery Support Services. Recovery support services include any
system that helps an individual successfully manage their substance use
6
disorder including supportive relationships and social networks or programs that
reduce barriers to employment, education, or housing.
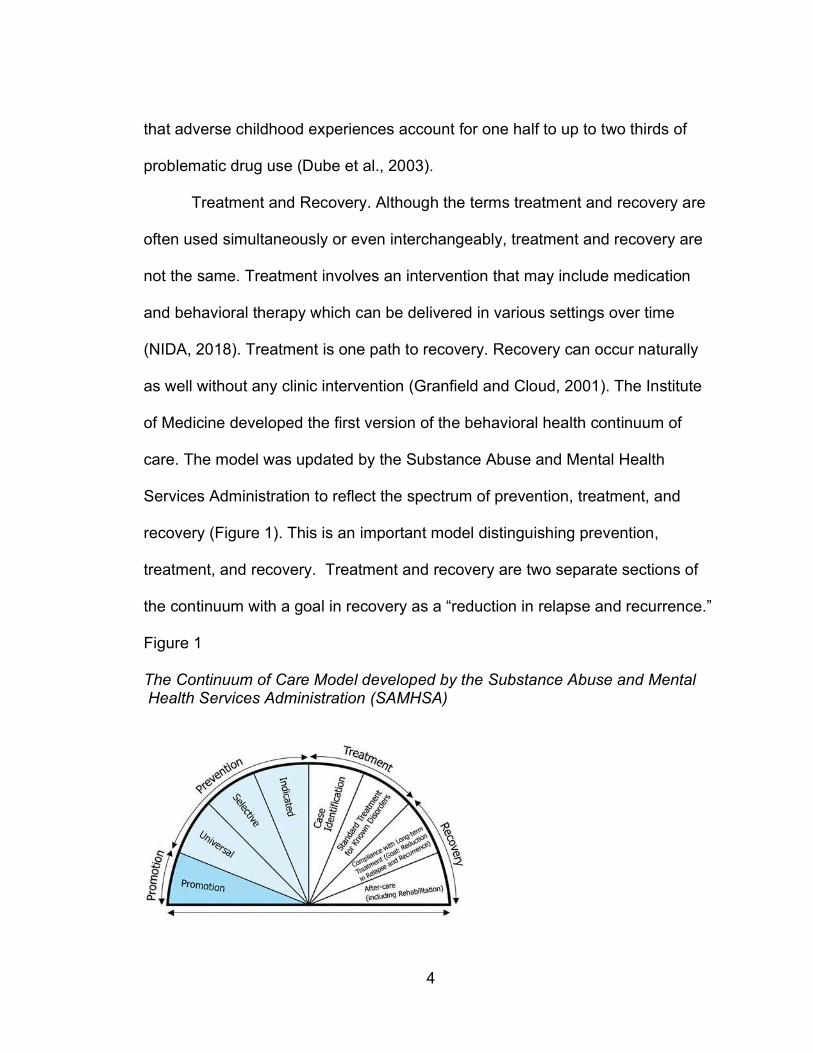
Figure 2
Four Dimensions of Recovery
SAMSHA describes recovery holistically as a “process of change through which
people improve their health and wellness, live self-directed lives, and strive to
reach their full potential.” Health, home, purpose, and community are four
dimensions involved in recovery (Figure 2). The health dimension includes
making choices supporting physical and emotional wellbeing to overcome or
manage a disease or symptoms. Participation in society including the needed
independence, income, resources, and meaningful daily activities is the basis of
the purpose dimension. A safe and stable place to live is needed to achieve the
home dimension. SAMHSA defines the community dimension as “relationships
and social networks that provide support, friendship, love, and hope” (SAMHSA,
2019). An estimated 23.5 million adults in the United States describe themselves
as in recovery from substance use (Laudet, 2013).
7
The National Institute on Drug Abuse estimates that 40-60% of individuals
will relapse following treatment for an addiction to drugs or alcohol. A relapse
does not indicate treatment has failed. As with other chronic diseases such as
hypertension or diabetes, avoiding relapse requires ongoing effort on the part of
the individual with the addiction. Mutual-aid groups and 12-step programs
following treatment are important for reducing relapse rates (NIDA Principles,
2018). Twelve-step programs are spirituality-based, mutual-aid groups and
include Alcoholics Anonymous, Narcotics Anonymous, Cocaine Anonymous, and
many others. These group meetings take place at no cost to participants.
Alcoholics Anonymous was founded in 1939 upon publication of the “Big Book”
text describing the 12 steps followed by participants. Other 12-step programs
followed using the framework created by Alcoholics Anonymous (Kelly, 2016).
The Alcoholics Anonymous’ website describes the 12 steps as “a group of
principles, spiritual in their nature, which, if practices as a way of life, can expel
the obsession to drink and enable the suffer to become happily and usefully
whole” (Alcoholics Anonymous, 2020).
Increasingly often, recovery includes support from peers identifying as
being in recovery from substance use disorder. Involvement of peers in recovery
programs ranges from the more informal sponsor in 12-step programs such as
Alcoholics Anonymous and Narcotics Anonymous to a certified peer recovery
specialist in formal recovery coaching programs (Eddie et al., 2019). Peer
recovery specialists are individuals with lived experience. These individuals are
in recovery from a substance use disorder or a co-occurring mental health
8
diagnosis. Certification is available at the national level by the National
Association for Alcoholism and Drug Abuse or at the state level (National
Association for Alcoholism and Drug Abuse, 2020).
Access to 12-step programs and peer support and meeting needs in the
four dimensions, health, home, purpose, and community (Figure 2) increase
one’s recovery capital. According to Granfield and Cloud (2001) recovery capital
is a total of an individual’s resources that contribute to initiation and maintenance
of cessation of substance misuse. Examples of resources important in recovery
capital are social resources, human capital, cultural capital, and physical capital
(Granfield and Cloud, 2001; Cloud and Granfield, 2008).
Faith-Based Organizations. Despite fewer adults reporting affiliation with a
specific religion, the United States continues to be a highly religious county. The
Pew Research Center’s Religious Landscape Study (2015) found 70.6% of US
adults identified as Christian, and 1.7%, 0.7%, 0.4%, and 0.4% identified as
Jewish, Buddhist, Muslim, and Hindu respectively. Tennessee is more religious
compared to the US average with 81% of Tennesseans identifying as Christian,
and 1%, 1%, 1%, and <1% identifying as Jewish, Buddhist, Muslim, and Hindu
respectively (Pew, 2014). There are approximately 11,500 institutions of faith in
Tennessee (TDMHSAS, n.d.). The strength and numbers of faith institutions is an
opportunity to increase access to recovery support services for individuals with a
history of addiction.
The George W. Bush administration expanded the Charitable Choice
legislation. Charitable Choice clarified faith-based organization’s ability to accept
9
grant funding from federal agencies. Programs related to substance use and
mental health from the Department of Health and Human Services are included
in the funding sources for faith-based organizations allowed by Charitable Choice
(White House, Charitable Choice: The Facts, n.d.). Grim and Grim (2016)
estimate 344,894 congregations spanning all faiths in the United States spent
over $9.2 billion on social programs in 2012. Social programs were defined as
“activities of congregations across multiple faith traditions that provide for civic
life and social cohesion above and beyond providing for the spiritual lives of
congregants” (Grim and Grim, 2016, pg. 9). The primary funding sources for
social programs are individual donations, dues, and contributions estimated at
over $74.5 billion. In comparison, government grants, contracts, and fees for
social services is estimated at only $252 million. Data used in this estimate are
from the National Congregations study and Religious Congregants and
Membership study (Grim and Grim, 2016). As of 2012 despite expansion of
access to government grant funds from the Charitable Choice legislation, the
vast majority of social programs were privately funded by congregations.
In 2018, The White House issued an executive order to further leverage
the capacity of the faith communities in the US to address social problems. This
executive order further extended federal funding opportunities to faith-based
communities which were previously available only to community organizations
(White House, Law and Justice, 2018). Funding allows and arguably incentives
faith-based organizations to serve as recovery capital to support individuals in
recovery from substance use disorder.
10
An extensive study of the role of religion in addiction prevention and
recovery by the Partnership to End Addiction (formerly The National Center on
Addiction and Substance Abuse (CASA) at Columbia University), found religion
and faith-based organizations play important roles. The study found that 94.4%
of clergy surveyed indicated that substance use disorder is an important issue
they confront. Despite the high level of awareness, only 36.5% of clergy discuss
substance use disorder in a sermon more than once per year and 22.4% never
discuss substance use disorder in sermons. One conclusion from the study was
faith-based organizations should host support group meetings and help connect
members of their congregations connect to treatment services (Columbia
University, 2001). Likewise, Former Surgeon General Murthy described the
important role of faith leaders in ending stigma towards mental illness. As leaders
and community messengers, faith leaders can support their congregations with
messages of acceptance and reassurance (Murthy, 2015).
Recovery support in faith communities exists in many forms. Faith-based
organizations can support recovery by providing meeting space for 12-step
programs such as Alcoholics Anonymous, Narcotics Anonymous, and Celebrate
Recovery. Narcotics Anonymous and Alcoholics Anonymous have an element of
spirituality but are not connected to a specific religion. Faith-based organizations
may host other support groups which are affiliated with specific religions such as
the Christian program Celebrate Recovery, Recovery Through Christ, Buddhist
Recovery Network, Jewish Alcoholics, and Millati Islami. Recovery churches aim
to provide a religious environment to support individuals in recovery (White,
11
2019). Grim and Grim (2019) estimate there are 130,000 recovery support
groups based in congregations throughout the United States. Faith-based
communities with recovery support services are an opportunity to increase
recovery capital. Gilbert and Kurz (2018) found that an increased level of
recovery capital defined as social support, participation in 12-step groups,
spirituality, and financial stability increased self-efficacy in sustaining from alcohol
and drug use.
The literature indicates that individuals with higher levels of religiosity are
more likely to be successful in addiction recovery. In a systematic review,
Walton-Moss et al. (2013) found that religiosity or spirituality significantly
increased likelihood of sobriety for individuals with alcoholism. Likewise, strong
evidence indicates that religious or spiritual individuals with substance use
disorder using more than one substance had lower likelihood of relapse (Walton-
Moss et al., 2013). An analysis of participation in 12-step programs following
substance use disorder treatment found that increased levels of spirituality/
religiosity increased likelihood of program participation up to one year post
treatment (Carrico et al., 2007). In a study of individuals with opioid use disorder,
utilization of religious coping skills was related to participation in 12-step
programs (Puffer et al., 2010). Kelly and Moos (2003) examined rates of
dropping out of 12-step programs one year following substance use disorder
treatment in 2,518 male patients. The overall dropout rate at the one year follow
up was 40%. The study found that formal religious background and attendance at
12
religious services was a statistically significant predictor reducing the likelihood of
dropping out of the program (Kelly and Moos, 2003).
Recovery conceptualized as a concept of holistic wellness includes a
component of spirituality. Faith-based organizations and mental health services
both claim to have a goal to enhance emotional wellbeing. There are many
examples of faith-based communities taking concrete steps towards helping their
congregation members find help from mental health and substance use
disorders. As a result, the number of therapist services offering Christian
counseling is increasing (Sullivan et al., 2014). In a study of African American
churches in the Los Angeles, California area, 62% of the churches surveyed
reported directly linking at least one member of their congregation with care for
substance use disorder. Mid-size churches were more likely than small churches
to make these direct linkages to care. Churches with clergy with formal seminary
training were more likely to make these connections (Wong et al., 2018).
In 2014, the Tennessee Department of Mental Health and Substance
Abuse Services (TDMHSAS) began a faith-based initiative with the vision
statement:
The vision of the Faith-Based Initiative is to partner with and leverage
Tennessee’s faith-based communities to increase outreach, build recovery
pathways, and provide an educated, welcoming, and supportive place for
individuals struggling with substance abuse issues so that they may find
help and hope on their pathway to recovery. (TDMHSAS, 2019, pg. 8)
13
The Certified Recovery Congregation program was developed under this
initiative. The TDMHSAS Faith-Based Community Coordinators provide
education for congregations including information about the continuum of care of
substance use disorder, treatment, and recovery (Figure 2) and resources
including access to the TDMHSAS Project Lifeline program to connect persons
with addiction to treatment services. The Faith-Based Community Coordinators
assist the congregation in the implementation of their best practice model.
Currently, TDMHSAS has three Faith-Based Community Coordinators in the
three grand regions of east, middle, and west Tennessee (TDMHSAS, n.d.).
The congregation is awarded the Recovery Congregation Certification
upon implementation of the following best practices model established by
TDMHSAS: provide spiritual/pastoral support, view addition as a treatable
disease, embrace and support people in recovery and walk with them on their
journey, provide a visible outreach in the community, disseminate recovery
information, host or refer individuals to recovery support programs. (TDMHSAS,
2019, pg. 24)
Community Capacity. For all public health programs including programs in
faith-based organizations, a network of community partners is essential for
success (HHS, 2019). Community capacity is a multi-dimensional concept
including resources, readiness, and social and interorganizational networks.
These dimensions are measures of a community’s capacity to address a social
problem (Goodman et al., 1998). The best practices model for the TDMHSAS
Recovery Congregation Certificate requires faith-based organizations to build
14
their capacity including community outreach and developing a referral network
(TDMHSAS, 2019, pg. 24).
Faith-based organizations have a history building capacity and
involvement in community health promotion activities including emergency
response, diabetes prevention, and influenza prevention. A survey of faith-based
organizations including congregations found that 55% of the congregations
indicated that they provide some type of human service program (Clerkin and
Gronbjerg, 2007). Because of the diversity across of faith-based organizations,
including levels of capacity, successful implementation of health and social
programs varies (Tagai et al., 2018). Faith-based organizations need appropriate
levels of capacity to improve implementation of programs and to adequately
support program participants. Specifically, for recovery support services,
community partners provide resources, expertise, and a source of referrals for
faith-based organizations serving individuals with substance-use disorder (HHS,
2019).
Theoretical Framework
Carolan (2014) describes social network analysis as both a method and a
theory. The concepts of social networks originated in sociology. The term
sociometry was first used in the 1930s by sociologist Jacob Moreno. Moreno
identified features of social network analysis that remain useful: a focus on
patterns between and within groups; systematic collection and analysis of data;
use of graphical imagery; and use of mathematical models (Carolan, 2014). Initial
15
work focused on the relationships to individuals. This was expanded to
organizational relationships for capacity building and sharing of resources.
Social network theory relies on four assumptions about the resulting
structure formed by actors and relationships: actors and actions are
interdependent, relational ties create channels for the transfer or flow of
resources, networks related to individual persons view the social network as an
opportunity or as a constraint on individual action, structural network
characteristics reflect enduring patters of relationships between the actors
(Wasserman and Galaskiewicz, 1994). Building community capacity by
enhancing networks to enhance the transfer of resources is a strategy to improve
social programs. This is associated with community organizing techniques to
strengthen social networks to involve community members and organizations to
solve social problems (Heaney and Israel, 2008, pp. 200-203).
Social network analysis is a tool to explore levels and types of
relationships that contribute to community capacity (Proven et al., 2005). Social
networks analysis increases the understanding of the type and strength of
connections between individuals or organizations. Analysis systems, such as
UCINet, allows for a visualization of the network connections. The results of a
social network analysis include a sociometric diagrams, called sociograms, for a
visual presentation of the relationships in the network.
Social network analysis has been used to study a variety of organizations
and their relationship to other community partners. A social network analysis
conducted at two time points of community cancer network found that the
16
network strengthened in trust over time (Luque et al., 2010). A social network
analysis of the strength of partnership in a coalition of academic institutions and
the community working on social determinants of health research found an
increase in the density of the connections in the network over time (Bright et al.,
2017). A study of a university extension program used social network analysis to
analyze the strength of the connections between different extension departments
(Bartholomay et al., 2011).
Methods
Capacity was examined using a social network analysis of for a newly
formed Recovery Congregation program. This cross-sectional study used a
survey tool to collect network information from the faith-based organization and
partnering organizations.
Purpose. The purpose of this study was to examine the frequency and
collaboration level of network connections of an active recovery congregation
program. The recovery congregation program is an initiative from the TDMHSAS
to educate congregations, reduce stigma, and to empower congregations to build
recovery support services by connecting congregations to the behavioral
healthcare system.
Research Question. What is the frequency and collaboration level of the
ties between organizations in the network of a recovery congregation program?
Data was collected via a semi-structured interview with the model program
and surveys of the partnering organizations. The interview included collection of
details about the program (Appendix A) and identification of approximately 10 to
17
15 of the program’s most important community partners. The semi-structured
interview template was informed by the semi-structured interview template
created for the National Academies’ Health and Medicine Division’s 2020 report
“Opportunities to Improve Opioid Use Disorder and Infectious Disease Services:
Integrating Responses to a Dual Epidemic.” The partnering organizations
identified in the interview form the boundary of the network of the recovery
congregation.
A survey of the identified community partners was used to collect the data
to build the social network surrounding the recovery congregation program
(Appendix B). The UCINet software version 6 was utilized for the network
analysis and NetDraw was utilized to create the network sociographs (Borgatti et
al., 2002; Borgatti, 2002).
The UCINet social network analysis organizes networks around nodes
and edges (or ties). The organizations (nodes) in the network are connected
based on variables reflecting aspects such as strength and direction of the
relationships between the nodes (Garson, 2012). In this study, the nodes are the
organizations in the network. The edges are the frequency and level of
collaboration existing between the nodes. This is an ego-centric network
analysis. Each organization in the network is an ‘ego’ and the organizations to
which they are connected are their alters.
Often the relationships between organizations are complex. In this
recovery congregation’s network, data collected will focus on the organizations
interactions specifically related to the goals of the recovery congregation.
18
Multiple-category measures of frequency and collaboration level will be collected
to examine the recovery congregation network and ties between the
organizations that are directly related to the recovery congregation.
The questionnaire to collect network frequency and strength was created
based on an instrument developed by Proven et al. (2005) and an instrument
developed by Wendel et al. (2010). To measure the frequency of the
relationships, data was collected related to the frequency of interactions (daily,
weekly, monthly, etc.), Specifically for the collection of data related to
collaboration level of the interorganizational ties, the levels developed by Frey et
al. (2006) for measuring collaboration between grant partners were utilized. The
Prevention Solutions program from SAMHSA recommends use of this
measurement to categorize collaboration strength as networking, cooperation,
coordination, and full coordination (Prevention Solutions, 2019).
Questionnaire data collected from the nodes was placed in a matrix to be
analyzed by UCINet and to develop a socio-gram. Data was entered in Microsoft
Excel and imported using UCINet’s DL Editor tool to create a matrix. A matrix will
be created for frequency and for collaboration level. The sociogram is the
graphical representation of the network.
The data collected in this study was directed and valued for both the
collaboration frequency and collaboration level. Density of the network was
examined. Density is a measure of the number of ties between the nodes. Dyads
and reciprocal relationships were examined by comparing each organizations’
response to the survey question related to frequency and collaboration level.
19
Organizations that give the same response (i.e., both organizations indicate a
collaboration) have a reciprocal relationship.
Follow-up attempts via phone and email took place to obtain responses
from as many organizations as possible. For organizations that did not respond
to the survey, data related to these organizations was not utilized. For this
analysis, only multiplex data was utilized meaning the collaboration is confirmed
by the organization. These multiplex ties are the most reliable network indicators
(Proven et al., 2005). This was a baseline data collection for this newly formed
recovery congregation program.
Results
Interview data. A semi-structed interview was conducted with the director
of the Recovery Congregation located in Murfreesboro, TN. The interview took
place on January 7, 2021 at 1:10 p.m. to 2:20 p.m.
Interview Summary. History and Description: The program director
described the church and the Recovery Congregation program. The church has
900 to 1000 members and was founded over 50 years ago although the
denomination has changed since the initial founding. The church is currently
Christian, non-denominational. The current pastor has led the church for
approximately eleven years. The pastor is leaving for a new position with an
assistant pastor planned to become the head pastor. The church core values
were discussed including a description of the congregation as multigenerational
and multicultural.
20
The program director described the church as offering many programs
including youth programs and community outreach. Specific community outreach
efforts include offering free health screenings required for youth to participate in
sports, free car oil changes for single mothers, and providing lunch to teachers
and staff each month at a local school.
Program History: The program director described the Recovery
Congregation program and her role in the program. The program director
describes herself as a person in recovery from substance use disorder and is a
Certified Peer Recovery Specialist. The congregation became certified through
the TDMHSAS Recovery Congregation program in approximately March 2019. In
January 2019, a workshop that included a presentation about the TDMHSAS
Recovery Congregation program and other resources related to mental and
behavioral health in Rutherford County took place at the church facility in January
2019. This workshop was a co-hosted event with a non-profit counseling center.
The church obtained the certification following the January 2019 workshop. The
current program director has been leading the program since obtaining the
certification.
The program director described high levels of support for the Recovery
Congregation program within the church and from the church leadership. The
program director stated that the head pastor selected her to lead the program
following the January 2019 workshop. The pastor described the need for the
program including the many requests from congregation and community
21
members related to mental health and substance abuse. The head pastor felt
that he could not adequately address the needs and a structured program to
connect with resources outside the church was needed. The head pastor has
spoken openly about personal mental health struggles with the congregation
members.
Program Description: The Recovery Congregation material developed by
the program director describes the program as follows:
“We strive to end the stigma associated with addiction and mental health
disorders and share healing and hope through Jesus Christ. We believe that
recovery is the first step toward and abundant life that is found in Jesus.”
The Recovery Congregation program host 12-step meetings following the
Recovery Through Christ program. This 12-step program is targeted at
individuals struggling with addiction, depression, anger, pride, low self-esteem,
and/or childhood trauma. An average of 10 individuals attend the weekly
meetings.
The program director described additional programs related to mental
health and substance use disorder. The church hosts the program “Parents of
Prodigals” for parents of teens or young adults struggling with mental health or
substance use disorder. The program director is currently scheduling a Youth
Mental Health First Aid class for a church youth group. The program director
described the need for evidence-based programs for youth including a pastor
with a master level counseling degree leading family and youth programs.
22
Challenges related to the COVID-19 epidemic were discussed. At the start
of 2020, the program director planned to implement a ministry program with
Rutherford County Corrections program. A program to provide meals to a local
non-profit organization providing reentry services for previously incarcerated
women, was planned but not implemented due to COVID-19 restrictions.
Likewise, offering services to schools and youth has been limited in 2020 due to
COVID-19. The program director expressed frustration in limitations caused by
COVID-19 when the need for support services of all types has increased.
Survey data. Sixteen organizations, including the Recovery Congregation
program, were identified to receive the social network survey. Organizations
include four primarily serving persons experiencing homelessness, two
counseling services including a non-profit counseling service offering pastoral
and general counseling and a counseling service focused specifically on post-
abortion mental health, a substance abuse prevention coalition, two thrift clothing
stores including one with a focus on persons in recovery and one Christian-
based store providing professional apparel to women, a publisher of a Christian-
focused, mental health magazine, an organization serving developmentally
delayed youth, two Christian-focused substance use disorder residential recovery
services, an organization for recently incarcerated women, and a service for
under-resourced pregnant women and new mothers.
Survey data related to the frequency of working with the recovery
congregation and the level of collaboration with the recovery congregation was
23
collected. This method was informed by a study conducted by Bright et al. (2017)
to examine the organizational relationships of a coalition formed to increase
research of social determinants of health (Bright et al., 2017).
Of the 15 organizations identified by the recovery congregation program,
12 responded to the survey in addition to the recovery congregation resulting in
an 81.25% response rate. The three organizations that did not respond were the
two thrift stores and one of the treatment facilities. These organizations were
removed from the analysis. Based on the data collected from the 13
organizations that completed the survey, connection to these three organizations
was minimal. Follow up took place for one organization to clarify one missing
response in their survey results. Fully completed surveys were received from the
13 organizations resulting in an analysis including only confirmed, multiplex ties.
Frequency was measured as 0 for never, 1 for once a year or less, 2 for about
once a quarter, 3 for about once a month, 4 every or almost every week, and 5
for every or almost every day. For purposes of inputting the data into UCINet, the
zero to five scale was used.
Collaboration level of the ties of the interorganizational connections was
measured as no relationship, networking described as exchanging information
and/or attending meetings together, cooperation described as jointly planning,
coordinating, or implementing an activity, training, or event or other program
and/or intentional efforts to enhance each other’s capacity for the benefit of the
recovery congregation, coordination described as implementing services together
24
such as sending referrals to or receiving referrals from the recovery congregation
program, and full coordination described as having a written agreement in place
to define the relationship between the organizations. For purposes of entering
this data in UCINet, a zero to four scale was used.
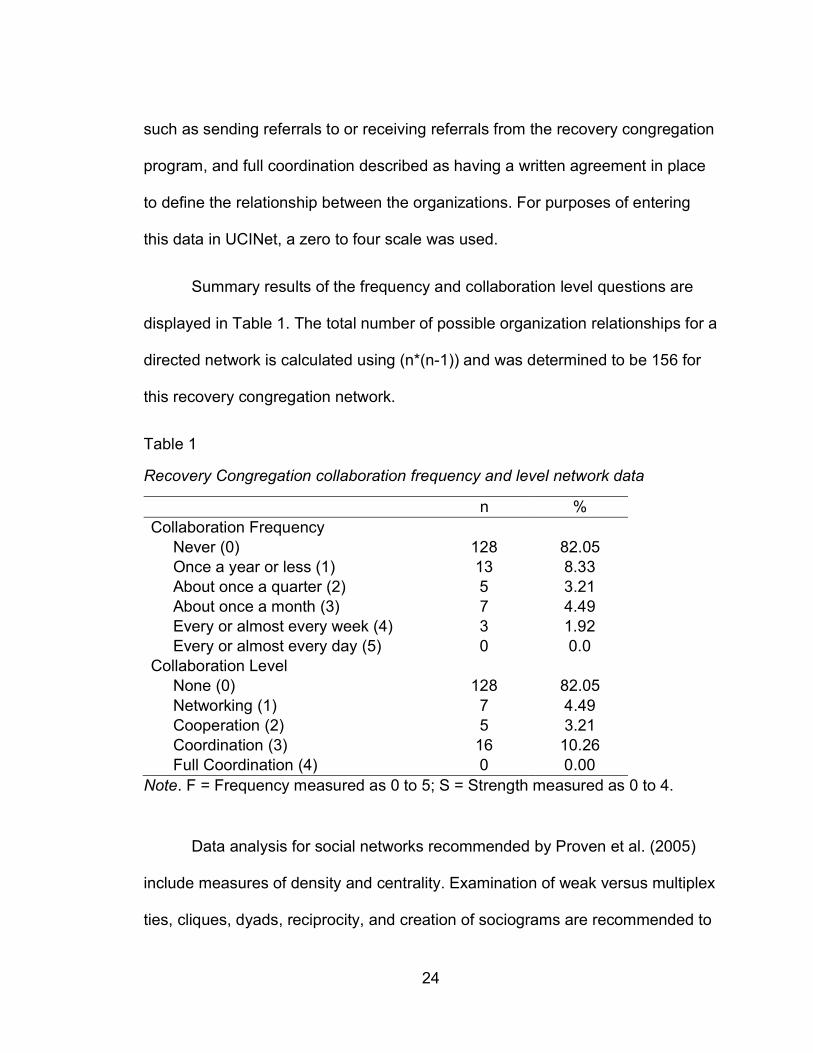
Summary results of the frequency and collaboration level questions are
displayed in Table 1. The total number of possible organization relationships for a
directed network is calculated using (n*(n-1)) and was determined to be 156 for
this recovery congregation network.
Table 1
Recovery Congregation collaboration frequency and level network data
n % Collaboration Frequency Never (0) 128 82.05 Once a year or less (1) 13 8.33 About once a quarter (2) 5 3.21 About once a month (3) 7 4.49 Every or almost every week (4) 3 1.92 Every or almost every day (5) 0 0.0 Collaboration Level None (0) 128 82.05 Networking (1) 7 4.49 Cooperation (2) 5 3.21 Coordination (3) 16 10.26 Full Coordination (4) 0 0.00
Note. F = Frequency measured as 0 to 5; S = Strength measured as 0 to 4.
Data analysis for social networks recommended by Proven et al. (2005)
include measures of density and centrality. Examination of weak versus multiplex
ties, cliques, dyads, reciprocity, and creation of sociograms are recommended to
25
better understand the network. Dyads and reciprocity are related. Dyads are
connections between two nodes and reciprocity are ties confirmed by both
nodes. Dyads are important because a reciprocal relationship between two
organization are building blocks for the network to create more ties (Proven et al.,
2005). There are 18 dyads in this recovery congregation network. In the 18
dyads, eight of the ties are not reciprocal indicating both organizations in the
dyad did not confirm a tie existed regardless of the frequency or collaboration
level of the tie. In the sociograms (Figures 3 and 4), these non-reciprocal
relationships are the unidirectional edges. In ten of the dyads, the tie was
reciprocal meaning both organizations reported a tie. In the sociograms (Figures
3 and 4), these are the bidirectional edges. In a multiplex network of
organizations, non-reciprocal relationships exist for many reasons. It is possible
that the individual completing the survey was simply not aware of the relationship
between the two organizations. Another possibility is when the two organizations
interact, the recovery congregation program director is not making it clear that
the interaction is related to the recovery congregation program. Identifying non-
reciprocal relationships is an opportunity for the program director to strengthen
the partnership by clarifying the purpose of the interaction.
Network density describes the overall connectedness of the network. The
network density provides an opportunity to increase the connectivity in terms of
the frequency of interaction or in the level of the interactions between the
organizations (Proven et al., 2005). Network density is calculated as the
proportion of the node’s ties divided by the total number of ties in the network.
26
The total network density is the average of the density of each node (Borgotti et
al., 2013). The total value of the frequency data in the network is 56 and the total
network density is 0.359. None of the organizations communicated every or
almost every day; therefore, the highest value for a relationship was 4 or every or
almost every week.
The total value of the collaboration level data in the network is 65 and the
total network density is 0.417. None of the organizations achieved the highest
collaboration level of full coordination. The highest value for a relationship was 3
or the coordination level. For both collaboration frequency and level, the average
value is much less than the possible maximum value. This indicates there are
partnerships that could be strengthened by increasing the collaboration
frequency or level of collaboration.
Cliques are fully connected subgroups of three or more nodes. Frequency,
collaboration level, and reciprocity is not considered in the identification of
cliques. Nodes connected by edges of any level can form a clique. When
considering only reciprocal ties, UCINet identified one cliques of three nodes of
the recovery congregation, the substance abuse prevention organization, and the
publisher. When including ties that are not reciprocal, four cliques were identified
including one clique with four connected organizations including the recovery
congregation, mental health counseling facility, substance abuse prevention
organization, and treatment facility. The other three node cliques are the
recovery congregation, substance abuse prevention organization, and publisher;
27
the recovery congregation, substance abuse prevention organization, and
homelessness service; and the recovery congregation, mental health counseling
facility, and homelessness service.
Centrality measures of in-centrality and out-centrality were examined for
this directed, valued network. For the centrality measure, degree refers to the
number and value of edges (or ties) connected to each node. For directed data,
out degree centrality refers to edges initiated by the node. In degree centrality
refers to the edges received by the node. For valued data such as this recovery
congregation network data, the degrees consist of the sums of the edges. The
normalized data is a proportion. To normalize the data, the maximum value must
be calculated. For the frequency data, the highest value reported was 4
indicating a collaboration frequency of every or almost every week. This value
was used as the maximum collaboration level. Assuming the higher numbers
represent stronger ties with 4 being the maximum value, normalization is
calculated as ((n-1)*max) (Borgotti et al., 2013). For this network, the
normalization value is ((13-1)*4) or 48. Likewise for the collaboration level, the
highest reported value was 3 indicating a collaboration level of coordination. For
collaboration level for this network, the normalization value is ((13-1)*3) or 36.
The normalized out degrees and normalized in degrees in Table 2 are
proportions of the maximum value.
28
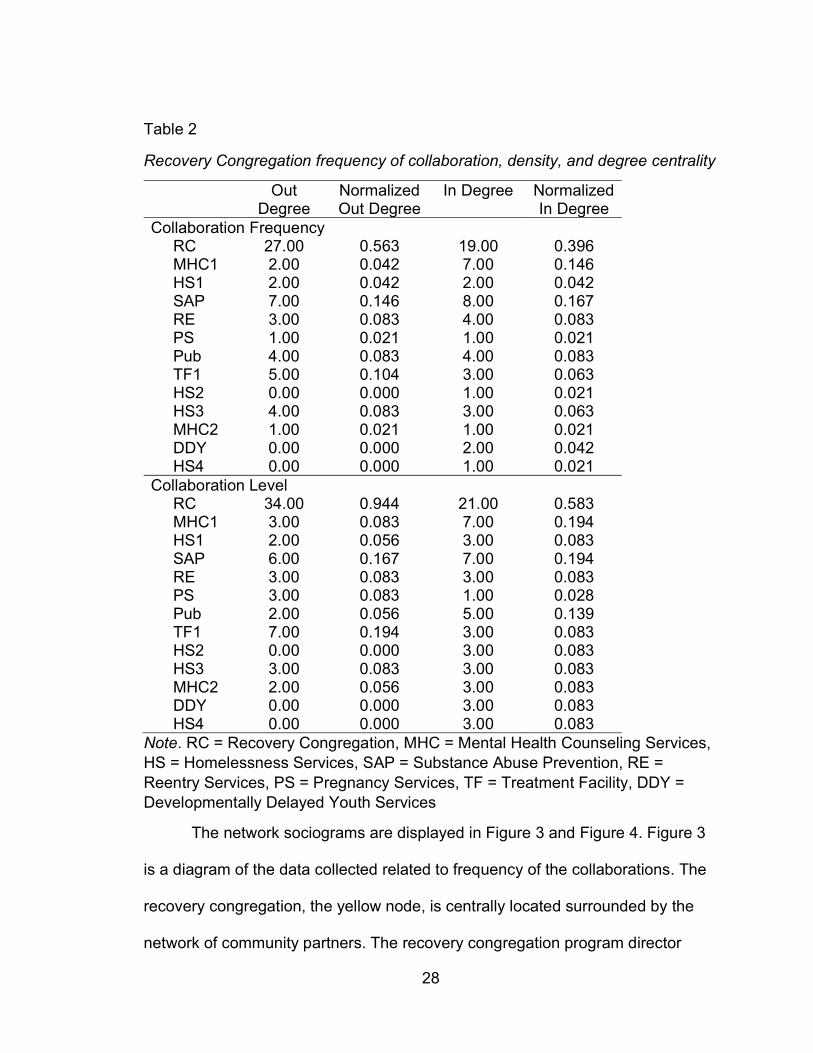
Table 2
Recovery Congregation frequency of collaboration, density, and degree centrality
Out Degree
Normalized Out Degree
In Degree Normalized In Degree
Collaboration Frequency RC 27.00 0.563 19.00 0.396 MHC1 2.00 0.042 7.00 0.146 HS1 2.00 0.042 2.00 0.042 SAP 7.00 0.146 8.00 0.167 RE 3.00 0.083 4.00 0.083 PS 1.00 0.021 1.00 0.021 Pub 4.00 0.083 4.00 0.083 TF1 5.00 0.104 3.00 0.063 HS2 0.00 0.000 1.00 0.021 HS3 4.00 0.083 3.00 0.063 MHC2 1.00 0.021 1.00 0.021 DDY 0.00 0.000 2.00 0.042 HS4 0.00 0.000 1.00 0.021 Collaboration Level RC 34.00 0.944 21.00 0.583 MHC1 3.00 0.083 7.00 0.194 HS1 2.00 0.056 3.00 0.083 SAP 6.00 0.167 7.00 0.194 RE 3.00 0.083 3.00 0.083 PS 3.00 0.083 1.00 0.028 Pub 2.00 0.056 5.00 0.139 TF1 7.00 0.194 3.00 0.083 HS2 0.00 0.000 3.00 0.083 HS3 3.00 0.083 3.00 0.083 MHC2 2.00 0.056 3.00 0.083 DDY 0.00 0.000 3.00 0.083 HS4 0.00 0.000 3.00 0.083
Note. RC = Recovery Congregation, MHC = Mental Health Counseling Services, HS = Homelessness Services, SAP = Substance Abuse Prevention, RE = Reentry Services, PS = Pregnancy Services, TF = Treatment Facility, DDY = Developmentally Delayed Youth Services
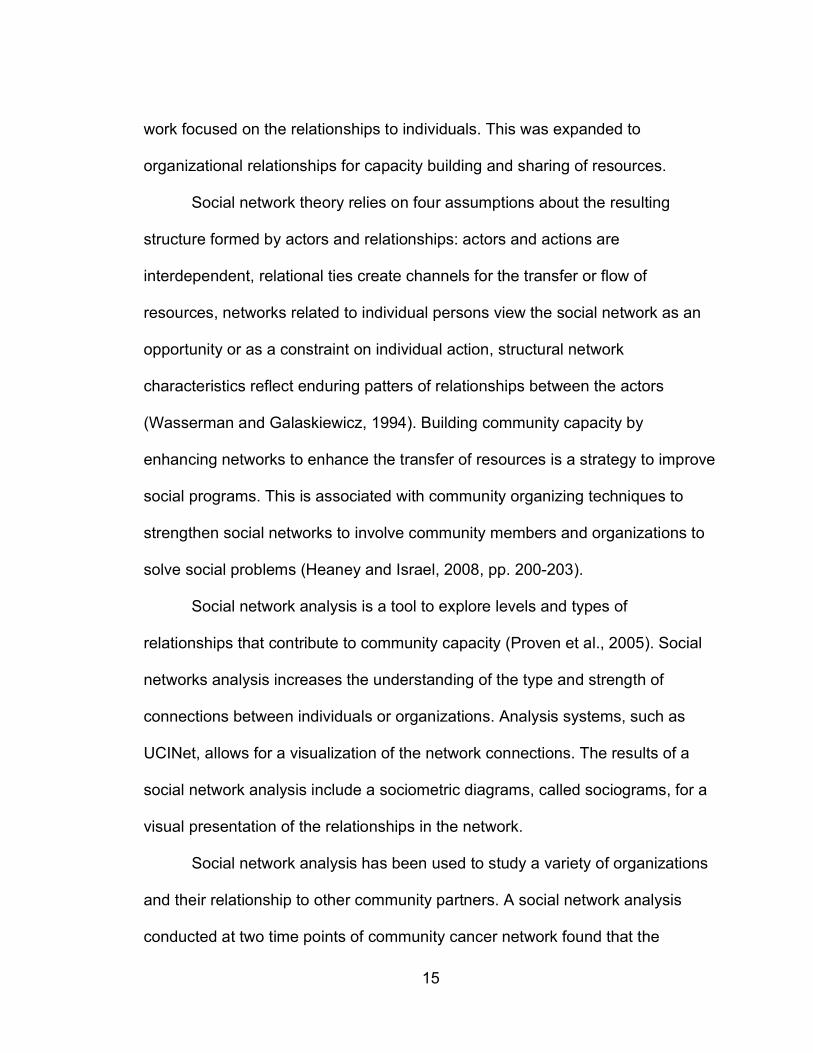
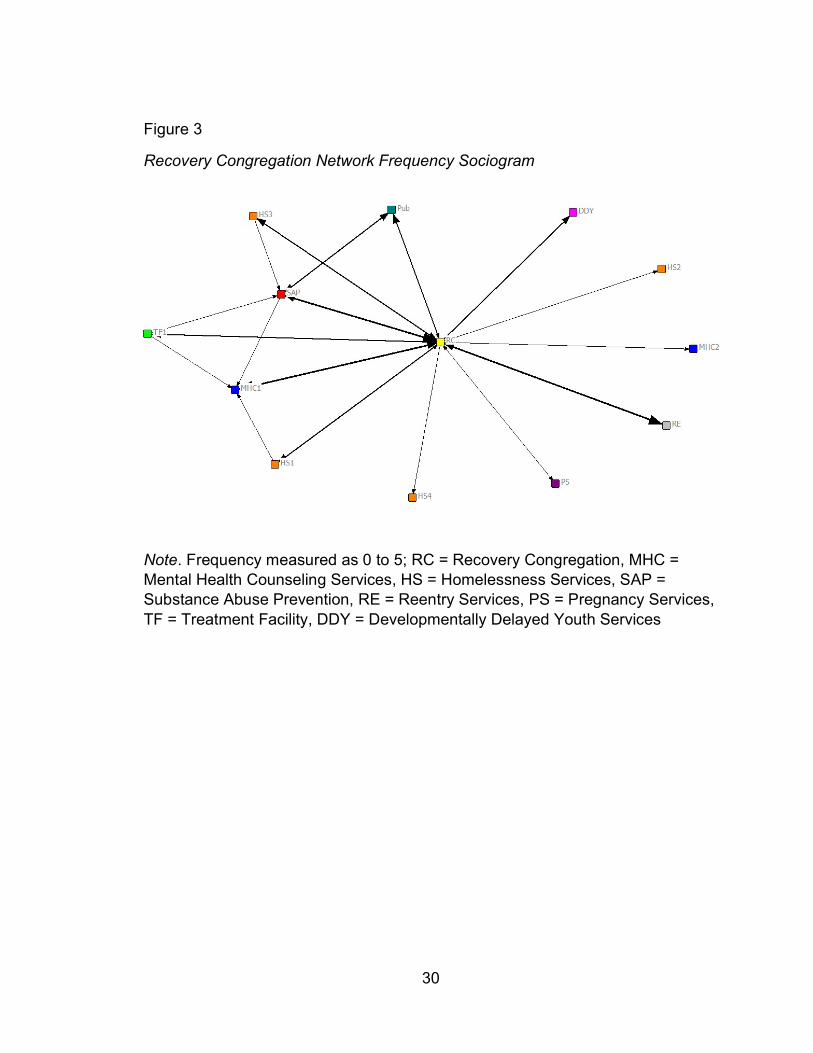
The network sociograms are displayed in Figure 3 and Figure 4. Figure 3
is a diagram of the data collected related to frequency of the collaborations. The
recovery congregation, the yellow node, is centrally located surrounded by the
network of community partners. The recovery congregation program director
29
indicated a frequency of working with each community partner at least once per
year. The nodes represented by the community partners are color-coded by
organization type with the three orange nodes representing homelessness
services and the two blue nodes representing the mental health counseling
services. The other community partners were unique organization types and are
represented by the seven other nodes of various colors.
This directed network is visually represented by the unidirectional or
bidirectional arrows on the edges connecting the nodes. The survey completed
by three organizations, HS2, DDY, and HS4, indicated they did not work with the
recovery congregation. These non-reciprocal relationships are visible in the
sociogram as edges with unidirectional arrows pointing from the recovery
congregation to HS2, DDY, and HS4.
The thicker lines and larger arrows on the edges indicate more frequent
collaboration. Since this is a valued and directed network with every
organizations providing data about all other organizations in the network, the
thickness of the edge is the highest value reported by either of the two nodes
connected by that edge.
30
Figure 3
Recovery Congregation Network Frequency Sociogram
Note. Frequency measured as 0 to 5; RC = Recovery Congregation, MHC = Mental Health Counseling Services, HS = Homelessness Services, SAP = Substance Abuse Prevention, RE = Reentry Services, PS = Pregnancy Services, TF = Treatment Facility, DDY = Developmentally Delayed Youth Services
31
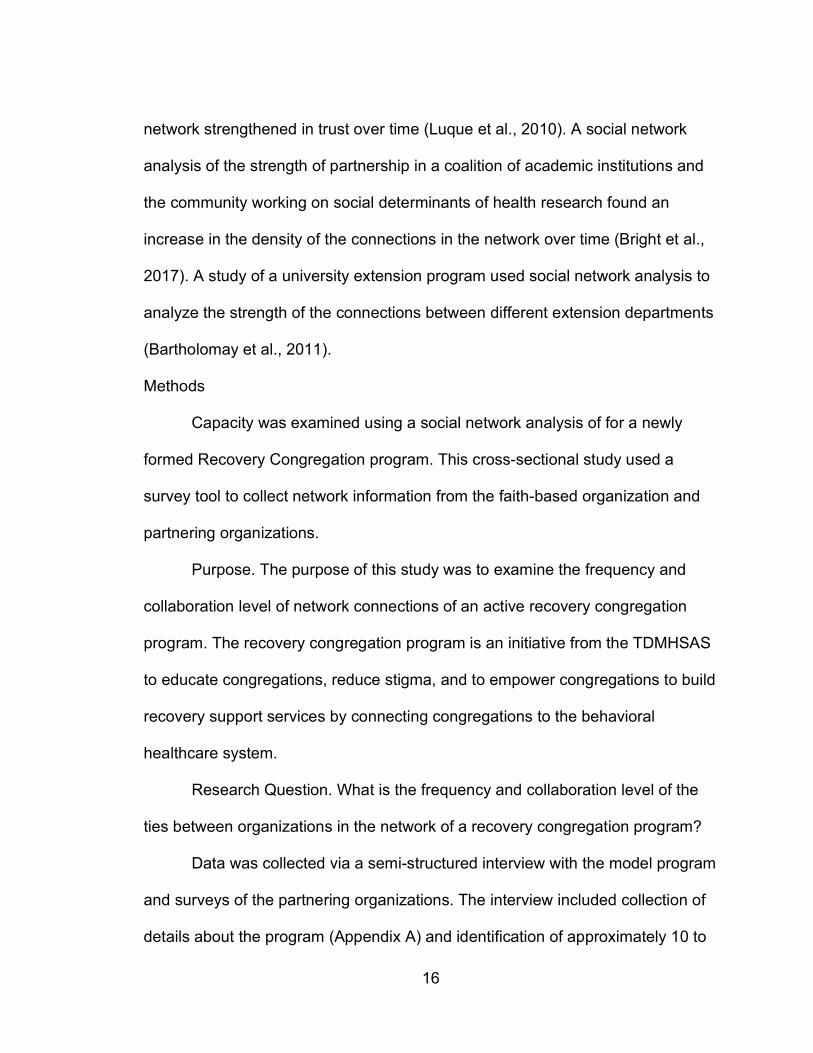
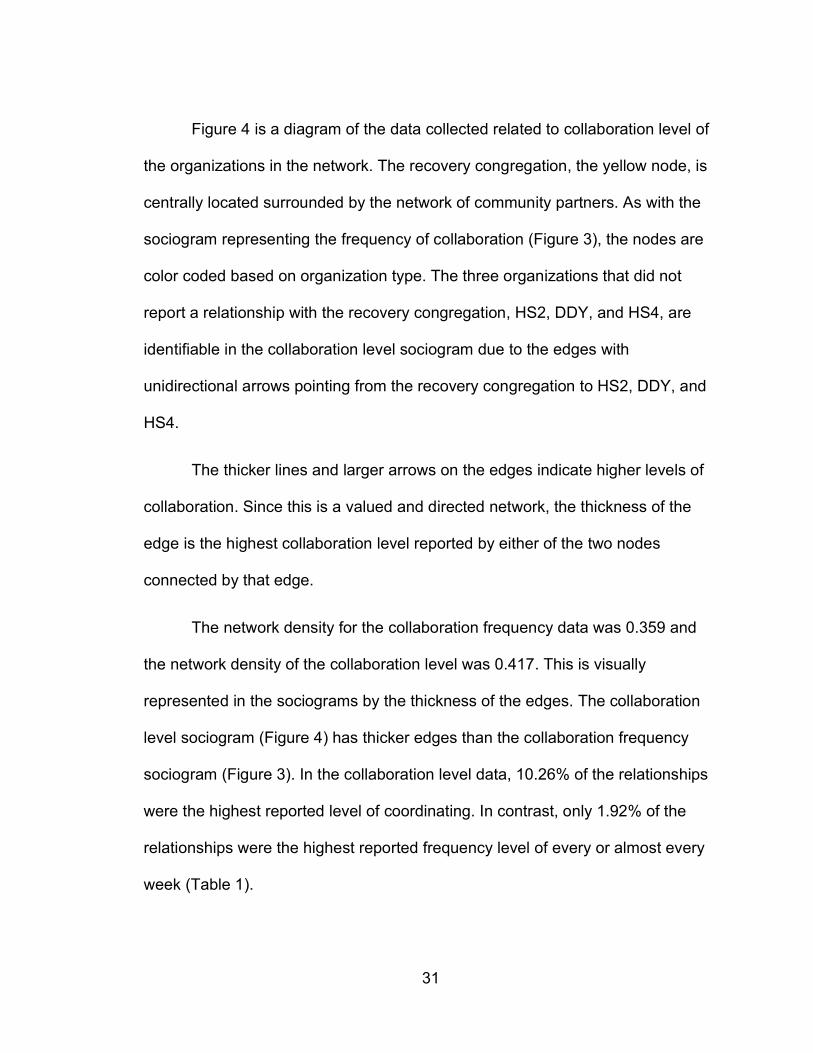
Figure 4 is a diagram of the data collected related to collaboration level of
the organizations in the network. The recovery congregation, the yellow node, is
centrally located surrounded by the network of community partners. As with the
sociogram representing the frequency of collaboration (Figure 3), the nodes are
color coded based on organization type. The three organizations that did not
report a relationship with the recovery congregation, HS2, DDY, and HS4, are
identifiable in the collaboration level sociogram due to the edges with
unidirectional arrows pointing from the recovery congregation to HS2, DDY, and
HS4.
The thicker lines and larger arrows on the edges indicate higher levels of
collaboration. Since this is a valued and directed network, the thickness of the
edge is the highest collaboration level reported by either of the two nodes
connected by that edge.
The network density for the collaboration frequency data was 0.359 and
the network density of the collaboration level was 0.417. This is visually
represented in the sociograms by the thickness of the edges. The collaboration
level sociogram (Figure 4) has thicker edges than the collaboration frequency
sociogram (Figure 3). In the collaboration level data, 10.26% of the relationships
were the highest reported level of coordinating. In contrast, only 1.92% of the
relationships were the highest reported frequency level of every or almost every
week (Table 1).
32
Figure 4 Recovery Congregation Network Collaboration Level Sociogram
Note. Collaboration level measured as 0 to 4; RC = Recovery Congregation, MHC = Mental Health Counseling Services, HS = Homelessness Services, SAP = Substance Abuse Prevention, RE = Reentry Services, PS = Pregnancy Services, TF = Treatment Facility, DDY = Developmentally Delayed Youth Services
33
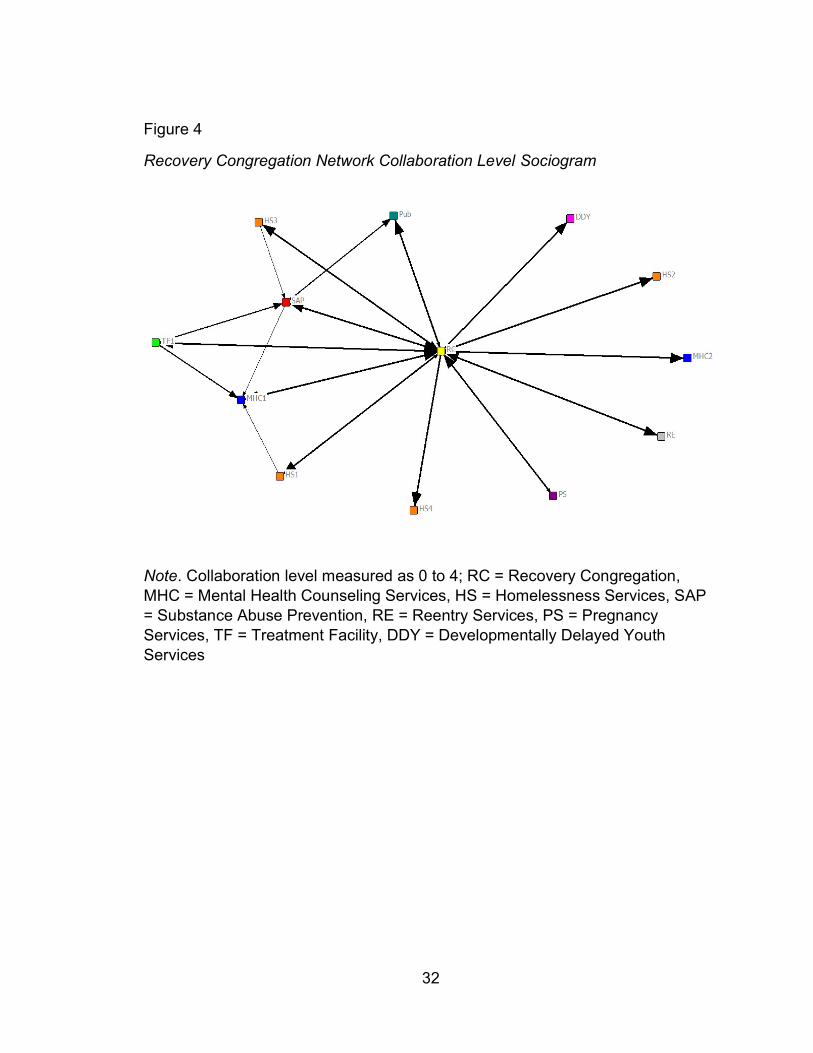
The survey included qualitative questions and open-ended questions to
collect feedback about the organizations’ contributions to the recovery
congregation program, important program outcomes, and partnerships. These
questions were included at the start of the survey and at the conclusion. Results
of information collected is summarized in Tables 3, 4, 5, 6, and 7. Table 3
summarizes questions about the contributions in the network to the recovery
congregation program. The most frequently selected response was community
connections. Two organizations selected ‘other contribution’ and utilized the open
text field to enter a response.
Table 3
Results of question “What is your organization’s most important contribution to the recovery congregation program?”
Possible responses n % Funding/ donations or paid staff 0 0.00 In-kind resources (e.g. – meeting space) 0 0.00 Volunteers or volunteer staff 0 0.00 Specific health expertise 0 0.00 Expertise in an area other than health 1 7.69 Community connections 6 46.15 Send/ receive referrals 3 23.08 Facilitation/ leadership 0 0.00 Advocacy (including raising awareness) 0 0.00 I’m not familiar with the recovery congregation program 1 7.69 Other contribution 2 15.38 Education and connection to serving those with special needs
1 7.69
Offering supportive housing to families and individuals dealing with food insecurity or experiencing homelessness
1 7.69
Note. In the survey, the response “other contribution” included an open text field.
34
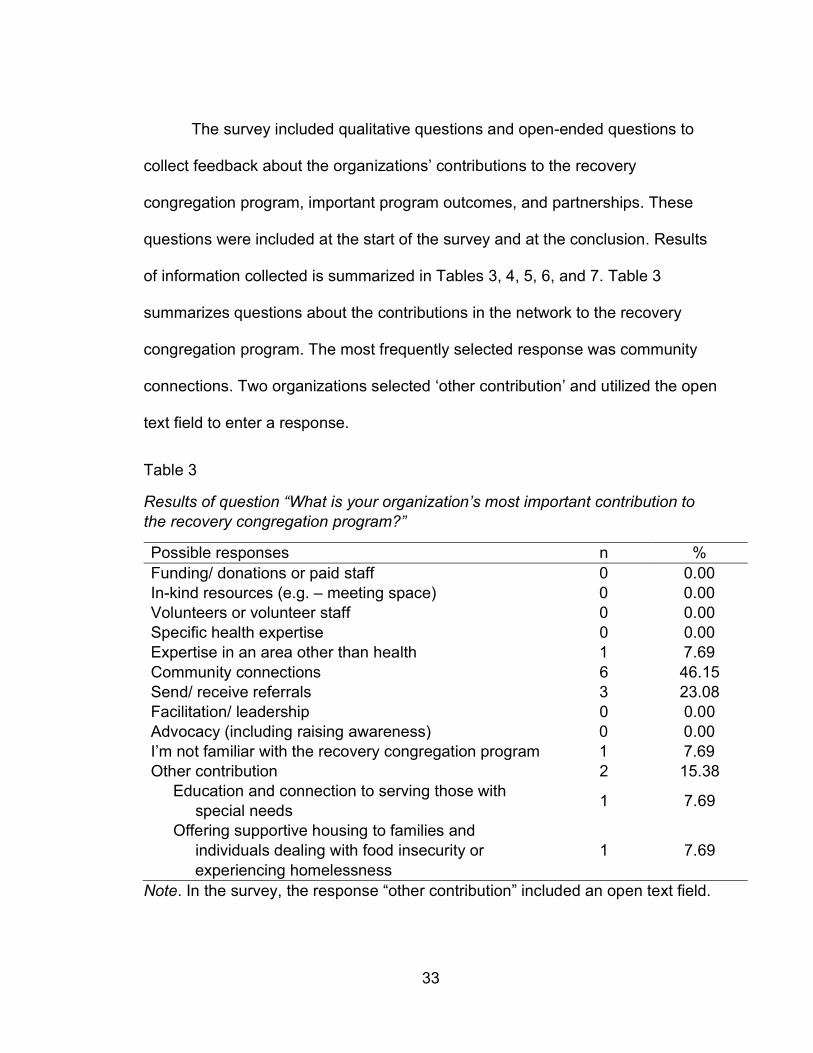
Table 4 summarizes the responses about positive outcomes and possible
outcomes of the recovery congregation program. Organizations were able to
select as multiple responses indicating positive outcomes. Changes to laws,
policies, and/or regulations was the response with the lowest number of
selections. All other responses except indicating unfamiliarity with the program,
were selected at least 8 times.
Table 4
Results of the question “Outcomes of the recovery congregation include or could potentially include (choose all that apply).”
Possible responses n % Improved services for individuals with SUD 8 11.94 Reduction of SUD rates 9 13.43 Improved services for individuals with MHD 9 13.43 Increase in shared knowledge 9 13.43 Increase in community support 10 14.93 Increased public awareness 10 14.93 Changes to policy, laws and/or regulations 1 1.49 Improved health outcomes 8 11.94 I’m not familiar with the recovery congregation program 3 4.48 Other outcome 0 0.00
Note. SUD = Substance use disorder; MHD = Mental health disorder. Percentages are calculated as a proportion of 67, the total number of responses.
Questions related to partnerships and collaborations to benefit the
recovery congregation program are summarized in Tables 5, 6, and 7. Table 7
summarizes the information collected about drawbacks of the collaborations. The
results in Table 5 indicate the creation of informal relationships is the most
important aspect of collaboration. This seems contradictory to the strongest
collaboration level of ‘full coordination’ including having a written agreement in
place to define the interorganizational relationship (Frey et al., 2006).
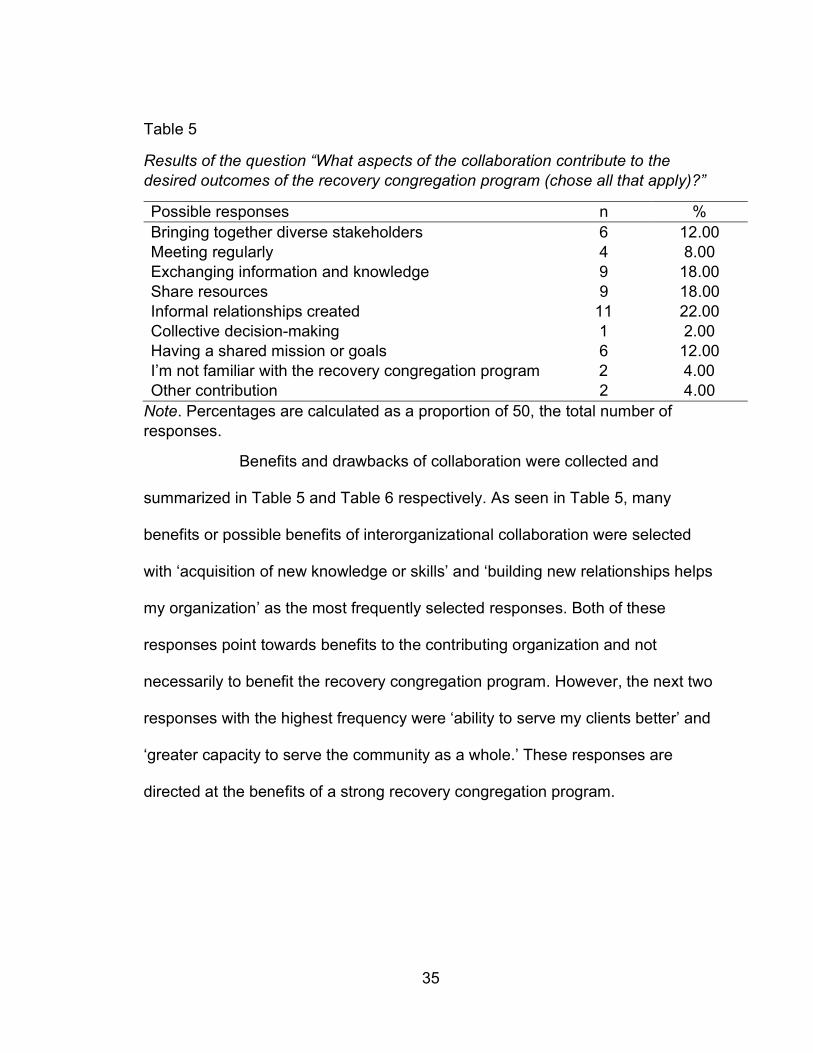
35
Table 5
Results of the question “What aspects of the collaboration contribute to the desired outcomes of the recovery congregation program (chose all that apply)?”
Possible responses n % Bringing together diverse stakeholders 6 12.00 Meeting regularly 4 8.00 Exchanging information and knowledge 9 18.00 Share resources 9 18.00 Informal relationships created 11 22.00 Collective decision-making 1 2.00 Having a shared mission or goals 6 12.00 I’m not familiar with the recovery congregation program 2 4.00 Other contribution 2 4.00
Note. Percentages are calculated as a proportion of 50, the total number of responses.
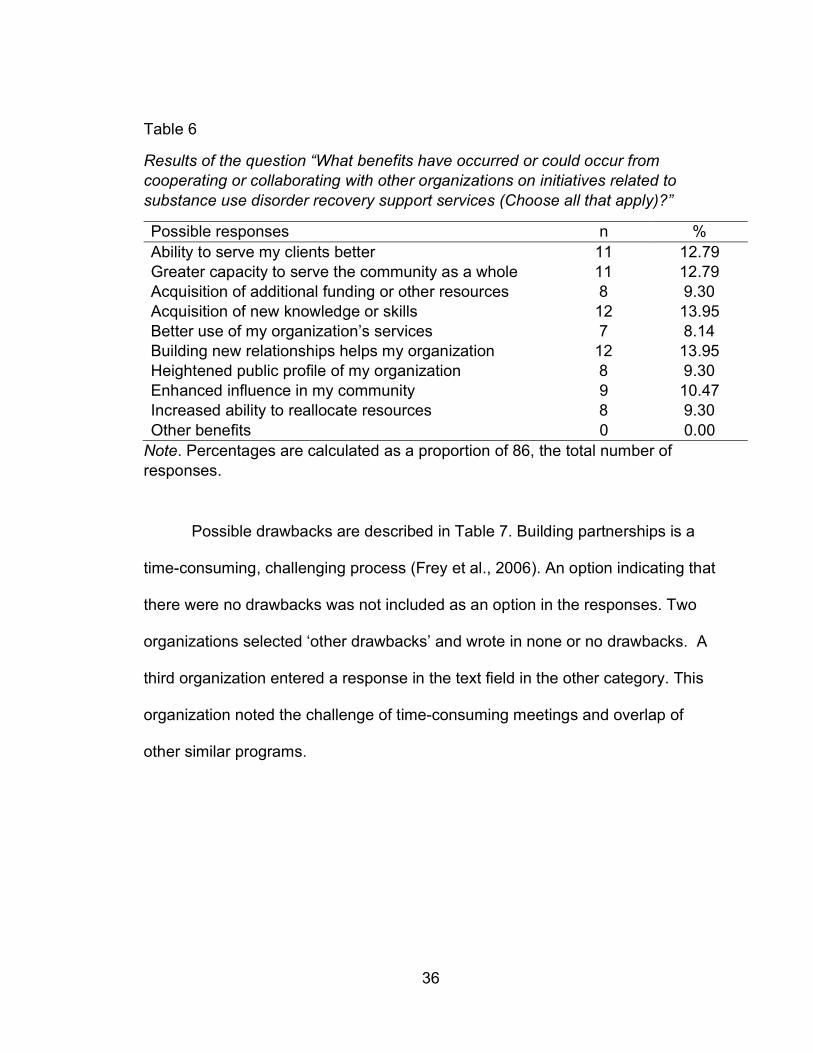
Benefits and drawbacks of collaboration were collected and
summarized in Table 5 and Table 6 respectively. As seen in Table 5, many
benefits or possible benefits of interorganizational collaboration were selected
with ‘acquisition of new knowledge or skills’ and ‘building new relationships helps
my organization’ as the most frequently selected responses. Both of these
responses point towards benefits to the contributing organization and not
necessarily to benefit the recovery congregation program. However, the next two
responses with the highest frequency were ‘ability to serve my clients better’ and
‘greater capacity to serve the community as a whole.’ These responses are
directed at the benefits of a strong recovery congregation program.
36
Table 6
Results of the question “What benefits have occurred or could occur from cooperating or collaborating with other organizations on initiatives related to substance use disorder recovery support services (Choose all that apply)?”
Possible responses n % Ability to serve my clients better 11 12.79 Greater capacity to serve the community as a whole 11 12.79 Acquisition of additional funding or other resources 8 9.30 Acquisition of new knowledge or skills 12 13.95 Better use of my organization’s services 7 8.14 Building new relationships helps my organization 12 13.95 Heightened public profile of my organization 8 9.30 Enhanced influence in my community 9 10.47 Increased ability to reallocate resources 8 9.30 Other benefits 0 0.00
Note. Percentages are calculated as a proportion of 86, the total number of responses.
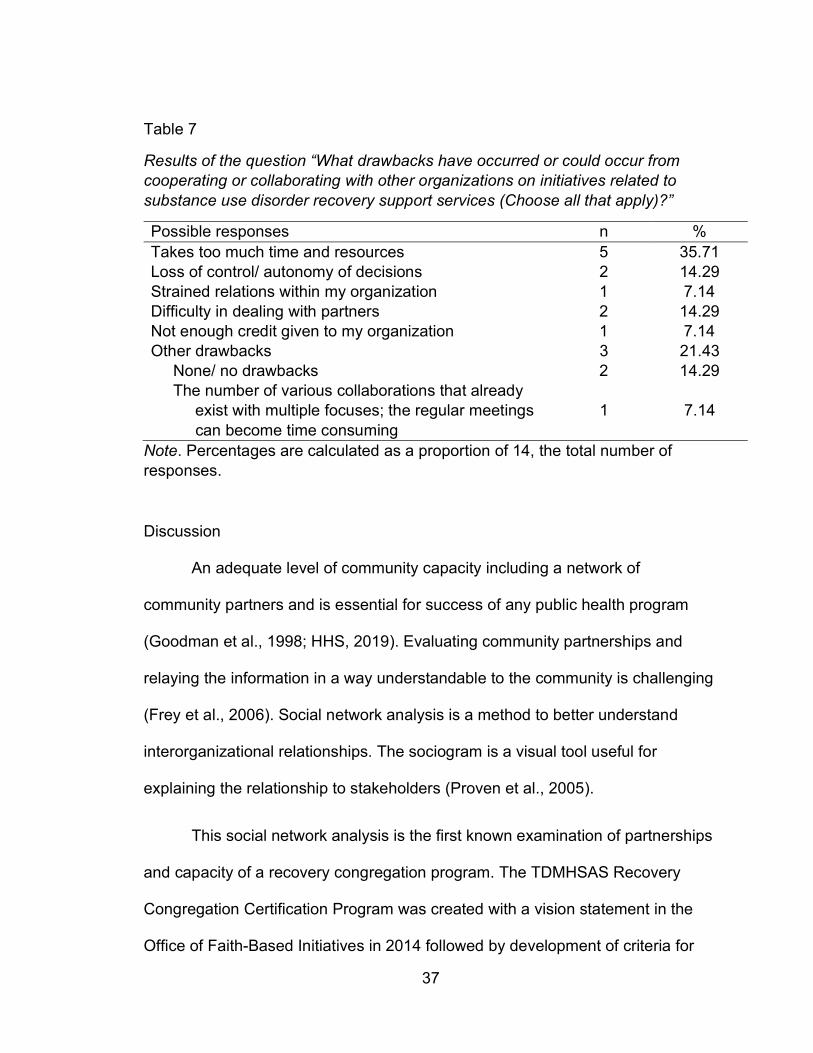
Possible drawbacks are described in Table 7. Building partnerships is a
time-consuming, challenging process (Frey et al., 2006). An option indicating that
there were no drawbacks was not included as an option in the responses. Two
organizations selected ‘other drawbacks’ and wrote in none or no drawbacks. A
third organization entered a response in the text field in the other category. This
organization noted the challenge of time-consuming meetings and overlap of
other similar programs.
37
Table 7
Results of the question “What drawbacks have occurred or could occur from cooperating or collaborating with other organizations on initiatives related to substance use disorder recovery support services (Choose all that apply)?”
Possible responses n % Takes too much time and resources 5 35.71 Loss of control/ autonomy of decisions 2 14.29 Strained relations within my organization 1 7.14 Difficulty in dealing with partners 2 14.29 Not enough credit given to my organization 1 7.14 Other drawbacks 3 21.43 None/ no drawbacks 2 14.29 The number of various collaborations that already exist with multiple focuses; the regular meetings can become time consuming
1 7.14
Note. Percentages are calculated as a proportion of 14, the total number of responses.
Discussion
An adequate level of community capacity including a network of
community partners and is essential for success of any public health program
(Goodman et al., 1998; HHS, 2019). Evaluating community partnerships and
relaying the information in a way understandable to the community is challenging
(Frey et al., 2006). Social network analysis is a method to better understand
interorganizational relationships. The sociogram is a visual tool useful for
explaining the relationship to stakeholders (Proven et al., 2005).
This social network analysis is the first known examination of partnerships
and capacity of a recovery congregation program. The TDMHSAS Recovery
Congregation Certification Program was created with a vision statement in the
Office of Faith-Based Initiatives in 2014 followed by development of criteria for
38
organizations to obtain the certification (TDMHSAS, 2019). The next step
involved recruiting of interested faith-based organizations in obtaining the
certification. The recovery congregation program examined in this analysis was
formed in March 2019. This is a newly formed program based on criteria for
certification established less than six years ago. The recovery congregation
program in this analysis experienced significant challenges expanding programs
in 2020 due to COVID-19 pandemic. This analysis will serve as a baseline for the
recovery congregation. A repeat of this analysis with newly collected data in one
year will allow for an examination of increasing capacity.
To obtain the TDMHSAS Recovery Congregation Program certification,
faith-based organizations must implement the following best practices: provide a
visible outreach in the community, disseminate recovery information, and host or
refer individuals to recovery support groups. Community partnerships are
necessary to achieve these best practices. Likewise, the recovery congregation
in this analysis identified their own program goal of ending stigma associated
with addiction and mental health disorders. The social network analysis provides
a visual and evaluation tool to better understand the community partnership and
interorganizational relationships necessary to achieve these goals.
The outcome of this social network analysis identified several areas of
focus for the program to expand including increasing reciprocal relationships.
Other than directly working with the recovery congregation program, few
community partners indicated they were working with other organizations to
39
benefit the recovery congregation program. This is an area for improvement and
capacity building.
The addiction crisis including the opioid epidemic continues to persist in
Rutherford County and across the US. New solutions are necessary to address
this crisis. The faith-based community is an important stakeholder in this work
especially in a highly religious state such as Tennessee (Pew, 2014). As of June
2018, Tennessee had 682 certified recovery congregation programs (TDMHSAS,
2018). Leveraging these programs could increase the availability and
accessibility of 12-step programs. There are many opportunities for involvement
from the faith community including programs for youth to prevent substance
misuse, outreach opportunities to persons with substance use disorder or a
mental health disorder, and to reduce the stigma associated with addiction.
Study limitations. This is a study of one of the 682 certified recovery
congregations in Tennessee. Conclusions from this social network analysis
cannot be generalized to other programs. This study was an examination of
program capacity and community partnerships. Other areas for study include
program outcomes including referrals to mental health or treatment services,
prevention of relapse, and retention or engagement of participants in the
programming offered by the recovery congregation. A follow up study in one year
is needed for an evaluation of program capacity building and achievement of
desired outcomes.
40
REFERENCES
Alcoholics Anonymous. (2020). What is A.A.?
https://www.aa.org/pages/en_US/what-is-aa
Bartholomay, T., Chazdon, S., Marczak, M. S., & Walker, K. C. (2011) Mapping
extension’s networks: Using social network analysis to explore extension’s
outreach. Journal of Extension, 49(6). 1-15.
Borgatti, S. P. (2002) Netdraw Network Visualization. Harvard, MA: Analytic
Technologies.
Borgatti, S. P., Everett, M.G. & Freeman, L.C. (2002). Ucinet 6 for Windows:
Software for Social Network Analysis. Harvard, MA: Analytic Technologies
Brady, J., Giglio, R., Keyes, K., DiMaggio, C., & Li, G. (2017). Risk markers for
fatal and non-fatal prescription drug overdose: A meta-analysis. Injury
Epidemiology, 4(1), 1-24. http://dx.doi.org/10.1186/s40621-017-0118-7
Bright, C. F., Haynes, E. E., Patterson, D., & Pisu, M. (2017). The value of social
network analysis for evaluating academic-community partnerships and
collaborations for social determinants of health research. Ethnicity &
Disease, 27(Suppl 1), 337-346. http://dx.doi.org/10.18865/ed.27.S1.337
Carolan, B. V. (2014). Social network analysis and education: theory, methods &
applications. SAGE.
Carrico, A. W., Gifford, E. V., & Moos, R. H. (2006). Spirituality/religiosity
promotes acceptance-based responding and 12-step involvement. Drug
and Alcohol Dependence, 89. 66-73.
41
Clerkin, R. M. & Grønbjerg, K. A. (2007). The capacities and challenges of faith-
based human service organizations. Public Administration Review, 67(1),
115-126. http://dx.doi.org/10.1111/j.1540-6210.2006.00701.x
Cloud, W., & Granfield, R. (2008). Conceptualizing recovery capital: Expansion of
a theoretical construct. Substance use & Misuse, 43(12-13), 1971-1986.
http://dx.doi.org/10.1080/10826080802289762
Columbia University. (2001). So help me God: Substance abuse, religion and
spirituality: a CASA white paper. New York: National Center on Addiction
and Substance Abuse at Columbia University.
Dube, S. R., Felitti, V. J., Dong, M., Chapman, D. P., Giles, W. H., & Anda, R. F.
(2003). Childhood Abuse, Neglect, and Household dysfunction and the
risk of illicit drug use: The Adverse Childhood Experiences Study.
Pediatrics, 111(3), 564-572.
Eddie, D., Hoffman, L., Vilsaint, C., Abry, A., Bergman, B., Hoeppner, B., . . .
Kelly, J. F. (2019). Lived experience in new models of care for substance
use disorder: A systematic review of peer recovery support services and
recovery coaching. Frontiers in Psychology, 10, 1052.
http://dx.doi.org/10.3389/fpsyg.2019.01052
Felitti, V. J., Anda, R. F., Nordenberg, D., Williamson, D. F., Spitz, A. M.,
Edwards, V., . . . Marks, J. S. (1998). Relationship of childhood abuse and
household dysfunction to many of the leading causes of death in
adults. American Journal of Preventive Medicine, 14(4), 245-258.
http://dx.doi.org/10.1016/S0749-3797(98)00017-8
42
Frey, B. B., Lohmeier, J. H., Lee, S. W., & Tollefson, N. (2006). Measuring
collaboration among grant partners. American Journal of Evaluation,
27(3), 383–392. https://dx.doi.org/10.1177/1098214006290356
Garson, G. D. (2012). Blue book series: Network analysis. Asheboro, NC:
Statistical Publishing Associates.
Gilbert, W. C., & Kurz, B. (2018). Correlates of recovery from substance use
disorders. Journal of Social Work Practice in the Addictions, 18(3), 270-
288. http://dx.doi.org/10.1080/1533256X.2018.1485573
Goodman, R. M., Speers, M. A., McLeroy, K., Fawcett, S., Kegler, M., Parker, E.,
Smith, S. R., Sterling, T. D., & Wallerstein, N. (1998). Identifying and
defining the dimensions of community capacity to provide a basis for
measurement. Health Education & Behavior, 25(3), 258-278.
Granfield, R., & Cloud, W. (2001). Social context and "natural recovery": The role
of social capital in the resolution of drug-associated problems. Substance
use & Misuse, 36(11), 1543-1570. http://dx.doi.org/10.1081/JA-100106963
Grimm, B. J. & Grimm, M. E. (2016). The socio-economic contribution of religion
to American society: An empirical analysis. Interdisciplinary Journal of
Research on Religion, 12, 1-31.
Grimm, B. J. & Grimm, M. E. (2019). Belief, behavior, and belonging: How faith is
indispensable in preventing and recovering from substance abuse. Journal
of Religion and Health, 58, 1713-1750. http://dx.doi.org/10.1007/s10943-
019-00876-w
43
Hazelden Betty Ford Foundation. (2018). Smashing the stigma of addiction.
https://www.hazeldenbettyford.org/recovery-advocacy/stigma-of-addiction
Health and Human Services. (2019). About the epidemic.
https://www.hhs.gov/opioids/about-the-epidemic/index.html
Heaney, C. A. & Israel, B. A. (2008). Social networks and social support. In K.
Glanz, B. K. Rimer, K. Viswanath (Eds.), Health behavior and health
education: Theory, research, and practice (4th ed., pp. 189-210). Jossey-
Bass.
Kelly, J. F. (2016). Is Alcoholics Anonymous religious, spiritual, neither? Findings
from 25 years of mechanisms of behavior change research. Addiction,
112(6), 929-936. http://dx.doi.org/10.1111/add.13590
Kelly, J. F. & Moos, R. (2003). Dropout from 12-step self-help groups:
Prevalence, predictors, and counteracting treatment influences. Journal of
Substance Abuse Treatment, 24. 241-250.
Kopak, A. M., Proctor, S. L., & Hofmann, N. G. (2014). The elimination of abuse
and dependence in DSM-5 substance use disorders: What does this mean
for treatment? Curr Addict Rep, 1. 166-171.
http://dx.doi.org/10.1007/s40429-014-0020-0
Laudet, A. B., Ph.D, & Humphreys, K., Ph.D. (2013). Promoting recovery in an
evolving policy context: What do we know and what do we need to know
about recovery support services? Journal of Substance Abuse
Treatment, 45(1), 126-133. http://dx.doi.org/10.1016/j.jsat.2013.01.009
44
Luque, J., Tyson, D. M., Lee, J., Gwede, C., Vadaparampil, S., Noel-Thomas, S.,
& Meade, C. (2010). Using social network analysis to evaluate community
capacity building of a regional community cancer network. Journal of
Community Psychology, 38(5), 656-668.
http://dx.doi.org/10.1002/jcop.20386
McLellan, A. T. (2017). Substance misuse and substance use disorders: Why do
they matter in healthcare? Transactions of the American Clinical and
Climatological Association, 128, 112-130. Retrieved
from https://www.ncbi.nlm.nih.gov/pubmed/28790493
Murthy, V. H. (2015). A season of hope, A season of action: Addressing mental
health through faith communities. Public Health Reports (Washington,
D.C. : 1974), 130(6), 560-561.
https://www.ncbi.nlm.nih.gov/pubmed/26556924
National Association of Alcoholism and Drug Addiction Counselors. (2020).
National Certified Peer Recovery Support Specialist.
https://www.naadac.org/ncprss
National Academies of Science, Engineering, and Medicine. (2016). Ending
discrimination against people with mental and substance use disorders:
The evidence for stigma change. The National Academies Press.
http://dx.doi.org/10/17226/23442
National Academies of Science, Engineering, and Medicine. (2020).
Opportunities to improve opioid use disorder and infectious disease
45
services: Integrating responses to a dual epidemic. The National
Academies Press. http://dx.doi.org/10.17226/25626
National Institute on Alcohol Abuse and Alcoholism. (2020). Alcohol facts and
statistics. https://www.niaaa.nih.gov/publications/brochures-and-fact-
sheets/alcohol-facts-and-statistics
National Institute on Drug Abuse. (2018). Media guide: How to find what you
need to know about drug use and addiction.
https://www.drugabuse.gov/publications/media-guide/dear-journalist
National Institute on Drug Abuse. (2018). Principles of drug addiction treatment:
A research-based guide (third edition): How effective is drug addiction
treatment? https://www.drugabuse.gov/publications/principles-drug-
addiction-treatment-research-based-guide-third-edition/preface
Pew Research Center. (2014). Religious Landscape Study.
https://www.pewforum.org/religious-landscape-study/
Puffer, E. S., Skalski, L. M., & Meade, C. S. (2012). Changes in religious coping
and relapse to drug use among opioid-dependent patients following
inpatient detoxification. Journal of Religion and Health, 51(4), 1226-1238.
http://dx.doi.org/10.1007/s10943-010-9418-8
Prevention Solutions. (2019). Prevention collaboration in action understanding
the basics: Levels of collaboration. https://preventionsolutions.edc.org/
services/resources/levels-collaboration
46
Proven, K. G. & Milward, H. B. (2001). Do networks really work? A framework for
evaluating public-sector organizational networks. Public Administration
Review, 61(4), 414-423.
Proven, K. G., Veazie, M. A., & Staten, L. K. (2005). The use of network analysis
to strengthen community partnerships. Public Administration Review,
65(5), 603-613.
Scholl, L, Seth, P., Kariisa, M., Wilson, N., & Baldwin, G. (2019). Drug and
opioid-involved overdose deaths – United States, 2013-2019. Morbidity
and Mortality Weekly Report, 67. 1419-1427.
Substance Abuse and Mental Health Services Administration. (2019). Recovery
and recovery support. https://www.samhsa.gov/find-help/recovery
Substance Abuse and Mental Health Services Administration. (2017). Key
substance use and mental health indicators in the United States: Results
from the 2016 National Survey on Drug Use and Health (HHS Publication
No. SMA 17-5044, NSDUH Series H-52). Rockville, MD:
https://www.samhsa.gov/data/
Sullivan, S., Pyne, J. M., Cheney, A. M., Hunt, J., Haynes, T. F., & Sullivan, G.
(2014). The pew versus the couch: Relationship between mental health
and faith communities and lessons learned from a VA/clergy partnership
project. Journal of Religion and Health, 53(4), 1267-1282.
http://dx.doi.org/10.1007/s10943-013-9731-0
Tagai, E. K., Scheirer, M. A., Santos, S. L. Z., Haider, M., Bowie, J., Slade, J., . .
. Holt, C. L. (2018). Assessing capacity of faith-based organizations for
47
health promotion activities. Health Promotion Practice, 19(5), 714-723.
http://dx.doi.org/10.1177/1524839917737510
Tennessee Department of Health Office of Informatics and Analytics. (2020).
Tennessee drug overdose data dashboard.
https://www.tn.gov/health/health-program-areas/pdo/pdo/data-
dashboard.html
Tennessee Department of Mental Health and Substance Abuse Services. (n.d.).
Faith-Based initiatives. https://www.tn.gov/behavioral-health/substance-
abuse-services/faith-based-initiatives.html
Tennessee Department of Mental Health and Substance Abuse Services. (2019).
Tennessee recovery congregation toolkit.
https://www.tn.gov/content/dam/tn/mentalhealth/documents/Faith%20Bas
ed%20Initiative%20toolkit__040119.pdf
Tennessee Department of Mental Health and Substance Abuse Services. (2018)
Fast Facts: Certified Recovery Congregation Locations.
https://www.tn.gov/behavioral-health/research/tdmhsas-fast-facts-test-
3/fast-facts--faith-based-initiatives-recovery-congregations.html
Walton-Moss, B., Ray, E. M., & Woodruff, K. (2013). Relationship of spirituality or
religion to recovery from substance abuse: A systematic review. Journal of
Addictions Nursing, 24(4), 217-226.
http://dx.doi.org/10.1097/JAN.0000000000000001
48
Wasserman, S. & Galaskiewicz, J. (Eds.) (1994). Advances in social network
analysis: Research in the social and behavioral sciences Thousand Oaks,
CA: SAGE Publications, Inc. http://dx.doi.org/10.4135/9781452243528
Wendel, M. L., Prochaska, J. D., Clark, H. R., Sackett, S., & Perkins, K. (2010).
Interorganizational network changes among health organizations in the
Brazos Valley, Texas. Journal of Primary Prevention, 31(1-2), 59-68.
http://dx.doi.org/10/1007/s10935-010-0203-y
White, W. (2019) The recovery revolution: Its critical ingredients.
http://www.williamwhitepapers.com/
White House Faith-Based and Community Initiatives. (n.d.). Charitable Choice:
The facts. https://georgewbush-
whitehouse.archives.gov/government/fbci/guidance/charitable.html
White House Law and Justice (2018, May 3). Executive Order on the
Establishment of a White House Faith and Opportunity Initiative.
https://www.whitehouse.gov/presidential-actions/executive-order-
establishment-white-house-faith-opportunity-initiative/
Wong, E. C., Derose, K. P., Litt, P., & Miles, J. N. V. (2018). Sources of care for
alcohol and other drug problems: The role of the African American church.
Journal of Religion and Health, 57, 1200-1210.
http://dx.doi.org/10.1007/s10943-017-0412-2
49
CHAPTER II: A Spatial Study of Recovery Support Service Location
Accessibility and Socioeconomic Characteristics in Rutherford
County, Tennessee
Background
Substance Use Disorder. Approximately 20.1 million persons age 12 or
older in the United States had a diagnosis of substance use disorder in 2016.
There were 15.1 million diagnoses of alcohol use disorder and 7.4 million
diagnosis of an illicit drug use disorder. (SAMHSA NSDU, 2017; National Institute
on Alcohol Abuse and Alcoholism, 2018).
Alcohol use is the third leading cause of preventable death in the United
States with an estimated 95,000 persons (68,000 men and 27,000 women) dying
of alcohol-related causes annually. Alcohol related mortality includes deaths due
to liver disease or other alcohol-induced chronic disease, accidental poisoning,
and unintentional injuries. The National Survey on Drug Use and Health
estimates 14.4 million adults in the United States have alcohol use disorder
which is 5.6% of the adult population (age 18 and older). Only an estimated 7.9%
of adults with alcohol use disorder received treatment in the past year (National
Institute on Alcohol Abuse and Alcoholism, 2020).
The Department of Health and Human Services (HHS) declared a public
health emergency in 2017 due to the rapid rise of misuse of opioids and
overdoses caused by opioids (HHS, 2019). Drug overdoses caused 70,237
deaths in the United States in 2017. Of the total number overdose deaths, 47,600
50
(67.8%) involved an opioid (Scholl et al., 2019). Geographic variation in overdose
mortality and behavioral health services exists across the United States. From
1999 to 2009, the age adjusted overdose death rate increased by a greater
proportion in rural counties compared to counties in large metropolitan areas.
However, the highest age adjusted death rates occurred in large metropolitan
counties (Rossen et al., 2013).
Nonfatal overdoses are increasing in the United States. Data related to
nonfatal overdoes are obtained from hospital billing reports and emergency
departments. Non-fatal overdoses are more challenging to track than fatal
overdoses because some individuals are not seen in a hospital setting. Both
fatal and nonfatal overdoses have an emotional impact the overdose victim and
family, friends, and others witnessing the overdose. Individuals who experience
one nonfatal overdose are at higher risk of another overdose (CDC Opioid
Overdose, 2018).
Specifically, for overdoses caused by prescription drugs, demographic risk
factors include white race, age group of 35 to 44 years, and male sex (Brady et
al., 2017). Prescription availability, medical need for opioid prescriptions, and
economic stressors are localized factors contributing to overdoses. In a study of
California zip codes, opioid prescription overdose was negatively related to
median household income. Opioid prescription overdose was higher in areas with
higher rates of employment in manual labor industries. This is likely due to the
higher opioid prescribing rates due to higher self-reported injury and pain in
manual labor industries. (Cerda et al., 2016).
51
There are many barriers such as social determinants and stigma that limit
access to substance use disorder treatment resulting in the majority of persons
with a substance use disorder never receiving treatment. SAMHSA estimates in
2016 that 3.8 million individuals age 12 and older received treatment for
substance use disorder whereas approximately 21 million individuals were in
need of treatment. The National Institute on Drug Abuse (NIDA) estimates that
40-60% of individuals will relapse following treatment for an addiction to drugs or
alcohol (NIDA Principles, 2018).
According to the Tennessee Department of Health, there were 1,818
deaths were attributed to drug overdose. Opioids were the largest contributor to
deaths with 1,304 deaths involving an opioid (prescription and illicit). The number
of deaths in 2018 was a moderate increase from previous years with 1,776 and
1,631 deaths in 2017 and 2016 respectively. The 1,818 deaths in 2018 is a
mortality rate of 27.4 deaths per 100,000 persons. In 2018, 16,363 nonfatal
overdose outpatient visits occurred in Tennessee. A nonfatal overdose outpatient
visit is typically an emergency department encounter. The total number of
inpatient stays in 2018 was 7,202 (TN Department of Health, 2020). Access to
needed services including general healthcare, mental health services, substance
use disorder treatment, and recovery support is a crucial component to reducing
overdoses.
Recovery Support Services. Support services are needed for persons with
substance use disorder especially considering the limitations related to treatment
access and the high numbers of overdoses. SAMSHA describes recovery
52
holistically as a “process of change through which people improve their health
and wellness, live self-directed lives, and strive to reach their full potential.”
Health, home, purpose, and community are four dimensions involved in recovery.
Recovery support services are systems that help individuals manage their
substance use disorder and prevent relapses. Examples include services
removing transportation or employment barriers, and housing (SAMHSA, 2019).
Availability and accessibility of recovery support services following treatment are
a critical component on the continuum of care to sustain recovery (Rural Health
Information Hub, 2020).
Mutual aid groups and peer support programs including 12-step programs
such as Alcoholics Anonymous, Narcotics Anonymous, Cocaine Anonymous,
and many others are important examples of recovery support services that
reduce relapse rates in program participants (NIDA Media, 2018). Recovery
support programs often utilize space in faith-based institutions or community
organizations for meetings. Grim and Grim (2019) estimate there are 130,000
recovery support groups based in congregations throughout the United States.
Tennessee is more religious compared to the US average with 81% of
Tennesseans identifying as Christian, and 1%, 1%, 1%, and <1% identifying as
Jewish, Buddhist, Muslim, and Hindu respectively (Pew, 2014). There are
approximately 11,500 institutions of faith in Tennessee (TDMHSAS, 2019).
Celebrate Recovery is a Christian based, spiritual 12-step program with faith-
based institutions as the most common meeting location (Celebrate Recovery,
2018). The Tennessee Department of Mental Health and Substance Abuse
53
Service’s (TDMHSAS) Certified Recovery Congregation program supports faith-
based organizations and congregations in offering recovery support services to
participants (TDMHSAS, 2019).
Importantly, these peer support recovery programs are free to participants.
Generally, the programs are open and available to anyone regardless of race,
age, or gender. These free services are important resources considering the
challenges with accessibility. A better understanding of the accessibility of peer
support services including those offered in faith-based organizations in a highly
religious state such as Tennessee could identify opportunities to leverage these
organizations to support recovery support services.
Place-Based Framework. Environmental factors including socioeconomic
status, neighborhood conditions, and access to transportation are social
determinants that affect health status including behavioral health. Examination of
social and community context is part of the place-based organizing framework to
examine social determinants (CDC Social Determinants, 2020). Socioeconomic
deprivation is often associated with increased likelihood of drug use. Boardman
et al. (2001) examined neighborhood disadvantage and deprivation compared to
drug use at the census tract level in Detroit, Michigan. The study found increased
drug use in disadvantaged neighborhoods. The increased use was attributed to
high levels of social stressors and social strain (Boardman et al., 2001). A study
of Baltimore, Maryland found a positive relationship between heroin or cocaine
use and neighborhood poverty. Social support and access to social networks of
employed individuals were protective factors (Williams & Latkin, 2007).
54
Published studies using GIS mapping of locations of overdoses are
increasingly available. A GIS study in Flint and Genesee Counties in Michigan
found that treatment facilities were not geographically related to locations of
naloxone administration. The study authors recommended consideration of
locations with clusters of overdoses for future treatment locations including those
offering medication assisted treatment (Sadler & Furr-Holden, 2019). Similarly,
Dworkis et al. (2017) recommend making naloxone publicly available in areas of
opioid overdose clustering. This GIS study of Cambridge, MA used data from
emergency medical services and identified several overdose clusters (Dworkis et
al., 2017).
Transportation barriers are important considerations when examining
location of services. Barriers including travel time and distance have been cited
as barriers to treatment and recovery. Individuals traveling more than 10 miles to
inpatient alcoholism treatment consume significantly more alcohol in the year
following treatment than individuals traveling 10 miles or less to inpatient
treatment (Klinger et al., 2018). Treatment facilities in high crime neighborhoods
reduced treatment retention for patients traveling from a lower crime
neighborhood (Mennis et al., 2012). Studies indicate transportation barriers
reduce engagement in treatment aftercare programs. For drug dependent
individuals with serious mental illness, travel time was a strong predictor of
attendance at the first outpatient visit following hospitalization.
Differences in rural and urban areas have been identified in various types
of healthcare services including substance use disorder treatment services.
55
Edmond et al. (2015) found differences including fewer treatment services and
few indicators of high-quality treatment from the services available in rural areas
(Edmond et al., 2015). A study of the geographic distribution of mental healthcare
providers in California found an uneven distribution of providers by population
density with a disproportionally higher number in urban areas. Disproportionately
higher numbers of mental healthcare providers were found in areas with
populations that were more educated, wealthier, older average age, and less
racial diversity (Sharma et al., 2017).
Agencies providing social services are important in recovery from
substance use disorder. Bauer et al. (2015) examined the geographic distribution
in agencies providing income-related social services in the Boston, MA area.
Location of agencies providing low-income financial services is an important
consideration for accessibility by low socioeconomic status populations. Most
areas of high unemployment had access to at least one income-related social
service agency. However, 25.6% of the low socioeconomic status population had
no geographic access to an agency (Bauer et al., 2015).
Morton (2019) examined mutual aid recovery groups and availability in
areas of social deprivation at the census tract level in New Hampshire. Mutual
aid recovery groups included locations of Alcoholics Anonymous, Narcotics
Anonymous, Heroin Anonymous, and SMART Recovery. This study found a
positive relationship between social deprivation, an index compiled from
education level, vehicle access, rental housing, non-employment, and poverty,
and mutual aid recovery services (Morton, 2019).
56
The literature is lacking in geographic studies of mutual aid and 12-step
programs. The study by Morton (2019) was the only study identified in a literature
review utilizing a place-based framework and geographic information systems to
examine 12-step program location. Mutual aid and 12-step programs are
available at no cost to participants and this is an important socioeconomic
consideration.
Morton (2019) proposed that stigma related to substance use disorder is a
factor in location of mutual aid recovery services resulting in lower
socioeconomic areas having higher proportion of these services. This is an
important consideration for the social and community context of the place-based
framework. Additional studies are needed to better understand the community
context surrounding these services.
A mix of rural and urban areas, rapid population growth, and increasing
numbers of overdoses make Rutherford County useful to examine the
geographic locations of recovery support services. Rutherford County is in the
geographic center of Tennessee. The population estimate on July 1, 2019 was
332,285 persons. The county is rapidly growing with an estimated population
increase of 26.5% between April 1, 2010 and July 1, 2019 (Census Quick Facts,
2020). The county’s rapid population growth has strained many social services.
Rutherford County experienced a substantial increase in fatal overdoses from
2017 to 2018. In 2017, overdose resulted in 65 total deaths or 20.1 per 100,000
persons. In 2018, the total number of deaths increased to 89 or 27.6 per 100,000
persons. The rate of outpatient visits for overdoses in Rutherford County was
57
274.6 per 100,000 persons. Comparatively in Tennessee in 2018, the rate of
outpatient visits was 252.7 per 100,000 persons. The rate of inpatient visits for
overdoses in Rutherford County was 77.5 per 100,000 persons. In Tennessee in
2018, the rate of inpatient visits was 103.2 per 100,000 persons. Treatment type
is influenced by the availability and accessibility of treatment within the county
and state (TN Department of Health, 2020). The increasing number of overdoses
support the need for improved services for persons with substance use disorder
in this county.
Theoretical Framework
Examining characteristics of place is an important epidemiological
approach to describe characteristics of a disease. Examinations of place can
inform strategic allocation of resources. Localized place examinations identify
influences of the built environment or other demographic, social, and economic
factors on disease (Friis and Sellers, 2014). The CDC describes geographic
information system mapping as a method to examine place and space. The
studies provide new insight into why phenomena occur in some locations but not
in others (CDC, 2019). Increasingly geographic information system (GIS)
mapping is used in public health to understand geographic contribution to risk.
Methods
Research Question. What is the accessibility to recovery support services
with no financial cost for low socioeconomic status populations in Rutherford
County, Tennessee?
58
A descriptive, spatial study was conducted utilizing a geographic
information system (GIS) to map recovery support services and census
population demographic information in Rutherford County, Tennessee. A logistic
regression analysis examined the relationship between recovery support services
and population demographics at the census tract level.
Descriptive Spatial Study
Esri ArcMAP version 10.7 was utilized for the GIS mapping. Locations of
12-step recovery meetings including Narcotics Anonymous, Alcohol Anonymous,
Celebrate Recovery, and Certified Recovery Congregations were geocoded and
uploaded to ArcMAP. Geocoding entail input of location data such as an address
and an output of latitude and longitude coordinates. These recovery support
services have no financial cost, and the meeting locations are publicly available
(Appendix C).
A workflow diagram guided the process for the descriptive study in
ArcMap (Appendix D). The ArcMap buffer tool was used to create a 0.5 mile
radius (walking / walkability) surrounding each recovery support service (Bauer et
al., 2015).
Logistic Regression Analysis.
The Census Bureau’s American Community Survey was used for the data
analysis. The American Community Survey (ACS) collects data related to
demographic characteristics, economic data, housing, household characteristics,
and other population measures. Data is collected by the Census Bureau from a
sample size of approximately 3.5 million households on an ongoing basis. The
59
ACS provides estimates of population characteristics and not individual level
characteristics. Data is collected by paper questionnaire, internet surveys, and
personal visits. Over 5 years, the Census Bureau samples approximately 1 out of
every 9 households in the United States. Rural and low population density areas
are oversampled to reduce sampling error. To increase statistical reliability due to
the small population size, the Census Bureau produces five-year estimates from
the ACS at the census tract level (Census Bureau American Community Survey,
2019). Census tracts have populations between 1,200 to 8,000 persons (Census
Bureau Geography, 2020).
Data Source. Data from the ACS Data Profile Tables for Economic
Characteristics (Summary Table ID DP03) and Demographics Characteristics
(Summary Table ID DP05) was utilized for this analysis (Census Data Profile,
n.d.). The tables contain the 2015-2019 ACS 5-year data profiles. The statistical
analysis was restricted to the Rutherford County boundary (FIPS Code 47149)
(Census Bureau Quick Facts, 2020). Census tract boundaries do not restrict
persons from accessing recovery support services. Therefore, census tracts with
a recovery support service located within 0.5 miles will be considered positive for
access to a recovery support service.
IBM Statistical Package for Social Sciences (SPSS) version 21 will be
used for the statistical analysis. The ACS data sets Summary Table ID DP03 and
Summary Table ID DP05 were merged in SPSS using the GEO_ID as the match
variable. The GEO_ID is the FIPS code and unique census tract number.
60
Selected Measures. Rutherford County, Tennessee is divided into 49
census tracts. The census tracts are the unit of analysis for this study. The binary
dichotomous dependent variable was created by categorizing each census tract
into either containing one or more recovery support services or containing no
recovery support services. A Logistic regression analyses with continuous
independent variables was conducted. To examine the odds ratios, a second
logistic regression with independent variables transformed to into categorical
variables based on county averages was also conducted. Independent variables
indicating higher levels of social determinants of health compared to the county
level were coded as ‘1’. Likewise, independent variables indicating lower levels of
social determinants of health compared to or equal to the county level were
coded as ‘0’. A value of p < 0.5 is considered statistically significant. Independent
variables reflect social determinant of health factors and socio-economic
indicators of poverty, participation in public assistance programs, unemployment,
and race/ethnicity in the census tract (Bauer et al., 2015; CDC Social
Determinants of Health, 2020). Test for collinearity were conducted to identify
highly correlated variables.
Independent variables from the ACS included the total population in
census tract and the total square mileage of the census tract. Population
demographic race variables included in the analysis were percent of Black or
African American, Hispanic or Latino, and Non-Hispanic White in the census
tract. The social determinant variables in the analysis were the percent of
unemployment, and percent of adults over age 18 with income below the federal
61
poverty level, and percent of households receiving food stamps/SNAP benefits in
the census tract.
Hypothesis. When controlling for census tract total population and size,
census tracts with populations with high proportions of social determinants of
health risk factors are more likely to have a recovery support service in the
census tract.
Results
Geographic Information Systems (GIS) Maps. ArcGIS was utilized to
create a map to visualize the locations of peer support recovery services
available at no cost to participants in Rutherford County, Tennessee. Locations
of 34 recovery support services were mapped (Appendix C). Three locations host
two meetings; therefore, these locations are one point on the map. These 31
locations and the census tract boundaries can be seen in Figure 5. In Figure 6,
each recovery support service has a buffer of 0.5 miles. The buffers were
dissolved at points of overlap.
Of the 49 total census tracts in Rutherford County, 31 have one or more
recovery support service within the boundary or within 0.5 miles of the boundary.
Census tract FIPS code 47149041900 contains six recovery support services
which is the most services in of any of the census tracts. Census tract FIPS code
47149041800 contains four recovery support services. These two census tracts
are adjacent and centrally located in Murfreesboro, TN near the downtown area.
Of the census tracts with one or more recovery support service located in the
tract or within 0.5 miles, 16 census tracts have one recovery support service.
62
There are seven census tracts with two recovery support services and six census
tracts with three recovery support services.
Figure 7 shows the location of recovery support services and the percent
of persons age 18 and over living at or below the federal poverty level by census
tract. Figure 8 shows population density by square mile. Census tracts are
created based on population size and not by square mileage. As a result, the
square mileage can differ widely from tract to tract. Comparing the more urban
areas with denser populations to the rural tracts with less dense populations is
helpful to visualize differences in accessibility in urban versus rural areas.
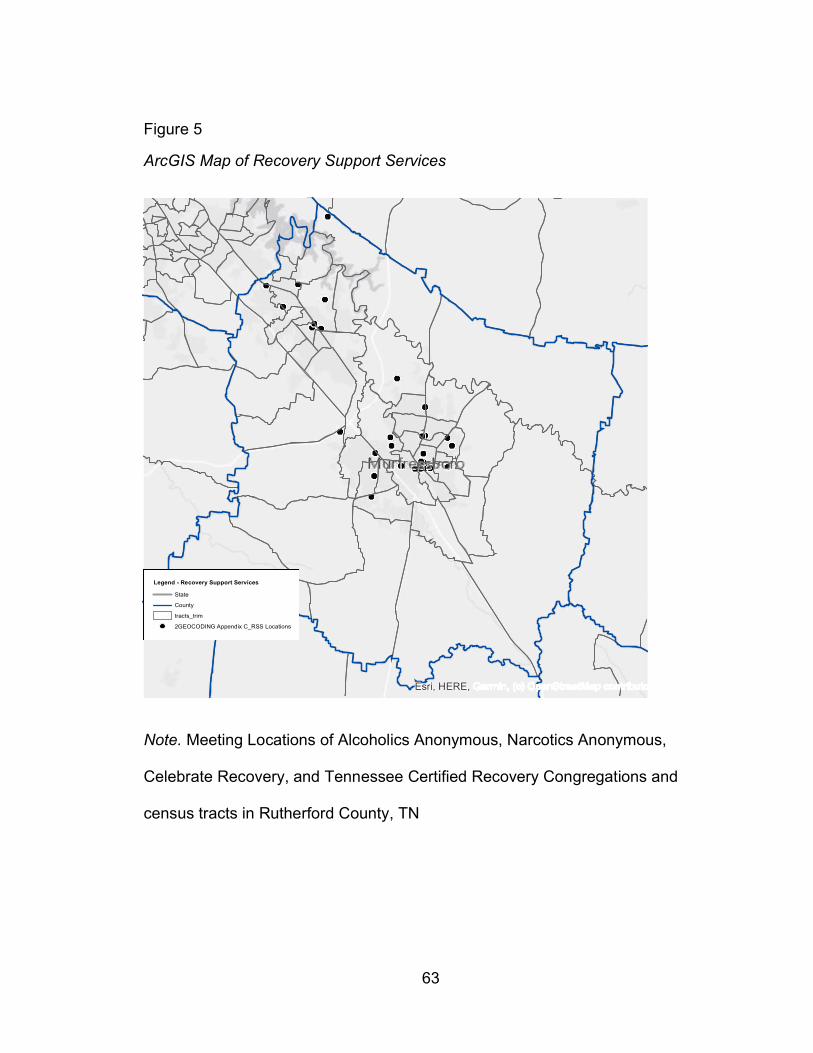
63
Figure 5
ArcGIS Map of Recovery Support Services
Note. Meeting Locations of Alcoholics Anonymous, Narcotics Anonymous,
Celebrate Recovery, and Tennessee Certified Recovery Congregations and
census tracts in Rutherford County, TN
Esri, HERE,
Legend - Recovery Support Services
State
County
tracts_trim
2GEOCODING Appendix C_RSS Locations
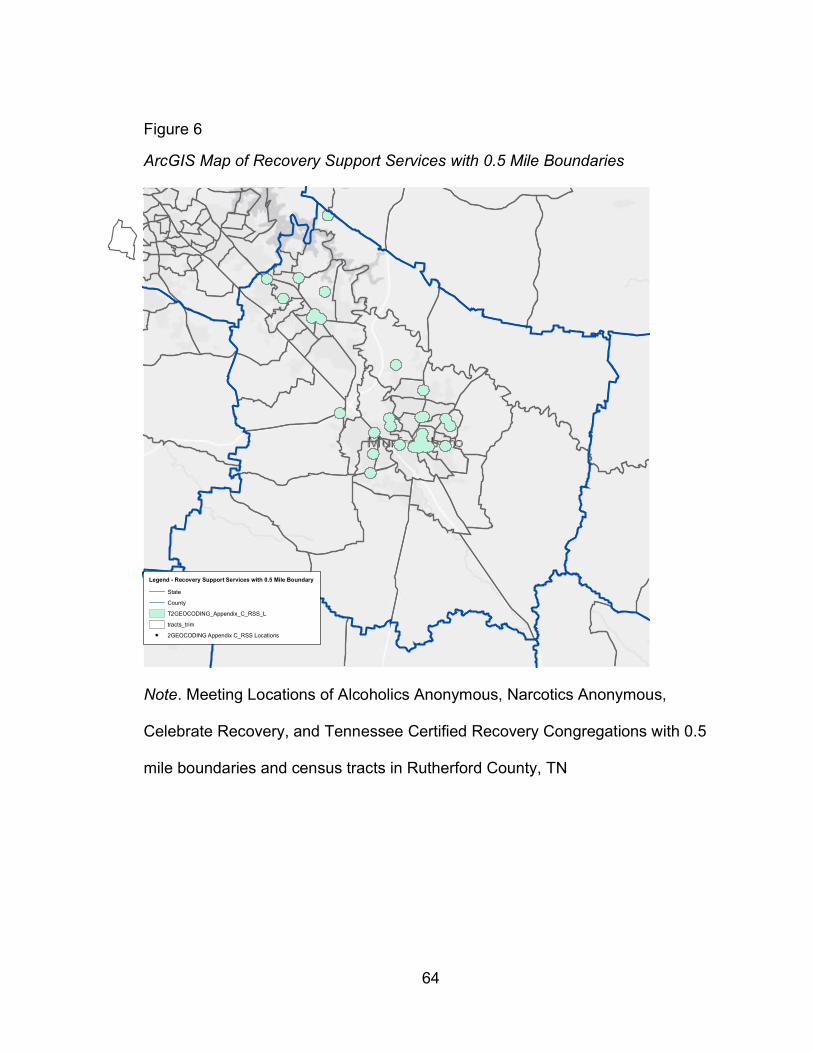
64
Figure 6
ArcGIS Map of Recovery Support Services with 0.5 Mile Boundaries
Note. Meeting Locations of Alcoholics Anonymous, Narcotics Anonymous,
Celebrate Recovery, and Tennessee Certified Recovery Congregations with 0.5
mile boundaries and census tracts in Rutherford County, TN
Legend - Recovery Support Services with 0.5 Mile Boundary
State
County
T2GEOCODING_Appendix_C_RSS_L
tracts_trim
2GEOCODING Appendix C_RSS Locations
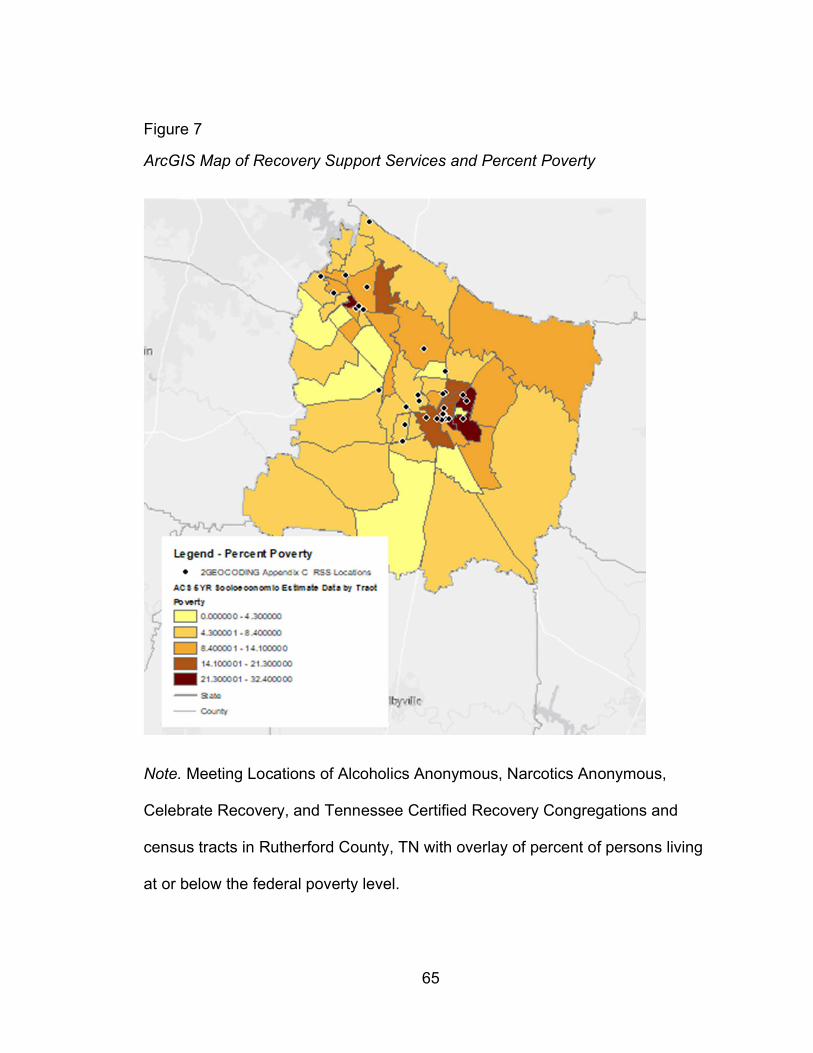
65
Figure 7
ArcGIS Map of Recovery Support Services and Percent Poverty
Note. Meeting Locations of Alcoholics Anonymous, Narcotics Anonymous,
Celebrate Recovery, and Tennessee Certified Recovery Congregations and
census tracts in Rutherford County, TN with overlay of percent of persons living
at or below the federal poverty level.
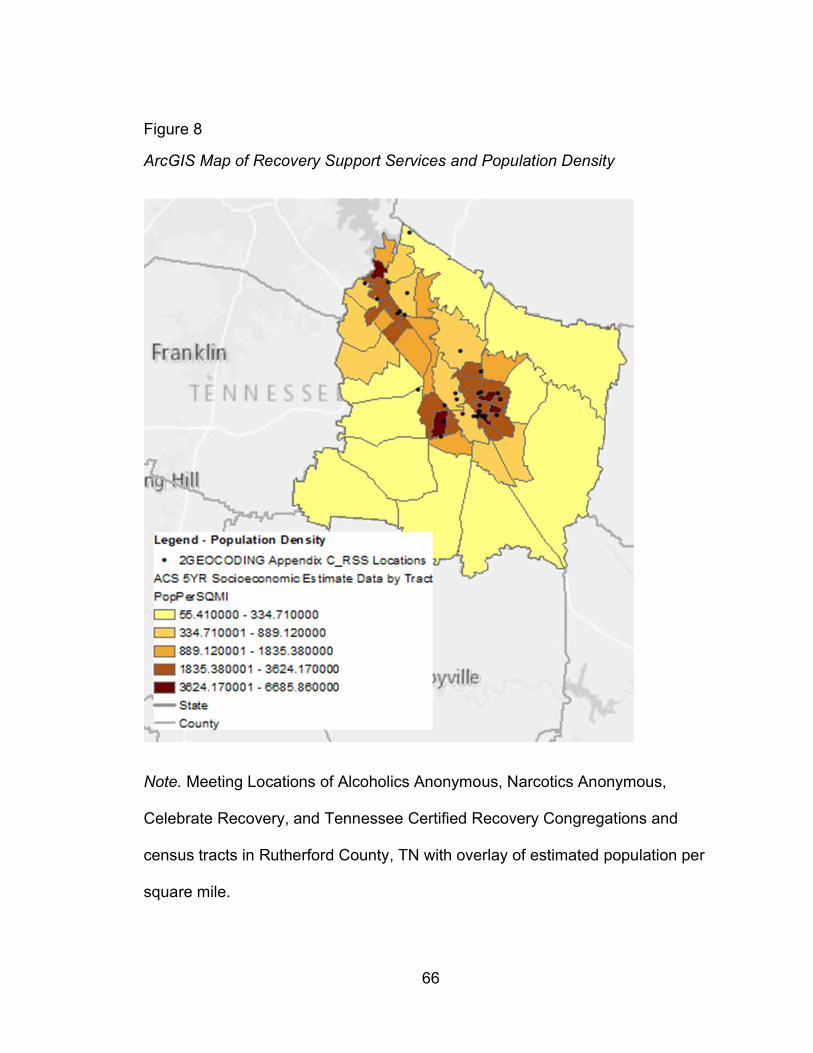
66
Figure 8
ArcGIS Map of Recovery Support Services and Population Density
Note. Meeting Locations of Alcoholics Anonymous, Narcotics Anonymous,
Celebrate Recovery, and Tennessee Certified Recovery Congregations and
census tracts in Rutherford County, TN with overlay of estimated population per
square mile.
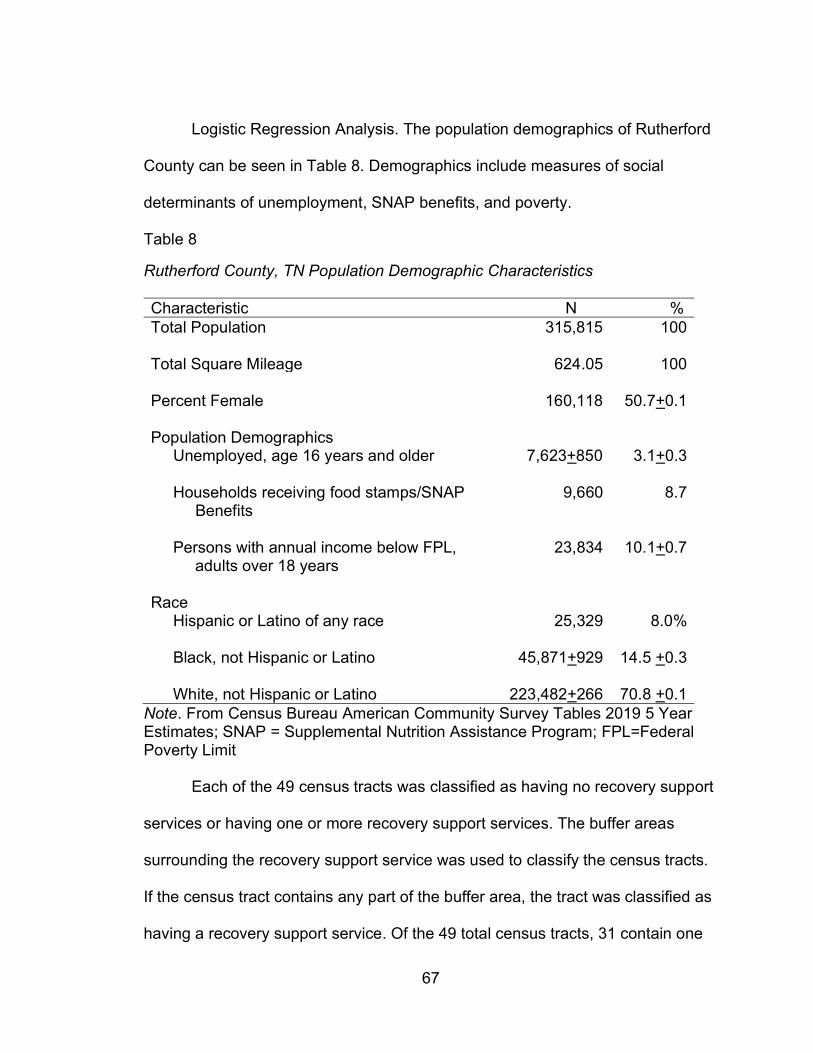
67
Logistic Regression Analysis. The population demographics of Rutherford
County can be seen in Table 8. Demographics include measures of social
determinants of unemployment, SNAP benefits, and poverty.
Table 8
Rutherford County, TN Population Demographic Characteristics
Characteristic N % Total Population 315,815 100
Total Square Mileage 624.05 100 Percent Female 160,118 50.7+0.1
Population Demographics Unemployed, age 16 years and older 7,623+850 3.1+0.3
Households receiving food stamps/SNAP Benefits
9,660 8.7
Persons with annual income below FPL, adults over 18 years
23,834 10.1+0.7
Race Hispanic or Latino of any race
25,329 8.0%
Black, not Hispanic or Latino
45,871+929 14.5 +0.3
White, not Hispanic or Latino 223,482+266 70.8 +0.1 Note. From Census Bureau American Community Survey Tables 2019 5 Year Estimates; SNAP = Supplemental Nutrition Assistance Program; FPL=Federal Poverty Limit
Each of the 49 census tracts was classified as having no recovery support
services or having one or more recovery support services. The buffer areas
surrounding the recovery support service was used to classify the census tracts.
If the census tract contains any part of the buffer area, the tract was classified as
having a recovery support service. Of the 49 total census tracts, 31 contain one
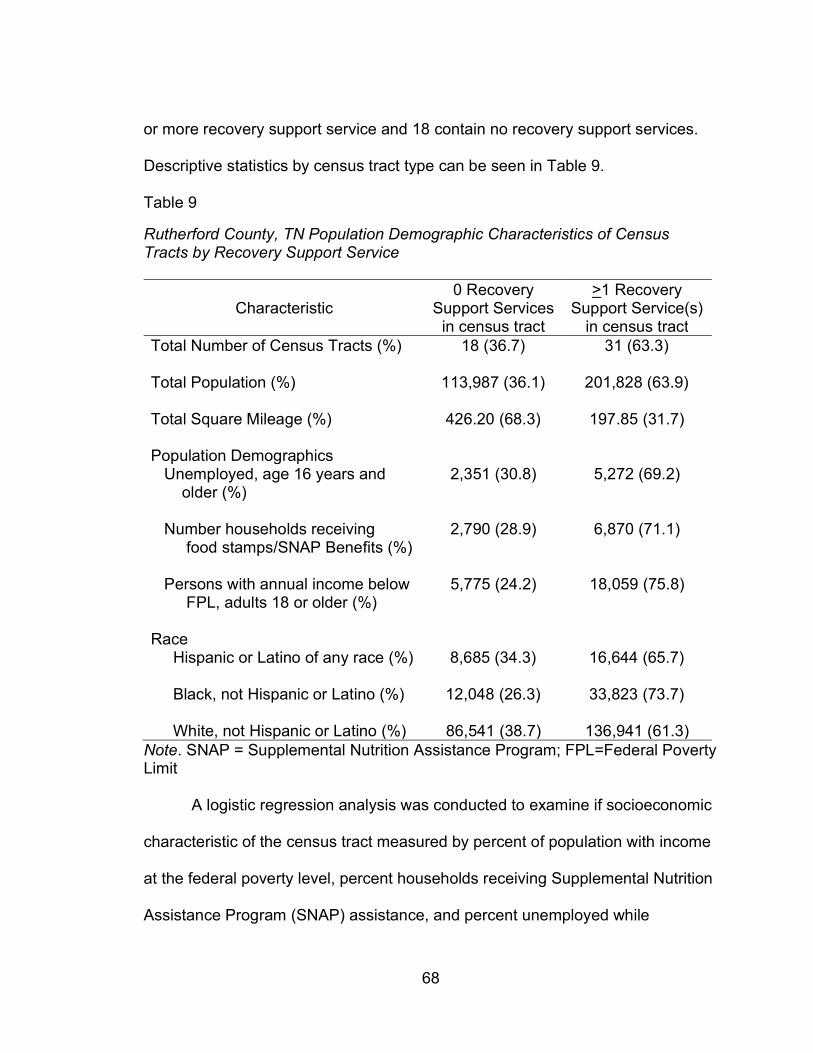
68
or more recovery support service and 18 contain no recovery support services.
Descriptive statistics by census tract type can be seen in Table 9.
Table 9
Rutherford County, TN Population Demographic Characteristics of Census Tracts by Recovery Support Service
Characteristic 0 Recovery
Support Services in census tract
>1 Recovery Support Service(s)
in census tract Total Number of Census Tracts (%) 18 (36.7) 31 (63.3)
Total Population (%) 113,987 (36.1) 201,828 (63.9)
Total Square Mileage (%) 426.20 (68.3) 197.85 (31.7)
Population Demographics Unemployed, age 16 years and older (%)
2,351 (30.8) 5,272 (69.2)
Number households receiving food stamps/SNAP Benefits (%)
2,790 (28.9) 6,870 (71.1)
Persons with annual income below FPL, adults 18 or older (%)
5,775 (24.2) 18,059 (75.8)
Race Hispanic or Latino of any race (%) 8,685 (34.3) 16,644 (65.7)
Black, not Hispanic or Latino (%) 12,048 (26.3) 33,823 (73.7)
White, not Hispanic or Latino (%) 86,541 (38.7) 136,941 (61.3)
Note. SNAP = Supplemental Nutrition Assistance Program; FPL=Federal Poverty Limit
A logistic regression analysis was conducted to examine if socioeconomic
characteristic of the census tract measured by percent of population with income
at the federal poverty level, percent households receiving Supplemental Nutrition
Assistance Program (SNAP) assistance, and percent unemployed while
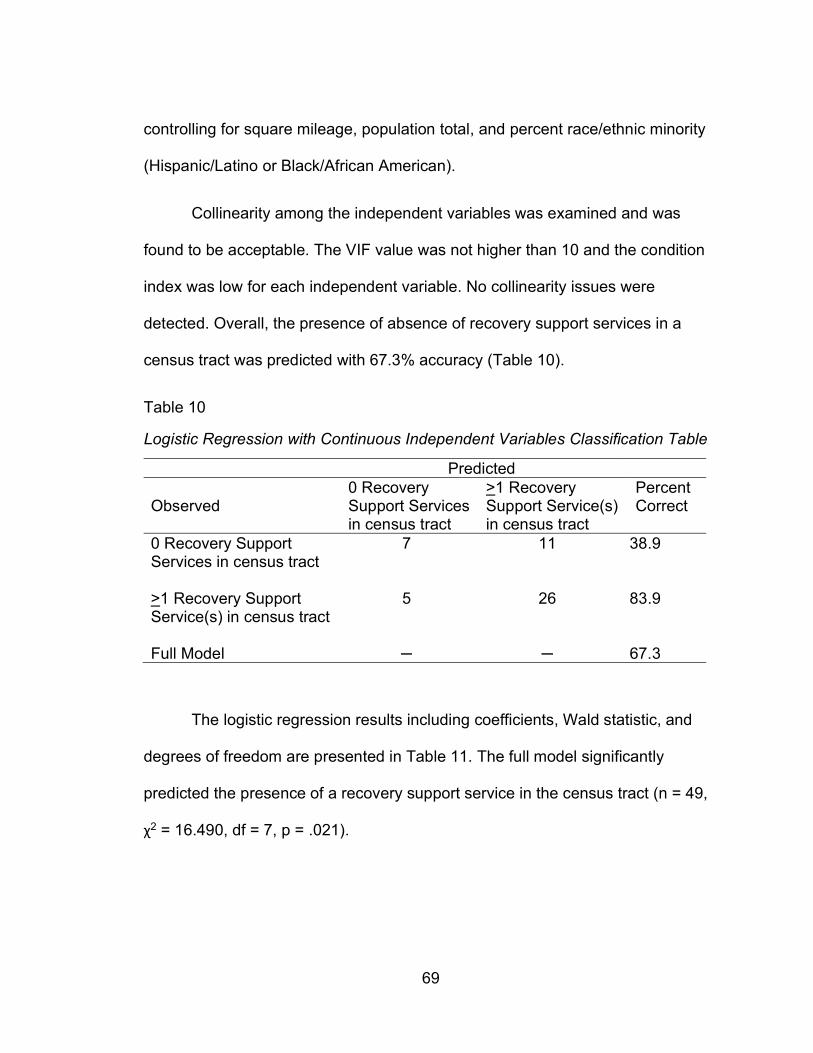
69
controlling for square mileage, population total, and percent race/ethnic minority
(Hispanic/Latino or Black/African American).
Collinearity among the independent variables was examined and was
found to be acceptable. The VIF value was not higher than 10 and the condition
index was low for each independent variable. No collinearity issues were
detected. Overall, the presence of absence of recovery support services in a
census tract was predicted with 67.3% accuracy (Table 10).
Table 10
Logistic Regression with Continuous Independent Variables Classification Table
Predicted
Observed 0 Recovery Support Services in census tract
>1 Recovery Support Service(s) in census tract
Percent Correct
0 Recovery Support Services in census tract
7 11 38.9
>1 Recovery Support Service(s) in census tract
5 26 83.9
Full Model ─ ─ 67.3
The logistic regression results including coefficients, Wald statistic, and
degrees of freedom are presented in Table 11. The full model significantly
predicted the presence of a recovery support service in the census tract (n = 49,
χ2 = 16.490, df = 7, p = .021).
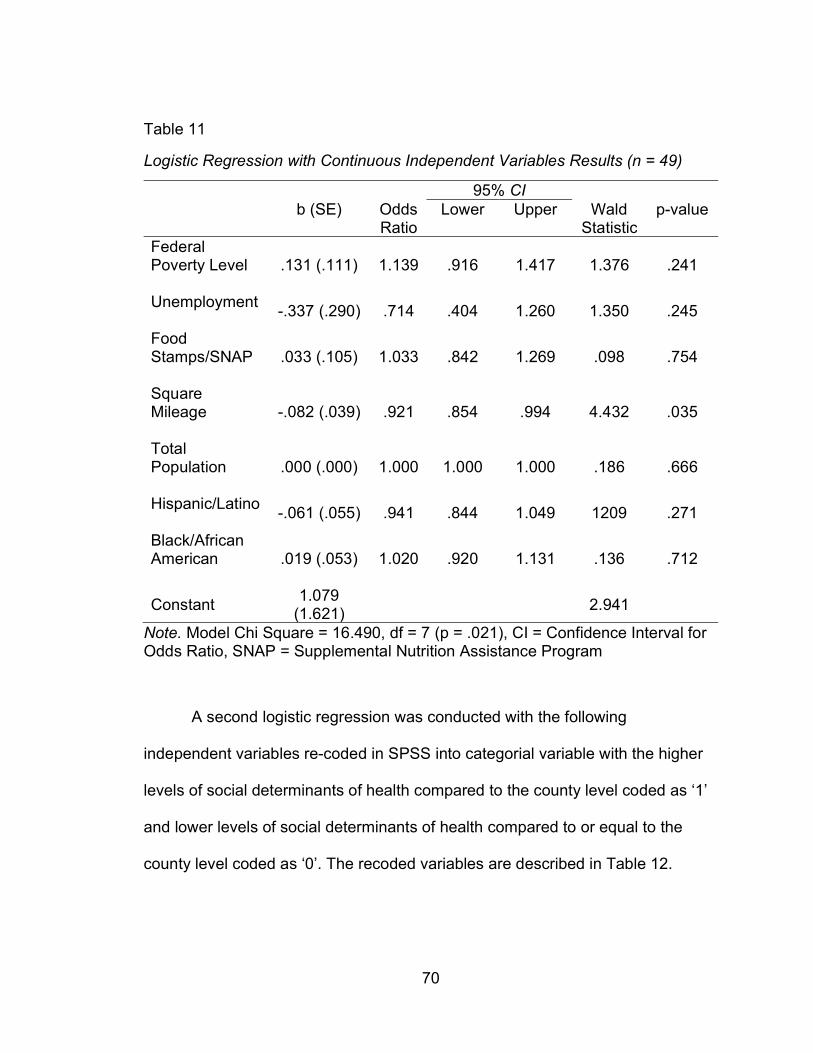
70
Table 11
Logistic Regression with Continuous Independent Variables Results (n = 49)
95% CI b (SE) Odds
Ratio Lower Upper Wald
Statistic p-value
Federal Poverty Level
.131 (.111) 1.139 .916 1.417 1.376 .241
Unemployment
-.337 (.290) .714 .404 1.260 1.350 .245
Food Stamps/SNAP
.033 (.105) 1.033 .842 1.269 .098 .754
Square Mileage
-.082 (.039) .921 .854 .994 4.432 .035
Total Population
.000 (.000) 1.000 1.000 1.000 .186 .666
Hispanic/Latino
-.061 (.055) .941 .844 1.049 1209 .271
Black/African American
.019 (.053) 1.020 .920 1.131 .136 .712
Constant 1.079
(1.621) 2.941
Note. Model Chi Square = 16.490, df = 7 (p = .021), CI = Confidence Interval for Odds Ratio, SNAP = Supplemental Nutrition Assistance Program
A second logistic regression was conducted with the following
independent variables re-coded in SPSS into categorial variable with the higher
levels of social determinants of health compared to the county level coded as ‘1’
and lower levels of social determinants of health compared to or equal to the
county level coded as ‘0’. The recoded variables are described in Table 12.
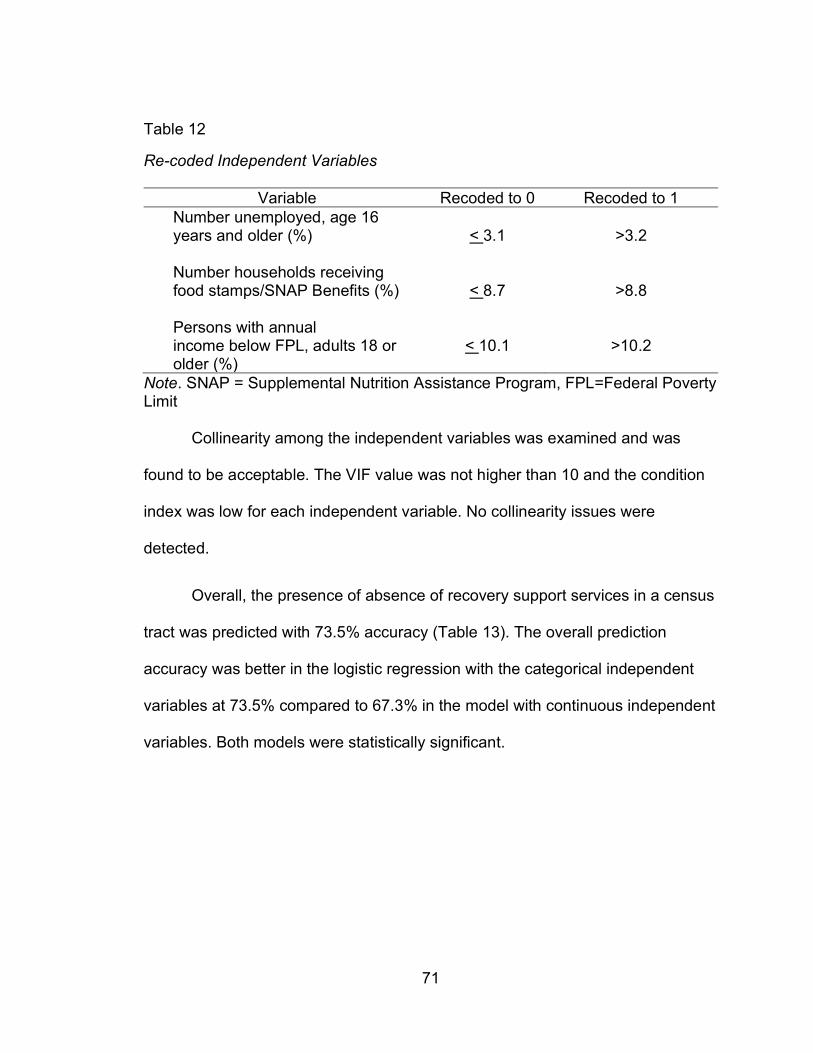
71
Table 12
Re-coded Independent Variables
Variable Recoded to 0 Recoded to 1 Number unemployed, age 16 years and older (%)
< 3.1 >3.2
Number households receiving food stamps/SNAP Benefits (%)
< 8.7 >8.8
Persons with annual income below FPL, adults 18 or older (%)
< 10.1 >10.2
Note. SNAP = Supplemental Nutrition Assistance Program, FPL=Federal Poverty Limit
Collinearity among the independent variables was examined and was
found to be acceptable. The VIF value was not higher than 10 and the condition
index was low for each independent variable. No collinearity issues were
detected.
Overall, the presence of absence of recovery support services in a census
tract was predicted with 73.5% accuracy (Table 13). The overall prediction
accuracy was better in the logistic regression with the categorical independent
variables at 73.5% compared to 67.3% in the model with continuous independent
variables. Both models were statistically significant.
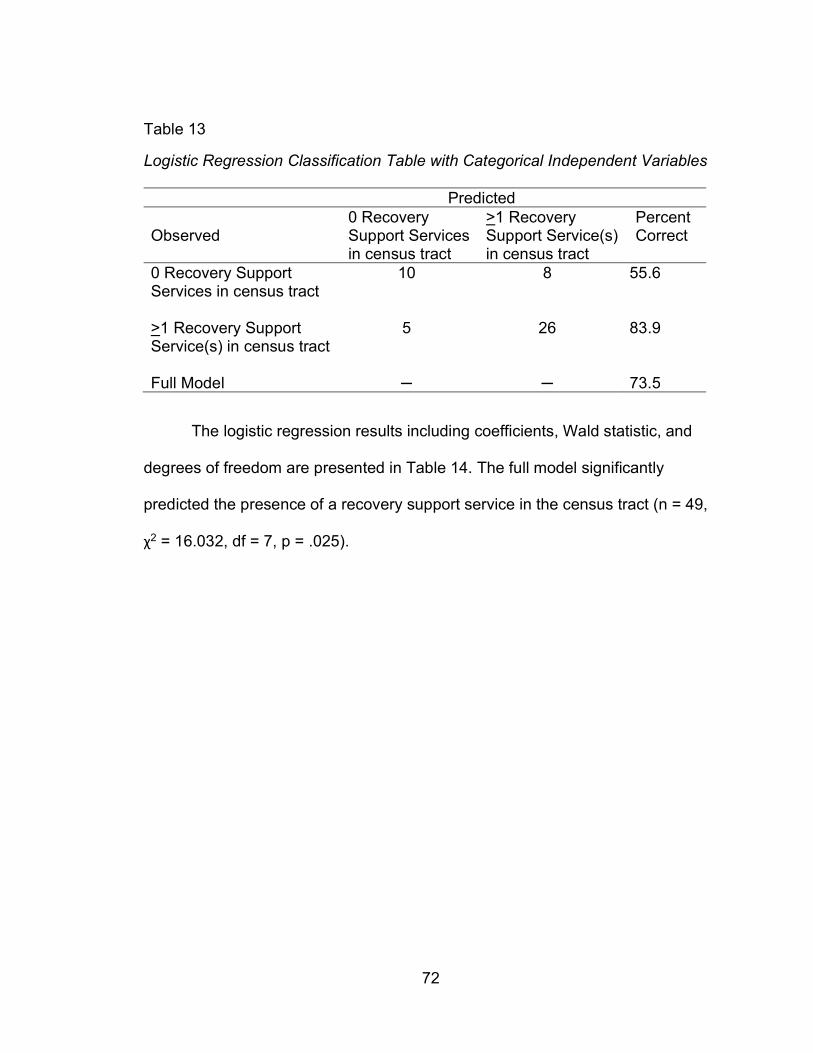
72
Table 13
Logistic Regression Classification Table with Categorical Independent Variables
Predicted
Observed 0 Recovery Support Services in census tract
>1 Recovery Support Service(s) in census tract
Percent Correct
0 Recovery Support Services in census tract
10 8 55.6
>1 Recovery Support Service(s) in census tract
5 26 83.9
Full Model ─ ─ 73.5
The logistic regression results including coefficients, Wald statistic, and
degrees of freedom are presented in Table 14. The full model significantly
predicted the presence of a recovery support service in the census tract (n = 49,
χ2 = 16.032, df = 7, p = .025).
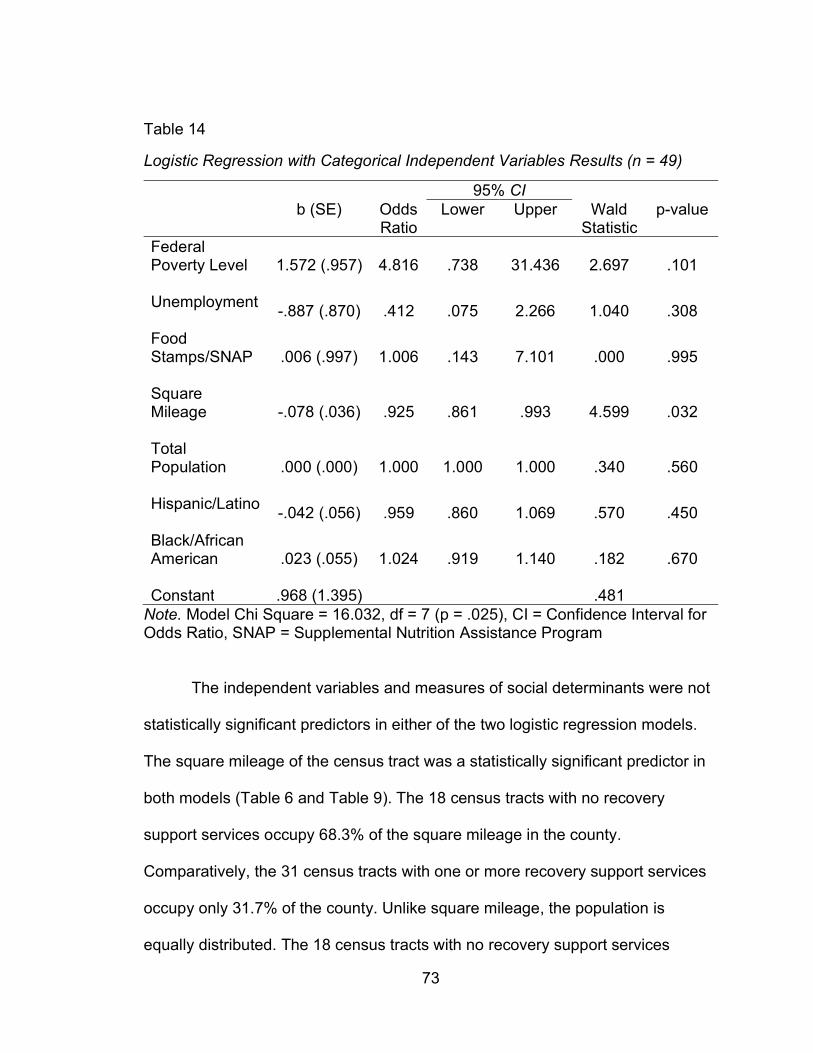
73
Table 14
Logistic Regression with Categorical Independent Variables Results (n = 49)
95% CI b (SE) Odds
Ratio Lower Upper Wald
Statistic p-value
Federal Poverty Level
1.572 (.957) 4.816 .738 31.436 2.697 .101
Unemployment
-.887 (.870) .412 .075 2.266 1.040 .308
Food Stamps/SNAP
.006 (.997) 1.006 .143 7.101 .000 .995
Square Mileage
-.078 (.036) .925 .861 .993 4.599 .032
Total Population
.000 (.000) 1.000 1.000 1.000 .340 .560
Hispanic/Latino
-.042 (.056) .959 .860 1.069 .570 .450
Black/African American
.023 (.055) 1.024 .919 1.140 .182 .670
Constant .968 (1.395) .481 Note. Model Chi Square = 16.032, df = 7 (p = .025), CI = Confidence Interval for Odds Ratio, SNAP = Supplemental Nutrition Assistance Program
The independent variables and measures of social determinants were not
statistically significant predictors in either of the two logistic regression models.
The square mileage of the census tract was a statistically significant predictor in
both models (Table 6 and Table 9). The 18 census tracts with no recovery
support services occupy 68.3% of the square mileage in the county.
Comparatively, the 31 census tracts with one or more recovery support services
occupy only 31.7% of the county. Unlike square mileage, the population is
equally distributed. The 18 census tracts with no recovery support services
74
equates to 36.1% of the 49 total census tracts. These census tracts contain
36.7% of the total population in the county. The 31 census tracts with one or
more recovery support service equates to 63.3% of the 49 total census tracts.
These census tracts contain 63.9% of the total population (Table 4). The
disproportional distribution in square mileage and proportional distribution of
population indicates that recovery support services are located in the census
tracts with denser populations and smaller square mileage. Figure 9 shows that
the majority of recovery support services are located in two areas with dense
populations.
The poverty variable measured by adults age 18 or older living at or below
the federal poverty level had the highest adjusted odds ratio. When controlling for
the other variables in the model, the odds of a census tract containing one or
more recovery support services was 4.8 times higher for census tracts with a
higher proportion than the county average of adults living at or below the federal
poverty level. The census tracts with denser populations also have higher
proportions of adults living at or below the federal poverty level.
Discussion
In Rutherford County, TN, mutual aid recovery support services and 12-
step programs are located in areas with smaller census tract square mileage and
denser populations. The areas with these recovery support services also have
higher proportions of adults living in poverty and families enrolled in SNAP.
These social determinants were not statistically significant predictors when
controlling for other variables including census tract size in square miles.
75
This spatial analysis shows an uneven distribution of mutual aid recovery
support services. Across the US, rural areas often lack accessible services of
many types including primary care providers, mental and behavioral health
services, substance use disorder treatment, emergency care due to closures of
hospitals in rural areas, dental care, and public health services. This is
compounded by additional challenges including transportation barriers, poverty,
and low health literacy in rural areas (The Rural Information Hub, 2019).
The US Census Bureau defines areas as urban, urban cluster, or rural.
Urban areas have populations of 50,000 or more. Urbanized clusters have
populations of 2,500 to 50,000. Areas that do not meet the urban area or cluster
criteria are classified as rural. Other considerations in the classification by the
Census Bureau includes population density at the block level and land use such
as proportion of paved area. At the census block level, 1,000 persons per square
mile is an indicator of an urban area (Ratcliffe et al., 2016).
Rutherford County has a mix of urban and rural areas resulting in a useful
example to compare services in urban versus rural areas. The population density
of the county in 2010 was 424 persons per square mile (Census Quick Facts,
2020). The census track with the densest population is tract FIPS code
47149041402 with a density estimated at 6,685.86 persons per square mile
followed by tract FIPS code 47149041900 with a density estimated at 5,258.54
persons per square mile. In contrast, the least dense tracts are FIPS code
47149040600 with 55.42 persons per square mile and FIPS code 47149040810
with 63.30 persons per square mile.
76
Studies of addiction treatment aftercare programs indicate distance to the
service reduces likelihood of engaging in the service. This is an important
consideration for residents in rural areas that travel further distances for services.
In a study of veterans receiving in-patient addiction treatment at a Veterans
Affairs facility, Schmitt et al. (2003) found that traveling ten miles or less made
patients 2.6 times more likely to attend mental health aftercare appointments
when compared to patients traveling 50 or more miles (Schmitt et al., 1993).
Fortney et al. (1995) examined patient demographic factors and likelihood of
utilizing mental health services following completion of inpatient alcoholism
treatment in a Veterans Affairs program. The findings indicate older patients and
those living in rural areas were less likely to utilize aftercare services due to
distance to the service (Fortney et al., 1995).
Access to a vehicle or public transportation are transportation barriers in
addition to travel distance. These barriers are not well studied in relation to
mutual aid and 12-step programs. In Rutherford County, only 2.9% of households
do not have access to a vehicle (Census Bureau ACS, 2019). This may reduce
the transportation barriers when traveling short distances from a rural to urban
area within a county.
In a qualitative literature review, Young et al. (2015) identified 14 barriers
limiting access to recovery in rural areas. For 12-step programs, the five barriers
experienced by rural residents identified were distance to meetings, meeting
availability, diversity of meeting types, and diversity of participants in meetings
including gender and specific populations such as LGBTQ or persons speaking
77
languages other than English. The fifth barrier identified is lack of reliable
sponsorships which relates specifically to the importance of the peer relationship
offered by 12-step programs (Young et al., 2015).
In a national study of a representative sample, Edmond et al. (2015) found
differences in quality between substance use disorder treatment facilities in rural
and urban areas. Rural facilities were less likely to provide meeting space for 12-
step programs compared to facilities in urban areas. Available program meeting
locations is another barrier for rural areas (Edmond et al., 2015).
Morton (2019) proposes that community-level stigma is a significant factor
in the location of mutual aid recovery support services. Morton’s study of 12-step
program locations in New Hampshire found a significant positive relationship
between program location and areas of social deprivation. A proposed reason for
location of these programs in areas higher in social deprivation is due to stigma
surrounding these programs and substance use disorder in general. This study
did not include population density variables (Morton, 2019). The Rural Health
Information Hub describes a unique challenge in that stigma related to substance
use disorder in rural areas that is intensified due to the lack of anonymity (The
Rural Health Information Hub, 2020). Likewise, Young et al. (2015) describes
lack of anonymity as a barrier for rural areas. Lack of anonymity increases stigma
and reduces the likelihood of seeking treatment services and recovery support
services such as 12-step groups (Young et al., 2015).
The lower number of services in rural areas is compounded by high rates
of substance use disorder and alcohol use disorder in these locations. The opioid
78
epidemic started in rural Appalachia with the rapid rise in opioid pain reliever
prescriptions and opioid deaths (CDC Opioid Overdose, 2020). Utilizing data
from the National Survey on Drug Use and Health, Mack et al. (2017) found
overdose deaths in rural areas increased by 325% from 1999 to 2015 compared
to an 198% increase in metropolitan areas. Although further analysis shows a
complicated picture when examining rural and urban differences in genders, age
groups, other demographic characteristics, and over time since 1999 (Mack et
al., 2017). Alcohol use disorder prevalence is equally complicated when
examining rural versus urban areas. A SAMHSA report found that 49.5% of
treatment facility admissions were for a primary disorder of alcohol use in rural
areas compared to 36.1% in urban areas (SAMHSA, 2012). In contrast, the
lowest rates of alcohol use are also found in rural areas. The low usage rates in
rural areas intersect with religious and cultural variables (Dixon and Chartier,
2016).
More research is needed to understand accessibility to mutual aid
recovery support services. The diverse population in Rutherford County, TN
made this county a useful case to examine population demographics in areas
with and without a mutual aid recovery support service. Larger spatial studies are
needed to better understand access in rural and urban areas and other important
population demographics including social determinants. The literature contains
few studies examining accessibility to mutual aid recovery support services and
very few utilizing geographic information systems. Future studies should consider
intersecting cultural factors and barriers to these services related to stigma.
79
Religious institutions often provide free meeting space for recovery support
programs. For rural areas high in religiosity but low in service availability,
leveraging the faith-based community is an important opportunity to expand
access.
Study Limitations. This geographic information study was limited in scope
to one county. A larger area of analysis is needed to better understand
availability and accessibility of services. The logistic regression analyses were
limited to the variables available in the Census Bureau’s American Community
Survey. Other important factors contributing to the location of recovery support
services may have been omitted. This study examined locations of Alcoholics
Anonymous, Narcotics Anonymous, Celebrate Recovery, and the TDMHSAS
certified recovery congregation programs. Other peer to peer, mutual-aid, and
12-step groups may exist in some areas and were not included in this study.
Peer-to-peer services are complex with various populations of focus, sizes, and
substances of focus. An available and accessible peer-to-peer program does not
guarantee that the program is a good fit for all persons living in close proximity
seeking a program. Studies utilizing a variety of methods including but not limited
to geographic information systems are needed to better understand barriers to
program access.
80
REFERENCES
Bauer. S. R., Monuteaux, M. C., & Fleegler, E. W. (2015). Geographic disparities
in access to agencies providing income-related social services. Journal of
Urban Health, 92(5), 853-863. http://dx.doi.org/10.1007/s11524-015-9971-
2
Boardman, J. D, Finch, B. K., Ellison, C. G., Williams, D. R., & Jackson., J. S.
(2001). Neighborhood disadvantage, stress, and drug use among adults.
Journal of Health and Social Behavior, 42(2), 151.
https://www.jstor.org/stable/3090175
Brady, J., Giglio, R., Keyes, K., DiMaggio, C., & Li, G. (2017). Risk markers for
fatal and non-fatal prescription drug overdose: A meta-analysis. Injury
Epidemiology, 4(1), 1-24. http://dx.doi.org/10.1186/s40621-017-0118-7
Celebrate Recovery. (2018). History of Celebrate Recovery. History of CR
(celebraterecovery.com)
Census Bureau. (2019, November 4). Census geocoding services.
https://www.census.gov/data/developers/data-sets/Geocoding-
services.html
Census Bureau. (2020). Geography and the American Community Survey: What
data users need to know. Understanding and Using ACS Data: What All
Data Users Need to Know (census.gov)
81
Census Bureau. (2019). Quick facts: Rutherford County, TN.
https://www.census.gov/quickfacts/fact/table/rutherfordcountytennessee/R
TN131212
Census Bureau. (2019). American community survey data profiles.
https://www.census.gov/acs/www/data/data-tables-and-tools/data-profiles/
Centers for Disease Control and Prevention. (2019). GIS and public health at
CDC. https://www.cdc.gov/gis/index.htm
Centers for Disease Control and Prevention. (2018). Opioid overdose: Nonfatal
drug overdoses. https://www.cdc.gov/drugoverdose/data/nonfatal.html
Centers for Disease Control and Prevention. (2020). Social determinants of
health: Know what affects health.
https://www.cdc.gov/socialdeterminants/about.html
Cerdá, M., Gaidus, A., Keyes, K. M., Ponicki, W., Martins, S., Galea, S., &
Gruenewald, P. (2017). Prescription opioid poisoning across urban and
rural areas: identifying vulnerable groups and geographic areas. Addiction,
112(1), 103–112. https://doi.org/10.1111/add.13543
Dixon, M. A. and Chartier, K G. (2016). Alcohol use pattern among urban and
rural residents. Alcohol Research Current Reviews, 36(1), 69-77.
Edmond, M. B., Aletraris, L., & Roman, P. M. (2015) Rural substance use
treatment centers in the United States: an assessment of treatment quality
82
by location. American Journal of Drug and Alcohol Abuse, 41(5), 449-457.
http://dx.doi.org/10.3109/00952990.2015.1059842
Fortney, J. C., Booth, B. M., Blow, F. C., & Bunn, J. Y. (1995). The effects of
travel barriers and age on the utilization of alcoholism treatment after care.
The American Journal of Drug and Alcohol Abuse, 21(3), 391-406.
http://dx.doi.org/10.3109/00952999509002705
Friis, R. H. & Sellers, T. A. (2014). Descriptive epidemiology: Person, place, time.
In M. Gartside (Ed.), Epidemiology for public health practice (pp. 157-234).
Burlington, MA: Jones & Bartlett Learning
Grimm, B. J. & Grimm, M. E. (2019). Belief, behavior, and belonging: How faith is
indispensable in preventing and recovering from substance abuse. Journal
of Religion and Health, 58, 1713-1750. http://dx.doi.org/10.1007/s10943-
019-00876-w
Health and Human Services. (2019). About the epidemic.
https://www.hhs.gov/opioids/about-the-epidemic/index.html
Klinger, J. L., Karriker-Jaffe, K. J., Witbrodt, J., & Kaskutas, L. A. (2018). Effects
of distance to treatment on subsequent alcohol consumption. Drugs:
Education, Prevention & Policy, 25(2), 173–180.
http://dx.doi.org/10.1080/09687637.2016.1189875
Mack, K. A., Jones, C. M., & Ballesteros., M. F. (2017). Illicit drug use, illicit drug
use disorders, and drug overdose deaths in metropolitan and
83
nonmetropolitan areas – United States. American Journal of
Transplantation 17(12), 3241-3252. https://doi.org/10.1111/ajt.14555
Mennis, J., Stahler, G. J., & Baron., D. A. (2012). Geographic barriers to
community-based psychiatric treatment for drug-dependent patients.
Annals of the Association of American Geographers, 102(5), 1093.
http://dx.doi.org/10.1080/00045608.2012.657142
Morton, C. M. (2019). Community social deprivation and availability of substance
use treatment and mutual aid recovery groups. Substance Abuse
Treatment, Prevention, and Policy, 114(1), 33.
http://dx.doi.org/10.1186/s13011-019-0221-6
National Institute on Alcohol Abuse and Alcoholism. (2018). Alcohol facts and
statistics. https://www.niaaa.nih.gov/publications/brochures-and-fact-
sheets/alcohol-facts-and-statistics
National Institute on Drug Abuse. (2018). Media guide: How to find what you
need to know about drug use and addiction.
https://www.drugabuse.gov/publications/media-guide/dear-journalist
National Institute on Drug Abuse. (2018). Principles of drug addiction treatment:
A research-based guide (third edition): How effective is drug addiction
treatment? https://www.drugabuse.gov/publications/principles-drug-
addiction-treatment-research-based-guide-third-edition/preface
84
Ratcliffe, M., Burd, C., Holder, K., & Fields, A. (2016). American Community
Survey and geography brief: Defining rural at the U.S. Census Bureau,
ACSGEO-1, U.S. Census Bureau, Washington DC
Rossen, L. M., Kahn, D., & Warner, M. (2013). Trends and geographic patterns
in drug-poisoning death rates in the U.S., 1999-2009. American Journal of
Preventive Medicine, 45(6), e19-e25.
http://dx.doi.org/10.1016/j.amepre.2013.07.012
Rural Health Information Hub. (2019). Healthcare access in rural communities.
https://www.ruralhealthinfo.org/topics/healthcare-access
Rural Health Information Hub. (2020). Treatment and recovery support services.
https://www.ruralhealthinfo.org/toolkits/substance-abuse/1/support-
services
Sadler, R. C., & Furr-Holden, D. (2019). The epidemiology of opioid overdose in
Flint and Genesee County, Michigan: Implications for public health
practice and intervention. Drug and Alcohol Dependence, 204.
http://dx.doi.org/10.1016/j.drugalcdep.2019.107560
Scholl, L, Seth, P., Kariisa, M., Wilson, N., & Baldwin, G. (2019). Drug and
opioid-involved overdose deaths – United States, 2013-2019. Morbidity
and Mortality Weekly Report, 67. 1419-1427.
Schmitt, S. K., Phibbs, C. S., & Piette, J. D. (2003). The influence of distance on
utilization of outpatient mental health aftercare following inpatient
85
substance abuse treatment. Addictive Behaviors, 28, 1183-1192.
http://dx.doi.org/10.1016/S0306-4603(02)00218-6
Sharma, R. N., Casa, R. N., Crawford, N. M., & Mills, L. N. (2017). Geographic
distribution of California mental health professionals in relation to
sociodemographic characteristics. Cultural Diversity and Ethnic Minority
Psychology, 23(4), 595-600. http://dx.doi.org/10.1037/cdp0000147
Substance Abuse and Mental Health Services Administration. (2017). Key
substance use and mental health indicators in the United States: Results
from the 2016 National Survey on Drug Use and Health (HHS Publication
No. SMA 17-5044, NSDUH Series H-52). Rockville, MD.
https://www.samhsa.gov/data/
Substance Abuse and Mental Health Services Administration (SAMHSA). (2019).
Recovery and recovery support. https://www.samhsa.gov/find-
help/recovery
Tennessee Department of Health Office of Informatics and Analytics. (2020).
Tennessee drug overdose data dashboard.
https://www.tn.gov/health/health-program-areas/pdo/pdo/data-
dashboard.html
Tennessee Department of Mental Health and Substance Abuse Services. (2019).
Tennessee recovery congregation toolkit.
86
https://www.tn.gov/content/dam/tn/mentalhealth/documents/Faith%20Bas
ed%20Initiative%20toolkit__040119.pdf
Substance Abuse and Mental Health Services Administration (SAMHSA). (2012).
The treatment episode dataset report.
https://www.samhsa.gov/sites/default/files/teds-short-report043-urban-
rural-admissions-2012.pdf
Williams, C. T., & Latkin, C. A. (2007). Neighborhood socioeconomic status,
personal network attributes, and use of heroin and cocaine. American
Journal of Preventive Medicine, 6, 203-210.
http://dx.doi.org/10.1016/j.amepre.2007.02.006
Young, L. B., Grant, K. M., & Tyler, K. A. (2015). Community-level barriers to
recovery for substance-dependent rural residents. Journal of Social Work
Practice in the Addictions.
http://dx.doi.org/10.1080/1533256X.2015.1056058

87
APPENDICES
88
APPENDIX A
Institutional Review Board
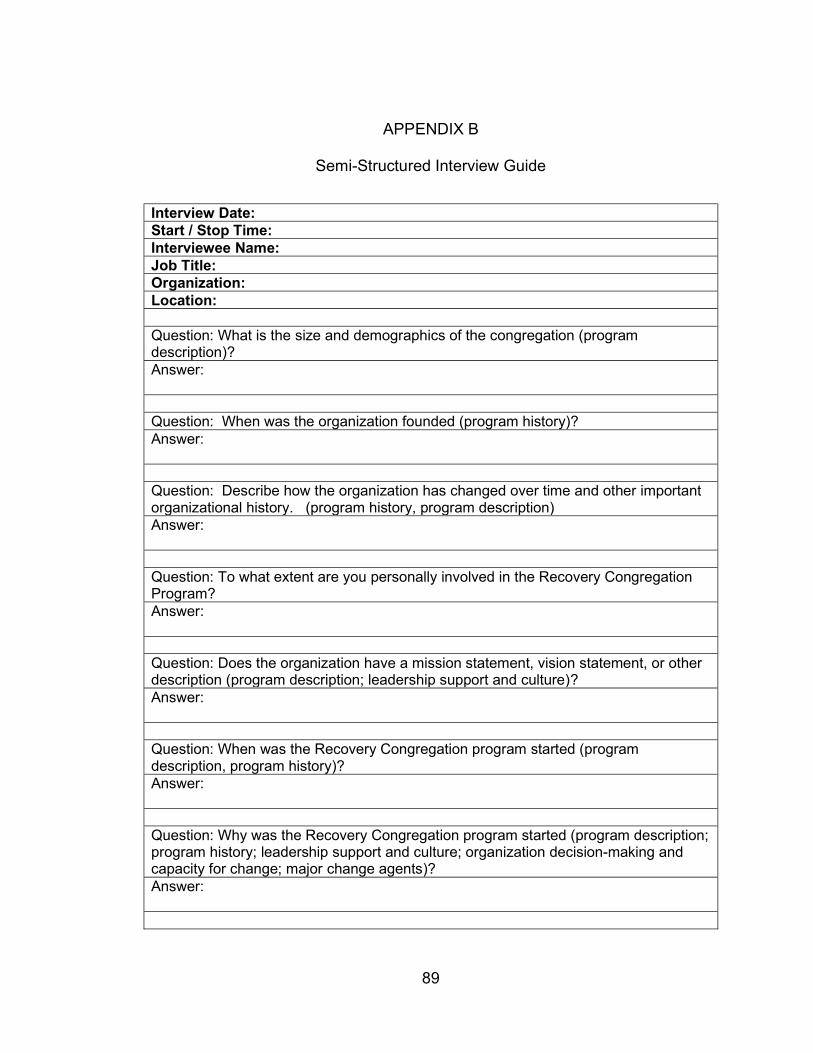
89
APPENDIX B
Semi-Structured Interview Guide
Interview Date: Start / Stop Time: Interviewee Name: Job Title: Organization: Location: Question: What is the size and demographics of the congregation (program description)? Answer: Question: When was the organization founded (program history)? Answer: Question: Describe how the organization has changed over time and other important organizational history. (program history, program description) Answer: Question: To what extent are you personally involved in the Recovery Congregation Program? Answer: Question: Does the organization have a mission statement, vision statement, or other description (program description; leadership support and culture)? Answer: Question: When was the Recovery Congregation program started (program description, program history)? Answer: Question: Why was the Recovery Congregation program started (program description; program history; leadership support and culture; organization decision-making and capacity for change; major change agents)? Answer:
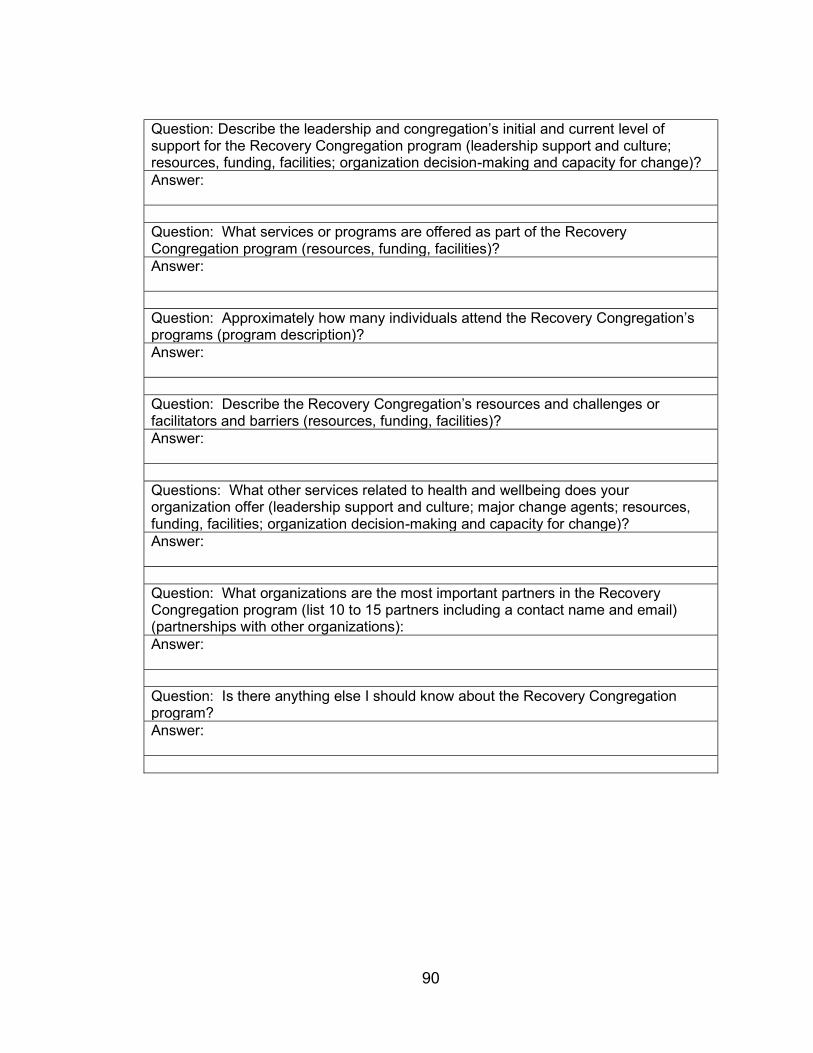
90
Question: Describe the leadership and congregation’s initial and current level of support for the Recovery Congregation program (leadership support and culture; resources, funding, facilities; organization decision-making and capacity for change)? Answer: Question: What services or programs are offered as part of the Recovery Congregation program (resources, funding, facilities)? Answer: Question: Approximately how many individuals attend the Recovery Congregation’s programs (program description)? Answer: Question: Describe the Recovery Congregation’s resources and challenges or facilitators and barriers (resources, funding, facilities)? Answer: Questions: What other services related to health and wellbeing does your organization offer (leadership support and culture; major change agents; resources, funding, facilities; organization decision-making and capacity for change)? Answer: Question: What organizations are the most important partners in the Recovery Congregation program (list 10 to 15 partners including a contact name and email) (partnerships with other organizations): Answer: Question: Is there anything else I should know about the Recovery Congregation program? Answer:
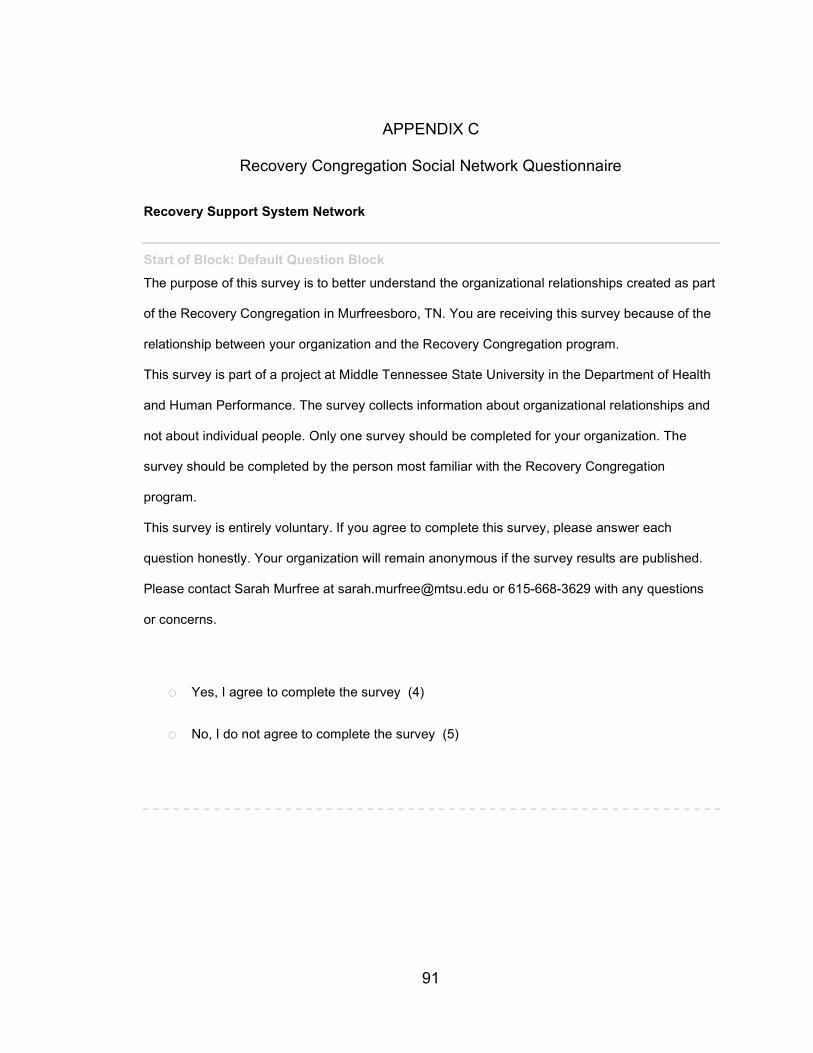
91
APPENDIX C
Recovery Congregation Social Network Questionnaire
Recovery Support System Network
Start of Block: Default Question Block
The purpose of this survey is to better understand the organizational relationships created as part
of the Recovery Congregation in Murfreesboro, TN. You are receiving this survey because of the
relationship between your organization and the Recovery Congregation program.
This survey is part of a project at Middle Tennessee State University in the Department of Health
and Human Performance. The survey collects information about organizational relationships and
not about individual people. Only one survey should be completed for your organization. The
survey should be completed by the person most familiar with the Recovery Congregation
program.
This survey is entirely voluntary. If you agree to complete this survey, please answer each
question honestly. Your organization will remain anonymous if the survey results are published.
Please contact Sarah Murfree at [email protected] or 615-668-3629 with any questions
or concerns.
o Yes, I agree to complete the survey (4)
o No, I do not agree to complete the survey (5)
92
Are you age 18 years or older?
o Yes (1)
o No (2)
Optional - Provide your name and email address for further follow-up.
________________________________________________________________
Select your organization from the list:
Page Break
Section 1: General Information about the Recovery Congregation
Page Break
Please indicate what your organization contributes to the Recovery Congregation in
Murfreesboro, TN (choose as many as apply).
▢ Funding/ Donations or Paid Staff (1)
93
▢ In-Kind Resources (e.g., meeting space) (2)
▢ Volunteers and Volunteer staff (3)
▢ Specific health expertise (4)
▢ Expertise an area other than in health (5)
▢ Community connections (6)
▢ Send and/or receive referrals (7)
▢ Facilitation/Leadership (8)
▢ Advocacy (including raising awareness) (9)
▢ Other contribution (10) ________________________________________________
▢ I am not familiar with Recovery Congregation (11)
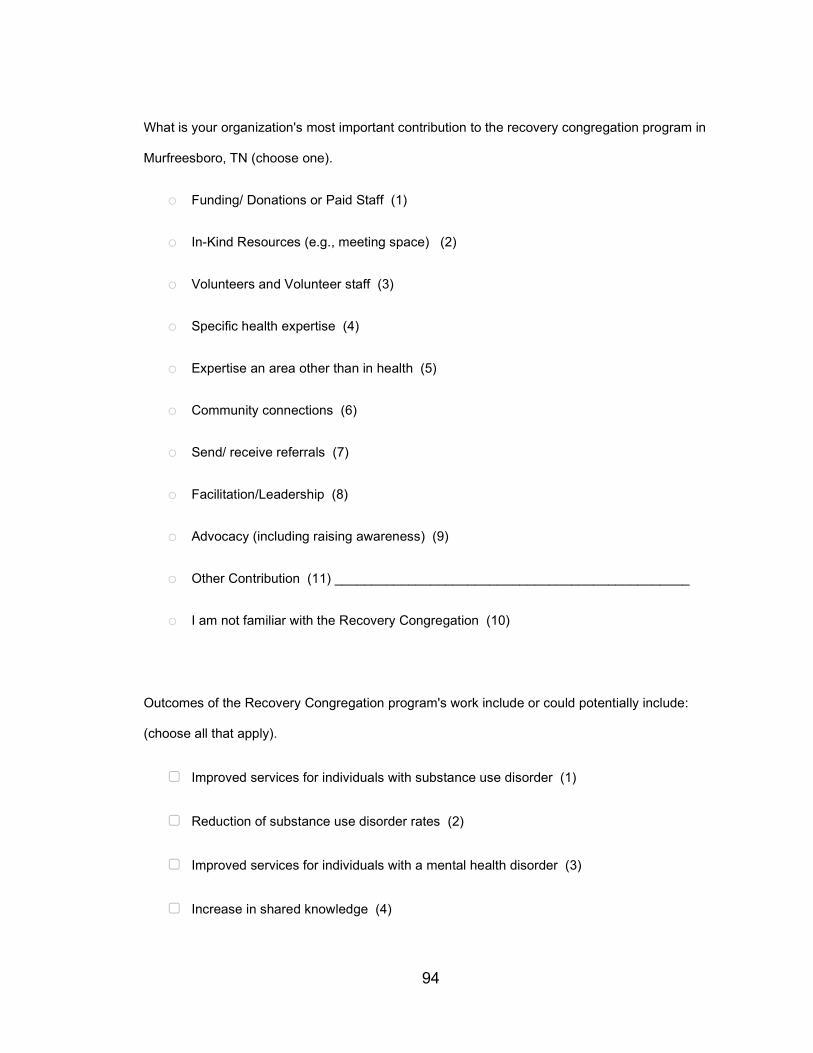
94
What is your organization's most important contribution to the recovery congregation program in
Murfreesboro, TN (choose one).
o Funding/ Donations or Paid Staff (1)
o In-Kind Resources (e.g., meeting space) (2)
o Volunteers and Volunteer staff (3)
o Specific health expertise (4)
o Expertise an area other than in health (5)
o Community connections (6)
o Send/ receive referrals (7)
o Facilitation/Leadership (8)
o Advocacy (including raising awareness) (9)
o Other Contribution (11) ________________________________________________
o I am not familiar with the Recovery Congregation (10)
Outcomes of the Recovery Congregation program's work include or could potentially include:
(choose all that apply).
▢ Improved services for individuals with substance use disorder (1)
▢ Reduction of substance use disorder rates (2)
▢ Improved services for individuals with a mental health disorder (3)
▢ Increase in shared knowledge (4)
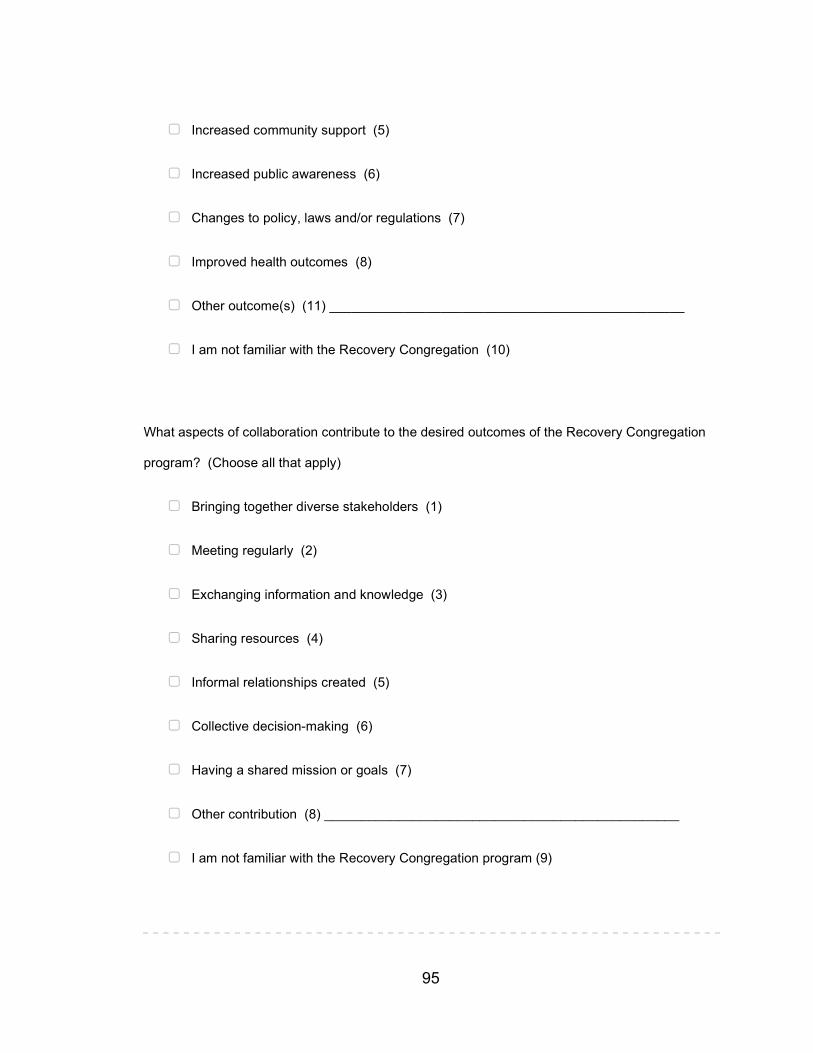
95
▢ Increased community support (5)
▢ Increased public awareness (6)
▢ Changes to policy, laws and/or regulations (7)
▢ Improved health outcomes (8)
▢ Other outcome(s) (11) ________________________________________________
▢ I am not familiar with the Recovery Congregation (10)
What aspects of collaboration contribute to the desired outcomes of the Recovery Congregation
program? (Choose all that apply)
▢ Bringing together diverse stakeholders (1)
▢ Meeting regularly (2)
▢ Exchanging information and knowledge (3)
▢ Sharing resources (4)
▢ Informal relationships created (5)
▢ Collective decision-making (6)
▢ Having a shared mission or goals (7)
▢ Other contribution (8) ________________________________________________
▢ I am not familiar with the Recovery Congregation program (9)
96
Do you have any additional comments about the Recovery Congregation program?
________________________________________________________________
Page Break
Section 2 - Organizational Relationships
Page Break
Since January 1, 2019, how frequently has your organization worked with the Recovery
Congregation on any activities related to their Recovery Congregation program?
o Not applicable; this is my organization (1)
o Never/We only interact on issues unrelated to the recovery friendly congregation program
(2)
o Once a year or less (3)
o About once a quarter (4)
o About once a month (5)
o Every or almost every week (6)
o Every or almost every day (7)
97
What kinds of activities does your relationship with the Recovery Congregation entail related to
the Recovery Congregation program? (Choose all that apply)?
▢ None (1)
▢ Exchanging information and/or attending meetings together related to the Recovery
Congregation program. (2)
▢ Jointly planning, coordinating, or implementing an activity, training, event, or other
program; and/or intentional efforts to enhance each other's capacity for the benefit of the
Recovery Congregation program. (3)
▢ Implementing services together such as sending referrals to or receiving referrals from
the Recovery Congregation program. (4)
▢ A written agreement is in place to define the relationship for the benefit of the Recovery
Congregation program. (5)
98
Since January 1, 2019, how frequently has your organization worked with Recovery Congregation
program on any other activity?
o Never (1)
o Once a year or less (2)
o About once a quarter (3)
o About once a month (4)
o Every or almost every week (5)
o Every or almost every day (6)
Page Break
99
Since January 1, 2019, how frequently has your organization worked with <<Organization 1 to
16>> on any activities related to the Recovery Congregation program?
o Not applicable; this is my organization (1)
o Never/We only interact on issues unrelated to the recovery congregation program (2)
o Once a year or less (3)
o About once a quarter (4)
o About once a month (5)
o Every or almost every week (6)
o Every or almost every day (7)
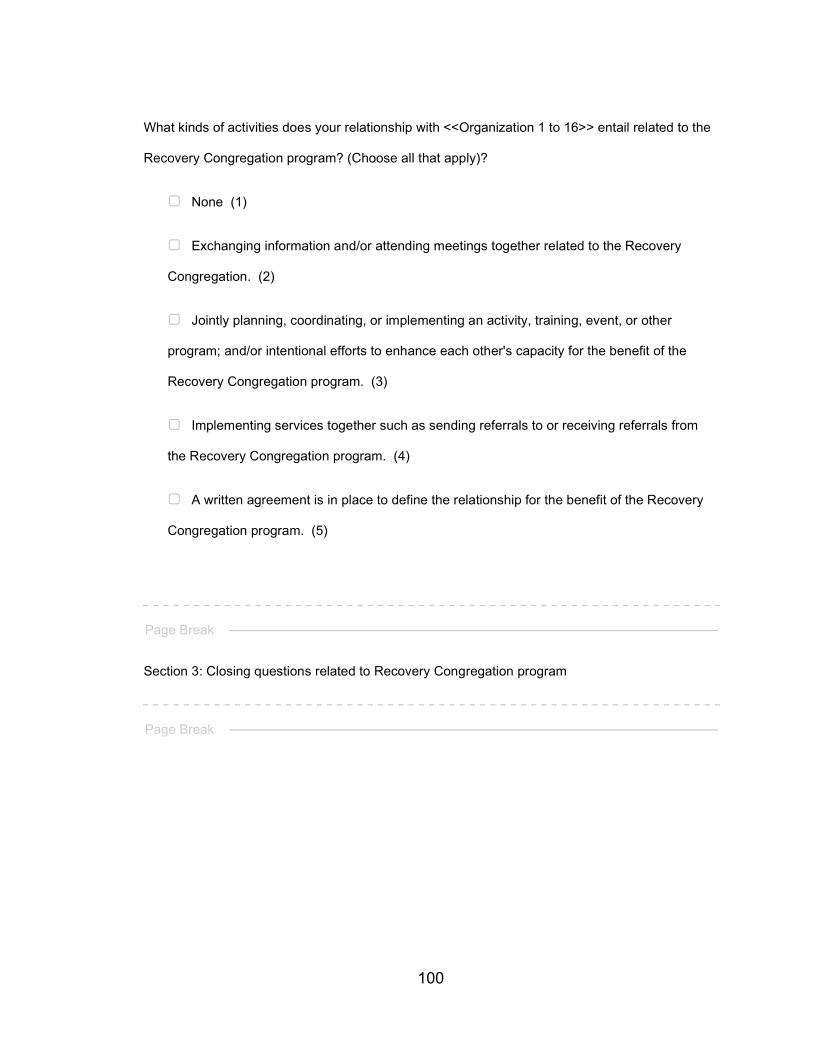
100
What kinds of activities does your relationship with <<Organization 1 to 16>> entail related to the
Recovery Congregation program? (Choose all that apply)?
▢ None (1)
▢ Exchanging information and/or attending meetings together related to the Recovery
Congregation. (2)
▢ Jointly planning, coordinating, or implementing an activity, training, event, or other
program; and/or intentional efforts to enhance each other's capacity for the benefit of the
Recovery Congregation program. (3)
▢ Implementing services together such as sending referrals to or receiving referrals from
the Recovery Congregation program. (4)
▢ A written agreement is in place to define the relationship for the benefit of the Recovery
Congregation program. (5)
Page Break
Section 3: Closing questions related to Recovery Congregation program
Page Break
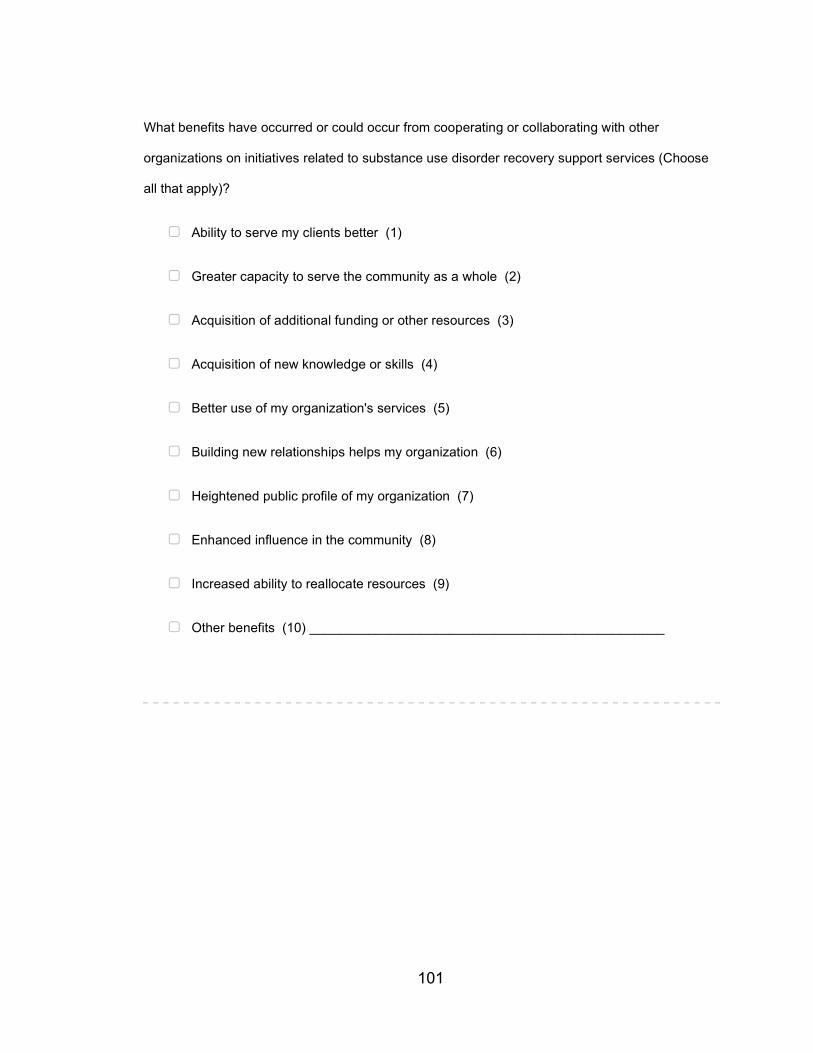
101
What benefits have occurred or could occur from cooperating or collaborating with other
organizations on initiatives related to substance use disorder recovery support services (Choose
all that apply)?
▢ Ability to serve my clients better (1)
▢ Greater capacity to serve the community as a whole (2)
▢ Acquisition of additional funding or other resources (3)
▢ Acquisition of new knowledge or skills (4)
▢ Better use of my organization's services (5)
▢ Building new relationships helps my organization (6)
▢ Heightened public profile of my organization (7)
▢ Enhanced influence in the community (8)
▢ Increased ability to reallocate resources (9)
▢ Other benefits (10) ________________________________________________
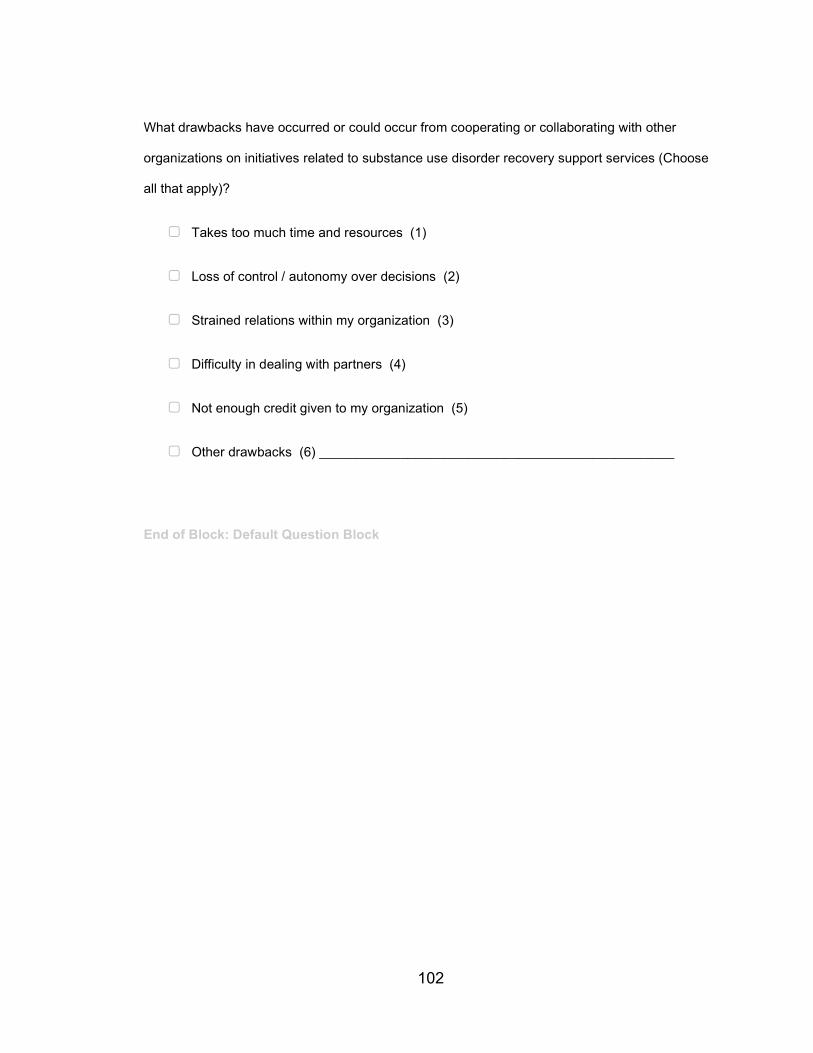
102
What drawbacks have occurred or could occur from cooperating or collaborating with other
organizations on initiatives related to substance use disorder recovery support services (Choose
all that apply)?
▢ Takes too much time and resources (1)
▢ Loss of control / autonomy over decisions (2)
▢ Strained relations within my organization (3)
▢ Difficulty in dealing with partners (4)
▢ Not enough credit given to my organization (5)
▢ Other drawbacks (6) ________________________________________________
End of Block: Default Question Block
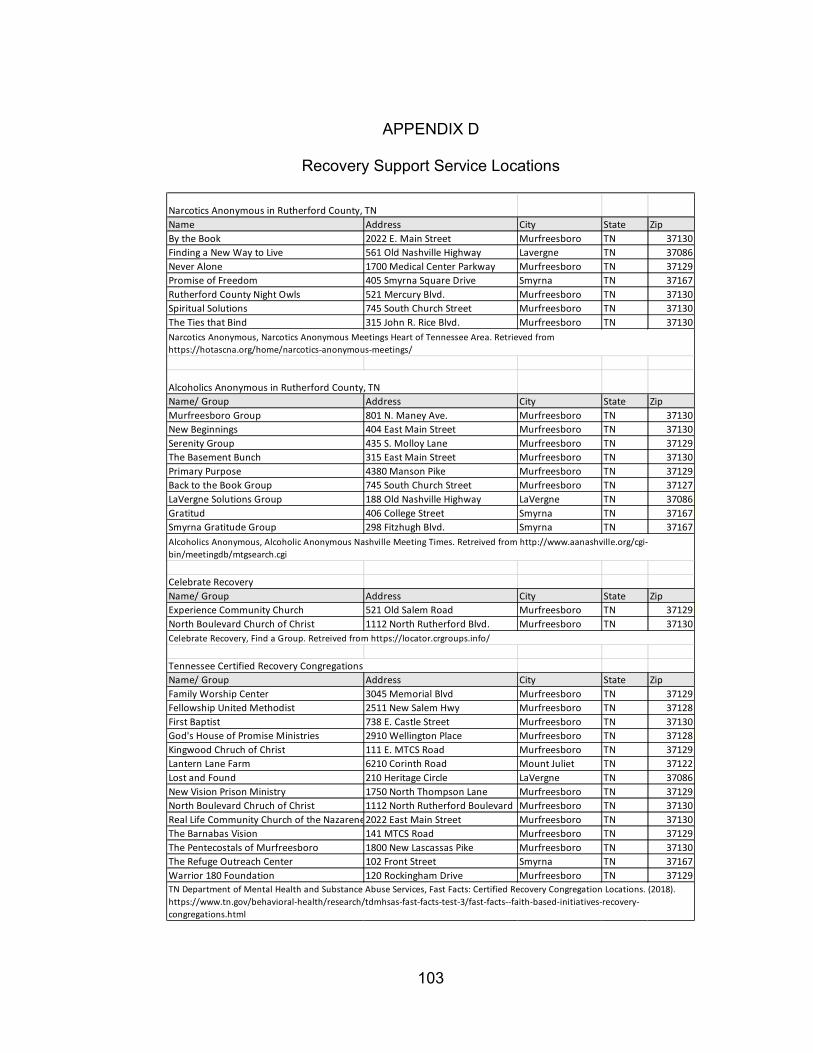
103
APPENDIX D
Recovery Support Service Locations
Narcotics Anonymous in Rutherford County, TN Name Address City State ZipBy the Book 2022 E. Main Street Murfreesboro TN 37130Finding a New Way to Live 561 Old Nashville Highway Lavergne TN 37086Never Alone 1700 Medical Center Parkway Murfreesboro TN 37129Promise of Freedom 405 Smyrna Square Drive Smyrna TN 37167Rutherford County Night Owls 521 Mercury Blvd. Murfreesboro TN 37130Spiritual Solutions 745 South Church Street Murfreesboro TN 37130The Ties that Bind 315 John R. Rice Blvd. Murfreesboro TN 37130
Alcoholics Anonymous in Rutherford County, TN Name/ Group Address City State ZipMurfreesboro Group 801 N. Maney Ave. Murfreesboro TN 37130New Beginnings 404 East Main Street Murfreesboro TN 37130Serenity Group 435 S. Molloy Lane Murfreesboro TN 37129The Basement Bunch 315 East Main Street Murfreesboro TN 37130Primary Purpose 4380 Manson Pike Murfreesboro TN 37129Back to the Book Group 745 South Church Street Murfreesboro TN 37127LaVergne Solutions Group 188 Old Nashville Highway LaVergne TN 37086Gratitud 406 College Street Smyrna TN 37167Smyrna Gratitude Group 298 Fitzhugh Blvd. Smyrna TN 37167
Celebrate Recovery Name/ Group Address City State ZipExperience Community Church 521 Old Salem Road Murfreesboro TN 37129North Boulevard Church of Christ 1112 North Rutherford Blvd. Murfreesboro TN 37130
Tennessee Certified Recovery Congregations Name/ Group Address City State ZipFamily Worship Center 3045 Memorial Blvd Murfreesboro TN 37129Fellowship United Methodist 2511 New Salem Hwy Murfreesboro TN 37128First Baptist 738 E. Castle Street Murfreesboro TN 37130God's House of Promise Ministries 2910 Wellington Place Murfreesboro TN 37128Kingwood Chruch of Christ 111 E. MTCS Road Murfreesboro TN 37129Lantern Lane Farm 6210 Corinth Road Mount Juliet TN 37122Lost and Found 210 Heritage Circle LaVergne TN 37086New Vision Prison Ministry 1750 North Thompson Lane Murfreesboro TN 37129North Boulevard Chruch of Christ 1112 North Rutherford Boulevard Murfreesboro TN 37130Real Life Community Church of the Nazarene2022 East Main Street Murfreesboro TN 37130The Barnabas Vision 141 MTCS Road Murfreesboro TN 37129The Pentecostals of Murfreesboro 1800 New Lascassas Pike Murfreesboro TN 37130The Refuge Outreach Center 102 Front Street Smyrna TN 37167Warrior 180 Foundation 120 Rockingham Drive Murfreesboro TN 37129
Narcotics Anonymous, Narcotics Anonymous Meetings Heart of Tennessee Area. Retrieved from https://hotascna.org/home/narcotics-anonymous-meetings/
Alcoholics Anonymous, Alcoholic Anonymous Nashville Meeting Times. Retreived from http://www.aanashville.org/cgi-bin/meetingdb/mtgsearch.cgi
TN Department of Mental Health and Substance Abuse Services, Fast Facts: Certified Recovery Congregation Locations. (2018). https://www.tn.gov/behavioral-health/research/tdmhsas-fast-facts-test-3/fast-facts--faith-based-initiatives-recovery-congregations.html
Celebrate Recovery, Find a Group. Retreived from https://locator.crgroups.info/
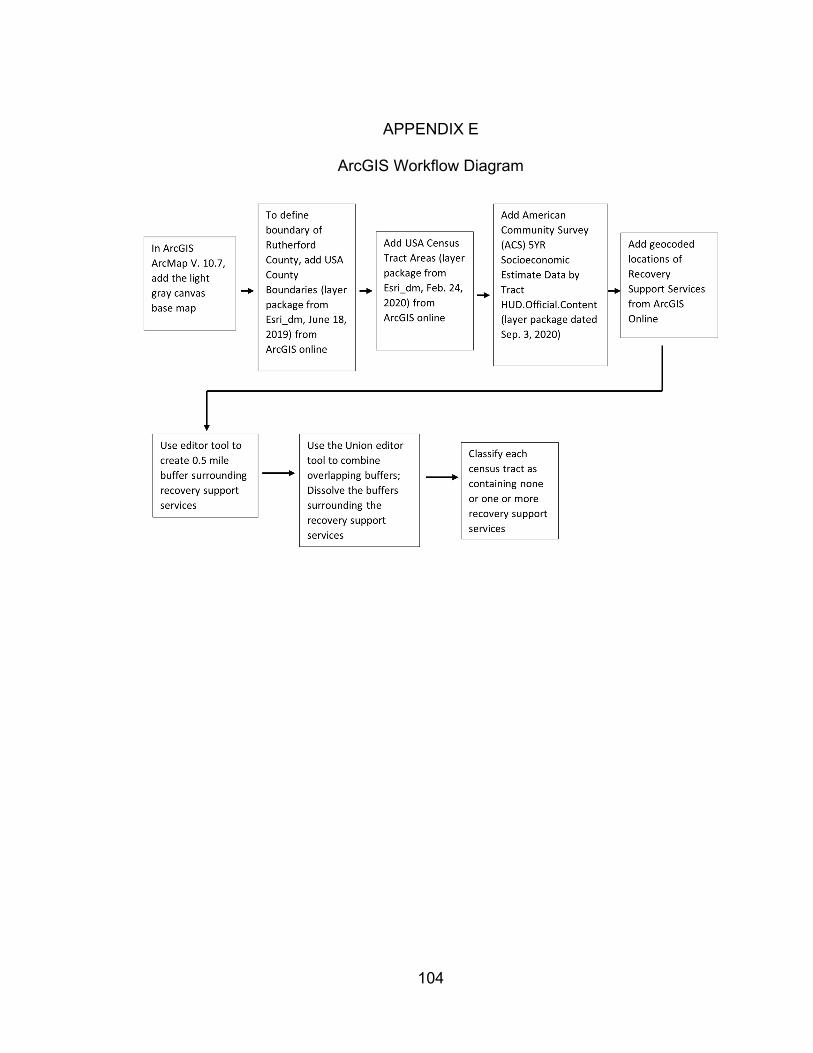
104
APPENDIX E
ArcGIS Workflow Diagram
Related Documents