Sustainability performance of organic and conventional farming systems in Kenya: Murang’a, Kirinyaga and Machakos Counties DISSERTATION zur Erlangung des Grades Doktor der Agrarwissenschaften (Dr. Agr.) der Landwirtschaftlichen Fakultät der Rheinischen Friedrich-Wilhelms-Universität Bonn von John Mwaniki Ndungu aus Kiambu, Kenya Bonn 2022

Welcome message from author
This document is posted to help you gain knowledge. Please leave a comment to let me know what you think about it! Share it to your friends and learn new things together.
Transcript
Sustainability performance of organic and conventional
farming systems in Kenya:
Murang’a, Kirinyaga and Machakos Counties
DISSERTATION
zur Erlangung des Grades
Doktor der Agrarwissenschaften (Dr. Agr.)
der Landwirtschaftlichen Fakultät
der Rheinischen Friedrich-Wilhelms-Universität Bonn
von
John Mwaniki Ndungu
aus
Kiambu, Kenya
Bonn 2022
ii
Referent: Prof. Dr. Christian Borgemeister
Koreferent: Dr. Christian Schrader
Tag der mündlichen Prüfung: 2. November 2021
Angefertigt mit Genehmigung der Landwirtschaftlichen Fakultät der Universität Bonn
iii
Acknowledgment
I express my gratitude to my supervisor Prof. Dr. Christian Borgemeister, for his highly
valuable guidance and scientific advice during the study. My gratitude extends to my doctoral
co-advisor, Dr. Christian Schader (FiBL) for his guidance and insight into this research. I thank
my tutors Dr. Oliver Kirui and Dr. Lisa Biber-Freudenberger from the Center for Development
Research (ZEF) for their research recommendations, inspiration and encouragement. My
sincere gratitude goes to the doctoral program team at ZEF especially to Dr. Günther Manske
and Mrs. Maike Retat-Amin for a well-organized and smooth stay in ZEF, Bonn and Germany.
I appreciate the team from the Research Institute of Organic Agriculture (FiBL), in particular,
Dr. Irene Kazdere the overall ProEcoAfrica and OFSA project coordinator, for the smooth
running of the research activities. I am also grateful to Mr. Johan Blockeel, Miss. Anja
Heidenreich and Mr. Bernhard Schlatter, all from FiBL, for their support and advice on
research and data collection and management guidance. I appreciate Dr. Anne W. Muriuki, the
Centre Director, KALRO Food Crops Research Centre, Kabete and ProEcoAfrica project
Kenya Country Coordinator, for inspiration and guidance in this research. I also appreciate Dr.
Rahab W. Muinga and Dr. Lusike Wasilwa for their encouragement and mentorship.
Funding for this study was made available by the Dutch Humanist Institute for Cooperation
with Developing Countries (Hivos), the Swiss Agency for Development and Co-operation
(SDC) and the Mercator Foundation Switzerland through the ProEcoAfrica and OFSA projects
(www.proecoafrica.net) led by the Research Institute of Organic Agriculture (FiBL), Frick,
Switzerland. I also acknowledge the German Federal Ministry of Education and Research
(BMBF), and the University of Bonn for its administrative support during my stay in Germany.
I am grateful to Dr. Eliud Kireger, the Director General, Kenya Agricultural and Livestock
Research Organization (KALRO) for logistical support. I appreciate the International Centre
of Insect Physiology and Ecology (ICIPE) for their collaboration in the overall
ProEcoAfrica/OFSA research in Kenya and the Project Advisory Committee for their overall
guidance to the project.
Finally, I express my sincere thanks to farmers in Murang’a, Kirinyaga and Machakos counties,
who willingly participated in this study. Thanks to the enumerators who were part of the team
on data collection. I thank my ZEF colleagues and friends who tirelessly supported and inspired
me during the study. I am grateful to my family for the care, support and sharing my difficult
moments. Above all, I am grateful to the Almighty God for making this journey possible.
iv
Table of Contents
Acknowledgment ..................................................................................................................... iii
Table of Contents ...................................................................................................................... iv
List of Tables ...........................................................................................................................vii
List of Figures ........................................................................................................................... ix
Abbreviations/ Acronyms .......................................................................................................... x
Abstract ..................................................................................................................................... xi
Zusammenfassung.................................................................................................................. xiii
1. Chapter General information ............................................................................................... 1
Motivation ........................................................................................................................ 1
1.2 Organic farming in Africa ................................................................................................ 2
1.2.1 Organic farming defined ............................................................................................. 2
1.2.2 Farming systems in Kenya .......................................................................................... 3
1.2.3 Organic farming in Kenya ........................................................................................... 5
1.2.4 Organic markets and certification in Kenya ................................................................ 5
1.3 Sustainability concepts and assessment ........................................................................... 7
1.3.1 Definitions of sustainability ........................................................................................ 7
1.3.2 Methods for sustainability assessments of agriculture ................................................ 8
1.4 Research questions and objectives, and outline of the thesis......................................... 13
1.4.1 Research questions and objectives ............................................................................ 13
1.4.2 Structure of the dissertation....................................................................................... 15
1.5 Methodology .................................................................................................................. 15
1.5.1 Description of the study area ..................................................................................... 15
1.5.2 County descriptions ................................................................................................... 18
1.5.3 Farm Selection for the study ..................................................................................... 19
2. Chapter : Productivity and profitability in organic and conventional farming systems in
Kenya ....................................................................................................................................... 21
2.1 Introduction .................................................................................................................... 21
2.2 Literature review ............................................................................................................ 23
2.2.1 Comparative assessments of productivity (yield) in organic and conventional farms
23
2.2.2 Comparative evaluations of profitability in organic and conventional farms ........... 25
2.3 Methodology .................................................................................................................. 26
2.3.1 Study area and data ................................................................................................... 26
2.3.2 Analytical approach................................................................................................... 28
v
2.4 Results and discussion ................................................................................................... 33
2.4.1 Descriptive statistics (farm characteristics)............................................................... 33
2.4.2 Crop yields ................................................................................................................ 35
2.4.3 Farm profits ............................................................................................................... 36
2.4.4 Determinants of yields: do farming systems matter? ................................................ 43
2.4.5 Determinants of profitability: does the farming system matter? ............................... 45
2.4.6 Effects of the farming system on yields: Results from the PSM approach ............... 48
2.4.7 Effects of the farming system on profits: Results from the PSM approach .............. 49
2.4.8 Robustness checks for PSM estimations ................................................................... 51
2.5 Conclusion ..................................................................................................................... 55
3. Chapter : Sustainability performance of smallholder organic and conventional farms in
Kenya ....................................................................................................................................... 57
3.1 Introduction .................................................................................................................... 57
3.2 Methodology .................................................................................................................. 59
3.3 Results ............................................................................................................................ 70
3.3.1 Environmental integrity............................................................................................. 70
3.3.2 Economic Resilience ................................................................................................. 76
3.3.3 Social well-being ....................................................................................................... 82
3.3.4 Governance................................................................................................................ 87
3.4 Discussion ...................................................................................................................... 92
3.5 Conclusions .................................................................................................................... 98
4. Chapter : Farmer's perceptions and suggestions of intervention measures to address
sustainability gaps in Kenya .................................................................................................. 100
4.1 Introduction .................................................................................................................. 100
4.2 Literature review .......................................................................................................... 101
4.3 Methodology ................................................................................................................ 103
4.3.1 Research design and approach ................................................................................ 103
4.3.2 Analytical approach................................................................................................. 108
4.4 Results and discussion ................................................................................................. 111
4.4.1 Evaluation of performance and key gaps ................................................................ 112
4.4.2 Farmers' suggestions for improvement measures ................................................... 113
4.4.3 Constraints/challenges (Investigation of the problems that need to be overcome) . 118
4.4.4 Interventions and strategies discussed and recommended by farmers .................... 123
4.5 Limitations to the study ............................................................................................... 133
4.6 Conclusions .................................................................................................................. 135
vi
5. Chapter: Research Synthesis and Conclusions ................................................................ 138
5.1 Summary of the study .................................................................................................. 138
5.1.1 Productivity and profitability in organic and conventional farming systems in Kenya
139
5.1.2 Sustainability performance of organic and conventional smallholder farms in Kenya
139
5.1.3 Farmers’ perceptions of intervention measures to address sustainability gaps in
Kenya 142
5.2 Synthesis summary of the objectives/ Chapters........................................................... 143
5.3 Recommendations for both organic and conventional systems ................................... 144
5.4 Further research ........................................................................................................... 146
Bibliography .......................................................................................................................... 148
Annexes.................................................................................................................................. 171
Annex 1: Schematic SMART data verification process (Source: FiBL) ............................ 171
Annex 2: Calculation of a goal achievement score: Example of capacity development .... 171
Annex 3: The 58 Sub-themes and sub-theme objectives .................................................... 172
Annex 4. Median Boxplot graph data ................................................................................. 175
Annex 5: Means of degree of goal achievement for each sub-theme by farming system and
significance levels in t-test P-values, and mean ranking through Mann Whitney U test ... 178
Annex 6: Mixed effect regression model ........................................................................... 181
Annex 7: Indicators system, county, significant level of indicator scores for the system and
interaction effects ............................................................................................................... 183
Annex 8: Indicator system and county significant level of indicator scores for the system
and interaction effects ......................................................................................................... 192
Annex 9: Comparing organic and conventional at sub-theme and county level ................ 207
Annex 10: Key message points for farmer feedback workshops ....................................... 211
Annex 11: Program developed for the farmer feedback meeting ....................................... 212
Annex 12 : In-depth Farmer Workshop .............................................................................. 213
Annex 13: The dimension, themes and subthemes with low degree of goal achievement in
the three counties (frequency n) ......................................................................................... 217
Annex 14: List of challenges discussed with farmers ........................................................ 218
vii
List of Tables
Table 1.3-1: A summary list of sustainability assessment tools ................................................ 9
Table 1.5-1: Characteristics of the study sites ......................................................................... 17
Table 1.5-2: Sample frame of farmers and final selection ....................................................... 20
Table 3.4-1: Sampling frame of organic and conventional farmers in the study areas ........... 27
Table 3.4-2: Variables used in the empirical model ................................................................ 31
Table 3.5-1: Socio-economic and farm characteristics of organic and conventional farms
(sample mean) .......................................................................................................................... 33
Table 3.5-2: Percentage of farms having crop by County and farming system ....................... 34
Table 3.5-3: Mean yield (Quantity in kg per ha) for the 10 key crops overall and in each
County ...................................................................................................................................... 37
Table 3.5-4: Total Costs (KES) per ha for the 10 Key crops overall and in each County....... 39
Table 3.5-5: Total Revenue in KES per ha for the 10 Key crops overall and in each County 40
Table 3.5-6: Total Profit in KES per ha for the 10 Key crops overall and in each County ..... 42
Table 3.5-7: Determinants of yields using OLS for selected ten crops ................................... 44
Table 3.5-8: Determinants of Profits using OLS for selected ten crops .................................. 47
Table 3.5-9: Effect of farming system on yields of selected crops .......................................... 48
Table 3.5-10: Effect of farming system on profits of selected crops ....................................... 50
Table 3.5-11: Test for Quality of Matches and Sensitivity Analysis ....................................... 53
Table 3.2-1: Farms sampled in the survey instrument used for data collection ...................... 60
Table 3.2-2: Selected Sub-themes and their objectives for the deeper analysis ...................... 69
Table 3.3-1:Sub-theme and the degree of achievement scores (%) comparing differences
between system, county, system and county with standard error margin ................................ 72
Table 3.3-2: Indicators and the degree of achievement scores (%) comparing the differences
between farming systems with standard error margin ............................................................. 73
Table 3.3-3: Indicators and the degree of achievement scores (%) comparing differences
between farming systems with standard error margin ............................................................. 74
Table 3.3-4: Indicators and the degree of achievement scores (%) comparing the differences
between farming systems with standard error margin ............................................................. 76
Table 3.3-5: Sub-theme and the degree of achievement scores (%) comparing differences
between system, county, system and county with standard error margin ................................ 78
Table 3.3-6: Indicators and the degree of achievement scores (%) comparing the differences
between farming systems with standard error margin ............................................................. 79
viii
Table 3.3-7: Indicators and the degree of achievement scores (%) comparing the differences
between farming systems with standard error margin ............................................................. 80
Table 3.3-8: Indicators and the degree of achievement scores (%) comparing the differences
between farming systems with standard error margin ............................................................. 81
Table 3.3-9: Sub-theme and the degree of achievement scores (%) comparing differences
between system, county, system and county with standard error margin ................................ 84
Table 3.3-10: Indicators and the degree of achievement scores (%) comparing the differences
between farming systems with standard error margin ............................................................. 85
Table 3.3-11: Indicators and the degree of achievement scores (%) comparing the differences
between farming systems with standard error margin ............................................................. 85
Table 3.3-12: Indicators and the degree of achievement scores (%) comparing the differences
between farming systems with standard error margin ............................................................. 86
Table 3.3-13: Sub-theme and the degree of achievement scores (%) comparing differences
between system, county, system and county with standard error margin ................................ 90
Table 3.3-14: Indicators and the degree of achievement scores (%) comparing the differences
between farming systems with standard error margin ............................................................. 91
Table 3.3-15: Indicators and the degree of achievement scores (%) comparing the differences
between farming systems with standard error margin ............................................................. 92
Table 3.3-16: Indicators and the degree of achievement scores (%) comparing the differences
between farming systems with standard error margin ............................................................. 92
Table 4.3-1: Research design and approach used in farmer perception study ....................... 103
Table 4.3-2: List of key areas for farmer discussion for each sustainability dimension. ...... 105
Table 4.3-3: Participating farmers who attended the farmer feedback workshops ................ 105
Table 4.3-4: participants to the in-depth farmer discussion groups in the three counties ..... 107
Table 4.4-1: Improvement measures, reasons for low adoption, the requirement to stimulate
adoption by farmers and strategies ........................................................................................ 129
Table 4.4-2: Implementation of improvement measures at all sites ...................................... 133
ix
List of Figures
Figure 1.5-1: Map of Kenya showing study counties .............................................................. 16
Figure 3.4-1: Schematic of data collection and verification/correction process (Source: FiBL)
.................................................................................................................................................. 28
Figure 3.5-1: Propensity score distribution and common support for propensity score
estimation ................................................................................................................................. 52
Figure 3.2-1: Summary of the dimension, themes, sub-themes and indicators of the
Sustainability Assessment of Food and Agriculture Systems guidelines. Source FAO, (2013)
.................................................................................................................................................. 64
Figure 3.3-1: Environmental integrity sub-theme median values for organic vs. conventional
(x: mean, -: median) ................................................................................................................. 70
Figure 3.3-2: Economic resilience sub-theme median values for organic vs. conventional (x:
mean, -: median) ...................................................................................................................... 77
Figure 3.3-3: Social well-being sub-theme median values for organic vs. conventional (x:
mean, -: median) ...................................................................................................................... 82
Figure 3.3-4: Governance sub-theme median values for organic vs. conventional (x: mean, -:
median) .................................................................................................................................... 88
Figure 3.4-1: Share of farms applying compost per case study ............................................... 96
Figure 3.4-2: Share of farms applying pesticides that are highly persistent in water ............. 96
Figure 3.4-3: Training in the use of plant protection products ................................................ 98
Figure 4.3-1: Steps in the analytical approach borrowing from (Harvey &Holmes, 2012;
Potter et al 2004; Olsen 2019). .............................................................................................. 109
Figure 4.4-1: Percentage share of farmers within a case study with unacceptable scores per
sub-theme ............................................................................................................................... 113
Figure 4.4-2: Potential intervention areas (solutions) expressed as the number of participants
taking part in the discussions (low, average and high) .......................................................... 123
Figure 5.1-1: Mineral N usage in terms of Kg/ha is computed based on the fertilizer types and
quantities entered by the enumerators.................................................................................... 141
Figure 5.1-2: Mineral P usage in terms of Kg/ha is computed based on the fertilizer types and
quantities entered by the enumerators.................................................................................... 141
x
Abbreviations/ Acronyms
AESIS Agro-Environmental Sustainability Information System
APOLA-NOVORURAL The System for Weighted Environmental Impact Assessment of Rural
Activities
ARBRE Arbre de l’Exploitation Agricole Durable (The tree of sustainable farming)
AVIBIO AVIculture BIOlogique (A program for evaluating requirements that meets
increasing demand for organic poultry towards sustainable production)
BMBF German Federal Ministry of Education and Research
COSA Committee on Sustainability Assessment
DELTA An Integrated Indicator-Based Self-Assessment Tool for the Evaluation of
Dairy Farms Sustainability
DSI Dairyman Sustainability Index
DSR Driving Force State Response
FiBL Forschungsinstitut für Biologischen Landbau (Research Institute of Organic
Agriculture)
GAP Good Agricultural Practices
Hivos Humanistisch Instituut voor Ontwikkelingssamenwerking (Dutch Humanist
Institute for Cooperation with Developing Countries)
IBM SPSS Statistical Package for the Social Sciences
ICIPE International Centre of Insect Physiology and Ecology
IDEA Indicateur de Durabilité des Exploitations Agricoles (farm sustainability
indicators
ISAP Indicator of Sustainable Agricultural Practice
KALRO Kenya Agricultural and Livestock Research Organization
LCA Life Cycle Assessment
MAUT Multi-Attribute Utility Theory
MESMIS Marco de Evaluacion de Sistemas de Manejo incorporando Indicadores de
Sustentabilidade (Framework for Assessing the Sustainability of Natural
Resource Management Systems)
MMF Multiscale Methodological Framework
MOTIFS Monitoring Tool for Integrated Farm Sustainability
OFSA Organic Farming System Africa
PAC Project Advisory Committee
PG Public Goods Tool
RAD Réseau d'Agriculture Durable (Sustainable agriculture network)
RISE Response-Inducing Sustainability Evaluation 2.0
SAT Sustainability Assessment tool
SAFA Sustainability Assessment of Food and Agriculture Systems
SAFE Sustainability Assessment of Farming and the Environment
SDC Swiss Agency for Development and Co-operation
SMART Sustainability Monitoring and Assessment RouTine
ZEF Zentrum für Entwicklungsforschung (Center for Development Research,
University of Bonn)
xi
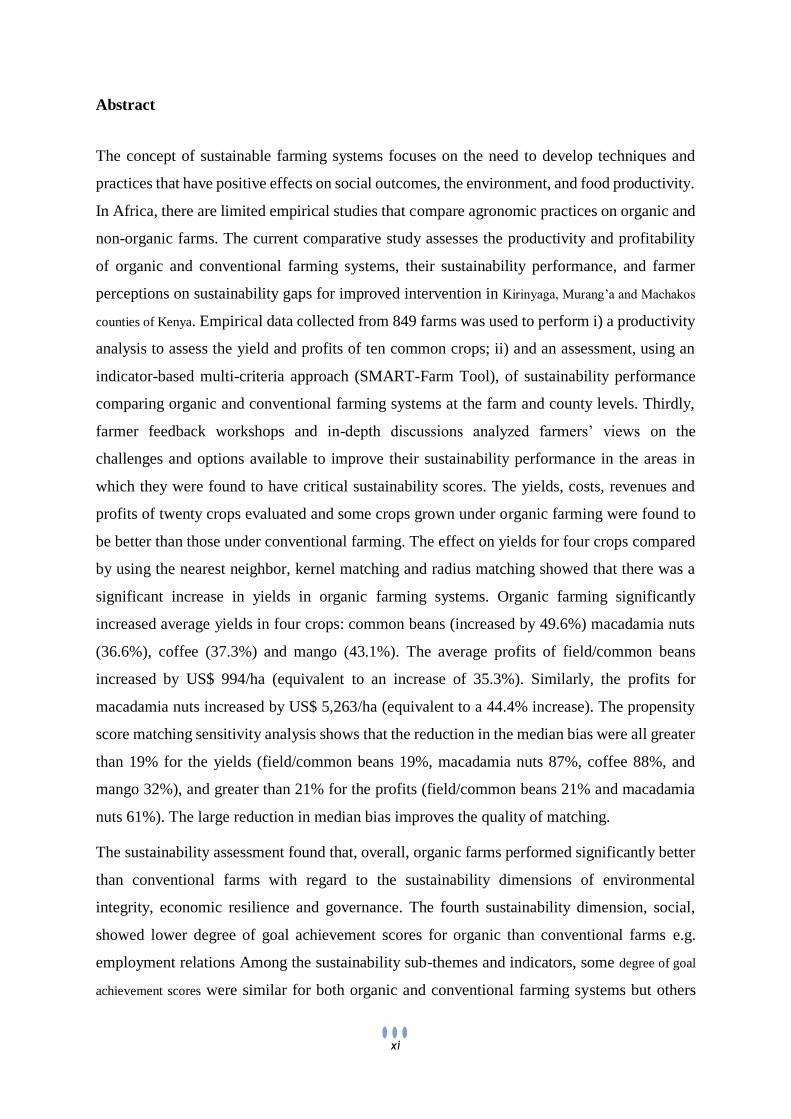
Abstract
The concept of sustainable farming systems focuses on the need to develop techniques and
practices that have positive effects on social outcomes, the environment, and food productivity.
In Africa, there are limited empirical studies that compare agronomic practices on organic and
non-organic farms. The current comparative study assesses the productivity and profitability
of organic and conventional farming systems, their sustainability performance, and farmer
perceptions on sustainability gaps for improved intervention in Kirinyaga, Murang’a and Machakos
counties of Kenya. Empirical data collected from 849 farms was used to perform i) a productivity
analysis to assess the yield and profits of ten common crops; ii) and an assessment, using an
indicator-based multi-criteria approach (SMART-Farm Tool), of sustainability performance
comparing organic and conventional farming systems at the farm and county levels. Thirdly,
farmer feedback workshops and in-depth discussions analyzed farmers’ views on the
challenges and options available to improve their sustainability performance in the areas in
which they were found to have critical sustainability scores. The yields, costs, revenues and
profits of twenty crops evaluated and some crops grown under organic farming were found to
be better than those under conventional farming. The effect on yields for four crops compared
by using the nearest neighbor, kernel matching and radius matching showed that there was a
significant increase in yields in organic farming systems. Organic farming significantly
increased average yields in four crops: common beans (increased by 49.6%) macadamia nuts
(36.6%), coffee (37.3%) and mango (43.1%). The average profits of field/common beans
increased by US$ 994/ha (equivalent to an increase of 35.3%). Similarly, the profits for
macadamia nuts increased by US$ 5,263/ha (equivalent to a 44.4% increase). The propensity
score matching sensitivity analysis shows that the reduction in the median bias were all greater
than 19% for the yields (field/common beans 19%, macadamia nuts 87%, coffee 88%, and
mango 32%), and greater than 21% for the profits (field/common beans 21% and macadamia
nuts 61%). The large reduction in median bias improves the quality of matching.
The sustainability assessment found that, overall, organic farms performed significantly better
than conventional farms with regard to the sustainability dimensions of environmental
integrity, economic resilience and governance. The fourth sustainability dimension, social,
showed lower degree of goal achievement scores for organic than conventional farms e.g.
employment relations Among the sustainability sub-themes and indicators, some degree of goal
achievement scores were similar for both organic and conventional farming systems but others
xii
lower for organic. The study identified sustainability challenges among the smallholder farms
that need to be addressed. The challenges of high importance facing both organic and
conventional farmers in the study area can be summarized as; limitations to technical and
physical inputs, market-related challenges, agronomic skills and limited institutional support.
The intervention areas and strategies suggested by farmers included biodiversity conservation,
water resource use and management, soil fertility management, farmer group establishment
and maintenance, diversification and alternative markets, and record keeping. Other strategies
suggested by farmers included capacity development and public health and safety measures.
The low indicator and sub-theme scores found in the sustainability assessment need to be
addressed. The identified constraints in the sustainability assessment can be addressed by
improving farming practices in both organic and conventional farming systems, such as by
enhancing farmers’ knowledge in correct use of synthetic fertilizers and manure, and correct
use of plant protection products, such as the recommended dosage required and observance of
pre-harvest intervals to ensure production of safe and nutritious foods. Capacity building of
farmers requires that a program for regular training and extension support for farmers be
implemented to take into account the continued improvement and maintenance of the set of
evolving organic standards. Since organic farming systems have significant positive impacts
on the yield and profitability of some crops, these should be promoted among small-scale
producers as a way of improving their livelihoods. It is strongly recommended that the
government create, using benefits, tax breaks and other incentives, an enabling environment
for organic farming as such policies that will encourage more farmers to join organic farming
groups and motivate already existing members to continue. The use of knowledge
dissemination, product diversification, and value addition using agricultural technologies
should be adopted to enhance organic farming systems.
xiii
Zusammenfassung
Das Konzept der nachhaltigen landwirtschaftlichen Systeme konzentriert sich auf die
Notwendigkeit, Techniken und Praktiken zu entwickeln, die positive Auswirkungen auf soziale
Ergebnisse, die Umwelt und die Nahrungsmittelproduktivität haben. In Afrika gibt es nur
wenige empirische Studien, die agronomische Praktiken auf ökologischen und nicht-
ökologischen Farmen vergleichen. Die vorliegende vergleichende Studie bewertet die
Produktivität und Rentabilität ökologischer und konventioneller Anbausysteme, ihre
Nachhaltigkeitsleistung sowie die Wahrnehmung der Landwirte in Bezug auf
Nachhaltigkeitslücken bei verbesserten Maßnahmen in drei Bezirken Kenias. Empirische
Daten wurden auf 849 Farmen gesammelt. Diese kamen zum Einsatz, um i) eine
Produktivitätsanalyse durchzuführen, welche die Erträge und Gewinne von zehn gängigen
Nutzpflanzen bewertet und ii) eine Bewertung der Nachhaltigkeitsleistung unter Verwendung
eines indikatorbasierten multikriteriellen Ansatzes (SMART-Farm Tool) ermöglicht. Letzterer
wird herangezogen, um ökologische und konventionelle Anbausysteme auf Farm- und
Bezirksebene zu vergleichen. Drittens wurden Feedback-Workshops und intensive
Gesprächsrunden mit Landwirten durchgeführt. In diesen Veranstaltungen wurde der Prozess
der Optimierung der Nachhaltigkeitsleistung in Bereichen behandelt, welche kritische Werte
aufwiesen. Die Sicht der Landwirte auf die Herausforderungen und Chancen im Prozess der
Steigerung der Verbessrung der Nachhaltigkeitskriterien stand dabei im Vordergrund. Die
Erträge, Kosten, Einnahmen und Gewinne von zwanzig Nutzpflanzen wurde untersucht.
Bestimmte Nutzpflanzen, die im ökologischen Landbau angebaut wurden, erwiesen sich als
vorteilhafter als die im konventionellen Landbau angebauten Pflanzen. Die Auswirkung auf
die Erträge für vier Kulturen, die mit Hilfe des nächsten Nachbarn, des Kernel-Matchings und
des Radius-Matchings verglichen wurden, zeigten, dass es eine signifikante Steigerung der
Erträge in ökologischen Anbausystemen gab. Der ökologische Landbau steigerte die
durchschnittlichen Erträge bei vier Feldfrüchten signifikant: Ackerbohnen (Steigerung um
49,6%), Macadamianüsse (36,6%), Kaffee (37,3%) und Mango (43,1%). Die
durchschnittlichen Gewinne von Ackerbohnen/Gartenbohnen stiegen um US$ 994/ha
(entspricht einer Steigerung von 35,3%). Ähnlich stiegen die Gewinne für Macadamia-Nüsse
um US$ 5.263/ha (entspricht einer Steigerung von 44,4%). Die Propensity-Score-Matching-
Sensitivitätsanalyse zeigt, dass die Reduktion der Medianverzerrung bei allen Erträgen größer
als 19 % war (Ackerbohnen 19 %, Macadamianüsse 87 %, Kaffee 88 % und Mango 32 %) und
bei den Gewinnen größer als 21 % (Ackerbohnen 21 % und Macadamianüsse 61 %). Die starke
Reduzierung der Medianverzerrung verbessert die Qualität des Abgleichs.
Die Nachhaltigkeitsbewertung ergab, dass ökologisch wirtschaftende Betriebe bei den
Nachhaltigkeitsdimensionen ökologische Integrität, wirtschaftliche Belastbarkeit und
Unternehmensführung insgesamt deutlich besser abschnitten als konventionelle Betriebe. Die
vierte Nachhaltigkeitsdimension, Soziales, zeigte eine niedrigere Zielerreichungsgrade für
ökologische gegenüber konventionellen Betrieben. Bei den Unterthemen und Indikatoren der
xiv
Nachhaltigkeit waren einige Werte für ökologische und konventionelle
Landwirtschaftssysteme vergleichbar, andere jedoch niedriger für Ökobetriebe. Die Studie
identifizierte Nachhaltigkeitsherausforderungen bei den kleinbäuerlichen Betrieben, die
angegangen werden müssen. Die wichtigsten Herausforderungen, mit denen sowohl
ökologische als auch konventionelle Landwirte im Untersuchungsgebiet konfrontiert sind,
lassen sich wie folgt zusammenfassen: Einschränkungen bei technischen und materiellen
Inputs, marktbezogene Herausforderungen, mangelnde agronomische Fähigkeiten und
begrenzte institutionelle Unterstützung. Zu den von den Landwirten vorgeschlagenen
Interventionsbereichen und Strategien gehörten die Erhaltung der Artenvielfalt, die Nutzung
und das Management von Wasserressourcen, das Management der Bodenfruchtbarkeit, die
Gründung und Aufrechterhaltung von landwirtschaftlichen Verbänden, Diversifizierung, das
erschließen alternativer Märkte sowie die Führung von Betriebsbüchern. Andere von den
Landwirten vorgeschlagene Strategien beinhalteten Kapazitätsentwicklung und Maßnahmen
zur öffentlichen Gesundheit und Sicherheit. Die niedrigen Werte für Indikatoren und deren
Subthemen, die in der Nachhaltigkeitsbewertung gefunden wurden, müssen beachtet werden.
Die in der Nachhaltigkeitsbewertung identifizierten Einschränkungen können durch die
Verbesserung der Anbaupraktiken sowohl in ökologischen als auch in konventionellen
Anbausystemen angegangen werden, z. B. durch die Verbesserung des Wissens der Landwirte
über die korrekte Verwendung von synthetischen Düngemitteln und Dung sowie die korrekte
Verwendung von Pflanzenschutzmitteln, wie z. B. die empfohlene Dosierung und die
Einhaltung der Intervalle vor der Ernte. Dadurch wird die Produktion von sicheren und
nahrhaften Lebensmitteln sichergestellt. Der Aufbau von Kapazitäten der Landwirte erfordert,
dass ein Programm zur regelmäßigen Schulung und Beratung der Landwirte implementiert
wird, um die kontinuierliche Verbesserung und Aufrechterhaltung der sich entwickelnden
ökologischen Standards zu gewährleisten. Da ökologische Anbausysteme signifikante positive
Auswirkungen auf den Ertrag und die Rentabilität einiger Nutzpflanzen haben, sollten diese
bei Kleinproduzenten als Möglichkeit zur Verbesserung ihrer Lebensgrundlage beworben
werden. Es wird dringend empfohlen, dass die Regierung durch Vergünstigungen und Anreize
ein günstiges Umfeld für den ökologischen Landbau schafft. Mehr Landwirte müssen motiviert
werden, sich ökologischen landwirtschaftlichen Verbänden anzuschließen und bereits
bestehende Mitglieder sollten zur Fortsetzung ihres Engagements ermutigt werden. Die
Verbreitung von Wissen, Diversifizierung von Produkten und eine Steigerung der
Wertschöpfung durch Einsatz von landwirtschaftlichen Technologien sollte genutzt werden,
um ökologische Anbausysteme zu verbessern.
1
1. Chapter General information
Motivation
Sustainable agriculture is directly or indirectly emphasized in connection to food production in
12 of the 17 United Nations Sustainable Development Goals (SDGs) (Röös et al., 2019; UNEP-
UNCTAD, 2008). Food production while maintaining biodiversity and the ecosystem is one of
the biggest constraint facing humanity (Ehrlich, 2008). About 40% of the earth’s surface is
utilized for agricultural production (Foley et al., 2011). The management of huge tracts of land
and the natural resources harvested from them, by farmers and pastoralists, shapes ecosystems,
habitats, and landscapes (Bosshard et al., 2009; Dale et al., 2019). To conserve biodiversity
and ecosystem services for future generations, agricultural farming methods such as
conservation agriculture, precision farming, intensification farming, agro-ecological farming,
and organic agriculture have been proposed as alternative, more sustainable farming practices
as compared to conventional farming (Latruffe et al., 2016; Pretty & Bharucha, 2014). Since
organic production targets the development of a sustainable cultivation-based system, it is a
relevant tool to advance the United Nations SDGs on sustainable agriculture, sustainable
production and consumption, climate change, and ecosystem management (UNEP-UNCTAD,
2008).
Interactions between farmers (perceptions and goals), the physical environment (land, animals,
plants, technology, and climate), and the socio-economic environment (norms, markets, policy)
bring about the formation of specific farming systems (Darnhofer, 2005). Information from the
ecological, social and economic situation is processed and resolutions are made and applied at
the farm-level (Malcolm et al., 2005). Studying productivity, profitability, and sustainability
of the complex heterogeneity of agricultural systems brings better understanding and
knowledge of these systems (Gaviglio et al., 2017), especially when utilizing revised and
improved interpretive methods (Bennet & Franzel, 2013; De Olde et al., 2016). Analysis of the
factors that help build the resilience of organic farms that pursue ecologically, socially, and
economically sustainable practices can help farmers to redirect their development paths to
become even more sustainable (Majewski, 2013; Malcolm et al., 2005). Such an analysis can
also help demonstrate to non-organic farmers that they can redirect their development paths to
become sustainable.
Farms of different sizes and commercial orientation coexist in any location, and further
differentiation over time is driven by the interaction of demographic and economic change
2
(IFOAM, 2018; Taylor, 2006; Weidmann et al., 2004). Sub-Saharan countries need to devote
their efforts to science-based, actionable solutions that are tailored to local situations, and
support structural transformations of whole food systems (Taylor, 2006; Weidmann et al.,
2004). In Africa, there are limited empirical studies on various aspects of organic agriculture,
like environmental sustainability, economic resilience, profitability, and productivity,
including production, marketing, and post-harvest management (Lee & Fowler, 2002). In
Kenya, only limited information exists on the economic benefits of organic farming and this
partly hinders farmers’ ability to make decisions in favor of adopting organic production
systems. At the same time, organic farming receives limited support by the government and
other development agencies (Ndungu et al., 2013; Taylor, 2006; UNEP-UNCTAD, 2008).
1.2 Organic farming in Africa
Africa has a large number of non-certified organic farms that are mainly subsistence farms or
provide products to local markets. Such farms are often termed ‘organic by default’. Africa
also produces organic food (e.g. olives, coffee, cotton, cocoa and palm oil) and non-food
products (cotton and medicinal plants) for export, with the European Union as the main
procurer (Bouagnimbeck, 2011; Tung, 2018). In 2018, about 2 million ha of agricultural land
was under organic farming in Africa, which constituted about 0.2% of the continent’s total
agricultural area (Willer et al., 2020, pp. 185-200). About 30% of the organic farmland was
used for arable crops and there were an estimated 788,858 organic producers in Africa (ibid.,
pp. 185-200).
1.2.1 Organic farming defined
There is no universally accepted definition of organic farming, but a majority of authors
consider it to be a specific production system that aims to avoid the use of synthetic and harmful
fertilizers, pesticides growth regulators and livestock feed additives. Organic farming can be
defined as an ecological production system which promotes and enhances biodiversity,
biological cycles and soil health, and utilizes limited off-farm inputs and farming practices that
restore, maintain, and enhance ecological harmony (De Ponti et al., 2012; Lee et al., 2015;
Weidmann et al., 2004 ; UNEP/UNCTAD, 2008). IFOAM (2014) defines organic farming as
a production system that sustains soil health, ecosystem and humans. The system relies on an
ecological processes, biodiversity and locally adapted cycles rather than the use of external
inputs with adverse impacts. Organic farming brings together traditions, innovations and
science and promotes fair interactions and a good quality of life to all (IFOAM, 2014; Schrama
et al., 2018). Organic agriculture considers the environment holistically, including its natural
3
cycles and complex food chain (Luttikholt, 2007; Mugivhisa et al., 2017). Weidmann et al.,
(2004) classify organic farming under four main principles, which are the health of soils, plants,
animals, and human beings; that every farm is embedded in an ecological context; fairness for
all relationships; and care and precaution. Traditional farming practices are low-intensity
agricultural production systems. Many traditional farming systems have been replaced with
more intensive and mechanized forms of farming, particularly on more productive land (FAO,
2019).
Organic farming is a process that involves adding organic matter (compost, farmyard manure,
green manure, and plant residues in the fields as mulch) to maintain soil fertility (Luttikholt,
2007; Pinthukas et al., 2015). Organic pest and disease management through strict crop rotation
and use of resistant crops and crop varieties is the preferred practice (Rodrigues et al., 2016).
The use of beneficial insects and natural enemies of plant and diseases, and mineral or botanical
extracts of insecticides and fungicides is promoted (Herath & Wijekoon, 2013). The practice
of organic weed management incorporates early weeding adapted soil preparation, crop
rotation, plant cover crops, green manures, mulching and maintains plant residues in the fields
(Luttikholt, 2007; Malcolm et al., 2005). Organic livestock husbandry includes the use of
fodder grasses and legumes, which apart from feed also build soils (nitrogen addition) and aid
soil water retention for plant growth (Rodrigues et al., 2016).
Another approach considered alongside organic farming is agro-ecology. According to the
FAO (2019), agro-ecology is a set of farming practices (seeking to boost resilience and the
ecological, socio-economic and cultural sustainability of farming systems), a social movement
(a new way of considering agriculture and its relationship with society), a scientific discipline
(the holistic study of agro-ecosystems), or all three as one. The core principles of agro-ecology
include planning, resource use, and field and landscape management.
The main supporting ideas and debates surrounding organic agriculture is that whatever the
farming system, it shares the common goal of striving for sustainability, which includes
environmental aspects and socio-economic considerations for the benefit of present and future
generations (Oberč, & Arroyo, 2020).
1.2.2 Farming systems in Kenya
Farming systems are a complex mix of farm enterprises to which farmers allocate their
resources in order to efficiently utilize the existing enterprises for increasing the productivity
4
and profitability of their farms (Goswami et al., 2017; FAPDA & FAO, 2014). Farming
systems involve the organization of farms and all the enterprises in relationship with each other
(FAO & World Bank 2001, pp. 8-10).
Types of farming systems
Extensive farming systems: - Involves farming using very little inputs to produce the
desired products (Dixon et al., 2001).
Intensive farming systems: - Involves usually commercial production of crops and
livestock using large amounts of external inputs on predominantly large farms (Dixon et al.,
2001.
The above extensive and intensive systems can be carried out under large scale or small scale
farming, depending on the level of technology, availability of land, capital, and skilled labour
(Dixon et al., 2001; FAO 1999).
Farming methods practiced in Kenya
Mixed farming: - Involves growing crops and keeping animals on the same piece of
land (Dixon et al., 2001; FAO 1999).
Nomadic pastoralism: - The moving of livestock from one place to another in search of
fresh water and pasture (Dixon et al., 2001; FAO 1999).
Organic farming: - Involves the growing of crops and rearing of livestock without using
agricultural chemicals while observing four principles - health (of soils, plants, animals, and
human beings), ecology, fairness, and care (Luttikholt, 2007; Seufert, Ramankutty, &
Mayerhofer, 2017).
Agroforestry: - an integration of land-use systems and technologies where trees, shrubs,
palms, bamboos, etc. are used on the same land management units as agricultural crops and
livestock crops. i.e. involves the growing of leguminous trees and crops and keeping livestock
on the same piece of land (Dixon et al., 2001; FAO 1999).
Crops are either annual crops (grown every year) or perennial crops. The crops found in Kenya
can be broadly classified as starchy staples, starchy roots, sugars and sweeteners, stimulants
and spices, timber trees, oils and nuts, fruits, fodder/foliage, vegetables, legumes, grains, and
fiber (GOK, 2019). Livestock found in Kenya include cattle, sheep, goats, donkeys, camels,
ducks, geese, horses, pigs, rabbits, quails, turkey, fish and crabs (ibid.).
5
1.2.3 Organic farming in Kenya
Organic farming initiatives and organizations that promote organic agriculture began in Kenya
in the 1980s. The Kenya Institute of Organic Farming (KIOF) was founded in 1986. In the
1990s, the Kenya Organic Farmers Association was created to support smallholder farmers,
while the Kenya Organic Producers Association (KOPA) was created for medium and large-
scale farmers engaged in the export market. The Kenya Organic Agriculture Network (KOAN)
was established in 2004 as an organic stakeholders’ platform to coordinate the organic sector.
Along with private sector companies (producing for local and export markets), an ever-growing
number of civil society organizations has led to the growth of the organic sector in Kenya.
The organic movement in Kenya has the potential for growth and expansion. The organic
potential areas including a lack of capital to invest in external inputs that are often expensive,
the ability of farmers to grow crops without external inputs, a rapid emerging local market for
organic products, an ever-increasing export market for organic products, and an awareness of
the possible negative effects of chemical residues in food (Walaga, 2004). Agricultural land
comprises about 48.5% of Kenya’s total land area of 569,140 square kilometers (GoK, 2019;
KNBS, 2019a, 2019b). Organic farming in Kenya has increased steadily as smallholder farmers
shift cultivation practices (Tung, 2018). The total hectares under organic management
increased from 4,894 ha in 2014 to 276,113 ha in 2018 (Willer & Lernoud, 2015, 2016, 2017,
2018, 2019; Willer et al., 2020). In 2018, organic farming was practiced on 0.6% of the
country’s agricultural land with about 37,295 organic producers, including 154,488 hectares
under wild collection (Willer & Lernoud, 2019). The wild collections are described in the
IFOAM Norms 2014 as wild harvests from a system that is sustainably managed and does not
surpass the sustainable return of the ecosystem or impend existence of plant, fungal or animal
species, including those not directly exploited (IFOAM, 2014).
1.2.4 Organic markets and certification in Kenya
Organic markets in Kenya are largely formal and export-orientated, requiring certified and
labeled products. Organic products range from vegetables, fruits, essential oils, nuts, spices,
dried and fresh herbs, plus products for the cosmetic and pharmaceutical industry (Herath &
Wijekoon, 2013; Weidmann et al., 2004). The certification process is essential in organic
farming. A certification body/organization assesses the product to verify its production as per
the rules of the organic standard followed (Herath & Wijekoon, 2013; Weidmann et al., 2004).
The standard describes in detail how a product must be produced, processed, and packaged for
6
it to be labeled and sold as organic. In Kenya, the main standard regulatory authority is the
Kenya Bureau of Standards (KEBS). It has recognized the National Organic Standard of
Processing and Production and the East African Organic Products Standards (EAOPS) as
standards that guide the organic sector (Tung, 2018; UNEP-UNCTAD, 2008). Certified
organic products are sold at a premium price. The standards regulate the control and
certification process that farmers or groups of farmers go through to acquire organic
certification labels. Training of farmers is necessary for the certification of the product.
East Africa Organic Products Standard (EAOPS) 2007
The EAOPS is a multi-country organic standard for Burundi, Rwanda, Tanzania, Uganda, and
Kenya (EAC, 2007; Tung, 2018; UNEP-UNCTAD, 2008). The EAOPS label is EAS456: 2007
Kilimo Hai (which means living agriculture in Kiswahili). The standard provides the general
requirements for organic production of crops and animals, beekeeping and wild collections,
handling, storage, and processing. It gives guidance on labeling and includes the International
Federation of Organic Agriculture Movement (IFOAM) principles of organic agriculture, a list
of substances allowed in organic plant production, a list of natural substances not allowed in
organic plant production, and a list of extracts and processing aids for organic food processing
(EAC, 2007).
The EAOPS borrows heavily from the European Union Organic Food and Farming Standard
Council Regulation (EC) 834/2007 on organic food and production labeling, since the
European Union organic framework needs enforcement of its standards by its Member States,
including a checkup process supervised by competent national authorities (European
Commission, 2013). The EAOPS also incorporates the best practices from the organic
equivalence tools of UNEP-UNCTAD, and the Pacific Organic Standard (POS) (Tung, 2018).
The EAOPS can be used for self-assessment by the producer’s declaration of conformity, in
line with organic principles, certification bodies, or means of verification (project plan and log
frame). When third-party certification, inspection, and certification are carried out the parties
concerned must follow the international norms throughout the process (ISO Guide 65 or the
IFOAM accreditation criteria) (EAC, 2007). The EAOPS lists the areas in which it can be used
for international negotiations on standards as well as for agreements with other countries and
regions (EAC, 2007).
7
1.3 Sustainability concepts and assessment
1.3.1 Definitions of sustainability
There is no universally accepted definition of sustainability. Some authors define sustainability
by reference to the functioning of natural systems, which remain diverse and produce
everything needed for the environment to remain in balance (Häni et al., 2003; Smith et al.,
2019).
The Brundtland Report’s 1987 definition of sustainability is widely used:
Sustainability, therefore, is much more than ensuring the protection of the natural
resource base. To be sustainable, agriculture must meet the needs of present and future
generations for its products and services, while ensuring profitability, environmental
health, and social and economic equity. Sustainable agriculture would contribute to all
the four pillars of food security – availability, access, utilization, and stability – in a
manner that is environmentally, economically and socially responsible over time
(Brundtland, 1987; FAO, 2012).
The value of the term ‘sustainability’ is that it gives equal weight to all its three dimensions,
i.e. environment, economy and society; not primacy to just one, i.e. the economy (Conway &
Wilson, 2012; FAO, 2012).
Various authors have defined sustainability in diverse ways according to the context, relevance
or process about which they write (Binder et al., 2010). López-Ridaura et al. (2002) define
sustainability by including seven general attributes of a natural resource management system,
namely resilience, productivity, reliability, adaptability, stability, equity, and self-reliance.
Rasul and Thapa (2004) define sustainable agriculture as a system that makes use of a farm's
internal resources, incorporating the natural process into agricultural production and greater
use of improved knowledge and practices. Häni et al. (2003) define sustainable agriculture as
one that adopts productive, competitive, and efficient production practices while protecting and
improving the natural environment and ecosystem as well as the socio-economic conditions of
local communities.
Debates continue over the meaning and definition of sustainability to refine it further. For
example the 10 elements of agro-ecology (FAO 2019) which guide policy makers, practitioners
and stakeholders to plan, manage and evaluate agro ecological systems. Some academics
question the feasibility of the proposed solutions to farming in the face of other societal grand
8
challenges related to the food system, such as food security for all (Elzen et al., 2011; Garnett
et al., 2013; Levin et al., 2012). Because of the lack of consensus on this issue, sustainable
agriculture can be considered a priority area for making iterative improvements, or incremental
innovations, to current agri-food systems (Busch, 2012, Grin et al., 2010). Specifically,
sustainable agri-food systems are required to ensure that the negative environmental effects of
production are limited while also providing economic benefits and socially appropriate
solutions to the challenges of food security (FAO, 2014a, 2014b). However, within the space
of political commitment to sustainable agriculture, more evidence is required on how farmers
and organizations can transit towards practicing sustainable agriculture and, more specifically,
on the motivations and driving forces needed for them to do so.
In this study, the working definition of sustainability is the integration of environmental,
economic, social well-being and governance aspects, in order to create thriving, healthy,
diverse and resilient societies in this generation and the next (Binder et al., 2010; De Olde et
al., 2016; Schader et al., 2014). In this sense, it improves on the narrow perspective of most
agricultural science assessments, which tend to privilege only the economic dimension through
a focus on yields and (narrowly defined) profits. The scope, context and tools to assess
sustainability requires further conceptualization of how sustainability at the farm level is to be
measured.
1.3.2 Methods for sustainability assessments of agriculture
Sustainability is measured at different levels, from the farm to the national and regional level
(Binders et al., 2010). A good number of sustainability assessment tools and frameworks exist
to support decision making in agriculture (Pope et al., 2004). Similarly, a wide range of tools
has been developed to provide an in-depth picture of the sustainability of agricultural systems
(Binder et al., 2010; Schader et al., 2014; De Olde et al., 2016). The target groups are usually
farmers or policy-makers who are directly or indirectly involved in discussions on the selection
of indicators, aggregation and weighing methods, and time required for the implementation of
sustainability tools and the outcomes of the assessment (Marchand et al., 2014; Schader et al.,
2014). New ways of acting, designing, and assessing sustainability have emerged, from partial
approaches (only environmental) to those that tackle the whole complexity (environmental,
social and economic), e.g. González de Molina (2013). Many approaches and frameworks
cover the three dimensions, such as poverty impact assessments (OECD, 2008), the framework
for participatory impact assessment (Morris et al., 2011) or participatory impact pathways
9
analyses (Douthwaite et al., 2007a, 2007b, and Alvarez et al., 2004). However the number of
indicators or variables that measure sustainability are limited. Schader et al. (2014) calculated
that there were over 35 different approaches to sustainability assessment existing but that the
scope and context by which users give meaning to these approaches limits the use of the results
of such assessments.
A shift to indicator-based sustainability assessments has become popular in recent years
(Binder et al., 2010; Trisete et al., 2014; Schader et al., 2014; Gasporatos et al., 2012).
Indicators are considered the tools for the measurement of sustainability (Freyenberg et al.,
1997). There is a continuous discussion among different scholars on methods, approaches, and
tools including indicator selection, stakeholders’ participation, aggregation and normalization
methods (de-Olde et al., 2016; Whitehead, 2017), as well as the feasibility of various tools to
measure sustainability (Sieber et al., 2017; Waas et al., 2014).
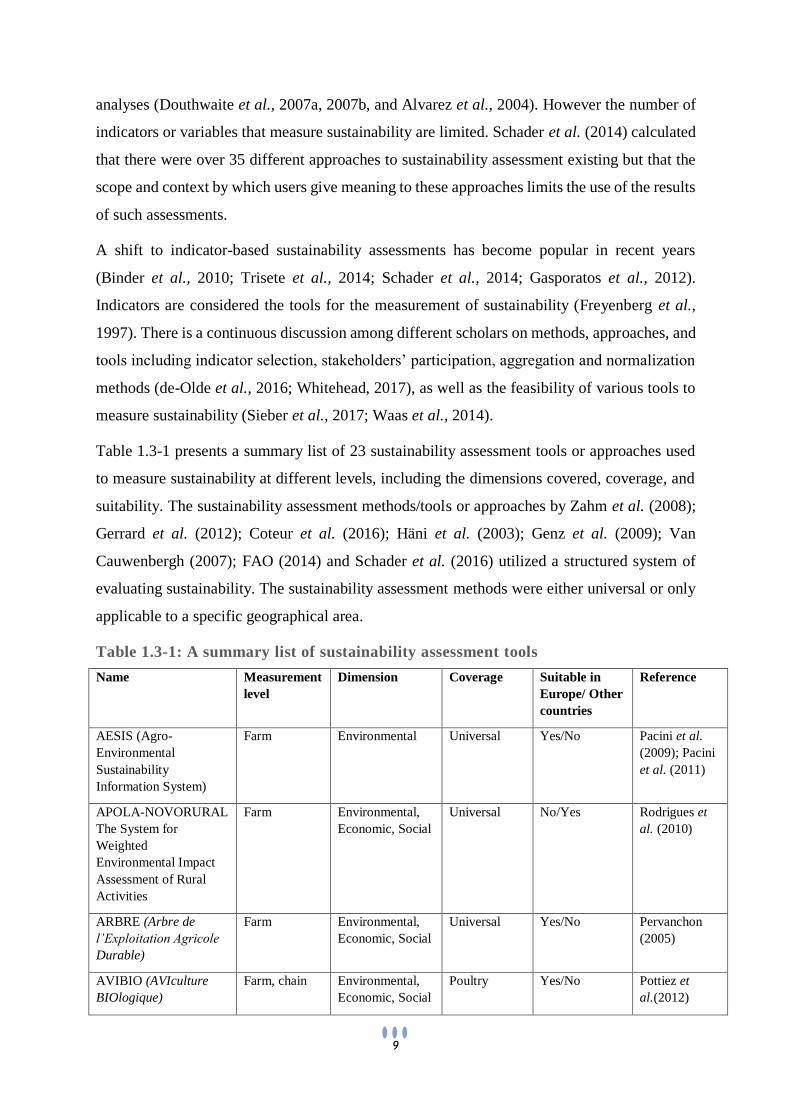
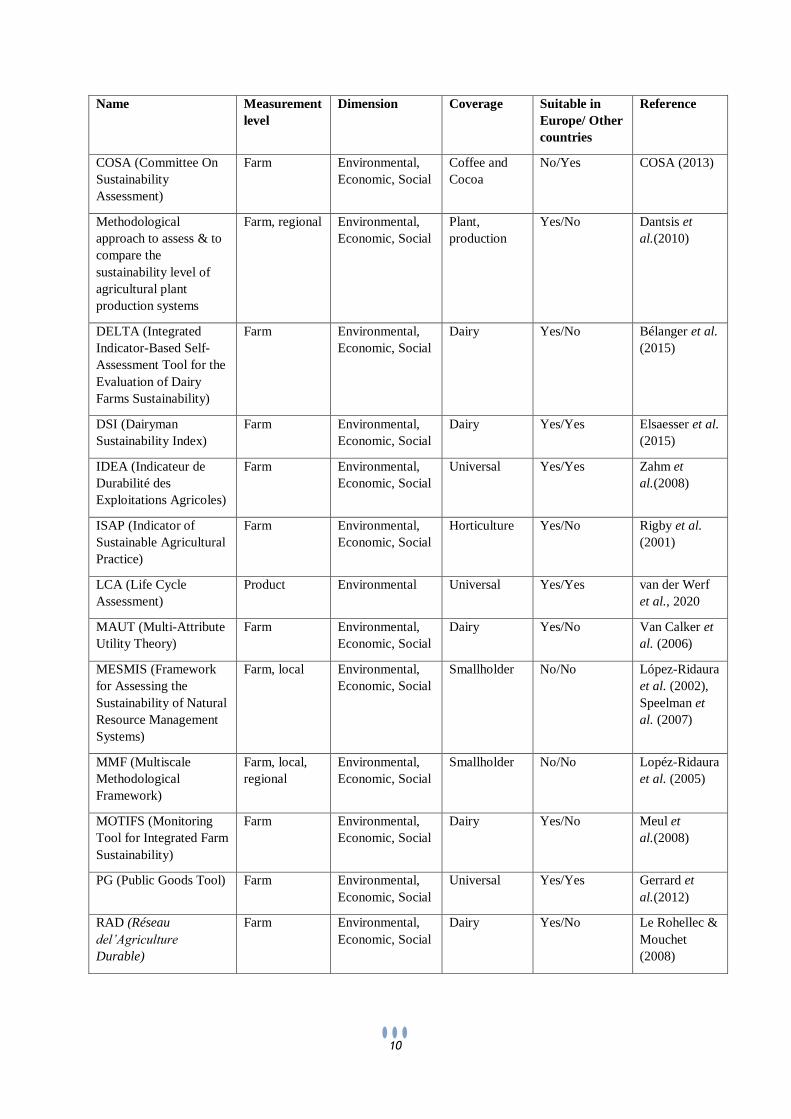
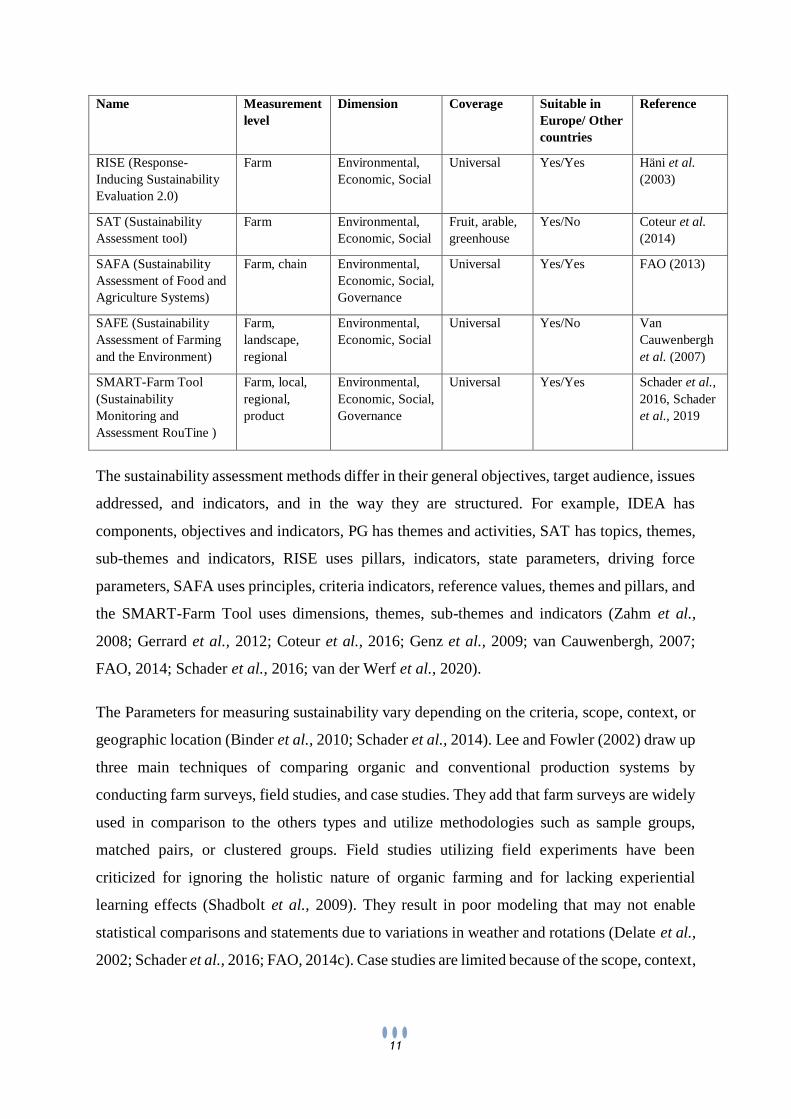
Table 1.3-1 presents a summary list of 23 sustainability assessment tools or approaches used
to measure sustainability at different levels, including the dimensions covered, coverage, and
suitability. The sustainability assessment methods/tools or approaches by Zahm et al. (2008);
Gerrard et al. (2012); Coteur et al. (2016); Häni et al. (2003); Genz et al. (2009); Van
Cauwenbergh (2007); FAO (2014) and Schader et al. (2016) utilized a structured system of
evaluating sustainability. The sustainability assessment methods were either universal or only
applicable to a specific geographical area.
Table 1.3-1: A summary list of sustainability assessment tools
Name Measurement
level
Dimension Coverage Suitable in
Europe/ Other
countries
Reference
AESIS (Agro-
Environmental
Sustainability
Information System)
Farm Environmental Universal Yes/No Pacini et al.
(2009); Pacini
et al. (2011)
APOLA-NOVORURAL
The System for
Weighted
Environmental Impact
Assessment of Rural
Activities
Farm Environmental,
Economic, Social
Universal No/Yes Rodrigues et
al. (2010)
ARBRE (Arbre de
l’Exploitation Agricole
Durable)
Farm Environmental,
Economic, Social
Universal Yes/No Pervanchon
(2005)
AVIBIO (AVIculture
BIOlogique)
Farm, chain Environmental,
Economic, Social
Poultry Yes/No Pottiez et
al.(2012)
10
Name Measurement
level
Dimension Coverage Suitable in
Europe/ Other
countries
Reference
COSA (Committee On
Sustainability
Assessment)
Farm Environmental,
Economic, Social
Coffee and
Cocoa
No/Yes COSA (2013)
Methodological
approach to assess & to
compare the
sustainability level of
agricultural plant
production systems
Farm, regional Environmental,
Economic, Social
Plant,
production
Yes/No Dantsis et
al.(2010)
DELTA (Integrated
Indicator-Based Self-
Assessment Tool for the
Evaluation of Dairy
Farms Sustainability)
Farm Environmental,
Economic, Social
Dairy Yes/No Bélanger et al.
(2015)
DSI (Dairyman
Sustainability Index)
Farm Environmental,
Economic, Social
Dairy Yes/Yes Elsaesser et al.
(2015)
IDEA (Indicateur de
Durabilité des
Exploitations Agricoles)
Farm Environmental,
Economic, Social
Universal Yes/Yes Zahm et
al.(2008)
ISAP (Indicator of
Sustainable Agricultural
Practice)
Farm Environmental,
Economic, Social
Horticulture Yes/No Rigby et al.
(2001)
LCA (Life Cycle
Assessment)
Product Environmental Universal Yes/Yes van der Werf
et al., 2020
MAUT (Multi-Attribute
Utility Theory)
Farm Environmental,
Economic, Social
Dairy Yes/No Van Calker et
al. (2006)
MESMIS (Framework
for Assessing the
Sustainability of Natural
Resource Management
Systems)
Farm, local Environmental,
Economic, Social
Smallholder No/No López-Ridaura
et al. (2002),
Speelman et
al. (2007)
MMF (Multiscale
Methodological
Framework)
Farm, local,
regional
Environmental,
Economic, Social
Smallholder No/No Lopéz-Ridaura
et al. (2005)
MOTIFS (Monitoring
Tool for Integrated Farm
Sustainability)
Farm Environmental,
Economic, Social
Dairy Yes/No Meul et
al.(2008)
PG (Public Goods Tool) Farm Environmental,
Economic, Social
Universal Yes/Yes Gerrard et
al.(2012)
RAD (Réseau
del’Agriculture
Durable)
Farm Environmental,
Economic, Social
Dairy Yes/No Le Rohellec &
Mouchet
(2008)
11
Name Measurement
level
Dimension Coverage Suitable in
Europe/ Other
countries
Reference
RISE (Response-
Inducing Sustainability
Evaluation 2.0)
Farm Environmental,
Economic, Social
Universal Yes/Yes Häni et al.
(2003)
SAT (Sustainability
Assessment tool)
Farm Environmental,
Economic, Social
Fruit, arable,
greenhouse
Yes/No Coteur et al.
(2014)
SAFA (Sustainability
Assessment of Food and
Agriculture Systems)
Farm, chain Environmental,
Economic, Social,
Governance
Universal Yes/Yes FAO (2013)
SAFE (Sustainability
Assessment of Farming
and the Environment)
Farm,
landscape,
regional
Environmental,
Economic, Social
Universal Yes/No Van
Cauwenbergh
et al. (2007)
SMART-Farm Tool
(Sustainability
Monitoring and
Assessment RouTine )
Farm, local,
regional,
product
Environmental,
Economic, Social,
Governance
Universal Yes/Yes Schader et al.,
2016, Schader
et al., 2019
The sustainability assessment methods differ in their general objectives, target audience, issues
addressed, and indicators, and in the way they are structured. For example, IDEA has
components, objectives and indicators, PG has themes and activities, SAT has topics, themes,
sub-themes and indicators, RISE uses pillars, indicators, state parameters, driving force
parameters, SAFA uses principles, criteria indicators, reference values, themes and pillars, and
the SMART-Farm Tool uses dimensions, themes, sub-themes and indicators (Zahm et al.,
2008; Gerrard et al., 2012; Coteur et al., 2016; Genz et al., 2009; van Cauwenbergh, 2007;
FAO, 2014; Schader et al., 2016; van der Werf et al., 2020).
The Parameters for measuring sustainability vary depending on the criteria, scope, context, or
geographic location (Binder et al., 2010; Schader et al., 2014). Lee and Fowler (2002) draw up
three main techniques of comparing organic and conventional production systems by
conducting farm surveys, field studies, and case studies. They add that farm surveys are widely
used in comparison to the others types and utilize methodologies such as sample groups,
matched pairs, or clustered groups. Field studies utilizing field experiments have been
criticized for ignoring the holistic nature of organic farming and for lacking experiential
learning effects (Shadbolt et al., 2009). They result in poor modeling that may not enable
statistical comparisons and statements due to variations in weather and rotations (Delate et al.,
2002; Schader et al., 2016; FAO, 2014c). Case studies are limited because of the scope, context,

12
climatic or geographic locational differences of variables to compare the matching systems
(Shennan et al., 2017).
The results of a sustainability assessment, when translated into action, can guide policy-makers
in their decisions to strengthen farming systems, while reflecting trade-offs between the
ecological, economic and social dimensions of sustainability (Hanuš, 2004; Malcolm, 2005; Li
et al., 2010; Perez et al., 2015). Indicators should assist in identifying policy fields where action
is needed and in monitoring the impact of policy action that makes it visible to the broader
public (Hanuš, 2004). Data and decision tools for assessing the various trade-offs and
improving management decisions, productivity and environmental sustainability, need to be
constantly improved (Foley, 2011).
The purpose of my study is to make a comparative evaluation of organic versus conventional
farming systems in Kenya. The study contributes to the knowledge gap on profitability,
economic resilience, and environmental sustainability of organic versus conventional farming
systems. It seeks to provide evidence-based data that can back the formulation of an organic
policy framework in Kenya and improve decision making at the farm level.
There is a general agreement in the sustainability discourse that policymakers have not equally
prioritized the different dimensions of sustainable development (EAC, 2007; Malcolm et al.,
2005; Perez et al., 2015). Most studies have favored environmental aspects with fewer studies
on economic and social aspects, or where the latter have been studied they were treated
separately (Singh et al., 2012). Some sustainability assessment methods have methodological
or conceptual limitations while others are limited by data availability (Bene et al., 2020;
Gasparatos et al., 2012; Pollesch et al., 2015). This study considers sustainability in a holistic
manner and uses different approaches to measure it using a hierarchical framework of
principles, criteria, and indicators. The results of the assessment are also easy to interpret and
use. The Sustainability Monitoring and Assessment RouTine (SMART-Farm Tool) (Schader
et al., 2016; Ssebunya et al., 2018), an indicator-based multi-criteria assessment tool, was used
to assess sustainability at the farm-level. The division of indicators along the lines of the
sustainability dimensions highlights the multi-dimensional nature of sustainable development
and mirrors the importance of incorporating its dimensions (Hanuš, 2004; Schader et al., 2016).
In terms of the number of households and counties covered, this is the largest study to compare
organic and conventional farming systems in Kenya. Data from 849 farms spread across three
counties (Murang’a, Kirinyaga, and Machakos) was analyzed. On-farm operations’
13
productivity and profitability are assessed, the SMART-Farm Tool is used to analyze the
sustainability performance of farms, and intervention measures farmers can apply to improve
sustainability gaps are identified from the results of farmer workshops
1.4 Research questions and objectives, and outline of the thesis
The purpose of this study was to assess the productivity and profitability of organic versus
conventional farming systems, their sustainability performance, and farmer perceptions on
sustainability gaps for improved intervention in three counties of Kenya. It aimed to contribute
to the sustainability knowledge gap in aid of better decision making in the policy sector and at
the farm level for farmers in Kenya. The study sought to provide evidence-based data that can
back the formulation of an organic policy framework as well as improve decision making at
the farmer level on sustainable farming. Three research questions guided the study.
1.4.1 Research questions and objectives
Research question 1: How productive and profitable are organic compared to conventional
agricultural systems in Kenya?
Objectives
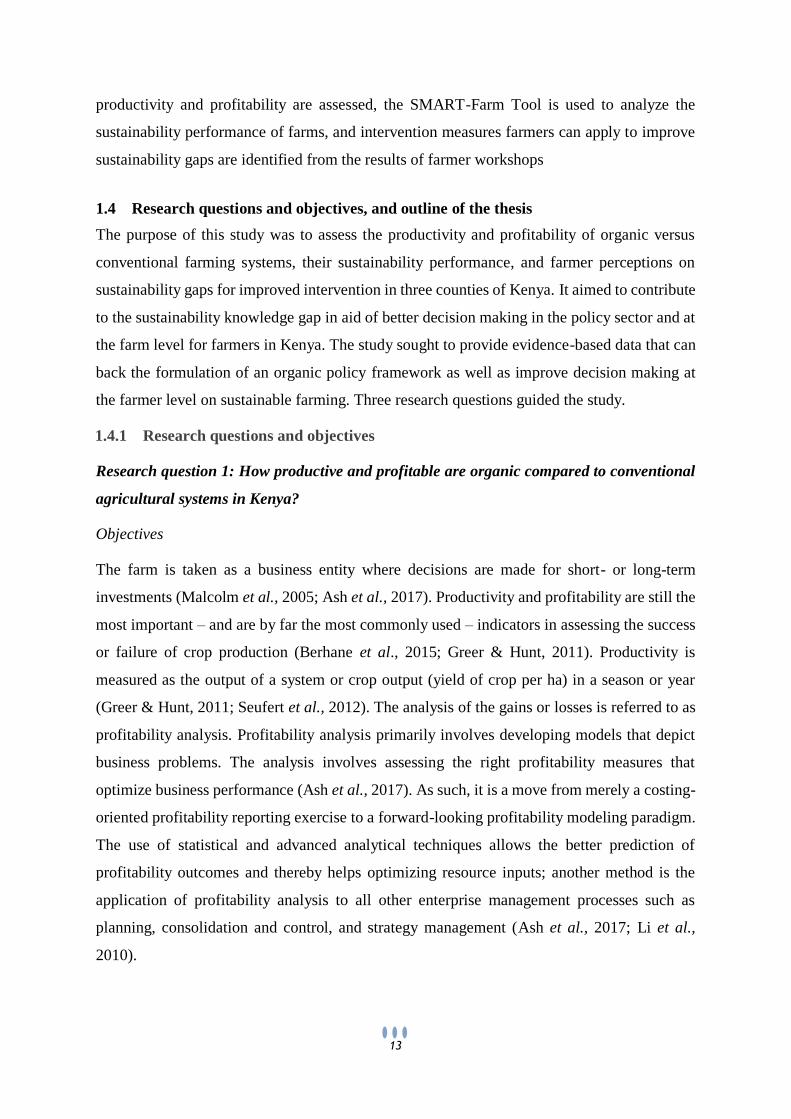
The farm is taken as a business entity where decisions are made for short- or long-term
investments (Malcolm et al., 2005; Ash et al., 2017). Productivity and profitability are still the
most important – and are by far the most commonly used – indicators in assessing the success
or failure of crop production (Berhane et al., 2015; Greer & Hunt, 2011). Productivity is
measured as the output of a system or crop output (yield of crop per ha) in a season or year
(Greer & Hunt, 2011; Seufert et al., 2012). The analysis of the gains or losses is referred to as
profitability analysis. Profitability analysis primarily involves developing models that depict
business problems. The analysis involves assessing the right profitability measures that
optimize business performance (Ash et al., 2017). As such, it is a move from merely a costing-
oriented profitability reporting exercise to a forward-looking profitability modeling paradigm.
The use of statistical and advanced analytical techniques allows the better prediction of
profitability outcomes and thereby helps optimizing resource inputs; another method is the
application of profitability analysis to all other enterprise management processes such as
planning, consolidation and control, and strategy management (Ash et al., 2017; Li et al.,
2010).
14
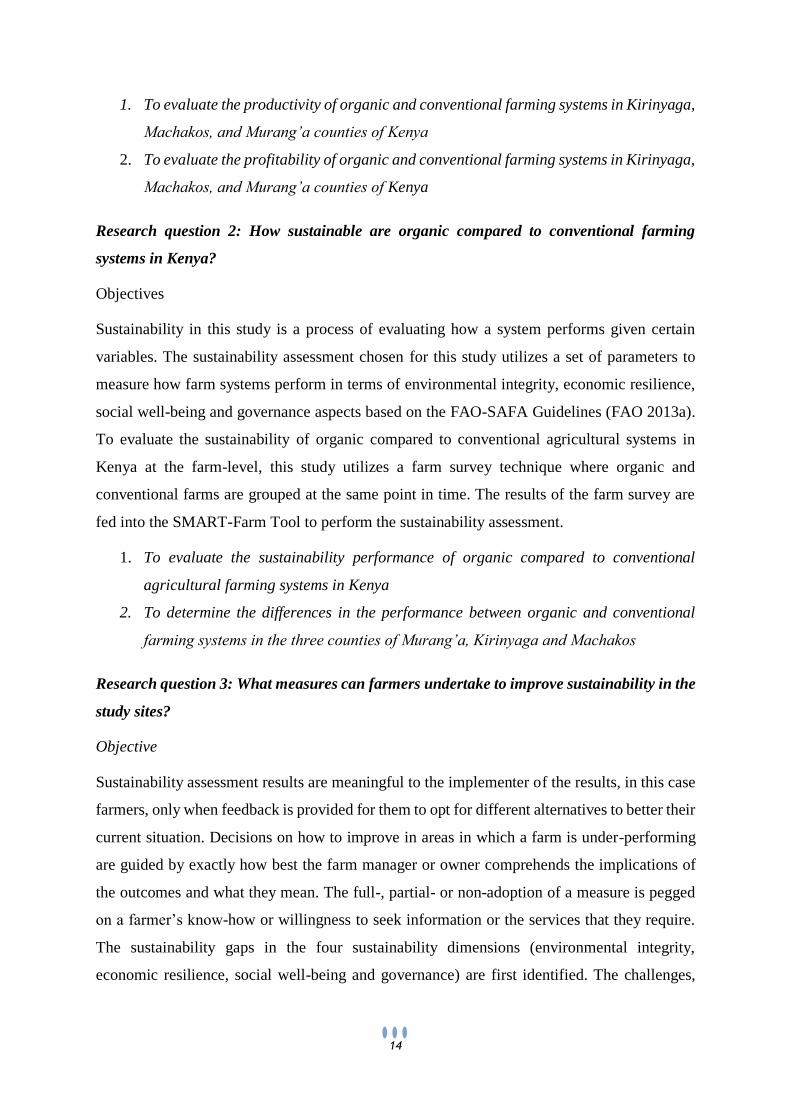
1. To evaluate the productivity of organic and conventional farming systems in Kirinyaga,
Machakos, and Murang’a counties of Kenya
2. To evaluate the profitability of organic and conventional farming systems in Kirinyaga,
Machakos, and Murang’a counties of Kenya
Research question 2: How sustainable are organic compared to conventional farming
systems in Kenya?
Objectives
Sustainability in this study is a process of evaluating how a system performs given certain
variables. The sustainability assessment chosen for this study utilizes a set of parameters to
measure how farm systems perform in terms of environmental integrity, economic resilience,
social well-being and governance aspects based on the FAO-SAFA Guidelines (FAO 2013a).
To evaluate the sustainability of organic compared to conventional agricultural systems in
Kenya at the farm-level, this study utilizes a farm survey technique where organic and
conventional farms are grouped at the same point in time. The results of the farm survey are
fed into the SMART-Farm Tool to perform the sustainability assessment.
1. To evaluate the sustainability performance of organic compared to conventional
agricultural farming systems in Kenya
2. To determine the differences in the performance between organic and conventional
farming systems in the three counties of Murang’a, Kirinyaga and Machakos
Research question 3: What measures can farmers undertake to improve sustainability in the
study sites?
Objective
Sustainability assessment results are meaningful to the implementer of the results, in this case
farmers, only when feedback is provided for them to opt for different alternatives to better their
current situation. Decisions on how to improve in areas in which a farm is under-performing
are guided by exactly how best the farm manager or owner comprehends the implications of
the outcomes and what they mean. The full-, partial- or non-adoption of a measure is pegged
on a farmer’s know-how or willingness to seek information or the services that they require.
The sustainability gaps in the four sustainability dimensions (environmental integrity,
economic resilience, social well-being and governance) are first identified. The challenges,
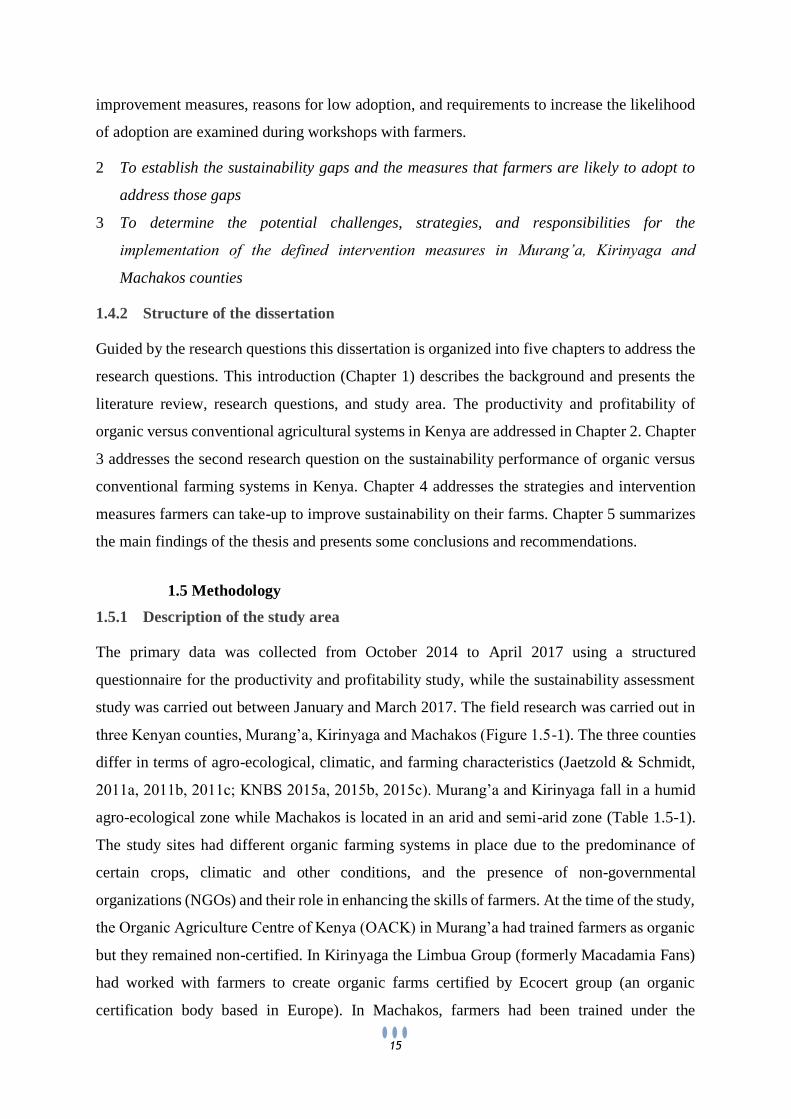
15
improvement measures, reasons for low adoption, and requirements to increase the likelihood
of adoption are examined during workshops with farmers.
2 To establish the sustainability gaps and the measures that farmers are likely to adopt to
address those gaps
3 To determine the potential challenges, strategies, and responsibilities for the
implementation of the defined intervention measures in Murang’a, Kirinyaga and
Machakos counties
1.4.2 Structure of the dissertation
Guided by the research questions this dissertation is organized into five chapters to address the
research questions. This introduction (Chapter 1) describes the background and presents the
literature review, research questions, and study area. The productivity and profitability of
organic versus conventional agricultural systems in Kenya are addressed in Chapter 2. Chapter
3 addresses the second research question on the sustainability performance of organic versus
conventional farming systems in Kenya. Chapter 4 addresses the strategies and intervention
measures farmers can take-up to improve sustainability on their farms. Chapter 5 summarizes
the main findings of the thesis and presents some conclusions and recommendations.
1.5 Methodology
1.5.1 Description of the study area
The primary data was collected from October 2014 to April 2017 using a structured
questionnaire for the productivity and profitability study, while the sustainability assessment
study was carried out between January and March 2017. The field research was carried out in
three Kenyan counties, Murang’a, Kirinyaga and Machakos (Figure 1.5-1). The three counties
differ in terms of agro-ecological, climatic, and farming characteristics (Jaetzold & Schmidt,
2011a, 2011b, 2011c; KNBS 2015a, 2015b, 2015c). Murang’a and Kirinyaga fall in a humid
agro-ecological zone while Machakos is located in an arid and semi-arid zone (Table 1.5-1).
The study sites had different organic farming systems in place due to the predominance of
certain crops, climatic and other conditions, and the presence of non-governmental
organizations (NGOs) and their role in enhancing the skills of farmers. At the time of the study,
the Organic Agriculture Centre of Kenya (OACK) in Murang’a had trained farmers as organic
but they remained non-certified. In Kirinyaga the Limbua Group (formerly Macadamia Fans)
had worked with farmers to create organic farms certified by Ecocert group (an organic
certification body based in Europe). In Machakos, farmers had been trained under the
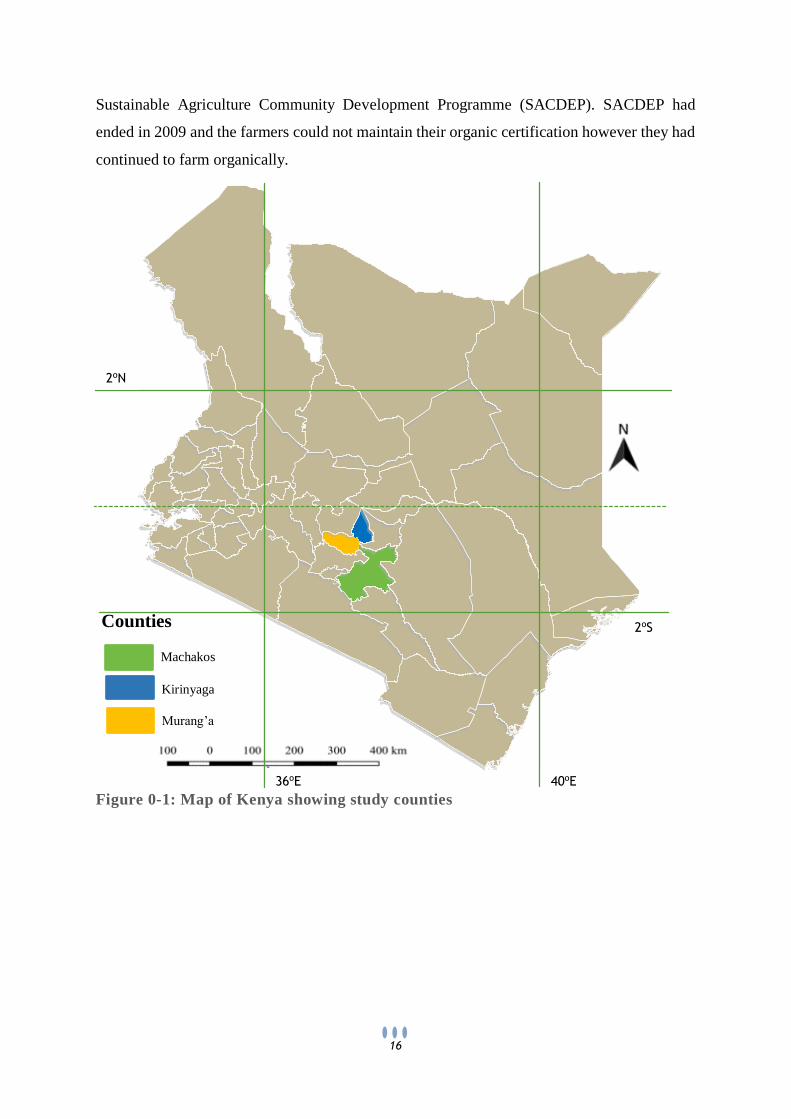
16
Sustainable Agriculture Community Development Programme (SACDEP). SACDEP had
ended in 2009 and the farmers could not maintain their organic certification however they had
continued to farm organically.
Figure 0-1: Map of Kenya showing study counties
Machakos
Kirinyaga
Murang’a
Counties
2oN
2oS
40oE 36oE
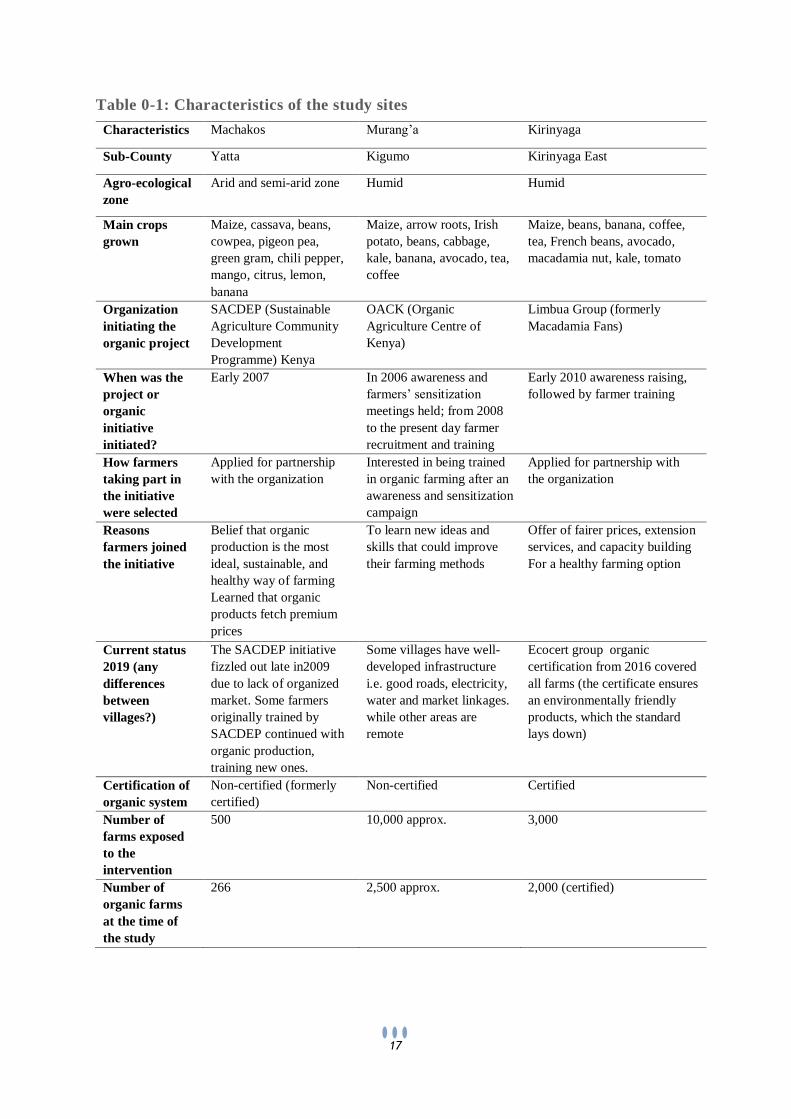
17
Table 0-1: Characteristics of the study sites
Characteristics Machakos Murang’a Kirinyaga
Sub-County Yatta Kigumo Kirinyaga East
Agro-ecological
zone
Arid and semi-arid zone Humid Humid
Main crops
grown
Maize, cassava, beans,
cowpea, pigeon pea,
green gram, chili pepper,
mango, citrus, lemon,
banana
Maize, arrow roots, Irish
potato, beans, cabbage,
kale, banana, avocado, tea,
coffee
Maize, beans, banana, coffee,
tea, French beans, avocado,
macadamia nut, kale, tomato
Organization
initiating the
organic project
SACDEP (Sustainable
Agriculture Community
Development
Programme) Kenya
OACK (Organic
Agriculture Centre of
Kenya)
Limbua Group (formerly
Macadamia Fans)
When was the
project or
organic
initiative
initiated?
Early 2007 In 2006 awareness and
farmers’ sensitization
meetings held; from 2008
to the present day farmer
recruitment and training
Early 2010 awareness raising,
followed by farmer training
How farmers
taking part in
the initiative
were selected
Applied for partnership
with the organization
Interested in being trained
in organic farming after an
awareness and sensitization
campaign
Applied for partnership with
the organization
Reasons
farmers joined
the initiative
Belief that organic
production is the most
ideal, sustainable, and
healthy way of farming
Learned that organic
products fetch premium
prices
To learn new ideas and
skills that could improve
their farming methods
Offer of fairer prices, extension
services, and capacity building
For a healthy farming option
Current status
2019 (any
differences
between
villages?)
The SACDEP initiative
fizzled out late in2009
due to lack of organized
market. Some farmers
originally trained by
SACDEP continued with
organic production,
training new ones.
Some villages have well-
developed infrastructure
i.e. good roads, electricity,
water and market linkages.
while other areas are
remote
Ecocert group organic
certification from 2016 covered
all farms (the certificate ensures
an environmentally friendly
products, which the standard
lays down)
Certification of
organic system
Non-certified (formerly
certified)
Non-certified Certified
Number of
farms exposed
to the
intervention
500 10,000 approx. 3,000
Number of
organic farms
at the time of
the study
266 2,500 approx. 2,000 (certified)
18
1.5.2 County descriptions
Murang’a
Murang’a County lies between latitudes 0°34′ and 1°7′ South and longitudes 36°36′ and 37°27′
East. Occupying a total area of 2,558.8 km2 (MCDIP, 2017b; KNBS, 2015), the county lies
between 914 meters above sea level (MASL) in the east and 3,353 MASL along the slopes of
the Aberdare Mountains in the west. The county is divided into six agro-ecological zones.
Agro-ecological zone one (AEZ 1) consists of the highlands where forestry, tea, and the
tourism industry form the most important economic activities (MCDIP, 2017b; KNBS, 2015.
AEZs 2 and 3 are the lowlands east of the Aberdare Mountains, generally suitable for both
coffee and dairy farming (MCDIP, 2017b; KNBS, 2015). The flatter area of the Makuyu
division of Maragwa constituency is characterized by arid and semi-arid conditions (MCDIP,
2017b; KNBS, 2015). This area forms AEZs 4, 5, and 6. In these zones, coffee and pineapple
plantations thrive through irrigation (MCDIP, 2017b; KNBS, 2015). The total area under food
crops farming is 180,225 ha, and 42,980 ha is under cash crop farming (MCDIP, 2017b; KNBS;
2015). Food crop farming is practiced in all parts of the county, but cash crop farming is
practiced in the upper and some lower zones of the county (MCDIP, 2017b; KNBS, 2015). The
main livestock bred in the county include cattle, pigs, goats, sheep, rabbits, and chickens. The
county has five indigenous gazetted forests covering a total area of 254.4 km2. It has 108,352
ha under farm forestry while 11,156 ha are under organic farming (MCDIP, 2017b; KNBS,
2015).
Kirinyaga
Kirinyaga County is located between latitudes 0°1’ and 0°40’ South and longitudes 37° and 38°
East. The county covers an area of 1,478.1 km2 and lies between 1,158 and 5,380 MASL in the
south and at the peak of Mt. Kenya, respectively (KCIDP, 2017; KNBS, 2015). The county
can be divided into three ecological zones; the lowland, midland and highland areas. It has a
tropical climate and an equatorial rainfall pattern with two rainy seasons. The long rains are
characterized by average precipitation of 2,147 mm per month which occur between March to
May. The short rains with an average precipitation of 1,212 mm per month occur in October
and November (KCIDP, 2017; KNBS, 2015). The most important crops are rice, coffee,
bananas, tomatoes, beans, mangoes, maize and other horticultural crops (KCIDP, 2017; KNBS,
2015). The total arable land in the county is 116,980 ha, which represents 79% of the total land
area. The main types of forests are indigenous natural forests that cover an area of 35,876 ha,
19
plantations (1,540 ha), bamboo forests (7,500 ha), bushland/grassland forests (6,956 ha) and
tea zone forests that cover 290 ha (KCIDP, 2017; KNBS, 2015). Certification for organic
farming under macadamia nut was first carried out by IMO (Institute for Market Ecology) and
later by Ecocert (which expanded the certification to avocado too). Groups of tea and coffee
producers were certified by the Rainforest Alliance.
Machakos
Machakos County lies between latitudes 0º45´ and 1º31´ South and longitudes 36º45´ and
37º45´ East. The county covers an area of 6208.2 km², with most of it being semi-arid (MCIDP,
2017; KNBS, 2015). The county receives bimodal rainfall with short rains from October to
December and long rains from March to May. The average annual rainfall is between 500 to
1300mm and is unevenly distributed and unreliable (MCIDP, 2017; KNBS, 2015). The
temperature varies between 18 and 29˚C throughout the year. The coldest month is July and
the warmest months are October and March before the onset of the rains. Dry periods are
experienced from February to March and August to September (MCIDP, 2017; KNBS, 2015).
Agriculture is the predominant economic activity in terms of employment, food security, and
income earnings. The main cash crops include sorghum, French beans, coffee and pineapple
while the main food crops normally grown on small scale are maize, common bean, pigeon pea
and cassava (MCIDP, 2017; KNBS, 2015). The total arable land in the county is 372,020 ha,
of which 248,333 ha is under crop production. The total area under food crops is 161,695 ha,
and under cash crops 86,638 ha. The average farm size under small-scale farming is 0.76 ha
while large farms occupy about 10 ha (MCIDP, 2017; KNBS, 2015). According to the 2009
Kenya population and housing census, the number of livestock in the county was cattle
230,891, sheep 126,608, goats 629,974, indigenous poultry 862,592, pigs 4,026, donkeys
21,336 and beehives 46,370.
1.5.3 Farm Selection for the study
Kenya has 47 counties and many NGOs working on organic farming. This study selected three
counties, each with different NGOs working with correspondingly different approaches to
organic farming. The study is more representative because a) it compares organic and
conventional farming, and b) it includes a county level analysis. The Kenya Organic
Agriculture Network (KOAN) has over 200,000 farmers, exporters, and works with partner
organizations throughout Kenya. Murang’a, Kirinyaga, and Machakos counties were selected
because they have the highest number of organic farms in the country. The initial meetings was
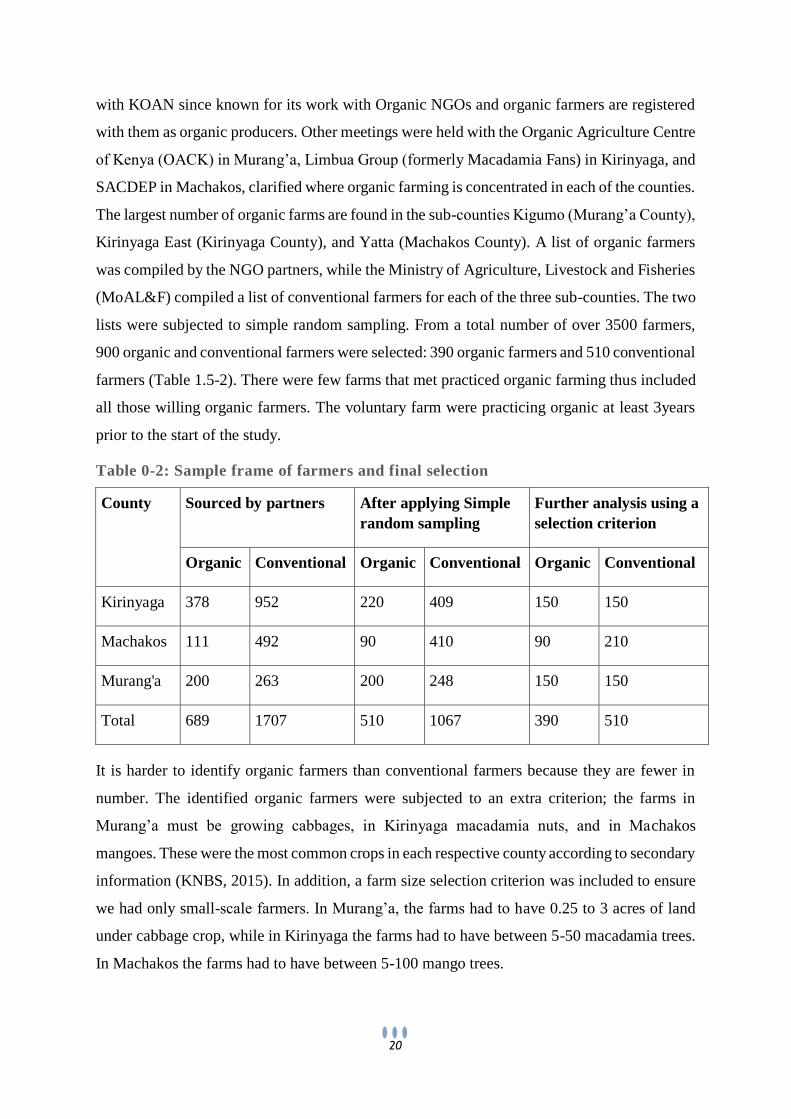
20
with KOAN since known for its work with Organic NGOs and organic farmers are registered
with them as organic producers. Other meetings were held with the Organic Agriculture Centre
of Kenya (OACK) in Murang’a, Limbua Group (formerly Macadamia Fans) in Kirinyaga, and
SACDEP in Machakos, clarified where organic farming is concentrated in each of the counties.
The largest number of organic farms are found in the sub-counties Kigumo (Murang’a County),
Kirinyaga East (Kirinyaga County), and Yatta (Machakos County). A list of organic farmers
was compiled by the NGO partners, while the Ministry of Agriculture, Livestock and Fisheries
(MoAL&F) compiled a list of conventional farmers for each of the three sub-counties. The two
lists were subjected to simple random sampling. From a total number of over 3500 farmers,
900 organic and conventional farmers were selected: 390 organic farmers and 510 conventional
farmers (Table 1.5-2). There were few farms that met practiced organic farming thus included
all those willing organic farmers. The voluntary farm were practicing organic at least 3years
prior to the start of the study.
Table 0-2: Sample frame of farmers and final selection
County Sourced by partners After applying Simple
random sampling
Further analysis using a
selection criterion
Organic Conventional Organic Conventional Organic Conventional
Kirinyaga 378 952 220 409 150 150
Machakos 111 492 90 410 90 210
Murang'a 200 263 200 248 150 150
Total 689 1707 510 1067 390 510
It is harder to identify organic farmers than conventional farmers because they are fewer in
number. The identified organic farmers were subjected to an extra criterion; the farms in
Murang’a must be growing cabbages, in Kirinyaga macadamia nuts, and in Machakos
mangoes. These were the most common crops in each respective county according to secondary
information (KNBS, 2015). In addition, a farm size selection criterion was included to ensure
we had only small-scale farmers. In Murang’a, the farms had to have 0.25 to 3 acres of land
under cabbage crop, while in Kirinyaga the farms had to have between 5-50 macadamia trees.
In Machakos the farms had to have between 5-100 mango trees.
21
2. Chapter : Productivity and profitability in organic and
conventional farming systems in Kenya
2.1 Introduction
Sub-Saharan Africa (SSA) is faced with the challenge of feeding its rapidly growing population of
over 1 billion people (Baquedano et al., 2020; FAO, 2020). SSA has the largest number and highest
share of its population that is food insecure in the world (Baquedano et al., 2020; FAO, 2020). Among
the SSA regions, East Africa has the most food-insecure people (Baquedano et al., 2020). The
situation is made even worse by a growing trend in the prevalence of hunger, worsened by conflict,
climate extremes, and economic slowdowns, and at times a combination of these challenges (FAO,
2020). Thus drastic transformations in the agricultural sector are needed to catalyze the sector's
growth by targeted research and effective policies to ensure that the region can sustainably provide
adequate nutritious food, feed, fiber, and fuel for its population (Mueller et al., 2012; Müller et al.,
2018; Reganold & Wachter, 2016).
Agriculture is a major driver of the Kenyan economy and is the dominant source of employment
(Wankuru et al., 2019). The agriculture sector contributes on average 21.9% of gross domestic
product (GDP), with at least 56% of the total labour force employed in agriculture in 2017 (Wankuru
et al., 2019). Kenya’s agriculture sector is faced with constraints that affect production, inputs, post-
harvest processing, and access to markets (KNBS, 2020). Production constraints include an
unpredictable climate, pests and diseases, low soil fertility and land fragmentation. Input challenges
include a narrow technology horizon, use of low yielding varieties, limited extension services, input
price volatility, and poor mechanization in the post-harvest stage (limited and poor pre- and post-
harvest handling technologies including inappropriate storage leading to losses, insufficient
aggregation centres, and limited mechanization across the value chain) (KNBS, 2020; GOK, 2019).
Further constraints include a limited range of products, and an unorganized marketing system (poor
market access, policy regulatory shifts, and crop price volatility) (GOK, 2019).
The intensive use of natural resources by conventional farming methods lead to high pollution of
soils, water, and air, chemical residuals in food, increased depletion of natural resources (like oil, gas,
and coal), and an increased social cost of production (Crowder & Reganold, 2015; Godfray et al.,
2010; Rockstrom et al., 2009). Alternative farming methods such as organic farming that are more
environmentally friendly and health cognizant are on the rise (Berhane et al., 2015; Crowder &
Reganold, 2015; Tanrivermiş, 2006). Organic farming has the potential benefits of ecological
protection, preservation of non-renewable resources, improved food quality, decrease in output
surplus products, and reorganization of market demand (Berhane et al., 2015; Brzezina et al., 2016;
22
Tanrivermiş, 2006). The demand for organic foods in the world is evident and rising (Crowder &
Reganold, 2015; Meemken & Qaim, 2018; Seufert & Ramankutty, 2017). Studies that provide
science-based evidence of the productivity and profitability of organic farming systems help guide
the agricultural sector in a more sustainable direction; however such studies are few in number
(Ahmad & Heng, 2012; Gomiero et al., 2011).
Organic farming offers several direct benefits to producers, such as reduced external input costs,
improved agricultural techniques, and improved quality of the environment and food (Tanrivermiş,
2006). However, there are very few studies that provide science-based evidence of the productivity
and profitability of organic farming systems (Crowder & Reganold, 2015; Seufert & Ramankutty,
2017; Smith et al., 2019), especially in non-industrialized countries which represent only a small
fraction of the overall scientific literature on the topic (De Ponti et al., 2012; Ponisio et al., 2014).
The meta-analyses by Seufert and Ramankutty (2017) and Te Pas and Rees (2014) on yields and
profits; and Crowder and Reganold (2015) and Meemken and Qaim (2018) on profitability, were
done using datasets from Europe, the USA, and Asia and contribute to a huge dataset. However data
from Africa is limited to a few studies.
Studying farmer practices gives the realities or the true picture of the operations and challenges
experienced in each farming system (Reganold & Wachter, 2016; Shennan et al., 2017). In Africa the
few studies done can be grouped into field experiments (Adamtey et al., 2016; Cavigelli et al., 2013),
on-farm studies (Ndungu et al., 2013), case studies (Chiputwa et al., 2014), adoption studies (Ahmad
& Heng, 2012) or farmer experiences’ studies. These studies are done either with a combination of a
single crop or multiple crops, looking at either organic and conventional crops or organic on its own;
but few compare organic and conventional farming systems. Farmer experiences are the least studied
area. In Africa, field experiments have been carried out that focus on productivity and profitability,
on either one crop or several crops in different localities (Adamtey et al., 2016). Fewer are the on-
farm studies that evaluate crop performance, i.e. productivity and profitability (De Bon et al., 2018).
These studies are insufficient in number to draw the attention of African governments to support the
organic sector (De Bon et al., 2018). In other words, a lot of research is needed to support farmers’
efforts.
In this chapter, an assessment of the effect of type of farming system (organic versus conventional)
on yield and profitability for various crops in three counties of Kenya is reported.
23
2.2 Literature review
2.2.1 Comparative assessments of productivity (yield) in organic and conventional farms
In past studies that compare organic and conventional systems, yields are shown to be either lower,
similar, or higher in one system. A comprehensive meta-analysis of 66 studies by Seufert and
Ramankutty (2017) found that the average yield of organic production is 25% lower than that of
conventional systems. The organic yields in cereals and vegetables were significantly lower than the
conventional crops (-3 and -11% respectively) (Seufert and Ramankutty, 2017). A study of maize
grain yields over a 22 year period found that yields were higher from conventional (5,903 kg/ha) than
organic systems (4,483 kg/ha) in the first five years (Pimentel et al., 2005) though after the transitional
period the corn grain yields were similar between systems (6451 kg/ha during normal rainfall).
Another study from Gopinath et al. (2008), shows that wheat produced using mineral fertilizer
developed more grains per ear than those receiving organic fertility amendments, but the yield gap
between conventional and organic fields narrowed in the next season (Gopinath et al., 2008).
Cavigelli et al. (2013) in the USA found that conventional maize and soybean yielded 29% and 19%
more, respectively, than organically produced maize and soybean; however wheat yields were similar
averaging 4.09 t/ha (Cavigelli et al., 2013). De Ponti et al. (2012) conducted a meta-analysis of 135
publications finding that organic yields were lower than conventional yields by 20%. The data reveal
that there was no significant substantial change in organic yields in the period 2004-2010 compared
with the period before 2004 (De Ponti et al., 2012). The yields of organic crops and per/ha organic
livestock production is found to be lower than for conventional management by Hopkins and Morris
(2002). Other studies in smallholder farms have similarly found that yields from conventional farming
are higher than organic. Krause and Machek (2018) found up to 12% lower yields in organic farms
as compared to conventional in Czech Republic. A study by Sharma (2020) in India found
conventional farms had higher yields by 11% than organic in medicinal and aromatic plants. A study
by Lu et al. (2020) in Taiwan found organic rice yield was 4,500 compared to conventional yields of
5,000 kg dried rice per ha.
A study by Gurbir et al., 2021, on the long term farming system comparisons in the tropics 2007-
2019 in Kenya, India and Bolivia found that in Kenya the organic and conventional high input for
maize had almost similar yields. In India soybeans has similar yields for organic and conventional
high input. The study reports that organic yields can match conventional ones depending on crop and
agronomic management practices (Gurbir et al., 2021). Suja et al. (2017) showed that there was a
similar yield performance of taro under organic and conventional systems (10.61 and 11.12 ton/ha
respectively) in small-scale farms in India. The yield attributes measured were corms number, average
weight of corms, maturity index (mother or young corms). The number of mother corms were the
24
same between organic and conventional (Suja et al., 2017). Eyhorn et al. (2018) revealed that organic
farms in small-scale farms in India could get similar yields to conventional in cereals and pulses with
considerably lower use of external inputs.
Field experiments have shown mixed results on lentil production: over the period 2012 to 2016,
Eyhorn et al. (2018) found the yields higher in the first year for conventional (by 14%) while in 2016
organic yields were higher by just 2%. A study by Ostapenko et al. (2020) on the evaluation of organic
products in Ukrainian small-holder farms showed that organic crop enterprises had higher yields
compared to conventional farms except for wheat which was not significantly different (organic
41.3kg/ha vs. conventional 41.5kg/ha). The organic yield levels for maize were 133.6% higher (80.3
kg/ha compared to 60.1 kg/ha); and for sunflower 112.3% higher (27.1 kg/ha compared to 24.1 kg/ha)
(Ostapenko et al. 2020). Krause and Machek (2018) reported higher yields in organic strawberries
compared to conventional smallholder farms in the Czech Republic.
The results from the above studies show that my study may get results that support either organic or
conventional small-scale farming systems. Other studies have compared organic and conventional
systems in terms of yields, costs, price, and profitability (Hopkins & Morris, 2002). In non-
industrialized countries, organic farming generally leads to higher profits due to higher yields,
reduced costs, and the price premiums of organic products (Nemes, 2009). Te Pas and Rees (2014)
analyzed the differences between organic and conventional farms in countries in the tropics and
subtropics. They used data from 88 papers with 458 data pairs to make comparisons in yield, gross
margins, and soil organic carbon. The results revealed that under organic management, yields were
on average about 26% higher and with a gross margins of 51% higher than under conventional
management (Te Pas & Rees, 2014). The highest yields in organic systems in industrialized countries
were on coarse soils in arid regions. The main reason for differences between organic and
conventional systems for the gross margins, was the certification process (Te Pas & Rees, 2014).
Higher yields alone are not the absolute solution to the problem of food security, as there are multiple
social, political, and economic contributing factors to the benefits obtained by farmers (Ponisio et al.,
2014; Vasilikiotis, 2000). For example, a market is necessary before farmers can receive price
premiums for organic produce.
This section has revealed that while some studies show that higher yields from organic farming are
higher (Auerbach et al., 2013; Te Pas & Rees, 2014; UNEP-UNCTAD, 2008) others report lower
yields compared to conventional farming (Connor, 2013; Kirchmann et al., 2016; Ponisio et al., 2014;
Seufert & Ramankutty, 2017). This confirms that the yield gap between organic and conventional
farming is highly dependent on the location as well as the crop (Adamtey et al., 2016; De Ponti et al.,
2012; Seufert & Ramankutty, 2017), besides other factors such as mechanization or climate.
25
2.2.2 Comparative evaluations of profitability in organic and conventional farms
Profitability studies that compare organic and conventional systems show similar patterns to studies
of yields: either lower, similar or higher profitability for either farming system. A study by Crowder
and Reganold (2015) examined the financial performance of organic and conventional agriculture
through a meta-analysis of a dataset of 55 crops across five continents. The results show that when
organic premiums are not applied, the benefit/cost ratios (range of -8 to -7%) and net present values
(-27 to -23%) of organic agriculture are significantly lower than conventional. Another study found
that conventional farming systems had higher gross margins (21%) in the first year of a two-year
rotation but organic gross margins were greater after the second cycle (Forster et al., 2013). Froehlich
et al. (2018) show that organic producers’ profits were 7-10% lower than conventional producers’ in
Brazil. The low profitability was due to regional particularities, the crops cultivated, farm types, farm
characteristics, regional-specific policies, and the presence of price premiums (Froehlich et al., 2018).
Meemken and Qaim (2018) found that without the organic certification contribution to higher
profitability in smaller organic farms, conventional farms gave higher profits. They conclude that
organic farming is only profitable when farmers receive support such as subsidies or from
development projects (Meemken & Qaim, 2018).
Profitability is similar for conventional and organic farms in the European Union (EU), although there
is considerable variability within samples, between sectors, and between the opportunities and
challenges for organic farming and small-scale farmers across EU countries (Greer & Hunt, 2011;
Jouzi et al., 2017; Nieberg et al., 2003). In a study by Mohamad et al. (2014) conducted in Italy the
initial and future investments of organic and conventional olive operations were found to be similar.
The net present value for organic systems was 6% greater than conventional (€ 16,041 per ha vs. €
15,118 per ha respectively). The internal rate of return was higher in organic (3.51%) than
conventional (3.37%) (Mohamad et al., 2014).
A comparative study on the economic profitability of organic and conventional farming in India
reveals that although crop productivity in organic farming decreased by 9.2%, due to a 20 to 40%
price premium and an 11.7% reduction in the production cost, net profits of farmers still increased by
22% (Ramesh et al., 2010). Where farmers benefit from premium prices in the organic system, this
leads to significantly more profitable organic systems (by 22-35%) with a higher benefit/cost ratio
(of 20-24%) as compared to conventional farming systems (Crowder & Reganold, 2015). The authors
conclude that organic can continue to expand even if premiums decline as organic production has
multiple sustainability benefits (ibid.). Sgroi et al. (2015) compared lemon farms in Italy and found
that the gross production value of organic farms (€ 6138 per ha) is almost ten times higher than in
conventional farms (€ 649 per ha) (Sgroi et al., 2015). Bett and Ayieko (2016) found that in Kenya,
26
the net present value of low input organic farms (KES 22,561 per ha or € 275 per ha) was greater than
conventional systems (KES 21,878 per ha or € 267 per ha). Another study in Cavigelli et al. (2013)
showed that the net returns for conventional systems (US$ 78 per acre) were lower than for organic
systems (US$ 286 per acre). The economic risk, with similar rotation lengths of three years, was
greater for conventional systems than for organic (Cavigelli et al., 2013).
Several other studies show that organic products are more profitable due to premium prices (Fess &
Benedito, 2018; Smith et al., 2019a). In India, organic Basmati rice is shown to be 105% more
profitable than conventionally managed Basmati; and organic had higher gross margins for Basmati
rice, coarse paddy, wheat, and lentils (Eyhorn et al., 2018). A study by Şurcă (2018) in Romania
shows that organic rice had a gross margin of lei -443 per ha (€ -90.81 per ha) than conventional lei
-1487 per ha (€ -304.83 per ha). Other studies reveal that organic had greater profitability than
conventional farming (Hampl, 2020). Organic enterprises in the Ukraine had an average profit of €
218 per ha compared to conventional farms getting an average of € 149 per ha (Ostapenko et al.,
2020). Other comparative studies of organic tea in China and Sri Lanka (Qiao et al., 2016), rice in
the Philippines (Mendoza, 2004; Pantoja et al., 2016), honey in Ethiopia (Girma & Gardebroek,
2015), cotton in India (Fayet & Vermeulen, 2014) and pineapple in Ghana (Kleemann, 2016), suggest
that organic farming can be profitable and is a feasible option for smallholders living in difficult
environmental situations.
My study seeks to add to the literature on organic farming with a focus on Kenya, as few comparative
studies have been carried out in Africa, sub-Saharan Africa and at the country level on the profitability
of organic and conventional agriculture. A two-year dataset was generated by a study of 849 farms,
which includes data on at least ten selected commonly grown crops in three counties of Kenya. The
methodology of this study is presented in the next section.
2.3 Methodology
2.3.1 Study area and data
The study was conducted in three counties in Kenya (Murang’a, Kirinyaga, and Machakos). Detailed
characteristics of the study sites are given in Chapter 1. Of the targeted 900 farms, a total of 864 farms
were interviewed consistently for the two-year period (Table 2.3-1). Data analysis was carried out for
849 of the farms, as 15 farms were dropped out because of inconsistencies in their data during data
cleaning (similar data, same farm, incomplete data, e.g. missing yields or some seasons, etc.).
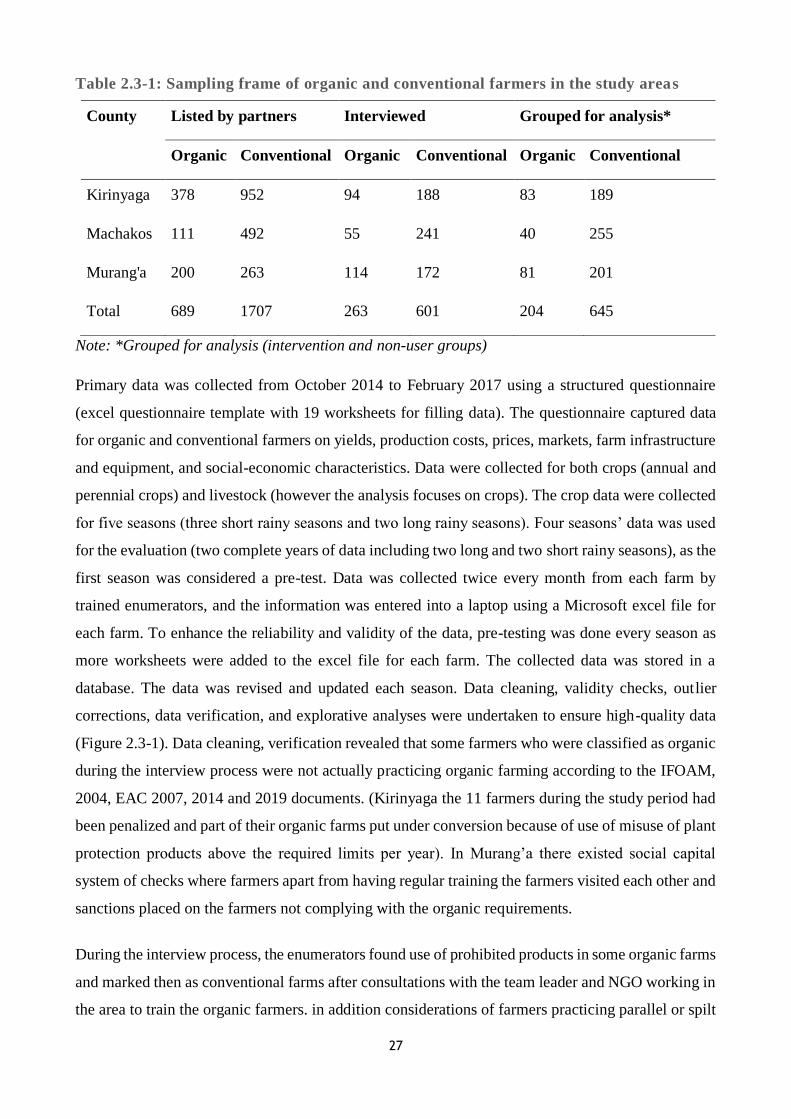
27
Table 2.3-1: Sampling frame of organic and conventional farmers in the study areas
County Listed by partners Interviewed Grouped for analysis*
Organic Conventional Organic Conventional Organic Conventional
Kirinyaga 378 952 94 188 83 189
Machakos 111 492 55 241 40 255
Murang'a 200 263 114 172 81 201
Total 689 1707 263 601 204 645
Note: *Grouped for analysis (intervention and non-user groups)
Primary data was collected from October 2014 to February 2017 using a structured questionnaire
(excel questionnaire template with 19 worksheets for filling data). The questionnaire captured data
for organic and conventional farmers on yields, production costs, prices, markets, farm infrastructure
and equipment, and social-economic characteristics. Data were collected for both crops (annual and
perennial crops) and livestock (however the analysis focuses on crops). The crop data were collected
for five seasons (three short rainy seasons and two long rainy seasons). Four seasons’ data was used
for the evaluation (two complete years of data including two long and two short rainy seasons), as the
first season was considered a pre-test. Data was collected twice every month from each farm by
trained enumerators, and the information was entered into a laptop using a Microsoft excel file for
each farm. To enhance the reliability and validity of the data, pre-testing was done every season as
more worksheets were added to the excel file for each farm. The collected data was stored in a
database. The data was revised and updated each season. Data cleaning, validity checks, outlier
corrections, data verification, and explorative analyses were undertaken to ensure high-quality data
(Figure 2.3-1). Data cleaning, verification revealed that some farmers who were classified as organic
during the interview process were not actually practicing organic farming according to the IFOAM,
2004, EAC 2007, 2014 and 2019 documents. (Kirinyaga the 11 farmers during the study period had
been penalized and part of their organic farms put under conversion because of use of misuse of plant
protection products above the required limits per year). In Murang’a there existed social capital
system of checks where farmers apart from having regular training the farmers visited each other and
sanctions placed on the farmers not complying with the organic requirements.
During the interview process, the enumerators found use of prohibited products in some organic farms
and marked then as conventional farms after consultations with the team leader and NGO working in
the area to train the organic farmers. in addition considerations of farmers practicing parallel or spilt
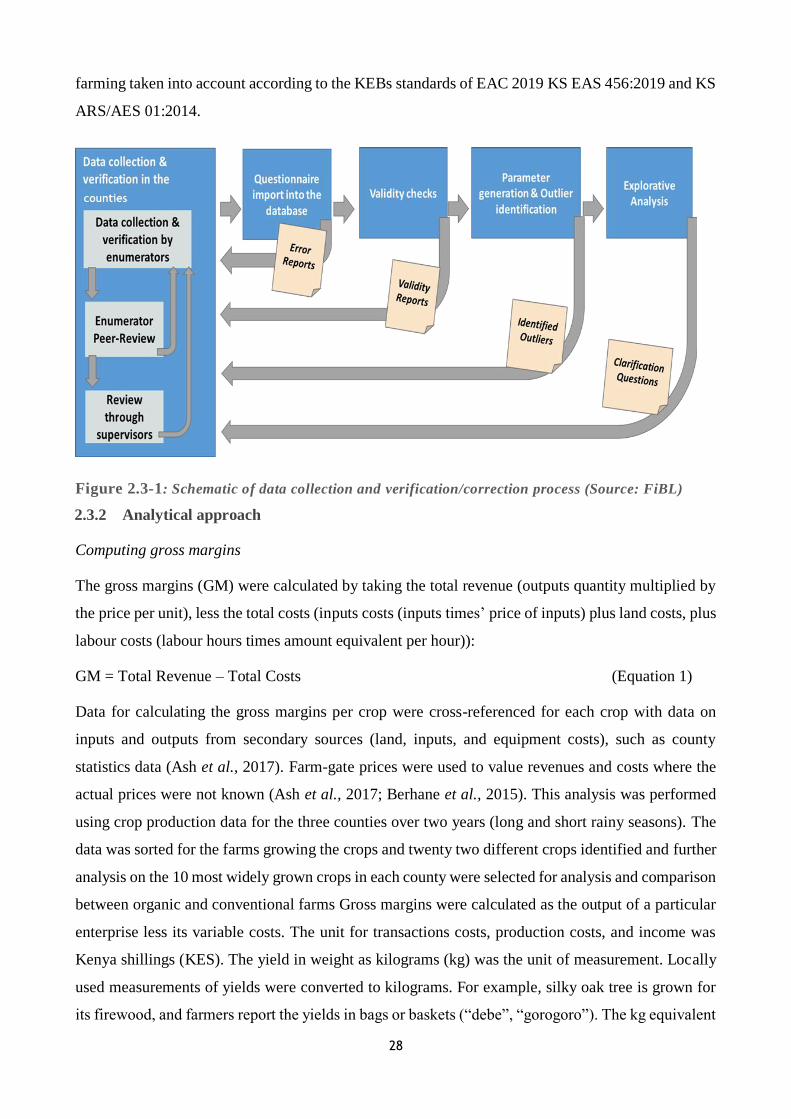
28
farming taken into account according to the KEBs standards of EAC 2019 KS EAS 456:2019 and KS
ARS/AES 01:2014.
Figure 2.3-1: Schematic of data collection and verification/correction process (Source: FiBL)
2.3.2 Analytical approach
Computing gross margins
The gross margins (GM) were calculated by taking the total revenue (outputs quantity multiplied by
the price per unit), less the total costs (inputs costs (inputs times’ price of inputs) plus land costs, plus
labour costs (labour hours times amount equivalent per hour)):
GM = Total Revenue – Total Costs (Equation 1)
Data for calculating the gross margins per crop were cross-referenced for each crop with data on
inputs and outputs from secondary sources (land, inputs, and equipment costs), such as county
statistics data (Ash et al., 2017). Farm-gate prices were used to value revenues and costs where the
actual prices were not known (Ash et al., 2017; Berhane et al., 2015). This analysis was performed
using crop production data for the three counties over two years (long and short rainy seasons). The
data was sorted for the farms growing the crops and twenty two different crops identified and further
analysis on the 10 most widely grown crops in each county were selected for analysis and comparison
between organic and conventional farms Gross margins were calculated as the output of a particular
enterprise less its variable costs. The unit for transactions costs, production costs, and income was
Kenya shillings (KES). The yield in weight as kilograms (kg) was the unit of measurement. Locally
used measurements of yields were converted to kilograms. For example, silky oak tree is grown for
its firewood, and farmers report the yields in bags or baskets (“debe”, “gorogoro”). The kg equivalent
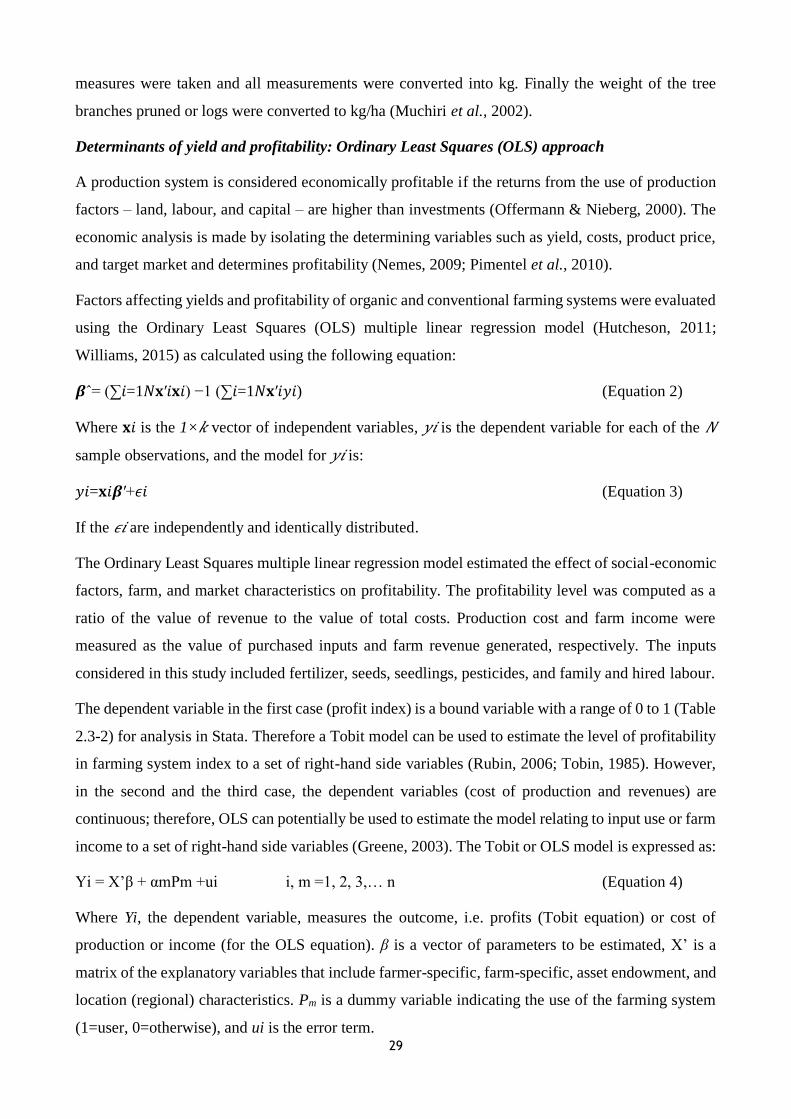
29
measures were taken and all measurements were converted into kg. Finally the weight of the tree
branches pruned or logs were converted to kg/ha (Muchiri et al., 2002).
Determinants of yield and profitability: Ordinary Least Squares (OLS) approach
A production system is considered economically profitable if the returns from the use of production
factors – land, labour, and capital – are higher than investments (Offermann & Nieberg, 2000). The
economic analysis is made by isolating the determining variables such as yield, costs, product price,
and target market and determines profitability (Nemes, 2009; Pimentel et al., 2010).
Factors affecting yields and profitability of organic and conventional farming systems were evaluated
using the Ordinary Least Squares (OLS) multiple linear regression model (Hutcheson, 2011;
Williams, 2015) as calculated using the following equation:
𝜷ˆ= (∑𝑖=1𝑁𝐱′𝑖𝐱𝑖) −1 (∑𝑖=1𝑁𝐱′𝑖𝑦𝑖) (Equation 2)
Where 𝐱𝑖 is the 1×𝑘 vector of independent variables, 𝑦𝑖 is the dependent variable for each of the 𝑁
sample observations, and the model for 𝑦𝑖 is:
𝑦𝑖=𝐱𝑖𝜷′+𝜖𝑖 (Equation 3)
If the 𝜖𝑖 are independently and identically distributed.
The Ordinary Least Squares multiple linear regression model estimated the effect of social-economic
factors, farm, and market characteristics on profitability. The profitability level was computed as a
ratio of the value of revenue to the value of total costs. Production cost and farm income were
measured as the value of purchased inputs and farm revenue generated, respectively. The inputs
considered in this study included fertilizer, seeds, seedlings, pesticides, and family and hired labour.
The dependent variable in the first case (profit index) is a bound variable with a range of 0 to 1 (Table
2.3-2) for analysis in Stata. Therefore a Tobit model can be used to estimate the level of profitability
in farming system index to a set of right-hand side variables (Rubin, 2006; Tobin, 1985). However,
in the second and the third case, the dependent variables (cost of production and revenues) are
continuous; therefore, OLS can potentially be used to estimate the model relating to input use or farm
income to a set of right-hand side variables (Greene, 2003). The Tobit or OLS model is expressed as:
Yi = X’β + αmPm +ui i, m =1, 2, 3,… n (Equation 4)
Where Yi, the dependent variable, measures the outcome, i.e. profits (Tobit equation) or cost of
production or income (for the OLS equation). β is a vector of parameters to be estimated, X’ is a
matrix of the explanatory variables that include farmer-specific, farm-specific, asset endowment, and
location (regional) characteristics. Pm is a dummy variable indicating the use of the farming system
(1=user, 0=otherwise), and ui is the error term.
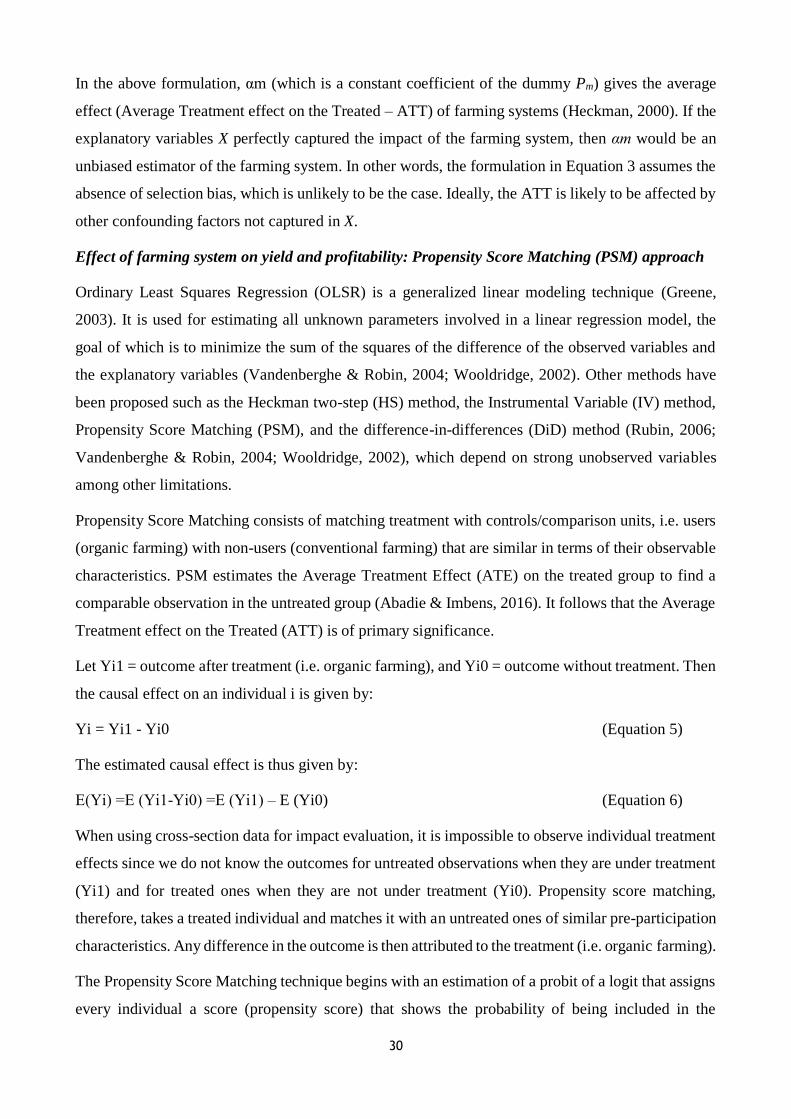
30
In the above formulation, αm (which is a constant coefficient of the dummy Pm) gives the average
effect (Average Treatment effect on the Treated – ATT) of farming systems (Heckman, 2000). If the
explanatory variables X perfectly captured the impact of the farming system, then αm would be an
unbiased estimator of the farming system. In other words, the formulation in Equation 3 assumes the
absence of selection bias, which is unlikely to be the case. Ideally, the ATT is likely to be affected by
other confounding factors not captured in X.
Effect of farming system on yield and profitability: Propensity Score Matching (PSM) approach
Ordinary Least Squares Regression (OLSR) is a generalized linear modeling technique (Greene,
2003). It is used for estimating all unknown parameters involved in a linear regression model, the
goal of which is to minimize the sum of the squares of the difference of the observed variables and
the explanatory variables (Vandenberghe & Robin, 2004; Wooldridge, 2002). Other methods have
been proposed such as the Heckman two-step (HS) method, the Instrumental Variable (IV) method,
Propensity Score Matching (PSM), and the difference-in-differences (DiD) method (Rubin, 2006;
Vandenberghe & Robin, 2004; Wooldridge, 2002), which depend on strong unobserved variables
among other limitations.
Propensity Score Matching consists of matching treatment with controls/comparison units, i.e. users
(organic farming) with non-users (conventional farming) that are similar in terms of their observable
characteristics. PSM estimates the Average Treatment Effect (ATE) on the treated group to find a
comparable observation in the untreated group (Abadie & Imbens, 2016). It follows that the Average
Treatment effect on the Treated (ATT) is of primary significance.
Let Yi1 = outcome after treatment (i.e. organic farming), and Yi0 = outcome without treatment. Then
the causal effect on an individual i is given by:
Yi = Yi1 - Yi0 (Equation 5)
The estimated causal effect is thus given by:
Ε(Yi) =Ε (Yi1-Yi0) =Ε (Yi1) – E (Yi0) (Equation 6)
When using cross-section data for impact evaluation, it is impossible to observe individual treatment
effects since we do not know the outcomes for untreated observations when they are under treatment
(Yi1) and for treated ones when they are not under treatment (Yi0). Propensity score matching,
therefore, takes a treated individual and matches it with an untreated ones of similar pre-participation
characteristics. Any difference in the outcome is then attributed to the treatment (i.e. organic farming).
The Propensity Score Matching technique begins with an estimation of a probit of a logit that assigns
every individual a score (propensity score) that shows the probability of being included in the
31
matching process. Mathematically, the match treated and untreated observations on the estimated
probability of being treated can be expressed as:
Prob(x) = Prob [P=1|X=x] (Equation 7)
Where P=1 is the observable treatment (user of treatment) and 0 otherwise; X is a vector of pre-
participation characteristics including farmer-specific, farm-specific, asset endowment, and
regional/location variables. The implicit functional form of estimated use the equation given by:
Yi = f(X) + e (Equation 8)
Where e is the random error term.
The estimated scores are then used for matching the treated and untreated.
Entropy balancing using ebalance (a Stata Package)
Methods such as nearest neighbor matching or propensity score techniques have become popular in
the social sciences in recent years to pre-process data before the estimation of causal effects in
observational studies with binary treatments under the selection on observables assumption (Ho, Imai,
King, & Stuart, 2007; Sekhon, 2009). The goal in pre-processing is to adjust the covariate distribution
of the control group data by reweighting or discarding of units, such that it becomes more similar to
the covariate distribution in the treatment group. This pre-processing step can reduce model
dependency for the subsequent analysis of treatment effects in the pre-processed data using standard
methods such as regression analysis (Abadie & Imbens, 2011).
The data analysis used a Stata package known as ebalance (Williams, 2015), which implements the
entropy balancing method as described in Hainmueller (2012). The package is distributed through the
Statistical Software Components (SSC) archive – often called the Boston College Archive – at
http://ideas.RePEc.org/c/boc/bocode/s457326.html.1. The key function of the ebalance package is
that it allows users to fit the entropy balancing weights and offers various options to specify the
balance constraints. In the ebalance function, the balance constraints can be flexibly specified with
the targets (numlist) option. The user can choose to adjust the first, second, or third moments of each
covariate. Ebalance [treat] covar [if] [in] [, options]. Stata statistical package 16.1 was used for data
analysis. The variables used in the analysis model were grouped into treatment and independent
variables, as listed in Table 2.3-2.
Table 2.3-2: Variables used in the empirical model
Variable name Variable Definition
'Treatment' variable
Farming system 1=Organic, 0=Conventional
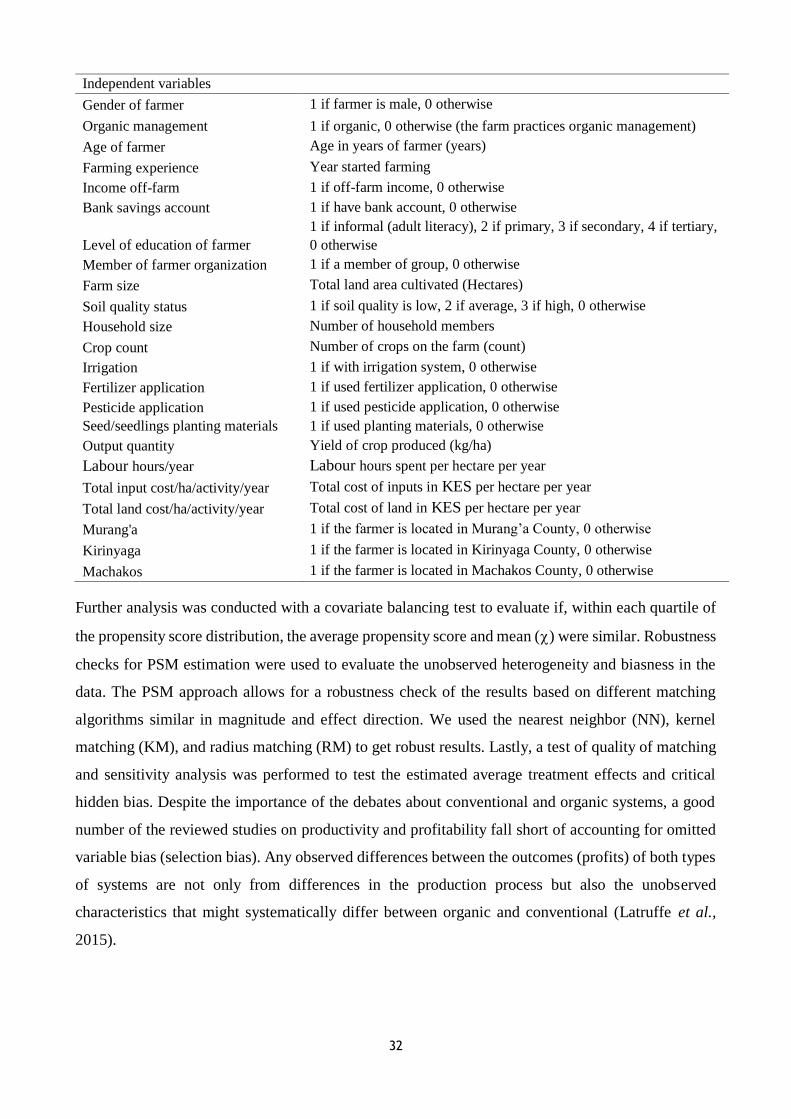
32
Independent variables
Gender of farmer 1 if farmer is male, 0 otherwise
Organic management 1 if organic, 0 otherwise (the farm practices organic management)
Age of farmer Age in years of farmer (years)
Farming experience Year started farming
Income off-farm 1 if off-farm income, 0 otherwise
Bank savings account 1 if have bank account, 0 otherwise
Level of education of farmer
1 if informal (adult literacy), 2 if primary, 3 if secondary, 4 if tertiary,
0 otherwise
Member of farmer organization 1 if a member of group, 0 otherwise
Farm size Total land area cultivated (Hectares)
Soil quality status 1 if soil quality is low, 2 if average, 3 if high, 0 otherwise
Household size Number of household members
Crop count Number of crops on the farm (count)
Irrigation 1 if with irrigation system, 0 otherwise
Fertilizer application 1 if used fertilizer application, 0 otherwise
Pesticide application 1 if used pesticide application, 0 otherwise
Seed/seedlings planting materials 1 if used planting materials, 0 otherwise
Output quantity Yield of crop produced (kg/ha)
Labour hours/year Labour hours spent per hectare per year
Total input cost/ha/activity/year Total cost of inputs in KES per hectare per year
Total land cost/ha/activity/year Total cost of land in KES per hectare per year
Murang'a 1 if the farmer is located in Murang’a County, 0 otherwise
Kirinyaga 1 if the farmer is located in Kirinyaga County, 0 otherwise
Machakos 1 if the farmer is located in Machakos County, 0 otherwise
Further analysis was conducted with a covariate balancing test to evaluate if, within each quartile of
the propensity score distribution, the average propensity score and mean () were similar. Robustness
checks for PSM estimation were used to evaluate the unobserved heterogeneity and biasness in the
data. The PSM approach allows for a robustness check of the results based on different matching
algorithms similar in magnitude and effect direction. We used the nearest neighbor (NN), kernel
matching (KM), and radius matching (RM) to get robust results. Lastly, a test of quality of matching
and sensitivity analysis was performed to test the estimated average treatment effects and critical
hidden bias. Despite the importance of the debates about conventional and organic systems, a good
number of the reviewed studies on productivity and profitability fall short of accounting for omitted
variable bias (selection bias). Any observed differences between the outcomes (profits) of both types
of systems are not only from differences in the production process but also the unobserved
characteristics that might systematically differ between organic and conventional (Latruffe et al.,
2015).
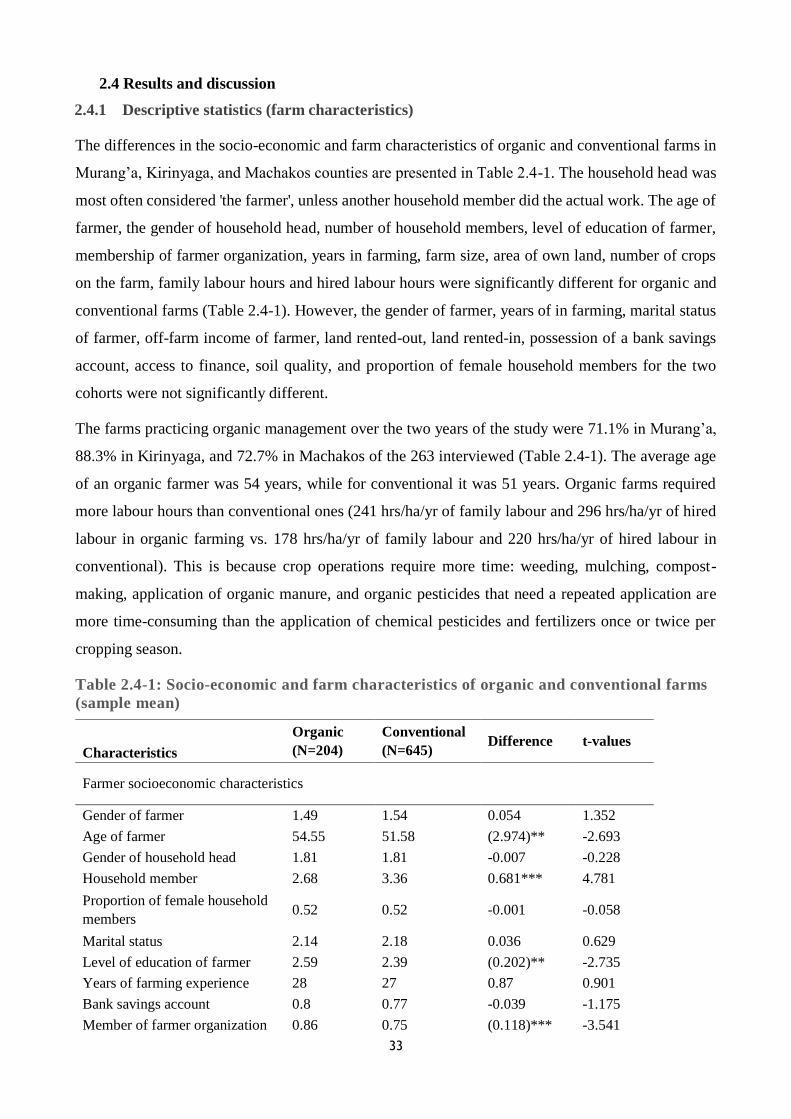
33
2.4 Results and discussion
2.4.1 Descriptive statistics (farm characteristics)
The differences in the socio-economic and farm characteristics of organic and conventional farms in
Murang’a, Kirinyaga, and Machakos counties are presented in Table 2.4-1. The household head was
most often considered 'the farmer', unless another household member did the actual work. The age of
farmer, the gender of household head, number of household members, level of education of farmer,
membership of farmer organization, years in farming, farm size, area of own land, number of crops
on the farm, family labour hours and hired labour hours were significantly different for organic and
conventional farms (Table 2.4-1). However, the gender of farmer, years of in farming, marital status
of farmer, off-farm income of farmer, land rented-out, land rented-in, possession of a bank savings
account, access to finance, soil quality, and proportion of female household members for the two
cohorts were not significantly different.
The farms practicing organic management over the two years of the study were 71.1% in Murang’a,
88.3% in Kirinyaga, and 72.7% in Machakos of the 263 interviewed (Table 2.4-1). The average age
of an organic farmer was 54 years, while for conventional it was 51 years. Organic farms required
more labour hours than conventional ones (241 hrs/ha/yr of family labour and 296 hrs/ha/yr of hired
labour in organic farming vs. 178 hrs/ha/yr of family labour and 220 hrs/ha/yr of hired labour in
conventional). This is because crop operations require more time: weeding, mulching, compost-
making, application of organic manure, and organic pesticides that need a repeated application are
more time-consuming than the application of chemical pesticides and fertilizers once or twice per
cropping season.
Table 2.4-1: Socio-economic and farm characteristics of organic and conventional farms
(sample mean)
Characteristics
Organic
(N=204)
Conventional
(N=645) Difference t-values
Farmer socioeconomic characteristics
Gender of farmer 1.49 1.54 0.054 1.352
Age of farmer 54.55 51.58 (2.974)** -2.693
Gender of household head 1.81 1.81 -0.007 -0.228
Household member 2.68 3.36 0.681*** 4.781
Proportion of female household
members 0.52 0.52 -0.001 -0.058
Marital status 2.14 2.18 0.036 0.629
Level of education of farmer 2.59 2.39 (0.202)** -2.735
Years of farming experience 28 27 0.87 0.901
Bank savings account 0.8 0.77 -0.039 -1.175
Member of farmer organization 0.86 0.75 (0.118)*** -3.541
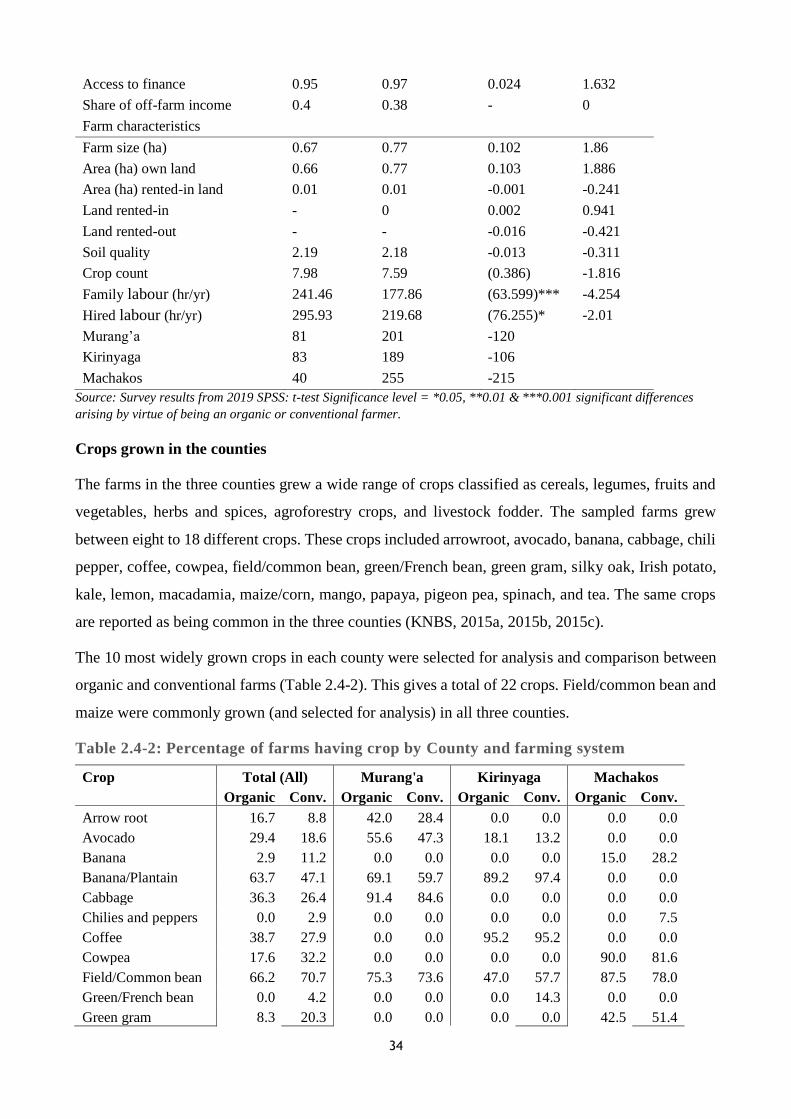
34
Access to finance 0.95 0.97 0.024 1.632
Share of off-farm income 0.4 0.38 - 0
Farm characteristics
Farm size (ha) 0.67 0.77 0.102 1.86
Area (ha) own land 0.66 0.77 0.103 1.886
Area (ha) rented-in land 0.01 0.01 -0.001 -0.241
Land rented-in - 0 0.002 0.941
Land rented-out - - -0.016 -0.421
Soil quality 2.19 2.18 -0.013 -0.311
Crop count 7.98 7.59 (0.386) -1.816
Family labour (hr/yr) 241.46 177.86 (63.599)*** -4.254
Hired labour (hr/yr) 295.93 219.68 (76.255)* -2.01
Murang’a 81 201 -120
Kirinyaga 83 189 -106
Machakos 40 255 -215
Source: Survey results from 2019 SPSS: t-test Significance level = *0.05, **0.01 & ***0.001 significant differences
arising by virtue of being an organic or conventional farmer.
Crops grown in the counties
The farms in the three counties grew a wide range of crops classified as cereals, legumes, fruits and
vegetables, herbs and spices, agroforestry crops, and livestock fodder. The sampled farms grew
between eight to 18 different crops. These crops included arrowroot, avocado, banana, cabbage, chili
pepper, coffee, cowpea, field/common bean, green/French bean, green gram, silky oak, Irish potato,
kale, lemon, macadamia, maize/corn, mango, papaya, pigeon pea, spinach, and tea. The same crops
are reported as being common in the three counties (KNBS, 2015a, 2015b, 2015c).
The 10 most widely grown crops in each county were selected for analysis and comparison between
organic and conventional farms (Table 2.4-2). This gives a total of 22 crops. Field/common bean and
maize were commonly grown (and selected for analysis) in all three counties.
Table 2.4-2: Percentage of farms having crop by County and farming system
Crop Total (All) Murang'a Kirinyaga Machakos
Organic Conv. Organic Conv. Organic Conv. Organic Conv.
Arrow root 16.7 8.8 42.0 28.4 0.0 0.0 0.0 0.0
Avocado 29.4 18.6 55.6 47.3 18.1 13.2 0.0 0.0
Banana 2.9 11.2 0.0 0.0 0.0 0.0 15.0 28.2
Banana/Plantain 63.7 47.1 69.1 59.7 89.2 97.4 0.0 0.0
Cabbage 36.3 26.4 91.4 84.6 0.0 0.0 0.0 0.0
Chilies and peppers 0.0 2.9 0.0 0.0 0.0 0.0 0.0 7.5
Coffee 38.7 27.9 0.0 0.0 95.2 95.2 0.0 0.0
Cowpea 17.6 32.2 0.0 0.0 0.0 0.0 90.0 81.6
Field/Common bean 66.2 70.7 75.3 73.6 47.0 57.7 87.5 78.0
Green/French bean 0.0 4.2 0.0 0.0 0.0 14.3 0.0 0.0
Green gram 8.3 20.3 0.0 0.0 0.0 0.0 42.5 51.4
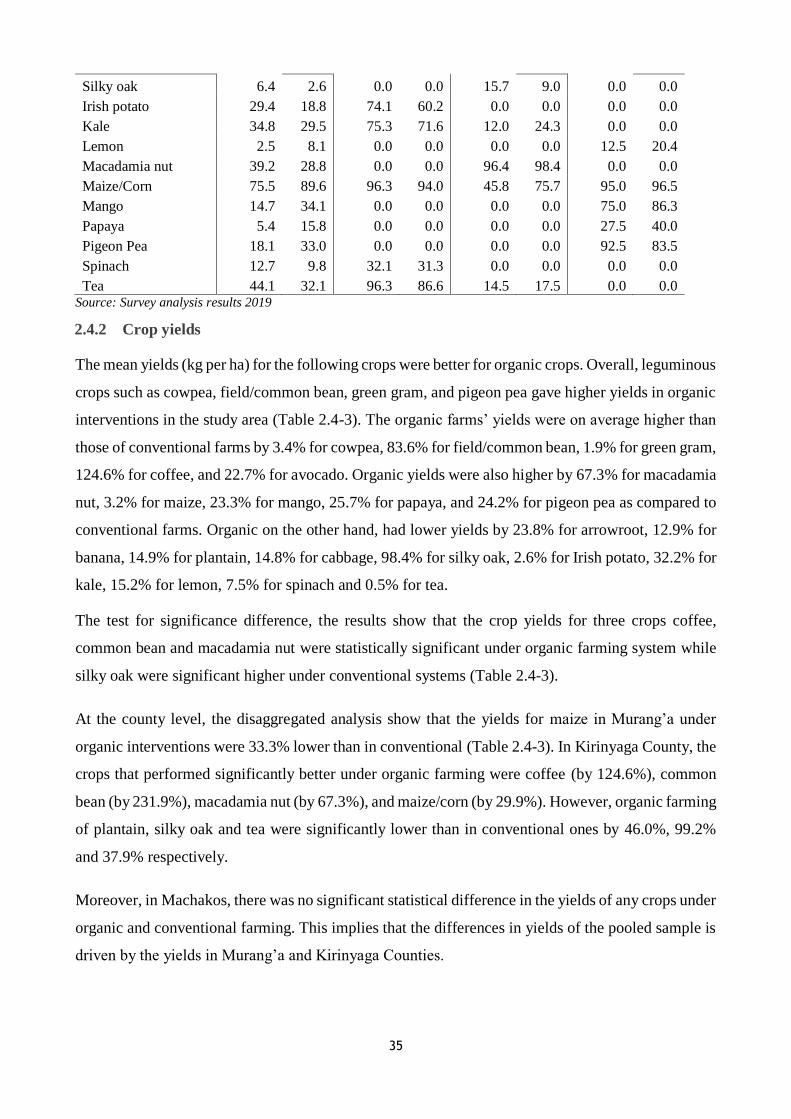
35
Silky oak 6.4 2.6 0.0 0.0 15.7 9.0 0.0 0.0
Irish potato 29.4 18.8 74.1 60.2 0.0 0.0 0.0 0.0
Kale 34.8 29.5 75.3 71.6 12.0 24.3 0.0 0.0
Lemon 2.5 8.1 0.0 0.0 0.0 0.0 12.5 20.4
Macadamia nut 39.2 28.8 0.0 0.0 96.4 98.4 0.0 0.0
Maize/Corn 75.5 89.6 96.3 94.0 45.8 75.7 95.0 96.5
Mango 14.7 34.1 0.0 0.0 0.0 0.0 75.0 86.3
Papaya 5.4 15.8 0.0 0.0 0.0 0.0 27.5 40.0
Pigeon Pea 18.1 33.0 0.0 0.0 0.0 0.0 92.5 83.5
Spinach 12.7 9.8 32.1 31.3 0.0 0.0 0.0 0.0
Tea 44.1 32.1 96.3 86.6 14.5 17.5 0.0 0.0 Source: Survey analysis results 2019
2.4.2 Crop yields
The mean yields (kg per ha) for the following crops were better for organic crops. Overall, leguminous
crops such as cowpea, field/common bean, green gram, and pigeon pea gave higher yields in organic
interventions in the study area (Table 2.4-3). The organic farms’ yields were on average higher than
those of conventional farms by 3.4% for cowpea, 83.6% for field/common bean, 1.9% for green gram,
124.6% for coffee, and 22.7% for avocado. Organic yields were also higher by 67.3% for macadamia
nut, 3.2% for maize, 23.3% for mango, 25.7% for papaya, and 24.2% for pigeon pea as compared to
conventional farms. Organic on the other hand, had lower yields by 23.8% for arrowroot, 12.9% for
banana, 14.9% for plantain, 14.8% for cabbage, 98.4% for silky oak, 2.6% for Irish potato, 32.2% for
kale, 15.2% for lemon, 7.5% for spinach and 0.5% for tea.
The test for significance difference, the results show that the crop yields for three crops coffee,
common bean and macadamia nut were statistically significant under organic farming system while
silky oak were significant higher under conventional systems (Table 2.4-3).
At the county level, the disaggregated analysis show that the yields for maize in Murang’a under
organic interventions were 33.3% lower than in conventional (Table 2.4-3). In Kirinyaga County, the
crops that performed significantly better under organic farming were coffee (by 124.6%), common
bean (by 231.9%), macadamia nut (by 67.3%), and maize/corn (by 29.9%). However, organic farming
of plantain, silky oak and tea were significantly lower than in conventional ones by 46.0%, 99.2%
and 37.9% respectively.
Moreover, in Machakos, there was no significant statistical difference in the yields of any crops under
organic and conventional farming. This implies that the differences in yields of the pooled sample is
driven by the yields in Murang’a and Kirinyaga Counties.
36
2.4.3 Farm profits
Comparison of the profitability of organic and conventional farms involved calculation of the total
cost of producing the crops (Tables 2.4-4), the total revenues generated by the crops (Tables 2.4-5),
and the total profits from the production of the crops (Tables 2.4-6).
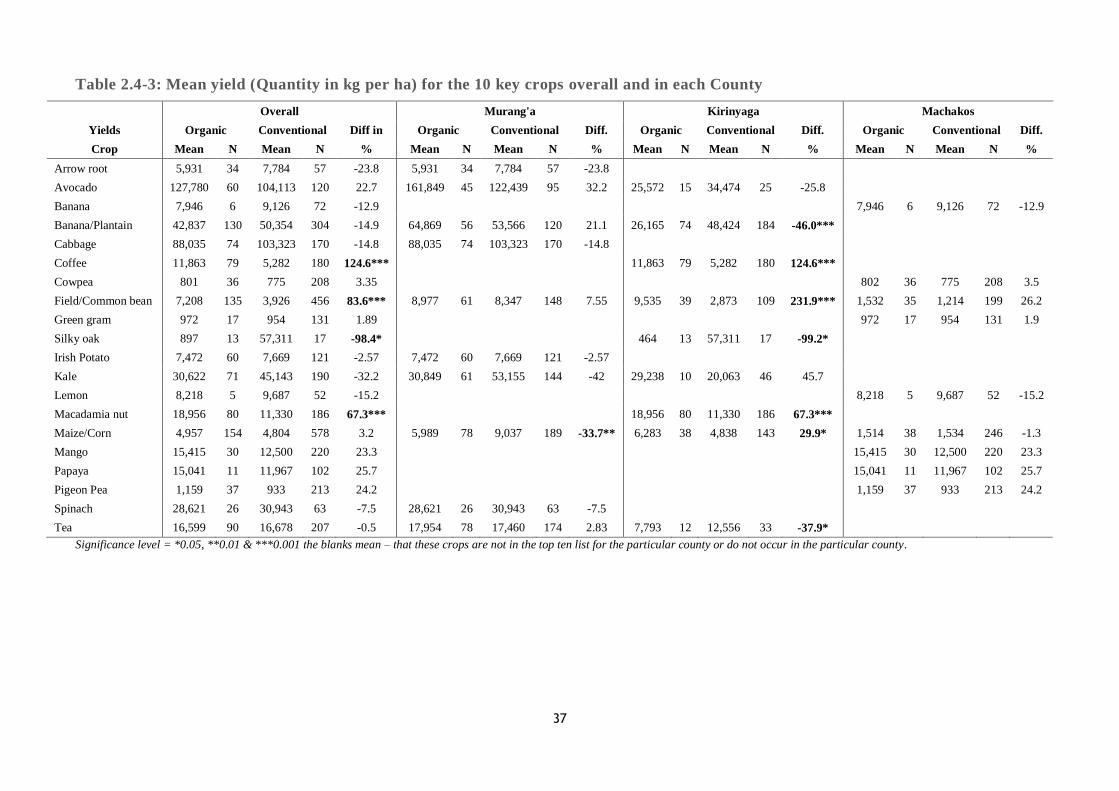
37
Table 2.4-3: Mean yield (Quantity in kg per ha) for the 10 key crops overall and in each County
Overall Murang'a Kirinyaga Machakos
Yields Organic Conventional Diff in Organic Conventional Diff. Organic Conventional Diff. Organic Conventional Diff.
Crop Mean N Mean N % Mean N Mean N % Mean N Mean N % Mean N Mean N %
Arrow root 5,931 34 7,784 57 -23.8 5,931 34 7,784 57 -23.8
Avocado 127,780 60 104,113 120 22.7 161,849 45 122,439 95 32.2 25,572 15 34,474 25 -25.8
Banana 7,946 6 9,126 72 -12.9 7,946 6 9,126 72 -12.9
Banana/Plantain 42,837 130 50,354 304 -14.9 64,869 56 53,566 120 21.1 26,165 74 48,424 184 -46.0***
Cabbage 88,035 74 103,323 170 -14.8 88,035 74 103,323 170 -14.8
Coffee 11,863 79 5,282 180 124.6*** 11,863 79 5,282 180 124.6***
Cowpea 801 36 775 208 3.35 802 36 775 208 3.5
Field/Common bean 7,208 135 3,926 456 83.6*** 8,977 61 8,347 148 7.55 9,535 39 2,873 109 231.9*** 1,532 35 1,214 199 26.2
Green gram 972 17 954 131 1.89 972 17 954 131 1.9
Silky oak 897 13 57,311 17 -98.4* 464 13 57,311 17 -99.2*
Irish Potato 7,472 60 7,669 121 -2.57 7,472 60 7,669 121 -2.57
Kale 30,622 71 45,143 190 -32.2 30,849 61 53,155 144 -42 29,238 10 20,063 46 45.7
Lemon 8,218 5 9,687 52 -15.2 8,218 5 9,687 52 -15.2
Macadamia nut 18,956 80 11,330 186 67.3*** 18,956 80 11,330 186 67.3***
Maize/Corn 4,957 154 4,804 578 3.2 5,989 78 9,037 189 -33.7** 6,283 38 4,838 143 29.9* 1,514 38 1,534 246 -1.3
Mango 15,415 30 12,500 220 23.3 15,415 30 12,500 220 23.3
Papaya 15,041 11 11,967 102 25.7 15,041 11 11,967 102 25.7
Pigeon Pea 1,159 37 933 213 24.2 1,159 37 933 213 24.2
Spinach 28,621 26 30,943 63 -7.5 28,621 26 30,943 63 -7.5
Tea 16,599 90 16,678 207 -0.5 17,954 78 17,460 174 2.83 7,793 12 12,556 33 -37.9*
Significance level = *0.05, **0.01 & ***0.001 the blanks mean – that these crops are not in the top ten list for the particular county or do not occur in the particular county.
38
Total costs of producing crops
The costs are related to what is spent (expenses) to produce or acquire the product or crop. Compared
to conventional production, the overall cost of organic production was lower by 36.1% in arrowroot,
9.0% in avocado, 12.9% in banana, 12.8% in cabbage, 10.7% in green gram, 3.7% for silky oak,
16.9% in Irish potato, 12.4% in kale, 19.0% in maize/corn, 19.4% in mango and 40.8% for spinach.
However the cost of organic was higher in plantain, coffee, cowpea, common bean, lemon,
macadamia, papaya, pigeon pea and tea.
The test of significant statistical differences, the cost of maize, mango and spinach were significant
for organic intervention while the crops for the crops coffee, macadamia and cowpeas were significant
differences for conventional farming (Table 2.4-4).
When we disaggregated the analysis by county, the results show that costs of common beans, maize
and spinach in Murang’a under organic production were 24.6%, 40.8% and 44.3% respectively
significantly lower than in conventional farming (Table 2.4-4). The crops that performed significantly
better under organic farming in Kirinyaga County were maize (by 19.8 %) and tea (by 44.5%).
However, the costs of organic farming of avocado, plantain, coffee and macadamia were significantly
higher than in conventional farming – 57.5%, 28.1%, 27.2% and 100.0% respectively. Whereas, in
Machakos the cost of organic farming was significantly higher for the crop cowpea (by 23.8%) but
lower for the crop mango (by 19.4%).
Total revenues generated by crops
The total revenues are the quantities harvested (yield) multiplied by the selling price for land ha per
year. The higher the revenues, the better the returns to the farm. Overall, the revenues from organic
were found to be higher than conventional crops in avocado by 35.0%%, coffee by 150.7%, cowpea
by 30.5%, common bean by 66.0%, green gram by 7.3%, macadamia nut by 97.9%, papaya by 46.7%
and pigeon pea by 27.0% (Table 2.4-5). Organic interventions had lower gross margins for arrowroot
(25.3%), banana (23.2%), plantain (4.0%), cabbage (16.2%), silky oak (63.4%), Irish potato (2.4%),
kale (20.2%), lemon (30.1%), maize/corn (8.2%), mango (9.1%), spinach (13.4%) and tea (0.9%).
The test of significant statistical differences, the cost of the crops coffee (150.7%), common bean
(66.0%), macadamia nut (97.9%), cowpea (30.5%) and pigeon pea (27.0%) showed significantly
higher revenues while silky oak showed significantly lower revenues (about 63.4%) under organic
interventions compared to conventional farming(Table 2.4-5).
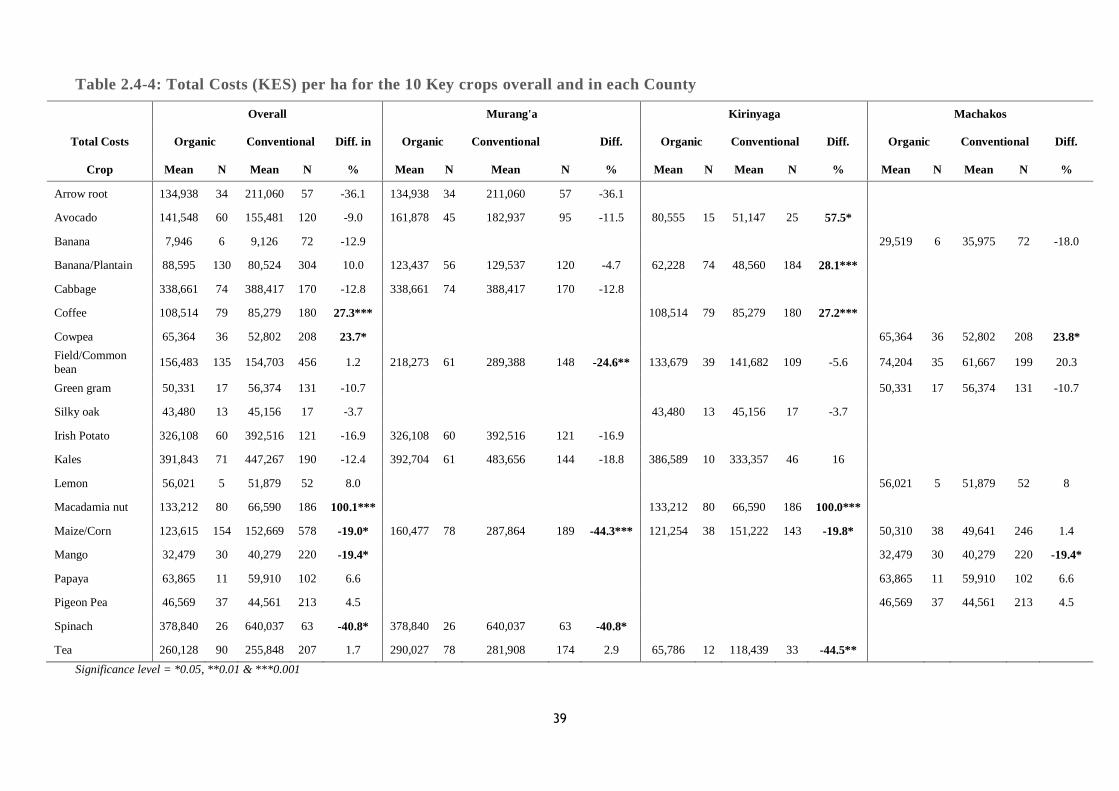
39
Table 2.4-4: Total Costs (KES) per ha for the 10 Key crops overall and in each County
Overall Murang'a Kirinyaga Machakos
Total Costs Organic Conventional Diff. in Organic Conventional Diff. Organic Conventional Diff. Organic Conventional Diff.
Crop Mean N Mean N % Mean N Mean N % Mean N Mean N % Mean N Mean N %
Arrow root 134,938 34 211,060 57 -36.1 134,938 34 211,060 57 -36.1
Avocado 141,548 60 155,481 120 -9.0 161,878 45 182,937 95 -11.5 80,555 15 51,147 25 57.5*
Banana 7,946 6 9,126 72 -12.9 29,519 6 35,975 72 -18.0
Banana/Plantain 88,595 130 80,524 304 10.0 123,437 56 129,537 120 -4.7 62,228 74 48,560 184 28.1***
Cabbage 338,661 74 388,417 170 -12.8 338,661 74 388,417 170 -12.8
Coffee 108,514 79 85,279 180 27.3*** 108,514 79 85,279 180 27.2***
Cowpea 65,364 36 52,802 208 23.7* 65,364 36 52,802 208 23.8*
Field/Common
bean 156,483 135 154,703 456 1.2 218,273 61 289,388 148 -24.6** 133,679 39 141,682 109 -5.6 74,204 35 61,667 199 20.3
Green gram 50,331 17 56,374 131 -10.7 50,331 17 56,374 131 -10.7
Silky oak 43,480 13 45,156 17 -3.7 43,480 13 45,156 17 -3.7
Irish Potato 326,108 60 392,516 121 -16.9 326,108 60 392,516 121 -16.9
Kales 391,843 71 447,267 190 -12.4 392,704 61 483,656 144 -18.8 386,589 10 333,357 46 16
Lemon 56,021 5 51,879 52 8.0 56,021 5 51,879 52 8
Macadamia nut 133,212 80 66,590 186 100.1*** 133,212 80 66,590 186 100.0***
Maize/Corn 123,615 154 152,669 578 -19.0* 160,477 78 287,864 189 -44.3*** 121,254 38 151,222 143 -19.8* 50,310 38 49,641 246 1.4
Mango 32,479 30 40,279 220 -19.4* 32,479 30 40,279 220 -19.4*
Papaya 63,865 11 59,910 102 6.6 63,865 11 59,910 102 6.6
Pigeon Pea 46,569 37 44,561 213 4.5 46,569 37 44,561 213 4.5
Spinach 378,840 26 640,037 63 -40.8* 378,840 26 640,037 63 -40.8*
Tea 260,128 90 255,848 207 1.7 290,027 78 281,908 174 2.9 65,786 12 118,439 33 -44.5**
Significance level = *0.05, **0.01 & ***0.001
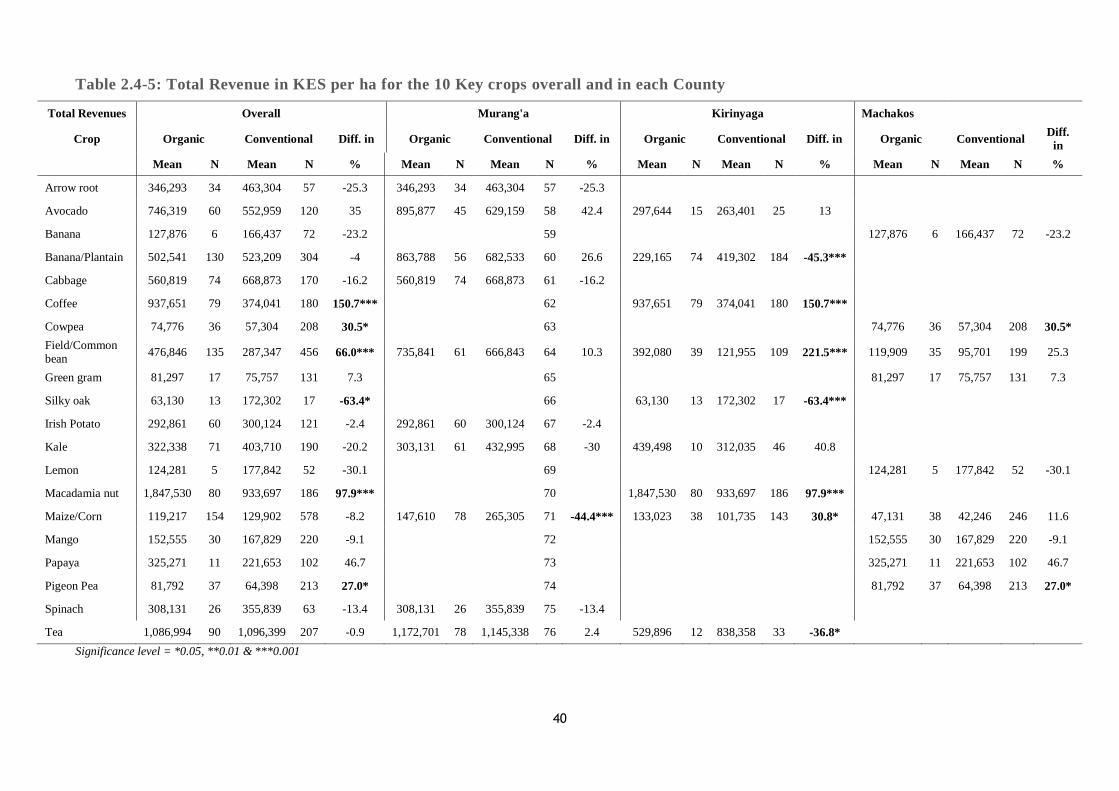
40
Table 2.4-5: Total Revenue in KES per ha for the 10 Key crops overall and in each County
Total Revenues Overall Murang'a Kirinyaga Machakos
Crop Organic Conventional Diff. in Organic Conventional Diff. in Organic Conventional Diff. in Organic Conventional Diff.
in
Mean N Mean N % Mean N Mean N % Mean N Mean N % Mean N Mean N %
Arrow root 346,293 34 463,304 57 -25.3 346,293 34 463,304 57 -25.3
Avocado 746,319 60 552,959 120 35 895,877 45 629,159 58 42.4 297,644 15 263,401 25 13
Banana 127,876 6 166,437 72 -23.2 59 127,876 6 166,437 72 -23.2
Banana/Plantain 502,541 130 523,209 304 -4 863,788 56 682,533 60 26.6 229,165 74 419,302 184 -45.3***
Cabbage 560,819 74 668,873 170 -16.2 560,819 74 668,873 61 -16.2
Coffee 937,651 79 374,041 180 150.7*** 62 937,651 79 374,041 180 150.7***
Cowpea 74,776 36 57,304 208 30.5* 63 74,776 36 57,304 208 30.5*
Field/Common bean
476,846 135 287,347 456 66.0*** 735,841 61 666,843 64 10.3 392,080 39 121,955 109 221.5*** 119,909 35 95,701 199 25.3
Green gram 81,297 17 75,757 131 7.3 65 81,297 17 75,757 131 7.3
Silky oak 63,130 13 172,302 17 -63.4* 66 63,130 13 172,302 17 -63.4***
Irish Potato 292,861 60 300,124 121 -2.4 292,861 60 300,124 67 -2.4
Kale 322,338 71 403,710 190 -20.2 303,131 61 432,995 68 -30 439,498 10 312,035 46 40.8
Lemon 124,281 5 177,842 52 -30.1 69 124,281 5 177,842 52 -30.1
Macadamia nut 1,847,530 80 933,697 186 97.9*** 70 1,847,530 80 933,697 186 97.9***
Maize/Corn 119,217 154 129,902 578 -8.2 147,610 78 265,305 71 -44.4*** 133,023 38 101,735 143 30.8* 47,131 38 42,246 246 11.6
Mango 152,555 30 167,829 220 -9.1 72 152,555 30 167,829 220 -9.1
Papaya 325,271 11 221,653 102 46.7 73 325,271 11 221,653 102 46.7
Pigeon Pea 81,792 37 64,398 213 27.0* 74 81,792 37 64,398 213 27.0*
Spinach 308,131 26 355,839 63 -13.4 308,131 26 355,839 75 -13.4
Tea 1,086,994 90 1,096,399 207 -0.9 1,172,701 78 1,145,338 76 2.4 529,896 12 838,358 33 -36.8*
Significance level = *0.05, **0.01 & ***0.001
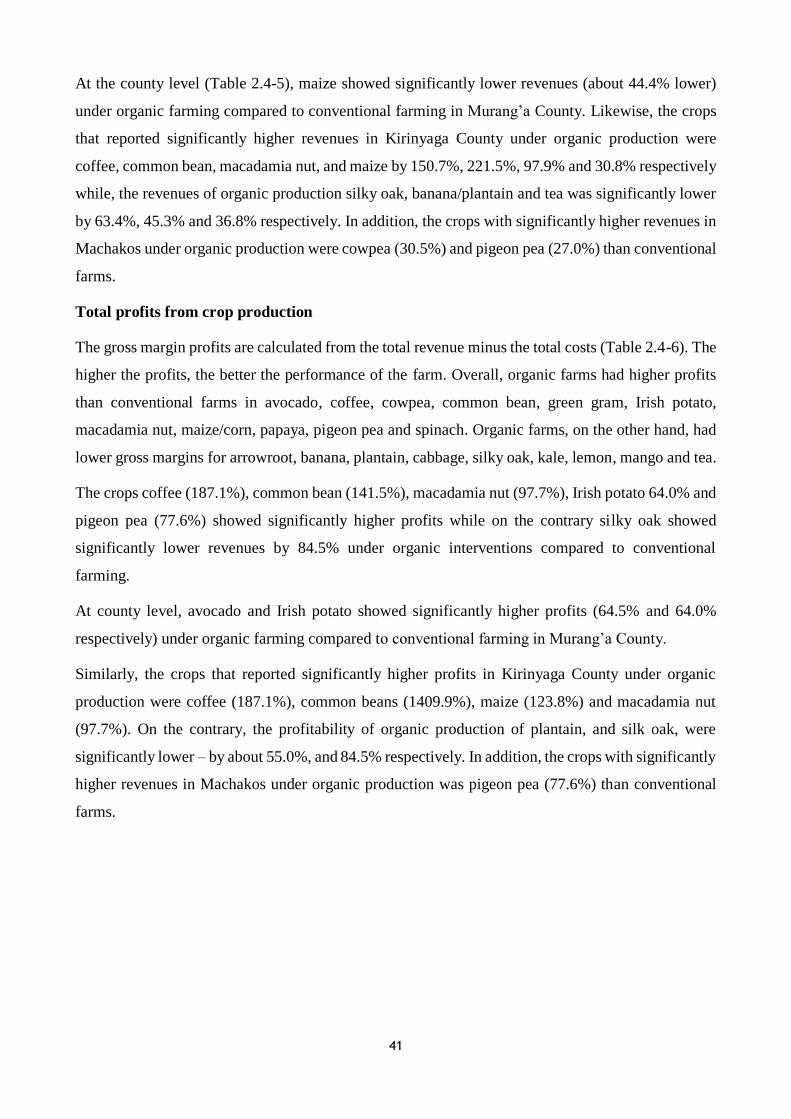
41
At the county level (Table 2.4-5), maize showed significantly lower revenues (about 44.4% lower)
under organic farming compared to conventional farming in Murang’a County. Likewise, the crops
that reported significantly higher revenues in Kirinyaga County under organic production were
coffee, common bean, macadamia nut, and maize by 150.7%, 221.5%, 97.9% and 30.8% respectively
while, the revenues of organic production silky oak, banana/plantain and tea was significantly lower
by 63.4%, 45.3% and 36.8% respectively. In addition, the crops with significantly higher revenues in
Machakos under organic production were cowpea (30.5%) and pigeon pea (27.0%) than conventional
farms.
Total profits from crop production
The gross margin profits are calculated from the total revenue minus the total costs (Table 2.4-6). The
higher the profits, the better the performance of the farm. Overall, organic farms had higher profits
than conventional farms in avocado, coffee, cowpea, common bean, green gram, Irish potato,
macadamia nut, maize/corn, papaya, pigeon pea and spinach. Organic farms, on the other hand, had
lower gross margins for arrowroot, banana, plantain, cabbage, silky oak, kale, lemon, mango and tea.
The crops coffee (187.1%), common bean (141.5%), macadamia nut (97.7%), Irish potato 64.0% and
pigeon pea (77.6%) showed significantly higher profits while on the contrary silky oak showed
significantly lower revenues by 84.5% under organic interventions compared to conventional
farming.
At county level, avocado and Irish potato showed significantly higher profits (64.5% and 64.0%
respectively) under organic farming compared to conventional farming in Murang’a County.
Similarly, the crops that reported significantly higher profits in Kirinyaga County under organic
production were coffee (187.1%), common beans (1409.9%), maize (123.8%) and macadamia nut
(97.7%). On the contrary, the profitability of organic production of plantain, and silk oak, were
significantly lower – by about 55.0%, and 84.5% respectively. In addition, the crops with significantly
higher revenues in Machakos under organic production was pigeon pea (77.6%) than conventional
farms.
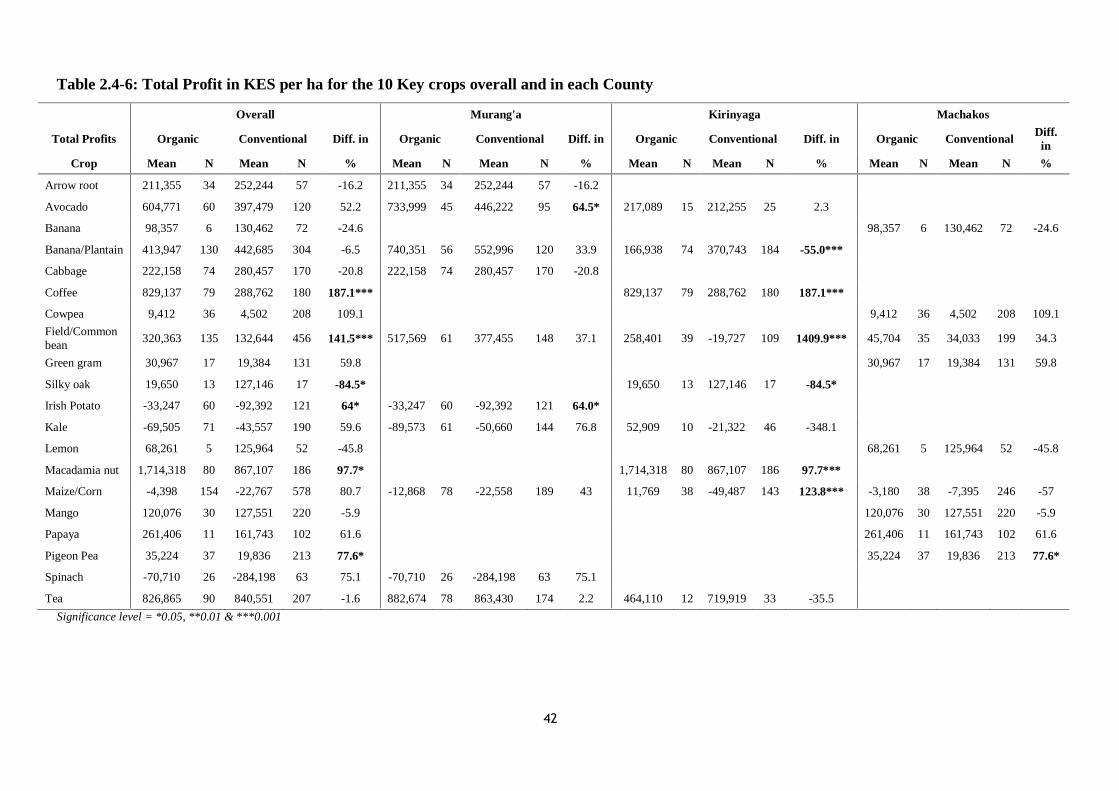
42
Table 2.4-6: Total Profit in KES per ha for the 10 Key crops overall and in each County
Overall Murang'a Kirinyaga Machakos
Total Profits Organic Conventional Diff. in Organic Conventional Diff. in Organic Conventional Diff. in Organic Conventional Diff.
in
Crop Mean N Mean N % Mean N Mean N % Mean N Mean N % Mean N Mean N %
Arrow root 211,355 34 252,244 57 -16.2 211,355 34 252,244 57 -16.2
Avocado 604,771 60 397,479 120 52.2 733,999 45 446,222 95 64.5* 217,089 15 212,255 25 2.3
Banana 98,357 6 130,462 72 -24.6 98,357 6 130,462 72 -24.6
Banana/Plantain 413,947 130 442,685 304 -6.5 740,351 56 552,996 120 33.9 166,938 74 370,743 184 -55.0***
Cabbage 222,158 74 280,457 170 -20.8 222,158 74 280,457 170 -20.8
Coffee 829,137 79 288,762 180 187.1*** 829,137 79 288,762 180 187.1***
Cowpea 9,412 36 4,502 208 109.1 9,412 36 4,502 208 109.1
Field/Common
bean 320,363 135 132,644 456 141.5*** 517,569 61 377,455 148 37.1 258,401 39 -19,727 109 1409.9*** 45,704 35 34,033 199 34.3
Green gram 30,967 17 19,384 131 59.8 30,967 17 19,384 131 59.8
Silky oak 19,650 13 127,146 17 -84.5* 19,650 13 127,146 17 -84.5*
Irish Potato -33,247 60 -92,392 121 64* -33,247 60 -92,392 121 64.0*
Kale -69,505 71 -43,557 190 59.6 -89,573 61 -50,660 144 76.8 52,909 10 -21,322 46 -348.1
Lemon 68,261 5 125,964 52 -45.8 68,261 5 125,964 52 -45.8
Macadamia nut 1,714,318 80 867,107 186 97.7* 1,714,318 80 867,107 186 97.7***
Maize/Corn -4,398 154 -22,767 578 80.7 -12,868 78 -22,558 189 43 11,769 38 -49,487 143 123.8*** -3,180 38 -7,395 246 -57
Mango 120,076 30 127,551 220 -5.9 120,076 30 127,551 220 -5.9
Papaya 261,406 11 161,743 102 61.6 261,406 11 161,743 102 61.6
Pigeon Pea 35,224 37 19,836 213 77.6* 35,224 37 19,836 213 77.6*
Spinach -70,710 26 -284,198 63 75.1 -70,710 26 -284,198 63 75.1
Tea 826,865 90 840,551 207 -1.6 882,674 78 863,430 174 2.2 464,110 12 719,919 33 -35.5
Significance level = *0.05, **0.01 & ***0.001
43
2.4.4 Determinants of yields: do farming systems matter?
This part of the study used OLS estimators to gauge the effects of the various factors associated with
farm productivity of the selected crops. Specifically, attention is drawn to the type of farming system
(organic or conventional) as well as socio-economic, farm, and market-related characteristics (Table
2.4-7). The organic farming system is the main variable being tested on yields, while the other factors
that may influence yields are controlled and kept at a constant. The factors controlled for yield are:
age, sex (male), education level (adult literacy, primary, secondary, tertiary), farm experience,
household size, farm size, soil quality status, crop count (number of crops grown), bank account, off-
farm income, membership in farmer group, irrigation, fertilizer use, labour hours, pesticide use,
seed/seedling (planting) use and location (county). The coefficient values of the variables that are
negative implies that these variables have a negative effect on yields and the others have a positive
effect. Values with significant differences are shown at P< 0.05, 0.01 and 0.001. The selected crops
shown in Table 2.4-7 are those that the sample size allowed for comparison across the three counties.
The controlled variables with an influence on yields are as follows. The size of the farm had a negative
significant relationship with yield. This finding is similar to that found by Mishra et al. (2018). Thus,
the smaller the farm size, the higher the yield for maize, field/common bean, banana/plantain, tea,
coffee, pigeon pea, and cowpea in organic farms. Small farm size allows farmers to better manage
their farms and thus increase the yields per unit area in organic farming (Pimentel et al., 2010). The
education level of farmers was a significant factor in increasing the yields of most crops. The higher
the level of education, the higher the crop yields. For example, farmers who had completed secondary
and tertiary levels of education reported higher yields for field/common bean, macadamia nut, coffee,
and mango. Off-farm income shows a positive significant relationship in the yield of maize,
field/common bean, tea, and pigeon pea but a negative significant relationship with yields of coffee
and cowpea. The higher the off-farm income, the higher the yields for maize, field/common bean,
tea, and pigeon pea. Farmers with money from off-farm activities plowed it back into farming leading
to higher yields (Reardon et al., 1996). In both organic and conventional farms, farmers who invested
in irrigation systems had higher yields: there was significant positive effect for organic yields of
maize, field/common bean, coffee, Irish potato, and mango. The adoption of an irrigation system by
farmers meant less reliance on rain-fed agriculture because they could produce crops during the dry
season (Pimentel et al., 2010; Virlanuta, 2011), and importantly, use irrigation to bridge dry spells in
rainy seasons (Rockström et al., 2007).
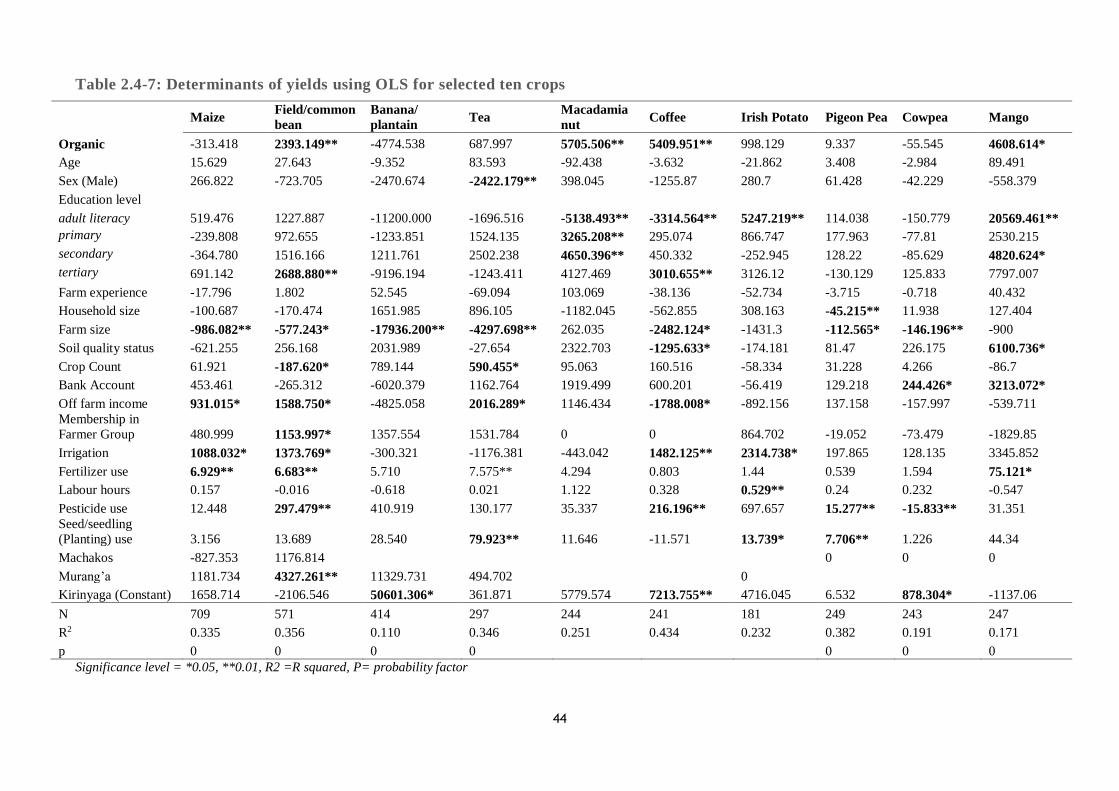
44
Table 2.4-7: Determinants of yields using OLS for selected ten crops
Maize
Field/common
bean
Banana/
plantain Tea
Macadamia
nut Coffee Irish Potato Pigeon Pea Cowpea Mango
Organic -313.418 2393.149** -4774.538 687.997 5705.506** 5409.951** 998.129 9.337 -55.545 4608.614*
Age 15.629 27.643 -9.352 83.593 -92.438 -3.632 -21.862 3.408 -2.984 89.491
Sex (Male) 266.822 -723.705 -2470.674 -2422.179** 398.045 -1255.87 280.7 61.428 -42.229 -558.379
Education level
adult literacy 519.476 1227.887 -11200.000 -1696.516 -5138.493** -3314.564** 5247.219** 114.038 -150.779 20569.461**
primary -239.808 972.655 -1233.851 1524.135 3265.208** 295.074 866.747 177.963 -77.81 2530.215
secondary -364.780 1516.166 1211.761 2502.238 4650.396** 450.332 -252.945 128.22 -85.629 4820.624*
tertiary 691.142 2688.880** -9196.194 -1243.411 4127.469 3010.655** 3126.12 -130.129 125.833 7797.007
Farm experience -17.796 1.802 52.545 -69.094 103.069 -38.136 -52.734 -3.715 -0.718 40.432
Household size -100.687 -170.474 1651.985 896.105 -1182.045 -562.855 308.163 -45.215** 11.938 127.404
Farm size -986.082** -577.243* -17936.200** -4297.698** 262.035 -2482.124* -1431.3 -112.565* -146.196** -900
Soil quality status -621.255 256.168 2031.989 -27.654 2322.703 -1295.633* -174.181 81.47 226.175 6100.736*
Crop Count 61.921 -187.620* 789.144 590.455* 95.063 160.516 -58.334 31.228 4.266 -86.7
Bank Account 453.461 -265.312 -6020.379 1162.764 1919.499 600.201 -56.419 129.218 244.426* 3213.072*
Off farm income 931.015* 1588.750* -4825.058 2016.289* 1146.434 -1788.008* -892.156 137.158 -157.997 -539.711
Membership in
Farmer Group 480.999 1153.997* 1357.554 1531.784 0 0 864.702 -19.052 -73.479 -1829.85
Irrigation 1088.032* 1373.769* -300.321 -1176.381 -443.042 1482.125** 2314.738* 197.865 128.135 3345.852
Fertilizer use 6.929** 6.683** 5.710 7.575** 4.294 0.803 1.44 0.539 1.594 75.121*
Labour hours 0.157 -0.016 -0.618 0.021 1.122 0.328 0.529** 0.24 0.232 -0.547
Pesticide use 12.448 297.479** 410.919 130.177 35.337 216.196** 697.657 15.277** -15.833** 31.351
Seed/seedling
(Planting) use 3.156 13.689 28.540 79.923** 11.646 -11.571 13.739* 7.706** 1.226 44.34
Machakos -827.353 1176.814 0 0 0
Murang’a 1181.734 4327.261** 11329.731 494.702 0
Kirinyaga (Constant) 1658.714 -2106.546 50601.306* 361.871 5779.574 7213.755** 4716.045 6.532 878.304* -1137.06
N 709 571 414 297 244 241 181 249 243 247
R2 0.335 0.356 0.110 0.346 0.251 0.434 0.232 0.382 0.191 0.171
p 0 0 0 0 0 0 0
Significance level = *0.05, **0.01, R2 =R squared, P= probability factor
45
Generally, organic pesticides are used to control pests. However diseases still had a significant factor
on yields. The use of organic pest control methods appears to have played a role in preventing higher
yield loss of field/common bean, coffee and pigeon pea. Pest and disease control mechanisms provide
the crops with an additional boost to survive pest and disease attacks, thus increasing the overall crop
yield on the farm (Ayuya et al., 2015). However perhaps more important are improvements to the
soil structure in organic farms: a healthy soil is a prerequisite for healthy plants, which are then better
able to withstand or avoid pest or disease attacks.
Of importance are the OLS results for the farming system. The results showed that the adoption of
organic farming techniques is associated with a significant increase in the productivity of
field/common bean, macadamia nut, coffee, and mango: a yield increase of 2393 kg/ha in common
bean, 5706 kg/ha in macadamia nut, 5410 kg/ha in coffee, and 4609 kg/ha in mango for organic
farming. There was no significant differences between organic and conventional farming for the other
crops (maize, plantain, tea, Irish potato, pigeon pea and cowpea). In the OLS analysis, yields are an
important determinant for the farming systems
2.4.5 Determinants of profitability: does the farming system matter?
OLS indicators were used to determine the effects of farming system type on farm profitability. The
socio-economic and farm characteristics, and location variables considered are shown in Table 2.4-
8. When all other factors are held constant the results showed that organic farming was significantly
more profitable for macadamia nut and coffee production but significantly less profitable (as
compared to conventional) for maize, field/common bean, and mango production. Furthermore,
improved yields were associated with increased profitability for all crops. Organic farming profits
were significantly higher for macadamia nut (by KES 156,054 per ha) and coffee (by KES 43,776
per ha) than under conventional farming. On the other hand conventional farming profits were
significantly higher for maize (by KES 10,611 per ha), field/common beans (by KES 34,420 per ha),
and mango (by KES 33,860 per ha). The profits from other crops (plantain, tea, Irish potato, pigeon
pea and cowpea) were not significant for the farming system, even if positive or negative.
The other factors were held constant or controlled for profits. These variables may have an influence
on profits from a crop. The results show that sex (if male), education level, farm size, input costs, cost
of land and location influence profits.
Male farmers reported significantly more profits in the production of maize, field/common bean,
macadamia nut, and coffee. The other crops (banana/plantain, tea, Irish potato, pigeon pea, cowpea,
and mango) did not show significant differences in profitability between male and female farmers.
The education level of farmers had an effect: those with tertiary level education, in particular, had
46
significantly higher profits for the production of maize and banana/plantains. For coffee, pigeon pea,
cowpea, and mango, a higher level of education had a significant negative effect on profitability. The
level of education did not affect the profitability of field/common bean, tea, macadamia nut, and Irish
potato.
Farm size had a positive significance on profits for field/common bean and tea while farm size under
maize had a negative significance on profits. The smaller the farm size for maize the more
unprofitable it became because of the costs of inputs, labour requirement and mechanization. A study
by Muzari et al., (2012) found similar results where the smaller the maize farm size the less profitable
the crop enterprise became. Small-scale farmers plant maize for subsistence (Muzari et al., 2012).
The other crops (banana/plantain, macadamia nut, coffee, Irish potato, pigeon pea, cowpea, and
mango) did not show significant differences in profitability in relation to farm size. Lower total input
costs led to significantly more profits in the production of maize and mango but significant negative
profits for coffee, Irish potato, and cowpea. Some authors show that a reduction in the cost of
production leads to more profit margins (Manglik & Goyal, 2018), however this is clearly not always
the case: it depends on the crop in question. The other crops (field/common bean, macadamia nut,
banana/plantain, tea, and pigeon pea) did not show significant differences in profitability in organic
systems.
The cost of land is included in the calculation of profits as it is a cost incurred for the production of
the crop (Eyhorn et al., 2018; Maltchik et al., 2017; Mendoza, 2004). Total land costs showed a
positive significance on profits of maize, field/common bean, and banana/plantain but significant
negative (loss) profits for tea. Investing in land for the growing of either maize, field/common bean,
or banana/plantain is clearly more profitable than for tea. The cost of inputs and labour requirements
were higher in tea than in maize and common bean. For the other crops (macadamia nut, coffee,
pigeon pea, Irish potato, cowpea, and mango) there were no significant differences in profitability
associated with land costs. In this study, farmers rarely hired land or purchased land for crop
production (the low and no values from the farm characteristics on land rented-in or land rented-out).
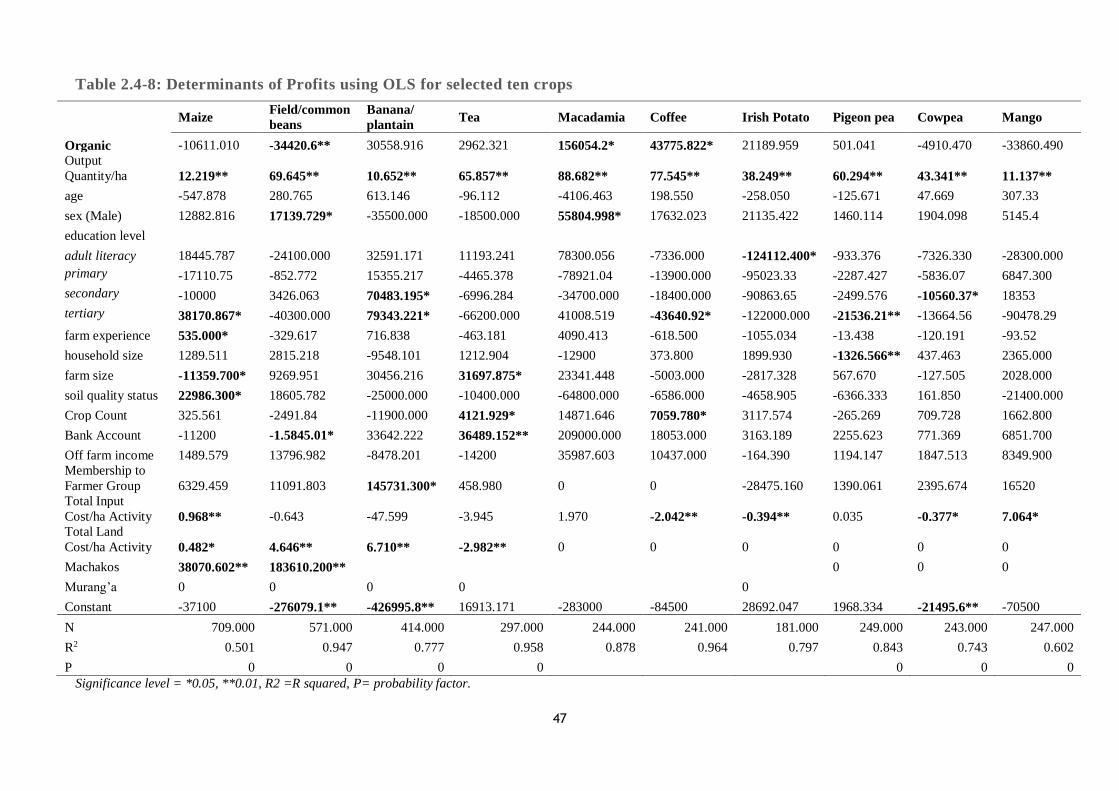
47
Table 2.4-8: Determinants of Profits using OLS for selected ten crops
Maize
Field/common
beans
Banana/
plantain Tea Macadamia Coffee Irish Potato Pigeon pea Cowpea Mango
Organic -10611.010 -34420.6** 30558.916 2962.321 156054.2* 43775.822* 21189.959 501.041 -4910.470 -33860.490
Output
Quantity/ha 12.219** 69.645** 10.652** 65.857** 88.682** 77.545** 38.249** 60.294** 43.341** 11.137**
age -547.878 280.765 613.146 -96.112 -4106.463 198.550 -258.050 -125.671 47.669 307.33
sex (Male) 12882.816 17139.729* -35500.000 -18500.000 55804.998* 17632.023 21135.422 1460.114 1904.098 5145.4
education level
adult literacy 18445.787 -24100.000 32591.171 11193.241 78300.056 -7336.000 -124112.400* -933.376 -7326.330 -28300.000
primary -17110.75 -852.772 15355.217 -4465.378 -78921.04 -13900.000 -95023.33 -2287.427 -5836.07 6847.300
secondary -10000 3426.063 70483.195* -6996.284 -34700.000 -18400.000 -90863.65 -2499.576 -10560.37* 18353
tertiary 38170.867* -40300.000 79343.221* -66200.000 41008.519 -43640.92* -122000.000 -21536.21** -13664.56 -90478.29
farm experience 535.000* -329.617 716.838 -463.181 4090.413 -618.500 -1055.034 -13.438 -120.191 -93.52
household size 1289.511 2815.218 -9548.101 1212.904 -12900 373.800 1899.930 -1326.566** 437.463 2365.000
farm size -11359.700* 9269.951 30456.216 31697.875* 23341.448 -5003.000 -2817.328 567.670 -127.505 2028.000
soil quality status 22986.300* 18605.782 -25000.000 -10400.000 -64800.000 -6586.000 -4658.905 -6366.333 161.850 -21400.000
Crop Count 325.561 -2491.84 -11900.000 4121.929* 14871.646 7059.780* 3117.574 -265.269 709.728 1662.800
Bank Account -11200 -1.5845.01* 33642.222 36489.152** 209000.000 18053.000 3163.189 2255.623 771.369 6851.700
Off farm income 1489.579 13796.982 -8478.201 -14200 35987.603 10437.000 -164.390 1194.147 1847.513 8349.900
Membership to
Farmer Group 6329.459 11091.803 145731.300* 458.980 0 0 -28475.160 1390.061 2395.674 16520
Total Input
Cost/ha Activity 0.968** -0.643 -47.599 -3.945 1.970 -2.042** -0.394** 0.035 -0.377* 7.064*
Total Land
Cost/ha Activity 0.482* 4.646** 6.710** -2.982** 0 0 0 0 0 0
Machakos 38070.602** 183610.200** 0 0 0
Murang’a 0 0 0 0 0
Constant -37100 -276079.1** -426995.8** 16913.171 -283000 -84500 28692.047 1968.334 -21495.6** -70500
N 709.000 571.000 414.000 297.000 244.000 241.000 181.000 249.000 243.000 247.000
R2 0.501 0.947 0.777 0.958 0.878 0.964 0.797 0.843 0.743 0.602
P 0 0 0 0 0 0 0
Significance level = *0.05, **0.01, R2 =R squared, P= probability factor.
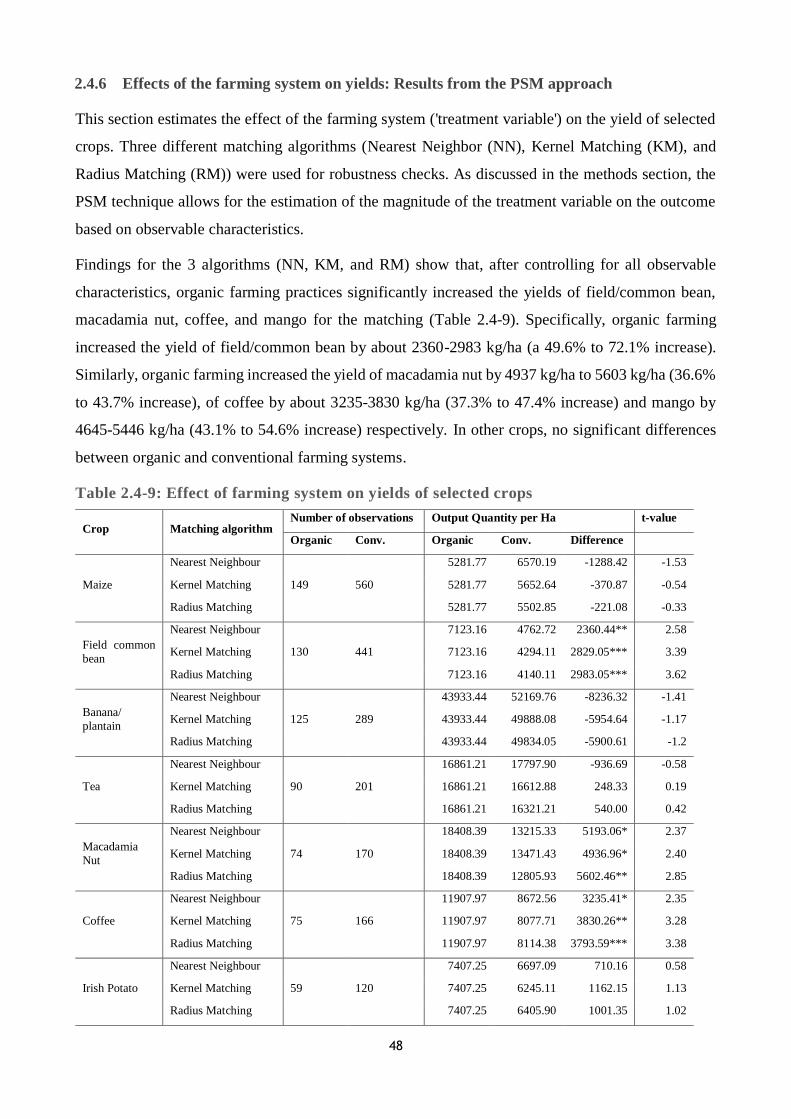
48
2.4.6 Effects of the farming system on yields: Results from the PSM approach
This section estimates the effect of the farming system ('treatment variable') on the yield of selected
crops. Three different matching algorithms (Nearest Neighbor (NN), Kernel Matching (KM), and
Radius Matching (RM)) were used for robustness checks. As discussed in the methods section, the
PSM technique allows for the estimation of the magnitude of the treatment variable on the outcome
based on observable characteristics.
Findings for the 3 algorithms (NN, KM, and RM) show that, after controlling for all observable
characteristics, organic farming practices significantly increased the yields of field/common bean,
macadamia nut, coffee, and mango for the matching (Table 2.4-9). Specifically, organic farming
increased the yield of field/common bean by about 2360-2983 kg/ha (a 49.6% to 72.1% increase).
Similarly, organic farming increased the yield of macadamia nut by 4937 kg/ha to 5603 kg/ha (36.6%
to 43.7% increase), of coffee by about 3235-3830 kg/ha (37.3% to 47.4% increase) and mango by
4645-5446 kg/ha (43.1% to 54.6% increase) respectively. In other crops, no significant differences
between organic and conventional farming systems.
Table 2.4-9: Effect of farming system on yields of selected crops
Crop Matching algorithm Number of observations Output Quantity per Ha t-value
Organic Conv. Organic Conv. Difference
Maize
Nearest Neighbour
149 560
5281.77 6570.19 -1288.42 -1.53
Kernel Matching 5281.77 5652.64 -370.87 -0.54
Radius Matching 5281.77 5502.85 -221.08 -0.33
Field common
bean
Nearest Neighbour
130 441
7123.16 4762.72 2360.44** 2.58
Kernel Matching 7123.16 4294.11 2829.05*** 3.39
Radius Matching 7123.16 4140.11 2983.05*** 3.62
Banana/
plantain
Nearest Neighbour
125 289
43933.44 52169.76 -8236.32 -1.41
Kernel Matching 43933.44 49888.08 -5954.64 -1.17
Radius Matching 43933.44 49834.05 -5900.61 -1.2
Tea
Nearest Neighbour
90 201
16861.21 17797.90 -936.69 -0.58
Kernel Matching 16861.21 16612.88 248.33 0.19
Radius Matching 16861.21 16321.21 540.00 0.42
Macadamia
Nut
Nearest Neighbour
74 170
18408.39 13215.33 5193.06* 2.37
Kernel Matching 18408.39 13471.43 4936.96* 2.40
Radius Matching 18408.39 12805.93 5602.46** 2.85
Coffee
Nearest Neighbour
75 166
11907.97 8672.56 3235.41* 2.35
Kernel Matching 11907.97 8077.71 3830.26** 3.28
Radius Matching 11907.97 8114.38 3793.59*** 3.38
Irish Potato
Nearest Neighbour
59 120
7407.25 6697.09 710.16 0.58
Kernel Matching 7407.25 6245.11 1162.15 1.13
Radius Matching 7407.25 6405.90 1001.35 1.02
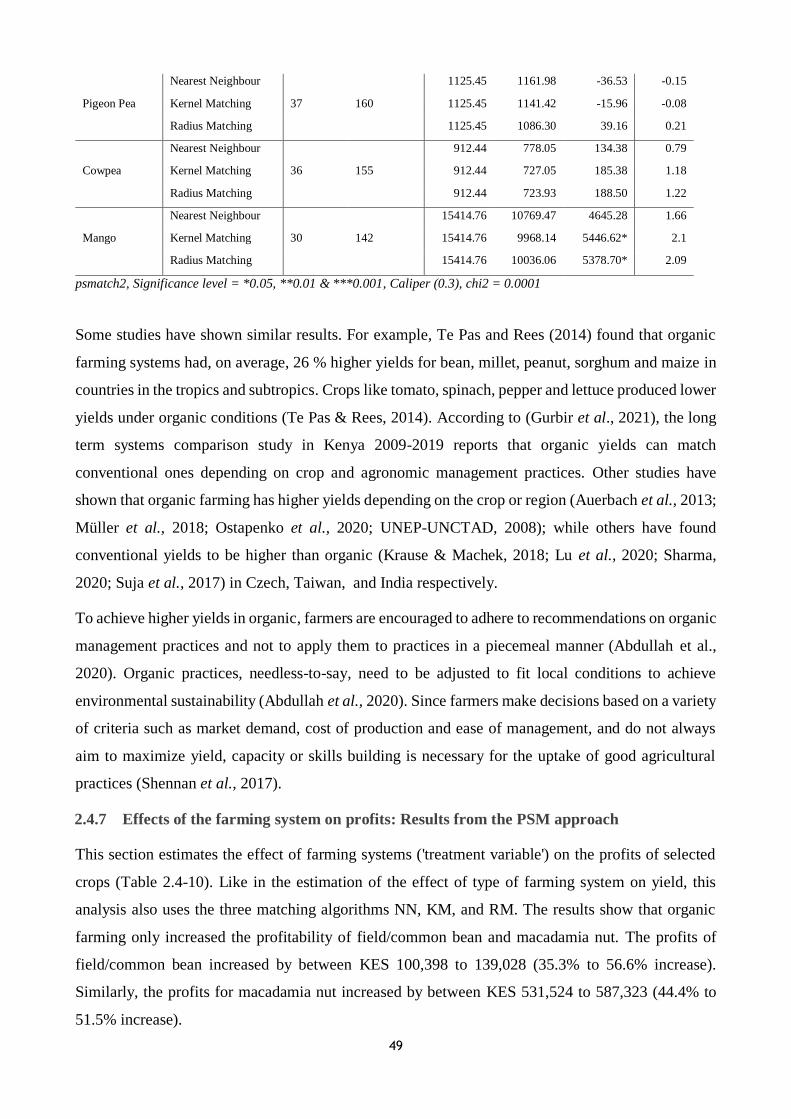
49
Pigeon Pea
Nearest Neighbour
37 160
1125.45 1161.98 -36.53 -0.15
Kernel Matching 1125.45 1141.42 -15.96 -0.08
Radius Matching 1125.45 1086.30 39.16 0.21
Cowpea
Nearest Neighbour
36 155
912.44 778.05 134.38 0.79
Kernel Matching 912.44 727.05 185.38 1.18
Radius Matching 912.44 723.93 188.50 1.22
Mango
Nearest Neighbour
30 142
15414.76 10769.47 4645.28 1.66
Kernel Matching 15414.76 9968.14 5446.62* 2.1
Radius Matching 15414.76 10036.06 5378.70* 2.09
psmatch2, Significance level = *0.05, **0.01 & ***0.001, Caliper (0.3), chi2 = 0.0001
Some studies have shown similar results. For example, Te Pas and Rees (2014) found that organic
farming systems had, on average, 26 % higher yields for bean, millet, peanut, sorghum and maize in
countries in the tropics and subtropics. Crops like tomato, spinach, pepper and lettuce produced lower
yields under organic conditions (Te Pas & Rees, 2014). According to (Gurbir et al., 2021), the long
term systems comparison study in Kenya 2009-2019 reports that organic yields can match
conventional ones depending on crop and agronomic management practices. Other studies have
shown that organic farming has higher yields depending on the crop or region (Auerbach et al., 2013;
Müller et al., 2018; Ostapenko et al., 2020; UNEP-UNCTAD, 2008); while others have found
conventional yields to be higher than organic (Krause & Machek, 2018; Lu et al., 2020; Sharma,
2020; Suja et al., 2017) in Czech, Taiwan, and India respectively.
To achieve higher yields in organic, farmers are encouraged to adhere to recommendations on organic
management practices and not to apply them to practices in a piecemeal manner (Abdullah et al.,
2020). Organic practices, needless-to-say, need to be adjusted to fit local conditions to achieve
environmental sustainability (Abdullah et al., 2020). Since farmers make decisions based on a variety
of criteria such as market demand, cost of production and ease of management, and do not always
aim to maximize yield, capacity or skills building is necessary for the uptake of good agricultural
practices (Shennan et al., 2017).
2.4.7 Effects of the farming system on profits: Results from the PSM approach
This section estimates the effect of farming systems ('treatment variable') on the profits of selected
crops (Table 2.4-10). Like in the estimation of the effect of type of farming system on yield, this
analysis also uses the three matching algorithms NN, KM, and RM. The results show that organic
farming only increased the profitability of field/common bean and macadamia nut. The profits of
field/common bean increased by between KES 100,398 to 139,028 (35.3% to 56.6% increase).
Similarly, the profits for macadamia nut increased by between KES 531,524 to 587,323 (44.4% to
51.5% increase).
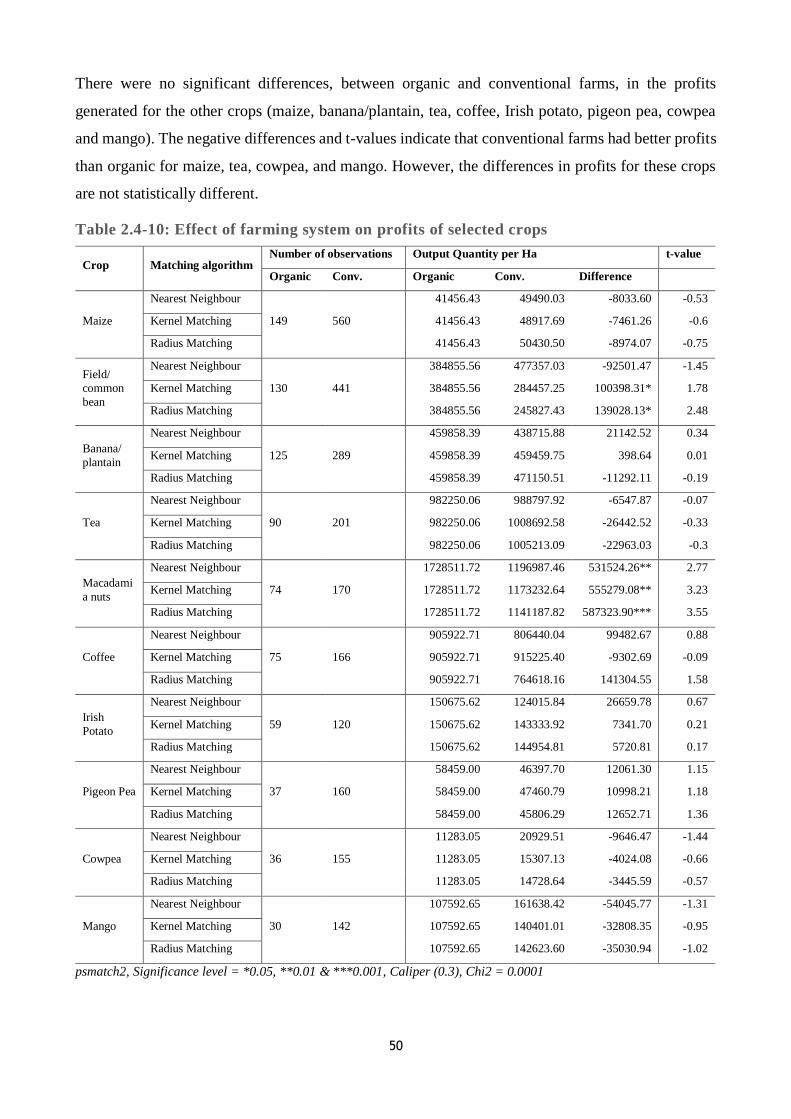
50
There were no significant differences, between organic and conventional farms, in the profits
generated for the other crops (maize, banana/plantain, tea, coffee, Irish potato, pigeon pea, cowpea
and mango). The negative differences and t-values indicate that conventional farms had better profits
than organic for maize, tea, cowpea, and mango. However, the differences in profits for these crops
are not statistically different.
Table 2.4-10: Effect of farming system on profits of selected crops
Crop Matching algorithm Number of observations Output Quantity per Ha t-value
Organic Conv. Organic Conv. Difference
Maize
Nearest Neighbour
149 560
41456.43 49490.03 -8033.60 -0.53
Kernel Matching 41456.43 48917.69 -7461.26 -0.6
Radius Matching 41456.43 50430.50 -8974.07 -0.75
Field/
common
bean
Nearest Neighbour
130 441
384855.56 477357.03 -92501.47 -1.45
Kernel Matching 384855.56 284457.25 100398.31* 1.78
Radius Matching 384855.56 245827.43 139028.13* 2.48
Banana/
plantain
Nearest Neighbour
125 289
459858.39 438715.88 21142.52 0.34
Kernel Matching 459858.39 459459.75 398.64 0.01
Radius Matching 459858.39 471150.51 -11292.11 -0.19
Tea
Nearest Neighbour
90 201
982250.06 988797.92 -6547.87 -0.07
Kernel Matching 982250.06 1008692.58 -26442.52 -0.33
Radius Matching 982250.06 1005213.09 -22963.03 -0.3
Macadami
a nuts
Nearest Neighbour
74 170
1728511.72 1196987.46 531524.26** 2.77
Kernel Matching 1728511.72 1173232.64 555279.08** 3.23
Radius Matching 1728511.72 1141187.82 587323.90*** 3.55
Coffee
Nearest Neighbour
75 166
905922.71 806440.04 99482.67 0.88
Kernel Matching 905922.71 915225.40 -9302.69 -0.09
Radius Matching 905922.71 764618.16 141304.55 1.58
Irish
Potato
Nearest Neighbour
59 120
150675.62 124015.84 26659.78 0.67
Kernel Matching 150675.62 143333.92 7341.70 0.21
Radius Matching 150675.62 144954.81 5720.81 0.17
Pigeon Pea
Nearest Neighbour
37 160
58459.00 46397.70 12061.30 1.15
Kernel Matching 58459.00 47460.79 10998.21 1.18
Radius Matching 58459.00 45806.29 12652.71 1.36
Cowpea
Nearest Neighbour
36 155
11283.05 20929.51 -9646.47 -1.44
Kernel Matching 11283.05 15307.13 -4024.08 -0.66
Radius Matching 11283.05 14728.64 -3445.59 -0.57
Mango
Nearest Neighbour
30 142
107592.65 161638.42 -54045.77 -1.31
Kernel Matching 107592.65 140401.01 -32808.35 -0.95
Radius Matching 107592.65 142623.60 -35030.94 -1.02
psmatch2, Significance level = *0.05, **0.01 & ***0.001, Caliper (0.3), Chi2 = 0.0001
51
Several authors reported that organic farms produce lower yields compared to conventional ones, but
emphasize that the former production systems is more profitable and environmentally friendly, and
deliver equally or more nutritious foods that contain less (or no) pesticide residues than the latter one
(Rahman & Chima, 2016; Ramesh et al 2010; Reganold & Wachter, 2016; Te Pas & Rees, 2014).
Sgroi et al. (2015) compared lemon farms in Italy and found that the gross production value of organic
farms (€ 6138 per ha) is almost ten times higher than in conventional farms (€ 649 per ha) (Sgroi et
al., 2015). Other studies reveal that organic had higher profitability than in conventional farming
(Hampl, 2020). Organic enterprises in Ukraine had an average profit of € 218 per ha compared to
conventional farms recording an average of € 149 per ha (Ostapenko et al., 2020). Other comparative
studies of organic, such as tea in China and Sri Lanka (Qiao et al., 2016), rice in the Philippines
(Mendoza, 2004; Pantoja et al., 2016), honey in Ethiopia (Girma & Gardebroek, 2015), cotton in
India (Fayet & Vermeulen, 2014) and pineapple in Ghana (Kleemann, 2016), suggest that organic
farming can be profitable and is a feasible option for smallholders living in difficult environmental
situations.
2.4.8 Robustness checks for PSM estimations
To establish whether the common support requirement is achieved, the distribution of propensity
scores among the two groups was established across the three matching algorithms. This matching
compares the situation before and after matching and checks if any remaining differences are likely
to affect the outcome variables. Propensity Score Matching analysis on the effect on yield showed
that there was significance for some of the crops like field/common bean, macadamia nut, coffee, and
mango (Figure 2.4.1). On the effect on profitability, there were significance differences for
field/common bean and macadamia nut. The graphical representation of the distribution of the
covariates between the treated and untreated groups for the selected crops was significant (yield
looked at field/common bean, macadamia nut, coffee and mango, while profits looked at
field/common bean and macadamia nut).
The distribution of the propensity scores is presented along with the area of common support. The
results show matching occurs within the region of common support. There is a skewed distribution
of the propensity scores between the organic (treated) and conventional farms (untreated) for some
of the crops (common beans, macadamia nut, coffee and mango). The results compare the situation
before and after matching to check if any remaining differences are likely to affect the outcome
variables (Table 2.4-11). The median absolute bias, the value of R-square, and the joint significance
of covariates are compared before and after matching.
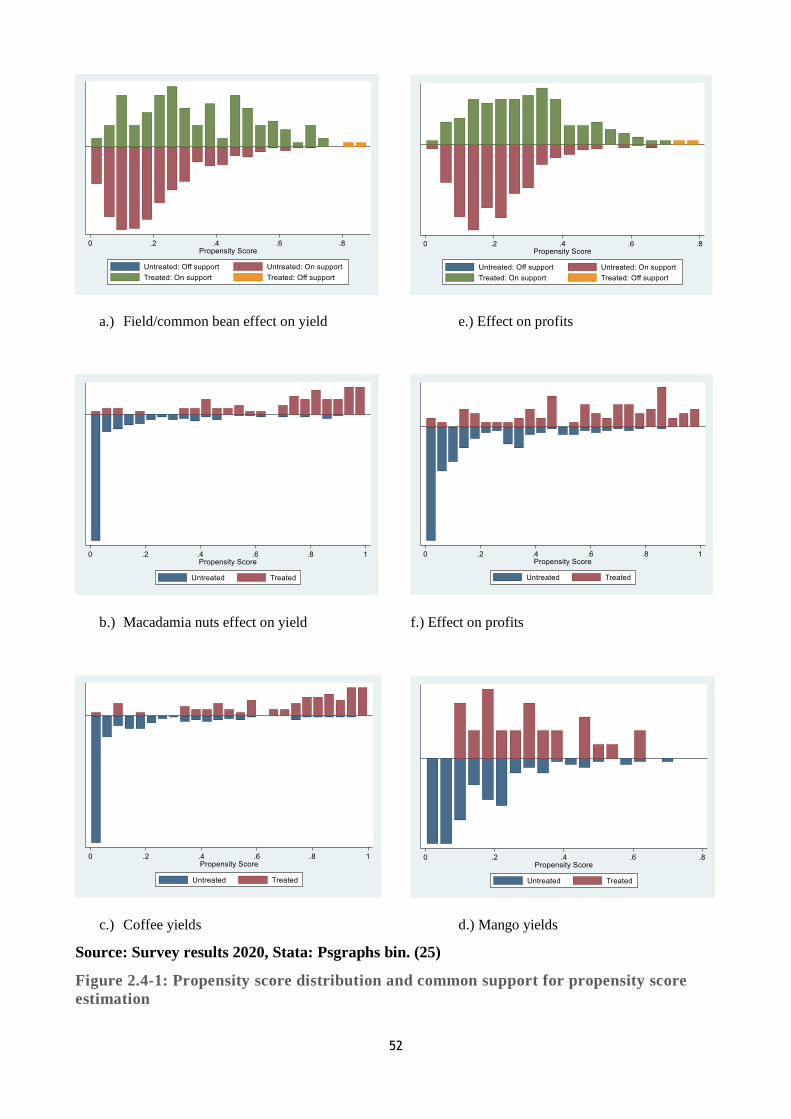
52
a.) Field/common bean effect on yield e.) Effect on profits
b.) Macadamia nuts effect on yield f.) Effect on profits
c.) Coffee yields d.) Mango yields
Source: Survey results 2020, Stata: Psgraphs bin. (25)
Figure 2.4-1: Propensity score distribution and common support for propensity score
estimation

53
Table 2.4-11: Test for Quality of Matches and Sensitivity Analysis
Outcome
variable
Matching
Algorithm
Median bias
before
matching
Median bias
after
matching
% bias
reduction
Pseudo R2
unmatched
Pseudo R2
matched
p-value of LR
unmatched
value of LR
matched
Critical level of
Hidden bias
(gamma)
Yield of
Common bean
NNM
13.4
2.6 19.0
0.131
0.007
0.000
1.000
1.00-1.05 KM 5.1 38.3 0.026 0.986
RM 6.9 58.1 0.047 0.739
Yield of
Macadamia nuts
NNM
27.6
12.6 116.0
0.520
0.202
0.000
0.001
1.85 – 1.90 KM 6.8 87.8 0.128 0.094
RM 5.7 89.1 0.132 0.076
Yield of Coffee NNM
28.4
11.3 101.9
0.514
0.162
0.000
0.013
1.80 – 1.85 KM 7.6 88.7 0.131 0.076
RM 6.5 90.0 0.135 0.061
Yield of Mango NNM
14.1
8.9 32.2
0.171
0.019
0.039
1.000
1.00-1.05 KM 7.5 59.2 0.065 0.993
RM 10.1 78.3 0.112 0.901
Profits of
Common bean
NNM
13.4
3.8 21.6
0.084
0.008
0.000
1.000
1.30-1.35 KM 8.2 40.5 0.029 0.921
RM 10.7 53.8 0.050 0.461
Profits of
Macadamia nut
NNM
24.8
10.0 65.2
0.376
0.073
0.000
0.455
1.80 – 1.85 KM 7.5 61.0 0.066 0.559
RM 7.9 65.1 0.075 0.418
Note: NNM= Nearest Neighbour Matching, KM= Kernel Matching and RM= Radius Matching
54
Table 2.4-11 indicates a reduction in median absolute bias before and after matching, for all three
matchings, as a result of matching algorithms for the yields of field/common bean, macadamia
nut, coffee, and mango, and for the profits of field/common bean and macadamia nut. The
estimates show that the reduction in the median bias were all greater than 19% for the yields
(field/common bean 19%, macadamia nut 87%, coffee 88%, and mango 32%) and greater than
21% for the profits (field/common beans 21% and macadamia nut 61%). According to Abadie and
Imbens (2011), Beal and Kupzyk (2014), and Rubin (2006), a large reduction in bias improves the
quality of matching.
Results of the Pseudo-R2 before (unmatched) and after (matching),presented in the columns 6 and
7 in Table 2.4-11, show the matching lower than before matching for the yields (field/common
bean, macadamia nut, coffee and mango) and profits (field/common bean and macadamia nut).
The results signify that there were no systematic differences in the distribution of covariates
between organic and conventional farms after the matching process for the crop yields
(field/common bean, macadamia nut, coffee, and mango) and profits (field/common bean and
macadamia nut).
The p-values of the likelihood ratio (LR) tests in the before and after matching scenarios are shown
in columns 8 and 9 of Table 2.4-11. The results indicate that the hypothesis of the joint significance
of the regressors is rejected after matching for yields in the field/common bean, macadamia nut,
coffee, and mango, and profits in the field/common bean and macadamia nut. The hypothesis of
the joint significance of the regressors is also rejected before matching for mango yields.
The results of the sensitivity analysis of the critical level of the hidden bias, shown by the gamma,
Γ, at which a causal inference of the significant impact of the choice of the farming system may
be questioned, are presented in the last column of Table 2.4-11. Gamma measures the difference
in response variables between treated and untreated cases. For example, the value of 1.85-1.90 for
the yield of macadamia nut implies that if farms that had the same characteristics were to differ in
the yields by a factor of 85-90%, the significance of the impact of yield on the farming system
would be questionable. The profits for field/common bean of a value of 1.30-1.35 and macadamia
nut value of 1.80-1.85 implies that if farms with the same characteristics were to differ in the
profits of field/common bean and macadamia nut by a factor of 30-35% and 80-85% respectively,
the significance of the impact of profits on the farming system would be questionable. The results
55
suggest that even a large amount of unobserved heterogeneity would not alter the inference about
the estimated effect of yields and profits on the farming system for the different crops.
2.5 Conclusion
The analysis presented in this chapter was undertaken to assess the effect of the type of farming
system (organic vs. conventional) on yield and profitability for various crops in Murang’a,
Kirinyaga and Machakos counties of Kenya. Some of the socio-economic and farm characteristic
aspects of the farmer influenced the productivity and profitability of organic and conventional
farming systems. The variables (age, number of household members, education level, membership
in farmer organization, farm size, land owned, crop count (the number of crops grown on the farm),
and hours worked by family and hired labour) considered for productivity (yield) had positive
significance for organic farming.
On the productivity of organic and conventional farming systems, the study also demonstrates that
in overall, the organic system had higher significant yields for coffee, common bean, macadamia
nut, and pigeon pea. The crops plantain, cabbage, and silky oak had lower significant yields for
organic interventions. Organic was significantly more profitable for the crops avocado, Irish
potato, spinach, pigeon pea, coffee, common bean, and macadamia nut while significant less
profitable only for silky oak.
The effect on yields for four organically grown crops, compared by using the nearest neighbor,
kernel matching and radius matching, showed that there was a significant increase in yields for
organic field/common bean, macadamia nut, coffee and mango more than in conventional farms.
Likewise, the profits of field/common bean and macadamia nut were significantly different on
organic as compared to conventional farms.
The results have agreed with the study objectives that organic farming systems can achieve similar
or higher productivity and profitability as conventional farming for some crops tested. Organic can
thus provide an alternative farming system that can viably compete with conventional systems and
should be promoted. The results show that for some crops, organic farming systems can improve
the livelihoods and household incomes of farmers in the three counties. The constraints organic
farmers face should be addressed to increase yields and profits. Capacity building of farmers to
enhance their skills on organic principles will go a long way in increasing the yields and
profitability of organic farming. The application of organic crop management practices by farmers
is dependent on the knowledge farmers have acquired in their farming experience, including
56
trainings they have participated in. On organic farms, soil health management, use of cover crops,
crop rotation, composting, integrated pest and disease management, and proper weed management
all aid the gaining of a higher yield. Since organic farming has significant positive impacts on
yields and profitability for some crops, these should be promoted among small-scale producers as
a way of improving their livelihoods. Strategies that promote good agricultural practices in the
production and marketing of farm produce should be adopted to enhance existing organic farming
systems. This could help other farmers see that organic is a viable alternative option, competitive
to conventional farming systems.
57
3. Chapter : Sustainability performance of smallholder organic and
conventional farms in Kenya
3.1 Introduction
The mechanization of agriculture and development and use of high-yielding crop varieties and
artificial fertilizers and pesticides, was initiated as a means to increase food production (Kannan et
al., 2005; Pretty & Bharucha, 2014). Compared to conventional farming, alternative agricultural
farming methods such as conservation agriculture, precision farming, agro-ecological farming and
organic agriculture among others, aim to provide more sustainable farming practices that conserve
biodiversity and ecosystem services for future generations (Hansen, 1996; Latruffe et al., 2016;
Pretty & Bharucha, 2014). It has been suggested that such alternative approaches can meet the
increasing demand for food as the world population rises (Pretty & Bharucha, 2014; Waney et al.,
2014).
The concept of sustainable agricultural systems is centered on the need to develop techniques and
practices that have low effects on the environment, improvements in productivity, and positive side-
effects on agricultural goods and services (Kannan et al., 2005; Waney et al., 2014). Conventional
agriculture is characterized by the extensive use of artificial fertilizers and pesticides, with
detrimental effects on the environment and human health (Luttikholt, 2007; Pretty & Bharucha,
2014). By contrast, organic farming utilizes on-farm or locally available resources, less or no
synthetic fertilizers and pesticides, and practices such as crop rotation and mulching with natural
plant materials, while encouraging diversification of crops and animal species (Adamtey et al., 2016;
Shennan et al., 2017. Organic farming conserves soil fertility and quality, leads to harmony with
nature, builds on relationships that ensure fairness, and protects current and future generations and
the environment (Luttikholt, 2007). Since organic production targets the development of a
sustainable cultivation-based system, organic agriculture is a relevant tool to advance the United
Nations SDGs on sustainable agriculture, sustainable consumption and production, climate change,
and ecosystems (UNEP-UNCTAD, 2008).
For a system to be defined as sustainable, certain variables that make it viable need to be measured
(Hayati et al., 2010; Latruffe et al., 2016; Pretty & Bharucha, 2014). The parameters for measuring
agricultural sustainability are multi-dimensional and complex, and vary depending on the criteria
58
used, scope of the study, and context or geographic location (Binder et al., 2010; FAO, 2013;
Marchand et al., 2014; Schader et al., 2014). Although many sustainability assessment methods and
tools exist, if they are not suited to the particular system to be assessed they may fail to correctly
measure the desired sustainability aspects (de Olde et al., 2016; Röös et al., 2019). Coteur (2018)
adds that for strategic decision making, sustainability assessment tools need to be well-tuned to
farmers’ needs, motivations, and vision. The methods need to assess any given farm from a broader
sustainability assessment approach to identify and highlight areas in need of improvement, study
trade-offs, and follow developments over time (Binder et al., 2010; FAO, 2013; Marchand et al.,
2014; Schader et al., 2014).
Past research that has compared organic and conventional production systems has utilized farm
surveys, field experiments, and case studies in similar geographical areas (Binta et al., 2015; Gabriel
et al., 2013; Shennan et al., 2017). Assessments take the farm level as the evaluation unit, where the
production of goods and services (economic); the management of natural resources (ecological); the
contribution to rural dynamics (social); and decision making (governance) takes place (Hayati et al.,
2010; Latruffe et al., 2016; Waney et al., 2014).
A limited number of studies on the sustainability of farming systems in Kenya exist. They largely
lack a holistic approach and fail to capture the multidimensional impacts expected in organic
farming. The existing studies on sustainability have assessed energy use (Mirko et al., 2019),
external input technologies (De Jager et al., 2001), priorities for extension and training in agriculture
(Grenz et al., 2009), school gardens (Sottile et al., 2016), urban sustainability (Mutisya & Yarime,
2014), typology of farms (Kamau et al., 2018), adoption and sustainability of dairy technologies
(Mwirigi et al., 2009), biogas (Nzila et al., 2012) and input-output tea management (Onduru et al.,
2012). In these studies, the data or sample sizes were relatively small e.g. 30 farms in Grenz et al.,
(2009), 15 case studies in Sottile et al., (2016), 200 farms in Mwirigi et al., 2009, 120 farms in
Onduru et al., (2012) and 53 households in Spaling, et al. (2014).
The current study seeks to provide evidence on how farmers and farming practices under organic
farming perform in Kenya in comparison with conventional farming systems. Most existing studies
examine only conventional farming methods and practices. Only a few focus on organic farming
and, in particular, farmer experiences in ecological farming (as against organic experimental
research). This study uses a novel approach to measure sustainability: it considers the holistic nature
59
of the sustainability concept, constructed through a hierarchical framework of principles, criteria,
and indicators. The indicator-based multi-criteria assessment tool used in this study is known as the
Sustainability Monitoring and Assessment RouTine Farm Tool (SMART-Farm Tool) (Schader et
al., 2016; Ssebunya et al., 2018). The SMART-Farm Tool’s indicators are spread across four
sustainability dimensions emphasizing the multi-dimensional nature of sustainable development
(Hanuš, 2004; Schader et al., 2016). Each of the four dimensions has its own set of indicators, sub-
themes and themes.
Within the space of political commitment to sustainable agriculture, more evidence is required on
how farmers and organizations transit towards practicing sustainable agriculture and, more
specifically, what their motivations and driving forces are. This study seeks to add to the existing
organic agriculture debate as well as to policy framework measures in Kenya that support organic
farming as a suitable alternative for sustainable farming, food and nutrition security, and income
generation of small-scale households. In this chapter, an assessment of the sustainability
performance of organic and conventional farming systems in three Kenyan counties (Kirinyaga,
Machakos, and Murang’a) is reported. The research questions is:
How sustainable are organic compared to conventional farming systems in Kenya?
Whereas the objectives are:
To evaluate the sustainability performance and differences of organic compared to
conventional agricultural farming systems in three counties of Murang’a, Kirinyaga and
Machakos in Kenya (at the sub-theme and indicator level).
3.2 Methodology
Study areas
This study was carried out between January and March 2017 in three counties, each with different
agro-ecological, climatic, and farming characteristics (see Chapter 1). The crops grown in the case
study counties include cereals, fruits, vegetables and stimulant crops. In Murang’a, the crops include
arrowroot, avocado, plantain, cabbage, common beans, Irish potato, kale, maize, spinach and tea. In
Kirinyaga, the crops were avocado, plantain, coffee, common beans, French beans, silky oak, kale,
macadamia, maize and tea. In Machakos, the crops include banana, chili pepper, cowpea, common
beans, green gram, lemon, maize, mango, papaya, and pigeon pea. The organic farming systems in
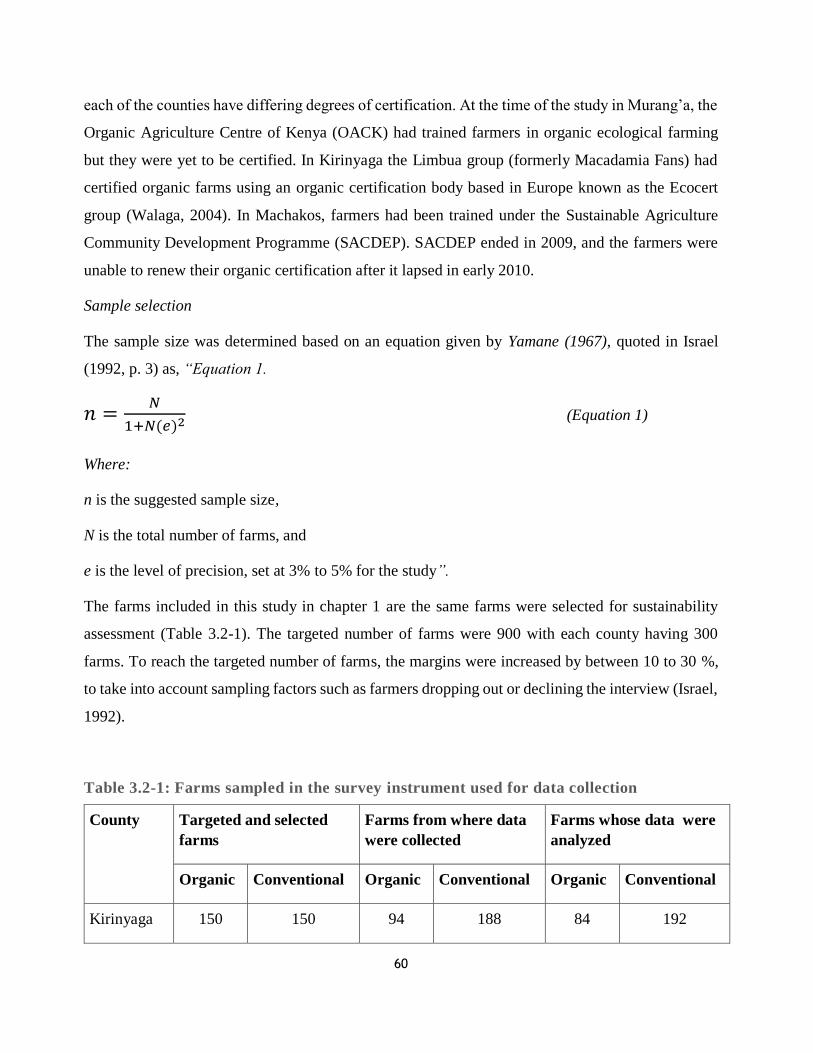
60
each of the counties have differing degrees of certification. At the time of the study in Murang’a, the
Organic Agriculture Centre of Kenya (OACK) had trained farmers in organic ecological farming
but they were yet to be certified. In Kirinyaga the Limbua group (formerly Macadamia Fans) had
certified organic farms using an organic certification body based in Europe known as the Ecocert
group (Walaga, 2004). In Machakos, farmers had been trained under the Sustainable Agriculture
Community Development Programme (SACDEP). SACDEP ended in 2009, and the farmers were
unable to renew their organic certification after it lapsed in early 2010.
Sample selection
The sample size was determined based on an equation given by Yamane (1967), quoted in Israel
(1992, p. 3) as, “Equation 1.
𝑛 =𝑁
1+𝑁(𝑒)2 (Equation 1)
Where:
n is the suggested sample size,
N is the total number of farms, and
e is the level of precision, set at 3% to 5% for the study”.
The farms included in this study in chapter 1 are the same farms were selected for sustainability
assessment (Table 3.2-1). The targeted number of farms were 900 with each county having 300
farms. To reach the targeted number of farms, the margins were increased by between 10 to 30 %,
to take into account sampling factors such as farmers dropping out or declining the interview (Israel,
1992).
Table 3.2-1: Farms sampled in the survey instrument used for data collection
County Targeted and selected
farms
Farms from where data
were collected
Farms whose data were
analyzed
Organic Conventional Organic Conventional Organic Conventional
Kirinyaga 150 150 94 188 84 192
61
Machakos 90 210 55 241 40 256
Murang'a 150 150 114 172 81 201
Total 390 510 263 601 205 649
Data were eventually collected from 864 farmers but only 854 farmers (205 organic, 649
conventional) were included in the subsequent statistical analysis, since not all the farmers
completed the survey and some dropped out during the interview process since they had other
commitments or due to natural demise. The 205 organic farms were those under the intervention.
SAFA guidelines and the SMART-Farm Tool
The Sustainability Assessment of Food and Agriculture Systems (SAFA) guidelines developed by
the Food and Agriculture Organization of the United Nations (FAO) provide a universal framework
for sustainability assessments. These guidelines aim to harmonize sustainability assessment methods
and increase the transparency and comparability of their results (FAO, 2013a). This study uses the
SMART-Farm Tool developed by the Research Institute of Organic Agriculture (FiBL). This
indicator-based multi-criteria assessment tool was created following the SAFA guidelines (Schader
et al., 2016; Ssebunya et al., 2018).
The SMART-Farm Tool, coded under the reference SMART-Farm Tool; RRID: SCR_018197, has
four dimensions (governance, environmental integrity, economic resilience, and social well-being),
21 themes, and 58 sub-themes. The tool takes a holistic approach by incorporating a wide range of
indicators and capturing the multidimensional impacts of sustainability in its four dimensions.
Constructed through a hierarchical framework of principles, criteria, and indicators, it utilizes a set
of indicators and impact weights to determine the degrees of goal achievement for different
sustainability dimensions and sub-themes (Schader et al., 2016; Ssebunya et al., 2018). It has about
327 indicators, with 1769 linkages between these indicators and the 58 SAFA sub-themes (Annex 1
highlights the sub-themes used in the analysis of this study). From the 327 indicators for 58 SAFA
sub-themes, a set of relevant indicators was selected for each farm interview by using a specific
relevance check function in the SMART-Farm Tool. This function selects indicators based on three
factors: geographic region, farm type (organic or conventional), and specific farm components
(crops, livestock, labour type, pesticides, or fertilizer use), as described by Schader et al. (2016) and
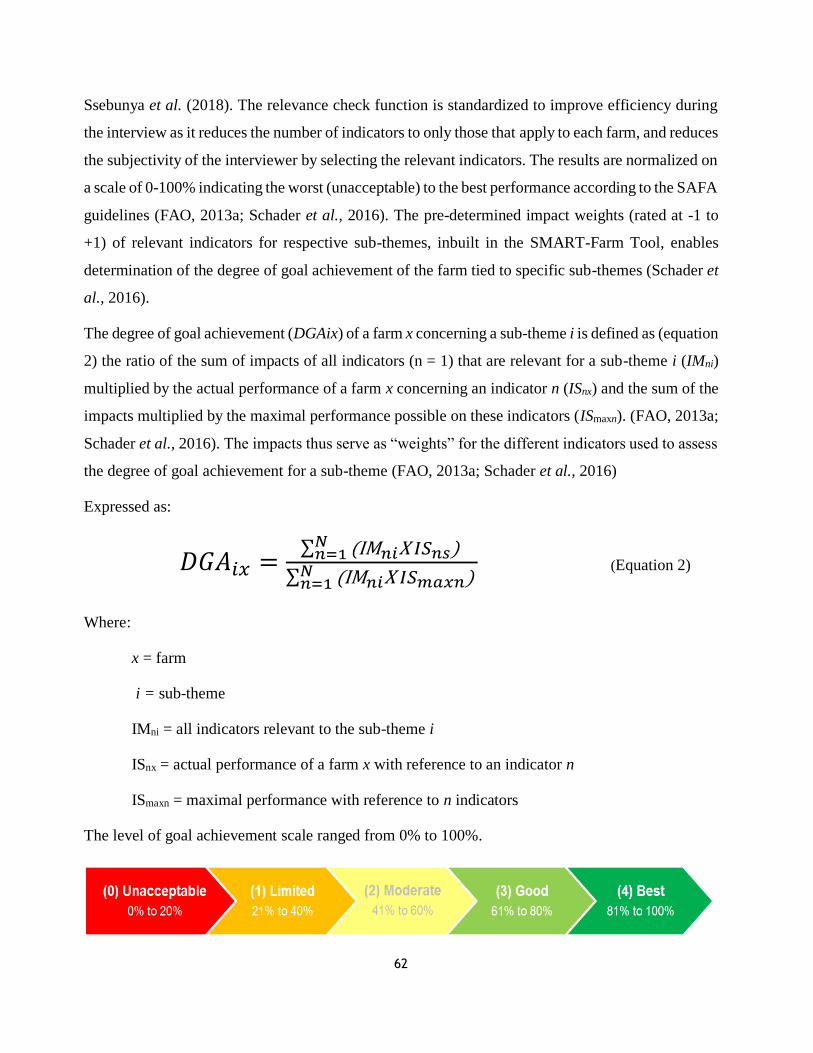
62
Ssebunya et al. (2018). The relevance check function is standardized to improve efficiency during
the interview as it reduces the number of indicators to only those that apply to each farm, and reduces
the subjectivity of the interviewer by selecting the relevant indicators. The results are normalized on
a scale of 0-100% indicating the worst (unacceptable) to the best performance according to the SAFA
guidelines (FAO, 2013a; Schader et al., 2016). The pre-determined impact weights (rated at -1 to
+1) of relevant indicators for respective sub-themes, inbuilt in the SMART-Farm Tool, enables
determination of the degree of goal achievement of the farm tied to specific sub-themes (Schader et
al., 2016).
The degree of goal achievement (DGAix) of a farm x concerning a sub-theme i is defined as (equation
2) the ratio of the sum of impacts of all indicators (n = 1) that are relevant for a sub-theme i (IMni)
multiplied by the actual performance of a farm x concerning an indicator n (ISnx) and the sum of the
impacts multiplied by the maximal performance possible on these indicators (ISmaxn). (FAO, 2013a;
Schader et al., 2016). The impacts thus serve as “weights” for the different indicators used to assess
the degree of goal achievement for a sub-theme (FAO, 2013a; Schader et al., 2016)
Expressed as:
𝐷𝐺𝐴𝑖𝑥 =∑ (IM𝑛𝑖X 𝐼𝑆𝑛𝑠) 𝑁𝑛=1
∑ (IM𝑛𝑖X 𝐼𝑆𝑚𝑎𝑥𝑛) 𝑁𝑛=1
(Equation 2)
Where:
x = farm
i = sub-theme
IMni = all indicators relevant to the sub-theme i
ISnx = actual performance of a farm x with reference to an indicator n
ISmaxn = maximal performance with reference to n indicators
The level of goal achievement scale ranged from 0% to 100%.
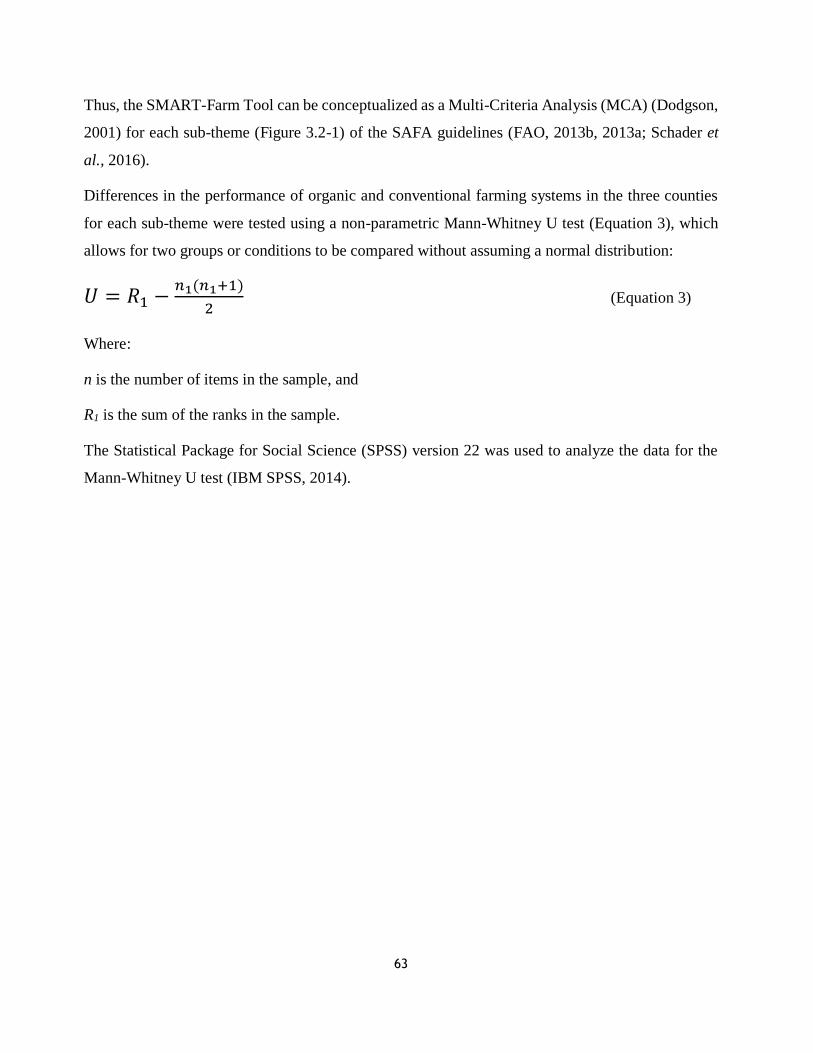
63
Thus, the SMART-Farm Tool can be conceptualized as a Multi-Criteria Analysis (MCA) (Dodgson,
2001) for each sub-theme (Figure 3.2-1) of the SAFA guidelines (FAO, 2013b, 2013a; Schader et
al., 2016).
Differences in the performance of organic and conventional farming systems in the three counties
for each sub-theme were tested using a non-parametric Mann-Whitney U test (Equation 3), which
allows for two groups or conditions to be compared without assuming a normal distribution:
𝑈 = 𝑅1 −𝑛1(𝑛1+1)
2 (Equation 3)
Where:
n is the number of items in the sample, and
R1 is the sum of the ranks in the sample.
The Statistical Package for Social Science (SPSS) version 22 was used to analyze the data for the
Mann-Whitney U test (IBM SPSS, 2014).
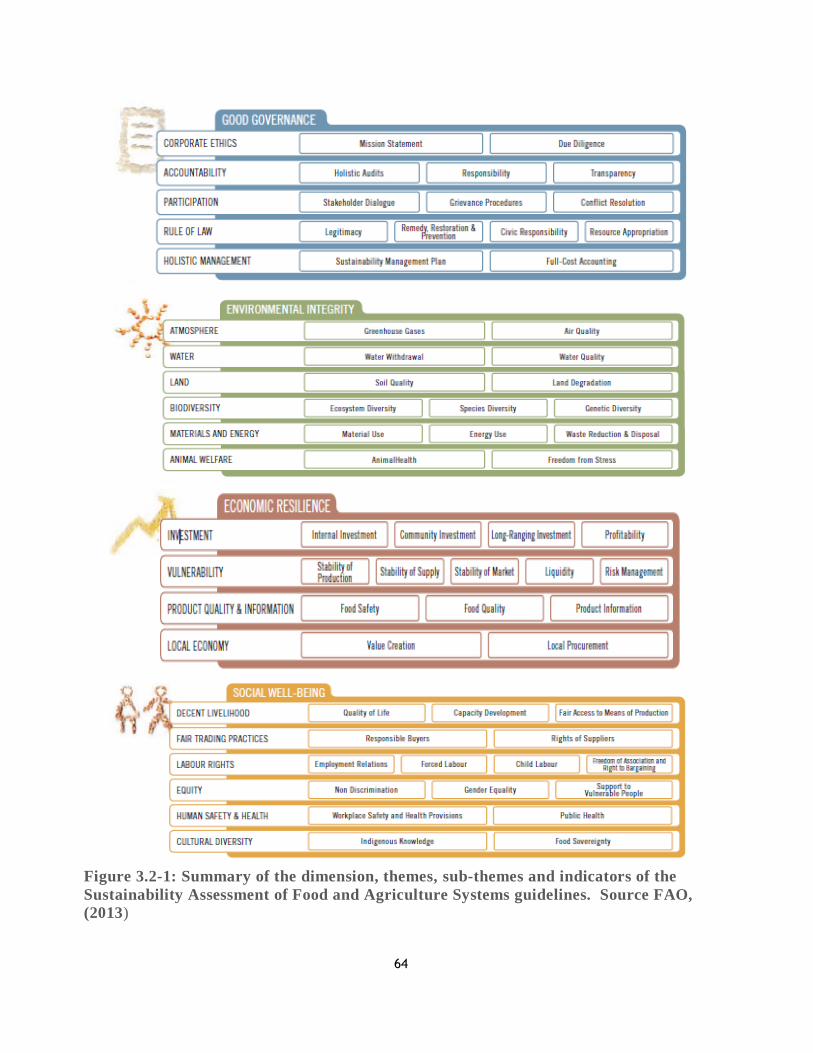
64
Figure 3.2-1: Summary of the dimension, themes, sub-themes and indicators of the
Sustainability Assessment of Food and Agriculture Systems guidelines. Source FAO,
(2013)
65
Survey design
To be defined as such, organic farmers should follow organic principles and organic management
practices (Luttikholt, 2007; Weidmann et al., 2004). The organic farms included in this survey are
those that practiced organic by default and those that were organic certified. A list of such farms was
provided by NGOs working on organic agriculture in the study area. Follow-up questions about
being organic were included in the questionnaire. Questions seeking the following information were
built into the farmer questionnaire: Is the farmer an organic farmer (yes/no)? What is the reason for
farming organically? Since when has the farmer been organic/when did the farmer convert to
organic? If the farmer has stopped farming organically, what was the main reason? Is the whole farm
certified organic or just a part of it? In which year was the entire farm, or a part of the farm, certified
organic? If a part of the farm only, which fields were certified organic? Which was the certification
body? Is there any internal control system? Other questions concerning inputs used (fertilizer,
insecticides, fungicides and herbicides) and management practices assisted in grouping the farmers
into the organic and conventional groups. Even if the farmer was initially considered organic, the
results of the (farm operations) analysis might have led to the farmer being reclassified as
conventional, and vice versa. The questionnaire incorporated both quantitative and qualitative
measures about the each farm and its operations. An extensive literature review had informed the
survey design on the geography, crops, yields, prices, typical farm activities, agricultural inputs, and
climatic conditions of the sampled counties, providing background information used as a reference
and as bench-marking points in the questionnaire.
Data collection
Prior to the onset of the farm survey, 15 auditors and six facilitators were trained for two weeks. The
questionnaire was piloted before the onset of the surveys. The survey was a process involving farm
tours, interviews (between auditor and farmer), and observations. All interviews started with a brief
introduction, a tour of the farm, and concluded after a face to face interview with the farm manager
covering all relevant evaluation topics. Clarification was sought from farmers for answers to
questions that were not clear, for example by scanning through records of farm receipts or viewing
input containers (for active insecticide, fungicide and herbicide ingredients).
After the farmer interviews, the surveys were reviewed by the auditors to ensure that each question
had been appropriately answered. A peer-review process was established to ensure consistency in
66
terms of the rating approaches used by different auditors. The peer-review involved the exchange of
the day’s surveys between auditors in the same county. If irregular responses were detected, further
consultation with the farmer was sought. A facilitator and auditor discussion also took place to
identify further corrective action to be taken before the final farm questionnaire was uploaded to the
SMART-Farm Tool (version 4.1) database.
Subsequent plausibility checks were conducted by a third person focusing on indicators that raised
issues of inconsistency or relevance checks in the database (Annex 1). Data errors were verified with
the respective auditors or corrected using available literature to maintain consistency in the ratings.
Where possible, the data was cross-referenced with existing secondary information as part of the
consistency check.
Data analysis
The surveys, as SMART-Farm Tool survey files, were analyzed with the SMART-Farm Tool
software to compute the degree of goal achievement per indicator, sub-theme, and theme.
Additional statistical analysis, including descriptive analysis (frequencies, percentages, means, and
medians), were conducted to check which goal achievement scores, across organic and conventional
farms and across counties, were the highest. Each sub-theme has several relevant indicators and
impact weights, which give the performance ratings at the sub-theme level (Annex 2). The sum of
the impact weights and the scores for the sub-theme category gave the level of achievement at the
sub-theme level. It is worth noting that for each sub-theme there is a group of indicators that in
combination allow for assessment of the degree of goal achievement. Each of the indicators has a
rating associated with it to be used in the analysis. A non-parametric test was carried out to check if
there were any significant differences between the sub-theme and indicators in organic and
conventional farms. The Mann-Whitney U test, using IBM SPSS version 22, was used for a quick
check on which of the means and mean rank scores were higher for organic and conventional farms
(IBM SPSS, 2014).
Further analysis to test for significant differences was carried out using Stata version 16. A mixed-
effect regression model was used and the farm type (organic or conventional) was considered as the
random factor for each variable in the “varlist mission statement to food sovereignty” for the sub-
theme and indicators (58 sub-themes and 1,300 sub-theme indicator combinations). The standard
67
error for the goal achievement scores were also included to show where there were significant
differences between organic and conventional farms. The P<0.05 shows the significance level of the
sub-theme/indicator scores for the distribution. A Fisher’s protected Least Significant Difference
(LSD) test was used for the pairwise comparison analysis, as recommended by Milliken and Johnson
(2009). The methodology was recommended for planned comparisons, assuming the corresponding
joint test is significant (Milliken & Johnson, 2009). Apart from comparing the overall performance
of organic and conventional farms at the sub-theme level, the comparison is also done at the county
(case study) level. This checks the performance of organic and conventional farms at the county
level and if they are significantly different.
Deeper analysis of 12 sub-themes
A further, deeper analysis, was required for a selected number of sub-themes to understand the scores
and the reasons behind the scores for the two systems as the results are interpreted. At times, the
result of the scores can be the same or almost the same for both organic and conventional farming.
It is therefore necessary to understand at a more detailed level the indicators for a better interpretation
of the data. Since it is not possible to look at the whole data-set of the sustainability assessment (over
1300 sub-theme indicator combinations), a selected number that were relevant, manageable,
consistent and sufficient to include all sustainability goals were chosen for the further indicator
analysis. 12 sub-themes (Table 3.2-2) were selected using the following four criteria:
Criteria 1: A synopsis of statistical analysis was done to check which of the sub-themes have
significant differences between the two groups (organic versus conventional). Of the total 58 sub-
themes (Annex 1), 13 had no significant difference and 46 were significant (across all four
sustainability dimensions: environmental integrity 10, economic resilience 12, social well-being 10,
and governance 14).
Criteria 2: Relevance to the case study (county) settings (based on the SAFA sub-theme objectives,
some had little or no relevance and were thus dropped). For example, in the “responsible buyers”
sub-theme, the buyers set the price and there are no real negotiations on the set prices; therefore this
sub-theme was deemed irrelevant and dropped.
Criteria 3: Not redundant but excluded because other analysis methods would be needed to assess
the sub-theme. For example, in the “emissions of greenhouse gases” sub-theme, a quantitative
68
measure would be necessary to assess the degree of goal achievement. Needless-to-say, this was
beyond the scope of this study.
Criteria 4: Availability of secondary information, for Kenya, on the opportunities, challenges and
constraints that affect the topic of the sub-theme. For example, some interesting aspects on
production, marketing and value addition along various value chains were considered, as was the
Economic Review of Agriculture in Kenya 2015(MoALF 2015) and the recent Agricultural Sector
Transformation and Growth Strategy 2019-2029 (GoK, 2019). The information was used to interpret
the results at the sub-theme and indicator levels. For example, which plant/pest protection control
measures are allowed or not allowed in organic farming and if allowed, what quantity per area per
time period (EAOPS 2007).
Finally, we compared the sub-theme means for organic and conventional farming systems across the
three counties to arrive at a number of sub-themes for further detailed analysis. The 12 sub-themes
selected were: water withdrawal, ecosystem diversity, and soil quality (dimension: environmental
integrity); stability of supplies, stability of the market, and food safety (economic resilience);
capacity development, indigenous knowledge, and public health (social well-being); and holistic
audits, civic responsibility, and sustainability management plan (governance) (Table 3.2-2). Annex
3 for the full list of sustainability subthemes and their objectives. Further comparison of the
indicators and sub-themes was undertaken to reduce the number of indicators to those relevant to
the 12 sub-themes. To do so, a high impact weight of 0.7 was applied to the data to get absolute
weights of between 0 and 1 to generate the sub-theme indicators for analysis and comparison. For
the indicators selected, a Fisher’s protected Least Significant Difference (LSD) test was used to
check if the means were significantly different at the farming system and the case study levels.
A mixed effect regression model is used for the final analysis. The mixed model takes the farm as a
random factor for each of the variables in the valist (mission statement to food sovereignty) for the
subthemes and valist (Air quality _00186_RenewableEnergyProductionOnFarm_Calculated to
Work place safety and health provision _00790_EmplyeesProtectiveGear) for the indicators. The
mixed, contrast and margins for the interactions are generated between organic and conventional
farms for significance differences test for the 854 farms.
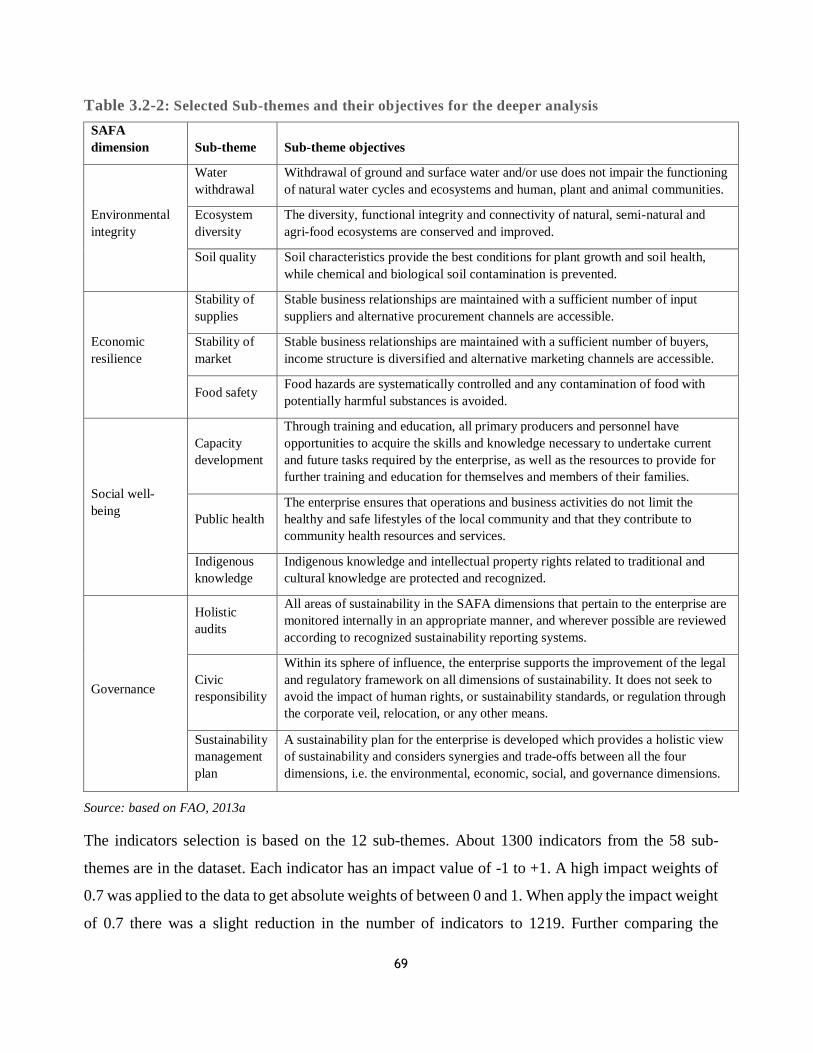
69
Table 3.2-2: Selected Sub-themes and their objectives for the deeper analysis
SAFA
dimension Sub-theme Sub-theme objectives
Environmental
integrity
Water
withdrawal
Withdrawal of ground and surface water and/or use does not impair the functioning
of natural water cycles and ecosystems and human, plant and animal communities.
Ecosystem
diversity
The diversity, functional integrity and connectivity of natural, semi-natural and
agri-food ecosystems are conserved and improved.
Soil quality Soil characteristics provide the best conditions for plant growth and soil health,
while chemical and biological soil contamination is prevented.
Economic
resilience
Stability of
supplies
Stable business relationships are maintained with a sufficient number of input
suppliers and alternative procurement channels are accessible.
Stability of
market
Stable business relationships are maintained with a sufficient number of buyers,
income structure is diversified and alternative marketing channels are accessible.
Food safety Food hazards are systematically controlled and any contamination of food with
potentially harmful substances is avoided.
Social well-
being
Capacity
development
Through training and education, all primary producers and personnel have
opportunities to acquire the skills and knowledge necessary to undertake current
and future tasks required by the enterprise, as well as the resources to provide for
further training and education for themselves and members of their families.
Public health
The enterprise ensures that operations and business activities do not limit the
healthy and safe lifestyles of the local community and that they contribute to
community health resources and services.
Indigenous
knowledge
Indigenous knowledge and intellectual property rights related to traditional and
cultural knowledge are protected and recognized.
Governance
Holistic
audits
All areas of sustainability in the SAFA dimensions that pertain to the enterprise are
monitored internally in an appropriate manner, and wherever possible are reviewed
according to recognized sustainability reporting systems.
Civic
responsibility
Within its sphere of influence, the enterprise supports the improvement of the legal
and regulatory framework on all dimensions of sustainability. It does not seek to
avoid the impact of human rights, or sustainability standards, or regulation through
the corporate veil, relocation, or any other means.
Sustainability
management
plan
A sustainability plan for the enterprise is developed which provides a holistic view
of sustainability and considers synergies and trade-offs between all the four
dimensions, i.e. the environmental, economic, social, and governance dimensions.
Source: based on FAO, 2013a
The indicators selection is based on the 12 sub-themes. About 1300 indicators from the 58 sub-
themes are in the dataset. Each indicator has an impact value of -1 to +1. A high impact weights of
0.7 was applied to the data to get absolute weights of between 0 and 1. When apply the impact weight
of 0.7 there was a slight reduction in the number of indicators to 1219. Further comparing the
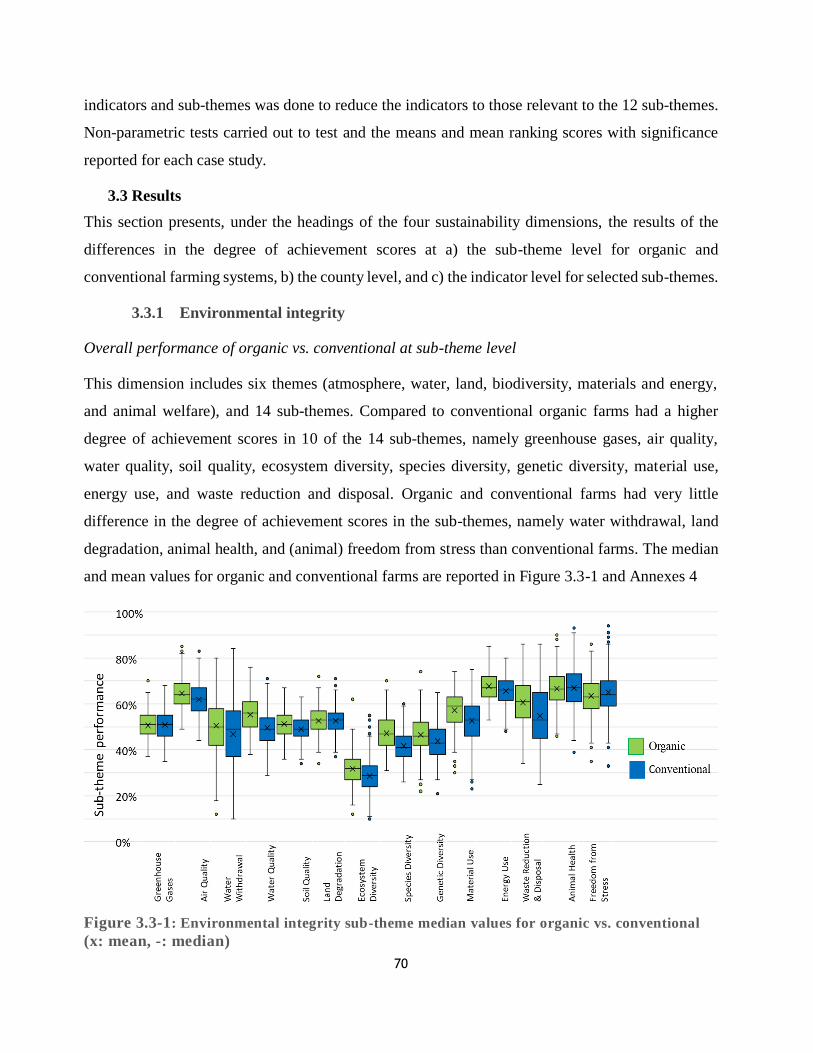
70
indicators and sub-themes was done to reduce the indicators to those relevant to the 12 sub-themes.
Non-parametric tests carried out to test and the means and mean ranking scores with significance
reported for each case study.
3.3 Results
This section presents, under the headings of the four sustainability dimensions, the results of the
differences in the degree of achievement scores at a) the sub-theme level for organic and
conventional farming systems, b) the county level, and c) the indicator level for selected sub-themes.
3.3.1 Environmental integrity
Overall performance of organic vs. conventional at sub-theme level
This dimension includes six themes (atmosphere, water, land, biodiversity, materials and energy,
and animal welfare), and 14 sub-themes. Compared to conventional organic farms had a higher
degree of achievement scores in 10 of the 14 sub-themes, namely greenhouse gases, air quality,
water quality, soil quality, ecosystem diversity, species diversity, genetic diversity, material use,
energy use, and waste reduction and disposal. Organic and conventional farms had very little
difference in the degree of achievement scores in the sub-themes, namely water withdrawal, land
degradation, animal health, and (animal) freedom from stress than conventional farms. The median
and mean values for organic and conventional farms are reported in Figure 3.3-1 and Annexes 4
Figure 3.3-1: Environmental integrity sub-theme median values for organic vs. conventional
(x: mean, -: median)
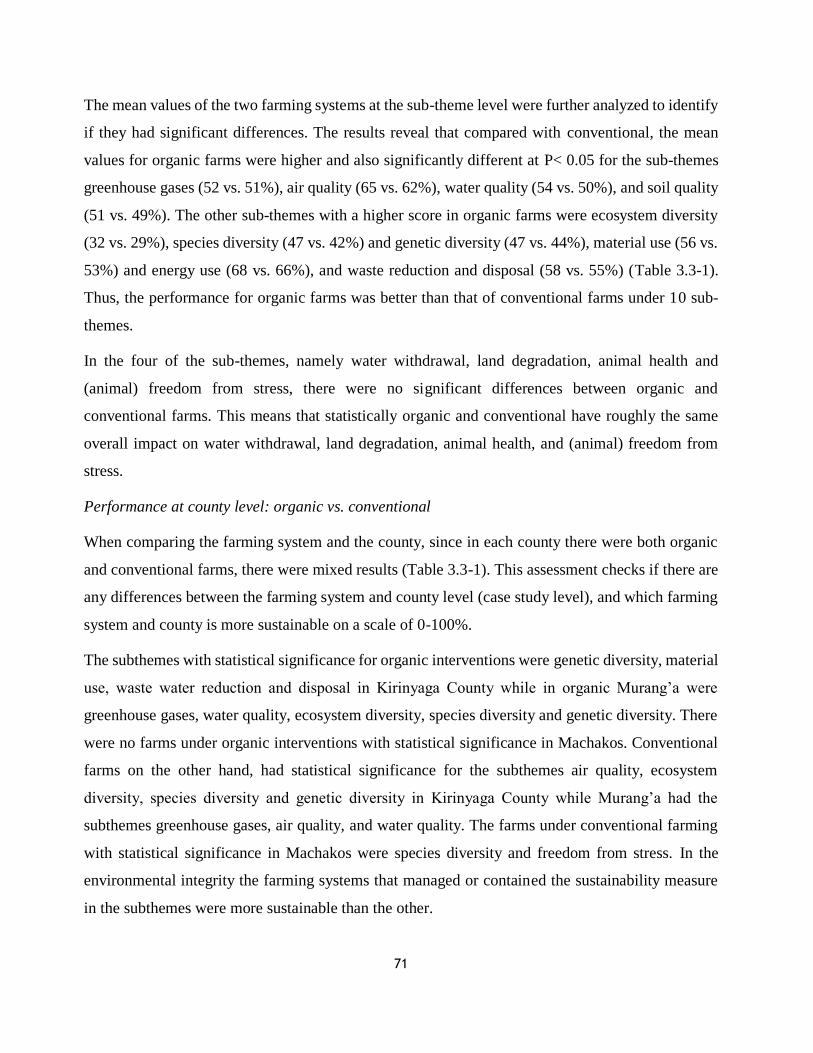
71
The mean values of the two farming systems at the sub-theme level were further analyzed to identify
if they had significant differences. The results reveal that compared with conventional, the mean
values for organic farms were higher and also significantly different at P< 0.05 for the sub-themes
greenhouse gases (52 vs. 51%), air quality (65 vs. 62%), water quality (54 vs. 50%), and soil quality
(51 vs. 49%). The other sub-themes with a higher score in organic farms were ecosystem diversity
(32 vs. 29%), species diversity (47 vs. 42%) and genetic diversity (47 vs. 44%), material use (56 vs.
53%) and energy use (68 vs. 66%), and waste reduction and disposal (58 vs. 55%) (Table 3.3-1).
Thus, the performance for organic farms was better than that of conventional farms under 10 sub-
themes.
In the four of the sub-themes, namely water withdrawal, land degradation, animal health and
(animal) freedom from stress, there were no significant differences between organic and
conventional farms. This means that statistically organic and conventional have roughly the same
overall impact on water withdrawal, land degradation, animal health, and (animal) freedom from
stress.
Performance at county level: organic vs. conventional
When comparing the farming system and the county, since in each county there were both organic
and conventional farms, there were mixed results (Table 3.3-1). This assessment checks if there are
any differences between the farming system and county level (case study level), and which farming
system and county is more sustainable on a scale of 0-100%.
The subthemes with statistical significance for organic interventions were genetic diversity, material
use, waste water reduction and disposal in Kirinyaga County while in organic Murang’a were
greenhouse gases, water quality, ecosystem diversity, species diversity and genetic diversity. There
were no farms under organic interventions with statistical significance in Machakos. Conventional
farms on the other hand, had statistical significance for the subthemes air quality, ecosystem
diversity, species diversity and genetic diversity in Kirinyaga County while Murang’a had the
subthemes greenhouse gases, air quality, and water quality. The farms under conventional farming
with statistical significance in Machakos were species diversity and freedom from stress. In the
environmental integrity the farming systems that managed or contained the sustainability measure
in the subthemes were more sustainable than the other.
72
Table 3.3-1:Sub-theme and the degree of achievement scores (%) comparing differences between system, county, system
and county with standard error margin
Sub-theme
System County System and County
P Kirinyaga Murang’a Machakos
P Organic Conventional P Kirinyaga Murang’a Machakos Organic Conventional Organic Conventional Organic Conventional
Greenhouse Gases <0.05 51.6(±0.4) a 50.6(±0.2)b <0.05 49.7(±0.3)a 46.2(±0.3)b 56.2(±0.3)c <0.05 50.3(±0.6) 49.6(±0.4) 48.3(±0.5)a 45.6(±0.3)b 56.0(±0.8) 56.2(±0.3)
Air Quality <0.05 65.1(±0.5) a 61.6(±0.2)b <0.05 60.0(±0.4)a 61.3(±0.4)b 66.0(±0.4)c <0.05 63.1(±0.8) 58.9(±0.5)a 64.7(±0.7) 60.1(±0.4)b 67.3(±1.2) 65.6(±0.4)
Water Withdrawal ns 49.0(±1.0) 47.1(±0.6) <0.05 47.8(±0.8)a 52.4(±0.7)b 42.8(±1.0)c <0.05 53.7(±1.1) 46.0(±0.9) 51.1(±1.3) 52.8(±1.3) 42.7(±2.3) 42.9(±1.0)
Water Quality <0.05 54.2(±0.6) a 49.7(±0.3)b <0.05 48.9(±0.4)a 55.5(±0.4)b 48.0(±0.4) <0.05 54.2(±0.7) 47.2(±0.5) 59.4(±0.8)a 54.3(±0.4)b 49.2(±1.2) 47.7(±0.4)
Soil Quality <0.05 51.0(±0.4) a 49.0(±0.2)b <0.05 49.1(±0.3) 50.3(±0.3)b 49.0(±0.3) <0.05 52.1(±0.6) 48.2(±0.4) 51.1(±0.7) 50.2(±0.4) 50.0(±0.8) 48.8(±0.3)
Land Degradation ns 52.6(±0.5) 52.6(±0.2) <0.05 53.4(±0.3) 51.4(±0.3)b 53.1(±0.3) <0.05 54.0(±0.7) 53.1(±0.4) 51.1(±0.7) 51.5(±0.3) 52.8(±1.0) 53.1(±0.4)
Ecosystem
Diversity <0.05 31.8(±0.5) a 28.6(±0.2)b <0.05 25.3(±0.4)a 32.0(±0.3)b 30.6(±0.4)c <0.05 28.6(±0.7) 24.3(±0.5)a 34.9(±0.6)b 31.1(±0.4) 31.8(±1.2) 30.1(±0.4)
Species Diversity <0.05 46.8(±0.5) a 41.8(±0.2)b <0.05 39.9(±0.4)a 47.0(±0.4)b 42.1(±0.4)c <0.05 44.7(±0.7) 38.3(±0.5)a 51.1(±0.7)b 45.7(±0.5) 44.5(±1.2) 41.2(±0.3)c
Genetic Diversity <0.05 46.7(±0.5) a 43.7(±0.3)b <0.05 40.2(±0.4)a 46.4(±0.4)b 46.3(±0.5) <0.05 42.3(±0.8)a 39.6(±0.4)b 50.6(±0.7)c 45.1(±0.5) 47.0(±1.2) 46.1(±0.5)
Material Use <0.05 55.7(±0.6) a 52.9(±0.3)b <0.05 53.8(±0.5)a 57.0(±0.4)b 50.3(±0.6)c <0.05 60.8(±0.6)a 51.5(±0.6) 57.2(±0.8) 56.9(±0.5) 49.6(±1.4) 50.5(±0.7)
Energy Use <0.05 68.0(±0.4) a 65.5(±0.2)b <0.05 66.2(±0.4)a 63.7(±0.3)b 68.3(±0.4)c <0.05 68.7(±0.7) 65.3(±0.5) 65.9(±0.6) 63.0(±0.4)a 69.5(±0.9) 67.9(±0.4)
Waste Reduction
& Disposal <0.05 58,3(±0.6) a 55.2(±0.4)b <0.05 52.0(±0.5)a 66.9(±0.6)b 49.1(±0.6)c <0.05 59.2(±0.6)a 49.8(±0.6) 68.2(±1.0) 66.5(±0.7) 48.2(±1.4) 49.5(±0.7)
Animal Health ns 66.0(±0.7) 66.7(±0.4) <0.05 63.5(±0.4)a 67.5(±0.6) 68.6(±0.6) ns 67.1(±0.8) 62.4(±0.5) 67.5(±1.0) 68.9(±0.6) 63.7(±1.4) 68.7(±0.6)
Freedom from
Stress ns 63.6(±0.6) 64.6(±0.4) <0.05 61.2(±0.4)a 63.6(±0.6)b 67.9(±0.6)c <0.05 64.2(±0.8) 60.2(±0.5) 62.3(±1.1) 64.1(±0.7) 64.2(±1.3) 69.1(±0.6)a
Note: margins showing letters in the group are significantly different at the 5% level
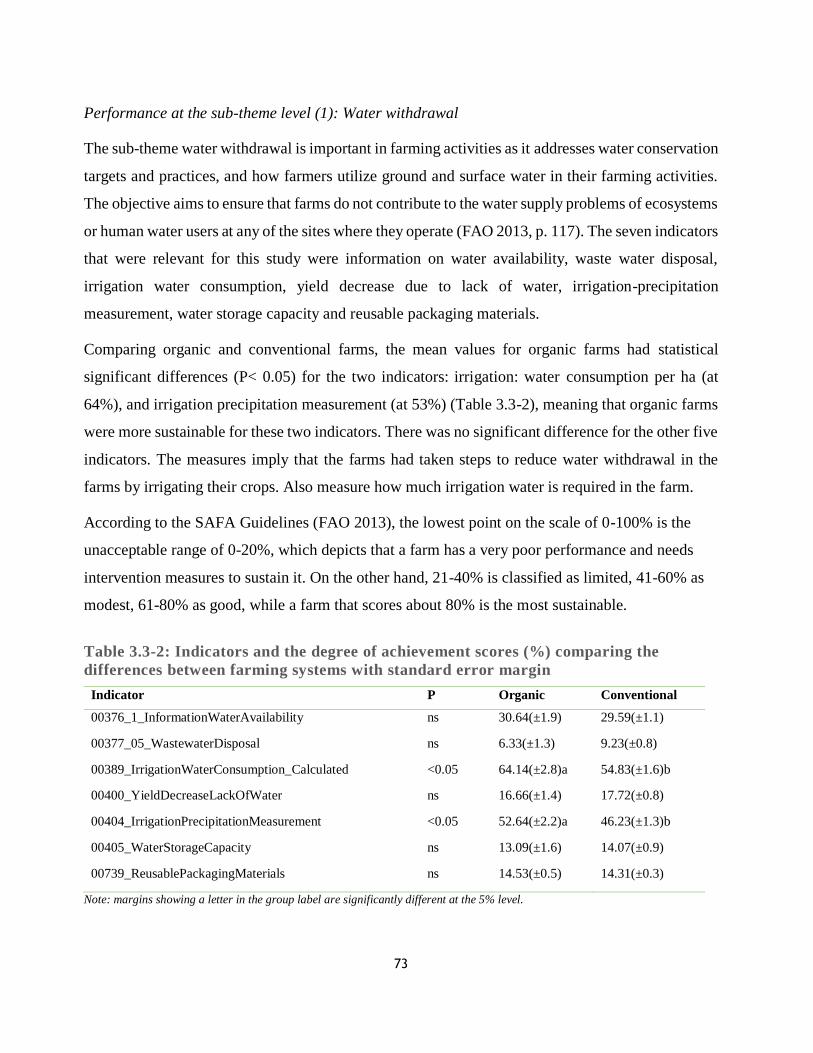
73
Performance at the sub-theme level (1): Water withdrawal
The sub-theme water withdrawal is important in farming activities as it addresses water conservation
targets and practices, and how farmers utilize ground and surface water in their farming activities.
The objective aims to ensure that farms do not contribute to the water supply problems of ecosystems
or human water users at any of the sites where they operate (FAO 2013, p. 117). The seven indicators
that were relevant for this study were information on water availability, waste water disposal,
irrigation water consumption, yield decrease due to lack of water, irrigation-precipitation
measurement, water storage capacity and reusable packaging materials.
Comparing organic and conventional farms, the mean values for organic farms had statistical
significant differences (P< 0.05) for the two indicators: irrigation: water consumption per ha (at
64%), and irrigation precipitation measurement (at 53%) (Table 3.3-2), meaning that organic farms
were more sustainable for these two indicators. There was no significant difference for the other five
indicators. The measures imply that the farms had taken steps to reduce water withdrawal in the
farms by irrigating their crops. Also measure how much irrigation water is required in the farm.
According to the SAFA Guidelines (FAO 2013), the lowest point on the scale of 0-100% is the
unacceptable range of 0-20%, which depicts that a farm has a very poor performance and needs
intervention measures to sustain it. On the other hand, 21-40% is classified as limited, 41-60% as
modest, 61-80% as good, while a farm that scores about 80% is the most sustainable.
Table 3.3-2: Indicators and the degree of achievement scores (%) comparing the
differences between farming systems with standard error margin
Indicator P Organic Conventional
00376_1_InformationWaterAvailability ns 30.64(±1.9) 29.59(±1.1)
00377_05_WastewaterDisposal ns 6.33(±1.3) 9.23(±0.8)
00389_IrrigationWaterConsumption_Calculated <0.05 64.14(±2.8)a 54.83(±1.6)b
00400_YieldDecreaseLackOfWater ns 16.66(±1.4) 17.72(±0.8)
00404_IrrigationPrecipitationMeasurement <0.05 52.64(±2.2)a 46.23(±1.3)b
00405_WaterStorageCapacity ns 13.09(±1.6) 14.07(±0.9)
00739_ReusablePackagingMaterials ns 14.53(±0.5) 14.31(±0.3)
Note: margins showing a letter in the group label are significantly different at the 5% level.
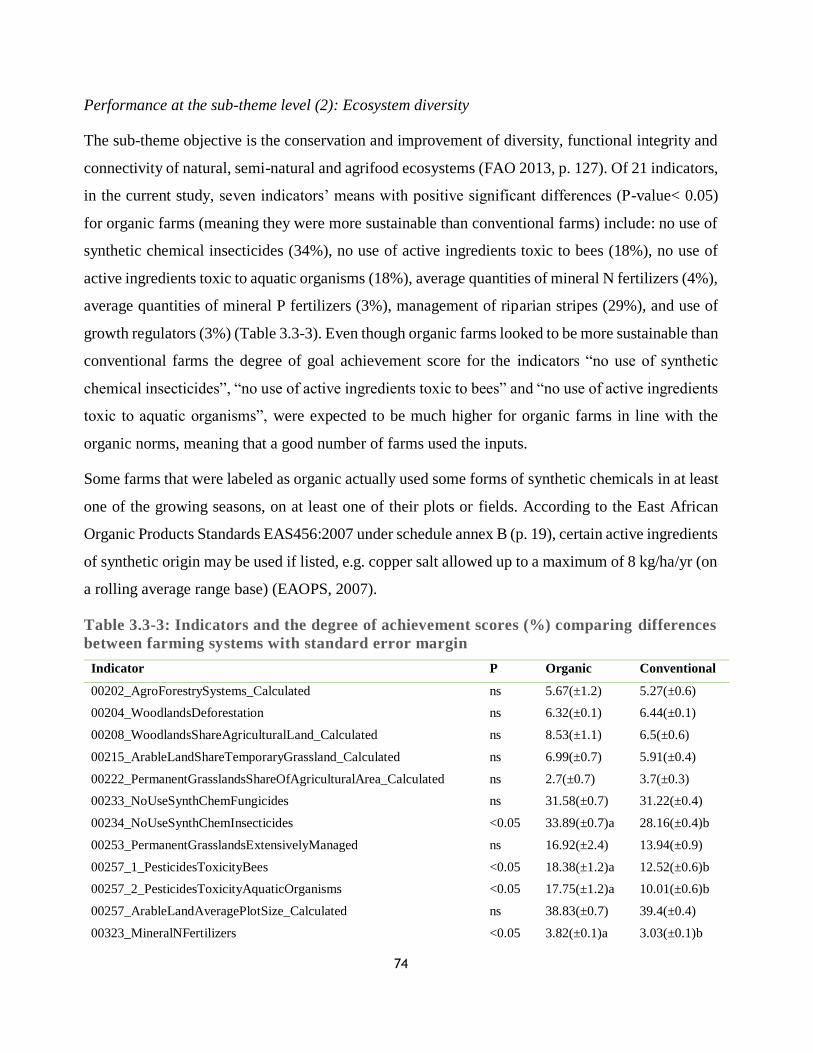
74
Performance at the sub-theme level (2): Ecosystem diversity
The sub-theme objective is the conservation and improvement of diversity, functional integrity and
connectivity of natural, semi-natural and agrifood ecosystems (FAO 2013, p. 127). Of 21 indicators,
in the current study, seven indicators’ means with positive significant differences (P-value< 0.05)
for organic farms (meaning they were more sustainable than conventional farms) include: no use of
synthetic chemical insecticides (34%), no use of active ingredients toxic to bees (18%), no use of
active ingredients toxic to aquatic organisms (18%), average quantities of mineral N fertilizers (4%),
average quantities of mineral P fertilizers (3%), management of riparian stripes (29%), and use of
growth regulators (3%) (Table 3.3-3). Even though organic farms looked to be more sustainable than
conventional farms the degree of goal achievement score for the indicators “no use of synthetic
chemical insecticides”, “no use of active ingredients toxic to bees” and “no use of active ingredients
toxic to aquatic organisms”, were expected to be much higher for organic farms in line with the
organic norms, meaning that a good number of farms used the inputs.
Some farms that were labeled as organic actually used some forms of synthetic chemicals in at least
one of the growing seasons, on at least one of their plots or fields. According to the East African
Organic Products Standards EAS456:2007 under schedule annex B (p. 19), certain active ingredients
of synthetic origin may be used if listed, e.g. copper salt allowed up to a maximum of 8 kg/ha/yr (on
a rolling average range base) (EAOPS, 2007).
Table 3.3-3: Indicators and the degree of achievement scores (%) comparing differences
between farming systems with standard error margin
Indicator P Organic Conventional
00202_AgroForestrySystems_Calculated ns 5.67(±1.2) 5.27(±0.6)
00204_WoodlandsDeforestation ns 6.32(±0.1) 6.44(±0.1)
00208_WoodlandsShareAgriculturalLand_Calculated ns 8.53(±1.1) 6.5(±0.6)
00215_ArableLandShareTemporaryGrassland_Calculated ns 6.99(±0.7) 5.91(±0.4)
00222_PermanentGrasslandsShareOfAgriculturalArea_Calculated ns 2.7(±0.7) 3.7(±0.3)
00233_NoUseSynthChemFungicides ns 31.58(±0.7) 31.22(±0.4)
00234_NoUseSynthChemInsecticides <0.05 33.89(±0.7)a 28.16(±0.4)b
00253_PermanentGrasslandsExtensivelyManaged ns 16.92(±2.4) 13.94(±0.9)
00257_1_PesticidesToxicityBees <0.05 18.38(±1.2)a 12.52(±0.6)b
00257_2_PesticidesToxicityAquaticOrganisms <0.05 17.75(±1.2)a 10.01(±0.6)b
00257_ArableLandAveragePlotSize_Calculated ns 38.83(±0.7) 39.4(±0.4)
00323_MineralNFertilizers <0.05 3.82(±0.1)a 3.03(±0.1)b
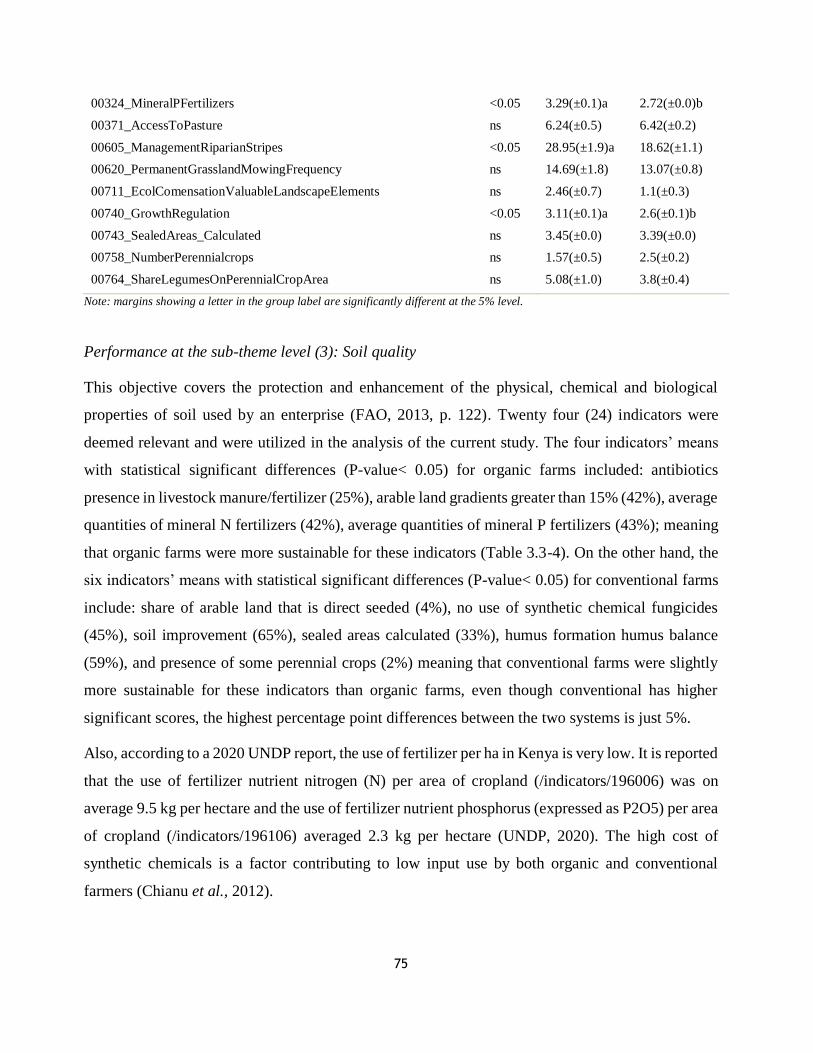
75
00324_MineralPFertilizers <0.05 3.29(±0.1)a 2.72(±0.0)b
00371_AccessToPasture ns 6.24(±0.5) 6.42(±0.2)
00605_ManagementRiparianStripes <0.05 28.95(±1.9)a 18.62(±1.1)
00620_PermanentGrasslandMowingFrequency ns 14.69(±1.8) 13.07(±0.8)
00711_EcolComensationValuableLandscapeElements ns 2.46(±0.7) 1.1(±0.3)
00740_GrowthRegulation <0.05 3.11(±0.1)a 2.6(±0.1)b
00743_SealedAreas_Calculated ns 3.45(±0.0) 3.39(±0.0)
00758_NumberPerennialcrops ns 1.57(±0.5) 2.5(±0.2)
00764_ShareLegumesOnPerennialCropArea ns 5.08(±1.0) 3.8(±0.4)
Note: margins showing a letter in the group label are significantly different at the 5% level.
Performance at the sub-theme level (3): Soil quality
This objective covers the protection and enhancement of the physical, chemical and biological
properties of soil used by an enterprise (FAO, 2013, p. 122). Twenty four (24) indicators were
deemed relevant and were utilized in the analysis of the current study. The four indicators’ means
with statistical significant differences (P-value< 0.05) for organic farms included: antibiotics
presence in livestock manure/fertilizer (25%), arable land gradients greater than 15% (42%), average
quantities of mineral N fertilizers (42%), average quantities of mineral P fertilizers (43%); meaning
that organic farms were more sustainable for these indicators (Table 3.3-4). On the other hand, the
six indicators’ means with statistical significant differences (P-value< 0.05) for conventional farms
include: share of arable land that is direct seeded (4%), no use of synthetic chemical fungicides
(45%), soil improvement (65%), sealed areas calculated (33%), humus formation humus balance
(59%), and presence of some perennial crops (2%) meaning that conventional farms were slightly
more sustainable for these indicators than organic farms, even though conventional has higher
significant scores, the highest percentage point differences between the two systems is just 5%.
Also, according to a 2020 UNDP report, the use of fertilizer per ha in Kenya is very low. It is reported
that the use of fertilizer nutrient nitrogen (N) per area of cropland (/indicators/196006) was on
average 9.5 kg per hectare and the use of fertilizer nutrient phosphorus (expressed as P2O5) per area
of cropland (/indicators/196106) averaged 2.3 kg per hectare (UNDP, 2020). The high cost of
synthetic chemicals is a factor contributing to low input use by both organic and conventional
farmers (Chianu et al., 2012).
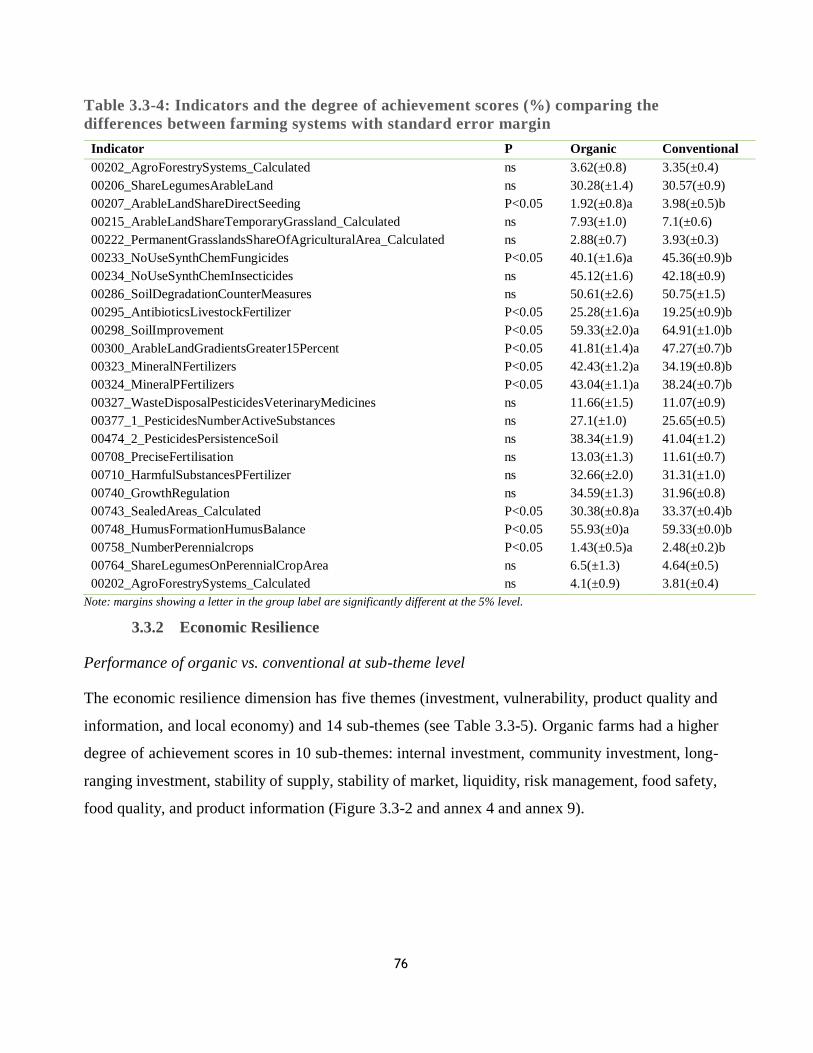
76
Table 3.3-4: Indicators and the degree of achievement scores (%) comparing the
differences between farming systems with standard error margin
Indicator P Organic Conventional
00202_AgroForestrySystems_Calculated ns 3.62(±0.8) 3.35(±0.4)
00206_ShareLegumesArableLand ns 30.28(±1.4) 30.57(±0.9)
00207_ArableLandShareDirectSeeding P<0.05 1.92(±0.8)a 3.98(±0.5)b
00215_ArableLandShareTemporaryGrassland_Calculated ns 7.93(±1.0) 7.1(±0.6)
00222_PermanentGrasslandsShareOfAgriculturalArea_Calculated ns 2.88(±0.7) 3.93(±0.3)
00233_NoUseSynthChemFungicides P<0.05 40.1(±1.6)a 45.36(±0.9)b
00234_NoUseSynthChemInsecticides ns 45.12(±1.6) 42.18(±0.9)
00286_SoilDegradationCounterMeasures ns 50.61(±2.6) 50.75(±1.5)
00295_AntibioticsLivestockFertilizer P<0.05 25.28(±1.6)a 19.25(±0.9)b
00298_SoilImprovement P<0.05 59.33(±2.0)a 64.91(±1.0)b
00300_ArableLandGradientsGreater15Percent P<0.05 41.81(±1.4)a 47.27(±0.7)b
00323_MineralNFertilizers P<0.05 42.43(±1.2)a 34.19(±0.8)b
00324_MineralPFertilizers P<0.05 43.04(±1.1)a 38.24(±0.7)b
00327_WasteDisposalPesticidesVeterinaryMedicines ns 11.66(±1.5) 11.07(±0.9)
00377_1_PesticidesNumberActiveSubstances ns 27.1(±1.0) 25.65(±0.5)
00474_2_PesticidesPersistenceSoil ns 38.34(±1.9) 41.04(±1.2)
00708_PreciseFertilisation ns 13.03(±1.3) 11.61(±0.7)
00710_HarmfulSubstancesPFertilizer ns 32.66(±2.0) 31.31(±1.0)
00740_GrowthRegulation ns 34.59(±1.3) 31.96(±0.8)
00743_SealedAreas_Calculated P<0.05 30.38(±0.8)a 33.37(±0.4)b
00748_HumusFormationHumusBalance P<0.05 55.93(±0)a 59.33(±0.0)b
00758_NumberPerennialcrops P<0.05 1.43(±0.5)a 2.48(±0.2)b
00764_ShareLegumesOnPerennialCropArea ns 6.5(±1.3) 4.64(±0.5)
00202_AgroForestrySystems_Calculated ns 4.1(±0.9) 3.81(±0.4)
Note: margins showing a letter in the group label are significantly different at the 5% level.
3.3.2 Economic Resilience
Performance of organic vs. conventional at sub-theme level
The economic resilience dimension has five themes (investment, vulnerability, product quality and
information, and local economy) and 14 sub-themes (see Table 3.3-5). Organic farms had a higher
degree of achievement scores in 10 sub-themes: internal investment, community investment, long-
ranging investment, stability of supply, stability of market, liquidity, risk management, food safety,
food quality, and product information (Figure 3.3-2 and annex 4 and annex 9).
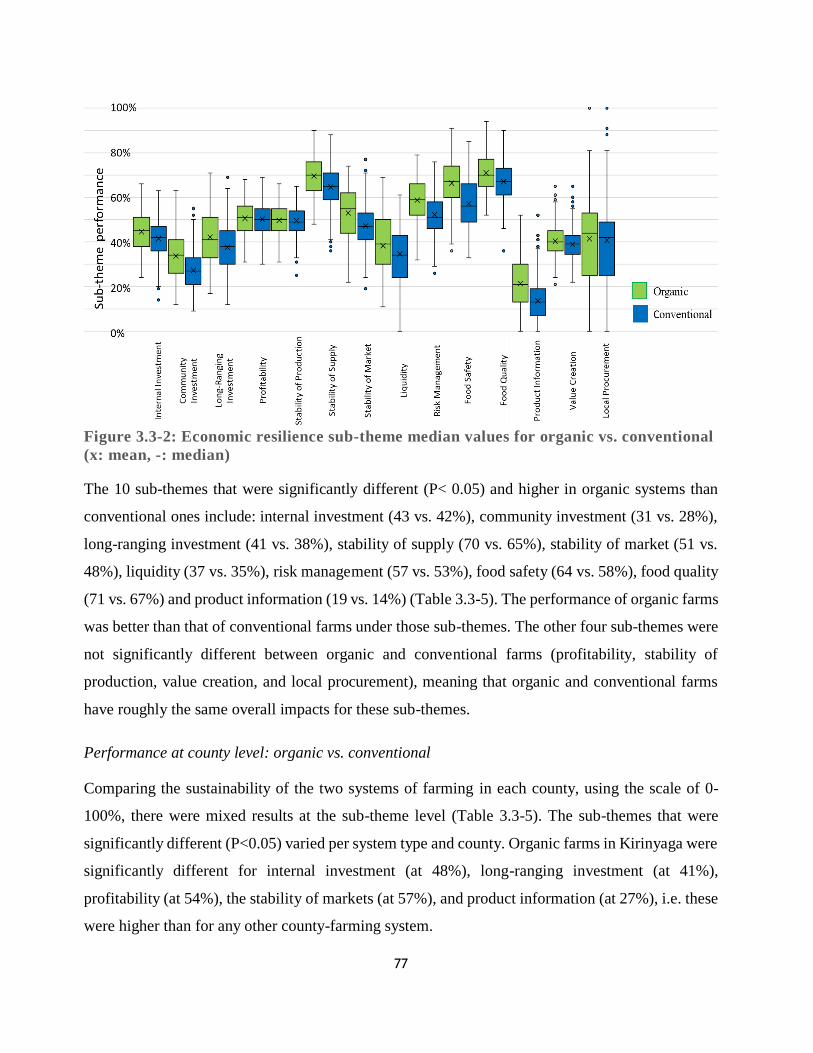
77
Figure 3.3-2: Economic resilience sub-theme median values for organic vs. conventional
(x: mean, -: median)
The 10 sub-themes that were significantly different (P< 0.05) and higher in organic systems than
conventional ones include: internal investment (43 vs. 42%), community investment (31 vs. 28%),
long-ranging investment (41 vs. 38%), stability of supply (70 vs. 65%), stability of market (51 vs.
48%), liquidity (37 vs. 35%), risk management (57 vs. 53%), food safety (64 vs. 58%), food quality
(71 vs. 67%) and product information (19 vs. 14%) (Table 3.3-5). The performance of organic farms
was better than that of conventional farms under those sub-themes. The other four sub-themes were
not significantly different between organic and conventional farms (profitability, stability of
production, value creation, and local procurement), meaning that organic and conventional farms
have roughly the same overall impacts for these sub-themes.
Performance at county level: organic vs. conventional
Comparing the sustainability of the two systems of farming in each county, using the scale of 0-
100%, there were mixed results at the sub-theme level (Table 3.3-5). The sub-themes that were
significantly different (P<0.05) varied per system type and county. Organic farms in Kirinyaga were
significantly different for internal investment (at 48%), long-ranging investment (at 41%),
profitability (at 54%), the stability of markets (at 57%), and product information (at 27%), i.e. these
were higher than for any other county-farming system.
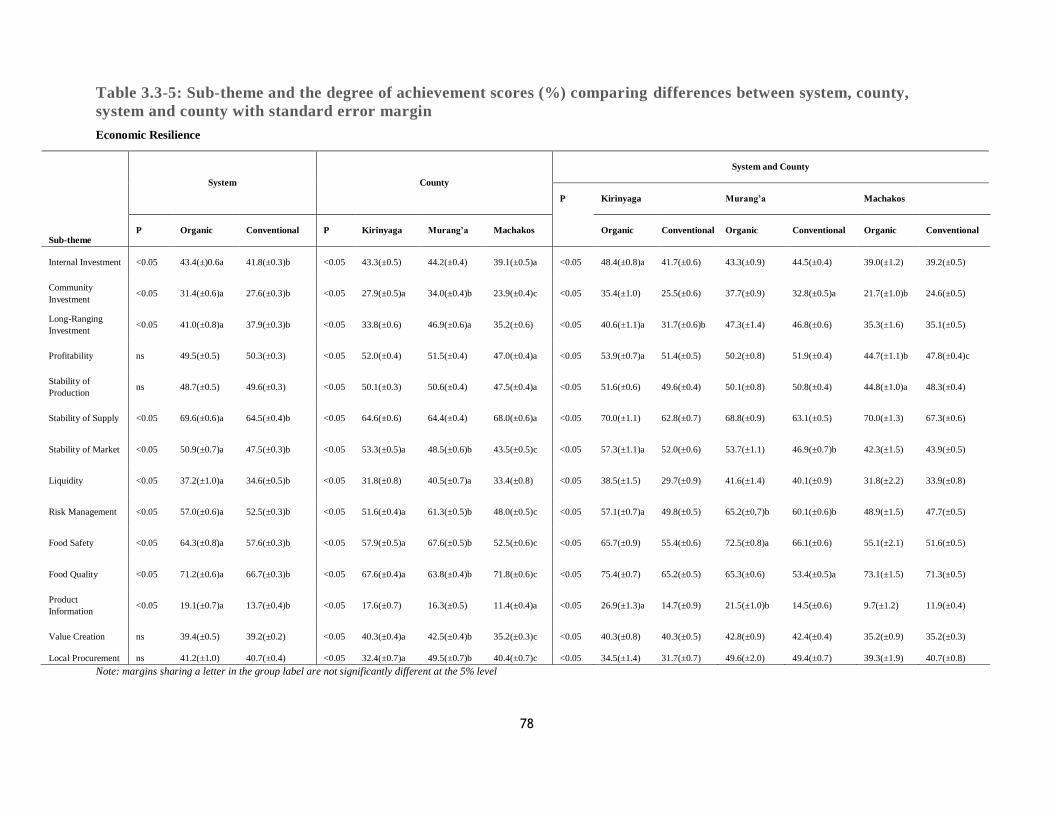
78
Table 3.3-5: Sub-theme and the degree of achievement scores (%) comparing differences between system, county,
system and county with standard error margin
Economic Resilience
Sub-theme
System County
System and County
P Kirinyaga Murang’a Machakos
P Organic Conventional P Kirinyaga Murang’a Machakos Organic Conventional Organic Conventional Organic Conventional
Internal Investment <0.05 43.4(±)0.6a 41.8(±0.3)b <0.05 43.3(±0.5) 44.2(±0.4) 39.1(±0.5)a <0.05 48.4(±0.8)a 41.7(±0.6) 43.3(±0.9) 44.5(±0.4) 39.0(±1.2) 39.2(±0.5)
Community
Investment <0.05 31.4(±0.6)a 27.6(±0.3)b <0.05 27.9(±0.5)a 34.0(±0.4)b 23.9(±0.4)c <0.05 35.4(±1.0) 25.5(±0.6) 37.7(±0.9) 32.8(±0.5)a 21.7(±1.0)b 24.6(±0.5)
Long-Ranging
Investment <0.05 41.0(±0.8)a 37.9(±0.3)b <0.05 33.8(±0.6) 46.9(±0.6)a 35.2(±0.6) <0.05 40.6(±1.1)a 31.7(±0.6)b 47.3(±1.4) 46.8(±0.6) 35.3(±1.6) 35.1(±0.5)
Profitability ns 49.5(±0.5) 50.3(±0.3) <0.05 52.0(±0.4) 51.5(±0.4) 47.0(±0.4)a <0.05 53.9(±0.7)a 51.4(±0.5) 50.2(±0.8) 51.9(±0.4) 44.7(±1.1)b 47.8(±0.4)c
Stability of
Production ns 48.7(±0.5) 49.6(±0.3) <0.05 50.1(±0.3) 50.6(±0.4) 47.5(±0.4)a <0.05 51.6(±0.6) 49.6(±0.4) 50.1(±0.8) 50.8(±0.4) 44.8(±1.0)a 48.3(±0.4)
Stability of Supply <0.05 69.6(±0.6)a 64.5(±0.4)b <0.05 64.6(±0.6) 64.4(±0.4) 68.0(±0.6)a <0.05 70.0(±1.1) 62.8(±0.7) 68.8(±0.9) 63.1(±0.5) 70.0(±1.3) 67.3(±0.6)
Stability of Market <0.05 50.9(±0.7)a 47.5(±0.3)b <0.05 53.3(±0.5)a 48.5(±0.6)b 43.5(±0.5)c <0.05 57.3(±1.1)a 52.0(±0.6) 53.7(±1.1) 46.9(±0.7)b 42.3(±1.5) 43.9(±0.5)
Liquidity <0.05 37.2(±1.0)a 34.6(±0.5)b <0.05 31.8(±0.8) 40.5(±0.7)a 33.4(±0.8) <0.05 38.5(±1.5) 29.7(±0.9) 41.6(±1.4) 40.1(±0.9) 31.8(±2.2) 33.9(±0.8)
Risk Management <0.05 57.0(±0.6)a 52.5(±0.3)b <0.05 51.6(±0.4)a 61.3(±0.5)b 48.0(±0.5)c <0.05 57.1(±0.7)a 49.8(±0.5) 65.2(±0,7)b 60.1(±0.6)b 48.9(±1.5) 47.7(±0.5)
Food Safety <0.05 64.3(±0.8)a 57.6(±0.3)b <0.05 57.9(±0.5)a 67.6(±0.5)b 52.5(±0.6)c <0.05 65.7(±0.9) 55.4(±0.6) 72.5(±0.8)a 66.1(±0.6) 55.1(±2.1) 51.6(±0.5)
Food Quality <0.05 71.2(±0.6)a 66.7(±0.3)b <0.05 67.6(±0.4)a 63.8(±0.4)b 71.8(±0.6)c <0.05 75.4(±0.7) 65.2(±0.5) 65.3(±0.6) 53.4(±0.5)a 73.1(±1.5) 71.3(±0.5)
Product
Information <0.05 19.1(±0.7)a 13.7(±0.4)b <0.05 17.6(±0.7) 16.3(±0.5) 11.4(±0.4)a <0.05 26.9(±1.3)a 14.7(±0.9) 21.5(±1.0)b 14.5(±0.6) 9.7(±1.2) 11.9(±0.4)
Value Creation ns 39.4(±0.5) 39.2(±0.2) <0.05 40.3(±0.4)a 42.5(±0.4)b 35.2(±0.3)c <0.05 40.3(±0.8) 40.3(±0.5) 42.8(±0.9) 42.4(±0.4) 35.2(±0.9) 35.2(±0.3)
Local Procurement ns 41.2(±1.0) 40.7(±0.4) <0.05 32.4(±0.7)a 49.5(±0.7)b 40.4(±0.7)c <0.05 34.5(±1.4) 31.7(±0.7) 49.6(±2.0) 49.4(±0.7) 39.3(±1.9) 40.7(±0.8)
Note: margins sharing a letter in the group label are not significantly different at the 5% level
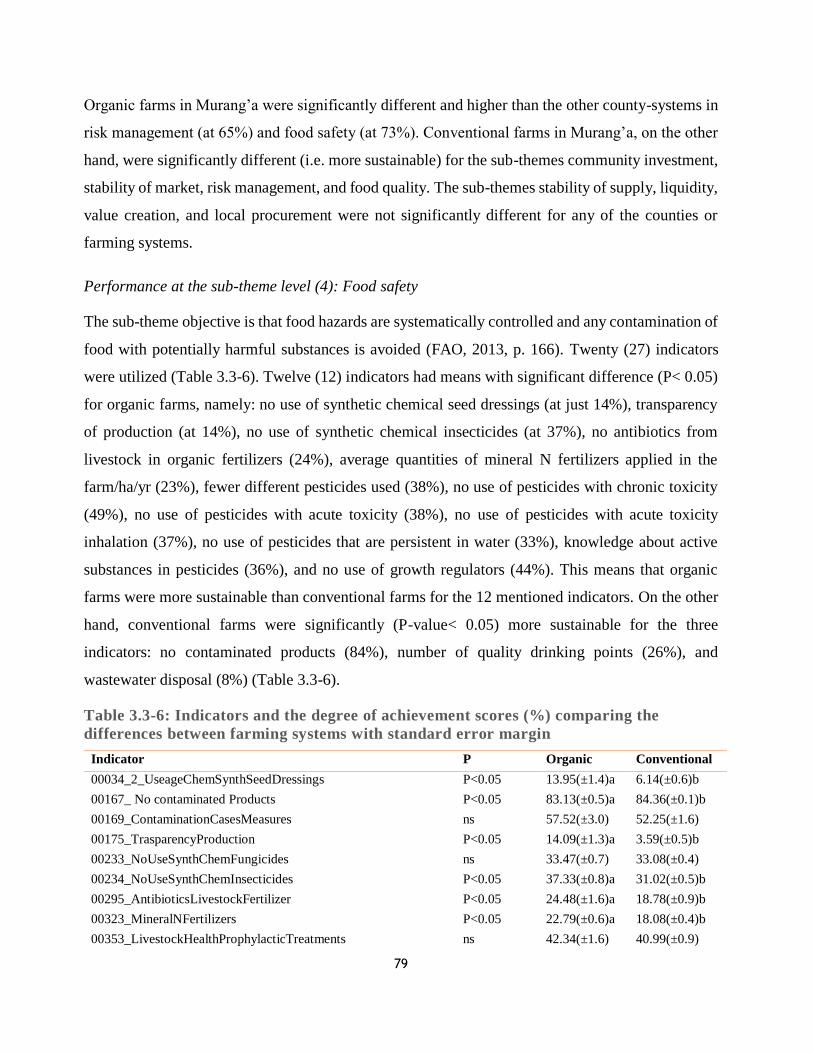
79
Organic farms in Murang’a were significantly different and higher than the other county-systems in
risk management (at 65%) and food safety (at 73%). Conventional farms in Murang’a, on the other
hand, were significantly different (i.e. more sustainable) for the sub-themes community investment,
stability of market, risk management, and food quality. The sub-themes stability of supply, liquidity,
value creation, and local procurement were not significantly different for any of the counties or
farming systems.
Performance at the sub-theme level (4): Food safety
The sub-theme objective is that food hazards are systematically controlled and any contamination of
food with potentially harmful substances is avoided (FAO, 2013, p. 166). Twenty (27) indicators
were utilized (Table 3.3-6). Twelve (12) indicators had means with significant difference (P< 0.05)
for organic farms, namely: no use of synthetic chemical seed dressings (at just 14%), transparency
of production (at 14%), no use of synthetic chemical insecticides (at 37%), no antibiotics from
livestock in organic fertilizers (24%), average quantities of mineral N fertilizers applied in the
farm/ha/yr (23%), fewer different pesticides used (38%), no use of pesticides with chronic toxicity
(49%), no use of pesticides with acute toxicity (38%), no use of pesticides with acute toxicity
inhalation (37%), no use of pesticides that are persistent in water (33%), knowledge about active
substances in pesticides (36%), and no use of growth regulators (44%). This means that organic
farms were more sustainable than conventional farms for the 12 mentioned indicators. On the other
hand, conventional farms were significantly (P-value< 0.05) more sustainable for the three
indicators: no contaminated products (84%), number of quality drinking points (26%), and
wastewater disposal (8%) (Table 3.3-6).
Table 3.3-6: Indicators and the degree of achievement scores (%) comparing the
differences between farming systems with standard error margin
Indicator P Organic Conventional
00034_2_UseageChemSynthSeedDressings P<0.05 13.95(±1.4)a 6.14(±0.6)b
00167_ No contaminated Products P<0.05 83.13(±0.5)a 84.36(±0.1)b
00169_ContaminationCasesMeasures ns 57.52(±3.0) 52.25(±1.6)
00175_TrasparencyProduction P<0.05 14.09(±1.3)a 3.59(±0.5)b
00233_NoUseSynthChemFungicides ns 33.47(±0.7) 33.08(±0.4)
00234_NoUseSynthChemInsecticides P<0.05 37.33(±0.8)a 31.02(±0.5)b
00295_AntibioticsLivestockFertilizer P<0.05 24.48(±1.6)a 18.78(±0.9)b
00323_MineralNFertilizers P<0.05 22.79(±0.6)a 18.08(±0.4)b
00353_LivestockHealthProphylacticTreatments ns 42.34(±1.6) 40.99(±0.9)
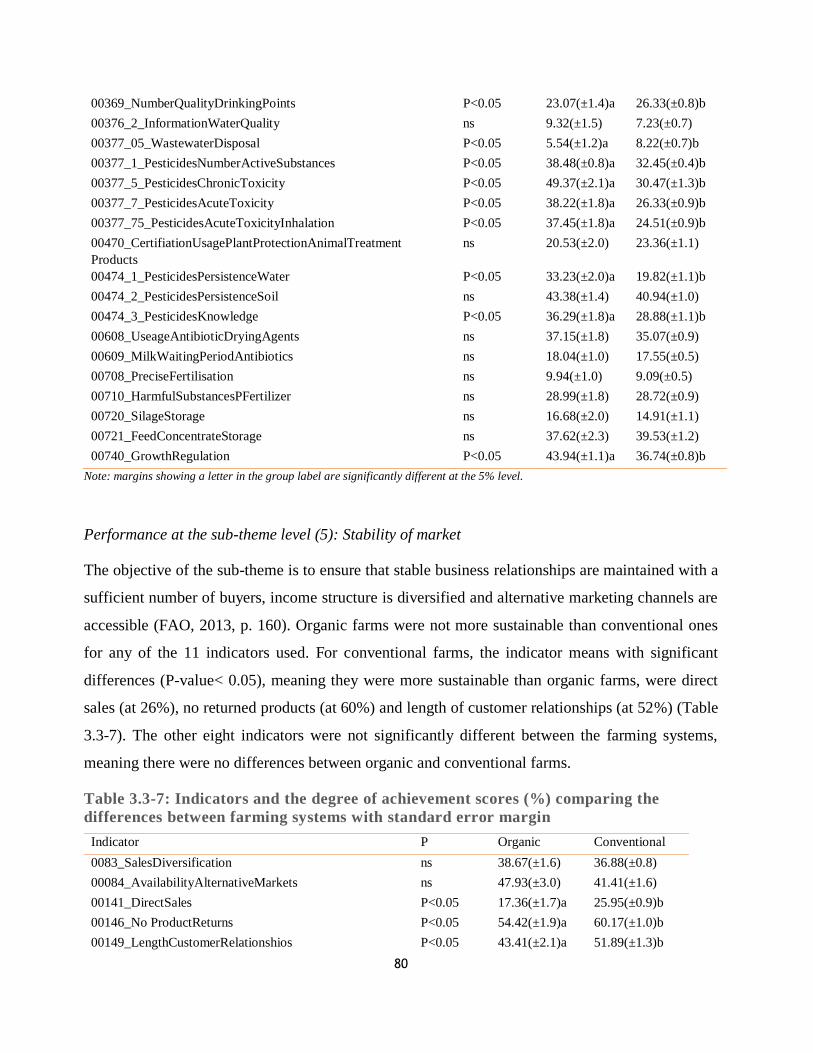
80
00369_NumberQualityDrinkingPoints P<0.05 23.07(±1.4)a 26.33(±0.8)b
00376_2_InformationWaterQuality ns 9.32(±1.5) 7.23(±0.7)
00377_05_WastewaterDisposal P<0.05 5.54(±1.2)a 8.22(±0.7)b
00377_1_PesticidesNumberActiveSubstances P<0.05 38.48(±0.8)a 32.45(±0.4)b
00377_5_PesticidesChronicToxicity P<0.05 49.37(±2.1)a 30.47(±1.3)b
00377_7_PesticidesAcuteToxicity P<0.05 38.22(±1.8)a 26.33(±0.9)b
00377_75_PesticidesAcuteToxicityInhalation P<0.05 37.45(±1.8)a 24.51(±0.9)b
00470_CertifiationUsagePlantProtectionAnimalTreatment
Products
ns 20.53(±2.0) 23.36(±1.1)
00474_1_PesticidesPersistenceWater P<0.05 33.23(±2.0)a 19.82(±1.1)b
00474_2_PesticidesPersistenceSoil ns 43.38(±1.4) 40.94(±1.0)
00474_3_PesticidesKnowledge P<0.05 36.29(±1.8)a 28.88(±1.1)b
00608_UseageAntibioticDryingAgents ns 37.15(±1.8) 35.07(±0.9)
00609_MilkWaitingPeriodAntibiotics ns 18.04(±1.0) 17.55(±0.5)
00708_PreciseFertilisation ns 9.94(±1.0) 9.09(±0.5)
00710_HarmfulSubstancesPFertilizer ns 28.99(±1.8) 28.72(±0.9)
00720_SilageStorage ns 16.68(±2.0) 14.91(±1.1)
00721_FeedConcentrateStorage ns 37.62(±2.3) 39.53(±1.2)
00740_GrowthRegulation P<0.05 43.94(±1.1)a 36.74(±0.8)b
Note: margins showing a letter in the group label are significantly different at the 5% level.
Performance at the sub-theme level (5): Stability of market
The objective of the sub-theme is to ensure that stable business relationships are maintained with a
sufficient number of buyers, income structure is diversified and alternative marketing channels are
accessible (FAO, 2013, p. 160). Organic farms were not more sustainable than conventional ones
for any of the 11 indicators used. For conventional farms, the indicator means with significant
differences (P-value< 0.05), meaning they were more sustainable than organic farms, were direct
sales (at 26%), no returned products (at 60%) and length of customer relationships (at 52%) (Table
3.3-7). The other eight indicators were not significantly different between the farming systems,
meaning there were no differences between organic and conventional farms.
Table 3.3-7: Indicators and the degree of achievement scores (%) comparing the
differences between farming systems with standard error margin
Indicator P Organic Conventional
0083_SalesDiversification ns 38.67(±1.6) 36.88(±0.8)
00084_AvailabilityAlternativeMarkets ns 47.93(±3.0) 41.41(±1.6)
00141_DirectSales P<0.05 17.36(±1.7)a 25.95(±0.9)b
00146_No ProductReturns P<0.05 54.42(±1.9)a 60.17(±1.0)b
00149_LengthCustomerRelationshios P<0.05 43.41(±2.1)a 51.89(±1.3)b
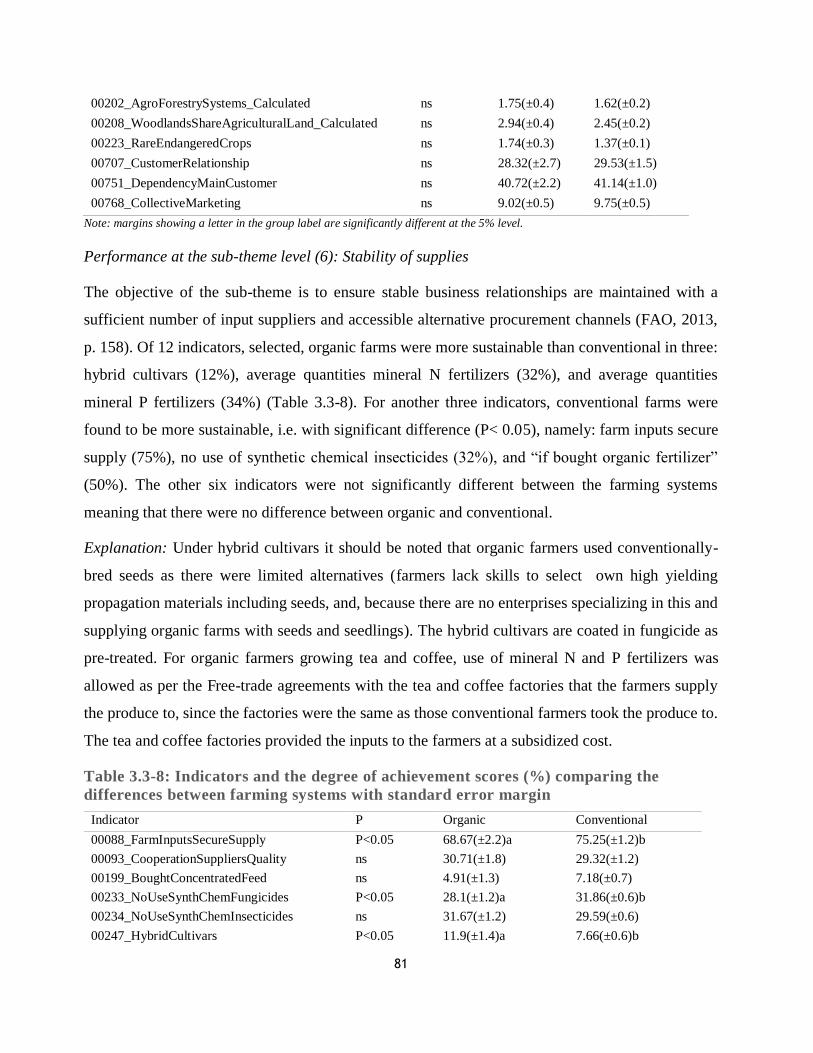
81
00202_AgroForestrySystems_Calculated ns 1.75(±0.4) 1.62(±0.2)
00208_WoodlandsShareAgriculturalLand_Calculated ns 2.94(±0.4) 2.45(±0.2)
00223_RareEndangeredCrops ns 1.74(±0.3) 1.37(±0.1)
00707_CustomerRelationship ns 28.32(±2.7) 29.53(±1.5)
00751_DependencyMainCustomer ns 40.72(±2.2) 41.14(±1.0)
00768_CollectiveMarketing ns 9.02(±0.5) 9.75(±0.5)
Note: margins showing a letter in the group label are significantly different at the 5% level.
Performance at the sub-theme level (6): Stability of supplies
The objective of the sub-theme is to ensure stable business relationships are maintained with a
sufficient number of input suppliers and accessible alternative procurement channels (FAO, 2013,
p. 158). Of 12 indicators, selected, organic farms were more sustainable than conventional in three:
hybrid cultivars (12%), average quantities mineral N fertilizers (32%), and average quantities
mineral P fertilizers (34%) (Table 3.3-8). For another three indicators, conventional farms were
found to be more sustainable, i.e. with significant difference (P< 0.05), namely: farm inputs secure
supply (75%), no use of synthetic chemical insecticides (32%), and “if bought organic fertilizer”
(50%). The other six indicators were not significantly different between the farming systems
meaning that there were no difference between organic and conventional.
Explanation: Under hybrid cultivars it should be noted that organic farmers used conventionally-
bred seeds as there were limited alternatives (farmers lack skills to select own high yielding
propagation materials including seeds, and, because there are no enterprises specializing in this and
supplying organic farms with seeds and seedlings). The hybrid cultivars are coated in fungicide as
pre-treated. For organic farmers growing tea and coffee, use of mineral N and P fertilizers was
allowed as per the Free-trade agreements with the tea and coffee factories that the farmers supply
the produce to, since the factories were the same as those conventional farmers took the produce to.
The tea and coffee factories provided the inputs to the farmers at a subsidized cost.
Table 3.3-8: Indicators and the degree of achievement scores (%) comparing the
differences between farming systems with standard error margin
Indicator P Organic Conventional
00088_FarmInputsSecureSupply P<0.05 68.67(±2.2)a 75.25(±1.2)b
00093_CooperationSuppliersQuality ns 30.71(±1.8) 29.32(±1.2)
00199_BoughtConcentratedFeed ns 4.91(±1.3) 7.18(±0.7)
00233_NoUseSynthChemFungicides P<0.05 28.1(±1.2)a 31.86(±0.6)b
00234_NoUseSynthChemInsecticides ns 31.67(±1.2) 29.59(±0.6)
00247_HybridCultivars P<0.05 11.9(±1.4)a 7.66(±0.6)b
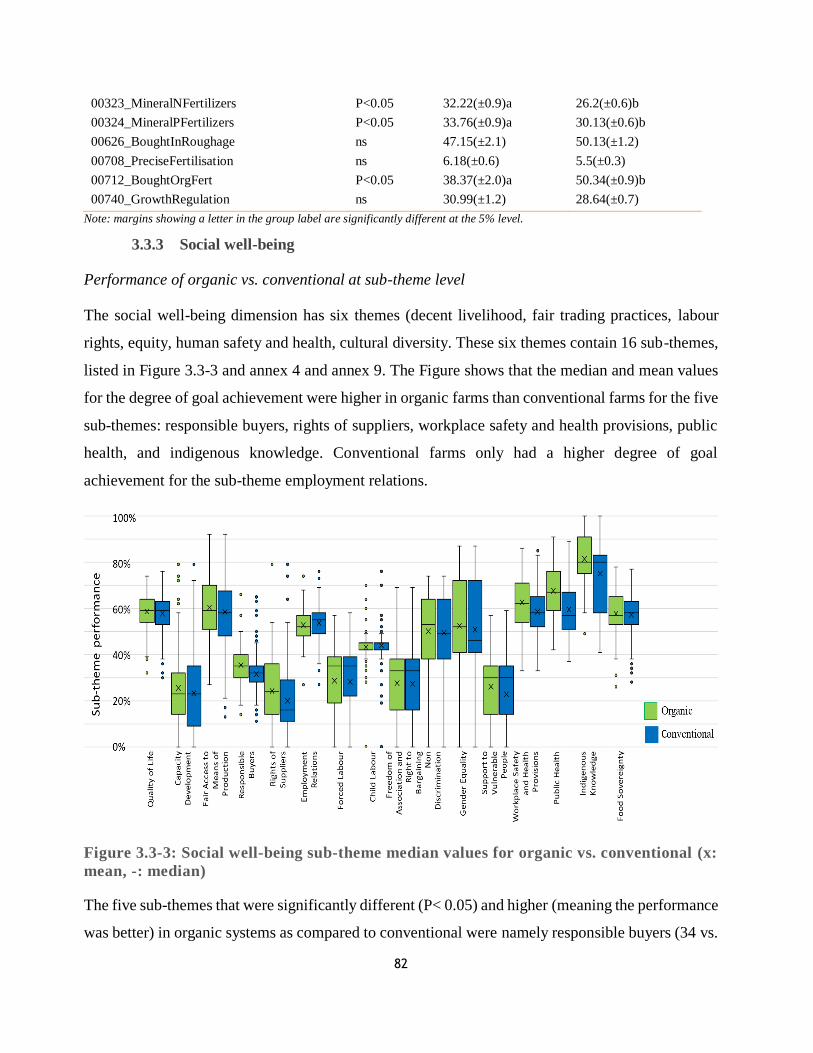
82
00323_MineralNFertilizers P<0.05 32.22(±0.9)a 26.2(±0.6)b
00324_MineralPFertilizers P<0.05 33.76(±0.9)a 30.13(±0.6)b
00626_BoughtInRoughage ns 47.15(±2.1) 50.13(±1.2)
00708_PreciseFertilisation ns 6.18(±0.6) 5.5(±0.3)
00712_BoughtOrgFert P<0.05 38.37(±2.0)a 50.34(±0.9)b
00740_GrowthRegulation ns 30.99(±1.2) 28.64(±0.7)
Note: margins showing a letter in the group label are significantly different at the 5% level.
3.3.3 Social well-being
Performance of organic vs. conventional at sub-theme level
The social well-being dimension has six themes (decent livelihood, fair trading practices, labour
rights, equity, human safety and health, cultural diversity. These six themes contain 16 sub-themes,
listed in Figure 3.3-3 and annex 4 and annex 9. The Figure shows that the median and mean values
for the degree of goal achievement were higher in organic farms than conventional farms for the five
sub-themes: responsible buyers, rights of suppliers, workplace safety and health provisions, public
health, and indigenous knowledge. Conventional farms only had a higher degree of goal
achievement for the sub-theme employment relations.
Figure 3.3-3: Social well-being sub-theme median values for organic vs. conventional (x:
mean, -: median)
The five sub-themes that were significantly different (P< 0.05) and higher (meaning the performance
was better) in organic systems as compared to conventional were namely responsible buyers (34 vs.
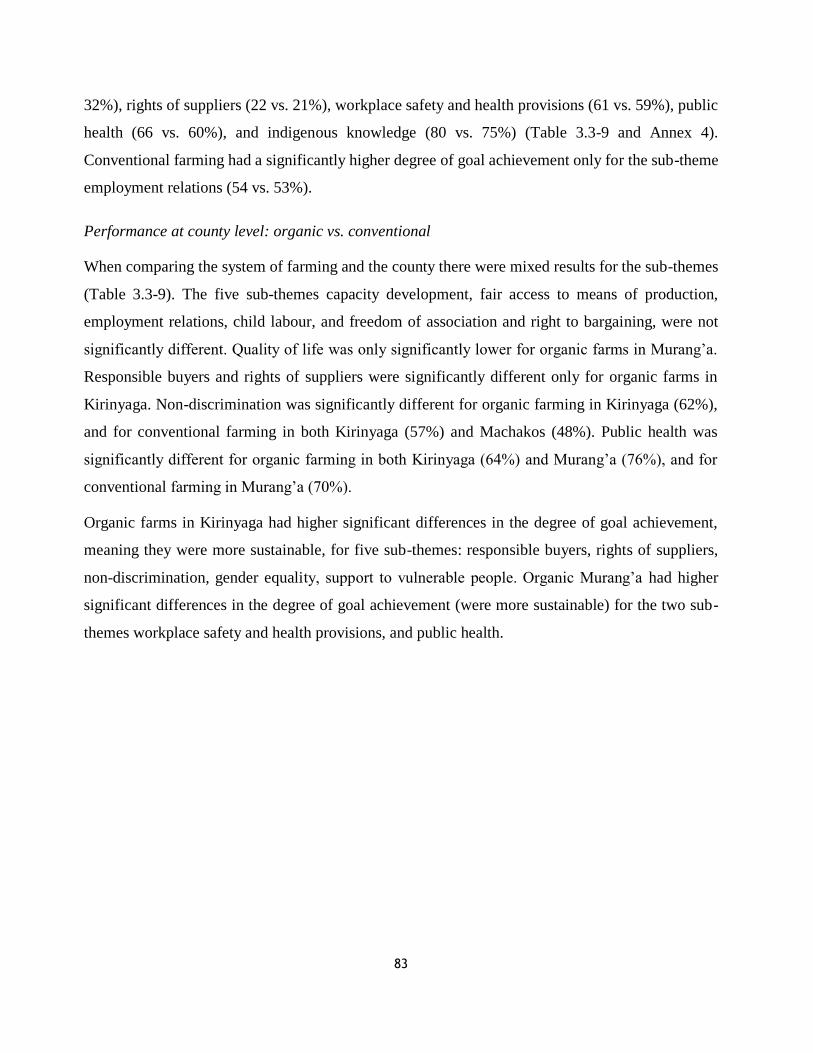
83
32%), rights of suppliers (22 vs. 21%), workplace safety and health provisions (61 vs. 59%), public
health (66 vs. 60%), and indigenous knowledge (80 vs. 75%) (Table 3.3-9 and Annex 4).
Conventional farming had a significantly higher degree of goal achievement only for the sub-theme
employment relations (54 vs. 53%).
Performance at county level: organic vs. conventional
When comparing the system of farming and the county there were mixed results for the sub-themes
(Table 3.3-9). The five sub-themes capacity development, fair access to means of production,
employment relations, child labour, and freedom of association and right to bargaining, were not
significantly different. Quality of life was only significantly lower for organic farms in Murang’a.
Responsible buyers and rights of suppliers were significantly different only for organic farms in
Kirinyaga. Non-discrimination was significantly different for organic farming in Kirinyaga (62%),
and for conventional farming in both Kirinyaga (57%) and Machakos (48%). Public health was
significantly different for organic farming in both Kirinyaga (64%) and Murang’a (76%), and for
conventional farming in Murang’a (70%).
Organic farms in Kirinyaga had higher significant differences in the degree of goal achievement,
meaning they were more sustainable, for five sub-themes: responsible buyers, rights of suppliers,
non-discrimination, gender equality, support to vulnerable people. Organic Murang’a had higher
significant differences in the degree of goal achievement (were more sustainable) for the two sub-
themes workplace safety and health provisions, and public health.
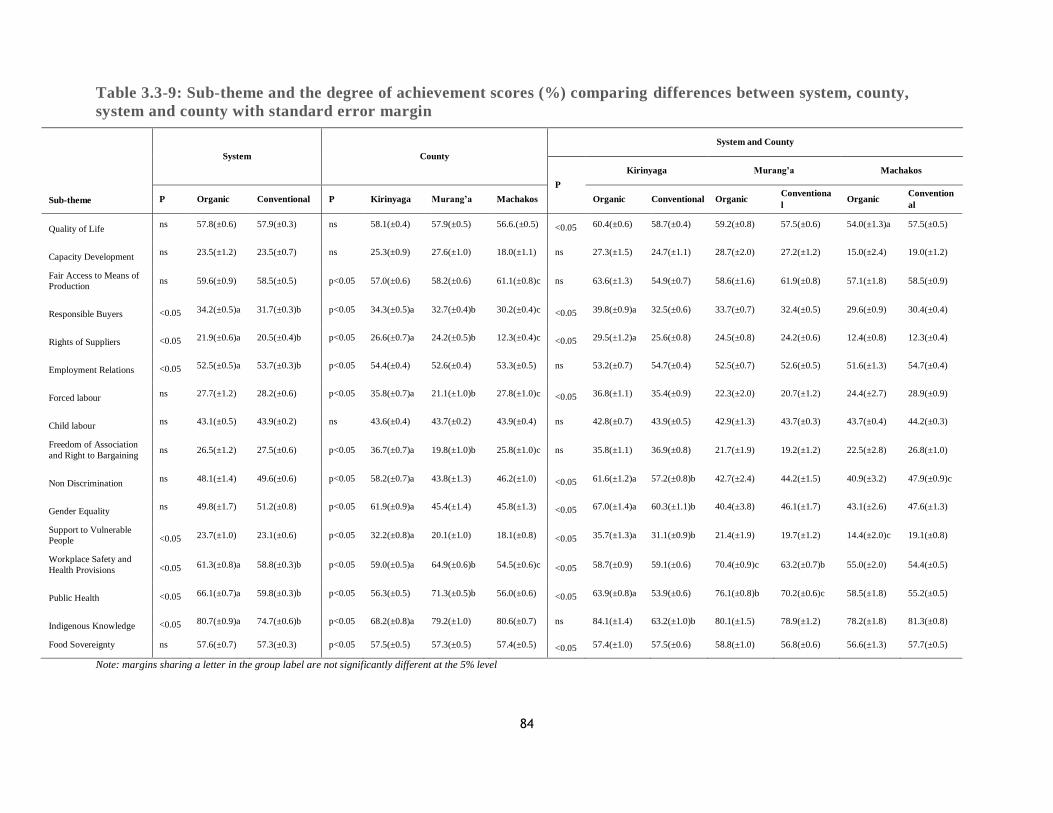
84
Table 3.3-9: Sub-theme and the degree of achievement scores (%) comparing differences between system, county,
system and county with standard error margin
Sub-theme
System County
System and County
P
Kirinyaga Murang’a Machakos
P Organic Conventional P Kirinyaga Murang’a Machakos Organic Conventional Organic Conventiona
l Organic
Convention
al
Quality of Life ns 57.8(±0.6) 57.9(±0.3) ns 58.1(±0.4) 57.9(±0.5) 56.6.(±0.5) <0.05 60.4(±0.6) 58.7(±0.4) 59.2(±0.8) 57.5(±0.6) 54.0(±1.3)a 57.5(±0.5)
Capacity Development ns 23.5(±1.2) 23.5(±0.7) ns 25.3(±0.9) 27.6(±1.0) 18.0(±1.1) ns 27.3(±1.5) 24.7(±1.1) 28.7(±2.0) 27.2(±1.2) 15.0(±2.4) 19.0(±1.2)
Fair Access to Means of
Production ns 59.6(±0.9) 58.5(±0.5) p<0.05 57.0(±0.6) 58.2(±0.6) 61.1(±0.8)c ns 63.6(±1.3) 54.9(±0.7) 58.6(±1.6) 61.9(±0.8) 57.1(±1.8) 58.5(±0.9)
Responsible Buyers <0.05 34.2(±0.5)a 31.7(±0.3)b p<0.05 34.3(±0.5)a 32.7(±0.4)b 30.2(±0.4)c <0.05 39.8(±0.9)a 32.5(±0.6) 33.7(±0.7) 32.4(±0.5) 29.6(±0.9) 30.4(±0.4)
Rights of Suppliers <0.05 21.9(±0.6)a 20.5(±0.4)b p<0.05 26.6(±0.7)a 24.2(±0.5)b 12.3(±0.4)c <0.05 29.5(±1.2)a 25.6(±0.8) 24.5(±0.8) 24.2(±0.6) 12.4(±0.8) 12.3(±0.4)
Employment Relations <0.05 52.5(±0.5)a 53.7(±0.3)b p<0.05 54.4(±0.4) 52.6(±0.4) 53.3(±0.5) ns 53.2(±0.7) 54.7(±0.4) 52.5(±0.7) 52.6(±0.5) 51.6(±1.3) 54.7(±0.4)
Forced labour ns 27.7(±1.2) 28.2(±0.6) p<0.05 35.8(±0.7)a 21.1(±1.0)b 27.8(±1.0)c <0.05 36.8(±1.1) 35.4(±0.9) 22.3(±2.0) 20.7(±1.2) 24.4(±2.7) 28.9(±0.9)
Child labour ns 43.1(±0.5) 43.9(±0.2) ns 43.6(±0.4) 43.7(±0.2) 43.9(±0.4) ns 42.8(±0.7) 43.9(±0.5) 42.9(±1.3) 43.7(±0.3) 43.7(±0.4) 44.2(±0.3)
Freedom of Association
and Right to Bargaining ns 26.5(±1.2) 27.5(±0.6) p<0.05 36.7(±0.7)a 19.8(±1.0)b 25.8(±1.0)c ns 35.8(±1.1) 36.9(±0.8) 21.7(±1.9) 19.2(±1.2) 22.5(±2.8) 26.8(±1.0)
Non Discrimination ns 48.1(±1.4) 49.6(±0.6) p<0.05 58.2(±0.7)a 43.8(±1.3) 46.2(±1.0) <0.05 61.6(±1.2)a 57.2(±0.8)b 42.7(±2.4) 44.2(±1.5) 40.9(±3.2) 47.9(±0.9)c
Gender Equality ns 49.8(±1.7) 51.2(±0.8) p<0.05 61.9(±0.9)a 45.4(±1.4) 45.8(±1.3) <0.05 67.0(±1.4)a 60.3(±1.1)b 40.4(±3.8) 46.1(±1.7) 43.1(±2.6) 47.6(±1.3)
Support to Vulnerable
People <0.05 23.7(±1.0) 23.1(±0.6) p<0.05 32.2(±0.8)a 20.1(±1.0) 18.1(±0.8) <0.05 35.7(±1.3)a 31.1(±0.9)b 21.4(±1.9) 19.7(±1.2) 14.4(±2.0)c 19.1(±0.8)
Workplace Safety and
Health Provisions <0.05 61.3(±0.8)a 58.8(±0.3)b p<0.05 59.0(±0.5)a 64.9(±0.6)b 54.5(±0.6)c <0.05 58.7(±0.9) 59.1(±0.6) 70.4(±0.9)c 63.2(±0.7)b 55.0(±2.0) 54.4(±0.5)
Public Health <0.05 66.1(±0.7)a 59.8(±0.3)b p<0.05 56.3(±0.5) 71.3(±0.5)b 56.0(±0.6) <0.05 63.9(±0.8)a 53.9(±0.6) 76.1(±0.8)b 70.2(±0.6)c 58.5(±1.8) 55.2(±0.5)
Indigenous Knowledge <0.05 80.7(±0.9)a 74.7(±0.6)b p<0.05 68.2(±0.8)a 79.2(±1.0) 80.6(±0.7) ns 84.1(±1.4) 63.2(±1.0)b 80.1(±1.5) 78.9(±1.2) 78.2(±1.8) 81.3(±0.8)
Food Sovereignty ns 57.6(±0.7) 57.3(±0.3) p<0.05 57.5(±0.5) 57.3(±0.5) 57.4(±0.5) <0.05 57.4(±1.0) 57.5(±0.6) 58.8(±1.0) 56.8(±0.6) 56.6(±1.3) 57.7(±0.5)
Note: margins sharing a letter in the group label are not significantly different at the 5% level
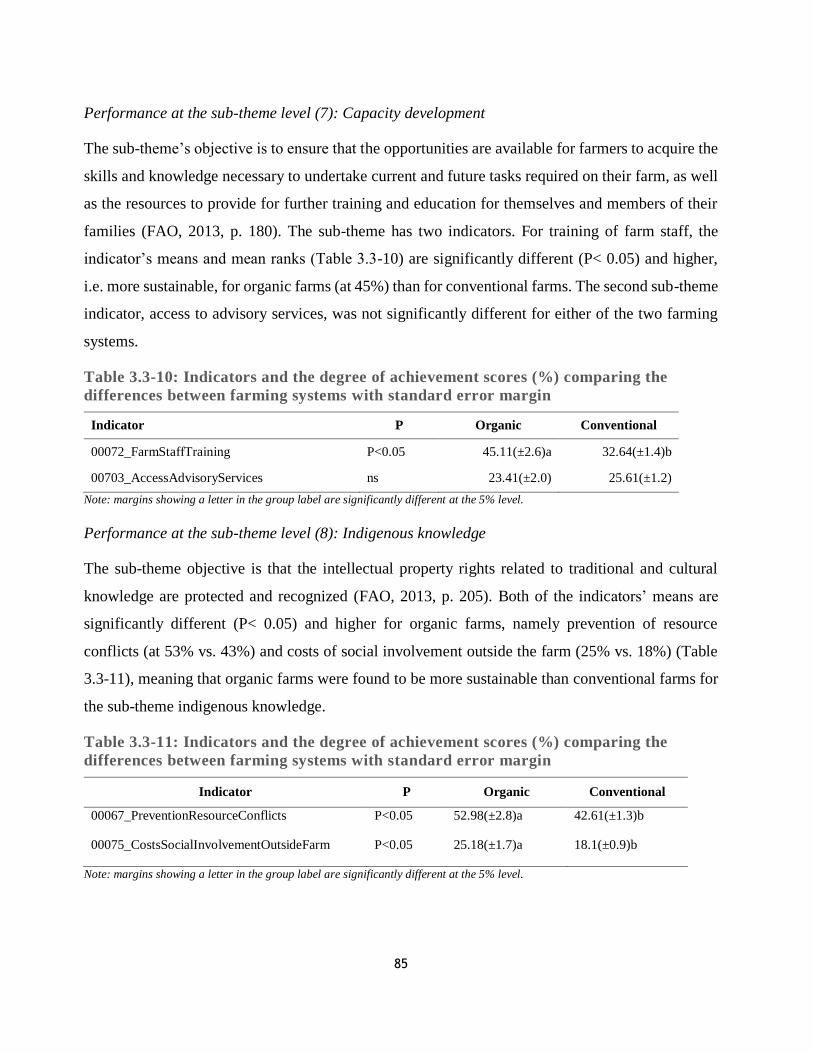
85
Performance at the sub-theme level (7): Capacity development
The sub-theme’s objective is to ensure that the opportunities are available for farmers to acquire the
skills and knowledge necessary to undertake current and future tasks required on their farm, as well
as the resources to provide for further training and education for themselves and members of their
families (FAO, 2013, p. 180). The sub-theme has two indicators. For training of farm staff, the
indicator’s means and mean ranks (Table 3.3-10) are significantly different (P< 0.05) and higher,
i.e. more sustainable, for organic farms (at 45%) than for conventional farms. The second sub-theme
indicator, access to advisory services, was not significantly different for either of the two farming
systems.
Table 3.3-10: Indicators and the degree of achievement scores (%) comparing the
differences between farming systems with standard error margin
Indicator P Organic Conventional
00072_FarmStaffTraining P<0.05 45.11(±2.6)a 32.64(±1.4)b
00703_AccessAdvisoryServices ns 23.41(±2.0) 25.61(±1.2)
Note: margins showing a letter in the group label are significantly different at the 5% level.
Performance at the sub-theme level (8): Indigenous knowledge
The sub-theme objective is that the intellectual property rights related to traditional and cultural
knowledge are protected and recognized (FAO, 2013, p. 205). Both of the indicators’ means are
significantly different (P< 0.05) and higher for organic farms, namely prevention of resource
conflicts (at 53% vs. 43%) and costs of social involvement outside the farm (25% vs. 18%) (Table
3.3-11), meaning that organic farms were found to be more sustainable than conventional farms for
the sub-theme indigenous knowledge.
Table 3.3-11: Indicators and the degree of achievement scores (%) comparing the
differences between farming systems with standard error margin
Indicator P Organic Conventional
00067_PreventionResourceConflicts P<0.05 52.98(±2.8)a 42.61(±1.3)b
00075_CostsSocialInvolvementOutsideFarm P<0.05 25.18(±1.7)a 18.1(±0.9)b
Note: margins showing a letter in the group label are significantly different at the 5% level.
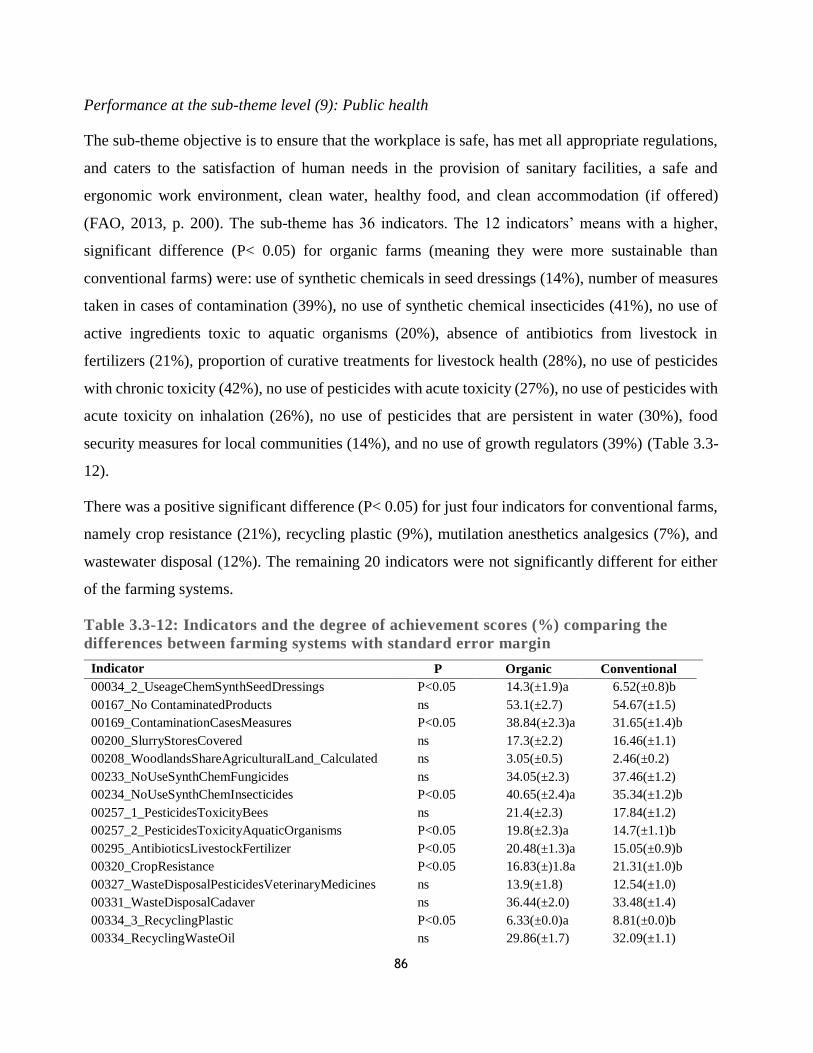
86
Performance at the sub-theme level (9): Public health
The sub-theme objective is to ensure that the workplace is safe, has met all appropriate regulations,
and caters to the satisfaction of human needs in the provision of sanitary facilities, a safe and
ergonomic work environment, clean water, healthy food, and clean accommodation (if offered)
(FAO, 2013, p. 200). The sub-theme has 36 indicators. The 12 indicators’ means with a higher,
significant difference (P< 0.05) for organic farms (meaning they were more sustainable than
conventional farms) were: use of synthetic chemicals in seed dressings (14%), number of measures
taken in cases of contamination (39%), no use of synthetic chemical insecticides (41%), no use of
active ingredients toxic to aquatic organisms (20%), absence of antibiotics from livestock in
fertilizers (21%), proportion of curative treatments for livestock health (28%), no use of pesticides
with chronic toxicity (42%), no use of pesticides with acute toxicity (27%), no use of pesticides with
acute toxicity on inhalation (26%), no use of pesticides that are persistent in water (30%), food
security measures for local communities (14%), and no use of growth regulators (39%) (Table 3.3-
12).
There was a positive significant difference (P< 0.05) for just four indicators for conventional farms,
namely crop resistance (21%), recycling plastic (9%), mutilation anesthetics analgesics (7%), and
wastewater disposal (12%). The remaining 20 indicators were not significantly different for either
of the farming systems.
Table 3.3-12: Indicators and the degree of achievement scores (%) comparing the
differences between farming systems with standard error margin
Indicator P Organic Conventional
00034_2_UseageChemSynthSeedDressings P<0.05 14.3(±1.9)a 6.52(±0.8)b
00167_No ContaminatedProducts ns 53.1(±2.7) 54.67(±1.5)
00169_ContaminationCasesMeasures P<0.05 38.84(±2.3)a 31.65(±1.4)b
00200_SlurryStoresCovered ns 17.3(±2.2) 16.46(±1.1)
00208_WoodlandsShareAgriculturalLand_Calculated ns 3.05(±0.5) 2.46(±0.2)
00233_NoUseSynthChemFungicides ns 34.05(±2.3) 37.46(±1.2)
00234_NoUseSynthChemInsecticides P<0.05 40.65(±2.4)a 35.34(±1.2)b
00257_1_PesticidesToxicityBees ns 21.4(±2.3) 17.84(±1.2)
00257_2_PesticidesToxicityAquaticOrganisms P<0.05 19.8(±2.3)a 14.7(±1.1)b
00295_AntibioticsLivestockFertilizer P<0.05 20.48(±1.3)a 15.05(±0.9)b
00320_CropResistance P<0.05 16.83(±)1.8a 21.31(±1.0)b
00327_WasteDisposalPesticidesVeterinaryMedicines ns 13.9(±1.8) 12.54(±1.0)
00331_WasteDisposalCadaver ns 36.44(±2.0) 33.48(±1.4)
00334_3_RecyclingPlastic P<0.05 6.33(±0.0)a 8.81(±0.0)b
00334_RecyclingWasteOil ns 29.86(±1.7) 32.09(±1.1)
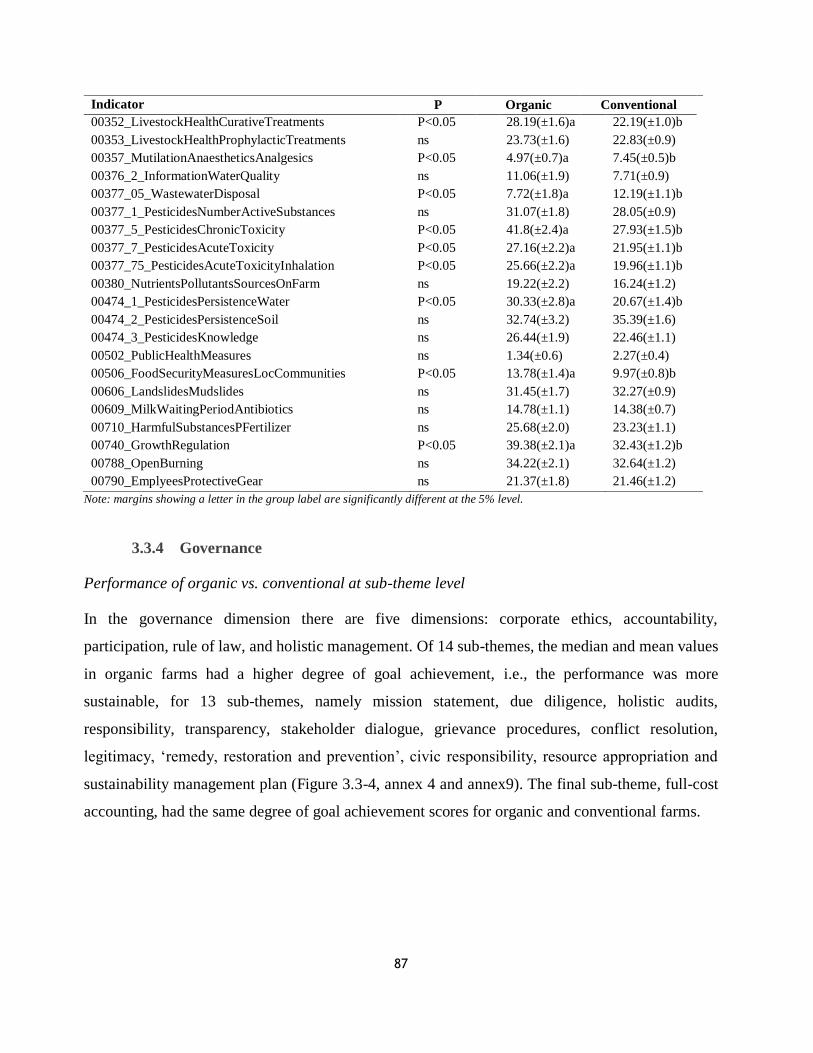
87
Indicator P Organic Conventional
00352_LivestockHealthCurativeTreatments P<0.05 28.19(±1.6)a 22.19(±1.0)b
00353_LivestockHealthProphylacticTreatments ns 23.73(±1.6) 22.83(±0.9)
00357_MutilationAnaestheticsAnalgesics P<0.05 4.97(±0.7)a 7.45(±0.5)b
00376_2_InformationWaterQuality ns 11.06(±1.9) 7.71(±0.9)
00377_05_WastewaterDisposal P<0.05 7.72(±1.8)a 12.19(±1.1)b
00377_1_PesticidesNumberActiveSubstances ns 31.07(±1.8) 28.05(±0.9)
00377_5_PesticidesChronicToxicity P<0.05 41.8(±2.4)a 27.93(±1.5)b
00377_7_PesticidesAcuteToxicity P<0.05 27.16(±2.2)a 21.95(±1.1)b
00377_75_PesticidesAcuteToxicityInhalation P<0.05 25.66(±2.2)a 19.96(±1.1)b
00380_NutrientsPollutantsSourcesOnFarm ns 19.22(±2.2) 16.24(±1.2)
00474_1_PesticidesPersistenceWater P<0.05 30.33(±2.8)a 20.67(±1.4)b
00474_2_PesticidesPersistenceSoil ns 32.74(±3.2) 35.39(±1.6)
00474_3_PesticidesKnowledge ns 26.44(±1.9) 22.46(±1.1)
00502_PublicHealthMeasures ns 1.34(±0.6) 2.27(±0.4)
00506_FoodSecurityMeasuresLocCommunities P<0.05 13.78(±1.4)a 9.97(±0.8)b
00606_LandslidesMudslides ns 31.45(±1.7) 32.27(±0.9)
00609_MilkWaitingPeriodAntibiotics ns 14.78(±1.1) 14.38(±0.7)
00710_HarmfulSubstancesPFertilizer ns 25.68(±2.0) 23.23(±1.1)
00740_GrowthRegulation P<0.05 39.38(±2.1)a 32.43(±1.2)b
00788_OpenBurning ns 34.22(±2.1) 32.64(±1.2)
00790_EmplyeesProtectiveGear ns 21.37(±1.8) 21.46(±1.2)
Note: margins showing a letter in the group label are significantly different at the 5% level.
3.3.4 Governance
Performance of organic vs. conventional at sub-theme level
In the governance dimension there are five dimensions: corporate ethics, accountability,
participation, rule of law, and holistic management. Of 14 sub-themes, the median and mean values
in organic farms had a higher degree of goal achievement, i.e., the performance was more
sustainable, for 13 sub-themes, namely mission statement, due diligence, holistic audits,
responsibility, transparency, stakeholder dialogue, grievance procedures, conflict resolution,
legitimacy, ‘remedy, restoration and prevention’, civic responsibility, resource appropriation and
sustainability management plan (Figure 3.3-4, annex 4 and annex9). The final sub-theme, full-cost
accounting, had the same degree of goal achievement scores for organic and conventional farms.
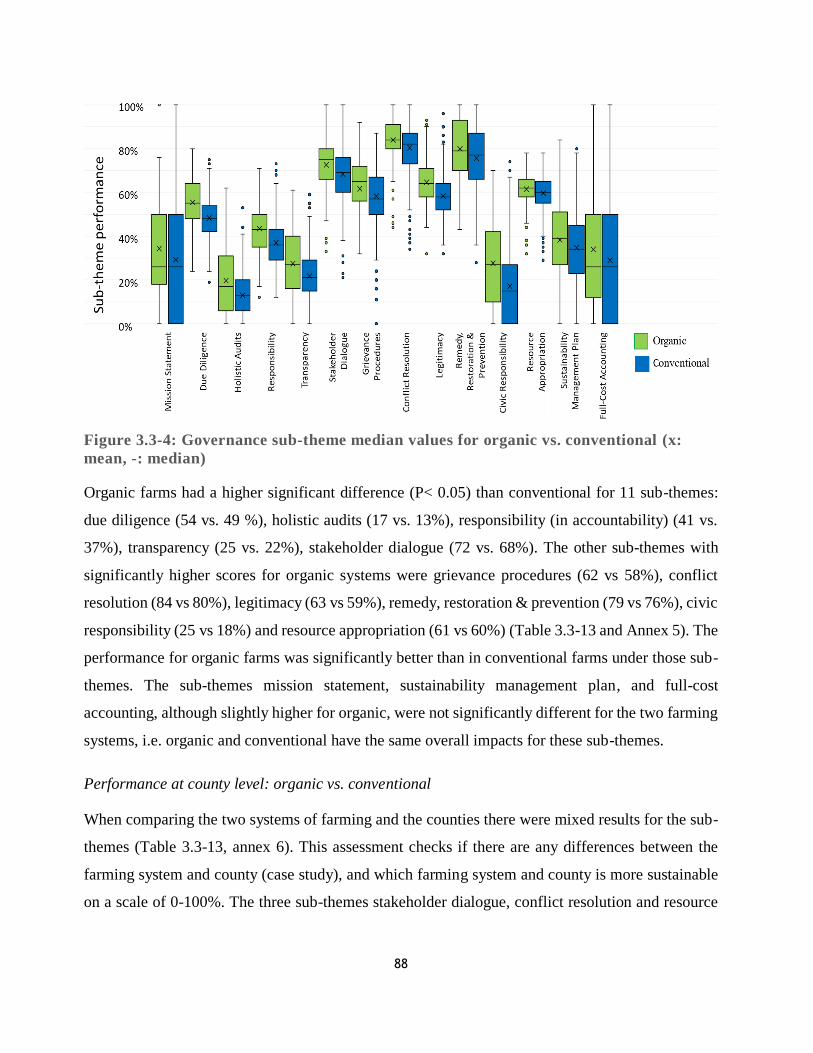
88
Figure 3.3-4: Governance sub-theme median values for organic vs. conventional (x:
mean, -: median)
Organic farms had a higher significant difference (P< 0.05) than conventional for 11 sub-themes:
due diligence (54 vs. 49 %), holistic audits (17 vs. 13%), responsibility (in accountability) (41 vs.
37%), transparency (25 vs. 22%), stakeholder dialogue (72 vs. 68%). The other sub-themes with
significantly higher scores for organic systems were grievance procedures (62 vs 58%), conflict
resolution (84 vs 80%), legitimacy (63 vs 59%), remedy, restoration & prevention (79 vs 76%), civic
responsibility (25 vs 18%) and resource appropriation (61 vs 60%) (Table 3.3-13 and Annex 5). The
performance for organic farms was significantly better than in conventional farms under those sub-
themes. The sub-themes mission statement, sustainability management plan, and full-cost
accounting, although slightly higher for organic, were not significantly different for the two farming
systems, i.e. organic and conventional have the same overall impacts for these sub-themes.
Performance at county level: organic vs. conventional
When comparing the two systems of farming and the counties there were mixed results for the sub-
themes (Table 3.3-13, annex 6). This assessment checks if there are any differences between the
farming system and county (case study), and which farming system and county is more sustainable
on a scale of 0-100%. The three sub-themes stakeholder dialogue, conflict resolution and resource
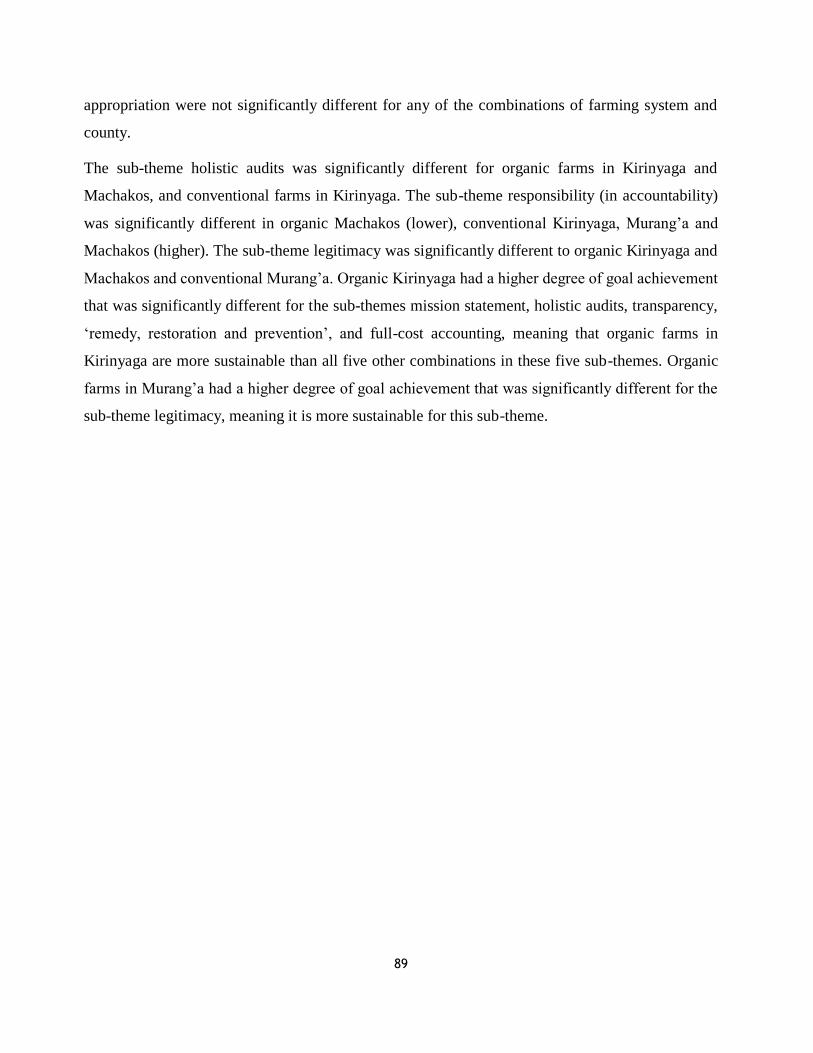
89
appropriation were not significantly different for any of the combinations of farming system and
county.
The sub-theme holistic audits was significantly different for organic farms in Kirinyaga and
Machakos, and conventional farms in Kirinyaga. The sub-theme responsibility (in accountability)
was significantly different in organic Machakos (lower), conventional Kirinyaga, Murang’a and
Machakos (higher). The sub-theme legitimacy was significantly different to organic Kirinyaga and
Machakos and conventional Murang’a. Organic Kirinyaga had a higher degree of goal achievement
that was significantly different for the sub-themes mission statement, holistic audits, transparency,
‘remedy, restoration and prevention’, and full-cost accounting, meaning that organic farms in
Kirinyaga are more sustainable than all five other combinations in these five sub-themes. Organic
farms in Murang’a had a higher degree of goal achievement that was significantly different for the
sub-theme legitimacy, meaning it is more sustainable for this sub-theme.
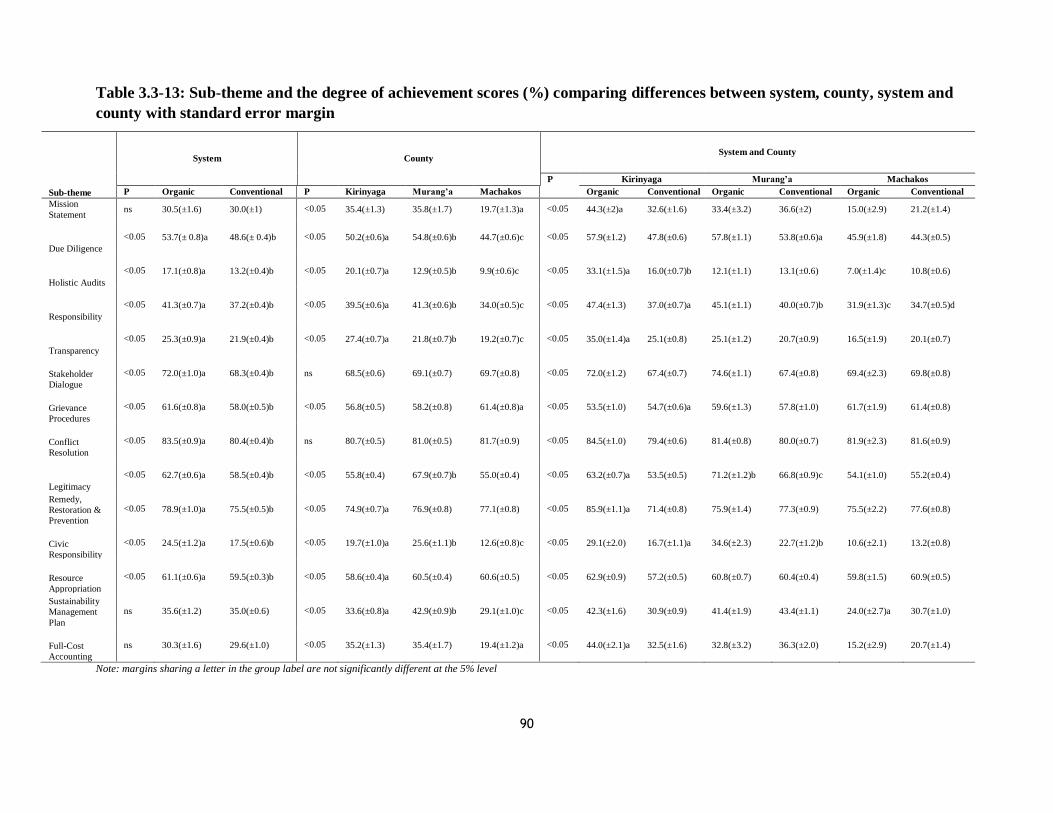
90
Table 3.3-13: Sub-theme and the degree of achievement scores (%) comparing differences between system, county, system and
county with standard error margin
Sub-theme
System County System and County
P Kirinyaga Murang’a Machakos
P Organic Conventional P Kirinyaga Murang’a Machakos Organic Conventional Organic Conventional Organic Conventional
Mission
Statement ns 30.5(±1.6) 30.0(±1) <0.05 35.4(±1.3) 35.8(±1.7) 19.7(±1.3)a <0.05 44.3(±2)a 32.6(±1.6) 33.4(±3.2) 36.6(±2) 15.0(±2.9) 21.2(±1.4)
Due Diligence
<0.05 53.7(± 0.8)a 48.6(± 0.4)b <0.05 50.2(±0.6)a 54.8(±0.6)b 44.7(±0.6)c <0.05 57.9(±1.2) 47.8(±0.6) 57.8(±1.1) 53.8(±0.6)a 45.9(±1.8) 44.3(±0.5)
Holistic Audits
<0.05 17.1(±0.8)a 13.2(±0.4)b <0.05 20.1(±0.7)a 12.9(±0.5)b 9.9(±0.6)c <0.05 33.1(±1.5)a 16.0(±0.7)b 12.1(±1.1) 13.1(±0.6) 7.0(±1.4)c 10.8(±0.6)
Responsibility
<0.05 41.3(±0.7)a 37.2(±0.4)b <0.05 39.5(±0.6)a 41.3(±0.6)b 34.0(±0.5)c <0.05 47.4(±1.3) 37.0(±0.7)a 45.1(±1.1) 40.0(±0.7)b 31.9(±1.3)c 34.7(±0.5)d
Transparency
<0.05 25.3(±0.9)a 21.9(±0.4)b <0.05 27.4(±0.7)a 21.8(±0.7)b 19.2(±0.7)c <0.05 35.0(±1.4)a 25.1(±0.8) 25.1(±1.2) 20.7(±0.9) 16.5(±1.9) 20.1(±0.7)
Stakeholder
Dialogue
<0.05 72.0(±1.0)a 68.3(±0.4)b ns 68.5(±0.6) 69.1(±0.7) 69.7(±0.8) <0.05 72.0(±1.2) 67.4(±0.7) 74.6(±1.1) 67.4(±0.8) 69.4(±2.3) 69.8(±0.8)
Grievance
Procedures
<0.05 61.6(±0.8)a 58.0(±0.5)b <0.05 56.8(±0.5) 58.2(±0.8) 61.4(±0.8)a <0.05 53.5(±1.0) 54.7(±0.6)a 59.6(±1.3) 57.8(±1.0) 61.7(±1.9) 61.4(±0.8)
Conflict
Resolution
<0.05 83.5(±0.9)a 80.4(±0.4)b ns 80.7(±0.5) 81.0(±0.5) 81.7(±0.9) <0.05 84.5(±1.0) 79.4(±0.6) 81.4(±0.8) 80.0(±0.7) 81.9(±2.3) 81.6(±0.9)
Legitimacy
<0.05 62.7(±0.6)a 58.5(±0.4)b <0.05 55.8(±0.4) 67.9(±0.7)b 55.0(±0.4) <0.05 63.2(±0.7)a 53.5(±0.5) 71.2(±1.2)b 66.8(±0.9)c 54.1(±1.0) 55.2(±0.4)
Remedy,
Restoration &
Prevention
<0.05 78.9(±1.0)a 75.5(±0.5)b <0.05 74.9(±0.7)a 76.9(±0.8) 77.1(±0.8) <0.05 85.9(±1.1)a 71.4(±0.8) 75.9(±1.4) 77.3(±0.9) 75.5(±2.2) 77.6(±0.8)
Civic
Responsibility
<0.05 24.5(±1.2)a 17.5(±0.6)b <0.05 19.7(±1.0)a 25.6(±1.1)b 12.6(±0.8)c <0.05 29.1(±2.0) 16.7(±1.1)a 34.6(±2.3) 22.7(±1.2)b 10.6(±2.1) 13.2(±0.8)
Resource
Appropriation
<0.05 61.1(±0.6)a 59.5(±0.3)b <0.05 58.6(±0.4)a 60.5(±0.4) 60.6(±0.5) <0.05 62.9(±0.9) 57.2(±0.5) 60.8(±0.7) 60.4(±0.4) 59.8(±1.5) 60.9(±0.5)
Sustainability
Management
Plan
ns 35.6(±1.2) 35.0(±0.6) <0.05 33.6(±0.8)a 42.9(±0.9)b 29.1(±1.0)c <0.05 42.3(±1.6) 30.9(±0.9) 41.4(±1.9) 43.4(±1.1) 24.0(±2.7)a 30.7(±1.0)
Full-Cost
Accounting
ns 30.3(±1.6) 29.6(±1.0) <0.05 35.2(±1.3) 35.4(±1.7) 19.4(±1.2)a <0.05 44.0(±2.1)a 32.5(±1.6) 32.8(±3.2) 36.3(±2.0) 15.2(±2.9) 20.7(±1.4)
Note: margins sharing a letter in the group label are not significantly different at the 5% level
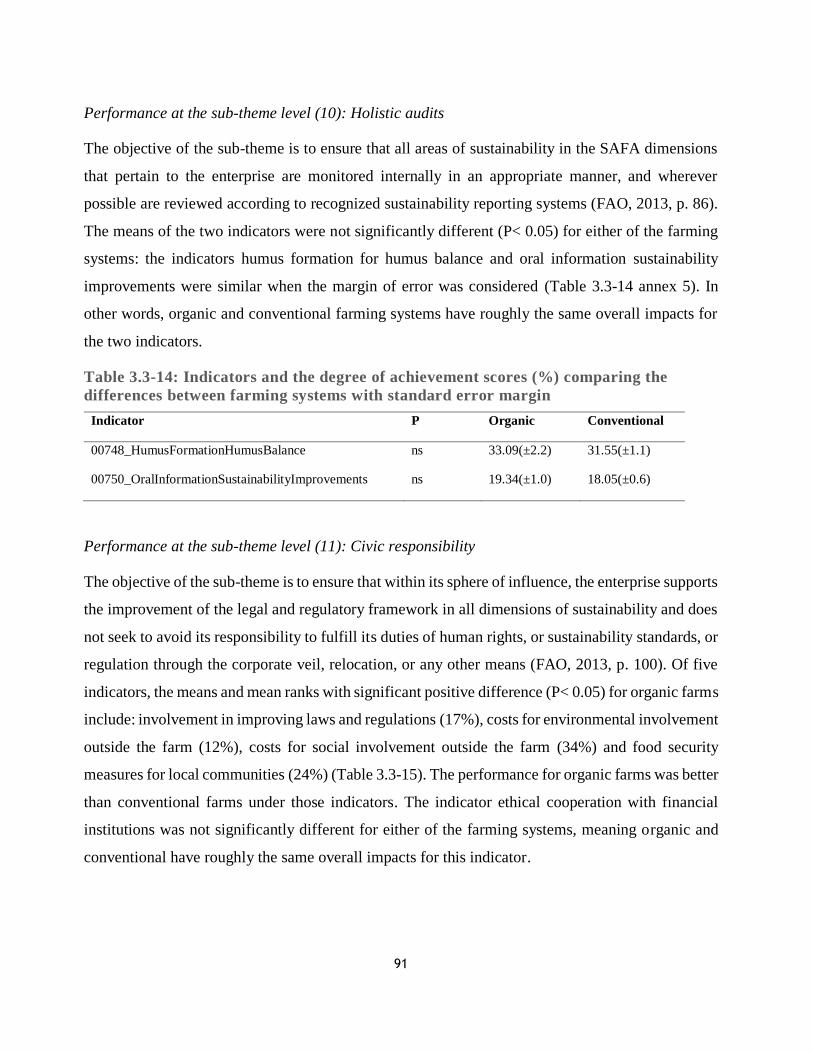
91
Performance at the sub-theme level (10): Holistic audits
The objective of the sub-theme is to ensure that all areas of sustainability in the SAFA dimensions
that pertain to the enterprise are monitored internally in an appropriate manner, and wherever
possible are reviewed according to recognized sustainability reporting systems (FAO, 2013, p. 86).
The means of the two indicators were not significantly different (P< 0.05) for either of the farming
systems: the indicators humus formation for humus balance and oral information sustainability
improvements were similar when the margin of error was considered (Table 3.3-14 annex 5). In
other words, organic and conventional farming systems have roughly the same overall impacts for
the two indicators.
Table 3.3-14: Indicators and the degree of achievement scores (%) comparing the
differences between farming systems with standard error margin
Indicator P Organic Conventional
00748_HumusFormationHumusBalance ns 33.09(±2.2) 31.55(±1.1)
00750_OralInformationSustainabilityImprovements ns 19.34(±1.0) 18.05(±0.6)
Performance at the sub-theme level (11): Civic responsibility
The objective of the sub-theme is to ensure that within its sphere of influence, the enterprise supports
the improvement of the legal and regulatory framework in all dimensions of sustainability and does
not seek to avoid its responsibility to fulfill its duties of human rights, or sustainability standards, or
regulation through the corporate veil, relocation, or any other means (FAO, 2013, p. 100). Of five
indicators, the means and mean ranks with significant positive difference (P< 0.05) for organic farms
include: involvement in improving laws and regulations (17%), costs for environmental involvement
outside the farm (12%), costs for social involvement outside the farm (34%) and food security
measures for local communities (24%) (Table 3.3-15). The performance for organic farms was better
than conventional farms under those indicators. The indicator ethical cooperation with financial
institutions was not significantly different for either of the farming systems, meaning organic and
conventional have roughly the same overall impacts for this indicator.
92
Table 3.3-15: Indicators and the degree of achievement scores (%) comparing the
differences between farming systems with standard error margin
Indicator P Organic Conventional
00057_InvolvementImprovingLawsRegulations P<0.05 16.84(±2.0)a 9.44(±1.0)b
00070_CooperationEthicalFinancialInstitutions ns 16.15(±1.7) 18.59(±0.9)
00074_CostsEnvironmentalInvolvementOutsideFarm P<0.05 11.59(±1.4)a 6.37(±0.7)b
00075_CostsSocialInvolvementOutsideFarm P<0.05 34.07(±2.3)a 24.14(±1.2)b
00506_FoodSecurityMeasuresLocCommunities P<0.05 24.33(±1.9)a 17.54(±1.1)b
Note: margins showing a letter in the group label are significantly different at the 5% level.
Performance at the sub-theme level (12): Sustainability management plan
The objective of the sub-theme is to ensure that a sustainability plan for the enterprise is developed
which provides a holistic view of sustainability and considers synergies and trade-offs between
dimensions, including each of the environmental, economic, social and governance dimensions
(FAO, 2013, p. 105). Of the six indicators, just one indicator’s mean score had a significant
difference (P< 0.05) for organic farms: market challenges (31%), meaning the performance of
organic farms was better than for conventional farms under the market challenges indicator (Table
3.3-16). Conventional farms had a better performance score in “guaranteed farm succession for
staff” indicator (38%), with a 10%-point difference to organic farms (at 28%). The other indicators
were not significantly different for either of the farming systems, meaning organic and conventional
farms have roughly the same overall impacts for the other indicators.
Table 3.3-16: Indicators and the degree of achievement scores (%) comparing the
differences between farming systems with standard error margin
Indicator P Organic Conventional
00008_VerbalCommitmentSustainability ns 17.58(±1.4) 17.6(±0.8)
00100_MarketChallenges P<0.05 30.85(±1.8)a 26.11(±1.0)b
00124_GuaranteedStaffReplacemetFarmSuccession P<0.05 28.19(±1.7)a 37.93(±0.8)b
00134_KnowledgeClimateChangeProblems ns 36.33(±1.5) 36.68(±0.8)
00136_ClimateChangeAdaptationMeasures ns 31.72(±2.5) 33.28(±1.3)
00750_OralInformationSustainabilityImprovements ns 20.39(±1.1) 18.91(±0.7)
Note: margins showing a letter in the group label are significantly different at the 5% level.
3.4 Discussion
Performance of organic and conventional farming systems at the sub-theme level
When comparing the sustainability scores of organic and conventional farms at the sub-theme level,
the results indicate that organic farms perform better than conventional farms (Annex 5, 6, 7). Within
93
the “Environmental Integrity” dimension, the organic interventions had a significantly higher degree
of goal achievement scores for 10 of the 14 sub-themes (the sub-themes that were not significantly
different are water withdrawal, land degradation, animal freedom from stress, and animal health).
These results suggest that certain organic farm practices (soil quality, crop rotation, animal and plant
diversity, water quality, and material and energy use) are more sustainable than conventional ones.
The positive impacts in the environmental integrity dimension are due to changes in the farm
management practices, i.e. improvements in soils fertility, mulching and crop rotation (Kamau et
al., 2018; Schader et al., 2016). Organic farming standards include the application of good farming
practices, use of manure, mulching, and inter-cropping that emphasize improvement in the
environment, namely soil health and fertility, and preventive pest and disease management (Kannan
et al., 2005).
Within the “Economic Resilience” dimension, 10 of the 14 sub-themes had a significantly higher
degree of goal achievement scores in organic interventions as compared to conventional ones. The
other four sub-themes – profitability, stability of production, value creation, and local procurement
– were not significantly different. The degree of achievement scores for the sub-themes in the “Social
Well-being” dimension revealed that 5 of the 16 sub-themes – responsible buyers, rights of suppliers,
workplace safety and health provisions, public health, and indigenous knowledge – had a
significantly higher degree of goal achievement scores in organic than conventional farms. The
subtheme employment relations scored significantly higher for conventional systems than organic
interventions, whereas the other sub-themes were not significantly different. In the “Governance”
dimension, 11 of the 14 sub-themes had a significantly higher degree of goal achievement scores in
organic farms than in conventional ones. The remaining three sub-themes – mission statement,
sustainability management plan, and full cost accounting – were not significantly different.
The results for the environmental integrity, economic resilience, and governance sub-themes suggest
that organic farms' performance was better than conventional farms, indicating that some organic
practices improve sustainability, e.g. food safety, public health, indigenous knowledge, and civic
responsibility had a 6-8% point difference over conventional farms. Though small in their overall
coverage, organic initiatives have substantial impacts in the communities or niche areas. Other
studies have also shown that organic farms perform better in environmental integrity and economic
resilience than conventional ones (Coteur et al., 2016; Marchand et al., 2014; Smith et al., 2019;
Ssebunya et al., 2018).
94
Performance of organic and conventional farming systems at the county level
In the environmental integrity dimension, the performance at the county level (Annex 6) showed
mixed results when comparing the farming systems. Of the organic systems with sub-themes that
were significantly different at the county level, meaning more sustainable than conventional farms,
Murang’a had five sub-themes (greenhouse gases, water quality, ecosystems, species diversity, and
genetic diversity) and Kirinyaga had three sub-themes (genetic diversity, material use, and waste
reduction and disposal). In Machakos, none were significantly different. Of the conventional systems
with sub-themes that were significantly different at the county level, Kirinyaga had four sub-themes
(air quality, ecosystems, species diversity and genetic diversity), Murang’a had three (greenhouse
gases, air quality and water quality) and Machakos had two (species diversity and animal freedom
from stress). This means that the conventional farming systems were more sustainable than organic
ones for these sub-themes in those counties.
In the economic resilience dimension, the performance at the county level were in favor of organic
farms. Of the organic farms where sub-themes were significantly different at the county level,
Kirinyaga had six sub-themes (internal investment, long-range investment, profitability, the stability
of the market, risk management, and product information), Murang’a had three sub-themes (risk
management, food safety, and product information) and Machakos had three sub-themes
(community investment, profitability, and stability of market). For these sub-themes in those
counties, organic farming was more sustainable than conventional farming. Conventional systems
where sub-themes were significantly different, meaning more sustainable, included: Kirinyaga with
one sub-theme (long-range investments), Murang’a with four sub-themes (community investment,
the stability of the market, risk management, and food quality), and Machakos with one sub-theme
(profitability).
The results of the performance at the county level were mixed in the social well-being dimension.
Organic interventions were more sustainable than conventional farming, i.e. sub-themes were
significantly different, in Kirinyaga for six sub-themes (responsible buyers, rights of suppliers, non-
discrimination, gender equity, support to vulnerable people and public health), in Murang’a for two
sub-themes (workplace safety and health provisions, and public health), and in Machakos for two
sub-themes (quality of life and support to vulnerable people). Conventional systems were more
sustainable than organic farms for the following sub-themes: four in Kirinyaga (non-discrimination,
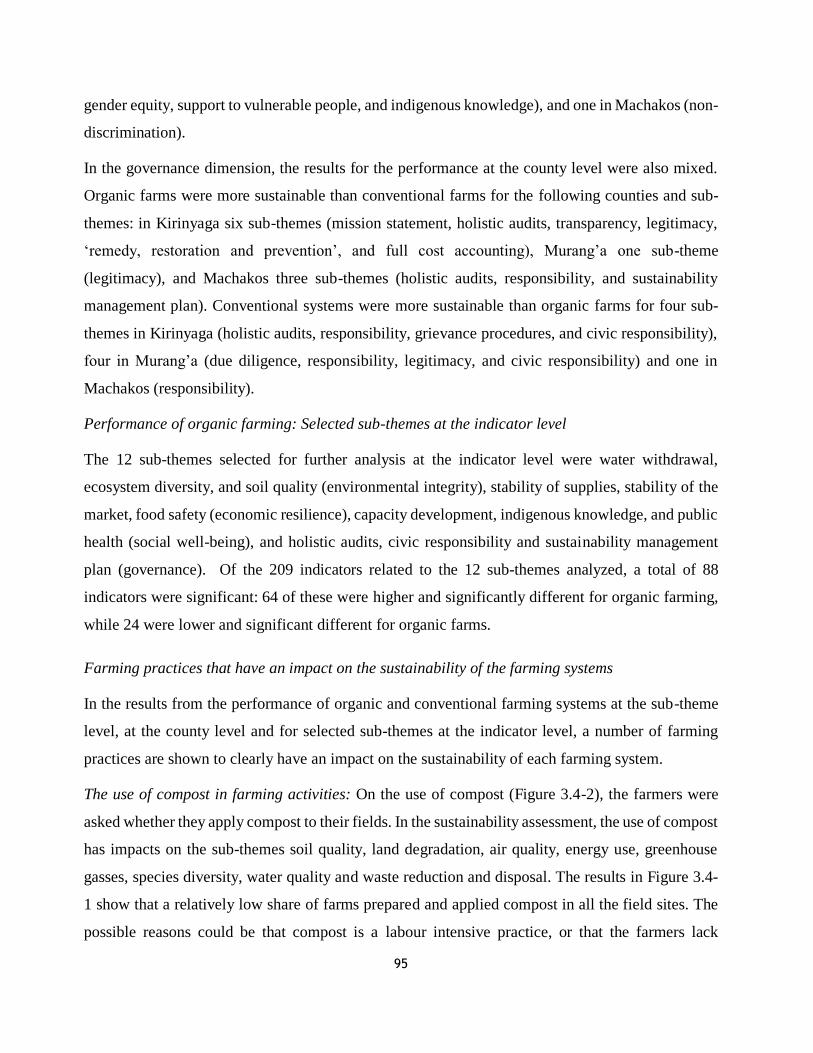
95
gender equity, support to vulnerable people, and indigenous knowledge), and one in Machakos (non-
discrimination).
In the governance dimension, the results for the performance at the county level were also mixed.
Organic farms were more sustainable than conventional farms for the following counties and sub-
themes: in Kirinyaga six sub-themes (mission statement, holistic audits, transparency, legitimacy,
‘remedy, restoration and prevention’, and full cost accounting), Murang’a one sub-theme
(legitimacy), and Machakos three sub-themes (holistic audits, responsibility, and sustainability
management plan). Conventional systems were more sustainable than organic farms for four sub-
themes in Kirinyaga (holistic audits, responsibility, grievance procedures, and civic responsibility),
four in Murang’a (due diligence, responsibility, legitimacy, and civic responsibility) and one in
Machakos (responsibility).
Performance of organic farming: Selected sub-themes at the indicator level
The 12 sub-themes selected for further analysis at the indicator level were water withdrawal,
ecosystem diversity, and soil quality (environmental integrity), stability of supplies, stability of the
market, food safety (economic resilience), capacity development, indigenous knowledge, and public
health (social well-being), and holistic audits, civic responsibility and sustainability management
plan (governance). Of the 209 indicators related to the 12 sub-themes analyzed, a total of 88
indicators were significant: 64 of these were higher and significantly different for organic farming,
while 24 were lower and significant different for organic farms.
Farming practices that have an impact on the sustainability of the farming systems
In the results from the performance of organic and conventional farming systems at the sub-theme
level, at the county level and for selected sub-themes at the indicator level, a number of farming
practices are shown to clearly have an impact on the sustainability of each farming system.
The use of compost in farming activities: On the use of compost (Figure 3.4-2), the farmers were
asked whether they apply compost to their fields. In the sustainability assessment, the use of compost
has impacts on the sub-themes soil quality, land degradation, air quality, energy use, greenhouse
gasses, species diversity, water quality and waste reduction and disposal. The results in Figure 3.4-
1 show that a relatively low share of farms prepared and applied compost in all the field sites. The
possible reasons could be that compost is a labour intensive practice, or that the farmers lack
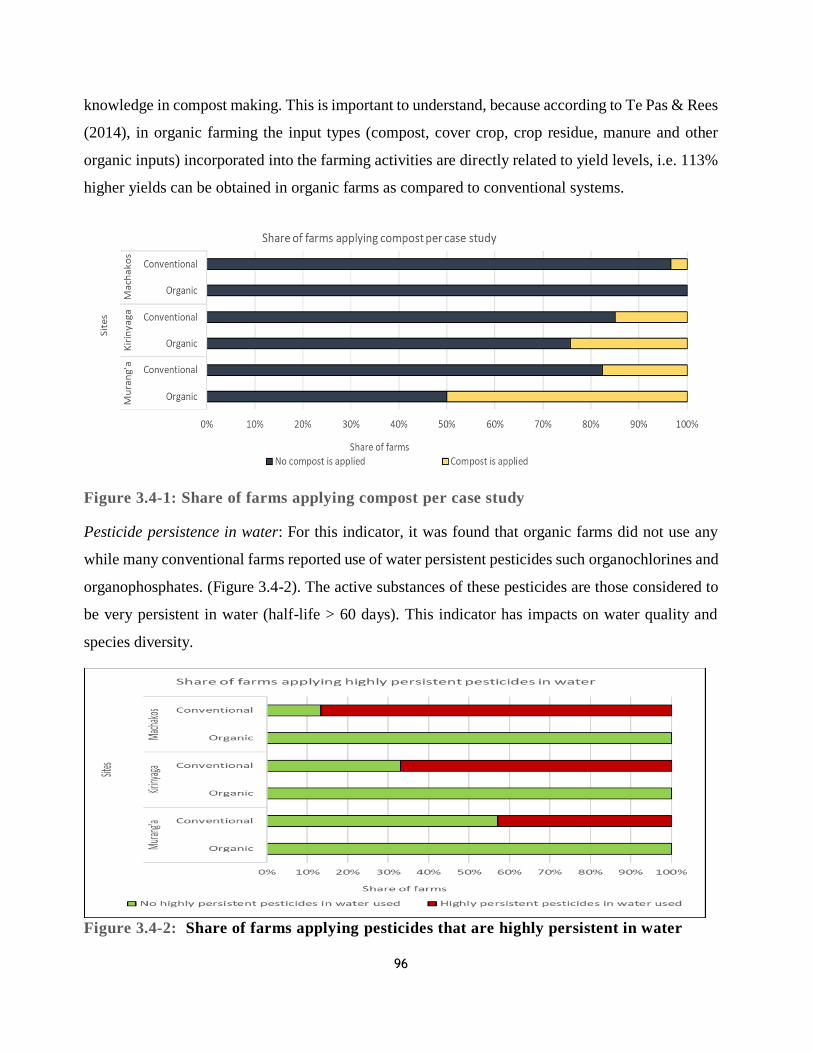
96
knowledge in compost making. This is important to understand, because according to Te Pas & Rees
(2014), in organic farming the input types (compost, cover crop, crop residue, manure and other
organic inputs) incorporated into the farming activities are directly related to yield levels, i.e. 113%
higher yields can be obtained in organic farms as compared to conventional systems.
Figure 3.4-1: Share of farms applying compost per case study
Pesticide persistence in water: For this indicator, it was found that organic farms did not use any
while many conventional farms reported use of water persistent pesticides such organochlorines and
organophosphates. (Figure 3.4-2). The active substances of these pesticides are those considered to
be very persistent in water (half-life > 60 days). This indicator has impacts on water quality and
species diversity.
Figure 3.4-2: Share of farms applying pesticides that are highly persistent in water
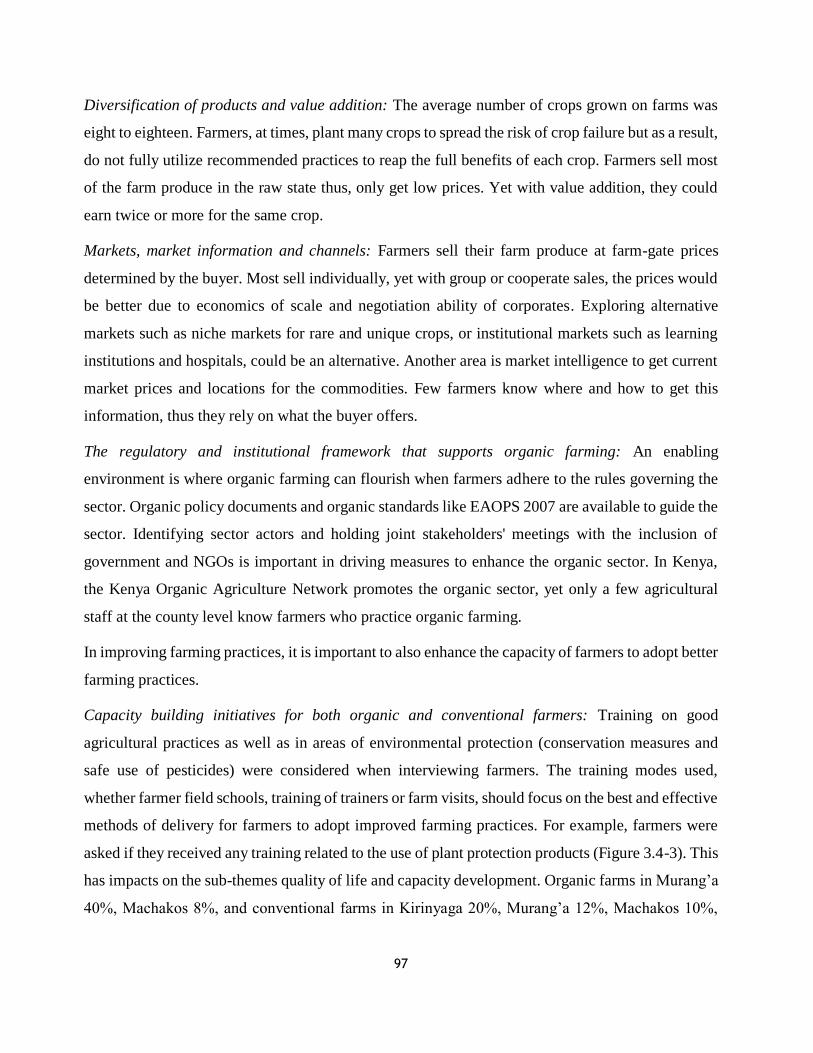
97
Diversification of products and value addition: The average number of crops grown on farms was
eight to eighteen. Farmers, at times, plant many crops to spread the risk of crop failure but as a result,
do not fully utilize recommended practices to reap the full benefits of each crop. Farmers sell most
of the farm produce in the raw state thus, only get low prices. Yet with value addition, they could
earn twice or more for the same crop.
Markets, market information and channels: Farmers sell their farm produce at farm-gate prices
determined by the buyer. Most sell individually, yet with group or cooperate sales, the prices would
be better due to economics of scale and negotiation ability of corporates. Exploring alternative
markets such as niche markets for rare and unique crops, or institutional markets such as learning
institutions and hospitals, could be an alternative. Another area is market intelligence to get current
market prices and locations for the commodities. Few farmers know where and how to get this
information, thus they rely on what the buyer offers.
The regulatory and institutional framework that supports organic farming: An enabling
environment is where organic farming can flourish when farmers adhere to the rules governing the
sector. Organic policy documents and organic standards like EAOPS 2007 are available to guide the
sector. Identifying sector actors and holding joint stakeholders' meetings with the inclusion of
government and NGOs is important in driving measures to enhance the organic sector. In Kenya,
the Kenya Organic Agriculture Network promotes the organic sector, yet only a few agricultural
staff at the county level know farmers who practice organic farming.
In improving farming practices, it is important to also enhance the capacity of farmers to adopt better
farming practices.
Capacity building initiatives for both organic and conventional farmers: Training on good
agricultural practices as well as in areas of environmental protection (conservation measures and
safe use of pesticides) were considered when interviewing farmers. The training modes used,
whether farmer field schools, training of trainers or farm visits, should focus on the best and effective
methods of delivery for farmers to adopt improved farming practices. For example, farmers were
asked if they received any training related to the use of plant protection products (Figure 3.4-3). This
has impacts on the sub-themes quality of life and capacity development. Organic farms in Murang’a
40%, Machakos 8%, and conventional farms in Kirinyaga 20%, Murang’a 12%, Machakos 10%,
98
had received some training on the use of plant protection products. In Kirinyaga the organic farmers
reported that they had not received any training on plant protection.
Figure 3.4-3: Training in the use of plant protection products
3.5 Conclusions
The analysis in this chapter assessed the sustainability performance of organic and conventional
farming systems in Murang’a, Kirinyaga, and Machakos counties in Kenya. The results show that
organic interventions had positive and significant sustainability performance in environmental
integrity, economic resilience, and governance. In the social well-being dimension, the sub-themes
with significantly higher scores for organic farms were responsible buyers, rights of suppliers,
workplace safety and health provisions, public health, and indigenous knowledge while for
conventional farming systems, the sub-theme employment relations was significantly higher than
for organic interventions.
There were similar scores between organic and conventional farms for many of the sub-themes
across all four dimensions: mission statement, sustainability management plan, full cost accounting,
water withdrawal, animal health, freedom from stress, profitability, the stability of production, value
creation, local procurement, quality of life, capacity development, forced labour, child labour, non-
discrimination, gender equity, support to vulnerable people and food sovereignty.
The performance at the county level showed that overall, farms in Kirinyaga were more sustainable,
followed by Murang’a and Machakos. The higher sustainability performance for Kirinyaga County
was expected as there was a certification system in existence and some farms were organically
99
certified. One recommendation is that other counties should seek ways of getting farms organically
certified to enjoy the benefits that this brings.
When compare farming system and county at the indicator level the results show that there are
agronomic differences that are responsible for the difference in performance. Some are very specific
to organic and some seem to be random or due to one of the specific interventions used by the
farmers.
Despite its encouraging findings, this study also identified some sustainability challenges among the
smallholder farms that require to be addressed. These low scores (either for indicators or sub-themes)
can be addressed through improving farming practices such as knowing the correct fertilizer
requirements, and for plant protection products, correct input use, use of recommended dosage, and
observance of pre-harvest intervals to ensure safe and nutritious foods produced in both farming
systems.
Capacity building of farmers requires that a program for regular training and extension support for
farmers be implemented, which can also take into account the continued improvement and
maintenance of the set of evolving organic standards. The existence of a traceability system and
better prices (premiums) further encourages organic practices in Kirinyaga County. Despite the
constraints and potential for improvement of the SMART-Farm Tool approach, it gives a prompt
way to bench-mark farms across farm types and regions at the dimensions, themes, and sub-themes
levels. As a sustainability assessment tool, it offers support to decision-makers, policy, and
development experts.
This study recommends the strengthening of the capacity of farmers to implement sustainability
measures and decisions that help to improve the future status of their farms based on the identified
sustainability gaps. The Kenya government should provide support for the development of
smallholder organic initiatives across the country, and address technical and policy-related
bottlenecks and the need for multi-stakeholder engagement in organic agriculture development.
100
4. Chapter : Farmer's perceptions and suggestions of intervention
measures to address sustainability gaps in Kenya
4.1 Introduction
Farmers manage and control many aspects of their farms. At the same time, other factors such as the
weather, market changes, and laws are outside their control (Compagnone et al., 2018). Farmers are
faced with an array of abiotic constraints, including limited access to inputs and high input costs, a
lack of output market linkages, financial credit, and information and technology, and low farm-gate
prices (Ochola et al., 2013). Climate change has led to less stable and predictable weather patterns
requiring farmers to adopt coping strategies in farming (Ndukhu et al., 2016). Farmers also face an
increasing number of national and regional regulations of their activities that may be helpful or
restricting (Spaling et al., 2011).
In sub-Saharan Africa (SSA), utilization of agricultural technology and participation in new
programs remains low (Mwangi & Kariuki, 2015). The low adoption of technology by farmers partly
explains the lagging agricultural productivity growth in SSA (Morris et al., 2007). Studies show that
a majority of farmers do not adopt the required best practices for increased food security and higher
incomes (Jha et al., 2020; Morris et al., 2007; Tittonell et al., 2010; Tittonell, 2014). Farmers'
decisions to adopt new agricultural technologies or practices depend on a complex array of factors.
Studies show that the best predictors of adoption practices were farmers' perception of the practices
(Ochola et al., 2013; Obayelu et al., 2017; Tatlidil et al., 2009).
If farmers are to adopt sustainable agricultural practices, they first need to understand that the
methods are essential and beneficial (Creemers et al., 2019). The uptake of new rules that offer better
incomes and target innovations call for resources efficiency, economic viability and environmental
sustainability (Creemers et al., 2019). According to Creemers et al, (2019) existing supply chain
arrangement have lower policy intentions and unbalanced power leading to increased competitive
pressures on primary producers. New type of relationships are thus required between producers and
buyers which have potential to regulate markets and less reliant on the management of markets. One
of the objectives in sustainability assessment is to detect opportunities to improve sustainability
(Jouzi et al., 2017). The sustainability assessment identifies superior strategies and technologies
form a sustainable point of view. Empirical applications are still needed not only to get the quantities
101
but also to identify the paths for improvement (Vogel et al., 2019). Therefore, it is important to find
out what farmers’ perception are in regard to sustainable agricultural practices (Coteur et al., 2018;
Jha et al., 2020; Obayelu et al., 2017).
Evaluation of farmer perceptions on specific farm management practices, and in particular the socio-
economic characteristics that influence these perceptions, are critical in developing and introducing
extension programs that promote sustainability among farmers and rural populations (Tatlidil et al.,
2009). In light of the limited adoption of practices that are proven to increase yield, change agents
promoting 'best practices' in agricultural practices should seek ways of understanding what drives
the farming community's behavior and decision-making processes (Isaac et al., 2009). It is
recognized that farmers have valuable knowledge about their farming activities and that they do their
own agricultural 'research', and that agronomists, ecologists, and development scientists would
benefit from close collaboration with them (Jha et al., 2020; Krueger & Casey, 2015).
Farmers' adoption of technologies and practice is based on farmers' knowledge or willingness to
seek information or specific services they require in farming, since they must believe that the
technologies or practices are important if they are to adopt them (Creemers et al., 2019).The
sustainability assessment farm-reports thus provide such information and the actions farmers must
take to improve in the areas or sections found to be under-performing. Not to put off the farmers,
the farm reports were designed to 'indirectly' suggest corrective actions. Based on the outcomes of
the sustainability assessment (Chapter 3), the objective of the research presented in this chapter was
to identify the sustainability gaps and the measures that farmers are likely to adopt to address those
gaps. The other objective was to determine the potential challenges, strategies, and responsibilities
for the implementation of the defined intervention measures in each of the three counties.
4.2 Literature review
Studies examining organic farming have looked at the perception of farmers either in relation to the
comparison of ecological and non-organic farming, or the adoption of agricultural technologies and
practices in the two systems. Khoy et al. (2017) examined farmers’ perceptions regarding the
opportunities and challenges in organic rice production in Cambodia. They categorized farmers into
three groups: pool sample, organic and conventional farmers. In the pooled sample farmers believed
that price premiums, health and environmental benefits, and market opportunities provided the
greatest benefits. They found that for organic farmers, intensive labour, lack of organic fertilizer,
102
and pest/disease problems were the key issues of concern. Conventional farmers believed that market
instability, lack of organic fertilizer, and labour -intensive production were the main obstacles (Khoy
et al. 2017). Agidew and Singh's (2019) study on understanding farmer perceptions focused on the
effectiveness of sustainable land management in Ethiopia. The study found that constraints related
to land management practices (lack of incentives, poverty, and lack of awareness about the long-
term benefits of such practices) hindered the adoption of new technologies (Agidew & Singh, 2019).
Patidar and Patidar (2015), in their study of the perceptions of farmers towards organic farming in
India, found that the gap between knowledge or perception and practice can be bridged by a better
understanding of the system and policy regulations that provide an enabling environment to farmers
(i.e. credit facilities, capacity building of change agents). Kings and Ilbery (2012) used a behavioral
approach to explore the perceptions and attitudes of farmers, loosely labeled as 'organic' and
'conventional', towards environmental aspects of agricultural sustainability. The behavioral
approach recognizes farmers as independent environmental managers who often make decisions
about the management of resources on their farms independently from the state and other actors
outside of their farms (Kings & Ilbery, 2012).
Other studies have evaluated farmers’ knowledge and awareness of particular farming practices. In
doing so, such studies have identified factors as broad as education level, gender, economic status,
knowledge of natural resources, and feeling of social responsibility as important indicators of
motivation to learn new farming practices (Muzari & Muvhunzi, 2012). Ustriyana and Dewi (2017),
in their analysis of perceptions of chili farmers on sustainable development, established that farmers'
education level had a direct relationship with their perception of sustainable agriculture. Oyedele et
al. (2018) studied the benefits, perceptions, and constraints of organic farming in Nigeria looking at,
for four different communities, gender, age, education level, household size, and crops grown. The
study found that if farmers were encouraged and motivated through adequate training in production
techniques (e.g. use of organic manure) they were likely to adopt organic farming practices (Oyedele
et al., 2018). Soire et al. (2016) determined farmers' perceptions on the dissemination of agricultural
technologies through a farmer’s group approach, finding it was effective by 96.4% and sustainable
by 66.7% when continued support in farmer skills development, community participation, utilization
of innovative farming technologies and farm inputs was provided. According to a study by Nautiyal
(2011), which promoted both improved livelihoods and the conservation and management of natural
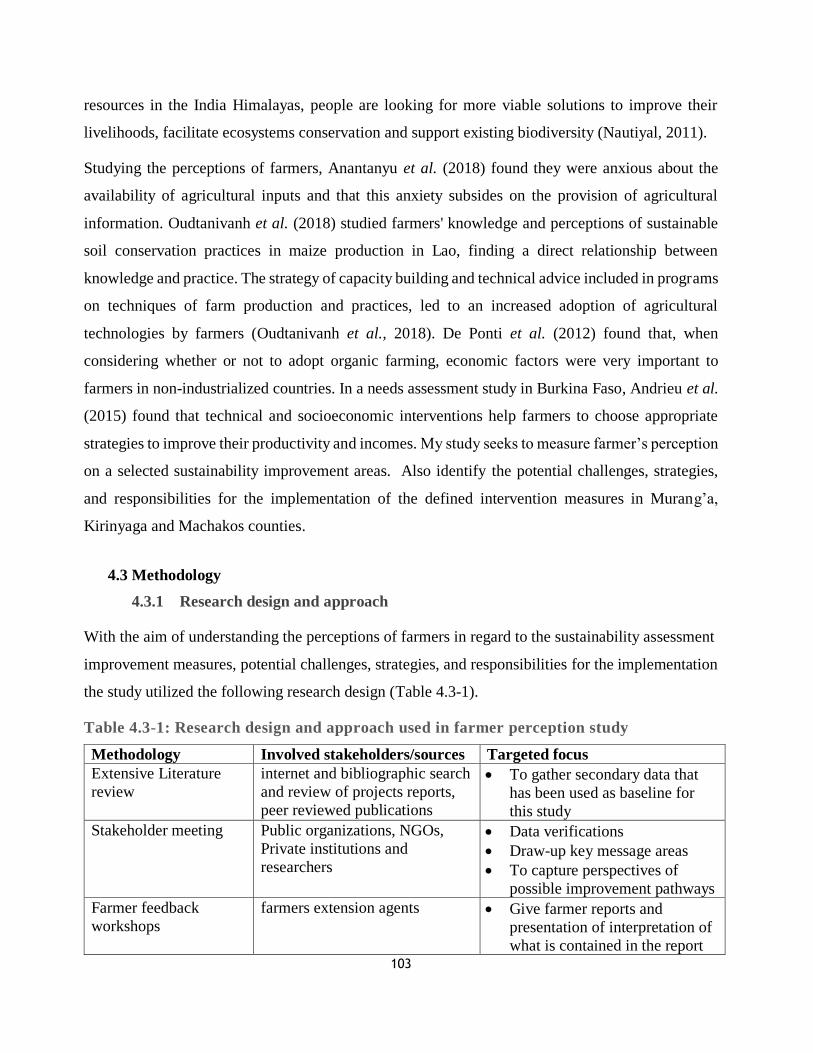
103
resources in the India Himalayas, people are looking for more viable solutions to improve their
livelihoods, facilitate ecosystems conservation and support existing biodiversity (Nautiyal, 2011).
Studying the perceptions of farmers, Anantanyu et al. (2018) found they were anxious about the
availability of agricultural inputs and that this anxiety subsides on the provision of agricultural
information. Oudtanivanh et al. (2018) studied farmers' knowledge and perceptions of sustainable
soil conservation practices in maize production in Lao, finding a direct relationship between
knowledge and practice. The strategy of capacity building and technical advice included in programs
on techniques of farm production and practices, led to an increased adoption of agricultural
technologies by farmers (Oudtanivanh et al., 2018). De Ponti et al. (2012) found that, when
considering whether or not to adopt organic farming, economic factors were very important to
farmers in non-industrialized countries. In a needs assessment study in Burkina Faso, Andrieu et al.
(2015) found that technical and socioeconomic interventions help farmers to choose appropriate
strategies to improve their productivity and incomes. My study seeks to measure farmer’s perception
on a selected sustainability improvement areas. Also identify the potential challenges, strategies,
and responsibilities for the implementation of the defined intervention measures in Murang’a,
Kirinyaga and Machakos counties.
4.3 Methodology
4.3.1 Research design and approach
With the aim of understanding the perceptions of farmers in regard to the sustainability assessment
improvement measures, potential challenges, strategies, and responsibilities for the implementation
the study utilized the following research design (Table 4.3-1).
Table 4.3-1: Research design and approach used in farmer perception study
Methodology Involved stakeholders/sources Targeted focus
Extensive Literature
review
internet and bibliographic search
and review of projects reports,
peer reviewed publications
To gather secondary data that
has been used as baseline for
this study
Stakeholder meeting Public organizations, NGOs,
Private institutions and
researchers
Data verifications
Draw-up key message areas
To capture perspectives of
possible improvement pathways
Farmer feedback
workshops
farmers extension agents Give farmer reports and
presentation of interpretation of
what is contained in the report
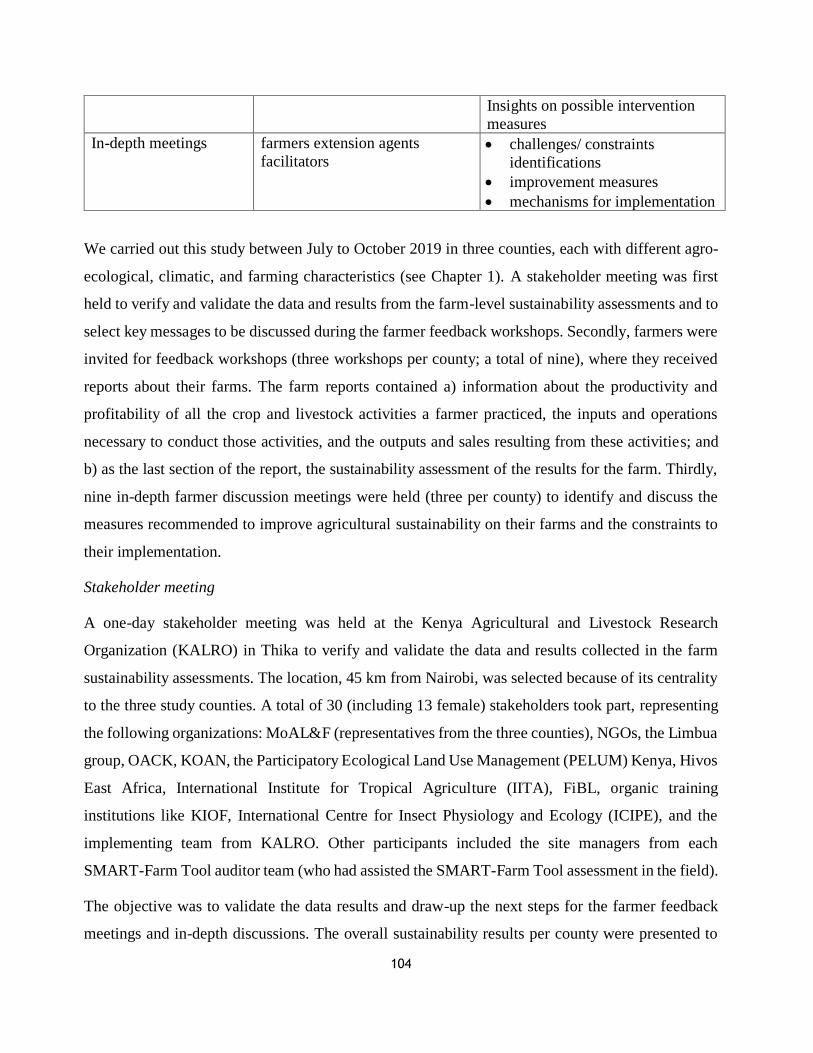
104
Insights on possible intervention
measures
In-depth meetings farmers extension agents
facilitators challenges/ constraints
identifications
improvement measures
mechanisms for implementation
We carried out this study between July to October 2019 in three counties, each with different agro-
ecological, climatic, and farming characteristics (see Chapter 1). A stakeholder meeting was first
held to verify and validate the data and results from the farm-level sustainability assessments and to
select key messages to be discussed during the farmer feedback workshops. Secondly, farmers were
invited for feedback workshops (three workshops per county; a total of nine), where they received
reports about their farms. The farm reports contained a) information about the productivity and
profitability of all the crop and livestock activities a farmer practiced, the inputs and operations
necessary to conduct those activities, and the outputs and sales resulting from these activities; and
b) as the last section of the report, the sustainability assessment of the results for the farm. Thirdly,
nine in-depth farmer discussion meetings were held (three per county) to identify and discuss the
measures recommended to improve agricultural sustainability on their farms and the constraints to
their implementation.
Stakeholder meeting
A one-day stakeholder meeting was held at the Kenya Agricultural and Livestock Research
Organization (KALRO) in Thika to verify and validate the data and results collected in the farm
sustainability assessments. The location, 45 km from Nairobi, was selected because of its centrality
to the three study counties. A total of 30 (including 13 female) stakeholders took part, representing
the following organizations: MoAL&F (representatives from the three counties), NGOs, the Limbua
group, OACK, KOAN, the Participatory Ecological Land Use Management (PELUM) Kenya, Hivos
East Africa, International Institute for Tropical Agriculture (IITA), FiBL, organic training
institutions like KIOF, International Centre for Insect Physiology and Ecology (ICIPE), and the
implementing team from KALRO. Other participants included the site managers from each
SMART-Farm Tool auditor team (who had assisted the SMART-Farm Tool assessment in the field).
The objective was to validate the data results and draw-up the next steps for the farmer feedback
meetings and in-depth discussions. The overall sustainability results per county were presented to
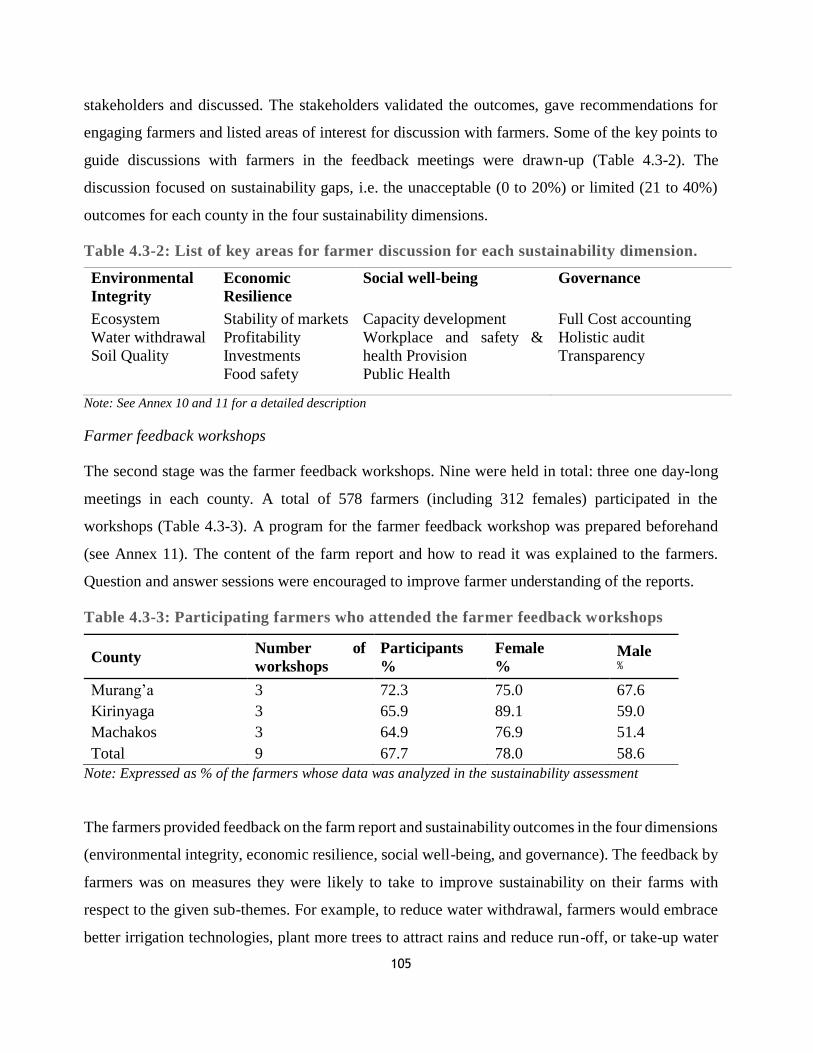
105
stakeholders and discussed. The stakeholders validated the outcomes, gave recommendations for
engaging farmers and listed areas of interest for discussion with farmers. Some of the key points to
guide discussions with farmers in the feedback meetings were drawn-up (Table 4.3-2). The
discussion focused on sustainability gaps, i.e. the unacceptable (0 to 20%) or limited (21 to 40%)
outcomes for each county in the four sustainability dimensions.
Table 4.3-2: List of key areas for farmer discussion for each sustainability dimension.
Environmental
Integrity
Economic
Resilience
Social well-being Governance
Ecosystem
Water withdrawal
Soil Quality
Stability of markets
Profitability
Investments
Food safety
Capacity development
Workplace and safety &
health Provision
Public Health
Full Cost accounting
Holistic audit
Transparency
Note: See Annex 10 and 11 for a detailed description
Farmer feedback workshops
The second stage was the farmer feedback workshops. Nine were held in total: three one day-long
meetings in each county. A total of 578 farmers (including 312 females) participated in the
workshops (Table 4.3-3). A program for the farmer feedback workshop was prepared beforehand
(see Annex 11). The content of the farm report and how to read it was explained to the farmers.
Question and answer sessions were encouraged to improve farmer understanding of the reports.
Table 4.3-3: Participating farmers who attended the farmer feedback workshops
County Number of
workshops
Participants
%
Female
% Male
%
Murang’a 3 72.3 75.0 67.6
Kirinyaga 3 65.9 89.1 59.0
Machakos 3 64.9 76.9 51.4
Total 9 67.7 78.0 58.6
Note: Expressed as % of the farmers whose data was analyzed in the sustainability assessment
The farmers provided feedback on the farm report and sustainability outcomes in the four dimensions
(environmental integrity, economic resilience, social well-being, and governance). The feedback by
farmers was on measures they were likely to take to improve sustainability on their farms with
respect to the given sub-themes. For example, to reduce water withdrawal, farmers would embrace
better irrigation technologies, plant more trees to attract rains and reduce run-off, or take-up water
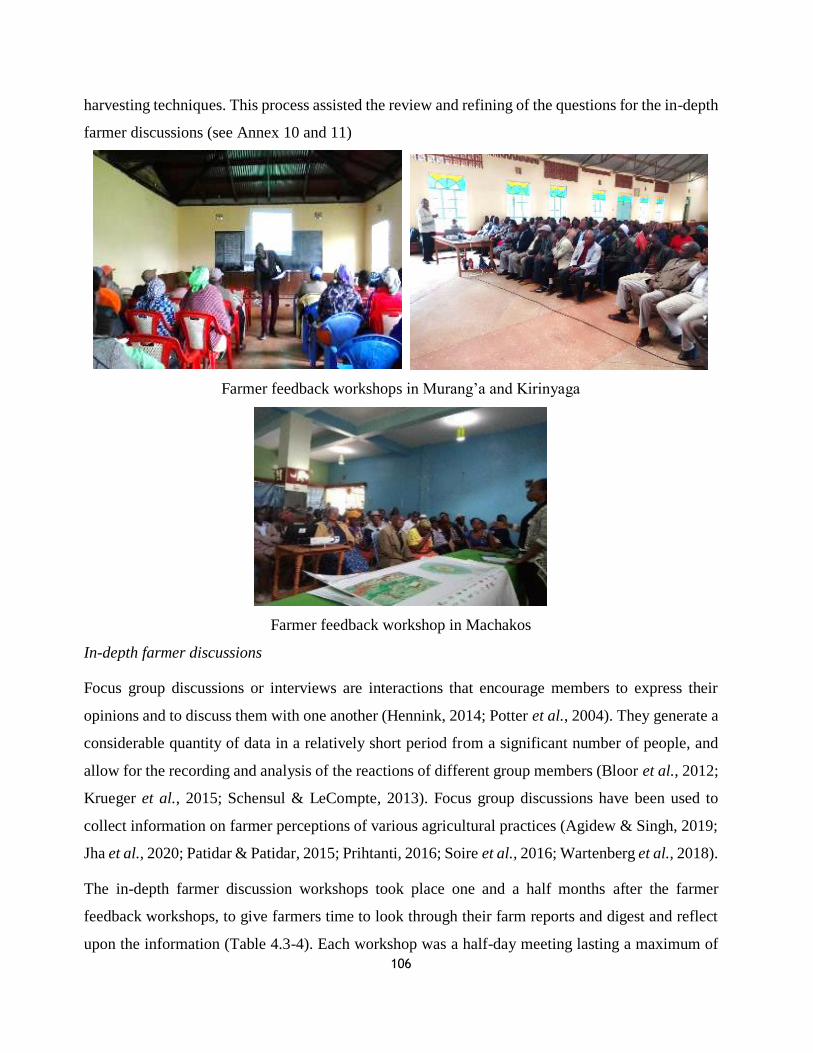
106
harvesting techniques. This process assisted the review and refining of the questions for the in-depth
farmer discussions (see Annex 10 and 11)
Farmer feedback workshops in Murang’a and Kirinyaga
Farmer feedback workshop in Machakos
In-depth farmer discussions
Focus group discussions or interviews are interactions that encourage members to express their
opinions and to discuss them with one another (Hennink, 2014; Potter et al., 2004). They generate a
considerable quantity of data in a relatively short period from a significant number of people, and
allow for the recording and analysis of the reactions of different group members (Bloor et al., 2012;
Krueger et al., 2015; Schensul & LeCompte, 2013). Focus group discussions have been used to
collect information on farmer perceptions of various agricultural practices (Agidew & Singh, 2019;
Jha et al., 2020; Patidar & Patidar, 2015; Prihtanti, 2016; Soire et al., 2016; Wartenberg et al., 2018).
The in-depth farmer discussion workshops took place one and a half months after the farmer
feedback workshops, to give farmers time to look through their farm reports and digest and reflect
upon the information (Table 4.3-4). Each workshop was a half-day meeting lasting a maximum of
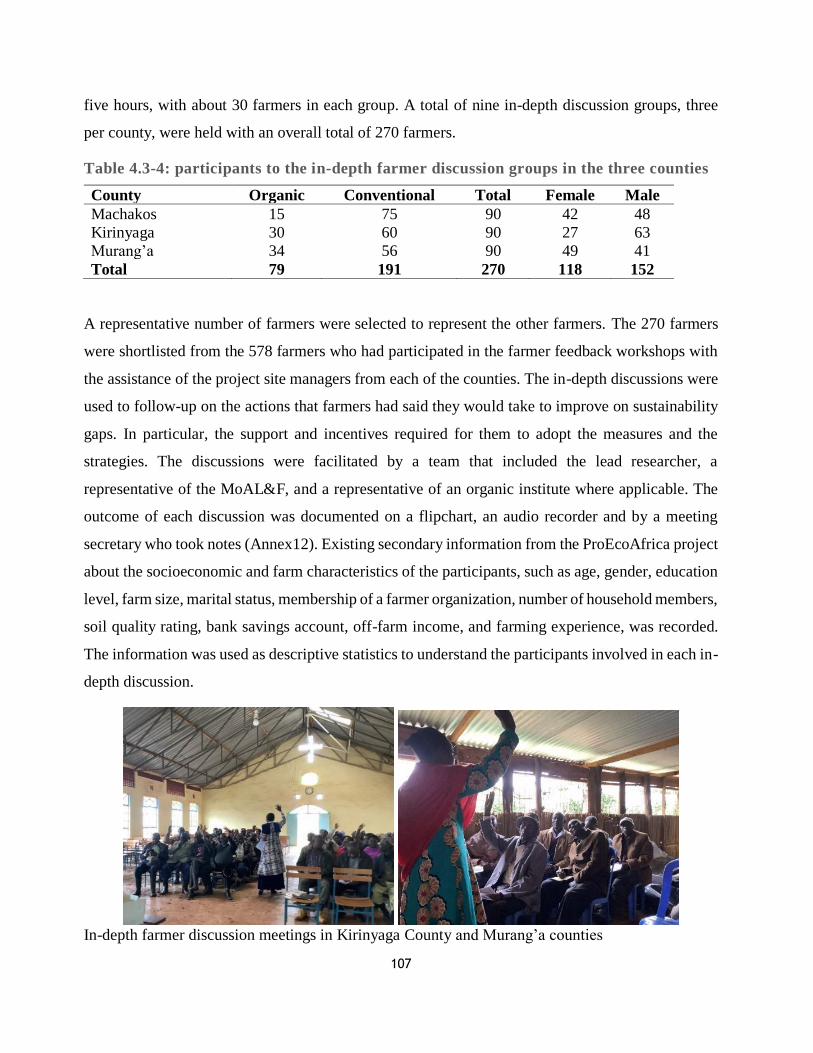
107
five hours, with about 30 farmers in each group. A total of nine in-depth discussion groups, three
per county, were held with an overall total of 270 farmers.
Table 4.3-4: participants to the in-depth farmer discussion groups in the three counties
County Organic Conventional Total Female Male
Machakos 15 75 90 42 48
Kirinyaga 30 60 90 27 63
Murang’a 34 56 90 49 41
Total 79 191 270 118 152
A representative number of farmers were selected to represent the other farmers. The 270 farmers
were shortlisted from the 578 farmers who had participated in the farmer feedback workshops with
the assistance of the project site managers from each of the counties. The in-depth discussions were
used to follow-up on the actions that farmers had said they would take to improve on sustainability
gaps. In particular, the support and incentives required for them to adopt the measures and the
strategies. The discussions were facilitated by a team that included the lead researcher, a
representative of the MoAL&F, and a representative of an organic institute where applicable. The
outcome of each discussion was documented on a flipchart, an audio recorder and by a meeting
secretary who took notes (Annex12). Existing secondary information from the ProEcoAfrica project
about the socioeconomic and farm characteristics of the participants, such as age, gender, education
level, farm size, marital status, membership of a farmer organization, number of household members,
soil quality rating, bank savings account, off-farm income, and farming experience, was recorded.
The information was used as descriptive statistics to understand the participants involved in each in-
depth discussion.
In-depth farmer discussion meetings in Kirinyaga County and Murang’a counties
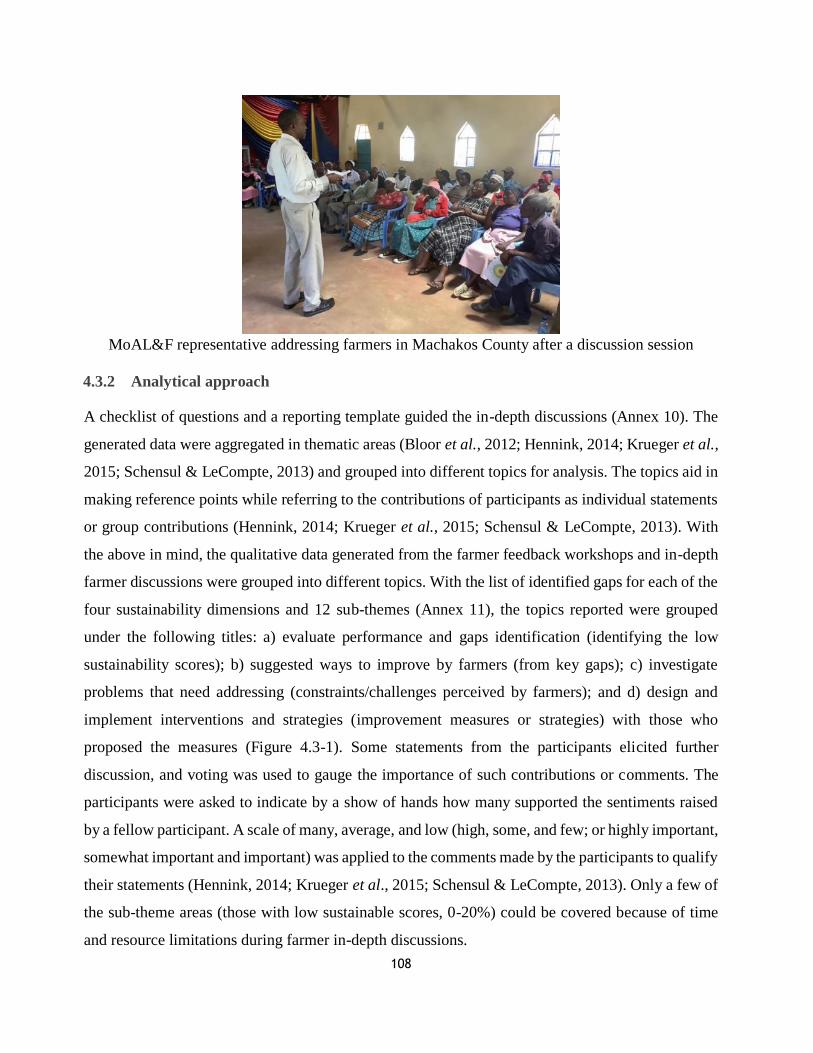
108
MoAL&F representative addressing farmers in Machakos County after a discussion session
4.3.2 Analytical approach
A checklist of questions and a reporting template guided the in-depth discussions (Annex 10). The
generated data were aggregated in thematic areas (Bloor et al., 2012; Hennink, 2014; Krueger et al.,
2015; Schensul & LeCompte, 2013) and grouped into different topics for analysis. The topics aid in
making reference points while referring to the contributions of participants as individual statements
or group contributions (Hennink, 2014; Krueger et al., 2015; Schensul & LeCompte, 2013). With
the above in mind, the qualitative data generated from the farmer feedback workshops and in-depth
farmer discussions were grouped into different topics. With the list of identified gaps for each of the
four sustainability dimensions and 12 sub-themes (Annex 11), the topics reported were grouped
under the following titles: a) evaluate performance and gaps identification (identifying the low
sustainability scores); b) suggested ways to improve by farmers (from key gaps); c) investigate
problems that need addressing (constraints/challenges perceived by farmers); and d) design and
implement interventions and strategies (improvement measures or strategies) with those who
proposed the measures (Figure 4.3-1). Some statements from the participants elicited further
discussion, and voting was used to gauge the importance of such contributions or comments. The
participants were asked to indicate by a show of hands how many supported the sentiments raised
by a fellow participant. A scale of many, average, and low (high, some, and few; or highly important,
somewhat important and important) was applied to the comments made by the participants to qualify
their statements (Hennink, 2014; Krueger et al., 2015; Schensul & LeCompte, 2013). Only a few of
the sub-theme areas (those with low sustainable scores, 0-20%) could be covered because of time
and resource limitations during farmer in-depth discussions.
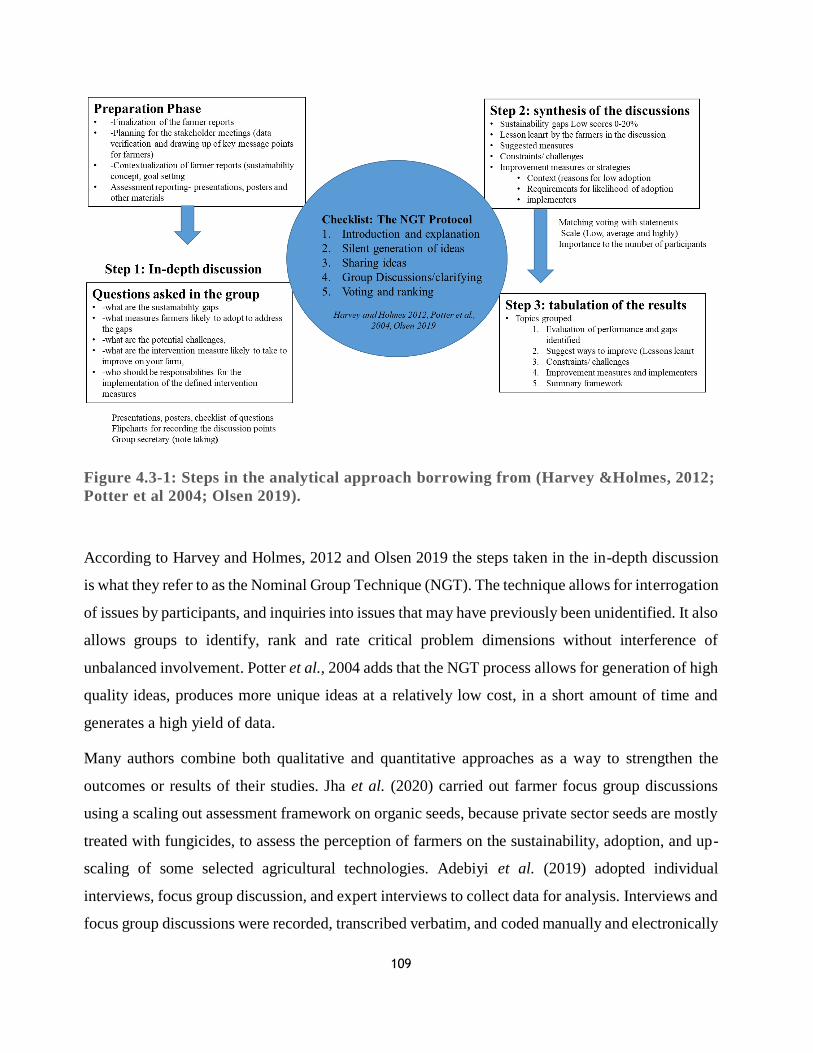
109
Figure 4.3-1: Steps in the analytical approach borrowing from (Harvey &Holmes, 2012;
Potter et al 2004; Olsen 2019).
According to Harvey and Holmes, 2012 and Olsen 2019 the steps taken in the in-depth discussion
is what they refer to as the Nominal Group Technique (NGT). The technique allows for interrogation
of issues by participants, and inquiries into issues that may have previously been unidentified. It also
allows groups to identify, rank and rate critical problem dimensions without interference of
unbalanced involvement. Potter et al., 2004 adds that the NGT process allows for generation of high
quality ideas, produces more unique ideas at a relatively low cost, in a short amount of time and
generates a high yield of data.
Many authors combine both qualitative and quantitative approaches as a way to strengthen the
outcomes or results of their studies. Jha et al. (2020) carried out farmer focus group discussions
using a scaling out assessment framework on organic seeds, because private sector seeds are mostly
treated with fungicides, to assess the perception of farmers on the sustainability, adoption, and up-
scaling of some selected agricultural technologies. Adebiyi et al. (2019) adopted individual
interviews, focus group discussion, and expert interviews to collect data for analysis. Interviews and
focus group discussions were recorded, transcribed verbatim, and coded manually and electronically
110
(Adebiyi et al., 2020). A study by Prihtanti (2016) used key informant interviews, focus group
discussion, a semi-structured and in-depth interview, and field visits. Descriptive statistics and
crosstabs with Somers’ procedure were used to analyze the data. Agidew and Singh (2019) collected
data using survey key informant interviews, questionnaires, focus group discussions, and field
observations. Oudtanivanh et al. (2018) collected data using a combination of methods (key
informant interviews, focus group discussion, and a semi-structured questionnaire for households)
(Oudtanivanh et al., 2018). Yanakittkul and Aungvaravong (2020) evaluated farmers' intentions
towards organic farming in rice farming by utilizing a questionnaire and focus group discussion for
data collection.
When a combination of qualitative and quantitative approaches are used, the qualitative aspects (key
informant interviews, focus group discussion) mostly begin or are incorporated within a semi-
structured questionnaire to gauge opinions (e.g. using a five-point Likert scale response to questions)
(Oudtanivanh et al., 2018, Yanakittkul & Aungvaravong, 2020; Patidar & Patidar, 2015). Various
researchers have used similar approaches to collect data. Jha et al. (2020) carried-out farmer focus
group discussions using a scaling out assessment framework to assess the perceptions of farmers on
sustainability, adoption and upscaling of some selected agricultural technologies. Information on
farmer characteristics was collected (gender, age, main crop, household size, land size, inputs
availability, and labour type). Kings and Ilbery (2012) used qualitative interview methods to collect
data from organic and conventional farmers about their life histories, work routine and farm
practices, noting their age, farm size, and education level. Recorded data was analyzed using a
textual approach of words and meanings. Any interesting or unusual quotations and paraphrases
made by respondents were highlighted to demonstrate attitude similarities or differences. Laepple
and Donnellan (2008) assessed farmers' attitudes towards converting to organic farming, using face-
to-face interviews to elicit the opinion and perceived problems of this alternative production system.
They used mean scores on a scale of 1 to 5 generated during the analysis, and correlated attitude
statements and intentions in their results. Patidar and Patidar (2015) in their study on the perception
of farmers towards organic farming in India, used descriptive statistics and factor analysis. The
theory of planned behavior (Ajzen, 1985; Beedell & Rehman, 2000) was used to analyze the data on
a five-point Likert scale (Patidar & Patidar, 2015; Prihtanti, 2016). Pinthukas (2015) used a semi-
structured questionnaire and focus group discussion and analyzed organic farming and farm
practices using a three-point scale method.
111
Evaluation of performance and key gaps
The objective here was to evaluate how the farms are performing regarding the objectives or
milestones set in the sustainability assessment against the set verifiable indicators, sub-themes,
themes, and dimensions. We evaluated the scores in the sustainability assessment and rated them
from 0-100%. The areas that scored between 0-20% (unacceptable range) were given a closer look
to identify the reasons for such low scores. The process of learning regards the areas that need
improvement and the steps required to improve low scores. A needs assessment was carried out to
prioritize the areas where the topics were too many, to scale them down to the most important one(s)
that can drive the whole change process.
Farmers' suggestions for improvement areas
For change to occur, there must be a willingness to change or do better. After evaluating the
performance and the areas that did not perform well, the identified areas for improvement were
broken down into ideas that would result in the changes taking place. The acknowledged
improvement areas included immediate changes, short or long-term shifts, and what is best for the
farms based on available resources.
Constraints (Investigation of the problems that need to be overcome)
The challenges that farmers face concerning production, harvesting and the marketing of farm
produce are also likely to be the areas that may interfere with the adoption of intervention measures
or strategies. Therefore, it was paramount that these were discussed before the final stage (see
below).
Design and implementation of interventions and strategies
These are the measures that farmers pledged to take to improve the performance of their farms.
Farmers listed the actions they would take up. They also discussed at which level, i.e. individual
farmer or community, the said strategies would be implemented.
4.4 Results and discussion
This section presents the results of the farmer feedback workshops and in-depth farmer discussion
meetings on the ways to improve the identified sustainability gaps. The results and discussion is
structured using the four headings mentioned above as the analytical approach, i.e. evaluation of
112
performance and learning; farmers' suggestions for improvement measures; investigation of the
problems that need to be overcome; and design and implementation of interventions and strategies.
12 sub-themes from the four major dimensions (environmental integrity, economic resilience, social
well-being, and governance) were selected for discussion with farmers.
4.4.1 Evaluation of performance and key gaps
The sustainability assessment reports of the SMART-Farm Tool rated scores as a percentage using
a five-scale scoring method ranging from 0-100%: 0-20% as unacceptable, 21-40% as limited, 41-
60% as moderate, 61-80% as good, and 81-100% as best (FAO, 2013a; Schader et al., 2016;
Ssebunya et al., 2017). The unacceptable scores of 0-20% for the farms in Murang’a, Kirinyaga, and
Machakos are summarized in Figure 4.4-1. The fewer the number of farms in the 0-20% range, the
better the county performance. The areas deemed unacceptable are those for which greater efforts
are required to improve farms' sustainability performance.
The sub-themes were drawn from the sustainability assessment's four dimensions (environmental
integrity, economic resilience, social well-being, and governance) and 21 themes (FAO, 2013a). See
Annex 13 for the full list of dimensions, themes, and sub-themes. Of the themes in the environmental
dimension, 2 out of 6 had low scores, whereas for the social well-being dimension, 4 out of 6 had
low ratings. All the themes in economic resilience and good governance had low ratings. At the sub-
theme level, the following had low scores: 2 of the 14 sub-themes in the environmental integrity
dimension, 7 out of 14 in the economic resilience dimension, 10 out of 16 in the social well-being
dimension, and 9 out of 14 in the governance dimension.
The 28 sub-themes with low scores form the table are: water withdrawal, ecosystem diversity
(environmental integrity), internal investment, community investment, long-ranging investment,
stability of market, liquidity, product information, local procurement (economic resilience),
capacity development, fair access to means of production, responsible buyers, rights of suppliers,
forced labour, child labour, freedom of association and right to bargaining, non-discrimination,
gender equality, support to vulnerable people (social well-being), and mission statement, due
diligence, holistic audits, responsibility, transparency, grievance procedures, civic responsibility,
sustainability management plan, and full-cost accounting (governance).
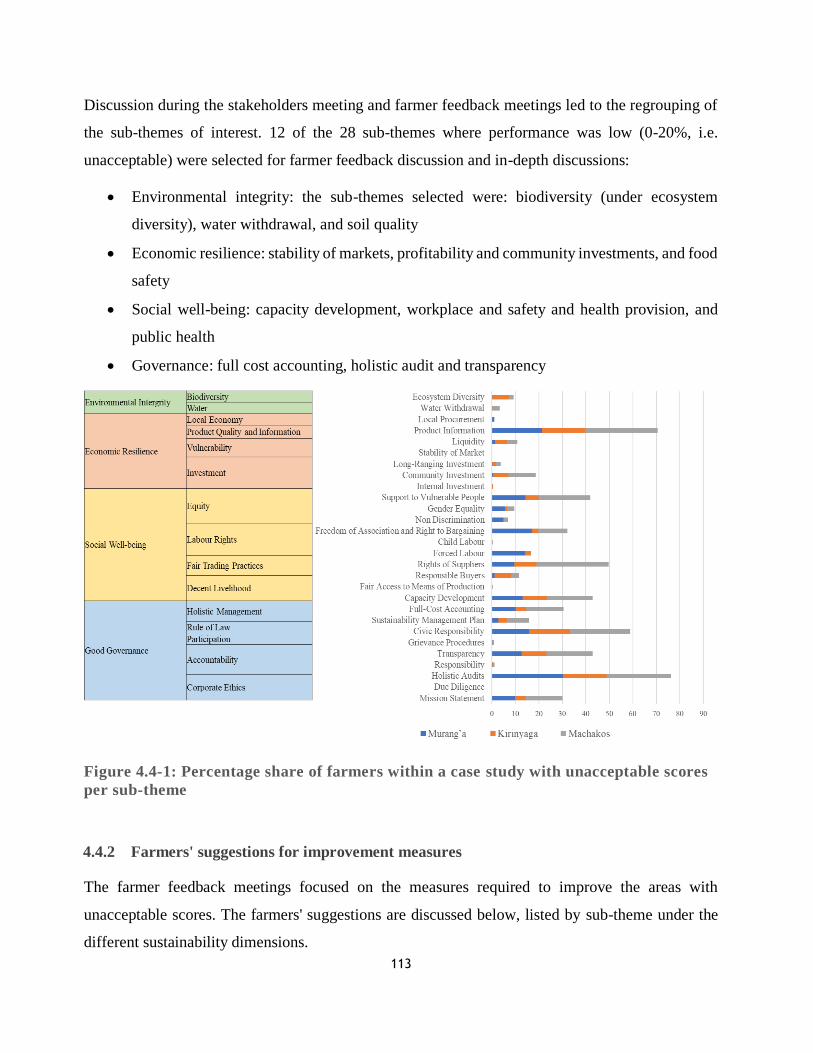
113
Discussion during the stakeholders meeting and farmer feedback meetings led to the regrouping of
the sub-themes of interest. 12 of the 28 sub-themes where performance was low (0-20%, i.e.
unacceptable) were selected for farmer feedback discussion and in-depth discussions:
Environmental integrity: the sub-themes selected were: biodiversity (under ecosystem
diversity), water withdrawal, and soil quality
Economic resilience: stability of markets, profitability and community investments, and food
safety
Social well-being: capacity development, workplace and safety and health provision, and
public health
Governance: full cost accounting, holistic audit and transparency
Figure 4.4-1: Percentage share of farmers within a case study with unacceptable scores
per sub-theme
4.4.2 Farmers' suggestions for improvement measures
The farmer feedback meetings focused on the measures required to improve the areas with
unacceptable scores. The farmers' suggestions are discussed below, listed by sub-theme under the
different sustainability dimensions.
114
Environmental integrity:
Reduce water withdrawal: The farmers suggested that improved irrigation technologies could reduce
water use/minimize water loss, would be less expensive to run, and more efficient to use. The use of
drip irrigation and foot-pumps was discussed, as well as the pros and cons of different technologies.
Farmers pledged to avoid planting water-draining trees, such as eucalyptus, near water sources. They
pledged to adopt various water harvesting methods, including surface run-off harvesting (such as
contour ridges, semi-circular bunds), Zai pits, rooftop harvesting, ponds or dams, and storage
reservoirs such as water tanks, to improve the availability of water during dry spells. A few farmers
suggested the construction of small dams to harvest water in Machakos County.
"…we have invested in foot water pumps and bought better PVC pipes that are helping to reduce
the cost we used to incur buying petrol and reduce water wastage when irrigating." (Farmer
from Kithimani in Machakos)
Reduce biodiversity loss: The farmers have taken up some practices that enhance biodiversity
conservation, that protect and preserve the wealth and variety of species, habitats, ecosystems, and
genetic diversity around their farms, by reducing the use of pesticides, and avoiding loss of micro-
organisms in the soil by reducing or stopping the practice of burning crop residues. Farmers also
suggested avoidance of cultivation along riparian areas which has led to a loss of organic matter by
water erosion and the washing away of soils. Another suggestion was planting more trees, especially
indigenous types, and avoiding the clearing of bushes where unnecessary. Indigenous trees are better
adapted to the local prevailing climatic and geographic conditions.
"…we have invested in tree planting on my farm, and this has helped in conserving water,
improving air quality around my farm." (Farmer from Machakos)
"…having indigenous trees on my farm has helped as a windbreak for my tea plantation and as
firewood for home use." (Farmer from Murang’a)
Improve soil quality: Practicing mulching, crop rotation, soil erosion control measures, and the use
of organic manures promotes soil quality. Farmers encouraged one another to prioritize soil testing
to know the quality of their soils before planting to avoid under or over nutrient application for the
crops grown. The use of quality farmyard manure on the farm was also suggested. The way the
115
farmyard manure is stored to reduce nutrient loss was stressed. Farmers suggested they should avoid
excessive use of synthetic fertilizers to reduce making the soil acidic.
"…last year (2018) I had the soils on my small farm tested, and the results revealed that there
was less nitrogen and dry matter in the soil. The measure recommended we addressed this, and
the crops performed better. We sold more vegetables and are happy with the results. I would
encourage other farmers to get their soils tested." (Farmer from Murang’a)
Economic resilience: The four key message areas discussed include the stability of markets,
improve profitability by keeping records, community investments, and food safety.
Stability of markets: The supply of sufficient farm produce to local markets throughout the year
requires that farmers work together as a group to stagger production and ensure that each month
crops are being produced. The suggested action-plan was to have a production plan showing a
schedule of farmers and the time to start planting, to ensure continuous production to sustain the
local market. Off-season production of crops using irrigation and reducing dependence on rain was
also discussed.
"…with irrigation we are able to grow green maize throughout the year and sell at a higher
price per cob than when we depend on rains only.” (Farmer from Murang’a)
"…having irrigation water enabled farming throughout the year. We grow many different leafy
vegetables that sell in the local markets, and traders come from far to purchase them since they
know we have them throughout the year." (Farmer from Mamba in Machakos)
Improve profitability by keeping records: Getting higher profits requires several aspects to be
considered, and key among them is having records of what inputs were used, labour costs, prices of
various items, dates of when crops were planted, and use of a cropping calendar. Keeping track of
the various farm activities requires record-keeping to avoid reliance on recalling the many details of
every crop operation, inputs prices, and revenue from produce. Record-keeping assists farmers to
assess the cost of production and calculate which crops are profitable, allowing them to reduce the
number of crops they grow to only those that they can manage profitably. Also, the documents assist
in planning farming activities to decide on where to re-invest to grow their farm enterprise.
116
"…watermelons were ready for harvesting around January, and as the only farmer in that area,
we got excellent prices as there were so few farms with melons in the market." (Farmer from
Matuu in Machakos)
Community investments: Most development activities and facilities are set up by the government.
Farmers working in groups can work together to improve community standards by maintaining the
infrastructure that benefits them (in areas such as link roads from farm to farm, community health
centers, local markets, etc.). Farmers' projects to improve the community’s environment were
discussed.
"…working together as a group we can ensure more is done together to benefit group members
and share ideas on investment options that favor the group." (Farmer from Murang’a)
Food safety: Rising number of cancer cases has led farmers to question the safety of the products
they use on their crops and livestock. The safe and hygienic measures taken in handling farm produce
to reduce high post-harvest losses were also discussed. The need to observe laid down procedures
after spraying crops or giving livestock medication to reduce residual levels in crops and milk was
discussed.
"…some farmers don't wait for the recommended duration after spraying the crop. They harvest
some crops (tomato and French beans) before the lapse of the chemical effect since the buyer is
on the farm and is giving good money for the crop…" (Farmer from Kirinyaga)
Social well-being: The need to improve capacity development, work safety and health provisions,
and public health were discussed.
Improve capacity development: The organization of farmer training meetings or workshops to enable
farmers to learn new farming practices should become a continuous process. The change to demand-
driven agricultural services and fewer extension service providers has led to changes in how
extension services are provided in the counties. Cooperatives organize training for crops like tea and
coffee and for milk production. Farmer field days are held in each area every year. Farmers also visit
each other and learn by sharing knowledge with those who are not informed on better crop
production techniques.
"…in the field days we attended, we learned a lot and picked up a few new ideas which we now
practice on our farms. We encourage the Ministry of Agriculture and the Organic Agriculture

117
Centre of Kenya to hold many more such field days each farming season…" (Farmer from
Murang’a)
Improve work safety and health provisions: The work environment for farmworkers and their
families must be conducive to enable good working conditions and relations. The persons working
on a farm should have the correct equipment and tools. In the spraying of crops against pests and
diseases, the correct spraying outfit is mandatory. The recommended practices include availability
of a secure first aid kit and the marking of all dangerous areas on the farm that are risky and should
be avoided. When using chemical pesticides, one should never spray against the wind, not eat or
smoke while spraying, and one should take a bath and drink water after spraying.
"…we get farmhands (casual labour) for spraying our tomato crop, but they don't listen to us on
wearing the full protective gear. Some say wearing the overall is uncomfortable…" (Farmer
from Kirinyaga)
"…we noticed that when we hire farmhands (casual labour) for spraying our crop, they don’t
wear the full protective gear. Some smoke in the field while spraying crops, and when asked why
they are doing so contrary to safety procedures, they say it's something small, just one or two
puffs…" (Farmer from Kirinyaga)
Improve public health: There is a need to protect crops and livestock against pests and diseases. The
inputs used for pests and disease control should be stored in line with recommendations on storage
to ensure viability is maintained as well as to minimize their harmful effects due to poor handling.
After use, the chemical containers should be destroyed or returned to Agro-vets where applicable.
Other measures to follow include; avoid dumping farm waste in rivers, avoid cleaning knapsack
pesticide sprayers in rivers, and observe pre-harvest intervals after spraying to stop the supply of
harmful products to the community.
"…sometimes as farmers we take it for granted that the crops we sell after spraying are good to
sell to the public but forgetting that our children living in the urban areas are the ones consuming
the crops we sold that are full of chemicals…" (Farmer from Kirinyaga)
Governance: The key message areas discussed were civic responsibility (community involvement)
and full-cost accounting (improving record-keeping, holistic audits, and transparency).
118
Civic responsibility (community engagement): The devolved governments at the county level plan
development activities. Public participation in this planning, including the budget-making process,
is encouraged as entrenched in the Constitution of Kenya (2010). Each citizen, apart from voting to
elect representatives to various positions (Member of County Assembly, women representative,
Member of Parliament, Senator, Governor, and President), can participate in activities that build the
community, such as the planning and budgeting process in the county. The farmers suggested that
they should take elected leaders to task on non-met initiatives which they committed to undertake.
"….we as citizens are encouraged to participate in the county budget-making process by
contributing our views each year during the stakeholders' budget discussion meeting held before
the county budget is passed in the county assembly." (Farmer from Kirinyaga)
Full cost accounting (improving record-keeping, holistic audits, and transparency): Farming is not
just about the production of crops for food and sale of the excess to the market. Farmers are
encouraged to consider it a business similar to other jobs that pay well. Investments in farming
should consider the future of the enterprise with achievable, sustainable goals that family members
can continue developing. Farmers should plan and involve their children in farming activities so that
they can take over from them. The farmers suggested that well-kept records could enable them to
secure investment capital for the development of the farm.
"…we were able to secure a bank loan from an agriculture finance cooperation since we had
been keeping various farm records as support documents for the farm business plan…" (Farmer
from Murang’a)
4.4.3 Constraints/challenges (Investigation of the problems that need to be overcome)
The in-depth farmer discussions looked at aspects limiting the uptake of the suggested measures
identified to improve sustainability in the identified areas. The challenges included the following
(see also Annex 14).
Environmental integrity
Lack of irrigation: A high number of farmers across the three counties stated that they depend on
rain-fed agriculture. The few that used irrigation lacked the technical knowledge to utilize the water
efficiently and effectively. They learned through trial and error by either over or under watering their
119
fields. Most farmers could not adopt efficient and effective methods of irrigation, such as drip
irrigation, due to inadequate capital.
Eucalyptus trees along the side of water bodies: Discussions with farmers revealed that some tree
species, such as eucalyptus trees, planted along the side of rivers and swampy areas were not ideal
in their areas. The farmers cited a reduction of water levels since the trees are fast-growing.
Eucalyptus tree suck up a lot of water (Ferreira et al., 2019; Lara et al., 2009). The trees are exotic
to Kenya and partly contribute to the reduction of cropping activities in Murang'a and Kirinyaga
counties where farmers depend on the river water. The farmers suggested they could replace the
eucalyptus trees with indigenous varieties (Ototo & Vlosky, 2018).
Biodiversity loss on farms: Loss of beneficial animals (insects, earthworms), plants (black jack), and
local crop varieties in the farms were discussed. Farmers shared that some insect species they used
to see ten years ago on their farms had disappeared. Many farmers had not seen earthworms for a
long time on their farms. Such insects are beneficial to the ecosystem and act as natural enemies,
pollinators, weed killers, or soil builders (Adhikari & Menalled, 2020; Getanjaly et al., 2015).
"….we practice organic farming, and since we started compost making after the training by
organic experts, we started seeing earthworms in the soils and other worms in the manure. They
had disappeared before converting to organic farming…" (Organic farmer from Murang’a)
The farmers also commented on the crop varieties grown. Most farmers nowadays grow hybrids and
stopped growing local varieties due to seed unavailability in Agro-vets. Other crop varieties like
cassava that were popular in the past as a staple crop in Murang’a and Kirinyaga have been replaced
by maize. Some plant species, like the black jack, which was considered a weed, are only found on
a few farms nowadays.
"….we used to see a lot of black jack plants on the farm as we did weeding, but now the plant
population has reduced and has been taken over by the nut-grass which gives us a problem if
weeding is not done early…" (Farmer from Murang’a)
Lack of proper knowledge and facilities for soil testing: Most farmers agreed that they did not carry-
out soil testing to know what amounts of organic or chemical fertilizers to apply. A high number of
farmers were unaware of where to seek soil test services and the location of such services. The
agriculture extension officers present in the discussion elaborated on what is required and
120
encouraged farmers to adopt a collective approach to conducting soil sampling and testing. Both
public and private sector organizations are needed to offer these services to farmers at the county
level.
Low soil quality leading to low crop yields. A high number of farmers agreed that low soil quality
leads to low yields. Very few farmers leave crop residuals on the farm and use compost manure to
improve soil fertility. Some farmers have adopted the use of animal manure, making compost to
improve soil fertility, and use of ash to reduce soil acidity.
Economic resilience
Market-related challenges: All the farmers agreed that markets and market information were
important to them. The issues of unstable markets, fluctuating prices, exploitation by
intermediaries/brokers, lack of price controls, and lack of target/alternative markets generated a lot
of heated debates among the participants. Farmers sell their produce individually, and the prices
quoted by buyers were rarely shared with others. Group marketing involves the aggregation of
produce at one central place to sell at a negotiated price. In Kithimani, Yatta sub-County, Machakos
County, an organic group, that had aggregated its produce and used public transport to take it to a
market in Nairobi, collapsed as members started withdrawing because of one reason or another.
Macadamia nuts from organic farms in Kirinyaga are picked up from their farms to comply with the
traceability system. The macadamia trees are marked and GPS coordinates are taken, and the harvest
is recorded per tree.
Fluctuating farm produce prices are caused by several issues, which include flooding of local
markets with crops from other counties, and overproduction of certain crops like mango and avocado
in some seasons. Farmers mainly produce crops at the same time, such as tomatoes, watermelons,
and green maize through rain-fed agriculture. Farmers' challenges were further compounded by
exploitation by brokers or intermediaries due to farmers' minimal market research for their produce
and lack of a marketing strategy. There is also a large and increasing number of brokers along the
value chain leading to the exploitation of farmers.
Low investments in community activities: In the present day most development activities and
facilities are set up and offered by the government. The dependency created means that farmers no
longer chip into the development activities that make their community's life better, such as to
improve and maintain infrastructure facilities that benefit them as farmers (for example, inaccessible
121
or poorly designed link roads that cannot accommodate large produce vehicles, a lack of community
health centers, or under-developed local markets).
Low farmer group formation: A high number of participating farmers agreed that there were too few
farmer groups. The type of groups mentioned by the farmers as more common included table
banking, self-help groups, and community-based organizations. These groups focus on the social
welfare of the community, however in most of the groups, discussions and agendas on agriculture
were not a priority. One farmer, happy that this study had brought farmers together, encouraged her
peers to continue in the spirit of staying together, learning from one another, and exploring the
different markets since, as a group, they have a better voice to negotiate with buyers for better
product prices.
"…this study was able to bring farmers from different communities together for two and a half
years with the agenda of sustainable agriculture." (Farmer from Kirinyaga)
Food safety: Lack of proper handling of crops by farmers during harvest and storage leads to food
losses. Some farmers mentioned that they lacked information on the processing of specific
vegetables and on the packaging and labeling of farm produce required for sale to the market. Those
who farmed under contract farming for crops like French beans are required to follow crop
operations strictly, to avoid rejection of the harvest. Post-harvest losses in most horticultural value
chain crops are generally in the range of 20-50% (Affognon et al., 2015).
Social well-being
Inadequate capacity development: A high share of farmers in the discussion groups agreed on the
limited access to information and capacity-building agricultural programs in their counties. There
are a few extension officers within the counties which has resulted in inadequate knowledge on best
agronomical practices for quality production, and for conventional farmers applying pesticides,
limited information on pre-harvest intervals for food safety and proper techniques for chemical
handling. Organic farmers face an information gap on the organic pesticides and fertilizers available
for use and on the pathways to access projects or programs in their areas.
Indeed, most of the farmers in the discussion groups were not aware of the agricultural projects or
programs earmarked for their sub-county or wards. The farmers agreed that the dissemination of
122
information was inadequate, and that as a result, they did not participate or volunteer for such
training when it took place.
Public health challenges: The majority of the farmers in the discussion groups did not have a
separate storage space for pesticides and food crops harvested. Neither did they observe pre-harvest
intervals when spraying chemical pesticides to ensure food safety for consumers. Another public
health challenge is the contamination of water either during spraying or the cleaning of equipment.
If spraying near the river, the farmer will clean the equipment in the river. Where tap water is used,
the knapsack pesticide sprayers were washed where other household items are cleaned and
sometimes, where drinking water or water used for cooking is sourced. Outfits worn during spraying
were washed together with other clothes. Most farmers stored the chemical pesticide containers
alongside farm produce or in the field (between a tree branch) or on top of the doorframe. Poor waste
disposal was also another challenge. Farmers lack adequate information on how to dispose of
containers and so on. Most of the time, apart from sorting the food-waste, everything else was
lumped together (paper, plastic, expired batteries, etc.) and thrown in a pit or hole dug at the far end
of the homestead.
Governance
Poor road networks: This is especially problematic when it rains, making it difficult to transport
goods from the farm to markets. A high share of farmers in the discussion groups agreed that sparse
road networks have sometimes forced them to carry their farm produce on their backs to a place
where vehicles were available or to use ox carts, both of which leads to crop losses.
Lack of proper record keeping: Farmers blamed this on time constraints, forgetfulness, and the
perception that it is a tedious process. Most of the farmers agreed that they were only keeping records
during the project period to avoid being reprimanded. Some farmers said that assistance from the
enumerators during the data collection period helped them to keep records. Farmers added that
record-keeping aided them in knowing the expenses used and money generated.
"….we stopped keeping records after the project ended. As farmers, we put a lot of money and
time into farming but the returns we see are little. We don't want to continue knowing how badly
we are doing considering that the prices we get are bad…" (Farmer from Murang’a)
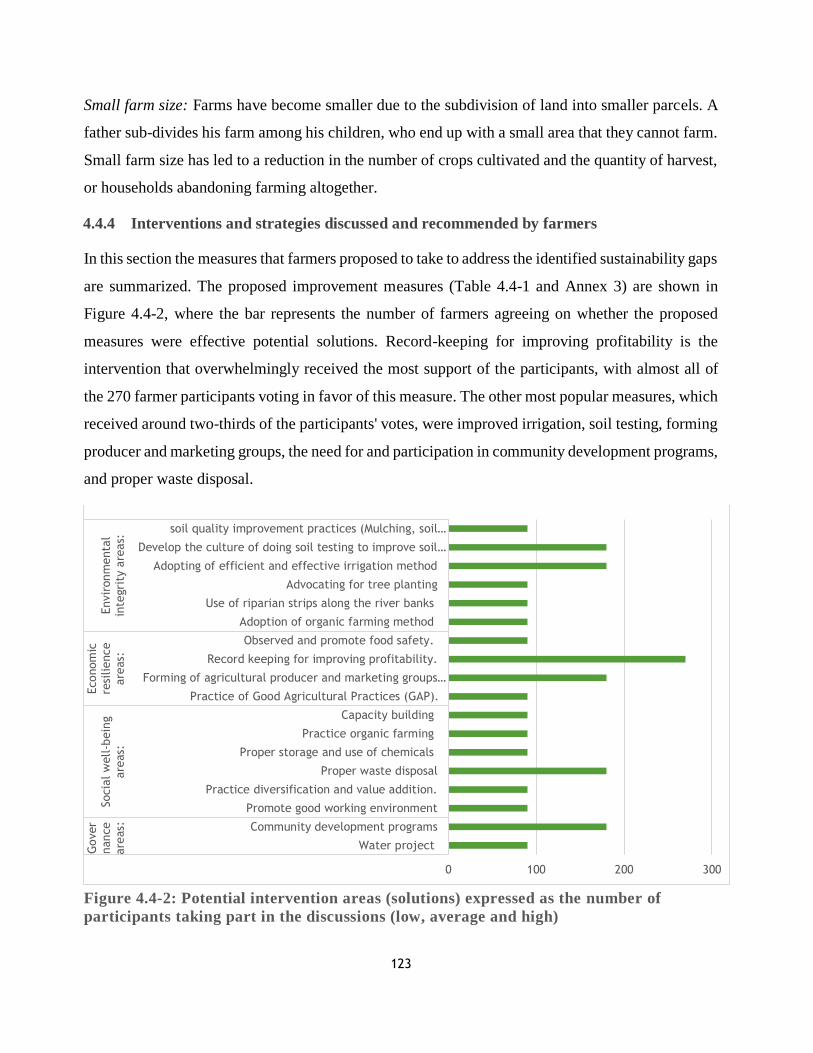
123
Small farm size: Farms have become smaller due to the subdivision of land into smaller parcels. A
father sub-divides his farm among his children, who end up with a small area that they cannot farm.
Small farm size has led to a reduction in the number of crops cultivated and the quantity of harvest,
or households abandoning farming altogether.
4.4.4 Interventions and strategies discussed and recommended by farmers
In this section the measures that farmers proposed to take to address the identified sustainability gaps
are summarized. The proposed improvement measures (Table 4.4-1 and Annex 3) are shown in
Figure 4.4-2, where the bar represents the number of farmers agreeing on whether the proposed
measures were effective potential solutions. Record-keeping for improving profitability is the
intervention that overwhelmingly received the most support of the participants, with almost all of
the 270 farmer participants voting in favor of this measure. The other most popular measures, which
received around two-thirds of the participants' votes, were improved irrigation, soil testing, forming
producer and marketing groups, the need for and participation in community development programs,
and proper waste disposal.
Figure 4.4-2: Potential intervention areas (solutions) expressed as the number of
participants taking part in the discussions (low, average and high)
0 100 200 300
Water project
Community development programs
Promote good working environment
Practice diversification and value addition.
Proper waste disposal
Proper storage and use of chemicals
Practice organic farming
Capacity building
Practice of Good Agricultural Practices (GAP).
Forming of agricultural producer and marketing groups…
Record keeping for improving profitability.
Observed and promote food safety.
Adoption of organic farming method
Use of riparian strips along the river banks
Advocating for tree planting
Adopting of efficient and effective irrigation method
Develop the culture of doing soil testing to improve soil…
soil quality improvement practices (Mulching, soil…
Gover
nance
are
as:
Socia
l w
ell-b
ein
gare
as:
Econom
icre
silience
are
as:
Envir
onm
enta
lin
tegri
ty a
reas:
124
Environmental integrity: The six intervention measures and strategies proposed by farmers
include:
1) Adoption of organic farming methods to promote biodiversity and soil quality. Farmers adopting
organic farming need quality organic inputs such as seeds, organic fertilizers, plant protection inputs,
as well as packaging materials for the harvested products. A value chain analysis for organic
players/actors requires an understanding of the actors and gaps so that business investment
opportunities linked to market analysis can catalyze a process that leads to higher organic food
production.
Organic farming is labour -intensive due to the use of bulky organic fertilizers, manual weeding, and
organic pesticide preparation and application. If the preparation of some of the organic fertilizers
and pesticides were to be taken up by local or existing companies, this would release farm labour to
other farming activities to increase farm production.
Farm monitoring is encouraged to monitor pests, diseases, and crop growth (concerning soil
moisture, structure, and texture for aeration of the soil, the presence of organisms and beneficial
insects in the soils and field).
2) The management of riparian strips. This is important for soil conservation and water quality. The
cultivation of farmers on riparian strips is discouraged as it leads to ecosystem disruptions such as
topsoil loss, lowering of water quality and interference with aquatic life. Farmers near water bodies
are encouraged to foster better management of riparian strips along the riverbanks or streams to
promote water quality. The riparian strips are usually low flat land that some farmers have taken
advantage of to grow crops without observing the required 40 meter distance as required by the
Agriculture Act (Cap.318) 2012, the Water Act (Cap.372) 2012, and the Water Act 2016; and if
found guilty, this is an offense punishable by law (The Republic of Kenya, 2012a, 2012b, 2016).
The law outlines strict measures to be taken against those violating the protection of catchment areas.
3) Tree planting initiatives. This would boost forest cover on farms and throughout the country and
is strongly encouraged. Kenya's tree cover stands at 7.4% of the total land area of Kenya (GoK,
2019; Ototo & Vlosky, 2018); which is less than the required minimum of 10% forest cover.
Initiatives by the government have encouraged tree-planting activities to boost Kenya's tree
population. Such programs advocate tree planting and discourage the planting of trees that reduce
water levels, such as Eucalyptus tree alongside water bodies. Farmers can get more information on
125
local and appropriate trees to plant on their farms from Kenya Forest Services. Apart from the
government institutions that have tree nurseries, farmers are encouraged to create certified tree
nurseries that complement government initiatives. The communal nurseries should raise different
varieties of trees that are indigenous and suitable for their agro-ecological zones. Farmers are also
encouraged to plant fruit and nut trees, which provide an additional source of income.
4) The adoption of an efficient and effective method of irrigation. Use of new technologies like drip
irrigation and renewable energy/solar efficient irrigation systems, can reduce water losses on farms
and increase crop yields. Apart from government incentives that promote the reduction of the cost
of equipment, tax exemption measures should be given on agricultural inputs to encourage farmers
to adopt new technologies.
5) Develop a culture of soil testing to improve soil quality. Most farmers in the study sites have not
had their soils tested. The farmers rely on the premise that their lands are good since they have been
getting a crop each year. However the few farmers who have had their soils tested make a better
judgment of input use and application on their farms. More farmers require training on the
importance of soil testing and a list of organizations (with their contacts) that offer soil testing
services was made available to the extension service providers and farmers. Setting up subsidized
mobile soil testing labs that offer reduced costs for the service to the farmers would also benefit the
farmers.
6) Improvement of soil quality on farms. Capacity building to farmers on Good Agricultural Practices
(GAP) that include crop rotation, mulching, and applying both farmyard and compost manure
enhances farmers’ skills and leads to higher crop productivity. Follow-up and practical training
where the farmers observe, learn, and practice what they have been taught is required to enhance
learned skills. The practice of leaving a good percentage of crop residue on the farm after harvesting
instead of removing everything should be encouraged. Farmers are also encouraged to avoid
excessive use of synthetic fertilizers and pesticides to reduce the level of acidity in the soil.
In summary, the environmental strategies listed by farmers that need to be incorporated in the
intervention plans include: biodiversity conservation measures to control biodiversity loss, tree
planting, the establishment of tree nurseries, maintenance and enhancement of beneficial organisms,
fertility management to improve soil quality, soil quality enhancement and soil testing, farmyard
manure testing for quality and management to conserve the required nitrogen, water management
126
especially irrigation techniques that promote efficiency in water use, alternative management options
such as mulching and residual crop management to reduce water withdrawal from the soil, and
appropriate application of water on the farm.
Economic resilience: The four intervention measures and strategies suggested by farmers include:
1) Forming of agricultural producer and marketing groups for market stability. Farmer producers
and marketing groups promote the interests of the group and encourage farmers to come together
and get trained on the importance of working together to achieving an economy of scale. Most
farmers sell their farm produce individually and accept the farm-gate price offered by the buyer
without negotiation. Group marketing and collection centers will reduce the poor negotiation of farm
prices with buyers. From their outset, farmer groups should have clear objectives and a well-
designed constitution to guide the achievement of the goals and aims of the group. Most government
organizations and NGOs have projects that provide agricultural incentives to groups of farmers
rather than to individuals.
2) Training farmers on Good Agricultural Practices (GAP). This will enhance farming skills and
increase safe and healthy crop production. The sustainability benefits of GAP are realized by both
farmers and consumers as there is control over production, lower costs (agrochemicals) and higher
yields, and more income and better prices for quality food. The formation of farmer groups and
collaboration with other farmer groups with common interests can improve economics of scale and
the production of larger quantities of food to meet market demands.
3) Record-keeping is important to guide farmers’ decision-making and improve the profitability of
farms. Good record-keeping practices should be cultivated. This will help farmers to have a clear
vision of what crops or livestock make profit or losses, and where to make cuts in production costs
to minimize expenditure. A continuity of good farming practices and knowledge of where to improve
are essential for sustainability.
4) Observation of Pre-Harvesting Intervals (PHI) when using chemical pesticides to ensure food
safety. Regulations, monitoring and traceability of farm produce should not only be for export crops
but also for the local market. Food quality and safety standards maintained for all crops grown on
the farm are important for safe production. The produce of farms that do not meet the required quality
and safety standards should be destroyed and legal action taken against the farmer. Strict measures
should be put in place in the agriculture value chain to protect the consumers of farm produce.
127
To summarize, the economic strategies that farmers were most keen to incorporate in the intervention
plans include the establishment of agricultural farmer groups and record keeping. Formation of
farmer groups necessitates mobilization and sensitization meetings and the drawing up of farmer
group constitutions with clear goals and objectives, including rules for conflict resolution
mechanisms, the sharing of proceeds, reporting of achievements, and maintenance of sufficient
number of members. Stabilization of the market area includes market analysis to understand the most
suitable and profitable crops to be planted by farmers, market intelligence gathering, reporting to
members, and the establishment of collection centers and product traceability systems. Furthermore,
identification of alternative and niche markets for a diverse range of farm produce and fulfilling the
required statutory requirements (standards and approvals). The importance of record-keeping was
the most popular measure: different types of records are important on a farm, and especially the
tracing of where losses or high expenses are incurred to improve the profitability of farms. Capacity
building aspects that range from agronomic practices to harvesting, value addition and marketing.
Social well-being: The six intervention measures and strategies proposed by the farmers include:
1) The promotion of a good working environment. Important for farmworkers, employees, hired
casual labour, and family members engaged on the farm. Provision of protective clothing and the
demarcating of hazardous areas on the farm are two obvious actions. Strict action should be taken
against farms that do not provide the necessary environment for an employee. A stricter follow-up,
rather than a casual warning approach, is needed for farmworkers who do not wear protective
clothing during crop or livestock spraying. Actions taken will promote adherence to labour laws and
reduce the number of cases of respiratory health problems caused by poor handling and spraying
using chemical pesticides or insecticides.
2) Farmers should be encouraged to diversify. By taking up the most profitable crops and livestock
enterprises, farmers can maximize the use of their land. As most farmers are small-scale (1-2 acres),
they should not have more than 15-20 different crops. Value addition can increase incomes by
changing the form of a raw product, i.e. fresh, dried, processed, milled, or liquid form. Green maize
cob fetches better returns than maize grain in most markets as consumers buy cobs for roasting,
boiling, and mixing with beans, etc. The diversification and value addition measures followed must
adhere to the set standards of quality and safety. Capacity building on the importance of
diversification and types of value addition is required for different crops and livestock.
128
3) Proper waste disposal. Farmers should be trained on the best way to dispose of the various waste
products generated by their farming activities. Some input companies provide recycling mechanisms
and return of empty containers but not many of the farmers are aware of the existing options.
Awareness creation and waste collection points and schedules should be advertised.
4) The correct storage and use of chemicals. This is included in the training schedules for both
conventional and organic farmers. Most farmers overuse plant protection chemicals, and it is
common for farmers to spray crops more times than required or to spray at the wrong time. Farmers
need to be trained on the importance of wearing protective gear while using chemicals, and on the
harmful health effects of exposure to chemicals and resultant need to store chemicals properly.
5) Capacity building on the principles of organic farming. This is required to remove misconceptions
about organic agriculture. Organic principles include an awareness of the ecological context; and
fairness for all relationships, care, and precautions for all. The traceability of all farm produce, not
just organic produce, should be encouraged. Farmers should start by researching the market and then
grow the crops the market demands. A market survey is important to identify the commodity buyers'
demands so that farmers can produce what sells and not produce and later discover a lack of market.
6) Frequent capacity building meetings. These are necessary for farmers to understand agriculture
value chains and the different players engaged, so that at every stage farmers are updated on the new
emerging farming trends and technologies they can use to increase production and make farming
more effective. Structured training may be conducted every quarter of the year and facilitation can
be done through groups by extension officers or any other stakeholder in the value chain.
In summary, the strategies mentioned by farmers that need to be incorporated into intervention plans
include capacity building programs, safe and proper use of crop protection measures, health and
safety for farm employees and workers, and proper disposal of waste.
Governance: The two intervention measures and strategies proposed by farmers include:
1) Farmers’ involvement in community development programs at the local and national levels. An
example is participation in the budgeting process for the county at scheduled days for the sub-county.
For this, a schedule of the planned presentations and discussion and location of the meeting venue
need to be organized and shared with the public in good time to maximize attendance and
participation.
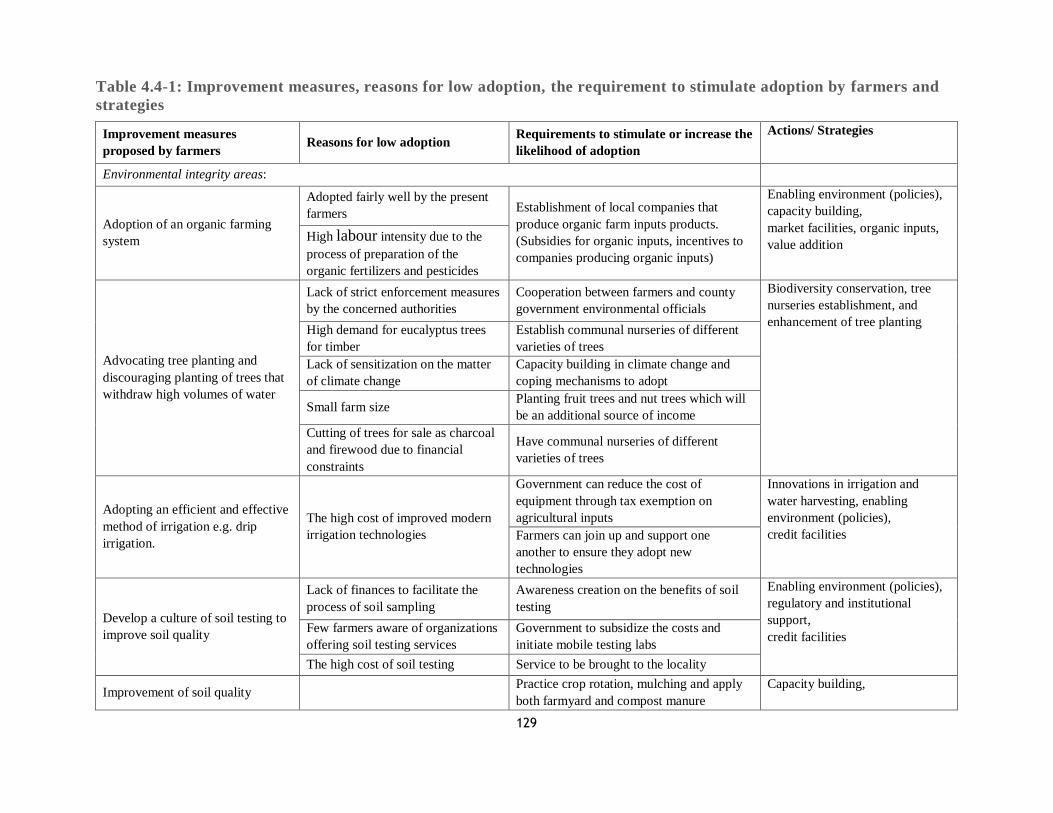
129
Table 4.4-1: Improvement measures, reasons for low adoption, the requirement to stimulate adoption by farmers and
strategies
Improvement measures
proposed by farmers Reasons for low adoption
Requirements to stimulate or increase the
likelihood of adoption
Actions/ Strategies
Environmental integrity areas:
Adoption of an organic farming
system
Adopted fairly well by the present
farmers Establishment of local companies that
produce organic farm inputs products.
(Subsidies for organic inputs, incentives to
companies producing organic inputs)
Enabling environment (policies),
capacity building,
market facilities, organic inputs,
value addition High labour intensity due to the
process of preparation of the
organic fertilizers and pesticides
Advocating tree planting and
discouraging planting of trees that
withdraw high volumes of water
Lack of strict enforcement measures
by the concerned authorities
Cooperation between farmers and county
government environmental officials
Biodiversity conservation, tree
nurseries establishment, and
enhancement of tree planting High demand for eucalyptus trees
for timber
Establish communal nurseries of different
varieties of trees
Lack of sensitization on the matter
of climate change
Capacity building in climate change and
coping mechanisms to adopt
Small farm size Planting fruit trees and nut trees which will
be an additional source of income
Cutting of trees for sale as charcoal
and firewood due to financial
constraints
Have communal nurseries of different
varieties of trees
Adopting an efficient and effective
method of irrigation e.g. drip
irrigation.
The high cost of improved modern
irrigation technologies
Government can reduce the cost of
equipment through tax exemption on
agricultural inputs
Innovations in irrigation and
water harvesting, enabling
environment (policies),
credit facilities Farmers can join up and support one
another to ensure they adopt new
technologies
Develop a culture of soil testing to
improve soil quality
Lack of finances to facilitate the
process of soil sampling
Awareness creation on the benefits of soil
testing
Enabling environment (policies),
regulatory and institutional
support,
credit facilities
Few farmers aware of organizations
offering soil testing services
Government to subsidize the costs and
initiate mobile testing labs
The high cost of soil testing Service to be brought to the locality
Improvement of soil quality Practice crop rotation, mulching and apply
both farmyard and compost manure
Capacity building,
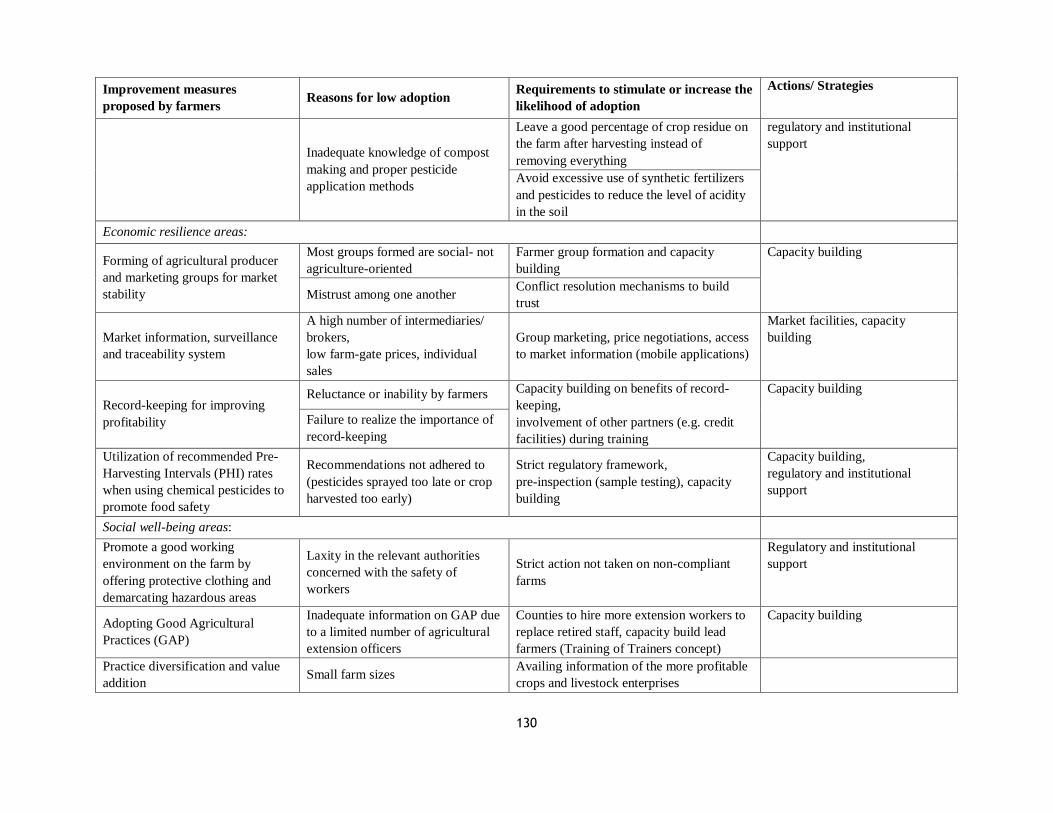
130
Improvement measures
proposed by farmers Reasons for low adoption
Requirements to stimulate or increase the
likelihood of adoption
Actions/ Strategies
Inadequate knowledge of compost
making and proper pesticide
application methods
Leave a good percentage of crop residue on
the farm after harvesting instead of
removing everything
regulatory and institutional
support
Avoid excessive use of synthetic fertilizers
and pesticides to reduce the level of acidity
in the soil
Economic resilience areas:
Forming of agricultural producer
and marketing groups for market
stability
Most groups formed are social- not
agriculture-oriented
Farmer group formation and capacity
building
Capacity building
Mistrust among one another Conflict resolution mechanisms to build
trust
Market information, surveillance
and traceability system
A high number of intermediaries/
brokers,
low farm-gate prices, individual
sales
Group marketing, price negotiations, access
to market information (mobile applications)
Market facilities, capacity
building
Record-keeping for improving
profitability
Reluctance or inability by farmers Capacity building on benefits of record-
keeping,
involvement of other partners (e.g. credit
facilities) during training
Capacity building
Failure to realize the importance of
record-keeping
Utilization of recommended Pre-
Harvesting Intervals (PHI) rates
when using chemical pesticides to
promote food safety
Recommendations not adhered to
(pesticides sprayed too late or crop
harvested too early)
Strict regulatory framework,
pre-inspection (sample testing), capacity
building
Capacity building,
regulatory and institutional
support
Social well-being areas:
Promote a good working
environment on the farm by
offering protective clothing and
demarcating hazardous areas
Laxity in the relevant authorities
concerned with the safety of
workers
Strict action not taken on non-compliant
farms
Regulatory and institutional
support
Adopting Good Agricultural
Practices (GAP)
Inadequate information on GAP due
to a limited number of agricultural
extension officers
Counties to hire more extension workers to
replace retired staff, capacity build lead
farmers (Training of Trainers concept)
Capacity building
Practice diversification and value
addition Small farm sizes
Availing information of the more profitable
crops and livestock enterprises
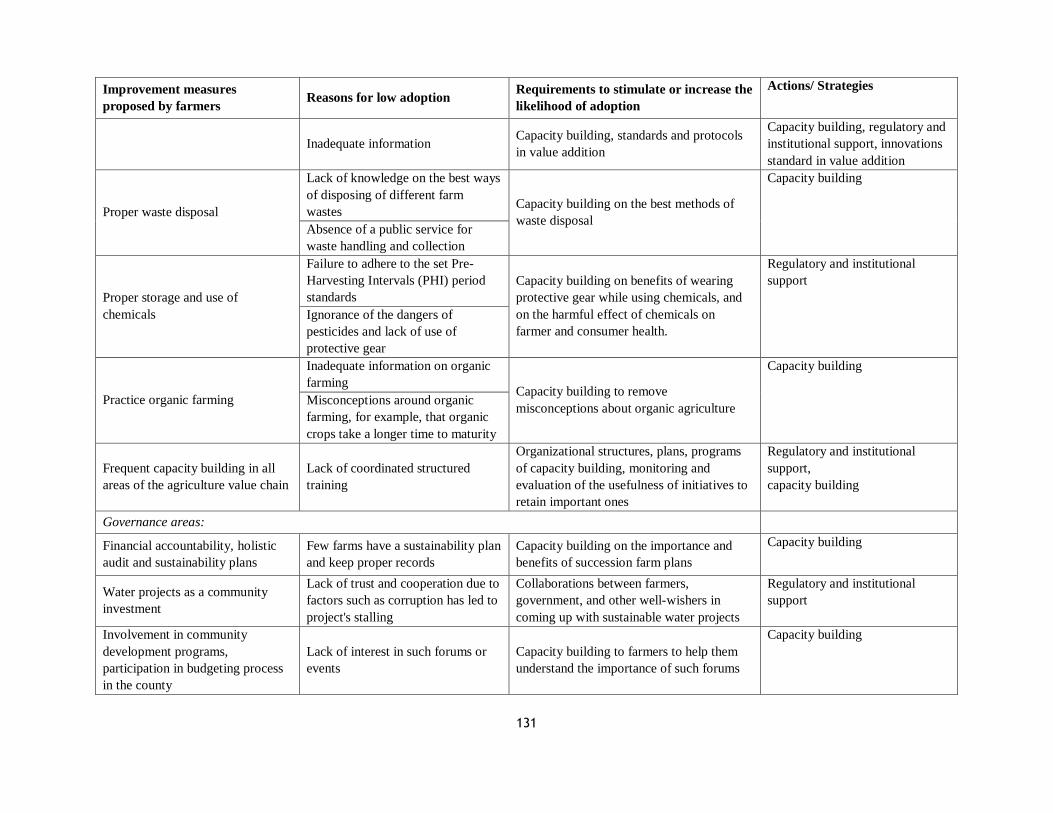
131
Improvement measures
proposed by farmers Reasons for low adoption
Requirements to stimulate or increase the
likelihood of adoption
Actions/ Strategies
Inadequate information Capacity building, standards and protocols
in value addition
Capacity building, regulatory and
institutional support, innovations
standard in value addition
Proper waste disposal
Lack of knowledge on the best ways
of disposing of different farm
wastes Capacity building on the best methods of
waste disposal
Capacity building
Absence of a public service for
waste handling and collection
Proper storage and use of
chemicals
Failure to adhere to the set Pre-
Harvesting Intervals (PHI) period
standards
Capacity building on benefits of wearing
protective gear while using chemicals, and
on the harmful effect of chemicals on
farmer and consumer health.
Regulatory and institutional
support
Ignorance of the dangers of
pesticides and lack of use of
protective gear
Practice organic farming
Inadequate information on organic
farming Capacity building to remove
misconceptions about organic agriculture
Capacity building
Misconceptions around organic
farming, for example, that organic
crops take a longer time to maturity
Frequent capacity building in all
areas of the agriculture value chain
Lack of coordinated structured
training
Organizational structures, plans, programs
of capacity building, monitoring and
evaluation of the usefulness of initiatives to
retain important ones
Regulatory and institutional
support,
capacity building
Governance areas:
Financial accountability, holistic
audit and sustainability plans
Few farms have a sustainability plan
and keep proper records
Capacity building on the importance and
benefits of succession farm plans
Capacity building
Water projects as a community
investment
Lack of trust and cooperation due to
factors such as corruption has led to
project's stalling
Collaborations between farmers,
government, and other well-wishers in
coming up with sustainable water projects
Regulatory and institutional
support
Involvement in community
development programs,
participation in budgeting process
in the county
Lack of interest in such forums or
events
Capacity building to farmers to help them
understand the importance of such forums
Capacity building
132
Advertisements are required that call for farmer participation in such meetings to discuss the
development of the community at the ward and county level. The advertisements can be placed in
local churches, social halls, and the chief's camp, as well as in the print media. Capacity building
helps farmers to understand the importance of such forums.
2) Water projects that provide access to clean, safe and reliable water at the community level. These
need to be incorporated in the case study sites. The different agro-ecological zones means that the
water needs differ across the study sites. Yatta sub-County in Machakos County has infrastructure
for water canals but the flow of water has been reducing over the years making farming using the
water unsustainable. Frequent de-siltation activities should be carried-out. Water harvesting
initiatives in the three study sites should be promoted to harvest rainwater for both domestic use and
farming
Involvement of youth: A cross-cutting theme
To ensure the sustainability of farming practices in the longer term, sustainability measures need to
be implemented by current farmers with an emphasis on the participation of the younger generation
who will, one day, takeover farming activities. The younger generation need to learn about farming
from the older generation, both to ensure there are no gaps in the takeover but also so that good
traditional practices and knowledge are not lost forever (the introduction of conventional farming has
led to the loss of traditional knowledge). Farming should be promoted as a career like any other job
among the younger generation. The youth agro-entrepreneurs are encouraged to select the crops and
value chains that best suit them, especially because they are generally more comfortable with new
technologies as compared with the older generation.
Implementation
It was agreed that the strategies identified were to be implemented by either the community or
individual farmer or by both parties (Table 4.4-2). The results show that individual farmers expect to
take up the following measures: adopting an efficient and effective method of irrigation, e.g., drip
irrigation (water use and management), the development of a culture of carrying out soil tests to
improve soil quality (soil fertility management), and record keeping for improving profitability.
Farmers also felt that individuals must play a strong role in promoting a good working environment,
for example, by offering protective clothing and demarcating hazardous areas on the farm.
The improvement measures that the community should implement are the formation of agricultural
production and marketing groups, and community welfare projects, namely water projects as a
community investment. The measures that require both individual and community engagement are
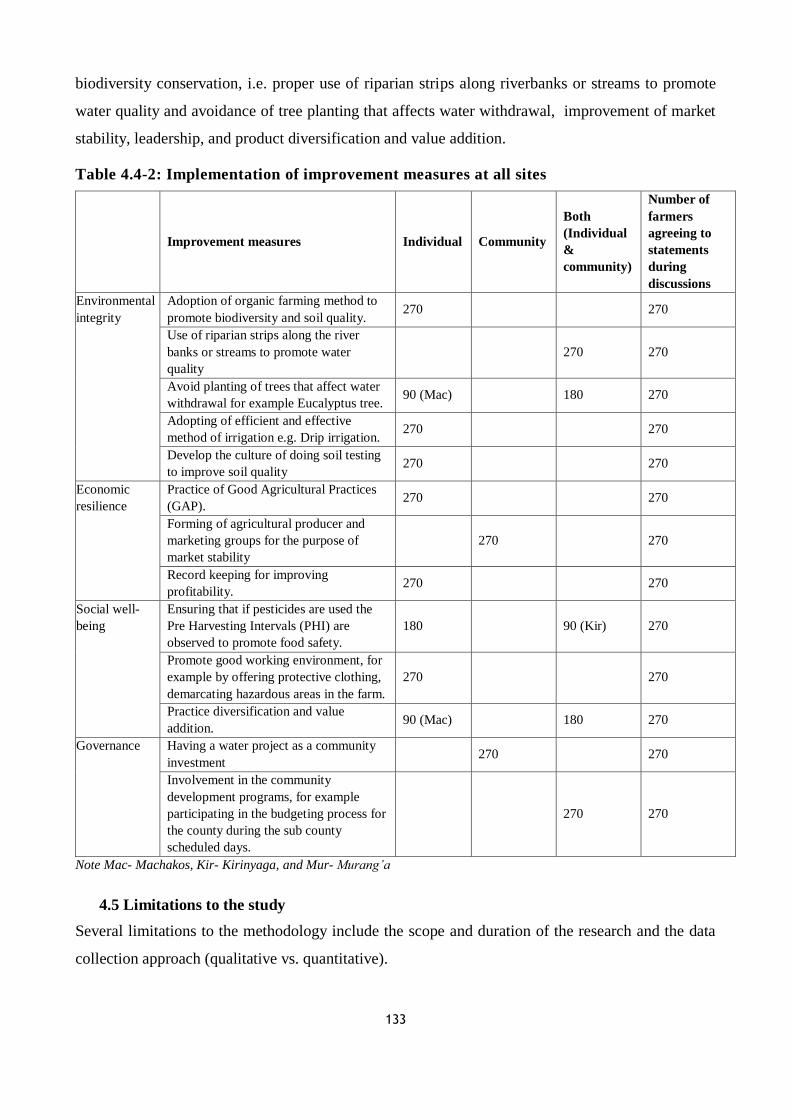
133
biodiversity conservation, i.e. proper use of riparian strips along riverbanks or streams to promote
water quality and avoidance of tree planting that affects water withdrawal, improvement of market
stability, leadership, and product diversification and value addition.
Table 4.4-2: Implementation of improvement measures at all sites
Improvement measures Individual Community
Both
(Individual
&
community)
Number of
farmers
agreeing to
statements
during
discussions
Environmental
integrity
Adoption of organic farming method to
promote biodiversity and soil quality. 270 270
Use of riparian strips along the river
banks or streams to promote water
quality
270 270
Avoid planting of trees that affect water
withdrawal for example Eucalyptus tree. 90 (Mac) 180 270
Adopting of efficient and effective
method of irrigation e.g. Drip irrigation. 270 270
Develop the culture of doing soil testing
to improve soil quality 270 270
Economic
resilience
Practice of Good Agricultural Practices
(GAP). 270 270
Forming of agricultural producer and
marketing groups for the purpose of
market stability
270 270
Record keeping for improving
profitability. 270 270
Social well-
being
Ensuring that if pesticides are used the
Pre Harvesting Intervals (PHI) are
observed to promote food safety.
180 90 (Kir) 270
Promote good working environment, for
example by offering protective clothing,
demarcating hazardous areas in the farm.
270 270
Practice diversification and value
addition. 90 (Mac) 180 270
Governance Having a water project as a community
investment 270 270
Involvement in the community
development programs, for example
participating in the budgeting process for
the county during the sub county
scheduled days.
270 270
Note Mac- Machakos, Kir- Kirinyaga, and Mur- Murang’a
4.5 Limitations to the study
Several limitations to the methodology include the scope and duration of the research and the data
collection approach (qualitative vs. quantitative).
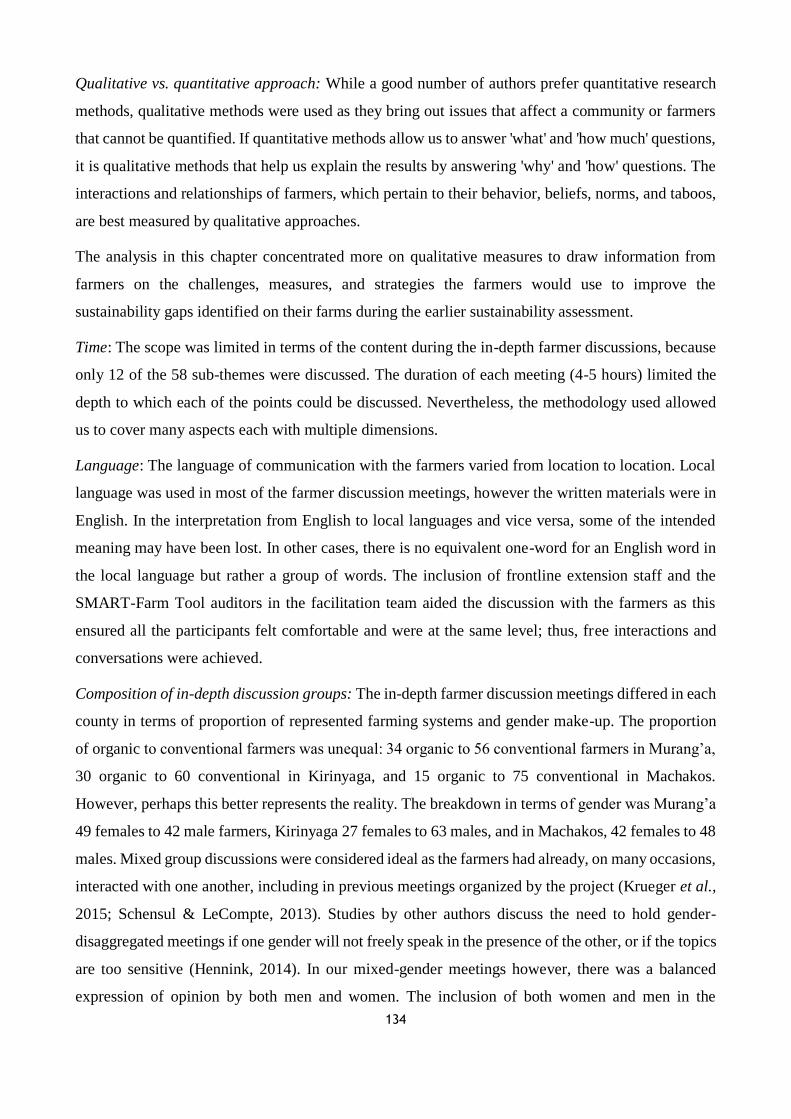
134
Qualitative vs. quantitative approach: While a good number of authors prefer quantitative research
methods, qualitative methods were used as they bring out issues that affect a community or farmers
that cannot be quantified. If quantitative methods allow us to answer 'what' and 'how much' questions,
it is qualitative methods that help us explain the results by answering 'why' and 'how' questions. The
interactions and relationships of farmers, which pertain to their behavior, beliefs, norms, and taboos,
are best measured by qualitative approaches.
The analysis in this chapter concentrated more on qualitative measures to draw information from
farmers on the challenges, measures, and strategies the farmers would use to improve the
sustainability gaps identified on their farms during the earlier sustainability assessment.
Time: The scope was limited in terms of the content during the in-depth farmer discussions, because
only 12 of the 58 sub-themes were discussed. The duration of each meeting (4-5 hours) limited the
depth to which each of the points could be discussed. Nevertheless, the methodology used allowed
us to cover many aspects each with multiple dimensions.
Language: The language of communication with the farmers varied from location to location. Local
language was used in most of the farmer discussion meetings, however the written materials were in
English. In the interpretation from English to local languages and vice versa, some of the intended
meaning may have been lost. In other cases, there is no equivalent one-word for an English word in
the local language but rather a group of words. The inclusion of frontline extension staff and the
SMART-Farm Tool auditors in the facilitation team aided the discussion with the farmers as this
ensured all the participants felt comfortable and were at the same level; thus, free interactions and
conversations were achieved.
Composition of in-depth discussion groups: The in-depth farmer discussion meetings differed in each
county in terms of proportion of represented farming systems and gender make-up. The proportion
of organic to conventional farmers was unequal: 34 organic to 56 conventional farmers in Murang’a,
30 organic to 60 conventional in Kirinyaga, and 15 organic to 75 conventional in Machakos.
However, perhaps this better represents the reality. The breakdown in terms of gender was Murang’a
49 females to 42 male farmers, Kirinyaga 27 females to 63 males, and in Machakos, 42 females to 48
males. Mixed group discussions were considered ideal as the farmers had already, on many occasions,
interacted with one another, including in previous meetings organized by the project (Krueger et al.,
2015; Schensul & LeCompte, 2013). Studies by other authors discuss the need to hold gender-
disaggregated meetings if one gender will not freely speak in the presence of the other, or if the topics
are too sensitive (Hennink, 2014). In our mixed-gender meetings however, there was a balanced
expression of opinion by both men and women. The inclusion of both women and men in the
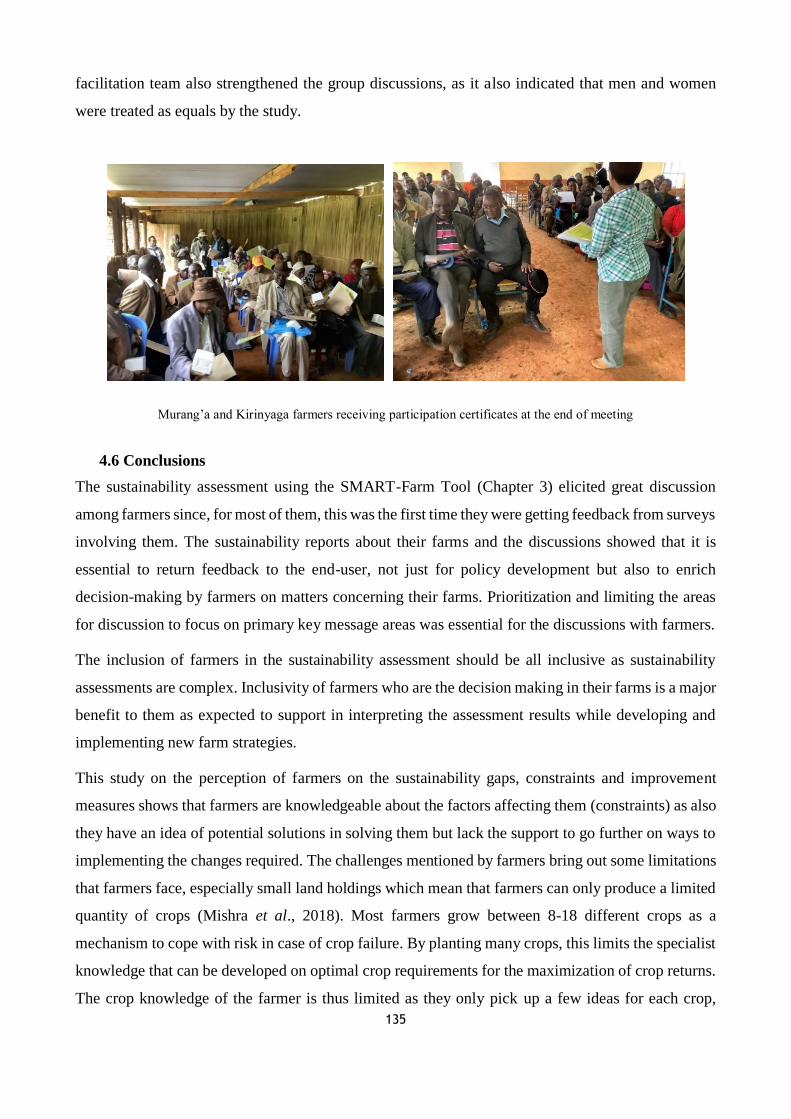
135
facilitation team also strengthened the group discussions, as it also indicated that men and women
were treated as equals by the study.
Murang’a and Kirinyaga farmers receiving participation certificates at the end of meeting
4.6 Conclusions
The sustainability assessment using the SMART-Farm Tool (Chapter 3) elicited great discussion
among farmers since, for most of them, this was the first time they were getting feedback from surveys
involving them. The sustainability reports about their farms and the discussions showed that it is
essential to return feedback to the end-user, not just for policy development but also to enrich
decision-making by farmers on matters concerning their farms. Prioritization and limiting the areas
for discussion to focus on primary key message areas was essential for the discussions with farmers.
The inclusion of farmers in the sustainability assessment should be all inclusive as sustainability
assessments are complex. Inclusivity of farmers who are the decision making in their farms is a major
benefit to them as expected to support in interpreting the assessment results while developing and
implementing new farm strategies.
This study on the perception of farmers on the sustainability gaps, constraints and improvement
measures shows that farmers are knowledgeable about the factors affecting them (constraints) as also
they have an idea of potential solutions in solving them but lack the support to go further on ways to
implementing the changes required. The challenges mentioned by farmers bring out some limitations
that farmers face, especially small land holdings which mean that farmers can only produce a limited
quantity of crops (Mishra et al., 2018). Most farmers grow between 8-18 different crops as a
mechanism to cope with risk in case of crop failure. By planting many crops, this limits the specialist
knowledge that can be developed on optimal crop requirements for the maximization of crop returns.
The crop knowledge of the farmer is thus limited as they only pick up a few ideas for each crop,
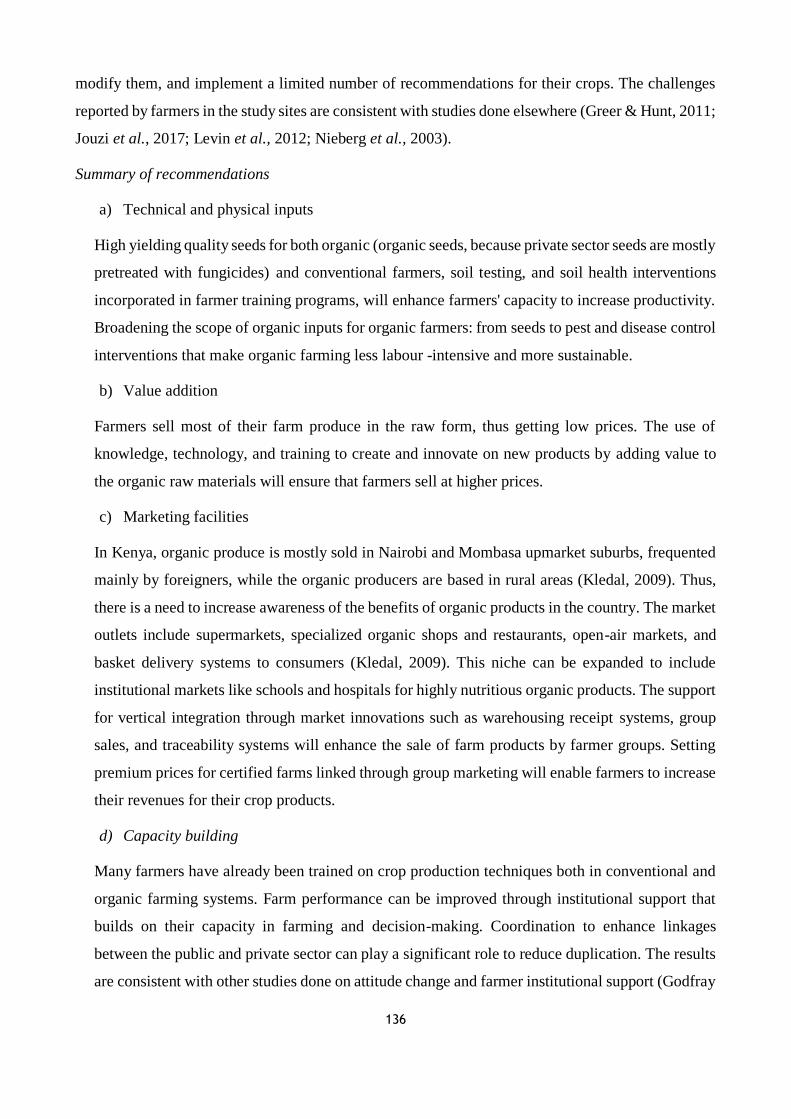
136
modify them, and implement a limited number of recommendations for their crops. The challenges
reported by farmers in the study sites are consistent with studies done elsewhere (Greer & Hunt, 2011;
Jouzi et al., 2017; Levin et al., 2012; Nieberg et al., 2003).
Summary of recommendations
a) Technical and physical inputs
High yielding quality seeds for both organic (organic seeds, because private sector seeds are mostly
pretreated with fungicides) and conventional farmers, soil testing, and soil health interventions
incorporated in farmer training programs, will enhance farmers' capacity to increase productivity.
Broadening the scope of organic inputs for organic farmers: from seeds to pest and disease control
interventions that make organic farming less labour -intensive and more sustainable.
b) Value addition
Farmers sell most of their farm produce in the raw form, thus getting low prices. The use of
knowledge, technology, and training to create and innovate on new products by adding value to
the organic raw materials will ensure that farmers sell at higher prices.
c) Marketing facilities
In Kenya, organic produce is mostly sold in Nairobi and Mombasa upmarket suburbs, frequented
mainly by foreigners, while the organic producers are based in rural areas (Kledal, 2009). Thus,
there is a need to increase awareness of the benefits of organic products in the country. The market
outlets include supermarkets, specialized organic shops and restaurants, open-air markets, and
basket delivery systems to consumers (Kledal, 2009). This niche can be expanded to include
institutional markets like schools and hospitals for highly nutritious organic products. The support
for vertical integration through market innovations such as warehousing receipt systems, group
sales, and traceability systems will enhance the sale of farm products by farmer groups. Setting
premium prices for certified farms linked through group marketing will enable farmers to increase
their revenues for their crop products.
d) Capacity building
Many farmers have already been trained on crop production techniques both in conventional and
organic farming systems. Farm performance can be improved through institutional support that
builds on their capacity in farming and decision-making. Coordination to enhance linkages
between the public and private sector can play a significant role to reduce duplication. The results
are consistent with other studies done on attitude change and farmer institutional support (Godfray
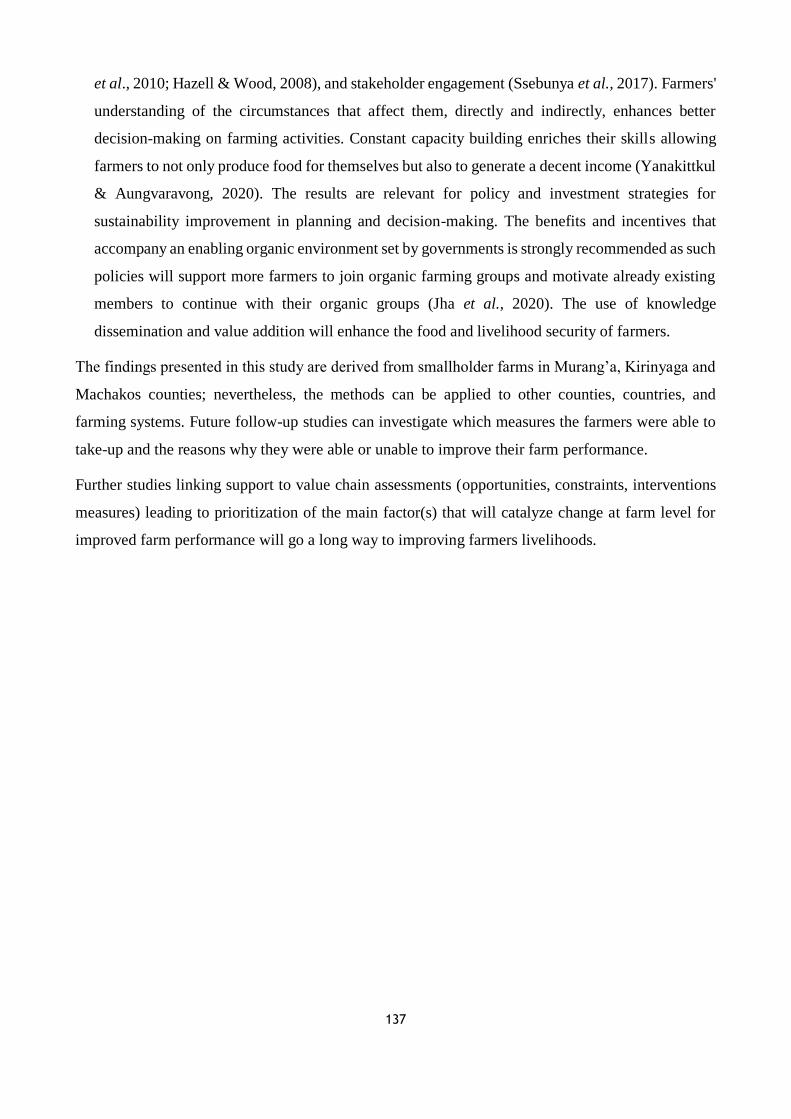
137
et al., 2010; Hazell & Wood, 2008), and stakeholder engagement (Ssebunya et al., 2017). Farmers'
understanding of the circumstances that affect them, directly and indirectly, enhances better
decision-making on farming activities. Constant capacity building enriches their skills allowing
farmers to not only produce food for themselves but also to generate a decent income (Yanakittkul
& Aungvaravong, 2020). The results are relevant for policy and investment strategies for
sustainability improvement in planning and decision-making. The benefits and incentives that
accompany an enabling organic environment set by governments is strongly recommended as such
policies will support more farmers to join organic farming groups and motivate already existing
members to continue with their organic groups (Jha et al., 2020). The use of knowledge
dissemination and value addition will enhance the food and livelihood security of farmers.
The findings presented in this study are derived from smallholder farms in Murang’a, Kirinyaga and
Machakos counties; nevertheless, the methods can be applied to other counties, countries, and
farming systems. Future follow-up studies can investigate which measures the farmers were able to
take-up and the reasons why they were able or unable to improve their farm performance.
Further studies linking support to value chain assessments (opportunities, constraints, interventions
measures) leading to prioritization of the main factor(s) that will catalyze change at farm level for
improved farm performance will go a long way to improving farmers livelihoods.
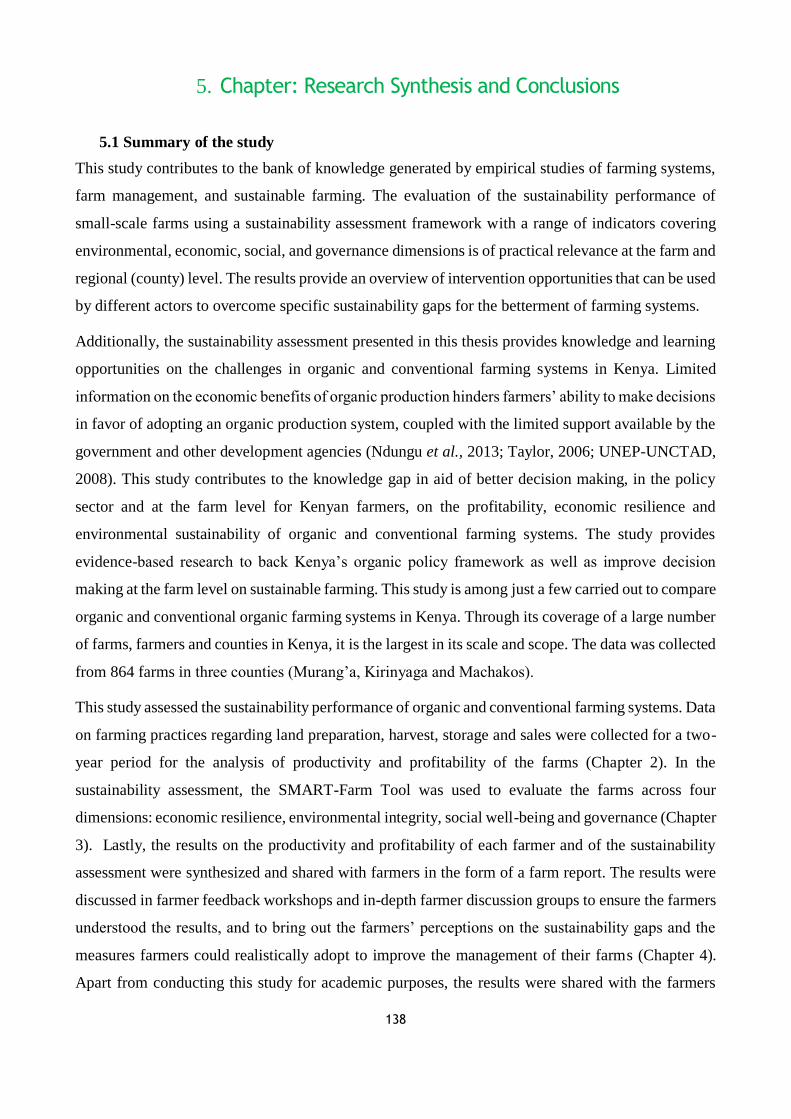
138
5. Chapter: Research Synthesis and Conclusions
5.1 Summary of the study
This study contributes to the bank of knowledge generated by empirical studies of farming systems,
farm management, and sustainable farming. The evaluation of the sustainability performance of
small-scale farms using a sustainability assessment framework with a range of indicators covering
environmental, economic, social, and governance dimensions is of practical relevance at the farm and
regional (county) level. The results provide an overview of intervention opportunities that can be used
by different actors to overcome specific sustainability gaps for the betterment of farming systems.
Additionally, the sustainability assessment presented in this thesis provides knowledge and learning
opportunities on the challenges in organic and conventional farming systems in Kenya. Limited
information on the economic benefits of organic production hinders farmers’ ability to make decisions
in favor of adopting an organic production system, coupled with the limited support available by the
government and other development agencies (Ndungu et al., 2013; Taylor, 2006; UNEP-UNCTAD,
2008). This study contributes to the knowledge gap in aid of better decision making, in the policy
sector and at the farm level for Kenyan farmers, on the profitability, economic resilience and
environmental sustainability of organic and conventional farming systems. The study provides
evidence-based research to back Kenya’s organic policy framework as well as improve decision
making at the farm level on sustainable farming. This study is among just a few carried out to compare
organic and conventional organic farming systems in Kenya. Through its coverage of a large number
of farms, farmers and counties in Kenya, it is the largest in its scale and scope. The data was collected
from 864 farms in three counties (Murang’a, Kirinyaga and Machakos).
This study assessed the sustainability performance of organic and conventional farming systems. Data
on farming practices regarding land preparation, harvest, storage and sales were collected for a two-
year period for the analysis of productivity and profitability of the farms (Chapter 2). In the
sustainability assessment, the SMART-Farm Tool was used to evaluate the farms across four
dimensions: economic resilience, environmental integrity, social well-being and governance (Chapter
3). Lastly, the results on the productivity and profitability of each farmer and of the sustainability
assessment were synthesized and shared with farmers in the form of a farm report. The results were
discussed in farmer feedback workshops and in-depth farmer discussion groups to ensure the farmers
understood the results, and to bring out the farmers’ perceptions on the sustainability gaps and the
measures farmers could realistically adopt to improve the management of their farms (Chapter 4).
Apart from conducting this study for academic purposes, the results were shared with the farmers
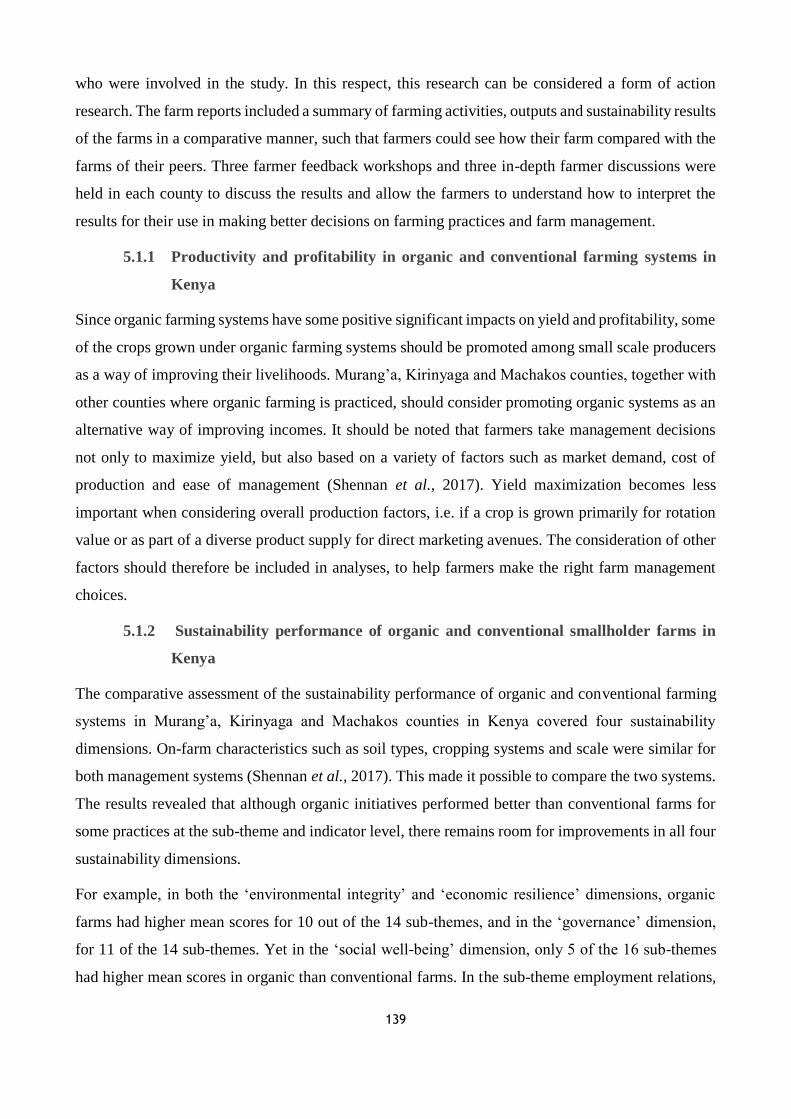
139
who were involved in the study. In this respect, this research can be considered a form of action
research. The farm reports included a summary of farming activities, outputs and sustainability results
of the farms in a comparative manner, such that farmers could see how their farm compared with the
farms of their peers. Three farmer feedback workshops and three in-depth farmer discussions were
held in each county to discuss the results and allow the farmers to understand how to interpret the
results for their use in making better decisions on farming practices and farm management.
5.1.1 Productivity and profitability in organic and conventional farming systems in
Kenya
Since organic farming systems have some positive significant impacts on yield and profitability, some
of the crops grown under organic farming systems should be promoted among small scale producers
as a way of improving their livelihoods. Murang’a, Kirinyaga and Machakos counties, together with
other counties where organic farming is practiced, should consider promoting organic systems as an
alternative way of improving incomes. It should be noted that farmers take management decisions
not only to maximize yield, but also based on a variety of factors such as market demand, cost of
production and ease of management (Shennan et al., 2017). Yield maximization becomes less
important when considering overall production factors, i.e. if a crop is grown primarily for rotation
value or as part of a diverse product supply for direct marketing avenues. The consideration of other
factors should therefore be included in analyses, to help farmers make the right farm management
choices.
5.1.2 Sustainability performance of organic and conventional smallholder farms in
Kenya
The comparative assessment of the sustainability performance of organic and conventional farming
systems in Murang’a, Kirinyaga and Machakos counties in Kenya covered four sustainability
dimensions. On-farm characteristics such as soil types, cropping systems and scale were similar for
both management systems (Shennan et al., 2017). This made it possible to compare the two systems.
The results revealed that although organic initiatives performed better than conventional farms for
some practices at the sub-theme and indicator level, there remains room for improvements in all four
sustainability dimensions.
For example, in both the ‘environmental integrity’ and ‘economic resilience’ dimensions, organic
farms had higher mean scores for 10 out of the 14 sub-themes, and in the ‘governance’ dimension,
for 11 of the 14 sub-themes. Yet in the ‘social well-being’ dimension, only 5 of the 16 sub-themes
had higher mean scores in organic than conventional farms. In the sub-theme employment relations,
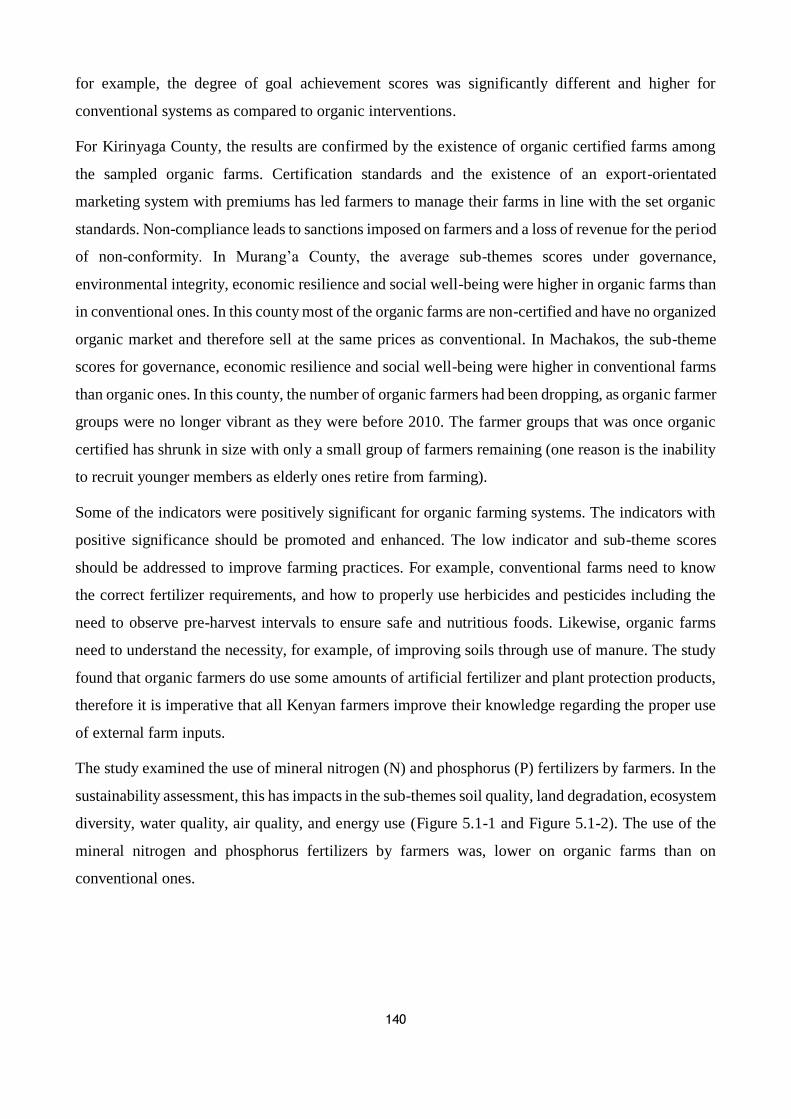
140
for example, the degree of goal achievement scores was significantly different and higher for
conventional systems as compared to organic interventions.
For Kirinyaga County, the results are confirmed by the existence of organic certified farms among
the sampled organic farms. Certification standards and the existence of an export-orientated
marketing system with premiums has led farmers to manage their farms in line with the set organic
standards. Non-compliance leads to sanctions imposed on farmers and a loss of revenue for the period
of non-conformity. In Murang’a County, the average sub-themes scores under governance,
environmental integrity, economic resilience and social well-being were higher in organic farms than
in conventional ones. In this county most of the organic farms are non-certified and have no organized
organic market and therefore sell at the same prices as conventional. In Machakos, the sub-theme
scores for governance, economic resilience and social well-being were higher in conventional farms
than organic ones. In this county, the number of organic farmers had been dropping, as organic farmer
groups were no longer vibrant as they were before 2010. The farmer groups that was once organic
certified has shrunk in size with only a small group of farmers remaining (one reason is the inability
to recruit younger members as elderly ones retire from farming).
Some of the indicators were positively significant for organic farming systems. The indicators with
positive significance should be promoted and enhanced. The low indicator and sub-theme scores
should be addressed to improve farming practices. For example, conventional farms need to know
the correct fertilizer requirements, and how to properly use herbicides and pesticides including the
need to observe pre-harvest intervals to ensure safe and nutritious foods. Likewise, organic farms
need to understand the necessity, for example, of improving soils through use of manure. The study
found that organic farmers do use some amounts of artificial fertilizer and plant protection products,
therefore it is imperative that all Kenyan farmers improve their knowledge regarding the proper use
of external farm inputs.
The study examined the use of mineral nitrogen (N) and phosphorus (P) fertilizers by farmers. In the
sustainability assessment, this has impacts in the sub-themes soil quality, land degradation, ecosystem
diversity, water quality, air quality, and energy use (Figure 5.1-1 and Figure 5.1-2). The use of the
mineral nitrogen and phosphorus fertilizers by farmers was, lower on organic farms than on
conventional ones.
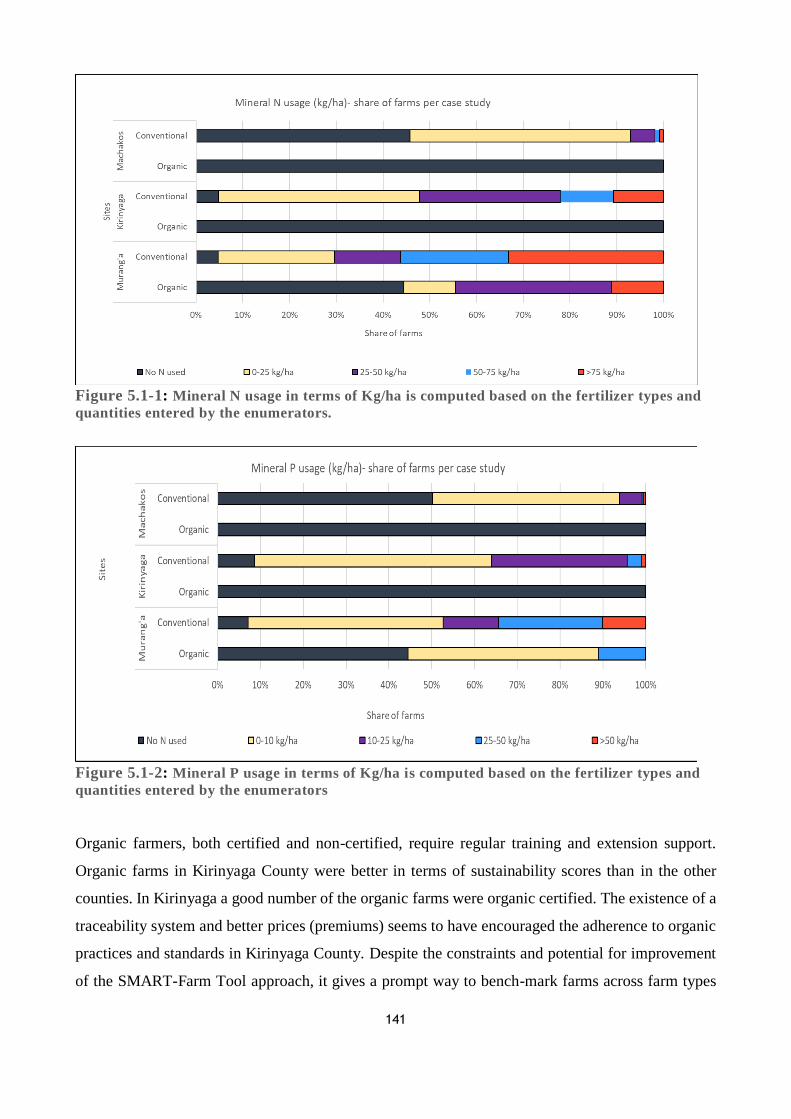
141
Figure 5.1-1: Mineral N usage in terms of Kg/ha is computed based on the fertilizer types and
quantities entered by the enumerators.
Figure 5.1-2: Mineral P usage in terms of Kg/ha is computed based on the fertilizer types and
quantities entered by the enumerators
Organic farmers, both certified and non-certified, require regular training and extension support.
Organic farms in Kirinyaga County were better in terms of sustainability scores than in the other
counties. In Kirinyaga a good number of the organic farms were organic certified. The existence of a
traceability system and better prices (premiums) seems to have encouraged the adherence to organic
practices and standards in Kirinyaga County. Despite the constraints and potential for improvement
of the SMART-Farm Tool approach, it gives a prompt way to bench-mark farms across farm types
142
and regions at the dimension, theme, and sub-theme levels. Sustainability assessment tools offer
support to decision-makers, policy, and development experts, and provide guidance to farmers as to
how they may best manage their resources.
5.1.3 Farmers’ perceptions of intervention measures to address sustainability gaps in
Kenya
The sustainability assessment of the farms and subsequent farmer feedback workshops revealed some
of the constraints facing farmers and discussed some of the intervention measures that farmers
perceive would improve the sustainability (including profitability) of their farms. In these fora, the
organic and conventional farmers explained that many of the farming decisions they take are
constrained by the challenges they face and their inability to overcome them. Summarized, the
constraints include limitations to technical and physical inputs (e.g. lack of irrigation systems and a
high reliance on rain-fed agriculture, and lack of soil testing and low soil quality leading to low
yields); market-related challenges (e.g. low and fluctuating prices, exploitation by
intermediaries/brokers and lack of target or alternative markets); inadequate knowledge and skills
(e.g. limited access to information and capacity building programs, lack of know-how on food safety
issues, chemical usage, storage, spraying, and lack of proper record keeping); limited institutional
support (e.g. poor infrastructure such as poor road networks to markets); and small farm sizes.
External factors faced by organic farmers included low levels of consumer awareness of organic farm
products, limited availability of organic inputs, and insufficient support to enable them to certify
themselves as organic producers. It is still the case that organic markets in Kenya are mostly found
in Nairobi and Mombasa upmarket suburbs, frequented mainly by expatriates, while the organic
producers are in the rural areas (Kledal, 2009). Thus there is a need to increase public awareness of
organic products and their health benefits in the country. The market outlets include supermarkets,
specialized organic shops, organic restaurants, organic farmers, open-air markets, and basket delivery
systems to consumers (Kledal, 2009). These market channels could be expanded further to include
niche and institutional markets (such as schools, hospitals). Organic farmers working in groups can
develop collection points and organize and advertise market days to get the end consumers to buy
directly from them. The Community Supported Agriculture (CSA) movement serves as a direct-
marketing model that could be taken up in Kenya (Hayden & Buck, 2012).
The intervention areas and strategies detailed in Chapter 4 offer opportunities to farmers that can be
implemented to improve the sustainability of their farms. These include: strategies for biodiversity
conservation, water resource use and management, and soil fertility management (environmental);
establishment of farmer groups, product diversification, creation of alternative markets, and record
143
keeping (economic); strategies of capacity development and public health and safety measures (social
well-being); and strategies of leadership, community welfare, and financial accountability
(governance).
5.2 Synthesis summary of the objectives/ Chapters
The analysis of the data from the productivity and profitability show that organic can be productive
and profitable for some crops and more sustainable in different sustainability dimensions, subthemes
and indicators yet a few farmers practicing it. In the farmers workshops farmers have list a good
number of constraints from production challenges to marketing. Additionally with the low
sustainability scores, the improvement measures need to be prioritized to the main factors that would
catalyze the change process to boost and make organic farming the go to system by farmers.
In the sustainability assessment farmers generally did well on the environmental, economic and
governance dimension but poorly in the social dimensions. Addressing these issues might solve a
good number of the challenges farmers face. For example by working together in groups farmers will
be able to consolidate farm products and market their product by eliminating middle men who take
advantage and offer low prices.
Another area is as build capacity of farmers’ awareness creation on the cost of production is necessary
During data collection in the productivity and profitability aspects the farmer were trained on record
keeping and basic accounting aspects (sales, costs, and profits calculations) to know where their
expenses were incurred. Reducing the cost of production can improve farm returns and farmers
knowledge about which areas to reduce costs one area for inclusion in intensive training program.
In my study a combination of qualitative and quantitative methods were used in the three counties
(Kirinyaga, Murang’a and Machakos) in Kenya. Productivity and profitability quantitative data
collection while sustainability and farmer perceptions used both qualitative (scores, ratings and scale)
and qualitative methods. The case studies selected give a good picture of organic farming in Kenya
up to a certain point since the sector is mostly dominated by NGOs who take the lead in organizing
and sourcing for markets. NGOs can only operationalize their activities up to a certain point
depending on financing and objectives. A case in point are the farmers in Kithimani in Yatta sub-
county who were introduced to organic farming and were trained and certified through a NGOs but
after the end of the program and certification period the farmers unable to raise the required capital
to renew the organic certification. The group disintegrated and only a few of the farmers remained
selling as organic non-certified.
144
Documentation of the study gives important insights into organic activities in Kenya and provides the
supporting evidence to enable policy makers make informed policy registration for the sector.
Additionally work by Kamau et al, 2018 merged together will strengthen the sectors evidence as the
study on the typology of organic farmers gives the different dimensions of organic farmers. The agro
ecological practices and emerging trends to promote the sector is not only left to the private sector
but added to the public extension services. Farmers have tend to approach public and frontline
extension staff first for answers on their farming bottlenecks or agrovets which are established at local
level.
Organic farming has a place in Kenya and can be a competitive options for farmers. The higher and
almost similar yields to conventional farming, better and also almost similar scores in the
sustainability assessment all point to engaging in the sector. The challenges faced by organic farmers
if addressed by policy actors can go a long way in improving the livelihoods of farmers as it also
improve on the environment. Also other benefits directly and indirectly such as health and nutritional
benefits accrue from use of the system (Note not documented in this study but mentioned by a good
number of non-certified farmers in Murang’a).
5.3 Recommendations for both organic and conventional systems
The recommendations are discussed under five groupings: enabling environment, physical inputs,
diversification and value addition, marketing, and capacity building
Enabling environment
A regulatory and legal framework that can guide the organic farming sector needs to be put in place.
Policies and strategies that enable the organic sector to grow and be competitive with conventional
farming systems are needed. Farmers in the organic sector in Kenya are faced with many constraints
and challenges. Support from the government is often lacking from production to marketing unlike
in conventional farming where policy frameworks and guidelines have been developed. In Kenya, a
proposed organic policy is yet to be passed by Parliament. Organic standards exist from 2007 but
require review as interventions and practices have since evolved. More broadly, the regulatory and
legal framework governing agriculture needs to be updated and farming practices effectively
regulated. Training of farmers and the relevant public sector workers is needed so that they understand
the law and regulations. An example that highlights the necessity of this is that of plant production
products, which are currently sold on the private market and wrongly used by farmers, which
negatively affects public health. Government policy to create an enabling organic environment would
145
lead to benefits and incentives that would encourage more farmers to join organic farming (Jha et al.,
2020).
Physical inputs
The quantities of inputs such as mineral fertilizer, organic pesticides, used by organic farmers in the
study county were low. The labour hours on the other hand were also higher for some crops than in
conventional farms. Physical inputs such as small machines and equipment (e.g. for preparing land,
planting, weeding), seeds and seedlings, natural fertilizers, natural or safer plant protection products,
and sustainably-sourced packaging materials are needed to improve farm production. An alternative
form of production that is less labour intensive and time demanding should be achieved and
infrastructure along the value chain needs to be developed. High yielding quality seeds and seedlings
(ideally not coated in fungicide) for organic and conventional farmers, soil testing and other soil
health interventions, and farmer training programs will enhance farmers' capacity to increase crop
productivity. Availability and access to organic inputs should be increased and promoted. Although
composting and other techniques should be encouraged on-farm, externally-produced organic inputs
are also required, for which suppliers are currently limited in scale and scope; such that only a few
farmers practicing organic farming know of their existence. Awareness creation via advertising, as
practiced for private and public sector conventional inputs, should be encouraged for organic inputs.
Farmers in Kirinyaga have gained from the operations of an NGO that not only buys their macadamia
nuts and avocado fruits for export but also provides them with farming inputs, extension services as
well as offering employment to family members during the processing of the nuts. Such support ought
to be provided by the government and other NGOs, for production for the domestic market too.
Diversification and value addition
Crop diversification among small-scale farmers should be promoted for risk management and
resilience management during dry spells. Farmers in the study area not only produced a wide range
of crops but also kept different livestock (cattle, sheep, goats, ducks, and chicken) both as an
integrated part of their farming operations and for sustenance (also considered a risk management
strategy that reduces their vulnerability to environmental and economic shocks). Some farmers had
off-farm sources of income which boosts their farming activities as they were able to access additional
land, equipment or hire labour with the earnings. The farm produce of most farms were sold in their
raw form with minimal processing (sorting or grading) or for quick access to cash. As a result they
receive low prices. Value addition would increase farm incomes as processed goods fetch higher
prices than raw products. The use of knowledge, technology, and training to create and innovate on
146
new products by adding value to organic raw materials will ensure that farmers sell at even high
prices.
Marketing
The support for vertical integration through market innovations such as warehousing receipt systems,
group sales, and traceability systems will enhance the sale of farm produce by farmer groups. The
setting of premium prices for certified farms linked through group marketing will enable farmers to
get better prices for their crop products. There is an unmet demand for organic products in the Kenyan
and export markets. Warehousing storage receipting systems and traceability systems, together with
information communication technology, should be encouraged for farmers to get better prices for
their farm produce. Besides, if traceability systems and random checking for pesticide levels were to
be applied to the entire agricultural system, the public would understand the benefits of organic
production, and conventional farmers may be inclined to switch to organic production.
Capacity building
Many organic and conventional farmers have already received training in certain crop production
techniques. The use of agro ecological practices by organic farmers is limited as shown by results
from the study. Limited capacity building in different ecological practices such as training on
pesticide use was reported amongst the farmers. To improve farm performance, farmers require
institutional support that builds on their capacity in farming and decision-making. Coordination
between the public and private sectors will enhance farmer training and play a significant role in
duplication reduction and the monitoring of projects’ and programs’ impacts on society. Farmers’
understanding of the circumstances that affect their farming practices, both directly and indirectly,
leads to better decision-making in farming activities (Godfray et al., 2010; Hazell & Wood, 2008).
The diversification of skills, such as proper record keeping, planning, budgeting, and evaluation, if
encouraged during training, would enable farmers to do what they do best (crop production). Constant
capacity building would enrich the skills of farmers to not only produce more food and generate more
income for themselves but also to create jobs and lead to other knock-on effects in their local area
(Yanakittkul & Aungvaravong, 2020).
5.4 Further research
This study on the sustainability performance of organic and conventional farming systems in Kenya
used the SMART-farm tool to conduct its sustainability assessment. A deeper analysis was performed
on only 12 of the 58 sub-themes. Further research can include the other 46 sub-themes. In the
sustainability assessment, some variables that could be best measured quantitatively, e.g. greenhouse
147
gases, were measured qualitatively. Another area that deserves attention is a comparison of farming
management systems with a focus on women and youth. Finally, this study mostly concentrated on
crops and thus, an analysis of the aspects of sustainability in the livestock value chain is another area
for further research.
This study included an assessment of productivity and profitability, a sustainability assessment, and
a series of discussions with farmers to gain their perception on sustainability gaps. Thus, the entire
cycle of starting with the farmer and ending with the farmer is captured. An adoption study is needed
to gauge which of the measures the farmers take up, and to understand how the adoption of these
measures impacts their livelihoods. Also studies on the impacts of time from organic conversion on
the productivity, profitability and sustainability of the farming systems should be taken up. The
sustainability assessment could also be repeated with the same farmers after some years, to check if
the areas that scored lowly have improved.
148
Bibliography
Abadie, A., & Imbens, G. W. (2011). Bias-corrected matching estimators for average treatment
effects. Journal of Business and Economic Statistics, 29(1), 1–11.
https://doi.org/10.1198/jbes.2009.07333
Abdullah, M., Mustafa, F. B. B., & Chowdhury, Z. Z. (2020). Organic Farming a viable option for
the global food supply and livelihood sustainability. Researchgate.Net, (July), 31.
https://doi.org/: https://www.researchgate.net/publication/343141033 Organic
Adamtey, N., Musyoka, M. W., Zundel, C., Cobo, J. G. Karanja, E., Fiaboe, K.K.M., Muriuki, A.,
Mucheru-Muna, M., Vanlauwe, B., Berset, E., Messmer, M.M., Gattinger, A., Bhullar, G.S.,
Cadisch, G., Fliessbach, A., Mäder, P., Niggli, U., & Foster, D (2016). Productivity,
profitability and partial nutrient balance in maize-based conventional and organic farming
systems in Kenya. Agriculture, Ecosystems and Environment, 235, 61–79.
https://doi.org/10.1016/j.agee.2016.10.001
Adebiyi, J. A., Olabisi, L. S., Richardson, R., Liverpool-Tasie, L. S. O., & Delate, K. (2020). Drivers
and constraints to the adoption of organic leafy vegetable production in Nigeria: A livelihood
approach. Sustainability (Switzerland), 12(1), 1–21. https://doi.org/10.3390/SU12010096
Adhikari, S., & Menalled, F. D. (2020). Supporting beneficial insects for agricultural sustainability:
The role of livestock-integrated organic and cover cropping to enhance ground beetle
(Carabidae) communities. Agronomy, 10(8), 1–15.
https://doi.org/10.3390/agronomy10081210
Adinya, O., Ajayi, S., & Idiege, D. (2009). Economic Analysis of Cassava Production in Akwa Ibom
State, Nigeria. Journal of Agriculture, Forestry and the Social Sciences, 5(2).
https://doi.org/10.4314/joafss.v5i2.46704
Affognon, H., Mutungi, C., Sanginga, P., & Borgemeister, C. (2015). Unpacking postharvest losses
in sub-Saharan Africa: A Meta-Analysis. World Development, 66, 49–68.
https://doi.org/10.1016/j.worlddev.2014.08.002
Agidew, A. A., & Singh, K. (2019). Factors Affecting the Adoption of Sustainable Land Management
Practices at Farm Level in the North eastern Highlands of Ethiopia: The Teleyayen Sub-
Watershed Case Study. Journal of Environmental Pollution and Management. Retrieved from
https://www.researchgate.net/publication/332621763_Factors_Affecting_the_Adoption_of_
Sustainable_Land_Management_Practices_at_Farm_Level_in_the_Northeastern_Highlands
_of_Ethiopia_The_Teleyayen_Sub-Watershed_Case_Study_Citation_Alem-
meta_Assefa_Agidew_
Ahmad, K., & Heng, A. C. T. (2012). Determinants of agriculture productivity growth in Pakistan.
International Research Journal of Finance and Economics, 95(January), 163–172.
Ajzen, I., 1985. From intentions to actions: a theory of planned behavior. In: Kuhle, J., Beckmann, J.
(Eds.), Action-control: From Cognition to Behavior. Heidelberg, Springer, pp. 11-39
Alcock, D., & Hegarty, R. S. (2006). Effects of pasture improvement on productivity, gross margin
and methane emissions of a grazing sheep enterprise. International Congress Series, 1293,
103–106. https://doi.org/10.1016/j.ics.2006.01.080
149
Alvarez, J.F.O., Valero, J.A.D., Martin-Benito, J.M.T., Mata, E.L., (2004). MOPECO: an economic
optimization model for irrigation water management. Irrigation Science 23, 61–75
Amudavi, D. M., Ombati, J. M., Nkurumwa, A. O., & Ngigi, M. (2014). Technical, economic and
social gaps and information needs among smallholder farmers in practice of ecological
organic agriculture in Kenya. International Journal of Agriculture Innovations and Research,
3(1), 198–209.
Anantanyu, S., Suwarto, & Suminah. (2018). Farmers’s perception and strategies for the
development of sustainable livelihoods in disaster prone areas. IOP Conference Series: Earth
and Environmental Science, 142(1). https://doi.org/10.1088/1755-1315/142/1/012054
Andrieu, N., Descheemaeker, K., Sanou, T., & Chia, E. (2015). Effects of technical interventions on
flexibility of farming systems in Burkina Faso: Lessons for the design of innovations in West
Africa. Agricultural Systems, 136, 125–137. https://doi.org/10.1016/j.agsy.2015.02.010
Anyanwu, S. O. (2013). Determinants of aggregate agricultural productivity among high external
input technology farms in a harsh macroeconomic environment of Imo state, Nigeria. African
Journal of Food, Agriculture, Nutrition and Development, 13(5), 8238–8248.
Ash, A., Gleeson, T., Hall, M., Higgins, A., Hopwood, G., MacLeod, N., Paini D., Poulton P.,
Prestwidge Di, Webster T., Wilson, P. (2017). Irrigated agricultural development in northern
Australia: Value-chain challenges and opportunities. Agricultural Systems, 155(March), 116–
125. https://doi.org/10.1016/j.agsy.2017.04.010
Auerbach, R. (2013) Transforming African Agriculture: Organics and Agra. Organic Agriculture:
African Experiences in Resilience and Sustainability. Natural Resources Management and
Environment Department Food and Agriculture Organization of the United Nations, Roma, 16
Ayuya, O. I., Gido, E. O., Bett, H. K., Lagat, J. K., Kahi, A. K., & Bauer, S. (2015). Effect of Certified
Organic Production Systems on Poverty among Smallholder Farmers: Empirical Evidence
from Kenya. World Development, 67, 27–37. https://doi.org/10.1016/j.worlddev.2014.10.005
Beal, S. J., & Kupzyk, K. A. (2014). An Introduction to Propensity Scores: What, When, and How.
Journal of Early Adolescence, 34(1), 66–92. https://doi.org/10.1177/0272431613503215
Beedell, J., & Rehman, T. (2000). Using social-psychology models to understand farmers’
conservation behaviour. UK. Journal of Rural Studies, 16, 117–127. Retrieved from
https://ac.els-cdn.com/S0743016799000431/1-s2.0-S0743016799000431-
main.pdf?_tid=9fdf52e9-0bcc-43a4-8ce5-
ca3164785090&acdnat=1551863521_accd70f1e45cc2a72c0d85b50d24346c
Beltrán-Esteve, M., & Reig-Martínez, E. (2014). Comparing conventional and organic citrus grower
efficiency in Spain. Agricultural Systems, 129, 115–123.
https://doi.org/10.1016/j.agsy.2014.05.014
Berhane, M., Abreha, Z., & Fitiwy, I. (2015). Farmer’s Perception of Productivity and Profitability
of Organic and Conventional tef [ Eragrostis tef ( Zucc .) Trotter] Production : Journal of
Agricultural Science and Food Technology, 1(7), 88–93.
Binder, C. R., Feola, G., & Steinberger, J. K. (2010). Considering the normative, systemic and
procedural dimensions in indicator-based sustainability assessments in agriculture.
Environmental Impact Assessment Review, 30(2), 71–81.
https://doi.org/10.1016/j.eiar.2009.06.002
150
Binta, B. A. A., & Barbier, B. (2015). Economic and Environmental Performances of Organic
Farming System Compared to Conventional Farming System: A Case Study of the
Horticulture Sector in the Niayes Region of Senegal. Procedia Environmental Sciences,
29(Agri), 17–19. https://doi.org/10.1016/j.proenv.2015.07.132
Bloor, M., Frankland, J., Thomas, M., & Robson, K. (2012). Focus Groups in Social Research. Focus
Groups in Social Research. https://doi.org/10.4135/9781849209175
Bon, H. De, Temple, L., Malézieux, É., Bendjebbar, P., Fouilleux, È., & Silvie, P. (2018). Organic
agriculture in Africa: A source of innovation for agricultural development.
Bosshard, A., Reinhard, B., & Taylor, S. (2009). IFOAM Guide to Biodiversity and Landscape
Quality in Organic Agriculture. Retrieved from
http://www.ecology.ch/BiodiversityGuide_Jul09_Preview.pdf
Bouagnimbeck Hervé. (2011). Organic Farming in Africa. In The World of Organic Agriculture.
Statistics and Emerging Trends Willer, H. and Kilcher (Ed.), (pp. 104–110). Bonn & Frick:
IFOAM & FIBL.
Broad, S. T., Lisson, S. N., & Mendham, N. J. (2009). Agronomic and gross margin analysis of an
insect pest suppressive broccoli cropping system. Agricultural Systems, 102(1–3), 41–47.
https://doi.org/10.1016/j.agsy.2009.06.007
Brundtland, H. G. (1987) “Our Common Future.” Report of the World Commission on Environment
and Development. Geneva, UN-Dokument A/42/427.
https://doi.org/10.1080/07488008808408783
Brzezina, N., Kopainsky, B., & Mathijs, E. (2016). Can organic farming reduce vulnerabilities and
enhance the resilience of the European food system? A critical assessment using system
dynamics structural thinking tools. Sustainability (Switzerland), 8(10), 32.
https://doi.org/10.3390/su8100971
Busch, L. (2012). Standards governing agricultural innovation. Where do we come from? Where
should we be going? In É. Coudel, H. Devautour, C.-T Soulard, G. Faure & B. Hubert, eds.
Renewing innovation systems in agriculture and food. How to go towards more sustainability?
pp. 37–56. Paris, Editions Quae.
Cavigelli, M. A., Teasdale, J. R., & Spargo, J. T. (2013). Increasing Crop Rotation Diversity
Improves Agronomic, Economic, and Environmental Performance of Organic Grain Cropping
Systems at the USDA-ARS Beltsville Farming Systems Project. Crop Management, 12(1), 1–
4. https://doi.org/10.1094/cm-2013-0429-02-ps
Chatzinikolaou, P., & Manos, B. (2012). Review of existing methodologies and tools for measuring
sustainability in rural areas. Department of Agricultural Economics, 1–19. Retrieved from
http://www.feem-project.net/belpasso_2012/files/studpapers/Paper_Chatzinikolaou.pdf
Chianu, J. N., Chianu, J. N., & Mairura, F. (2012). Mineral fertilizers in the farming systems of sub-
Saharan Africa. A review. Agronomy for Sustainable Development, 32(2), 545–566.
https://doi.org/10.1007/s13593-011-0050-0
Chiputwa, B., Qaim, M., & Spielman, D. J. (2014). RTG 1666 GlobalFood Food Standards,
Certification, and Poverty among Coffee Farmers in Uganda Food Standards, Certification,
and Poverty among Coffee Farmers in Uganda. EAAE 2014 Congress ‘Agri-Food and Rural
Innovations for Healthier Societies, 1–13. Retrieved from www.uni-goettingen.de/globalfood
151
Compagnone, C., Lamine, C., & Dupré, L. (2018). The production and circulation of agricultural
knowledge as interrogated by agro-ecology: of old and new. Revue d’Anthropologie Des
Connaissances, 12(2). https://doi.org/10.3917/rac.039.a
Connor, D. J. (2013). Organically grown crops do not a cropping system make and nor can organic
agriculture nearly feed the world. Field Crops Research, 144, 145–147.
https://doi.org/10.1016/j.fcr.2012.12.013
Conway, G., & Wilson, K. (2012). One Billion Hungry, can we feed the World? Cornell University.
New: Cornell University Press First. https://doi.org/10.1017/CBO9781107415324.004
Coteur, I., Marchand, F., Debruyne, L., Bijttebier, J., Triste, L. & Lauwers, L. (2014). Development
and evaluation of an on-demand sustainability tool in Flanders. In 11th European IFSA
symposium: Farming systems facing global challenges: Capacities and strategies, pp. 38–48.
International Farming Systems Association, Europe; Leibniz Centre for Agricultural
Landscape Research; Humboldt-Universität zu Berlin.
Coteur, I., Marchand, F., Debruyne, L., Dalemans, F., & Lauwers, L. (2016). A framework for
guiding sustainability assessment and on-farm strategic decision making. Environmental
Impact Assessment Review, 60, 16–23. https://doi.org/10.1016/j.eiar.2016.04.003
Coteur, I., Wustenberghs, H., Debruyne, L., Lauwers, L., & Marchand, F. (2020). How do current
sustainability assessment tools support farmers’ strategic decision making? Ecological
Indicators, 114(July 2019), 106298. https://doi.org/10.1016/j.ecolind.2020.106298
Creemers, S., Van Passel, S., Vigani, M., & Vlahos, G. (2019). Relationship between farmers’
perception of sustainability and future farming strategies: A commodity-level comparison.
AIMS Agriculture and Food, 4(3), 613–642. https://doi.org/10.3934/agrfood.2019.3.613
Crowder, D. W., & Reganold, J. P. (2015). Financial competitiveness of organic agriculture on a
global scale. Proceedings of the National Academy of Sciences of the United States of
America, 112(24), 7611–7616. https://doi.org/10.1073/pnas.1423674112
Dantsis, T., Loumou, A., Douma, C., Giourga, C., & Polychronaki, E. A. (2009). A methodological
approach to assess and compare the sustainability level of agricultural plant production systems.
Ecological Indicators, 10(2), 256–263. https://doi.org/10.1016/j.ecolind.2009.05.007
Darnhofer, I. (2005). Organic farming and rural development: Some evidence from Austria.
Sociologia Ruralis, 45(4), 308–323. https://doi.org/10.1111/j.1467-9523.2005.00307.x
De Bon H., Temple L., Malézieux É., Bendjebbar P., Fouilleux È., Silvie P., 2018. Organic
agriculture in Africa: a source of innovation for agricultural development. CIRAD,
Montpellier, Perspective 48. https://doi.org/10.19182/agritrop/00036
De Jager, A., Onduru, D., Van Wijk, M. S., Vlaming, J., & Gachini, G. N. (2001). Assessing
sustainability of low-external-input farm management systems with the nutrient monitoring
approach: A case study in Kenya. Agricultural Systems, 69(1–2), 99–118.
https://doi.org/10.1016/S0308-521X (01)00020-8
De Olde E. M., Oudshoorn, F. W., Sørensen, C. A. G., Bokkers, E. A. M., & De Boer, I. J. M. (2016).
Assessing sustainability at farm-level: Lessons learned from a comparison of tools in practice.
Ecological Indicators, 66(July), 391–404. https://doi.org/10.1016/j.ecolind.2016.01.047
De Ponti, T., Rijk, B., & Van Ittersum, M. K. (2012). The crop yield gap between organic and
conventional agriculture. Agricultural Systems, 108, 1–9.
152
https://doi.org/10.1016/j.agsy.2011.12.004
Delate, K., Duffy, M., Chase, C., Holste, A., Friedrich, H., & Wantate, N. (2003). An economic
comparison of organic and conventional grain crops in a long-term agroecological research
(LTAR) site in Iowa. American Journal of Alternative Agriculture, 18(2), 59–69.
https://doi.org/10.1079/AJAA200235
Dixon, J.A., Gulliver, A., Gibbon, D., & Hall, M. (2001). Farming Systems and Poverty Improving
Farmers' Livelihoods in a changing World. FAO and World Bank Rome, Italy
Dobermann A and Nelson R (2013) Opportunities and Solutions for Sustainable Food Production.
Sustainable Development Solutions Network Global Initiative of the United Nations.
Douthwaite B, Alvarez S, Cook S, Davies R, George P, Howell J, MacKay R, Rubiano J (2007a)
Participatory impact pathways analysis: a practical application of program theory in research
for development. Can J Program Eval 22(2):127–159
Douthwaite B, Schulz S, Olanrewaju AS, Ellis-Jones J (2007b) Impact pathway evaluation of an
integrated Striga hermonthica control project in Northern Nigeria. Agric Syst 92(1–3):201–
222. DOI: 10.1016/ j.agsy.2006.03.007
EAC. (2007). AID‐FOR‐TRADE CASE STORY: UNEP Aid for Trade Case Story: The East African
Organic Products Standard AID‐FOR‐TRADE: CASE STORY UNITED NATIONS
ENVIRONMENT PROGRAMME. Retrieved from
https://www.oecd.org/aidfortrade/47719232.pdf
Ehrlich, P. R. (2008). Key issues for attention from ecological economists. Environment and
Development Economics, 13(1), 1–20. https://doi.org/10.1017/S1355770X07004019
Elsaesser, M., Jilg, T., Herrmann, K., Boonen, J., Debruyne, L., Laidlaw, A.S., Aarts, F., 2015.
Quantifying sustainability of dairy farms with the DAIRYMAN sustainability index,
European Grassland Federation. Grassland Science in Europe, Wageningen, the Netherlands,
pp. 367-376
Elzen, B., Geels, F. W., Leeuwis, C., & Van Mierlo, B. (2011). Normative contestation in transitions
“in the making”: Animal welfare concerns and system innovation in pig husbandry. Research
Policy, 40(2), 263–275. https://doi.org/10.1016/j.respol.2010.09.018
EPOPA/Export Promotion of Organic Products from Africa (2007). Organic Exports – A Way to a
Better Life? Agro Eco BV, Bennekom and Grolink AB, Hoje. Available at
www.grolink.se/epopa/Publications/epopa-experience.htm
European Commission. (2013). Organic versus conventional farming, which performs better
financially ? Farm Economic Brief, (4), 1–10. Retrieved from
http://ec.europa.eu/agriculture/rica/pdf/FEB4_Organic_farming_final_web.pdf
Eyhorn, F., van den Berg, M., Decock, C., Maat, H., & Srivastava, A. (2018). Does organic farming
provide a viable alternative for smallholder rice farmers in India? Sustainability (Switzerland),
10(12), 1–15. https://doi.org/10.3390/su10124424
FAPDA, & FAO. (2015). Country Fact Sheet On Food And Agriculture Policy Trends Kenya. Rome
Italy. https://doi.org/http://www.fao.org/in-action/fapda/publications/country-fact-sheets/en/
153
FAO. (1988). Report of the FAO Council, 94th session. Rome FAO. (2007). Food Security District
Profiles. Nairobi: FAO.
FAO. (1990). Sustainable Agricultural Resources Development. Available at:
http://www.fao.org/nr/sustainability/sustainability-assessments-safa/en/
FAO. (1999). Agro-Ecological Zones, Farming Systems and Land Pressure in Africa and Asia.
Environmental Research Group Oxford Ltd and TALA Research Group, Department of
Zoology, University of Oxford, for the Animal Health Service of the Animal Production and
Health Division, FAO, Rome, Italy.
FAO. (2011a). Save and Grow: A policymaker’s guide to the sustainable intensification of
smallholder crop production. Rome Italy: FAO. https://doi.org/10.16309/j.cnki.issn.1007-
1776.2003.03.004
FAO. (2011b). Innovative policies and institutions to support agro-industries development. Rome.
FAO. (2012). Developing sustainable food value chains: guiding principles. FAO, 25(9), 51–55.
FAO. (2013a). SAFA Sustainability Assessment for Food and Agricultural Systems Guidelines:
Version 3.0. (FAO, Ed.). Rome: FAO.
FAO. (2013b). Sustainability Assessment of Food and Agricultural System: indicators. Food and
Agriculture Organization of the United Nations - Rome 2013, 271.
https://doi.org/10.2144/000113056
FAO. (2014a). Building a common vision for sustainable food and agriculture. Principles and
approaches. Rome.
FAO (2019). The State of the World’s Biodiversity for Food and Agriculture, J. Bélanger & D. Pilling
(eds.). FAO Commission on Genetic Resources for Food and Agriculture Assessments. Rome.
572 pp. Available at: http://www.fao.org/3/CA3129EN/CA3129EN.pdf.
FAO, & World Bank. (2001). Farming Systems and Poverty Farming Systems and Poverty. (M. Hall,
J. Dixon, A. Gulliver, & D. Gibbon, Eds.).
Fayet, L., & Vermeulen, W. J. V. (2014). Supporting Smallholders to Access Sustainable Supply
Chains: Lessons from the Indian Cotton Supply Chain. Sustainable Development, 22(5), 289–
310. https://doi.org/10.1002/sd.1540
Ferreira, V., Boyero, L., Calvo, C., Correa, F., Figueroa, R., Gonçalves, J. F., Goyenola G., Graça
Manuel A.S., Hepp Luiz U.,Kariuki S., López-Rodríguez A., Mazzeo N., M’Erimba C.,
Monroy S., Peil A., Pozo J., Rezende R., Teixeira-de-Mello, F. (2019). A Global Assessment
of the Effects of Eucalyptus Plantations on Stream Ecosystem Functioning. Ecosystems,
22(3), 629–642. https://doi.org/10.1007/s10021-018-0292-7
Fess, T. L., & Benedito, V. A. (2018a). Organic versus conventional cropping sustainability: A
comparative system analysis. Sustainability (Switzerland), 10(1).
https://doi.org/10.3390/su10010272
Firth, C. (2002). The use of gross and net margins in the economic analysis of organic farms.
Proceedings of the UK Organic Research 2002, (Table 1), 285–288. Retrieved from
http://orgprints.org/id/eprint/8290
Foley, J. A., Ramankutty, N., Brauman, K. A., Cassidy, E. S., Gerber, J. S., Johnston, M., Mueller N.
D., O’Connell C., Ray D K., West P. C., Balzer Christian, Bennett E. M., Carpenter S. R.,
154
Hill J., Monfreda C., Polasky S., Rockström J., Sheehan J., Siebert S., Tilman D., Zaks D. P.
M. (2011). Solutions for a cultivated planet. Nature, 478, 337. Retrieved from
http://dx.doi.org/10.1038/nature10452
Food and Agriculture Organization of the United Nations (FAO). Sustainability Assessment of Food
and Agriculture Systems (SAFA); FAO: Rome, Italy, (2014b). Available online:
http://www.Fao.Org/nr/sustainability/sustainability-assessments-safa/en/
Forster, D., Andres, C., Verma, R., Zundel, C., Messmer, M. M., & Mäder, P. (2013). Yield and
economic performance of organic and conventional cotton-based farming systems - Results
from a field trial in India. PLoS ONE, 8(12). https://doi.org/10.1371/journal.pone.0081039
Froehlich, A. G., Melo, A. S. S. A., & Sampaio, B. (2018). Comparing the Profitability of Organic
and Conventional Production in Family Farming: Empirical Evidence From Brazil. Ecological
Economics, 150(April), 307–314. https://doi.org/10.1016/j.ecolecon.2018.04.022
Gabriel, D., Sait, S. M., Kunin, W. E., & Benton, T. G. (2013). Food production vs. biodiversity:
Comparing organic and conventional agriculture. Journal of Applied Ecology, 50(2), 355–364.
https://doi.org/10.1111/1365-2664.12035
Garnett, T., Appleby, M.C., Balmford, A., Bateman, I.J., Benton, T.G., Bloomer, P., Burlingame, B.,
Dawkins, M., Dolan, L., Fraser, D., Herrero, M., Hoffmann, I., Smith, P., Thornton, P.K.,
Toulmin, C., Vermeulen, S.J. & Godfray, H.C.J. (2013). Sustainable intensification in
agriculture. Premises and policies. Science, 341(6141): 33–34.
Gasparatos, A. (2010). Embedded value systems in sustainability assessment tools and their
implications. Journal of Environmental Management 91(8): 1613–1622.
Gaviglio, A., Bertocchi, M., & Demartini, E. (2017). A Tool for the Sustainability Assessment of
Farms: Selection, Adaptation and Use of Indicators for an Italian Case Study. Resources, 6(4),
60. https://doi.org/10.3390/resources6040060
Getanjaly, V. L. R., Sharma, P., & Kushwaha, R. (2015). Beneficial insects and their value to
agriculture. Research Journal of Agriculture and Forestry Sciences, 3(5), 25–30. Retrieved
from www.isca.me
Girma, J., & Gardebroek, C. (2015). The impact of contracts on organic honey producers’ incomes
in southwestern Ethiopia. Forest Policy and Economics, 50, 259–268.
https://doi.org/10.1016/j.forpol.2014.08.001
Gerrard, C. L., Smith, L. G., Pearce, B., Padel, S., Hitchings, R., Measures, M., & Cooper, N. (2012).
Farming for Food and Water Security, Sustianble Agriculture Reviews 10.
https://doi.org/10.1007/978-94-007-4500-1_1
Godfray, H. C. J., Beddington, J. R., Crute, I. R., Haddad, L., Lawrence, D., Muir, J. F., Pretty J.,
Robinson S., Thomas S. M.,& Toulmin C. (2010). Food security: The challenge of the present.
Science, 327(5967), 812–818. https://doi.org/10.1016/j.geoforum.2018.02.030
GoK (2019). Government of Kenya. Agricultural Sector Transformation & Growth Strategy.
Towards Sustainable Agricultural Transformation & Food Security in Kenya - 2019-2019
Gomiero, T., Pimentel, D., & Paoletti, M. G. (2011). Environmental impact of different agricultural
management practices: Conventional vs. Organic agriculture. Critical Reviews in Plant
Sciences, 30(1–2), 95–124. https://doi.org/10.1080/07352689.2011.554355
155
González de Molina, M. (2013). Agroecology and Politics. How to get Sustainability? About the
Necessity for a Political Agroecology. Agroecology and Sustainable Food Systems, vol 37.
Pp. 45-59.
Gopinath, K. A., Saha, S., Mina, B. L., Pande, H., Kundu, S., & Gupta, H. S. (2008). Influence of
organic amendments on growth, yield and quality of wheat and on soil properties during
transition to organic production. Nutrient Cycling in Agroecosystems, 82(1), 51–60.
https://doi.org/10.1007/s10705-008-9168-0
Goswami, R., Saha, S., & Dasgupta, P. (2017). Sustainability assessment of smallholder farms in
developing countries. Agroecology and Sustainable Food Systems, 41(5), 546–569.
https://doi.org/10.1080/21683565.2017.1290730
Greene, W. H. (2003). Econometric Analysis (5th ed.). New York: Pearson Education, Inc., Upper
Saddle River, New Jersey, 07458.
Greer, G., & Hunt, L. (2011). Comparison of the productivity and profitability of organic and
conventional farms in the New Zealand sheep/beef and kiwifruit sectors. 18th International
Farm Managment Congress Methven, Canterbury, New Zealand, 111–121.
Grenz, J., Thalmann, C., Stampfli, A., Studer, C., & Häni, F. (2009). RISE – a method for assessing.
Rural Development News, 1, 5–9. Retrieved from http://www.jdb.uzh.ch/24610/
Grin, J., Rotmans, J. & Schot, J. W. (2010). Transitions to Sustainable Development. New Directions
in the Study of Long Term Transformative Change. New York, United States of America,
Routledge.
Gurbir S. Bhullar, David Bautze, Noah Adamtey, Laura Armengot, Harun Cicek, Eva Goldmann,
Amritbir Riar, Johanna Rüegg, Monika Schneider, Beate Huber (2021). What is the
contribution of organic agriculture to sustainable development? A synthesis of twelve years
(2007-2019) of the “long-term farming systems comparisons in the tropics (SysCom)”.
Research Institute of Organic Agriculture, Frick, Switzerland: https://systems-
comparison.fibl.org/results/reports.html.
Hainmueller, J. (2012). Entropy balancing for causal effects: A multivariate reweighting method to
produce balanced samples in observational studies. Political Analysis, 20(1), 25–46.
https://doi.org/10.1093/pan/mpr025
Hamblin, A. (1992). How do we know when agricultural systems are sustainable? In Environmental
Indicators for Sustainable Agriculture. Report on a national workshop, 28-29 November
1991, ed. A. Hamblin. Bureau of Rural Resources, Land and Water Resource Research and
Development Corporation, Grains Research Corporation, Canberra, Australia, p. 90.
Hampl, F. (2020). A statistical analysis of the financial performance of organic and conventional
farms in the Czech Republic with respect to their size. Agricultural Economics (Czech
Republic), 66(1), 1–9. https://doi.org/10.17221/78/2019-AGRICECON
Häni, F., Braga, F., Stämpfli, A., Keller, T., Fischer, M. & Porsche, H. (2003). RISE: A tool for
holistic sustainability assessment at the farm level. International Food and Agribusiness
Management Review, 6(4): 78-90.
Hanuš, L. (2004). Sustainability analysis of agricultural systems. Acta Universitatis Agriculturae et
Silviculturae Mendelianae Brunensis, 52(1), 103–112.
https://doi.org/10.11118/actaun200452010103
156
Harvey, N., & Holmes, C. A. (2012). Nominal group technique: An effective method for obtaining
group consensus. International Journal of Nursing Practice, 18(2), 188–194.
https://doi.org/10.1111/j.1440-172X.2012.02017.x
Hayati, D., Ranjbar, Z., & Karami, E. (2010). Biodiversity, Biofuels, Agroforestry and Conservation
Agriculture. Biodiversity, Biofuels, Agroforestry, and Conservation Agriculture, 5, 317–358.
https://doi.org/10.1007/978-90-481-9513-8
Hayden, J., & Buck, D. (2012). Doing community supported agriculture: Tactile space, affect and
effects of membership. Geoforum, 43(2), 332–341.
https://doi.org/10.1016/j.geoforum.2011.08.003
Hazell, P., & Wood, S. (2008). Drivers of change in global agriculture. Philosophical Transactions
of the Royal Society B: Biological Sciences, 363(1491), 495–515.
https://doi.org/10.1098/rstb.2007.2166
Hennink Monique M. (2014). Focus group discussions: understanding Qualitative Research.
Oxford USA: Oxford university Press 2014.
Herath, C. S., & Wijekoon, R. (2013). Study on attitudes and perceptions of organic and non-
organic coconut growers towards organic coconut farming. IDESIA INVESTIGaCIONES,
31(2), 5–14. https://doi.org/10.1007/BF01474163
Heckman, J. J. (2000). Causal Parameters and Policy Analysis in Economics: A Twentieth Century
Retrospective. The Quarterly Journal of Economics, (February), 45–97.
Hennink Monique M. (2014). Focus group discussions: understanding Qualitative Research, 222.
Herath, C. S., & Wijekoon, R. (2013). Study on attitudes and perceptions of organic and non-organic
coconut growers towards organic coconut farming. IDESIA INVESTIGACIONES, 31(2), 5–
14. https://doi.org/10.1007/BF01474163
Ho, D. E., Imai, K., King, G., & Stuart, E. A. (2007). Matching as nonparametric preprocessing for
reducing model dependence in parametric causal inference. Political Analysis, 15(3), 199–
236. https://doi.org/10.1093/pan/mpl013
Hopkins, Alan and Morris, Carol (2002) Multi-functional roles of grassland in organic farming
systems. In: Powell, Jane and et al., (Eds.) Proceedings of the UK Organic Research 2002
Conference, Organic Centre Wales, Institute of Rural Studies, University of Wales Aberystwyth,
pp. 75-80. Accessed at http://orgprints.org/8287.
Hutcheson, G. D. (2011). Ordinary Least-Squares Regression. The SAGE Dictionary of Quantitative
Management Research, 224–228. https://doi.org/10.4135/9781446251119.n67
IBM SPSS. (2014). IBM SPSS Advanced Statistics 22. Local License for Version 22.0, 118.
IFOAM. (2012). The IFOAM norms for organic production and processing Version 2012. IFOAM,
18(13), 1–134. https://doi.org/10.1017/S1368980015002529
IFOAM. (2018). Productivity and Profitability of Organic Farming Systems in East Africa, (August).
Isaac, M. E., Dawoe, E., & Sieciechowicz, K. (2009). Assessing local knowledge use in agroforestry
management with cognitive maps. Environmental Management, 43(6), 1321–1329.
https://doi.org/10.1007/s00267-008-9201-8
157
Israel, G. D. (1992). Determination of sample size (No. Fact Sheet PEOD-6), a series of the Program
Evaluation and Organizational Development, Florida Cooperative Extension Service,
Institute of Food and Agricultural Sciences, University of Florida. Florida.
Jaetzold, R., Schmidt, H., Hornetz, B. and, & Shisanya, C. (2011a). Farm Management Handbook of
Kenya. Vol II – Natural conditions and farm management information 2nd Edition Part C East
Kenya. Subpart C1. Eastern Province Machakos & Makueni County (2nd ed., Vol. II). Nairobi
Kenya: Ministry of Agriculture, German Agricultural Team.
Jaetzold, R., Schmidt, H., Hornetz, B., & Shisanya, C. (2011b). Farm Management Handbook of
Kenya. Vol II – Natural conditions and farm management information 2nd Edition Part B
Central Kenya. Subpart B2. Central Province: Murang’a County (2nd ed., Vol. II). Nairobi
Kenya: Ministry of Agriculture, German Agricultural Team.
Jaetzold, R., Schmidt, H., Hornetz, B., & Shisanya, C. (2011c). Farm Management Handbook of
Kenya. Vol II – Natural conditions and farm management information 2nd Edition Part B
Central Kenya. Subpart B2. Central Province: Kirinyaga County - Kenya (Vol. II). Nairobi
Kenya: Ministry of Agriculture, German Agricultural Team.
Jassogne, L., van Asten, P. J. A., Laderach, P., Craparo, A., Wanyama, I., Nibasumba, A., & Bielders,
C. (2014). Climate-smart perennial systems, 12–16.
Jha, S., Kaechele, H., Lana, M., Amjath-Babu, T. S., & Sieber, S. (2020). Exploring farmers’
perceptions of agricultural technologies: A case study from Tanzania. Sustainability
(Switzerland), 12(3), 1–21. https://doi.org/10.3390/su12030998
Jouzi, Z., Azadi, H., Taheri, F., Zarafshani, K., Gebrehiwot, K., Van Passel, S., & Lebailly, P. (2017).
Organic Farming and Small-Scale Farmers: Main Opportunities and Challenges. Ecological
Economics, 132, 144–154. https://doi.org/10.1016/j.ecolecon.2016.10.016
Kamau, J. W., Stellmacher, T., Biber-Freudenberger, L., & Borgemeister, C. (2018). Organic and
conventional agriculture in Kenya: A typology of smallholder farms in Kajiado and Murang’a
counties. Journal of Rural Studies, 57(December 2017), 171–185.
https://doi.org/10.1016/j.jrurstud.2017.12.014
Kannan, P., Saravanan, A., Krishnakumar, S., & Natarajan, S. K. (2005). Biological Properties of
Soil as Influenced by Different Organic Manures. Research Journal of Agriculture and
Biological Sciences, 1(2), 181–183.
KCIDP (2017) Kirinyaga County Integrated Development Plan 2018-2022 County government of
Kirinyaga
Kerselaers, E., Cock, L. De, Lauwers, L., & Huylenbroeck, G. Van. (2007). Modeling farm-level
economic potential for conversion to organic farming, Agricultural Systems 94, 671–682.
http://doi.org/10.1016/j.agsy.2007.02.007
Khoy, R., Nansek, T., & Chomei, Y. (2017). Farmers’ Perceptions of Organic Rice Farming in
Cambodia: Opportunities and Challenges. International Journal of Humanities and Social
Science, 7(4), 92–103. Retrieved from
http://www.ijhssnet.com/journals/Vol_7_No_4_April_2017/9.pdf
Kings, D., & Ilbery, B. (2012). Farmers’ Attitudes towards Organic and Conventional Agriculture: A
Behavioural Perspective. Intech, i, 13. https://doi.org/10.1016/j.colsurfa.2011.12.014
158
Kirchmann, H., Kätterer, T., Bergström, L., Börjesson, G., & Bolinder, M. A. (2016). Flaws and
criteria for design and evaluation of comparative organic and conventional cropping systems.
Field Crops Research, 186, 99–106. https://doi.org/10.1016/j.fcr.2015.11.006
Kledal, P. R., Oyiera, H. F., Njoroge, J. W. and, Kiarii, E. (2009). Organic Food and Farming in
Kenya. The World of Organic Agriculture - Statistics and Emerging Trends 2009, (May),
127–132. https://doi.org/10.1063/1.2653669
Kleemann, L. (2016). Organic Pineapple Farming in Ghana - A Good Choice for Smallholders? The
Journal of Developing Areas, 50(3), 109–130. https://doi.org/10.1353/jda.2016.0096
KNBS. (2015a). County Statistical Abstract 2015 Machakos County, Nairobi Kenya
KNBS. (2015b). County statistical abstract Kirinyaga County 2015, Nairobi Kenya.
KNBS. (2015c). County Statistical Abstract Murang’a County 2015. Nairobi Kenya. Retrieved from
https://www.knbs.or.ke/?page_id=3142&wpdmc=county-statistical-abstracts
KNBS. (2019a). Kenya Population and Housing Census Volume 1: Population by County and Sub-
County. 2019 Kenya Population and Housing Census (Vol. I). Retrieved from
https://www.knbs.or.ke/?wpdmpro=2019-kenya-population-and-housing-census-volume-i-
population-by-county-and-sub-county
KNBS. (2019b). Economic Survey 2019. Nairobi Kenya: Kenya National Bureau of Statistics.
https://doi.org/10.16309/j.cnki.issn.1007-1776.2003.03.004
KNBS. (2020). Economic survey 2020. Nairobi Kenya: Kenya National Bureau of Statistics.
https://doi.org/10.4324/9781315016702
KOAS 2018 KENYA ORGANIC AGRICULTURE SECTOR strategy plan 2019-2023 Nairobi
Kenya
KOAN 2019 Kenya Organic Agriculture Network institutional profile Nairobi Kenya
KOAN 2019 ECOLOGICAL ORGANIC AGRICULTURE DIRECTORY 2018 Kenya Organic
Agriculture Network www.koan.co.ke
KS ARS/AES 01:2014 The Agriculture-Sustainability and eco-labelling-Requirements.
https://webstore.kebs.org/index.php?route=product/product&product_id=14594 accessed on
2nd July 2021
KS EAS 456:2019 Organic production standard
http://onlinecatalogue.kebs.org/webquery.dll?v1=pbMarc&v4=0&v5=5A&v8=380648&v9=
4&v10=N&v13=4A&v20=4&v22=4A@KS%20145:1983&v23=0&v25=ORGANIC%20an
d%20%20FARMING%25&v27=15862&v29=5A&v34=5&v35={]0[}{]0[}{]0[}{]0[}&v40
=380646&v46=380648 accessed on 2nd July 2021
Krause, J., & Machek, O. (2018). A comparative analysis of organic and conventional farmers in
the czech republic. Agricultural Economics (Czech Republic), 64(1), 1–8.
https://doi.org/10.17221/161/2016-AGRICECON
Krueger Richard A. and Casey Mary Anne. (2015). Focus Groups: A practical Guide for applied
research. Sage, 560.
159
Laepple, D., & Donnellan, T. (2008). Farmer attitudes towards converting to organic farming.
Teagasc Organic Production Research Conference Proceedings, 114–121. Retrieved from
http://orgprints.org/18624/
Lara A., Little C., Urrutia R., McPhee J., Álvarez-Garretón C., Oyarzún C., Soto D., Donoso p.,
Nahuelhual L., Pino M., Arismendi, I. (2009). Assessment of ecosystem services as an
opportunity for the conservation and management of native forests in Chile. Forest Ecology
and Management, 258(4), 415–424. https://doi.org/10.1016/j.foreco.2009.01.004
Latruffe L., Diazabakana A., Bockstaller C., Desjeux Y., Finn J., Kelly E., Uthes S. (2016).
Measurement of sustainability in agriculture: a review of indicators. Studies in Agricultural
Economics, 118(3), 123–130. https://doi.org/10.7896/j.1624
Le Rohellec, C., & Mouchet, C. (2008). Efficacité économique de systèmes laitiers herbagers en
agriculture durable (RAD): Une comparaison avec le RICA. Fourrages, 2008(193), 107–113.
Lee, H., & Fowler, S. (2002). Methodologies for the comparison of organic and conventional farming
systems. International Journal of Agricultural Sustainability, 3(2), 122–129.
https://doi.org/10.1080/14735903.2005.9684750
Lee, H., and Fowler, S. (2002). A critique of methodologies for the comparison of organic and
conventional farming systems. Retrieved July 20, 2011, from Http://orgprints.org/8234:
www.orgprints.org
Lee, J., Hwang, S., Ha, I., Min, B., Hwang, H., & Lee, S. (2015). Comparison of bulb and leaf quality,
and antioxidant compounds of intermediate-day onion from organic and conventional
systems. Horticulture Environment and Biotechnology, 56(4), 427–436.
https://doi.org/10.1007/s13580-015-1036-7
Levin, K., Cashore, B., Bernstein, S., & Auld, G. (2012). Overcoming the tragedy of super wicked
problems: Constraining our future selves to ameliorate global climate change. Policy Sciences,
45(2), 123–152. https://doi.org/10.1007/s11077-012-9151-0
Li, G. D., Singh, R. P., Brennan, J. P., & Helyar, K. R. (2010). A financial analysis of lime application
in a long-term agronomic experiment on the south-western slopes of New South Wales. Crop
and Pasture Science, 61(1), 12–23. https://doi.org/10.1071/CP09103
Li, X. (2014). The making of organic agriculture in China. Boundaries, standards, and controversies.
United States of America, Michigan State University. (Ph.D. thesis)
López-Ridaura, S., Masera, O. & Astier, M. (2002). Evaluating the sustainability of complex socio-
environmental systems. The MESMIS framework. Ecological Indicators 2(1): 135–148.
Lu, H. ling, Chang, Y. H., & Wu, B. Y. (2020). The compare organic farm and conventional farm
to improve sustainable agriculture, ecosystems, and environment. Organic Agriculture, (91).
https://doi.org/10.1007/s13165-020-00278-3
Luttikholt, L. W. M. (2007). Principles of organic agriculture as formulated by the International
Federation of Organic Agriculture Movements. NJAS - Wageningen Journal of Life Sciences,
54(4), 347–360. https://doi.org/10.1016/S1573-5214 (07)80008-X
Majewski, E. (2013). Measuring and Modelling Farm Level Sustainability. Visegrad Journal on
Bioeconomy and Sustainable Development, 2(1), 2–10. https://doi.org/10.2478/vjbsd-2013-
0001
160
Malcolm, B., Makeham, J., & Wright, V. (2005). The Farming Game: Agricultural Management and
Marketing. (B. Malcolm, J. Makeham, & V. Wright, Eds.) (2nd ed.). Cambridge UK:
Cambridge University Press. Retrieved from http://repositorio.unan.edu.ni/2986/1/5624.pdf
Maltchik, L., Stenert, C., & Batzer, D. P. (2017). Can rice field management practices contribute to
the conservation of species from natural wetlands? Lessons from Brazil. Basic and Applied
Ecology, 18, 50–56. https://doi.org/10.1016/j.baae.2016.10.002
Marchand, F., Debruyne, L., Triste, L., Gerrard, C., Padel, S., & Lauwers, L. (2014). Key
characteristics for tool choice in indicator-based sustainability assessment at farm level.
Ecology and Society, 19(3). https://doi.org/10.5751/ES-06876-190346
Muzari, W., Gatsi, W., & Muvhunzi, S. (2012). The Impacts of Technology Adoption on
Smallholder Agricultural Productivity in Sub-Saharan Africa: A Review. Journal of
Sustainable Development, 5(8), 69–77. https://doi.org/10.5539/jsd.v5n8p69
MCIDP (2017) Machakos County Integrated Development Plan 2018-2022 County government of
Machakos
MCIDP (2017b) Murang’a County Integrated Development Plan 2018-2022 County government of
Murang’a
Meemken, E.-M., & Qaim, M. (2018). Organic Agriculture, Food Security, and the Environment.
Annual Review of Resource Economics, 10(1), 39–63. https://doi.org/10.1146/annurev-
resource-100517-023252
Mendoza, T. C. (2004). Evaluating the benefits of organic farming in rice agroecosystems in the
Philippines. Journal of Sustainable Agriculture, 24(2), 93–115.
https://doi.org/10.1300/J064v24n02
Meul, M., Passel, S. Van, Nevens, F., Dessein, J., Rogge, E., Mulier, A., & Hauwermeiren, A. Van.
(2008). MOTIFS: A monitoring tool for integrated farm sustainability. Agronomy for
Sustainable Development, 28(2), 321–332. https://doi.org/10.1051/agro:2008001
Milliken, G. A., & Johnson, D. E. (2009). Analysis of Messy Data Volume 1 Designed Experiments
(2nd Editio). Broken Sound Parkway NW: CRC Press Taylor & Francis Group.
Mirko, D. M., Olsen, K. H., Dong, Y., Pedersen, M. B., & Hauschild, M. Z. (2019). Sustainable
development impacts of nationally determined contributions: assessing the case of mini-grids
in Kenya. Climate Policy, 0(0), 1–17. https://doi.org/10.1080/14693062.2019.1644987
MoALF-Kenya. (2015). Economic Review of Agriculture (ERA) 2015 (Vol. 20). Nairobi Kenya:
Central Planning and Project Monitoring Unit Ministry of Agriculture Livestock and
Fisheries. https://doi.org/10.5089/9781513543284.002
Mohamad, R. S., Verrastro, V., Cardone, G., Bteich, M. R., Favia, M., Moretti, M., & Roma, R.
(2014). Optimization of organic and conventional olive agricultural practices from a Life
Cycle Assessment and Life Cycle Costing perspectives. Journal of Cleaner Production, 70,
78–89. https://doi.org/10.1016/j.jclepro.2014.02.033
Morris, J. B., V. Tassone, R. De Groot, M. Camilleri, and S. Moncada. (2011). A Framework for
Participatory Impact Assessment: involving stakeholders in European policymaking, a case
study of land-use change in Malta. Ecology and Society 16(1): 12. [online] URL:
http://www.ecologyandsociety.org/vol16/iss1/art12/
161
Morris, M., Kelly, V. A., Kopicki, R. J., & Byerlee, D. (2007). Fertilizer Use in African Agriculture.
Lessons Learned and Good Practice Guidelines. Experimental Agriculture (Vol. 44).
https://doi.org/10.1017/S0014479707005777
Mueller, N. D., Gerber, J. S., Johnston, M., Ray, D. K., Ramankutty, N., & Foley, J. A. (2012). Closing yield
gaps through nutrient and water management. Nature, 490(7419), 254–257.
https://doi.org/10.1038/nature11420
Mugivhisa, L. L., Olowoyo, J. O., & Mzimba, D. (2017). Perceptions on organic farming and selected
organic fertilizers by subsistence farmers in Ga-Rankuwa, Pretoria, South Africa. African
Journal of Science, Technology, Innovation and Development, 9(1), 85–91.
https://doi.org/10.1080/20421338.2016.1269459
Müller, C., Elliott, J., Pugh, T. A. M., Ruane, A. C., Ciais, P., Balkovic, J., Deryng, D., Folberth, C.,
Izaurralde C. R., Jones C. D., Khabarov N., Lawrence P., Liu W., Reddy A. D., Schmid E.
and Wang X. (2018). Global patterns of crop yield stability under additional nutrient and water
inputs. PLoS ONE, 13(6), 1–14. https://doi.org/10.1371/journal.pone.0198748
Mutisya, E., & Yarime, M. (2014). Moving towards urban sustainability in Kenya: A framework for
integration of environmental, economic, social and governance dimensions. Sustainability
Science, 9(2), 205–215. https://doi.org/10.1007/s11625-013-0223-7
Mwangi, M., & Kariuki, S. (2015). Factors Determining Adoption of New Agricultural Technology
by Smallholder Farmers in Developing Countries. Issn, 6(5), 2222–1700. Retrieved from
www.iiste.org
Mwaura, F. (2007). Organic agriculture in Kenya: An integrated assessment for policy advocacy.
Geneva: UNEP-UNCTAD.
Mwirigi, J. W., Makenzi, P. M., & Ochola, W. O. (2009). Socio-economic constraints to adoption
and sustainability of biogas technology by farmers in Nakuru Districts, Kenya. Energy for
Sustainable Development, 13(2), 106–115. https://doi.org/10.1016/j.esd.2009.05.002
Nautiyal, S. (2011). Can conservation and development interventions in the Indian Central
Himalaya ensure environmental sustainability? A socioecological evaluation. Sustainability
Science, 6(2), 151–167. https://doi.org/10.1007/s11625-011-0126-4
Ndukhu, O., Onwonga, N., Wahome, G., Kironchi, G., & Jensen, H. (2016). Assessment of Organic
Farmers’ Knowledge and Adaptation Strategies to Climate Change and Variability in Central
Kenya. British Journal of Applied Science & Technology, 17(6), 1–22.
https://doi.org/10.9734/bjast/2016/16270
Ndungu, S., Macharia, I., Kahuthia, R., & Wahome, R. (2013). Impact of Organic Vegetable
Production System in Kiambu and Kajiado Counties of Kenya. Journal of Environmental
Science and Engineering, A2(4), 256–266.
Nemes, N. (2009). Comparative Analysis of Organic and Non-organic Farming Systems: A critical
Assessment of Farm Profitability. Food and Agriculture Organization, (June), 1–33.
Ngungiri R. (2017). Organic farming in Kenya: Promising growth and a bright future in Willer, Helga
and Jilia Lemoud (Eds) 2017, The World of Organic Agriculture: Statistics and Emerging
Trends 2018 Research Institute of Organic Agriculture FiBL- Frick and IFOAM Organic
International Bonn pg 167-168.
162
Nzila, C., Dewulf, J., Spanjers, H., Tuigong, D., Kiriamiti, H., & van Langenhove, H. (2012). Multi
criteria sustainability assessment of biogas production in Kenya. Applied Energy, 93, 496–
506. https://doi.org/10.1016/j.apenergy.2011.12.020
Obayelu, A. E., Ajayi, O. D., Oluwalana, E. O. A., & O, O. O. (2017). What Does Literature Say
about the Determinants jig of Adoption of Agricultural Technologies by Smallholders
Farmers? Agricultural Research & Technology: Open Access Journal, 6(1).
https://doi.org/10.19080/artoaj.2017.06.555676
Oberč, B.P. & Arroyo Schnell, A. (2020). Approaches to sustainable agriculture. Exploring the
pathways towards the future of farming. Brussels, Belgium: IUCN EURO. DOI:
https://doi.org/10.2305/IUCN.CH.2020.07.en
Ochola, D., Jogo, W., Ocimati, W., Rietveld, A., Tinzaara, W., Karamura, D. A., & Karamura, E. B.
(2013). Farmers’ awareness and perceived benefits of agro-ecological intensification practices
in banana systems in Uganda. African Journal of Biotechnology, 12(29), 4603–4613.
https://doi.org/10.5897/ajb12.2868
Odhiambo, W., Nyangito, H., & Nzuma, J. (2004). Source and Determinant of Agricultural Growth
and Productivity in Kenya, (34), 67.
OECD. (2008). Environmental performance of agriculture at a glance. Environmental Performance
of Agriculture at a Glance (Vol. 9789264046). https://doi.org/10.1787/9789264046788-en
OECD. (2001). Environmental indicators for agriculture: Methods and Results. Paris.
Offermann, F., & Nieberg, H. (2000). Profitability of organic farming in Europe, (November).
Oloo J.E.O. (2015). Food Safety and Quality Management in Kenya: An overview of the roles played
by various stakeholders. African Journal of Food Agriculture, Nutrition and Development,
10(11), 4379–4397. https://doi.org/10.1007/978-3-319-09650-6
Olsen, J. (2019). The Nominal Group Technique (NGT) as a Tool for Facilitating Pan-Disability
Focus Groups and as a New Method for Quantifying Changes in Qualitative Data. International
Journal of Qualitative Methods, 18, 1–10. https://doi.org/10.1177/1609406919866049
Onduru, D. D., De Jager, A., Hiller, S., & Van den Bosch, R. (2012). Sustainability of smallholder
tea production in developing countries : Learning experiences from farmer field schools in
Kenya. International Journal of Development and Sustainability, 1(3), 1–29.
Ostapenko, R., Herasymenko, Y., Nitsenko, V., Koliadenko, S., Balezentis, T., & Streimikiene, D.
(2020). Analysis of production and sales of organic products in ukrainian agricultural
enterprises. Sustainability (Switzerland), 12(8), 1–15. https://doi.org/10.3390/SU12083416
Oudtanivanh, O., Limnirankul, B., & Kramol, P. (2018). Farmers’ knowledge and perceptions of
sustainable soil conservation practices in Paklay district, Sayabouly province, Lao PDR.
Kasetsart Journal of Social Sciences, 40(3), 650–656.
https://doi.org/10.1016/j.kjss.2018.07.006
Ototo, G., & Vlosky, R. P. (2018). Overview of the forest sector in Kenya. Forest Products Journal,
68(1), 6–14. https://doi.org/10.13073/0015-7473.68.1.4
Oyedele, G. T., Owolabi, K. E., & Okunlola, J. O. (2018). Small – Scale Farmers Perception on
Organic Farming Status in Ondo State , Nigeria. American Journal of Agriculture and
Forestry, 6(6), 186–190. https://doi.org/10.11648/j.ajaf.20180606.15
163
Panneerselvam, P., Halberg, N., Vaarst, M., & Hermansen, J. E. (2012). Indian farmers’ experience
with and perceptions of organic farming. Renewable Agriculture and Food Systems, 27(2),
157–169. https://doi.org/10.1017/S1742170511000238
Patidar, S., & Patidar, H. (2015). A Study of Perception of Farmers towards Organic Farming.
International Journal of Application or Innovation in Engineering and Management
(IJAIEM), 4(3), 269–277. Retrieved from www.ilaiem.org
Perez, C., Jones, E. M., Kristjanson, P., Cramer, L., Thornton, P. K., Förch, W., & Barahona, C.
(2015). How resilient are farming households and communities to a changing climate in
Africa? A gender-based perspective. Global Environmental Change, 34, 95–107.
https://doi.org/10.1016/j.gloenvcha.2015.06.003
Pervanchon, F., Bockstaller, C., Amiaud, B., Peigné, J., Bernard, P., Vertès, F., Fiorelli, J., &
Plantureux, S. (2005). A novel indicator of environmental risks due to nitrogen management
on grasslands. Agriculture, Ecosystems & Environment, 105, 1-16.
Pimentel, D., Hepperly, P., Hanson, J., Douds, D., & Seidel, R. (2010). Environment, Energetic and
Economic Comparisons of Organic and Conventional Farming Systems. BioScience, 55(7),
573–582.
Pinthukas, N. (2015). Farmers’ Perception and Adaptation in Organic Vegetable Production for
Sustainable Livelihood in Chiang Mai Province. Agriculture and Agricultural Science
Procedia, 5, 46–51. https://doi.org/10.1016/j.aaspro.2015.08.007
Pollesch, N., & Dale, V. H. (2015). Applications of aggregation theory to sustainability assessment.
Ecological Economics, 114, 117–127. https://doi.org/10.1016/j.ecolecon.2015.03.011
Ponisio, L. C., M’Gonigle, L. K., Mace, K. C., Palomino, J., de Valpine, P., & Kremen, C. (2014).
Diversification practices reduce organic to conventional yield gap. Proceedings of the Royal
Society B: Biological Sciences, 282(1799), 20141396–20141396.
https://doi.org/10.1098/rspb.2014.1396
Pope, J., Annandale, D. & Morrison-Saunders, A. (2004). Conceptualizing sustainability assessment.
Environmental Impact Assessment Review 24(6): 595–616.
Pope, J., Morrison-Saunders, A., (2013). Pluralism in practice. In: Bond, A.J., Morrison- Saunders,
A., Howitt, R. (Eds.), Sustainability Assessment: Pluralism, Practice, and Progress.
Routledge, pp. 100–114
Potter, M., Gordon, S., & Hamer, P. (2004). The Nominal Group Technique: A useful consensus
methodology in physiotherapy research. New Zealand Journal of Physiotherapy, 32(January
2004), 126–130.
Pottiez, E., Lescoat, P., & Bouvare, I. (2012). AVIBIO: a method to assess the sustainability of the
organic poultry industry. Producing and Reproducing Farming Systems. New Modes of
Organisation for Sustainable Food Systems of Tomorrow. 10th European IFSA Symposium,
Aarhus, Denmark, 1-4 July 2012. Retrieved from
http://search.ebscohost.com/login.aspx?direct=true&db=lah&AN=20133410280&site=ehost
-
live%5Cnhttp://www.cabi.org/cabdirect/showpdf.aspx?PAN=http://www.cabi.org/cabdirect/
showpdf.aspx?PAN=20133410280%5Cnhttp://ifsa.boku.ac.at/cms/index.php?id=ifsa2012
164
Power, A. G. (2010). Ecosystem services and agriculture: tradeoffs and synergies. Philosophical
Transactions of the Royal Society B 365:2959-2971.
http://dx.doi.org/10.1098/rstb.2010.0143
Pretty, J., & Bharucha, Z. P. (2014). Sustainable intensification in agricultural systems. Annals of
Botany, 114(8), 1571–1596. https://doi.org/10.1093/aob/mcu205
Prihtanti, T. M. (2016). Farmer Group as Social Determinant of Farmer’s Perceptions on Organic
Farming Concepts and Practice. RA Journal of Applied Research, 2(02), 407–415.
https://doi.org/10.18535/rajar/v2i2.03
Qiao, Y., Halberg, N., Vaheesan, S., & Scott, S. (2016). Assessing the social and economic benefits
of organic and fair trade tea production for small-scale farmers in Asia: A comparative case
study of China and Sri Lanka. Renewable Agriculture and Food Systems, 31(3), 246–257.
https://doi.org/10.1017/S1742170515000162
Ramesh, P., Panwar, N. R., Singh, A. ., Ramana, S., Yadav, S. K., Shrivastava, R., & Rao, A. S.
(2010). Status of organic farming in India. Current Science, 98(9), 1190–1194.
Rao, N.H. & Rogers, P.P. (2006). Assessment of agricultural sustainability. Current Science 91(4):
439–448.
Rasul, G. & Thapa, G.B. (2004). Sustainability of ecological and conventional agricultural systems
in Bangladesh: An assessment based on environmental, economic and social perspectives.
Agricultural Systems 79(3): 327–351.
Reganold, J. P., & Wachter, J. M. (2016). Organic agriculture in the twenty-first century. Nature
Plants, 2(February), 15221. https://doi.org/10.1038/nplants.2015.221
Republic of Kenya. (2012). Water Act, 245. Kenya: Law society of Kenya
Republic of Kenya (2012b). Agriculture Act (Cap 318), Government Printers, Nairobi Kenya: Law
society of Kenya. Retrieved from www.kenyalaw.org
Republic of Kenya. (2016). The Water Act 2016, Kenya: Law society of Kenya.
Rigby, D. & Caceres, D. (2001). Organic farming and the sustainability of agricultural systems.
Agricultural Systems, 68, 21–40
Rhoades, R. E., & Booth, R. H. (1982). Farmer-back-to-farmer: A model for generating acceptable
agricultural technology. Agricultural Administration, 11(2), 127–137.
https://doi.org/10.1016/0309-586X (82)90056-5
Rockstrom, J., W. Steffen, K. Noone, A. Persson, F. S. Chapin, III, E. Lambin, T. M. Lenton, M.
Scheffer, C. Folke, H. Schellnhuber, B. Nykvist, C. A. De Wit, T. Hughes, S. van der Leeuw,
H. Rodhe, S. Sorlin, P. K. Snyder, R. Costanza, U. Svedin, M. Falkenmark, L. Karlberg, R.
W. Corell, V. J. Fabry, J. Hansen, B. Walker, D. Liverman, K. Richardson, P. Crutzen, and J.
Foley. (2009). Planetary boundaries: exploring the safe operating space for humanity. Ecology
and Society 14(2): 32. [online] URL:http://www.ecologyandsociety.org/vol14/iss2/art32/.
Rodrigues, D. B., Dalmarco, D. de A. S., Aoqui, C., & Marinho, B. de L. (2016). The meaning
of the organic certification label for the consumer: a cluster analysis. REGE - Revista de
Gestão, 36, 1–11. https://doi.org/10.1016/j.rege.2016.08.001
Rodrigues, G. S., Rodrigues, I. A., Buschinelli, C. C. de A., & de Barros, I. (2010). Integrated farm
sustainability assessment for the environmental management of rural activities.
165
Environmental Impact Assessment Review, 30(4), 229–239.
https://doi.org/10.1016/j.eiar.2009.10.002
Rodríguez-Bermúdez, R., Miranda, M., Orjales, I., Rey-Crespo, F., Muñoz, N., & López-Alonso, M.
(2017). Holstein-friesian milk performance in organic farming in north Spain: Comparison
with other systems and breeds. Spanish Journal of Agricultural Research, 15(1), 1–10.
https://doi.org/10.5424/sjar/2017151-10037
Röös, E., Fischer, K., Tidåker, P., & Nordström Källström, H. (2019). How well is farmers’ social
situation captured by sustainability assessment tools? A Swedish case study. International
Journal of Sustainable Development and World Ecology, 26(3), 268–281.
https://doi.org/10.1080/13504509.2018.1560371
Rubin, D. B. (2006). Macthing Sampling for casual Effects. Cambridge: Cambridge University Press.
Schader, C.; Baumgart, L.; Landert, J.; Muller, A.; Ssebunya, B.; Blockeel, J.; Weisshaidinger, R.;
Petrasek, R.; Mészáros, D.; Padel, S.; Gerrard, C.; Smith, L.; Lindenthal, T.; Niggli, U.;
Stolze, M. (2016). Using the Sustainability Monitoring and Assessment Routine (SMART)
for the systematic analysis of trade-offs and synergies between sustainability dimensions and
themes at farm level. Sustainability (Switzerland), 8(3). https://doi.org/10.3390/su8030274
Schader, C., Grenz, J., Meier, M. S., & Stolze, M. (2014). Scope and precision of sustainability
assessment approaches to food systems. Ecology and Society, 19(3).
https://doi.org/10.5751/ES-06866-190342
Schensul J. J., & LeCompte. M. D. (2013). Essential Ethnographic Methods: A Mixed Method
approach (2nd ed.) Lanham Maryland USA Aita Mira Press.
Schrama, M., de Haan, J. J., Kroonen, M., Verstegen, H., & Van der Putten, W. H. (2018). Crop yield
gap and stability in organic and conventional farming systems. Agriculture, Ecosystems and
Environment, 256(December 2017), 123–130. https://doi.org/10.1016/j.agee.2017.12.023
Schönhart, M., Schauppenlehner, T., Schmid, E., & Muhar, A. (2011). Integration of bio-physical
and economic models to analyze management intensity and landscape structure effects at farm
and landscape level. Agricultural Systems, 104(2), 122–134.
https://doi.org/10.1016/j.agsy.2010.03.014
Sekhon, J. S. (2009). Opiates for the Matches: Matching Methods for Causal Inference. Annual
Review of Political Science, 12(1), 487–508.
https://doi.org/10.1146/annurev.polisci.11.060606.135444
Seufert, V., Ramankutty, N., & Foley, J. A. (2012). Comparing the yields of organic and
conventional agriculture. Nature, 485(7397), 229–232. https://doi.org/10.1038/nature11069
Seufert, V., & Ramankutty, N. (2017). Many shades of gray—the context-dependent performance of
organic agriculture. Science Advances, 3(3). https://doi.org/10.1126/sciadv.1602638
Seufert, V., Ramankutty, N., & Mayerhofer, T. (2017). What is this thing called organic? – How
organic farming is codified in regulations. Food Policy, 68, 10–20.
https://doi.org/10.1016/j.foodpol.2016.12.009
Sgroi, F., Candela, M., Di Trapani, A. M., Foderà, M., Squatrito, R., Testa, R., & Tudisca, S.
(2015). Economic and financial comparison between organic and conventional farming in
Sicilian lemon orchards. Sustainability (Switzerland), 7(1), 947–961.
166
https://doi.org/10.3390/su7010947
Shadbolt, N., Kelly, T., Horne, D., Harrington, K., Kemp, P., Palmer, A. and Thatcher, A. (2009).
Comparisons between organic & conventional pastoral dairy farming systems: cost of
production and profitability. Journal of Farm Management 13, 671-685.
Sharma, M. (2020). Oragnic Framing; A Modern apporach for Cultivation of Medicinal and
Aromatic plants. In W. Bank (Ed.), IInternational Virtual Conference On Vermicomposting
and Organic Farming, Organized by Dept Of Botany & Zoology. Nepal: Narasingh Choudhury
Autonomous College, Jajpur, Odisha and Dept. of Env Sc, Trichandra College, Tu, Nepal.
Shennan, C., Krupnik, T. J., Baird, G., Cohen, H., Forbush, K., Lovell, R. J., & Olimpi, E. M. (2017).
Organic and Conventional Agriculture: A Useful Framing? Annual Review of Environment
and Resources, 42, 317–346. https://doi.org/10.1146/annurev-environ-110615-085750
Sieber, S., Amjath-babu, T. S., Reidsma, P., Koenig, H., Piorr, A., Bezlepkina, I., & Mueller, K.
(2018). Land Use Policy Sustainability impact assessment tools for land use policy advice : A
comparative analysis of five research approaches. Land Use Policy, 71(November 2017), 75–
85. http://doi.org/10.1016/j.landusepol.2017.11.042
Singh, R. K., Murty, H. R., Gupta, S. K., & Dikshit, A. K. (2012). An overview of sustainability
assessment methodologies. Ecological Indicators, 15(1), 281–299.
https://doi.org/10.1016/j.ecolind.2011.01.007
Smith, O. M., Cohen, A. L., Rieser, C. J., Davis, A. G., Taylor, J. M., Adesanya, A. W., Jones M. S.,
Meier A. R., Reganold J. P., Orpet R. J., Northfield T. D., Crowder, D. W. (2019). Organic
Farming Provides Reliable Environmental Benefits but Increases Variability in Crop Yields:
A Global Meta-Analysis. Frontiers in Sustainable Food Systems, 3(September), 1–10.
https://doi.org/10.3389/fsufs.2019.00082
Soire, N., Maobe, S., Basweti, E., & Makone, S. (2016). Farmer’s Perception on the Effectiveness
and Sustainability of Disseminated Agricultural Technologies Through farmer groups
approach in Kisii County, Kenya. International Journal of Information Research and Review,
03(02), 1856–1859.
Sottile, F., Fiorito, D., Tecco, N., Girgenti, V., & Peano, C. (2016). An interpretive framework for
assessing and monitoring the sustainability of school gardens. Sustainability (Switzerland),
8(8). https://doi.org/10.3390/su8080801
Spaling, H., Brouwer, G., & Njoka, J. (2014). Factors affecting the sustainability of a community
water supply project in Kenya. Development in Practice, 24(7), 797–811.
https://doi.org/10.1080/09614524.2014.944485
Spaling, H., Montes, J., & Sinclair, J. (2011). Best practices for promoting participation and
learning for sustainability:lessons from community-based environmental assessment in kenya
and tanzania. Journal of Environmental Assessment Policy and Management, 13(3), 343–366.
https://doi.org/10.1142/S1464333211003924
Spedding, C. (2012). An introduction to agricultural systems. Netherlands: Springer Science and
Business Media
Speelman, E. N., López-Ridaura, S., Colomer, N. A., Astier, M., & Masera, O. R. (2007). Ten years
of sustainability evaluation using the MESMIS framework: Lessons learned from its
application in 28 Latin American case studies. International Journal of Sustainable
167
Development and World Ecology, 14(4), 345–361.
https://doi.org/10.1080/13504500709469735
Ssebunya, B. R., Altenbuchner, C., Schmid, E., Schader, C., Landert, J., Baumgart, L., & Stolze, M.
(2018). Sustainability Performance of Certified and Non-certified Smallholder Coffee Farms
in Uganda. Ecological Economics, 156(July 2016), 35–47.
https://doi.org/10.1016/j.ecolecon.2018.09.004
Ssebunya, B. R., Schmid, E., Van Asten, P., Schader, C., Altenbuchner, C., & Stolze, M. (2017).
Stakeholder engagement in prioritizing sustainability assessment themes for smallholder
coffee production in Uganda. Renewable Agriculture and Food Systems, 32(5), 428–445.
https://doi.org/10.1017/S1742170516000363
StataCorp. 2019. Stata Statistical Software: Release 16. College Station, TX: StataCorp LLC.
Suja, G., Byju, G., Jyothi, A. N., Veena, S. S., & Sreekumar, J. (2017). Yield, quality and soil
health under organic vs conventional farming in taro. Scientia Horticulturae, 218, 334–343.
https://doi.org/10.1016/j.scienta.2017.02.006
Şurcă, D.-E. C. (2018). Comparative study on the economic efficiency of rice culture in a
conventional and organic system. In Econstor (Ed.), Agrarian Economy and Rural
Development - Realities and Perspectives for Romania. 9th Edition of the International
Symposium, November 2018, Buchares (pp. 278–285). Bucharest: The Research Institute for
Agricultural Economy and Rural Development (ICEADR), Bucharest).
https://doi.org/http://hdl.handle.net/10419/205120
Tanrivermiş, H. (2006). The development of organic farming and its impacts on farms in Turkey: A
discussion on research results. Pakistan Journal of Biological Sciences.
https://doi.org/10.3923/pjbs.2006.1192.1204
Tatlidil, F. F., Boz, I., & Tatlidil, H. (2009). Farmers’ perception of sustainable agriculture and its
determinants: A case study in Kahramanmaras province of Turkey. Environment,
Development and Sustainability, 11(6), 1091–1106. https://doi.org/10.1007/s10668-008-
9168-x
Taylor, A. (2006). Overview of the current state of organic agriculture in Kenya, Uganda and the
United Republic of Tanzania and the opportunities for regional harmonization Geneva: United
Nations
Te Pas, C. M., & Rees, R. M. (2014). Analysis of Differences in Productivity, Profitability and Soil
Fertility between Organic and Conventional Cropping Systems in the Tropics and Sub-tropics.
Journal of Integrative Agriculture, 13(10), 2299–2310. https://doi.org/10.1016/S2095-3119
(14)60786-3
Tittonell, P., Muriuki, A., Shepherd, K.D., Mugendi, D., Kaizzi, K.C., Okeyo, J., Verchot, L., Coe,
R., Vanlauwe, B., (2010). The diversity of rural livelihoods and their influence on soil fertility
in agricultural systems of East Africa - A typology of smallholder farms. Agricultural Systems,
103(2), 83–97. https://doi.org/10.1016/j.agsy.2009.10.001
Tittonell, Pablo. (2014). Livelihood strategies, resilience and transformability in African
agroecosystems. Agricultural Systems, 126, 3–14. https://doi.org/10.1016/j.agsy.2013.10.010
Tobin, J. (1985). Neoclassical Theory in America: J. B. Clark and Fisher. American Economic
Review, 75(6), 28–38. https://doi.org/10.2307/1914327
168
Triste, L., Marchand, F., Debruyne, L., Meul, M., Lauwers, L., (2014). Reflection on the development
process of a sustainability assessment tool: learning from a Flemish case the MOTIFS case.
Ecol. Soc. 19.
Tung, L. I. M. (2018). African Organic Product Standards for the African Continent ? Prospects and
Limitations. Pioneer in Peer-Reviewed, 2018(21), 38.
https://doi.org/http://dx.doi.org/10.17159/1727- 3781/2018/v21i0a4308
UNEP -UNCTAD 2008 Best practices for organic policy. What developing country Governments
can do go promote the organic agriculture sector United Nations New York and Geneva
UNCTAD and UNEP (2008). 'Organic Agriculture and Food Security in Africa', New York, Geneva,
United Nations Conference on Trade and Development, United Nations Environment
Programme.
UNDP. (2018). National Human Development Report 2018: Planning the Opportunities for a
Youthful Population.
UNDP. (2020). Human Development Report 2020The next frontier Human development and the
Anthropocene Human Development Report 2020. New York, NY 10017 USA: United Nations
Development Programme. Retrieved from http://hdr.undp.org.
UNEP-UNCTAD. (2008). Capacity-building Task Force on Trade, Environment and Development.
Organic Agriculture and Food Security in Africa. Geneva and New York, United Nations. 21–
44. Retrieved from https://unctad.org/en/docs/ditcted200715_en.pdf
UN-DE (2017) United Nations Department of Economics. Indicators of sustainable development:
Guidelines and methodologies. United Nations Publications.
UN-SDSN (United Nations Sustainable Development Solutions Network), 2014b. Monitoring the
performance of agriculture and food systems. GSDR 2015 Brief. UN-SDSN.
Upton M. (1964). A Development of Gross Margin Analysis. Journal of Agricultural Economics,
16(1), 111–117. https://doi.org/10.1111/j.1477-9552.1964.tb00484.x
Ustriyana, I. N. G., Ayu, I., & Dewi, L. (2017). Analysis Of Perception Of Chili Farmers On
Sustainable Development. American-Eurasian Journal of Sustainable Agriculture, 11(4), 23–
29. Retrieved from http://www.aensiweb.com/AEJSA/
Van Cauwenbergh K Biala, Charles Bielders, V Brouckaert, L Francois, V Garcia Cidad, Martin
Hermy, Erik Mathijs, Bart Muys, J Reijnders, Xavier Sauvenier, Jan Valckx, Marnik
Vanclooster, B Van der Veken, Erwin Wauters, Alain Peeters (2007), SAFE—A hierarchical
framework for assessing the sustainability of agricultural systems Agriculture, Ecosystems
and Environment 120 229–242. https://doi:10.1016/j.agee.2006.09.006
Van der Werf, H. M. G., Knudsen, M. T., & Cederberg, C. (2020). Towards better representation of
organic agriculture in life cycle assessment. Nature Sustainability, 3(6), 419–425.
https://doi.org/10.1038/s41893-020-0489-6
Vandenberghe, V., & Robin, S. (2004). Evaluating the effectiveness of private education across
countries: A comparison of methods. Labour Economics, 11(4), 487–506.
https://doi.org/10.1016/j.labeco.2004.02.007
Vasilikiotis, C. (2000). Can Organic Farming “Feed the World”? University of California, Berkeley
ESPM-Division of Insect Biology, 136(11), 1324–1324.
169
https://doi.org/10.1001/archderm.136.11.1324
Virlanuta, F. O. (2011). Profitability Analysis for Agricultural Investment Projects. Risk in
Contemporary Economy, 336–342.
Waas, T., Hugé, J., Block, T., Wright, T., Benitez-Capistros, F., & Verbruggen, A. (2014).
Sustainability Assessment and Indicators: Tools in a Decision-Making Strategy for
Sustainable Development, Sustainability, 6, 5512-5534. http://doi.org/10.3390/su6095512
Walaga, C. (2004). Organic agriculture in Kenya and Uganda STUDY VISIT REPORT. Technical
Centre for Agricultural and Rural Cooperation (CTA), (8033), 19–30.
Waney, N. F. L., Soemarno, Yuliaty, Y., & Polii, B. (2014). Developing Indicators of Sustainable
Agriculture at Farm Level. IOSR Journal of Agriculture and Veterinary Science, 7(2), 42–53.
https://doi.org/10.9790/2380-07224253
Wankuru P. C., Dennis A. C. K., Umutesi A., Chege P. N., Mutie C. K., Sanya S. O., Chengula L.
K.,Njagi T.,Pape U. J.,Haynes A. P. F., 2019. Kenya Economic Update: Unbundling the Slack
in Private Sector Investment – Transforming Agriculture Sector Productivity and Linkages to
Poverty Reduction (English). Kenya economic update; no. 19 Washington, D.C.: World Bank
Group. http://documents.worldbank.org/curated/en/820861554470832579/Kenya-Economic-
Update-Unbundling-the-Slack-in-Private-Sector-Investment-Transforming-Agriculture-
Sector-Productivity-and-Linkages-to-Poverty-Reduction
Wartenberg, A. C., Blaser, W. J., Janudianto, K. N., Roshetko, J. M., van Noordwijk, M., & Six, J.
(2018). Farmer perceptions of plant–soil interactions can affect adoption of sustainable
management practices in cocoa agroforests: A case study from Southeast Sulawesi. Ecology
and Society, 23(1). https://doi.org/10.5751/ES-09921-230118
Weidmann, Gilles, Kilcher, Lukas and Garibay, Salvador. (2004). IFOAM Training Manual for
organic agriculture in the Tropics. Research Institute for Organic Agriculture (FIBL), Bonn:
IFOAM.
Whitehead, J. (2017) Prioritizing Sustainability Indicators: Using Materiality Analysis to Guide
Sustainability Assessment and Strategy. Bus. Strat. Env. 26: 399– 412. DOI:
10.1002/bse.1928.
Willer, H., & Lernoud, J. (2018). The world of organic agriculture. Statistics and Emerging Trends
2018. Fibl, Fricks, and IFOAM-Organics International.
https://doi.org/10.4324/9781849775991
Willer, H., & Lernoud, J. (Eds.). (2015). The World of Organic Agriculture. Statistics and Emerging
Trends 2015. Frick, Bonn: Research Institute of Organic Agriculture, and IFOAM – Organics
International. Retrieved from https://shop.fibl.org/de/artikel/c/statistik/p/1663-organic-
world-2015.html
Willer, H., & Lernoud, J. (Eds.). (2016). The World of Organic Agriculture Statistics and Emerging
Trends 2016. Frick, Bonn: Research Institute of Organic Agriculture, and IFOAM – Organics
International. https://doi.org/10.4324/9781849775991
Willer, H., & Lernoud, J. (Eds.). (2017). The World of Organic Agriculture Statistics and Emerging
Trends 2017. Frick, Bonn: Research Institute of Organic Agriculture, and IFOAM – Organics
International. https://doi.org/10.4324/9781849775991
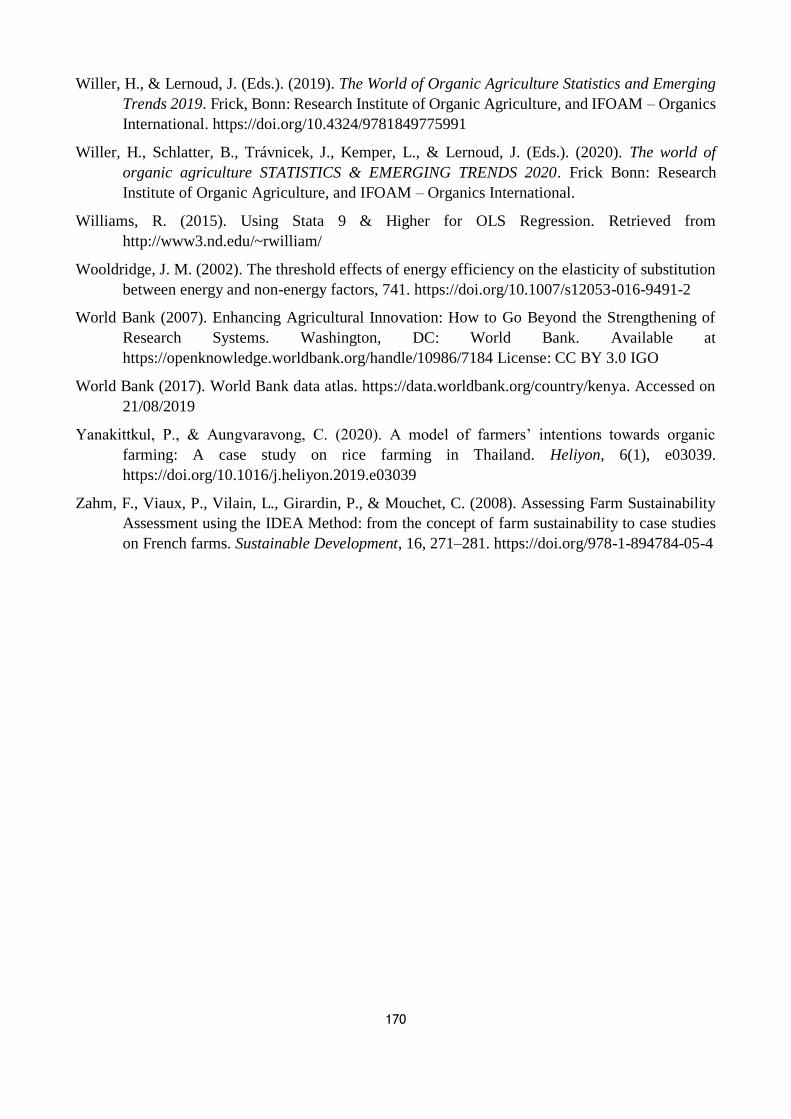
170
Willer, H., & Lernoud, J. (Eds.). (2019). The World of Organic Agriculture Statistics and Emerging
Trends 2019. Frick, Bonn: Research Institute of Organic Agriculture, and IFOAM – Organics
International. https://doi.org/10.4324/9781849775991
Willer, H., Schlatter, B., Trávnicek, J., Kemper, L., & Lernoud, J. (Eds.). (2020). The world of
organic agriculture STATISTICS & EMERGING TRENDS 2020. Frick Bonn: Research
Institute of Organic Agriculture, and IFOAM – Organics International.
Williams, R. (2015). Using Stata 9 & Higher for OLS Regression. Retrieved from
http://www3.nd.edu/~rwilliam/
Wooldridge, J. M. (2002). The threshold effects of energy efficiency on the elasticity of substitution
between energy and non-energy factors, 741. https://doi.org/10.1007/s12053-016-9491-2
World Bank (2007). Enhancing Agricultural Innovation: How to Go Beyond the Strengthening of
Research Systems. Washington, DC: World Bank. Available at
https://openknowledge.worldbank.org/handle/10986/7184 License: CC BY 3.0 IGO
World Bank (2017). World Bank data atlas. https://data.worldbank.org/country/kenya. Accessed on
21/08/2019
Yanakittkul, P., & Aungvaravong, C. (2020). A model of farmers’ intentions towards organic
farming: A case study on rice farming in Thailand. Heliyon, 6(1), e03039.
https://doi.org/10.1016/j.heliyon.2019.e03039
Zahm, F., Viaux, P., Vilain, L., Girardin, P., & Mouchet, C. (2008). Assessing Farm Sustainability
Assessment using the IDEA Method: from the concept of farm sustainability to case studies
on French farms. Sustainable Development, 16, 271–281. https://doi.org/978-1-894784-05-4
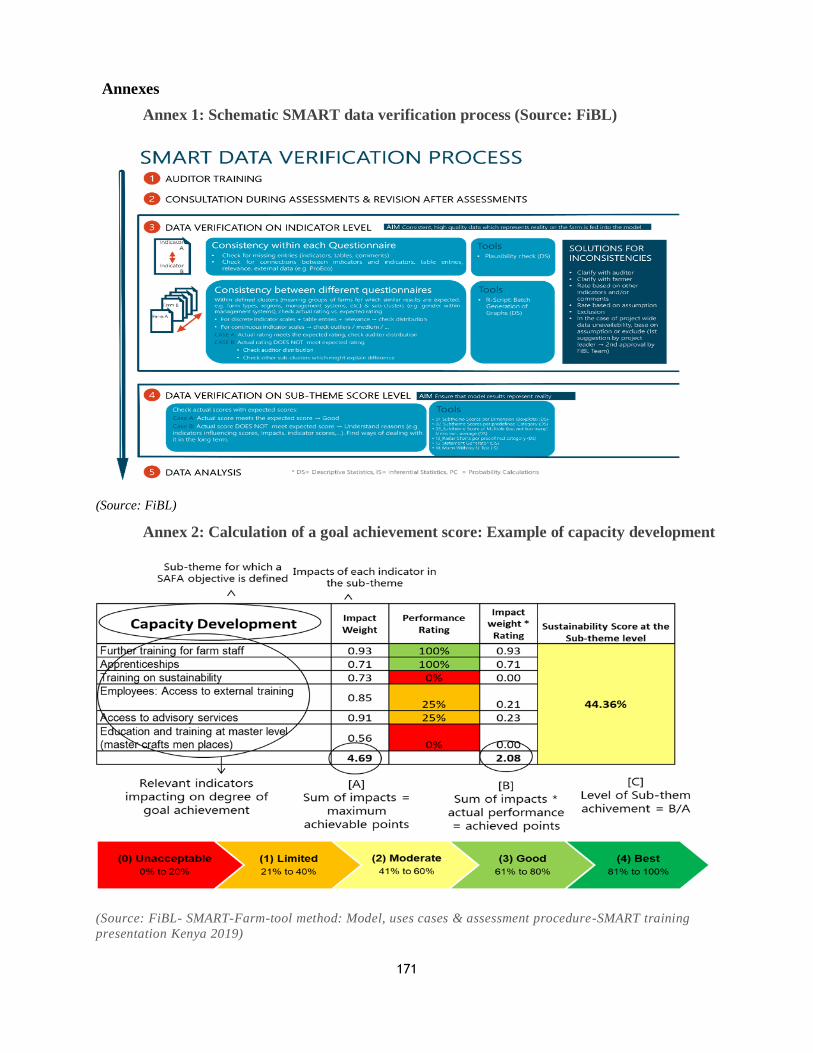
171
Annexes
Annex 1: Schematic SMART data verification process (Source: FiBL)
(Source: FiBL)
Annex 2: Calculation of a goal achievement score: Example of capacity development
(Source: FiBL- SMART-Farm-tool method: Model, uses cases & assessment procedure-SMART training
presentation Kenya 2019)
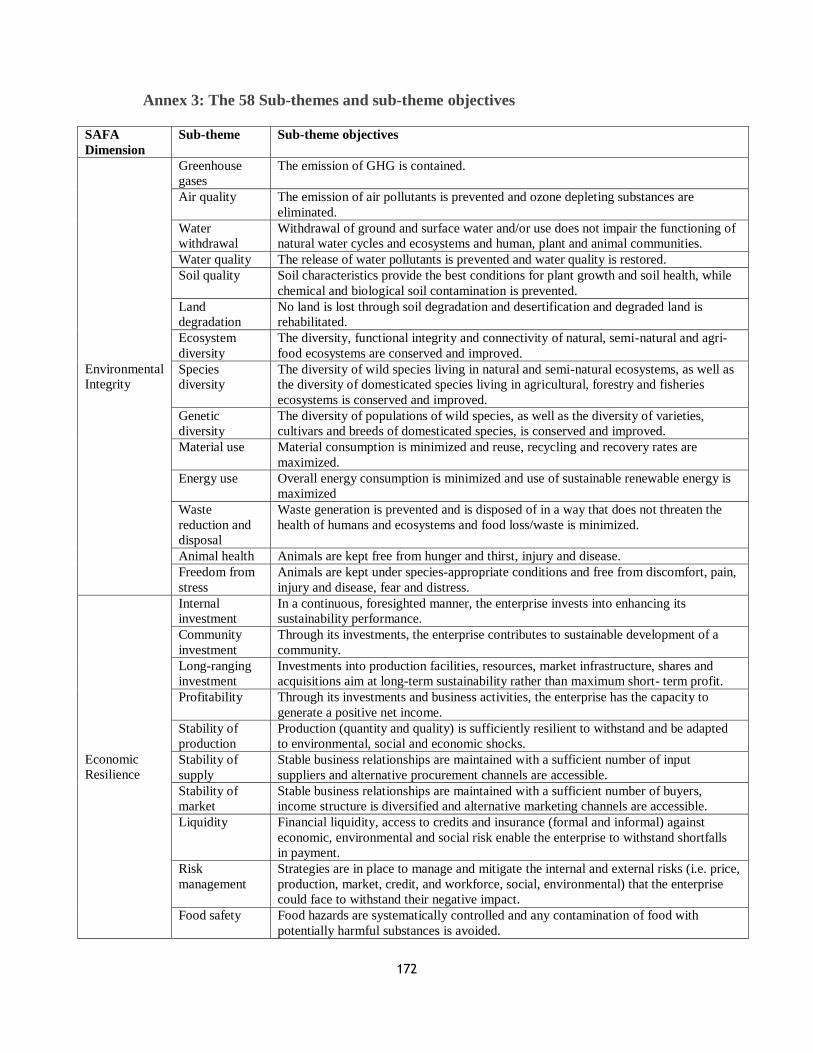
172
Annex 3: The 58 Sub-themes and sub-theme objectives
SAFA
Dimension
Sub-theme Sub-theme objectives
Environmental
Integrity
Greenhouse
gases
The emission of GHG is contained.
Air quality The emission of air pollutants is prevented and ozone depleting substances are
eliminated.
Water
withdrawal
Withdrawal of ground and surface water and/or use does not impair the functioning of
natural water cycles and ecosystems and human, plant and animal communities.
Water quality The release of water pollutants is prevented and water quality is restored.
Soil quality Soil characteristics provide the best conditions for plant growth and soil health, while
chemical and biological soil contamination is prevented.
Land
degradation
No land is lost through soil degradation and desertification and degraded land is
rehabilitated.
Ecosystem
diversity
The diversity, functional integrity and connectivity of natural, semi-natural and agri-
food ecosystems are conserved and improved.
Species
diversity
The diversity of wild species living in natural and semi-natural ecosystems, as well as
the diversity of domesticated species living in agricultural, forestry and fisheries
ecosystems is conserved and improved.
Genetic
diversity
The diversity of populations of wild species, as well as the diversity of varieties,
cultivars and breeds of domesticated species, is conserved and improved.
Material use Material consumption is minimized and reuse, recycling and recovery rates are
maximized.
Energy use Overall energy consumption is minimized and use of sustainable renewable energy is
maximized
Waste
reduction and
disposal
Waste generation is prevented and is disposed of in a way that does not threaten the
health of humans and ecosystems and food loss/waste is minimized.
Animal health Animals are kept free from hunger and thirst, injury and disease.
Freedom from
stress
Animals are kept under species-appropriate conditions and free from discomfort, pain,
injury and disease, fear and distress.
Economic
Resilience
Internal
investment
In a continuous, foresighted manner, the enterprise invests into enhancing its
sustainability performance.
Community
investment
Through its investments, the enterprise contributes to sustainable development of a
community.
Long-ranging
investment
Investments into production facilities, resources, market infrastructure, shares and
acquisitions aim at long-term sustainability rather than maximum short- term profit.
Profitability Through its investments and business activities, the enterprise has the capacity to
generate a positive net income.
Stability of
production
Production (quantity and quality) is sufficiently resilient to withstand and be adapted
to environmental, social and economic shocks.
Stability of
supply
Stable business relationships are maintained with a sufficient number of input
suppliers and alternative procurement channels are accessible.
Stability of
market
Stable business relationships are maintained with a sufficient number of buyers,
income structure is diversified and alternative marketing channels are accessible.
Liquidity Financial liquidity, access to credits and insurance (formal and informal) against
economic, environmental and social risk enable the enterprise to withstand shortfalls
in payment.
Risk
management
Strategies are in place to manage and mitigate the internal and external risks (i.e. price,
production, market, credit, and workforce, social, environmental) that the enterprise
could face to withstand their negative impact.
Food safety Food hazards are systematically controlled and any contamination of food with
potentially harmful substances is avoided.
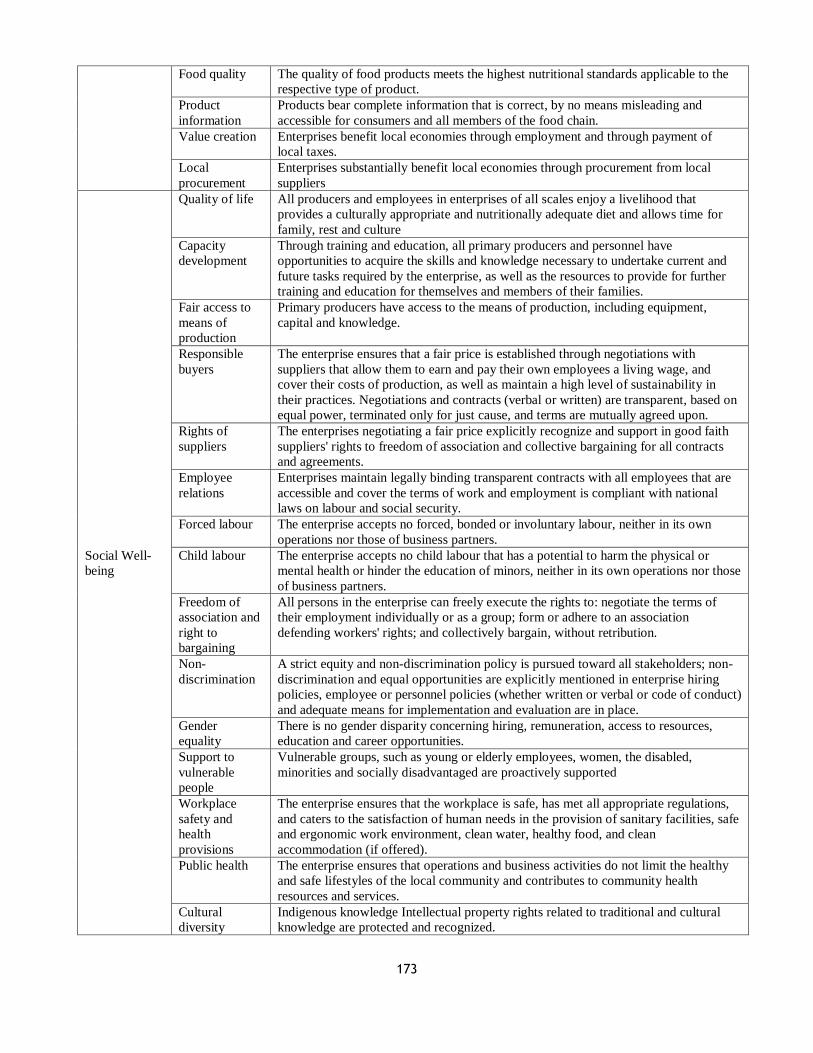
173
Food quality The quality of food products meets the highest nutritional standards applicable to the
respective type of product.
Product
information
Products bear complete information that is correct, by no means misleading and
accessible for consumers and all members of the food chain.
Value creation Enterprises benefit local economies through employment and through payment of
local taxes.
Local
procurement
Enterprises substantially benefit local economies through procurement from local
suppliers
Social Well-
being
Quality of life All producers and employees in enterprises of all scales enjoy a livelihood that
provides a culturally appropriate and nutritionally adequate diet and allows time for
family, rest and culture
Capacity
development
Through training and education, all primary producers and personnel have
opportunities to acquire the skills and knowledge necessary to undertake current and
future tasks required by the enterprise, as well as the resources to provide for further
training and education for themselves and members of their families.
Fair access to
means of
production
Primary producers have access to the means of production, including equipment,
capital and knowledge.
Responsible
buyers
The enterprise ensures that a fair price is established through negotiations with
suppliers that allow them to earn and pay their own employees a living wage, and
cover their costs of production, as well as maintain a high level of sustainability in
their practices. Negotiations and contracts (verbal or written) are transparent, based on
equal power, terminated only for just cause, and terms are mutually agreed upon.
Rights of
suppliers
The enterprises negotiating a fair price explicitly recognize and support in good faith
suppliers' rights to freedom of association and collective bargaining for all contracts
and agreements.
Employee
relations
Enterprises maintain legally binding transparent contracts with all employees that are
accessible and cover the terms of work and employment is compliant with national
laws on labour and social security.
Forced labour The enterprise accepts no forced, bonded or involuntary labour, neither in its own
operations nor those of business partners.
Child labour The enterprise accepts no child labour that has a potential to harm the physical or
mental health or hinder the education of minors, neither in its own operations nor those
of business partners.
Freedom of
association and
right to
bargaining
All persons in the enterprise can freely execute the rights to: negotiate the terms of
their employment individually or as a group; form or adhere to an association
defending workers' rights; and collectively bargain, without retribution.
Non-
discrimination
A strict equity and non-discrimination policy is pursued toward all stakeholders; non-
discrimination and equal opportunities are explicitly mentioned in enterprise hiring
policies, employee or personnel policies (whether written or verbal or code of conduct)
and adequate means for implementation and evaluation are in place.
Gender
equality
There is no gender disparity concerning hiring, remuneration, access to resources,
education and career opportunities.
Support to
vulnerable
people
Vulnerable groups, such as young or elderly employees, women, the disabled,
minorities and socially disadvantaged are proactively supported
Workplace
safety and
health
provisions
The enterprise ensures that the workplace is safe, has met all appropriate regulations,
and caters to the satisfaction of human needs in the provision of sanitary facilities, safe
and ergonomic work environment, clean water, healthy food, and clean
accommodation (if offered).
Public health The enterprise ensures that operations and business activities do not limit the healthy
and safe lifestyles of the local community and contributes to community health
resources and services.
Cultural
diversity
Indigenous knowledge Intellectual property rights related to traditional and cultural
knowledge are protected and recognized.
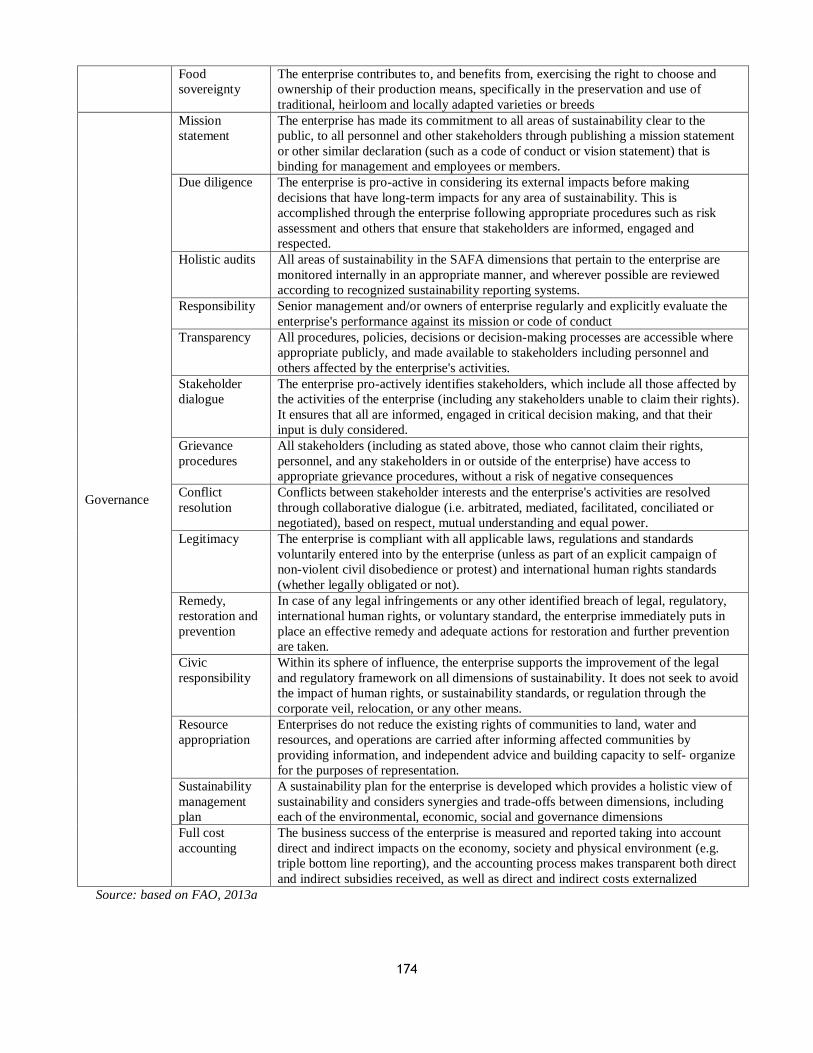
174
Food
sovereignty
The enterprise contributes to, and benefits from, exercising the right to choose and
ownership of their production means, specifically in the preservation and use of
traditional, heirloom and locally adapted varieties or breeds
Governance
Mission
statement
The enterprise has made its commitment to all areas of sustainability clear to the
public, to all personnel and other stakeholders through publishing a mission statement
or other similar declaration (such as a code of conduct or vision statement) that is
binding for management and employees or members.
Due diligence The enterprise is pro-active in considering its external impacts before making
decisions that have long-term impacts for any area of sustainability. This is
accomplished through the enterprise following appropriate procedures such as risk
assessment and others that ensure that stakeholders are informed, engaged and
respected.
Holistic audits All areas of sustainability in the SAFA dimensions that pertain to the enterprise are
monitored internally in an appropriate manner, and wherever possible are reviewed
according to recognized sustainability reporting systems.
Responsibility Senior management and/or owners of enterprise regularly and explicitly evaluate the
enterprise's performance against its mission or code of conduct
Transparency All procedures, policies, decisions or decision-making processes are accessible where
appropriate publicly, and made available to stakeholders including personnel and
others affected by the enterprise's activities.
Stakeholder
dialogue
The enterprise pro-actively identifies stakeholders, which include all those affected by
the activities of the enterprise (including any stakeholders unable to claim their rights).
It ensures that all are informed, engaged in critical decision making, and that their
input is duly considered.
Grievance
procedures
All stakeholders (including as stated above, those who cannot claim their rights,
personnel, and any stakeholders in or outside of the enterprise) have access to
appropriate grievance procedures, without a risk of negative consequences
Conflict
resolution
Conflicts between stakeholder interests and the enterprise's activities are resolved
through collaborative dialogue (i.e. arbitrated, mediated, facilitated, conciliated or
negotiated), based on respect, mutual understanding and equal power.
Legitimacy The enterprise is compliant with all applicable laws, regulations and standards
voluntarily entered into by the enterprise (unless as part of an explicit campaign of
non-violent civil disobedience or protest) and international human rights standards
(whether legally obligated or not).
Remedy,
restoration and
prevention
In case of any legal infringements or any other identified breach of legal, regulatory,
international human rights, or voluntary standard, the enterprise immediately puts in
place an effective remedy and adequate actions for restoration and further prevention
are taken.
Civic
responsibility
Within its sphere of influence, the enterprise supports the improvement of the legal
and regulatory framework on all dimensions of sustainability. It does not seek to avoid
the impact of human rights, or sustainability standards, or regulation through the
corporate veil, relocation, or any other means.
Resource
appropriation
Enterprises do not reduce the existing rights of communities to land, water and
resources, and operations are carried after informing affected communities by
providing information, and independent advice and building capacity to self- organize
for the purposes of representation.
Sustainability
management
plan
A sustainability plan for the enterprise is developed which provides a holistic view of
sustainability and considers synergies and trade-offs between dimensions, including
each of the environmental, economic, social and governance dimensions
Full cost
accounting
The business success of the enterprise is measured and reported taking into account
direct and indirect impacts on the economy, society and physical environment (e.g.
triple bottom line reporting), and the accounting process makes transparent both direct
and indirect subsidies received, as well as direct and indirect costs externalized
Source: based on FAO, 2013a
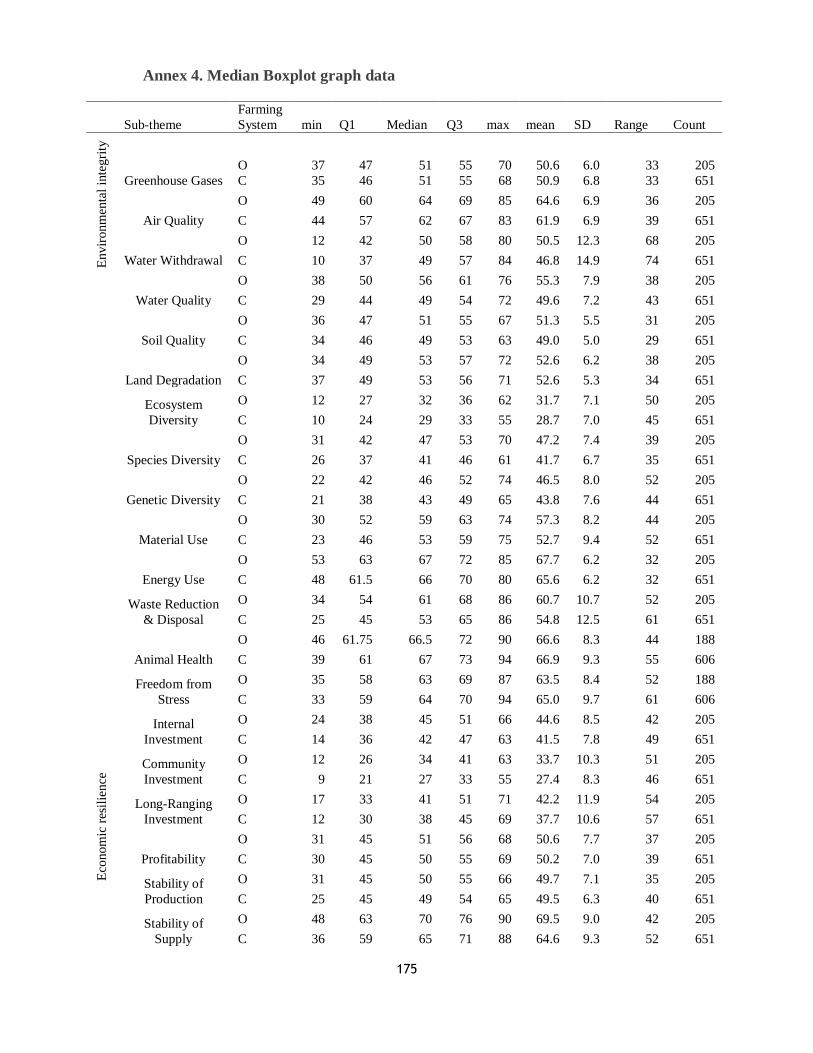
175
Annex 4. Median Boxplot graph data
Sub-theme
Farming
System min Q1 Median Q3 max mean SD Range Count
Envir
onm
enta
l in
tegri
ty
Greenhouse Gases
O 37 47 51 55 70 50.6 6.0 33 205
C 35 46 51 55 68 50.9 6.8 33 651
Air Quality
O 49 60 64 69 85 64.6 6.9 36 205
C 44 57 62 67 83 61.9 6.9 39 651
Water Withdrawal
O 12 42 50 58 80 50.5 12.3 68 205
C 10 37 49 57 84 46.8 14.9 74 651
Water Quality
O 38 50 56 61 76 55.3 7.9 38 205
C 29 44 49 54 72 49.6 7.2 43 651
Soil Quality
O 36 47 51 55 67 51.3 5.5 31 205
C 34 46 49 53 63 49.0 5.0 29 651
Land Degradation
O 34 49 53 57 72 52.6 6.2 38 205
C 37 49 53 56 71 52.6 5.3 34 651
Ecosystem
Diversity
O 12 27 32 36 62 31.7 7.1 50 205
C 10 24 29 33 55 28.7 7.0 45 651
Species Diversity
O 31 42 47 53 70 47.2 7.4 39 205
C 26 37 41 46 61 41.7 6.7 35 651
Genetic Diversity
O 22 42 46 52 74 46.5 8.0 52 205
C 21 38 43 49 65 43.8 7.6 44 651
Material Use
O 30 52 59 63 74 57.3 8.2 44 205
C 23 46 53 59 75 52.7 9.4 52 651
Energy Use
O 53 63 67 72 85 67.7 6.2 32 205
C 48 61.5 66 70 80 65.6 6.2 32 651
Waste Reduction
& Disposal
O 34 54 61 68 86 60.7 10.7 52 205
C 25 45 53 65 86 54.8 12.5 61 651
Animal Health
O 46 61.75 66.5 72 90 66.6 8.3 44 188
C 39 61 67 73 94 66.9 9.3 55 606
Freedom from
Stress
O 35 58 63 69 87 63.5 8.4 52 188
C 33 59 64 70 94 65.0 9.7 61 606
Eco
nom
ic r
esil
ience
Internal
Investment
O 24 38 45 51 66 44.6 8.5 42 205
C 14 36 42 47 63 41.5 7.8 49 651
Community
Investment
O 12 26 34 41 63 33.7 10.3 51 205
C 9 21 27 33 55 27.4 8.3 46 651
Long-Ranging
Investment
O 17 33 41 51 71 42.2 11.9 54 205
C 12 30 38 45 69 37.7 10.6 57 651
Profitability
O 31 45 51 56 68 50.6 7.7 37 205
C 30 45 50 55 69 50.2 7.0 39 651
Stability of
Production
O 31 45 50 55 66 49.7 7.1 35 205
C 25 45 49 54 65 49.5 6.3 40 651
Stability of
Supply
O 48 63 70 76 90 69.5 9.0 42 205
C 36 59 65 71 88 64.6 9.3 52 651
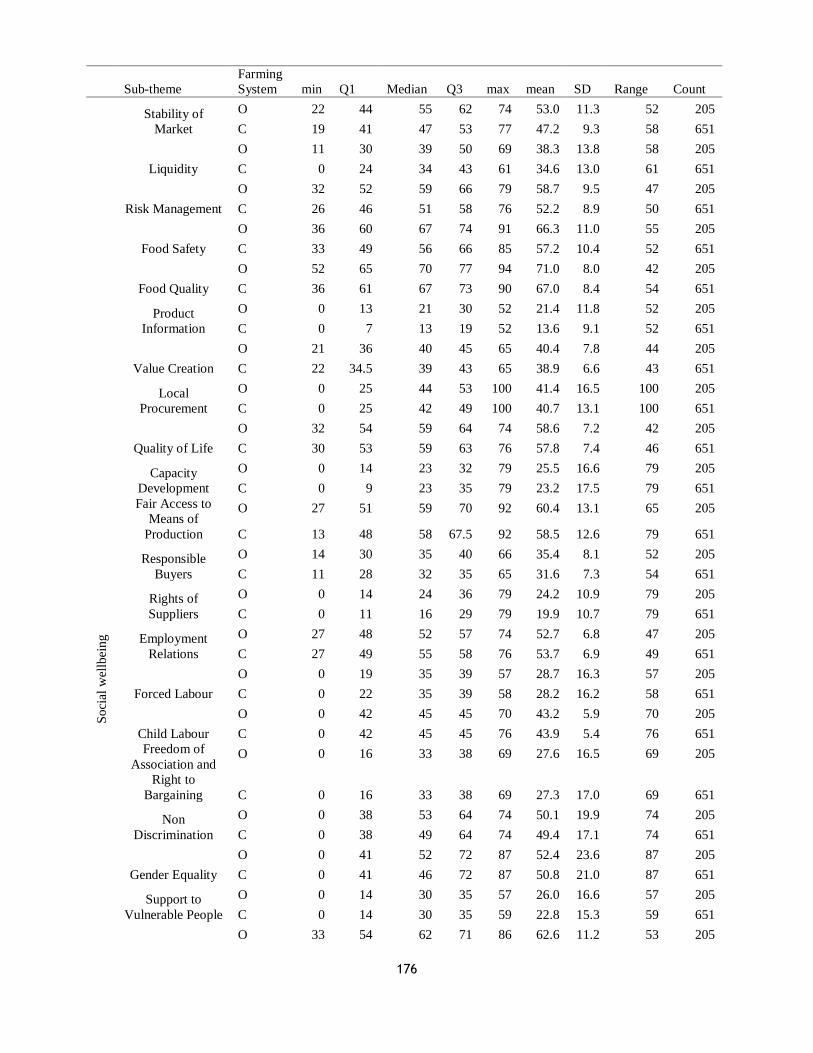
176
Sub-theme
Farming
System min Q1 Median Q3 max mean SD Range Count
Stability of
Market
O 22 44 55 62 74 53.0 11.3 52 205
C 19 41 47 53 77 47.2 9.3 58 651
Liquidity
O 11 30 39 50 69 38.3 13.8 58 205
C 0 24 34 43 61 34.6 13.0 61 651
Risk Management
O 32 52 59 66 79 58.7 9.5 47 205
C 26 46 51 58 76 52.2 8.9 50 651
Food Safety
O 36 60 67 74 91 66.3 11.0 55 205
C 33 49 56 66 85 57.2 10.4 52 651
Food Quality
O 52 65 70 77 94 71.0 8.0 42 205
C 36 61 67 73 90 67.0 8.4 54 651
Product
Information
O 0 13 21 30 52 21.4 11.8 52 205
C 0 7 13 19 52 13.6 9.1 52 651
Value Creation
O 21 36 40 45 65 40.4 7.8 44 205
C 22 34.5 39 43 65 38.9 6.6 43 651
Local
Procurement
O 0 25 44 53 100 41.4 16.5 100 205
C 0 25 42 49 100 40.7 13.1 100 651
So
cial
wel
lbei
ng
Quality of Life
O 32 54 59 64 74 58.6 7.2 42 205
C 30 53 59 63 76 57.8 7.4 46 651
Capacity
Development
O 0 14 23 32 79 25.5 16.6 79 205
C 0 9 23 35 79 23.2 17.5 79 651
Fair Access to
Means of
Production
O 27 51 59 70 92 60.4 13.1 65 205
C 13 48 58 67.5 92 58.5 12.6 79 651
Responsible
Buyers
O 14 30 35 40 66 35.4 8.1 52 205
C 11 28 32 35 65 31.6 7.3 54 651
Rights of
Suppliers
O 0 14 24 36 79 24.2 10.9 79 205
C 0 11 16 29 79 19.9 10.7 79 651
Employment
Relations
O 27 48 52 57 74 52.7 6.8 47 205
C 27 49 55 58 76 53.7 6.9 49 651
Forced Labour
O 0 19 35 39 57 28.7 16.3 57 205
C 0 22 35 39 58 28.2 16.2 58 651
Child Labour
O 0 42 45 45 70 43.2 5.9 70 205
C 0 42 45 45 76 43.9 5.4 76 651
Freedom of
Association and
Right to
Bargaining
O 0 16 33 38 69 27.6 16.5 69 205
C 0 16 33 38 69 27.3 17.0 69 651
Non
Discrimination
O 0 38 53 64 74 50.1 19.9 74 205
C 0 38 49 64 74 49.4 17.1 74 651
Gender Equality
O 0 41 52 72 87 52.4 23.6 87 205
C 0 41 46 72 87 50.8 21.0 87 651
Support to
Vulnerable People
O 0 14 30 35 57 26.0 16.6 57 205
C 0 14 30 35 59 22.8 15.3 59 651
O 33 54 62 71 86 62.6 11.2 53 205
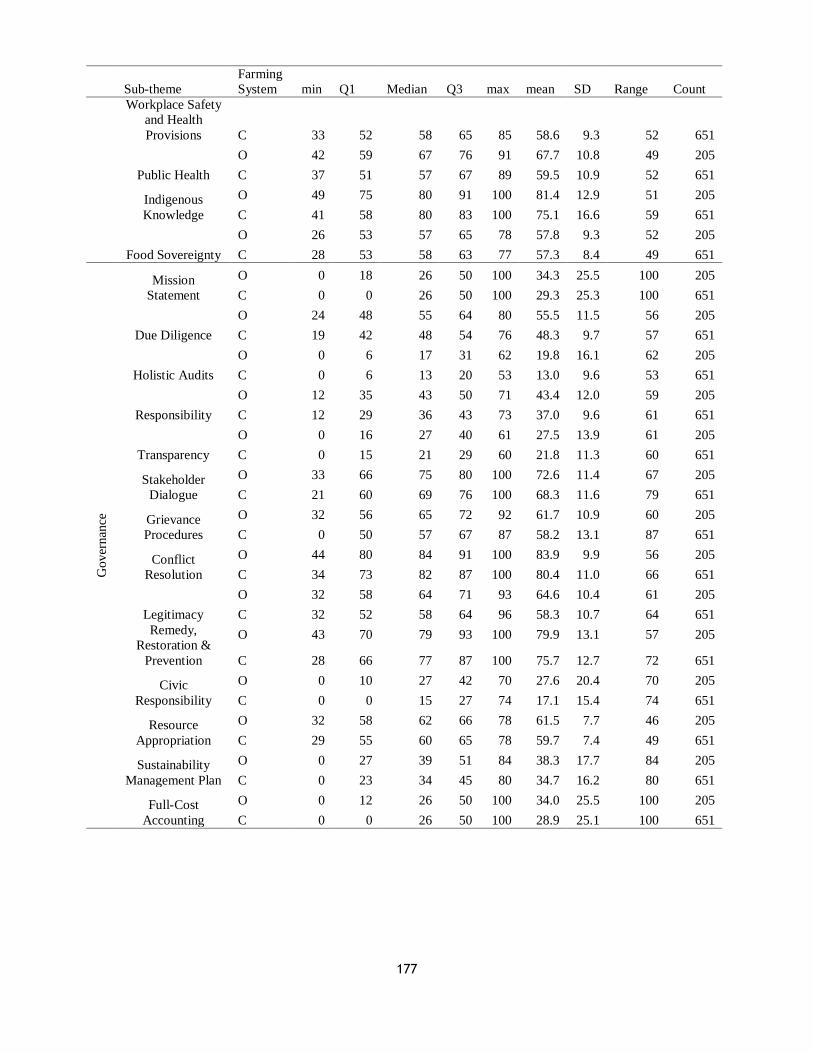
177
Sub-theme
Farming
System min Q1 Median Q3 max mean SD Range Count
Workplace Safety
and Health
Provisions C 33 52 58 65 85 58.6 9.3 52 651
Public Health
O 42 59 67 76 91 67.7 10.8 49 205
C 37 51 57 67 89 59.5 10.9 52 651
Indigenous
Knowledge
O 49 75 80 91 100 81.4 12.9 51 205
C 41 58 80 83 100 75.1 16.6 59 651
Food Sovereignty
O 26 53 57 65 78 57.8 9.3 52 205
C 28 53 58 63 77 57.3 8.4 49 651
Gover
nan
ce
Mission
Statement
O 0 18 26 50 100 34.3 25.5 100 205
C 0 0 26 50 100 29.3 25.3 100 651
Due Diligence
O 24 48 55 64 80 55.5 11.5 56 205
C 19 42 48 54 76 48.3 9.7 57 651
Holistic Audits
O 0 6 17 31 62 19.8 16.1 62 205
C 0 6 13 20 53 13.0 9.6 53 651
Responsibility
O 12 35 43 50 71 43.4 12.0 59 205
C 12 29 36 43 73 37.0 9.6 61 651
Transparency
O 0 16 27 40 61 27.5 13.9 61 205
C 0 15 21 29 60 21.8 11.3 60 651
Stakeholder
Dialogue
O 33 66 75 80 100 72.6 11.4 67 205
C 21 60 69 76 100 68.3 11.6 79 651
Grievance
Procedures
O 32 56 65 72 92 61.7 10.9 60 205
C 0 50 57 67 87 58.2 13.1 87 651
Conflict
Resolution
O 44 80 84 91 100 83.9 9.9 56 205
C 34 73 82 87 100 80.4 11.0 66 651
Legitimacy
O 32 58 64 71 93 64.6 10.4 61 205
C 32 52 58 64 96 58.3 10.7 64 651
Remedy,
Restoration &
Prevention
O 43 70 79 93 100 79.9 13.1 57 205
C 28 66 77 87 100 75.7 12.7 72 651
Civic
Responsibility
O 0 10 27 42 70 27.6 20.4 70 205
C 0 0 15 27 74 17.1 15.4 74 651
Resource
Appropriation
O 32 58 62 66 78 61.5 7.7 46 205
C 29 55 60 65 78 59.7 7.4 49 651
Sustainability
Management Plan
O 0 27 39 51 84 38.3 17.7 84 205
C 0 23 34 45 80 34.7 16.2 80 651
Full-Cost
Accounting
O 0 12 26 50 100 34.0 25.5 100 205
C 0 0 26 50 100 28.9 25.1 100 651
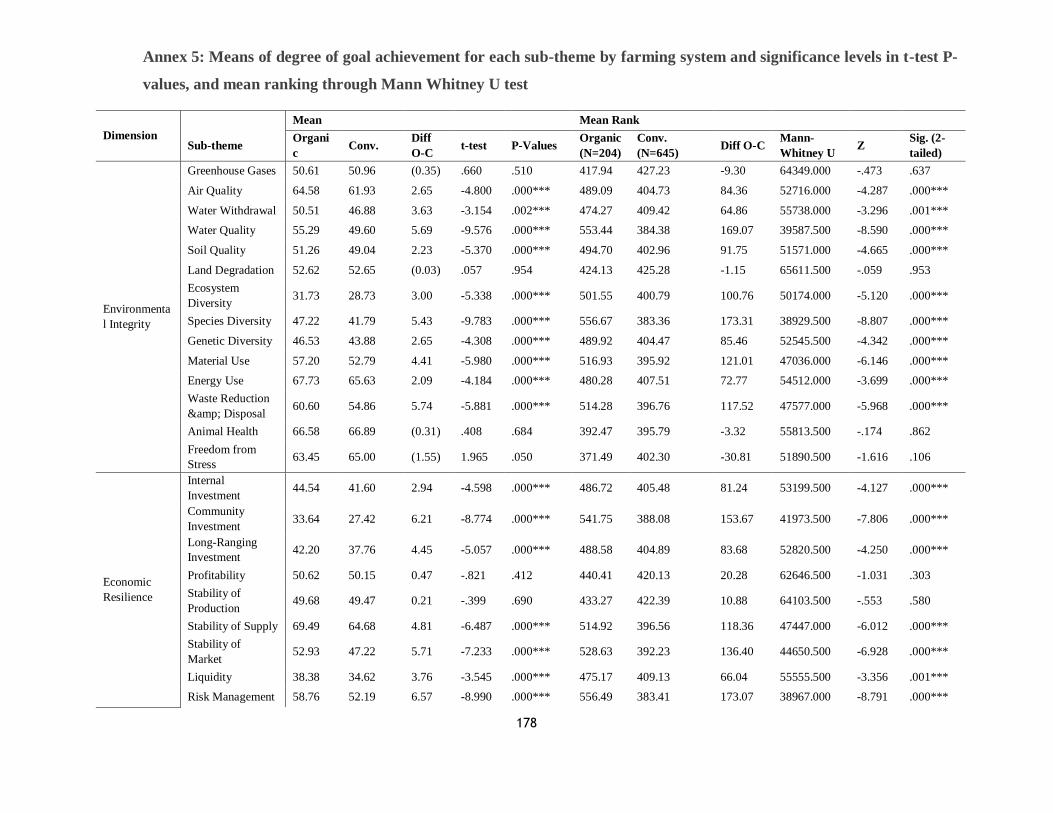
178
Annex 5: Means of degree of goal achievement for each sub-theme by farming system and significance levels in t-test P-
values, and mean ranking through Mann Whitney U test
Dimension
Mean Mean Rank
Sub-theme Organi
c Conv.
Diff
O-C t-test P-Values
Organic
(N=204)
Conv.
(N=645) Diff O-C
Mann-
Whitney U Z
Sig. (2-
tailed)
Environmenta
l Integrity
Greenhouse Gases 50.61 50.96 (0.35) .660 .510 417.94 427.23 -9.30 64349.000 -.473 .637
Air Quality 64.58 61.93 2.65 -4.800 .000*** 489.09 404.73 84.36 52716.000 -4.287 .000***
Water Withdrawal 50.51 46.88 3.63 -3.154 .002*** 474.27 409.42 64.86 55738.000 -3.296 .001***
Water Quality 55.29 49.60 5.69 -9.576 .000*** 553.44 384.38 169.07 39587.500 -8.590 .000***
Soil Quality 51.26 49.04 2.23 -5.370 .000*** 494.70 402.96 91.75 51571.000 -4.665 .000***
Land Degradation 52.62 52.65 (0.03) .057 .954 424.13 425.28 -1.15 65611.500 -.059 .953
Ecosystem
Diversity 31.73 28.73 3.00 -5.338 .000*** 501.55 400.79 100.76 50174.000 -5.120 .000***
Species Diversity 47.22 41.79 5.43 -9.783 .000*** 556.67 383.36 173.31 38929.500 -8.807 .000***
Genetic Diversity 46.53 43.88 2.65 -4.308 .000*** 489.92 404.47 85.46 52545.500 -4.342 .000***
Material Use 57.20 52.79 4.41 -5.980 .000*** 516.93 395.92 121.01 47036.000 -6.146 .000***
Energy Use 67.73 65.63 2.09 -4.184 .000*** 480.28 407.51 72.77 54512.000 -3.699 .000***
Waste Reduction
& Disposal 60.60 54.86 5.74 -5.881 .000*** 514.28 396.76 117.52 47577.000 -5.968 .000***
Animal Health 66.58 66.89 (0.31) .408 .684 392.47 395.79 -3.32 55813.500 -.174 .862
Freedom from
Stress 63.45 65.00 (1.55) 1.965 .050 371.49 402.30 -30.81 51890.500 -1.616 .106
Economic
Resilience
Internal
Investment 44.54 41.60 2.94 -4.598 .000*** 486.72 405.48 81.24 53199.500 -4.127 .000***
Community
Investment 33.64 27.42 6.21 -8.774 .000*** 541.75 388.08 153.67 41973.500 -7.806 .000***
Long-Ranging
Investment 42.20 37.76 4.45 -5.057 .000*** 488.58 404.89 83.68 52820.500 -4.250 .000***
Profitability 50.62 50.15 0.47 -.821 .412 440.41 420.13 20.28 62646.500 -1.031 .303
Stability of
Production 49.68 49.47 0.21 -.399 .690 433.27 422.39 10.88 64103.500 -.553 .580
Stability of Supply 69.49 64.68 4.81 -6.487 .000*** 514.92 396.56 118.36 47447.000 -6.012 .000***
Stability of
Market 52.93 47.22 5.71 -7.233 .000*** 528.63 392.23 136.40 44650.500 -6.928 .000***
Liquidity 38.38 34.62 3.76 -3.545 .000*** 475.17 409.13 66.04 55555.500 -3.356 .001***
Risk Management 58.76 52.19 6.57 -8.990 .000*** 556.49 383.41 173.07 38967.000 -8.791 .000***
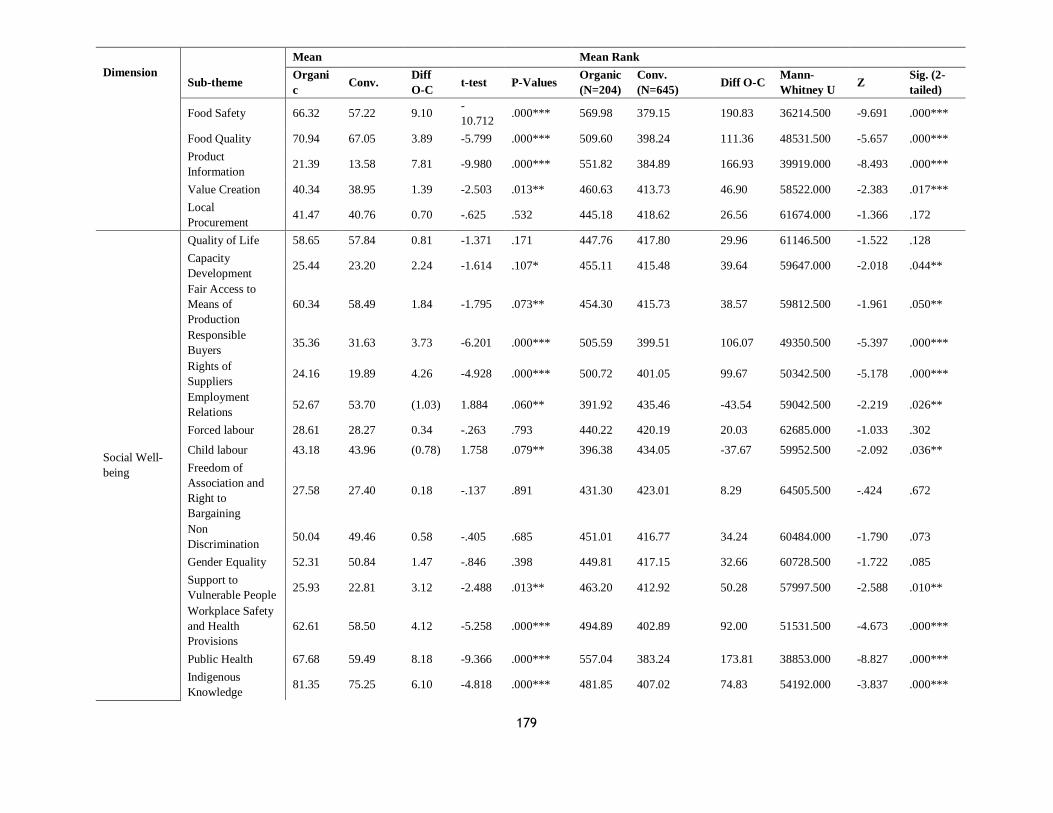
179
Dimension
Mean Mean Rank
Sub-theme Organi
c Conv.
Diff
O-C t-test P-Values
Organic
(N=204)
Conv.
(N=645) Diff O-C
Mann-
Whitney U Z
Sig. (2-
tailed)
Food Safety 66.32 57.22 9.10 -
10.712 .000*** 569.98 379.15 190.83 36214.500 -9.691 .000***
Food Quality 70.94 67.05 3.89 -5.799 .000*** 509.60 398.24 111.36 48531.500 -5.657 .000***
Product
Information 21.39 13.58 7.81 -9.980 .000*** 551.82 384.89 166.93 39919.000 -8.493 .000***
Value Creation 40.34 38.95 1.39 -2.503 .013** 460.63 413.73 46.90 58522.000 -2.383 .017***
Local
Procurement 41.47 40.76 0.70 -.625 .532 445.18 418.62 26.56 61674.000 -1.366 .172
Social Well-
being
Quality of Life 58.65 57.84 0.81 -1.371 .171 447.76 417.80 29.96 61146.500 -1.522 .128
Capacity
Development 25.44 23.20 2.24 -1.614 .107* 455.11 415.48 39.64 59647.000 -2.018 .044**
Fair Access to
Means of
Production
60.34 58.49 1.84 -1.795 .073** 454.30 415.73 38.57 59812.500 -1.961 .050**
Responsible
Buyers 35.36 31.63 3.73 -6.201 .000*** 505.59 399.51 106.07 49350.500 -5.397 .000***
Rights of
Suppliers 24.16 19.89 4.26 -4.928 .000*** 500.72 401.05 99.67 50342.500 -5.178 .000***
Employment
Relations 52.67 53.70 (1.03) 1.884 .060** 391.92 435.46 -43.54 59042.500 -2.219 .026**
Forced labour 28.61 28.27 0.34 -.263 .793 440.22 420.19 20.03 62685.000 -1.033 .302
Child labour 43.18 43.96 (0.78) 1.758 .079** 396.38 434.05 -37.67 59952.500 -2.092 .036**
Freedom of
Association and
Right to
Bargaining
27.58 27.40 0.18 -.137 .891 431.30 423.01 8.29 64505.500 -.424 .672
Non
Discrimination 50.04 49.46 0.58 -.405 .685 451.01 416.77 34.24 60484.000 -1.790 .073
Gender Equality 52.31 50.84 1.47 -.846 .398 449.81 417.15 32.66 60728.500 -1.722 .085
Support to
Vulnerable People 25.93 22.81 3.12 -2.488 .013** 463.20 412.92 50.28 57997.500 -2.588 .010**
Workplace Safety
and Health
Provisions
62.61 58.50 4.12 -5.258 .000*** 494.89 402.89 92.00 51531.500 -4.673 .000***
Public Health 67.68 59.49 8.18 -9.366 .000*** 557.04 383.24 173.81 38853.000 -8.827 .000***
Indigenous
Knowledge 81.35 75.25 6.10 -4.818 .000*** 481.85 407.02 74.83 54192.000 -3.837 .000***
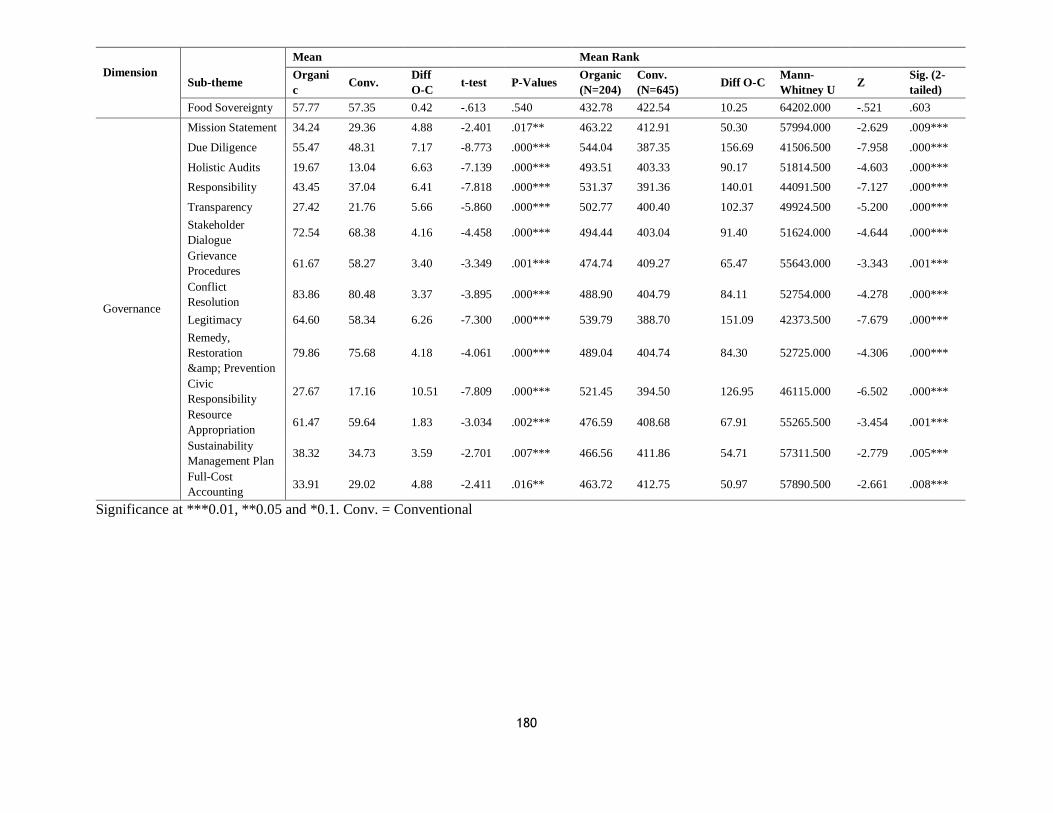
180
Dimension
Mean Mean Rank
Sub-theme Organi
c Conv.
Diff
O-C t-test P-Values
Organic
(N=204)
Conv.
(N=645) Diff O-C
Mann-
Whitney U Z
Sig. (2-
tailed)
Food Sovereignty 57.77 57.35 0.42 -.613 .540 432.78 422.54 10.25 64202.000 -.521 .603
Governance
Mission Statement 34.24 29.36 4.88 -2.401 .017** 463.22 412.91 50.30 57994.000 -2.629 .009***
Due Diligence 55.47 48.31 7.17 -8.773 .000*** 544.04 387.35 156.69 41506.500 -7.958 .000***
Holistic Audits 19.67 13.04 6.63 -7.139 .000*** 493.51 403.33 90.17 51814.500 -4.603 .000***
Responsibility 43.45 37.04 6.41 -7.818 .000*** 531.37 391.36 140.01 44091.500 -7.127 .000***
Transparency 27.42 21.76 5.66 -5.860 .000*** 502.77 400.40 102.37 49924.500 -5.200 .000***
Stakeholder
Dialogue 72.54 68.38 4.16 -4.458 .000*** 494.44 403.04 91.40 51624.000 -4.644 .000***
Grievance
Procedures 61.67 58.27 3.40 -3.349 .001*** 474.74 409.27 65.47 55643.000 -3.343 .001***
Conflict
Resolution 83.86 80.48 3.37 -3.895 .000*** 488.90 404.79 84.11 52754.000 -4.278 .000***
Legitimacy 64.60 58.34 6.26 -7.300 .000*** 539.79 388.70 151.09 42373.500 -7.679 .000***
Remedy,
Restoration
& Prevention
79.86 75.68 4.18 -4.061 .000*** 489.04 404.74 84.30 52725.000 -4.306 .000***
Civic
Responsibility 27.67 17.16 10.51 -7.809 .000*** 521.45 394.50 126.95 46115.000 -6.502 .000***
Resource
Appropriation 61.47 59.64 1.83 -3.034 .002*** 476.59 408.68 67.91 55265.500 -3.454 .001***
Sustainability
Management Plan 38.32 34.73 3.59 -2.701 .007*** 466.56 411.86 54.71 57311.500 -2.779 .005***
Full-Cost
Accounting 33.91 29.02 4.88 -2.411 .016** 463.72 412.75 50.97 57890.500 -2.661 .008***
Significance at ***0.01, **0.05 and *0.1. Conv. = Conventional
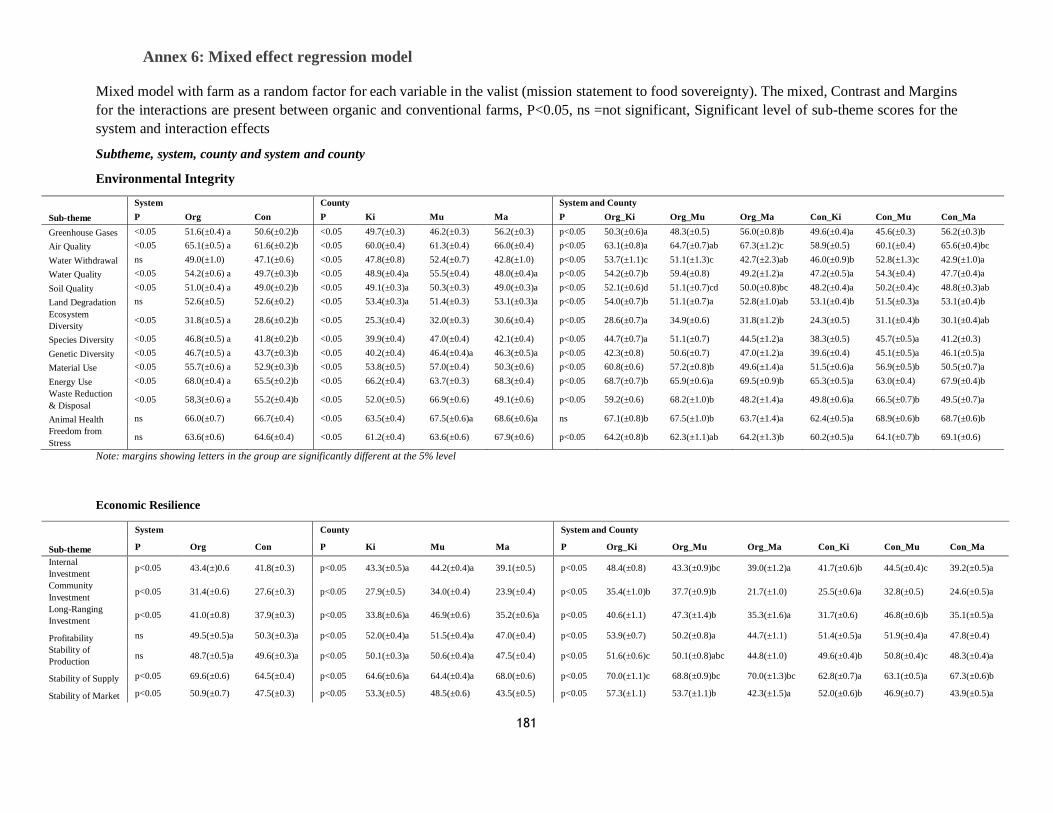
181
Annex 6: Mixed effect regression model
Mixed model with farm as a random factor for each variable in the valist (mission statement to food sovereignty). The mixed, Contrast and Margins
for the interactions are present between organic and conventional farms, P<0.05, ns =not significant, Significant level of sub-theme scores for the
system and interaction effects
Subtheme, system, county and system and county
Environmental Integrity
System County System and County
Sub-theme P Org Con P Ki Mu Ma P Org_Ki Org_Mu Org_Ma Con_Ki Con_Mu Con_Ma
Greenhouse Gases <0.05 51.6(±0.4) a 50.6(±0.2)b <0.05 49.7(±0.3) 46.2(±0.3) 56.2(±0.3) p<0.05 50.3(±0.6)a 48.3(±0.5) 56.0(±0.8)b 49.6(±0.4)a 45.6(±0.3) 56.2(±0.3)b
Air Quality <0.05 65.1(±0.5) a 61.6(±0.2)b <0.05 60.0(±0.4) 61.3(±0.4) 66.0(±0.4) p<0.05 63.1(±0.8)a 64.7(±0.7)ab 67.3(±1.2)c 58.9(±0.5) 60.1(±0.4) 65.6(±0.4)bc
Water Withdrawal ns 49.0(±1.0) 47.1(±0.6) <0.05 47.8(±0.8) 52.4(±0.7) 42.8(±1.0) p<0.05 53.7(±1.1)c 51.1(±1.3)c 42.7(±2.3)ab 46.0(±0.9)b 52.8(±1.3)c 42.9(±1.0)a
Water Quality <0.05 54.2(±0.6) a 49.7(±0.3)b <0.05 48.9(±0.4)a 55.5(±0.4) 48.0(±0.4)a p<0.05 54.2(±0.7)b 59.4(±0.8) 49.2(±1.2)a 47.2(±0.5)a 54.3(±0.4) 47.7(±0.4)a
Soil Quality <0.05 51.0(±0.4) a 49.0(±0.2)b <0.05 49.1(±0.3)a 50.3(±0.3) 49.0(±0.3)a p<0.05 52.1(±0.6)d 51.1(±0.7)cd 50.0(±0.8)bc 48.2(±0.4)a 50.2(±0.4)c 48.8(±0.3)ab
Land Degradation ns 52.6(±0.5) 52.6(±0.2) <0.05 53.4(±0.3)a 51.4(±0.3) 53.1(±0.3)a p<0.05 54.0(±0.7)b 51.1(±0.7)a 52.8(±1.0)ab 53.1(±0.4)b 51.5(±0.3)a 53.1(±0.4)b
Ecosystem
Diversity <0.05 31.8(±0.5) a 28.6(±0.2)b <0.05 25.3(±0.4) 32.0(±0.3) 30.6(±0.4) p<0.05 28.6(±0.7)a 34.9(±0.6) 31.8(±1.2)b 24.3(±0.5) 31.1(±0.4)b 30.1(±0.4)ab
Species Diversity <0.05 46.8(±0.5) a 41.8(±0.2)b <0.05 39.9(±0.4) 47.0(±0.4) 42.1(±0.4) p<0.05 44.7(±0.7)a 51.1(±0.7) 44.5(±1.2)a 38.3(±0.5) 45.7(±0.5)a 41.2(±0.3)
Genetic Diversity <0.05 46.7(±0.5) a 43.7(±0.3)b <0.05 40.2(±0.4) 46.4(±0.4)a 46.3(±0.5)a p<0.05 42.3(±0.8) 50.6(±0.7) 47.0(±1.2)a 39.6(±0.4) 45.1(±0.5)a 46.1(±0.5)a
Material Use <0.05 55.7(±0.6) a 52.9(±0.3)b <0.05 53.8(±0.5) 57.0(±0.4) 50.3(±0.6) p<0.05 60.8(±0.6) 57.2(±0.8)b 49.6(±1.4)a 51.5(±0.6)a 56.9(±0.5)b 50.5(±0.7)a
Energy Use <0.05 68.0(±0.4) a 65.5(±0.2)b <0.05 66.2(±0.4) 63.7(±0.3) 68.3(±0.4) p<0.05 68.7(±0.7)b 65.9(±0.6)a 69.5(±0.9)b 65.3(±0.5)a 63.0(±0.4) 67.9(±0.4)b
Waste Reduction
& Disposal <0.05 58,3(±0.6) a 55.2(±0.4)b <0.05 52.0(±0.5) 66.9(±0.6) 49.1(±0.6) p<0.05 59.2(±0.6) 68.2(±1.0)b 48.2(±1.4)a 49.8(±0.6)a 66.5(±0.7)b 49.5(±0.7)a
Animal Health ns 66.0(±0.7) 66.7(±0.4) <0.05 63.5(±0.4) 67.5(±0.6)a 68.6(±0.6)a ns 67.1(±0.8)b 67.5(±1.0)b 63.7(±1.4)a 62.4(±0.5)a 68.9(±0.6)b 68.7(±0.6)b
Freedom from
Stress ns 63.6(±0.6) 64.6(±0.4) <0.05 61.2(±0.4) 63.6(±0.6) 67.9(±0.6) p<0.05 64.2(±0.8)b 62.3(±1.1)ab 64.2(±1.3)b 60.2(±0.5)a 64.1(±0.7)b 69.1(±0.6)
Note: margins showing letters in the group are significantly different at the 5% level
Economic Resilience
System County System and County
Sub-theme P Org Con P Ki Mu Ma P Org_Ki Org_Mu Org_Ma Con_Ki Con_Mu Con_Ma
Internal
Investment p<0.05 43.4(±)0.6 41.8(±0.3) p<0.05 43.3(±0.5)a 44.2(±0.4)a 39.1(±0.5) p<0.05 48.4(±0.8) 43.3(±0.9)bc 39.0(±1.2)a 41.7(±0.6)b 44.5(±0.4)c 39.2(±0.5)a
Community
Investment p<0.05 31.4(±0.6) 27.6(±0.3) p<0.05 27.9(±0.5) 34.0(±0.4) 23.9(±0.4) p<0.05 35.4(±1.0)b 37.7(±0.9)b 21.7(±1.0) 25.5(±0.6)a 32.8(±0.5) 24.6(±0.5)a
Long-Ranging
Investment p<0.05 41.0(±0.8) 37.9(±0.3) p<0.05 33.8(±0.6)a 46.9(±0.6) 35.2(±0.6)a p<0.05 40.6(±1.1) 47.3(±1.4)b 35.3(±1.6)a 31.7(±0.6) 46.8(±0.6)b 35.1(±0.5)a
Profitability ns 49.5(±0.5)a 50.3(±0.3)a p<0.05 52.0(±0.4)a 51.5(±0.4)a 47.0(±0.4) p<0.05 53.9(±0.7) 50.2(±0.8)a 44.7(±1.1) 51.4(±0.5)a 51.9(±0.4)a 47.8(±0.4)
Stability of
Production ns 48.7(±0.5)a 49.6(±0.3)a p<0.05 50.1(±0.3)a 50.6(±0.4)a 47.5(±0.4) p<0.05 51.6(±0.6)c 50.1(±0.8)abc 44.8(±1.0) 49.6(±0.4)b 50.8(±0.4)c 48.3(±0.4)a
Stability of Supply p<0.05 69.6(±0.6) 64.5(±0.4) p<0.05 64.6(±0.6)a 64.4(±0.4)a 68.0(±0.6) p<0.05 70.0(±1.1)c 68.8(±0.9)bc 70.0(±1.3)bc 62.8(±0.7)a 63.1(±0.5)a 67.3(±0.6)b
Stability of Market p<0.05 50.9(±0.7) 47.5(±0.3) p<0.05 53.3(±0.5) 48.5(±0.6) 43.5(±0.5) p<0.05 57.3(±1.1) 53.7(±1.1)b 42.3(±1.5)a 52.0(±0.6)b 46.9(±0.7) 43.9(±0.5)a
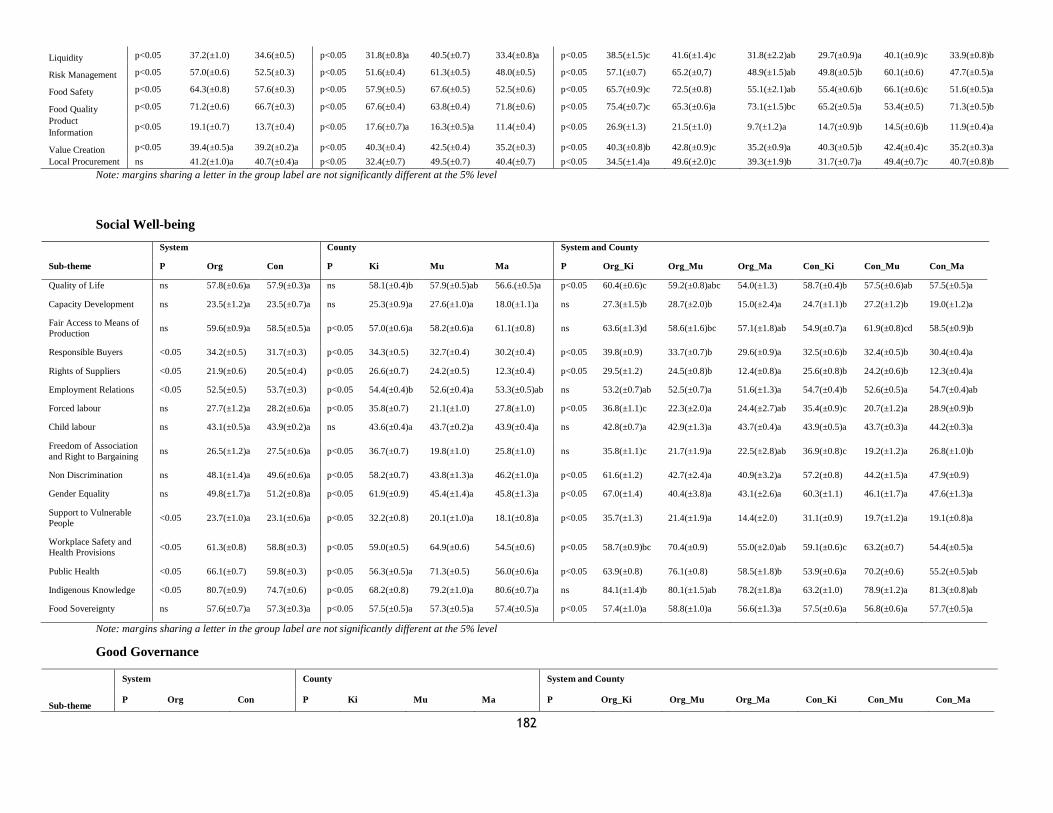
182
Liquidity p<0.05 37.2(±1.0) 34.6(±0.5) p<0.05 31.8(±0.8)a 40.5(±0.7) 33.4(±0.8)a p<0.05 38.5(±1.5)c 41.6(±1.4)c 31.8(±2.2)ab 29.7(±0.9)a 40.1(±0.9)c 33.9(±0.8)b
Risk Management p<0.05 57.0(±0.6) 52.5(±0.3) p<0.05 51.6(±0.4) 61.3(±0.5) 48.0(±0.5) p<0.05 57.1(±0.7) 65.2(±0,7) 48.9(±1.5)ab 49.8(±0.5)b 60.1(±0.6) 47.7(±0.5)a
Food Safety p<0.05 64.3(±0.8) 57.6(±0.3) p<0.05 57.9(±0.5) 67.6(±0.5) 52.5(±0.6) p<0.05 65.7(±0.9)c 72.5(±0.8) 55.1(±2.1)ab 55.4(±0.6)b 66.1(±0.6)c 51.6(±0.5)a
Food Quality p<0.05 71.2(±0.6) 66.7(±0.3) p<0.05 67.6(±0.4) 63.8(±0.4) 71.8(±0.6) p<0.05 75.4(±0.7)c 65.3(±0.6)a 73.1(±1.5)bc 65.2(±0.5)a 53.4(±0.5) 71.3(±0.5)b
Product
Information p<0.05 19.1(±0.7) 13.7(±0.4) p<0.05 17.6(±0.7)a 16.3(±0.5)a 11.4(±0.4) p<0.05 26.9(±1.3) 21.5(±1.0) 9.7(±1.2)a 14.7(±0.9)b 14.5(±0.6)b 11.9(±0.4)a
Value Creation p<0.05 39.4(±0.5)a 39.2(±0.2)a p<0.05 40.3(±0.4) 42.5(±0.4) 35.2(±0.3) p<0.05 40.3(±0.8)b 42.8(±0.9)c 35.2(±0.9)a 40.3(±0.5)b 42.4(±0.4)c 35.2(±0.3)a
Local Procurement ns 41.2(±1.0)a 40.7(±0.4)a p<0.05 32.4(±0.7) 49.5(±0.7) 40.4(±0.7) p<0.05 34.5(±1.4)a 49.6(±2.0)c 39.3(±1.9)b 31.7(±0.7)a 49.4(±0.7)c 40.7(±0.8)b
Note: margins sharing a letter in the group label are not significantly different at the 5% level
Social Well-being
System County System and County
Sub-theme P Org Con P Ki Mu Ma P Org_Ki Org_Mu Org_Ma Con_Ki Con_Mu Con_Ma
Quality of Life ns 57.8(±0.6)a 57.9(±0.3)a ns 58.1(±0.4)b 57.9(±0.5)ab 56.6.(±0.5)a p<0.05 60.4(±0.6)c 59.2(±0.8)abc 54.0(±1.3) 58.7(±0.4)b 57.5(±0.6)ab 57.5(±0.5)a
Capacity Development ns 23.5(±1.2)a 23.5(±0.7)a ns 25.3(±0.9)a 27.6(±1.0)a 18.0(±1.1)a ns 27.3(±1.5)b 28.7(±2.0)b 15.0(±2.4)a 24.7(±1.1)b 27.2(±1.2)b 19.0(±1.2)a
Fair Access to Means of
Production ns 59.6(±0.9)a 58.5(±0.5)a p<0.05 57.0(±0.6)a 58.2(±0.6)a 61.1(±0.8) ns 63.6(±1.3)d 58.6(±1.6)bc 57.1(±1.8)ab 54.9(±0.7)a 61.9(±0.8)cd 58.5(±0.9)b
Responsible Buyers <0.05 34.2(±0.5) 31.7(±0.3) p<0.05 34.3(±0.5) 32.7(±0.4) 30.2(±0.4) p<0.05 39.8(±0.9) 33.7(±0.7)b 29.6(±0.9)a 32.5(±0.6)b 32.4(±0.5)b 30.4(±0.4)a
Rights of Suppliers <0.05 21.9(±0.6) 20.5(±0.4) p<0.05 26.6(±0.7) 24.2(±0.5) 12.3(±0.4) p<0.05 29.5(±1.2) 24.5(±0.8)b 12.4(±0.8)a 25.6(±0.8)b 24.2(±0.6)b 12.3(±0.4)a
Employment Relations <0.05 52.5(±0.5) 53.7(±0.3) p<0.05 54.4(±0.4)b 52.6(±0.4)a 53.3(±0.5)ab ns 53.2(±0.7)ab 52.5(±0.7)a 51.6(±1.3)a 54.7(±0.4)b 52.6(±0.5)a 54.7(±0.4)ab
Forced labour ns 27.7(±1.2)a 28.2(±0.6)a p<0.05 35.8(±0.7) 21.1(±1.0) 27.8(±1.0) p<0.05 36.8(±1.1)c 22.3(±2.0)a 24.4(±2.7)ab 35.4(±0.9)c 20.7(±1.2)a 28.9(±0.9)b
Child labour ns 43.1(±0.5)a 43.9(±0.2)a ns 43.6(±0.4)a 43.7(±0.2)a 43.9(±0.4)a ns 42.8(±0.7)a 42.9(±1.3)a 43.7(±0.4)a 43.9(±0.5)a 43.7(±0.3)a 44.2(±0.3)a
Freedom of Association
and Right to Bargaining ns 26.5(±1.2)a 27.5(±0.6)a p<0.05 36.7(±0.7) 19.8(±1.0) 25.8(±1.0) ns 35.8(±1.1)c 21.7(±1.9)a 22.5(±2.8)ab 36.9(±0.8)c 19.2(±1.2)a 26.8(±1.0)b
Non Discrimination ns 48.1(±1.4)a 49.6(±0.6)a p<0.05 58.2(±0.7) 43.8(±1.3)a 46.2(±1.0)a p<0.05 61.6(±1.2) 42.7(±2.4)a 40.9(±3.2)a 57.2(±0.8) 44.2(±1.5)a 47.9(±0.9)
Gender Equality ns 49.8(±1.7)a 51.2(±0.8)a p<0.05 61.9(±0.9) 45.4(±1.4)a 45.8(±1.3)a p<0.05 67.0(±1.4) 40.4(±3.8)a 43.1(±2.6)a 60.3(±1.1) 46.1(±1.7)a 47.6(±1.3)a
Support to Vulnerable
People <0.05 23.7(±1.0)a 23.1(±0.6)a p<0.05 32.2(±0.8) 20.1(±1.0)a 18.1(±0.8)a p<0.05 35.7(±1.3) 21.4(±1.9)a 14.4(±2.0) 31.1(±0.9) 19.7(±1.2)a 19.1(±0.8)a
Workplace Safety and
Health Provisions <0.05 61.3(±0.8) 58.8(±0.3) p<0.05 59.0(±0.5) 64.9(±0.6) 54.5(±0.6) p<0.05 58.7(±0.9)bc 70.4(±0.9) 55.0(±2.0)ab 59.1(±0.6)c 63.2(±0.7) 54.4(±0.5)a
Public Health <0.05 66.1(±0.7) 59.8(±0.3) p<0.05 56.3(±0.5)a 71.3(±0.5) 56.0(±0.6)a p<0.05 63.9(±0.8) 76.1(±0.8) 58.5(±1.8)b 53.9(±0.6)a 70.2(±0.6) 55.2(±0.5)ab
Indigenous Knowledge <0.05 80.7(±0.9) 74.7(±0.6) p<0.05 68.2(±0.8) 79.2(±1.0)a 80.6(±0.7)a ns 84.1(±1.4)b 80.1(±1.5)ab 78.2(±1.8)a 63.2(±1.0) 78.9(±1.2)a 81.3(±0.8)ab
Food Sovereignty ns 57.6(±0.7)a 57.3(±0.3)a p<0.05 57.5(±0.5)a 57.3(±0.5)a 57.4(±0.5)a p<0.05 57.4(±1.0)a 58.8(±1.0)a 56.6(±1.3)a 57.5(±0.6)a 56.8(±0.6)a 57.7(±0.5)a
Note: margins sharing a letter in the group label are not significantly different at the 5% level
Good Governance
System County System and County
Sub-theme P Org Con P Ki Mu Ma P Org_Ki Org_Mu Org_Ma Con_Ki Con_Mu Con_Ma
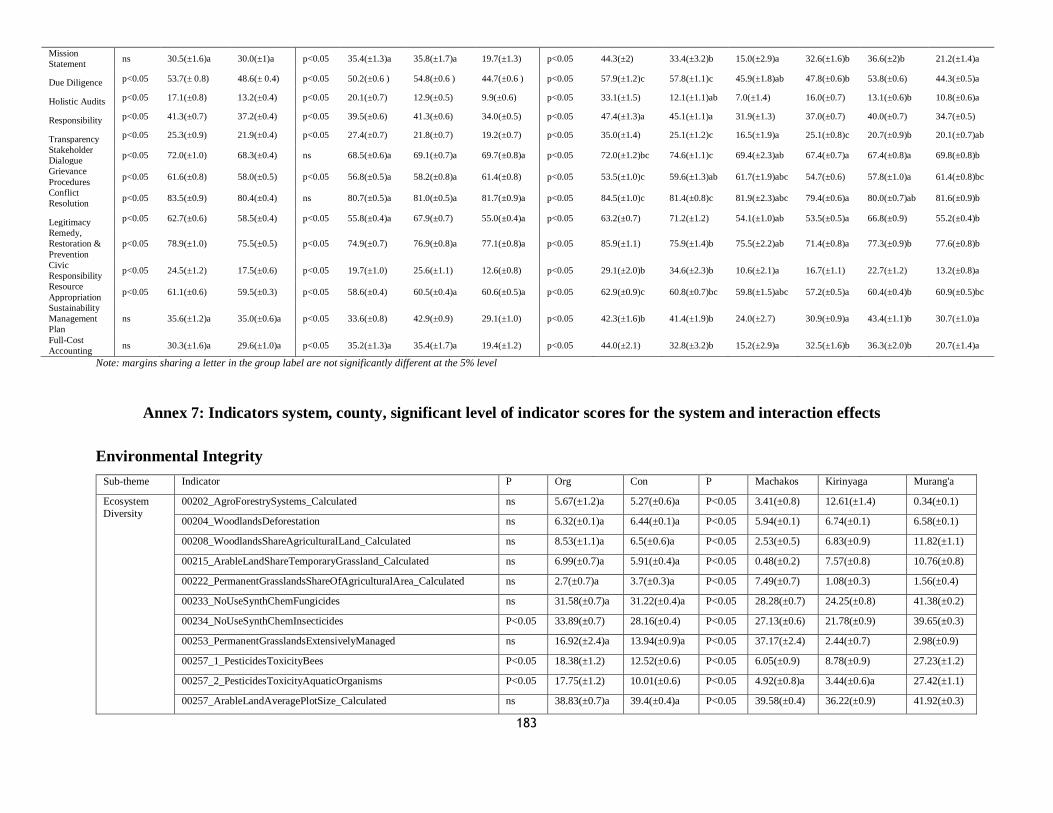
183
Mission
Statement ns 30.5(±1.6)a 30.0(±1)a p<0.05 35.4(±1.3)a 35.8(±1.7)a 19.7(±1.3) p<0.05 44.3(±2) 33.4(±3.2)b 15.0(±2.9)a 32.6(±1.6)b 36.6(±2)b 21.2(±1.4)a
Due Diligence p<0.05 53.7(± 0.8) 48.6(± 0.4) p<0.05 50.2(±0.6 ) 54.8(±0.6 ) 44.7(±0.6 ) p<0.05 57.9(±1.2)c 57.8(±1.1)c 45.9(±1.8)ab 47.8(±0.6)b 53.8(±0.6) 44.3(±0.5)a
Holistic Audits p<0.05 17.1(±0.8) 13.2(±0.4) p<0.05 20.1(±0.7) 12.9(±0.5) 9.9(±0.6) p<0.05 33.1(±1.5) 12.1(±1.1)ab 7.0(±1.4) 16.0(±0.7) 13.1(±0.6)b 10.8(±0.6)a
Responsibility p<0.05 41.3(±0.7) 37.2(±0.4) p<0.05 39.5(±0.6) 41.3(±0.6) 34.0(±0.5) p<0.05 47.4(±1.3)a 45.1(±1.1)a 31.9(±1.3) 37.0(±0.7) 40.0(±0.7) 34.7(±0.5)
Transparency p<0.05 25.3(±0.9) 21.9(±0.4) p<0.05 27.4(±0.7) 21.8(±0.7) 19.2(±0.7) p<0.05 35.0(±1.4) 25.1(±1.2)c 16.5(±1.9)a 25.1(±0.8)c 20.7(±0.9)b 20.1(±0.7)ab
Stakeholder
Dialogue p<0.05 72.0(±1.0) 68.3(±0.4) ns 68.5(±0.6)a 69.1(±0.7)a 69.7(±0.8)a p<0.05 72.0(±1.2)bc 74.6(±1.1)c 69.4(±2.3)ab 67.4(±0.7)a 67.4(±0.8)a 69.8(±0.8)b
Grievance
Procedures p<0.05 61.6(±0.8) 58.0(±0.5) p<0.05 56.8(±0.5)a 58.2(±0.8)a 61.4(±0.8) p<0.05 53.5(±1.0)c 59.6(±1.3)ab 61.7(±1.9)abc 54.7(±0.6) 57.8(±1.0)a 61.4(±0.8)bc
Conflict
Resolution p<0.05 83.5(±0.9) 80.4(±0.4) ns 80.7(±0.5)a 81.0(±0.5)a 81.7(±0.9)a p<0.05 84.5(±1.0)c 81.4(±0.8)c 81.9(±2.3)abc 79.4(±0.6)a 80.0(±0.7)ab 81.6(±0.9)b
Legitimacy p<0.05 62.7(±0.6) 58.5(±0.4) p<0.05 55.8(±0.4)a 67.9(±0.7) 55.0(±0.4)a p<0.05 63.2(±0.7) 71.2(±1.2) 54.1(±1.0)ab 53.5(±0.5)a 66.8(±0.9) 55.2(±0.4)b
Remedy,
Restoration &
Prevention
p<0.05 78.9(±1.0) 75.5(±0.5) p<0.05 74.9(±0.7) 76.9(±0.8)a 77.1(±0.8)a p<0.05 85.9(±1.1) 75.9(±1.4)b 75.5(±2.2)ab 71.4(±0.8)a 77.3(±0.9)b 77.6(±0.8)b
Civic
Responsibility p<0.05 24.5(±1.2) 17.5(±0.6) p<0.05 19.7(±1.0) 25.6(±1.1) 12.6(±0.8) p<0.05 29.1(±2.0)b 34.6(±2.3)b 10.6(±2.1)a 16.7(±1.1) 22.7(±1.2) 13.2(±0.8)a
Resource
Appropriation p<0.05 61.1(±0.6) 59.5(±0.3) p<0.05 58.6(±0.4) 60.5(±0.4)a 60.6(±0.5)a p<0.05 62.9(±0.9)c 60.8(±0.7)bc 59.8(±1.5)abc 57.2(±0.5)a 60.4(±0.4)b 60.9(±0.5)bc
Sustainability
Management
Plan
ns 35.6(±1.2)a 35.0(±0.6)a p<0.05 33.6(±0.8) 42.9(±0.9) 29.1(±1.0) p<0.05 42.3(±1.6)b 41.4(±1.9)b 24.0(±2.7) 30.9(±0.9)a 43.4(±1.1)b 30.7(±1.0)a
Full-Cost
Accounting ns 30.3(±1.6)a 29.6(±1.0)a p<0.05 35.2(±1.3)a 35.4(±1.7)a 19.4(±1.2) p<0.05 44.0(±2.1) 32.8(±3.2)b 15.2(±2.9)a 32.5(±1.6)b 36.3(±2.0)b 20.7(±1.4)a
Note: margins sharing a letter in the group label are not significantly different at the 5% level
Annex 7: Indicators system, county, significant level of indicator scores for the system and interaction effects
Environmental Integrity
Sub-theme Indicator P Org Con P Machakos Kirinyaga Murang'a
Ecosystem
Diversity
00202_AgroForestrySystems_Calculated ns 5.67(±1.2)a 5.27(±0.6)a P<0.05 3.41(±0.8) 12.61(±1.4) 0.34(±0.1)
00204_WoodlandsDeforestation ns 6.32(±0.1)a 6.44(±0.1)a P<0.05 5.94(±0.1) 6.74(±0.1) 6.58(±0.1)
00208_WoodlandsShareAgriculturalLand_Calculated ns 8.53(±1.1)a 6.5(±0.6)a P<0.05 2.53(±0.5) 6.83(±0.9) 11.82(±1.1)
00215_ArableLandShareTemporaryGrassland_Calculated ns 6.99(±0.7)a 5.91(±0.4)a P<0.05 0.48(±0.2) 7.57(±0.8) 10.76(±0.8)
00222_PermanentGrasslandsShareOfAgriculturalArea_Calculated ns 2.7(±0.7)a 3.7(±0.3)a P<0.05 7.49(±0.7) 1.08(±0.3) 1.56(±0.4)
00233_NoUseSynthChemFungicides ns 31.58(±0.7)a 31.22(±0.4)a P<0.05 28.28(±0.7) 24.25(±0.8) 41.38(±0.2)
00234_NoUseSynthChemInsecticides P<0.05 33.89(±0.7) 28.16(±0.4) P<0.05 27.13(±0.6) 21.78(±0.9) 39.65(±0.3)
00253_PermanentGrasslandsExtensivelyManaged ns 16.92(±2.4)a 13.94(±0.9)a P<0.05 37.17(±2.4) 2.44(±0.7) 2.98(±0.9)
00257_1_PesticidesToxicityBees P<0.05 18.38(±1.2) 12.52(±0.6) P<0.05 6.05(±0.9) 8.78(±0.9) 27.23(±1.2)
00257_2_PesticidesToxicityAquaticOrganisms P<0.05 17.75(±1.2) 10.01(±0.6) P<0.05 4.92(±0.8)a 3.44(±0.6)a 27.42(±1.1)
00257_ArableLandAveragePlotSize_Calculated ns 38.83(±0.7)a 39.4(±0.4)a P<0.05 39.58(±0.4) 36.22(±0.9) 41.92(±0.3)
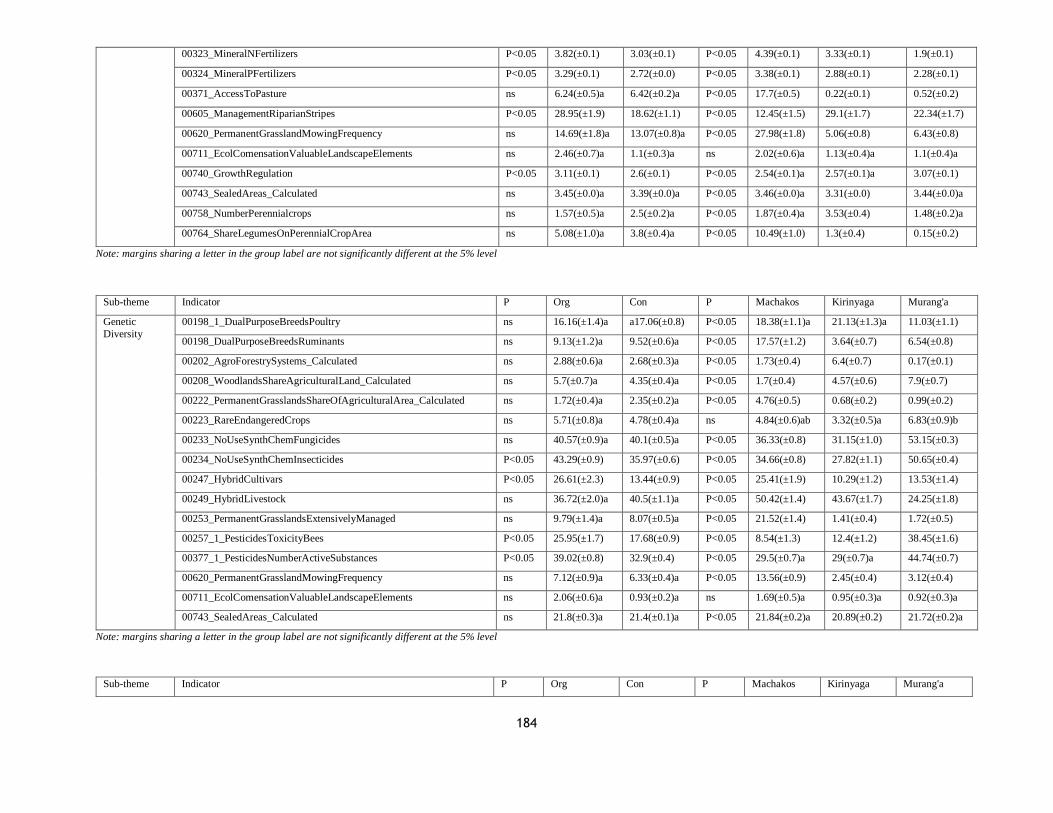
184
00323_MineralNFertilizers P<0.05 3.82(±0.1) 3.03(±0.1) P<0.05 4.39(±0.1) 3.33(±0.1) 1.9(±0.1)
00324_MineralPFertilizers P<0.05 3.29(±0.1) 2.72(±0.0) P<0.05 3.38(±0.1) 2.88(±0.1) 2.28(±0.1)
00371_AccessToPasture ns 6.24(±0.5)a 6.42(±0.2)a P<0.05 17.7(±0.5) 0.22(±0.1) 0.52(±0.2)
00605_ManagementRiparianStripes P<0.05 28.95(±1.9) 18.62(±1.1) P<0.05 12.45(±1.5) 29.1(±1.7) 22.34(±1.7)
00620_PermanentGrasslandMowingFrequency ns 14.69(±1.8)a 13.07(±0.8)a P<0.05 27.98(±1.8) 5.06(±0.8) 6.43(±0.8)
00711_EcolComensationValuableLandscapeElements ns 2.46(±0.7)a 1.1(±0.3)a ns 2.02(±0.6)a 1.13(±0.4)a 1.1(±0.4)a
00740_GrowthRegulation P<0.05 3.11(±0.1) 2.6(±0.1) P<0.05 2.54(±0.1)a 2.57(±0.1)a 3.07(±0.1)
00743_SealedAreas_Calculated ns 3.45(±0.0)a 3.39(±0.0)a P<0.05 3.46(±0.0)a 3.31(±0.0) 3.44(±0.0)a
00758_NumberPerennialcrops ns 1.57(±0.5)a 2.5(±0.2)a P<0.05 1.87(±0.4)a 3.53(±0.4) 1.48(±0.2)a
00764_ShareLegumesOnPerennialCropArea ns 5.08(±1.0)a 3.8(±0.4)a P<0.05 10.49(±1.0) 1.3(±0.4) 0.15(±0.2)
Note: margins sharing a letter in the group label are not significantly different at the 5% level
Sub-theme Indicator P Org Con P Machakos Kirinyaga Murang'a
Genetic
Diversity
00198_1_DualPurposeBreedsPoultry ns 16.16(±1.4)a a17.06(±0.8) P<0.05 18.38(±1.1)a 21.13(±1.3)a 11.03(±1.1)
00198_DualPurposeBreedsRuminants ns 9.13(±1.2)a 9.52(±0.6)a P<0.05 17.57(±1.2) 3.64(±0.7) 6.54(±0.8)
00202_AgroForestrySystems_Calculated ns 2.88(±0.6)a 2.68(±0.3)a P<0.05 1.73(±0.4) 6.4(±0.7) 0.17(±0.1)
00208_WoodlandsShareAgriculturalLand_Calculated ns 5.7(±0.7)a 4.35(±0.4)a P<0.05 1.7(±0.4) 4.57(±0.6) 7.9(±0.7)
00222_PermanentGrasslandsShareOfAgriculturalArea_Calculated ns 1.72(±0.4)a 2.35(±0.2)a P<0.05 4.76(±0.5) 0.68(±0.2) 0.99(±0.2)
00223_RareEndangeredCrops ns 5.71(±0.8)a 4.78(±0.4)a ns 4.84(±0.6)ab 3.32(±0.5)a 6.83(±0.9)b
00233_NoUseSynthChemFungicides ns 40.57(±0.9)a 40.1(±0.5)a P<0.05 36.33(±0.8) 31.15(±1.0) 53.15(±0.3)
00234_NoUseSynthChemInsecticides P<0.05 43.29(±0.9) 35.97(±0.6) P<0.05 34.66(±0.8) 27.82(±1.1) 50.65(±0.4)
00247_HybridCultivars P<0.05 26.61(±2.3) 13.44(±0.9) P<0.05 25.41(±1.9) 10.29(±1.2) 13.53(±1.4)
00249_HybridLivestock ns 36.72(±2.0)a 40.5(±1.1)a P<0.05 50.42(±1.4) 43.67(±1.7) 24.25(±1.8)
00253_PermanentGrasslandsExtensivelyManaged ns 9.79(±1.4)a 8.07(±0.5)a P<0.05 21.52(±1.4) 1.41(±0.4) 1.72(±0.5)
00257_1_PesticidesToxicityBees P<0.05 25.95(±1.7) 17.68(±0.9) P<0.05 8.54(±1.3) 12.4(±1.2) 38.45(±1.6)
00377_1_PesticidesNumberActiveSubstances P<0.05 39.02(±0.8) 32.9(±0.4) P<0.05 29.5(±0.7)a 29(±0.7)a 44.74(±0.7)
00620_PermanentGrasslandMowingFrequency ns 7.12(±0.9)a 6.33(±0.4)a P<0.05 13.56(±0.9) 2.45(±0.4) 3.12(±0.4)
00711_EcolComensationValuableLandscapeElements ns 2.06(±0.6)a 0.93(±0.2)a ns 1.69(±0.5)a 0.95(±0.3)a 0.92(±0.3)a
00743_SealedAreas_Calculated ns 21.8(±0.3)a 21.4(±0.1)a P<0.05 21.84(±0.2)a 20.89(±0.2) 21.72(±0.2)a
Note: margins sharing a letter in the group label are not significantly different at the 5% level
Sub-theme Indicator P Org Con P Machakos Kirinyaga Murang'a
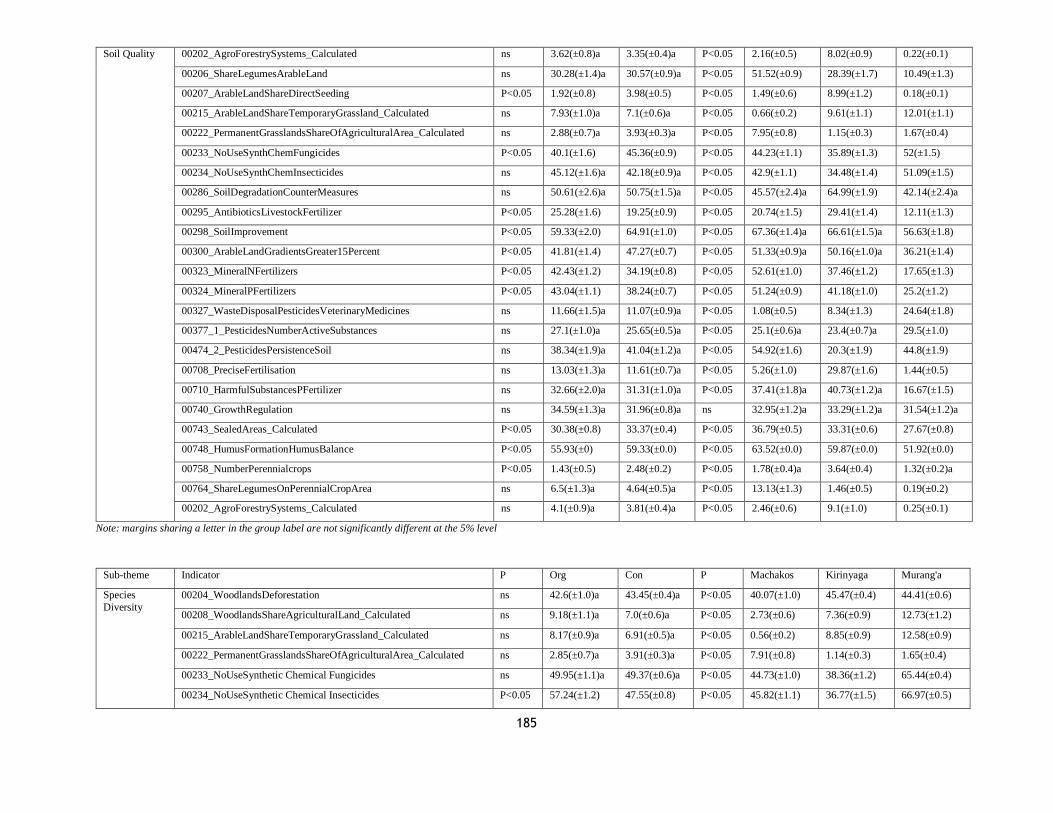
185
Soil Quality 00202_AgroForestrySystems_Calculated ns 3.62(±0.8)a 3.35(±0.4)a P<0.05 2.16(±0.5) 8.02(±0.9) 0.22(±0.1)
00206_ShareLegumesArableLand ns 30.28(±1.4)a 30.57(±0.9)a P<0.05 51.52(±0.9) 28.39(±1.7) 10.49(±1.3)
00207_ArableLandShareDirectSeeding P<0.05 1.92(±0.8) 3.98(±0.5) P<0.05 1.49(±0.6) 8.99(±1.2) 0.18(±0.1)
00215_ArableLandShareTemporaryGrassland_Calculated ns 7.93(±1.0)a 7.1(±0.6)a P<0.05 0.66(±0.2) 9.61(±1.1) 12.01(±1.1)
00222_PermanentGrasslandsShareOfAgriculturalArea_Calculated ns 2.88(±0.7)a 3.93(±0.3)a P<0.05 7.95(±0.8) 1.15(±0.3) 1.67(±0.4)
00233_NoUseSynthChemFungicides P<0.05 40.1(±1.6) 45.36(±0.9) P<0.05 44.23(±1.1) 35.89(±1.3) 52(±1.5)
00234_NoUseSynthChemInsecticides ns 45.12(±1.6)a 42.18(±0.9)a P<0.05 42.9(±1.1) 34.48(±1.4) 51.09(±1.5)
00286_SoilDegradationCounterMeasures ns 50.61(±2.6)a 50.75(±1.5)a P<0.05 45.57(±2.4)a 64.99(±1.9) 42.14(±2.4)a
00295_AntibioticsLivestockFertilizer P<0.05 25.28(±1.6) 19.25(±0.9) P<0.05 20.74(±1.5) 29.41(±1.4) 12.11(±1.3)
00298_SoilImprovement P<0.05 59.33(±2.0) 64.91(±1.0) P<0.05 67.36(±1.4)a 66.61(±1.5)a 56.63(±1.8)
00300_ArableLandGradientsGreater15Percent P<0.05 41.81(±1.4) 47.27(±0.7) P<0.05 51.33(±0.9)a 50.16(±1.0)a 36.21(±1.4)
00323_MineralNFertilizers P<0.05 42.43(±1.2) 34.19(±0.8) P<0.05 52.61(±1.0) 37.46(±1.2) 17.65(±1.3)
00324_MineralPFertilizers P<0.05 43.04(±1.1) 38.24(±0.7) P<0.05 51.24(±0.9) 41.18(±1.0) 25.2(±1.2)
00327_WasteDisposalPesticidesVeterinaryMedicines ns 11.66(±1.5)a 11.07(±0.9)a P<0.05 1.08(±0.5) 8.34(±1.3) 24.64(±1.8)
00377_1_PesticidesNumberActiveSubstances ns 27.1(±1.0)a 25.65(±0.5)a P<0.05 25.1(±0.6)a 23.4(±0.7)a 29.5(±1.0)
00474_2_PesticidesPersistenceSoil ns 38.34(±1.9)a 41.04(±1.2)a P<0.05 54.92(±1.6) 20.3(±1.9) 44.8(±1.9)
00708_PreciseFertilisation ns 13.03(±1.3)a 11.61(±0.7)a P<0.05 5.26(±1.0) 29.87(±1.6) 1.44(±0.5)
00710_HarmfulSubstancesPFertilizer ns 32.66(±2.0)a 31.31(±1.0)a P<0.05 37.41(±1.8)a 40.73(±1.2)a 16.67(±1.5)
00740_GrowthRegulation ns 34.59(±1.3)a 31.96(±0.8)a ns 32.95(±1.2)a 33.29(±1.2)a 31.54(±1.2)a
00743_SealedAreas_Calculated P<0.05 30.38(±0.8) 33.37(±0.4) P<0.05 36.79(±0.5) 33.31(±0.6) 27.67(±0.8)
00748_HumusFormationHumusBalance P<0.05 55.93(±0) 59.33(±0.0) P<0.05 63.52(±0.0) 59.87(±0.0) 51.92(±0.0)
00758_NumberPerennialcrops P<0.05 1.43(±0.5) 2.48(±0.2) P<0.05 1.78(±0.4)a 3.64(±0.4) 1.32(±0.2)a
00764_ShareLegumesOnPerennialCropArea ns 6.5(±1.3)a 4.64(±0.5)a P<0.05 13.13(±1.3) 1.46(±0.5) 0.19(±0.2)
00202_AgroForestrySystems_Calculated ns 4.1(±0.9)a 3.81(±0.4)a P<0.05 2.46(±0.6) 9.1(±1.0) 0.25(±0.1)
Note: margins sharing a letter in the group label are not significantly different at the 5% level
Sub-theme Indicator P Org Con P Machakos Kirinyaga Murang'a
Species
Diversity
00204_WoodlandsDeforestation ns 42.6(±1.0)a 43.45(±0.4)a P<0.05 40.07(±1.0) 45.47(±0.4) 44.41(±0.6)
00208_WoodlandsShareAgriculturalLand_Calculated ns 9.18(±1.1)a 7.0(±0.6)a P<0.05 2.73(±0.6) 7.36(±0.9) 12.73(±1.2)
00215_ArableLandShareTemporaryGrassland_Calculated ns 8.17(±0.9)a 6.91(±0.5)a P<0.05 0.56(±0.2) 8.85(±0.9) 12.58(±0.9)
00222_PermanentGrasslandsShareOfAgriculturalArea_Calculated ns 2.85(±0.7)a 3.91(±0.3)a P<0.05 7.91(±0.8) 1.14(±0.3) 1.65(±0.4)
00233_NoUseSynthetic Chemical Fungicides ns 49.95(±1.1)a 49.37(±0.6)a P<0.05 44.73(±1.0) 38.36(±1.2) 65.44(±0.4)
00234_NoUseSynthetic Chemical Insecticides P<0.05 57.24(±1.2) 47.55(±0.8) P<0.05 45.82(±1.1) 36.77(±1.5) 66.97(±0.5)
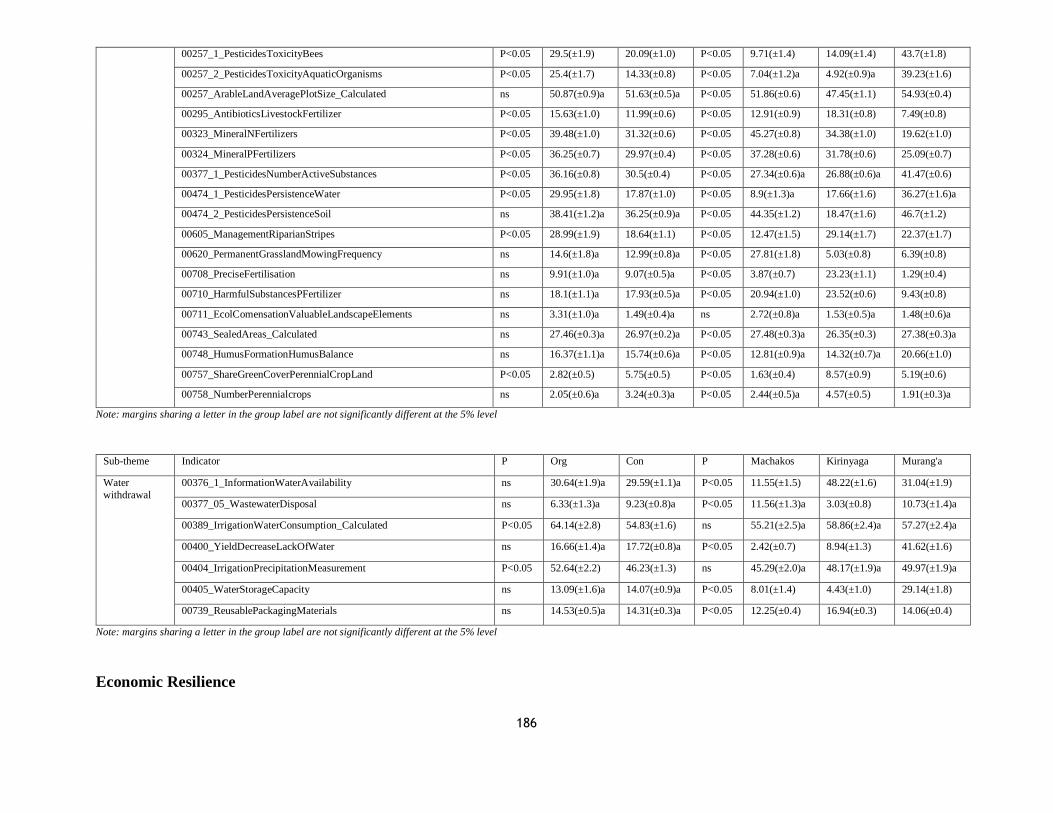
186
00257_1_PesticidesToxicityBees P<0.05 29.5(±1.9) 20.09(±1.0) P<0.05 9.71(±1.4) 14.09(±1.4) 43.7(±1.8)
00257_2_PesticidesToxicityAquaticOrganisms P<0.05 25.4(±1.7) 14.33(±0.8) P<0.05 7.04(±1.2)a 4.92(±0.9)a 39.23(±1.6)
00257_ArableLandAveragePlotSize_Calculated ns 50.87(±0.9)a 51.63(±0.5)a P<0.05 51.86(±0.6) 47.45(±1.1) 54.93(±0.4)
00295_AntibioticsLivestockFertilizer P<0.05 15.63(±1.0) 11.99(±0.6) P<0.05 12.91(±0.9) 18.31(±0.8) 7.49(±0.8)
00323_MineralNFertilizers P<0.05 39.48(±1.0) 31.32(±0.6) P<0.05 45.27(±0.8) 34.38(±1.0) 19.62(±1.0)
00324_MineralPFertilizers P<0.05 36.25(±0.7) 29.97(±0.4) P<0.05 37.28(±0.6) 31.78(±0.6) 25.09(±0.7)
00377_1_PesticidesNumberActiveSubstances P<0.05 36.16(±0.8) 30.5(±0.4) P<0.05 27.34(±0.6)a 26.88(±0.6)a 41.47(±0.6)
00474_1_PesticidesPersistenceWater P<0.05 29.95(±1.8) 17.87(±1.0) P<0.05 8.9(±1.3)a 17.66(±1.6) 36.27(±1.6)a
00474_2_PesticidesPersistenceSoil ns 38.41(±1.2)a 36.25(±0.9)a P<0.05 44.35(±1.2) 18.47(±1.6) 46.7(±1.2)
00605_ManagementRiparianStripes P<0.05 28.99(±1.9) 18.64(±1.1) P<0.05 12.47(±1.5) 29.14(±1.7) 22.37(±1.7)
00620_PermanentGrasslandMowingFrequency ns 14.6(±1.8)a 12.99(±0.8)a P<0.05 27.81(±1.8) 5.03(±0.8) 6.39(±0.8)
00708_PreciseFertilisation ns 9.91(±1.0)a 9.07(±0.5)a P<0.05 3.87(±0.7) 23.23(±1.1) 1.29(±0.4)
00710_HarmfulSubstancesPFertilizer ns 18.1(±1.1)a 17.93(±0.5)a P<0.05 20.94(±1.0) 23.52(±0.6) 9.43(±0.8)
00711_EcolComensationValuableLandscapeElements ns 3.31(±1.0)a 1.49(±0.4)a ns 2.72(±0.8)a 1.53(±0.5)a 1.48(±0.6)a
00743_SealedAreas_Calculated ns 27.46(±0.3)a 26.97(±0.2)a P<0.05 27.48(±0.3)a 26.35(±0.3) 27.38(±0.3)a
00748_HumusFormationHumusBalance ns 16.37(±1.1)a 15.74(±0.6)a P<0.05 12.81(±0.9)a 14.32(±0.7)a 20.66(±1.0)
00757_ShareGreenCoverPerennialCropLand P<0.05 2.82(±0.5) 5.75(±0.5) P<0.05 1.63(±0.4) 8.57(±0.9) 5.19(±0.6)
00758_NumberPerennialcrops ns 2.05(±0.6)a 3.24(±0.3)a P<0.05 2.44(±0.5)a 4.57(±0.5) 1.91(±0.3)a
Note: margins sharing a letter in the group label are not significantly different at the 5% level
Sub-theme Indicator P Org Con P Machakos Kirinyaga Murang'a
Water
withdrawal
00376_1_InformationWaterAvailability ns 30.64(±1.9)a 29.59(±1.1)a P<0.05 11.55(±1.5) 48.22(±1.6) 31.04(±1.9)
00377_05_WastewaterDisposal ns 6.33(±1.3)a 9.23(±0.8)a P<0.05 11.56(±1.3)a 3.03(±0.8) 10.73(±1.4)a
00389_IrrigationWaterConsumption_Calculated P<0.05 64.14(±2.8) 54.83(±1.6) ns 55.21(±2.5)a 58.86(±2.4)a 57.27(±2.4)a
00400_YieldDecreaseLackOfWater ns 16.66(±1.4)a 17.72(±0.8)a P<0.05 2.42(±0.7) 8.94(±1.3) 41.62(±1.6)
00404_IrrigationPrecipitationMeasurement P<0.05 52.64(±2.2) 46.23(±1.3) ns 45.29(±2.0)a 48.17(±1.9)a 49.97(±1.9)a
00405_WaterStorageCapacity ns 13.09(±1.6)a 14.07(±0.9)a P<0.05 8.01(±1.4) 4.43(±1.0) 29.14(±1.8)
00739_ReusablePackagingMaterials ns 14.53(±0.5)a 14.31(±0.3)a P<0.05 12.25(±0.4) 16.94(±0.3) 14.06(±0.4)
Note: margins sharing a letter in the group label are not significantly different at the 5% level
Economic Resilience
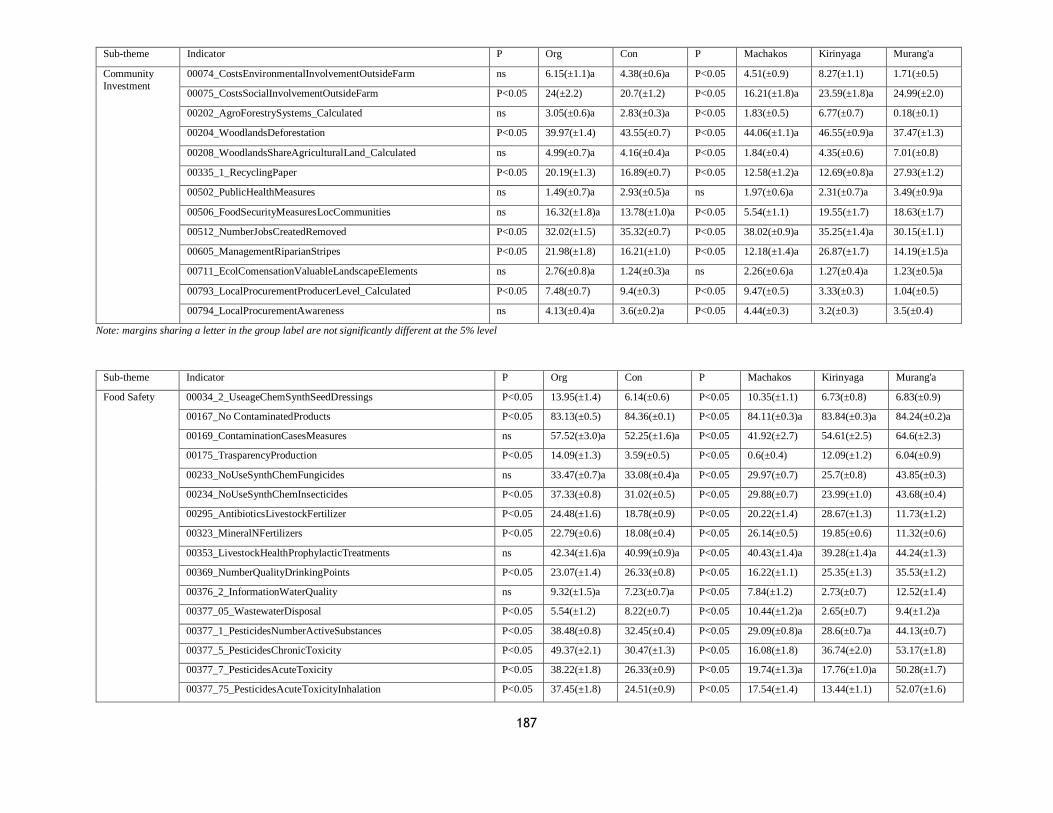
187
Sub-theme Indicator P Org Con P Machakos Kirinyaga Murang'a
Community
Investment
00074_CostsEnvironmentalInvolvementOutsideFarm ns 6.15(±1.1)a 4.38(±0.6)a P<0.05 4.51(±0.9) 8.27(±1.1) 1.71(±0.5)
00075_CostsSocialInvolvementOutsideFarm P<0.05 24(±2.2) 20.7(±1.2) P<0.05 16.21(±1.8)a 23.59(±1.8)a 24.99(±2.0)
00202_AgroForestrySystems_Calculated ns 3.05(±0.6)a 2.83(±0.3)a P<0.05 1.83(±0.5) 6.77(±0.7) 0.18(±0.1)
00204_WoodlandsDeforestation P<0.05 39.97(±1.4) 43.55(±0.7) P<0.05 44.06(±1.1)a 46.55(±0.9)a 37.47(±1.3)
00208_WoodlandsShareAgriculturalLand_Calculated ns 4.99(±0.7)a 4.16(±0.4)a P<0.05 1.84(±0.4) 4.35(±0.6) 7.01(±0.8)
00335_1_RecyclingPaper P<0.05 20.19(±1.3) 16.89(±0.7) P<0.05 12.58(±1.2)a 12.69(±0.8)a 27.93(±1.2)
00502_PublicHealthMeasures ns 1.49(±0.7)a 2.93(±0.5)a ns 1.97(±0.6)a 2.31(±0.7)a 3.49(±0.9)a
00506_FoodSecurityMeasuresLocCommunities ns 16.32(±1.8)a 13.78(±1.0)a P<0.05 5.54(±1.1) 19.55(±1.7) 18.63(±1.7)
00512_NumberJobsCreatedRemoved P<0.05 32.02(±1.5) 35.32(±0.7) P<0.05 38.02(±0.9)a 35.25(±1.4)a 30.15(±1.1)
00605_ManagementRiparianStripes P<0.05 21.98(±1.8) 16.21(±1.0) P<0.05 12.18(±1.4)a 26.87(±1.7) 14.19(±1.5)a
00711_EcolComensationValuableLandscapeElements ns 2.76(±0.8)a 1.24(±0.3)a ns 2.26(±0.6)a 1.27(±0.4)a 1.23(±0.5)a
00793_LocalProcurementProducerLevel_Calculated P<0.05 7.48(±0.7) 9.4(±0.3) P<0.05 9.47(±0.5) 3.33(±0.3) 1.04(±0.5)
00794_LocalProcurementAwareness ns 4.13(±0.4)a 3.6(±0.2)a P<0.05 4.44(±0.3) 3.2(±0.3) 3.5(±0.4)
Note: margins sharing a letter in the group label are not significantly different at the 5% level
Sub-theme Indicator P Org Con P Machakos Kirinyaga Murang'a
Food Safety 00034_2_UseageChemSynthSeedDressings P<0.05 13.95(±1.4) 6.14(±0.6) P<0.05 10.35(±1.1) 6.73(±0.8) 6.83(±0.9)
00167_No ContaminatedProducts P<0.05 83.13(±0.5) 84.36(±0.1) P<0.05 84.11(±0.3)a 83.84(±0.3)a 84.24(±0.2)a
00169_ContaminationCasesMeasures ns 57.52(±3.0)a 52.25(±1.6)a P<0.05 41.92(±2.7) 54.61(±2.5) 64.6(±2.3)
00175_TrasparencyProduction P<0.05 14.09(±1.3) 3.59(±0.5) P<0.05 0.6(±0.4) 12.09(±1.2) 6.04(±0.9)
00233_NoUseSynthChemFungicides ns 33.47(±0.7)a 33.08(±0.4)a P<0.05 29.97(±0.7) 25.7(±0.8) 43.85(±0.3)
00234_NoUseSynthChemInsecticides P<0.05 37.33(±0.8) 31.02(±0.5) P<0.05 29.88(±0.7) 23.99(±1.0) 43.68(±0.4)
00295_AntibioticsLivestockFertilizer P<0.05 24.48(±1.6) 18.78(±0.9) P<0.05 20.22(±1.4) 28.67(±1.3) 11.73(±1.2)
00323_MineralNFertilizers P<0.05 22.79(±0.6) 18.08(±0.4) P<0.05 26.14(±0.5) 19.85(±0.6) 11.32(±0.6)
00353_LivestockHealthProphylacticTreatments ns 42.34(±1.6)a 40.99(±0.9)a P<0.05 40.43(±1.4)a 39.28(±1.4)a 44.24(±1.3)
00369_NumberQualityDrinkingPoints P<0.05 23.07(±1.4) 26.33(±0.8) P<0.05 16.22(±1.1) 25.35(±1.3) 35.53(±1.2)
00376_2_InformationWaterQuality ns 9.32(±1.5)a 7.23(±0.7)a P<0.05 7.84(±1.2) 2.73(±0.7) 12.52(±1.4)
00377_05_WastewaterDisposal P<0.05 5.54(±1.2) 8.22(±0.7) P<0.05 10.44(±1.2)a 2.65(±0.7) 9.4(±1.2)a
00377_1_PesticidesNumberActiveSubstances P<0.05 38.48(±0.8) 32.45(±0.4) P<0.05 29.09(±0.8)a 28.6(±0.7)a 44.13(±0.7)
00377_5_PesticidesChronicToxicity P<0.05 49.37(±2.1) 30.47(±1.3) P<0.05 16.08(±1.8) 36.74(±2.0) 53.17(±1.8)
00377_7_PesticidesAcuteToxicity P<0.05 38.22(±1.8) 26.33(±0.9) P<0.05 19.74(±1.3)a 17.76(±1.0)a 50.28(±1.7)
00377_75_PesticidesAcuteToxicityInhalation P<0.05 37.45(±1.8) 24.51(±0.9) P<0.05 17.54(±1.4) 13.44(±1.1) 52.07(±1.6)
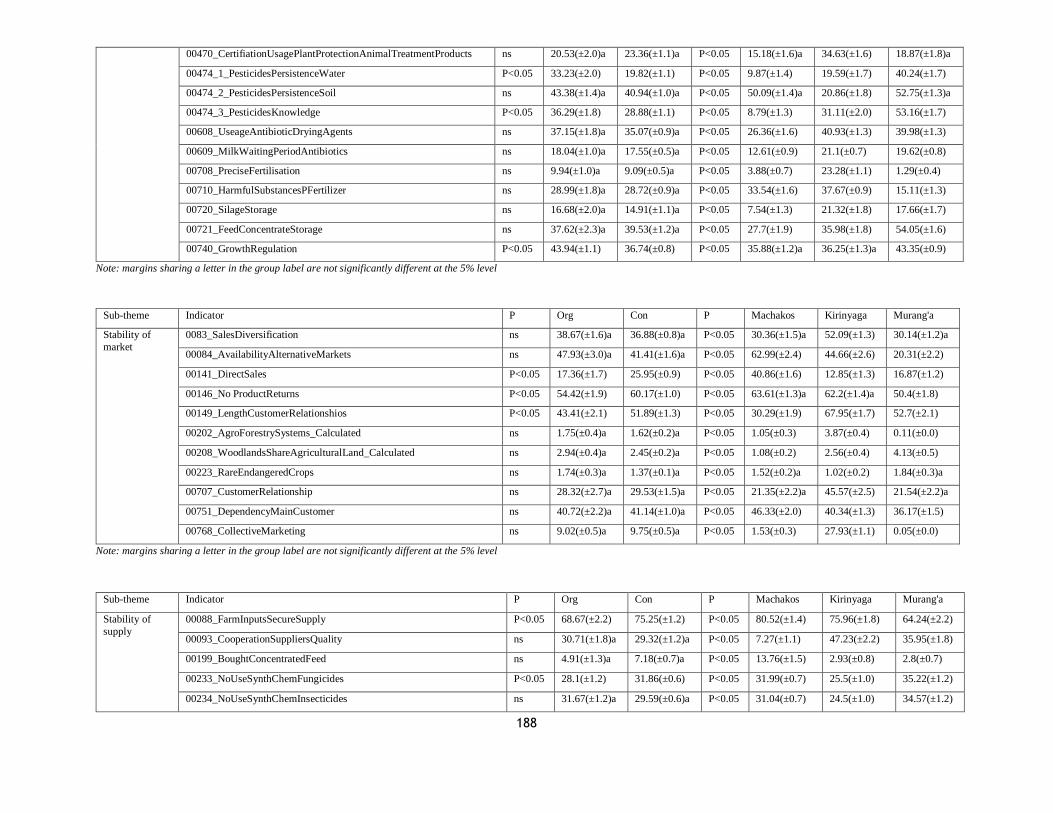
188
00470_CertifiationUsagePlantProtectionAnimalTreatmentProducts ns 20.53(±2.0)a 23.36(±1.1)a P<0.05 15.18(±1.6)a 34.63(±1.6) 18.87(±1.8)a
00474_1_PesticidesPersistenceWater P<0.05 33.23(±2.0) 19.82(±1.1) P<0.05 9.87(±1.4) 19.59(±1.7) 40.24(±1.7)
00474_2_PesticidesPersistenceSoil ns 43.38(±1.4)a 40.94(±1.0)a P<0.05 50.09(±1.4)a 20.86(±1.8) 52.75(±1.3)a
00474_3_PesticidesKnowledge P<0.05 36.29(±1.8) 28.88(±1.1) P<0.05 8.79(±1.3) 31.11(±2.0) 53.16(±1.7)
00608_UseageAntibioticDryingAgents ns 37.15(±1.8)a 35.07(±0.9)a P<0.05 26.36(±1.6) 40.93(±1.3) 39.98(±1.3)
00609_MilkWaitingPeriodAntibiotics ns 18.04(±1.0)a 17.55(±0.5)a P<0.05 12.61(±0.9) 21.1(±0.7) 19.62(±0.8)
00708_PreciseFertilisation ns 9.94(±1.0)a 9.09(±0.5)a P<0.05 3.88(±0.7) 23.28(±1.1) 1.29(±0.4)
00710_HarmfulSubstancesPFertilizer ns 28.99(±1.8)a 28.72(±0.9)a P<0.05 33.54(±1.6) 37.67(±0.9) 15.11(±1.3)
00720_SilageStorage ns 16.68(±2.0)a 14.91(±1.1)a P<0.05 7.54(±1.3) 21.32(±1.8) 17.66(±1.7)
00721_FeedConcentrateStorage ns 37.62(±2.3)a 39.53(±1.2)a P<0.05 27.7(±1.9) 35.98(±1.8) 54.05(±1.6)
00740_GrowthRegulation P<0.05 43.94(±1.1) 36.74(±0.8) P<0.05 35.88(±1.2)a 36.25(±1.3)a 43.35(±0.9)
Note: margins sharing a letter in the group label are not significantly different at the 5% level
Sub-theme Indicator P Org Con P Machakos Kirinyaga Murang'a
Stability of
market
0083_SalesDiversification ns 38.67(±1.6)a 36.88(±0.8)a P<0.05 30.36(±1.5)a 52.09(±1.3) 30.14(±1.2)a
00084_AvailabilityAlternativeMarkets ns 47.93(±3.0)a 41.41(±1.6)a P<0.05 62.99(±2.4) 44.66(±2.6) 20.31(±2.2)
00141_DirectSales P<0.05 17.36(±1.7) 25.95(±0.9) P<0.05 40.86(±1.6) 12.85(±1.3) 16.87(±1.2)
00146_No ProductReturns P<0.05 54.42(±1.9) 60.17(±1.0) P<0.05 63.61(±1.3)a 62.2(±1.4)a 50.4(±1.8)
00149_LengthCustomerRelationshios P<0.05 43.41(±2.1) 51.89(±1.3) P<0.05 30.29(±1.9) 67.95(±1.7) 52.7(±2.1)
00202_AgroForestrySystems_Calculated ns 1.75(±0.4)a 1.62(±0.2)a P<0.05 1.05(±0.3) 3.87(±0.4) 0.11(±0.0)
00208_WoodlandsShareAgriculturalLand_Calculated ns 2.94(±0.4)a 2.45(±0.2)a P<0.05 1.08(±0.2) 2.56(±0.4) 4.13(±0.5)
00223_RareEndangeredCrops ns 1.74(±0.3)a 1.37(±0.1)a P<0.05 1.52(±0.2)a 1.02(±0.2) 1.84(±0.3)a
00707_CustomerRelationship ns 28.32(±2.7)a 29.53(±1.5)a P<0.05 21.35(±2.2)a 45.57(±2.5) 21.54(±2.2)a
00751_DependencyMainCustomer ns 40.72(±2.2)a 41.14(±1.0)a P<0.05 46.33(±2.0) 40.34(±1.3) 36.17(±1.5)
00768_CollectiveMarketing ns 9.02(±0.5)a 9.75(±0.5)a P<0.05 1.53(±0.3) 27.93(±1.1) 0.05(±0.0)
Note: margins sharing a letter in the group label are not significantly different at the 5% level
Sub-theme Indicator P Org Con P Machakos Kirinyaga Murang'a
Stability of
supply
00088_FarmInputsSecureSupply P<0.05 68.67(±2.2) 75.25(±1.2) P<0.05 80.52(±1.4) 75.96(±1.8) 64.24(±2.2)
00093_CooperationSuppliersQuality ns 30.71(±1.8)a 29.32(±1.2)a P<0.05 7.27(±1.1) 47.23(±2.2) 35.95(±1.8)
00199_BoughtConcentratedFeed ns 4.91(±1.3)a 7.18(±0.7)a P<0.05 13.76(±1.5) 2.93(±0.8) 2.8(±0.7)
00233_NoUseSynthChemFungicides P<0.05 28.1(±1.2) 31.86(±0.6) P<0.05 31.99(±0.7) 25.5(±1.0) 35.22(±1.2)
00234_NoUseSynthChemInsecticides ns 31.67(±1.2)a 29.59(±0.6)a P<0.05 31.04(±0.7) 24.5(±1.0) 34.57(±1.2)
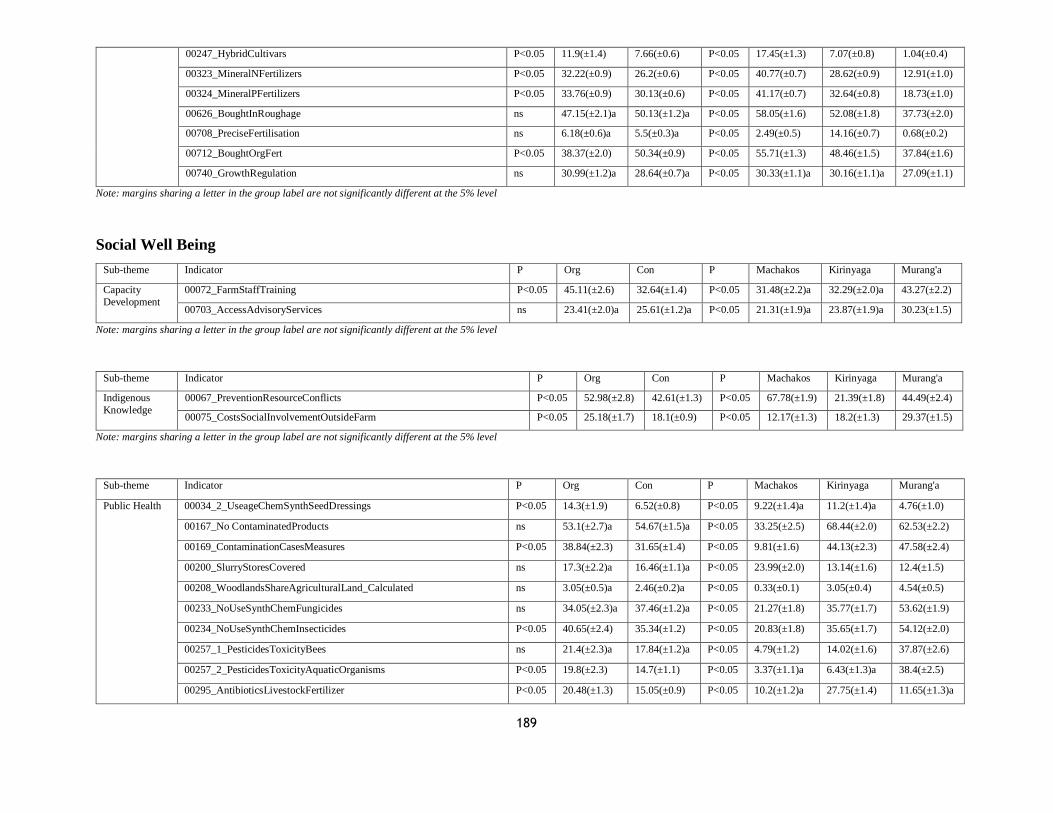
189
00247_HybridCultivars P<0.05 11.9(±1.4) 7.66(±0.6) P<0.05 17.45(±1.3) 7.07(±0.8) 1.04(±0.4)
00323_MineralNFertilizers P<0.05 32.22(±0.9) 26.2(±0.6) P<0.05 40.77(±0.7) 28.62(±0.9) 12.91(±1.0)
00324_MineralPFertilizers P<0.05 33.76(±0.9) 30.13(±0.6) P<0.05 41.17(±0.7) 32.64(±0.8) 18.73(±1.0)
00626_BoughtInRoughage ns 47.15(±2.1)a 50.13(±1.2)a P<0.05 58.05(±1.6) 52.08(±1.8) 37.73(±2.0)
00708_PreciseFertilisation ns 6.18(±0.6)a 5.5(±0.3)a P<0.05 2.49(±0.5) 14.16(±0.7) 0.68(±0.2)
00712_BoughtOrgFert P<0.05 38.37(±2.0) 50.34(±0.9) P<0.05 55.71(±1.3) 48.46(±1.5) 37.84(±1.6)
00740_GrowthRegulation ns 30.99(±1.2)a 28.64(±0.7)a P<0.05 30.33(±1.1)a 30.16(±1.1)a 27.09(±1.1)
Note: margins sharing a letter in the group label are not significantly different at the 5% level
Social Well Being
Sub-theme Indicator P Org Con P Machakos Kirinyaga Murang'a
Capacity
Development
00072_FarmStaffTraining P<0.05 45.11(±2.6) 32.64(±1.4) P<0.05 31.48(±2.2)a 32.29(±2.0)a 43.27(±2.2)
00703_AccessAdvisoryServices ns 23.41(±2.0)a 25.61(±1.2)a P<0.05 21.31(±1.9)a 23.87(±1.9)a 30.23(±1.5)
Note: margins sharing a letter in the group label are not significantly different at the 5% level
Sub-theme Indicator P Org Con P Machakos Kirinyaga Murang'a
Indigenous
Knowledge
00067_PreventionResourceConflicts P<0.05 52.98(±2.8) 42.61(±1.3) P<0.05 67.78(±1.9) 21.39(±1.8) 44.49(±2.4)
00075_CostsSocialInvolvementOutsideFarm P<0.05 25.18(±1.7) 18.1(±0.9) P<0.05 12.17(±1.3) 18.2(±1.3) 29.37(±1.5)
Note: margins sharing a letter in the group label are not significantly different at the 5% level
Sub-theme Indicator P Org Con P Machakos Kirinyaga Murang'a
Public Health 00034_2_UseageChemSynthSeedDressings P<0.05 14.3(±1.9) 6.52(±0.8) P<0.05 9.22(±1.4)a 11.2(±1.4)a 4.76(±1.0)
00167_No ContaminatedProducts ns 53.1(±2.7)a 54.67(±1.5)a P<0.05 33.25(±2.5) 68.44(±2.0) 62.53(±2.2)
00169_ContaminationCasesMeasures P<0.05 38.84(±2.3) 31.65(±1.4) P<0.05 9.81(±1.6) 44.13(±2.3) 47.58(±2.4)
00200_SlurryStoresCovered ns 17.3(±2.2)a 16.46(±1.1)a P<0.05 23.99(±2.0) 13.14(±1.6) 12.4(±1.5)
00208_WoodlandsShareAgriculturalLand_Calculated ns 3.05(±0.5)a 2.46(±0.2)a P<0.05 0.33(±0.1) 3.05(±0.4) 4.54(±0.5)
00233_NoUseSynthChemFungicides ns 34.05(±2.3)a 37.46(±1.2)a P<0.05 21.27(±1.8) 35.77(±1.7) 53.62(±1.9)
00234_NoUseSynthChemInsecticides P<0.05 40.65(±2.4) 35.34(±1.2) P<0.05 20.83(±1.8) 35.65(±1.7) 54.12(±2.0)
00257_1_PesticidesToxicityBees ns 21.4(±2.3)a 17.84(±1.2)a P<0.05 4.79(±1.2) 14.02(±1.6) 37.87(±2.6)
00257_2_PesticidesToxicityAquaticOrganisms P<0.05 19.8(±2.3) 14.7(±1.1) P<0.05 3.37(±1.1)a 6.43(±1.3)a 38.4(±2.5)
00295_AntibioticsLivestockFertilizer P<0.05 20.48(±1.3) 15.05(±0.9) P<0.05 10.2(±1.2)a 27.75(±1.4) 11.65(±1.3)a
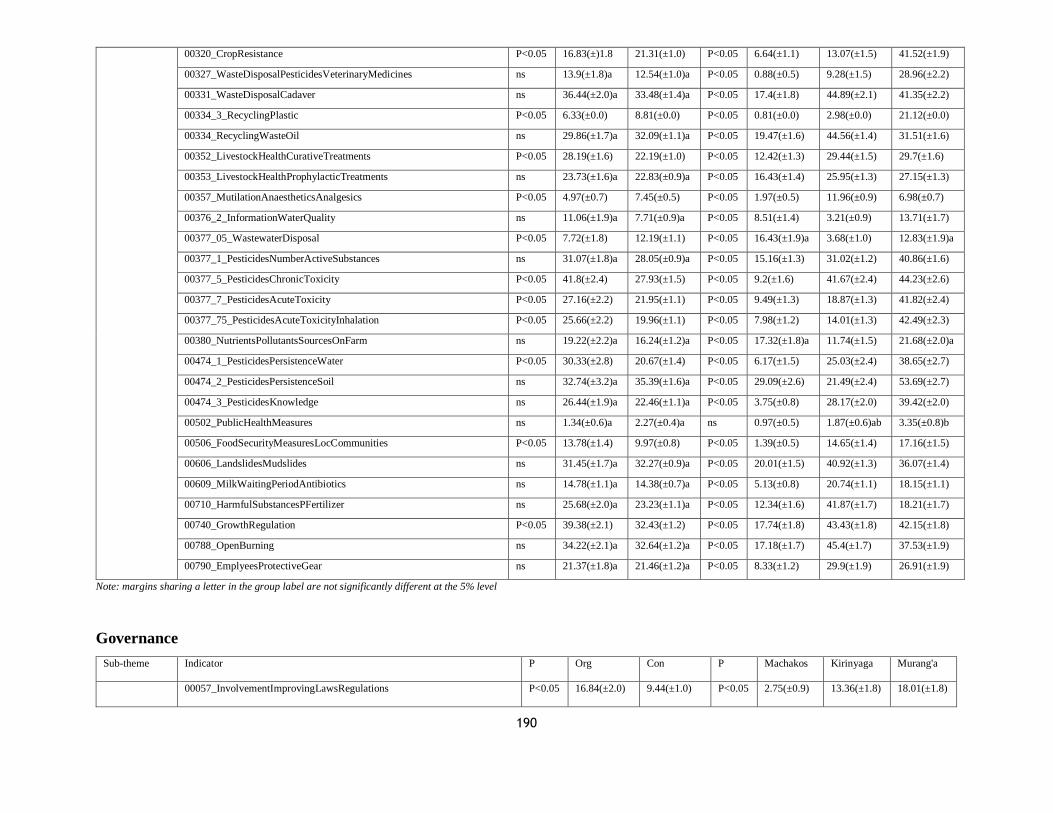
190
00320_CropResistance P<0.05 16.83(±)1.8 21.31(±1.0) P<0.05 6.64(±1.1) 13.07(±1.5) 41.52(±1.9)
00327_WasteDisposalPesticidesVeterinaryMedicines ns 13.9(±1.8)a 12.54(±1.0)a P<0.05 0.88(±0.5) 9.28(±1.5) 28.96(±2.2)
00331_WasteDisposalCadaver ns 36.44(±2.0)a 33.48(±1.4)a P<0.05 17.4(±1.8) 44.89(±2.1) 41.35(±2.2)
00334_3_RecyclingPlastic P<0.05 6.33(±0.0) 8.81(±0.0) P<0.05 0.81(±0.0) 2.98(±0.0) 21.12(±0.0)
00334_RecyclingWasteOil ns 29.86(±1.7)a 32.09(±1.1)a P<0.05 19.47(±1.6) 44.56(±1.4) 31.51(±1.6)
00352_LivestockHealthCurativeTreatments P<0.05 28.19(±1.6) 22.19(±1.0) P<0.05 12.42(±1.3) 29.44(±1.5) 29.7(±1.6)
00353_LivestockHealthProphylacticTreatments ns 23.73(±1.6)a 22.83(±0.9)a P<0.05 16.43(±1.4) 25.95(±1.3) 27.15(±1.3)
00357_MutilationAnaestheticsAnalgesics P<0.05 4.97(±0.7) 7.45(±0.5) P<0.05 1.97(±0.5) 11.96(±0.9) 6.98(±0.7)
00376_2_InformationWaterQuality ns 11.06(±1.9)a 7.71(±0.9)a P<0.05 8.51(±1.4) 3.21(±0.9) 13.71(±1.7)
00377_05_WastewaterDisposal P<0.05 7.72(±1.8) 12.19(±1.1) P<0.05 16.43(±1.9)a 3.68(±1.0) 12.83(±1.9)a
00377_1_PesticidesNumberActiveSubstances ns 31.07(±1.8)a 28.05(±0.9)a P<0.05 15.16(±1.3) 31.02(±1.2) 40.86(±1.6)
00377_5_PesticidesChronicToxicity P<0.05 41.8(±2.4) 27.93(±1.5) P<0.05 9.2(±1.6) 41.67(±2.4) 44.23(±2.6)
00377_7_PesticidesAcuteToxicity P<0.05 27.16(±2.2) 21.95(±1.1) P<0.05 9.49(±1.3) 18.87(±1.3) 41.82(±2.4)
00377_75_PesticidesAcuteToxicityInhalation P<0.05 25.66(±2.2) 19.96(±1.1) P<0.05 7.98(±1.2) 14.01(±1.3) 42.49(±2.3)
00380_NutrientsPollutantsSourcesOnFarm ns 19.22(±2.2)a 16.24(±1.2)a P<0.05 17.32(±1.8)a 11.74(±1.5) 21.68(±2.0)a
00474_1_PesticidesPersistenceWater P<0.05 30.33(±2.8) 20.67(±1.4) P<0.05 6.17(±1.5) 25.03(±2.4) 38.65(±2.7)
00474_2_PesticidesPersistenceSoil ns 32.74(±3.2)a 35.39(±1.6)a P<0.05 29.09(±2.6) 21.49(±2.4) 53.69(±2.7)
00474_3_PesticidesKnowledge ns 26.44(±1.9)a 22.46(±1.1)a P<0.05 3.75(±0.8) 28.17(±2.0) 39.42(±2.0)
00502_PublicHealthMeasures ns 1.34(±0.6)a 2.27(±0.4)a ns 0.97(±0.5) 1.87(±0.6)ab 3.35(±0.8)b
00506_FoodSecurityMeasuresLocCommunities P<0.05 13.78(±1.4) 9.97(±0.8) P<0.05 1.39(±0.5) 14.65(±1.4) 17.16(±1.5)
00606_LandslidesMudslides ns 31.45(±1.7)a 32.27(±0.9)a P<0.05 20.01(±1.5) 40.92(±1.3) 36.07(±1.4)
00609_MilkWaitingPeriodAntibiotics ns 14.78(±1.1)a 14.38(±0.7)a P<0.05 5.13(±0.8) 20.74(±1.1) 18.15(±1.1)
00710_HarmfulSubstancesPFertilizer ns 25.68(±2.0)a 23.23(±1.1)a P<0.05 12.34(±1.6) 41.87(±1.7) 18.21(±1.7)
00740_GrowthRegulation P<0.05 39.38(±2.1) 32.43(±1.2) P<0.05 17.74(±1.8) 43.43(±1.8) 42.15(±1.8)
00788_OpenBurning ns 34.22(±2.1)a 32.64(±1.2)a P<0.05 17.18(±1.7) 45.4(±1.7) 37.53(±1.9)
00790_EmplyeesProtectiveGear ns 21.37(±1.8)a 21.46(±1.2)a P<0.05 8.33(±1.2) 29.9(±1.9) 26.91(±1.9)
Note: margins sharing a letter in the group label are not significantly different at the 5% level
Governance
Sub-theme Indicator P Org Con P Machakos Kirinyaga Murang'a
00057_InvolvementImprovingLawsRegulations P<0.05 16.84(±2.0) 9.44(±1.0) P<0.05 2.75(±0.9) 13.36(±1.8) 18.01(±1.8)
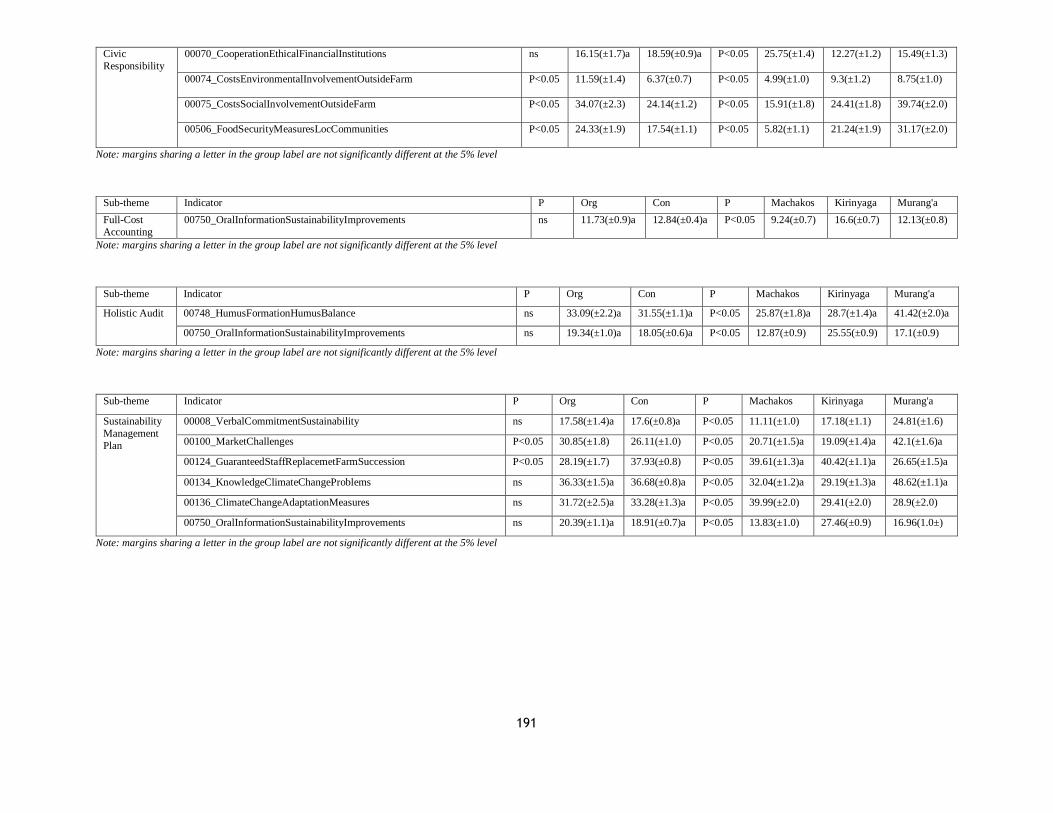
191
Civic
Responsibility
00070_CooperationEthicalFinancialInstitutions ns 16.15(±1.7)a 18.59(±0.9)a P<0.05 25.75(±1.4) 12.27(±1.2) 15.49(±1.3)
00074_CostsEnvironmentalInvolvementOutsideFarm P<0.05 11.59(±1.4) 6.37(±0.7) P<0.05 4.99(±1.0) 9.3(±1.2) 8.75(±1.0)
00075_CostsSocialInvolvementOutsideFarm P<0.05 34.07(±2.3) 24.14(±1.2) P<0.05 15.91(±1.8) 24.41(±1.8) 39.74(±2.0)
00506_FoodSecurityMeasuresLocCommunities P<0.05 24.33(±1.9) 17.54(±1.1) P<0.05 5.82(±1.1) 21.24(±1.9) 31.17(±2.0)
Note: margins sharing a letter in the group label are not significantly different at the 5% level
Sub-theme Indicator P Org Con P Machakos Kirinyaga Murang'a
Full-Cost
Accounting
00750_OralInformationSustainabilityImprovements ns 11.73(±0.9)a 12.84(±0.4)a P<0.05 9.24(±0.7) 16.6(±0.7) 12.13(±0.8)
Note: margins sharing a letter in the group label are not significantly different at the 5% level
Sub-theme Indicator P Org Con P Machakos Kirinyaga Murang'a
Holistic Audit 00748_HumusFormationHumusBalance ns 33.09(±2.2)a 31.55(±1.1)a P<0.05 25.87(±1.8)a 28.7(±1.4)a 41.42(±2.0)a
00750_OralInformationSustainabilityImprovements ns 19.34(±1.0)a 18.05(±0.6)a P<0.05 12.87(±0.9) 25.55(±0.9) 17.1(±0.9)
Note: margins sharing a letter in the group label are not significantly different at the 5% level
Sub-theme Indicator P Org Con P Machakos Kirinyaga Murang'a
Sustainability
Management
Plan
00008_VerbalCommitmentSustainability ns 17.58(±1.4)a 17.6(±0.8)a P<0.05 11.11(±1.0) 17.18(±1.1) 24.81(±1.6)
00100_MarketChallenges P<0.05 30.85(±1.8) 26.11(±1.0) P<0.05 20.71(±1.5)a 19.09(±1.4)a 42.1(±1.6)a
00124_GuaranteedStaffReplacemetFarmSuccession P<0.05 28.19(±1.7) 37.93(±0.8) P<0.05 39.61(±1.3)a 40.42(±1.1)a 26.65(±1.5)a
00134_KnowledgeClimateChangeProblems ns 36.33(±1.5)a 36.68(±0.8)a P<0.05 32.04(±1.2)a 29.19(±1.3)a 48.62(±1.1)a
00136_ClimateChangeAdaptationMeasures ns 31.72(±2.5)a 33.28(±1.3)a P<0.05 39.99(±2.0) 29.41(±2.0) 28.9(±2.0)
00750_OralInformationSustainabilityImprovements ns 20.39(±1.1)a 18.91(±0.7)a P<0.05 13.83(±1.0) 27.46(±0.9) 16.96(1.0±)
Note: margins sharing a letter in the group label are not significantly different at the 5% level
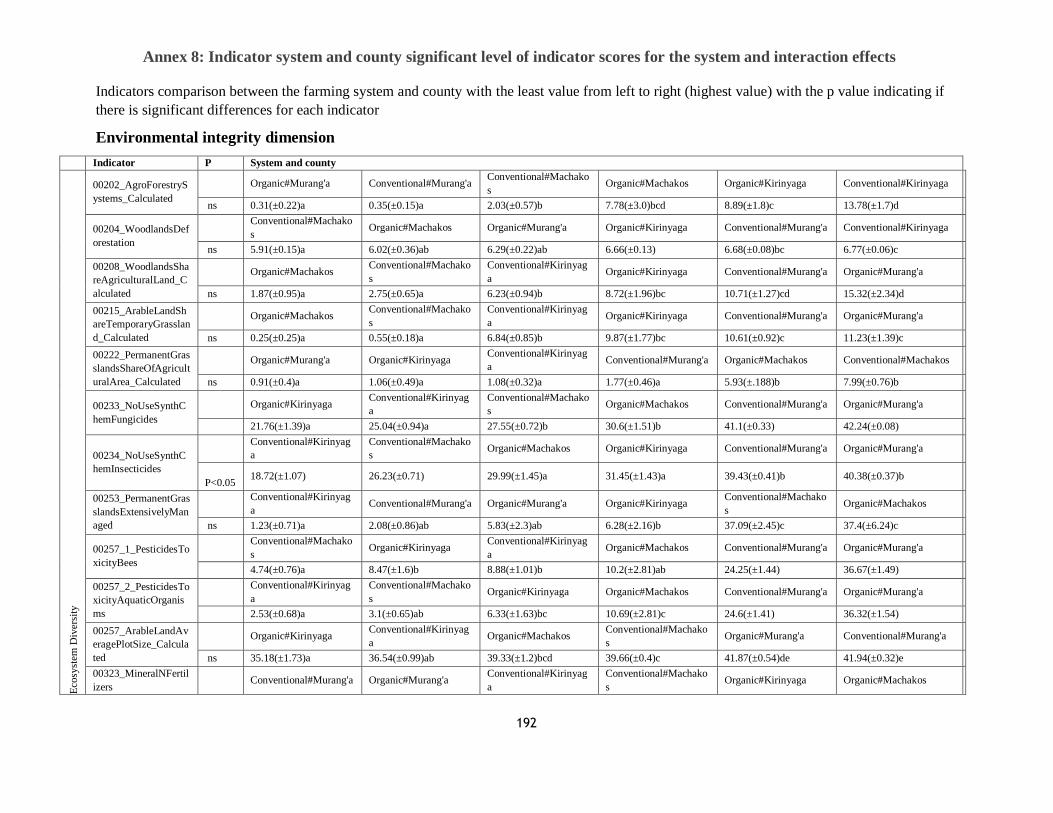
192
Annex 8: Indicator system and county significant level of indicator scores for the system and interaction effects
Indicators comparison between the farming system and county with the least value from left to right (highest value) with the p value indicating if
there is significant differences for each indicator
Environmental integrity dimension
Indicator P System and county
Eco
syst
em D
iver
sity
00202_AgroForestryS
ystems_Calculated
Organic#Murang'a Conventional#Murang'a Conventional#Machako
s Organic#Machakos Organic#Kirinyaga Conventional#Kirinyaga
ns 0.31(±0.22)a 0.35(±0.15)a 2.03(±0.57)b 7.78(±3.0)bcd 8.89(±1.8)c 13.78(±1.7)d
00204_WoodlandsDef
orestation
Conventional#Machako
s Organic#Machakos Organic#Murang'a Organic#Kirinyaga Conventional#Murang'a Conventional#Kirinyaga
ns 5.91(±0.15)a 6.02(±0.36)ab 6.29(±0.22)ab 6.66(±0.13) 6.68(±0.08)bc 6.77(±0.06)c
00208_WoodlandsSha
reAgriculturalLand_C
alculated
Organic#Machakos Conventional#Machako
s
Conventional#Kirinyag
a Organic#Kirinyaga Conventional#Murang'a Organic#Murang'a
ns 1.87(±0.95)a 2.75(±0.65)a 6.23(±0.94)b 8.72(±1.96)bc 10.71(±1.27)cd 15.32(±2.34)d
00215_ArableLandSh
areTemporaryGrasslan
d_Calculated
Organic#Machakos Conventional#Machako
s
Conventional#Kirinyag
a Organic#Kirinyaga Conventional#Murang'a Organic#Murang'a
ns 0.25(±0.25)a 0.55(±0.18)a 6.84(±0.85)b 9.87(±1.77)bc 10.61(±0.92)c 11.23(±1.39)c
00222_PermanentGras
slandsShareOfAgricult
uralArea_Calculated
Organic#Murang'a Organic#Kirinyaga Conventional#Kirinyag
a Conventional#Murang'a Organic#Machakos Conventional#Machakos
ns 0.91(±0.4)a 1.06(±0.49)a 1.08(±0.32)a 1.77(±0.46)a 5.93(±.188)b 7.99(±0.76)b
00233_NoUseSynthC
hemFungicides
Organic#Kirinyaga Conventional#Kirinyag
a
Conventional#Machako
s Organic#Machakos Conventional#Murang'a Organic#Murang'a
21.76(±1.39)a 25.04(±0.94)a 27.55(±0.72)b 30.6(±1.51)b 41.1(±0.33) 42.24(±0.08)
00234_NoUseSynthC
hemInsecticides
Conventional#Kirinyag
a
Conventional#Machako
s Organic#Machakos Organic#Kirinyaga Conventional#Murang'a Organic#Murang'a
P<0.05 18.72(±1.07) 26.23(±0.71) 29.99(±1.45)a 31.45(±1.43)a 39.43(±0.41)b 40.38(±0.37)b
00253_PermanentGras
slandsExtensivelyMan
aged
Conventional#Kirinyag
a Conventional#Murang'a Organic#Murang'a Organic#Kirinyaga
Conventional#Machako
s Organic#Machakos
ns 1.23(±0.71)a 2.08(±0.86)ab 5.83(±2.3)ab 6.28(±2.16)b 37.09(±2.45)c 37.4(±6.24)c
00257_1_PesticidesTo
xicityBees
Conventional#Machako
s Organic#Kirinyaga
Conventional#Kirinyag
a Organic#Machakos Conventional#Murang'a Organic#Murang'a
4.74(±0.76)a 8.47(±1.6)b 8.88(±1.01)b 10.2(±2.81)ab 24.25(±1.44) 36.67(±1.49)
00257_2_PesticidesTo
xicityAquaticOrganis
ms
Conventional#Kirinyag
a
Conventional#Machako
s Organic#Kirinyaga Organic#Machakos Conventional#Murang'a Organic#Murang'a
2.53(±0.68)a 3.1(±0.65)ab 6.33(±1.63)bc 10.69(±2.81)c 24.6(±1.41) 36.32(±1.54)
00257_ArableLandAv
eragePlotSize_Calcula
ted
Organic#Kirinyaga Conventional#Kirinyag
a Organic#Machakos
Conventional#Machako
s Organic#Murang'a Conventional#Murang'a
ns 35.18(±1.73)a 36.54(±0.99)ab 39.33(±1.2)bcd 39.66(±0.4)c 41.87(±0.54)de 41.94(±0.32)e
00323_MineralNFertil
izers Conventional#Murang'a Organic#Murang'a
Conventional#Kirinyag
a
Conventional#Machako
s Organic#Kirinyaga Organic#Machakos
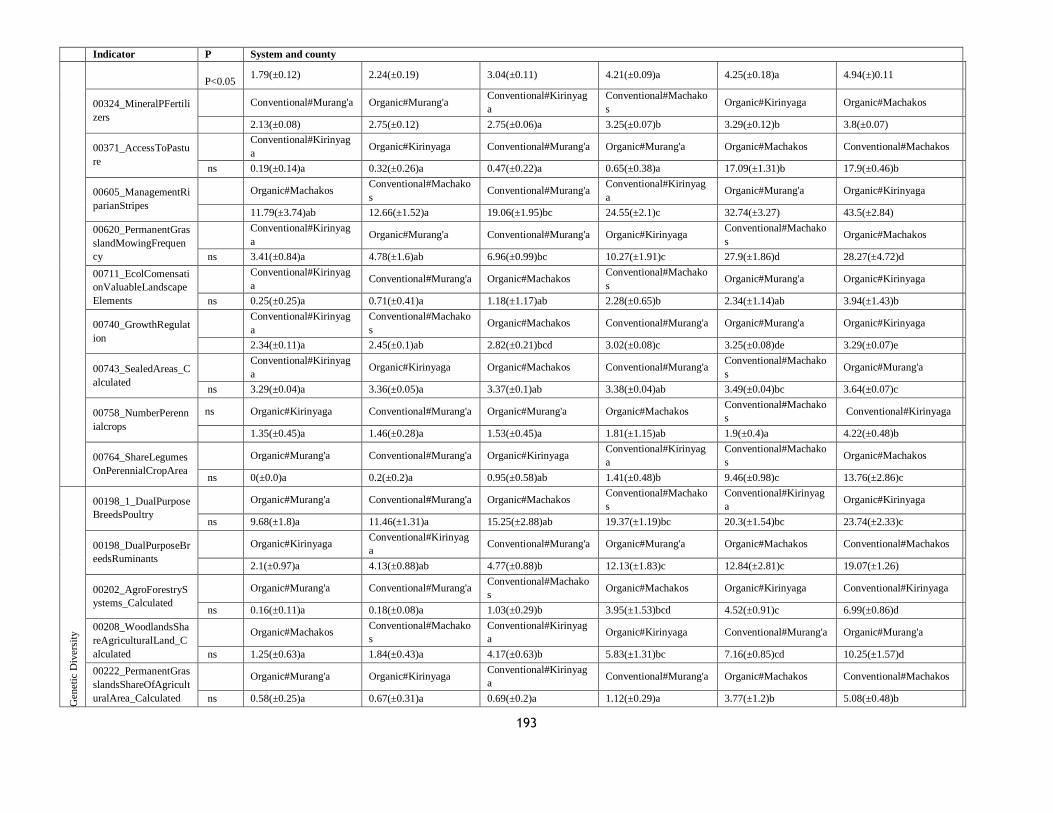
193
Indicator P System and county
P<0.05 1.79(±0.12) 2.24(±0.19) 3.04(±0.11) 4.21(±0.09)a 4.25(±0.18)a 4.94(±)0.11
00324_MineralPFertili
zers
Conventional#Murang'a Organic#Murang'a Conventional#Kirinyag
a
Conventional#Machako
s Organic#Kirinyaga Organic#Machakos
2.13(±0.08) 2.75(±0.12) 2.75(±0.06)a 3.25(±0.07)b 3.29(±0.12)b 3.8(±0.07)
00371_AccessToPastu
re
Conventional#Kirinyag
a Organic#Kirinyaga Conventional#Murang'a Organic#Murang'a Organic#Machakos Conventional#Machakos
ns 0.19(±0.14)a 0.32(±0.26)a 0.47(±0.22)a 0.65(±0.38)a 17.09(±1.31)b 17.9(±0.46)b
00605_ManagementRi
parianStripes
Organic#Machakos Conventional#Machako
s Conventional#Murang'a
Conventional#Kirinyag
a Organic#Murang'a Organic#Kirinyaga
11.79(±3.74)ab 12.66(±1.52)a 19.06(±1.95)bc 24.55(±2.1)c 32.74(±3.27) 43.5(±2.84)
00620_PermanentGras
slandMowingFrequen
cy
Conventional#Kirinyag
a Organic#Murang'a Conventional#Murang'a Organic#Kirinyaga
Conventional#Machako
s Organic#Machakos
ns 3.41(±0.84)a 4.78(±1.6)ab 6.96(±0.99)bc 10.27(±1.91)c 27.9(±1.86)d 28.27(±4.72)d
00711_EcolComensati
onValuableLandscape
Elements
Conventional#Kirinyag
a Conventional#Murang'a Organic#Machakos
Conventional#Machako
s Organic#Murang'a Organic#Kirinyaga
ns 0.25(±0.25)a 0.71(±0.41)a 1.18(±1.17)ab 2.28(±0.65)b 2.34(±1.14)ab 3.94(±1.43)b
00740_GrowthRegulat
ion
Conventional#Kirinyag
a
Conventional#Machako
s Organic#Machakos Conventional#Murang'a Organic#Murang'a Organic#Kirinyaga
2.34(±0.11)a 2.45(±0.1)ab 2.82(±0.21)bcd 3.02(±0.08)c 3.25(±0.08)de 3.29(±0.07)e
00743_SealedAreas_C
alculated
Conventional#Kirinyag
a Organic#Kirinyaga Organic#Machakos Conventional#Murang'a
Conventional#Machako
s Organic#Murang'a
ns 3.29(±0.04)a 3.36(±0.05)a 3.37(±0.1)ab 3.38(±0.04)ab 3.49(±0.04)bc 3.64(±0.07)c
00758_NumberPerenn
ialcrops
ns Organic#Kirinyaga Conventional#Murang'a Organic#Murang'a Organic#Machakos Conventional#Machako
s Conventional#Kirinyaga
1.35(±0.45)a 1.46(±0.28)a 1.53(±0.45)a 1.81(±1.15)ab 1.9(±0.4)a 4.22(±0.48)b
00764_ShareLegumes
OnPerennialCropArea
Organic#Murang'a Conventional#Murang'a Organic#Kirinyaga Conventional#Kirinyag
a
Conventional#Machako
s Organic#Machakos
ns 0(±0.0)a 0.2(±0.2)a 0.95(±0.58)ab 1.41(±0.48)b 9.46(±0.98)c 13.76(±2.86)c
Gen
etic
Div
ersi
ty
00198_1_DualPurpose
BreedsPoultry
Organic#Murang'a Conventional#Murang'a Organic#Machakos Conventional#Machako
s
Conventional#Kirinyag
a Organic#Kirinyaga
ns 9.68(±1.8)a 11.46(±1.31)a 15.25(±2.88)ab 19.37(±1.19)bc 20.3(±1.54)bc 23.74(±2.33)c
00198_DualPurposeBr
eedsRuminants
Organic#Kirinyaga Conventional#Kirinyag
a Conventional#Murang'a Organic#Murang'a Organic#Machakos Conventional#Machakos
2.1(±0.97)a 4.13(±0.88)ab 4.77(±0.88)b 12.13(±1.83)c 12.84(±2.81)c 19.07(±1.26)
00202_AgroForestryS
ystems_Calculated
Organic#Murang'a Conventional#Murang'a Conventional#Machako
s Organic#Machakos Organic#Kirinyaga Conventional#Kirinyaga
ns 0.16(±0.11)a 0.18(±0.08)a 1.03(±0.29)b 3.95(±1.53)bcd 4.52(±0.91)c 6.99(±0.86)d
00208_WoodlandsSha
reAgriculturalLand_C
alculated
Organic#Machakos Conventional#Machako
s
Conventional#Kirinyag
a Organic#Kirinyaga Conventional#Murang'a Organic#Murang'a
ns 1.25(±0.63)a 1.84(±0.43)a 4.17(±0.63)b 5.83(±1.31)bc 7.16(±0.85)cd 10.25(±1.57)d
00222_PermanentGras
slandsShareOfAgricult
uralArea_Calculated
Organic#Murang'a Organic#Kirinyaga Conventional#Kirinyag
a Conventional#Murang'a Organic#Machakos Conventional#Machakos
ns 0.58(±0.25)a 0.67(±0.31)a 0.69(±0.2)a 1.12(±0.29)a 3.77(±1.2)b 5.08(±0.48)b
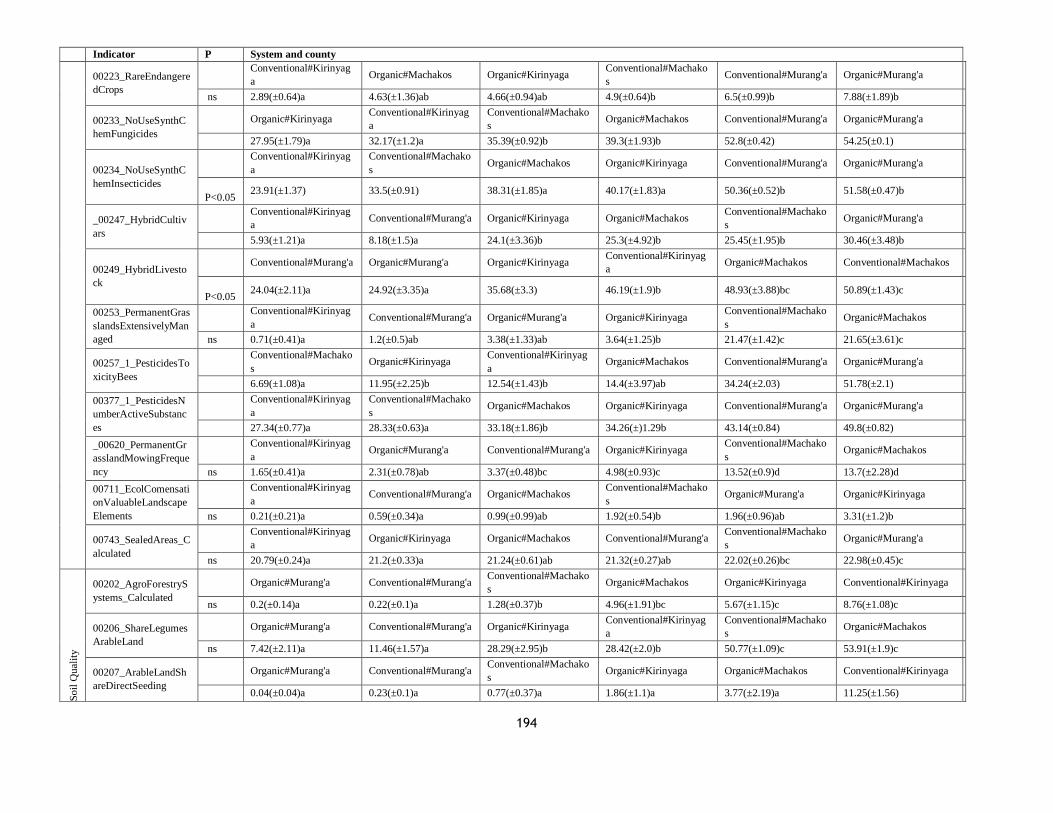
194
Indicator P System and county
00223_RareEndangere
dCrops
Conventional#Kirinyag
a Organic#Machakos Organic#Kirinyaga
Conventional#Machako
s Conventional#Murang'a Organic#Murang'a
ns 2.89(±0.64)a 4.63(±1.36)ab 4.66(±0.94)ab 4.9(±0.64)b 6.5(±0.99)b 7.88(±1.89)b
00233_NoUseSynthC
hemFungicides
Organic#Kirinyaga Conventional#Kirinyag
a
Conventional#Machako
s Organic#Machakos Conventional#Murang'a Organic#Murang'a
27.95(±1.79)a 32.17(±1.2)a 35.39(±0.92)b 39.3(±1.93)b 52.8(±0.42) 54.25(±0.1)
00234_NoUseSynthC
hemInsecticides
Conventional#Kirinyag
a
Conventional#Machako
s Organic#Machakos Organic#Kirinyaga Conventional#Murang'a Organic#Murang'a
P<0.05 23.91(±1.37) 33.5(±0.91) 38.31(±1.85)a 40.17(±1.83)a 50.36(±0.52)b 51.58(±0.47)b
_00247_HybridCultiv
ars
Conventional#Kirinyag
a Conventional#Murang'a Organic#Kirinyaga Organic#Machakos
Conventional#Machako
s Organic#Murang'a
5.93(±1.21)a 8.18(±1.5)a 24.1(±3.36)b 25.3(±4.92)b 25.45(±1.95)b 30.46(±3.48)b
00249_HybridLivesto
ck
Conventional#Murang'a Organic#Murang'a Organic#Kirinyaga Conventional#Kirinyag
a Organic#Machakos Conventional#Machakos
P<0.05 24.04(±2.11)a 24.92(±3.35)a 35.68(±3.3) 46.19(±1.9)b 48.93(±3.88)bc 50.89(±1.43)c
00253_PermanentGras
slandsExtensivelyMan
aged
Conventional#Kirinyag
a Conventional#Murang'a Organic#Murang'a Organic#Kirinyaga
Conventional#Machako
s Organic#Machakos
ns 0.71(±0.41)a 1.2(±0.5)ab 3.38(±1.33)ab 3.64(±1.25)b 21.47(±1.42)c 21.65(±3.61)c
00257_1_PesticidesTo
xicityBees
Conventional#Machako
s Organic#Kirinyaga
Conventional#Kirinyag
a Organic#Machakos Conventional#Murang'a Organic#Murang'a
6.69(±1.08)a 11.95(±2.25)b 12.54(±1.43)b 14.4(±3.97)ab 34.24(±2.03) 51.78(±2.1)
00377_1_PesticidesN
umberActiveSubstanc
es
Conventional#Kirinyag
a
Conventional#Machako
s Organic#Machakos Organic#Kirinyaga Conventional#Murang'a Organic#Murang'a
27.34(±0.77)a 28.33(±0.63)a 33.18(±1.86)b 34.26(±)1.29b 43.14(±0.84) 49.8(±0.82)
_00620_PermanentGr
asslandMowingFreque
ncy
Conventional#Kirinyag
a Organic#Murang'a Conventional#Murang'a Organic#Kirinyaga
Conventional#Machako
s Organic#Machakos
ns 1.65(±0.41)a 2.31(±0.78)ab 3.37(±0.48)bc 4.98(±0.93)c 13.52(±0.9)d 13.7(±2.28)d
00711_EcolComensati
onValuableLandscape
Elements
Conventional#Kirinyag
a Conventional#Murang'a Organic#Machakos
Conventional#Machako
s Organic#Murang'a Organic#Kirinyaga
ns 0.21(±0.21)a 0.59(±0.34)a 0.99(±0.99)ab 1.92(±0.54)b 1.96(±0.96)ab 3.31(±1.2)b
00743_SealedAreas_C
alculated
Conventional#Kirinyag
a Organic#Kirinyaga Organic#Machakos Conventional#Murang'a
Conventional#Machako
s Organic#Murang'a
ns 20.79(±0.24)a 21.2(±0.33)a 21.24(±0.61)ab 21.32(±0.27)ab 22.02(±0.26)bc 22.98(±0.45)c
Soil
Qual
ity
00202_AgroForestryS
ystems_Calculated
Organic#Murang'a Conventional#Murang'a Conventional#Machako
s Organic#Machakos Organic#Kirinyaga Conventional#Kirinyaga
ns 0.2(±0.14)a 0.22(±0.1)a 1.28(±0.37)b 4.96(±1.91)bc 5.67(±1.15)c 8.76(±1.08)c
00206_ShareLegumes
ArableLand
Organic#Murang'a Conventional#Murang'a Organic#Kirinyaga Conventional#Kirinyag
a
Conventional#Machako
s Organic#Machakos
ns 7.42(±2.11)a 11.46(±1.57)a 28.29(±2.95)b 28.42(±2.0)b 50.77(±1.09)c 53.91(±1.9)c
00207_ArableLandSh
areDirectSeeding
Organic#Murang'a Conventional#Murang'a Conventional#Machako
s Organic#Kirinyaga Organic#Machakos Conventional#Kirinyaga
0.04(±0.04)a 0.23(±0.1)a 0.77(±0.37)a 1.86(±1.1)a 3.77(±2.19)a 11.25(±1.56)
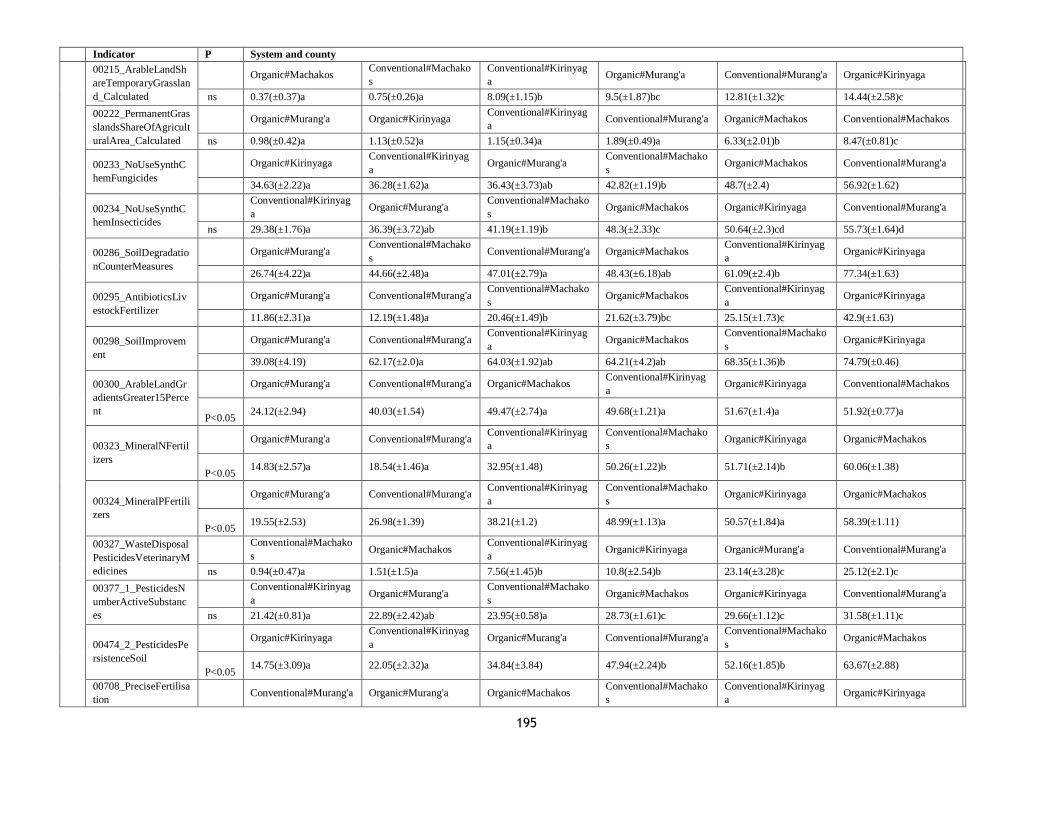
195
Indicator P System and county
00215_ArableLandSh
areTemporaryGrasslan
d_Calculated
Organic#Machakos Conventional#Machako
s
Conventional#Kirinyag
a Organic#Murang'a Conventional#Murang'a Organic#Kirinyaga
ns 0.37(±0.37)a 0.75(±0.26)a 8.09(±1.15)b 9.5(±1.87)bc 12.81(±1.32)c 14.44(±2.58)c
00222_PermanentGras
slandsShareOfAgricult
uralArea_Calculated
Organic#Murang'a Organic#Kirinyaga Conventional#Kirinyag
a Conventional#Murang'a Organic#Machakos Conventional#Machakos
ns 0.98(±0.42)a 1.13(±0.52)a 1.15(±0.34)a 1.89(±0.49)a 6.33(±2.01)b 8.47(±0.81)c
00233_NoUseSynthC
hemFungicides
Organic#Kirinyaga Conventional#Kirinyag
a Organic#Murang'a
Conventional#Machako
s Organic#Machakos Conventional#Murang'a
34.63(±2.22)a 36.28(±1.62)a 36.43(±3.73)ab 42.82(±1.19)b 48.7(±2.4) 56.92(±1.62)
00234_NoUseSynthC
hemInsecticides
Conventional#Kirinyag
a Organic#Murang'a
Conventional#Machako
s Organic#Machakos Organic#Kirinyaga Conventional#Murang'a
ns 29.38(±1.76)a 36.39(±3.72)ab 41.19(±1.19)b 48.3(±2.33)c 50.64(±2.3)cd 55.73(±1.64)d
00286_SoilDegradatio
nCounterMeasures
Organic#Murang'a Conventional#Machako
s Conventional#Murang'a Organic#Machakos
Conventional#Kirinyag
a Organic#Kirinyaga
26.74(±4.22)a 44.66(±2.48)a 47.01(±2.79)a 48.43(±6.18)ab 61.09(±2.4)b 77.34(±1.63)
00295_AntibioticsLiv
estockFertilizer
Organic#Murang'a Conventional#Murang'a Conventional#Machako
s Organic#Machakos
Conventional#Kirinyag
a Organic#Kirinyaga
11.86(±2.31)a 12.19(±1.48)a 20.46(±1.49)b 21.62(±3.79)bc 25.15(±1.73)c 42.9(±1.63)
00298_SoilImprovem
ent
Organic#Murang'a Conventional#Murang'a Conventional#Kirinyag
a Organic#Machakos
Conventional#Machako
s Organic#Kirinyaga
39.08(±4.19) 62.17(±2.0)a 64.03(±1.92)ab 64.21(±4.2)ab 68.35(±1.36)b 74.79(±0.46)
00300_ArableLandGr
adientsGreater15Perce
nt
Organic#Murang'a Conventional#Murang'a Organic#Machakos Conventional#Kirinyag
a Organic#Kirinyaga Conventional#Machakos
P<0.05 24.12(±2.94) 40.03(±1.54) 49.47(±2.74)a 49.68(±1.21)a 51.67(±1.4)a 51.92(±0.77)a
00323_MineralNFertil
izers
Organic#Murang'a Conventional#Murang'a Conventional#Kirinyag
a
Conventional#Machako
s Organic#Kirinyaga Organic#Machakos
P<0.05 14.83(±2.57)a 18.54(±1.46)a 32.95(±1.48) 50.26(±1.22)b 51.71(±2.14)b 60.06(±1.38)
00324_MineralPFertili
zers
Organic#Murang'a Conventional#Murang'a Conventional#Kirinyag
a
Conventional#Machako
s Organic#Kirinyaga Organic#Machakos
P<0.05 19.55(±2.53) 26.98(±1.39) 38.21(±1.2) 48.99(±1.13)a 50.57(±1.84)a 58.39(±1.11)
00327_WasteDisposal
PesticidesVeterinaryM
edicines
Conventional#Machako
s Organic#Machakos
Conventional#Kirinyag
a Organic#Kirinyaga Organic#Murang'a Conventional#Murang'a
ns 0.94(±0.47)a 1.51(±1.5)a 7.56(±1.45)b 10.8(±2.54)b 23.14(±3.28)c 25.12(±2.1)c
00377_1_PesticidesN
umberActiveSubstanc
es
Conventional#Kirinyag
a Organic#Murang'a
Conventional#Machako
s Organic#Machakos Organic#Kirinyaga Conventional#Murang'a
ns 21.42(±0.81)a 22.89(±2.42)ab 23.95(±0.58)a 28.73(±1.61)c 29.66(±1.12)c 31.58(±1.11)c
00474_2_PesticidesPe
rsistenceSoil
Organic#Kirinyaga Conventional#Kirinyag
a Organic#Murang'a Conventional#Murang'a
Conventional#Machako
s Organic#Machakos
P<0.05 14.75(±3.09)a 22.05(±2.32)a 34.84(±3.84) 47.94(±2.24)b 52.16(±1.85)b 63.67(±2.88)
00708_PreciseFertilisa
tion Conventional#Murang'a Organic#Murang'a Organic#Machakos
Conventional#Machako
s
Conventional#Kirinyag
a Organic#Kirinyaga
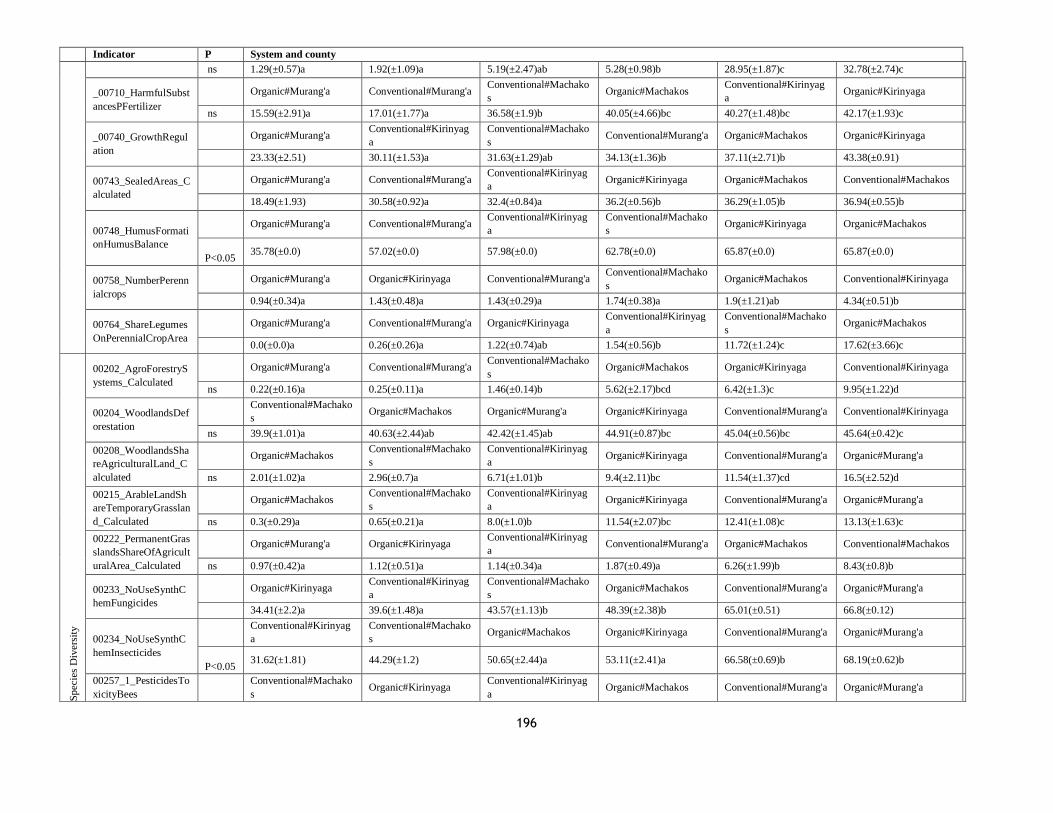
196
Indicator P System and county
ns 1.29(±0.57)a 1.92(±1.09)a 5.19(±2.47)ab 5.28(±0.98)b 28.95(±1.87)c 32.78(±2.74)c
_00710_HarmfulSubst
ancesPFertilizer
Organic#Murang'a Conventional#Murang'a Conventional#Machako
s Organic#Machakos
Conventional#Kirinyag
a Organic#Kirinyaga
ns 15.59(±2.91)a 17.01(±1.77)a 36.58(±1.9)b 40.05(±4.66)bc 40.27(±1.48)bc 42.17(±1.93)c
_00740_GrowthRegul
ation
Organic#Murang'a Conventional#Kirinyag
a
Conventional#Machako
s Conventional#Murang'a Organic#Machakos Organic#Kirinyaga
23.33(±2.51) 30.11(±1.53)a 31.63(±1.29)ab 34.13(±1.36)b 37.11(±2.71)b 43.38(±0.91)
00743_SealedAreas_C
alculated
Organic#Murang'a Conventional#Murang'a Conventional#Kirinyag
a Organic#Kirinyaga Organic#Machakos Conventional#Machakos
18.49(±1.93) 30.58(±0.92)a 32.4(±0.84)a 36.2(±0.56)b 36.29(±1.05)b 36.94(±0.55)b
00748_HumusFormati
onHumusBalance
Organic#Murang'a Conventional#Murang'a Conventional#Kirinyag
a
Conventional#Machako
s Organic#Kirinyaga Organic#Machakos
P<0.05 35.78(±0.0) 57.02(±0.0) 57.98(±0.0) 62.78(±0.0) 65.87(±0.0) 65.87(±0.0)
00758_NumberPerenn
ialcrops
Organic#Murang'a Organic#Kirinyaga Conventional#Murang'a Conventional#Machako
s Organic#Machakos Conventional#Kirinyaga
0.94(±0.34)a 1.43(±0.48)a 1.43(±0.29)a 1.74(±0.38)a 1.9(±1.21)ab 4.34(±0.51)b
00764_ShareLegumes
OnPerennialCropArea
Organic#Murang'a Conventional#Murang'a Organic#Kirinyaga Conventional#Kirinyag
a
Conventional#Machako
s Organic#Machakos
0.0(±0.0)a 0.26(±0.26)a 1.22(±0.74)ab 1.54(±0.56)b 11.72(±1.24)c 17.62(±3.66)c
Spec
ies
Div
ersi
ty
00202_AgroForestryS
ystems_Calculated
Organic#Murang'a Conventional#Murang'a Conventional#Machako
s Organic#Machakos Organic#Kirinyaga Conventional#Kirinyaga
ns 0.22(±0.16)a 0.25(±0.11)a 1.46(±0.14)b 5.62(±2.17)bcd 6.42(±1.3)c 9.95(±1.22)d
00204_WoodlandsDef
orestation
Conventional#Machako
s Organic#Machakos Organic#Murang'a Organic#Kirinyaga Conventional#Murang'a Conventional#Kirinyaga
ns 39.9(±1.01)a 40.63(±2.44)ab 42.42(±1.45)ab 44.91(±0.87)bc 45.04(±0.56)bc 45.64(±0.42)c
00208_WoodlandsSha
reAgriculturalLand_C
alculated
Organic#Machakos Conventional#Machako
s
Conventional#Kirinyag
a Organic#Kirinyaga Conventional#Murang'a Organic#Murang'a
ns 2.01(±1.02)a 2.96(±0.7)a 6.71(±1.01)b 9.4(±2.11)bc 11.54(±1.37)cd 16.5(±2.52)d
00215_ArableLandSh
areTemporaryGrasslan
d_Calculated
Organic#Machakos Conventional#Machako
s
Conventional#Kirinyag
a Organic#Kirinyaga Conventional#Murang'a Organic#Murang'a
ns 0.3(±0.29)a 0.65(±0.21)a 8.0(±1.0)b 11.54(±2.07)bc 12.41(±1.08)c 13.13(±1.63)c
00222_PermanentGras
slandsShareOfAgricult
uralArea_Calculated
Organic#Murang'a Organic#Kirinyaga Conventional#Kirinyag
a Conventional#Murang'a Organic#Machakos Conventional#Machakos
ns 0.97(±0.42)a 1.12(±0.51)a 1.14(±0.34)a 1.87(±0.49)a 6.26(±1.99)b 8.43(±0.8)b
00233_NoUseSynthC
hemFungicides
Organic#Kirinyaga Conventional#Kirinyag
a
Conventional#Machako
s Organic#Machakos Conventional#Murang'a Organic#Murang'a
34.41(±2.2)a 39.6(±1.48)a 43.57(±1.13)b 48.39(±2.38)b 65.01(±0.51) 66.8(±0.12)
00234_NoUseSynthC
hemInsecticides
Conventional#Kirinyag
a
Conventional#Machako
s Organic#Machakos Organic#Kirinyaga Conventional#Murang'a Organic#Murang'a
P<0.05 31.62(±1.81) 44.29(±1.2) 50.65(±2.44)a 53.11(±2.41)a 66.58(±0.69)b 68.19(±0.62)b
00257_1_PesticidesTo
xicityBees
Conventional#Machako
s Organic#Kirinyaga
Conventional#Kirinyag
a Organic#Machakos Conventional#Murang'a Organic#Murang'a
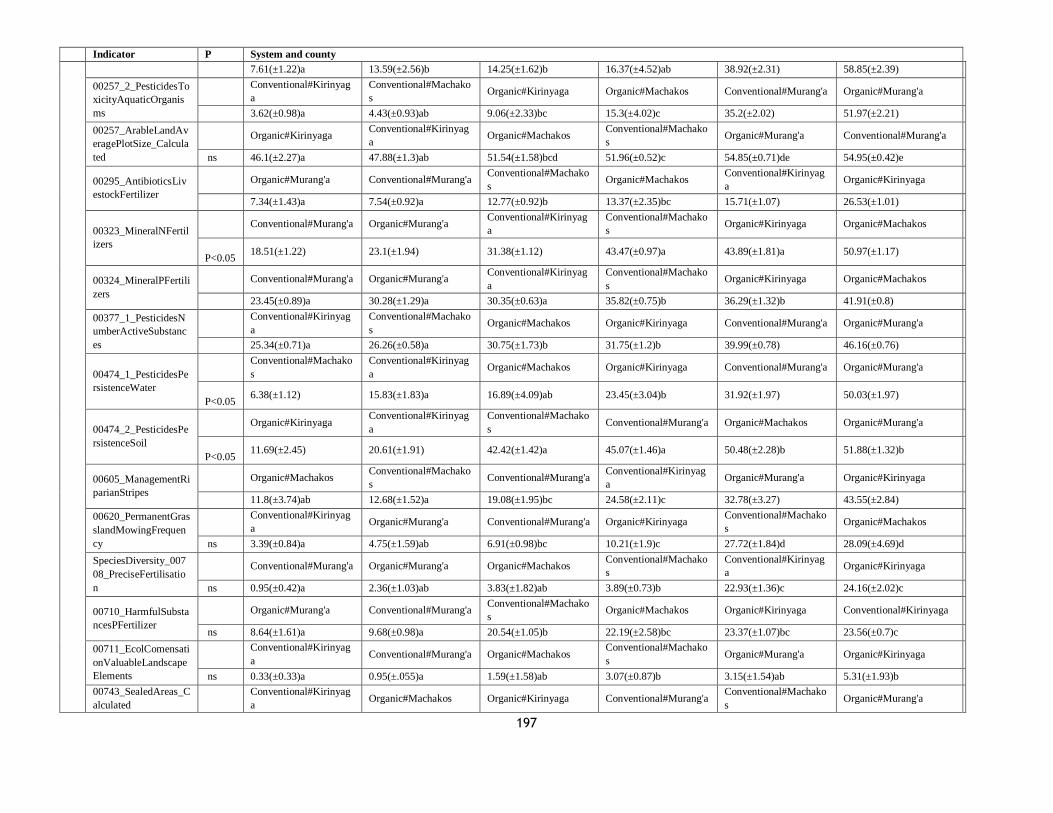
197
Indicator P System and county
7.61(±1.22)a 13.59(±2.56)b 14.25(±1.62)b 16.37(±4.52)ab 38.92(±2.31) 58.85(±2.39)
00257_2_PesticidesTo
xicityAquaticOrganis
ms
Conventional#Kirinyag
a
Conventional#Machako
s Organic#Kirinyaga Organic#Machakos Conventional#Murang'a Organic#Murang'a
3.62(±0.98)a 4.43(±0.93)ab 9.06(±2.33)bc 15.3(±4.02)c 35.2(±2.02) 51.97(±2.21)
00257_ArableLandAv
eragePlotSize_Calcula
ted
Organic#Kirinyaga Conventional#Kirinyag
a Organic#Machakos
Conventional#Machako
s Organic#Murang'a Conventional#Murang'a
ns 46.1(±2.27)a 47.88(±1.3)ab 51.54(±1.58)bcd 51.96(±0.52)c 54.85(±0.71)de 54.95(±0.42)e
00295_AntibioticsLiv
estockFertilizer
Organic#Murang'a Conventional#Murang'a Conventional#Machako
s Organic#Machakos
Conventional#Kirinyag
a Organic#Kirinyaga
7.34(±1.43)a 7.54(±0.92)a 12.77(±0.92)b 13.37(±2.35)bc 15.71(±1.07) 26.53(±1.01)
00323_MineralNFertil
izers
Conventional#Murang'a Organic#Murang'a Conventional#Kirinyag
a
Conventional#Machako
s Organic#Kirinyaga Organic#Machakos
P<0.05 18.51(±1.22) 23.1(±1.94) 31.38(±1.12) 43.47(±0.97)a 43.89(±1.81)a 50.97(±1.17)
00324_MineralPFertili
zers
Conventional#Murang'a Organic#Murang'a Conventional#Kirinyag
a
Conventional#Machako
s Organic#Kirinyaga Organic#Machakos
23.45(±0.89)a 30.28(±1.29)a 30.35(±0.63)a 35.82(±0.75)b 36.29(±1.32)b 41.91(±0.8)
00377_1_PesticidesN
umberActiveSubstanc
es
Conventional#Kirinyag
a
Conventional#Machako
s Organic#Machakos Organic#Kirinyaga Conventional#Murang'a Organic#Murang'a
25.34(±0.71)a 26.26(±0.58)a 30.75(±1.73)b 31.75(±1.2)b 39.99(±0.78) 46.16(±0.76)
00474_1_PesticidesPe
rsistenceWater
Conventional#Machako
s
Conventional#Kirinyag
a Organic#Machakos Organic#Kirinyaga Conventional#Murang'a Organic#Murang'a
P<0.05 6.38(±1.12) 15.83(±1.83)a 16.89(±4.09)ab 23.45(±3.04)b 31.92(±1.97) 50.03(±1.97)
00474_2_PesticidesPe
rsistenceSoil
Organic#Kirinyaga Conventional#Kirinyag
a
Conventional#Machako
s Conventional#Murang'a Organic#Machakos Organic#Murang'a
P<0.05 11.69(±2.45) 20.61(±1.91) 42.42(±1.42)a 45.07(±1.46)a 50.48(±2.28)b 51.88(±1.32)b
00605_ManagementRi
parianStripes
Organic#Machakos Conventional#Machako
s Conventional#Murang'a
Conventional#Kirinyag
a Organic#Murang'a Organic#Kirinyaga
11.8(±3.74)ab 12.68(±1.52)a 19.08(±1.95)bc 24.58(±2.11)c 32.78(±3.27) 43.55(±2.84)
00620_PermanentGras
slandMowingFrequen
cy
Conventional#Kirinyag
a Organic#Murang'a Conventional#Murang'a Organic#Kirinyaga
Conventional#Machako
s Organic#Machakos
ns 3.39(±0.84)a 4.75(±1.59)ab 6.91(±0.98)bc 10.21(±1.9)c 27.72(±1.84)d 28.09(±4.69)d
SpeciesDiversity_007
08_PreciseFertilisatio
n
Conventional#Murang'a Organic#Murang'a Organic#Machakos Conventional#Machako
s
Conventional#Kirinyag
a Organic#Kirinyaga
ns 0.95(±0.42)a 2.36(±1.03)ab 3.83(±1.82)ab 3.89(±0.73)b 22.93(±1.36)c 24.16(±2.02)c
00710_HarmfulSubsta
ncesPFertilizer
Organic#Murang'a Conventional#Murang'a Conventional#Machako
s Organic#Machakos Organic#Kirinyaga Conventional#Kirinyaga
ns 8.64(±1.61)a 9.68(±0.98)a 20.54(±1.05)b 22.19(±2.58)bc 23.37(±1.07)bc 23.56(±0.7)c
00711_EcolComensati
onValuableLandscape
Elements
Conventional#Kirinyag
a Conventional#Murang'a Organic#Machakos
Conventional#Machako
s Organic#Murang'a Organic#Kirinyaga
ns 0.33(±0.33)a 0.95(±.055)a 1.59(±1.58)ab 3.07(±0.87)b 3.15(±1.54)ab 5.31(±1.93)b
00743_SealedAreas_C
alculated
Conventional#Kirinyag
a Organic#Machakos Organic#Kirinyaga Conventional#Murang'a
Conventional#Machako
s Organic#Murang'a
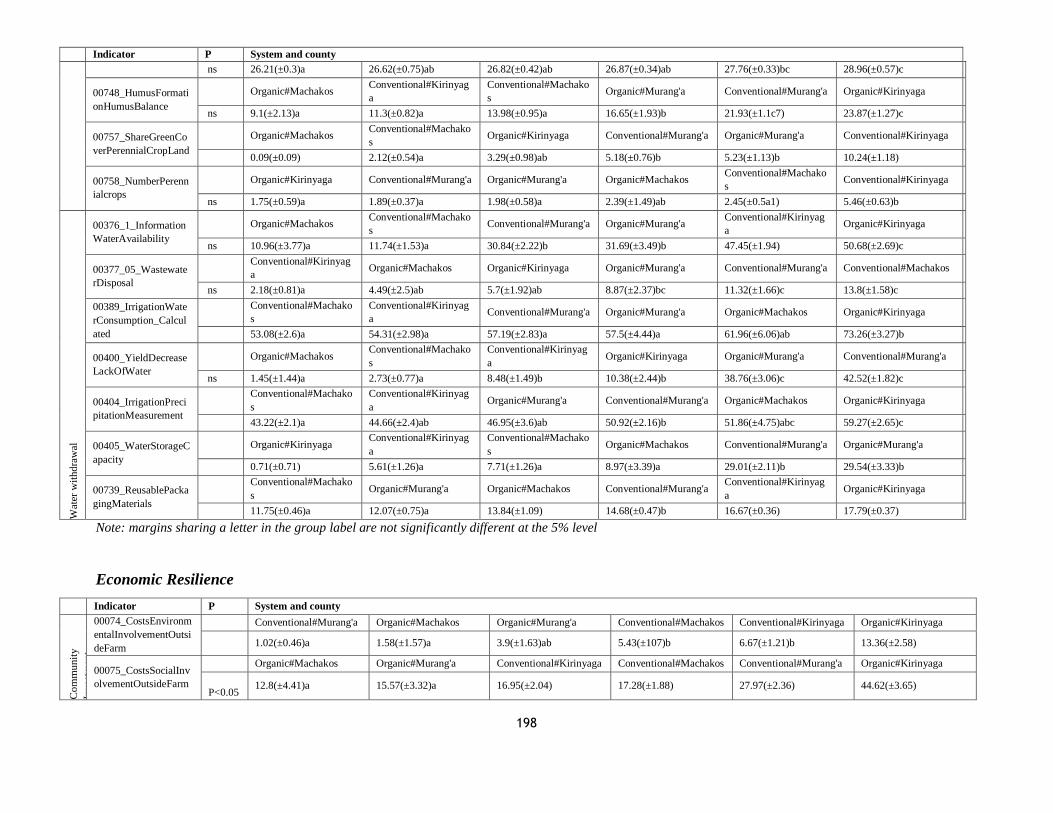
198
Indicator P System and county
ns 26.21(±0.3)a 26.62(±0.75)ab 26.82(±0.42)ab 26.87(±0.34)ab 27.76(±0.33)bc 28.96(±0.57)c
00748_HumusFormati
onHumusBalance
Organic#Machakos Conventional#Kirinyag
a
Conventional#Machako
s Organic#Murang'a Conventional#Murang'a Organic#Kirinyaga
ns 9.1(±2.13)a 11.3(±0.82)a 13.98(±0.95)a 16.65(±1.93)b 21.93(±1.1c7) 23.87(±1.27)c
00757_ShareGreenCo
verPerennialCropLand
Organic#Machakos Conventional#Machako
s Organic#Kirinyaga Conventional#Murang'a Organic#Murang'a Conventional#Kirinyaga
0.09(±0.09) 2.12(±0.54)a 3.29(±0.98)ab 5.18(±0.76)b 5.23(±1.13)b 10.24(±1.18)
00758_NumberPerenn
ialcrops
Organic#Kirinyaga Conventional#Murang'a Organic#Murang'a Organic#Machakos Conventional#Machako
s Conventional#Kirinyaga
ns 1.75(±0.59)a 1.89(±0.37)a 1.98(±0.58)a 2.39(±1.49)ab 2.45(±0.5a1) 5.46(±0.63)b
Wat
er w
ithdra
wal
00376_1_Information
WaterAvailability
Organic#Machakos Conventional#Machako
s Conventional#Murang'a Organic#Murang'a
Conventional#Kirinyag
a Organic#Kirinyaga
ns 10.96(±3.77)a 11.74(±1.53)a 30.84(±2.22)b 31.69(±3.49)b 47.45(±1.94) 50.68(±2.69)c
00377_05_Wastewate
rDisposal
Conventional#Kirinyag
a Organic#Machakos Organic#Kirinyaga Organic#Murang'a Conventional#Murang'a Conventional#Machakos
ns 2.18(±0.81)a 4.49(±2.5)ab 5.7(±1.92)ab 8.87(±2.37)bc 11.32(±1.66)c 13.8(±1.58)c
00389_IrrigationWate
rConsumption_Calcul
ated
Conventional#Machako
s
Conventional#Kirinyag
a Conventional#Murang'a Organic#Murang'a Organic#Machakos Organic#Kirinyaga
53.08(±2.6)a 54.31(±2.98)a 57.19(±2.83)a 57.5(±4.44)a 61.96(±6.06)ab 73.26(±3.27)b
00400_YieldDecrease
LackOfWater
Organic#Machakos Conventional#Machako
s
Conventional#Kirinyag
a Organic#Kirinyaga Organic#Murang'a Conventional#Murang'a
ns 1.45(±1.44)a 2.73(±0.77)a 8.48(±1.49)b 10.38(±2.44)b 38.76(±3.06)c 42.52(±1.82)c
00404_IrrigationPreci
pitationMeasurement
Conventional#Machako
s
Conventional#Kirinyag
a Organic#Murang'a Conventional#Murang'a Organic#Machakos Organic#Kirinyaga
43.22(±2.1)a 44.66(±2.4)ab 46.95(±3.6)ab 50.92(±2.16)b 51.86(±4.75)abc 59.27(±2.65)c
00405_WaterStorageC
apacity
Organic#Kirinyaga Conventional#Kirinyag
a
Conventional#Machako
s Organic#Machakos Conventional#Murang'a Organic#Murang'a
0.71(±0.71) 5.61(±1.26)a 7.71(±1.26)a 8.97(±3.39)a 29.01(±2.11)b 29.54(±3.33)b
00739_ReusablePacka
gingMaterials
Conventional#Machako
s Organic#Murang'a Organic#Machakos Conventional#Murang'a
Conventional#Kirinyag
a Organic#Kirinyaga
11.75(±0.46)a 12.07(±0.75)a 13.84(±1.09) 14.68(±0.47)b 16.67(±0.36) 17.79(±0.37)
Note: margins sharing a letter in the group label are not significantly different at the 5% level
Economic Resilience
Indicator P System and county
Com
munit
y
Inves
tmen
t
00074_CostsEnvironm
entalInvolvementOutsi
deFarm
Conventional#Murang'a Organic#Machakos Organic#Murang'a Conventional#Machakos Conventional#Kirinyaga Organic#Kirinyaga
1.02(±0.46)a 1.58(±1.57)a 3.9(±1.63)ab 5.43(±107)b 6.67(±1.21)b 13.36(±2.58)
00075_CostsSocialInv
olvementOutsideFarm
Organic#Machakos Organic#Murang'a Conventional#Kirinyaga Conventional#Machakos Conventional#Murang'a Organic#Kirinyaga
P<0.05 12.8(±4.41)a 15.57(±3.32)a 16.95(±2.04) 17.28(±1.88) 27.97(±2.36) 44.62(±3.65)
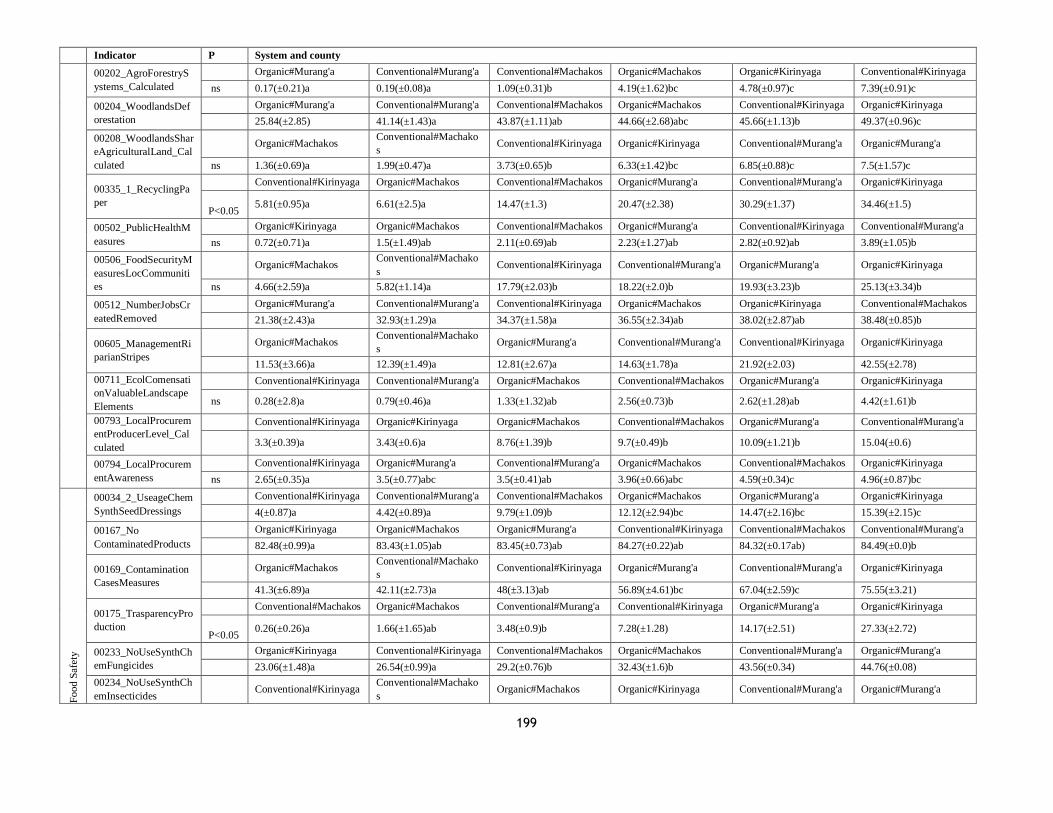
199
Indicator P System and county
00202_AgroForestryS
ystems_Calculated
Organic#Murang'a Conventional#Murang'a Conventional#Machakos Organic#Machakos Organic#Kirinyaga Conventional#Kirinyaga
ns 0.17(±0.21)a 0.19(±0.08)a 1.09(±0.31)b 4.19(±1.62)bc 4.78(±0.97)c 7.39(±0.91)c
00204_WoodlandsDef
orestation
Organic#Murang'a Conventional#Murang'a Conventional#Machakos Organic#Machakos Conventional#Kirinyaga Organic#Kirinyaga
25.84(±2.85) 41.14(±1.43)a 43.87(±1.11)ab 44.66(±2.68)abc 45.66(±1.13)b 49.37(±0.96)c
00208_WoodlandsShar
eAgriculturalLand_Cal
culated
Organic#Machakos Conventional#Machako
s Conventional#Kirinyaga Organic#Kirinyaga Conventional#Murang'a Organic#Murang'a
ns 1.36(±0.69)a 1.99(±0.47)a 3.73(±0.65)b 6.33(±1.42)bc 6.85(±0.88)c 7.5(±1.57)c
00335_1_RecyclingPa
per
Conventional#Kirinyaga Organic#Machakos Conventional#Machakos Organic#Murang'a Conventional#Murang'a Organic#Kirinyaga
P<0.05 5.81(±0.95)a 6.61(±2.5)a 14.47(±1.3) 20.47(±2.38) 30.29(±1.37) 34.46(±1.5)
00502_PublicHealthM
easures
Organic#Kirinyaga Organic#Machakos Conventional#Machakos Organic#Murang'a Conventional#Kirinyaga Conventional#Murang'a
ns 0.72(±0.71)a 1.5(±1.49)ab 2.11(±0.69)ab 2.23(±1.27)ab 2.82(±0.92)ab 3.89(±1.05)b
00506_FoodSecurityM
easuresLocCommuniti
es
Organic#Machakos Conventional#Machako
s Conventional#Kirinyaga Conventional#Murang'a Organic#Murang'a Organic#Kirinyaga
ns 4.66(±2.59)a 5.82(±1.14)a 17.79(±2.03)b 18.22(±2.0)b 19.93(±3.23)b 25.13(±3.34)b
00512_NumberJobsCr
eatedRemoved
Organic#Murang'a Conventional#Murang'a Conventional#Kirinyaga Organic#Machakos Organic#Kirinyaga Conventional#Machakos
21.38(±2.43)a 32.93(±1.29)a 34.37(±1.58)a 36.55(±2.34)ab 38.02(±2.87)ab 38.48(±0.85)b
00605_ManagementRi
parianStripes
Organic#Machakos Conventional#Machako
s Organic#Murang'a Conventional#Murang'a Conventional#Kirinyaga Organic#Kirinyaga
11.53(±3.66)a 12.39(±1.49)a 12.81(±2.67)a 14.63(±1.78)a 21.92(±2.03) 42.55(±2.78)
00711_EcolComensati
onValuableLandscape
Elements
Conventional#Kirinyaga Conventional#Murang'a Organic#Machakos Conventional#Machakos Organic#Murang'a Organic#Kirinyaga
ns 0.28(±2.8)a 0.79(±0.46)a 1.33(±1.32)ab 2.56(±0.73)b 2.62(±1.28)ab 4.42(±1.61)b
00793_LocalProcurem
entProducerLevel_Cal
culated
Conventional#Kirinyaga Organic#Kirinyaga Organic#Machakos Conventional#Machakos Organic#Murang'a Conventional#Murang'a
3.3(±0.39)a 3.43(±0.6)a 8.76(±1.39)b 9.7(±0.49)b 10.09(±1.21)b 15.04(±0.6)
00794_LocalProcurem
entAwareness
Conventional#Kirinyaga Organic#Murang'a Conventional#Murang'a Organic#Machakos Conventional#Machakos Organic#Kirinyaga
ns 2.65(±0.35)a 3.5(±0.77)abc 3.5(±0.41)ab 3.96(±0.66)abc 4.59(±0.34)c 4.96(±0.87)bc
Food S
afet
y
00034_2_UseageChem
SynthSeedDressings
Conventional#Kirinyaga Conventional#Murang'a Conventional#Machakos Organic#Machakos Organic#Murang'a Organic#Kirinyaga
4(±0.87)a 4.42(±0.89)a 9.79(±1.09)b 12.12(±2.94)bc 14.47(±2.16)bc 15.39(±2.15)c
00167_No
ContaminatedProducts
Organic#Kirinyaga Organic#Machakos Organic#Murang'a Conventional#Kirinyaga Conventional#Machakos Conventional#Murang'a
82.48(±0.99)a 83.43(±1.05)ab 83.45(±0.73)ab 84.27(±0.22)ab 84.32(±0.17ab) 84.49(±0.0)b
00169_Contamination
CasesMeasures
Organic#Machakos Conventional#Machako
s Conventional#Kirinyaga Organic#Murang'a Conventional#Murang'a Organic#Kirinyaga
41.3(±6.89)a 42.11(±2.73)a 48(±3.13)ab 56.89(±4.61)bc 67.04(±2.59)c 75.55(±3.21)
00175_TrasparencyPro
duction
Conventional#Machakos Organic#Machakos Conventional#Murang'a Conventional#Kirinyaga Organic#Murang'a Organic#Kirinyaga
P<0.05 0.26(±0.26)a 1.66(±1.65)ab 3.48(±0.9)b 7.28(±1.28) 14.17(±2.51) 27.33(±2.72)
00233_NoUseSynthCh
emFungicides
Organic#Kirinyaga Conventional#Kirinyaga Conventional#Machakos Organic#Machakos Conventional#Murang'a Organic#Murang'a
23.06(±1.48)a 26.54(±0.99)a 29.2(±0.76)b 32.43(±1.6)b 43.56(±0.34) 44.76(±0.08)
00234_NoUseSynthCh
emInsecticides Conventional#Kirinyaga
Conventional#Machako
s Organic#Machakos Organic#Kirinyaga Conventional#Murang'a Organic#Murang'a
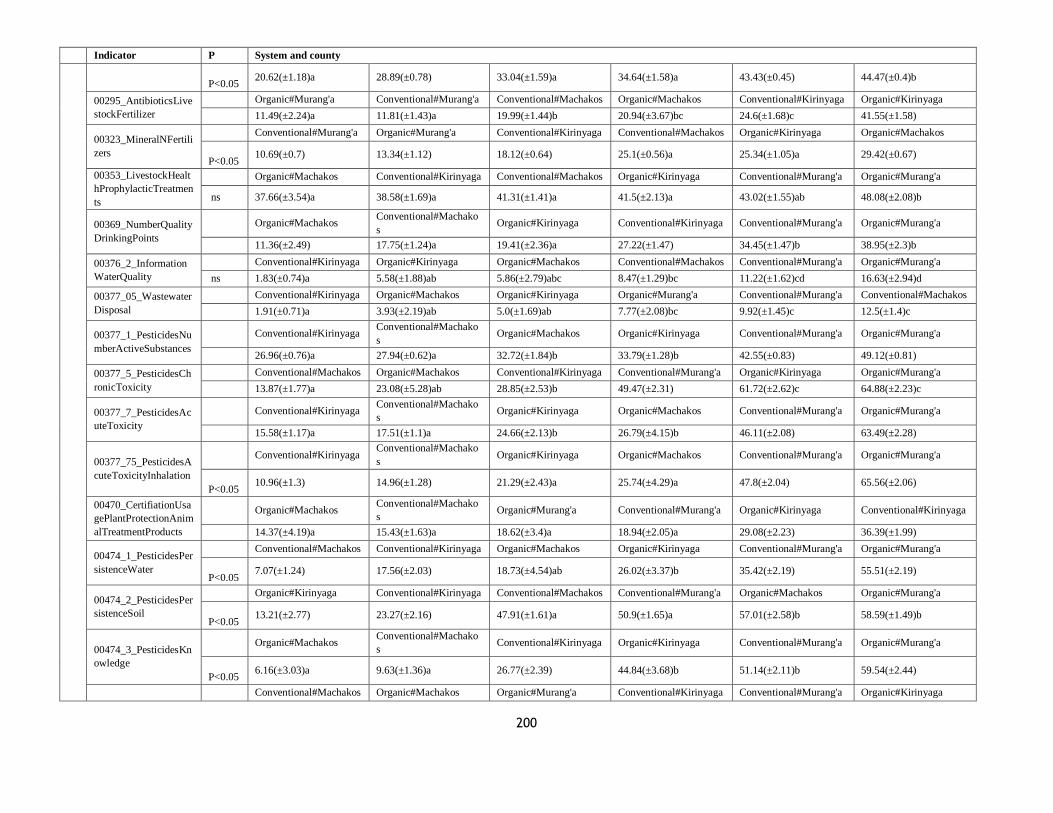
200
Indicator P System and county
P<0.05 20.62(±1.18)a 28.89(±0.78) 33.04(±1.59)a 34.64(±1.58)a 43.43(±0.45) 44.47(±0.4)b
00295_AntibioticsLive
stockFertilizer
Organic#Murang'a Conventional#Murang'a Conventional#Machakos Organic#Machakos Conventional#Kirinyaga Organic#Kirinyaga
11.49(±2.24)a 11.81(±1.43)a 19.99(±1.44)b 20.94(±3.67)bc 24.6(±1.68)c 41.55(±1.58)
00323_MineralNFertili
zers
Conventional#Murang'a Organic#Murang'a Conventional#Kirinyaga Conventional#Machakos Organic#Kirinyaga Organic#Machakos
P<0.05 10.69(±0.7) 13.34(±1.12) 18.12(±0.64) 25.1(±0.56)a 25.34(±1.05)a 29.42(±0.67)
00353_LivestockHealt
hProphylacticTreatmen
ts
Organic#Machakos Conventional#Kirinyaga Conventional#Machakos Organic#Kirinyaga Conventional#Murang'a Organic#Murang'a
ns 37.66(±3.54)a 38.58(±1.69)a 41.31(±1.41)a 41.5(±2.13)a 43.02(±1.55)ab 48.08(±2.08)b
00369_NumberQuality
DrinkingPoints
Organic#Machakos Conventional#Machako
s Organic#Kirinyaga Conventional#Kirinyaga Conventional#Murang'a Organic#Murang'a
11.36(±2.49) 17.75(±1.24)a 19.41(±2.36)a 27.22(±1.47) 34.45(±1.47)b 38.95(±2.3)b
00376_2_Information
WaterQuality
Conventional#Kirinyaga Organic#Kirinyaga Organic#Machakos Conventional#Machakos Conventional#Murang'a Organic#Murang'a
ns 1.83(±0.74)a 5.58(±1.88)ab 5.86(±2.79)abc 8.47(±1.29)bc 11.22(±1.62)cd 16.63(±2.94)d
00377_05_Wastewater
Disposal
Conventional#Kirinyaga Organic#Machakos Organic#Kirinyaga Organic#Murang'a Conventional#Murang'a Conventional#Machakos
1.91(±0.71)a 3.93(±2.19)ab 5.0(±1.69)ab 7.77(±2.08)bc 9.92(±1.45)c 12.5(±1.4)c
00377_1_PesticidesNu
mberActiveSubstances
Conventional#Kirinyaga Conventional#Machako
s Organic#Machakos Organic#Kirinyaga Conventional#Murang'a Organic#Murang'a
26.96(±0.76)a 27.94(±0.62)a 32.72(±1.84)b 33.79(±1.28)b 42.55(±0.83) 49.12(±0.81)
00377_5_PesticidesCh
ronicToxicity
Conventional#Machakos Organic#Machakos Conventional#Kirinyaga Conventional#Murang'a Organic#Kirinyaga Organic#Murang'a
13.87(±1.77)a 23.08(±5.28)ab 28.85(±2.53)b 49.47(±2.31) 61.72(±2.62)c 64.88(±2.23)c
00377_7_PesticidesAc
uteToxicity
Conventional#Kirinyaga Conventional#Machako
s Organic#Kirinyaga Organic#Machakos Conventional#Murang'a Organic#Murang'a
15.58(±1.17)a 17.51(±1.1)a 24.66(±2.13)b 26.79(±4.15)b 46.11(±2.08) 63.49(±2.28)
00377_75_PesticidesA
cuteToxicityInhalation
Conventional#Kirinyaga Conventional#Machako
s Organic#Kirinyaga Organic#Machakos Conventional#Murang'a Organic#Murang'a
P<0.05 10.96(±1.3) 14.96(±1.28) 21.29(±2.43)a 25.74(±4.29)a 47.8(±2.04) 65.56(±2.06)
00470_CertifiationUsa
gePlantProtectionAnim
alTreatmentProducts
Organic#Machakos Conventional#Machako
s Organic#Murang'a Conventional#Murang'a Organic#Kirinyaga Conventional#Kirinyaga
14.37(±4.19)a 15.43(±1.63)a 18.62(±3.4)a 18.94(±2.05)a 29.08(±2.23) 36.39(±1.99)
00474_1_PesticidesPer
sistenceWater
Conventional#Machakos Conventional#Kirinyaga Organic#Machakos Organic#Kirinyaga Conventional#Murang'a Organic#Murang'a
P<0.05 7.07(±1.24) 17.56(±2.03) 18.73(±4.54)ab 26.02(±3.37)b 35.42(±2.19) 55.51(±2.19)
00474_2_PesticidesPer
sistenceSoil
Organic#Kirinyaga Conventional#Kirinyaga Conventional#Machakos Conventional#Murang'a Organic#Machakos Organic#Murang'a
P<0.05 13.21(±2.77) 23.27(±2.16) 47.91(±1.61)a 50.9(±1.65)a 57.01(±2.58)b 58.59(±1.49)b
00474_3_PesticidesKn
owledge
Organic#Machakos Conventional#Machako
s Conventional#Kirinyaga Organic#Kirinyaga Conventional#Murang'a Organic#Murang'a
P<0.05 6.16(±3.03)a 9.63(±1.36)a 26.77(±2.39) 44.84(±3.68)b 51.14(±2.11)b 59.54(±2.44)
Conventional#Machakos Organic#Machakos Organic#Murang'a Conventional#Kirinyaga Conventional#Murang'a Organic#Kirinyaga
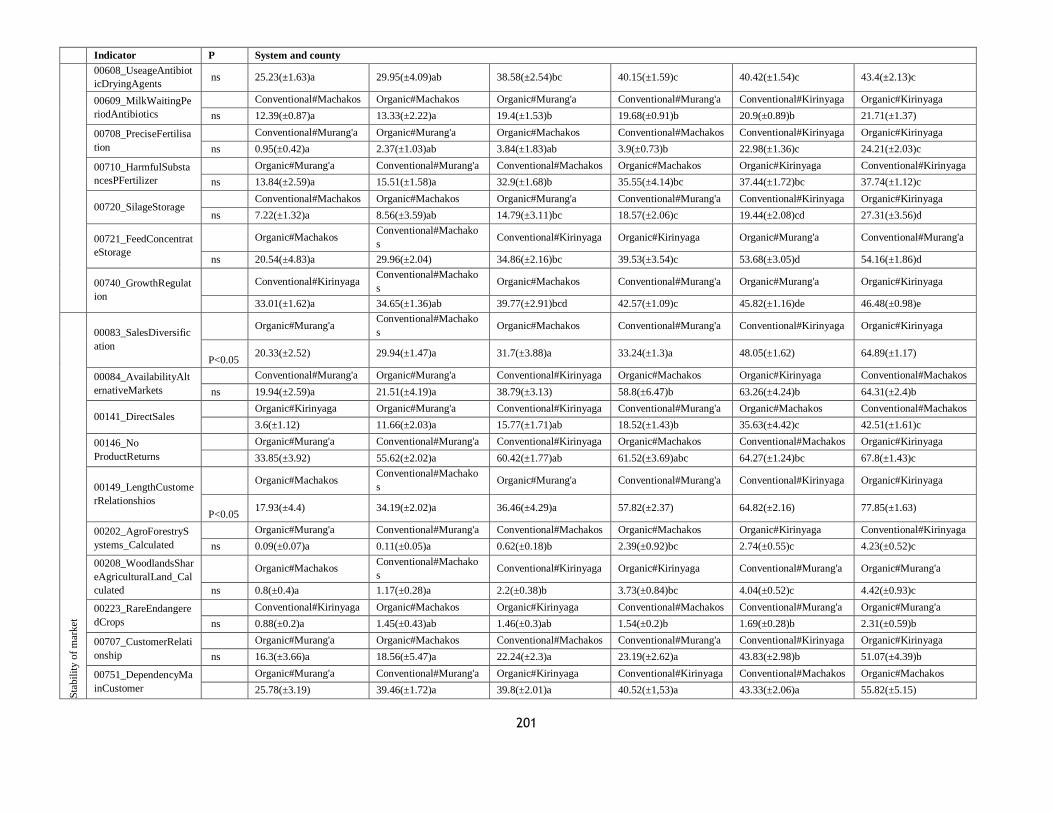
201
Indicator P System and county
00608_UseageAntibiot
icDryingAgents ns 25.23(±1.63)a 29.95(±4.09)ab 38.58(±2.54)bc 40.15(±1.59)c 40.42(±1.54)c 43.4(±2.13)c
00609_MilkWaitingPe
riodAntibiotics
Conventional#Machakos Organic#Machakos Organic#Murang'a Conventional#Murang'a Conventional#Kirinyaga Organic#Kirinyaga
ns 12.39(±0.87)a 13.33(±2.22)a 19.4(±1.53)b 19.68(±0.91)b 20.9(±0.89)b 21.71(±1.37)
00708_PreciseFertilisa
tion
Conventional#Murang'a Organic#Murang'a Organic#Machakos Conventional#Machakos Conventional#Kirinyaga Organic#Kirinyaga
ns 0.95(±0.42)a 2.37(±1.03)ab 3.84(±1.83)ab 3.9(±0.73)b 22.98(±1.36)c 24.21(±2.03)c
00710_HarmfulSubsta
ncesPFertilizer
Organic#Murang'a Conventional#Murang'a Conventional#Machakos Organic#Machakos Organic#Kirinyaga Conventional#Kirinyaga
ns 13.84(±2.59)a 15.51(±1.58)a 32.9(±1.68)b 35.55(±4.14)bc 37.44(±1.72)bc 37.74(±1.12)c
00720_SilageStorage Conventional#Machakos Organic#Machakos Organic#Murang'a Conventional#Murang'a Conventional#Kirinyaga Organic#Kirinyaga
ns 7.22(±1.32)a 8.56(±3.59)ab 14.79(±3.11)bc 18.57(±2.06)c 19.44(±2.08)cd 27.31(±3.56)d
00721_FeedConcentrat
eStorage
Organic#Machakos Conventional#Machako
s Conventional#Kirinyaga Organic#Kirinyaga Organic#Murang'a Conventional#Murang'a
ns 20.54(±4.83)a 29.96(±2.04) 34.86(±2.16)bc 39.53(±3.54)c 53.68(±3.05)d 54.16(±1.86)d
00740_GrowthRegulat
ion
Conventional#Kirinyaga Conventional#Machako
s Organic#Machakos Conventional#Murang'a Organic#Murang'a Organic#Kirinyaga
33.01(±1.62)a 34.65(±1.36)ab 39.77(±2.91)bcd 42.57(±1.09)c 45.82(±1.16)de 46.48(±0.98)e
Sta
bil
ity o
f m
arket
00083_SalesDiversific
ation
Organic#Murang'a Conventional#Machako
s Organic#Machakos Conventional#Murang'a Conventional#Kirinyaga Organic#Kirinyaga
P<0.05 20.33(±2.52) 29.94(±1.47)a 31.7(±3.88)a 33.24(±1.3)a 48.05(±1.62) 64.89(±1.17)
00084_AvailabilityAlt
ernativeMarkets
Conventional#Murang'a Organic#Murang'a Conventional#Kirinyaga Organic#Machakos Organic#Kirinyaga Conventional#Machakos
ns 19.94(±2.59)a 21.51(±4.19)a 38.79(±3.13) 58.8(±6.47)b 63.26(±4.24)b 64.31(±2.4)b
00141_DirectSales Organic#Kirinyaga Organic#Murang'a Conventional#Kirinyaga Conventional#Murang'a Organic#Machakos Conventional#Machakos
3.6(±1.12) 11.66(±2.03)a 15.77(±1.71)ab 18.52(±1.43)b 35.63(±4.42)c 42.51(±1.61)c
00146_No
ProductReturns
Organic#Murang'a Conventional#Murang'a Conventional#Kirinyaga Organic#Machakos Conventional#Machakos Organic#Kirinyaga
33.85(±3.92) 55.62(±2.02)a 60.42(±1.77)ab 61.52(±3.69)abc 64.27(±1.24)bc 67.8(±1.43)c
00149_LengthCustome
rRelationshios
Organic#Machakos Conventional#Machako
s Organic#Murang'a Conventional#Murang'a Conventional#Kirinyaga Organic#Kirinyaga
P<0.05 17.93(±4.4) 34.19(±2.02)a 36.46(±4.29)a 57.82(±2.37) 64.82(±2.16) 77.85(±1.63)
00202_AgroForestryS
ystems_Calculated
Organic#Murang'a Conventional#Murang'a Conventional#Machakos Organic#Machakos Organic#Kirinyaga Conventional#Kirinyaga
ns 0.09(±0.07)a 0.11(±0.05)a 0.62(±0.18)b 2.39(±0.92)bc 2.74(±0.55)c 4.23(±0.52)c
00208_WoodlandsShar
eAgriculturalLand_Cal
culated
Organic#Machakos Conventional#Machako
s Conventional#Kirinyaga Organic#Kirinyaga Conventional#Murang'a Organic#Murang'a
ns 0.8(±0.4)a 1.17(±0.28)a 2.2(±0.38)b 3.73(±0.84)bc 4.04(±0.52)c 4.42(±0.93)c
00223_RareEndangere
dCrops
Conventional#Kirinyaga Organic#Machakos Organic#Kirinyaga Conventional#Machakos Conventional#Murang'a Organic#Murang'a
ns 0.88(±0.2)a 1.45(±0.43)ab 1.46(±0.3)ab 1.54(±0.2)b 1.69(±0.28)b 2.31(±0.59)b
00707_CustomerRelati
onship
Organic#Murang'a Organic#Machakos Conventional#Machakos Conventional#Murang'a Conventional#Kirinyaga Organic#Kirinyaga
ns 16.3(±3.66)a 18.56(±5.47)a 22.24(±2.3)a 23.19(±2.62)a 43.83(±2.98)b 51.07(±4.39)b
00751_DependencyMa
inCustomer
Organic#Murang'a Conventional#Murang'a Organic#Kirinyaga Conventional#Kirinyaga Conventional#Machakos Organic#Machakos
25.78(±3.19) 39.46(±1.72)a 39.8(±2.01)a 40.52(±1,53)a 43.33(±2.06)a 55.82(±5.15)
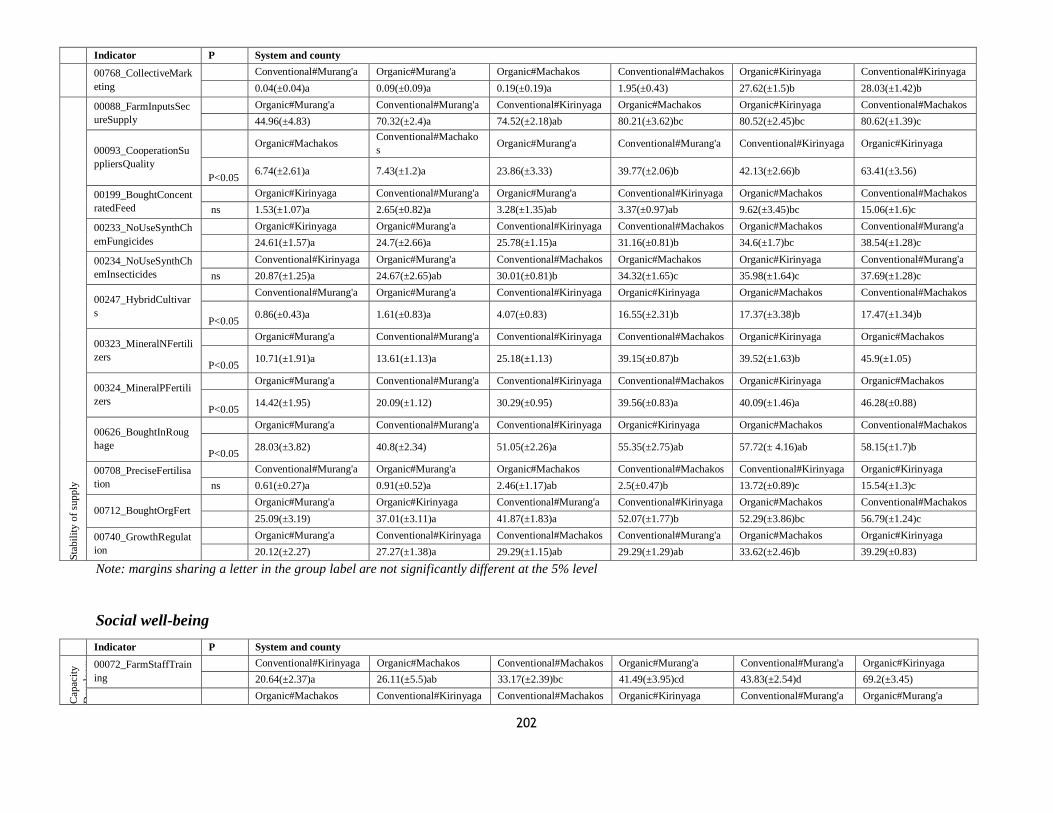
202
Indicator P System and county
00768_CollectiveMark
eting
Conventional#Murang'a Organic#Murang'a Organic#Machakos Conventional#Machakos Organic#Kirinyaga Conventional#Kirinyaga
0.04(±0.04)a 0.09(±0.09)a 0.19(±0.19)a 1.95(±0.43) 27.62(±1.5)b 28.03(±1.42)b
Sta
bil
ity o
f su
pply
00088_FarmInputsSec
ureSupply
Organic#Murang'a Conventional#Murang'a Conventional#Kirinyaga Organic#Machakos Organic#Kirinyaga Conventional#Machakos
44.96(±4.83) 70.32(±2.4)a 74.52(±2.18)ab 80.21(±3.62)bc 80.52(±2.45)bc 80.62(±1.39)c
00093_CooperationSu
ppliersQuality
Organic#Machakos Conventional#Machako
s Organic#Murang'a Conventional#Murang'a Conventional#Kirinyaga Organic#Kirinyaga
P<0.05 6.74(±2.61)a 7.43(±1.2)a 23.86(±3.33) 39.77(±2.06)b 42.13(±2.66)b 63.41(±3.56)
00199_BoughtConcent
ratedFeed
Organic#Kirinyaga Conventional#Murang'a Organic#Murang'a Conventional#Kirinyaga Organic#Machakos Conventional#Machakos
ns 1.53(±1.07)a 2.65(±0.82)a 3.28(±1.35)ab 3.37(±0.97)ab 9.62(±3.45)bc 15.06(±1.6)c
00233_NoUseSynthCh
emFungicides
Organic#Kirinyaga Organic#Murang'a Conventional#Kirinyaga Conventional#Machakos Organic#Machakos Conventional#Murang'a
24.61(±1.57)a 24.7(±2.66)a 25.78(±1.15)a 31.16(±0.81)b 34.6(±1.7)bc 38.54(±1.28)c
00234_NoUseSynthCh
emInsecticides
Conventional#Kirinyaga Organic#Murang'a Conventional#Machakos Organic#Machakos Organic#Kirinyaga Conventional#Murang'a
ns 20.87(±1.25)a 24.67(±2.65)ab 30.01(±0.81)b 34.32(±1.65)c 35.98(±1.64)c 37.69(±1.28)c
00247_HybridCultivar
s
Conventional#Murang'a Organic#Murang'a Conventional#Kirinyaga Organic#Kirinyaga Organic#Machakos Conventional#Machakos
P<0.05 0.86(±0.43)a 1.61(±0.83)a 4.07(±0.83) 16.55(±2.31)b 17.37(±3.38)b 17.47(±1.34)b
00323_MineralNFertili
zers
Organic#Murang'a Conventional#Murang'a Conventional#Kirinyaga Conventional#Machakos Organic#Kirinyaga Organic#Machakos
P<0.05 10.71(±1.91)a 13.61(±1.13)a 25.18(±1.13) 39.15(±0.87)b 39.52(±1.63)b 45.9(±1.05)
00324_MineralPFertili
zers
Organic#Murang'a Conventional#Murang'a Conventional#Kirinyaga Conventional#Machakos Organic#Kirinyaga Organic#Machakos
P<0.05 14.42(±1.95) 20.09(±1.12) 30.29(±0.95) 39.56(±0.83)a 40.09(±1.46)a 46.28(±0.88)
00626_BoughtInRoug
hage
Organic#Murang'a Conventional#Murang'a Conventional#Kirinyaga Organic#Kirinyaga Organic#Machakos Conventional#Machakos
P<0.05 28.03(±3.82) 40.8(±2.34) 51.05(±2.26)a 55.35(±2.75)ab 57.72(± 4.16)ab 58.15(±1.7)b
00708_PreciseFertilisa
tion
Conventional#Murang'a Organic#Murang'a Organic#Machakos Conventional#Machakos Conventional#Kirinyaga Organic#Kirinyaga
ns 0.61(±0.27)a 0.91(±0.52)a 2.46(±1.17)ab 2.5(±0.47)b 13.72(±0.89)c 15.54(±1.3)c
00712_BoughtOrgFert Organic#Murang'a Organic#Kirinyaga Conventional#Murang'a Conventional#Kirinyaga Organic#Machakos Conventional#Machakos
25.09(±3.19) 37.01(±3.11)a 41.87(±1.83)a 52.07(±1.77)b 52.29(±3.86)bc 56.79(±1.24)c
00740_GrowthRegulat
ion
Organic#Murang'a Conventional#Kirinyaga Conventional#Machakos Conventional#Murang'a Organic#Machakos Organic#Kirinyaga
20.12(±2.27) 27.27(±1.38)a 29.29(±1.15)ab 29.29(±1.29)ab 33.62(±2.46)b 39.29(±0.83)
Note: margins sharing a letter in the group label are not significantly different at the 5% level
Social well-being
Indicator P System and county
Cap
acit
y
Dev
elopm
ent
00072_FarmStaffTrain
ing
Conventional#Kirinyaga Organic#Machakos Conventional#Machakos Organic#Murang'a Conventional#Murang'a Organic#Kirinyaga
20.64(±2.37)a 26.11(±5.5)ab 33.17(±2.39)bc 41.49(±3.95)cd 43.83(±2.54)d 69.2(±3.45)
Organic#Machakos Conventional#Kirinyaga Conventional#Machakos Organic#Kirinyaga Conventional#Murang'a Organic#Murang'a
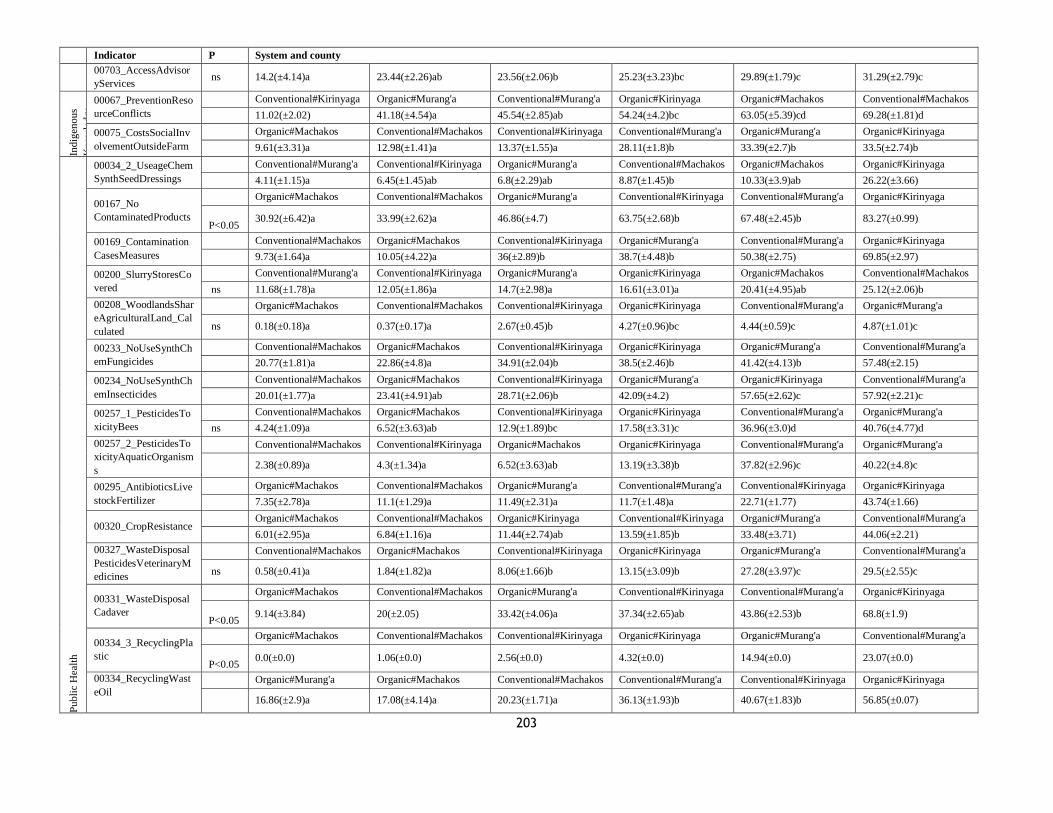
203
Indicator P System and county
00703_AccessAdvisor
yServices ns 14.2(±4.14)a 23.44(±2.26)ab 23.56(±2.06)b 25.23(±3.23)bc 29.89(±1.79)c 31.29(±2.79)c
Indig
enous
Know
ledge
00067_PreventionReso
urceConflicts
Conventional#Kirinyaga Organic#Murang'a Conventional#Murang'a Organic#Kirinyaga Organic#Machakos Conventional#Machakos
11.02(±2.02) 41.18(±4.54)a 45.54(±2.85)ab 54.24(±4.2)bc 63.05(±5.39)cd 69.28(±1.81)d
00075_CostsSocialInv
olvementOutsideFarm
Organic#Machakos Conventional#Machakos Conventional#Kirinyaga Conventional#Murang'a Organic#Murang'a Organic#Kirinyaga
9.61(±3.31)a 12.98(±1.41)a 13.37(±1.55)a 28.11(±1.8)b 33.39(±2.7)b 33.5(±2.74)b
Publi
c H
ealt
h
00034_2_UseageChem
SynthSeedDressings
Conventional#Murang'a Conventional#Kirinyaga Organic#Murang'a Conventional#Machakos Organic#Machakos Organic#Kirinyaga
4.11(±1.15)a 6.45(±1.45)ab 6.8(±2.29)ab 8.87(±1.45)b 10.33(±3.9)ab 26.22(±3.66)
00167_No
ContaminatedProducts
Organic#Machakos Conventional#Machakos Organic#Murang'a Conventional#Kirinyaga Conventional#Murang'a Organic#Kirinyaga
P<0.05 30.92(±6.42)a 33.99(±2.62)a 46.86(±4.7) 63.75(±2.68)b 67.48(±2.45)b 83.27(±0.99)
00169_Contamination
CasesMeasures
Conventional#Machakos Organic#Machakos Conventional#Kirinyaga Organic#Murang'a Conventional#Murang'a Organic#Kirinyaga
9.73(±1.64)a 10.05(±4.22)a 36(±2.89)b 38.7(±4.48)b 50.38(±2.75) 69.85(±2.97)
00200_SlurryStoresCo
vered
Conventional#Murang'a Conventional#Kirinyaga Organic#Murang'a Organic#Kirinyaga Organic#Machakos Conventional#Machakos
ns 11.68(±1.78)a 12.05(±1.86)a 14.7(±2.98)a 16.61(±3.01)a 20.41(±4.95)ab 25.12(±2.06)b
00208_WoodlandsShar
eAgriculturalLand_Cal
culated
Organic#Machakos Conventional#Machakos Conventional#Kirinyaga Organic#Kirinyaga Conventional#Murang'a Organic#Murang'a
ns 0.18(±0.18)a 0.37(±0.17)a 2.67(±0.45)b 4.27(±0.96)bc 4.44(±0.59)c 4.87(±1.01)c
00233_NoUseSynthCh
emFungicides
Conventional#Machakos Organic#Machakos Conventional#Kirinyaga Organic#Kirinyaga Organic#Murang'a Conventional#Murang'a
20.77(±1.81)a 22.86(±4.8)a 34.91(±2.04)b 38.5(±2.46)b 41.42(±4.13)b 57.48(±2.15)
00234_NoUseSynthCh
emInsecticides
Conventional#Machakos Organic#Machakos Conventional#Kirinyaga Organic#Murang'a Organic#Kirinyaga Conventional#Murang'a
20.01(±1.77)a 23.41(±4.91)ab 28.71(±2.06)b 42.09(±4.2) 57.65(±2.62)c 57.92(±2.21)c
00257_1_PesticidesTo
xicityBees
Conventional#Machakos Organic#Machakos Conventional#Kirinyaga Organic#Kirinyaga Conventional#Murang'a Organic#Murang'a
ns 4.24(±1.09)a 6.52(±3.63)ab 12.9(±1.89)bc 17.58(±3.31)c 36.96(±3.0)d 40.76(±4.77)d
00257_2_PesticidesTo
xicityAquaticOrganism
s
Conventional#Machakos Conventional#Kirinyaga Organic#Machakos Organic#Kirinyaga Conventional#Murang'a Organic#Murang'a
2.38(±0.89)a 4.3(±1.34)a 6.52(±3.63)ab 13.19(±3.38)b 37.82(±2.96)c 40.22(±4.8)c
00295_AntibioticsLive
stockFertilizer
Organic#Machakos Conventional#Machakos Organic#Murang'a Conventional#Murang'a Conventional#Kirinyaga Organic#Kirinyaga
7.35(±2.78)a 11.1(±1.29)a 11.49(±2.31)a 11.7(±1.48)a 22.71(±1.77) 43.74(±1.66)
00320_CropResistance Organic#Machakos Conventional#Machakos Organic#Kirinyaga Conventional#Kirinyaga Organic#Murang'a Conventional#Murang'a
6.01(±2.95)a 6.84(±1.16)a 11.44(±2.74)ab 13.59(±1.85)b 33.48(±3.71) 44.06(±2.21)
00327_WasteDisposal
PesticidesVeterinaryM
edicines
Conventional#Machakos Organic#Machakos Conventional#Kirinyaga Organic#Kirinyaga Organic#Murang'a Conventional#Murang'a
ns 0.58(±0.41)a 1.84(±1.82)a 8.06(±1.66)b 13.15(±3.09)b 27.28(±3.97)c 29.5(±2.55)c
00331_WasteDisposal
Cadaver
Organic#Machakos Conventional#Machakos Organic#Murang'a Conventional#Kirinyaga Conventional#Murang'a Organic#Kirinyaga
P<0.05 9.14(±3.84) 20(±2.05) 33.42(±4.06)a 37.34(±2.65)ab 43.86(±2.53)b 68.8(±1.9)
00334_3_RecyclingPla
stic
Organic#Machakos Conventional#Machakos Conventional#Kirinyaga Organic#Kirinyaga Organic#Murang'a Conventional#Murang'a
P<0.05 0.0(±0.0) 1.06(±0.0) 2.56(±0.0) 4.32(±0.0) 14.94(±0.0) 23.07(±0.0)
00334_RecyclingWast
eOil
Organic#Murang'a Organic#Machakos Conventional#Machakos Conventional#Murang'a Conventional#Kirinyaga Organic#Kirinyaga
16.86(±2.9)a 17.08(±4.14)a 20.23(±1.71)a 36.13(±1.93)b 40.67(±1.83)b 56.85(±0.07)

204
Indicator P System and county
00352_LivestockHealt
hCurativeTreatments
Organic#Machakos Conventional#Machakos Conventional#Kirinyaga Organic#Murang'a Conventional#Murang'a Organic#Kirinyaga
11.7(±3.17)a 12.65(±1.36)a 22.69(±1.86)b 23.35(±3.01)b 31.7(±1.86) 50.83(±1.52)
00353_LivestockHealt
hProphylacticTreatmen
ts
Organic#Machakos Conventional#Machakos Organic#Murang'a Conventional#Kirinyaga Conventional#Murang'a Organic#Kirinyaga
14.72(±3.44)a 16.97(±1.41)a 21.97(±2.58)ab 23.03(±1.6)b 28.79(±1.57) 35.19(±1.81)
00357_MutilationAnae
stheticsAnalgesics
Conventional#Machakos Organic#Machakos Organic#Murang'a Conventional#Murang'a Organic#Kirinyaga Conventional#Kirinyaga
1.88(±0.45)a 2.26(±1.26)ab 4.46(±1.16)b 7.78(±0.91)c 8.41(±1.42)c 13.08(±1.08)
00376_2_Information
WaterQuality
Conventional#Kirinyaga Organic#Kirinyaga Organic#Machakos Conventional#Machakos Conventional#Murang'a Organic#Murang'a
ns 1.96(±0.87)a 7.17(±2.42)b 7.53(±3.58)ab 8.82(±1.52)b 12.17(±1.95)bc 18.58(±3.62)c
00377_05_Wastewater
Disposal
Conventional#Kirinyaga Organic#Machakos Organic#Kirinyaga Organic#Murang'a Conventional#Murang'a Conventional#Machakos
2.25(±1.0)a 6.48(±3.61)ab 8.23(±2.78)b 8.53(±2.87)b 14.18(±2.27)bc 19.57(±2.27)c
00377_1_PesticidesNu
mberActiveSubstances
Conventional#Machakos Organic#Machakos Conventional#Kirinyaga Organic#Murang'a Conventional#Murang'a Organic#Kirinyaga
P<0.05 15.04(±1.27)a 15.55(±3.5)a 26.97(±1.42) 34.87(±3.58)b 42.75(±1.83)bc 43.84(±1.66)c
00377_5_PesticidesCh
ronicToxicity
Conventional#Machakos Organic#Machakos Conventional#Kirinyaga Organic#Murang'a Conventional#Murang'a Organic#Kirinyaga
P<0.05 8.71(±1.63)a 10.72(±4.5)a 31.28(±2.99) 42.37(±4.78)b 44.82(±3.03)b 74.56(±3.17)
00377_7_PesticidesAc
uteToxicity
Conventional#Machakos Organic#Machakos Conventional#Kirinyaga Organic#Kirinyaga Organic#Murang'a Conventional#Murang'a
8.9(±1.11)a 11.39(±3.92)ab 15.36(±1.45)b 29.96(±2.59) 40.97(±4.73)c 42.09(±2.71)c
00377_75_PesticidesA
cuteToxicityInhalation
Conventional#Machakos Conventional#Kirinyaga Organic#Machakos Organic#Kirinyaga Organic#Murang'a Conventional#Murang'a
7.14(±1.11)a 10.52(±1.49)a 10.63(±3.62)a 25.07(±2.86) 42.01(±4.61)b 42.64(±2.62)b
00380_NutrientsPollut
antsSourcesOnFarm
Organic#Machakos Conventional#Kirinyaga Conventional#Murang'a Conventional#Machakos Organic#Kirinyaga Organic#Murang'a
ns 7.38(±3.51)a 7.68(±1.63)a 20.18(±2.33)b 20.46(±2.07)b 24.59(±3.81)b 26.41(±3.94)b
00474_1_PesticidesPer
sistenceWater
Conventional#Machakos Organic#Machakos Conventional#Kirinyaga Conventional#Murang'a Organic#Kirinyaga Organic#Murang'a
4.57(±1.24)a 11.25(±4.72)ab 21.09(±2.76)b 37.16(±3.14)c 37.5(±4.86)c 43.33(±5.01)c
00474_2_PesticidesPer
sistenceSoil
Organic#Kirinyaga Conventional#Kirinyaga Conventional#Machakos Organic#Machakos Organic#Murang'a Conventional#Murang'a
ns 19.39(±4.07)a 22.15(±2.82)a 28.28(±2.63)a 31.67(±6.85)ab 46.92(±5.04)bc 55.82(±3.11)c
00474_3_PesticidesKn
owledge
Organic#Machakos Conventional#Machakos Conventional#Kirinyaga Organic#Murang'a Conventional#Murang'a Organic#Kirinyaga
P<0.05 1.75(±1.74)a 4.38(±0.95)a 22.98(±2.31) 34.59(±3.9)b 40.94(±2.39)b 44.61(±3.66)b
00502_PublicHealthM
easures
Organic#Kirinyaga Conventional#Machakos Organic#Machakos Organic#Murang'a Conventional#Kirinyaga Conventional#Murang'a
ns 0.64(±0.64)a 0.85(±0.42)a 1.35(±1.34)ab 2.01(±1.14)ab 2.26(±0.78)ab 3.77(±0.98)
00506_FoodSecurityM
easuresLocCommuniti
es
Conventional#Machakos Organic#Machakos Conventional#Kirinyaga Conventional#Murang'a Organic#Murang'a Organic#Kirinyaga
1.01(±0.45)a 2.59(±1.79)a 12.66(±1.61)b 16.73(±1.71)bc 18.52(±2.77)bc 20.94(±2.78)
00606_LandslidesMud
slides
Organic#Machakos Conventional#Machakos Organic#Murang'a Conventional#Kirinyaga Conventional#Murang'a Organic#Kirinyaga
19.24(±3.94)a 20.25(±1.57)a 26.61(±2.86)a 38.22(±1.62)b 39.06(±1.55)b 49.48(±1.04)
00609_MilkWaitingPe
riodAntibiotics
Organic#Machakos Conventional#Machakos Organic#Murang'a Conventional#Kirinyaga Conventional#Murang'a Organic#Kirinyaga
P<0.05 4.49(±1.88)a 5.33(±0.8)a 12.85(±2.02) 18.51(±1.3)b 19.83(±1.26)b 27.78(±1.75)
00710_HarmfulSubsta
ncesPFertilizer
Conventional#Machakos Organic#Machakos Organic#Murang'a Conventional#Murang'a Conventional#Kirinyaga Organic#Kirinyaga
12.28(±1.69)a 12.51(±4.31)ab 16.76(±3.32)ab 18.67(±2.04)b 39.64(±2.07) 48.92(±2.24)
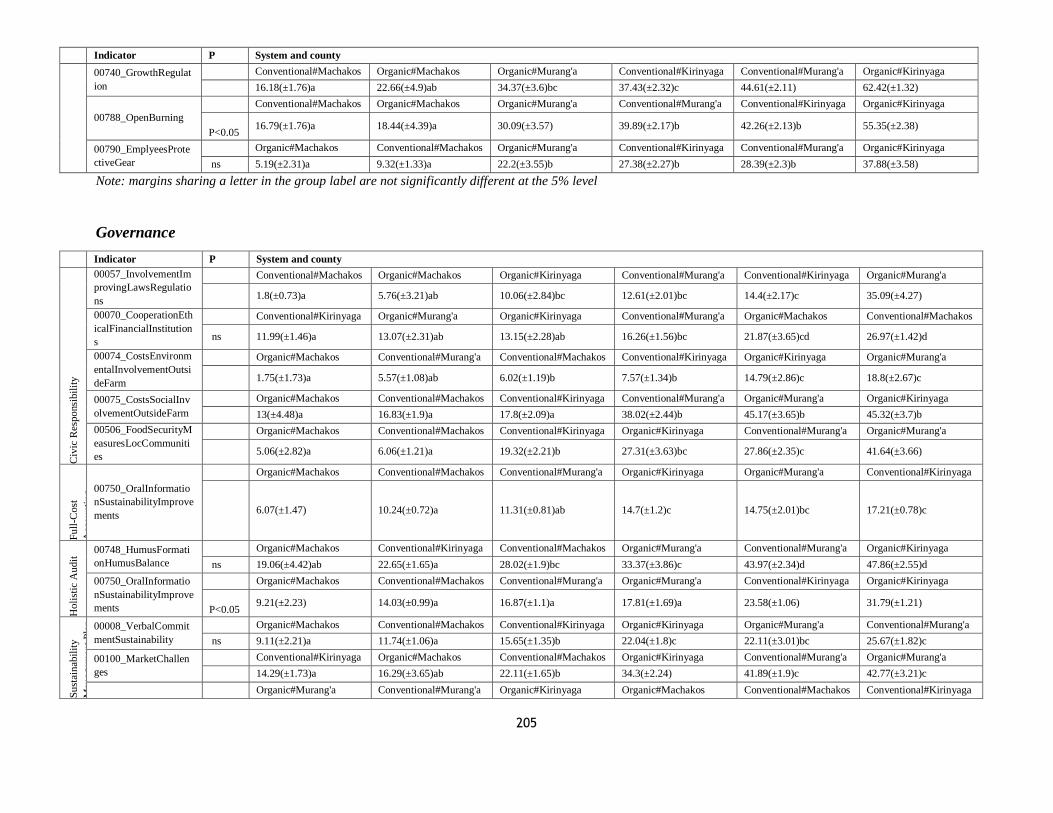
205
Indicator P System and county
00740_GrowthRegulat
ion
Conventional#Machakos Organic#Machakos Organic#Murang'a Conventional#Kirinyaga Conventional#Murang'a Organic#Kirinyaga
16.18(±1.76)a 22.66(±4.9)ab 34.37(±3.6)bc 37.43(±2.32)c 44.61(±2.11) 62.42(±1.32)
00788_OpenBurning
Conventional#Machakos Organic#Machakos Organic#Murang'a Conventional#Murang'a Conventional#Kirinyaga Organic#Kirinyaga
P<0.05 16.79(±1.76)a 18.44(±4.39)a 30.09(±3.57) 39.89(±2.17)b 42.26(±2.13)b 55.35(±2.38)
00790_EmplyeesProte
ctiveGear
Organic#Machakos Conventional#Machakos Organic#Murang'a Conventional#Kirinyaga Conventional#Murang'a Organic#Kirinyaga
ns 5.19(±2.31)a 9.32(±1.33)a 22.2(±3.55)b 27.38(±2.27)b 28.39(±2.3)b 37.88(±3.58)
Note: margins sharing a letter in the group label are not significantly different at the 5% level
Governance
Indicator P System and county
Civ
ic R
esponsi
bil
ity
00057_InvolvementIm
provingLawsRegulatio
ns
Conventional#Machakos Organic#Machakos Organic#Kirinyaga Conventional#Murang'a Conventional#Kirinyaga Organic#Murang'a
1.8(±0.73)a 5.76(±3.21)ab 10.06(±2.84)bc 12.61(±2.01)bc 14.4(±2.17)c 35.09(±4.27)
00070_CooperationEth
icalFinancialInstitution
s
Conventional#Kirinyaga Organic#Murang'a Organic#Kirinyaga Conventional#Murang'a Organic#Machakos Conventional#Machakos
ns 11.99(±1.46)a 13.07(±2.31)ab 13.15(±2.28)ab 16.26(±1.56)bc 21.87(±3.65)cd 26.97(±1.42)d
00074_CostsEnvironm
entalInvolvementOutsi
deFarm
Organic#Machakos Conventional#Murang'a Conventional#Machakos Conventional#Kirinyaga Organic#Kirinyaga Organic#Murang'a
1.75(±1.73)a 5.57(±1.08)ab 6.02(±1.19)b 7.57(±1.34)b 14.79(±2.86)c 18.8(±2.67)c
00075_CostsSocialInv
olvementOutsideFarm
Organic#Machakos Conventional#Machakos Conventional#Kirinyaga Conventional#Murang'a Organic#Murang'a Organic#Kirinyaga
13(±4.48)a 16.83(±1.9)a 17.8(±2.09)a 38.02(±2.44)b 45.17(±3.65)b 45.32(±3.7)b
00506_FoodSecurityM
easuresLocCommuniti
es
Organic#Machakos Conventional#Machakos Conventional#Kirinyaga Organic#Kirinyaga Conventional#Murang'a Organic#Murang'a
5.06(±2.82)a 6.06(±1.21)a 19.32(±2.21)b 27.31(±3.63)bc 27.86(±2.35)c 41.64(±3.66)
Full
-Cost
Acc
ounti
ng
00750_OralInformatio
nSustainabilityImprove
ments
Organic#Machakos Conventional#Machakos Conventional#Murang'a Organic#Kirinyaga Organic#Murang'a Conventional#Kirinyaga
6.07(±1.47) 10.24(±0.72)a 11.31(±0.81)ab 14.7(±1.2)c 14.75(±2.01)bc 17.21(±0.78)c
Holi
stic
Audit
00748_HumusFormati
onHumusBalance
Organic#Machakos Conventional#Kirinyaga Conventional#Machakos Organic#Murang'a Conventional#Murang'a Organic#Kirinyaga
ns 19.06(±4.42)ab 22.65(±1.65)a 28.02(±1.9)bc 33.37(±3.86)c 43.97(±2.34)d 47.86(±2.55)d
00750_OralInformatio
nSustainabilityImprove
ments
Organic#Machakos Conventional#Machakos Conventional#Murang'a Organic#Murang'a Conventional#Kirinyaga Organic#Kirinyaga
P<0.05 9.21(±2.23) 14.03(±0.99)a 16.87(±1.1)a 17.81(±1.69)a 23.58(±1.06) 31.79(±1.21)
Sust
ainab
ilit
y
Man
agem
ent
Pla
n
00008_VerbalCommit
mentSustainability
Organic#Machakos Conventional#Machakos Conventional#Kirinyaga Organic#Kirinyaga Organic#Murang'a Conventional#Murang'a
ns 9.11(±2.21)a 11.74(±1.06)a 15.65(±1.35)b 22.04(±1.8)c 22.11(±3.01)bc 25.67(±1.82)c
00100_MarketChallen
ges
Conventional#Kirinyaga Organic#Machakos Conventional#Machakos Organic#Kirinyaga Conventional#Murang'a Organic#Murang'a
14.29(±1.73)a 16.29(±3.65)ab 22.11(±1.65)b 34.3(±2.24) 41.89(±1.9)c 42.77(±3.21)c
Organic#Murang'a Conventional#Murang'a Organic#Kirinyaga Organic#Machakos Conventional#Machakos Conventional#Kirinyaga
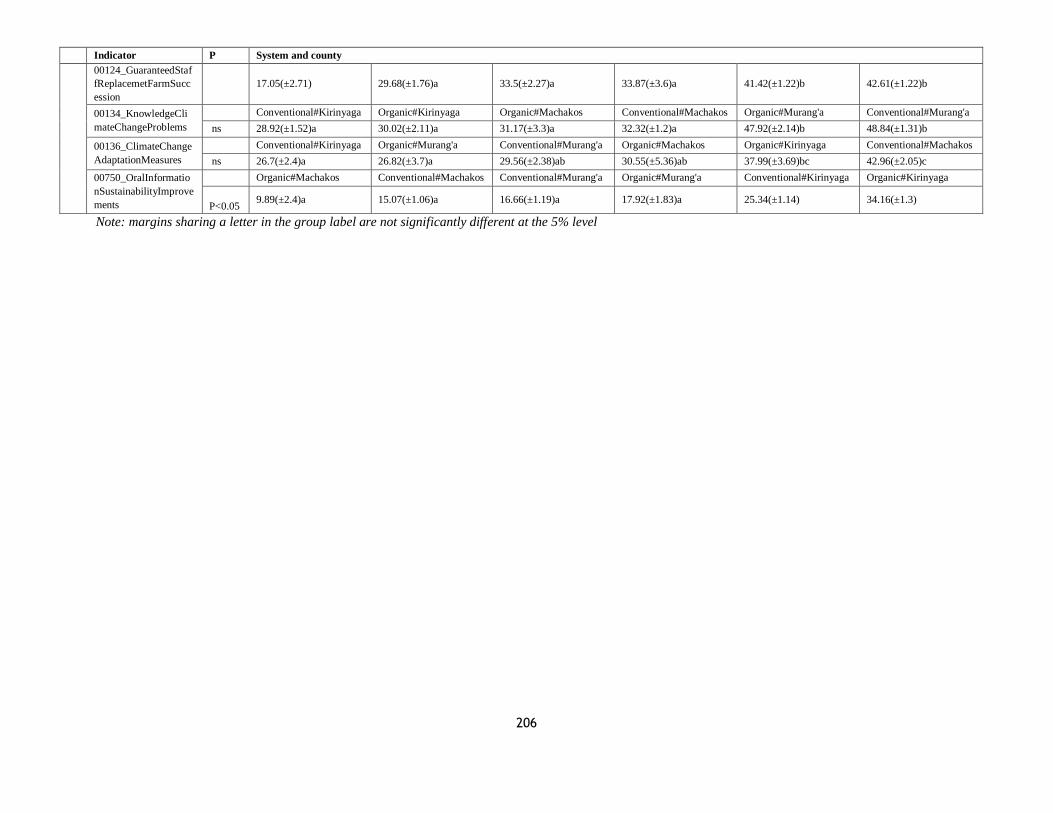
206
Indicator P System and county
00124_GuaranteedStaf
fReplacemetFarmSucc
ession
17.05(±2.71) 29.68(±1.76)a 33.5(±2.27)a 33.87(±3.6)a 41.42(±1.22)b 42.61(±1.22)b
00134_KnowledgeCli
mateChangeProblems
Conventional#Kirinyaga Organic#Kirinyaga Organic#Machakos Conventional#Machakos Organic#Murang'a Conventional#Murang'a
ns 28.92(±1.52)a 30.02(±2.11)a 31.17(±3.3)a 32.32(±1.2)a 47.92(±2.14)b 48.84(±1.31)b
00136_ClimateChange
AdaptationMeasures
Conventional#Kirinyaga Organic#Murang'a Conventional#Murang'a Organic#Machakos Organic#Kirinyaga Conventional#Machakos
ns 26.7(±2.4)a 26.82(±3.7)a 29.56(±2.38)ab 30.55(±5.36)ab 37.99(±3.69)bc 42.96(±2.05)c
00750_OralInformatio
nSustainabilityImprove
ments
Organic#Machakos Conventional#Machakos Conventional#Murang'a Organic#Murang'a Conventional#Kirinyaga Organic#Kirinyaga
P<0.05 9.89(±2.4)a 15.07(±1.06)a 16.66(±1.19)a 17.92(±1.83)a 25.34(±1.14) 34.16(±1.3)
Note: margins sharing a letter in the group label are not significantly different at the 5% level
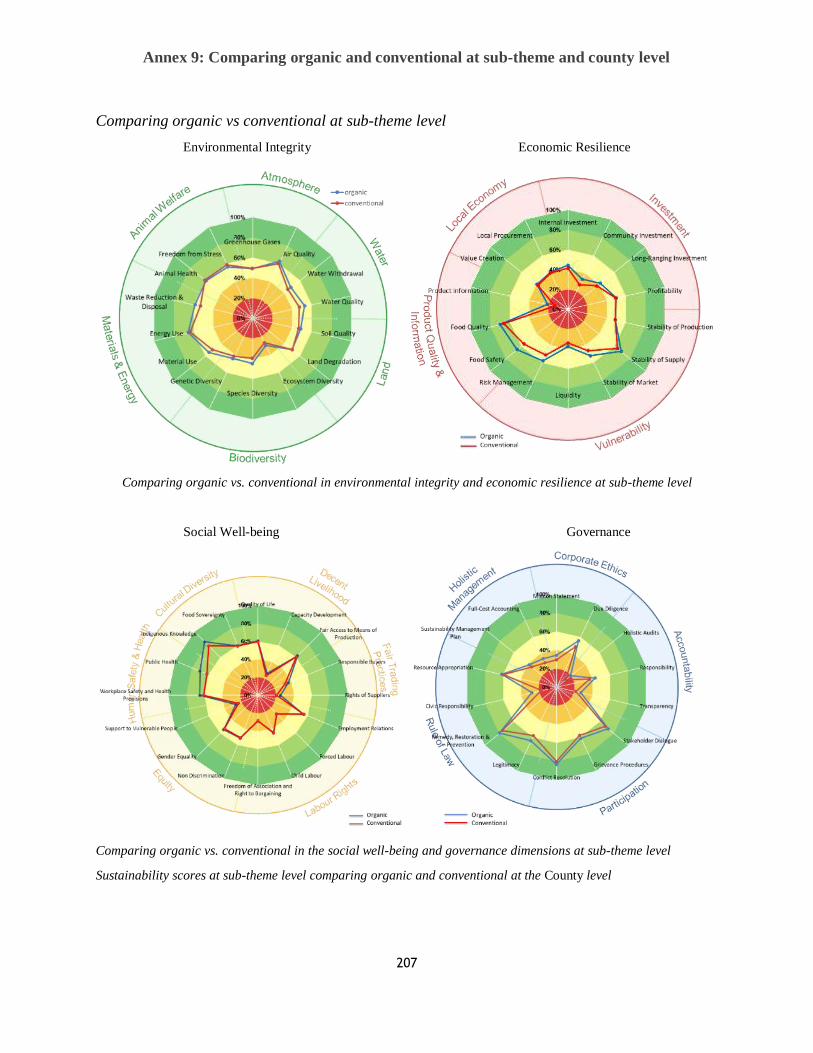
207
Annex 9: Comparing organic and conventional at sub-theme and county level
Comparing organic vs conventional at sub-theme level
Environmental Integrity Economic Resilience
Comparing organic vs. conventional in environmental integrity and economic resilience at sub-theme level
Social Well-being Governance
Comparing organic vs. conventional in the social well-being and governance dimensions at sub-theme level
Sustainability scores at sub-theme level comparing organic and conventional at the County level
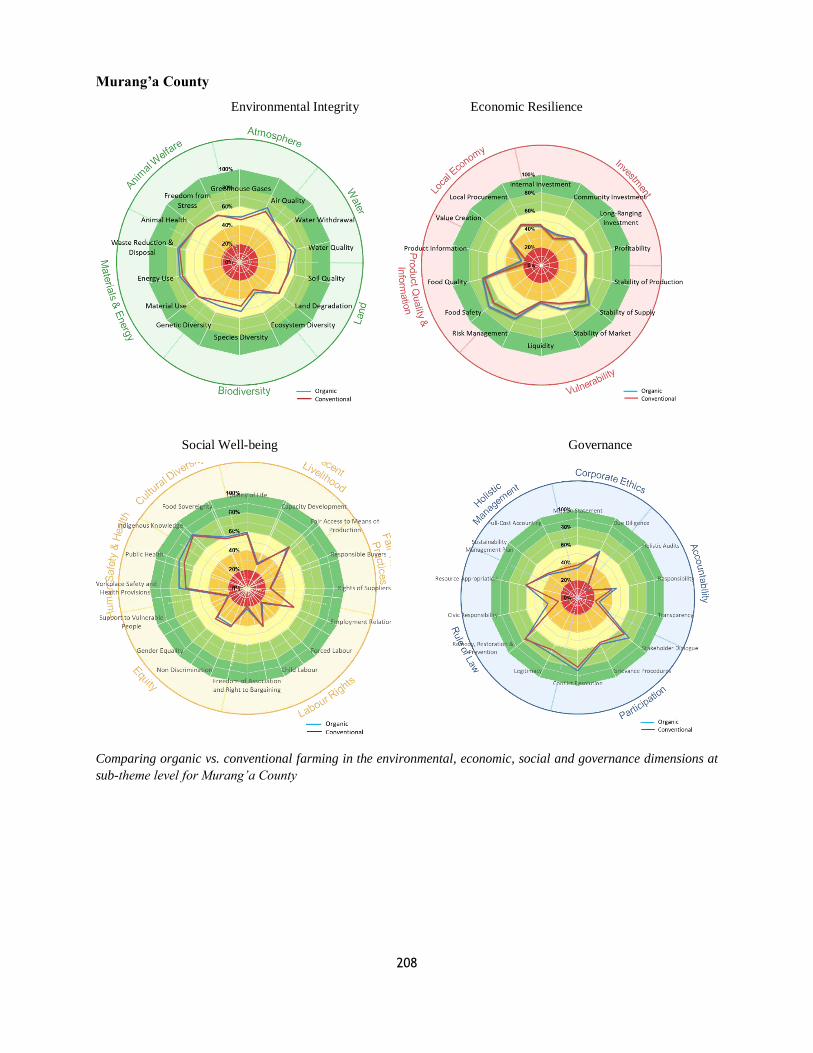
208
Murang’a County
Environmental Integrity Economic Resilience
Social Well-being Governance
Comparing organic vs. conventional farming in the environmental, economic, social and governance dimensions at
sub-theme level for Murang’a County
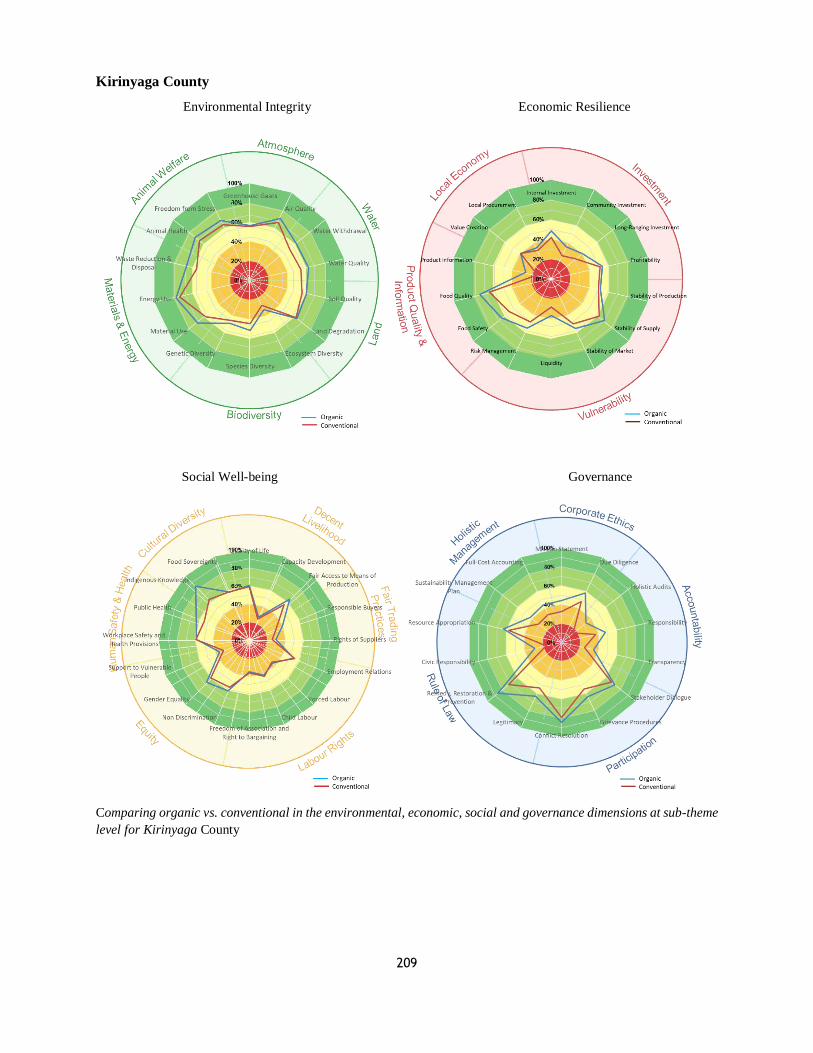
209
Kirinyaga County
Environmental Integrity Economic Resilience
Social Well-being Governance
Comparing organic vs. conventional in the environmental, economic, social and governance dimensions at sub-theme
level for Kirinyaga County
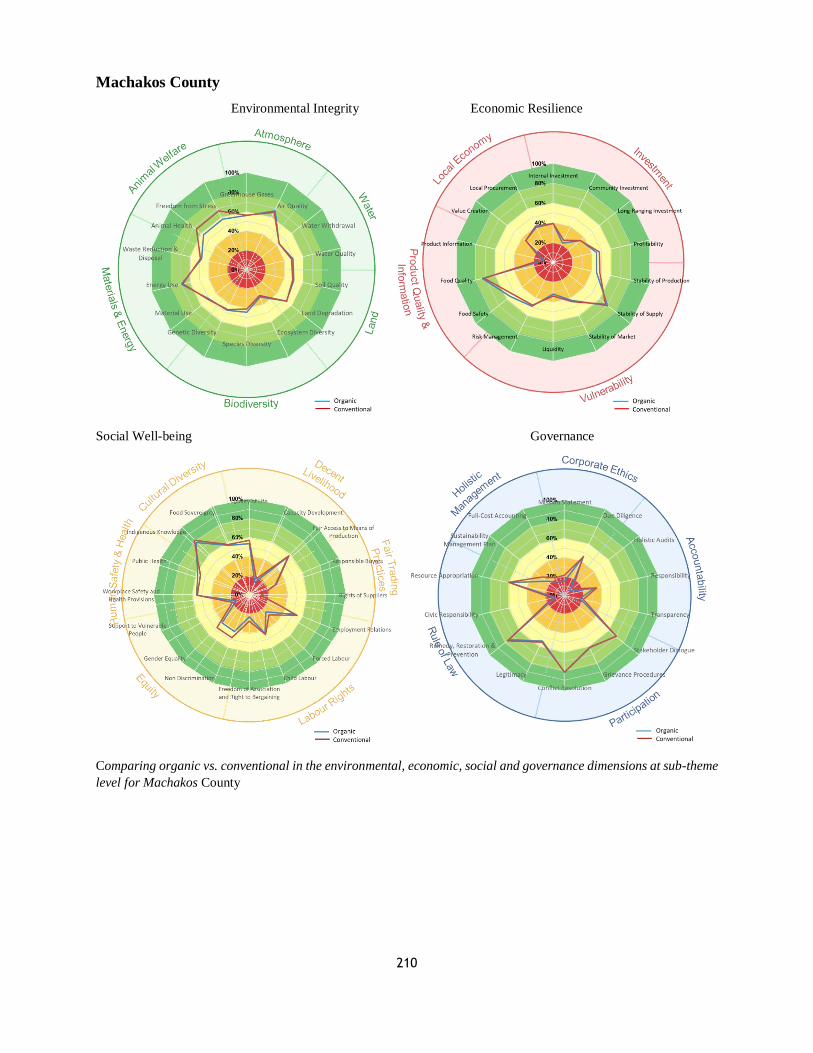
210
Machakos County
Environmental Integrity Economic Resilience
Social Well-being Governance
Comparing organic vs. conventional in the environmental, economic, social and governance dimensions at sub-theme
level for Machakos County
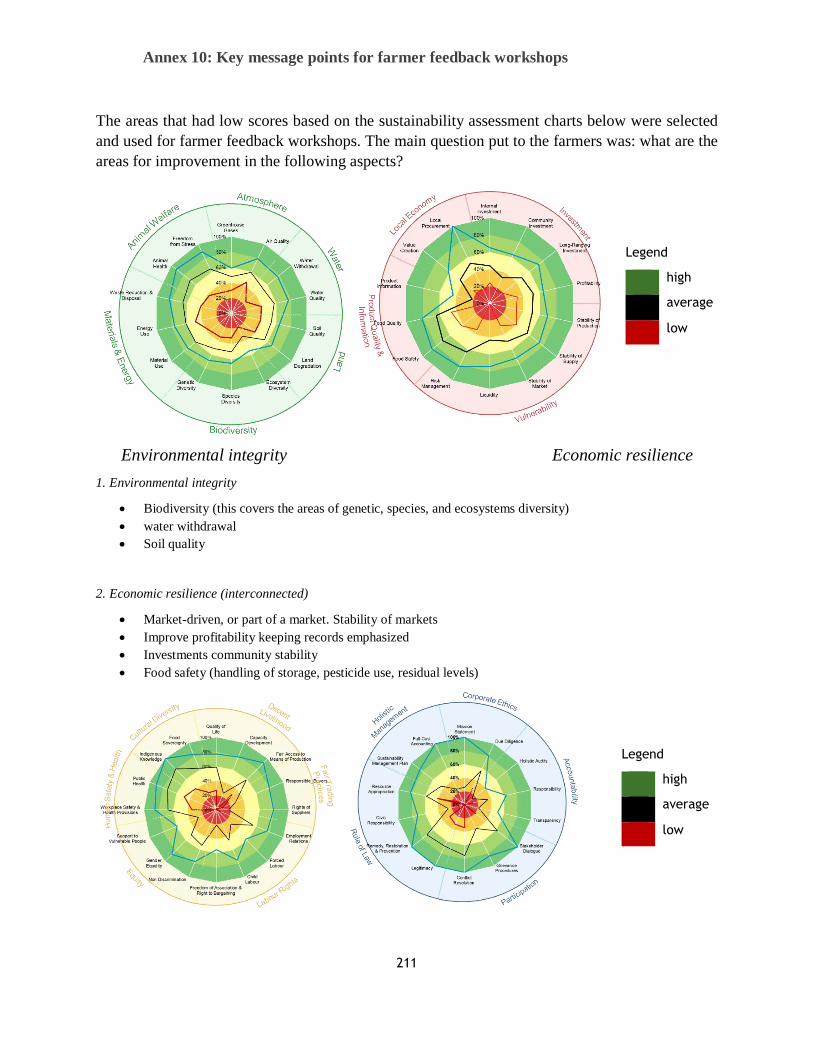
211
Annex 10: Key message points for farmer feedback workshops
The areas that had low scores based on the sustainability assessment charts below were selected
and used for farmer feedback workshops. The main question put to the farmers was: what are the
areas for improvement in the following aspects?
Environmental integrity Economic resilience
1. Environmental integrity
Biodiversity (this covers the areas of genetic, species, and ecosystems diversity)
water withdrawal
Soil quality
2. Economic resilience (interconnected)
Market-driven, or part of a market. Stability of markets
Improve profitability keeping records emphasized
Investments community stability
Food safety (handling of storage, pesticide use, residual levels)
Legend
high
average
low
Legend
high
average
low
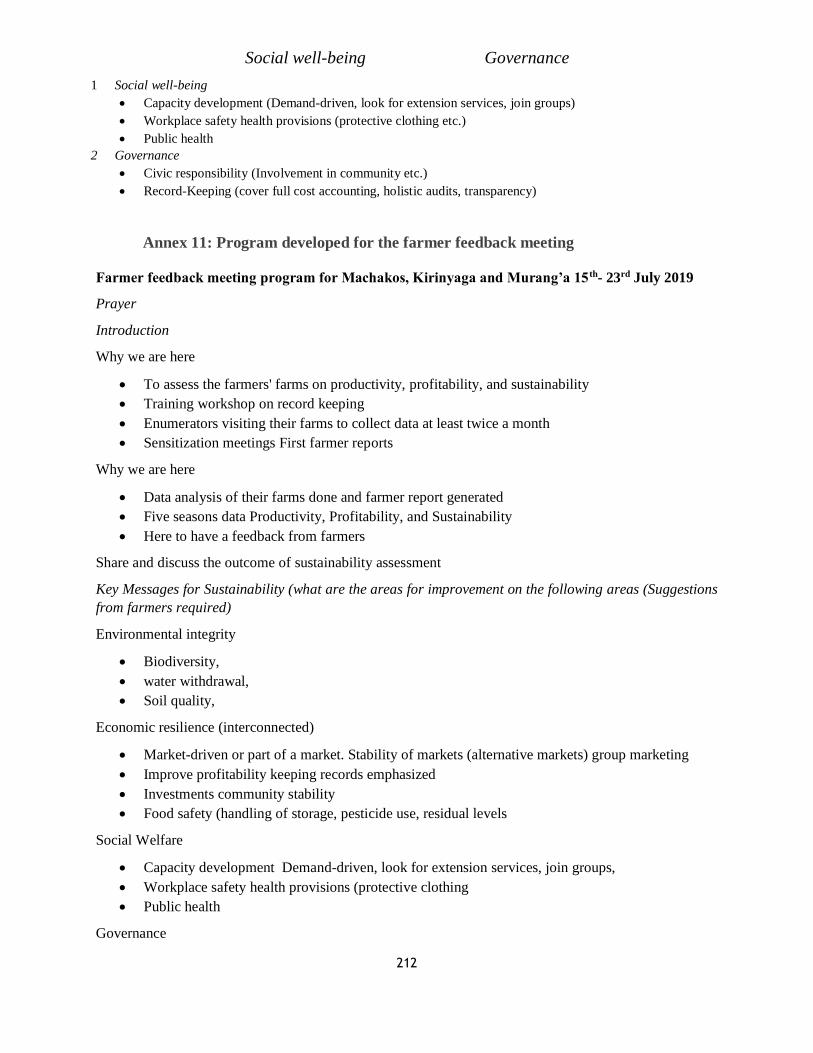
212
Social well-being Governance
1 Social well-being
Capacity development (Demand-driven, look for extension services, join groups)
Workplace safety health provisions (protective clothing etc.)
Public health
2 Governance
Civic responsibility (Involvement in community etc.)
Record-Keeping (cover full cost accounting, holistic audits, transparency)
Annex 11: Program developed for the farmer feedback meeting
Farmer feedback meeting program for Machakos, Kirinyaga and Murang’a 15 th- 23rd July 2019
Prayer
Introduction
Why we are here
To assess the farmers' farms on productivity, profitability, and sustainability
Training workshop on record keeping
Enumerators visiting their farms to collect data at least twice a month
Sensitization meetings First farmer reports
Why we are here
Data analysis of their farms done and farmer report generated
Five seasons data Productivity, Profitability, and Sustainability
Here to have a feedback from farmers
Share and discuss the outcome of sustainability assessment
Key Messages for Sustainability (what are the areas for improvement on the following areas (Suggestions
from farmers required)
Environmental integrity
Biodiversity,
water withdrawal,
Soil quality,
Economic resilience (interconnected)
Market-driven or part of a market. Stability of markets (alternative markets) group marketing
Improve profitability keeping records emphasized
Investments community stability
Food safety (handling of storage, pesticide use, residual levels
Social Welfare
Capacity development Demand-driven, look for extension services, join groups,
Workplace safety health provisions (protective clothing
Public health
Governance
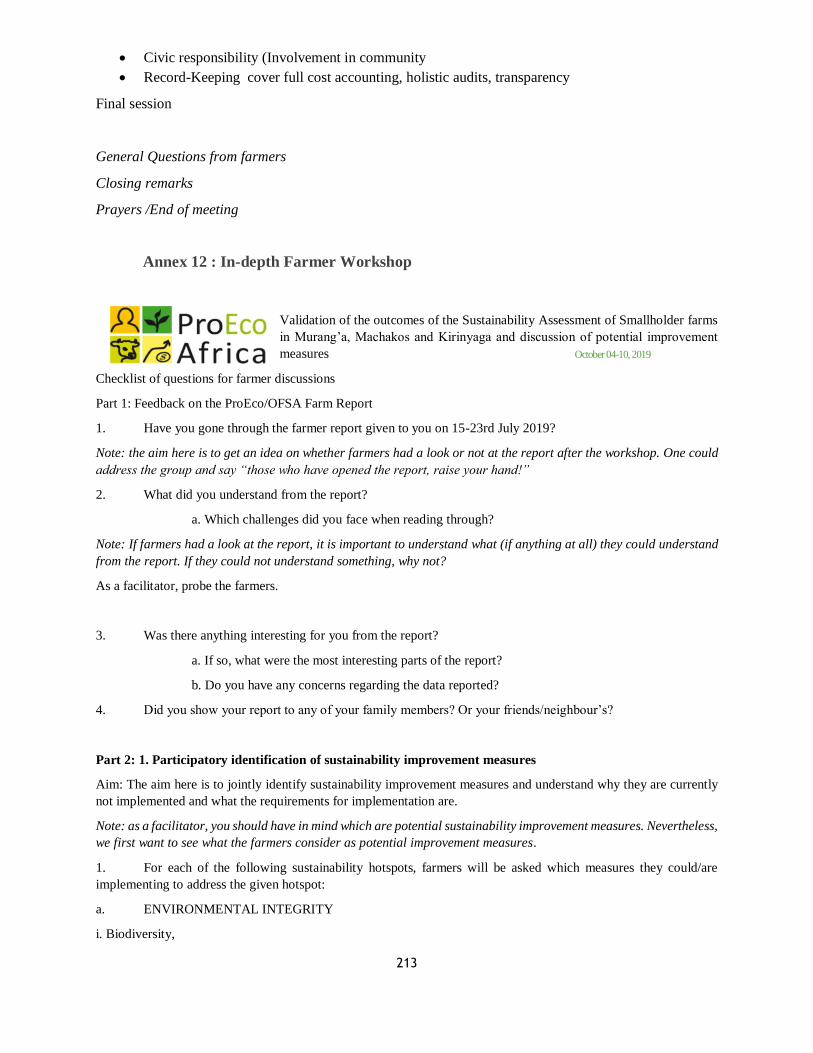
213
Civic responsibility (Involvement in community
Record-Keeping cover full cost accounting, holistic audits, transparency
Final session
General Questions from farmers
Closing remarks
Prayers /End of meeting
Annex 12 : In-depth Farmer Workshop
Validation of the outcomes of the Sustainability Assessment of Smallholder farms
in Murang’a, Machakos and Kirinyaga and discussion of potential improvement
measures October 04-10, 2019
Checklist of questions for farmer discussions
Part 1: Feedback on the ProEco/OFSA Farm Report
1. Have you gone through the farmer report given to you on 15-23rd July 2019?
Note: the aim here is to get an idea on whether farmers had a look or not at the report after the workshop. One could
address the group and say “those who have opened the report, raise your hand!”
2. What did you understand from the report?
a. Which challenges did you face when reading through?
Note: If farmers had a look at the report, it is important to understand what (if anything at all) they could understand
from the report. If they could not understand something, why not?
As a facilitator, probe the farmers.
3. Was there anything interesting for you from the report?
a. If so, what were the most interesting parts of the report?
b. Do you have any concerns regarding the data reported?
4. Did you show your report to any of your family members? Or your friends/neighbour’s?
Part 2: 1. Participatory identification of sustainability improvement measures
Aim: The aim here is to jointly identify sustainability improvement measures and understand why they are currently
not implemented and what the requirements for implementation are.
Note: as a facilitator, you should have in mind which are potential sustainability improvement measures. Nevertheless,
we first want to see what the farmers consider as potential improvement measures.
1. For each of the following sustainability hotspots, farmers will be asked which measures they could/are
implementing to address the given hotspot:
a. ENVIRONMENTAL INTEGRITY
i. Biodiversity,
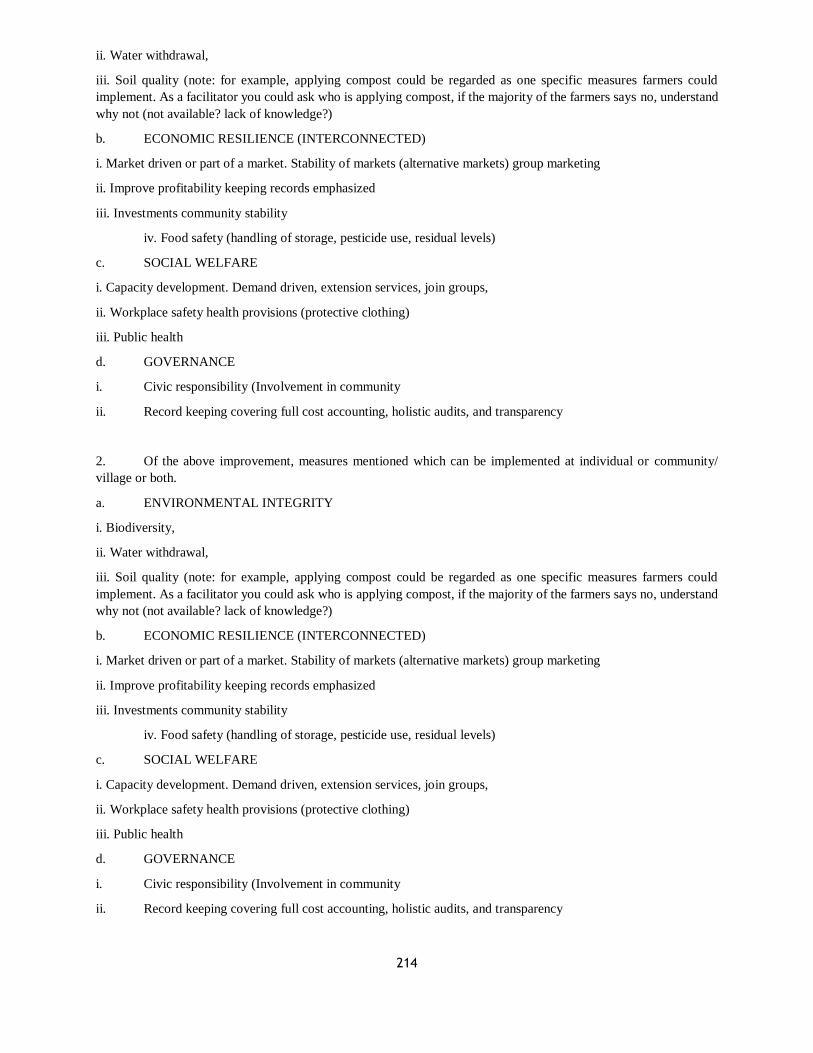
214
ii. Water withdrawal,
iii. Soil quality (note: for example, applying compost could be regarded as one specific measures farmers could
implement. As a facilitator you could ask who is applying compost, if the majority of the farmers says no, understand
why not (not available? lack of knowledge?)
b. ECONOMIC RESILIENCE (INTERCONNECTED)
i. Market driven or part of a market. Stability of markets (alternative markets) group marketing
ii. Improve profitability keeping records emphasized
iii. Investments community stability
iv. Food safety (handling of storage, pesticide use, residual levels)
c. SOCIAL WELFARE
i. Capacity development. Demand driven, extension services, join groups,
ii. Workplace safety health provisions (protective clothing)
iii. Public health
d. GOVERNANCE
i. Civic responsibility (Involvement in community
ii. Record keeping covering full cost accounting, holistic audits, and transparency
2. Of the above improvement, measures mentioned which can be implemented at individual or community/
village or both.
a. ENVIRONMENTAL INTEGRITY
i. Biodiversity,
ii. Water withdrawal,
iii. Soil quality (note: for example, applying compost could be regarded as one specific measures farmers could
implement. As a facilitator you could ask who is applying compost, if the majority of the farmers says no, understand
why not (not available? lack of knowledge?)
b. ECONOMIC RESILIENCE (INTERCONNECTED)
i. Market driven or part of a market. Stability of markets (alternative markets) group marketing
ii. Improve profitability keeping records emphasized
iii. Investments community stability
iv. Food safety (handling of storage, pesticide use, residual levels)
c. SOCIAL WELFARE
i. Capacity development. Demand driven, extension services, join groups,
ii. Workplace safety health provisions (protective clothing)
iii. Public health
d. GOVERNANCE
i. Civic responsibility (Involvement in community
ii. Record keeping covering full cost accounting, holistic audits, and transparency
215
In-depth Farmer Workshop
Validation of the outcomes of the Sustainability Assessment of Smallholder farms in Murang’a, Machakos and Kirinyaga and discussion of potential
improvement measures October 04-10, 2019
Date:
Community: _______________________________________________________venue: ______________________________________________
Name of minute taker:
PART 1: DISCUSSION OF THE MAIN CHALLENGES PERCEIVED BY THE FARMERS
Challenge mentioned Agreed upon by a low/average/high share of farms Other relevant comments
216
Part 2: Discussion of improvement measures and requirements for the identified hotspots
Improvement measure proposed by the
farmers
Reasons for low adoption
currently
Requirements to stimulate or
increase the likelihood of
adoption
Comments/ any other key
discussion points of interest
Who proposed the
measure (farmers or
facilitator?)
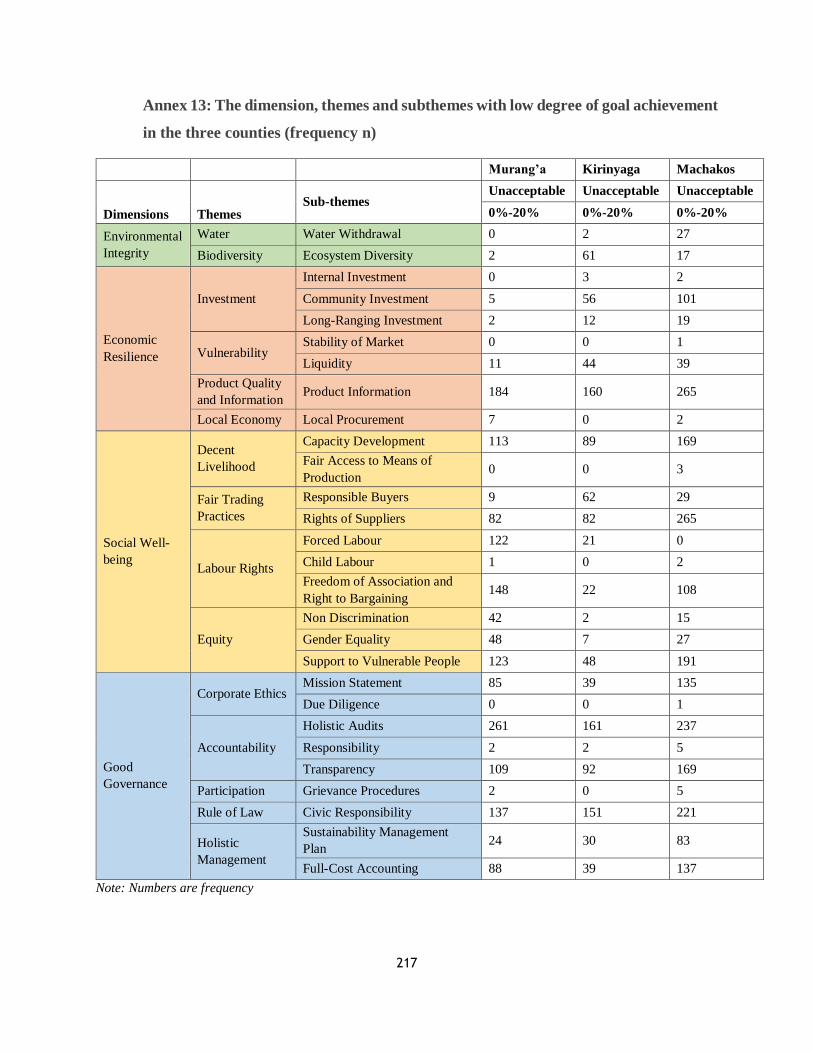
217
Annex 13: The dimension, themes and subthemes with low degree of goal achievement
in the three counties (frequency n)
Murang’a Kirinyaga Machakos
Dimensions Themes Sub-themes
Unacceptable Unacceptable Unacceptable
0%-20% 0%-20% 0%-20%
Environmental
Integrity
Water Water Withdrawal 0 2 27
Biodiversity Ecosystem Diversity 2 61 17
Economic
Resilience
Investment
Internal Investment 0 3 2
Community Investment 5 56 101
Long-Ranging Investment 2 12 19
Vulnerability Stability of Market 0 0 1
Liquidity 11 44 39
Product Quality
and Information Product Information 184 160 265
Local Economy Local Procurement 7 0 2
Social Well-
being
Decent
Livelihood
Capacity Development 113 89 169
Fair Access to Means of
Production 0 0 3
Fair Trading
Practices
Responsible Buyers 9 62 29
Rights of Suppliers 82 82 265
Labour Rights
Forced Labour 122 21 0
Child Labour 1 0 2
Freedom of Association and
Right to Bargaining 148 22 108
Equity
Non Discrimination 42 2 15
Gender Equality 48 7 27
Support to Vulnerable People 123 48 191
Good
Governance
Corporate Ethics Mission Statement 85 39 135
Due Diligence 0 0 1
Accountability
Holistic Audits 261 161 237
Responsibility 2 2 5
Transparency 109 92 169
Participation Grievance Procedures 2 0 5
Rule of Law Civic Responsibility 137 151 221
Holistic
Management
Sustainability Management
Plan 24 30 83
Full-Cost Accounting 88 39 137
Note: Numbers are frequency
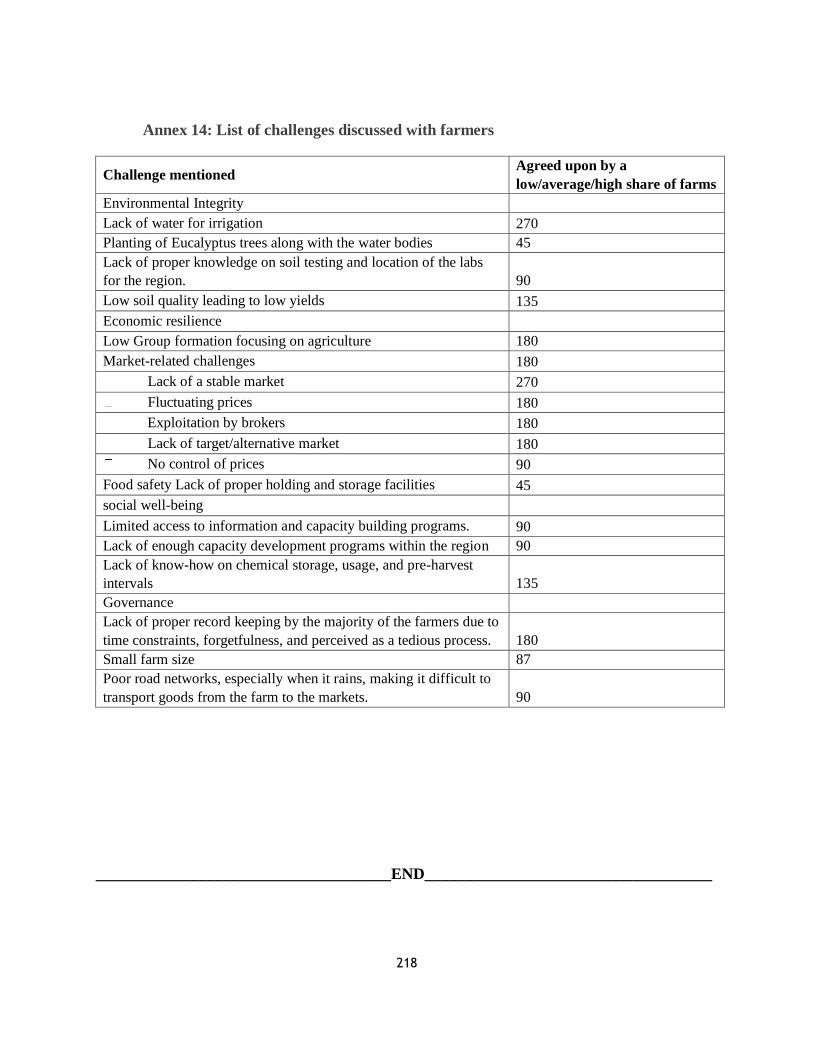
218
Annex 14: List of challenges discussed with farmers
Challenge mentioned Agreed upon by a
low/average/high share of farms
Environmental Integrity
Lack of water for irrigation 270
Planting of Eucalyptus trees along with the water bodies 45
Lack of proper knowledge on soil testing and location of the labs
for the region. 90
Low soil quality leading to low yields 135
Economic resilience
Low Group formation focusing on agriculture 180
Market-related challenges 180
Lack of a stable market 270
Fluctuating prices 180
Exploitation by brokers 180
Lack of target/alternative market 180
No control of prices 90
Food safety Lack of proper holding and storage facilities 45
social well-being
Limited access to information and capacity building programs. 90
Lack of enough capacity development programs within the region 90
Lack of know-how on chemical storage, usage, and pre-harvest
intervals 135
Governance
Lack of proper record keeping by the majority of the farmers due to
time constraints, forgetfulness, and perceived as a tedious process. 180
Small farm size 87
Poor road networks, especially when it rains, making it difficult to
transport goods from the farm to the markets. 90
_____________________________________END____________________________________
Related Documents


