Resources, Conservation and Recycling 44 (2005) 73–90 Municipal solid waste recycling and associated markets in Delhi, India Ankit Agarwal, Ashish Singhmar, Mukul Kulshrestha, Atul K. Mittal ∗ Department of Civil Engineering, Indian Institute of Technology, IIT-Delhi 110016, India Received 10 September 2003; received in revised form 5 September 2004; accepted 20 September 2004 Abstract Recycling of the municipal solid waste (MSW) was investigated and analyzed in the Indian capital city of Delhi. It was found that an informal sector comprising waste recyclists and a hierarchy of recyclable dealers plays an important role in the management of solid waste. The associated activity transports nearly 17% of the waste to the recycling units (RU). In this process an entire market is created for the recycle trade. The present work covered an extensive study of this waste trade with emphasis on the most important unit of the waste chain, the recyclists. Extensive interviews and surveys with recyclists from various slums helped in evaluating the market mechanisms of the recycla trade in Delhi and in revealing details of this informal sector. Through a number of field interviews undertaken on recyclists, recyclables dealers and municipal authorities, a complete hierarchy from recyclists to the final sellers of the recycled product was identified and delineated and the profits at each level determined. The value addition to each product at every level of the waste trade was also determined. Two models were subsequently proposed to evaluate the possibility of formalizing the unorganized waste trade. It was concluded that it is possible to organize the sector, but this would leave more than 66,000 recyclists without employment, a consequence of organizing an activity that presently provides employment and daily living to nearly 89,600 recyclists who belong to the poorest strata of the society. The work also probes into the various aspects of the lives of the recyclists and provides details of the economics of MSW. © 2004 Elsevier B.V. All rights reserved. Keywords: Municipal solid waste; Recycling; Recyclists; Recycle trade; Economics of MSW ∗ Corresponding author. Tel.: +91 11 26591239; fax: +91 11 26581117. E-mail addresses: mukul [email protected] (M. Kulshrestha), [email protected] (A.K. Mittal). 0921-3449/$ – see front matter © 2004 Elsevier B.V. All rights reserved. doi:10.1016/j.resconrec.2004.09.007

Welcome message from author
This document is posted to help you gain knowledge. Please leave a comment to let me know what you think about it! Share it to your friends and learn new things together.
Transcript
Resources, Conservation and Recycling 44 (2005) 73–90
Municipal solid waste recycling and associatedmarkets in Delhi, India
Ankit Agarwal, Ashish Singhmar,Mukul Kulshrestha, Atul K. Mittal∗
Department of Civil Engineering, Indian Institute of Technology, IIT-Delhi 110016, India
Received 10 September 2003; received in revised form 5 September 2004; accepted 20 September 2004
Abstract
Recycling of the municipal solid waste (MSW) was investigated and analyzed in the Indian capitalcity of Delhi. It was found that an informal sector comprising waste recyclists and a hierarchy ofrecyclable dealers plays an important role in the management of solid waste. The associated activitytransports nearly 17% of the waste to the recycling units (RU). In this process an entire market iscreated for the recycle trade. The present work covered an extensive study of this waste trade withemphasis on the most important unit of the waste chain, the recyclists. Extensive interviews andsurveys with recyclists from various slums helped in evaluating the market mechanisms of the recyclatrade in Delhi and in revealing details of this informal sector. Through a number of field interviewsundertaken on recyclists, recyclables dealers and municipal authorities, a complete hierarchy fromrecyclists to the final sellers of the recycled product was identified and delineated and the profits ateach level determined. The value addition to each product at every level of the waste trade was alsodetermined. Two models were subsequently proposed to evaluate the possibility of formalizing theunorganized waste trade. It was concluded that it is possible to organize the sector, but this wouldleave more than 66,000 recyclists without employment, a consequence of organizing an activity thatpresently provides employment and daily living to nearly 89,600 recyclists who belong to the pooreststrata of the society. The work also probes into the various aspects of the lives of the recyclists andprovides details of the economics of MSW.© 2004 Elsevier B.V. All rights reserved.
Keywords: Municipal solid waste; Recycling; Recyclists; Recycle trade; Economics of MSW
∗ Corresponding author. Tel.: +91 11 26591239; fax: +91 11 26581117.E-mail addresses:mukul [email protected] (M. Kulshrestha), [email protected] (A.K. Mittal).
0921-3449/$ – see front matter © 2004 Elsevier B.V. All rights reserved.doi:10.1016/j.resconrec.2004.09.007
74 A. Agarwal et al. / Resources, Conservation and Recycling 44 (2005) 73–90
1. Introduction
Recycling of municipal solid waste (MSW) is now recognized as the “most environmen-tally sound” strategy for dealing with MSW following only the preventive strategy of sourcereduction and reuse (EPA, 2004). Developed nations, like USA, recover as much as 30%of the total waste (EPA, 2004). Substantially increasing the money available for householdrecycling schemes makes environmental and economic sense with 20% recycling producingan environmental benefit of around £200 a tonne (ECOTEC, 2000) that include the poten-tial benefits from diverting million of tons of material away from landfills and incineratorsand in the process preventing greenhouse gaseous emissions and water pollution, savinghuge energy, and reducing the need for new landfills and combustors. Intense efforts arebeing currently made by the European Commission and European Countries to assess thebenefits accruing from material recycling in comparison to the other methods of waste man-agement like land filling, incineration, etc. (Coopers & Lybrand, 1996; ECOTEC, 2000).In all likelihood, recycling turns materials that would otherwise become waste into valu-able resource and generates a host of benefits at every level: environmental, financial, andsocial.
The recycling of MSW is carried out to a very large extent even in the developingcountries like India. However, unlike the developed countries like USA, the recyclingremains essentially an informal activity. The collection of MSW is carried out by thepoor recyclists and the waste finally lands up at the recycling units (RU) through a hi-erarchy of recycle dealers. The city of Delhi, the capital of India, alone is estimatedto have more than 85,000 people (Datta, 1997) engaged in such activities. Since nospecial support from the government has been forthcoming to encourage clean and or-ganized recycling, it remains an activity within the informal sector, and almost with-out exception, takes place in small shanty operations, which are highly polluting andunhealthy.
This paper explores details of the research work carried out on the MSW recycling marketin the city of Delhi. The work probes into the various aspects of the lives of the recyclistsand provides details of the economics of MSW.
2. MSW scenario in India and the choice of project area
Municipal solid waste management continues to remain one of the most neglected areasof urban development in India. In many cities almost more than half of the solid wastegenerated remains unattended (Jha, 2001). This gives rise to insanitary conditions espe-cially in densely populated areas, which in turn may have serious health and environmentalconsequences. Despite the fact that Solid waste management comprises a whole range ofactivities involving the public sector, small-scale private enterprises and service users andgiven the size, complexity and budget share, it remains surprising that dedicated solid wastemanagement departments are very rare in municipal government. For example, MunicipalCorporation of Delhi (MCD) that looks after much of the solid waste management in Delhi,also provides a number of other services that include health, property taxation, engineering,complaints redressal, licensing, horticulture, etc.
A. Agarwal et al. / Resources, Conservation and Recycling 44 (2005) 73–90 75
Table 1Physical characteristics of msw generated in major Indian cities (%) (source:CPCB, 1998)
Metro city Paper Textile Leather Plastic Metal Glass Ash Compostablematter
Ahmedabad 6 1 NA 3 NA NA 50 40Bangalore 8 5 NA 6 3 6 27 45Bhopal 10 5 2 2 NA 1 35 45Bombay 10 3.6 0.2 2 NA 0.2 44 40Calcutta 10 3 1 8 NA 3 35 40Coimbatore 5 9 NA 1 NA NA 50 35Delhi 6.6 4 0.6 1.5 2.5 1.2 51.5 31.78Hyderabad 7 1.7 NA 1.3 NA NA 50 40Indore 5 2 NA 1 NA NA 49 43Jaipur 6 2 NA 1 NA 2 47 42Kanpur 5 1 5 1.5 NA NA 52.5 40Kochi 4.9 NA NA 1.1 NA NA 36 58Lucknow 4 2 NA 4 1 NA 49 40Ludhiana 3 5 NA 3 NA NA 30 40Madras 10 5 5 3 NA NA 33 44Madurai 5 1 NA 3 NA NA 46 45Nagpur 4.5 7 1.9 1.25 .35 1.2 53.4 30Patna 4 5 2 6 1 2 35 45Pune 5 NA NA 5 NA 10 15 55Surat 4 5 NA 3 NA 3 45 40Vadodara 4 NA NA 7 NA NA 49 40Varanasi 3 4 NA 10 NA NA 35 48Vishakapatnam 3 2 NA 5 NA 5 50 35
NA: data not available.
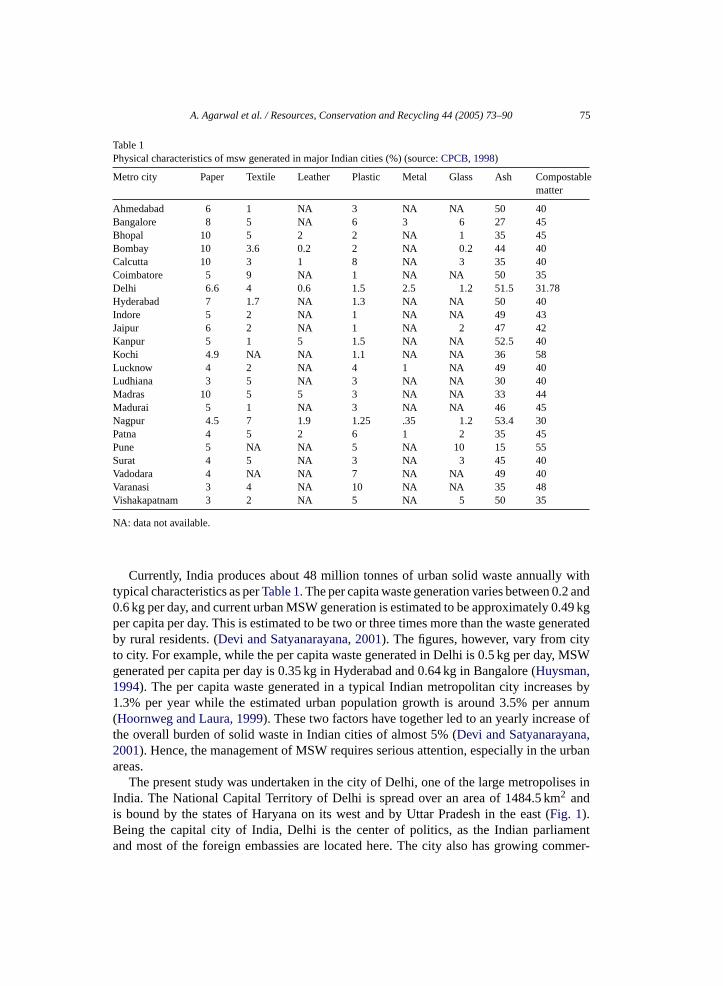
Currently, India produces about 48 million tonnes of urban solid waste annually withtypical characteristics as perTable 1. The per capita waste generation varies between 0.2 and0.6 kg per day, and current urban MSW generation is estimated to be approximately 0.49 kgper capita per day. This is estimated to be two or three times more than the waste generatedby rural residents. (Devi and Satyanarayana, 2001). The figures, however, vary from cityto city. For example, while the per capita waste generated in Delhi is 0.5 kg per day, MSWgenerated per capita per day is 0.35 kg in Hyderabad and 0.64 kg in Bangalore (Huysman,1994). The per capita waste generated in a typical Indian metropolitan city increases by1.3% per year while the estimated urban population growth is around 3.5% per annum(Hoornweg and Laura, 1999). These two factors have together led to an yearly increase ofthe overall burden of solid waste in Indian cities of almost 5% (Devi and Satyanarayana,2001). Hence, the management of MSW requires serious attention, especially in the urbanareas.
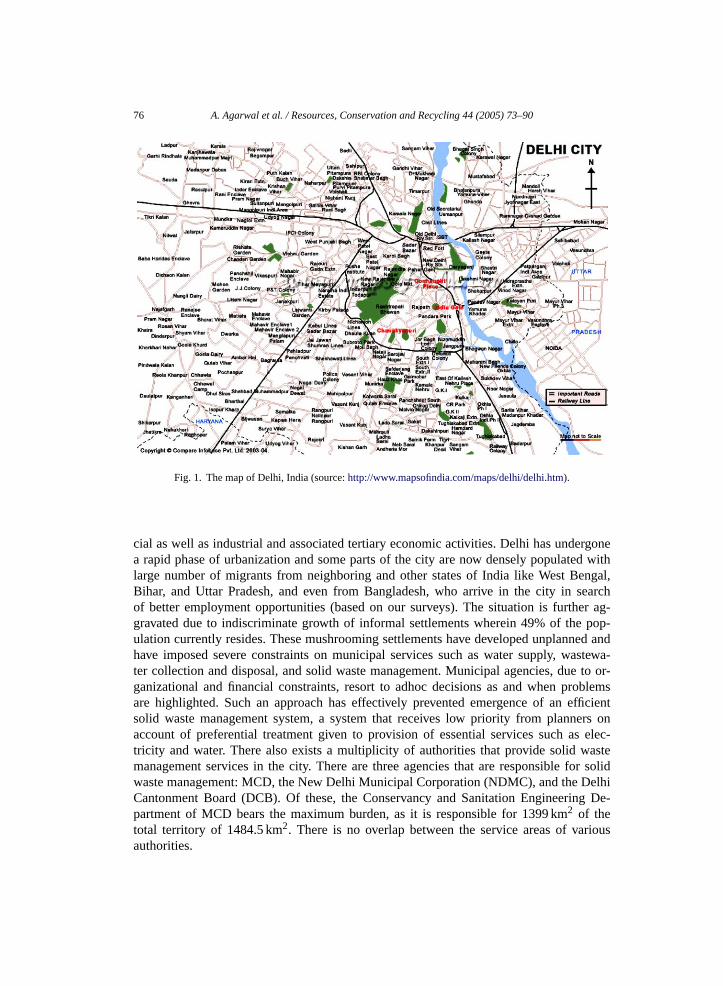
The present study was undertaken in the city of Delhi, one of the large metropolises inIndia. The National Capital Territory of Delhi is spread over an area of 1484.5 km2 andis bound by the states of Haryana on its west and by Uttar Pradesh in the east (Fig. 1).Being the capital city of India, Delhi is the center of politics, as the Indian parliamentand most of the foreign embassies are located here. The city also has growing commer-
76 A. Agarwal et al. / Resources, Conservation and Recycling 44 (2005) 73–90
Fig. 1. The map of Delhi, India (source:http://www.mapsofindia.com/maps/delhi/delhi.htm).
cial as well as industrial and associated tertiary economic activities. Delhi has undergonea rapid phase of urbanization and some parts of the city are now densely populated withlarge number of migrants from neighboring and other states of India like West Bengal,Bihar, and Uttar Pradesh, and even from Bangladesh, who arrive in the city in searchof better employment opportunities (based on our surveys). The situation is further ag-gravated due to indiscriminate growth of informal settlements wherein 49% of the pop-ulation currently resides. These mushrooming settlements have developed unplanned andhave imposed severe constraints on municipal services such as water supply, wastewa-ter collection and disposal, and solid waste management. Municipal agencies, due to or-ganizational and financial constraints, resort to adhoc decisions as and when problemsare highlighted. Such an approach has effectively prevented emergence of an efficientsolid waste management system, a system that receives low priority from planners onaccount of preferential treatment given to provision of essential services such as elec-tricity and water. There also exists a multiplicity of authorities that provide solid wastemanagement services in the city. There are three agencies that are responsible for solidwaste management: MCD, the New Delhi Municipal Corporation (NDMC), and the DelhiCantonment Board (DCB). Of these, the Conservancy and Sanitation Engineering De-partment of MCD bears the maximum burden, as it is responsible for 1399 km2 of thetotal territory of 1484.5 km2. There is no overlap between the service areas of variousauthorities.
A. Agarwal et al. / Resources, Conservation and Recycling 44 (2005) 73–90 77
3. Work methodology
A field survey was undertaken to provide a better insight to the nature and problemsof MSW. A set of questionnaires designed for the sanitation staff, workers, patients, andrecyclists were used to obtain information about the ongoing waste management system.At the landfill sites, engineers of the government agencies responsible for management ofthe solid waste as well as the recyclists were interviewed. A total of 43 recyclists wereinterviewed for getting information on their social and economic conditions. All the recy-clists were from the three-landfill sites, viz. Okhla, Bhalswa, and Ghazipur. The work waslimited to these three sites and the neighboring slum areas where the migrants, many ofwhom are unemployed and take to the recycling work, commonly reside. The work alsoinvolved surveys on recyclable dealers from the wholesale market in Jangpura (Shahadara,New Delhi), to get firsthand information on the prices at various levels in the recycle tradechain. A total of 7 big recyclable dealers and 15 small recyclable dealers were interviewed.The criterion for the categorization of dealers into small or big was based on the type ofrecycled material that they handled. The large recyclable dealers dealt in specific items, sayglass or paper or bottles or plastics, while the small recyclable dealers dealt with variouskind of recyclables. The sampling approach involved the data based on the interviews andextrapolating the average of the collected data per person to all the recyclists present inDelhi. Similar methodology was adopted while calculating the amount of waste recycled atmedium and large recyclable dealer levels.
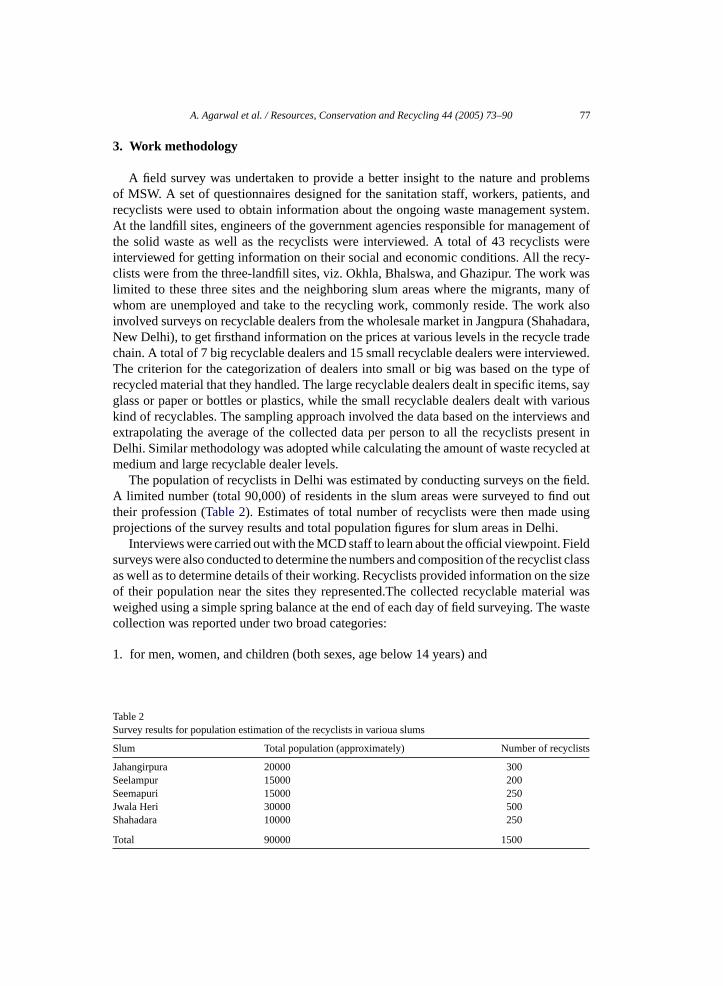
The population of recyclists in Delhi was estimated by conducting surveys on the field.A limited number (total 90,000) of residents in the slum areas were surveyed to find outtheir profession (Table 2). Estimates of total number of recyclists were then made usingprojections of the survey results and total population figures for slum areas in Delhi.
Interviews were carried out with the MCD staff to learn about the official viewpoint. Fieldsurveys were also conducted to determine the numbers and composition of the recyclist classas well as to determine details of their working. Recyclists provided information on the sizeof their population near the sites they represented.The collected recyclable material wasweighed using a simple spring balance at the end of each day of field surveying. The wastecollection was reported under two broad categories:
1. for men, women, and children (both sexes, age below 14 years) and
Table 2Survey results for population estimation of the recyclists in varioua slums
Slum Total population (approximately) Number of recyclists
Jahangirpura 20000 300Seelampur 15000 200Seemapuri 15000 250Jwala Heri 30000 500Shahadara 10000 250
Total 90000 1500
78 A. Agarwal et al. / Resources, Conservation and Recycling 44 (2005) 73–90
2. according to the mode of waste collection and transport: manual, using a bicycle, orusing a tricycle At the recyclable dealer level, the weighing measurements were madeat the dealer shops.
The average weight picked by children, man, and woman was calculated by arithmeticmean of the survey collected in each category. The sample size in each case was 46.
The data was collected between the period June 1998 and May 2000.
4. Results and discussion
4.1. MSW composition and disposal
The organic content of the waste was found to vary considerably at various sites owingto variations in origin of waste, ranging from as low as 23% to as high as 58% in the areasin vicinity to restaurants. The average share of this biodegradable component was found tobe 38% against 35% for the national average of class-I cities. Compared to this, the averageorganic waste content of USA is 11.2% (EPA, 2004). The reasons for the high decline inthe biodegradable in USA may be assigned to the increased use of methods (such as dishwashers) that put the waste into the wastewater system rather than in MSW, and increaseduse of preprocessed and packaged food both in homes and in commercial and institutionalfood services. These differences in the waste compositions highlight the fact that universalMSW management strategies are not easy to evolve, since societies can have wide variationsin the type of solid wastes they generate.
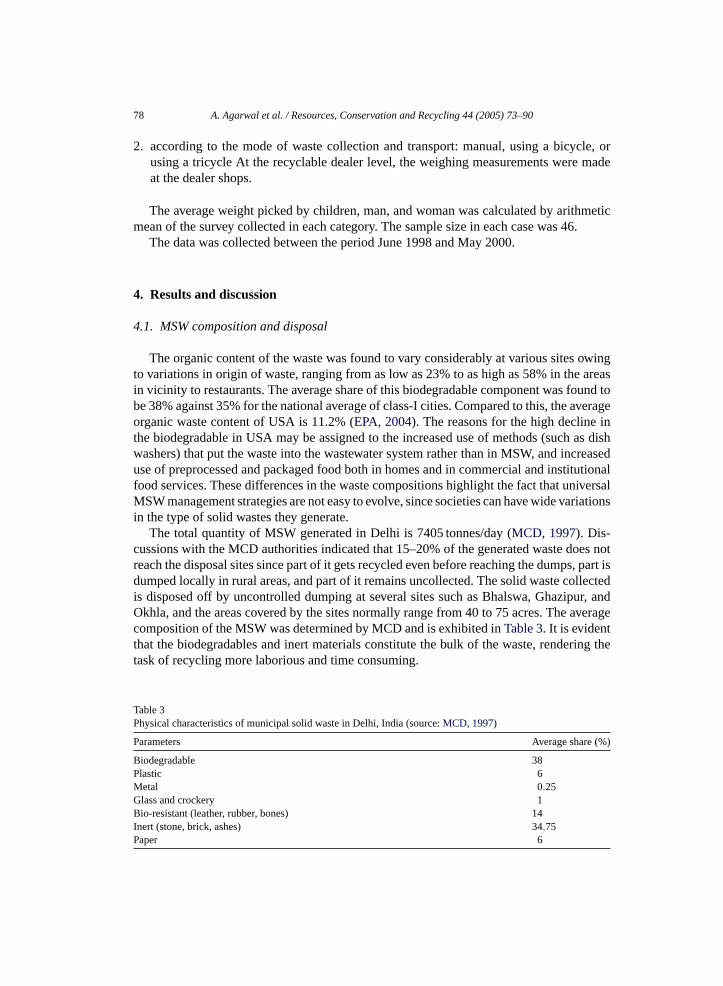
The total quantity of MSW generated in Delhi is 7405 tonnes/day (MCD, 1997). Dis-cussions with the MCD authorities indicated that 15–20% of the generated waste does notreach the disposal sites since part of it gets recycled even before reaching the dumps, part isdumped locally in rural areas, and part of it remains uncollected. The solid waste collectedis disposed off by uncontrolled dumping at several sites such as Bhalswa, Ghazipur, andOkhla, and the areas covered by the sites normally range from 40 to 75 acres. The averagecomposition of the MSW was determined by MCD and is exhibited inTable 3. It is evidentthat the biodegradables and inert materials constitute the bulk of the waste, rendering thetask of recycling more laborious and time consuming.
Table 3Physical characteristics of municipal solid waste in Delhi, India (source:MCD, 1997)
Parameters Average share (%)
Biodegradable 38Plastic 6Metal 0.25Glass and crockery 1Bio-resistant (leather, rubber, bones) 14Inert (stone, brick, ashes) 34.75Paper 6
A. Agarwal et al. / Resources, Conservation and Recycling 44 (2005) 73–90 79
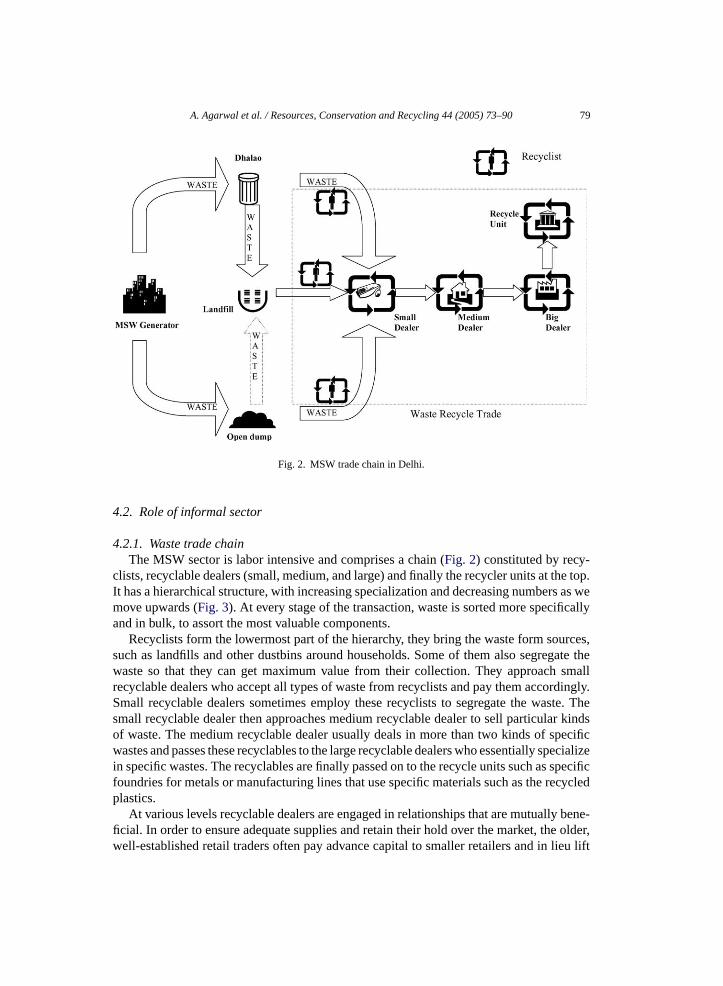
Fig. 2. MSW trade chain in Delhi.
4.2. Role of informal sector
4.2.1. Waste trade chainThe MSW sector is labor intensive and comprises a chain (Fig. 2) constituted by recy-
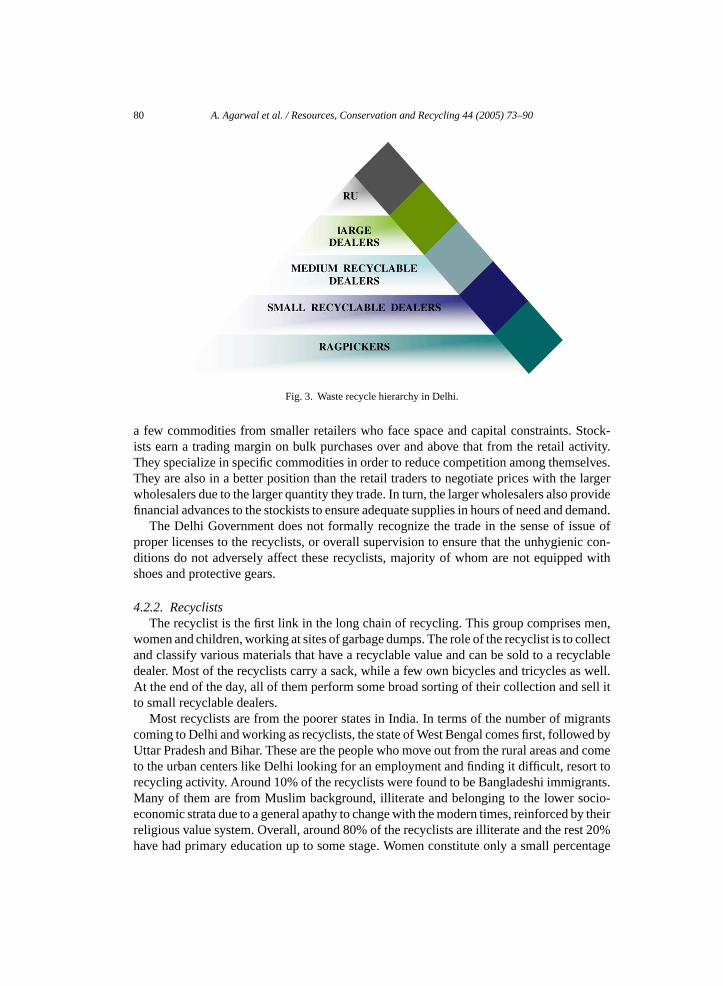
clists, recyclable dealers (small, medium, and large) and finally the recycler units at the top.It has a hierarchical structure, with increasing specialization and decreasing numbers as wemove upwards (Fig. 3). At every stage of the transaction, waste is sorted more specificallyand in bulk, to assort the most valuable components.
Recyclists form the lowermost part of the hierarchy, they bring the waste form sources,such as landfills and other dustbins around households. Some of them also segregate thewaste so that they can get maximum value from their collection. They approach smallrecyclable dealers who accept all types of waste from recyclists and pay them accordingly.Small recyclable dealers sometimes employ these recyclists to segregate the waste. Thesmall recyclable dealer then approaches medium recyclable dealer to sell particular kindsof waste. The medium recyclable dealer usually deals in more than two kinds of specificwastes and passes these recyclables to the large recyclable dealers who essentially specializein specific wastes. The recyclables are finally passed on to the recycle units such as specificfoundries for metals or manufacturing lines that use specific materials such as the recycledplastics.
At various levels recyclable dealers are engaged in relationships that are mutually bene-ficial. In order to ensure adequate supplies and retain their hold over the market, the older,well-established retail traders often pay advance capital to smaller retailers and in lieu lift
80 A. Agarwal et al. / Resources, Conservation and Recycling 44 (2005) 73–90
Fig. 3. Waste recycle hierarchy in Delhi.
a few commodities from smaller retailers who face space and capital constraints. Stock-ists earn a trading margin on bulk purchases over and above that from the retail activity.They specialize in specific commodities in order to reduce competition among themselves.They are also in a better position than the retail traders to negotiate prices with the largerwholesalers due to the larger quantity they trade. In turn, the larger wholesalers also providefinancial advances to the stockists to ensure adequate supplies in hours of need and demand.
The Delhi Government does not formally recognize the trade in the sense of issue ofproper licenses to the recyclists, or overall supervision to ensure that the unhygienic con-ditions do not adversely affect these recyclists, majority of whom are not equipped withshoes and protective gears.
4.2.2. RecyclistsThe recyclist is the first link in the long chain of recycling. This group comprises men,
women and children, working at sites of garbage dumps. The role of the recyclist is to collectand classify various materials that have a recyclable value and can be sold to a recyclabledealer. Most of the recyclists carry a sack, while a few own bicycles and tricycles as well.At the end of the day, all of them perform some broad sorting of their collection and sell itto small recyclable dealers.
Most recyclists are from the poorer states in India. In terms of the number of migrantscoming to Delhi and working as recyclists, the state of West Bengal comes first, followed byUttar Pradesh and Bihar. These are the people who move out from the rural areas and cometo the urban centers like Delhi looking for an employment and finding it difficult, resort torecycling activity. Around 10% of the recyclists were found to be Bangladeshi immigrants.Many of them are from Muslim background, illiterate and belonging to the lower socio-economic strata due to a general apathy to change with the modern times, reinforced by theirreligious value system. Overall, around 80% of the recyclists are illiterate and the rest 20%have had primary education up to some stage. Women constitute only a small percentage
A. Agarwal et al. / Resources, Conservation and Recycling 44 (2005) 73–90 81
of the recycling class and mostly resort to recycling as a part-time activity or as a helpinghand to their husbands.
4.2.2.1. Residential status.Recyclists stay injhuggis(huts or tin sheds) in slums, whichare owned by them or rented or provided to them by the recyclable dealers. Four to fiverecyclists often share the samejhuggisince it is not possible for any one of them to pay themonthly rent of around Rs. 400–500 (US$ 9–11 approximately) single handedly.
4.2.2.2. Life-style of recyclists.Most of the recyclists had incomes just sufficient enoughto avail them food and accommodation on a day-to-day basis. During times of financialdistress, they often approach their recyclable dealers for help, since their low economic statusmakes help from ordinary moneylenders inaccessible to them. The workplace relations thusspill over and reflect in social relations and the help from small dealers is usually readilyforthcoming.
Recyclists are economically marginal, but those who have some savings cannot depositit in banks or post offices due to the unavailability of ration cards, that is, a prerequisite toopening of a bank account. While politicians have tried to issue them ration cards and votercards (primarily to cultivate vote banks for themselves), it has not been done on a large scalesince many of them are illegally residing in India and are immigrants from Bangladesh.
4.2.2.3. Working conditions.The recyclists pick up waste from streets, drains, municipalbins, open dumping sites and landfill sites. None of these is hygienic enough, and yetthe recyclists do not use any kind of protective gears, like gumboots or gloves, and areexposed to frequent injuries like cuts from glass pieces, metals, etc. The work is unpleasant,and frequently the areas in which waste is found and assorted are used for defecation bypublic. The health and safety problems associated with the work are numerous and quiteobvious.
The recyclists’ tangible resource (i.e., waste) is not liable to damage, theft, and supplyproblems or, to unexpected changes in markets. Recyclists mostly work alone, are solelyresponsible for the success of their work and each day is critical for them in the sense thateach day’s earnings are used to provide basic necessities for that day. Average income ofthe rag picking class was found to be Rs. 59.27 (US$ 1.35) per day in Delhi. This compareswell (and is towards the lower side) with the corresponding figures of incomes of recyclistsin Dhaka (Bangladesh) whose earnings range between Tk40 to Tk200 (US$ 0.80–4.00) perday (Rouse and Ali, 2001).
4.2.3. Estimation of population of recyclistsThe population of recyclists in Delhi was estimated by conducting surveys for fiding
the profession of a total of 90,000 residents of the project area slums. Assuming a similardistribution of employment amongst the slum residents in Delhi, the survey results wereprojected for the total slum population in Delhi. This yielded the presence of nearly 89,600recyclists in Delhi.Table 2represents the survey results undertaken in the slums. It is evidentthat nearly 1.67% of the slum area population resorts to the recycling of MSW activity inDelhi.
82 A. Agarwal et al. / Resources, Conservation and Recycling 44 (2005) 73–90
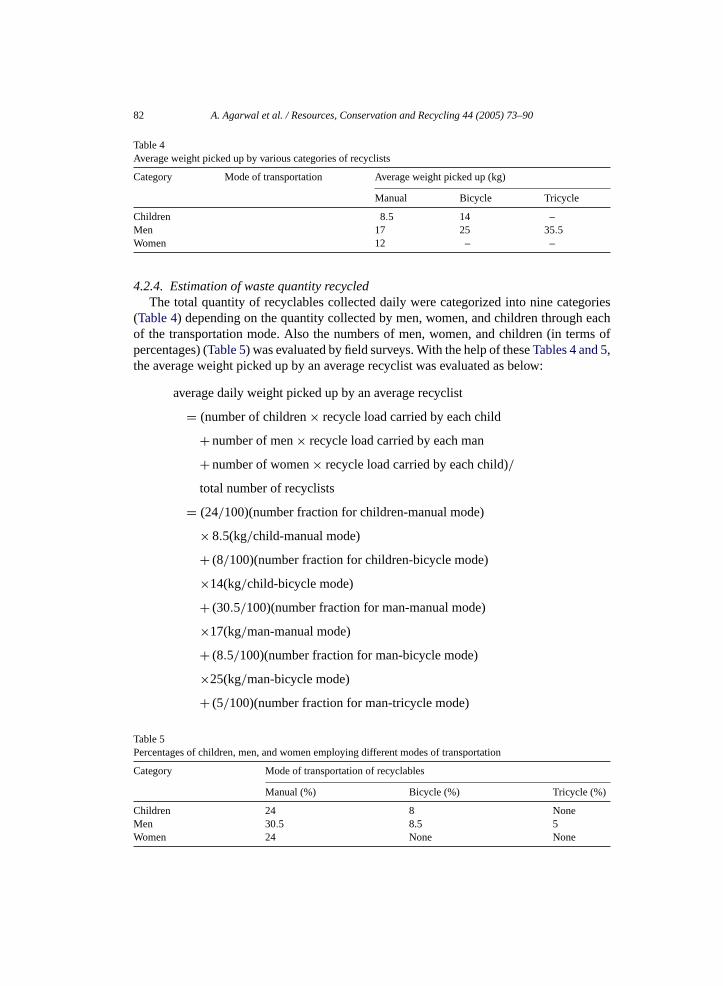
Table 4Average weight picked up by various categories of recyclists
Category Mode of transportation Average weight picked up (kg)
Manual Bicycle Tricycle
Children 8.5 14 –Men 17 25 35.5Women 12 – –
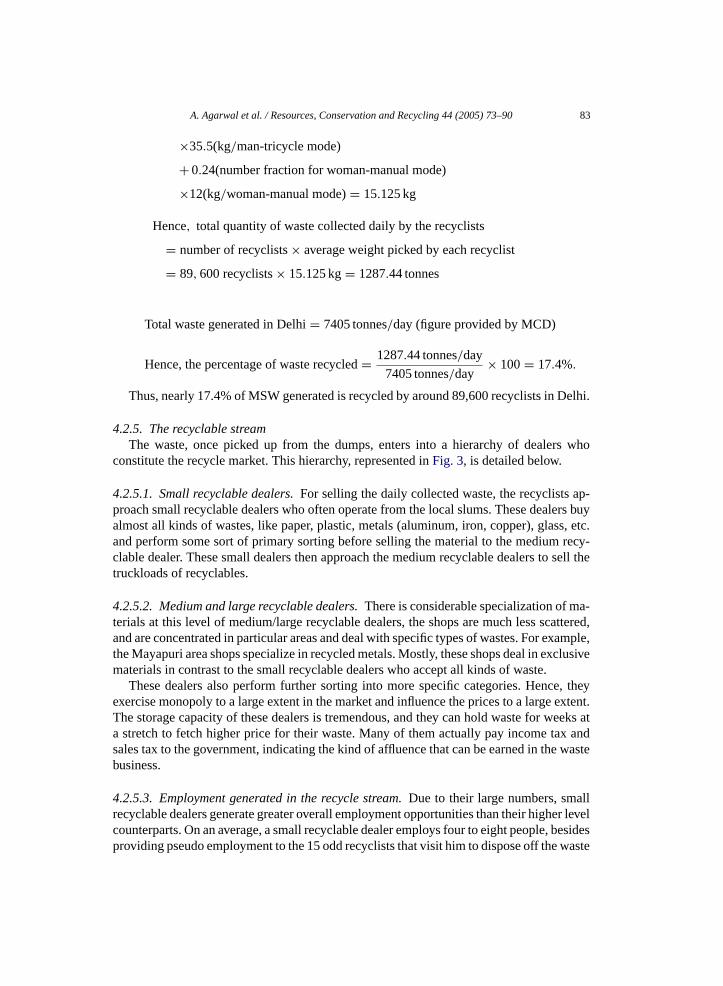
4.2.4. Estimation of waste quantity recycledThe total quantity of recyclables collected daily were categorized into nine categories
(Table 4) depending on the quantity collected by men, women, and children through eachof the transportation mode. Also the numbers of men, women, and children (in terms ofpercentages) (Table 5) was evaluated by field surveys. With the help of theseTables 4 and 5,the average weight picked up by an average recyclist was evaluated as below:
average daily weight picked up by an average recyclist
= (number of children× recycle load carried by each child
+ number of men× recycle load carried by each man
+ number of women× recycle load carried by each child)/
total number of recyclists
= (24/100)(number fraction for children-manual mode)
× 8.5(kg/child-manual mode)
+ (8/100)(number fraction for children-bicycle mode)
×14(kg/child-bicycle mode)
+ (30.5/100)(number fraction for man-manual mode)
×17(kg/man-manual mode)
+ (8.5/100)(number fraction for man-bicycle mode)
×25(kg/man-bicycle mode)
+ (5/100)(number fraction for man-tricycle mode)
Table 5Percentages of children, men, and women employing different modes of transportation
Category Mode of transportation of recyclables
Manual (%) Bicycle (%) Tricycle (%)
Children 24 8 NoneMen 30.5 8.5 5Women 24 None None
A. Agarwal et al. / Resources, Conservation and Recycling 44 (2005) 73–90 83
×35.5(kg/man-tricycle mode)
+ 0.24(number fraction for woman-manual mode)
×12(kg/woman-manual mode)= 15.125 kg
Hence, total quantity of waste collected daily by the recyclists
= number of recyclists× average weight picked by each recyclist
= 89, 600 recyclists× 15.125 kg= 1287.44 tonnes
Total waste generated in Delhi= 7405 tonnes/day (figure provided by MCD)
Hence, the percentage of waste recycled= 1287.44 tonnes/day
7405 tonnes/day× 100= 17.4%.
Thus, nearly 17.4% of MSW generated is recycled by around 89,600 recyclists in Delhi.
4.2.5. The recyclable streamThe waste, once picked up from the dumps, enters into a hierarchy of dealers who
constitute the recycle market. This hierarchy, represented inFig. 3, is detailed below.
4.2.5.1. Small recyclable dealers.For selling the daily collected waste, the recyclists ap-proach small recyclable dealers who often operate from the local slums. These dealers buyalmost all kinds of wastes, like paper, plastic, metals (aluminum, iron, copper), glass, etc.and perform some sort of primary sorting before selling the material to the medium recy-clable dealer. These small dealers then approach the medium recyclable dealers to sell thetruckloads of recyclables.
4.2.5.2. Medium and large recyclable dealers.There is considerable specialization of ma-terials at this level of medium/large recyclable dealers, the shops are much less scattered,and are concentrated in particular areas and deal with specific types of wastes. For example,the Mayapuri area shops specialize in recycled metals. Mostly, these shops deal in exclusivematerials in contrast to the small recyclable dealers who accept all kinds of waste.
These dealers also perform further sorting into more specific categories. Hence, theyexercise monopoly to a large extent in the market and influence the prices to a large extent.The storage capacity of these dealers is tremendous, and they can hold waste for weeks ata stretch to fetch higher price for their waste. Many of them actually pay income tax andsales tax to the government, indicating the kind of affluence that can be earned in the wastebusiness.
4.2.5.3. Employment generated in the recycle stream.Due to their large numbers, smallrecyclable dealers generate greater overall employment opportunities than their higher levelcounterparts. On an average, a small recyclable dealer employs four to eight people, besidesproviding pseudo employment to the 15 odd recyclists that visit him to dispose off the waste
84 A. Agarwal et al. / Resources, Conservation and Recycling 44 (2005) 73–90
collected. A typical medium recyclable dealer provides employment to 10–15 sorters whilea large recyclable dealer typically employs 10–20 people on a daily basis for sorting andfor loading the waste for ultimate destination.
4.2.5.4. Inventory storage capacity.A small recyclable dealer uses around 15–20 m2
of space to store their waste, while a medium recyclable dealer can own as much as20–35 m2 of land. A large recyclable dealer typically requires 40–80 m2 of space tooperate.
4.2.6. Market price mechanismThe price of a particular item is governed by the way the recycle market operates. The
deciding factor is usually the current demand for the material and the inflow of collectedmaterial into the market.
• If the material is in excess, then the recycle units decide the price.• If the material is scarce, then the dealers dictate the price.• In a neutral situation, market fixes the price depending on demand and supply.• In most cases, the price of the virgin materials affects the pricing of the recycled material.
If the virgin material and waste material have same or nearly the same prices, then theface value of that particular recycled material is bound to fall in comparison to the virginmaterial. In contrast, if the virgin material witnesses a price rise, then often the recycledmaterial prices also rise. This price rise, however, may not be proportional. To the pricerise of virgin material.
• Periodic fluctuation in the prices is also observed. Some of the large recyclable dealers,who have surplus holding and storage capacities to store the waste, wait till the demandrises and hedge market prices.
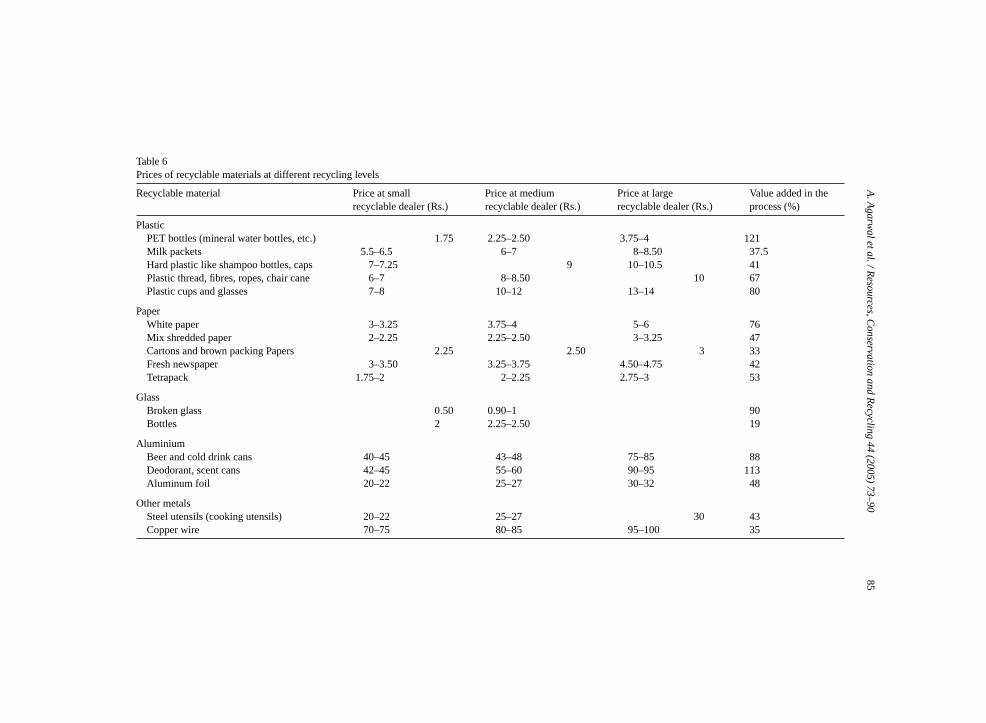
4.2.7. Value addition to waste itemsThe item-wise waste prices and their appreciation in the waste market is presented in
Table 6. The value added in the waste trade chain from the small Recyclable dealers’ level tolarge Recyclable dealers’ level varies from 19 to 121% depending on the recycling potentialof the material, its ease of availability and the demand in the market FromTable 6, it isevident that the highest value addition occurs for PET bottles, which have a long life andare readily recyclable and reusable. On the other hand metals including Aluminum fetchthe highest revenues to the recyclists on account of their low prevalence in waste (0.25% asperTable 3) and due to the high market cost of metals.
4.2.8. Should the sector be organized?Currently, the recyclists often take up the task in the absence of alternative employ-
ment. The working conditions are unhygienic and security equipment such as boots andgloves are never worn. The chances of transmission of infections are therefore high, andonce sick, the recyclists suffer from the risk of loosing the meager earnings in the absenceof medical insurance and facilities. Besides, the work has associated insecurities: for ex-ample, in the rainy season nothing can be collected for days, and this means economichardships.
A.A
ga
rwa
leta
l./Re
sou
rces,C
on
serva
tion
an
dR
ecyclin
g4
4(2
00
5)
73
–9
085
Table 6Prices of recyclable materials at different recycling levels
Recyclable material Price at smallrecyclable dealer (Rs.)
Price at mediumrecyclable dealer (Rs.)
Price at largerecyclable dealer (Rs.)
Value added in theprocess (%)
PlasticPET bottles (mineral water bottles, etc.) 1.75 2.25–2.50 3.75–4 121Milk packets 5.5–6.5 6–7 8–8.50 37.5Hard plastic like shampoo bottles, caps 7–7.25 9 10–10.5 41Plastic thread, fibres, ropes, chair cane 6–7 8–8.50 10 67Plastic cups and glasses 7–8 10–12 13–14 80
PaperWhite paper 3–3.25 3.75–4 5–6 76Mix shredded paper 2–2.25 2.25–2.50 3–3.25 47Cartons and brown packing Papers 2.25 2.50 3 33Fresh newspaper 3–3.50 3.25–3.75 4.50–4.75 42Tetrapack 1.75–2 2–2.25 2.75–3 53
GlassBroken glass 0.50 0.90–1 90Bottles 2 2.25–2.50 19
AluminiumBeer and cold drink cans 40–45 43–48 75–85 88Deodorant, scent cans 42–45 55–60 90–95 113Aluminum foil 20–22 25–27 30–32 48
Other metalsSteel utensils (cooking utensils) 20–22 25–27 30 43Copper wire 70–75 80–85 95–100 35
86 A. Agarwal et al. / Resources, Conservation and Recycling 44 (2005) 73–90
Research has shown that organizing the informal sector and promoting micro-enterpriseshas proven to be an effective way of extending affordable services, especially to urbancommunities (Devi and Satyanarayana, 2001). Presently, the recycling activity is completelyinformal. Organizing and formalizing the activity so that the work is recognized as anemployment (and hence is subject to labour laws and entitlement to medical facilities) maybe a way out for the alleviation of the living conditions of the recyclists. It was with thisview that two models are proposed and are evaluated for the feasibility of formalization ofthe hitherto informal recycling sector by the local municipality, the Municipal Corporationof Delhi.
4.2.8.1. Management model-A: regularize the services of all recyclists.Model A is basedupon the basic concept of rehabilitation of existing recyclists in Delhi and organizing therecyclist by transforming the recyclist into a scientific sorting and recycling of the waste.Following are the major assumptions of the model:
1. All the recyclists would be rehabilitated. The MCD would take over the unorganizedtrade and provides employment to the poor recyclists.
2. The recyclable dealers are likely to find alternative employment at their own, due togreater specialized skills and better financial status.
3. Existing all the recyclists would participate in the organized activity4. The wage to be paid to an employee is Rs. 110 per day (US$ 2.5) as per the Indian Labor
Law. This Minimum Wages Act is primarily applicable to workers in the unorganizedsector and empowers both the federal and state governments to fix and revise the min-imum wage rates for the occupations that are covered by the Act and are under theirrespective jurisdictions.
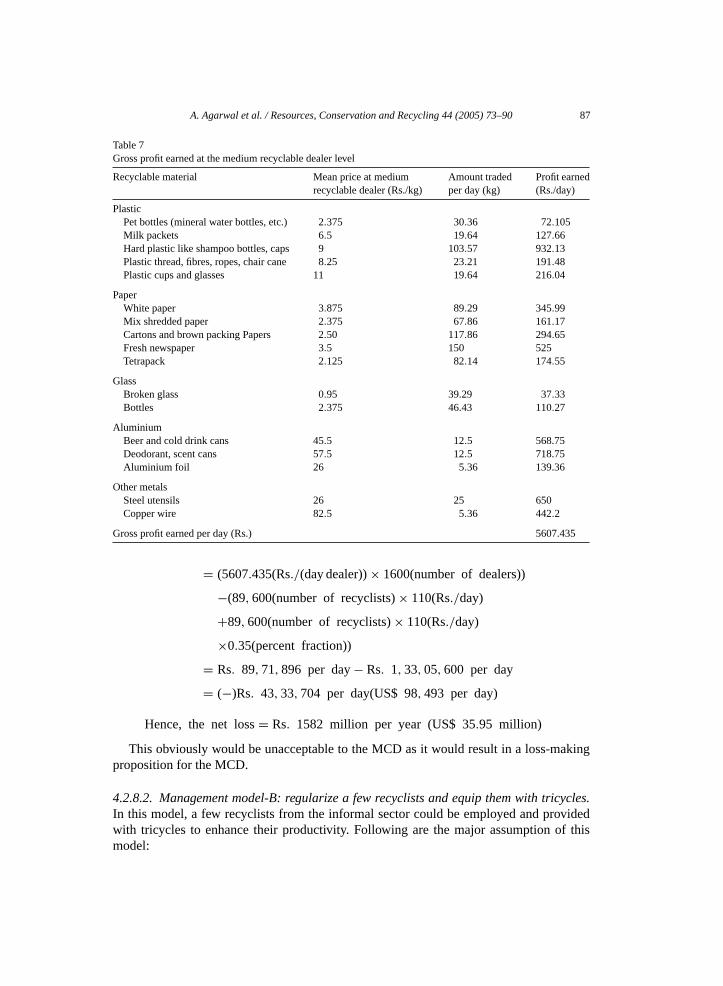
5. Gross profits earned from the waste are based upon the value of the waste recovered(1287.44 tonnes, which is currently being recycled by the recyclists in Delhi) by therecyclists. To estimate the gross profit earned from the above material, an analysis isdone as exhibited inTable 7. The calculations have been performed using the pricesof the various materials at the level of medium Recyclable dealers. This is justified aslarge dealers often hoard the waste creating artificial scarcity in the market and causethe waste prices to fluctuate. Prices at the medium dealers reflect a greater degree ofmarket reality and the fluctuations are less severe from week to week. The total numberof medium recyclable dealers in Delhi is nearly 1600.
6. The other overheads, interviews with MCD officials revealed it, such as officecharges, supervising charges, storage and transportation of waste, and miscella-neous overheads, would account for additional charges to the tune of 35% of thewages.
Net profit= total value of the recycled waste
− expenditure incurred by the MCD
= (gross profit earned per day× number of medium recyclable
dealers)− (number of recyclist× average daily wages
+overhead charges)
A. Agarwal et al. / Resources, Conservation and Recycling 44 (2005) 73–90 87
Table 7Gross profit earned at the medium recyclable dealer level
Recyclable material Mean price at mediumrecyclable dealer (Rs./kg)
Amount tradedper day (kg)
Profit earned(Rs./day)
PlasticPet bottles (mineral water bottles, etc.) 2.375 30.36 72.105Milk packets 6.5 19.64 127.66Hard plastic like shampoo bottles, caps 9 103.57 932.13Plastic thread, fibres, ropes, chair cane 8.25 23.21 191.48Plastic cups and glasses 11 19.64 216.04
PaperWhite paper 3.875 89.29 345.99Mix shredded paper 2.375 67.86 161.17Cartons and brown packing Papers 2.50 117.86 294.65Fresh newspaper 3.5 150 525Tetrapack 2.125 82.14 174.55
GlassBroken glass 0.95 39.29 37.33Bottles 2.375 46.43 110.27
AluminiumBeer and cold drink cans 45.5 12.5 568.75Deodorant, scent cans 57.5 12.5 718.75Aluminium foil 26 5.36 139.36
Other metalsSteel utensils 26 25 650Copper wire 82.5 5.36 442.2
Gross profit earned per day (Rs.) 5607.435
= (5607.435(Rs./(day dealer))× 1600(number of dealers))
−(89, 600(number of recyclists)× 110(Rs./day)
+89, 600(number of recyclists)× 110(Rs./day)
×0.35(percent fraction))
= Rs. 89, 71, 896 per day− Rs. 1, 33, 05, 600 per day
= (−)Rs. 43, 33, 704 per day(US$ 98, 493 per day)
Hence, the net loss= Rs. 1582 million per year (US$ 35.95 million)
This obviously would be unacceptable to the MCD as it would result in a loss-makingproposition for the MCD.
4.2.8.2. Management model-B: regularize a few recyclists and equip them with tricycles.In this model, a few recyclists from the informal sector could be employed and providedwith tricycles to enhance their productivity. Following are the major assumption of thismodel:
88 A. Agarwal et al. / Resources, Conservation and Recycling 44 (2005) 73–90
1. The recyclists may be provided with tricycles to increase their efficiencies.2. Each tricycle costs Rs. 1540 [US$ 35].3. The tricycle collection capacity for men as found from the field surveys is 60 kg/day. This
implies that 21,458 tricycles will have to be brought and an equal number of recyclistscan be employed.
4. Assume 35% overheads over the salary component and a 5% rate of return on borrowingsfor a 15-year period (soft loans are often available for such projects) and accounting fora depreciation period of 15 years.
Net profit/loss= total value of the recycled waste
− expenditure incurred by the MCD
= (gross profits earned× number of medium recyclable dealers)
− (wages+ one time investment to buy tricycles
+ 35% overheads over salary component
+ 5% rate of return on borrowings for a period of 15 years
+ 35% depreciation)
= 5607.435(Rs./day)× 1600(number of dealers)
× 365(days/year)− (21, 458(number of recyclists)
× 110(Rs/day)× 365(days/year)
+ 21, 458(number of tricycles)× 1540(Rs./tricycle)
15(years)
+ 0.40(percent fraction)× 21, 458(number of recyclists)
× 110(Rs./day))
= Rs. 2410.06 million(US$ 54.77 million)per year
This proposal seems economically sustainable, as recovered costs of the recycledwaste would far exceed expenses. However, this proposal has the obvious shortcomingof seeing 68,142 recyclists loose their daily employment. Finding alternative employ-ment for these left-outs would be an unenviable task by any standards. Also, this pro-posal would imply loss of job for children and women, since they do not use tricycles inIndia.
Thus organizing a hitherto informal sector can be financially attractive and viable butmay play havoc with the lives of a majority of recyclists and can have tremendous socio-political fallouts. The models clearly illustrate the point that promoting micro-enterprisesmay prove to be an effective way of extending affordable services, especially to urban com-munities as far as economics goes, but the socio-political dimensions of such efforts must bewatched out and may prove inhibitory to the entire process of formalizing the unorganizedsectors.
A. Agarwal et al. / Resources, Conservation and Recycling 44 (2005) 73–90 89
5. Conclusions and recommendations
In Delhi, the recycling of MSW is currently carried out by an informal sector comprisingrecyclists at the lowest end and a succession of dealers. The process creates a market ofrecyclables, and value addition occurs for the various recyclables in the recycle stream. Itis possible to attempt to formally organize the recyclable activity, so that the recyclists leada secured and better life. Though such attempts may be financially viable, they would notbe bereft of the socio-economic impacts on the life of these recyclists. If the proposal isfinancially viable, the private sector may also be encouraged to enter into the waste businessby employing the recyclists. In turn, the government may grant assured waste supplies tothe private parties and can structure the waste markets so that the profits reach in a moresustained and assured manner to the recyclists.
The study on MSW recycling provides insights into the market mehanism of recyclables,but also reveals details on the plight of recyclists. The recyclists might ultimately need tobe formally incorporated in waste management systems, both at local level systems, aswell as in the larger urban framework. For this, there should be an accent on trainingthem. Training would also be required on personal hygiene as most recyclists are presentlyunaware of the consequences of garbage sorting without adopting safety guidelines. Itmay also be in the interest of overall waste management and all associated stakeholders togainfully use biodegradable part of the waste (23–58%, in case of Delhi) by imparting skillson use of composting so that that the recyclists get an alternative way of supplementingtheir incomes from a part of the waste which they presently find not useful. It is here thatnon government organizations (NGOs) can be particulaly effective. The local governmentbodies may encourage NGOs to set up co-operatives of recyclists to take up composting asan alternative way of supplementing their incomes. Furthermore, the recyclists may organisedoorstep waste collection and this may provide them an opportunity to improve their workingconditions, safety levels and incomes. The local bodies can further give incentives to NGOsin their effort of organizing recyclists in primary collection of recyclable and/or organicwaste, and provide financial and logistic support to the extent possible. If succesful, suchexperiments can then be replicated in other large urban centers to evolve recycling as aclean alternative in management of MSW.
Acknowledgements
The authors are grateful to the Summer Undergraduate Research Award (SURA), IIT-Delhi, for funding this research work. The authors are also grateful to the two anonymousreferees who through their comments, helped to substantially improve the manuscript.
References
Coopers & Lybrand. Cost benefit analysis of the different municipal solid waste management systems: objectivesand instruments for the year 2000. Final Report for European Commission, DGXI; 1996.
CPCB. Status of solid waste management in metro cities. Report. India: Central Pollution Control Board; 1998.
90 A. Agarwal et al. / Resources, Conservation and Recycling 44 (2005) 73–90
Datta M. Waste disposal in engineered landfills. India: Narosa Publishing House Private Limited; 1997.Devi K, Satyanarayana V. Financial resources and private sector participation in SWM in India. Indo-US Financial
Reform and Expansion (FIRE) Project, New Delhi; 2001.ECOTEC. Beyond the bin; the economics of waste management options. Final Report by ECOTEC Research and
Consulting Limited to Friends of the Earth, UK Waste and Waste Watch; 2000.EPA. Municipal Solid Waste Basic Facts U.S. Environmental Protection Agency, 2004http://www.epa.gov/
epaoswer/non-hw/muncpl/facts.htm.Hoornweg D, Laura T. What a waste: solid management in Asia. Working Paper Series No. 1. Washington, DC:
Urban Development Sector Unit, East Asia and Pacific Region, The World Bank; 1999.Huysman M. A profile of Bangalore. In: Proceedings Workshop Linkages in Urban SWM; 1994.Jha PK. Sustainable technologies for waste management. In: Proceedings of the First International Conference on
Ecological Sanitation; 2001.MCD. Projections for 10th Five Year Plan (1997–2002) under development sector. India: Municipal Corporation
of Delhi; 1997.Rouse J, Ali M. Waste pickers in Dhaka: using the sustainable livelihood approach—key findings and field notes.
UK: WEDC, Loughborough University; 2001.
Related Documents