BioMed Central Page 1 of 14 (page number not for citation purposes) BMC Cancer Open Access Research article Municipal distribution of breast cancer mortality among women in Spain Marina Pollán* 1,2 , Rebeca Ramis 1,2 , Nuria Aragonés 1,2 , Beatriz Pérez- Gómez 1,2 , Diana Gómez 1 , Virginia Lope 1,2 , Javier García-Pérez 1,2 , Jose Miguel Carrasco 1 , Maria José García-Mendizábal 1,2 and Gonzalo López- Abente 1,2 Address: 1 Environmental and Cancer Epidemiology Unit, National Centre for Epidemiology, Carlos III Institute of Public Health, Madrid, Spain and 2 CIBER Epidemiología y Salud Pública (CIBERESP), Spain Email: Marina Pollán* - [email protected]; Rebeca Ramis - [email protected]; Nuria Aragonés - [email protected]; Beatriz Pérez- Gómez - [email protected]; Diana Gómez - [email protected]; Virginia Lope - [email protected]; Javier García-Pérez - [email protected]; Jose Miguel Carrasco - [email protected]; Maria José García-Mendizábal - [email protected]; Gonzalo López-Abente - [email protected] * Corresponding author Abstract Background: Spain has one of the lowest rates of breast cancer in Europe, though estimated incidence has risen substantially in recent decades. Some years ago, the Spanish Cancer Mortality Atlas showed Spain as having a heterogeneous distribution of breast cancer mortality at a provincial level. This paper describes the municipal distribution of breast cancer mortality in Spain and its relationship with socio-economic indicators. Methods: Breast cancer mortality was modelled using the Besag-York-Molliè autoregressive spatial model, including socio- economic level, rurality and percentage of population over 64 years of age as surrogates of reproductive and lifestyle risk factors. Municipal relative risks (RRs) were independently estimated for women aged under 50 years and for those aged 50 years and over. Maps were plotted depicting smoothed RR estimates and the distribution of the posterior probability of RR>1. Results: In women aged 50 years and over, mortality increased with socio-economic level, and was lower in rural areas and municipalities with higher proportion of old persons. Among women aged under 50 years, rurality was the only statistically significant explanatory variable. For women older than 49 years, the highest relative risks were mainly registered for municipalities located in the Canary Islands, Balearic Islands, the Mediterranean coast of Catalonia and Valencia, plus others around the Ebro River. In premenopausal women, the pattern was similar but tended to be more homogeneous. In mainland Spain, a group of municipalities with high RRs were located in Andalusia, near the left bank of the Guadalquivir River. Conclusion: As previously observed in other contexts, mortality rates are positively related with socio-economic status and negatively associated with rurality and the presence of a higher proportion of people over age 64 years. Taken together, these variables represent the influence of lifestyle factors which have determined the increase in breast cancer frequency over recent decades. The results for the younger group of women suggest an attenuation of the socio-economic gradient in breast cancer mortality in Spain. The geographical variation essentially suggests the influence of other environmental variables, yet the descriptive nature of this study does not allow for the main determinants to be established. Published: 8 May 2007 BMC Cancer 2007, 7:78 doi:10.1186/1471-2407-7-78 Received: 1 December 2006 Accepted: 8 May 2007 This article is available from: http://www.biomedcentral.com/1471-2407/7/78 © 2007 Pollán et al; licensee BioMed Central Ltd. This is an Open Access article distributed under the terms of the Creative Commons Attribution License (http://creativecommons.org/licenses/by/2.0 ), which permits unrestricted use, distribution, and reproduction in any medium, provided the original work is properly cited.

Welcome message from author
This document is posted to help you gain knowledge. Please leave a comment to let me know what you think about it! Share it to your friends and learn new things together.
Transcript
BioMed CentralBMC Cancer
ss
Open AcceResearch articleMunicipal distribution of breast cancer mortality among women in SpainMarina Pollán*1,2, Rebeca Ramis1,2, Nuria Aragonés1,2, Beatriz Pérez-Gómez1,2, Diana Gómez1, Virginia Lope1,2, Javier García-Pérez1,2, Jose Miguel Carrasco1, Maria José García-Mendizábal1,2 and Gonzalo López-Abente1,2Address: 1Environmental and Cancer Epidemiology Unit, National Centre for Epidemiology, Carlos III Institute of Public Health, Madrid, Spain and 2CIBER Epidemiología y Salud Pública (CIBERESP), Spain
Email: Marina Pollán* - [email protected]; Rebeca Ramis - [email protected]; Nuria Aragonés - [email protected]; Beatriz Pérez-Gómez - [email protected]; Diana Gómez - [email protected]; Virginia Lope - [email protected]; Javier García-Pérez - [email protected]; Jose Miguel Carrasco - [email protected]; Maria José García-Mendizábal - [email protected]; Gonzalo López-Abente - [email protected]
* Corresponding author
AbstractBackground: Spain has one of the lowest rates of breast cancer in Europe, though estimated incidence has risen substantiallyin recent decades. Some years ago, the Spanish Cancer Mortality Atlas showed Spain as having a heterogeneous distribution ofbreast cancer mortality at a provincial level. This paper describes the municipal distribution of breast cancer mortality in Spainand its relationship with socio-economic indicators.
Methods: Breast cancer mortality was modelled using the Besag-York-Molliè autoregressive spatial model, including socio-economic level, rurality and percentage of population over 64 years of age as surrogates of reproductive and lifestyle risk factors.Municipal relative risks (RRs) were independently estimated for women aged under 50 years and for those aged 50 years andover. Maps were plotted depicting smoothed RR estimates and the distribution of the posterior probability of RR>1.
Results: In women aged 50 years and over, mortality increased with socio-economic level, and was lower in rural areas andmunicipalities with higher proportion of old persons. Among women aged under 50 years, rurality was the only statisticallysignificant explanatory variable.
For women older than 49 years, the highest relative risks were mainly registered for municipalities located in the Canary Islands,Balearic Islands, the Mediterranean coast of Catalonia and Valencia, plus others around the Ebro River. In premenopausalwomen, the pattern was similar but tended to be more homogeneous. In mainland Spain, a group of municipalities with high RRswere located in Andalusia, near the left bank of the Guadalquivir River.
Conclusion: As previously observed in other contexts, mortality rates are positively related with socio-economic status andnegatively associated with rurality and the presence of a higher proportion of people over age 64 years. Taken together, thesevariables represent the influence of lifestyle factors which have determined the increase in breast cancer frequency over recentdecades. The results for the younger group of women suggest an attenuation of the socio-economic gradient in breast cancermortality in Spain. The geographical variation essentially suggests the influence of other environmental variables, yet thedescriptive nature of this study does not allow for the main determinants to be established.
Published: 8 May 2007
BMC Cancer 2007, 7:78 doi:10.1186/1471-2407-7-78
Received: 1 December 2006Accepted: 8 May 2007
This article is available from: http://www.biomedcentral.com/1471-2407/7/78
© 2007 Pollán et al; licensee BioMed Central Ltd. This is an Open Access article distributed under the terms of the Creative Commons Attribution License (http://creativecommons.org/licenses/by/2.0), which permits unrestricted use, distribution, and reproduction in any medium, provided the original work is properly cited.
Page 1 of 14(page number not for citation purposes)
BMC Cancer 2007, 7:78 http://www.biomedcentral.com/1471-2407/7/78
BackgroundBreast cancer is the leading malignant tumour in women,accounting for 27% of cancers in European women [1].Spain has one of the lowest rates in Europe, in terms bothof incidence (estimated age-standardised rate of 51 per100,000 population) more especially, of mortality (16 per100,000)[1]. The major risk factors seem to be genetic sus-ceptibility, reproductive behaviour, obesity and, less con-sistently demonstrated, diet[2]. Ecological studies haveshown an association with fertility, body weight or fatconsumption, but these variables explained only a minorcomponent of the overall variation[3]. A positive associa-tion between breast cancer and socio-economic level hasbeen consistently reported [4-10]. Although socio-eco-nomic status can be a surrogate of several risk factors(reproductive behaviour, diet or physical activity) [11-13], these variables do not completely explain the excessrisk observed in the more affluent groups[8].
One of the classic approaches in epidemiology is the studyof geographical distribution. In administrative terms,Spain is divided into Autonomous Regions known asComunidades Autónomas. These are in turn divided intoprovinces and, at the lowest level, into municipalities.Breast cancer mortality has been previously studied at aprovincial level. The highest standardised rates observedin Las Palmas Province (Canary Islands) were doublethose registered for Orense, the province with the lowestrate[14].
Currently, spatial epidemiology allows for a greater levelof disaggregation. One of the advantages of this approachis to highlight local effects that might be linked to specificgeographic, social or environmental characteristics[15].This study reports on municipal distribution of breast can-cer mortality in Spain and the variability associated withsocio-economic level and other explanatory variables.Furthermore, given that pre- and postmenopausaltumours have somewhat different risk factors (i.e. obesityseems to act as protective exposure in younger women andis a well-established risk factor among postmenopausalwomen), the geographical pattern is independentlyexplored in women aged under 50 years or 50 years andover.
MethodsAs our case source, we used all Spanish individual deathentries for the period 1989–1998 corresponding to breastcancer (International Classification of Diseases, 9th Revi-sion (ICD-9) code 174) broken down by municipality. Amunicipality is an administrative unit, made up of aclearly demarcated territory and its population, governedby a municipal council. This is the smallest aggregateddivision for which mortality and population data couldbe obtained at a national basis for the study period. Mor-
tality data were furnished by the National Statistics Insti-tute. Municipal populations, broken down by age group(18 groups) and sex, were obtained from the 1991 censusand 1996 municipal rolls. These years correspond to themidpoints of the two quinquennia that comprise thestudy period (1989–1993 and 1994–1998). The person-years for each five-year period were obtained by multiply-ing these populations by 5.
As an indicator of socio-economic level, the index pro-vided by the Spanish Credit Bank (Banco Español deCrédito) for 1991 was used[16]. This index classifiesmunicipalities into 10 levels, according to different mark-ers of economic activity, namely, the number of holidayhomes, bank branch offices and telephones, and esti-mated average family income. An indicator of rurality wasdrawn up, based on the number of inhabitants, as classi-fied by the National Statistics Institute in the following 10categories: > 500,000; 100,001–500,000; 50,001–100,000; 20,001–50,000; 10,001–20,000; 5,001–10,000;2,001–5,000; 1,001–2,000; 501–1,000; and 101–500 and<100 inhabitants. Finally, the percentage of people overthe age of 64 years living in each municipality wasdeemed to be a surrogate of life-style factors that mighthave changed and were less prevalent in older genera-tions.
Standardised mortality ratios (SMRs) were computed asthe ratio of observed to expected deaths. Expected caseswere computed, taking Spanish breast cancer mortalityrates, broken down by age and five-year period, as refer-ence. SMRs were also calculated by province and categoryof explanatory variable, and confidence intervals for thesecategories were duly computed using Byar's approach[17].
Breast cancer mortality was separately studied amongwomen aged under 50 years and comprised deaths fromcancers diagnosed mainly in premenopausal women andamong women aged 50 years and over. This latter groupwas made up of a mixture of pre- and postmenopausalcases but was nevertheless dominated by the secondgroup.
Smoothed municipal relative risks (RRs) were calculatedusing the conditional autoregressive model introduced byClayton and Kaldor[18], and further developed by Besag,York and Molliè [19]. This model has been applied in thefield of ecological studies[20]. It is a Poisson spatialmodel with observed cases as the dependent variable,expected cases as offset, and two random effects terms thattake the following into account: a) municipal contiguity(spatial term); and b) municipal heterogeneity. Socio-eco-nomic level, rurality and percentage of people over the ageof 64 years were introduced into the model as continuousexplanatory variables. The purpose was twofold: 1) to
Page 2 of 14(page number not for citation purposes)
BMC Cancer 2007, 7:78 http://www.biomedcentral.com/1471-2407/7/78
ascertain their influence on breast cancer mortality; and 2)to smooth relative risk, taking into account the variabilityassociated with these factors rather than merely the spatialrelationship among municipal areas. The model took thefollowing form
where: λi is the relative risk in area I; Oi is the number ofdeaths in area I; Ei are the expected cases; βj is the coeffi-cient representing the effect (log(RR)) of the explanatoryvariable J, xji refers to the value of the explanatory variableJ in the area I, hi is the municipal heterogeneity term; andbi is the spatial term.
Models were fitted using Bayesian Markov Chain MonteCarlo simulation methods[21]. Posterior distributions ofRR were obtained using WinBugs[22]. The criterion ofcontiguity used was adjacency. Convergence was verifiedusing the BOA (Bayesian Output Analysis) R programmelibrary[23]. Given the great number of parameters, theconvergence analysis was performed on a randomlyselected sample of 10 towns and cities, taking 4 stratadefined by municipal size. Convergence of the estimatorswas achieved before 100,000 iterations. Risk estimatorswere computed after a "burn-in" (iterations discarded toensure convergence) of 300,000 iterations, based on theposterior distribution observed in the next 5,000 itera-tions.
For comparison purposes, standard Poisson regressionmodels were also fitted, with the three explanatory varia-bles being included to quantify their effect on mortality.Confidence intervals were computed using robust esti-mates of variance[24], as a way of taking overdispersioninto account.
A Geographic Information System was used to plotmunicipal maps that depicted smoothed RR and the dis-
tribution of the posterior probability (pp) that RR>1(Bayesian equivalent to p value). Insofar as this indicatorwas concerned, we followed Richardson's criterion[15],which recommends that probabilities above 0.8 shouldbe deemed significant.
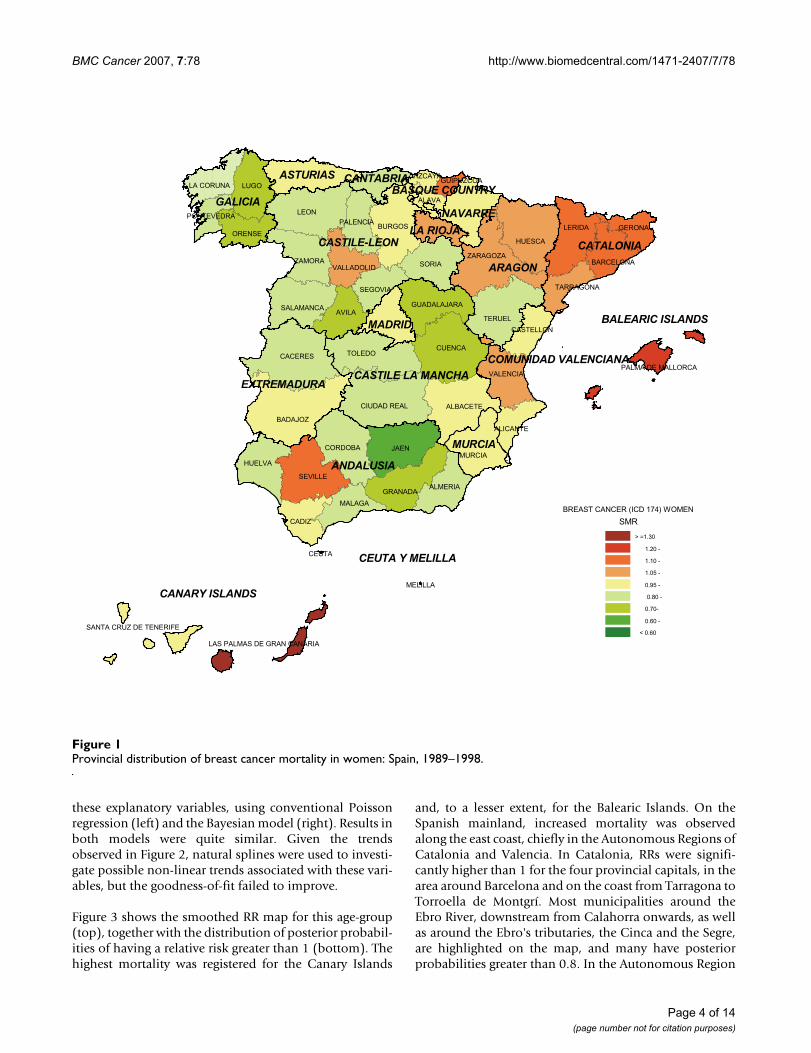
ResultsFrom 1989 to 1998, a total of 56711 breast cancer deathswere registered. Eighty-four percent (47789) corre-sponded to women aged over 49 years, and the remaining8922 to younger women. In 3328 municipalities therewere no deaths due to this cause. Ninety percent of thesevillages had less than 1000 inhabitants and the number ofexpected cases in all of these was lower than 1. Further-more, 3% of the Spanish population lived in municipali-ties that registered no breast cancer deaths during thestudy period. Table 1 displays a number of descriptive sta-tistics, including the distribution of population andexplanatory variables, as well as observed and expectedcases of breast cancer in the two age groups considered.
To give an overall picture, Figure 1 shows breast cancermortality by province. There were only two provinces withSMRs greater than 1.20, namely, Las Palmas in the CanaryIslands (SMR = 1.42), and the Balearic Islands (SMR =1.21). Jaén in Andalusia registered the lowest mortality(SMR = 0.67). SMRs ranging from 0.70 to 0.80 wereobserved in Cuenca and Guadalajara (Castile-La Man-cha), Lugo and Orense (Galicia), Granada (Andalusia)and Avila (Castile-León).
Breast cancer mortality in women 50 and more years old:
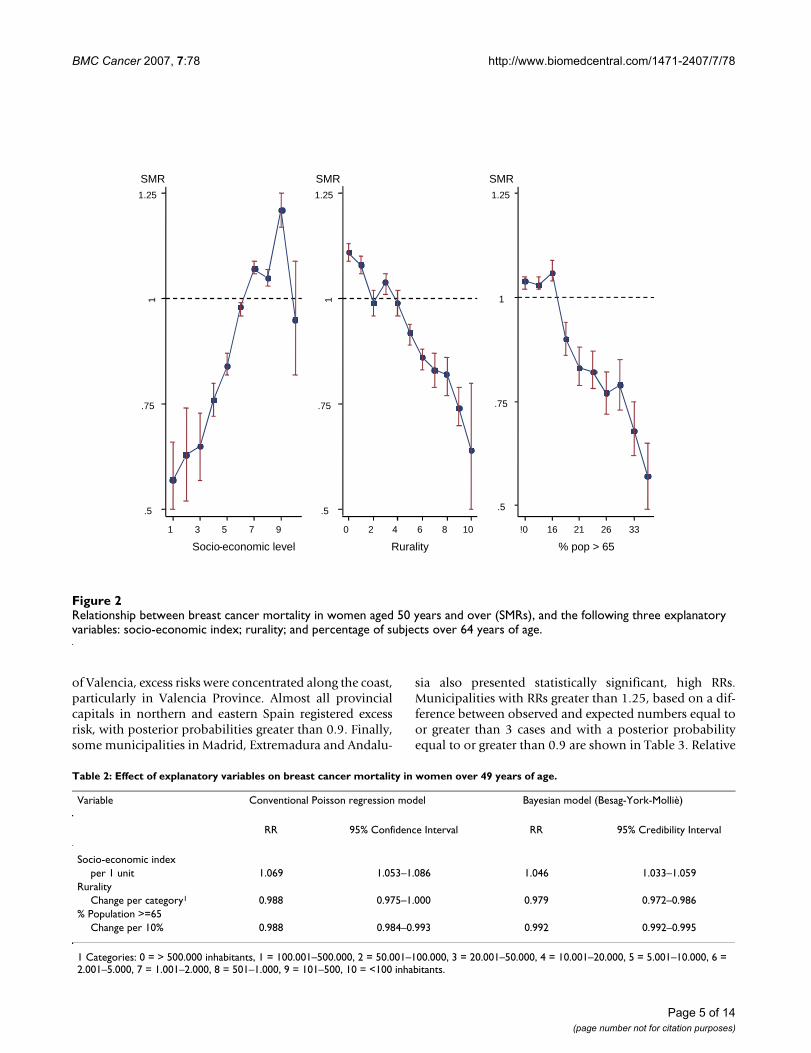
Figure 2 depicts the relationship between breast cancermortality in these women and the three explanatory vari-ables. Breast cancer mortality increased with socio-eco-nomic level, though a sharp drop is observed in thehighest income category. For the other two variables,rurality and percentage of subjects aged over 64 years, adownward trend was observed. Table 2 lists the RR for
O P E
x h bi o i i
i j ji i ij
~ ( )
log( )
λλ α β= + ∗ + +∑
Table 1: Summaries of population, other explanatory variables and breast cancer mortality in 8077 Spanish towns. Spain, 1989–1998.
Total Mean Standard Deviation Median Min Max P5 – P95 No. (%) with zero counts
Population 39648759 4908.9 42430.4 586 5 2866850 63 – 14177 0 (0)Socioeconomic index - 5.23 2.17 5 1 10 1 – 9 0 (0)% Population >=65 - 23.4 9.58 22.3 0 100 10.4 – 40.8 0 (0)Women >=50
Observed breast cancer cases 47789 5.9 65.8 1 0 4283 0 – 16 3522 (43.6)Expected number 47789 5.9 60.9 1.0 0.003 4274.5 0.3 – 16.1 0 (0)SMR 1.00 0.84 2.27 0.53 0 5.85 0.00 – 2.79 3522 (43.6)
Women <50Observed breast cancer cases 8922 1.1 11.2 0 0 718 0 – 4 6237 (77.2)Expected number 8922 1.1 10.5 0.1 0 704.3 0.0 – 3.2 36 (0.5)SMR 1.00 0.98 6.17 0.0 0 333.3 0.00 – 3.52 6237 (77.2)
Page 3 of 14(page number not for citation purposes)
BMC Cancer 2007, 7:78 http://www.biomedcentral.com/1471-2407/7/78
these explanatory variables, using conventional Poissonregression (left) and the Bayesian model (right). Results inboth models were quite similar. Given the trendsobserved in Figure 2, natural splines were used to investi-gate possible non-linear trends associated with these vari-ables, but the goodness-of-fit failed to improve.
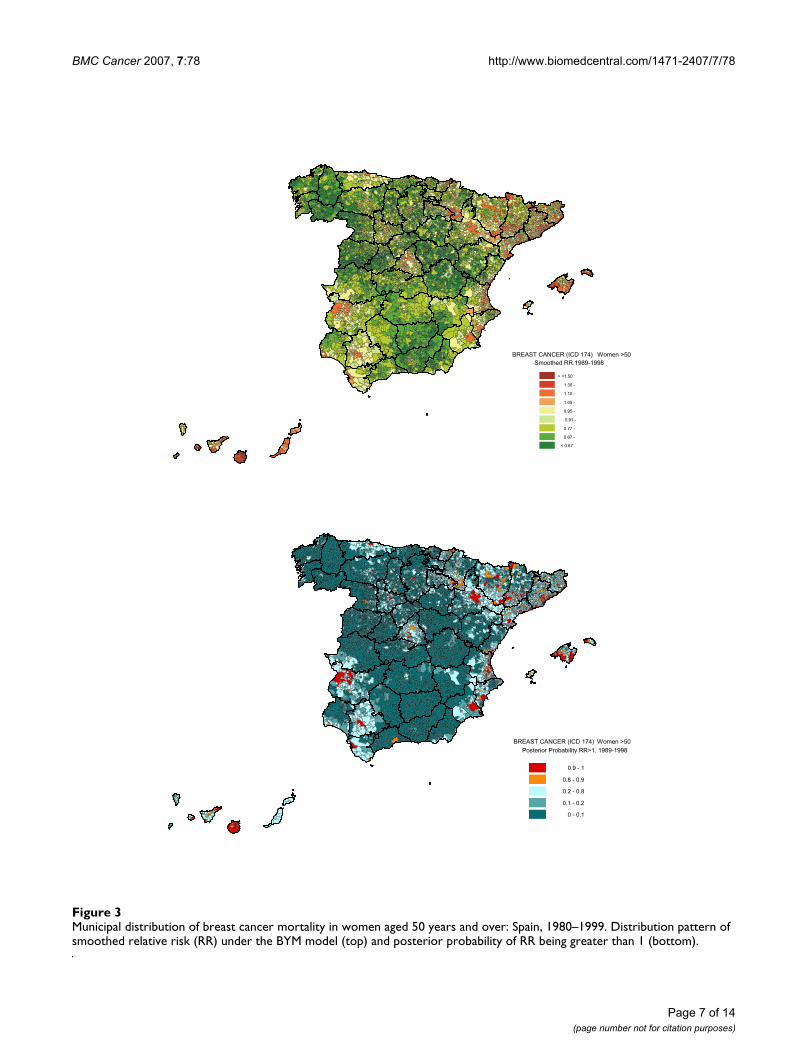
Figure 3 shows the smoothed RR map for this age-group(top), together with the distribution of posterior probabil-ities of having a relative risk greater than 1 (bottom). Thehighest mortality was registered for the Canary Islands
and, to a lesser extent, for the Balearic Islands. On theSpanish mainland, increased mortality was observedalong the east coast, chiefly in the Autonomous Regions ofCatalonia and Valencia. In Catalonia, RRs were signifi-cantly higher than 1 for the four provincial capitals, in thearea around Barcelona and on the coast from Tarragona toTorroella de Montgrí. Most municipalities around theEbro River, downstream from Calahorra onwards, as wellas around the Ebro's tributaries, the Cinca and the Segre,are highlighted on the map, and many have posteriorprobabilities greater than 0.8. In the Autonomous Region
Provincial distribution of breast cancer mortality in women: Spain, 1989–1998Figure 1Provincial distribution of breast cancer mortality in women: Spain, 1989–1998.
�������������������������������������� ��������
������
����������������������������� ��������
�������� ��������
���������� ��������
������ ��������
������ �� �� ��������������
������ ����������������������� ������
������ �� ������������
��� ������
������
� ������� �����
���
!���
����!�"
��������#����
���#�
$#����
�� ���
#%�
��&� �
�����
�����
�#�%��
"���%�"�
��#�������
�#����
� ������
�&� �
�������
%������
$#� &�
����"
"�����
&� �����
�� ������
� �����
�� �%�
������
%#��� �!���
'� �����
��%�&��
�����#��
%�����
&� ��� �� ����� ���
� ������
����� ��
� �&�
�����%���
'����&����
&�"��(�
'� �������� ����
%#�'#"���
��#��
�� � �
���������
��������������
���'� �������%�����������
��������#"����������)�
Page 4 of 14(page number not for citation purposes)
BMC Cancer 2007, 7:78 http://www.biomedcentral.com/1471-2407/7/78
of Valencia, excess risks were concentrated along the coast,particularly in Valencia Province. Almost all provincialcapitals in northern and eastern Spain registered excessrisk, with posterior probabilities greater than 0.9. Finally,some municipalities in Madrid, Extremadura and Andalu-
sia also presented statistically significant, high RRs.Municipalities with RRs greater than 1.25, based on a dif-ference between observed and expected numbers equal toor greater than 3 cases and with a posterior probabilityequal to or greater than 0.9 are shown in Table 3. Relative
Table 2: Effect of explanatory variables on breast cancer mortality in women over 49 years of age.
Variable Conventional Poisson regression model Bayesian model (Besag-York-Molliè)
RR 95% Confidence Interval RR 95% Credibility Interval
Socio-economic indexper 1 unit 1.069 1.053–1.086 1.046 1.033–1.059
RuralityChange per category1 0.988 0.975–1.000 0.979 0.972–0.986
% Population >=65Change per 10% 0.988 0.984–0.993 0.992 0.992–0.995
1 Categories: 0 = > 500.000 inhabitants, 1 = 100.001–500.000, 2 = 50.001–100.000, 3 = 20.001–50.000, 4 = 10.001–20.000, 5 = 5.001–10.000, 6 = 2.001–5.000, 7 = 1.001–2.000, 8 = 501–1.000, 9 = 101–500, 10 = <100 inhabitants.
Relationship between breast cancer mortality in women aged 50 years and over (SMRs), and the following three explanatory variables: socio-economic index; rurality; and percentage of subjects over 64 years of ageFigure 2Relationship between breast cancer mortality in women aged 50 years and over (SMRs), and the following three explanatory variables: socio-economic index; rurality; and percentage of subjects over 64 years of age.
.5
.75
1
1.25
1 3 5 7 9
Socio-economic level
.5
.75
1
1.25
0 2 4 6 8 10
Rurality
.5
.75
1
1.25
!0 16 21 26 33
% pop > 65
SMR SMR SMR
Page 5 of 14(page number not for citation purposes)
BMC Cancer 2007, 7:78 http://www.biomedcentral.com/1471-2407/7/78
risks of over 1.50 were only seen in the Canary Islands.Explanatory variables did not fully account for the excessrisk observed in all these municipalities, since their RRwere substantially higher than the value obtained by onlytaking the linear predictor into account, i.e., the part of themodel that includes the three explanatory variables.
Breast cancer mortality in women younger than 50 years:
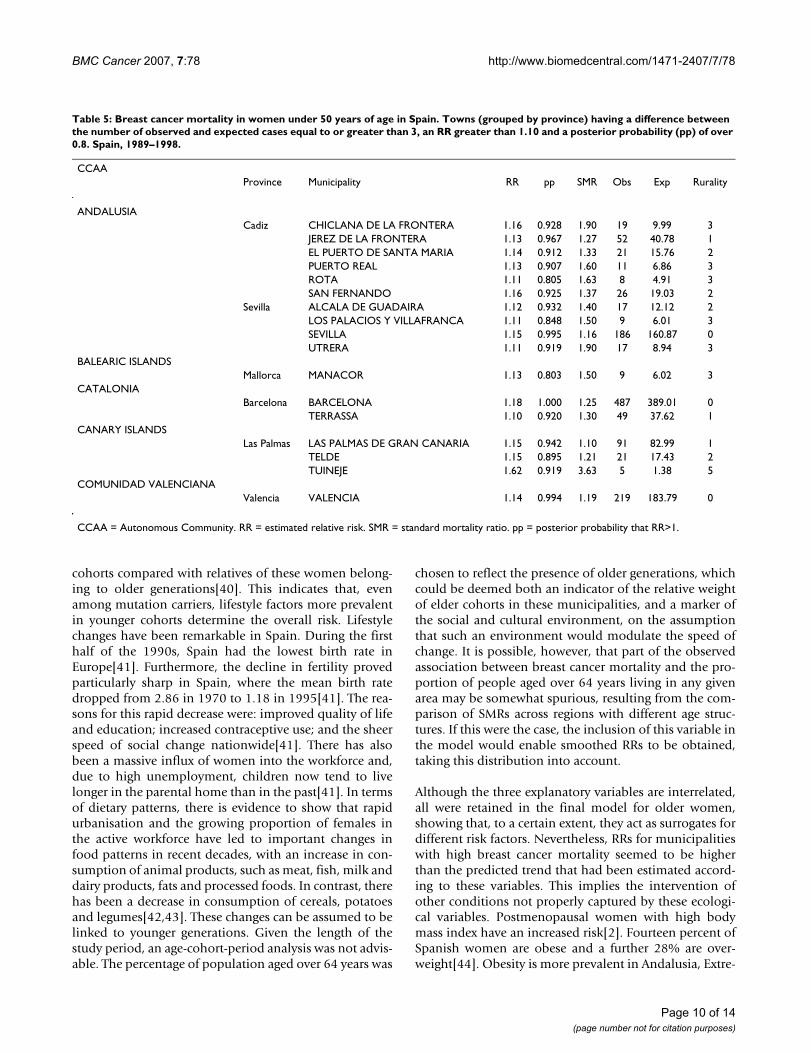
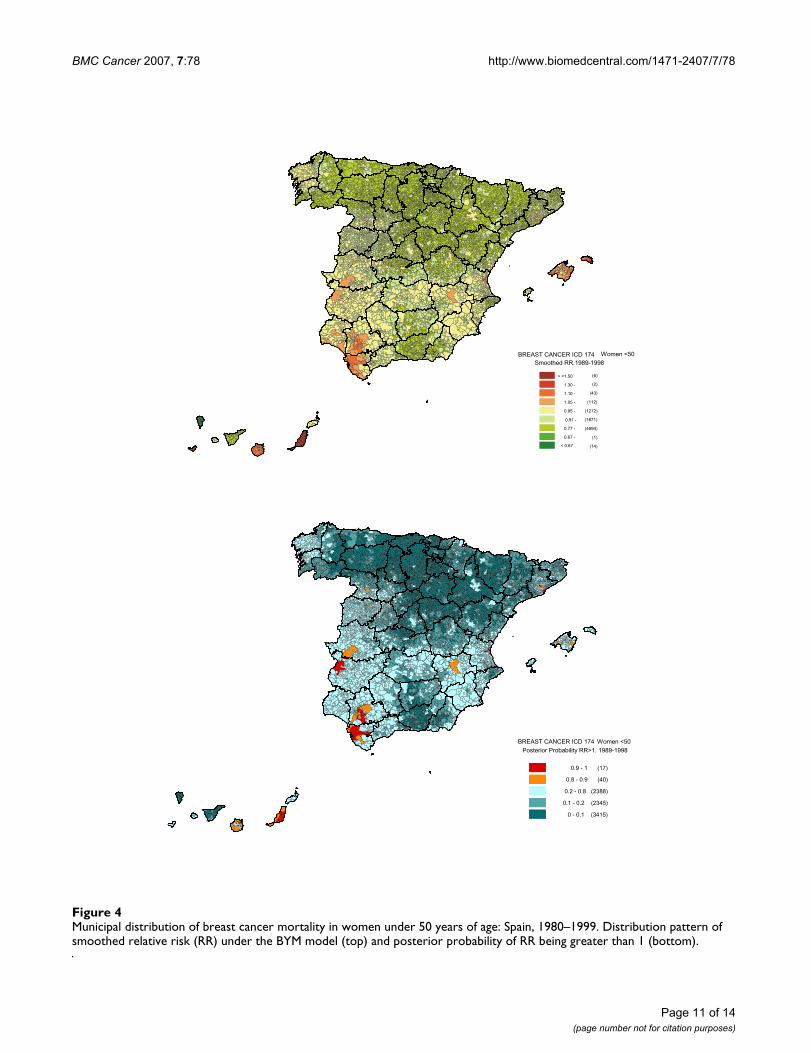
Observed deaths among premenopausal womenaccounted for only 16% of overall breast cancer mortality,and 6237 municipalities registered zero cases (Table 1).While no clear trend was associated with socio-economiclevel or percentage of population above the age of 64,SMRs were inversely associated with rurality (data notshown). This information is summarised by RR estimatorsof these factors (Table 4). As rurality was the only statisti-cally significant variable, the final model only includedthis explanatory term. The geographical pattern (Figure 4)was less marked than in older women, with a somewhatgreater risk in Canary Islands, Balearic Islands, the city ofValencia and south-west Andalusia (Cadiz and Seville). Inthis last-mentioned area, there was a cluster of municipal-ities with higher risk, located near the left bank of theGuadalquivir River, including towns and cities such asJerez de la Frontera, El Puerto de Santa María, Puerto Realand Chiclana in Cadiz, and Utrera, Seville, Alcalá deGuadaira and Dos Hermanas in Seville. Table 5 showsthose municipalities with RRs equal to or greater than1.10, a posterior probability of over 0.80 and a differencebetween observed and expected cases equal to or greaterthan 3.
DiscussionOur results reflect excess breast cancer mortality inwomen aged over 49 years in the Canary Islands, BalearicIslands, Catalonia and Valencia. Furthermore, high signif-icant excess risks were observed in municipalities of LaRioja, Navarre, Aragon and Catalonia around the EbroRiver. Most provincial capitals in the north and east ofSpain displayed increased RR. Lastly, Badajoz, Mérida andAlmendralejo in Extremadura, Seville and Alcalá deGuadaira in the Province of Seville, and Puerto Real andPuerto de Santa María in Cadiz registered high, significantRRs. The geographical pattern in younger womenappeared to be more uniform and no RR over 1.20 werein evidence. The only exception was Tuineje (Las Palmas).On the Spanish mainland, a group of municipalities withhigh RRs were located in two Andalusian provinces, Cadizand Seville, near the Guadalquivir River.
When seeking possible etiological clues, it could beargued that incidence would be more valuable than mor-tality, given that in Spain breast cancer survival rates arequite high, i.e., around 78% at five years[25]. Neverthe-
less, mortality is the only global source of informationavailable in this country. Breast cancer is a well-certifiedcause of death in Spain, with both detection and confir-mation rates exceeding 90%[26]. Incidence rates wouldnot be useful for comparison purposes during the studyperiod, since Spanish Autonomous Regions put theirscreening programmes in place during the 1990s. Screen-ing artificially increases incidence, by advancing diagnosisof very small tumours and including cases that will notprogress[27]. In view of regional differences in the startingpoint of screening programmes around Spain, extractingconclusions based on incidence would be problematic inthis particular period. Mortality rates, on the other hand,are not influenced by such overdiagnosis. Although itwould be interesting to study the influence of screeningprogrammes on breast cancer mortality, the time-framerenders this impossible because, in almost all cases, thefirst round of screening was only completed after 1995 inthe territories in question.
Municipal RRs were estimated, including three ecologicalvariables in the model, namely: the socio-economic indexprovided by the Spanish Credit Bank; the number ofinhabitants categorised by the National Statistics Institute;and the percentage of subjects aged over 64 years. Thesevariables were used as markers of the heterogeneous dis-tribution of lifestyle and reproductive factors influencingbreast cancer frequency. Selection of these variables waslimited by the availability of information at a municipallevel, so they only partially reflect the distribution ofbreast cancer risk factors in Spain. However, their inclu-sion served to smooth relative risks, taking into accountboth the spatial relation among municipalities and thevariability associated with these indices. In the model pro-posed by Besag, York and Molliè, modelling the clusteringvariation allows for unmeasured risk factors that varysmoothly with location. Where the pattern of covariatevariation is similar to that of disease risk, location may actas a confounder[20]. This phenomenon will produce achange in the regression coefficient on introduction of thespatial clustering term. In our study, this location-inducedconfounding effect is small, as can be seen by comparingthe estimated effects yielded by Besag, York and Mollièmodels against those yielded by conventional Poissonregression (see Tables 2 and 4).
Small area analysis tends to reduce ecological fallacy,since the populations defined by municipal boundariesare more homogeneous. This might well be true of villagesand towns of average size. In large cities, however, theresults reported here correspond to an overall mean, andsocio-economic and mortality differences inside citieshave been disregarded. It could be very interesting toassess whether such differences exist in major Spanish cit-ies, such as Madrid, Barcelona, Valencia, Seville and
Page 6 of 14(page number not for citation purposes)
BMC Cancer 2007, 7:78 http://www.biomedcentral.com/1471-2407/7/78
Page 7 of 14(page number not for citation purposes)
Municipal distribution of breast cancer mortality in women aged 50 years and over: Spain, 1980–1999Figure 3Municipal distribution of breast cancer mortality in women aged 50 years and over: Spain, 1980–1999. Distribution pattern of smoothed relative risk (RR) under the BYM model (top) and posterior probability of RR being greater than 1 (bottom).
������������������������������������������������ �����
�����������������������������������
����������������
�������������������������������� ���!����"�#$�%�&$'&#��()&*���+,
"�#$�%�&$'&#��()&*���+, ���!����
BMC Cancer 2007, 7:78 http://www.biomedcentral.com/1471-2407/7/78
Zaragoza. This internal variability could not beenexplored in this paper.
Risk factors for breast cancer may differ for premenopau-sal and postmenopausal cancers [2]. Family history andhereditary susceptibility are particularly relevant for pre-menopausal tumours [28,29], whereas obesity and repro-
ductive behaviour are generally more important inpostmenopausal women. The geographical pattern of pre-menopausal breast cancer was designated as a specificgoal of the study. One third of breast cancer diagnoses inSpain occur in premenopausal women [30] and breastcancer mortality before age 50 may be considered as dueto premenopausal cancers [31]. The geographical distribu-
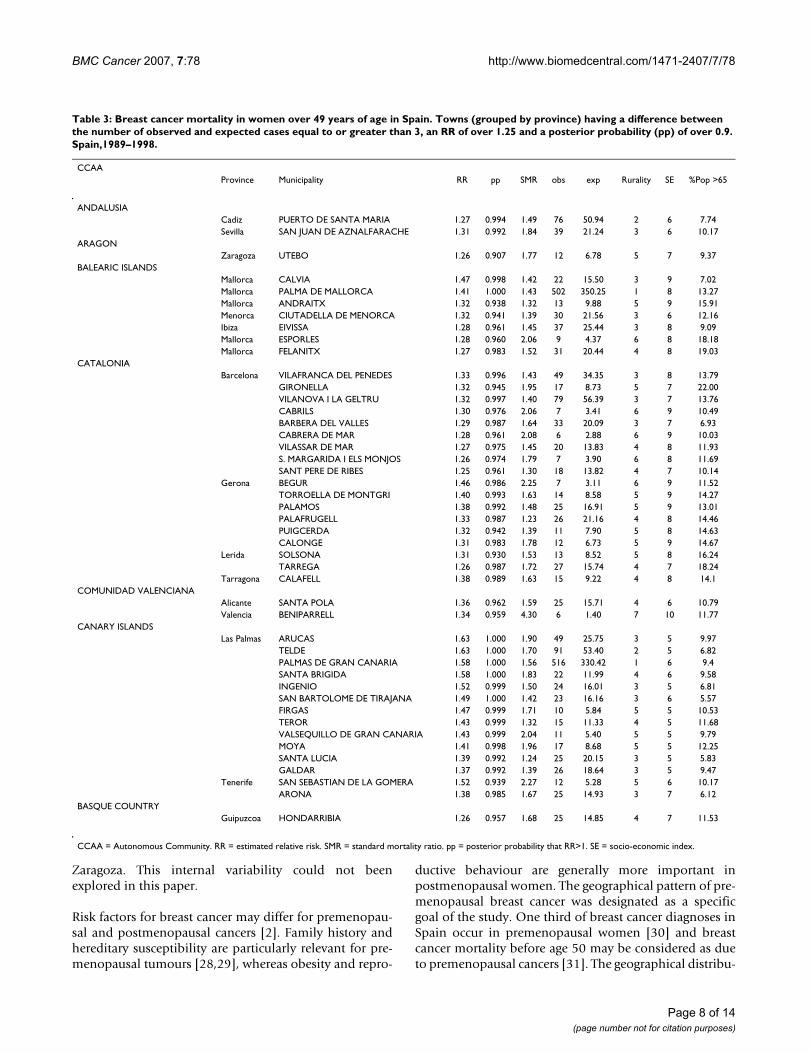
Table 3: Breast cancer mortality in women over 49 years of age in Spain. Towns (grouped by province) having a difference between the number of observed and expected cases equal to or greater than 3, an RR of over 1.25 and a posterior probability (pp) of over 0.9. Spain,1989–1998.
CCAAProvince Municipality RR pp SMR obs exp Rurality SE %Pop >65
ANDALUSIACadiz PUERTO DE SANTA MARIA 1.27 0.994 1.49 76 50.94 2 6 7.74Sevilla SAN JUAN DE AZNALFARACHE 1.31 0.992 1.84 39 21.24 3 6 10.17
ARAGONZaragoza UTEBO 1.26 0.907 1.77 12 6.78 5 7 9.37
BALEARIC ISLANDSMallorca CALVIA 1.47 0.998 1.42 22 15.50 3 9 7.02Mallorca PALMA DE MALLORCA 1.41 1.000 1.43 502 350.25 1 8 13.27Mallorca ANDRAITX 1.32 0.938 1.32 13 9.88 5 9 15.91Menorca CIUTADELLA DE MENORCA 1.32 0.941 1.39 30 21.56 3 6 12.16Ibiza EIVISSA 1.28 0.961 1.45 37 25.44 3 8 9.09Mallorca ESPORLES 1.28 0.960 2.06 9 4.37 6 8 18.18Mallorca FELANITX 1.27 0.983 1.52 31 20.44 4 8 19.03
CATALONIABarcelona VILAFRANCA DEL PENEDES 1.33 0.996 1.43 49 34.35 3 8 13.79
GIRONELLA 1.32 0.945 1.95 17 8.73 5 7 22.00VILANOVA I LA GELTRU 1.32 0.997 1.40 79 56.39 3 7 13.76CABRILS 1.30 0.976 2.06 7 3.41 6 9 10.49BARBERA DEL VALLES 1.29 0.987 1.64 33 20.09 3 7 6.93CABRERA DE MAR 1.28 0.961 2.08 6 2.88 6 9 10.03VILASSAR DE MAR 1.27 0.975 1.45 20 13.83 4 8 11.93S. MARGARIDA I ELS MONJOS 1.26 0.974 1.79 7 3.90 6 8 11.69SANT PERE DE RIBES 1.25 0.961 1.30 18 13.82 4 7 10.14
Gerona BEGUR 1.46 0.986 2.25 7 3.11 6 9 11.52TORROELLA DE MONTGRI 1.40 0.993 1.63 14 8.58 5 9 14.27PALAMOS 1.38 0.992 1.48 25 16.91 5 9 13.01PALAFRUGELL 1.33 0.987 1.23 26 21.16 4 8 14.46PUIGCERDA 1.32 0.942 1.39 11 7.90 5 8 14.63CALONGE 1.31 0.983 1.78 12 6.73 5 9 14.67
Lerida SOLSONA 1.31 0.930 1.53 13 8.52 5 8 16.24TARREGA 1.26 0.987 1.72 27 15.74 4 7 18.24
Tarragona CALAFELL 1.38 0.989 1.63 15 9.22 4 8 14.1COMUNIDAD VALENCIANA
Alicante SANTA POLA 1.36 0.962 1.59 25 15.71 4 6 10.79Valencia BENIPARRELL 1.34 0.959 4.30 6 1.40 7 10 11.77
CANARY ISLANDSLas Palmas ARUCAS 1.63 1.000 1.90 49 25.75 3 5 9.97
TELDE 1.63 1.000 1.70 91 53.40 2 5 6.82PALMAS DE GRAN CANARIA 1.58 1.000 1.56 516 330.42 1 6 9.4SANTA BRIGIDA 1.58 1.000 1.83 22 11.99 4 6 9.58INGENIO 1.52 0.999 1.50 24 16.01 3 5 6.81SAN BARTOLOME DE TIRAJANA 1.49 1.000 1.42 23 16.16 3 6 5.57FIRGAS 1.47 0.999 1.71 10 5.84 5 5 10.53TEROR 1.43 0.999 1.32 15 11.33 4 5 11.68VALSEQUILLO DE GRAN CANARIA 1.43 0.999 2.04 11 5.40 5 5 9.79MOYA 1.41 0.998 1.96 17 8.68 5 5 12.25SANTA LUCIA 1.39 0.992 1.24 25 20.15 3 5 5.83GALDAR 1.37 0.992 1.39 26 18.64 3 5 9.47
Tenerife SAN SEBASTIAN DE LA GOMERA 1.52 0.939 2.27 12 5.28 5 6 10.17ARONA 1.38 0.985 1.67 25 14.93 3 7 6.12
BASQUE COUNTRYGuipuzcoa HONDARRIBIA 1.26 0.957 1.68 25 14.85 4 7 11.53
CCAA = Autonomous Community. RR = estimated relative risk. SMR = standard mortality ratio. pp = posterior probability that RR>1. SE = socio-economic index.
Page 8 of 14(page number not for citation purposes)
BMC Cancer 2007, 7:78 http://www.biomedcentral.com/1471-2407/7/78
tion observed for the younger group, albeit attenuated,was no different to that observed for older women. Themost distinctive result was the higher risk registered insouth-west Andalusia, near the course of the GuadalquivirRiver.
Research indicates that use of well-chosen census tractsocio-economic measures can provide important insightsinto socio-economic disparities in the burden of breastcancer[32]. In our study, using the economic classificationprovided by the Spanish Credit Bank, a positive gradientof mortality was observed. Although socio-economic classis a poorly understood concept that has not been homo-geneously measured[7], a positive association betweenthis factor and breast cancer has consistently beenreported [4-7,9,10]. Socio-economic status can be relatedto environmental exposures and reproductive behaviours(e.g., nulliparity)[7,11]. In terms of mortality, however,greater survival, coupled with higher participation inscreening programmes[32], have been observed in moreaffluent groups[7]. In Europe, the ELDCARE study hasshown a strong correlation between breast cancer survivaland national gross domestic product (correlation coeffi-cient of 0.80) [33]. Spanish survival rates are greater thanthose expected from this correlation, probably reflectinglower inequalities in access to adequate medical serv-ices[33]. Yet women living in most affluent municipalitiesmight receive earlier diagnosis and treatment, and thiswould explain the comparatively lower SMR observed forthe highest socio-economic category (see Figure 2).
Socio-economic level was not associated with breast can-cer mortality in younger women. This result is in agree-ment with the few studies available that looked intochanges in social inequalities in breast cancer mortal-ity[31,34,35]. Social disparities are decreasing morequickly in younger groups[31]. One explanation could bebetter prognosis in young women from affluent areas, due
to their greater awareness and access to medical diagnosis,since these age groups are not included in mass screeningprogrammes. Alternatively, the lack of socio-economicdifferences in younger women may reflect a more uniformpattern vis-à-vis lifestyle factors. Thus, parity hasdecreased in France more markedly among women withlower educational levels[31]. Likewise, in Finland thedecline in educational differences in breast cancer mortal-ity has been associated with changes in reproductivebehaviour and body mass index among less educatedwomen[35].
In our study, breast cancer mortality in both age groupswas higher in more urban areas, which is consistent withthe increased incidence observed in urban settings[8].Lower incidence in rural areas probably reflects differ-ences in education, age at first birth and other breast-can-cer-related factors. On the other hand, when consideringmortality, real differences in incidence may be attenuated,since lower participation rates in screening programmeshave been reported in rural areas[32] and this translates asa lower number of in situ tumours and a higher propor-tion of more advanced stages with increased lethality[36].Rurality was the only explaining factor negatively associ-ated with mortality in women under the age of 50 years,probably indicating that changes in lifestyle risk factorsoccurred earlier in urban areas.
A negative correlation was observed between the percent-age of old population and breast cancer mortality inwomen aged 50 years or over. Birth-cohort trends reflectdemographic patterns that are related to recognised breastcancer risk factors[37]. Age-cohort-period analysis ofbreast cancer mortality across time has consistently showna strong variation associated with the cohort component,in Europe [38] and in Spain[39]. An analysis performedamong carriers of BRCA1 and BRCA2 mutations, showeda greater incidence of breast cancer in younger birth-
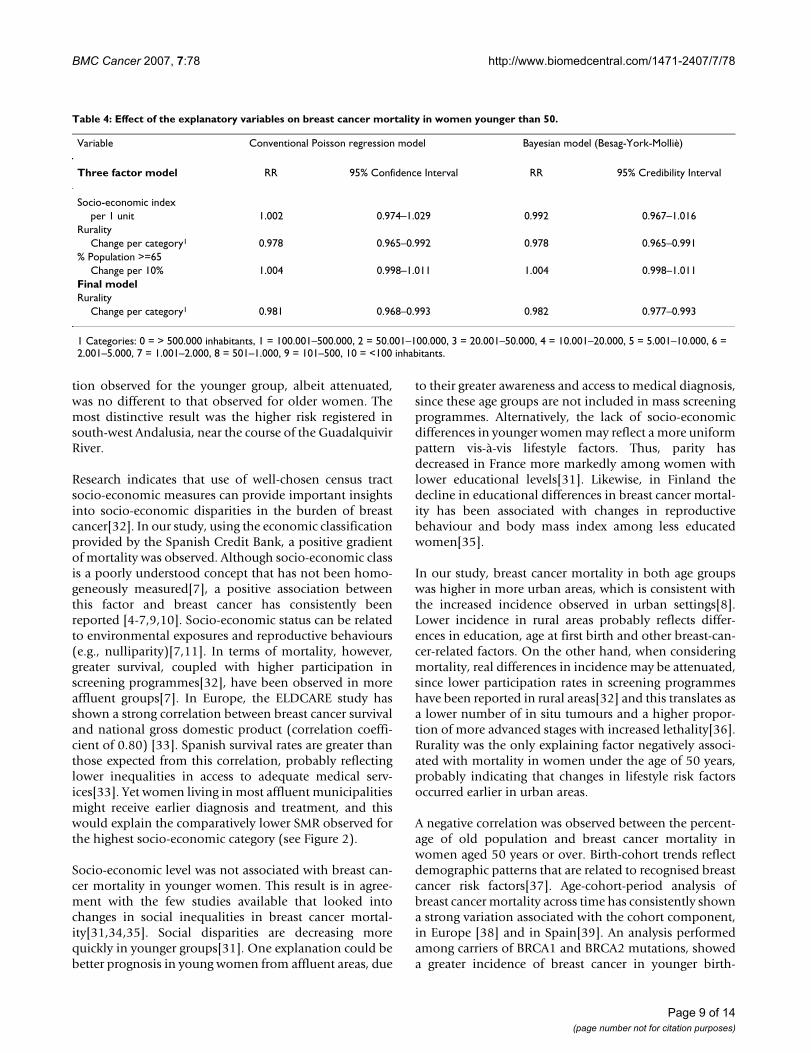
Table 4: Effect of the explanatory variables on breast cancer mortality in women younger than 50.
Variable Conventional Poisson regression model Bayesian model (Besag-York-Molliè)
Three factor model RR 95% Confidence Interval RR 95% Credibility Interval
Socio-economic indexper 1 unit 1.002 0.974–1.029 0.992 0.967–1.016
RuralityChange per category1 0.978 0.965–0.992 0.978 0.965–0.991
% Population >=65Change per 10% 1.004 0.998–1.011 1.004 0.998–1.011
Final modelRurality
Change per category1 0.981 0.968–0.993 0.982 0.977–0.993
1 Categories: 0 = > 500.000 inhabitants, 1 = 100.001–500.000, 2 = 50.001–100.000, 3 = 20.001–50.000, 4 = 10.001–20.000, 5 = 5.001–10.000, 6 = 2.001–5.000, 7 = 1.001–2.000, 8 = 501–1.000, 9 = 101–500, 10 = <100 inhabitants.
Page 9 of 14(page number not for citation purposes)
BMC Cancer 2007, 7:78 http://www.biomedcentral.com/1471-2407/7/78
cohorts compared with relatives of these women belong-ing to older generations[40]. This indicates that, evenamong mutation carriers, lifestyle factors more prevalentin younger cohorts determine the overall risk. Lifestylechanges have been remarkable in Spain. During the firsthalf of the 1990s, Spain had the lowest birth rate inEurope[41]. Furthermore, the decline in fertility provedparticularly sharp in Spain, where the mean birth ratedropped from 2.86 in 1970 to 1.18 in 1995[41]. The rea-sons for this rapid decrease were: improved quality of lifeand education; increased contraceptive use; and the sheerspeed of social change nationwide[41]. There has alsobeen a massive influx of women into the workforce and,due to high unemployment, children now tend to livelonger in the parental home than in the past[41]. In termsof dietary patterns, there is evidence to show that rapidurbanisation and the growing proportion of females inthe active workforce have led to important changes infood patterns in recent decades, with an increase in con-sumption of animal products, such as meat, fish, milk anddairy products, fats and processed foods. In contrast, therehas been a decrease in consumption of cereals, potatoesand legumes[42,43]. These changes can be assumed to belinked to younger generations. Given the length of thestudy period, an age-cohort-period analysis was not advis-able. The percentage of population aged over 64 years was
chosen to reflect the presence of older generations, whichcould be deemed both an indicator of the relative weightof elder cohorts in these municipalities, and a marker ofthe social and cultural environment, on the assumptionthat such an environment would modulate the speed ofchange. It is possible, however, that part of the observedassociation between breast cancer mortality and the pro-portion of people aged over 64 years living in any givenarea may be somewhat spurious, resulting from the com-parison of SMRs across regions with different age struc-tures. If this were the case, the inclusion of this variable inthe model would enable smoothed RRs to be obtained,taking this distribution into account.
Although the three explanatory variables are interrelated,all were retained in the final model for older women,showing that, to a certain extent, they act as surrogates fordifferent risk factors. Nevertheless, RRs for municipalitieswith high breast cancer mortality seemed to be higherthan the predicted trend that had been estimated accord-ing to these variables. This implies the intervention ofother conditions not properly captured by these ecologi-cal variables. Postmenopausal women with high bodymass index have an increased risk[2]. Fourteen percent ofSpanish women are obese and a further 28% are over-weight[44]. Obesity is more prevalent in Andalusia, Extre-
Table 5: Breast cancer mortality in women under 50 years of age in Spain. Towns (grouped by province) having a difference between the number of observed and expected cases equal to or greater than 3, an RR greater than 1.10 and a posterior probability (pp) of over 0.8. Spain, 1989–1998.
CCAAProvince Municipality RR pp SMR Obs Exp Rurality
ANDALUSIACadiz CHICLANA DE LA FRONTERA 1.16 0.928 1.90 19 9.99 3
JEREZ DE LA FRONTERA 1.13 0.967 1.27 52 40.78 1EL PUERTO DE SANTA MARIA 1.14 0.912 1.33 21 15.76 2PUERTO REAL 1.13 0.907 1.60 11 6.86 3ROTA 1.11 0.805 1.63 8 4.91 3SAN FERNANDO 1.16 0.925 1.37 26 19.03 2
Sevilla ALCALA DE GUADAIRA 1.12 0.932 1.40 17 12.12 2LOS PALACIOS Y VILLAFRANCA 1.11 0.848 1.50 9 6.01 3SEVILLA 1.15 0.995 1.16 186 160.87 0UTRERA 1.11 0.919 1.90 17 8.94 3
BALEARIC ISLANDSMallorca MANACOR 1.13 0.803 1.50 9 6.02 3
CATALONIABarcelona BARCELONA 1.18 1.000 1.25 487 389.01 0
TERRASSA 1.10 0.920 1.30 49 37.62 1CANARY ISLANDS
Las Palmas LAS PALMAS DE GRAN CANARIA 1.15 0.942 1.10 91 82.99 1TELDE 1.15 0.895 1.21 21 17.43 2TUINEJE 1.62 0.919 3.63 5 1.38 5
COMUNIDAD VALENCIANAValencia VALENCIA 1.14 0.994 1.19 219 183.79 0
CCAA = Autonomous Community. RR = estimated relative risk. SMR = standard mortality ratio. pp = posterior probability that RR>1.
Page 10 of 14(page number not for citation purposes)
BMC Cancer 2007, 7:78 http://www.biomedcentral.com/1471-2407/7/78
Page 11 of 14(page number not for citation purposes)
Municipal distribution of breast cancer mortality in women under 50 years of age: Spain, 1980–1999Figure 4Municipal distribution of breast cancer mortality in women under 50 years of age: Spain, 1980–1999. Distribution pattern of smoothed relative risk (RR) under the BYM model (top) and posterior probability of RR being greater than 1 (bottom).
������������������������������������������������
�����
�������������������������������������
������������� ��!���"�������� "���!�������"���� "���!
���������� ����!
����������� ��!
#�$��%&�%�#%�'('&)&�*�����������+���,� �����������������������
+���,� ��
��!� �!
� ���! ����!� �"�"!� ��"!
��! "! �!
BMC Cancer 2007, 7:78 http://www.biomedcentral.com/1471-2407/7/78
madura, Castile-La Mancha and the Canary Islands[44].Yet, obesity would not seem to explain the observed geo-graphical pattern. Insofar as nutrition is concerned, overthe past 100 years, the mean age of menarche has declinedfrom 16 to 14 years in all industrialised nations[45,46].This phenomenon has been predominantly attributed toabundant nutrition during childhood[47]. In this regard,the higher risk in the Balearic and Canary Islands can bepartly linked to the higher proportion of European immi-grants who come from countries with higher incidence ofbreast cancer and now live in these regions. These womenhave spent their childhood in areas with higher back-ground rates.
At an individual level, well-established breast-cancer riskfactors account for less than 50% of overall incidence[48].Like most chronic diseases, breast cancer is considered tobe the result of an interaction between genetic and envi-ronmental factors[29,49]. Hereditary susceptibility playsan important role in breast cancer pathogenesis, but time-trends as well as twin-studies suggest that in sporadicbreast cancer, environmental, nutritional and lifestyle fac-tors dominate over genetic predisposition[47,49]. Envi-ronmental factors are believed to account for a largeproportion of cases. Apart from ionising radiation, a well-established risk factor, some chemicals induce mammarycancer in rodents, though evidence in humans is lack-ing[50]. For instance, to show that in rats, cadmium atvery low doses acts as an oestrogen mimic, indicating aneed to investigate the effects of metals on breast cancerrisk[51]. Pesticides are also of interest because manymimic oestrogen or cause mammary tumours in ani-mals[52,53]. The most abundant of these contaminantsare the pesticide, dichloro-diphenyl-trichloroethane(DDT), and polychlorinated biphenyls (PCBs)[50]. Theyare included among persistent organic compounds, giventhat they degrade slowly, bioaccumulate and may befound in human adipose tissue, blood and breast milk.The most prevalent organic compound residues found inhuman tissues are dichlorodiphenyldichloroethane(DDE) -the major metabolite of DDT- and PCBs. Availa-ble epidemiological evidence linking pesticides and breastcancer is considered inadequate[50]. A recent meta-analy-sis concluded that, taken together, available results pro-vide enough evidence to discard a relationship betweenbreast cancer and DDT[54], and organochlorine exposureis not believed to be causally related to breast cancer[55].Nevertheless, these studies provide no information onexposure during critical periods of human development,namely, from conception to adolescence[54]. In Spain,even though DDT was banned in 1977, a recent studyshowed that 99% of the 682 samples collected fromhealthy people in the Canary Islands displayed detectablelevels of some DDT-derivatives[56]. The presence of a veryhigh DDT/DDE ratio indicated chronic exposure to DDT,
which has persisted until now[56]. The highest levels wereseen in Gran Canaria, the island on which the municipal-ities with the highest RR are located. However, given thecurrent state of knowledge, any implication of DDT andDDE levels in the excess mortality observed in GranCanaria is highly speculative.
High breast cancer mortality was also observed along theEbro river in postmenopausal women and near the leftbank of the Guadalquivir River in premenopausalwomen. Both rivers are included among fluvial areas withchemical pollution in Spain[57]. The Ebro river hasreceived a great amount of pollutants, including pesti-cides, hydrocarbons and nitrates[57]. A recent studyshows that organochlorine contaminants continue to beof concern in this area and that, among its degradationproducts, DDT still predominates, indicating recentinputs of this banned substance[58].
ConclusionEven though breast cancer mortality has begun to declinein Spain, a heterogeneous geographical pattern is in evi-dence, with higher rates in the Canary Islands, the BalearicIslands, the Mediterranean coast of Catalonia and Valen-cia, and a series of municipalities around the Ebro River.Among premenopausal women, increased mortality wasalso observed for municipalities located along the lastthird of the Guadalquivir River. As has been previouslyreported in other contexts, mortality rates are positivelyassociated with socio-economic status and negativelyassociated with rurality and the presence of a higher pro-portion of persons over the age of 64 years (born before1931). Taken together, these variables represent the influ-ence of lifestyle factors that have determined the increasein breast cancer frequency over recent decades. On theother hand, the results for the younger group of womenwould suggest an attenuation of the socio-economic gra-dient in breast cancer mortality. The geographical varia-tion mainly suggests the influence of other environmentalvariables, though a heterogeneous distribution of geneticfactors cannot be ruled out. The descriptive nature of thisstudy means, however, that the main determinants of thispattern cannot be ascertained.
AbbreviationsDDE: dichlorodiphenyldichloroethane; DDT: dichlo-rodiphenyltrichloroethane; ICD-9: international classifi-cation of diseases, 9th revision; PCBs: polychlorinatedbiphenyls; RR: relative risk; SMR: standardised mortalityratio.
Competing interestsThe author(s) declare that they have no competing inter-ests.
Page 12 of 14(page number not for citation purposes)
BMC Cancer 2007, 7:78 http://www.biomedcentral.com/1471-2407/7/78
Authors' contributionsMP, GLA, NA, and BPG were all involved in designing thestudy. GLA, RR & MP performed the statistical analysis.DG draw the maps using GIS software. VL & JGP reviewedthe information about possible pollutant sources in theareas with high RR, JMC & MJG reviewed the socio-eco-nomic index used in this study and the abundant litera-ture on this issue. MP wrote the draft of the manuscript towhich all authors subsequently contributed. All authorsmade contribution to statistical analyses and interpreta-tion of results, and revised the manuscript for importantintellectual content. All authors read and approved thefinal manuscript.
AcknowledgementsThis study was funded by Grant No. EPY-1176/02 from the Carlos III Insti-tute of Health (Instituto de Salud Carlos III – ISCIII) and the Consortium for Biomedical Research in Epidemiology & Public Health (CIBERESP). The authors would like to thank Michael Benedict for his help with the English and Maria José Sánchez del Corral for her assistance with the bibliographic material.
References1. Ferlay J, Bray F, Pisani P, Parkin DM: GLOBOCAN 2002: Cancer Inci-
dence, Mortality and Prevalence Worldwide. [IARC CancerBase No. 5. ver-sion 2.0,] Lyon, IARC Press; 2004. Ref Type: Electronic Citation.
2. Dumitrescu RG, Cotarla I: Understanding breast cancer risk –where do we stand in 2005? J Cell Mol Med 2005, 9:208-221.
3. Parkin DM: International variation. Oncogene 2004,23:6329-6340.
4. Faggiano F, Partanen T, Kogevinas M, Boffetta P: Socioeconomic differ-ences in cancer incidence and mortality IARC Sci Publ; 1997:65-176.
5. Heck KE, Wagener DK, Schatzkin A, Devesa SS, Breen N: Socioeco-nomic status and breast cancer mortality, 1989 through1993: An analysis of education data from death certificates.American Journal of Public Health 1997, 87:1218-1222.
6. Dano H, Andersen O, Ewertz M, Petersen JH, Lynge E: Socioeco-nomic status and breast cancer in Denmark. International Jour-nal of Epidemiology 2003, 32:218-224.
7. Baquet CR, Commiskey P: Socioeconomic factors and breastcarcinoma in multicultural women. Cancer 2000, 88:1256-1264.
8. Robert SA, Strombom I, Trentham-Dietz A, Hampton JM, McElroy JA,Newcomb PA, et al.: Socioeconomic risk factors for breast can-cer – Distinguishing individual- and community-level effects.Epidemiology 2004, 15:442-450.
9. Pollan M, Gustavsson P: High-risk occupations for breast cancerin the Swedish female working population. American Journal ofPublic Health 1999, 89:875-881.
10. Sarfati D, Blakely T, Shaw C, Cormack D, Atkinson J: Patterns ofdisparity: ethnic and socio-economic trends in breast cancermortality in New Zealand. Cancer Causes Control 2006,17:671-678.
11. dos Santos I, Beral V: Socioeconomic differences in reproductive behaviourIARC Sci Publ; 1997:285-308.
12. Heck KE, Pamuk ER: Explaining the relation between educationand postmenopausal breast cancer. American Journal of Epidemi-ology 1997, 145:366-372.
13. Dunnell K, Bunting J, Wood R, Babb P: Measuring aspects ofwomen's life and work for the study of variations in health.American Journal of Industrial Medicine 1999, 36:25-33.
14. Lopez-Abente G, Pollan M, Escolar A, Errezola M, Abraira V: Atlas ofcancer mortality and other causes of death in Spain, 1978–1992 2nd edi-tion. Instituto de Salud Carlos III; 2001.
15. Richardson S, Thomson A, Best N, Elliott P: Interpreting posteriorrelative risk estimates in disease-mapping studies. Environ-mental Health Perspectives 2004, 112:1016-1025.
16. Banco Español de Credito: Anuario del Mercado Español Madrid: BancoEspañol de Credito; 1993.
17. Breslow NE, Day NE: Statistical methods in cancer research. The designand analysis of cohort studies Volume II. Lyon: IARC; 1987.
18. Clayton D, Kaldor J: Empirical Bayes Estimates of Age-Stand-ardized Relative Risks for Use in Disease Mapping. Biometrics1987, 43:671-681.
19. Besag J, York J, Mollie A: Bayesian Image-Restoration, with 2Applications in Spatial Statistics. Annals of the Institute of Statisti-cal Mathematics 1991, 43:1-20.
20. Clayton DG, Bernardinelli L, Montomoli C: Spatial Correlation inEcological Analysis. International Journal of Epidemiology 1993,22:1193-1202.
21. Gilks W, Richardson S, Spiegelhalter D: Markov Chain Montecarlo inpractise. Interdisciplinary statistics Boca Raton, Florida: Chapman & Hall/CRC; 1995.
22. Spiegelhalter D, Thomas A, Best N: WinBUGS user manual. Versioin1.4.1 Cambridge: MRC; 2003. Ref Type: Computer Program
23. Smith BJ: Bayesian Output Analysis Program (BOA), Version 0.99.1 for S-Plus and R 2001. Ref Type: internet communication.
24. Hardin J, Hilbe J: Generalized Linear Models and extensions Texas: StataPress; 2001.
25. Sant M, Aareleid T, Berrino F, Bielska Lasota M, Carli PM, Faivre J, etal.: EUROCARE-3: survival of cancer patients diagnosed1990–94 – results and commentary. Annals of Oncology 2003,14:61-118.
26. Perez-Gomez B, Aragones N, Pollan M, Suarez B, Lope V, Llacer A, etal.: Accuracy of cancer death certificates in Spain: A sum-mary of available information. Gaceta Sanitaria 2006, 20(Supl.3):42-51.
27. Zahl PH, Strand H, Maehlen J: Incidence of breast cancer in Nor-way and Sweden during introduction of nationwide screen-ing: prospective cohort study. British Medical Journal 2004,328:921-924.
28. Anderson DE: Familial Versus Sporadic Breast-Cancer. Cancer1992, 70:1740-1746.
29. Risch N: The genetic epidemiology of cancer: Interpretingfamily and twin studies and their implications for moleculargenetic approaches. Cancer Epidemiology Biomarkers & Prevention2001, 10:733-741.
30. Martin M, Llombart-Cussac A, Lluch A, Alba E, Munarriz B, TusquetsI, et al.: Epidemiological study of the GEICAM group aboutbreast cancer in Spain (1990–1993): El Alamo project. Medic-ina Clinica 2004, 122:12-17.
31. Menvielle G, Leclerc A, Chastang JF, Luce D: Social inequalities inbreast cancer mortality among French women: disappearingeducational disparities from 1968 to 1996. Br J Cancer 2006,94:152-155.
32. Bigby J, Holmes MD: Disparities across the breast cancer con-tinuum. Cancer Causes Control 2005, 16:35-44.
33. Quaglia A, Vercelli M, Lillini R, Mugno E, Coebergh JW, Quinn M, etal.: Socio-economic factors and health care system charac-teristics related to cancer survival in the elderly. A popula-tion-based analysis in 16 European countries (ELDCAREproject). Crit Rev Oncol Hematol 2005, 54:117-128.
34. Wagener DK, Schatzkin A: Temporal Trends in the Socioeco-nomic Gradient for Breast-Cancer Mortality Among UsWomen. American Journal of Public Health 1994, 84:1003-1006.
35. Martikainen P, Valkonen T: Diminishing educational differencesin breast cancer mortality among Finnish women: a register-based 25-year follow-up. Am J Public Health 2000, 90:277-280.
36. Schootman M, Fuortes LJ: Breast and cervical carcinoma: thecorrelation of activity limitations and rurality with screening,disease incidence, and mortality. Cancer 1999, 86:1087-1094.
37. Lacey JV Jr, Devesa SS, Brinton LA: Recent trends in breast can-cer incidence and mortality. Environ Mol Mutagen 2002, 39:82-88.
38. La Vecchia C, Negri E, Levi F, Decarli A: Age, cohort-of-birth, andperiod-of-death trends in breast cancer mortality in Europe.J Natl Cancer Inst 1997, 89:732-734.
39. Lopez-Abente G, Pollan M, Aragones N, Perez-Gomez B, Llacer A,Perez J, et al.: Tendencias de la mortalidad en España, 1952–1996 Efectode la edad, de la cohorte de nacimiento y del periodo de muerte Madrid:Instituto de Salud Carlos III; 2002.
40. King MC, Marks JH, Mandell JB: Breast and ovarian cancer risksdue to inherited mutations in BRCA1 and BRCA2. Science2003, 302:643-646.
41. Bosch X: Investigating the reasons for Spain's falling birthrate. Lancet 1998, 352:887.
Page 13 of 14(page number not for citation purposes)
http://www.ncbi.nlm.nih.gov/entrez/query.fcgi?cmd=Retrieve&db=PubMed&dopt=Abstract&list_uids=9240118
http://www.ncbi.nlm.nih.gov/entrez/query.fcgi?cmd=Retrieve&db=PubMed&dopt=Abstract&list_uids=9240118
http://www.ncbi.nlm.nih.gov/entrez/query.fcgi?cmd=Retrieve&db=PubMed&dopt=Abstract&list_uids=9054241
http://www.ncbi.nlm.nih.gov/entrez/query.fcgi?cmd=Retrieve&db=PubMed&dopt=Abstract&list_uids=9054241
http://www.ncbi.nlm.nih.gov/entrez/query.fcgi?cmd=Retrieve&db=PubMed&dopt=Abstract&list_uids=3663823
http://www.ncbi.nlm.nih.gov/entrez/query.fcgi?cmd=Retrieve&db=PubMed&dopt=Abstract&list_uids=3663823
http://www.ncbi.nlm.nih.gov/entrez/query.fcgi?cmd=Retrieve&db=PubMed&dopt=Abstract&list_uids=8144305
http://www.ncbi.nlm.nih.gov/entrez/query.fcgi?cmd=Retrieve&db=PubMed&dopt=Abstract&list_uids=8144305
http://www.ncbi.nlm.nih.gov/entrez/query.fcgi?cmd=Retrieve&db=PubMed&dopt=Abstract&list_uids=1516029
http://www.ncbi.nlm.nih.gov/entrez/query.fcgi?cmd=Retrieve&db=PubMed&dopt=Abstract&list_uids=8203664
http://www.ncbi.nlm.nih.gov/entrez/query.fcgi?cmd=Retrieve&db=PubMed&dopt=Abstract&list_uids=8203664
http://www.ncbi.nlm.nih.gov/entrez/query.fcgi?cmd=Retrieve&db=PubMed&dopt=Abstract&list_uids=8203664
http://www.ncbi.nlm.nih.gov/entrez/query.fcgi?cmd=Retrieve&db=PubMed&dopt=Abstract&list_uids=9168190
http://www.ncbi.nlm.nih.gov/entrez/query.fcgi?cmd=Retrieve&db=PubMed&dopt=Abstract&list_uids=9168190
BMC Cancer 2007, 7:78 http://www.biomedcentral.com/1471-2407/7/78
Publish with BioMed Central and every scientist can read your work free of charge
"BioMed Central will be the most significant development for disseminating the results of biomedical research in our lifetime."
Sir Paul Nurse, Cancer Research UK
Your research papers will be:
available free of charge to the entire biomedical community
peer reviewed and published immediately upon acceptance
cited in PubMed and archived on PubMed Central
yours — you keep the copyright
Submit your manuscript here:http://www.biomedcentral.com/info/publishing_adv.asp
BioMedcentral
42. Serra-Majem L, Ribas L, Lloveras G, Salleras L: Changing patternsof fat consumption in Spain. Eur J Clin Nutr 1993, 47(Suppl1):S13-S20.
43. Aranceta J: Spanish food patterns. Public Health Nutr 2001,4:1399-1402.
44. Ministerio de Sanidad: Encuesta Nacional de Salud 2003 2003 [http://www.ine.es/inebase/menu3_soc.htm#3]. Instituto Nacional de Esta-distica Ref. Type: Electronic Citation
45. Merzenich H, Boeing H, Wahrendorf J: Dietary-Fat and SportsActivity As Determinants for Age at Menarche. American Jour-nal of Epidemiology 1993, 138:217-224.
46. Stoll BA: Western diet, early puberty, and breast cancer risk.Breast Cancer Research and Treatment 1998, 49:187-193.
47. Gerber B, Muller H, Reimer T, Krause A, Friese K: Nutrition andlifestyle factors on the risk of developing breast cancer.Breast Cancer Res Treat 2003, 79:265-276.
48. Madigan MP, Ziegler RG, Benichou J, Byrne C, Hoover RN: Propor-tion of Breast-Cancer Cases in the United-States Explainedby Well-Established Risk-Factors. Journal of the National CancerInstitute 1995, 87:1681-1685.
49. Lichtenstein P, Holm NV, Verkasalo PK, Iliadou A, Kaprio J, Kosken-vuo M, et al.: Environmental and heritable factors in the cau-sation of cancer – Analyses of cohorts of twins from Sweden,Denmark, and Finland. New England Journal of Medicine 2000,343:78-85.
50. Coyle YM: The effect of environment on breast cancer risk.Breast Cancer Res Treat 2004, 84:273-288.
51. Johnson MD, Kenney N, Stoica A, Hilakivi-Clarke L, Singh B, ChepkoG, et al.: Cadmium mimics the in vivo effects of estrogen inthe uterus and mammary gland. Nature Medicine 2003,9:1081-1084.
52. Soto AM, Sonnenschein C, Chung KL, Fernandez MF, Olea N, Ser-rano FO: The E-Screen Assay As A Tool to Identify Estrogens– An Update on Estrogenic Environmental-Pollutants. Envi-ronmental Health Perspectives 1995, 103:113-122.
53. Gammon DW, Aldous CN, Carr WC, Sanborn JR, Pfeifer KF: A riskassessment of atrazine use in California: human health andecological aspects. Pest Management Science 2005, 61:331-355.
54. Lopez-Cervantes M, Torres-Sanchez L, Tobias A, Lopez-Carrillo L:Dichlorodiphenyldichloroethane burden and breast cancerrisk: A meta-analysis of the epidemiologic evidence. Environ-mental Health Perspectives 2004, 112:207-214.
55. Calle EE, Frumkin H, Henley SJ, Savitz DA, Thun MJ: Organochlo-rines and breast cancer risk. Ca-A Cancer Journal for Clinicians2002, 52:301-309.
56. Zumbado M, Goethals M, Alvarez-Leon EE, Luzardo OP, Cabrera F,Serra-Majem L, et al.: Inadvertent exposure to organochlorinepesticides DDT and derivatives in people from the CanaryIslands (Spain). Science of the Total Environment 2005, 339:49-62.
57. Barea J, de Armas H, Caballero MJ, Carrasco JF, Colmenarejo P, Gar-cia L, et al.: La calidad de las aguas en España. Un estudio por cuencas[http://www.greenpeace.org/espana/reports/agua-la-calidad-de-las-aguas]. 10-25-2005. Greenpeace. Ref Type: Electronic Citation
58. Gomez-Gutierrez AI, Jover E, Bodineau L, Albaiges J, Bayona JM:Organic contaminant loads into the Western MediterraneanSea: Estimate of Ebro River inputs. Chemosphere 2006 in press.
Pre-publication historyThe pre-publication history for this paper can be accessedhere:
http://www.biomedcentral.com/1471-2407/7/78/prepub
Page 14 of 14(page number not for citation purposes)
http://www.ncbi.nlm.nih.gov/entrez/query.fcgi?cmd=Retrieve&db=PubMed&dopt=Abstract&list_uids=8269893
http://www.ncbi.nlm.nih.gov/entrez/query.fcgi?cmd=Retrieve&db=PubMed&dopt=Abstract&list_uids=8269893
http://www.ncbi.nlm.nih.gov/entrez/query.fcgi?cmd=Retrieve&db=PubMed&dopt=Abstract&list_uids=8356963
http://www.ncbi.nlm.nih.gov/entrez/query.fcgi?cmd=Retrieve&db=PubMed&dopt=Abstract&list_uids=8356963
http://www.ncbi.nlm.nih.gov/entrez/query.fcgi?cmd=Retrieve&db=PubMed&dopt=Abstract&list_uids=7473816
http://www.ncbi.nlm.nih.gov/entrez/query.fcgi?cmd=Retrieve&db=PubMed&dopt=Abstract&list_uids=7473816
http://www.ncbi.nlm.nih.gov/entrez/query.fcgi?cmd=Retrieve&db=PubMed&dopt=Abstract&list_uids=7473816
http://www.ncbi.nlm.nih.gov/entrez/query.fcgi?cmd=Retrieve&db=PubMed&dopt=Abstract&list_uids=8593856
Related Documents


![Effect of radiotherapy after breast-conserving surgery on ... · Radiotherapy reduced the annual breast cancer mortality rate by one‐sixth (RR=0.82 [0.75, 0.90]). The timing of](https://static.cupdf.com/doc/110x72/5f025ab17e708231d403db86/effect-of-radiotherapy-after-breast-conserving-surgery-on-radiotherapy-reduced.jpg)