Munich Personal RePEc Archive Globalized Banking Sectors: Features and Policy Implications amidst Global Uncertainties Reza Siregar The ASEAN+3 Macroeconomic Research Office 10. January 2013 Online at http://mpra.ub.uni-muenchen.de/43709/ MPRA Paper No. 43709, posted 11. January 2013 14:44 UTC

Welcome message from author
This document is posted to help you gain knowledge. Please leave a comment to let me know what you think about it! Share it to your friends and learn new things together.
Transcript

MPRAMunich Personal RePEc Archive
Globalized Banking Sectors: Featuresand Policy Implications amidst GlobalUncertainties
Reza Siregar
The ASEAN+3 Macroeconomic Research Office
10. January 2013
Online at http://mpra.ub.uni-muenchen.de/43709/MPRA Paper No. 43709, posted 11. January 2013 14:44 UTC

Globalized Banking Sectors:
Features and Policy Implications amidst Global Uncertainties
Reza Siregar
The ASEAN+3 Macroeconomic Research Office (AMRO)
Version: January 2013
Abstract
Amidst the global financial uncertainties since 2007, the East and Southeast Asian economies continued to attract a significant bulk of the global banks’ loans to emerging markets, albeit at a decelerating rate. The alleged advantages of these lending are well-known. Yet the recent interruption to this spectacular rise in international bank lending during the 2007/2008 global financial crisis serves as a stark reminder that international bank lending can rapidly transmit adverse shocks from developed markets to emerging markets. The objective of this study is to identify key features and characteristics of foreign banks’ activities in East and Southeast Asian economies, particularly during the post 2007 global financial crisis period, and to weigh their implications on the local economies, including policy challenges for the central banks and banking supervisors in the region.
JEL Classification: C23, F34, F36, G15 and N25
Key Words: Foreign Banks, Interconnectedness, Financial Stability, Branch, Subsidiary, Financial Crisis
*/The early draft of this paper was presented at the “SEACEN-CeMCoA/BOJ High-Level Seminar on Finding Asia's New Sustainable Growth Model Post GFC: The Role of the Central Banks”, November 2012 in Kuala Lumpur. Comments and suggestions from the participants are greatly acknowledged and appreciated. Views expressed in this study, however, are of the author’s own alone and do not necessarily represent those of the ASEAN+3 Macroeconomic Research Office (AMRO) and its management.

1. Intro
remarka
From th
markets
Amidst
continu
albeit a
times in
America
respect
Source
Source
1 The ASE
1,
2,
3,
4,
5,
6,
Dev
oduction
One notab
able rise in
he first half
s increased
the global f
ed to attra
at a deceler
nternationa
a and Carib
tively (Figur
: Cetorelli a
: BIS datab
EAN+3 include
0
,000,000
,000,000
,000,000
,000,000
,000,000
,000,000
2005‐Q1
2005Q2
veloping Europe
ble tradema
n cross-bor
of 2006 to t
d from abo
financial un
ct a signific
rating rate1.
l bank lend
bbean, and
re 2).
Figur
and Goldber
ase
es the ASEAN‐
2005‐Q2
2005‐Q3
2005‐Q4
2006‐Q1
2006‐Q2
Developing
Figure 2: Tot
ark of fina
rder bankin
the first half
out USD200
ncertainties
cant portion
These eco
ding reporte
Africa and t
re 1: Capita
rg (2009)
‐10 economie
2006‐Q3
2006‐Q4
2007‐Q1
2007‐Q2
g Latin America &
tal Foreign C
ncial globa
g linkages,
f of 2007, to
0 billion to
since 2007
n of the glo
onomies in
ed by the
the Middle
al Flows to
es, China (inclu
2007‐Q3
2007‐Q4
2008‐Q1
2008‐Q2
& Caribbean
Claims from
alisation in
, especially
otal loans of
o more tha
7, the ASEA
obal banks
average att
emerging m
East during
o the Emerg
uding Hong Ko
2008‐Q3
2008‐Q4
2009‐Q1
2009‐Q2
2009Q3
Developing Afric
BIS Reportin
recent ye
y between e
f the global
n USD500
AN+3 (excl.
’ loans to
tracted abo
markets of
g each quar
ging marke
ong), Japan, K
2009‐Q3
2009‐Q4
2010‐Q1
2010‐Q2
2010‐Q3
ca & Middle East
ng Institution
ars has be
emerging m
banks to e
billion (Fig
Japan) eco
emerging m
out 1.4, 1.6
the Europ
rter of 2010
ets
Korea and Sing
2010Q3
2010‐Q4
2011‐Q1
2011‐Q2
2011‐Q3
ASEAN+3 e
ns (USD mn)
1
een the
markets.
merging
gure 1).
onomies
markets,
and 3.2
pe, Latin
– 2011,
gapore.
2011‐Q4
2012‐Q1
excl. Japan
)

2
The alleged advantages of opening the local financial markets to the foreign banks
are well-known. Under the presence of foreign banks, emerging markets have benefitted
from efficiency gains manifested in the form of greater variety in financial services and lower
prices; transfer and spill-over of knowledge and technical know-how as well as greater
availability of funding most especially to credit-constrained firms and households. Foreign
bank lending has also been found to be more stable during the past economic and financial
crises originated from the emerging markets.
Yet the sudden interruption to this spectacular rise in international bank lending
during the recent 2007/2008 global financial crisis serves as a stark reminder that
international bank lending can rapidly transmit adverse shocks from developed markets to
emerging markets. Compared to long-term equity flows such as foreign direct investment
(FDI), cross-border bank-intermediated capital flows, being a form of short-term debt capital
flow, may potentially pose more risk to the recipient economy if not properly managed. The
risk exposure may be magnified if the bank loan is in foreign currency and hence subject to
currency mismatch in the borrowing economies, as was reported during the Asian financial
crisis in the late 1990s.
The objective of this study is to identify a number of specific features and
characteristics of foreign banks’ activities in East and Southeast Asian economies, and to
weigh their implications on the local economies, including policy challenges to the central
banks and banking supervisors of the region. While many studies have been carried out on
these topics, a few have so far focused on these economies.2 The road map of the paper is
as follows. Section 2 of the paper presents a brief overview of the banking sector landscape
in the ASEAN+3 economies. Next, Section 3 of the study reviews the literature to take stock
of factors driving the international bank lending into various Asian economies. Section 4
dwells into core financial stability implications of the foreign bank activities on the domestic
economies. Lastly, Section 5 reviews a number of topical debated policy issues, especially in
the area of central banking. A brief concluding remark section (Section 6) ends the study.
2. A Brief Overview of Banking Sector Landscape in ASEAN+3 Economies
Despite their various stages of financial development, banks still, in general, play a
dominant role in the financial intermediation in most of the ASEAN+3 economies. Advanced
economies in the region, namely Japan, Hong Kong and Singapore exhibit the highest level
of banking sector asset in terms of GDP at more than 200 percent (Figure 3). For
2 Among the recent works on the global banking and implications on the East and Southeast Asian economies are Siregar and Choy (2010) and Pontines and Siregar (2012).

internat
sector
econom
growing
heavily
Malaysi
sector a
emergin
Philippi
private
Source:
remain
other e
centre
3 This is would al
tional finan
partly reflec
mies project
g economie
on bank c
ia, Thailand
around or
ng econom
nes, with a
sector of 25
F
CEIC datab
Foreign ba
modest in o
economy in
countries,
the general llow foreign b
cial centres
cts a large
t a mixed p
s in the AS
credit to ch
d and Vietn
above 100
mies, such
average ban
5.2 percent
igure 3: Ke
ase and Ann
anks are do
others. With
the ASEA
such as
situation as banks to ente
s such as
e amount o
picture in te
EAN+3 reg
hannel sav
am, which
percent of
as Brunei,
nking secto
to GDP.
ey Stylized
nual Reports
ominant in a
h the excep
AN+3 regio
Brunei an
of the end 20er Myanmar.
Hong Kong
f offshore f
erms of the
ion have bu
ings to inv
all have ba
f GDP. Yet
, Cambodia
or asset of
Facts of th
of the Centr
a few ASEA
ption of Mya
n3. Their p
nd Cambod
011. The lift .
g and Sing
financial ac
banking se
uilt fairly lar
vestments.
anking secto
t, banking s
a, Indones
56.7 perce
he ASEAN+
ral Banks
AN+3 econ
anmar, forei
presence is
dia, where
of sanctions
apore, the
ctivities. In
ector develo
ge banking
These inclu
or assets a
sector is st
ia, Lao PD
nt to GDP
+3 Banking
omies, but
gn banks a
s large in s
e they out
on Myanma
oversized
general, e
opment. So
sectors, an
ude China,
and credit to
till modest
DR, Myanm
and bank c
g Sectors
their partic
are present
some non-f
tnumber th
ar since early
3
banking
merging
ome fast
nd relied
, Korea,
o private
in other
mar and
credit to
cipations
in every
financial
he local
y 2012

4
competitors. Foreign banks represent an important share in a few other economies, such as
Malaysia and Korea, where they account for around 20 percent of the market. For the rest of
the non-financial centre economies, the overall foreign banks’ presence is relatively modest,
with usually less than 15 percent of the total assets, and their share in deposit and loans
could be even lower. For the largest economies in the region (China and Japan), foreign
banks remain small compared to their domestic counterparts at lower than 4 percent of the
total banking sector. Foreign banks are usually competing in the same business areas as the
domestic banks, although depending on the country they are subject to different levels of
restrictions regarding ownership structure and range of business.
Major foreign banks in the region have diversified origins and lend to all segments of
the markets. Some large global banks, such as Citi Group, Bank of America, JP Morgan,
Mitsubishi UFJ, Mizuho, HSBC, Standard Chartered, Deutsche Bank, Royal Bank of
Scotland, BNP Paribas, ANZ, etc., all have representations in the region. Regional banks
have also become major players in the region, such as CIMB, DBS, OCBC, UOB, Bank of
China, Bangkok Bank, Maybank, etc. As in other emerging markets of the world, the foreign
bank’s presence in the region is either in the form of subsidiary or branch (Table 1). With the
exception of Malaysia, most of the ASEAN+3 economies authorize the establishment of both
subsidiary and branch in their territories. Between 2010 and 2011, the non-bank private
sector has been the largest recipient of the global bank lending to the region, absorbing in
average around 46.5 percent of total lending, followed by public (27.6 percent) and banking
sectors (25.7 percent) (Figure 4).
Table 1: Status of Selected Foreign Banks in ASEAN+3 Economies
Malaysia
HSBC Bank Malaysia Berhad Subsidiary
Standard Chartered Bank Malaysia Berhad Subsidiary
Deutsche Bank (Malaysia) Bhd. Subsidiary
Bank of Tokyo-Mitsubishi UFJ (Malaysia) Berhad Subsidiary
Citibank Malaysia (L) Ltd Subsidiary
Indonesia
PT Bank ANZ Indonesia Subsidiary
PT Bank Mizuho Indonesia Subsidiary
Bank BNP Paribas Indonesia PT Subsidiary
Citibank Branch
Deutsche Bank Branch
HSBC Branch
Standard Chartered Branch

5
Korea
Standard Chartered Bank Korea Limited Subsidiary
Citibank Korea Inc. Subsidiary
Philippines
Hongkong and Shanghai Banking Corp Ltd Branch
Bank of Tokyo - Mitsubishi UFJ Ltd Branch
Citibank Savings Inc Subsidiary
United Overseas Bank Philippines Subsidiary
Thailand
United Overseas Bank (Thai) PCL Subsidiary
Standard Chartered Bank (Thai) Public Company Limited Subsidiary CIMB Thai Bank Public Company Limited Subsidiary
Source: Annual reports and Bank-scope database
Source: BIS database
3. Determinant Factors of Global Bank Lending: A Brief Overview
Studies have been carried out to ascertain push and pull factors behind the global
bank lending outside of their home countries. Only a few have however focused on the Asian
emerging markets. In their recent study, Pontines and Siregar (2011) highlighted several
fundamental determinant factors of bank lending from three major advanced economies,
namely Japan, the UK and the US to a number of Asian economies, such as Indonesia,
Korea, Malaysia, and the Philippines. To start, the real GDP growth rates of the home
(Japan, UK and US) and host Asian economies have, indeed, been an important factor. In
particular, the pro-cyclicality of these flows, i.e., better (worse) economic conditions in the
host (home) economies leads to greater (less) bank flows into some of these Asian
economies. This was evident in late 2008 and early 2009, following the collapse of the
Lehman-Brothers, as demonstrated by the UK banks’ lending to the world (Figure 5).
0
500,000
1,000,000
1,500,000
2,000,000
2,500,000
3,000,000
3,500,000
Banks Public sector Non-bank private sector Foreign claims
Figure 4: Foreign Claims on ASEAN+3 (in USD mn)

6
Figure 5: Pro-cyclicality of International Lending of UK Banks and GDP Growth Rate
Source: BIS database and AMRO Staff Calculation
The short-term uncertainties and volatilities of the global economies, captured by the
widely used S&P 100 Volatility Index of the Chicago Board Options Exchange for instance,
are found to have adverse impacts on the flows of international bank lending into the East
Asian region. This finding strongly suggests that global/external factors have a role to play in
determining bank flows from developed to emerging economies. The balance of the
evidence also appears to suggest that greater exposure on the part of major foreign banks in
these Asian economies fulfil a stabilizing or crisis-mitigating role of international bank lending
during periods of financial distress such as that of the 1997 East Asian financial crisis.
However, the opposite case is found during the recent subprime crisis. In short, the impacts
and roles of international bank lending in the local economy can be a double-edged sword.
In good times, the flows contribute positively to the financing of economic activities.
However, during times of uncertainties in the local and external markets, international bank
lending can amplify the severity of volatilities and hence the vulnerability risks of the local
economy.
Another determinant of the lending of the international banks is bilateral trade
activities between home and host economies. This is particularly evident for instance in the
case of early expansion of the Japanese banks to the East Asian markets, as found in
Siregar and Choy (2010). The same study also found political stability, legal and
bureaucratic quality have become increasingly important considerations for the expansion of
global bank lending to East Asia following the 1997 East Asian crisis. Distance plays a role
as well in various regions of the world. In particular, multinational banks place priority in
expanding their activities into their close neighbours in the early stage cross-border
endeavours. Lastly, the strength and soundness of these international banks’ balance
sheets have also been found to influence their capacities and willingness to loan. This
‐9.0
‐6.0
‐3.0
0.0
3.0
6.0
9.0
12.0
15.0
‐30.00
‐20.00
‐10.00
0.00
10.00
20.00
30.00
40.00
50.00UK, claims (% yoy) UK (GDP, % yoy), rhs

7
aspect of balance sheet particularly focuses on asset/capital size, solvency, liquidity and
profitability.
4. Financial Stability Implications
Financial stability is receiving increased attention in both policy making and academic
settings, as concerted efforts are made to draw lessons from the recent global financial
crisis. The challenge of incorporating the lessons of the crisis is however increasingly more
difficult, in part, because there is no one clear definition of financial stability (and instability).
From a more focused point of view shared by many central banks, including those in
ASEAN+3 economies, financial stability describes the condition where the financial
intermediation process functions smoothly and there is confidence in the operation of key
financial institutions and markets within the economy. Others take a slightly broader
perspective of financial stability that encompasses monetary stability, asset price stability
and growth stability (Foot (2003)). Financial stability should reflect the ability of the financial
system to consistently supply the credit intermediation and payment services that are
needed in the real economy if it is to continue on its growth (Rosengren (2011)). The next
sub-sections examine a number of frequently debated financial stability consequences of
foreign bank’s activities on the host economies, particularly the ASEAN+3 economies.
4.1 Lending Activities
4.1.1 Global Banks
The recent global financial crisis provides a rather unique opportunity to assess the
lending performance of the global banks during the period in which financial turbulence
originated from the developed economies, home of the major banks of the world. In the past,
global bank lending had been demonstrably more resilient and better prepared to handle
shocks originating from emerging markets. The emerging trends from the 2007/2008 global
financial crisis and the European sovereign debt crisis painted a contrasting picture.
Claessens and van Horen (2012) study over 3615 banks in 118 countries (of which 1198
foreign banks) covering the period of 2005-2009. They find conclusive evidence that foreign
banks reduced lending more compared to their domestic counterparts in 2009. A quick
glimpse of a number of ASEAN+3 economies supports the findings of Claessens and van
Horen (2012). The foreign banks’ gross lending in the Philippines for instance grew by 1.1
percent in 2009 and -10 percent in 2011, significantly lower than 4.6 percent in 2009 and
18.8 percent in 2011 for the whole banking system. Major European branches and
subsidiaries in selected ASEAN economies saw their lending to contract and to become

8
more volatile during the period of 2008-2011 (Table 2). Nonetheless, the major local banks
continued to support their lending growths during those turbulent years.4
Table 2: The Loan Growth of Selected Foreign and Local Banks in ASEAN+3 Economies
(in %) 2008 2009 2010 2011
Indonesia
Bank Mandiri (Persero) Tbk 25.96 13.78 24 27.69
Bank Rakyat Indonesia (Persero) Tbk 41.36 29.18 21.62 16.35
Bank BNP Paribas Indonesia PT 58.17 -91.55 226.37 n.a.
Malaysia
Malayan Banking Berhad - Maybank 16.04 12.97 10.29 22.47
CIMB Bank Berhad 17.8 17.18 9.15 11.87
HSBC Bank Malaysia Berhad 14.39 -3.3 18.74 14.68
Deutsche Bank (Malaysia) Bhd 35.52 -18.84 -4.31 8.83
Citibank (Malaysia) Bhd -2.95 -6.44 4.51 4.29
Thailand
Bangkok Bank Public Company Limited 13.34 -3.31 9.89 17.14
Kasikornbank Public Company Limited 18.56 4.3 14.19 12.48
Standard Chartered Bank (Thai) PCL 13.42 -7.29 18.51 2.74 Source: Bankscope database and AMRO Staff Calculation
Due to the need to shore-up capital and mitigate funding strains, European banks
have been under heavy pressure to promptly trim down their balance-sheets. In its report,
the IMF projected banks in the European Union would undergo a USD2.6 trillion
deleveraging in 2013 and 2014 (WEO (2012)). Moreover, massive bank bailouts using tax
payer funds during the 2008 global financial crisis have pressured banks to focus more on
domestic lending activities and prune back on activities abroad. Consequently, economies
that were highly exposed to the cross-border lending activities of these Eurozone banks
have had to bear the consequences of recent deleveraging efforts. While the ASEAN+3
economies (excluding Japan) attracted only around 15 percent of the total foreign claims of
the Eurozone banks to the emerging markets of the Europe, Latin American and ASEAN+3
(Figure 6), these economies endured the steepest rates of drops of the Eurozone loans
during the final two quarters of last year. The total foreign claims of the Eurozone banks to
the ASEAN+3 economies contracted quarter on quarter by an average of 10.5 percent
during the second half of 2011, compared to about 4.5 percent for Latin American and
Caribbean (LATAM) economies and 6.8 percent for the developing European economies.
4 Given the limited publically available balance sheet data on individual major bank, this assessment should only be an indicative and may not be conclusive.
9
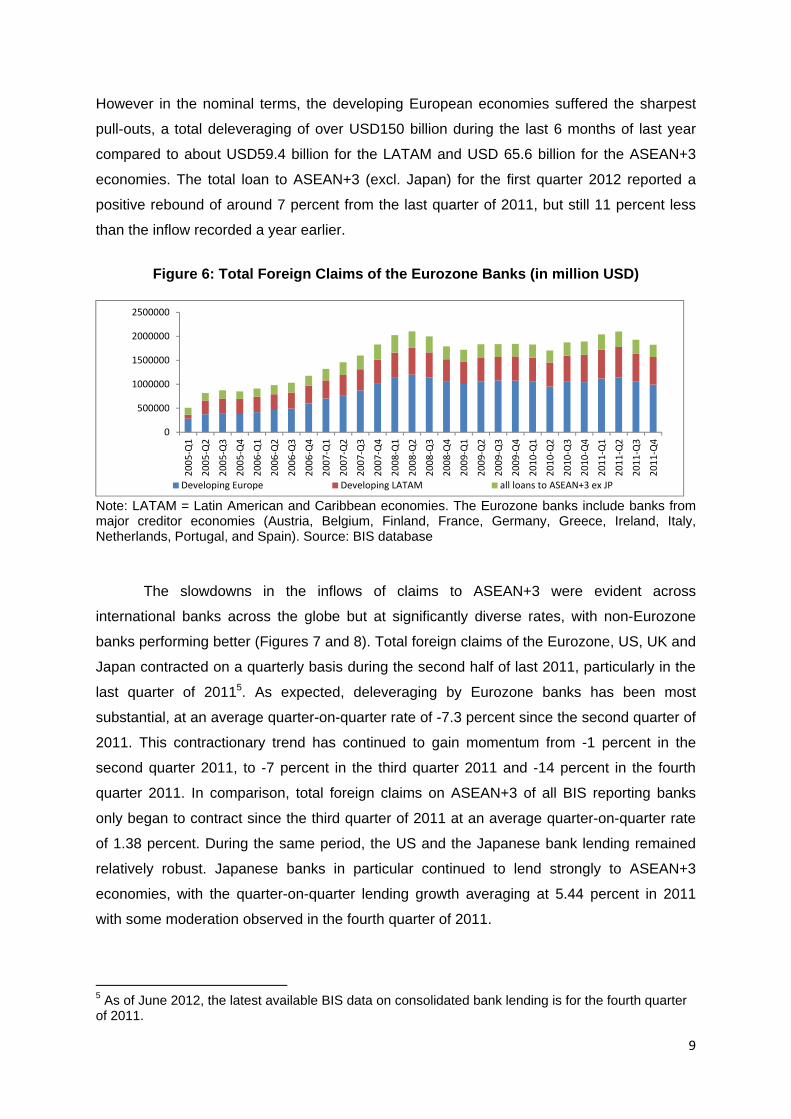
However in the nominal terms, the developing European economies suffered the sharpest
pull-outs, a total deleveraging of over USD150 billion during the last 6 months of last year
compared to about USD59.4 billion for the LATAM and USD 65.6 billion for the ASEAN+3
economies. The total loan to ASEAN+3 (excl. Japan) for the first quarter 2012 reported a
positive rebound of around 7 percent from the last quarter of 2011, but still 11 percent less
than the inflow recorded a year earlier.
Figure 6: Total Foreign Claims of the Eurozone Banks (in million USD)
Note: LATAM = Latin American and Caribbean economies. The Eurozone banks include banks from major creditor economies (Austria, Belgium, Finland, France, Germany, Greece, Ireland, Italy, Netherlands, Portugal, and Spain). Source: BIS database
The slowdowns in the inflows of claims to ASEAN+3 were evident across
international banks across the globe but at significantly diverse rates, with non-Eurozone
banks performing better (Figures 7 and 8). Total foreign claims of the Eurozone, US, UK and
Japan contracted on a quarterly basis during the second half of last 2011, particularly in the
last quarter of 20115. As expected, deleveraging by Eurozone banks has been most
substantial, at an average quarter-on-quarter rate of -7.3 percent since the second quarter of
2011. This contractionary trend has continued to gain momentum from -1 percent in the
second quarter 2011, to -7 percent in the third quarter 2011 and -14 percent in the fourth
quarter 2011. In comparison, total foreign claims on ASEAN+3 of all BIS reporting banks
only began to contract since the third quarter of 2011 at an average quarter-on-quarter rate
of 1.38 percent. During the same period, the US and the Japanese bank lending remained
relatively robust. Japanese banks in particular continued to lend strongly to ASEAN+3
economies, with the quarter-on-quarter lending growth averaging at 5.44 percent in 2011
with some moderation observed in the fourth quarter of 2011.
5 As of June 2012, the latest available BIS data on consolidated bank lending is for the fourth quarter of 2011.
0
500000
1000000
1500000
2000000
2500000
2005‐Q1
2005‐Q2
2005‐Q3
2005‐Q4
2006‐Q1
2006‐Q2
2006‐Q3
2006‐Q4
2007‐Q1
2007‐Q2
2007‐Q3
2007‐Q4
2008‐Q1
2008‐Q2
2008‐Q3
2008‐Q4
2009‐Q1
2009‐Q2
2009‐Q3
2009‐Q4
2010‐Q1
2010‐Q2
2010‐Q3
2010‐Q4
2011‐Q1
2011‐Q2
2011‐Q3
2011‐Q4
Developing Europe Developing LATAM all loans to ASEAN+3 ex JP

10
Source: BIS database
Source: BIS database
Furthermore, the largest recipients of the global bank loans endured the sharpest
sudden reversals of the flows. The plus-3 economies (China, Korea and Japan) and the
financial markets of the region (Hong Kong and Singapore) attracted on averages of nearly
60 percent and 30 percent of total foreign claims to the ASEAN+3 economies in 2011,
respectively (Table 3). Yet, the same two groups of economies endured the sharpest
slowdowns of international bank lending, especially from the Eurozone banks (Figure 9). The
plus-3 economies reported a quarter-on-quarter pull-out of foreign claims of the Eurozone
banks on the average of 11 percent per quarter within the last two quarters of 2011,
compared to 9.9 percent for Hong Kong and Singapore, 8.5 percent for ASEAN-5
(Indonesia, Malaysia, Philippines, Thailand and Vietnam) and 6 percent for BCLM (Brunei,
Cambodia, Laos and Myanmar). The decline in UK bank lending to the region follows a
similar trend. It is interesting to note however that the lending of the Japanese and the US
‐15
‐10
‐5
0
5
10
15
2010‐Q1 2010‐Q2 2010‐Q3 2010‐Q4 2011‐Q1 2011‐Q2 2011‐Q3 2011‐Q4 2012‐Q1All Reporting Countries Eurozone United States United Kingdom Japan
Figure 7: Growth of foreign bank claims to ASEAN+3 economies (%, q/q)
‐20.00
‐10.00
0.00
10.00
20.00
30.00
40.00
2010‐Q1 2010‐Q2 2010‐Q3 2010‐Q4 2011‐Q1 2011‐Q2 2011‐Q3 2011‐Q4 2012‐Q1
All Reporting Countries Eurozone United States United Kingdom Japan
Figure 8: Growth of foreign bank claims to ASEAN+3 economies (%, y/y)

11
banks to the plus-3 economies continued to be robust in the second half of 2011. In
particular the Japanese banks have continued to expand their foreign lending to China and
Korea at an average quarter-on-quarter rate of 7.1 percent during the final two quarters of
last year.
Table 3: Foreign Claims Shares
Source: BIS database
2007 2008 2009 2010 2011‐Q1 2011‐Q2 2011‐Q3 2011‐Q4 2012‐Q1
2012‐Q1
(% share)
Total ASEAN+3 2,080.55 1,922.99 2,172.81 2,598.38 2,729.00 2,859.45 2,867.10 2,803.76 2,905.66 100.000
Japan 778.45 714.06 769.48 857.59 793.79 808.94 832.28 815.79 833.27 28.677
Hong Kong SAR 331.70 342.80 397.79 481.79 519.77 539.62 547.60 532.46 541.50 18.636
China 214.07 175.81 236.77 356.37 425.11 478.14 487.93 474.29 497.80 17.132
South Korea 331.21 272.94 303.10 318.43 338.00 348.38 318.48 318.10 330.69 11.381
Singapore 191.46 187.74 212.20 261.58 292.39 310.30 312.25 298.71 318.02 10.945
Malaysia 104.25 98.81 103.55 125.42 139.37 145.48 140.16 144.33 151.91 5.228
Indonesia 46.72 47.86 54.52 74.41 84.06 88.45 87.78 88.29 89.94 3.095
Thailand 44.89 46.52 56.72 73.42 82.69 84.37 83.49 75.69 85.36 2.938
Philippines 23.32 21.37 23.53 30.34 32.44 32.67 34.04 32.04 31.94 1.099
Vietnam 11.49 11.48 12.45 15.81 16.90 18.40 18.42 18.99 20.13 0.693
Brunei 1.71 2.11 2.03 2.40 3.71 3.67 3.89 4.08 4.01 0.138
Myanmar 0.85 1.00 0.23 0.23 0.24 0.24 0.24 0.34 0.43 0.015
Laos 0.37 0.36 0.29 0.33 0.35 0.37 0.34 0.36 0.35 0.012
Cambodia 0.07 0.13 0.17 0.25 0.19 0.43 0.21 0.29 0.32 0.011
Foreign claims on ASEAN+3 countries (USD bn, ultimate risk basis)

12
Figure 9: Growths of Foreign Claims to ASEAN+3 Economies
Source: BIS database and AMRO Staff Calculation
‐40
‐30
‐20
‐10
0
10
20
30
40
50
2006
‐Q1
2006
‐Q3
2007
‐Q1
2007
‐Q3
2008
‐Q1
2008
‐Q3
2009
‐Q1
2009
‐Q3
2010
‐Q1
2010
‐Q3
2011
‐Q1
2011
‐Q3
2012
‐Q1
Eurozone to ASEAN‐5
Eurozone to HK & SIN
Eurozone to Plus‐3(excl. HK)
Eurozone Banks' Foreign Claims (% y/y growth)
‐25
‐20
‐15
‐10
‐5
0
5
10
15
20
25
2006
‐Q1
2006
‐Q3
2007
‐Q1
2007
‐Q3
2008
‐Q1
2008
‐Q3
2009
‐Q1
2009
‐Q3
2010
‐Q1
2010
‐Q3
2011
‐Q1
2011
‐Q3
2012
‐Q1
Eurozone to ASEAN‐5
Eurozone to HK & SIN
Eurozone to Plus‐3 (excl.HK)
Eurozone Banks' Foreign Claims (% q/q growth)
‐40
‐30
‐20
‐10
0
10
20
30
40
50
60
70
2006‐Q1
2006‐Q3
2007‐Q1
2007‐Q3
2008‐Q1
2008‐Q3
2009‐Q1
2009‐Q3
2010‐Q1
2010‐Q3
2011‐Q1
2011‐Q3
2012‐Q1
United Kingdom toASEAN‐5
United Kingdom toHK&SIN
United Kingdom toPlus‐3 (excl. HK)
UK Banks' Foreign Claims (% y/y growth)
‐15
‐10
‐5
0
5
10
15
20
25
United Kingdom toASEAN‐5
United Kingdom toHK&SIN
United Kingdom to Plus‐3 (excl. HK)
UK Banks' Foreign Claims (% m/m growth)
‐20
0
20
40
60
80
100
120
140
2006
‐Q1
2006
‐Q3
2007
‐Q1
2007
‐Q3
2008
‐Q1
2008
‐Q3
2009
‐Q1
2009
‐Q3
2010
‐Q1
2010
‐Q3
2011
‐Q1
2011
‐Q3
2012
‐Q1
United States toASEAN‐5
United States to HK &SIN
United States to Plus‐3(excl. HK)
US Banks' Foreign Claims (% y/y growth)
‐40
‐20
0
20
40
60
80
100
2006‐Q1
2006‐Q3
2007‐Q1
2007‐Q3
2008‐Q1
2008‐Q3
2009‐Q1
2009‐Q3
2010‐Q1
2010‐Q3
2011‐Q1
2011‐Q3
2012‐Q1
United States to ASEAN‐5
United States to HK &SIN
United States to Plus‐3(excl. HK)
US Banks' Foreign Claims (% m/m growth)
‐20
‐10
0
10
20
30
40
50
60
2006‐Q1
2006‐Q3
2007‐Q1
2007‐Q3
2008‐Q1
2008‐Q3
2009‐Q1
2009‐Q3
2010‐Q1
2010‐Q3
2011‐Q1
2011‐Q3
2012‐Q1
Japan to ASEAN‐5
Japan to HK & SIN
Japan to Plus‐3 (excl.Japan & HK)
Japanese Banks' Foreign Claims (% y/y growth)
‐15
‐10
‐5
0
5
10
15
20
25
2006‐Q1
2006‐Q3
2007‐Q1
2007‐Q3
2008‐Q1
2008‐Q3
2009‐Q1
2009‐Q3
2010‐Q1
2010‐Q3
2011‐Q1
2011‐Q3
2012‐Q1
Japan to ASEAN‐5
Japan to HK & SIN
Japan to Plus‐3 (excl.Japan & HK)
Japanese Banks' Foreign Claims (% m/m growth)

13
The high exposure to ASEAN+3 economies through cross-border lending partially
explains relatively large cutbacks in the international bank lending to the region.6 Further
investigation into the composition of total foreign claims of global banks into the ASEAN+3
region shows that a significant share of total claims (around 40 percent) has been in the form
of cross-border lending (Figure 10). This is in sharp contrast to the situation in Latin
American countries where local lending of international banks proportionally larger than their
cross-border lending. For Indonesia, China, Philippines and the CLMV economies
(Cambodia, Laos, Myanmar and Vietnam), the share of cross-border lending out of overall
foreign claims are well above 50 percent. This is considerably higher than the 17 to 27
percent share of cross-border lending activities for Eurozone claims in major Latin American
economies, such as Argentina, Brazil and Mexico. As demonstrated in selected ASEAN+3
economies’ experiences (Figure 11), the growths of cross-border lending have largely been
more volatile and often experienced sudden and sharper withdrawals than the local lending.
At the height of the Lehman Brothers crisis, the total cross-border lending to ASEAN+3
region plummeted by more than -15 percent in the second quarter of 2009 from the same
quarter a year earlier, while the local claims of these banks in the region continued to
expand robustly at above 33 percent for the same period.
Figure 10: Shares of Cross Border Claims and Local Claims at the End 2011
Source: BIS database and AMRO Staff Calculation
6 Total foreign claims of global banks can be decomposed into two parts. The first part is the local lending component which is lending carried out by local subsidiaries or branches of a particular global bank, using funding generated from the local economy. The second component is the cross-border lending which are sourced from the external network or head-quarters of the bank.
20 25 30 31 43 46 48 51 53 54 54 60 98 100
80 75 70 69 57 54 52 49 47 46 46 40 2 0
0
20
40
60
80
100
HK MY TH SG JP KR BN ID VN KH CN PH MM LA
Cross border claims Local claims of foreign affiliates in foreign currency
%

14
Figure 11: Quarterly Growths of Different Forms of Claims
Note: Source: BIS database and Staff Calculation
Lending of the international banks targets three domestic sectors: public, non-bank
private and banking sector. Among the various domestic sectors, the banking sector of the
ASEAN+3 economies suffered the worst cuts in the lending of the foreign banks in 2011 and
early 2012. From third quarter of 2011 to first quarter of 2012, foreign claims to the banking
sector grew in average of 6.5 percent, the slowest compare to 8.9 percent of the public
sector and 10.3 percent of the non-bank private sector (Figure 12). In particular, the financial
centres of the ASEAN+3 economies, Hong Kong and Singapore, experienced the most
noticeable contractions in the claims to the banking sector. During the first quarter of 2012,
foreign claims to the banking sector of Hong Kong and Singapore declined by 17.9 percent
from a year earlier, in contrast to a positive growth of 12.1 percent for the public sector and
-30
-20
-10
0
10
20
30
40
2005 2006 2007 2008 2009 2010 2011 2012
ASEAN+3 Foreign ClaimsASEAN+3 Cross-border ClaimsASEAN+3 Local Claims
-20
-10
0
10
20
30
2005 2006 2007 2008 2009 2010 2011 2012
Indonesia Foreign ClaimsIndonesia Cross-border ClaimsIndonesia Local Claims
-30
-20
-10
0
10
20
30
40
2005 2006 2007 2008 2009 2010 2011 2012
Malaysia Foreign ClaimsMalaysia Cross-border ClaimsMalaysia Local Claims

15
9.6 percent for the non-bank private sector. It is also noteworthy that among the three
sectors, the banking sector of the ASEAN+3 had also suffered the worst sudden reversal of
capital flows during the height of the 2008 Lehman Brothers collapse. The strength of the
lending to the public sector, on the other hand, reflected the attractiveness of the sovereign
debts of the emerging markets in the region.
Figure 12: Allocations of International Bank Lending
Source: BIS database and AMRO Staff Calculation
4.1.2 Regional Banks
While the focus of this study is on the implication of the global major banks’ activities
in the ASEAN+3 economies, it is however important to recognize the increasing role of the
ASEAN+3 banks regionally and globally. The ASEAN+3 economies had turned into a net
lender to the world since 2010, with an average net lending of around USD 465 billion per
quarter as reported in the first quarter of 2012 (Table 4). With the exception of BCLM
economies, the rest of the ASEAN+3 were net lender in 2011. According to the BIS
‐40
‐20
0
20
40
60
80
2006
-Q1
2006
-Q2
2006
-Q3
2006
-Q4
2007
-Q1
2007
-Q2
2007
-Q3
2007
-Q4
2008
-Q1
2008
-Q2
2008
-Q3
2008
-Q4
2009
-Q1
2009
-Q2
2009
-Q3
2009
-Q4
2010
-Q1
2010
-Q2
2010
-Q3
2010
-Q4
2011
-Q1
2011
-Q2
2011
-Q3
2011
-Q4
2012
-Q1
Banks Public sector Non‐bank private sector Foreign claims
Growth in foreign claims to ASEAN+3 (incl. HK) , % y/y
‐60
‐40
‐20
0
20
40
60
80
100
120
2005
‐Q3
2005
‐Q4
2006
‐Q1
2006
‐Q2
2006
‐Q3
2006
‐Q4
2007
‐Q1
2007
‐Q2
2007
‐Q3
2007
‐Q4
2008
‐Q1
2008
‐Q2
2008
‐Q3
2008
‐Q4
2009
‐Q1
2009
‐Q2
2009
‐Q3
2009
‐Q4
2010
‐Q1
2010
‐Q2
2010
‐Q3
2010
‐Q4
2011
‐Q1
2011
‐Q2
2011
‐Q3
2011
‐Q4
2012
‐Q1
Banks Public sector Non‐bank private sector Foreign claims
Growth in foreign claims to SIngapore and Hong Kong, % y/y

16
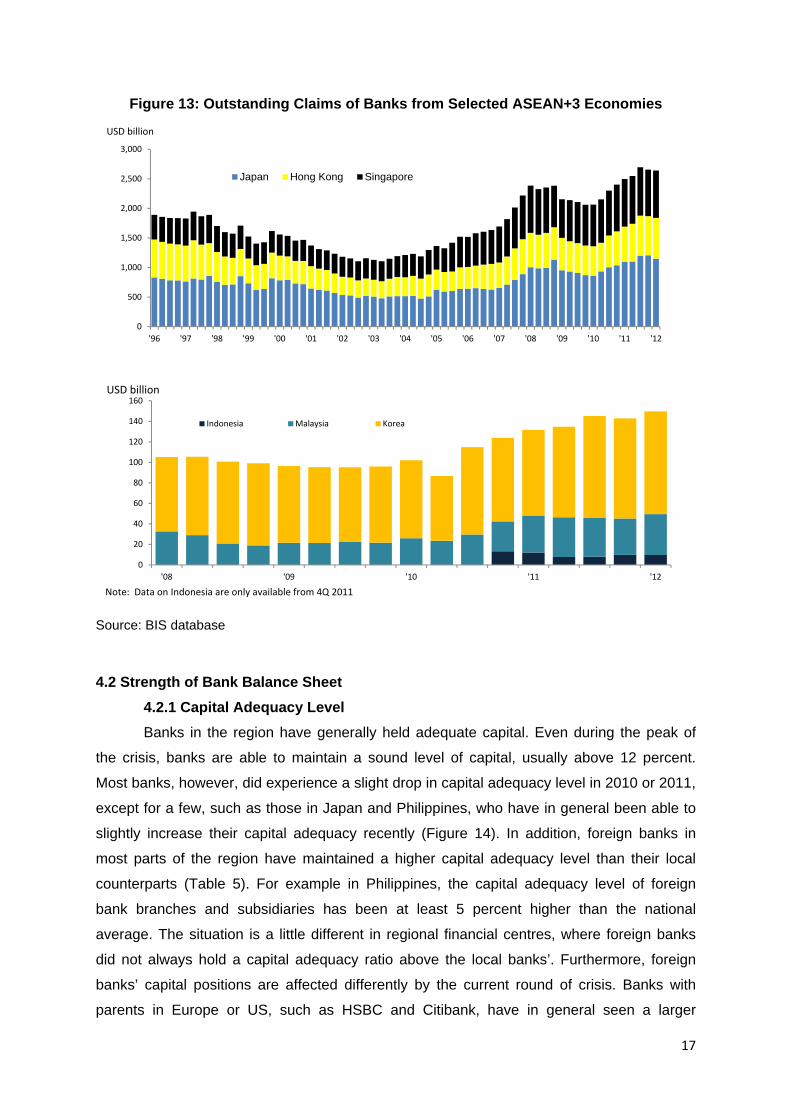
database, the international claims of banks from five ASEAN+3 economies (Japan,
Singapore, Hongkong, Korea and Malaysia) reached around USD4.05 trillion in the second
quarter of 2011 or around 66 percent increase from the number reported in the first quarter
of 2006 (Figure 13). The Japanese banks’ loans continued to play a big role, making up
slightly over 50 percent of the total international claims of this group of banks. From the
second half of 2010 to first half 2011, the quarterly average of the year-on-year growths of
the international claims from these countries’ banks is reported to be above 17 percent.7
Given their increasingly important presence, regionally and globally, understanding of the
networks and interconnectedness of these ASEAN+3 banks should be greatly enhanced to
assess potential challenges or concerns of their operations, particularly on the local and
regional economies. With the exception of the Japanese banks, data on the cross-border
lending activities of the regional banks are however publically inaccessible.
Table 4: Net Lending to the World
USD billion 2011:q1 2011:q2 2011:q3 2011:q4 2012:q1ASEAN+3 411 493 561 396 466 ASEAN-5 75 82 82 70 72 Plus-3 321 352 388 298 376 BCLM -4 -5 -4 -5 -5 Hong Kong and Singapore 19 64 95 33 22 Note: ASEAN-5 includes Indonesia, Malaysia, Philippines, Thailand and Vietnam. Plus-3 includes China, Korea and Japan. BCLM includes Brunei, Cambodia, Laos and Myanmar. Source: BIS database
7 The banks from Malaysia have been the most aggressive one with quarterly average of year on year growth over 30 percent.
17
Figure 13: Outstanding Claims of Banks from Selected ASEAN+3 Economies
Source: BIS database
4.2 Strength of Bank Balance Sheet
4.2.1 Capital Adequacy Level
Banks in the region have generally held adequate capital. Even during the peak of
the crisis, banks are able to maintain a sound level of capital, usually above 12 percent.
Most banks, however, did experience a slight drop in capital adequacy level in 2010 or 2011,
except for a few, such as those in Japan and Philippines, who have in general been able to
slightly increase their capital adequacy recently (Figure 14). In addition, foreign banks in
most parts of the region have maintained a higher capital adequacy level than their local
counterparts (Table 5). For example in Philippines, the capital adequacy level of foreign
bank branches and subsidiaries has been at least 5 percent higher than the national
average. The situation is a little different in regional financial centres, where foreign banks
did not always hold a capital adequacy ratio above the local banks’. Furthermore, foreign
banks’ capital positions are affected differently by the current round of crisis. Banks with
parents in Europe or US, such as HSBC and Citibank, have in general seen a larger
0
500
1,000
1,500
2,000
2,500
3,000
'96 '97 '98 '99 '00 '01 '02 '03 '04 '05 '06 '07 '08 '09 '10 '11 '12
Japan Hong Kong Singapore
USD billion
0
20
40
60
80
100
120
140
160
'08 '09 '10 '11 '12
Indonesia Malaysia Korea
USD billion
Note: Data on Indonesia are only available from 4Q 2011

18
magnitude of drop of capital in some economies (Indonesia, Hong Kong for example) during
the crisis than other foreign banks in the ASEAN+3 region. This is partly explained by the
deleveraging process unfolding in the advanced economies.
Figure 14: Regulatory Capital to Risk-Weighted Assets
Source: IMF-Financial Stability Indicator Database
0.0
5.0
10.0
15.0
20.0
China Hong Kong Japan Korea
2008 2009 2010 2011
0.0
5.0
10.0
15.0
20.0
Indonesia Malaysia Philippines Singapore Thailand
2008 2009 2010 2011

19
Table 5: Capital Adequacy Ratio of Selected Banks in Selected ASEAN+3 Economies
Source: Bank-scope database and Annual Reports
4.2.2 Liquidity Position
Both foreign and local banks in general remain liquid. With few exceptions, the
standard liquidity ratio (net loan to deposit ratio) of selected major local and foreign banks
have in general been stable between 2006 and 2011 (Table 6). Nonetheless, a number of
noticeable increases in the ratio suggest some deterioration of the liquidity position in recent
years. More importantly, the marginal decline in the liquidity position has been widely
reported by local, regional and global foreign banks. As in the case of the CAR earlier, we do
also find evidences that liquidity position of the European and the US banks in particular has
2011 2010 2009 2008 2007 2006 2011 2010 2009 2008 2007 2006
MalaysiaMalayan Banking Berhad - Maybank 17.5 13.4 14.3 11.5 9.8 9.7 13.4 12.5 14.3 12.7 14.1 12.6
HSBC Bank Malaysia Berhad 9.9 10.2 11.1 9.2 10.0 n.a. 13.6 14.4 15.8 13.4 15.1 n.a.
Standard Chartered Bank Malaysia Berhad 11.3 9.2 9.6 8.6 8.0 9.6 13.5 13.4 15.0 13.8 13.7 13.2
Deutsche Bank (Malaysia) Bhd. 14.4 16.9 15.0 14.5 n.a. 14.6 14.5 17.2 15.3 14.9 n.a. 15.0
Bank of Tokyo-Mitsubishi UFJ (Malaysia) Berhad 22.2 22.1 26.5 23.8 25.8 31.6 23.2 23.1 27.8 25.0 27.1 33.2
Citibank Malaysia (L) Ltd n.a. n.a. n.a. n.a. n.a. n.a. n.a. n.a. n.a. n.a. n.a. n.a.
Indonesia
Bank Mandiri (Persero) Tbk 12.4 10.1 12.4 12.8 17.0 19.1 15.0 13.4 15.4 15.7 20.8 24.6
PT Bank ANZ Indonesia 12.0 11.2 13.0 15.0 16.8 16.9 13.0 12.3 14.1 16.3 18.1 17.6
PT Bank Mizuho Indonesia 16.1 18.8 24.0 n.a. n.a. n.a. 17.3 20.0 25.1 19.7 26.6 25.3
Bank BNP Paribas Indonesia PT n.a. n.a. n.a. n.a. n.a. n.a. n.a. n.a. n.a. 56.9 76.9 70.9
Citibank (Capital Adequacy Ratio ‐ with credit and market risk) 25.3 26.8 30.5 24.1 20.8
Deutsche Bank (Capital Adequacy Ratio) 29.8 33.3 47.0 46.9 n.a.
HSBC (Capital Adequacy Ratio) 17.6 13.2 19.1 12.0 14.6
Standard Chartered (Capital Adequacy Ratio) 14.1 14.4 14.6 13.3 13.3
KoreaKookmin Bank 10.3 n.a. n.a. n.a. n.a. n.a. 13.6 n.a. n.a. n.a. n.a. n.a.
Standard Chartered Bank Korea Limited 11.6 n.a. n.a. n.a. n.a. n.a. 15.6 n.a. n.a. n.a. n.a. n.a.
Citibank Korea Inc. 13.4 14.3 n.a. n.a. n.a. n.a. 16.4 17.2 n.a. n.a. n.a. n.a.
Philippines
Philippines banking system: Capital Adequacy Ratio 16.3 16.0 14.9 14.7 14.7
Foreign bank branches and subsidiaries: Capital Adequacy Ratio 21.6 21.9 19.4 22.5 21.3
Existing foreign bank branches: Capital Adequacy Ratio 18.5 18.8 12.8 18.4 17.1
New foreign bank branches: Capital Adequacy Ratio 28.9 29.5 35.2 34.9 32.1
Foreign bank susidiaries: Capital Adequacy Ratio 19.6 18.0 19.1 17.0 23.3
Thailand
Bangkok Bank Public Company Limited 12.2 12.5 12.6 11.2 12.0 11.7 15.4 16.1 15.5 13.8 14.5 14.5
Siam Commercial Bank Public Company Limited 11.1 11.6 12.3 11.0 10.6 11.4 14.5 15.5 16.5 15.2 13.1 14.4
Kasikornbank Public Company Limited 9.6 9.4 10.3 9.8 10.7 10.5 13.8 14.0 15.2 15.1 14.6 14.7
United Overseas Bank (Thai) PCL 15.5 17.8 19.5 17.0 16.5 16.4 16.7 19.0 21.2 18.5 17.7 17.4
Standard Chartered Bank (Thai) Public Company Limited 17.1 15.1 18.3 12.1 13.9 n.a. 17.1 15.1 18.7 12.5 14.2 n.a.
CIMB Thai Bank Public Company Limited 7.7 9.0 6.0 3.6 0.8 4.1 13.0 14.7 12.0 5.8 1.5 6.0
Capital Adequacy Ratio (in %)Tier 1 Ratio Total Capital Adequacy Ratio
2011 2010 2009 2008 2007 2006 2011 2010 2009 2008 2007 2006
SingaporeDBS Bank Ltd n.a. n.a. n.a. 10.1 8.9 10.1 n.a. n.a. n.a. 14.0 13.4 14.4
Oversea-Chinese Banking Corporation Limited OCB 14.5 16.3 16.0 14.9 11.5 13.1 15.7 17.6 16.5 15.2 12.5 15.8
United Overseas Bank Limited UOB 13.5 15.3 14.0 10.9 10.0 11.0 16.7 19.8 19.0 15.3 14.5 16.3
Citibank Singapore Limited n.a. n.a. n.a. 13.1 11.8 n.a. n.a. n.a. n.a. 13.2 11.9 n.a.
Hong Kong
Hongkong and Shanghai Banking Corporation Limite n.a. 11.7 12.2 10.3 8.8 12.3 n.a. 14.7 16.1 13.4 11.6 13.5
BOC Hong Kong (Holdings) Ltd 12.5 11.3 11.6 10.9 12.2 13.4 16.9 16.1 16.9 16.2 13.1 14.0
Bank of China (Hong Kong) Limited 12.5 11.3 11.6 10.9 12.2 13.4 16.9 16.1 16.9 16.2 13.1 14.0
Hang Seng Bank Ltd. 11.6 10.8 12.8 9.5 8.4 10.7 14.3 13.6 15.8 12.5 11.2 13.6
Standard Chartered Bank (Hong Kong) Limited n.a. 10.9 14.4 11.7 10.5 n.a. n.a. 12.8 14.4 13.1 13.2 14.9
DBS Bank (Hong Kong) Limited 12.2 12.7 12.6 9.8 11.4 11.6 14.5 15.2 15.6 13.1 15.1 15.9
Citibank (Hong Kong) Limited 25.9 20.7 28.3 14.4 13.7 14.8 27.2 20.7 29.1 15.2 14.3 15.4
JapanBank of Tokyo - Mitsubishi UFJ Ltd (The)-Kabushiki 11.4 10.8 7.6 7.4 7.7 7.1 15.8 15.5 12.0 11.2 12.8 12.5
Sumitomo Mitsui Banking Corporation 14.3 12.3 9.2 7.6 7.2 5.6 19.2 16.7 13.5 12.2 13.0 10.8
Mizuho Bank 10.4 7.7 6.7 7.3 7.5 5.8 14.9 12.9 11.8 12.0 12.3 10.3
Citibank Japan Ltd 25.1 24.5 22.9 14.6 n.a. n.a. 25.2 25.1 23.1 14.6 n.a. n.a.
CAR (in %)Tier 1 Ratio Total Capital Adequacy Ratio

20
fallen more substantially than that of the local or regional banks. Moreover, the liquidity
position of the foreign banks relative to local banks varies across banks and host economies.
In the case of the Philippines, the local banks are in average more liquid than the foreign
banks. This is not necessarily the case however when we observe closely the cases of
Indonesia, Hong Kong, Malaysia, Thailand and Singapore. The HSBC in Malaysia, Hong
Kong and the Citibank in Singapore and Hong Kong for instance continued to maintain a
relatively strong loan to deposit level, although noticeably higher than during the pre-2008
period. It should be noted however that these analyses are based on a rather limited
available sample set of observations.
Table 6: Liquidity Position
Source: Bank-scope database and Annual Bank Reports
2011 2010 2009 2008 2007
SingaporeDBS Bank Ltd 74.5 73.5 69.3 73.0 66.4
Oversea-Chinese Banking Corporation Limited OCBC 72.4 74.9 71.8 76.0 68.5
United Overseas Bank Limited UOB 72.4 64.1 65.8 67.4 66.6
Citibank Singapore Limited n.a. 40.8 38.2 22.7 21.8
Nomura Singapore Limited n.a. 44.7 43.4 57.9 56.3
Hong Kong
Hongkong and Shanghai Banking Corporation Limited n.a. 53.0 43.3 45.1 43.9
BOC Hong Kong (Holdings) Ltd 54.5 47.9 55.4 52.3 48.2
Bank of China (Hong Kong) Limited 54.3 47.8 55.2 51.6 48.3
Hang Seng Bank Ltd. 63.5 65.3 51.7 53.5 52.8
Standard Chartered Bank (Hong Kong) Limited 56.6 56.5 42.1 44.1 47.9
DBS Bank (Hong Kong) Limited 86.5 74.8 69.8 71.8 64.6
Citibank (Hong Kong) Limited 47.2 38.8 30.1 33.3 28.1
JapanBank of Tokyo - Mitsubishi UFJ Ltd 51.7 56.4 63.7 63.1 60.6
Sumitomo Mitsui Banking Corporation 56.9 65.0 68.2 71.1 74.1
Mizuho Bank 50.5 50.2 59.7 56.0 58.6
Citibank Japan Ltd 9.3 7.7 6.0 6.6 n.a.
Liquidity Ratio (in %)Net Loans / Dep & ST Funding
2011 2010 2009 2008 2007
MalaysiaMalayan Banking Berhad - Maybank 77.8 76.4 74.6 76.8 67.5
HSBC Bank Malaysia Berhad 57.2 61.7 60.3 66.8 63.8
Standard Chartered Bank Malaysia Berhad 73.9 74.1 62.9 56.7 55.1
Deutsche Bank (Malaysia) Bhd. 10.5 8.8 9.6 14.0 10.0
Bank of Tokyo-Mitsubishi UFJ (Malaysia) Berhad 71.1 62.8 57.7 60.8 52.5
Citibank Malaysia (L) Ltd n.a. 61.7 61.9 82.3 75.9
Indonesia
Bank Mandiri (Persero) Tbk 69.2 63.3 56.0 54.4 48.3
Hongkong and Shanghai Banking Corporation Limited (The) - Indones n.a. n.a. n.a. n.a. 54.2
PT Bank ANZ Indonesia 76.8 78.7 72.7 83.2 59.6
Bank BNP Paribas Indonesia PT n.a. 18.6 34.2 88.8 136.1
Citibank (Loan to Deposit Ratio) 66.7 69.2 73.6 79.5 70.8
Deutsche Bank (Loan to Deposit Ratio) 50.8 52.4 60.2 68.0
HSBC (Loan to Deposit Ratio) 77.9 72.6 72.3 67.3 65.9
Standard Chartered (Loan to Deposit Ratio) 88.6 101.8 81.3 84.7 61.0Philippines
Philippines banking system: Gross loans to deposits 70 64.4 68.1 69.7 70.9
Foreign bank branches and subsidiaries: Gross loans to deposits 86.7 101.2 96.4 102.5 83.5
Existing foreign bank branches: Gross loans to deposits 81.9 99.9 95.2 97.5 80.7
New foreign bank branches: Gross loans to deposits 102.9 112 111 119 91.5
Foreign bank susidiaries: Gross loans to deposits 77 85.7 76.4 94.9 83.1
Thailand
Bangkok Bank Public Company Limited 79.4 73.5 71.4 78.6 71.4
Siam Commercial Bank Public Company Limited 85.8 86.7 86.7 88.6 85.5
Kasikornbank Public Company Limited 88.1 87.9 86.1 81.0 88.4
United Overseas Bank (Thai) PCL 72.6 77.6 74.0 88.1 80.9
Standard Chartered Bank (Thai) Public Company Limited 52.4 55.6 47.8 47.9 45.2
CIMB Thai Bank Public Company Limited 83.5 79.5 72.6 48.1 49.6
Liquidity Ratio (in %)Net Loans / Dep & ST Funding

21
4.2.3 Profitability
Banks have been able to remain profitable throughout the crisis. In some economies
the return to equity level is relatively high at above 15 percent, such as Indonesia, China,
and Hong Kong, while in others the levels can be more modest at 5-10 percent, such as
Japan, Korea and Thailand (Figure 15). While profitability levels vary across the region,
banks have been able to maintain decent returns throughout the crisis, even rising
profitability in some economies such as Korea and Philippines. The net interest margin (NIM)
as an important contributor to profitability has dropped in most of the countries since the start
of the crisis, with some countries faring better than the others (Table 7).
Figure 15: Return to Equity
Source: IMF-Financial Stability Indicator Database
0.0
5.0
10.0
15.0
20.0
25.0
30.0
China Hong Kong Japan Korea
2008 2009 2010 2011
0.0
5.0
10.0
15.0
20.0
25.0
30.0
Indonesia Malaysia Philippines Singapore Thailand
2008 2009 2010 2011

22
Table 7: Profit Indicators
Source: Bankscope database and Annual Reports
Most foreign banks exhibit a lower profitability than their local counterparts in recent
years. This is perhaps not surprising in most economies in this region, particularly wherein
foreign banks only control a modest market share and usually maintain a higher capital
2011 2010 2009 2008 2007 2006 2011 2010 2009 2008 2007 2006
MalaysiaMalayan Banking Berhad - Maybank 2.5 2.9 2.9 3.0 3.2 2.8 12.6 14.9 -1.7 13.7 17.5 16.3
HSBC Bank Malaysia Berhad 2.2 2.4 2.4 3.0 3.3 3.3 22.6 18.8 17.9 28.6 27.1 28.5
Standard Chartered Bank Malaysia Berhad 2.2 2.1 1.9 2.6 3.3 2.9 21.0 17.8 13.4 37.4 29.9 26.6
Deutsche Bank (Malaysia) Bhd. 2.5 2.5 1.9 2.0 2.2 3.4 4.0 11.1 9.7 15.2 16.5 16.4
Bank of Tokyo-Mitsubishi UFJ (Malaysia) Berhad 2.1 2.0 2.2 2.5 2.5 3.2 9.3 10.1 10.2 13.3 8.6 14.3
Citibank Malaysia (L) Ltd n.a. 0.4 0.5 0.7 0.9 n.a. n.a. 19.8 13.1 16.5 28.6 n.a.
Indonesia
Bank Mandiri (Persero) Tbk 5.1 5.4 5.1 5.2 5.1 4.5 24.2 24.2 20.8 17.8 15.6 9.8
Hongkong and Shanghai Banking Corporation Limite n.a. n.a. n.a. n.a. 8.8 8.5 n.a. n.a. n.a. n.a. 216.2 87.9
PT Bank ANZ Indonesia 7.6 8.6 6.3 7.8 9.5 9.7 12.4 9.4 1.2 20.9 16.9 16.4
PT Bank Mizuho Indonesia 2.4 2.7 3.1 3.3 3.5 4.3 8.8 12.8 11.1 11.5 11.3 14.8
Bank BNP Paribas Indonesia PT n.a. 2.4 4.1 4.3 5.1 4.6 n.a. 6.7 16.8 17.0 10.1 12.5
Citibank* 4.1 4.8 6.7 7.7 8.4 19.1 23.5 25.3 28.1 33.2
Deutsche Bank* 8.1 1.0 3.1 3.4 27.8 14.1 18.8 22.8
HSBC* 5.3 5.4 7.9 8.7 9.5 16.3 18.3 11.0 14.4 13.9
Standard Chartered* 4.6 3.7 4.1 5.2 3.7 18.9 10.5 16.9 19.6 23.1
KoreaKookmin Bank 2.6 2.3 n.a. n.a. n.a. n.a. 10.2 0.7 n.a. n.a. n.a. n.a.
Standard Chartered Bank Korea Limited 2.6 2.3 n.a. n.a. n.a. n.a. 5.2 6.6 n.a. n.a. n.a. n.a.
Citibank Korea Inc. 3.1 2.7 n.a. n.a. n.a. n.a. 8.5 9.0 n.a. n.a. n.a. n.a.
Philippines
Philippines banking system** 12.5 12.2 10.8 6.9 10.7Foreign bank branches and subsidiaries** 10.6 9 8.3 6.4 11.9
Existing foreign bank branches** 9.8 13.5 12.3 8.9 19.4
New foreign bank branches** 11 5.5 6.2 7.5 7.8
Foreign bank susidiaries** 12.3 4.1 1.5 -5.4 -6.1
Thailand
Bangkok Bank Public Company Limited 2.9 2.7 3.1 3.6 3.3 3.4 11.6 11.7 11.2 11.9 12.3 12.5
Siam Commercial Bank Public Company Limited 3.4 3.2 3.6 4.0 4.0 4.0 21.2 16.4 15.5 17.8 16.5 13.6
Kasikornbank Public Company Limited 3.9 3.6 3.5 4.0 4.2 4.3 16.8 15.6 12.2 14.4 15.9 16.4
United Overseas Bank (Thai) PCL 3.0 3.2 3.5 4.0 3.8 3.8 0.4 3.6 2.8 5.6 -0.4 2.5
Standard Chartered Bank (Thai) Public Company Li 3.1 2.7 2.7 3.0 4.2 n.a. 10.5 5.7 6.3 9.2 8.3 n.a.
CIMB Thai Bank Public Company Limited 3.4 4.0 3.3 3.5 3.8 3.0 10.5 8.5 0.1 -67.9 -277.4 -69.2
* For Citi, Deutsch, HSBC and Standard Chartered in Indonesia, Return on Assets and Return on Equity from Annual Reports
** Return on Assets and Return on Equity from A Status Report on the Philippine Financial System.
Profitability (in %)Net Interest Margin Return on Avg Equity
2011 2010 2009 2008 2007 2006 2011 2010 2009 2008 2007 2006
SingaporeDBS Bank Ltd 1.8 1.9 2.0 2.0 2.2 2.2 10.6 6.5 8.8 9.1 11.1 12.1
Oversea-Chinese Banking Corporation Limited OCB 1.5 1.6 1.7 1.8 1.6 1.5 10.1 10.8 10.7 10.5 13.9 15.1
United Overseas Bank Limited UOB 2.0 2.2 2.4 2.4 2.2 2.1 10.5 13.3 11.0 11.7 12.5 16.2
Citibank Singapore Limited n.a. 2.0 1.9 1.5 1.2 n.a. n.a. 12.9 19.4 24.6 20.5 n.a.
Credit Suisse (Singapore) Limited n.a. n.a. 1.2 2.4 1.1 1.1 n.a. n.a. 10.3 -3.7 17.1 18.8
Barclays Merchant Bank (Singapore) Ltd n.a. n.a. 3.6 2.4 1.7 3.5 n.a. n.a. 18.1 24.4 25.4 85.1
Nomura Singapore Limited n.a. 0.6 0.7 0.3 0.2 0.4 n.a. -22.3 -56.7 3.4 5.9 10.7
Hong Kong
Hongkong and Shanghai Banking Corporation Limite n.a. 1.4 1.5 2.1 2.0 2.1 n.a. 20.6 21.0 24.7 27.5 22.6
BOC Hong Kong (Holdings) Ltd 1.6 1.6 1.7 2.1 2.4 2.1 16.6 14.8 14.9 3.3 17.4 17.0
Bank of China (Hong Kong) Limited 1.6 1.6 1.7 2.0 2.1 1.9 18.2 16.0 15.6 8.1 19.0 18.1
Hang Seng Bank Ltd. 1.8 1.7 1.8 2.3 2.2 2.0 23.6 24.7 26.3 29.2 38.9 29.0
Standard Chartered Bank (Hong Kong) Limited 1.6 1.5 1.8 2.0 2.5 2.7 21.0 15.8 14.2 18.1 24.6 22.6
DBS Bank (Hong Kong) Limited 1.6 1.7 2.1 2.0 2.3 2.7 10.6 11.1 13.2 11.1 17.6 18.1
Citibank (Hong Kong) Limited 2.6 2.7 3.2 3.8 3.4 3.4 11.1 9.5 17.4 36.4 53.7 38.8
JapanBank of Tokyo - Mitsubishi UFJ Ltd (The)-Kabushiki 1.1 1.2 1.3 1.3 1.2 1.1 8.6 5.3 -2.0 7.8 9.4 15.7
Sumitomo Mitsui Banking Corporation 1.1 1.2 1.3 1.3 1.2 1.2 7.7 7.3 -5.5 8.0 9.2 14.9
Mizuho Bank 0.9 1.0 1.0 1.0 1.0 0.9 7.1 3.0 -17.6 10.0 9.7 8.8
Citibank Japan Ltd 0.9 1.0 0.9 0.6 n.a. n.a. 4.4 4.0 9.2 9.1 n.a. n.a.
Barclays Capital Japan Limited n.a. 0.0 0.0 0.0 n.a. n.a. n.a. 0.7 -6.3 1.3 n.a. n.a.
Société Générale Private Banking (Japan) Limited n.a. n.a. n.a. n.a. 0.4 0.2 n.a. n.a. n.a. n.a. -18.7 -28.5
Profitability (in %)Net Interest Margin Return on Avg Equity

23
adequacy level than the local banks. Moreover, the profitability of the foreign banks largely
depends on their business locations rather than parent bank origins. Although banks in
advanced countries such as US or Europe are hit harder than banks in other places, the
performance of their subsidiaries or branches in the ASEAN+3 region is largely determined
by the local business conditions, and do not show significant higher volatility of profitability.
Despite the swings their parent banks are experiencing in terms of capital and profitability,
the foreign bank branches or subsidiaries in the ASEAN+3 region have seen steady
profitability during the crisis (although slightly lower in some economies). Some foreign
banks have achieved higher profitability in the recent years, such as in the Philippines and
Thailand, which is generally in line with the overall profitability development in the banking
sectors of the respective countries. This suggests that the profitability of foreign bank
branches or subsidiaries in this region are perhaps less affected by the performance of their
parent banks but more by local factors, particularly the growth rate of the host economies.
4.3 Trade Financing
Two key factors have frequently been underlined by early studies as root causes of
poor export/trade performance of the East and Southeast Asian economies at the height of
the 1997 East Asian crisis. The first factor is the exchange rate risk, and the second is the
scarcity of short-term trade financing facilities. Accompanying the sharp fall in global trade,
the joint IMF–Banker’s Association for Trade and Finance (BAFT) survey found the decrease
in the value of trade finance accelerated between October 2008 and January 2009 in almost
every region of the world (BAFT, 2009). Furthermore, the World Bank estimates that 85–90
percent of the fall in world trade since the second half of 2008 is due to falling international
demand, and 10–15 percent is attributable to a fall in the supply of trade finance (Auboin,
2009). Claudio (2008) further claimed that the role of trade financing has been strengthened
by the structure of production lines through regional supply chains and the move to the
greater cross-border dispersion of component production and assemblies within vertically
integrated production processes in Asia. A recent work (Siregar 2009) on the experiences of
Indonesia, Thailand and Korea from 1993 to 2009 confirmed the importance of trade
financing on the overall export performance of these three economies.8
8 The study finds that a 1 percent drop in the trade finance could lead to around 0.2-0.4 percent drops in the exports. Furthermore, the study also claims that the more developed a country’s financial sector the more significant the role of trade financing would likely to be.

24
Wholesale funding activities, especially in the areas of trade and project financing,
remain a concern in the event of a prolonged deleveraging by the advanced economies’
lenders. Banks and non-bank financial institutions from major European economies, in
particular from the UK, Germany, France and Spain, have long been the major providers and
underwriters of trade financing to emerging markets in Asia and Pacific (Figure 16). Based
on the March 2012 BIS report, trade and project financing activities of Eurozone lenders
have been most affected by the deleveraging process. While total lending globally by the
weaker European banks were scaled back by about 15 percent in the second half of 2011,
project and trade financing were reduced by 39 percent and 23.5 percent respectively. The
larger proportions of cuts in trade and project financing were also reported by many
Eurozone lenders.
Figure 16: Export Credit Agency Backed Trade Finance in Asia
Source: Barclays Capital
Assessing the full impact of on-going Eurozone bank deleveraging on trade financing
and subsequently on trade performance is challenging in the absence of detailed information
and data on the different types of loans (including trade and project financing) that have
been extended to ASEAN+3 economies. However, a straightforward mapping of the growth
rates of the bilateral bank lending from four major Eurozone economies and the ASEAN-5
economies and Korea, and of the bilateral trades (exports and imports) between the same
sets of economies visibly signal a high degree co-movements between them, especially
since 2005 (Figure 17). A similar co-movement between bilateral loans from the UK banks to
ASEAN-5 and Korea and bilateral trades between UK and the same set of Asian economies
is well traced during the same period (Figure 18).
HSBC14%
BP Paribas12%
Citi10%
SG Corp & Inv Banking9%
BBVA6%
Credit Agricole6%
Deutsche Bank4%
Santander4%
Westpac3%
Standard Chartered Bank
3%
Other29%

25
Figure 17: Bilateral Lending and Trade of Four Eurozone Economies and ASEAN-5 and Korea
Note: Four Eurozone economies are France, Germany Spain, and Netherlands. ASEAN-5 includes Indonesia, Malaysia, Philippines, Thailand and Singapore. All growth rates are in percentages. Source: AMRO Staff calculation, BIS database and CEIC.
Figure 18: Bilateral Lending and Trade of UK and ASEAN-5 and Korea
Note: ASEAN-5 includes Indonesia, Malaysia, Philippines, Thailand and Singapore. Source: AMRO Staff calculation, BIS database and CEIC.
The parallel movements of the trade and lending series arguably point to either
bilateral trade activities lead to higher demand for bilateral bank lending or vice-versa, and
therefore corroborate the claims that a portion of the lending by the global banks directly
associated with trade financing. A set of pair-wise granger causality testing confirms the two-
ways relationships between lending and trade (Table 8). As much as bilateral trade activities
between the ASEAN+3 economies and the major global trading partners (US, UK, Japan
and Euro) could have induced more demand for trade financing, the availability of trade
financing facility may have also further fuelled bilateral trade activities between these
economies. The Granger-causality test, in particular, confirm that the availability of financing
has boosted bilateral trade activities between selected ASEAN+3 economies with their key
global trading partners (US and UK) with about 2-4 quarters lag. This set of test results
supports the early stylized fact that the US and the UK banks are important suppliers of
trade financing to the ASEAN+3 region. On the other hand, the granger causality test results
found a less significant role of the Eurozone bank lending in explaining bilateral exports with
this small subset of the ASEAN+3 economies (Table 8). Unfortunately, long enough
‐40
‐20
0
20
40
60
loan growth YoY trade growth YoY
‐50
0
50
100loan growth (%) trade growth (%)

26
individual time-series data on loans for trade and project financing for ASEAN+3 economies
are not publically available for the testing to be carried out in a more comprehensive manner.
Table 8: Granger-Causality Testing for Bilateral Export and Lending
(Period: 2000:q1 – 2011q4)
a). Bilateral Export Does Granger-Cause Bilateral Lending
Eurozone
US UK Japan Germany Italy Spain
Indonesia Yes No Yes No No Yes
Korea No No Yes Yes No No
Malaysia No Yes Yes Yes No No
Philippines No Yes No Yes No No
Thailand No No Yes No No Yes
b). Bilateral Lending Does Granger-Cause Bilateral Export
Eurozone
US UK Japan Germany Italy Spain
Indonesia Yes Yes Yes No No No
Korea Yes No Yes No No Yes
Malaysia Yes Yes Yes Yes No No
Philippines Yes Yes No No Yes Yes
Thailand Yes Yes No Yes Yes No
Source: AMRO Staff Calculation
4.4 Asset Markets: Boom and Bust Factors
The strong relation between asset prices and bank lending has long been spotted,
particularly during periods of severe economic and financial crisis. Real effects are particular
grave if a bubble occurs in the real estate market, but stock prices can experience
substantial declines as well. Two ways of transmission of shocks have been reported. One
way is for the asset price slump to affect balance sheets of banks and therefore their lending

27
capacities. Reciprocally, a dry-up in liquidity/funding due to a sudden pull-out in the bank
lending (including those of the foreign banks) could lead to falling asset prices. Seminal
studies in this topic are on the great depression period (Bernanke 1983 and 1995) and on
the East Asian crisis (Stiglitz and Greenwald (2003)).
As in other parts of the globe, foreign bank lending potentially contributed to the
general rising residential house price level in ASEAN+3 economies. The annualized
quarterly growths of residential house price in selected ASEAN+3 economies (Indonesia,
Malaysia, Philippines, Thailand, Singapore, China, Hong Kong, Korea and Japan) since
2005 are found to be positively related to the exposure levels of those economies to the
foreign bank lending (Figure 19). A closer observation also reveals that during the boom
period of the foreign bank lending to East Asia from 2005 to the second quarter of 2008,
foreign bank lending and residential property rose in tandem. On the other hand, a reversal
or pull-out of these lending immediately after the Lehman collapse seems to be followed
closely by a period of housing price correction within 1-2 quarters. This was particularly
apparent in Hong Kong, Singapore and to some extent Malaysia and Thailand, but less in
Indonesia and the Philippines.9 Unfortunately, the limited observation set does not allow us
to robustly test the causality between lending and property price, particularly for the crisis
period.
9 A more in-depth research to understand the link between real estate price and foreign bank lending is warranted. In particular, one may want to look into the breakdowns of the foreign bank lending to understand the share that goes to the property market.

28
Figure 19: Global Bank Lending Exposure and Residential Property Price
The interconnectedness between the asset markets and the global banking sector is
also evident from the recent performance of stock exchange markets within the ASEAN+3
region. As demonstrated in Figure 20, the performance of the stock markets of selected non-
financial centre ASEAN+3 economies in 2009-2010, following the Lehman Brothers debacle,
appears to be negatively affected by their exposures to the claims of the global banks
(Figure 20). In particular, the more exposed the financial sector was to foreign bank cross-
border lending, the more severe the losses in these respective stock markets. A similar trend
is reported during the recent Eurozone sovereign debt turmoil in 2011. The negative
relationship seems to be more pronounced when we focus for the case of Eurozone banks’
lending in 2011.
y = 1.6109x + 2.2716
‐30.00
‐20.00
‐10.00
0.00
10.00
20.00
30.00
40.00
0.00 2.00 4.00 6.00 8.00 10.00
% in
hou
se pric
es (y
/y)
Foreign claims/GDP (%)
The Period of 2005:q1 ‐ 2012:q1
y = ‐1.1462x + 1.818
‐30.00
‐20.00
‐10.00
0.00
10.00
20.00
30.00
40.00
0.00 2.00 4.00 6.00 8.00
% chan
ge in
hou
se pric
es (y/y)
Foreign claims/GDP (%)
The Period of Post Lehman GFC: 2008:q3 ‐ 2009:q2

29
Figure 20: Global Bank Lending Exposure and Stock Exchange Performance
Source: CEIC database and BIS.
5. Practical Implication to Banking Regulation and Monetary Policy Management
5.1 Strengthening Supervisory Capacity: Beyond Local Jurisdiction
y = ‐0.14x + 47.11
‐40
‐20
0
20
40
60
80
100
25 45 65 85 105 125 145 165 185 205 225
Stock
Index
(% Yo
Y)
Foreign claims/GDP (%)
From 2nd quarter 2009 to 2nd quarter 2010
y = ‐0.047x + 17.23
‐15
‐10
‐5
0
5
10
15
20
25
30
35
40
0 50 100 150 200 250
Stock Ind
ex (%
YoY)
Foreign claims/GDP (%)
2011
y = ‐0.61x + 55.39
‐40
‐20
0
20
40
60
80
100
15 25 35 45 55 65
Stock
Index (%
YoY)
Cross border claims/GDP (%)
From 2nd quarter 2009 to 2nd quarter 2010
y = ‐0.09x + 15.89
‐15
‐10
‐5
0
5
10
15
20
25
30
35
40
0 10 20 30 40 50 60 70
Stock Inde
x (% YoY
)
Cross border claims/GDP (%)
2011

30
Following the 1997 East Asian crisis, the collapse of banking sectors in a number of
East Asian economies underscored the inadequate supervisory capacities in our region. The
shortcoming was partly due to the failure to keep up with the reform and the development of
the banking sector. Not only that the sector quickly opened up to the foreign banks, but with
the accompanied reform of the capital and insurance markets, banks are providing services
beyond the conventional banking activities, such as offering investment
instruments/derivatives and insurance policies. The emergence of the “supermarket” banks
warrants a closer integration among the financial market supervisory agencies in the
domestic economy.
Fast forward more than a decade later, the challenges facing financial sector
supervisors become more complex globally, including those in the emerging markets of East
and Southeast Asia. The banking sectors are not only deeply interconnected regionally, but
also globally. As elaborated, the local and regional banks have not only borrowed heavily
from, but also extended loans to global banking system. The traditional global banks, such
as the HSBC and the Standard Chartered bank, have increasingly become regional banks10.
At the same time, many of the ASEAN banks, such as the DBS, OCBC, UOB, MayBank and
the CIMB, have become regional and global banks. The need to integrate financial market
supervisory agencies is no longer a domestic issue. Given the cross-border nature of these
banks’ operations, the regular supervision on domestic activities of these banks will not be
sufficient to assess the overall risk exposures. There are a number of lessons from the
recent global financial crisis that underscore the importance of establishing a closer
coordination among banking supervisors across the borders.
To start, a much more in-depth research needs to be undertaken to fully grasp the
interconnectedness of the domestic banking sector, regionally and globally. Mapping the
networks and degree of integration of the regional banking systems is urgently needed
before even formulating steps to enhance the supervisory capacities of the networks. This
study has so far identified potential areas of issues that need to be further examined. The
lack of timely and publically available data on the detailed breakdowns of foreign bank
lending directed for trade and project financing inhibits efforts in conducting more in-depth
analyses on the lending activities of the foreign banks. Furthermore, data on the lending
activities of the regional banks are not publically available. While the frequently visited BIS
database reports bilateral lending from the advanced economies’ banks to most individual
ASEAN+3 economies, no disaggregated level of lending data to various destinations,
particularly to the ASEAN+3 economies, is reported for Singaporean, Malaysian, Korean and
10 As discussed and will be elaborated more, these banks’ operations in ASEAN+3 become more independent from the Headquarters of these banks.

31
Indonesian banks. In fact, only the bilateral lending of the Japanese banks is regularly
reported at this time. Without these valuable information and data, potential contagion or
spill-over within the banking sectors of the region and the world will likely be underestimated.
The recent global events also demonstrate that the economic cost of gaps in
regulation across banking supervisors across economies will likely be amplified. A tougher
set of regulation by the Financial Service Authority in UK introduced in the past two years,
including on mode of entry (branch or subsidiary) and more rigorous liquidity rules, has
resulted in international banks pulling out big shares of their activities away from London to
other European economies with less-regulated financial markets. Expansion of global banks
has increasingly been influenced by the rules and regulations of domestic supervisors
relative to their foreign counterparts.
Another concrete lesson from the recent sovereign debt crisis in the Eurozone area is
on the design of legal framework to inject emergency funds required to bail-out trouble
banks. Given the cross-border networks of the banks, any bail-out program must be
coordinated across the border. An important hurdle of the bail-out program in the European
economies is with the lack of cross-border integrated supervisory capacity to fully assess the
extensiveness of the bail-outs needed. The failure to mitigate the impacts of the Lehman-
Brothers’ debacle in 2008 for instance could arguably be attributed to the lack of cooperation
between the supervisors in the US and the UK. Hence, building trust through deepening
cooperation among supervisors across the borders is greatly vital to manage this
increasingly interconnected banking system.
5.2 Managing Monetary and Exchange Rate Stability Amidst of Global Stimulus
The monetary and exchange rate policy stances of central banks, particularly for
major advanced economies, have frequently been swiftly transmitted to other part of the
world through this globally integrated banking system. The transmission of the “policy
shocks” has made conducting monetary and exchange rate policy arguably to be even more
complex, particularly for the recipient economies. A study done by Ceterolli and Goldberg
(2008) for instance finds the globalization of banking in the United States is influencing
monetary transmission mechanism both domestically and in foreign markets.
A similar experience has also been reported from the recent quantitative easing
measures by the US Federal Reserve. It is estimated around USD236 billion total private
capital outflow per quarter during the US Federal Reserve quantitative easing measure (QE-
1) and about USD278 billion per quarter during the first two quarters of QE-2 (Table 9).
These rates are higher than the average of USD204 billion per quarter during the period with

32
no QE measure between November 2009 and October 2010. A slightly above 20 percent of
these total capital outflows were eventually absorbed by the Asia-Pacific economies. As
demonstrated in the Table 9, a fair share of the increase in the private outflow during the
second quantitative easing (QE-2) was in the form of other private claims, namely via
international bank lending.
Table 9: US Gross Private Capital Outflows Following Past QEs
Quarterly Average in USD billion QE-1 QE-2* No QE**
Direct Investment -80.8 -85.9 -86.0
Portfolio Investment -74.1 -50.8 -37.6
Other Private Claims -82.0 -141.6 -81.2
Total -236.9 -278.3 -204.8
Note: */QE2 includes data on the first two quarters. **/ No QE covers the period of Oct 2009- Sept 2010. Source: the U.S. Bureau of Economic Analyses and Morgan (2011).
There are obvious and wide implications of these stimulus measures for the
monetary and exchange rate policy management across the globe, including the emerging
markets of East and Southeast Asia. To start, a weaker USD against major currencies
around the world was reported in the past QEs. The US dollar was in average hovering
around 0.687 and 0.757 against the UK pound sterling and the euro, respectively, during the
three months period prior to implementation of the QE-1. By the final three months of QE-1,
the US dollar has depreciated by almost 11 percent against the UK pound sterling and 9.2
percent against the euro. As for the final three months of the QE-2, the US currency
weakened by around 6 percent against the pound sterling and the Japanese yen, and at
around 11.6 percent against the euro from the average rates reported during the last three
months prior to the implementation of the QE-2. Similar general trends were reported in
currencies of major Latin American economies such as Brazilian real, Mexican peso and the
East and Southeast Asian currencies such as Korean won and Indonesian rupiah (Figure
21). The strong domestic currency against the US dollar and the weak demand due to slow
GDP growth impose risk to the competitiveness of export products of these emerging
markets. Many central banks, including in the East and Southeast Asian region, had to
intervene and manage the appreciation pressure and volatility of the local currencies, and
absorbed the balance sheet costs of these intervention.

33
Figure 21: Quantitative Easing and the US dollar Rates
Note: An increase in the rate implies an appreciation of the US dollar. Source: CEIC database
Furthermore, managing asset bubble and headline inflation have become more
complex as well amidst these global stimulus. As discussed earlier (and demonstrated by
Figure 19), international bank lending has fuelled a rise in the residential property price. In
addition, a rise in the past quantitative measures underpinned rising commodity prices, and
potential similar consequences of the latest QE should also be anticipated. The world
commodity price index rose as much as 29.4 percent and 31.7 percent at the peak reached
in October 2009 for the QE-1 and April 2011 for the QE-2, respectively, from the levels one
month prior to the implementation of those policies (Figure 22). The rise was particularly felt
in the energy sector with the commodity fuel price index rose well above 40 percent during
each of the two QE episodes. The combination of surges in the asset and commodity prices
contributed to the unanchored inflation expectation and thus complicated further the
management of price stability in many economies across the globe, particularly those
experiencing massive inflows of the private capitals. In the second half of 2012, we
witnessed announcements and implementations of multiple stimuli by the monetary
authorities/central banks of the advanced economies (Box 1). The combination of stimulus
efforts will undoubtedly make the management of monetary and exchange rate policies even
more complex for the regional central banks in Asia.
0
2,000
4,000
6,000
8,000
10,000
12,000
14,000
0
200
400
600
800
1,000
1,200
1,400
1,600
1 USD = Korea Won (Left) 1 USD = Indonesia Rupiah (Right)
QE1 QE2

34
Figure 22: Global Commodity Price Index*
Note: */this index includes both fuel and non-fuel commodities. Source: IMF
Box 1: Recent Monetary Easing Measures in Major Advanced Economies
The Federal Reserve (Fed) embarked on QE3 in September 2012 and anticipated the low federal funds
rate to stay till at least mid‐2015. The newest round of quantitative easing would involve monthly
purchase of additional $40 billion of agency mortgage‐backed securities, and no ceiling or end date was
set. The length of the program would hinge on development of labor market. Meanwhile, the Fed would
continue with its Operation Twist program which started in late 2011 with $ 400 billion and expanded by
another $267 billion in June 2012. The Fed also anticipates the federal funds rate to remain at 0‐0.25
percent till at least mid‐2015.
The European Central Bank (ECB) announced Outright Monetary Transactions (OMT) in August 2012
as the latest easing efforts to improve financial conditions and stimulate growth. The OMT would
replace the Securities Markets Programme (SMP) which was originally introduced in May 2010 and has
accumulated a stock of $ 270 billion. The major difference between OMT and SMP is that purchase
under OMT would be conditional on EFSF/ESM program. Moreover there is no preset limit on the size,
and the coverage would be shorter term bonds (mainly sovereign) at the 1‐3 year maturity.
The Bank of Japan (BoJ) boosted the Asset Purchase Program by 5 trillion yen in April and 10 trillion
Yen ($128 billion) in September 2012. The program was first established in October 2010 with a size of
35 trillion yen, and aimed to enhance monetary easing by reducing long term market interest rates and
risk premiums. Since then the program was expanded several times and currently has a size of 80 trillion
yen. At the same time, the BoJ would continue its zero interest rate policy adopted since October 2010.
The Bank of England (BoE) activated the Extended Collateral Term Repo (ECTR) in June and increased
the Asset Purchase Facility (APF) by £50 billion in July 2012. The ECTR is a contingency liquidity facility
launched in December 2011 that enables the BoE to provide liquidity with a much wider range of
collaterals than in normal indexed long term repo operations. The BoE would conduct the operation at
least once a month with a minimum size of £5 billion.
0
50
100
150
200
250
QE1 QE2
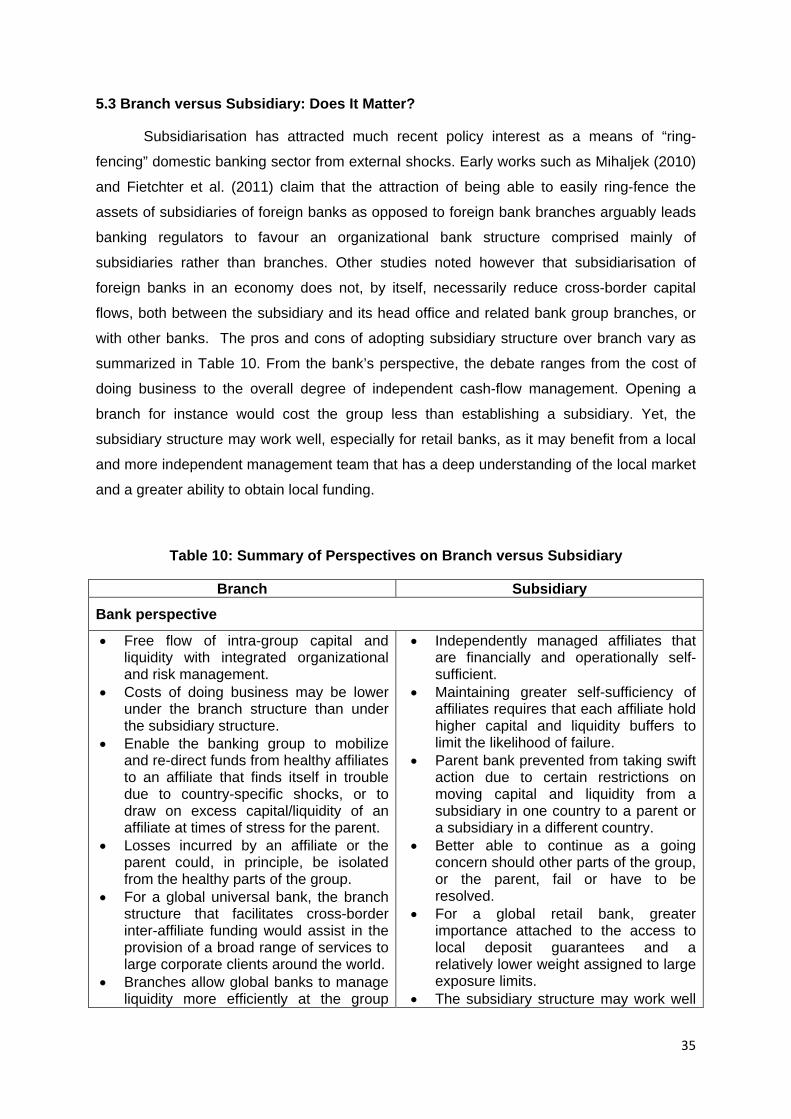
35
5.3 Branch versus Subsidiary: Does It Matter?
Subsidiarisation has attracted much recent policy interest as a means of “ring-
fencing” domestic banking sector from external shocks. Early works such as Mihaljek (2010)
and Fietchter et al. (2011) claim that the attraction of being able to easily ring-fence the
assets of subsidiaries of foreign banks as opposed to foreign bank branches arguably leads
banking regulators to favour an organizational bank structure comprised mainly of
subsidiaries rather than branches. Other studies noted however that subsidiarisation of
foreign banks in an economy does not, by itself, necessarily reduce cross-border capital
flows, both between the subsidiary and its head office and related bank group branches, or
with other banks. The pros and cons of adopting subsidiary structure over branch vary as
summarized in Table 10. From the bank’s perspective, the debate ranges from the cost of
doing business to the overall degree of independent cash-flow management. Opening a
branch for instance would cost the group less than establishing a subsidiary. Yet, the
subsidiary structure may work well, especially for retail banks, as it may benefit from a local
and more independent management team that has a deep understanding of the local market
and a greater ability to obtain local funding.
Table 10: Summary of Perspectives on Branch versus Subsidiary
Branch Subsidiary
Bank perspective
Free flow of intra-group capital and liquidity with integrated organizational and risk management.
Costs of doing business may be lower under the branch structure than under the subsidiary structure.
Enable the banking group to mobilize and re-direct funds from healthy affiliates to an affiliate that finds itself in trouble due to country-specific shocks, or to draw on excess capital/liquidity of an affiliate at times of stress for the parent.
Losses incurred by an affiliate or the parent could, in principle, be isolated from the healthy parts of the group.
For a global universal bank, the branch structure that facilitates cross-border inter-affiliate funding would assist in the provision of a broad range of services to large corporate clients around the world.
Branches allow global banks to manage liquidity more efficiently at the group
Independently managed affiliates that are financially and operationally self-sufficient.
Maintaining greater self-sufficiency of affiliates requires that each affiliate hold higher capital and liquidity buffers to limit the likelihood of failure.
Parent bank prevented from taking swift action due to certain restrictions on moving capital and liquidity from a subsidiary in one country to a parent or a subsidiary in a different country.
Better able to continue as a going concern should other parts of the group, or the parent, fail or have to be resolved.
For a global retail bank, greater importance attached to the access to local deposit guarantees and a relatively lower weight assigned to large exposure limits.
The subsidiary structure may work well

36
level. Counterparty and liquidity risks reduced
through internalization of clearing and settlement of securities and cash payment obligations.
for retail banks, as it may benefit from a local management team that has a deep understanding of the local market and a greater ability to obtain local funding.
Policymaker perspective (host country)
Branches could provide host country borrowers with easier access to foreign credit.
The host country is better off with the branch structure if facing a shock to the domestic economy or the financial system as the branch structure entails stronger commitment, in principle, on the part of the parent bank to support its affiliates.
In the event that an affiliate operating in a host country falls into distress, the host country would have a relatively lighter obligation and burden when dealing with a branch, which is the responsibility of the parent bank and home authorities, than with a subsidiary.
The subsidiary model could be better for local market development as subsidiaries are more likely to rely on local savings.
Supervisory control and oversight responsibility of the host country are greater under the subsidiary structure.
Subsidiary structure permits host country supervisor to impose the regulations that could protect the depositors of the institutions doing business in their jurisdiction.
The host country is better off with the subsidiary structure when facing adverse external shocks as it is easier to ring-fence the subsidiaries of foreign banks than their branches.
Organizing banking groups as a constellation of separate legal subsidiaries may facilitate implementation of recovery and resolution plans that provide systematic and holistic blueprints to facilitate orderly wind-down of systemically important financial groups in the event of failures.
Furthermore from the perspective of the supervisor of the host economies, financial
stability benefit of subsidiary or branch may in fact be influenced by the origin of the
economic and financial turbulence.
If the parent bank in the home jurisdiction or head office-related entities run
into liquidity or solvency problems: a ring-fenced foreign bank subsidiary may
be more isolated from these problems elsewhere in its bank group. The
subsidiary holds its own assets and capital that are legally separate from the
parent bank. The parent bank and creditors of the parent bank have no
recourse to the assets of the subsidiary, and can only recover the capital that
the parent bank has invested in the subsidiary after creditors and deposits of
the subsidiary have been paid. The host jurisdiction banking regulator also
has greater control over the liquidation of the subsidiary.

37
If the foreign bank subsidiary in the host jurisdiction runs into liquidity or
solvency problems (that are unrelated to the parent bank): the flip-side of
ring-fencing is that the subsidiary may be perceived to have less support from
the parent bank and its bank group, and also from the home jurisdiction
regulator. This places the burden of lender-of-last resort on the host
jurisdiction regulator.
Local economic conditions of the host and home countries also influence significantly
the performance of the subsidiary and branch of the global banks. During the past economic
and financial crisis, originated predominantly from the emerging economies, foreign bank’s
branch and subsidiary performed more robustly and efficiently than domestic commercial
banks, as demonstrated by a more stable lending and a more aggressive action against bad
loans. However during the recent global financial crisis, the branch and subsidiary of the
foreign banks in general cut back their bank lending more aggressively, particularly in
Eastern Europe. Furthermore studies have also reported a high presence of foreign bank
increases exposure of host economies to cyclical conditions in the home countries of those
banks.
Furthermore, it is not clear that the market differentiated between branches and
subsidiaries of a bank group that was in trouble during the recent global financial crisis. A
classic example is the case of the Lehman Brothers. The loss of confidence in Lehman
Brothers affected both branches and subsidiaries alike, leading to the collapse of the whole
group. Similarly, based on the balance sheets of a number of major foreign banks in the
ASEAN+3 region (listed in Table 2), both subsidiaries and branches seem to weather their
crisis equally well. As reported and discussed earlier, capital adequacy levels in general
remain above Basel II and in some cases of the Basel III requirements. Furthermore, these
foreign banks continued to sustain profit amid the volatile global financial market. As far as
their lending and liquidity position, our limited observation fails to detect a significant gap
between subsidiary and branch. Nonetheless, a more in-depth research with a much more
comprehensive data of the banking system of the region is urgently needed to generate a
more conclusive finding.
To manage any potential high cost of bail-out, the United States Federal Reserve in
December 2012 proposed that the policy on the foreign banks be tightened to protect
taxpayers from having to bail them out. The US has traditionally relied on foreign supervisors
to watch overseas banks, allowing them to hold less capital than their domestic counterparts.
The 2010 Dodd-Frank broad overhaul of the US financial landscape put an end to that
policy, after the Federal Reserve was forced to extend hundreds of billion dollars in

38
emergency loans to overseas banks in the financial crisis. The recent move will require
foreign banks to group all their subsidiaries under a holding company, subject to same
capital standards as US holding companies.
6. Brief Concluding Remarks
As clearly demonstrated in a recent global financial crisis, the economic shocks from
one part of the world can swiftly be transmitted to another via both trade and financial
channels. For the emerging markets of the ASEAN+3 economies, banking remains a key
transmission channel of shock through the financial sector. The increasing presence and
importance of the foreign banks in the domestic economy have not only been beneficial, but
have also increased the exposure of the local economy to volatilities of the global financial
markets.
The objective of this study is to identify a number of features and characteristics of
foreign banks’ activities in East and Southeast Asian economies. In particularly, the study
highlights certain key fundamental challenges facing the regulatory institution and central
banks in dealing with these global banks. There are a number of regulatory and supervisory
adjustments to be considered nationally, regionally and even globally. At these different
levels of policy formulations, designs and implementations are increasingly needed to be
carried out in a coordinated manner to maximize the effectiveness of the measures given the
highly integrated banking system. Concurrently, it is also important to recognize that over-
regulated banking system could potentially limit the benefits of having foreign banks for the
domestic economy.

39
Reference:
1. Auboin, M (2009), “The Challenges of Trade Financing”, VOX Research-based Policy, http://www.voxeu.org/index.php?q=node/2905.
2. BAFT (2009), Third Benchmark Survey of International Trade Finance Markets, www.baft.org.
3. Bernanke, B.S. (1983), “Nonmonetary Effects of the Financial Crisis in the Propagation of the Great Depression”, American Economic Review, no. 73, pp. 257-276.
4. Bernanke, B.S. (1995), “The Macroeconomics of the Great Depression: A Comparative Approach”, Journal of Money, Credit and Banking, 27, pp. 1-28.
5. Cetorelli, N. and Goldber, L.S. (2008), “Banking Globalization, Monetary Transmission, and the Lending Channel,” NBER Working Papers, no. 14101.
6. Cetorelli, N. and Goldberg, L.S. (2009), “Globalized Banks: Lending to Emerging Markets in the Crisis”, Staff Report no. 377, the Federal Reserve Bank of New York, June.
7. Claessens, S. and van Horen, N. (2012), “Foreign Banks: Trends, Impacts and Financial Stability”, IMF Working Paper/12/10.
8. Claudio, R (2008), “Credit Chains and Sectoral Comovement: Does the Use of Trade Credit Amplify Sectoral Shocks?’ Policy Research Working Paper Series no.4525, The World Bank.
9. Foot, Michael (2003), “What is Financial Stability and How Do We Get It?” The Roy Bridge Memorial Lecture, http://www.fsa.gov.uk/library/communication/speeches/2003/sp122.shtml
10. Morgan, P. (2011), “Impact of US Quantitative Easing Policy on Emerging Asia”, ADBI Working Paper Series No.321, November.
11. Pontines, V. and Siregar, R. Y. (2012), “How Should We Bank with Foreigners? An Empirical Assessment of Lending Behavior of International Banks to Six East Asian Countries”, CAMA Working Paper 4/2012, the Australian National University.
12. Rosengren, E.S. (2011), “Defining Financial Stability, and Some Policy Implications of Applying the Definition”, Keynote Remarks at the Stanford Finance Forum Graduate School of Business, Stanford University, June 3. http://www.bos.frb.org/news/speeches/rosengren/2011/060311/060311.pdf
13. Siregar, Reza.Y. (2009), “Trade Financing and Export Performance: Experiences of Indonesia, Korea and Thailand”, in eds. Christopher Findlay, Friska Parulian and Jenny Corbett, Linkages between Real and Financial Aspects of Economic Integration in East Asia, ERIA Research Project 2009, No.1,(http://eria.org/pdf/research/y2009/no1/Ch08-DEI01.pdf
14. Siregar, Reza. Y and Choy, Keen Meng (2010), “Determinants of International Bank Lending from the Developed World to East Asia”, IMF Staff Papers, Vol. 57, no. 2, pp. 484-516.
15. Stiglitz, J.E. and Greenwald, B.C. (2003), Towards a New Paradigm in Monetary Economics, Cambridge: Cambridge University Press.
16. Takats, E. (2010), “Cross-border Bank Lending to Emerging Market Economics,” BIS Papers no. 54.
Related Documents