MuniCast® Financial Forecasting Model for Local Governments 1

Welcome message from author
This document is posted to help you gain knowledge. Please leave a comment to let me know what you think about it! Share it to your friends and learn new things together.
Transcript

MuniCast®Financial Forecasting Model
for Local Governments
1
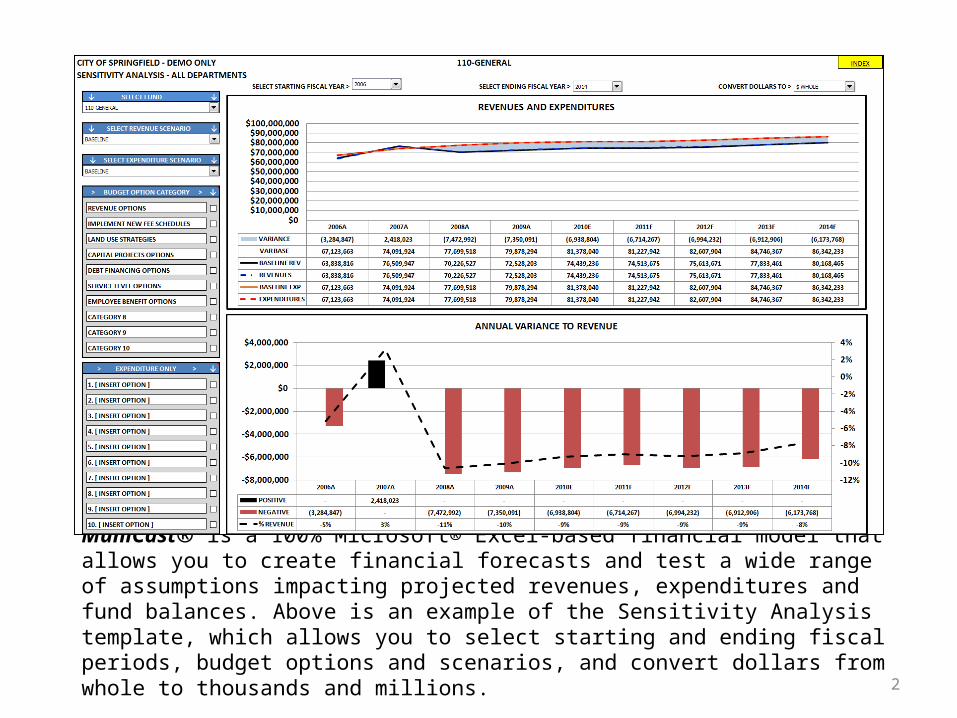
MuniCast® is a 100% Microsoft® Excel-based financial model that allows you to create financial forecasts and test a wide range of assumptions impacting projected revenues, expenditures and fund balances. Above is an example of the Sensitivity Analysis template, which allows you to select starting and ending fiscal periods, budget options and scenarios, and convert dollars from whole to thousands and millions.
2

In this scenario, the selected starting and ending periods are FY2000 and FY2016, respectively. The chart depicts a “baseline scenario” projected structural deficit beyond FY2007, based on forecast assumptions that can be adjusted in the model. Dollars are presented in thousands.
3

By activating the “unfavorable” revenue scenario in the menu to the left of the chart, a greater structural deficit is revealed, both graphically and in tabular form. The ending year has been expanded to FY2017, and annual deficits are more than double the “baseline” scenario on the previous page.
4

In response to an unfavorable economic scenario that generates revenue shortfalls, a “restrained” expenditure scenario, defined in the Forecast Assumptions section of the model, can be activated to demonstrate the mitigating impact of a contingency plan that reduces expenditures in the event revenue targets are not met over the next several years.
5

In addition to a range of scenarios impacting all revenues and expenditures, specific budget options can be easily created and tested in the model. In this example, the “Revenue Options” budget option category is activated to demonstrate how proposed new taxes could close the structural deficit over the next several years.
6

A menu of budget options can be created, providing decision-makers with multiple revenue and spending alternatives. In this example, new user fee schedules are implemented along with the tax revenue options, to not only close the gap but generate a small surplus in FY2016 and beyond.
7

In this example, activation of the “Land Use Strategies” option generates new developer fee revenues as illustrated in both charts beginning in FY2012.
8

Detailed multi-year capital improvement projects can be input into the model and variations of CIP spending scenarios can be demonstrated as in this example showing a higher expenditure level (dotted red line) with activation of “Capital Projects Options”. Both proposed capital outlays and related new operating and maintenance costs can be input into the model.
9
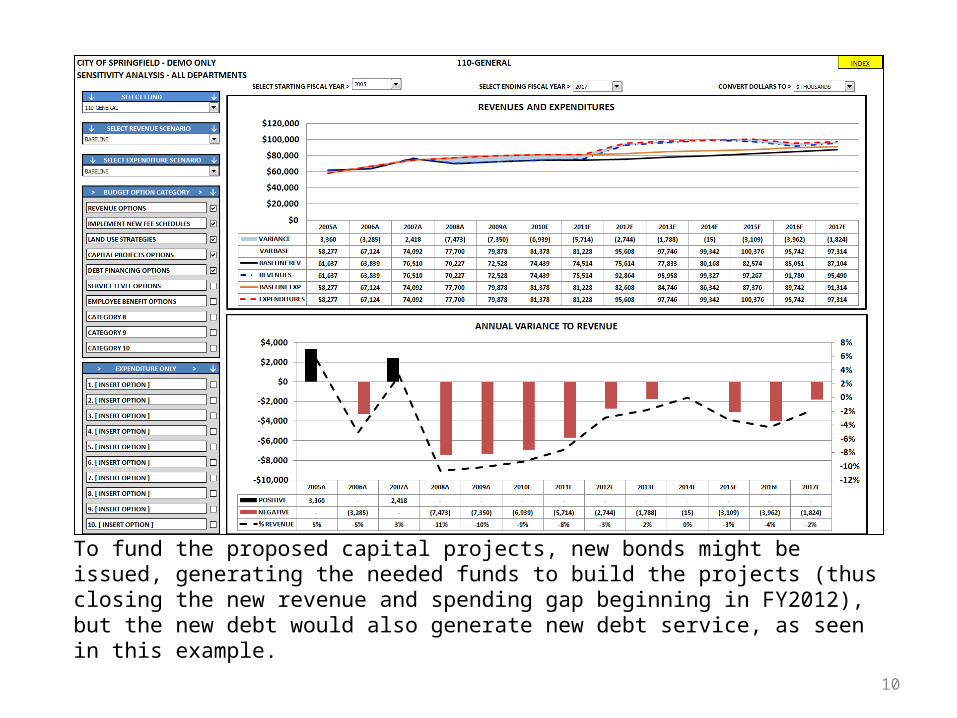
To fund the proposed capital projects, new bonds might be issued, generating the needed funds to build the projects (thus closing the new revenue and spending gap beginning in FY2012), but the new debt would also generate new debt service, as seen in this example.
10

Budget options can be categorized by revenues and expenditures, and/or in a manner that complements similar policy categories in the organization’s strategic plan. This example shows the impact of activating the “Service Level Options” category, which adjusts certain services and costs beginning FY2012.
11

Interactive graphical and tabular pro forma data are presented throughout the model. Typical presentations include 10 years of historic data and 20 years of projected revenues, expenditures and fund balances. Revenue and expenditures are custom-classified and grouped to meet the user’s reporting requirements.
12

Using the interactive Trend Analysis chart, you can select revenue or expenditure accounts, starting and ending fiscal periods, and key metrics such as % Annual Change, Per Capita, and % of Total, to analyze each line item.
13

In this example, General Sales Tax is the selected revenue account along with a Per Capita Metric, which is measured on the right-hand axis.
14
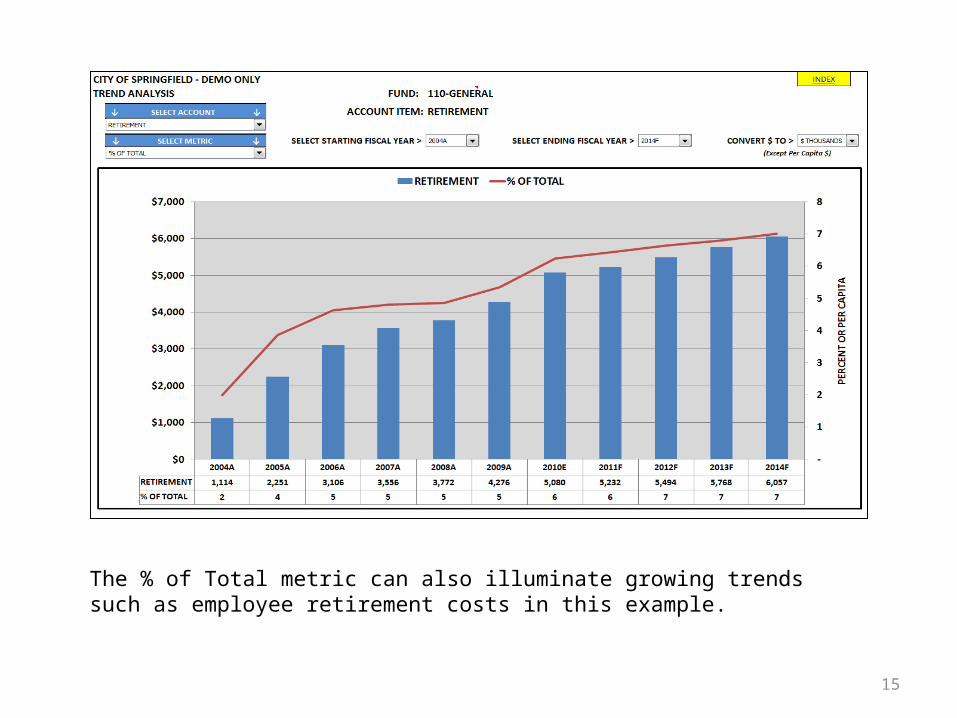
The % of Total metric can also illuminate growing trends such as employee retirement costs in this example.
15

Because MuniCast’s financial tables and charts are driven by detailed revenue and expenditure data, Excel’s pivot reporting feature allows for easy drill-down and sorting of data in a variety of analytical presentations. Data can be selected by fiscal periods and sorted by fund, department-organization, account type and by individual general ledger account number.
16

The Department Analysis template illustrates actual and projected revenues, expenditures and net costs, which can be useful in analyzing department efficiency and activity-based cost analysis.
17

The Index Analysis features a data table for collecting key financial data, demographic and economic indicators, performance metrics and other operating statistics that are converted to an Index of 100 for comparison purposes and identification of correlating variables.
18
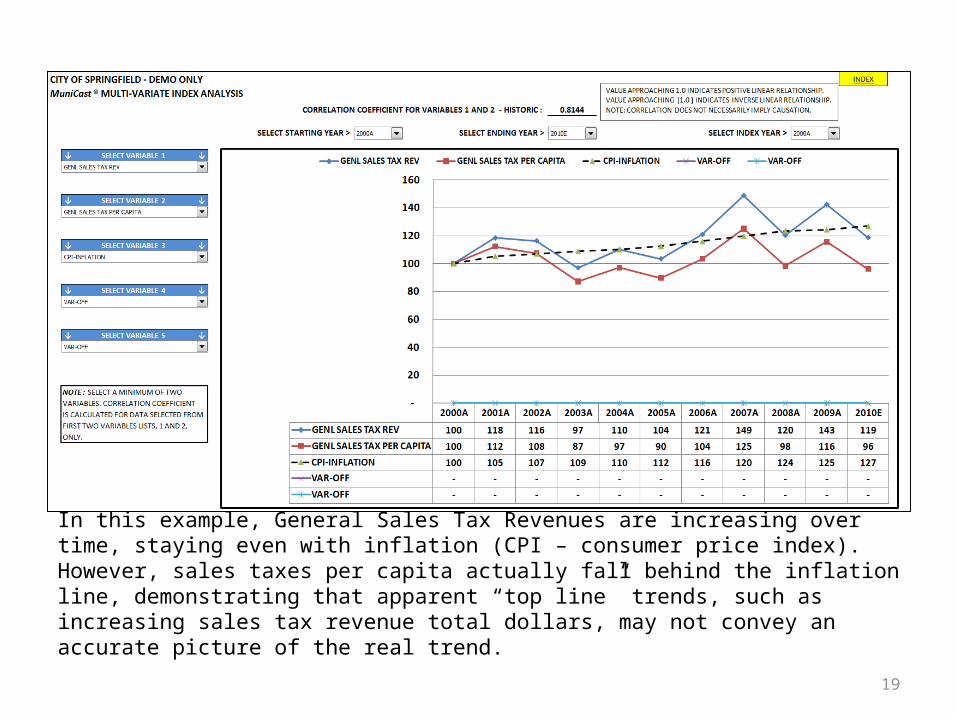
In this example, General Sales Tax Revenues are increasing over time, staying even with inflation (CPI – consumer price index). However, sales taxes per capita actually fall behind the inflation line, demonstrating that apparent “top line” trends, such as increasing sales tax revenue total dollars, may not convey an accurate picture of the real trend.
19

The Correlation Matrix automatically presents the data collected in the Index Analysis data table and calculates correlation coefficients which indicate correlating and sometimes causal relationships between the variables.
20

Forecast assumptions are documented in the model and include account types used for aggregating individual revenue and expenditure accounts for forecasting purposes as well as related key factors and drivers. A documentation section describing how forecasting formulae are derived is included in the model and provides a handy reference when presenting the forecast.
21

Once forecast account types are identified, the annual rate of change table provides a convenient means for establishing and revising forecast assumptions. The complexity of forecasting formulae may differ by account, based on availability of data pertaining to underlying variables.
22

The interactive Chart Gallery provides a dashboard-style view of key metrics used by the organization to track and project critical measurements impacting organization effectiveness and financial health. Starting and ending fiscal periods can be selected and applied to all charts.
23

An example of key metrics included in the interactive Chart Gallery include inflation-adjusted revenues, annual rates of change, salary and benefit trends and other expenditure analysis.
24
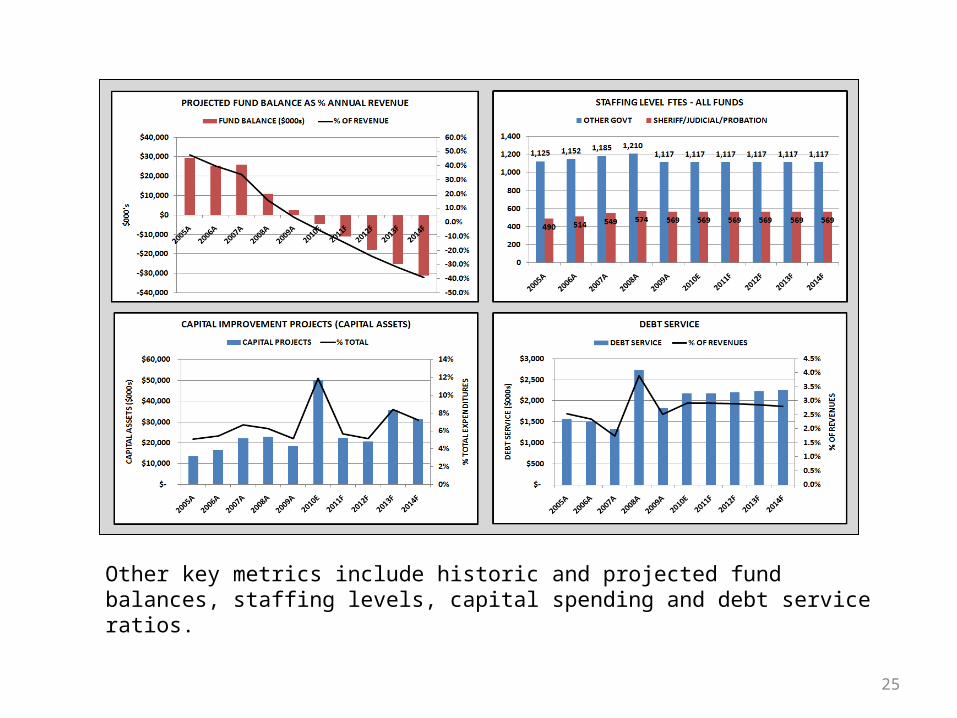
Other key metrics include historic and projected fund balances, staffing levels, capital spending and debt service ratios.
25

MuniCast also features interactive pie charts that allow you to choose fund and fiscal period to compare changes in composition of revenues and expenditures. For example, this page shows revenue and expenditures in FY2004.
26

By selecting FY2011, there is a noted increase in taxes and decrease in intergovernmental revenues as a % of total revenue, and a slight increase in salaries and benefits as compared with FY2004.
27

Other MuniCast® Features Include:Comparative Analysis benchmarking chart gallery allows for comparison of key metrics and ratios with peer organizations;Account Maintenance master file facilitates chart of accounts additions and revisions;Training, Help Desk and customer support included in flat fee implementation price;Model customization and data refreshing services are available;
28

For more information on how GFOA and MuniCast® can help your organization improve its financial
planning processes, please contact:Chris Swanson949-412-6078
29
Related Documents