Mummaloo Hydrological Study September 2012 ISO 9001 QEC22878 SAI Global

Welcome message from author
This document is posted to help you gain knowledge. Please leave a comment to let me know what you think about it! Share it to your friends and learn new things together.
Transcript

Mummaloo Hydrological Study
September 2012
ISO 9001 QEC22878 SAI Global

Top Iron Pty Ltd 2334-01_R01v06
ii
DOCUMENT STATUS
Version Doc type Reviewed by Approved by Date issued
V01 Report CLA CLA 29/05/2012
V02 Report CLA CLA 06/08/12
V03 Report LT Reviewed with comments/changes
27/08/12
V04 Report CLA CLA 31/08/12
V05 Report LT CLA 03/09/2012
V06 Report CLA CLA 06/09/2012
PROJECT DETAILS
Project Name 2334-01_R01v06
Client Top Iron Pty Ltd
Client Project Manager Laura Todd
Water Technology Project Manager Rianda Mills
Report Authors Rianda Mills, Christine Lauchlan Arrowsmith
Job Number 2334-01
Report Number R01
Document Name 2334-01_FinalReport_R01V06 Combined.docx
Cover Photo: Mummaloo tenement. Photo taken during June 2012 site visit.
Copyright
Water Technology Pty Ltd has produced this document in accordance with instructions from Top Iron Pty Ltd for their use only. The concepts and information contained in this document are the copyright of Water Technology Pty Ltd. Use or copying of this document in whole or in part without written permission of Water Technology Pty Ltd constitutes an infringement of copyright.
Water Technology Pty Ltd does not warrant this document is definitive nor free from error and does not accept liability for any loss caused, or arising from, reliance upon the information provided herein.
15 Business Park Drive
Notting Hill VIC 3168
Telephone (03) 9558 9366
Fax (03) 9558 9365
ACN No. 093 377 283
ABN No. 60 093 377 283

Top Iron Pty Ltd 2334-01_R01v06
iii
EXECUTIVE SUMMARY
This hydrological study has been undertaken for the Top Iron’s proposed iron ore mining operations at the Mummaloo tenement. Existing surface water features and characteristics were assessed via:
A literature review;
A site reconnaissance visit;
Analysis of satellite imagery; and
Hydrological / hydraulic modelling and mapping.
The Greater Mummaloo tenements are within the Yarra Monger catchment also known as the Yarra Yarra Drainage Basin. In the Yarra Yarra Drainage Basin, a chain of about 4,500 salt lakes marks a low-lying, 300 km belt which superficially resembles a river because it follows an ancient paleodrainage channel, but the lakes in the chain are no longer connected. The larger lakes in the chain are Hillman (near Kalannie), DeCourcy, Goorly, Mongers, Weelhamby, Nullewah, and the terminal Yarra Yarra Lakes (near Three Springs and Carnamah). These lakes are all over 20 km from the Mummaloo project which occurs on the eastern edge of the drainage basin, and given the distance are unlikely to be impacted by the project.
The climate varies from semi desert to Mediterranean. The region can experience 9 to 11 months of dry weather. Summers are hot and dry and the winters are mild and wet. The median annual rainfall is approximately 200 mm. The wettest months are May, June and July, while the driest months are October, November and December, with medians of 5-7 mm of rain per month.
The Mummaloo tenement’s surface geology is predominantly sandy earths, ironstone gravel and granite outcrops. Water sheds in multiple directions from the Mummaloo-Wye-Bubba Hill, located in the middle of the Mummaloo project tenement. Four key sub-catchments (whose topographically is created by the Mummaloo-Wye-Bubba Hill) fall within the tenement boundary. Of these four sub-catchments, the southern sub-catchment drains in the direction of Lake Karpa, while the remaining three drain either overland or via shallow overland flow paths in other directions toward surrounding un-named topographic depressions (termed basins). These basins have been assessed to be internally draining due to the very low topographic relief and no obvious drainage lines or waterways. The approximate distances from the tenement to each of these saline basins are:
2 km to the North-eastern Un-named Basin;
1 km to the Eastern Un-named Basins;
2.5 km to the Western Un-named Basins; and
2.2 km to Lake Karpa.
Drainage observed on the tenement were generally shallow (<0.5 m deep), indicating that during high rainfall overland or ‘sheet’ flow is likely in many areas. Some flow is transported via more established drainage lines in some areas, and along existing tracks (often with evidence of gullying caused by erosion of surface sediments).
The un-named basins surrounding the tenement are ephemeral saline lakes. Most saline lakes are filled from local runoff and not from a major drainage channel. Some of these lakes rarely contain free water. In most years, surface water does not flow through the lake system at all. Instead, it ponds in waterlogged depressions or poorly defined flow paths, and eventually drains away to the local groundwater table.
Lake Karpa (south of the tenement) has a 1-2 m high artificial windrow around its circumference which would block surface water runoff from the surrounding catchment from entering the Lake, and conversely prevent the Lake from inundating areas outside of the windrow. A pipe was

Top Iron Pty Ltd 2334-01_R01v06
iv
positioned on the southern side of Lake Karpa originating from the near-by Mount Gibson Mine, presumably for discharges from the mine site into the Lake. The natural hydrologic regime of Lake Karpa has therefore already been impacted by the construction of the windrow the introduction of Mount Gibson Mine discharge water.
Karpa Spring is located outside the proposed project area approximately 1.5 km from the south-western edge of the tenement. Springs are surface water expressions generally fed by groundwater. Given the distance of the spring from the Mummaloo project area, and given no dewatering or interception of the groundwater table is proposed by Top Iron, it is unlikely the project will impact on the spring water levels. A significant surface water feature within the Mummaloo tenement is Water Hole A4-1, a cultural heritage site. The Water Hole is 170 x 100 cm and its site boundary has been established as a 10 m radius around the centroid of the Water Hole. This boundary was established based on presence of cultural heritage artefacts around the Water Hole. The Water Hole can be classified as an Isolated Rock Hole, and more specifically, a gnamma hole, which occur in hard rock. Rock holes often remain inundated for some time and can support fauna. Visual assessment of the local terrain suggests that the water hole is almost certainly locally draining, with a contributing sub-catchment of approximately 8 m radius around the Water Hole. This is within the 10 m boundary already established. Top Iron has established a protection buffer around the water hole of 150 m radius to protect the water hole from disturbance.
Two additional water holes have been located by EnviroWorks Consulting during fauna habitat assessments (EnviroWorks, 2012). These water holes are described as follows:
Water Hole 2: A small surface water feature which is approximately 80 cm x 50 cm within the crevice of a large rocky outcrop. It is readily accessible to fauna and is greater than 60 cm deep. The water hole is an Isolated Rock Hole (gnamma hole) occurring in hard rock. It is locally draining, with a contributing sub-catchment of approximately less than 10 m radius around the water hole.
Water Hole 3: A small surface water feature which is approximately 50 cm x 20 cm within the crevice of a rock outcrop. Access to the water is restricted by the small size of the hole. The water hole is an Isolated Rock Hole (gnamma hole) occurring in hard rock. It is locally draining, with a contributing sub-catchment of approximately less than 10 m radius around the water hole.
A hydraulic model was set up to model a suite of rainfall events to further describe surface water movement on the site and to identify areas where surface water drains and collects. Areas of inundation of modelled surface water were in line with known basins, with additional water collecting to the east of the tenement (referred to as the Eastern Un-named Saline Basins). Since Mummaloo-Wye-Bubba Hill occurs within the tenement and drainage occurs in all directions from the hill, in some areas and under higher rainfall the site runoff may be connected to the surrounding basins, although the contribution of water inflow from the tenement areas in the context of the basin catchment areas is relatively small. Regardless, consideration should be given to the quality of water leaving the site and any impacts the development of pits and site features (waste storage areas) may have on drainage.
For areas on site where water drains internally, this water will either evaporate or infiltrate to the groundwater table. Meteorological data was investigated to determine the amount of surface water available for infiltration. Estimated evaporation was compared to rainfall and it was found that from September to February, even under high rainfall, the total evaporation is still much greater than the rainfall. It follows that any water available for groundwater infiltration would have to infiltrate quite rapidly during these months to effect water table levels. This is more likely to occur in areas of sandy soils such as drainage lines or sandy plains. March and May to August show a small positive rainfall residual indicating some groundwater recharge could occur in these months.

Top Iron Pty Ltd 2334-01_R01v06
v
The model results show that the following potential impacts should be considered and managed:
Changes to the hydrological regime of the surrounding un-named basins, Karpa Spring, Lake Karpa and water holes due to the mine layout/pits; and
Changes to the sediment load and other water quality parameters (such as hydrocarbons) into the un-named basins, Karpa Spring, Lake Karpa and Water Hole A4-1 from mine stormwater runoff; and
Inundation of access roads is a further issue in terms of safe site access and egress.
Management measures should be put in place to protect the hydrological regime and water quality of the un-named basins, Karpa Spring, Lake Karpa and the water holes, given that they are likely to provide habitat for local flora and fauna. Such measures include:
Containing stormwater on site in clay-lined sediment ponds to allow settling of sediment and retention for any other water quality treatment which may be required (such as oil-water separation);
Re-using collecting stormwater on site or allowing it to evaporate;
Creating bunding around areas being mined/excavated to protect key surface water features (such as the un-named basins and Karpa Spring) from runoff with a potentially high sediment load;
Avoiding or minimising disturbance to water holes where possible; and
Implementing a suitable surface water monitoring program to verify that the project is not causing unacceptable surface water impacts.
Model results also showed some areas where the access roads may be inundated. Upgrades may be required to the roads to enable greater accessibility and ensure road safety during times of high rainfall. Culverts could be sized and positioned for the deepest road crossings if required.

Top Iron Pty Ltd 2334-01_R01v06
vi
TABLE OF CONTENTS
Executive Summary ..................................................................................................................... iii
1. Study Objectives ............................................................................................................ 1
2. Study Methodology ....................................................................................................... 1
3. Results .......................................................................................................................... 2
3.1 Location and Regional Catchment ........................................................................................... 2
3.1.1 Meteorology ............................................................................................................................ 4
3.1.2 Topography .............................................................................................................................. 6
3.2 Geomorphology and Geology.................................................................................................. 8
3.3 Local Catchments, Drainage and Surface Water Features ...................................................... 9
3.3.1 Local Catchment Mapping ....................................................................................................... 9
3.3.2 Local Drainage ....................................................................................................................... 10
3.3.3 Surface Water Features ......................................................................................................... 16
3.4 Surface Water Modelling ....................................................................................................... 29
3.5 Surface Water / Ground Water Interactions ......................................................................... 34
4. Identification of potential surface water impacts and Recommended Management ...... 35
4.1.1 Potential Surface Water Impacts ........................................................................................... 35
4.1.2 Proposed Management ......................................................................................................... 38
5. Monitoring .................................................................................................................. 39
6. References .................................................................................................................. 43
Appendix A Hydraulic modelling ........................................................................................... 44
LIST OF FIGURES
Figure 3-1 The tenement incorporating waterways, as defined by 1:250,000 mapping. .............. 3 Figure 3-2 Current (2011/12) wet season rainfall totals for Western Australia, showing the
approximate location of Mummaloo. ........................................................................... 4 Figure 3-3 Nighan total daily rainfall (mm/d). Raw data source: BoM. ......................................... 5 Figure 3-4 Mummaloo Topography................................................................................................ 7 Figure 3-5 Soil-landscape Provinces of the Western Region. Source: Tille (2006). ........................ 8 Figure 3-6 Soil-landscape Zones of the Avon Province. Source: Tille (2006). ................................ 9 Figure 3-7 Mummaloo tenement sub-catchments. ..................................................................... 11 Figure 3-8 Mummaloo tenement sub-catchments and tenement drainage. .............................. 12 Figure 3-9 An established natural drainage line on site (looking upstream). Coordinates
6718303 m N, 521791 m E. ......................................................................................... 13 Figure 3-10 An established natural drainage line on site, showing bank erosion and debris.
Coordinates 6718303 m N, 521791 m E. ..................................................................... 14 Figure 3-11 An established natural drainage line near the western boundary. Coordinates
6720373 m N, 521047 m E. ......................................................................................... 15 Figure 3-12 Examples of gullies caused by drainage as photographed during the June 2012 site
visit. Coordinates 6719140 m N, 522645 m E. ........................................................... 15 Figure 3-13 Overland flow area. Coordinates 6720121 m N, 522604 m E. .................................... 16 Figure 3-14 Mummaloo surface water features. ........................................................................... 17 Figure 3-15 Water sampling locations from a 1998 study. Source: Gray, 1998. ............................ 18

Top Iron Pty Ltd 2334-01_R01v06
vii
Figure 3-16 Regolith cross section of Lake Karpa (after Anand and Smith, 2005 (after Smith et al., 1992)). ......................................................................................................................... 19
Figure 3-17 A Western Un-named Basin as photographed during the June 2012 site visit. Coordinates 6719900 m N, 518309 m E. ..................................................................... 20
Figure 3-18 A Western Un-named Basin surface detail as photographed during the June 2012 site visit. Coordinates 6719900 m N, 518309 m E. ............................................................ 20
Figure 3-19 Lake Karpa as photographed during the June 2012 site visit. Coordinates (approx.) 6713603 m N, 520577 m E. ......................................................................................... 21
Figure 3-20 Lake Karpa windrow as photographed during the June 2012 site visit. Coordinates (approx.) 6717268 m N, 522079 m E. ......................................................................... 22
Figure 3-21 Lake Karpa discharge pipe as photographed during the June 2012 site visit. Coordinates (approx.) 6713603 m N, 520577 m E. ..................................................... 23
Figure 3-22 Lake Karpa showing the discharge pipe from a near-by mine and the windrow around the Lake circumference. Source: Google Maps. ............................................. 23
Figure 3-23 Windmill at the Karpa Spring coordinates as photographed during the June 2012 site visit. Coordinates 6714607 m N, 520774 m E. ............................................................ 25
Figure 3-24 Circular topographical depression at the Karpa Spring coordinates as photographed during the June 2012 site visit. Coordinates 6714404 m N, 520792 m E. .................. 26
Figure 3-25 Water Hole A4-1 as photographed during the June 2012 site visit. Coordinates 6718461 m N, 522407 m E. ......................................................................................... 27
Figure 3-26 Water Hole A4-1 maximum depth during the June 2012 site visit. Coordinates 6718461 m N, 522407 m E. ......................................................................................... 28
Figure 3-27 Water Hole A4-1 local area. Coordinates (approx.) 6718461 m N, 522407 m E. ....... 28 Figure 3-28 Water Hole 3. Coordinates 6718554.02 m N, 522353.24 m E. ................................... 29 Figure 3-29 Mummaloo 10 year design event maximum depths. ................................................. 31 Figure 3-30 Mummaloo 50 year design event maximum depths. ................................................. 32 Figure 3-31 Mummaloo 100 year design event maximum depths. ............................................... 33 Figure 3-32 Daily rainfall minus estimated daily evaporation........................................................ 34 Figure 3-33 Monthly maximum rainfall minus mean estimated evaporation. .............................. 34 Figure 4-1 Alluvial deposits within a drainage line. Coordinates 6718303 m N, 521791 m E. ..... 36 Figure 4-2 Debris in an existing drainage line. Coordinates 6720373 m N, 521047 m E. ............ 36 Figure 4-3 Debris and sediment transport deposited adjacent to an existing track. Coordinates
6720118 m N, 523011 m E. ......................................................................................... 37 Figure 4-4 Fine sediment typical of the site. Coordinates unknown............................................ 37 Figure 4-5 Highly turbid waters of the Northern Un-named Basin. Coordinates 6721825 m N,
523610 m E. ................................................................................................................. 38 Figure 5-1 Proposed monitoring sites. ......................................................................................... 42
LIST OF TABLES
Table 3-1 Summary of available meteorological data .................................................................. 5 Table 3-2 Total monthly rainfall statistics. .................................................................................... 6 Table 3-3 Mean daily evaporation per month. ............................................................................. 6 Table 3-4 Model output key features for the 1 in 10, 50 and 100 year events. ......................... 30 Table 5-1 Proposed Surface Water Monitoring Program ........................................................... 40

Top Iron Pty Ltd 2334-01_R01v06
1
1. STUDY OBJECTIVES
The purpose of this hydrological study for the proposed Mummaloo iron ore mining project is to assess the existing surface water characteristics of the site and potential impacts associated with the proposed project. The key objectives are:
Modelling and mapping of surface water catchments and surface water drainage within the project area and surrounding environment;
Site-based reconnaissance to verify assumed model parameters and surface water mapping;
Identification of all existing surface water characteristics at the tenement and within the project zone of influence;
Identification and description of potential surface water impacts within the project zone of influence and associated with the proposed project activities; and
Provision of recommendations regarding surface water management measures for the mine to minimise and mitigate potential impacts on surface water systems.
2. STUDY METHODOLOGY
The following methodology was utilised to meet the study objectives:
1. Background information on meteorology, topography, geology, geomorphology and land systems was reviewed.
2. Surface water mapping was conducted including: a. Catchment mapping and drainage flows identification. b. Wetlands, drainage and surface water features.
3. A hydraulic model was set up to model a suite of rainfall events to help further describe surface water movement on the site and to identify areas where surface water drains and collects.
4. Surface water / ground water interaction was characterised through an assessment of rainfall and evaporation.
5. A site reconnaissance was carried out after heavy rainfall to verify assumed model parameters and surface water mapping.
6. Potential surface water impacts were identified by analysis of surface water flows, available water quality information, areas of inundation and assessing potential project water quality and flow impacts.
7. Recommendation of surface water management measures was undertaken by analysis of potential impacts and management measures that could be applied to these impacts.
8. An ongoing water quality and surface flow monitoring program to verify the project is not causing surface water impacts was recommended.

Top Iron Pty Ltd 2334-01_R01v06
2
3. RESULTS
3.1 Location and Regional Catchment
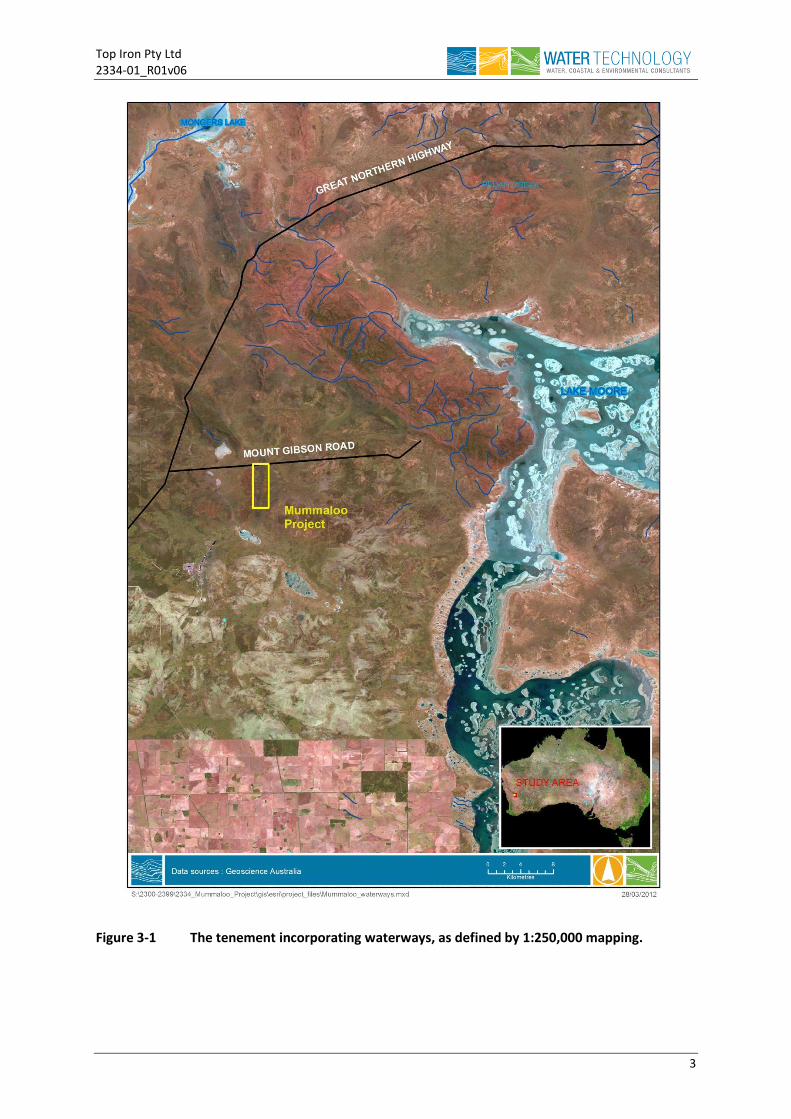
The location of the tenement is shown in Figure 3-1 along with the defined waterways (based on 1:250,000 mapping).
Hydrographic catchment boundaries have been defined by the Western Australian Department of Water for more than 3400 key sites on streams throughout Western Australia. The Greater Mummaloo tenements are within the Yarra Monger catchment also known as the Yarra Yarra Drainage Basin. In the Yarra Yarra Drainage Basin, a chain of about 4,500 salt lakes marks a low-lying, 300 km belt which superficially resembles a river because it follows an ancient paleodrainage channel, but the lakes in the chain are no longer connected. The larger lakes in the chain are Hillman (near Kalannie), DeCourcy, Goorly, Mongers, Weelhamby, Nullewah, and the terminal Yarra Yarra Lakes (near Three Springs and Carnamah). These lakes are all over 20 km from the Mummaloo project which occurs on the eastern edge of the drainage basin, and given the distance are unlikely to be impacted by the project. The resemblance of the lake chain to a river is misleading - although floodwaters regularly meander through long sections of the chain, there are no historical records of continuous flow from one end of the chain to the other. In fact, given the exceedingly low relief (the total fall from Lake Hillman to the terminal Yarra Yarra Lake is only about 50 m, which equates to an average gradient of 0.00167, or 1 m per 6 km), with slight gradient reversals in some sections, it is doubtful that the lake chain has performed as a river at all during modern geological times (Fordyce, 2009).
Top Iron Pty Ltd 2334-01_R01v06
3
Figure 3-1 The tenement incorporating waterways, as defined by 1:250,000 mapping.

Top Iron Pty Ltd 2334-01_R01v06
4
3.1.1 Meteorology
The climate varies from semi desert to Mediterranean. The region can experience 9 to 11 months of dry weather. Summers are hot and dry and the winters are mild and wet. The median annual rainfall is approximately 200 mm. The mean summer average temperatures range from 18.4° C to 37.2° C. The recent 12 month period has been wetter than average for this area, as shown in Figure 3-2.
Figure 3-2 Current (2011/12) wet season rainfall totals for Western Australia, showing the approximate location of Mummaloo.

Top Iron Pty Ltd 2334-01_R01v06
5
Table 3-1 summarises the available Bureau of Meteorology (BoM) rainfall, evaporation and air temperature data recorded nearest the Mummaloo tenement.
Table 3-1 Summary of available meteorological data
Parameter Station Name Station # Distance from tenement
Frequency Available Record
Gauge status
Rainfall Mount Gibson
(29.61° S, 117.41° E)
010075 19 km Daily 1983-2012 Open
Ninghan Station
(29.43° S, 117.29° E)
007068 27 km Daily 1905-2012 Open
Air Temperature (min and max)
Paynes Find
(29.27° S, 117.68° E)
007139 62 km Daily 1975-2012 Open
Dalwallinu (23.42° S, 119.80° E)
008297 86 km Daily 1997-2012 Open
Evaporation1 Paynes Find
(29.27° S, 117.68° E)
007139 62 km Unknown 2000-2008 Closed
The full available record of total daily rainfall recorded at Ninghan station, the station with the longest rainfall record, is presented in Figure 3-3. Missing or poor quality data are indicated in yellow. The time series data is considered sufficiently long to indicate long term rainfall trends.
Figure 3-3 Nighan total daily rainfall (mm/d). Raw data source: BoM.
Table 3-2 provides descriptive statistics of the monthly rainfall totals. The wettest months are May, June and July, while the driest months are October, November and December, with medians of 5-7 mm of rain per month. For all months, the mean is lower than the median indicating the monthly rainfall data are skewed to the left. This means that there are a small number of very low rainfall days causing a lower mean. A high rainfall range is evident across all months, from a minimum of 44 mm/month in November to 312 mm/month in March. Maximum monthly rainfall occurred in March (312 mm/month), while the minimum experienced across all months was 0-2 mm/month.

Top Iron Pty Ltd 2334-01_R01v06
6
Table 3-2 Total monthly rainfall statistics.
Parameter Months
J F M A M J J A S O N D
Mean (mm)
20 26 27 25 46 54 49 37 19 12 11 11
Median (mm)
9 14 10 17 33 49 43 32 17 7 5 6
Max (mm) 132 148 312 124 212 123 123 136 86 53 44 102
Min (mm) 0 2 0 1 0 2 0 0 1 0 0 0
Range (mm)
132 146 312 123 212 121 123 136 85 53 44 102
Mean daily evaporation for each month are presented in Table 3-3. This shows that the highest evaporation occurs in December, January and February, while June, July and August have the lowest mean daily evaporation rates.
Table 3-3 Mean daily evaporation per month.
Parameter Months
J F M A M J J A S O N D
Mean – Paynes Find (mm/d)1
11.8 10.9 8.6 5.6 3.6 2.4 2.4 3.1 4.9 7 9.6 11.1
1BoM mean monthly evaporation (mm/d) from Paynes Find station (# 007139). From 1919-2012.
3.1.2 Topography
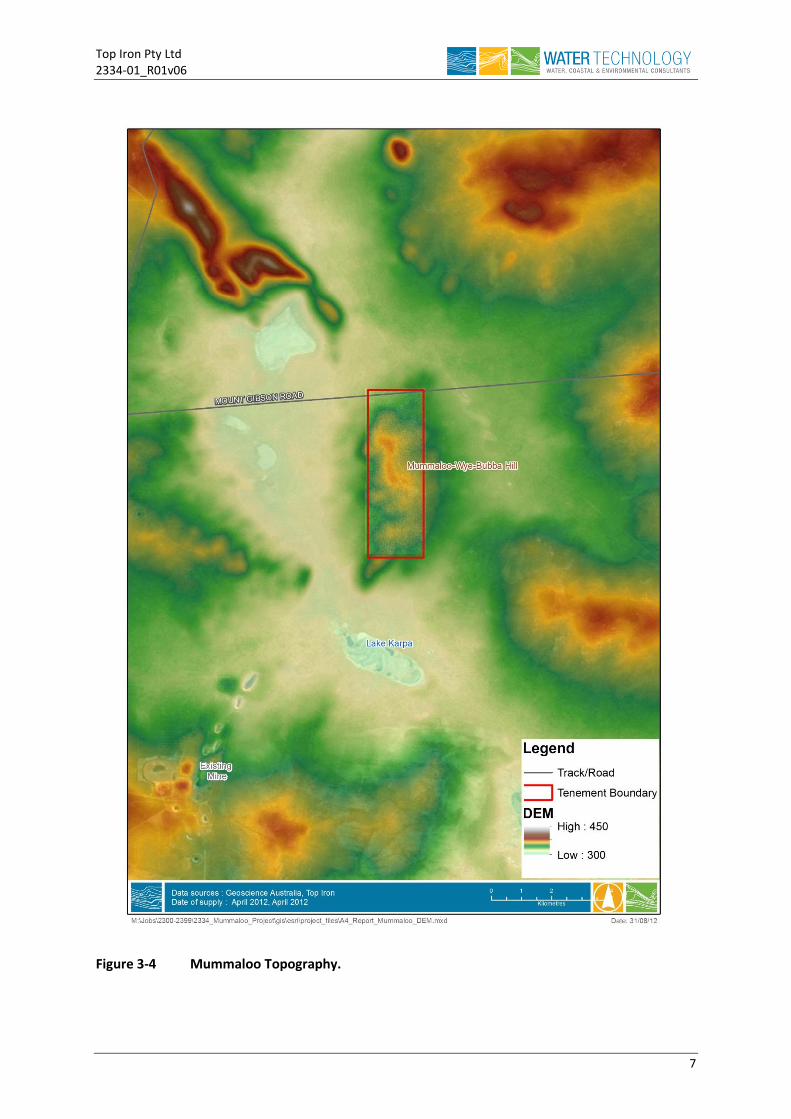
The Geoscience Australia (GA) 1s Digital Elevation Model (DEM) information (SRTM-derived 1 Second Digital Elevation Models Version 1.0) was used for mapping of topography of the broader contributing catchment as shown in Figure 3-4. The overall relief from the top of Mummaloo-Wye-Bubba Hill to the valleys to the north and east of the tenement is gentler than the relief to the south and west, with a drop of ~40 m over a horizontal distance of 3.5 km (~1.1% grade) as opposed to a drop of ~57 m over a similar distance (~1.6% grade). The valley surrounding Mummaloo-Wye-Bubba Hill slopes to the north, however the grade is very subtle and, as shown later in this report, drainage in the valley areas is internal even under the 1 in 100 year design rainfall event (refer to section 3.4).
Top Iron Pty Ltd 2334-01_R01v06
7
Figure 3-4 Mummaloo Topography.

Top Iron Pty Ltd 2334-01_R01v06
8
3.2 Geomorphology and Geology
Preliminary analysis of available maps found that the tenement likely sits in the Avon Province within the Western Region (Figure 3-5). Available maps were difficult to interpret as the tenement is located near the intersection of the Murchison Province and the Avon Province.
The Avon Province is divided into soil-landscape zones (Figure 3-6). The tenement is in the Northern Zone of Ancient Drainage sub-zone within the Avon Province (zone 258). The description by Tille (2006) aptly describes the tenement and immediate surrounds:
Gently undulating terrain (with some sandplains and salt lakes chains) on deeply weathered mantle and alluvium over granitic rocks of the Yilgarn Craton. Sandy earths (mostly yellow and red), Loamy earths (often calcareous), Sandy duplexes, Loamy duplexes, Deep sands and Ironstone gravelly soils.
Further, the north-east of the Avon Province is described as:
…an area of low relief…The valley floors are broad with very low gradients. They only carry flows in very wet years and contain chains of salt lakes.
Figure 3-5 Soil-landscape Provinces of the Western Region. Source: Tille (2006).

Top Iron Pty Ltd 2334-01_R01v06
9
Figure 3-6 Soil-landscape Zones of the Avon Province. Source: Tille (2006).
3.3 Local Catchments, Drainage and Surface Water Features
Aerial imagery was firstly analysed to provide an indication of surface drainage and surface water features. Following this, the DEM (refer to Figure 3-4) was analysed using the Geographic Information System (GIS) analysis tool ArcHydro to determine catchment areas throughout the project zone of influence and surrounding area. A site visit was undertaken in June 2012, immediately following rainfall, in part to ground-truth the ArcHydro output. The ArcHydro sub-catchment boundaries were quite well-approximated in most areas when compared to observations during the site visit. These sub-catchment boundaries were refined following the site visit site visit and analysis of hydraulic modelling results. The resulting interpretation produced four key sub-catchments intersecting the tenement are shown in Figure 3-7.
Site visit observations are also used here to describe the local drainage and surface water features, and to record some important subtleties that could not be ascertained from a desktop review alone.
3.3.1 Local Catchment Mapping
Water sheds in multiple directions from the Mummaloo-Wye-Bubba Hill, located in the middle of the tenement. As shown in Figure 3-7 and Figure 3-8, four key sub-catchments (topographically created by the Mummaloo-Wye-Bubba Hill) fall within the tenement boundary. Of these four sub-catchments, the southern sub-catchment drains in the direction of Lake Karpa, while the remaining three drain via shallow overland flow paths in other directions toward surrounding un-named basins.

Top Iron Pty Ltd 2334-01_R01v06
10
3.3.2 Local Drainage
Drainage from Mummaloo-Wye-Bubba Hill naturally occurs in the direction of the surrounding saline basins (Figure 3-8). The saline basins surrounding the tenement shall here-in be referred to as the North-Eastern Un-named Basin, the Eastern Un-named Basin, the Western Un-named Basins and Lake Karpa, as labelled in Figure 3-7. These saline basins all appear to be internally draining themselves, i.e. they do not appear to connect (via surface water) to a larger system, mainly due to the very low topographic relief. The approximate distances from the tenement to each of these saline basins are:
2 km to the North-eastern Un-named Basin;
1 km to the Eastern Un-named Basins;
2.5 km to the Western Un-named Basins; and
2.2 km to Lake Karpa.
Inundation observed on the tenement was generally shallow (<0.5 m deep), indicating that during high rainfall overland or ‘sheet’ flow is likely in many areas. Some flow is transported via more established drainage lines and along existing tracks (often with evidence of gullying caused by erosion of surface sediments). Figure 3-9 and Figure 3-10 show examples of more established drainage on the tenement near a rock outcrop, and the location of the established drainage line (observed during the site visit) is depicted in navy blue in Figure 3-8. The photographs are of different sections of the same drainage line. The drainage line rises at approximately 521791 mE and 6718303 mN.
Figure 3-11 shows another more established drainage line on the tenement, which rises just inside the western boundary and flattens out (internally draining) within 100 m of the western boundary (outside). The drainage line is approximately 200 m long and up to approximately 1.5 m deep in some areas.
Figure 3-12 shows examples of gullies typically seen along tracks at the Mummaloo tenement. These photos were taken on the tenement eastern boundary line.
A typical overland flow area is shown in Figure 3-13. This area was saturated at the time of the site visit and showed evidence of overland flow to the east.

Top Iron Pty Ltd 2334-01_R01v06
11
Figure 3-7 Mummaloo tenement sub-catchments.

Top Iron Pty Ltd 2334-01_R01v06
12
Figure 3-8 Mummaloo tenement sub-catchments and tenement drainage.

Top Iron Pty Ltd 2334-01_R01v06
13
Figure 3-9 An established natural drainage line on site (looking upstream). Coordinates 6718303 m N, 521791 m E.

Top Iron Pty Ltd 2334-01_R01v06
14
Figure 3-10 An established natural drainage line on site, showing bank erosion and debris. Coordinates 6718303 m N, 521791 m E.

Top Iron Pty Ltd 2334-01_R01v06
15
Figure 3-11 An established natural drainage line near the western boundary. Coordinates 6720373 m N, 521047 m E.
Figure 3-12 Examples of gullies caused by drainage as photographed during the June 2012 site visit. Coordinates 6719140 m N, 522645 m E.

Top Iron Pty Ltd 2334-01_R01v06
16
Figure 3-13 Overland flow area. Coordinates 6720121 m N, 522604 m E.
3.3.3 Surface Water Features
Surface water features are labelled in Figure 3-14 and described further below.
Saline Basins and Salt Lakes
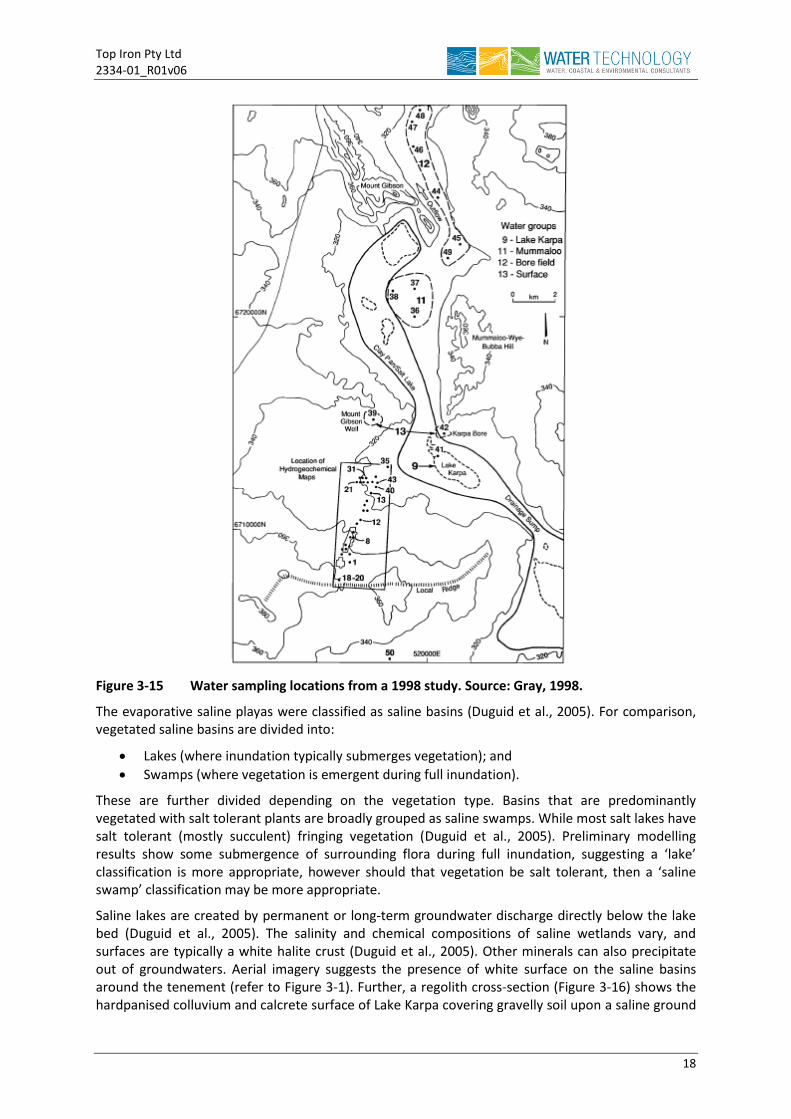
The un-named basins and associated salt lakes surrounding the tenement are ephemeral (Gray, 1998). The main drainage system is dominated by evaporative saline playa, with salinity in Lake Karpa measured at 31% total dissolved solids during a 1998 study (Figure 3-15) (Gray, 1998). The salt lakes that form after rainfall within the catchment are ephemeral or episodic. They burst into their high-productivity phase only occasionally, after episodes of lake-filling rain. This initial flush of runoff water is fairly fresh, but as the lake dries, the water becomes progressively saltier. Eventually, the lake dries out completely. So, whatever organisms are present in the water column have to grow to maturity and reproduce in the few weeks or months before the lake becomes too salty or dries up altogether (Fordyce, 2008). Some of these lakes rarely contain free water. In most years, surface water does not flow through the lake system at all. Instead, it ponds in waterlogged depressions or poorly defined drainage lines, and eventually drains away to the local groundwater table (Yarra Yarra Catchment Management Group, 2012). Like other salt lake systems in the Yilgarn area, the chain of lakes within the catchment follows a pre-existing palaeodrainage system. Erosion and peneplanation of the catchment area made those flows sluggish, and eventually produced the silt-clogged, broad, flat valley-floors that characterise the drainage system today (Fordyce, 2009).

Top Iron Pty Ltd 2334-01_R01v06
17
Figure 3-14 Mummaloo surface water features.
Top Iron Pty Ltd 2334-01_R01v06
18
Figure 3-15 Water sampling locations from a 1998 study. Source: Gray, 1998.
The evaporative saline playas were classified as saline basins (Duguid et al., 2005). For comparison, vegetated saline basins are divided into:
Lakes (where inundation typically submerges vegetation); and
Swamps (where vegetation is emergent during full inundation).
These are further divided depending on the vegetation type. Basins that are predominantly vegetated with salt tolerant plants are broadly grouped as saline swamps. While most salt lakes have salt tolerant (mostly succulent) fringing vegetation (Duguid et al., 2005). Preliminary modelling results show some submergence of surrounding flora during full inundation, suggesting a ‘lake’ classification is more appropriate, however should that vegetation be salt tolerant, then a ‘saline swamp’ classification may be more appropriate.
Saline lakes are created by permanent or long-term groundwater discharge directly below the lake bed (Duguid et al., 2005). The salinity and chemical compositions of saline wetlands vary, and surfaces are typically a white halite crust (Duguid et al., 2005). Other minerals can also precipitate out of groundwaters. Aerial imagery suggests the presence of white surface on the saline basins around the tenement (refer to Figure 3-1). Further, a regolith cross-section (Figure 3-16) shows the hardpanised colluvium and calcrete surface of Lake Karpa covering gravelly soil upon a saline ground

Top Iron Pty Ltd 2334-01_R01v06
19
water table. Mineralisation was evident on Lake Karpa during the site visit, supporting its saline classification.
Figure 3-16 Regolith cross section of Lake Karpa (after Anand and Smith, 2005 (after Smith et al., 1992)).
Most saline lakes are filled from local runoff and not from a major drainage channel (Duguid et al., 2005). One of the Western Un-named Basins and Lake Karpa were inspected during the site visit. The Western Un-named Basin had no water in it at the time of the visit as can be seen in Figure 3-17. Closer inspection of the surface shows saturation of the soil and evidence of dehydration (i.e. cracks) preceding the recent rainfall, as shown in Figure 3-18.
Aerial imagery suggests Lake Karpa is approximately 2.5 km long and 1 km wide at its widest point. During the site visit the Lake was inundated to a length of approximately 300 m (Figure 3-20). The Lake has a 1-2 m high windrow around its circumference (Figure 3-20) which would block surface water runoff from the surrounding catchment from entering the Lake, and conversely prevent the Lake from inundating areas outside of the windrow. Should there be breaks in the windrow, then water could enter/exit the Lake through the breaks. There was insufficient time during the site visit to inspect the entire windrow. A pipe was positioned on the southern side of the Lake presumably for discharges from the near-by Mount Gibson mine, where it originates; however there was no discharge at the time of the site visit (Figure 3-21). Figure 3-22 shows the existing pipe and windrow around the Lake. Therefore the natural hydrologic regime of Lake Karpa has already been impacted by the construction of the windrow the introduction of discharge water from Mount Gibson Mine.

Top Iron Pty Ltd 2334-01_R01v06
20
Figure 3-17 A Western Un-named Basin as photographed during the June 2012 site visit. Coordinates 6719900 m N, 518309 m E.
Figure 3-18 A Western Un-named Basin surface detail as photographed during the June 2012 site visit. Coordinates 6719900 m N, 518309 m E.

Top Iron Pty Ltd 2334-01_R01v06
21
Figure 3-19 Lake Karpa as photographed during the June 2012 site visit. Coordinates (approx.) 6713603 m N, 520577 m E.

Top Iron Pty Ltd 2334-01_R01v06
22
Figure 3-20 Lake Karpa windrow as photographed during the June 2012 site visit. Coordinates (approx.) 6717268 m N, 522079 m E.

Top Iron Pty Ltd 2334-01_R01v06
23
Figure 3-21 Lake Karpa discharge pipe as photographed during the June 2012 site visit. Coordinates (approx.) 6713603 m N, 520577 m E.
Figure 3-22 Lake Karpa showing the discharge pipe from a near-by mine and the windrow around the Lake circumference. Source: Google Maps.

Top Iron Pty Ltd 2334-01_R01v06
24
Springs
Karpa Spring is labelled in the Geosciences Australia water resources layer approximately 1.5 km from the south-western edge of the tenement (refer to Figure 3-14 for the location of the spring). Little is known about Karpa Spring in terms of the volume of water it contributes to the surrounding playa. The Karpa Spring coordinates as defined by Geosciences Australia were visited during the site visit. This location comprised a defunct windmill with an empty water tank next to it (the water tank had holes in it near the base therefore it would not be able to fill) (Figure 3-23). There was no surface water ponding near the location. A circular topographical depression was located near the windmill (Figure 3-24). It was empty at the time of the site visit. It is likely that the natural hydrologic regime of Karpa Spring has been impacted by the windmill.
Springs typically play an important role in wetland creation and length of inundation (Duguid et al., 2005). Some springs produce fairly constant outflow while others vary. Whether producing seepage or a greater flow, springs can support dependent flora and fauna.
Springs are further classified into upland versus lowland, flowing versus non-flowing, saline versus semi-saline or fresh. Longevity, degree of shading and whether in a drainage line also determines the classification. Gray (1998) found the total dissolved solids (TDS) of Karpa Spring to be 0.4 g/mL (1 sample). While this is high, it is considerably less than near-by Lake Karpa (31 g/mL). However, at 0.4 g/mL (4000 ppm) it can be classified as saline at the time of sampling, using the classification of Duguid et al (2005). Karpa Spring is located on the hill slope in the drainage line of the hill (shown later in the hydraulic modelling results, refer to Figure 3-30), approximately 3 m higher in altitude than Lake Karpa and 80 m from the edge of the lake. The Spring is on exposed terrain. Depending on the longevity of flow from Karpa Spring, a suitable classification could be Temporary Minor Spring/Seepage in Exposed Upland Terrain (generally dry), described as (Duguid et al., 2005):
…appear after heavy regional rains and may last from weeks to months. This wetland type includes temporary minor springs and seepages in drainage lines and on hill sides, the latter typically being on the mid-lower slope above a drainage line. A considerable range in salinities is likely.

Top Iron Pty Ltd 2334-01_R01v06
25
Figure 3-23 Windmill at the Karpa Spring coordinates as photographed during the June 2012 site visit. Coordinates 6714607 m N, 520774 m E.

Top Iron Pty Ltd 2334-01_R01v06
26
Figure 3-24 Circular topographical depression at the Karpa Spring coordinates as photographed during the June 2012 site visit. Coordinates 6714404 m N, 520792 m E.
Isolated Rock Holes
Isolated rock holes, such as Water Hole A4-1 (refer to Figure 3-14 for location), are not part of a watercourse or channel but are water holding depressions in outcropping rock (Duguid et al., 2005). Isolated rock holes are completely filled by local runoff (Duguid et al., 2005).
The Water Hole A4-1 is 170 x 100 cm and its site boundary has been established as a 10 m radius around the centroid of the Water Hole (0522407 m E, 6718461 m N). This boundary was established based on presence of artefacts around the Water Hole (YMAC, 2012). The observed dimensions of the Water Hole fit those of gnamma holes, which occur in hard rock. Rock holes often remain inundated for some time and can support fauna (Duguid et al., 2005).
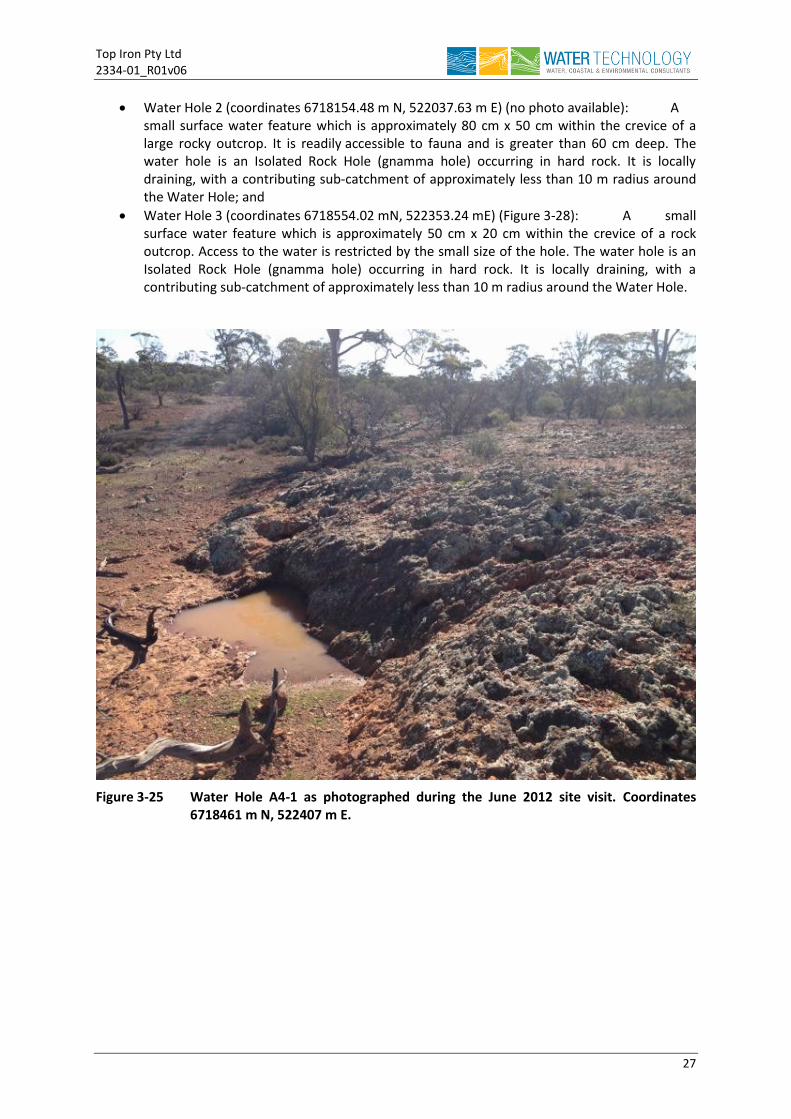
Water Hole A4-1 was inspected during the site visit in June 2012, and is shown in Figure 3-25. The Water Hole was full at the time of the site visit, with approximately 0.6 m of water at its deepest (Figure 3-26). Figure 3-27 shows the local topography surrounding the water hole. Visual assessment of the local terrain suggests that the water hole is almost certainly locally draining, with a contributing sub-catchment of approximately 8 m radius around the Water Hole. This is within the boundary established in the YMAC (2012) report. It should be noted that the coordinates of Water Hole A4-1 as picked up during the site visit were 0522410 m E and 6718467 m N which are slightly offset from those reported in YMAC (2012).
Two additional rock holes were identified by EnviroWorks Consulting (2012) during fauna assessments for the project as follows (refer to Figure 3-14 for locations):
Topographical depression
Top Iron Pty Ltd 2334-01_R01v06
27
Water Hole 2 (coordinates 6718154.48 m N, 522037.63 m E) (no photo available): A small surface water feature which is approximately 80 cm x 50 cm within the crevice of a large rocky outcrop. It is readily accessible to fauna and is greater than 60 cm deep. The water hole is an Isolated Rock Hole (gnamma hole) occurring in hard rock. It is locally draining, with a contributing sub-catchment of approximately less than 10 m radius around the Water Hole; and
Water Hole 3 (coordinates 6718554.02 mN, 522353.24 mE) (Figure 3-28): A small surface water feature which is approximately 50 cm x 20 cm within the crevice of a rock outcrop. Access to the water is restricted by the small size of the hole. The water hole is an Isolated Rock Hole (gnamma hole) occurring in hard rock. It is locally draining, with a contributing sub-catchment of approximately less than 10 m radius around the Water Hole.
Figure 3-25 Water Hole A4-1 as photographed during the June 2012 site visit. Coordinates 6718461 m N, 522407 m E.

Top Iron Pty Ltd 2334-01_R01v06
28
Figure 3-26 Water Hole A4-1 maximum depth during the June 2012 site visit. Coordinates 6718461 m N, 522407 m E.
Figure 3-27 Water Hole A4-1 local area. Coordinates (approx.) 6718461 m N, 522407 m E.
Water Hole A4-1

Top Iron Pty Ltd 2334-01_R01v06
29
Figure 3-28 Water Hole 3. Coordinates 6718554.02 m N, 522353.24 m E.
3.4 Surface Water Modelling
A hydraulic model was set up to model the 1 in 10, 1 in 50 and 1 in 100 year design rainfall events over a suite of durations to help further describe surface water movement and features on the site, and to identify areas where flow internally drains. Details on the hydraulic model configuration can be viewed in Appendix A.
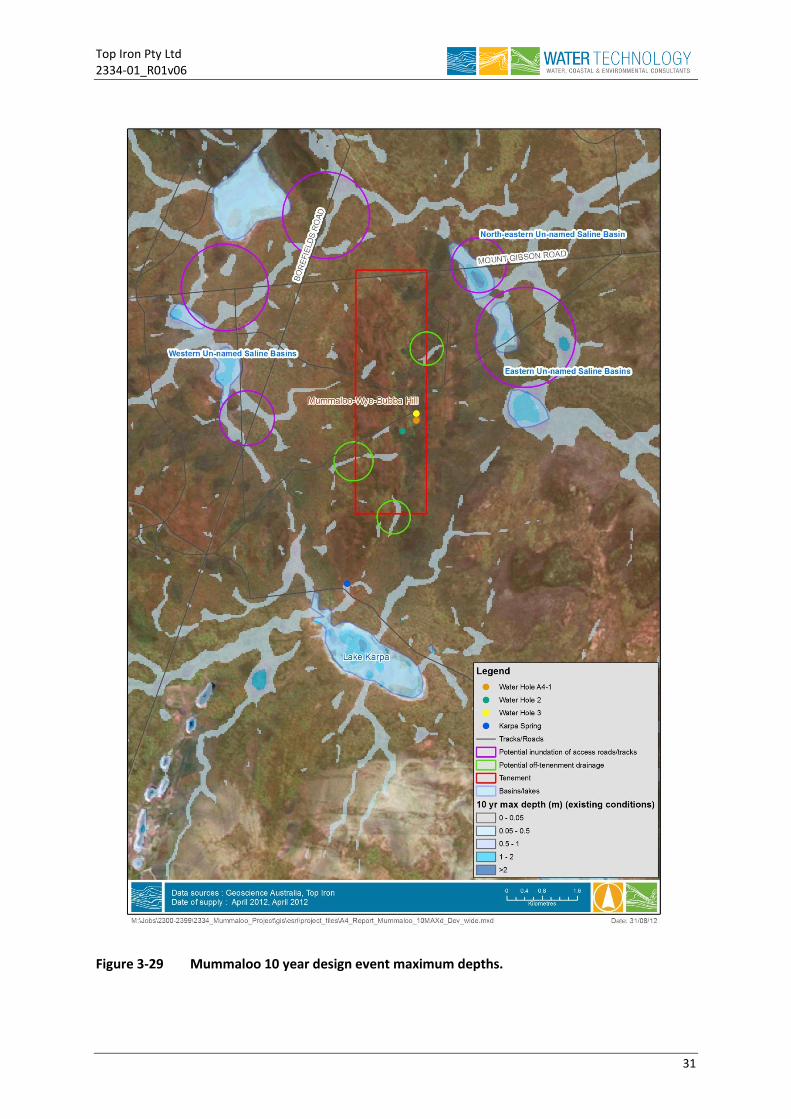
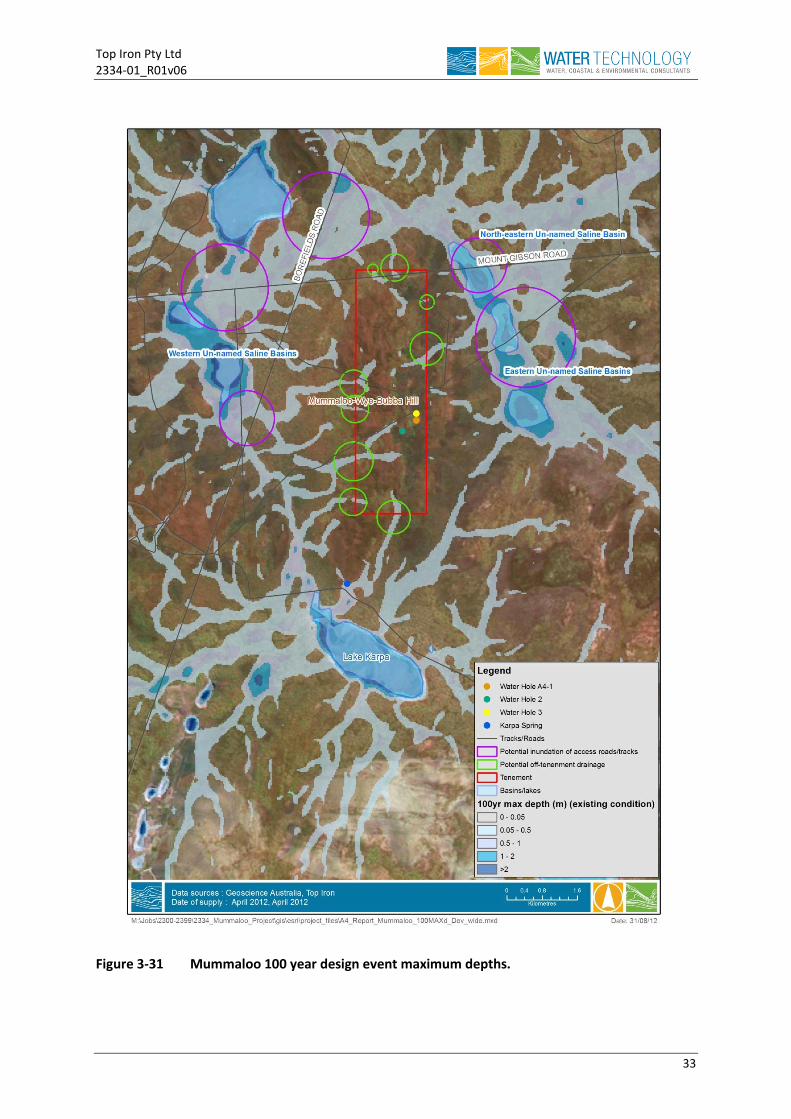
Figure 3-29, Figure 3-30 and Figure 3-31 map maximum depths for the 10, 50 and 100 year rainfall events. Deeper regions of modelled surface water are in line with known lake playas as identified in the Geosciences Australia data and aerial imagery (for example, Figure 3-30), with additional areas of inundation identified east of the tenement (North-eastern Un-named Basin and Eastern Un-named Basins). Key features are noted in Table 3-4. Since a hill occurs within the tenement and drainage occurs in all directions, in some areas and under higher rainfall the site runoff flows toward the surrounding saline basins. Therefore careful consideration must be given to the quality of water leaving the site and any impacts the development of pits and site features (waste mounds/pits) may have on drainage.
Top Iron Pty Ltd 2334-01_R01v06
30
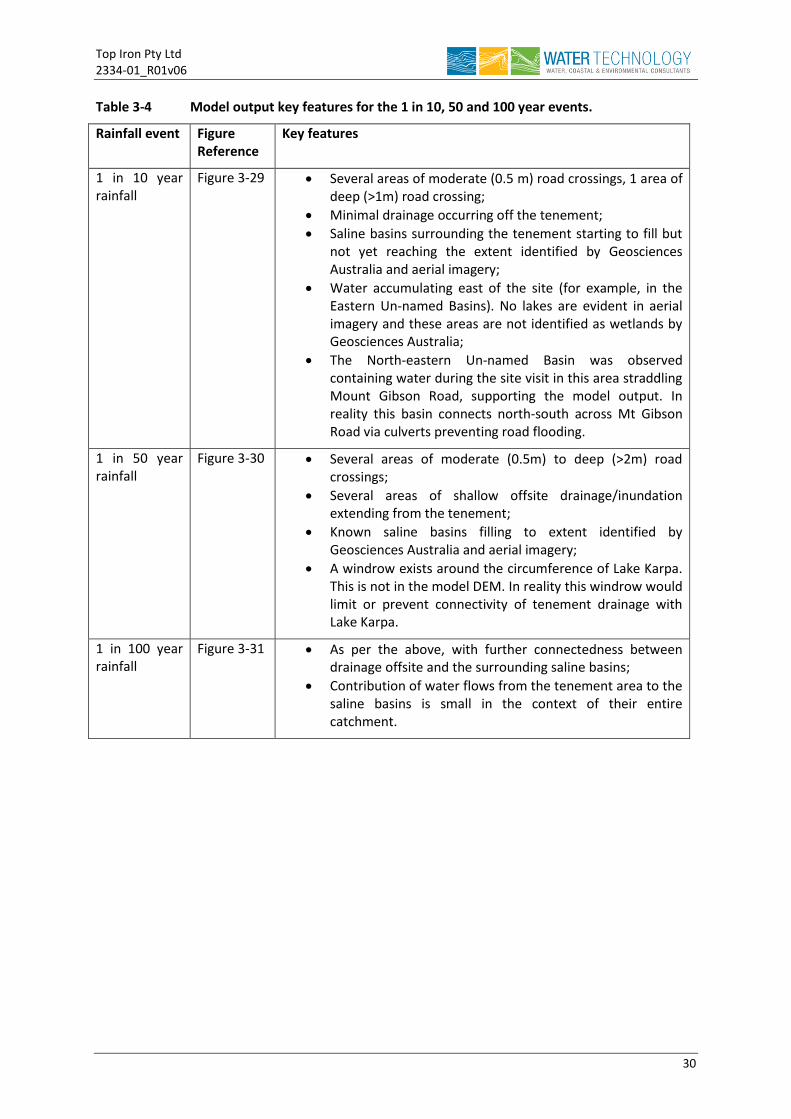
Table 3-4 Model output key features for the 1 in 10, 50 and 100 year events.
Rainfall event Figure Reference
Key features
1 in 10 year rainfall
Figure 3-29 Several areas of moderate (0.5 m) road crossings, 1 area of deep (>1m) road crossing;
Minimal drainage occurring off the tenement;
Saline basins surrounding the tenement starting to fill but not yet reaching the extent identified by Geosciences Australia and aerial imagery;
Water accumulating east of the site (for example, in the Eastern Un-named Basins). No lakes are evident in aerial imagery and these areas are not identified as wetlands by Geosciences Australia;
The North-eastern Un-named Basin was observed containing water during the site visit in this area straddling Mount Gibson Road, supporting the model output. In reality this basin connects north-south across Mt Gibson Road via culverts preventing road flooding.
1 in 50 year rainfall
Figure 3-30 Several areas of moderate (0.5m) to deep (>2m) road crossings;
Several areas of shallow offsite drainage/inundation extending from the tenement;
Known saline basins filling to extent identified by Geosciences Australia and aerial imagery;
A windrow exists around the circumference of Lake Karpa. This is not in the model DEM. In reality this windrow would limit or prevent connectivity of tenement drainage with Lake Karpa.
1 in 100 year rainfall
Figure 3-31 As per the above, with further connectedness between drainage offsite and the surrounding saline basins;
Contribution of water flows from the tenement area to the saline basins is small in the context of their entire catchment.
Top Iron Pty Ltd 2334-01_R01v06
31
Figure 3-29 Mummaloo 10 year design event maximum depths.

Top Iron Pty Ltd 2334-01_R01v06
32
Figure 3-30 Mummaloo 50 year design event maximum depths.
Top Iron Pty Ltd 2334-01_R01v06
33
Figure 3-31 Mummaloo 100 year design event maximum depths.

Top Iron Pty Ltd 2334-01_R01v06
34
3.5 Surface Water / Ground Water Interactions
Internally draining surface water must either evaporate or infiltrate. Modelling results showed that all saline basins immediately surrounding the Mummaloo tenement are internally draining (Figure 3-31).
A time series of daily rainfall available for infiltration was generated by subtracting estimated daily evaporation from total daily rainfall, with the resultant time series presented in Figure 3-32. The daily evaporation time series was generated by applying the mean daily evaporation rate for each month across all days for that month.
Considering the monthly timescales, an estimate of the maximum volume of water available for infiltration over the course of a month is provided in Figure 3-33. This subtracts mean evaporation from the maximum rainfall for each month, and shows that for September to February, even under high rainfall, the total evaporation is still much greater than the rainfall. It follows that any water available for groundwater infiltration would have to infiltrate quite rapidly during these months. This is more likely to occur in areas of sandy soils such as drainage lines or sandy plains. March and May to August show a small positive rainfall residual indicating some groundwater recharge could occur in these months.
Figure 3-32 Daily rainfall minus estimated daily evaporation.
Figure 3-33 Monthly maximum rainfall minus mean estimated evaporation.

Top Iron Pty Ltd 2334-01_R01v06
35
4. IDENTIFICATION OF POTENTIAL SURFACE WATER IMPACTS AND RECOMMENDED MANAGEMENT
The purpose of this section is to:
Identify and describe potential surface water impacts within the project zone of influence; and
Recommend management measures that should be employed to minimise surface water impacts.
4.1.1 Potential Surface Water Impacts
The following potential impacts should be considered:
Changes to the hydrological regime of the surrounding un-named basins, Karpa Spring, Lake Karpa and water holes due to the mine layout/pits; and
Changes to the sediment load and other water quality parameters (such as hydrocarbons) into the un-named basins, Karpa Spring, Lake Karpa and water holes from mine stormwater runoff.
Inundation of access roads is a further issue in terms of safe site access and egress.
Sedimentation and erosion are naturally occurring processes within alluvial systems and are considered a natural part of the landscape in the mid-west. However grazing, roads and clearing can exacerbate erosion and sedimentation issues. Figure 4-1 and Figure 4-2 show flow-induced sediment and debris transport across the tenement (i.e. natural sediment transport), while Figure 4-3 shows sediment flow along an existing track at the time of the site visit. Figure 4-4 shows some fine sediment typical on the tenement. The highly turbid ponding shown in Figure 4-5 immediately east of the tenement within the North-eastern Saline Basin on Mount Gibson Road is further evidence of the current degree of sediment transport already occurring in the area. Some of this is likely due to erosion of tracks under high flow conditions, which are unsealed and unvegetated, therefore have little buffering to protect against erosion. It is unlikely that the sedimentation within the North-eastern Saline Basin (Figure 4-5) is being contributed to a large degree by sediment coming from the tenement area given:
The catchment area contributed by the tenement is comparatively small compared to the North-eastern Basin’s entire catchment;
Modelling shows very little flow coming from the tenement area into the Northern Basin (Figures 3-28, 3-29 and 3-30);
Much of the contribution to sediment in the North-eastern Basin is likely to come from the unsealed Mount Gibson Road which crosses the full extent of this basin and the areas of inundation surrounding it (Figures 3-28, 3-29 and 3-30).
Given the surrounding basins are already impacted by sedimentation, it is recommended that water sedimentation and turbidity is monitored prior to commencement of mining, so that pre-existing water quality is established before mining activities commence.

Top Iron Pty Ltd 2334-01_R01v06
36
Figure 4-1 Alluvial deposits within a drainage line. Coordinates 6718303 m N, 521791 m E.
Figure 4-2 Debris in an existing drainage line. Coordinates 6720373 m N, 521047 m E.

Top Iron Pty Ltd 2334-01_R01v06
37
Figure 4-3 Debris and sediment transport deposited adjacent to an existing track. Coordinates 6720118 m N, 523011 m E.
Figure 4-4 Fine sediment typical of the site. Coordinates unknown.

Top Iron Pty Ltd 2334-01_R01v06
38
Figure 4-5 Highly turbid waters of the Northern Un-named Basin. Coordinates 6721825 m N, 523610 m E.
4.1.2 Proposed Management
Management measures should be put in place to protect the hydrological regime and water quality of the un-named basins, Karpa Spring, Lake Karpa and water holes.
Such measures include:
Containing stormwater on site in clay-lined sediment ponds to allow settling of sediment and retention for any other water quality treatment which may be required (such as oil-water separation);
Re-using collecting stormwater on site or allowing it to evaporate;
Creating bunding around areas being mined/excavated to protect key surface water features (such as the un-named basins and Karpa Spring) from runoff with a potentially high sediment load;
Avoiding or minimising disturbance to water holes where possible; and
Implementing a suitable surface water monitoring program to verify that the project is not causing adverse surface water impacts (refer to section 5).
Model results also showed some areas where the access roads may be inundated in the 50 and 100 year flood events. Upgrades may be required to the roads to enable greater accessibility during times of high rainfall. Culverts could be sized and positioned for the deepest road crossings if required. Some culverts already exist on Mount Gibson Road immediately east of the tenement, however two of the four culverts at this crossing were blocked. Culverts would need to be maintained to ensure proper functionality.
The location of Karpa Spring should be monitored to assist with its characterisation.
Top Iron Pty Ltd 2334-01_R01v06
39
5. MONITORING
It is recommended that the following surface water monitoring program is implemented to establish pre-mining water levels and quality, in order to verify that the project is not causing adverse surface water impacts. A surface water monitoring programme should be used to monitor water quality and or levels in:
Lake Karpa;
Un-named Basins;
Karpa Spring;
Water Hole A4-1, Water Hole 2, Water Hole 3; and
At key locations on the tenement to understand the water quality of the drainage leaving the tenement.
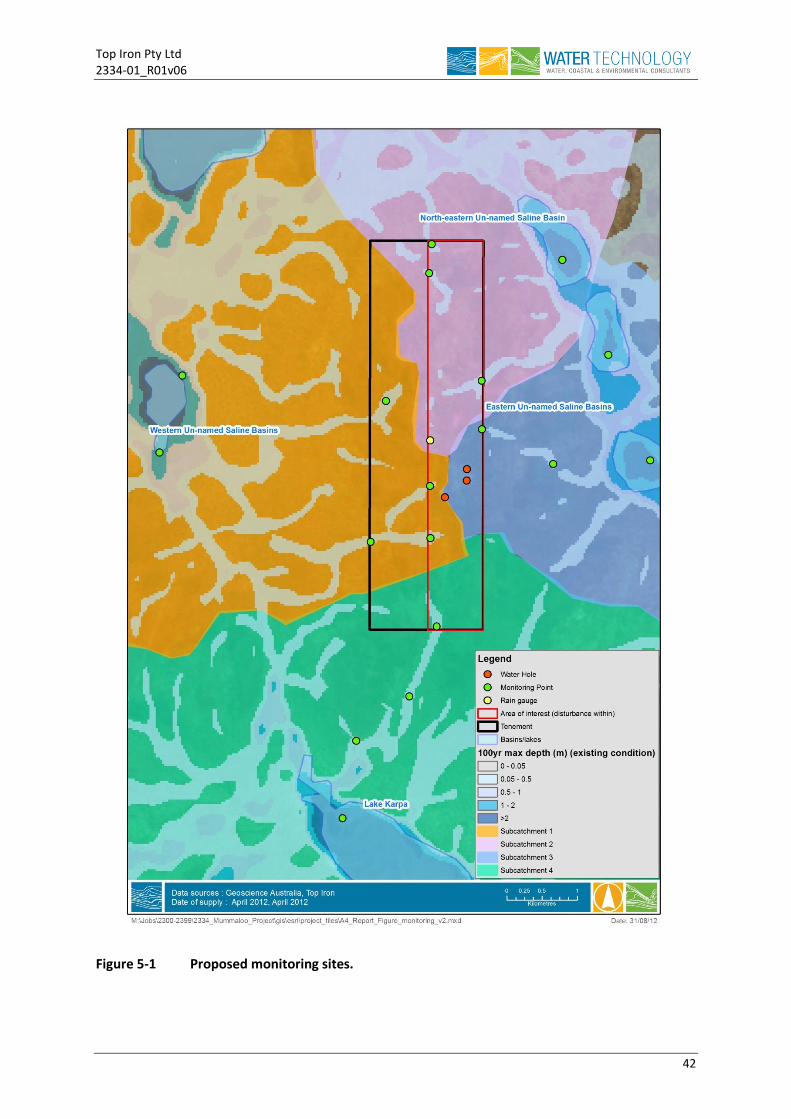
The monitoring program should be established before mining operations commence to obtain baseline data and it should continue for at least a year after rehabilitation has been completed. The monitoring programme will be implemented as soon as possible so that relevant baseline data can be collected taking into account the variability of rainfall events. This may be difficult in the case of the overland flow paths, which will only flow during and immediately following heavy rain, during which times access may be difficult. It is proposed that surface water monitoring is completed opportunistically when surface expressions of water are present at the following locations (Figure 5-1). These locations below were selected based on a combination of the project area of interest (within which disturbance will occur), site observations, hydraulic model output and investigation of high resolution aerial photography – these locations are indicative only and may be modified in the final design of the monitoring program according to accessibility / practicality / mine layout, as long as the overall outcome of comprehensive monitoring of surface water that may be impacted by the project is not altered. Figure 5-1 overlays the proposed monitoring sites onto the 100 year modelling output, the DEM and site aerial, and delineates the sub-catchments, providing further support for the choice of monitoring locations. The proposed surface water monitoring program is outlined in Table 5-1.
North drainage 01 Northing 6721359
Easting 521816
North drainage 02 Northing 6721772
Easting 521850
West drainage 01 Northing 6718326
Easting 521827
West drainage 02 Northing 6717586
Easting 521832
West drainage 03 Northing 6717550
Easting 521045
West drainage 04 Northing 671953
Easting 521197
East drainage 01 Northing 6719824
Easting 522563
East drainage 02 Northing 6719134
Easting 522567
East drainage 03 Northing 6718639
Easting 523579

Top Iron Pty Ltd 2334-01_R01v06
40
South drainage 01 Northing 6716326
Easting 521922
South drainage 02 Northing 6715331
Easting 521532
Water Hole A4-1 Northing 6718467
Easting 522410
Water Hole 2 Northing 6718154
Easting 522038
Water Hole 3 Northing 6718554
Easting 522353
Lake Karpa Northing 6713603
Easting 520577
Karpa Spring Northing 6714607
Easting 520774
Western Un-named Basins 01 Northing 6719900
Easting 518309
Western Un-named Basins 02 Northing 6718803
Easting 517973
Eastern Un-named Basins 01 Northing 6718689
Easting 524961
Eastern Un-named Basins 02 Northing 6720194
Easting 524364
North-eastern Un-named Basin 01 Northing 6721547
Easting 523710
Table 5-1 Proposed Surface Water Monitoring Program
Proposed Analytes Potential Source Frequency
Total Petroleum Hydrocarbons Hydrocarbon spill/ leak
Opportunistically when surface expressions of water are present in the wetland, ideally at least annually, with 3 – 5 water samples taken.
pH, Total Iron, Total Aluminium, DO, Dissolved metals, dissolved salts
Acidic / saline Groundwater from Regional Area
Total N, Total P, coliforms On-site toilets
Nutrients (ammonia, NOx-N), sulphate, Total Iron, Total Aluminium, pH, chlorine, fluoride
Groundwater Treatment Plant
Turbidity, total suspended solids Mobilised sediments from site ground works
Conductivity, salinity, temperature, total dissolved solids
To establish baseline salinities of key water features and of that leaving site.

Top Iron Pty Ltd 2334-01_R01v06
41
It is also proposed that staff gauges are installed at the following locations so that water levels may be read when manual samples are collected (also refer to Figure 5-1).
Water Hole A4-1 Northing 6718467
Easting 522410
Water Hole 2 Northing 6718154
Easting 522038
Water Hole 3 Northing 6718554
Easting 522353
Lake Karpa Northing 6713603
Easting 520577
Western Un-named Basins 01 Northing 6719900
Easting 518309
Western Un-named Basins 02 Northing 6718803
Easting 517973
Eastern Un-named Basins 01 Northing 6718689
Easting 524961
Eastern Un-named Basins 02 Northing 6720194
Easting 524364
North-eastern Un-named Basin 01 Northing 6721547
Easting 523710
Rainfall commonly has high spatial variability therefore an automatic rain gauge is proposed for collection of site-specific rainfall data at the following location on the tenement (also refer to Figure 5-1):
Rain gauge 01 Northing 6718977
Easting 521829
Top Iron Pty Ltd 2334-01_R01v06
42
Figure 5-1 Proposed monitoring sites.

Top Iron Pty Ltd 2334-01_R01v06
43
6. REFERENCES
Anand, R. R. and Smith, R. E. 2005. Mt Gibson Gold Deposit, Western Australia. CRC LEME, CSIRO Exploration and Mining.
Degens, B and Shand, P (Eds). (2010). Assessment of Acidic Saline Groundwater Hazard in the Western Australia Wheatbelt: Yarra yarra, Blackwood and South Coast, CSIRO: Water for a Healthy Country national Research Flagship. 152pp
Duguid, A., Barnetson, J., Clifford, B., Pavey, C., Albrecht, D., Risler, J. and McNellie, M. 2005. Wetlands in the arid Northern Territory. A report to Environment Australia on the inventory and significance of wetlands in the arid NT. Parks and Wildlife Commission of the Northern Territory. Alice Springs.
Enviroworks. 2012. Personal Communication with Ecologist Stephen Connell regarding rock hole locations.
Fordyce, I. 2008. Saltlakes. Yarra Yarra Catchment Management Group Technical Note.
Fordyce, I. 2009. Yarra and Ninghan Drainage Basins – Background (Location, climate, geology, physiology, soils, native vegetation, landuse). Yarra Yarra Catchment Management Group Technical Note.
Gray, D. 1998. Hydrogeochemistry in the Mount Gibson Gold District. CRC LEME open file report 21. CSIRO Division of Exploration Geoscience Report 120R, 1991. Second impression 1998.
Payne, A.L. Van Vreeswyk, A.M.E. Pringle, H.J.R. Leighton, K.A. and Hennig, P. (1998). An inventory and condition survey of the Sandstone-Yalgoo-Paynes Find area, Western Australia, Technical Bulletin No. 90, Agriculture Western Australia
Tille, P. 2006. Soil-landscapes of Western Australia’s Rangelands and Arid Interior. Resource Management Technical Report 313. ISSN 1039-7205. The Department of Agriculture and Food, Government of Western Australia.
Yamatji Marlpa Aboriginal Corporation (YMAC), 2012. Archaeological and Ethnographic Heritage Survey Report. Badimia Native Title Claim. Mouint Bibson Station – Mummaloo. Top Iron Limited. BAD690-1.
Yarra Yarra Catchment Mangement Group. Accessed online [http://www.yarrayarracatchment.org.au/yycmgcatchmentlocation.php]. Accessed 31/08/12.

Top Iron Pty Ltd 2334-01_R01v06
44
APPENDIX A HYDRAULIC MODELLING

Top Iron Pty Ltd 2334-01_R01v06
45
1. Introduction
The purpose of this is to gain an understanding of general flow patterns and runoff characteristics across the project zone of influence for the Mummaloo mining tenement. The modelling will help inform future planning onsite to minimize the risk of inundation, and to assist in identifying the potential impacts of the proposed mining operations on the surface water. This appendix details the development of the hydraulic model.
2. Overview
TUFLOW is a widely used model that is suitable for the analysis of overland flows. When used as part of the direct rainfall on grid method, TUFLOW has five main inputs:
Topography data;
Rainfall data;
Catchment losses;
Site roughness; and
Boundary conditions.
The TUFLOW model was used to apply rainfall and then route flows through the catchment both overland in a 2D domain. The model was constructed using MapInfo V11.0 and text editing software. The double precision version of the latest release (as of January 2011) was used for all simulations.
The 1 in 10, 50 and 100 year Annual Recurrence Interval (ARI) events were modelled using the direct rainfall on grid method for a suite of durations.
2.1 2D Grid Size and Topography
2D domains were sized at 30 m using the 1s DEM. An ASCII grid file was read directly by TUFLOW.
2.2 Roughness
For the 2D domain, a uniform Manning’s roughness of 0.03 was applied. The Manning’s value was specified in the .tmf TUFLOW model file.
2.3 Downstream Boundary
At the downstream boundary where overland flow out of the catchment was present, a ‘HT’ boundary was used to convey the overland flow out the catchment in a steady manner.
Tailwater was estimated at 1 m above the surface level at the downstream boundary. As the boundary is over 20 km downstream from the study site the downstream boundary conditions are unlikely to affect flows at the site.
2.4 Rainfall
A 2d_rf rainfall file was produced in MapInfo for both ARI events which consisted of rainfall polygons. Rainfall was applied uniformly across the entire catchment on only active areas of the model. It is to be noted that areal reduction parameters have not been applied as such the model is considered conservative.
Intensity Frequency Duration (IFD) Parameters were determined at the centroid of the study area using the Bureau of Meteorology IFD program and are shown in Table 1. AusIFD Software and in-house Microsoft Excel tools were then used to produce hyetographs for each required ARI Event and duration for the catchment. These were converted to an appropriate format for input into the TUFLOW hydraulic model. After preliminary investigations it was determined that the critical storm duration across the site varies from the 6 hours to the 48 hours. As such the hydraulic model was run for all of these durations.

Top Iron Pty Ltd 2334-01_R01v06
46
Table 1 IFD Parameters
Catchment Log Normal Intensities (mm) Geographical Factors
2 year ARI 50 year ARI 1hr 12hr 72h 1hr 12hr 72h Skewness
(G) F2 F50
All 15.7 2.81 0.72 34.2 6.26 1.77 0.46 4.59 15.3
2.5 Losses
Initial and continuing losses (of rainfall) were applied uniformly across the study area. Table 2 shows adopted losses taken from AR& R. No losses were defined in AR&R for the 100 year event, therefore the 50 year losses were applied in that case.
Table 2 Initial and continuing losses derived from regional loss equation
ARI Event (years)
Initial Losses (mm) Continuing Losses (mm)
20 37.7 3
50 34.6 3
100 34.6 3
3. Model Checks
The following checks were undertaken on TUFLOW model parameters and outputs and are based on industry standard recommendations:
2D grid size: The model has a 2D grid size of 30 x 30 m.
2D timestep: The 2D timestep on the model was 2 seconds, and is hence within the recommended range.
Model mass errors: The Mass Errors for all models were no greater than 1%, and in most cases less than 0.1% and is hence within the recommended range.
Errors and warning messages: None
2D Model extent: All produced flood extents are not impacted by the edge of the TUFLOW model’s active area.
4. Model Outputs
Maximum depths, velocities and flows are to be used to help inform future planning onsite to minimize the risk of inundation, and to assist in identifying the potential impacts of the proposed mining operations on the surface water. Maximum magnitudes were created using the dat-to-dat function of TUFLOW. Reported maximums are the maximum magnitude in each cell over all storm durations ran of a particular ARI. Key results are available in the main report.
Related Documents