Mon. Not. R. Astron. Soc. 337, 385–400 (2002) Multiwavelength observations of the M15 intermediate-velocity cloud J. V. Smoker, 1 L. M. Haffner, 2 F. P. Keenan, 1 R. D. Davies 3 and D. Pollacco 1 1 Astrophysics and Planetary Science Division, Department of Pure and Applied Physics, The Queen’s University of Belfast, University Road, Belfast BT7 1NN 2 Department of Astronomy, University of Wisconsin, 5534 Sterling Hall, 475 North Charter Street, Madison, WI 53706, USA 3 Jodrell Bank Observatory, University of Manchester, near Macclesfield, Cheshire SK11 9DL Accepted 2002 June 10. Received 2002 May 2; in original form 2001 May 30 ABSTRACT We present Westerbork Synthesis Radio Telescope H I images, Lovell telescope multibeam H I wide-field mapping, William Herschel Telescope long-slit echelle Ca II observations, Wiscon- sin Hα Mapper (WHAM) facility images, and IRAS ISSA 60- and 100-µm co-added images towards the intermediate-velocity cloud (IVC) at +70 km s −1 , located in the general direction of the M15 globular cluster. When combined with previously published Arecibo data, the H I gas in the IVC is found to be clumpy, with a peak H I column density of ∼1.5 × 10 20 cm −2 , inferred volume density (assuming spherical symmetry) of ∼24 cm −3 /D (kpc) and a maximum brightness temperature at a resolution of 81 × 14 arcsec 2 of ∼14 K. The major axis of this part of the IVC lies approximately parallel to the Galactic plane, as does the low-velocity H I gas and IRAS emission. The H I gas in the cloud is warm, with a minimum value of the full width at half- maximum velocity width of 5 km s −1 corresponding to a kinetic temperature, in the absence of turbulence, of ∼540 K. From the H I data, there are indications of two-component velocity structure. Similarly, the Ca II spectra, of resolution 7 km s −1 , also show tentative evidence of velocity structure, perhaps indicative of cloudlets. Assuming that there are no unresolved narrow-velocity components, the mean values of log 10 [N(Ca II K) cm −2 ] ∼ 12.0 and Ca II/H I ∼2.5 × 10 −8 are typical of observations of high Galactic latitude clouds. This compares with a value of Ca II/H I>10 −6 for IVC absorption towards HD 203664, a halo star of distance 3 kpc, some 3. ◦ 1 from the main M15 IVC condensation. The main IVC condensation is detected by WHAM in Hα with central local-standard-of-rest velocities of ∼60–70 km s −1 , and intensities uncorrected for Galactic extinction of up to 1.3 R, indicating that the gas is partially ionized. The FWHM values of the Hα IVC component, at a resolution of 1 ◦ , exceed 30 km s −1 . This is some 10 km s −1 larger than the corresponding H I value at a similar resolution, and indicates that the two components may not be mixed. However, the spatial and velocity coincidence of the Hα and H I peaks in emission towards the main IVC component is qualitatively good. If the Hα emission is caused solely by photoionization, the Lyman continuum flux towards the main IVC condensation is ∼2.7 × 10 6 photon cm −2 s −1 . There is not a corresponding IVC Hα detection towards the halo star HD 203664 at velocities exceeding ∼60 km s −1 . Finally, both the 60- and 100-µm IRAS images show spatial coincidence, over a 0.675 × 0.625 deg 2 field, with both low- and intermediate-velocity H I gas (previously observed with the Arecibo tele- scope), indicating that the IVC may contain dust. Both the Hα and tentative IRAS detections discriminate this IVC from high-velocity clouds, although the H I properties do not. When combined with the H I and optical results, these data point to a Galactic origin for at least parts of this IVC. Key words: ISM: clouds – ISM: general – ISM: individual: Complex gp – ISM: structure – globular clusters: individual: M15 – radio lines: ISM. E-mail: [email protected] 1 INTRODUCTION The study of intermediate-velocity clouds (IVCs) remains one of the most challenging aspects of contemporary Galactic astronomy, with several issues concerning IVCs remaining unresolved. These C 2002 RAS

Welcome message from author
This document is posted to help you gain knowledge. Please leave a comment to let me know what you think about it! Share it to your friends and learn new things together.
Transcript
Mon. Not. R. Astron. Soc. 337, 385–400 (2002)
Multiwavelength observations of the M15 intermediate-velocity cloud
J. V. Smoker,1� L. M. Haffner,2 F. P. Keenan,1 R. D. Davies3 and D. Pollacco1
1Astrophysics and Planetary Science Division, Department of Pure and Applied Physics, The Queen’s University of Belfast, University Road, Belfast BT7 1NN2Department of Astronomy, University of Wisconsin, 5534 Sterling Hall, 475 North Charter Street, Madison, WI 53706, USA3Jodrell Bank Observatory, University of Manchester, near Macclesfield, Cheshire SK11 9DL
Accepted 2002 June 10. Received 2002 May 2; in original form 2001 May 30
ABSTRACTWe present Westerbork Synthesis Radio Telescope H I images, Lovell telescope multibeam H I
wide-field mapping, William Herschel Telescope long-slit echelle Ca II observations, Wiscon-sin Hα Mapper (WHAM) facility images, and IRAS ISSA 60- and 100-µm co-added imagestowards the intermediate-velocity cloud (IVC) at +70 km s−1, located in the general directionof the M15 globular cluster. When combined with previously published Arecibo data, the H I
gas in the IVC is found to be clumpy, with a peak H I column density of ∼1.5 × 1020 cm−2,inferred volume density (assuming spherical symmetry) of ∼24 cm−3/D (kpc) and a maximumbrightness temperature at a resolution of 81 × 14 arcsec2 of ∼14 K. The major axis of this partof the IVC lies approximately parallel to the Galactic plane, as does the low-velocity H I gas andIRAS emission. The H I gas in the cloud is warm, with a minimum value of the full width at half-maximum velocity width of 5 km s−1 corresponding to a kinetic temperature, in the absenceof turbulence, of ∼540 K. From the H I data, there are indications of two-component velocitystructure. Similarly, the Ca II spectra, of resolution 7 km s−1, also show tentative evidenceof velocity structure, perhaps indicative of cloudlets. Assuming that there are no unresolvednarrow-velocity components, the mean values of log10[N(Ca II K) cm−2] ∼ 12.0 and Ca II/H I
∼2.5 × 10⁻⁸ are typical of observations of high Galactic latitude clouds. This compares with avalue of Ca II/H I>10−6 for IVC absorption towards HD 203664, a halo star of distance 3 kpc,some 3.◦1 from the main M15 IVC condensation. The main IVC condensation is detected byWHAM in Hα with central local-standard-of-rest velocities of ∼60–70 km s−1, and intensitiesuncorrected for Galactic extinction of up to 1.3 R, indicating that the gas is partially ionized.The FWHM values of the Hα IVC component, at a resolution of 1◦, exceed 30 km s−1. This issome 10 km s−1 larger than the corresponding H I value at a similar resolution, and indicatesthat the two components may not be mixed. However, the spatial and velocity coincidence ofthe Hα and H I peaks in emission towards the main IVC component is qualitatively good. Ifthe Hα emission is caused solely by photoionization, the Lyman continuum flux towards themain IVC condensation is ∼2.7 × 10⁶ photon cm−2 s−1. There is not a corresponding IVC Hα
detection towards the halo star HD 203664 at velocities exceeding ∼60 km s−1. Finally, boththe 60- and 100-µm IRAS images show spatial coincidence, over a 0.675 × 0.625 deg2 field,with both low- and intermediate-velocity H I gas (previously observed with the Arecibo tele-scope), indicating that the IVC may contain dust. Both the Hα and tentative IRAS detectionsdiscriminate this IVC from high-velocity clouds, although the H I properties do not. Whencombined with the H I and optical results, these data point to a Galactic origin for at least partsof this IVC.
Key words: ISM: clouds – ISM: general – ISM: individual: Complex gp – ISM: structure –globular clusters: individual: M15 – radio lines: ISM.
�E-mail: [email protected]
1 I N T RO D U C T I O N
The study of intermediate-velocity clouds (IVCs) remains one ofthe most challenging aspects of contemporary Galactic astronomy,with several issues concerning IVCs remaining unresolved. These
C© 2002 RAS
386 J. V. Smoker et al.
include, but are not limited to, the method of their formation, theirrelationship (if any) with high-velocity clouds (HVCs) and the ques-tion of whether IVCs are sites of star formation in the halo of theGalaxy (Kuntz & Danly 1996; Christodoulou, Tohline & Keenan1997; Ivezic & Christodoulou 1997). This latter possibility is un-derpinned by the fact that within the Galactic halo, there existsa population of early B-type stars where the velocities, ages anddistances from the Galactic plane (z) are incompatible with thembeing formed within the disc. A possible site for their formation isIVCs/HVCs via cloud–cloud collisions and subsequent compressionof the gas (Dyson & Hartquist 1983). Such collisions are thoughtto be a viable star formation mechanism within at least the discsof galaxies, albeit where the gas density and cloud–cloud collisionrates are somewhat higher than inferred in IVCs/HVCs (Tan 2000).
The solution to both the star formation question and also anypossible relationship between HVCs and IVCs requires both theanalysis of aggregate parameters of well-defined samples of IVCsand HVCs, and also more detailed studies of individual objects.In this paper we report on radio H I aperture synthesis, H I multi-beam wide field mapping, long-slit Ca II observations, Wisconsin Hα
Mapper (WHAM) facility images, and IRAS sky-survey archivedata retrieval towards a particular IVC located in the generaldirection of the M15 globular cluster [RA = 21h 29m 58.s29,Dec. = +12◦10′00.′′5 (J2000); l = 65.01◦, b = −27.31◦]. These ob-servations are amongst the first H I synthesis data to be taken ofpositive-velocity IVCs, which remain poorly studied as a group ofobjects.
The M15 H I cloud lies at a velocity of ∼+70 km s−1 in thedynamic local standard of rest (LSR) (Allen 1973); its distancetentatively lies between ∼0.8–3 kpc (Little et al. 1994; Smokeret al. 2001a). The upper distance limit is gleaned from the fact thatIVC absorption at ∼+70–80 km s−1 is observed in the spectrum ofHD 203664, a halo star of distance 3 kpc and ∼3.1◦ from M15 (Littleet al. 1994), combined with the detection of IV H I approximatelymid-way between the M15 IVC and HD 203 664.
The deviation velocity of the M15 IVC at such a mid-Galacticlatitude puts it in on the borderline between the normal definitionsfor intermediate and high-velocity clouds (cf. fig. 1 of Wakker 1991),although in common with Sembach (1995) and Kennedy et al. (1998)here we classify it as an IVC. The line-of-sight position of the M15IVC is between the negative-velocity Local Group barycentre cloudComplex G and the Galactic Centre clouds (fig. 8 of Blitz et al.1999), hence the M15 IVC is a part of IVC Complex gp (Wakker2001).
Previous observations in H I emission using the Lovell andArecibo telescopes (Kennedy et al. 1998; Smoker et al. 2001a) haveshown that the IVC consists of several condensations of gas spreadout over an area of more than 3 deg2, with structure existing downto the previous resolution limit of ∼3 arcmin. The brightest com-ponent is located towards M15 itself and has a peak H I columndensity at the Arecibo resolution of ∼8 × 1019 cm−2. In this paper,we study this part of the IVC at higher spatial resolution. The massof this particular clump is ∼20D2 M (where D is the distance inkpc), thus for this particular object, in the absence of H2, there isinsufficient neutral gas to form an early-type star. Low-resolutionabsorption-line Ca II and Na I spectroscopy (Lehner et al. 1999) to-wards cluster stars tentatively found cloud structure (or variationsin the relative abundance) over scales as small as a few arcsec, withfibre-optic array mapping in the Na I D absorption lines (Meyer& Lauroesch 1999), obtaining similar results with structure visibleon scales of ∼4 arcsec (velocity resolution ∼16 km s−1). Usingempirical relationships between the sodium and hydrogen column
densities, Meyer & Lauroesch (1999) derived values of the H I col-umn density towards the cluster centre of ≈5 × 1020 cm−2, some sixtimes higher than that found using the Arecibo H I data alone; thedifference may be attributable to fine-scale cloud structure. Assum-ing spherical symmetry, a volume density of ≈1000 cm−3 is impliedby these latter results, similar to values obtained for gas in the lo-cal interstellar medium (ISM) (e.g. Faison et al. 1998, although seeLauroesch, Meyer & Blades 2000). Such a high volume density andimplied overpressure with respect to the ISM perhaps indicates thatthe assumption of spherical symmetry is invalid and that there maybe some sheet-like geometry in the IVC as has been postulated forlow-velocity gas (Heiles 1997).
In the current paper, we extend our studies of the M15 IVC tohigher resolution and different wavelength regions in order to in-vestigate three areas. First, H I synthesis mapping, WHAM Hα andIRAS ISSA survey data retrieval towards the IVC were performedto see whether the H I, Hα and infrared properties of the M15 IVCare compatible with either low-velocity gas or HVCs in general,and whether there are any differences between the types of object,perhaps attributable to differences in the formation mechanism orcurrent environment (for example, the distance from the ionizingfield of the Galaxy). Secondly, wide-field medium-resolution H I
data were obtained in a search for more IVC components, to tracehow the gas kinetic temperature changes with sky position, and pos-sibly to determine the relative distance of cloud components fromthe Galactic plane (cf. Lehner 2000). Thirdly, long-slit echelle Ca II
observations were undertaken, using the centre of M15 as a back-ground continuum source, in order to look for small-scale velocityand column density substructure within the IVC, which could indi-cate the presence of cloudlets, collisions between which in certainIVCs may be responsible for star formation in the Galactic halo.
Section 2 describes the observations and data reduction, Section 3gives the results, Section 4 contains the discussion and Section 5presents a summary and the conclusions.
2 O B S E RVAT I O N S A N D DATA R E D U C T I O N
2.1 Westerbork aperture synthesis H I observations
21-cm aperture synthesis H I observations of the M15 IVC wereobtained during two observing sessions, each of 12 h, using theWesterbork Synthesis Radio Telescope (WSRT). The first on 1998December 19 had a minimum antenna spacing of 32 m and thesecond in 1999 April 17 had a corresponding separation of 72 m.The velocity resolution for all observations was 1.03 km s−1.
Standard methods within AIPS1 were used to reduce the visibilitydata. Reduction included amplitude calibration using 3C 286 and3C 48 (assuming flux densities of 14.76 and 15.98 Jy, respectively),phase calibration and flagging of bad data, and concatenation ofthe two ultraviolet (UV) data sets using DBCON. The calibrated dataset was mapped with IMAGR using both quasi-natural and uniformweightings, with the Arecibo map from Smoker et al. (2001a) beingused to set the locations of the CLEAN boxes for each velocity channelinteractively. The respective beamsizes of the final images were111 × 56 and 81 × 14 arcsec2 (approximately north–south by east–west), with the corresponding rms noises being 2.3 and 1.3 mJybeam−1 for the naturally and uniformly weighted data.
As the WSRT maps suffer from missing short-spacing infor-mation, it was decided to create ‘total power’ channel maps by
1 AIPS is distributed by the National Radio Astronomy Observatory, USA.
C© 2002 RAS, MNRAS 337, 385–400
Observations of the M15 cloud 387
combining the current observations with the single-dish Arecibodata. For this we used MIRIAD (Sault, Teuben & Wright 1995). Thetwo data sets were first regridded so that they had the same cen-tral coordinate and channel width. Following this, we multipliedthe Arecibo data by the WSRT single-dish beam, converted to fluxdensity units, and combined the WSRT and weighted Arecibo mapsusing IMMERGE. Combination was performed by specifying an an-nulus of between 50 and 150 m in the Fourier domain where thehigh- and low-resolution images were made to agree. Within thisannulus it was found that, where the H I was strong, the flux densityscales of the two data sets were the same. Hence the ‘calibrationfactor’ used when combining the two data sets was set to unity.The resulting combined channel maps were divided by the WSRTsingle-dish beam to produce the final combined images. These areof the resolution of the WSRT data (111 × 56 arcsec2), but with thecorrect zero-spacing flux. Finally, moments analysis and Gaussianfitting were performed on the WSRT channel maps and combinedcube from +50 to +90 km s−1 in order to determine the H I columndensities, velocities and velocity widths of the IVC. H I column den-sities were derived using the relationship NH I = 1.823 × 10¹⁸
∫TB
dv (cm−2), where v is the velocity in km s−1.
2.2 Lovell telescope multibeam H I observations
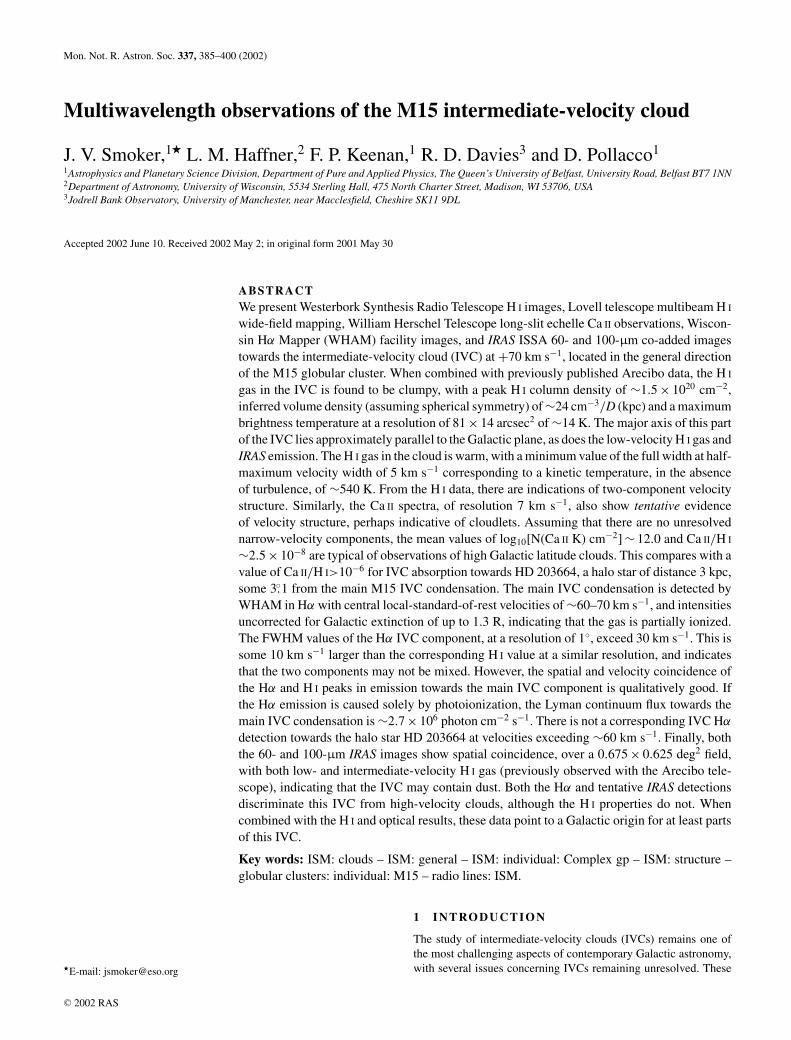
Lovell telescope multibeam 21-cm H I observations covering a∼4.9 × 9.3 deg2 RA–Dec. region, centred upon RA = 21h 22m 47s,Dec. = +10◦ 00′ 29′′ (J2000) were taken during 2000 June 2. Theresolution of these data is 12 arcmin spatially and 3.0 km s−1 invelocity. The total integration time was 4 h and the rms noise perchannel was ∼0.1 K. The observed field is not quite fully sampled,with the spacing between the beams being 10 arcmin, compared withthe spatial resolution of 12 arcmin. During observing, data were cal-ibrated in terms of antenna temperature by a frequently fired noisediode. Off-line, bootstrapping of the flux scale to some previousLovell telescope H I observations taken during 1996 enabled cali-bration in terms of brightness temperature (TB). Data reduction pro-cedures will be discussed in more detail in a future paper. For now,we simply note that most of the process is automated, the bandpassremoval being performed within AIPS++ using LIVEDATA and the databeing gridded using GRIDZILLA (Barnes et al. 2001). As the bandpassis simply a running average of the observed spectra in a window,incorrect removal is performed around the low-velocity gas wherethere is no ‘empty’ region of the sky. However, at the velocity ofthe IVC (v ∼ +70 km s−1) the baseline subtraction is adequate. Anexample of a spectrum after automated bandpass removal is shownin Fig. 1.
After gridding, the data were imported into AIPS, whence a columndensity map was made of the entire field between +50 and +90 kms−1 which is presented in Section 3.2.
2.3 William Herschel Telescope long-slit UES observations
WHT Utrecht Echelle Spectrograph (UES) observations towards thecentre of the M15 globular cluster were taken during bright time over2000 July 19–21. Twin EEV charge-coupled devices (CCDs) wereused. In combination with the E79 grating, this gave nearly com-plete wavelength coverage from 3800 to 6300 A, with a slitwidthof 0.85 arcsec, providing an instrumental FWHM resolution of∼6 km s−1. On the first night of the run, a slit height of 16 arcsecwas used; this has the advantage that the full wavelength coveragewas obtained with no overlapping orders on either of the CCDs. Onthe observations of the second and third night, in order to maximize
Figure 1. Lovell telescope multibeam H I spectrum towards RA =21h 26m 47s, Dec. = +09◦ 16′ 23′′ (J2000). The dotted line shows the re-sults of a single-component Gaussian fit. The brightness temperature cali-bration is accurate to ∼40 per cent with the negative features present near to∼0 km s−1 being an artefact of the baseline removal procedure. The dashedline is the (data–single-Gaussian fit) residual.
the amount of sky available for the calcium lines at 3933.66 A, aslit of height 22 arcsec was used, which leads to overlapping ordersin the red CCD. ThAr arcs were taken two or three times a nightto act as a wavelength calibration with tungsten and sky flats alsobeing obtained. The echelle proved to be remarkably stable, withthe centres of the arc lines varying by less than 1.5 pixels throughoutthe whole of the run.
The original intention of the observations was to obtain sevenparallel cuts through the IVC, separated by 0.7 arcsec, and to usethese to make up an RA–Dec. rectangle of size ∼5 × 20 arcsec2
within which cloudlet sizes could be obtained. Unfortunately, ow-ing to the presence of Sahara dust and non-ideal seeing conditions(1.5–2.0 arcsec), integration times were somewhat longer than hadbeen hoped for and in the end only two long-slit positions were ob-tained, offset by a position angle of 85◦. Additionally, on the secondnight we obtained 1200 s of integration towards a blank sky regionwith a 0.85-arcsec slit and on the third night a total of 5 × 400 s,interleaved with the object exposures and using a slit of width4.0 arcsec, corresponding to ∼9500 s of integration with a slit of0.85 arcsec used for the IVC observations.
Data reduction was performed using standard methods withinIRAF.2 The aims were first to obtain a spectrum of the inner part ofthe globular cluster over the whole wavelength region, and moreimportantly, to produce long-slit spectra of the Ca II lines alone forthe two long-slit positions taken. Data reduction included debiasing,and use of the sky flat-fields to get rid of the vignetting that wasclearly visible on many of the orders. Cosmic ray hits near the Ca II
line were removed within FIGARO (Shortridge et al. 1999) usingCLEAN. Because of the small pixel-to-pixel variation and pixel size(∼0.2 arcsec), no flat-fielding to remove the pixel-to-pixel variationwas performed on the data. The images were rotated in order tomake the cross-dispersion axis occur along the image rows, afterwhich sky subtraction was performed. As expected, this proved tobe challenging.
2 IRAF is distributed by the National Optical Astronomy Observatories, USA.
C© 2002 RAS, MNRAS 337, 385–400
388 J. V. Smoker et al.
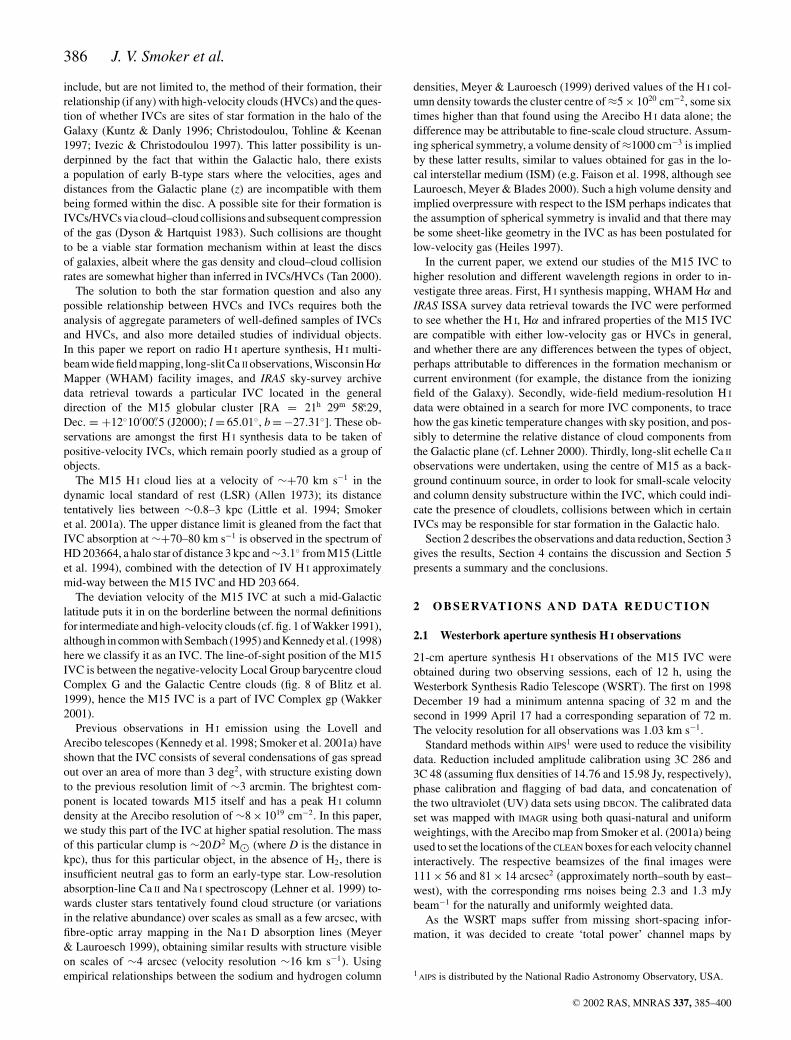
Figure 2. Cut across the dispersion axis at ∼3937 A of a blank sky region,equivalent to 5400 s of object observing time on night 3. The ‘dips’ in thespectrum correspond to the interorder gaps.
2.3.1 Sky subtraction
Two methods were used to estimate the sky value and the resultscompared. The first used the data from the observations of the thirdnight, where the blank sky exposures were interleaved with the ob-ject exposures. For these data, we scaled the high signal-to-noiseratio combined sky flat (taken at twilight with the 0.85-arcsec slit)to produce an image ‘scaled˙sky’ and then smoothed this in wave-length to a resolution equivalent to a 4-arcsec slit. The scaling factorwas chosen so that the resulting image was the same as the blanksky image taken with the 4-arcsec slit for an equivalent of 5400 s ofintegration. The image ‘scaled˙sky’ was then subtracted from each5400 s of the object data. This method has the advantage that in theblank sky images there are clearly no contaminating counts from theobject, but it is susceptible to changes in the observing conditionsand requires careful removal of the bias strip in both sky and objectframes. Fig. 2 shows a cut across the dispersion axis for the sky expo-sures on night 3. As can be seen, there are few sky counts, althoughobviously in the outer parts of the slit there are few object counts too,so errors in the equivalent width increase rapidly in the extractedspectra for this region. For an equivalent 5400 s of integration time,at λ ∼ 3937 A, there were ∼3 ADU sky counts and somewhat fewerat λ = 3933.66 A, as a result of the ‘sky’ effectively being a solar(G-type) spectrum that has strong Ca II absorption lines.
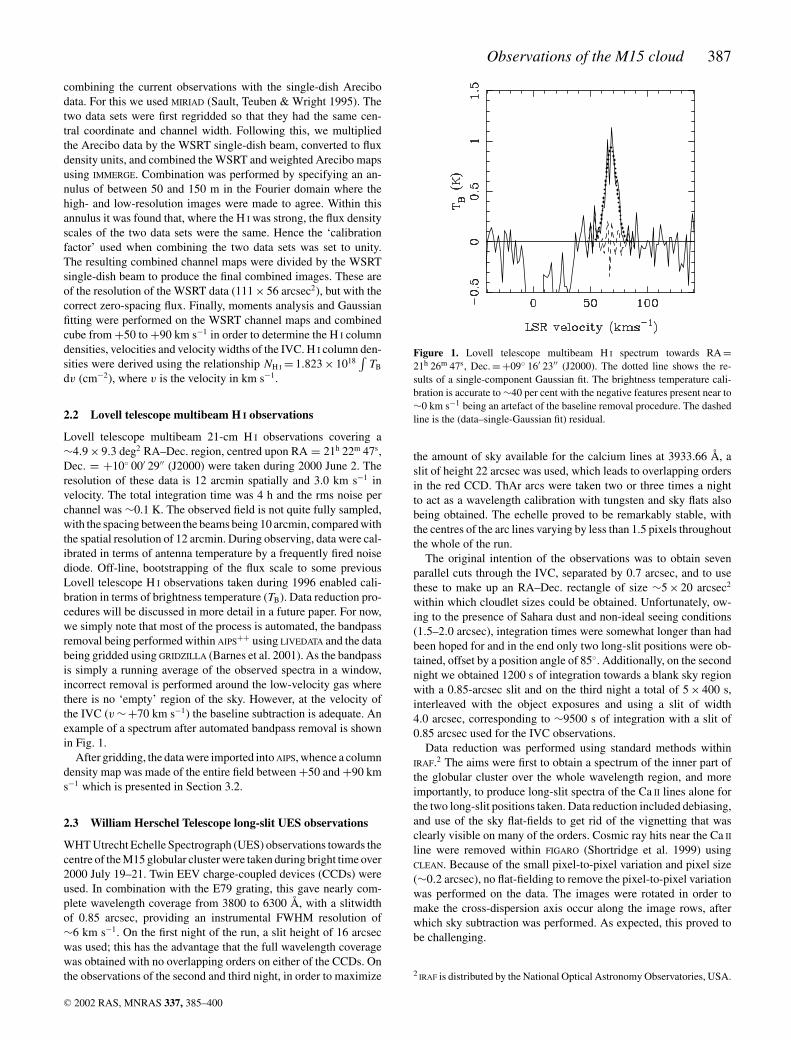
The method of sky subtraction that we had envisaged performinga priori involved removal of sky using parts of the long-slit imagethat appeared to be free of emission from the globular cluster. Theproblem with this method is illustrated by Fig. 3(a), which showscuts across the dispersion axis for 5400 s of data taken on the thirdnight at each of the two slit positions. As is apparent from the figures,the ‘sky’ level at the same position on the order at the two differentslit positions differs by ∼3–4 ADU per 5400 s of integration. Duringnight 3, at λ ∼ 3937 A, position p1 had ∼8 ADU as its ‘sky’ value,with the corresponding value for p2 being ∼12 ADU. These clearlyare much larger than the values obtained by exposing on the nightsky and combined with the fact that p1 and p2 are different indicatesthat we are still obtaining counts from the cluster in the outer partsof the slit. This is confirmed by performing an extraction using suchcounts; in some parts of the spectrum the IVC absorption becomesnegative, which is unphysical.
Because of the lack of object-free emission on the slit, we decidedto remove the sky by subtracting the smoothed version of the sky
Figure 3. (a) Cut across the dispersion axis at ∼3937 A for the two slitpositions with 5400 s of integration, showing the difficulty in determiningthe sky. IOG refers to the interorder gap between the echelle orders. (b) Cutalong the dispersion axis before normalization.
images from our object data. This method relies upon the sky con-ditions being similar throughout the three nights of observing. Thiswas checked by taking cuts across three places on the dispersionaxis of each 5400 s worth of data and checking for variability. Atλ ∼ 3937 A, the values varied by only 2 ADU per 5400 s betweennights 1 and 3 for the two slit positions. This variability, combinedwith the error in removing the bias, gives us an error in the finalsky value of ∼4 ADU at 3937 A, compared with a peak continuumvalue at this point of ∼30 ADU.
2.3.2 Extraction and analysis
The sky-subtracted spectra were extracted within FIGARO by sum-ming over each 10 columns, corresponding to the worst seeing of∼2.0 arcsec. Wavelength calibration was then undertaken, takinginto account the shift in the λ scale along the length of the slit. Fi-nally, normalization and profile fitting were performed within DIPSO
(Howarth et al. 1996). The final spectra have a spatial resolution of∼2 arcsec and a velocity resolution of ∼7 km s−1.
Data were analysed using standard profile fitting methods withinDIPSO using the ELF and IS programs. Before fitting, the stellar linewas removed by fitting the profile by eye to the lower-wavelengthpart of the spectrum up to the peak stellar absorption unaffectedby LV and IV gas, and creating a mirror of this spectrum for thehigher wavelength data. The derived stellar spectrum has a Stark-like line profile, typical of stellar Ca II lines, and was subtractedfrom the whole spectrum to leave the interstellar components only.After stellar-line removal, the ELF routines were used to fit Gaussianprofiles to input spectra and hence provide the equivalent width, peakabsorption and full width at half-maximum (FWHM) velocity valuesfor the low-velocity gas and IVC components. These results werecompared with the theoretical absorption profiles computed by the IS
suite of programs within DIPSO. These theoretical profiles are derivedfrom the observed b-values (corrected for instrumental broadening),atomic data for the Ca II lines taken from Morton (1991) and initialguesses for the Ca II column density. Input parameters were varieduntil a good fit was produced to match the profiles obtained usingELF. This method is only appropriate in the regime where the linesare not saturated and are resolved in velocity; both caveats apply fora number of positions in the current data set, although the presence
C© 2002 RAS, MNRAS 337, 385–400

Observations of the M15 cloud 389
of narrow, unresolved components cannot be ruled out. If present,these would cause our estimated column densities to be too low. Thefinal ELF and IS fits provide the Ca II number densities and values forthe FWHM velocities at each of the positions along the slit.
2.4 Wisconsin Hα Mapper observations
Data were retrieved from the Wisconsin Hα Mapper survey in therange +06◦ < Dec. < +15◦ and 20h 20m < RA < 21h 38m (J2000).These data have a resolution 1◦ spatially and ∼12 km s−1 in ve-locity, with a velocity coverage at this sky position from ∼−120to +90 km s−1 in the local standard of rest. Data were reduced us-ing standard methods, which included conversion into the LSR andremoval of the geocoronal Hα line that appears at velocities in therange ∼+30 to +40 km s−1 (Haffner 1999; Haffner et al., in prepa-ration). Owing to the removal of this line, the noise in this part of thespectrum is slightly enhanced compared with the typical rms noisevalue (measured for the current spectra) of ∼1–3 mR (km s−1)−1.These values are typical for the WHAM survey as a whole. Finally,we note that if the IVC Hα flux originates from above the Galacticplane, then a correction for Galactic extinction of 1.25 would benecessary, calculated from an E(B − V ) = 0.10 observed towardsM15 by Durrell & Harris (1993), combined with the extinction lawof Cardelli, Clayton & Mathis (1989). We have not applied this cor-rection to our data so the IVC Hα fluxes may be ∼25 per cent toolow.
2.5 IRAS ISSA data retrieval
Both the 60- and 100-µm images of a field of size 0.675 × 0.625 deg2
were extracted from the on-line versions of the IRAS Sky SurveyAtlas (ISSA). These images are of resolution ∼5 arcmin and havemost of their zodiacal emission removed, although they have anarbitrary zero-point.
3 R E S U LT S
3.1 WSRT aperture synthesis H I results
Fig. 4 shows the H I column density map of the IVC for the low-resolution WSRT data alone, with Fig. 5 showing the corresponding
M15 IVC WSRT only. Low resolution HIE19
DE
CL
INA
TIO
N (
J200
0)
RIGHT ASCENSION (J2000)21 31 00 30 30 00 29 30 00
12 25
20
15
10
05
00
11 55
l=65.4
l=64.6
b=-27.6
b=-27.0
Figure 4. WSRT H I column density map of the M15 IVC integrated between+50 and +90 km s−1 and at a resolution of 111 × 56 arcsec2 (∼ NS by EW).Contour levels are at NH I = (2, 4, 6, 8, 10) × 1019 cm−2.
CONT: M15 IVC WSRT+Arecibo HIE19 mapGREY: M15 POSS1 DSS red image
DE
CL
INA
TIO
N (
J200
0)
RIGHT ASCENSION (J2000)21 31 00 30 30 00 29 30 00
12 25
20
15
10
05
00
11 55
Figure 5. WSRT plus Arecibo combined H I column density map of theM15 IVC integrated between +50 and +90 km s−1 and at a resolutionof 111 × 56 arcsec2, overlaid on the red POSS-1 digital sky survey im-age towards M15. Velocities are in the LSR with contour levels being atNH I = (2, 4, 6, 8, 10, 12, 14) × 1019 cm−2. Lines of constant Galactic lon-gitude and latitude are also plotted on the figure.
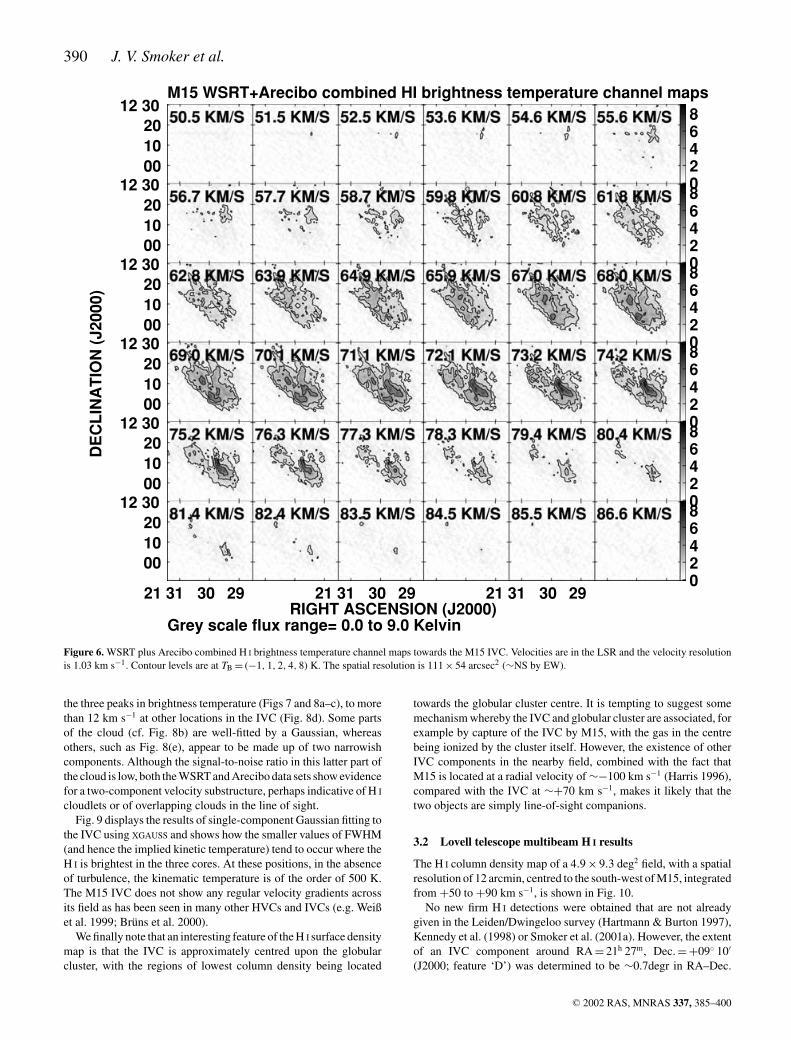
map of the combined (WSRT plus Arecibo) image overlaid on thedigitized Palomar Observatory Sky Atlas (POSS-I) red image re-gridded to a 4-arcsec pixel size. The major axis of this part of theIVC lies parallel to the Galactic plane. The H I channel maps of thecombined WSRT plus Arecibo data set in brightness temperature(TB) are shown in Fig. 6, where the flux density per beam is re-lated to TB by SmJy beam−1 = 0.65�asTB/λ2
cm, where �as is the beamarea in arcsec2 and λ2
cm is the observed wavelength in centimetres(Braun & Burton 2000). Immediately obvious from each of thesefigures is the fact that the H I is clumpy in nature, as is seen in otherintermediate- and high-velocity clouds observed at a similar reso-lution (e.g. Weiß et al. 1999; Braun & Burton 2000). Variations inthe column density of a factor of ∼4 on scales of ∼5 arcmin areobserved, corresponding to scales of ∼1.5D pc, where D is the IVCdistance in kpc. The peak brightness temperature in the combinedmap (of resolution 111 × 56 arcsec2), is ∼8 K, rising to ∼14 K forthe highest-resolution WSRT map with beamsize 81 × 14 arcsec2.These values compare with peak values of TB for HVCs of ∼25 Ktowards Complex A at 2-arcmin resolution (Schwarz, Sullivan &Hulsbosch 1976), ∼34 K observed towards Complex M at a reso-lution of 1 arcmin (Wakker & Schwarz 1991) and ∼75 K observedto the compact high-velocity cloud CHVC 125 + 41–207 (Braun &Burton 2000). Similarly the IVC observed by Weiß et al. (1999) hasa peak TB exceeding 7 K, at a resolution of 1 arcmin.
The peak H I column density in the combined image is∼1.5 × 1020 cm−2. If we assume that the cloud is spherically sym-metric or filamentary (Stoppelenburg, Schwarz & van Woerden1998), and using a cloud size FWHM (cf. Wakker & Schwarz 1991)of ∼7 arcmin or 2D pc for the brightest point, we obtain a peak vol-ume density of ∼24D−1 cm−3. At the assumed distance, this valueis a lower limit as it is likely that there will be more structure onsmaller scales, as indicated by the spectra of Meyer & Lauroesch(1999).
Fig. 7 shows the brightness temperature (TB) profile at the positionof peak temperature in the uniformly weighted data, with Fig. 8depicting the combined temperature profiles at a number of positionsin the cloud. The FWHM varies from 5 km s−1 at the position of
C© 2002 RAS, MNRAS 337, 385–400
390 J. V. Smoker et al.
M15 WSRT+Arecibo combined HI brightness temperature channel maps
Grey scale flux range= 0.0 to 9.0 Kelvin
12 30201000
02468
12 30201000
02468
12 30201000
02468
DE
CL
INA
TIO
N (
J200
0)
12 30201000
02468
12 30201000
02468
21 31 30 29
12 30201000
RIGHT ASCENSION (J2000)21 31 30 29 21 31 30 29
02468
Figure 6. WSRT plus Arecibo combined H I brightness temperature channel maps towards the M15 IVC. Velocities are in the LSR and the velocity resolutionis 1.03 km s−1. Contour levels are at TB = (−1, 1, 2, 4, 8) K. The spatial resolution is 111 × 54 arcsec2 (∼NS by EW).
the three peaks in brightness temperature (Figs 7 and 8a–c), to morethan 12 km s−1 at other locations in the IVC (Fig. 8d). Some partsof the cloud (cf. Fig. 8b) are well-fitted by a Gaussian, whereasothers, such as Fig. 8(e), appear to be made up of two narrowishcomponents. Although the signal-to-noise ratio in this latter part ofthe cloud is low, both the WSRT and Arecibo data sets show evidencefor a two-component velocity substructure, perhaps indicative of H I
cloudlets or of overlapping clouds in the line of sight.Fig. 9 displays the results of single-component Gaussian fitting to
the IVC using XGAUSS and shows how the smaller values of FWHM(and hence the implied kinetic temperature) tend to occur where theH I is brightest in the three cores. At these positions, in the absenceof turbulence, the kinematic temperature is of the order of 500 K.The M15 IVC does not show any regular velocity gradients acrossits field as has been seen in many other HVCs and IVCs (e.g. Weißet al. 1999; Bruns et al. 2000).
We finally note that an interesting feature of the H I surface densitymap is that the IVC is approximately centred upon the globularcluster, with the regions of lowest column density being located
towards the globular cluster centre. It is tempting to suggest somemechanism whereby the IVC and globular cluster are associated, forexample by capture of the IVC by M15, with the gas in the centrebeing ionized by the cluster itself. However, the existence of otherIVC components in the nearby field, combined with the fact thatM15 is located at a radial velocity of ∼−100 km s−1 (Harris 1996),compared with the IVC at ∼+70 km s−1, makes it likely that thetwo objects are simply line-of-sight companions.
3.2 Lovell telescope multibeam H I results
The H I column density map of a 4.9 × 9.3 deg2 field, with a spatialresolution of 12 arcmin, centred to the south-west of M15, integratedfrom +50 to +90 km s−1, is shown in Fig. 10.
No new firm H I detections were obtained that are not alreadygiven in the Leiden/Dwingeloo survey (Hartmann & Burton 1997),Kennedy et al. (1998) or Smoker et al. (2001a). However, the extentof an IVC component around RA = 21h 27m, Dec. = +09◦ 10′
(J2000; feature ‘D’) was determined to be ∼0.7degr in RA–Dec.
C© 2002 RAS, MNRAS 337, 385–400
Observations of the M15 cloud 391
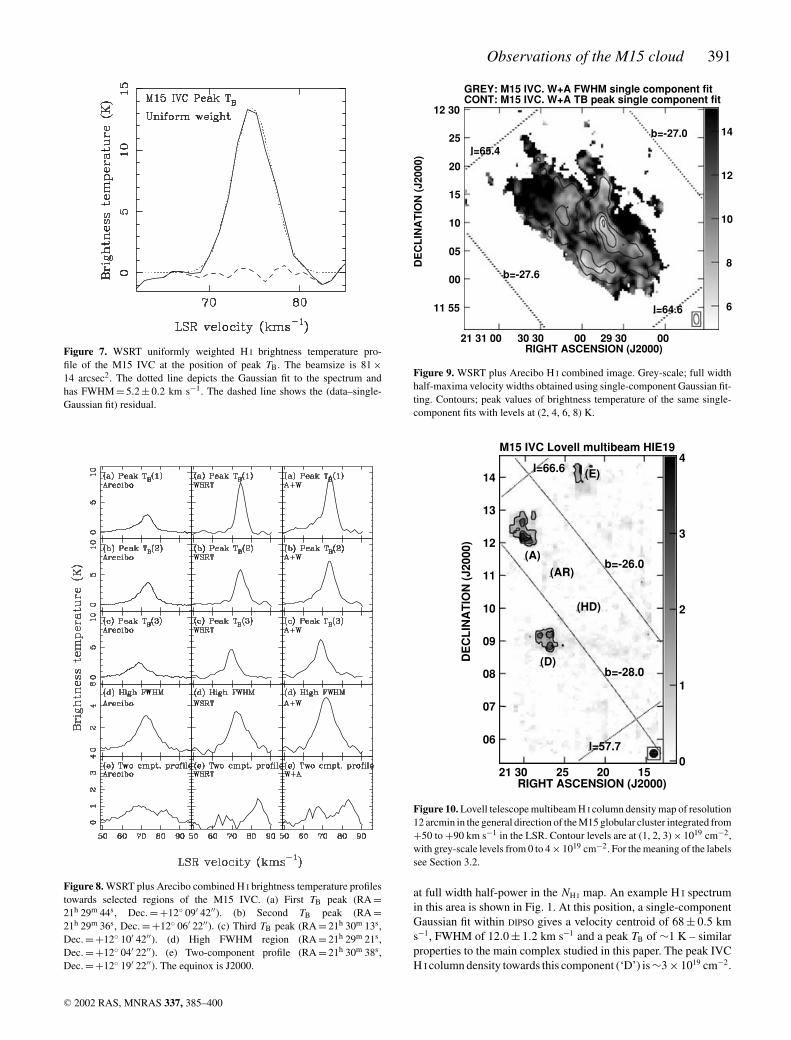
Figure 7. WSRT uniformly weighted H I brightness temperature pro-file of the M15 IVC at the position of peak TB. The beamsize is 81 ×14 arcsec2. The dotted line depicts the Gaussian fit to the spectrum andhas FWHM = 5.2 ± 0.2 km s−1. The dashed line shows the (data–single-Gaussian fit) residual.
Figure 8. WSRT plus Arecibo combined H I brightness temperature profilestowards selected regions of the M15 IVC. (a) First TB peak (RA =21h 29m 44s, Dec. = +12◦ 09′ 42′′). (b) Second TB peak (RA =21h 29m 36s, Dec. = +12◦ 06′ 22′′). (c) Third TB peak (RA = 21h 30m 13s,Dec. = +12◦ 10′ 42′′). (d) High FWHM region (RA = 21h 29m 21s,Dec. = +12◦ 04′ 22′′). (e) Two-component profile (RA = 21h 30m 38s,Dec. = +12◦ 19′ 22′′). The equinox is J2000.
CONT: M15 IVC. W+A TB peak single component fitGREY: M15 IVC. W+A FWHM single component fit
6
8
10
12
14
DE
CL
INA
TIO
N (
J200
0)
RIGHT ASCENSION (J2000)21 31 00 30 30 00 29 30 00
12 30
25
20
15
10
05
00
11 55
l=65.4
l=64.6
b=-27.6
b=-27.0
Figure 9. WSRT plus Arecibo H I combined image. Grey-scale; full widthhalf-maxima velocity widths obtained using single-component Gaussian fit-ting. Contours; peak values of brightness temperature of the same single-component fits with levels at (2, 4, 6, 8) K.
M15 IVC Lovell multibeam HIE19
0
1
2
3
4D
EC
LIN
AT
ION
(J2
000)
RIGHT ASCENSION (J2000)21 30 25 20 15
14
13
12
11
10
09
08
07
06
(A)
(D)
(E)
(HD)
(AR)
l=66.6
l=57.7
b=-28.0
b=-26.0
Figure 10. Lovell telescope multibeam H I column density map of resolution12 arcmin in the general direction of the M15 globular cluster integrated from+50 to +90 km s−1 in the LSR. Contour levels are at (1, 2, 3) × 1019 cm−2,with grey-scale levels from 0 to 4 × 1019 cm−2. For the meaning of the labelssee Section 3.2.
at full width half-power in the NH I map. An example H I spectrumin this area is shown in Fig. 1. At this position, a single-componentGaussian fit within DIPSO gives a velocity centroid of 68 ± 0.5 kms−1, FWHM of 12.0 ± 1.2 km s−1 and a peak TB of ∼1 K – similarproperties to the main complex studied in this paper. The peak IVCH I column density towards this component (‘D’) is ∼3 × 1019 cm−2.
C© 2002 RAS, MNRAS 337, 385–400
392 J. V. Smoker et al.
Also plotted in Fig. 10 are ‘A’, ‘AR’ and ‘HD’. ‘A’ correspondsto the main clump observed by Kennedy et al. (1998), which hasFWHM ∼12–15 km s−1 at 12-arcmin resolution. The peak IVCcolumn H I density derived using the current observations towardscomponent ‘A’ of 3.7 × 1019 cm−2 is close to the value of 3.9 ×1019 cm−2 observed by Kennedy et al. (1998) with the same tele-scope and gives us faith in our calibration. ‘AR’ refers to previousIVC detections using the Arecibo telescope that have FWHM =12 km s−1 and vLSR = +61 km s−1 at a resolution of 3 arcmin.‘HD’ is the position of the halo star HD 203664 (of distance 3 kpc)in which two strong interstellar IVC Ca II K absorption compo-nents are seen with FWHM = 2.8 and 3.2 km s−1 and v ∼ +80 and+75 km s−1, respectively (Ryans, Sembach & Keenan 1996). Asthis is an absorption-line measurement towards a star, the resolutionis subarcsecond. Finally, we note that there is a hint of emissionat RA = 21h 23m 04s, Dec. = +14◦ 12′ 42′′ (feature ‘E’ in Fig. 10),although this is very close to the noise level and may be a spuriousdetection.
3.3 William Herschel Telescope long-slit UES results
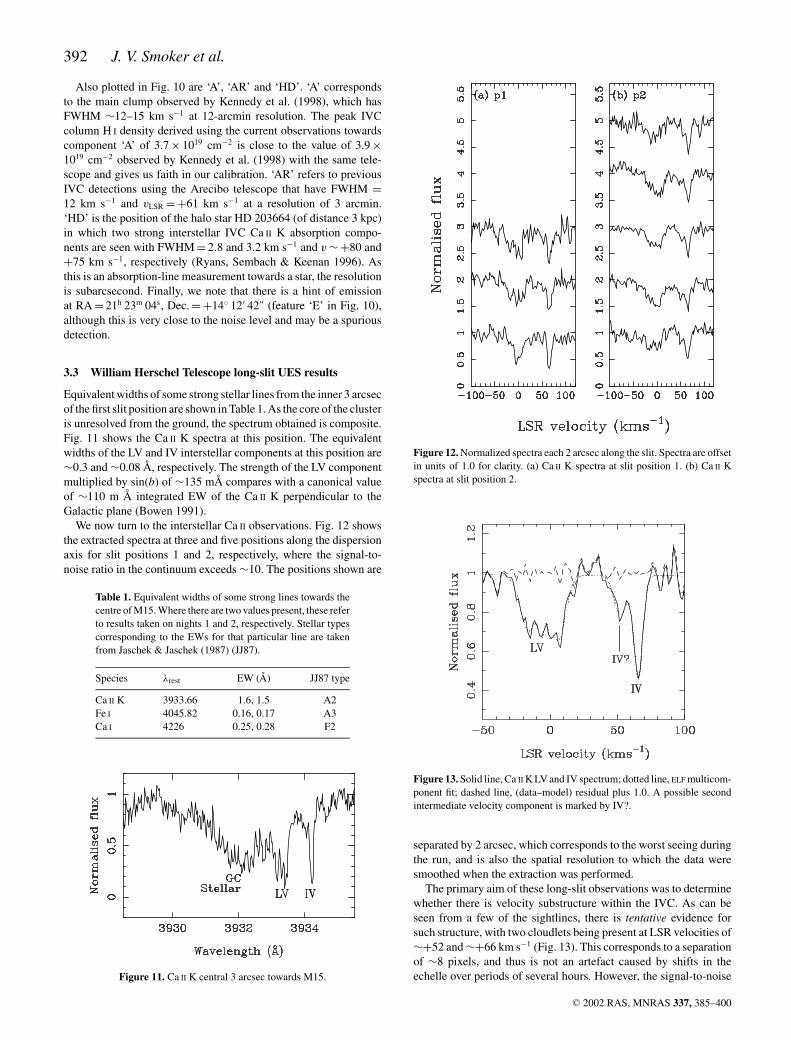
Equivalent widths of some strong stellar lines from the inner 3 arcsecof the first slit position are shown in Table 1. As the core of the clusteris unresolved from the ground, the spectrum obtained is composite.Fig. 11 shows the Ca II K spectra at this position. The equivalentwidths of the LV and IV interstellar components at this position are∼0.3 and ∼0.08 A, respectively. The strength of the LV componentmultiplied by sin(b) of ∼135 mA compares with a canonical valueof ∼110 m A integrated EW of the Ca II K perpendicular to theGalactic plane (Bowen 1991).
We now turn to the interstellar Ca II observations. Fig. 12 showsthe extracted spectra at three and five positions along the dispersionaxis for slit positions 1 and 2, respectively, where the signal-to-noise ratio in the continuum exceeds ∼10. The positions shown are
Table 1. Equivalent widths of some strong lines towards thecentre of M15. Where there are two values present, these referto results taken on nights 1 and 2, respectively. Stellar typescorresponding to the EWs for that particular line are takenfrom Jaschek & Jaschek (1987) (JJ87).
Species λrest EW (A) JJ87 type
Ca II K 3933.66 1.6, 1.5 A2Fe I 4045.82 0.16, 0.17 A3Ca I 4226 0.25, 0.28 F2
Figure 11. Ca II K central 3 arcsec towards M15.
Figure 12. Normalized spectra each 2 arcsec along the slit. Spectra are offsetin units of 1.0 for clarity. (a) Ca II K spectra at slit position 1. (b) Ca II Kspectra at slit position 2.
Figure 13. Solid line, Ca II K LV and IV spectrum; dotted line, ELF multicom-ponent fit; dashed line, (data–model) residual plus 1.0. A possible secondintermediate velocity component is marked by IV?.
separated by 2 arcsec, which corresponds to the worst seeing duringthe run, and is also the spatial resolution to which the data weresmoothed when the extraction was performed.
The primary aim of these long-slit observations was to determinewhether there is velocity substructure within the IVC. As can beseen from a few of the sightlines, there is tentative evidence forsuch structure, with two cloudlets being present at LSR velocities of∼+52 and ∼+66 km s−1 (Fig. 13). This corresponds to a separationof ∼8 pixels, and thus is not an artefact caused by shifts in theechelle over periods of several hours. However, the signal-to-noise
C© 2002 RAS, MNRAS 337, 385–400
Observations of the M15 cloud 393
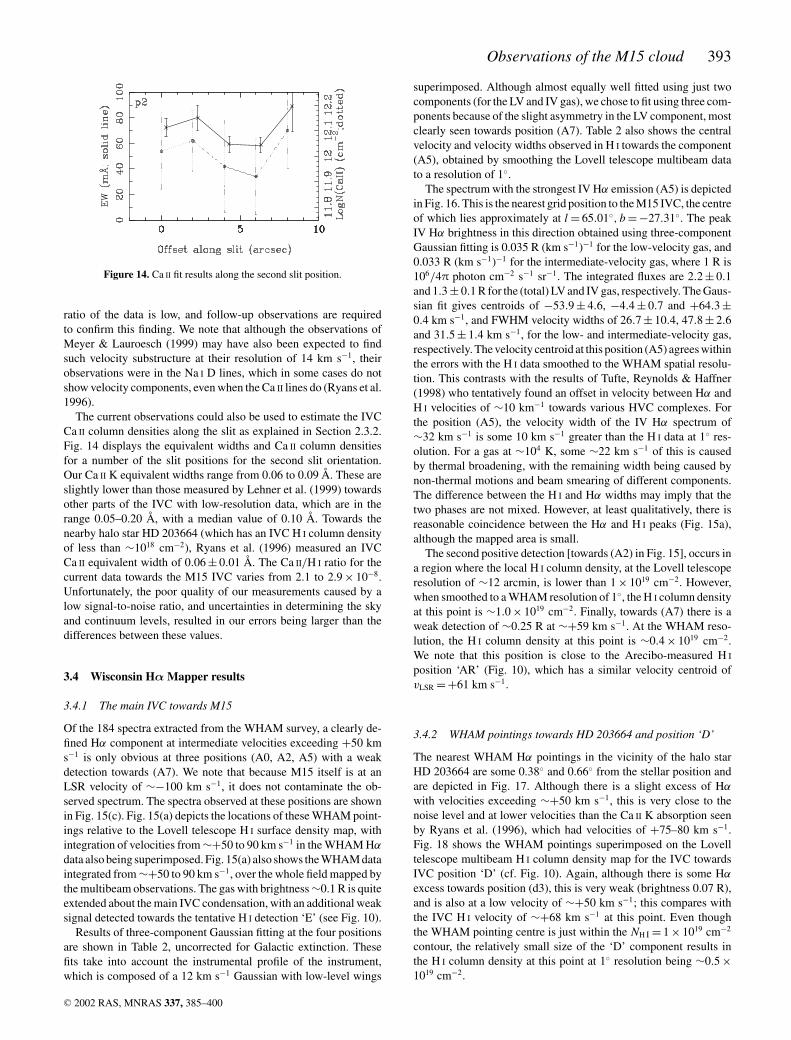
Figure 14. Ca II fit results along the second slit position.
ratio of the data is low, and follow-up observations are requiredto confirm this finding. We note that although the observations ofMeyer & Lauroesch (1999) may have also been expected to findsuch velocity substructure at their resolution of 14 km s−1, theirobservations were in the Na I D lines, which in some cases do notshow velocity components, even when the Ca II lines do (Ryans et al.1996).
The current observations could also be used to estimate the IVCCa II column densities along the slit as explained in Section 2.3.2.Fig. 14 displays the equivalent widths and Ca II column densitiesfor a number of the slit positions for the second slit orientation.Our Ca II K equivalent widths range from 0.06 to 0.09 A. These areslightly lower than those measured by Lehner et al. (1999) towardsother parts of the IVC with low-resolution data, which are in therange 0.05–0.20 A, with a median value of 0.10 A. Towards thenearby halo star HD 203664 (which has an IVC H I column densityof less than ∼1018 cm−2), Ryans et al. (1996) measured an IVCCa II equivalent width of 0.06 ± 0.01 A. The Ca II/H I ratio for thecurrent data towards the M15 IVC varies from 2.1 to 2.9 × 10⁻⁸.Unfortunately, the poor quality of our measurements caused by alow signal-to-noise ratio, and uncertainties in determining the skyand continuum levels, resulted in our errors being larger than thedifferences between these values.
3.4 Wisconsin Hα Mapper results
3.4.1 The main IVC towards M15
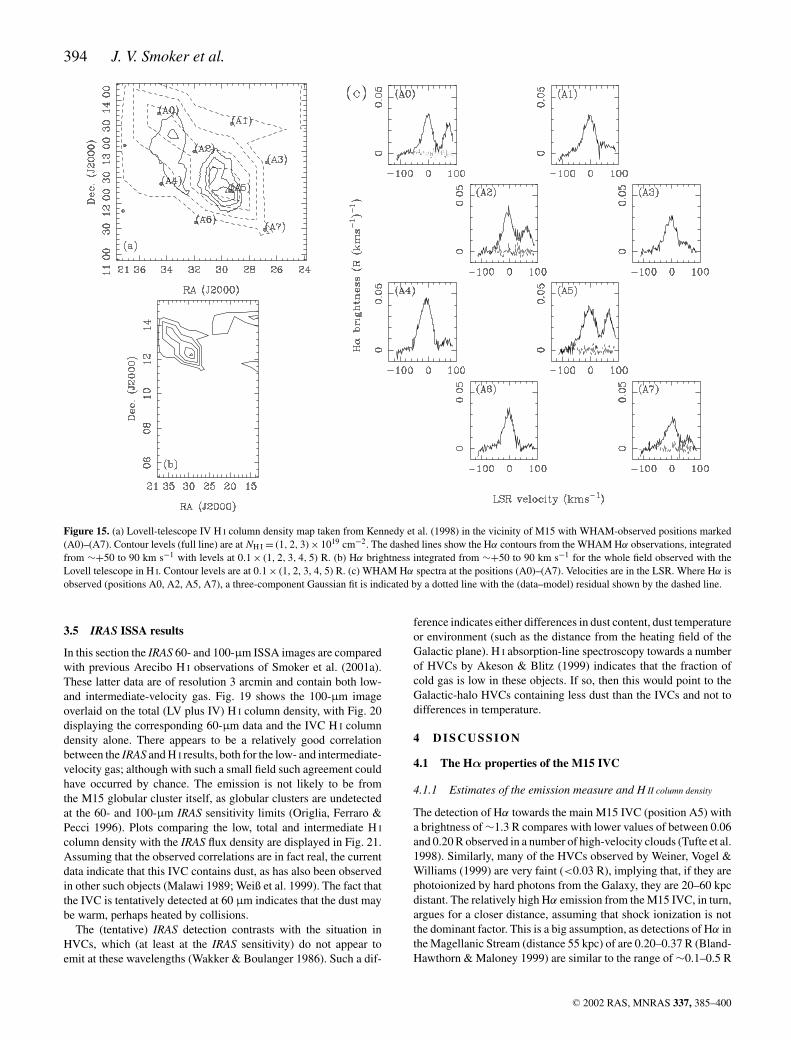
Of the 184 spectra extracted from the WHAM survey, a clearly de-fined Hα component at intermediate velocities exceeding +50 kms−1 is only obvious at three positions (A0, A2, A5) with a weakdetection towards (A7). We note that because M15 itself is at anLSR velocity of ∼−100 km s−1, it does not contaminate the ob-served spectrum. The spectra observed at these positions are shownin Fig. 15(c). Fig. 15(a) depicts the locations of these WHAM point-ings relative to the Lovell telescope H I surface density map, withintegration of velocities from ∼+50 to 90 km s−1 in the WHAM Hα
data also being superimposed. Fig. 15(a) also shows the WHAM dataintegrated from ∼+50 to 90 km s−1, over the whole field mapped bythe multibeam observations. The gas with brightness ∼0.1 R is quiteextended about the main IVC condensation, with an additional weaksignal detected towards the tentative H I detection ‘E’ (see Fig. 10).
Results of three-component Gaussian fitting at the four positionsare shown in Table 2, uncorrected for Galactic extinction. Thesefits take into account the instrumental profile of the instrument,which is composed of a 12 km s−1 Gaussian with low-level wings
superimposed. Although almost equally well fitted using just twocomponents (for the LV and IV gas), we chose to fit using three com-ponents because of the slight asymmetry in the LV component, mostclearly seen towards position (A7). Table 2 also shows the centralvelocity and velocity widths observed in H I towards the component(A5), obtained by smoothing the Lovell telescope multibeam datato a resolution of 1◦.
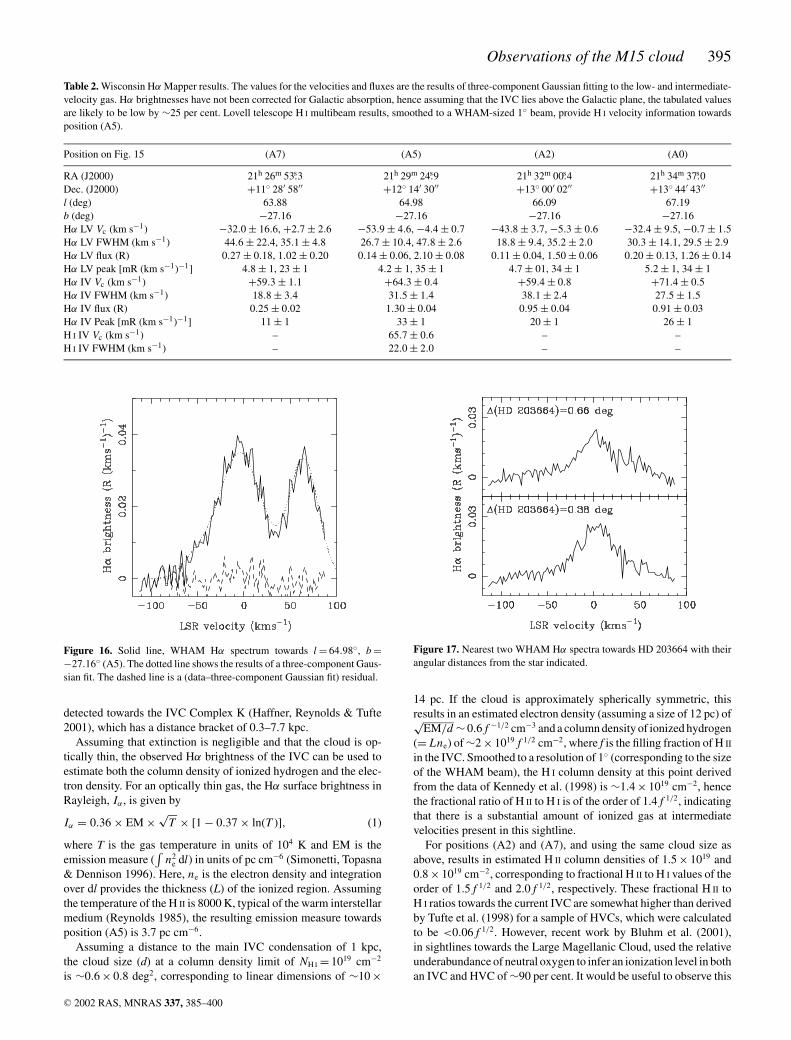
The spectrum with the strongest IV Hα emission (A5) is depictedin Fig. 16. This is the nearest grid position to the M15 IVC, the centreof which lies approximately at l = 65.01◦, b = −27.31◦. The peakIV Hα brightness in this direction obtained using three-componentGaussian fitting is 0.035 R (km s−1)−1 for the low-velocity gas, and0.033 R (km s−1)−1 for the intermediate-velocity gas, where 1 R is106/4π photon cm−2 s−1 sr−1. The integrated fluxes are 2.2 ± 0.1and 1.3 ± 0.1 R for the (total) LV and IV gas, respectively. The Gaus-sian fit gives centroids of −53.9 ± 4.6, −4.4 ± 0.7 and +64.3 ±0.4 km s−1, and FWHM velocity widths of 26.7 ± 10.4, 47.8 ± 2.6and 31.5 ± 1.4 km s−1, for the low- and intermediate-velocity gas,respectively. The velocity centroid at this position (A5) agrees withinthe errors with the H I data smoothed to the WHAM spatial resolu-tion. This contrasts with the results of Tufte, Reynolds & Haffner(1998) who tentatively found an offset in velocity between Hα andH I velocities of ∼10 km−1 towards various HVC complexes. Forthe position (A5), the velocity width of the IV Hα spectrum of∼32 km s−1 is some 10 km s−1 greater than the H I data at 1◦ res-olution. For a gas at ∼104 K, some ∼22 km s−1 of this is causedby thermal broadening, with the remaining width being caused bynon-thermal motions and beam smearing of different components.The difference between the H I and Hα widths may imply that thetwo phases are not mixed. However, at least qualitatively, there isreasonable coincidence between the Hα and H I peaks (Fig. 15a),although the mapped area is small.
The second positive detection [towards (A2) in Fig. 15], occurs ina region where the local H I column density, at the Lovell telescoperesolution of ∼12 arcmin, is lower than 1 × 1019 cm−2. However,when smoothed to a WHAM resolution of 1◦, the H I column densityat this point is ∼1.0 × 1019 cm−2. Finally, towards (A7) there is aweak detection of ∼0.25 R at ∼+59 km s−1. At the WHAM reso-lution, the H I column density at this point is ∼0.4 × 1019 cm−2.We note that this position is close to the Arecibo-measured H I
position ‘AR’ (Fig. 10), which has a similar velocity centroid ofvLSR = +61 km s−1.
3.4.2 WHAM pointings towards HD 203664 and position ‘D’
The nearest WHAM Hα pointings in the vicinity of the halo starHD 203664 are some 0.38◦ and 0.66◦ from the stellar position andare depicted in Fig. 17. Although there is a slight excess of Hα
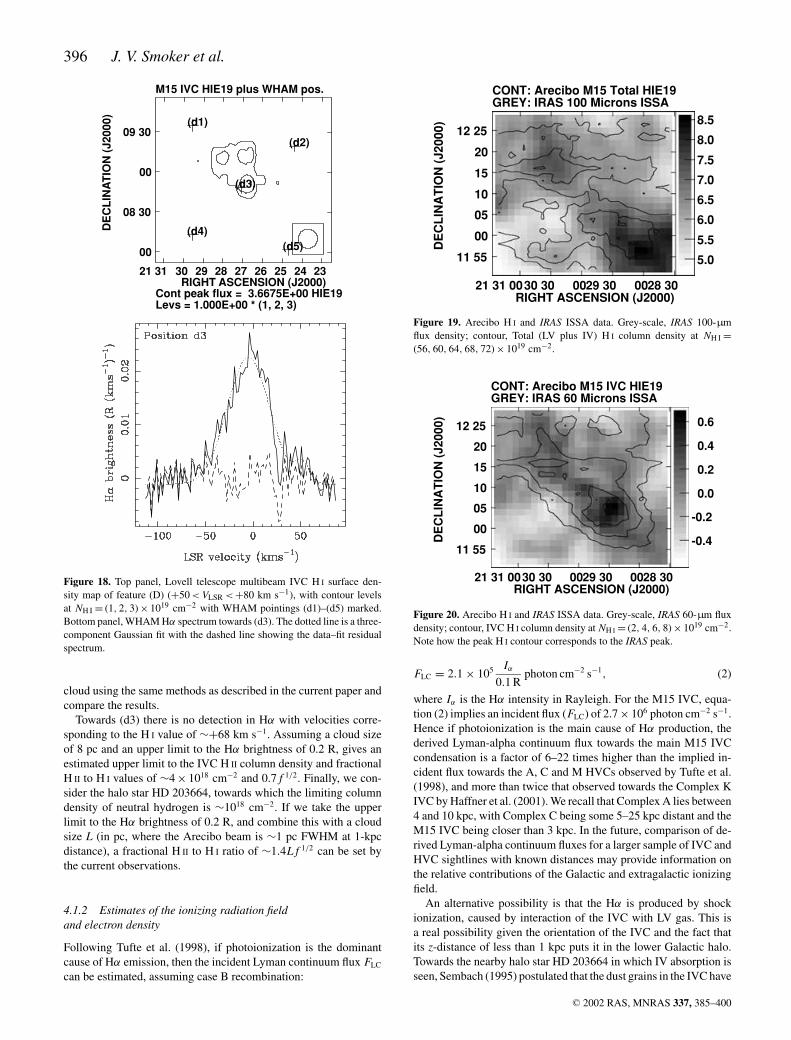
with velocities exceeding ∼+50 km s−1, this is very close to thenoise level and at lower velocities than the Ca II K absorption seenby Ryans et al. (1996), which had velocities of +75–80 km s−1.Fig. 18 shows the WHAM pointings superimposed on the Lovelltelescope multibeam H I column density map for the IVC towardsIVC position ‘D’ (cf. Fig. 10). Again, although there is some Hα
excess towards position (d3), this is very weak (brightness 0.07 R),and is also at a low velocity of ∼+50 km s−1; this compares withthe IVC H I velocity of ∼+68 km s−1 at this point. Even thoughthe WHAM pointing centre is just within the NH I = 1 × 1019 cm−2
contour, the relatively small size of the ‘D’ component results inthe H I column density at this point at 1◦ resolution being ∼0.5 ×1019 cm−2.
C© 2002 RAS, MNRAS 337, 385–400
394 J. V. Smoker et al.
Figure 15. (a) Lovell-telescope IV H I column density map taken from Kennedy et al. (1998) in the vicinity of M15 with WHAM-observed positions marked(A0)–(A7). Contour levels (full line) are at NH I = (1, 2, 3) × 1019 cm−2. The dashed lines show the Hα contours from the WHAM Hα observations, integratedfrom ∼+50 to 90 km s−1 with levels at 0.1 × (1, 2, 3, 4, 5) R. (b) Hα brightness integrated from ∼+50 to 90 km s−1 for the whole field observed with theLovell telescope in H I. Contour levels are at 0.1 × (1, 2, 3, 4, 5) R. (c) WHAM Hα spectra at the positions (A0)–(A7). Velocities are in the LSR. Where Hα isobserved (positions A0, A2, A5, A7), a three-component Gaussian fit is indicated by a dotted line with the (data–model) residual shown by the dashed line.
3.5 IRAS ISSA results
In this section the IRAS 60- and 100-µm ISSA images are comparedwith previous Arecibo H I observations of Smoker et al. (2001a).These latter data are of resolution 3 arcmin and contain both low-and intermediate-velocity gas. Fig. 19 shows the 100-µm imageoverlaid on the total (LV plus IV) H I column density, with Fig. 20displaying the corresponding 60-µm data and the IVC H I columndensity alone. There appears to be a relatively good correlationbetween the IRAS and H I results, both for the low- and intermediate-velocity gas; although with such a small field such agreement couldhave occurred by chance. The emission is not likely to be fromthe M15 globular cluster itself, as globular clusters are undetectedat the 60- and 100-µm IRAS sensitivity limits (Origlia, Ferraro &Pecci 1996). Plots comparing the low, total and intermediate H I
column density with the IRAS flux density are displayed in Fig. 21.Assuming that the observed correlations are in fact real, the currentdata indicate that this IVC contains dust, as has also been observedin other such objects (Malawi 1989; Weiß et al. 1999). The fact thatthe IVC is tentatively detected at 60 µm indicates that the dust maybe warm, perhaps heated by collisions.
The (tentative) IRAS detection contrasts with the situation inHVCs, which (at least at the IRAS sensitivity) do not appear toemit at these wavelengths (Wakker & Boulanger 1986). Such a dif-
ference indicates either differences in dust content, dust temperatureor environment (such as the distance from the heating field of theGalactic plane). H I absorption-line spectroscopy towards a numberof HVCs by Akeson & Blitz (1999) indicates that the fraction ofcold gas is low in these objects. If so, then this would point to theGalactic-halo HVCs containing less dust than the IVCs and not todifferences in temperature.
4 D I S C U S S I O N
4.1 The Hα properties of the M15 IVC
4.1.1 Estimates of the emission measure and H II column density
The detection of Hα towards the main M15 IVC (position A5) witha brightness of ∼1.3 R compares with lower values of between 0.06and 0.20 R observed in a number of high-velocity clouds (Tufte et al.1998). Similarly, many of the HVCs observed by Weiner, Vogel &Williams (1999) are very faint (<0.03 R), implying that, if they arephotoionized by hard photons from the Galaxy, they are 20–60 kpcdistant. The relatively high Hα emission from the M15 IVC, in turn,argues for a closer distance, assuming that shock ionization is notthe dominant factor. This is a big assumption, as detections of Hα inthe Magellanic Stream (distance 55 kpc) of are 0.20–0.37 R (Bland-Hawthorn & Maloney 1999) are similar to the range of ∼0.1–0.5 R
C© 2002 RAS, MNRAS 337, 385–400
Observations of the M15 cloud 395
Table 2. Wisconsin Hα Mapper results. The values for the velocities and fluxes are the results of three-component Gaussian fitting to the low- and intermediate-velocity gas. Hα brightnesses have not been corrected for Galactic absorption, hence assuming that the IVC lies above the Galactic plane, the tabulated valuesare likely to be low by ∼25 per cent. Lovell telescope H I multibeam results, smoothed to a WHAM-sized 1◦ beam, provide H I velocity information towardsposition (A5).
Position on Fig. 15 (A7) (A5) (A2) (A0)
RA (J2000) 21h 26m 53.s3 21h 29m 24.s9 21h 32m 00.s4 21h 34m 37.s0Dec. (J2000) +11◦ 28′ 58′′ +12◦ 14′ 30′′ +13◦ 00′ 02′′ +13◦ 44′ 43′′l (deg) 63.88 64.98 66.09 67.19b (deg) −27.16 −27.16 −27.16 −27.16Hα LV Vc (km s−1) −32.0 ± 16.6, +2.7 ± 2.6 −53.9 ± 4.6, −4.4 ± 0.7 −43.8 ± 3.7, −5.3 ± 0.6 −32.4 ± 9.5, −0.7 ± 1.5Hα LV FWHM (km s−1) 44.6 ± 22.4, 35.1 ± 4.8 26.7 ± 10.4, 47.8 ± 2.6 18.8 ± 9.4, 35.2 ± 2.0 30.3 ± 14.1, 29.5 ± 2.9Hα LV flux (R) 0.27 ± 0.18, 1.02 ± 0.20 0.14 ± 0.06, 2.10 ± 0.08 0.11 ± 0.04, 1.50 ± 0.06 0.20 ± 0.13, 1.26 ± 0.14Hα LV peak [mR (km s−1)−1] 4.8 ± 1, 23 ± 1 4.2 ± 1, 35 ± 1 4.7 ± 01, 34 ± 1 5.2 ± 1, 34 ± 1Hα IV Vc (km s−1) +59.3 ± 1.1 +64.3 ± 0.4 +59.4 ± 0.8 +71.4 ± 0.5Hα IV FWHM (km s−1) 18.8 ± 3.4 31.5 ± 1.4 38.1 ± 2.4 27.5 ± 1.5Hα IV flux (R) 0.25 ± 0.02 1.30 ± 0.04 0.95 ± 0.04 0.91 ± 0.03Hα IV Peak [mR (km s−1)−1] 11 ± 1 33 ± 1 20 ± 1 26 ± 1H I IV Vc (km s−1) – 65.7 ± 0.6 – –H I IV FWHM (km s−1) – 22.0 ± 2.0 – –
Figure 16. Solid line, WHAM Hα spectrum towards l = 64.98◦, b =−27.16◦ (A5). The dotted line shows the results of a three-component Gaus-sian fit. The dashed line is a (data–three-component Gaussian fit) residual.
detected towards the IVC Complex K (Haffner, Reynolds & Tufte2001), which has a distance bracket of 0.3–7.7 kpc.
Assuming that extinction is negligible and that the cloud is op-tically thin, the observed Hα brightness of the IVC can be used toestimate both the column density of ionized hydrogen and the elec-tron density. For an optically thin gas, the Hα surface brightness inRayleigh, Iα , is given by
Iα = 0.36 × EM ×√
T × [1 − 0.37 × ln(T )], (1)
where T is the gas temperature in units of 104 K and EM is theemission measure (
∫n2
e dl) in units of pc cm−6 (Simonetti, Topasna& Dennison 1996). Here, ne is the electron density and integrationover dl provides the thickness (L) of the ionized region. Assumingthe temperature of the H II is 8000 K, typical of the warm interstellarmedium (Reynolds 1985), the resulting emission measure towardsposition (A5) is 3.7 pc cm−6.
Assuming a distance to the main IVC condensation of 1 kpc,the cloud size (d) at a column density limit of NH I = 1019 cm−2
is ∼0.6 × 0.8 deg2, corresponding to linear dimensions of ∼10 ×
Figure 17. Nearest two WHAM Hα spectra towards HD 203664 with theirangular distances from the star indicated.
14 pc. If the cloud is approximately spherically symmetric, thisresults in an estimated electron density (assuming a size of 12 pc) of√
EM/d ∼ 0.6 f −1/2 cm−3 and a column density of ionized hydrogen(= Lne) of ∼2 × 10¹⁹ f 1/2 cm−2, where f is the filling fraction of H II
in the IVC. Smoothed to a resolution of 1◦ (corresponding to the sizeof the WHAM beam), the H I column density at this point derivedfrom the data of Kennedy et al. (1998) is ∼1.4 × 1019 cm−2, hencethe fractional ratio of H II to H I is of the order of 1.4 f 1/2, indicatingthat there is a substantial amount of ionized gas at intermediatevelocities present in this sightline.
For positions (A2) and (A7), and using the same cloud size asabove, results in estimated H II column densities of 1.5 × 10¹⁹ and0.8 × 1019 cm−2, corresponding to fractional H II to H I values of theorder of 1.5 f 1/2 and 2.0 f 1/2, respectively. These fractional H II toH I ratios towards the current IVC are somewhat higher than derivedby Tufte et al. (1998) for a sample of HVCs, which were calculatedto be <0.06 f 1/2. However, recent work by Bluhm et al. (2001),in sightlines towards the Large Magellanic Cloud, used the relativeunderabundance of neutral oxygen to infer an ionization level in bothan IVC and HVC of ∼90 per cent. It would be useful to observe this
C© 2002 RAS, MNRAS 337, 385–400
396 J. V. Smoker et al.
M15 IVC HIE19 plus WHAM pos.
Cont peak flux = 3.6675E+00 HIE19Levs = 1.000E+00 * (1, 2, 3)
DE
CL
INA
TIO
N (
J200
0)
RIGHT ASCENSION (J2000)21 31 30 29 28 27 26 25 24 23
09 30
00
08 30
00 (d5)
(d3)
(d1)
(d2)
(d4)
Figure 18. Top panel, Lovell telescope multibeam IVC H I surface den-sity map of feature (D) (+50 < VLSR < +80 km s−1), with contour levelsat NH I = (1, 2, 3) × 1019 cm−2 with WHAM pointings (d1)–(d5) marked.Bottom panel, WHAM Hα spectrum towards (d3). The dotted line is a three-component Gaussian fit with the dashed line showing the data–fit residualspectrum.
cloud using the same methods as described in the current paper andcompare the results.
Towards (d3) there is no detection in Hα with velocities corre-sponding to the H I value of ∼+68 km s−1. Assuming a cloud sizeof 8 pc and an upper limit to the Hα brightness of 0.2 R, gives anestimated upper limit to the IVC H II column density and fractionalH II to H I values of ∼4 × 1018 cm−2 and 0.7 f 1/2. Finally, we con-sider the halo star HD 203664, towards which the limiting columndensity of neutral hydrogen is ∼1018 cm−2. If we take the upperlimit to the Hα brightness of 0.2 R, and combine this with a cloudsize L (in pc, where the Arecibo beam is ∼1 pc FWHM at 1-kpcdistance), a fractional H II to H I ratio of ∼1.4L f 1/2 can be set bythe current observations.
4.1.2 Estimates of the ionizing radiation fieldand electron density
Following Tufte et al. (1998), if photoionization is the dominantcause of Hα emission, then the incident Lyman continuum flux FLC
can be estimated, assuming case B recombination:
GREY: IRAS 100 Microns ISSACONT: Arecibo M15 Total HIE19
5.0
5.5
6.0
6.5
7.0
7.5
8.0
8.5
DE
CL
INA
TIO
N (
J200
0)
RIGHT ASCENSION (J2000)21 31 0030 30 0029 30 0028 30
12 25
20
15
10
05
00
11 55
Figure 19. Arecibo H I and IRAS ISSA data. Grey-scale, IRAS 100-µmflux density; contour, Total (LV plus IV) H I column density at NH I =(56, 60, 64, 68, 72) × 1019 cm−2.
GREY: IRAS 60 Microns ISSACONT: Arecibo M15 IVC HIE19
-0.4
-0.2
0.0
0.2
0.4
0.6D
EC
LIN
AT
ION
(J2
000)
RIGHT ASCENSION (J2000)21 31 0030 30 0029 30 0028 30
12 25
20
15
10
05
00
11 55
Figure 20. Arecibo H I and IRAS ISSA data. Grey-scale, IRAS 60-µm fluxdensity; contour, IVC H I column density at NH I = (2, 4, 6, 8) × 1019 cm−2.Note how the peak H I contour corresponds to the IRAS peak.
FLC = 2.1 × 10⁵ Iα
0.1 Rphoton cm−2 s−1, (2)
where Iα is the Hα intensity in Rayleigh. For the M15 IVC, equa-tion (2) implies an incident flux (FLC) of 2.7 × 10⁶ photon cm−2 s−1.Hence if photoionization is the main cause of Hα production, thederived Lyman-alpha continuum flux towards the main M15 IVCcondensation is a factor of 6–22 times higher than the implied in-cident flux towards the A, C and M HVCs observed by Tufte et al.(1998), and more than twice that observed towards the Complex KIVC by Haffner et al. (2001). We recall that Complex A lies between4 and 10 kpc, with Complex C being some 5–25 kpc distant and theM15 IVC being closer than 3 kpc. In the future, comparison of de-rived Lyman-alpha continuum fluxes for a larger sample of IVC andHVC sightlines with known distances may provide information onthe relative contributions of the Galactic and extragalactic ionizingfield.
An alternative possibility is that the Hα is produced by shockionization, caused by interaction of the IVC with LV gas. This isa real possibility given the orientation of the IVC and the fact thatits z-distance of less than 1 kpc puts it in the lower Galactic halo.Towards the nearby halo star HD 203664 in which IV absorption isseen, Sembach (1995) postulated that the dust grains in the IVC have
C© 2002 RAS, MNRAS 337, 385–400

Observations of the M15 cloud 397
Figure 21. Arecibo H I and IRAS ISSA data. The IRAS fluxes have an arbi-trary zero-point. (a) IRAS 100-µm flux density plotted against low-velocitygas H I column density. (b) IRAS 100-µm flux density plotted against totalH I column density. (c) IRAS 60-µm flux density plotted against IVC H I
column density alone.
been processed by such shocks, which also currently produce thehighly ionized species. For an ambient temperature of <3 × 10⁵ K,a cloud of velocity 50 km s−1 will be supersonic and hence shocksmay be formed given the right conditions. Using the models of Ray-mond (1979), which are applicable for shocks with speed 50 < Vs <
140 km s−1, the face-on Hα surface brightness (Iαperp) can be relatedto the number density of the pre-shocked gas (n0), thus
(Iαperp) ∼ 6.5 × n0(Vs/100)1.7 R. (3)
Given that Iαperp = 1.3 R, and assuming a shock speed of 50 kms−1, leads to an upper limit to n0 of 0.6 cm−3. The value is an upperlimit (for this shock speed velocity) as a non-perpendicular sightlinewill increase the observed Iα (Tufte et al. 1998). Of course, given thefact that the transverse component of the velocity of the M15 IVCis unknown, this value is very uncertain. Discriminating betweenshock and photoionization is difficult, although further progress maybe possible via measurements of appropriate emission-line ratios(Tufte et al. 1998).
4.2 Ca II number density towardsthe M15 IVC and HD 203664
Before discussing the Ca II K results, we note that calcium is de-pleted on to dust and is not the dominant ionization species, hencethe absolute metallicity of the M15 IVC is uncertain and awaitshigh-resolution UV observations. As emphasized by Ryans et al.
(1997), differences in resolution between the optical and radio data,combined with the Ca II K results only placing limits on the ionabundances, makes it important not to overinterpret the observedN(Ca II)/N(H I) ratios.
With that caveat, and assuming that the current observationsdo not miss any narrow-velocity components, the average IVCCa II number density and ratio of the IVC compared with H I
towards the centre of M15 are log10[N (Ca II cm−2)] = 12.0 andN(Ca II)/N (H I) = 2.5 × 10⁻⁸. The H I column density towards theM15 centre is 4 × 1019 cm−2 and was obtained using the combinedWSRT plus Arecibo map of resolution 111 × 56 arcsec2. For thenearby sightline towards the halo star HD 203664, we use the re-sults of Ryans et al. (1996) for the total IVC Ca II K column densityof ∼1 × 1012 cm−2, combined with the upper limit to the H I col-umn density at a resolution of 3 arcmin towards HD 203664 of∼1 × 1018 cm−2 (Smoker et al. 2001a), giving a much higher valueof N(Ca II)/N (H I) > 1.0 × 10⁻⁶.
The current results compare with literature values ofN(Ca II)/N (H I) ∼2 × 10⁻⁹ (Hobbs 1974, 1976) for low-velocitydiffuse clouds and of N(Ca II)/N (H I) in the range 3–300 × 10−9
cm−2 for the high latitude clouds studied by Albert et al. (1993). TheN(Ca II)/N (H I) ratios in IVCs and HVCs are thought to be higherthan in low-velocity gas, owing to the former having less dust on towhich calcium is depleted. Thus the observed N(Ca II)/N (H I) ratioof 2.5 × 10⁻⁸ (or ∼0.01 of the total solar calcium abundance) in theline of sight towards M15 is typical of other high-latitude cloudsand also of other HVCs and IVCs (e.g. Wakker et al. 1996a; Ryanset al. 1997).
The lower limit of N (Ca II)/N (H I) > 10−6 towards HD 203664is, however, on the high side for IVCs/HVCs, being ∼0.5 of thetotal solar calcium abundance. There are several possible reasonsfor this. First, the (currently undetected) H I towards HD 203664could be in a clump of gas smaller than the Arecibo beamsize of3 arcmin; if this were the case then the H I column density limitused would be too low and the derived N (Ca II)/N (H I) ratio toohigh. Additionally, HST UV observations towards HD 203664 in-dicate that the H I towards this object is at least partially ionized(Sembach, private communication), either by shock ionization orphotoionization. If photoionization, aside from the normal ionizingsource being Galactic OB-type stars or the extragalactic UV field,HD 203664 itself (spectral type B0.5) could be a possible ioniz-ing source. The fact that its LSR velocity is +110 km s−1 (Littleet al. 1994) compared with the IVC at +70 km s−1 is inconclusivein determining the relative distance of the line-of-sight IVC towardsHD 203664 with the star itself. Finally, there remains the possibil-ity that the hydrogen is in molecular form. However, given the lowH I column density towards the HD 203664 sightline, this appearsunlikely.
Alternatively, it could be that the derived value of N (Ca II)/N (H I) > 10−6 towards HD 203664 is correct. This would tally withthe IUE results of Sembach (1995), which found that the majority ofthe elements in the IV gas, when referenced to sulphur, were withina factor of 5 of their solar values and strongly point to a Galac-tic origin for this part of the IVC. The fact that our derived valuefor N (Ca II)/N (H I) towards the M15 IVC of 0.01 solar is muchlower than towards HD 203664 is likely to be caused by differentionization fractions and dust contents, and/or differing formationmechanisms. Clearly, the latter is speculative and requires follow-uphigh-resolution UV observations towards the M15 IVC to determinethe abundances of elements such as sulphur and zinc that are notdepleted on to dust.
C© 2002 RAS, MNRAS 337, 385–400
398 J. V. Smoker et al.
4.3 Velocity widths and temperatures towardsthe M15 IVC and HD 203664
Towards the main M15 IVC condensation (feature ‘A’ in Fig. 10)values of the H I FWHM velocity width at resolutions of ∼2 ×1 arcmin2 range from 5 to 14 km s−1, corresponding to maximumkinetic temperatures in the range ∼500–4000 K. Mid-way betweenthe M15 IVC and HD 203664, the FWHM equals 12 km s−1 at aresolution of 3 arcmin, which corresponds to Tk ∼ 3000 K (feature‘AR’ in Fig. 10). The current observations have additionally ob-served feature ‘D’ at a resolution 12 arcmin, also with a FWHMvelocity width of 12 km s−1, indicating gas at a similar tempera-ture. We note that each of these temperatures will be upper limitscaused by beam smearing and turbulent velocity components. Fi-nally, towards HD 203664, Ryans et al. (1996) found cloudlets withFWHM of 2.8 and 3.2 km s−1 in Ca II K, corresponding to upperlimits for the kinetic temperatures of ∼8000–10 000 K. Towardsthe same star, Sembach (1995) used the relative abundances of low-ionization species to derive a temperature for the HD 203664 IVCof 5300–6100 K.
The higher IVC gas temperatures towards HD 203664 than to-wards the M15 IVC, feature ‘D’ or the intermediate position ‘AR’could be interpreted as being caused by the former cloud beingnearer to the ionizing field of the Galactic plane than the other twoIVCs (Lehner 2000). It seems more likely that the lower temper-atures seen towards parts of ‘A’ and ‘AR’ are simply caused byshielding of parts of these gas clouds; shielding that is not pos-sible towards the HD 203664 IVC because of the lower gas den-sity there. A two-phase core–envelope structure for halo HVCshas often been proposed within the Galactic corona for 1 < z <
5 kpc (e.g. Wolfire et al. 1995), where the two components of100 and 10 000 K are entrained by pressure from the hot Galac-tic corona. We note that the high-end H I temperatures observedtowards the M15 IVC indeed occur towards its outer parts wherethe H I column density is low and the FWHM velocity widths areuncertain.
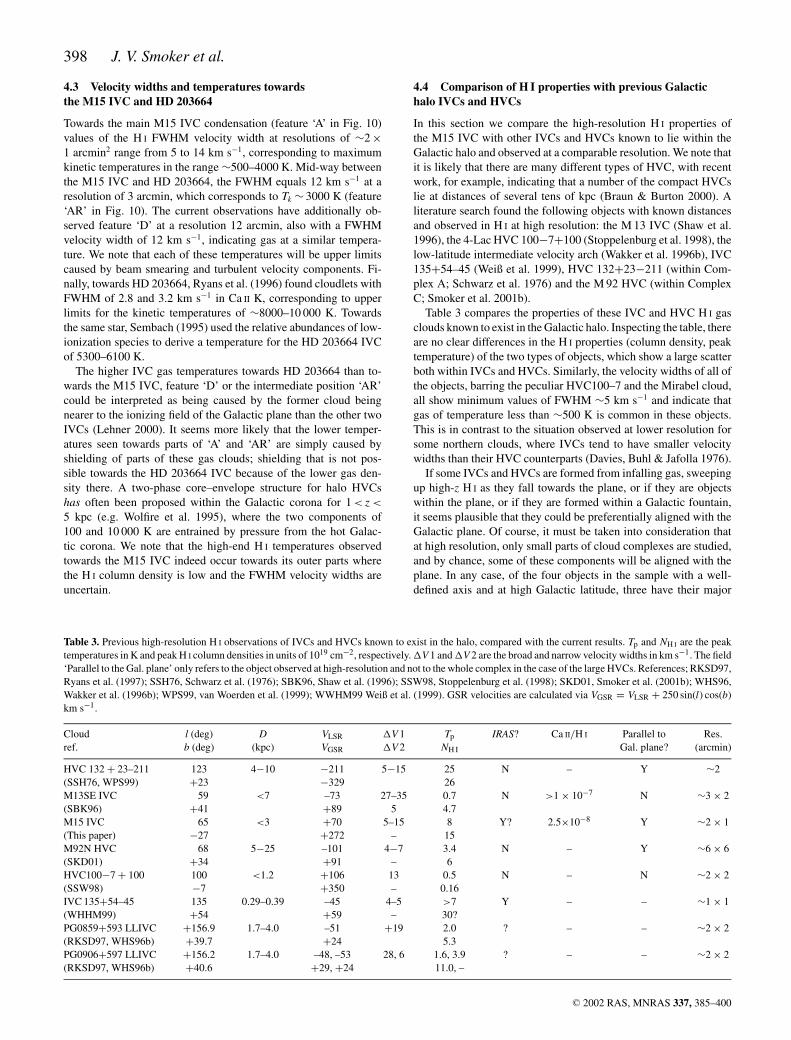
Table 3. Previous high-resolution H I observations of IVCs and HVCs known to exist in the halo, compared with the current results. Tp and NH I are the peaktemperatures in K and peak H I column densities in units of 1019 cm−2, respectively. �V 1 and �V 2 are the broad and narrow velocity widths in km s−1. The field‘Parallel to the Gal. plane’ only refers to the object observed at high-resolution and not to the whole complex in the case of the large HVCs. References; RKSD97,Ryans et al. (1997); SSH76, Schwarz et al. (1976); SBK96, Shaw et al. (1996); SSW98, Stoppelenburg et al. (1998); SKD01, Smoker et al. (2001b); WHS96,Wakker et al. (1996b); WPS99, van Woerden et al. (1999); WWHM99 Weiß et al. (1999). GSR velocities are calculated via VGSR = VLSR + 250 sin(l) cos(b)km s−1.
Cloud l (deg) D VLSR �V 1 Tp IRAS? Ca II/H I Parallel to Res.ref. b (deg) (kpc) VGSR �V 2 NH I Gal. plane? (arcmin)
HVC 132 + 23–211 123 4−10 −211 5−15 25 N – Y ∼2(SSH76, WPS99) +23 −329 26M13SE IVC 59 <7 –73 27–35 0.7 N >1 × 10⁻⁷ N ∼3 × 2(SBK96) +41 +89 5 4.7M15 IVC 65 <3 +70 5–15 8 Y? 2.5×10⁻⁸ Y ∼2 × 1(This paper) −27 +272 – 15M92N HVC 68 5−25 –101 4−7 3.4 N – Y ∼6 × 6(SKD01) +34 +91 – 6HVC100−7 + 100 100 <1.2 +106 13 0.5 N – N ∼2 × 2(SSW98) −7 +350 – 0.16IVC 135+54–45 135 0.29–0.39 –45 4–5 >7 Y – – ∼1 × 1(WHHM99) +54 +59 – 30?PG0859+593 LLIVC +156.9 1.7–4.0 –51 +19 2.0 ? – – ∼2 × 2(RKSD97, WHS96b) +39.7 +24 5.3PG0906+597 LLIVC +156.2 1.7–4.0 –48, –53 28, 6 1.6, 3.9 ? – – ∼2 × 2(RKSD97, WHS96b) +40.6 +29, +24 11.0, –
4.4 Comparison of H I properties with previous Galactichalo IVCs and HVCs
In this section we compare the high-resolution H I properties ofthe M15 IVC with other IVCs and HVCs known to lie within theGalactic halo and observed at a comparable resolution. We note thatit is likely that there are many different types of HVC, with recentwork, for example, indicating that a number of the compact HVCslie at distances of several tens of kpc (Braun & Burton 2000). Aliterature search found the following objects with known distancesand observed in H I at high resolution: the M 13 IVC (Shaw et al.1996), the 4-Lac HVC 100−7+100 (Stoppelenburg et al. 1998), thelow-latitude intermediate velocity arch (Wakker et al. 1996b), IVC135+54–45 (Weiß et al. 1999), HVC 132+23−211 (within Com-plex A; Schwarz et al. 1976) and the M 92 HVC (within ComplexC; Smoker et al. 2001b).
Table 3 compares the properties of these IVC and HVC H I gasclouds known to exist in the Galactic halo. Inspecting the table, thereare no clear differences in the H I properties (column density, peaktemperature) of the two types of objects, which show a large scatterboth within IVCs and HVCs. Similarly, the velocity widths of all ofthe objects, barring the peculiar HVC100–7 and the Mirabel cloud,all show minimum values of FWHM ∼5 km s−1 and indicate thatgas of temperature less than ∼500 K is common in these objects.This is in contrast to the situation observed at lower resolution forsome northern clouds, where IVCs tend to have smaller velocitywidths than their HVC counterparts (Davies, Buhl & Jafolla 1976).
If some IVCs and HVCs are formed from infalling gas, sweepingup high-z H I as they fall towards the plane, or if they are objectswithin the plane, or if they are formed within a Galactic fountain,it seems plausible that they could be preferentially aligned with theGalactic plane. Of course, it must be taken into consideration thatat high resolution, only small parts of cloud complexes are studied,and by chance, some of these components will be aligned with theplane. In any case, of the four objects in the sample with a well-defined axis and at high Galactic latitude, three have their major
C© 2002 RAS, MNRAS 337, 385–400
Observations of the M15 cloud 399
axis near-parallel to the plane. Although there exist a number ofsuch objects observed at lower resolution with this orientation, to ourknowledge no systematic survey has been performed determiningthe orientation parameters of HVCs. If performed, this could act as afurther discriminator between HVCs known to exist in the Galactichalo, and the sample of HVCs postulated to lie at extragalacticdistances.
Summarizing, at present there are too few high-resolution obser-vations of Galactic halo IVCs and HVCs to determine differencesin H I properties and any relationship between the two types of ob-ject. However, as previously noted, the IRAS and Hα properties doappear to differ, although the number of objects studied in all threewavebands remains small.
5 S U M M A RY A N D C O N C L U S I O N S
The current H I WSRT synthesis observations have shown that onscales down to ∼1 arcmin, the M15 IVC shows substructure, withvariations in the column density of a factor of ∼4 on scales of ∼5arcmin being observed, corresponding to scales of ∼1.5D pc, whereD is the IVC distance in kpc. Of course, this is not an unexpectedfinding, but once again demonstrates that great care must be takenin interpreting quantities such as cloud metallicities that are derivedfrom a combination of low-resolution radio plus optical data. TheLovell telescope H I observations towards this cloud demonstratedhow relatively large areas of sky can be mapped with the multibeamsystem in a short period of time in the search for IVCs and HVCs.These data showed that the M15 IVC has components spread outover several square degrees, with component ‘D’ being mapped forthe first time at medium resolution (12 arcmin) and having a similarcolumn density to the IV gas centred upon M15 itself. Both the H I
emission-line and Ca II absorption-line data showed tentative evi-dence for velocity substructure, perhaps indicative of cloudlets. TheCa II/H I value of ∼2.5 × 10⁻⁸ towards the main M15 condensationis similar to that previously observed in other IVCs and HVCs. To-wards HD 203664, the observed lower limit of 10−6 is somewhathigher, although this may be caused by factors such as the H I beambeing unfilled or partial ionization of the gas on this sightline. TheH I properties of the M15 IVC are indistinguishable from HVCs,although with the lack of distance information towards most HVCs,comparisons are difficult.
The tentative detection of infrared emission from the M15 IVC,as in other IVCs, does distinguish it from HVCs, and either pointsto the M15 IVC containing more dust, and/or being closer to theheating field of the Galactic plane than HVCs, which as a class ofobjects are not detected in the IRAS wavebands. Similarly, the rel-atively strong Hα emission (exceeding 1 R) towards parts of theM15 IVC, if caused by photoionization, may place it closer to theGalaxy than HVCs. Again, however, this finding is uncertain owingto the problem in distinguishing photoionization from shock ion-ization, uncertainties in dust content, and differences in H I volumedensities in different objects studied thus far.
Future work towards this cloud should include higher signal-to-noise ratio observations in the Ca II line in order to determine whetherthe cloud velocity substructure tentatively found in the current ob-servations is in fact real, and whether the Ca II/H I ratio determinedby the current observations is lower than towards the HD 203664sightline. This should be combined with 12CO(1–0) submillimetreobservations in order to determine whether molecular material existstowards the peaks in H I column density and out of which stars mayform. The determination of the fall-off in H I column density, of thecloud to low column density limits would also indicate the ionization
properties of the object and whether or not there is any interactionbetween the M15 IVC gas and low-velocity material. Finally, UVobservations towards M15 globular cluster stars, although difficult,would provide important information on the absolute metallicity ofthe gas towards this object for comparison with the HD 203 664sightline.
AC K N OW L E D G M E N T S
We would like to thank the Netherlands Foundation for Researchin Astronomy (NFRA) which is a national facility supported by theNetherlands Organization for Scientific Research. In particular, weare very grateful for the help that Robert Braun provided with thereduction of the WSRT data. JVS acknowledges NFRA for use ofdata reduction facilities and hospitality and to the staff of JodrellBank observatory for help with the Lovell telescope multibeam ob-servations. We would particularly like to thank Chris Jordan, RobLang, Peter Boyce and Robert Minchin for help with the LT observa-tions. JVS would also like to thank the staff of the William HerschelTelescope, which is part of the Isaac Newton Group of telescopes,La Palma. The Digitized Sky Surveys were produced at the SpaceTelescope Science Institute under US Government grant NAG W-2166. The National Geographic Society – Palomar Observatory SkyAtlas (POSS-I) was made by the California Institute of Technologywith grants from the National Geographic Society. IPAC is operatedby the Jet Propulsion Laboratory (JPL) and California Institute ofTechnology (Caltech) for NASA. IPAC is funded by NASA aspart of the IRAS extended mission programme under contract toJPL/Caltech. The WHAM project is funded primarily through grantsfrom the National Science Foundation with additional support pro-vided by the University of Wisconsin. JVS also thanks AndrewGeorge and PPARC for financial support and to the referee, Dr V.Kilborn for useful comments.
R E F E R E N C E S
Akeson R.L., Blitz L., 1999, ApJ, 523, 163Albert C.E., Blades J.C., Morton D.C., Lockman F.J., Proulx M., Ferrarese
L., 1993, ApJS, 88, 81Allen C.W., 1973, Astrophysical Quantities, 3rd edn. Athlone Press, LondonBarnes D.G. et al., 2001, MNRAS, 322, 486Bland-Hawthorn J., Maloney P.R., 1999, ApJ, 510, 33Blitz L., Spergel D.N., Teuben P.J., Hartmann D., Burton W.B., 1999, ApJ,
514, 818Bluhm H., de Boer K.S., Marggraf O., Richter P., 2001, A&A, 367, 299Bowen D.V., 1991, MNRAS, 251, 649Braun R., Burton W.B., 2000, A&A, 354, 853Bruns C., Kerp J., Kalberla P.M.W., Mebold U., 2000, A&A, 357, 120Cardelli J.A., Clayton G.C., Mathis J.S., 1989, ApJ, 345, 245Christodoulou D.M., Tohline J.E., Keenan F.P., 1997, ApJ, 486, 810Davies R.D., Buhl D., Jafolla J., 1976, A&AS, 23, 181Durrell P.R., Harris W.E., 1993, AJ, 105, 1420Dyson J.E., Hartquist T.W., 1983, MNRAS, 203, 1233Faison M.D., Goss W.M., Diamond P.J., Taylor G.B., 1998, AJ, 116, 2916Haffner L.M., 1999, PhD thesis, Univ. Wisconsin-MadisonHaffner L.M., Reynolds R.J., Tufte S.L., 2001, ApJ, 556, 33Harris W.E., 1996, AJ, 112, 1487Hartmann D., Burton W.B., 1997, Atlas of Galactic Neutral Hydrogen.
Cambridge Univ. Press, CambridgeHeiles C., 1997, ApJ, 481, 193Hobbs L.M., 1974, ApJ, 191, 381Hobbs L.M., 1976, ApJ, 203, 143Howarth I.D., Murray J., Mills D., Berry D.S., 1996, STARLINK, User Note
SUN 50. Rutherford Appleton Laboratory/CCLRC
C© 2002 RAS, MNRAS 337, 385–400
400 J. V. Smoker et al.
Ivezic Z., Christodoulou D.M., 1997, ApJ, 486, 818Jaschek C., Jaschek M., 1987, The Classification of Stars. Cambridge Univ.
Press, CambridgeKennedy D.C., Bates B., Keenan F.P., Kemp S.N., Ryans R.S.I., Davies R.D.,
Sembach K.R., 1998, MNRAS, 297, 849Kuntz K.D., Danly L., 1996, ApJ, 457, 703Lauroesch J.T., Meyer D.M., Blades J.C., 2000, ApJ, 543, 43Lehner N., 2000, PhD thesis, The Queen’s Univ. BelfastLehner N., Rolleston W.R.J., Ryans R.S.I., Keenan F.P., Bates B., Pollacco
D.L., Sembach K.R., 1999, A&AS, 134, 257Little J.E., Dufton P.L., Keenan F.P., Conlon E.S., Davies R.D., 1994, ApJ,
427, 267Malawi A., 1989, PhD thesis, Univ. ManchesterMeyer D.M., Lauroesch J.T., 1999, ApJ, 520, 103Morton D.C., 1991, ApJS, 77, 119Origlia L., Ferraro F.R., Pecci F.F., 1996, MNRAS, 280, 572Raymond J.C., 1979, ApJS, 39, 1Reynolds R.J., 1985, ApJ, 294, 256Ryans R.S.I., Sembach K.R., Keenan F.P., 1996, A&A, 314, 609Ryans R.S.I., Keenan F.P., Sembach K.R., Davies R.D., 1997, MNRAS, 289,
83Sault R.J., Teuben P.J., Wright M.C.H., 1995, in Shaw R., Payne H.E., Hayes
J.J.E., eds, ASP Conf. Ser. Vol. 77. Astronomical Data Analysis Softwareand Systems IV. Astron. Soc. Pac., San Francisco, p. 433
Schwarz U.J., Sullivan W.T. III., Hulsbosch A.N.M., 1976, A&A, 52, 133Sembach K.R., 1995, ApJ, 445, 314Shaw C.R., Bates B., Kemp S.N., Keenan F.P., Davies R.D., Roger R.S.,
1996, ApJ, 473, 849Shortridge K. et al., 1999, STARLINK, User Note SUN 86. Rutherford Appleton
Laboratory/CCLRC
Simonetti J.H., Topasna G.A., Dennison B., 1996, AAS, 188, 1201Smoker J.V., Lehner N., Keenan F.P., Totten E.J., Murphy E., Sembach K.R.,
Davies R.D., Bates B., 2001a, MNRAS, 322, 13Smoker J.V., Roger R.S., Keenan F.P., Davies R.D., Lang R.H., 2001b, A&A,
380, 673Stoppelenburg P.S., Schwarz U.J., van Woerden H., 1998, A&A, 338, 200Tan J.C., 2000, ApJ, 536, 173Tufte S.L., Reynolds R.J., Haffner L.M., 1998, ApJ, 504, 773van Woerden H., Peletier R.F., Schwarz U.J., Wakker B.P., Kalberla
P.M.W., 1999, in Gibson B.K., Putman M.-E., eds, ASP Conf. Ser.Vol. 166, Stromlo Workshop on High-Velocity Clouds. Astron. Soc. Pac.,San Francisco, p. 1
Wakker B.P., 1991, A&A, 250, 499Wakker B.P., 2001, ApJS, 136, 463Wakker B.P., Boulanger F., 1986, A&A, 170, 84Wakker B.P., Schwarz U.J., 1991, A&A, 250, 484Wakker B.P., van Woerden H., Schwarz U.J., Peletier R.F., Douglas N.G.,
1996a, A&A, 306, 25Wakker B., Howk C., Schwarz U., van Woerden H., Beers T., Wilhelm R.,
Kalberla P., Danly L., 1996b, ApJ, 473, 834Weiß A., Heithausen A., Herbstmeier U., Mebold U., 1999, A&A, 344,
955Weiner B.J., Vogel S.N., Williams T.B., 1999, BAAS, 195, 9703 (abstract)Wolfire M.G., McKee C.F., Hollenbach D., Tielens A.G.G.M., 1995, ApJ,
453, 673
This paper has been typeset from a TEX/LATEX file prepared by the author.
C© 2002 RAS, MNRAS 337, 385–400
Related Documents


![-./ oC. J. Grund, Lidar observations of atmospheric processes involving volcanic clouds, preprint, 1993]. Observed strato-spheric aerosol extinction from SAGE II multiwavelength measurements](https://static.cupdf.com/doc/110x72/5f09d19e7e708231d428a2d3/-o-c-j-grund-lidar-observations-of-atmospheric-processes-involving-volcanic.jpg)


