Multivariate Statistical Multivariate Statistical Process Control for Process Control for Fault Detection using Fault Detection using Principal Component Principal Component Analysis Analysis . . APACT Conference ’04 APACT Conference ’04 Bath Bath

Multivariate Statistical Process Control for Fault Detection using Principal Component Analysis .
Dec 30, 2015
Multivariate Statistical Process Control for Fault Detection using Principal Component Analysis. APACT Conference ’04 Bath. Personnel. Outline. Process Monitoring and Fault Detection and Isolation. Implement Statistical Quality Control prog. Maximise Yield through Statistical Data Analysis - PowerPoint PPT Presentation
Welcome message from author
This document is posted to help you gain knowledge. Please leave a comment to let me know what you think about it! Share it to your friends and learn new things together.
Transcript

Multivariate Statistical Multivariate Statistical Process Control for Fault Process Control for Fault Detection using Principal Detection using Principal
Component AnalysisComponent Analysis..
APACT Conference ’04APACT Conference ’04
BathBath

PersonnelPersonnel
Richard Southern, Richard Southern, MSc.MSc.
Trinity College Trinity College Dublin,Dublin,
Ireland.Ireland.
Craig Meskell, PhD.Craig Meskell, PhD. Trinity College Trinity College Dublin,Dublin,
Ireland.Ireland.
Peter Twigg, PhD.Peter Twigg, PhD. Manchester Manchester Metropolitan Metropolitan University, Uk.University, Uk.
Ernst-Michael Ernst-Michael Bohne, PhD.Bohne, PhD.
IBM Microelectronics IBM Microelectronics Division, Ireland.Division, Ireland.

OutlineOutline
Process Monitoring and Fault Detection Process Monitoring and Fault Detection and Isolation.and Isolation.
Implement Statistical Quality Control Implement Statistical Quality Control prog.prog.
Maximise Yield through Statistical Data Maximise Yield through Statistical Data AnalysisAnalysis
Application of RWMApplication of RWM Development of NOC modelDevelopment of NOC model Inference and ConclusionsInference and Conclusions

Real World Real World MethodologiesMethodologies
Statistical Process / Quality Control Statistical Process / Quality Control (SP/QC)(SP/QC)
Statistical process monitoring (uni & multivariate)Statistical process monitoring (uni & multivariate)
Fault Detection & Isolation (FDI)Fault Detection & Isolation (FDI) Principal Component Analysis (PCA)Principal Component Analysis (PCA)
Latent structures modelling (PLS)Latent structures modelling (PLS)
Exponentially Weighted Moving Average Exponentially Weighted Moving Average (EWMA)(EWMA) and MEWMA and MEWMA
Batchwise or Run2Run strategies (R2R)Batchwise or Run2Run strategies (R2R)

Statistical ControlStatistical Control
The objective of SPC is to minimise The objective of SPC is to minimise variation and aim to run in a ‘state of variation and aim to run in a ‘state of statistical control’.statistical control’.
Distinction between common cause (stochastic) Distinction between common cause (stochastic) variations and assignable causevariations and assignable cause
Where process is operating efficientlyWhere process is operating efficiently When product is yielding sufficientlyWhen product is yielding sufficiently
MSPC more realistic representation but MSPC more realistic representation but more complexmore complex
Performance enhancementPerformance enhancement MonitoringMonitoring ImprovementImprovement

FDIFDI
Distinguish between Distinguish between productproduct and and testtest Consistently high quality product/process Consistently high quality product/process
is a challengeis a challenge FDI schemeFDI scheme: a specific application of SPC, : a specific application of SPC,
where a distinction needs to be made where a distinction needs to be made between normal process operation and between normal process operation and faulty operation. i.e. faulty operation. i.e. bullet pt. 1bullet pt. 1
Key pointsKey points Process knowledgeProcess knowledge Fault classificationFault classification

Plant OverviewPlant Overview
IBM Microelectronics DivisionIBM Microelectronics Division Testing vendor supplied Testing vendor supplied μμchipschips Many combinations (product & process)Many combinations (product & process)
(wafer/lot/batch/tester/handler)(wafer/lot/batch/tester/handler) Large data sets (inherent redundancy)Large data sets (inherent redundancy)
This leads to the following pertinent This leads to the following pertinent question:question: Chip faultChip fault or evolving or evolving test unittest unit malfunction?? malfunction??

Batch ProcessBatch Process
Finite durationFinite duration non-linear behaviour & system dependentnon-linear behaviour & system dependent
‘‘Open loop’ wrt to product qualityOpen loop’ wrt to product quality no feedback is applied to the process to reduce error no feedback is applied to the process to reduce error
through batch runthrough batch run
3-way data structure (batch x var x time)3-way data structure (batch x var x time) Parametric and non-std data formatsParametric and non-std data formats Differing test timesDiffering test times Yield is calculated as a % of starts/goodsYield is calculated as a % of starts/goods Yield is a logical AND of test metricsYield is a logical AND of test metrics

Test MatrixTest Matrix
GOOD
GOOD
BAD
BAD
PROCESS
PR
OD
UC
TFalse Fail
Genuine Fails
Pass

Data StructureData Structure
Unusual data set, complex in natureUnusual data set, complex in nature Different data structures (HP, Different data structures (HP,
Teradyne)Teradyne) Large data matrix (avg. batch ≈ 7-10K Large data matrix (avg. batch ≈ 7-10K
cycles)cycles) ≈ ≈ 180 metrics/180 metrics/μμchip/cycle (MS/RF) chip/cycle (MS/RF)
Correlation/redundancyCorrelation/redundancy Analogue and Digital test vectorsAnalogue and Digital test vectors

PCA TheoryPCA Theory Rank reduction or data compression methodRank reduction or data compression method Singular Value Decomposition (SVD) Singular Value Decomposition (SVD) variance-covariance matrixvariance-covariance matrix
Variance - eigenvalues (Variance - eigenvalues (λλ)) Loadings - eigenvectors (PC’s) Loadings - eigenvectors (PC’s)
Linear transform equation yields scoresLinear transform equation yields scores 11stst PC has largest PC has largest λλ, sub. smaller, sub. smaller How many components? How many components? Subjective processSubjective process
Disregard Disregard λλ < 1 < 1 Scree plotsScree plots [too many = over parameterise, [too many = over parameterise,
noise]noise] 70 – 90 % var70 – 90 % var [too few = poor model, incomplete][too few = poor model, incomplete]

PCA PCA flowchartflowchart DB link
data set X (n x m)
normalisation
cov matrix
SVD
pre-processing
model eig%
score & loading vector
T2 & Q stat
MEWMA
Fault Detection

NOC ModelNOC Model Pre-process the dataPre-process the data
normalise normalise NN~(0,1)~(0,1) apply limit files (separate components)apply limit files (separate components) partition data and work with subset of known partition data and work with subset of known
goods goods SVD on subsetSVD on subset eigenvalue contribution to model eigenvalue contribution to model (≈70%)(≈70%)
Post-multiply PC’s with normal batch dataPost-multiply PC’s with normal batch data batch data normalised with model statistics batch data normalised with model statistics ((µ,µ,σσ)) model results can be used to identify shift from model results can be used to identify shift from
normalnormal

-15 -10 -5 0 5 10 15-15
-10
-5
0
5
10
Principal Component 1
Prin
cipa
l Com
pone
nt 2
NOC PC Score plot
HP Data 0905 Yield=91.65%
NOC scores
Pass Data Only

-500 0 500 1000 1500 2000 2500 3000 3500-300
-200
-100
0
100
200
300
400
Principal Component 1
Prin
cipa
l Com
pone
nt 2
Monitoring PC Score plot
HP Data 0905 Yield=91.65%
230
5106
1421
3181
4984
NOCBatch 0905

-100 -50 0 50 100
-20
-15
-10
-5
0
5
10
15
20
Principal Component 1
Prin
cipa
l Com
pone
nt 2
Monitoring PC Score plot
HP Data 0905 Yield=91.65%
4363
4874
NOCBatch 0905
Zoom of scores cluster
-50
510
-10
-5
0
5
-5
0
5
10
Principal Component 1
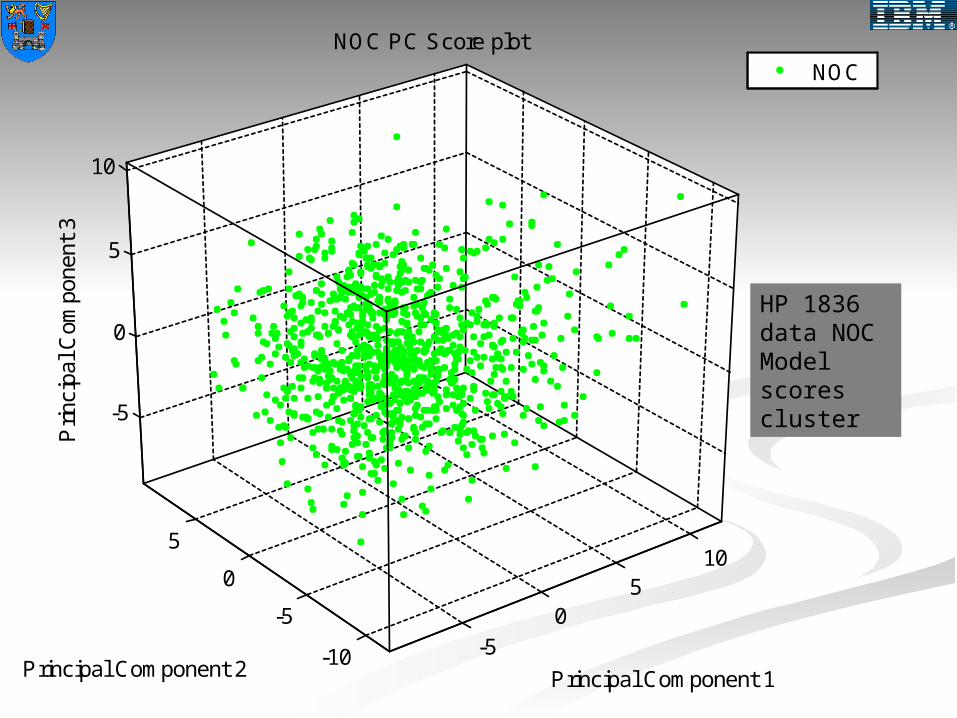
NOC PC Score plot
Principal Component 2
Prin
cipa
l Com
pone
nt 3
NOC
HP 1836 data NOC Model scores cluster

-3000-2000
-10000
1000
-500
0
500
1000
1500-400
-200
0
200
400
600
Principal Component 1
Monitoring PC Score plot
Principal Component 2
Prin
cipa
l Com
pone
nt 3
NOCBatch 1836
HP 1836 data NOC & Batch 1836 scores cluster

HP 1836 data NOC & Batch 1836 scores cluster
(Close Up)

t2036 statisticst2036 statistics
75% eigenvalue 75% eigenvalue contribution (14 contribution (14 PC’s)PC’s)
no. faults = 117 no. faults = 117 Batch size = 2135Batch size = 2135 NOC model shows NOC model shows
fault clustersfault clusters
1 2 3 4 5 6 7 8 9 100
10
20
30
40
50
60
70
80
90
0%
11%
22%
33%
44%
55%
66%
77%
88%
99%Eigenvalue Pareto

-150 -100 -50 0 50 100 150 200-150
-100
-50
0
50
100
150
200
250NOC Scores
PC Score 1
PC
Sco
re 2

-100-50
050
100150
-100
0
100
200
-300
-200
-100
0
PC Score 1
PC Monitoring Score Chart
PC Score 2
PC
Sco
re 3

-150 -100 -50 0 50 100 150 200-150
-100
-50
0
50
100
150
200
250NOC Scores
PC Score 1
PC
Sco
re 2
This fault cluster represent the same fault (8)

MEWMAMEWMA
Rational Rational The PCA is used for a preconditioning, The PCA is used for a preconditioning,
data reduction tooldata reduction tool The scores (subjective level) are used as The scores (subjective level) are used as
input to a MEWMA schemeinput to a MEWMA scheme Create single multivariate chart Create single multivariate chart Weighted average nature is sensitive to Weighted average nature is sensitive to
subtle faultssubtle faults Robust to auto correlated data, Non-Robust to auto correlated data, Non-
normal data normal data

SchematicSchematic
Product Handler TesterProductionData
DUT
DIB Test prog
DB
Yield calc
Summary Stats
Supervisory Scheme
Loop ntimes
SPCPCAMEWMA
Batch loop

ConclusionsConclusions
Process at ‘cell level’Process at ‘cell level’ Reduction of large data setsReduction of large data sets Generation of NOC modelGeneration of NOC model
Tester specific NOC modelTester specific NOC model Product specific NOC modelProduct specific NOC model
Tested with production batch dataTested with production batch data MEWMA method under developmentMEWMA method under development Single fault statistic to max. DUT FPYSingle fault statistic to max. DUT FPY

AcknowledgementsAcknowledgements
IBM Microelectronics Division, IBM Microelectronics Division, IrelandIreland
Trinity College Dublin, IrelandTrinity College Dublin, Ireland APACT 04, Bath.APACT 04, Bath.
Related Documents


