Analytica Chimica Acta 553 (2005) 111–122 Multivariate calibration applied to the field of cultural heritage: Analysis of the pigments on the surface of a painting Emilio Marengo ∗ , Maria Cristina Liparota, Elisa Robotti, Marco Bobba Department of Environment and Life Sciences, University of Eastern Piedmont, Via Bellini 25/G, 15100 Alessandria, Italy Received 10 May 2005; received in revised form 29 June 2005; accepted 26 July 2005 Available online 6 September 2005 Abstract This paper concerns a first attempt of application of multivariate calibration to the field of cultural heritage for the determination of the superficial pigments composition of a painting. For this purpose, 10 mixtures of three organic pigments (Alizarin, Permanent Red and Phtalocyanine Green) selected by an augmented simplex-centroid design were mixed with linseed oil and spread on 10 cotton canvas strips. Each sample was characterised with three genuine replicates of an ATR-IR spectrum. Three calibration models, responding to the relative concentration of each specific pigment in the mixtures, were built with the partial least squares (PLS1) algorithm, using the ATR-IR spectra of the surfaces as predictors. The three mixtures corresponding to the augmentation of the simplex-centroid design were used to validate the model predictive ability which proved to be very satisfactory, with very low root mean squared error of prediction (RMSEP). Finally the models were successfully applied to a real painting, to predict the concentrations of some unknown mixtures of the three studied pigments. This work might have possible applications in the determination of the composition of dyes in real paintings to obtain information on the execution technique and for restoration purposes. © 2005 Elsevier B.V. All rights reserved. Keywords: Augmented simplex-centroid design; ATR-FT-IR spectroscopy; PLS (partial last squares); Cultural heritage 1. Introduction Today, cultural heritage preservation has become an inter- disciplinary discipline, linking naturally far fields like the humanistic and the scientific ones. Art historians and restor- ers necessarily need to know the exact composition of the investigated handmade, together with possible degradation products, in order to individuate the suitable actions for the restoring and the correct conservation state which allow to well-preserve the handmade. Moreover, very often the hypothesis from humanists about works-of-art’s provenance and execution techniques need to be supported by scien- tific investigations. Literature reports several applications of chemometrics in the field of cultural heritage like prin- cipal component analysis [1], classification methods [2], ∗ Corresponding author. Tel.: +39 0131 360272; fax: +39 0131 360390. E-mail address: [email protected] (E. Marengo). cluster analysis [3] in order to extract useful information from the complex data set usually acquired by non-invasive and non-destructive analytical techniques. These last express a compromise between the research of the optimal con- ditions to perform the analysis and the necessity to pre- serve the handmade. Several analytical techniques have been applied in cultural heritage investigations: X-ray fluorescence spectrometry (XRF) [4], atomic absorption spectroscopy (AAS) [5], inductively coupled plasma-mass spectrome- try (ICP-MS) [6], proton induced X-ray emission (PIXE) [7], scanning electron microscopy (SEM) [8] for works- of-art elemental characterisation and IR [9], Raman [10], UV–vis [11], X-ray diffraction spectroscopy (XRD) [12], HPLC [13], GC–MS [14] for their molecular characterisa- tion. In particular infrared spectroscopy [15–19] is one of the most exploited techniques in this field as it allows to charac- terise both the inorganic and organic constituents of a wide 0003-2670/$ – see front matter © 2005 Elsevier B.V. All rights reserved. doi:10.1016/j.aca.2005.07.061

Welcome message from author
This document is posted to help you gain knowledge. Please leave a comment to let me know what you think about it! Share it to your friends and learn new things together.
Transcript
Analytica Chimica Acta 553 (2005) 111–122
Multivariate calibration applied to the field of cultural heritage:Analysis of the pigments on the surface of a painting
Emilio Marengo∗, Maria Cristina Liparota, Elisa Robotti, Marco BobbaDepartment of Environment and Life Sciences, University of Eastern Piedmont, Via Bellini 25/G, 15100 Alessandria, Italy
Received 10 May 2005; received in revised form 29 June 2005; accepted 26 July 2005Available online 6 September 2005
Abstract
This paper concerns a first attempt of application of multivariate calibration to the field of cultural heritage for the determination ofthe superficial pigments composition of a painting. For this purpose, 10 mixtures of three organic pigments (Alizarin, Permanent Red andPhtalocyanine Green) selected by an augmented simplex-centroid design were mixed with linseed oil and spread on 10 cotton canvas strips.Each sample was characterised with three genuine replicates of an ATR-IR spectrum.
Three calibration models, responding to the relative concentration of each specific pigment in the mixtures, were built with the partial leastentation of
oot meanns of some
on on the
nsivepresscon-pre-
e beenncepyme-E)
a-
rac-wide
squares (PLS1) algorithm, using the ATR-IR spectra of the surfaces as predictors. The three mixtures corresponding to the augmthe simplex-centroid design were used to validate the model predictive ability which proved to be very satisfactory, with very low rsquared error of prediction (RMSEP). Finally the models were successfully applied to a real painting, to predict the concentratiounknown mixtures of the three studied pigments.
This work might have possible applications in the determination of the composition of dyes in real paintings to obtain informatiexecution technique and for restoration purposes.© 2005 Elsevier B.V. All rights reserved.
Keywords: Augmented simplex-centroid design; ATR-FT-IR spectroscopy; PLS (partial last squares); Cultural heritage
1. Introduction
Today, cultural heritage preservation has become an inter-disciplinary discipline, linking naturally far fields like thehumanistic and the scientific ones. Art historians and restor-ers necessarily need to know the exact composition of theinvestigated handmade, together with possible degradationproducts, in order to individuate the suitable actions forthe restoring and the correct conservation state which allowto well-preserve the handmade. Moreover, very often thehypothesis from humanists about works-of-art’s provenanceand execution techniques need to be supported by scien-tific investigations. Literature reports several applicationsof chemometrics in the field of cultural heritage like prin-cipal component analysis[1], classification methods[2],
∗ Corresponding author. Tel.: +39 0131 360272; fax: +39 0131 360390.E-mail address: [email protected] (E. Marengo).
cluster analysis[3] in order to extract useful informatiofrom the complex data set usually acquired by non-invaand non-destructive analytical techniques. These last exa compromise between the research of the optimalditions to perform the analysis and the necessity toserve the handmade. Several analytical techniques havapplied in cultural heritage investigations: X-ray fluorescespectrometry (XRF)[4], atomic absorption spectrosco(AAS) [5], inductively coupled plasma-mass spectrotry (ICP-MS) [6], proton induced X-ray emission (PIX[7], scanning electron microscopy (SEM)[8] for works-of-art elemental characterisation and IR[9], Raman[10],UV–vis [11], X-ray diffraction spectroscopy (XRD)[12],HPLC [13], GC–MS[14] for their molecular characteristion.
In particular infrared spectroscopy[15–19] is one of themost exploited techniques in this field as it allows to chaterise both the inorganic and organic constituents of a
0003-2670/$ – see front matter © 2005 Elsevier B.V. All rights reserved.doi:10.1016/j.aca.2005.07.061
112 E. Marengo et al. / Analytica Chimica Acta 553 (2005) 111–122
variety of artworks, giving an insight into the materials andtechniques of execution[9].
A useful method for obtaining the infrared spectra of filmsthat is suitable to analyse works-of-art as it does not requireany sample pre-treatment and it is a non-destructive analy-sis, is the attenuated total reflection (ATR), as described byFahrenfort[20] and Harrick[21].
This paper is relative to an application of multivariate cal-ibration by PLS1[22–26]to 10 cotton canvas strips paintedwith mixtures of three organic pigments (Alizarin, Perma-nent Red, Phtalocyanine Green) mixed with linseed oil. Themixtures come from an experimental mixture design: the aug-mented simplex-centroid design. Each strip is characterisedby three genuine replicates of the ATR-IR spectra of the sur-face under study. Three models were built by PLS1, one foreach pigment, providing the concentration of a specific pig-ment in the seven mixtures used for the calibration. The threeremaining mixtures were used as an external validation set,allowing to estimate the predictive ability of the three models.The final aim is to apply these models to predict the concen-trations of some unknown mixtures of the studied pigmentsin a real painting.
This work might have interesting applications to real paint-ings, in order to determine the composition of the pigments’mixtures on theirs surfaces.
2
2
fac-t onsed ents[
gf , allb
ents( rian-g tures( thep nt allt cor-r 1/3)o
turesc delsa eri-m spacei enteds -s r thec and1 vels,x
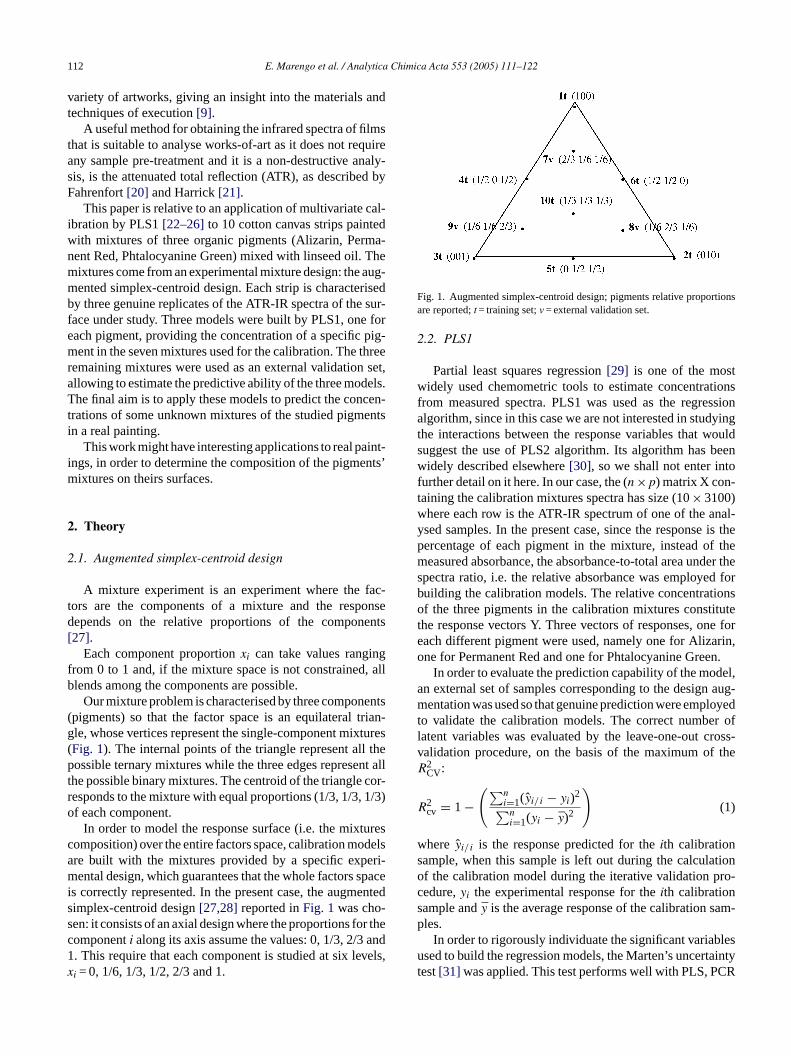
Fig. 1. Augmented simplex-centroid design; pigments relative proportionsare reported;t = training set;v = external validation set.
2.2. PLS1
Partial least squares regression[29] is one of the mostwidely used chemometric tools to estimate concentrationsfrom measured spectra. PLS1 was used as the regressionalgorithm, since in this case we are not interested in studyingthe interactions between the response variables that wouldsuggest the use of PLS2 algorithm. Its algorithm has beenwidely described elsewhere[30], so we shall not enter intofurther detail on it here. In our case, the (n × p) matrix X con-taining the calibration mixtures spectra has size (10× 3100)where each row is the ATR-IR spectrum of one of the anal-ysed samples. In the present case, since the response is thepercentage of each pigment in the mixture, instead of themeasured absorbance, the absorbance-to-total area under thespectra ratio, i.e. the relative absorbance was employed forbuilding the calibration models. The relative concentrationsof the three pigments in the calibration mixtures constitutethe response vectors Y. Three vectors of responses, one foreach different pigment were used, namely one for Alizarin,one for Permanent Red and one for Phtalocyanine Green.
In order to evaluate the prediction capability of the model,an external set of samples corresponding to the design aug-mentation was used so that genuine prediction were employedto validate the calibration models. The correct number oflatent variables was evaluated by the leave-one-out cross-v theR
R
ws tiono ro-cs am-p
lesu aintyt CR
. Theory
.1. Augmented simplex-centroid design
A mixture experiment is an experiment where theors are the components of a mixture and the respepends on the relative proportions of the compon
27].Each component proportionxi can take values rangin
rom 0 to 1 and, if the mixture space is not constrainedlends among the components are possible.
Our mixture problem is characterised by three componpigments) so that the factor space is an equilateral tle, whose vertices represent the single-component mixFig. 1). The internal points of the triangle represent allossible ternary mixtures while the three edges represe
he possible binary mixtures. The centroid of the triangleesponds to the mixture with equal proportions (1/3, 1/3,f each component.
In order to model the response surface (i.e. the mixomposition) over the entire factors space, calibration more built with the mixtures provided by a specific expental design, which guarantees that the whole factors
s correctly represented. In the present case, the augmimplex-centroid design[27,28] reported inFig. 1was choen: it consists of an axial design where the proportions foomponenti along its axis assume the values: 0, 1/3, 2/3. This require that each component is studied at six lei = 0, 1/6, 1/3, 1/2, 2/3 and 1.
alidation procedure, on the basis of the maximum of2CV:
2cv = 1 −
(∑ni=1(yi/i − yi)2∑ni=1(yi − y)2
)(1)
here yi/i is the response predicted for theith calibrationample, when this sample is left out during the calculaf the calibration model during the iterative validation pedure,yi the experimental response for theith calibrationample and ¯y is the average response of the calibration sles.
In order to rigorously individuate the significant variabsed to build the regression models, the Marten’s uncert
est[31] was applied. This test performs well with PLS, P
E. Marengo et al. / Analytica Chimica Acta 553 (2005) 111–122 113
or PCA models when cross validation is applied and a num-ber of sub-models is created. These sub-models are basedon all the samples that are not kept out in the cross valida-tion segment. For every sub-model, a set of model parameters(B-coefficients, scores, loadings and loading weights) are cal-culated. In addition a total model is generated, based on allthe samples. For each variable the difference between the B-coefficientBi in a sub-model and theBtot for the total modelis calculated. The sum of the squares of the differences inall sub-models can be used to estimate the variance of theBi value for theith variable. The significance of the estimateof Bi can then be calculated with at-test that can be graphi-cally represented by reporting the regression coefficients withuncertainty limits corresponding to two standard deviations(significance level at 5%). This allows to easily detect thesignificant variables at the given significance level.
The uncertainty of the predictions obtained from the cali-bration models was estimated by the root mean squared errorof prediction (RMSEP)[32]:
RMSEP=(∑r
j=1(yj − yj)2
r
)1/2
(2)
wherer is the number of samples of the external validationper-on
ents:er-
Italy)lori-
froms for
yhtal-e bothand
n have, theul-
rt as
lex-ord-
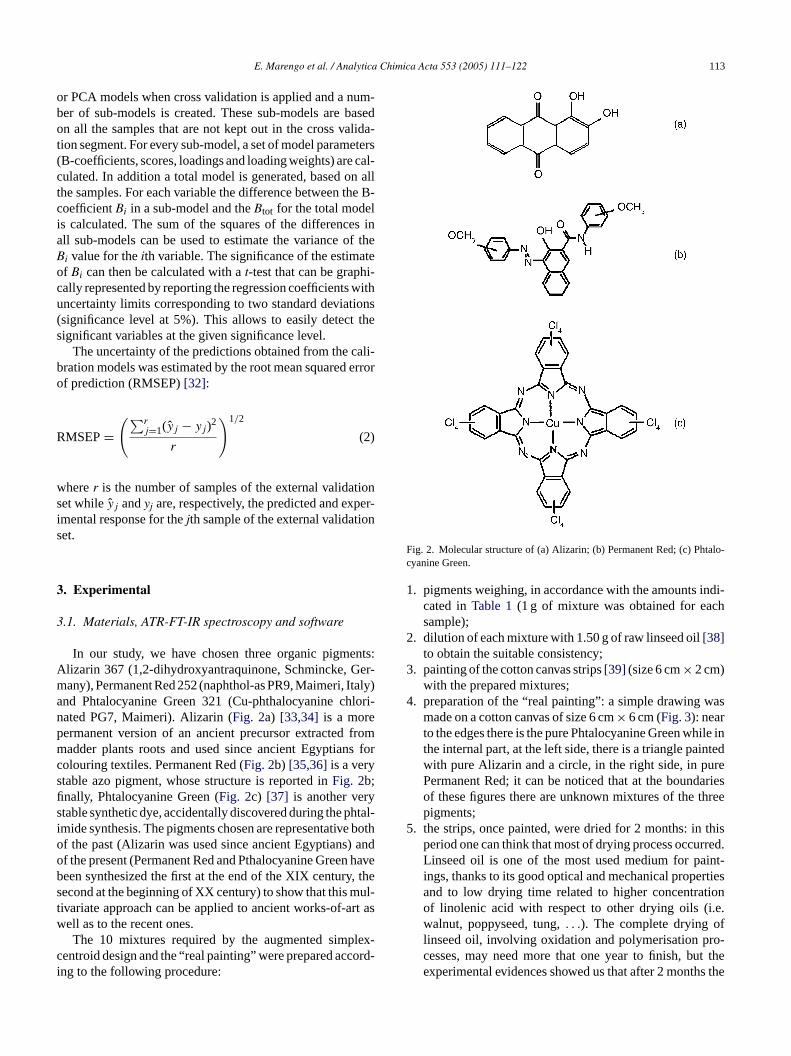
Fig. 2. Molecular structure of (a) Alizarin; (b) Permanent Red; (c) Phtalo-cyanine Green.
1. pigments weighing, in accordance with the amounts indi-cated inTable 1(1 g of mixture was obtained for eachsample);
2. dilution of each mixture with 1.50 g of raw linseed oil[38]to obtain the suitable consistency;
3. painting of the cotton canvas strips[39] (size 6 cm× 2 cm)with the prepared mixtures;
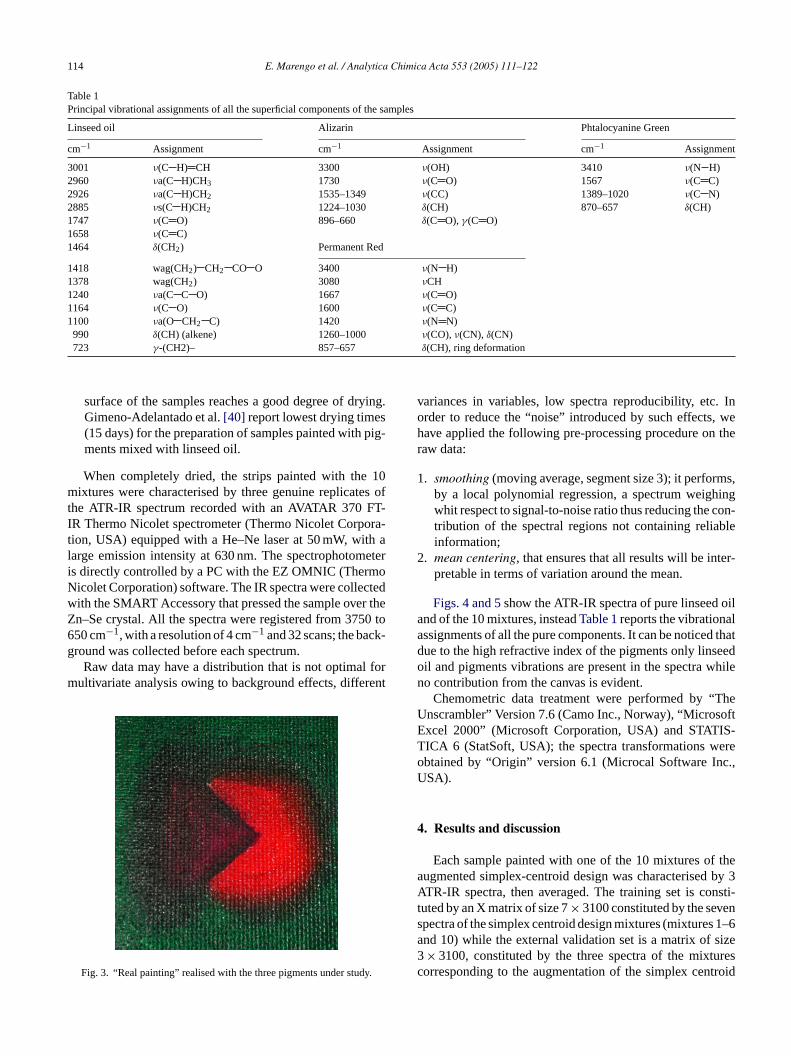
4. preparation of the “real painting”: a simple drawing wasmade on a cotton canvas of size 6 cm× 6 cm (Fig. 3): nearto the edges there is the pure Phtalocyanine Green while inthe internal part, at the left side, there is a triangle paintedwith pure Alizarin and a circle, in the right side, in purePermanent Red; it can be noticed that at the boundariesof these figures there are unknown mixtures of the threepigments;
5. the strips, once painted, were dried for 2 months: in thisperiod one can think that most of drying process occurred.Linseed oil is one of the most used medium for paint-ings, thanks to its good optical and mechanical propertiesand to low drying time related to higher concentrationof linolenic acid with respect to other drying oils (i.e.walnut, poppyseed, tung,. . .). The complete drying oflinseed oil, involving oxidation and polymerisation pro-cesses, may need more that one year to finish, but theexperimental evidences showed us that after 2 months the
set whileyj andyj are, respectively, the predicted and eximental response for thejth sample of the external validatiset.
3. Experimental
3.1. Materials, ATR-FT-IR spectroscopy and software
In our study, we have chosen three organic pigmAlizarin 367 (1,2-dihydroxyantraquinone, Schmincke, Gmany), Permanent Red 252 (naphthol-as PR9, Maimeri,and Phtalocyanine Green 321 (Cu-phthalocyanine chnated PG7, Maimeri). Alizarin (Fig. 2a) [33,34] is a morepermanent version of an ancient precursor extractedmadder plants roots and used since ancient Egyptiancolouring textiles. Permanent Red (Fig. 2b) [35,36] is a verystable azo pigment, whose structure is reported inFig. 2b;finally, Phtalocyanine Green (Fig. 2c) [37] is another verstable synthetic dye, accidentally discovered during the pimide synthesis. The pigments chosen are representativof the past (Alizarin was used since ancient Egyptians)of the present (Permanent Red and Pthalocyanine Greebeen synthesized the first at the end of the XIX centurysecond at the beginning of XX century) to show that this mtivariate approach can be applied to ancient works-of-awell as to the recent ones.
The 10 mixtures required by the augmented simpcentroid design and the “real painting” were prepared accing to the following procedure:
114 E. Marengo et al. / Analytica Chimica Acta 553 (2005) 111–122
Table 1Principal vibrational assignments of all the superficial components of the samples
Linseed oil Alizarin Phtalocyanine Green
cm−1 Assignment cm−1 Assignment cm−1 Assignment
3001 ν(C H) CH 3300 ν(OH) 3410 ν(N H)2960 νa(C H)CH3 1730 ν(C O) 1567 ν(C C)2926 νa(C H)CH2 1535–1349 ν(CC) 1389–1020 ν(C N)2885 νs(C H)CH2 1224–1030 δ(CH) 870–657 δ(CH)1747 ν(C O) 896–660 δ(C O), γ(C O)1658 ν(C C)1464 δ(CH2) Permanent Red
1418 wag(CH2) CH2 CO O 3400 ν(N H)1378 wag(CH2) 3080 νCH1240 νa(C C O) 1667 ν(C O)1164 ν(C O) 1600 ν(C C)1100 νa(O CH2 C) 1420 ν(N N)990 δ(CH) (alkene) 1260–1000 ν(CO),ν(CN), δ(CN)723 γ-(CH2)– 857–657 δ(CH), ring deformation
surface of the samples reaches a good degree of drying.Gimeno-Adelantado et al.[40] report lowest drying times(15 days) for the preparation of samples painted with pig-ments mixed with linseed oil.
When completely dried, the strips painted with the 10mixtures were characterised by three genuine replicates ofthe ATR-IR spectrum recorded with an AVATAR 370 FT-IR Thermo Nicolet spectrometer (Thermo Nicolet Corpora-tion, USA) equipped with a He–Ne laser at 50 mW, with alarge emission intensity at 630 nm. The spectrophotometeris directly controlled by a PC with the EZ OMNIC (ThermoNicolet Corporation) software. The IR spectra were collectedwith the SMART Accessory that pressed the sample over theZn–Se crystal. All the spectra were registered from 3750 to650 cm−1, with a resolution of 4 cm−1 and 32 scans; the back-ground was collected before each spectrum.
Raw data may have a distribution that is not optimal formultivariate analysis owing to background effects, different
y.
variances in variables, low spectra reproducibility, etc. Inorder to reduce the “noise” introduced by such effects, wehave applied the following pre-processing procedure on theraw data:
1. smoothing (moving average, segment size 3); it performs,by a local polynomial regression, a spectrum weighingwhit respect to signal-to-noise ratio thus reducing the con-tribution of the spectral regions not containing reliableinformation;
2. mean centering, that ensures that all results will be inter-pretable in terms of variation around the mean.
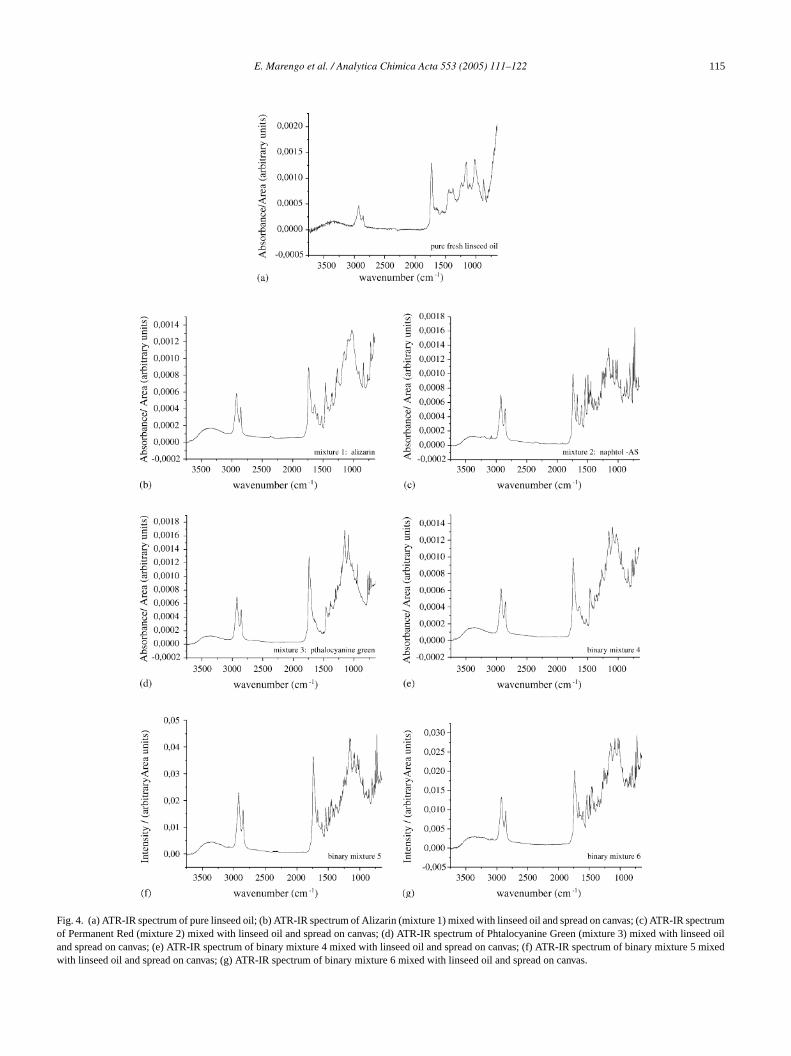
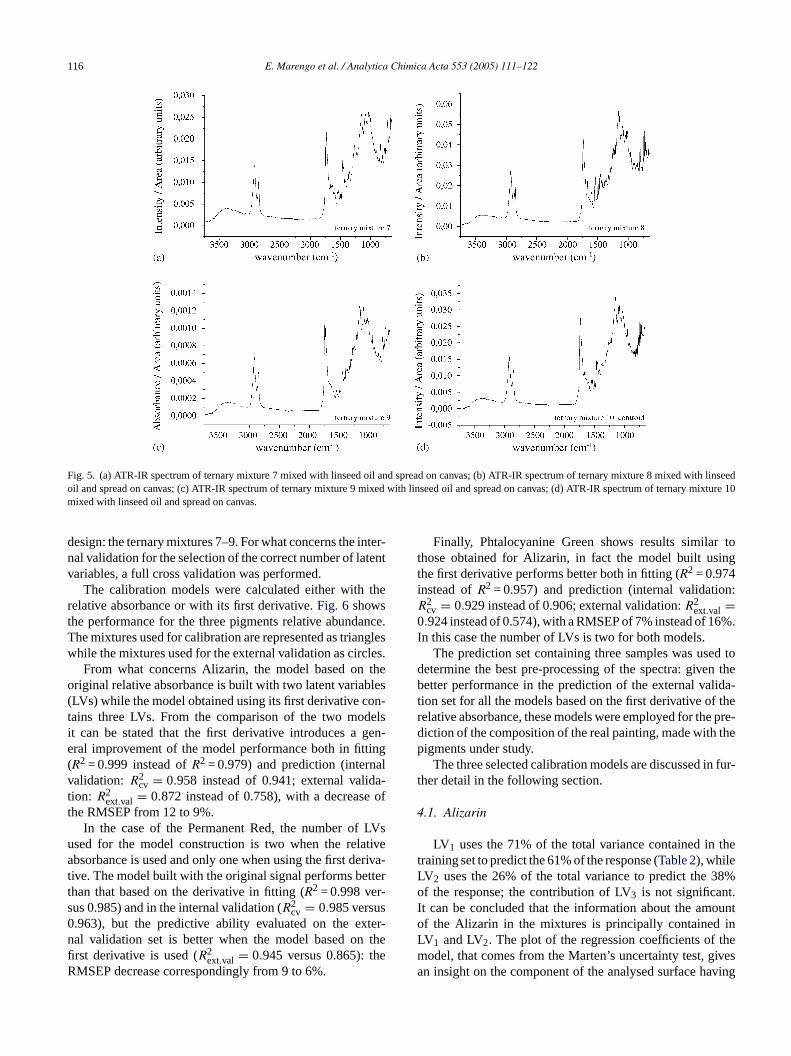
Figs. 4 and 5show the ATR-IR spectra of pure linseed oiland of the 10 mixtures, insteadTable 1reports the vibrationalassignments of all the pure components. It can be noticed thatdue to the high refractive index of the pigments only linseedoil and pigments vibrations are present in the spectra whileno contribution from the canvas is evident.
Chemometric data treatment were performed by “TheUnscrambler” Version 7.6 (Camo Inc., Norway), “MicrosoftExcel 2000” (Microsoft Corporation, USA) and STATIS-TICA 6 (StatSoft, USA); the spectra transformations wereobtained by “Origin” version 6.1 (Microcal Software Inc.,USA).
4
thea by 3A nsti-t ens 1–6a size3 uresc troid
Fig. 3. “Real painting” realised with the three pigments under stud. Results and discussion
Each sample painted with one of the 10 mixtures ofugmented simplex-centroid design was characterisedTR-IR spectra, then averaged. The training set is co
uted by an X matrix of size 7× 3100 constituted by the sevpectra of the simplex centroid design mixtures (mixturesnd 10) while the external validation set is a matrix of× 3100, constituted by the three spectra of the mixtorresponding to the augmentation of the simplex cen
E. Marengo et al. / Analytica Chimica Acta 553 (2005) 111–122 115
Fig. 4. (a) ATR-IR spectrum of pure linseed oil; (b) ATR-IR spectrum of Alizarin (mixture 1) mixed with linseed oil and spread on canvas; (c) ATR-IR spectrumof Permanent Red (mixture 2) mixed with linseed oil and spread on canvas; (d) ATR-IR spectrum of Phtalocyanine Green (mixture 3) mixed with linseed oiland spread on canvas; (e) ATR-IR spectrum of binary mixture 4 mixed with linseed oil and spread on canvas; (f) ATR-IR spectrum of binary mixture 5 mixedwith linseed oil and spread on canvas; (g) ATR-IR spectrum of binary mixture 6 mixed with linseed oil and spread on canvas.
116 E. Marengo et al. / Analytica Chimica Acta 553 (2005) 111–122
Fig. 5. (a) ATR-IR spectrum of ternary mixture 7 mixed with linseed oil and spread on canvas; (b) ATR-IR spectrum of ternary mixture 8 mixed with linseedoil and spread on canvas; (c) ATR-IR spectrum of ternary mixture 9 mixed with linseed oil and spread on canvas; (d) ATR-IR spectrum of ternary mixture 10mixed with linseed oil and spread on canvas.
design: the ternary mixtures 7–9. For what concerns the inter-nal validation for the selection of the correct number of latentvariables, a full cross validation was performed.
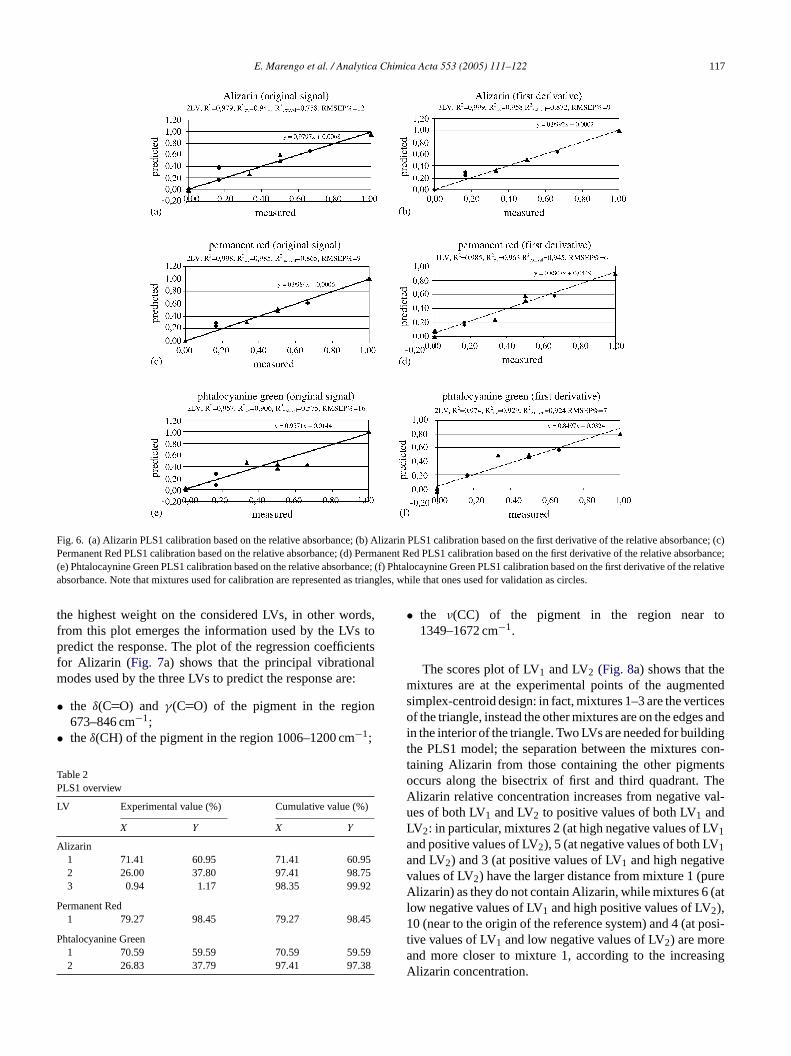
The calibration models were calculated either with therelative absorbance or with its first derivative.Fig. 6 showsthe performance for the three pigments relative abundance.The mixtures used for calibration are represented as triangleswhile the mixtures used for the external validation as circles.
From what concerns Alizarin, the model based on theoriginal relative absorbance is built with two latent variables(LVs) while the model obtained using its first derivative con-tains three LVs. From the comparison of the two modelsit can be stated that the first derivative introduces a gen-eral improvement of the model performance both in fitting(R2 = 0.999 instead ofR2 = 0.979) and prediction (internalvalidation: R2
cv = 0.958 instead of 0.941; external valida-tion: R2
ext.val = 0.872 instead of 0.758), with a decrease ofthe RMSEP from 12 to 9%.
In the case of the Permanent Red, the number of LVsused for the model construction is two when the relativeabsorbance is used and only one when using the first deriva-tive. The model built with the original signal performs betterthan that based on the derivative in fitting (R2 = 0.998 ver-sus 0.985) and in the internal validation (R2
cv = 0.985 versus0.963), but the predictive ability evaluated on the exter-nal validation set is better when the model based on thefi eR
Finally, Phtalocyanine Green shows results similar tothose obtained for Alizarin, in fact the model built usingthe first derivative performs better both in fitting (R2 = 0.974instead ofR2 = 0.957) and prediction (internal validation:R2
cv = 0.929 instead of 0.906; external validation:R2ext.val =
0.924 instead of 0.574), with a RMSEP of 7% instead of 16%.In this case the number of LVs is two for both models.
The prediction set containing three samples was used todetermine the best pre-processing of the spectra: given thebetter performance in the prediction of the external valida-tion set for all the models based on the first derivative of therelative absorbance, these models were employed for the pre-diction of the composition of the real painting, made with thepigments under study.
The three selected calibration models are discussed in fur-ther detail in the following section.
4.1. Alizarin
LV1 uses the 71% of the total variance contained in thetraining set to predict the 61% of the response (Table 2), whileLV2 uses the 26% of the total variance to predict the 38%of the response; the contribution of LV3 is not significant.It can be concluded that the information about the amountof the Alizarin in the mixtures is principally contained inLV and LV . The plot of the regression coefficients of them ivesa aving
rst derivative is used (R2ext.val = 0.945 versus 0.865): th
MSEP decrease correspondingly from 9 to 6%.
1 2odel, that comes from the Marten’s uncertainty test, gn insight on the component of the analysed surface h
E. Marengo et al. / Analytica Chimica Acta 553 (2005) 111–122 117
Fig. 6. (a) Alizarin PLS1 calibration based on the relative absorbance; (b) Alizarin PLS1 calibration based on the first derivative of the relative absorbance; (c)Permanent Red PLS1 calibration based on the relative absorbance; (d) Permanent Red PLS1 calibration based on the first derivative of the relative absorbance;(e) Phtalocaynine Green PLS1 calibration based on the relative absorbance; (f) Phtalocaynine Green PLS1 calibration based on the first derivative ofthe relativeabsorbance. Note that mixtures used for calibration are represented as triangles, while that ones used for validation as circles.
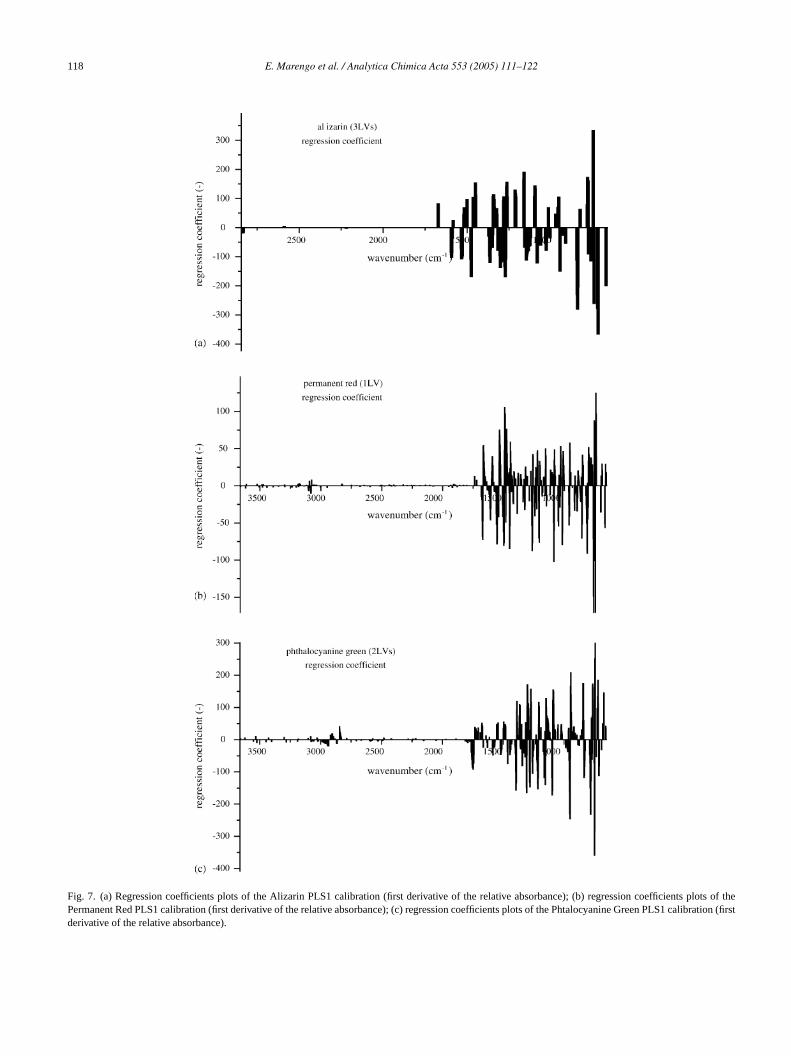
the highest weight on the considered LVs, in other words,from this plot emerges the information used by the LVs topredict the response. The plot of the regression coefficientsfor Alizarin (Fig. 7a) shows that the principal vibrationalmodes used by the three LVs to predict the response are:
• the δ(C O) and γ(C O) of the pigment in the region673–846 cm−1;
• theδ(CH) of the pigment in the region 1006–1200 cm−1;
Table 2PLS1 overview
LV Experimental value (%) Cumulative value (%)
X Y X Y
Alizarin1 71.41 60.95 71.41 60.952 26.00 37.80 97.41 98.753 0.94 1.17 98.35 99.92
Permanent Red1 79.27 98.45 79.27 98.45
Phtalocyanine Green1 70.59 59.59 70.59 59.592 26.83 37.79 97.41 97.38
• the ν(CC) of the pigment in the region near to1349–1672 cm−1.
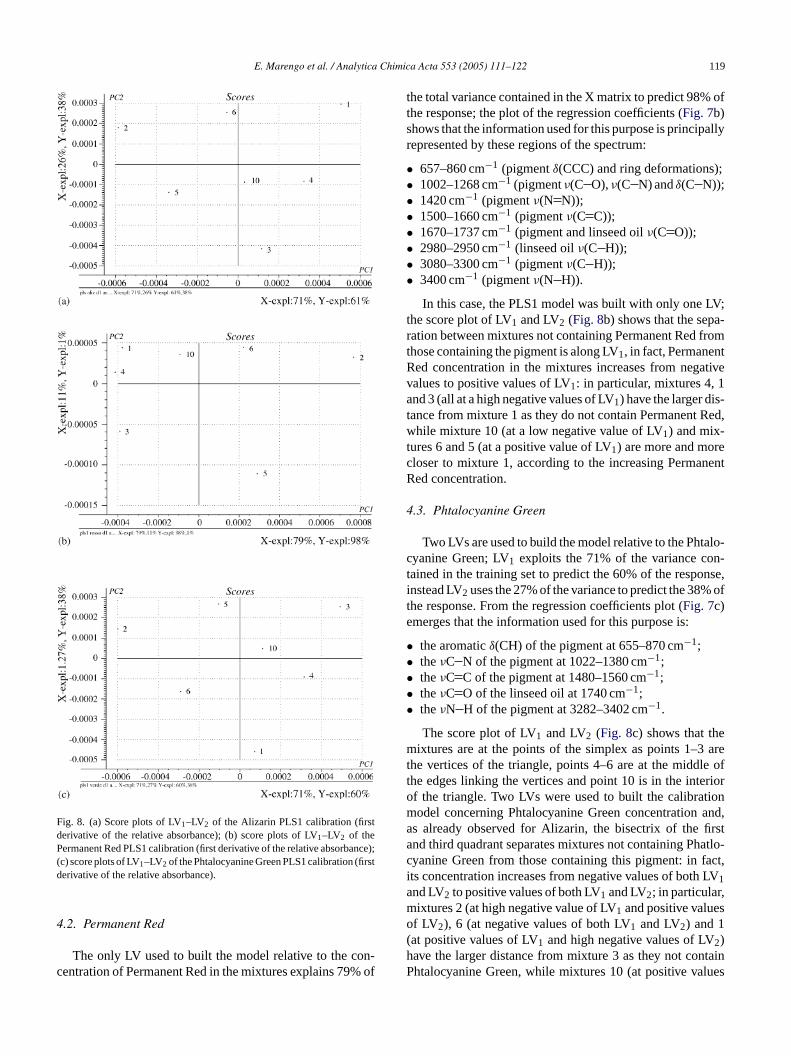
The scores plot of LV1 and LV2 (Fig. 8a) shows that themixtures are at the experimental points of the augmentedsimplex-centroid design: in fact, mixtures 1–3 are the verticesof the triangle, instead the other mixtures are on the edges andin the interior of the triangle. Two LVs are needed for buildingthe PLS1 model; the separation between the mixtures con-taining Alizarin from those containing the other pigmentsoccurs along the bisectrix of first and third quadrant. TheAlizarin relative concentration increases from negative val-ues of both LV1 and LV2 to positive values of both LV1 andLV2: in particular, mixtures 2 (at high negative values of LV1and positive values of LV2), 5 (at negative values of both LV1and LV2) and 3 (at positive values of LV1 and high negativevalues of LV2) have the larger distance from mixture 1 (pureAlizarin) as they do not contain Alizarin, while mixtures 6 (atlow negative values of LV1 and high positive values of LV2),10 (near to the origin of the reference system) and 4 (at posi-tive values of LV1 and low negative values of LV2) are moreand more closer to mixture 1, according to the increasingAlizarin concentration.
118 E. Marengo et al. / Analytica Chimica Acta 553 (2005) 111–122
Fig. 7. (a) Regression coefficients plots of the Alizarin PLS1 calibration (first derivative of the relative absorbance); (b) regression coefficientsplots of thePermanent Red PLS1 calibration (first derivative of the relative absorbance); (c) regression coefficients plots of the Phtalocyanine Green PLS1 calibration (firstderivative of the relative absorbance).
E. Marengo et al. / Analytica Chimica Acta 553 (2005) 111–122 119
Fig. 8. (a) Score plots of LV1–LV2 of the Alizarin PLS1 calibration (firstderivative of the relative absorbance); (b) score plots of LV1–LV2 of thePermanent Red PLS1 calibration (first derivative of the relative absorbance);(c) score plots of LV1–LV2 of the Phtalocyanine Green PLS1 calibration (firstderivative of the relative absorbance).
4.2. Permanent Red
The only LV used to built the model relative to the con-centration of Permanent Red in the mixtures explains 79% of
the total variance contained in the X matrix to predict 98% ofthe response; the plot of the regression coefficients (Fig. 7b)shows that the information used for this purpose is principallyrepresented by these regions of the spectrum:
• 657–860 cm−1 (pigmentδ(CCC) and ring deformations);• 1002–1268 cm−1 (pigmentν(C O),ν(C N) andδ(C N));• 1420 cm−1 (pigmentν(N N));• 1500–1660 cm−1 (pigmentν(C C));• 1670–1737 cm−1 (pigment and linseed oilν(C O));• 2980–2950 cm−1 (linseed oilν(C H));• 3080–3300 cm−1 (pigmentν(C H));• 3400 cm−1 (pigmentν(N H)).
In this case, the PLS1 model was built with only one LV;the score plot of LV1 and LV2 (Fig. 8b) shows that the sepa-ration between mixtures not containing Permanent Red fromthose containing the pigment is along LV1, in fact, PermanentRed concentration in the mixtures increases from negativevalues to positive values of LV1: in particular, mixtures 4, 1and 3 (all at a high negative values of LV1) have the larger dis-tance from mixture 1 as they do not contain Permanent Red,while mixture 10 (at a low negative value of LV1) and mix-tures 6 and 5 (at a positive value of LV1) are more and morecloser to mixture 1, according to the increasing PermanentRed concentration.
4
alo-c n-t nse,i % ofte
•••••
em aret le oft rioro ionm and,a firsta atlo-c fact,i LVa ,m so(h tainP lues
.3. Phtalocyanine Green
Two LVs are used to build the model relative to the Phtyanine Green; LV1 exploits the 71% of the variance coained in the training set to predict the 60% of the responstead LV2 uses the 27% of the variance to predict the 38he response. From the regression coefficients plot (Fig. 7c)merges that the information used for this purpose is:
the aromaticδ(CH) of the pigment at 655–870 cm−1;theνC N of the pigment at 1022–1380 cm−1;theνC C of the pigment at 1480–1560 cm−1;theνC O of the linseed oil at 1740 cm−1;theνN H of the pigment at 3282–3402 cm−1.
The score plot of LV1 and LV2 (Fig. 8c) shows that thixtures are at the points of the simplex as points 1–3
he vertices of the triangle, points 4–6 are at the middhe edges linking the vertices and point 10 is in the intef the triangle. Two LVs were used to built the calibratodel concerning Phtalocyanine Green concentrations already observed for Alizarin, the bisectrix of thend third quadrant separates mixtures not containing Phyanine Green from those containing this pigment: ints concentration increases from negative values of both1nd LV2 to positive values of both LV1 and LV2; in particularixtures 2 (at high negative value of LV1 and positive valuef LV2), 6 (at negative values of both LV1 and LV2) and 1at positive values of LV1 and high negative values of LV2)ave the larger distance from mixture 3 as they not conhtalocyanine Green, while mixtures 10 (at positive va
120 E. Marengo et al. / Analytica Chimica Acta 553 (2005) 111–122
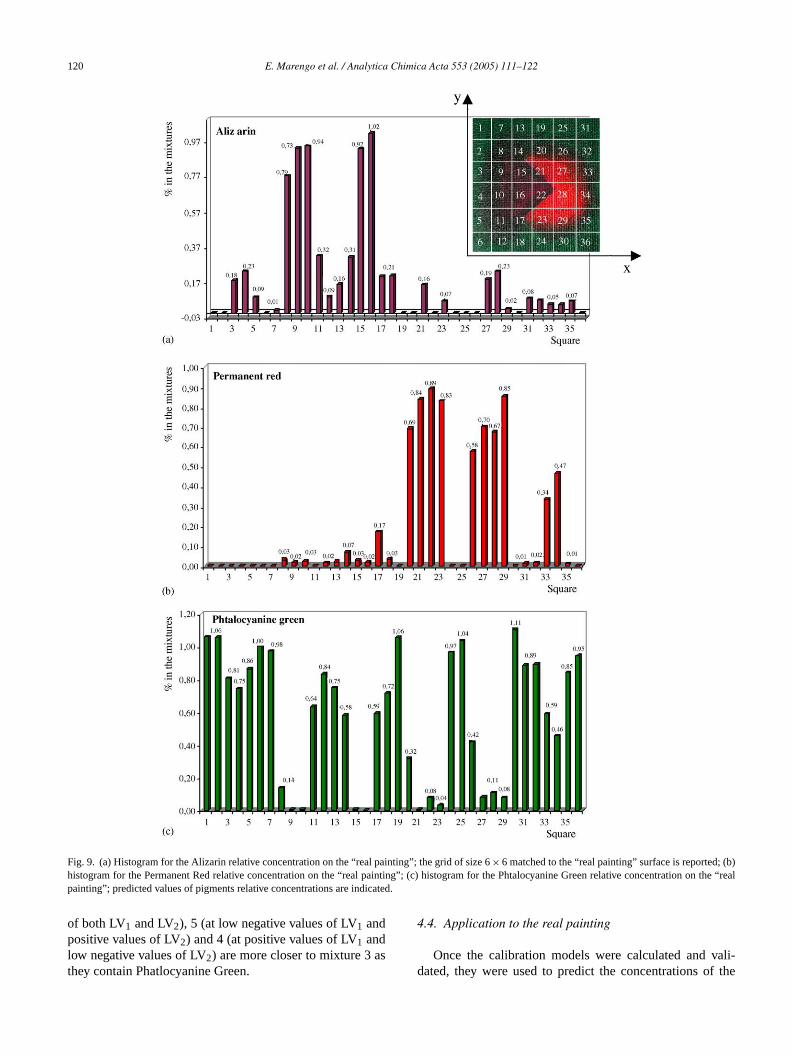
Fig. 9. (a) Histogram for the Alizarin relative concentration on the “real painting”; the grid of size 6× 6 matched to the “real painting” surface is reported; (b)histogram for the Permanent Red relative concentration on the “real painting”; (c) histogram for the Phtalocyanine Green relative concentration onthe “realpainting”; predicted values of pigments relative concentrations are indicated.
of both LV1 and LV2), 5 (at low negative values of LV1 andpositive values of LV2) and 4 (at positive values of LV1 andlow negative values of LV2) are more closer to mixture 3 asthey contain Phatlocyanine Green.
4.4. Application to the real painting
Once the calibration models were calculated and vali-dated, they were used to predict the concentrations of the
E. Marengo et al. / Analytica Chimica Acta 553 (2005) 111–122 121
three pigments in the “real painting”. Its surface was dividedinto a grid of size 6× 6 (Fig. 9a), namely in 36 squares,and a spectrum was collected in the centre of each square,so that the surface could be described by a matrix of size36× 3100. Our interest is to verify that the closing rela-tionship regarding the three pigments is respected in thecase of the “real painting”; we have an idea of the expectedcomposition in each zone of the painting, for example it isknown that in the interior of the figure there are the purepigments (so their relative concentration is expected to bepredicted around 1), what we expect is to obtain realisticpredictions of the pigments relative concentration. The threepigments concentrations were then predicted using the cal-ibration models:Fig. 9 shows the results obtained. It canbe noticed that there is a general good agreement betweenthe predicted values and the real pigments concentrationsfor the points concerning pure pigments as acceptable errorsoccur (the maximum error is 11%); moreover also for theother sampled points of the painting realistic results wereobtained.
Fig. 9 also reports the reconstruction of the surface pig-ments composition, by means of three histograms: each figureshows the concentration of a pigment in the 36 analysedpoints of the surface. It can be clearly seen that Alizarinconcentrates in the internal part of the surface, on the leftside (Fig. 9b), Permanent Red concentrates in the internal
-rfacetion
ul-urecya-turesixedvasthree
PLSationtinganceents.e ofedicthree
int-entsuse-rtist
Acknowledgment
The authors gratefully acknowledge financial supportby MIUR (Ministero dell’Istruzione, dell’Universita e dellaRicerca, Rome, ITALY; COFIN 2003).
References
[1] C. Bonifazi, E. Lodi, G. Maino, V. Muzzioli, L. Nanetti, N. Lud-wig, M. Milazzo, A. Tartari, Nucl. Instrum. Methods B 213 (2004)707–711.
[2] E. Marengo, E. Robotti, M.C. Liparota, M.C. Gennaro, Talanta 63(2004) 987–1002.
[3] I. Calliari, E. Canal, S. Cavazzoni, L. Lazzaroni, J. Cult. Herit. 2(2001) 23–29.
[4] G. Pappalardo, E. Costa, C. Marchetta, L. Pappalardo, F.P. Romano,A. Zucchiatti, P. Prati, J. Cult. Herit. 5 (2004) 183–188.
[5] S. Sanchez Ramos, F. Bosh Reig, J.V. Giemeno Adelantado, D.J.Yusa Marco, A. Domenech Carbo, Spectrochim. Acta B 57 (2002)689–700.
[6] J.A. Habicht-Mauche, S.T. Glenn, R. Franks, H. Milford, A.R. Fle-gal, J. Archaeol. Sci. 29 (2002) 1043–1053.
[7] A. Denker, J. Optiz-Coutureau, Nucl. Instrum. Methods B 213 (2004)677–682.
[8] P.A. Vigato, et al., J. Cult. Herit. 4 (2003) 337–353.[9] F. Casadio, L. Toniolo, J. Cult. Herit. 2 (2001) 71–78.
[10] D.C. Creagh, V. Otieno-Alego, Nucl. Instrum. Methods B 213 (2004)670–676.
[[ ti,
[ arbo,
[ 04)
[[[ 02)
[[[[[ –13.[ trosc.
[ pesyd.
[[[ ew
[ 002)
[ onalJune
[ w
[[ , P.J.
uali-
part but on the right side (Fig. 9c) and finally Phtalocyanine Green concentrates at the external parts of the su(Fig. 9d): these behaviours represent a realistic distribuof the pigments on the surface.
5. Conclusions
In this paper, we show an application of PLS1 for the mtivariate calibration in the field of cultural heritage: three porganic pigments (Alizarin, Permanent Red and Phtalonine Green) have been used in the preparation of 10 mixaccording to an augmented simplex-centroid design, m1/1.5 (w/w) with linseed oil and spread on cotton canstrips. Each painted surface has been characterised bygenuine replicates of its ATR-IR spectrum. The threecalibration models, responding to the relative concentrof each single pigment, perform satisfactorily both in fitand prediction. The first derivative of the relative absorbspectra provided the best results in prediction for all pigmFinally, the calibration models based on the first derivativthe relative absorbance were successfully applied to prthe surface composition of a real painting made with the tpigments under study.
This work might have possible applications in real paings analysis, in order to determine the relative pigmconcentration along the surface of the painting, gainingful information about the execution technique of the aand for restoring purposes.
11] P.A. Vigato, et al., J. Cult. Herit. 5 (2004) 167–182.12] G. Barone, V. Crupi, S. Galli, D. Majiolino, P. Migliardo, V. Venu
J. Mol. Struct. 651-653 (2003) 449–458.13] J. Peris Vicente, J.V. Gimeno Adelantado, M.T. Domenech C
R. Mateo Castro, Talanta 64 (2004) 326–333.14] C. Marinach, M.C. Papillon, C. Pepe, J. Cult. Herit. 5 (20
231–240.15] C. Balas, et al., J. Cult. Herit. 4 (2003) 330s–337s.16] M. Attas, et al., J. Cult. Herit. 4 (2003) 27–136.17] M. Fabbri, M. Picollo, S. Porcinai, Appl. Spectrosc. 56 (20
420–427.18] H. Kuhn, Stud. Conserv. 15 (1970) 12–36.19] V.J. Birstein, Stud. Conserv. 20 (1975) 8–19.20] J. Fahrenfort, Spectrochim. Acta 17 (1961) 689.21] N.J. Harrick, J. Opt. Soc. Am. 55 (1965) 581.22] S.J. Horn, E. Moen, K. Ostgaard, J. Appl. Phycol. 11 (1999) 923] A. Van Overbeke, W. Baeyens, W. Vanden Bossche, Vib. Spec
9 (1995) 121–130.24] A.A. Barros, I. Manfra, D. Ferriera, S. Cardoso, A. Reis, J.A. Lo
de Silva, I. Delgadillo, D.N. Rutledge, M.A. Coimbra, CarbohPolym. 50 (2002) 85–94.
25] K.R. Beebe, B.R. Kowalski, Anal. Chem. 59 (1987) 1007A.26] D.M. Haaland, E.V. Thomas, Anal. Chem. 60 (1998) 1193.27] J.A. Cornell, Experiments with Mixtures, second ed., Wiley, N
York, 1990.28] K.A. Ruch, T. Guo, R.K. Seals, J. Hazard. Mater. 93 (167) (2
186.29] H. Wold, Multivariate analysis, in: Proceedings of an Internati
Symposium, Dayton, OH, Academic Press, New York, 14–191996, pp. 391–420.
30] H. Martens, in: Wiley (Ed.), Multivariate Calibration, Wiley, NeYork, 1983.
31] K. Ito, T. Kato, T. Ona, Vib. Spectrosc. 35 (2004) 159–163.32] D.L. Massart, B.G.M. Vandeginste, L.M.C. Buydens, S. de Jong
Lewi, J. Smeyers-Verbeke, Handbook of Chemometrics and Qmetrics: Part A, Elsevier, Amsterdam, The Netherlands, 1997.

122 E. Marengo et al. / Analytica Chimica Acta 553 (2005) 111–122
[33] L. Burgio, R.J. Clark, Spectrochim. Acta A 57 (2001) 1491–1521.[34] M.V. Canamares, J.V. Garcia-Ramos, C. Domingo, S. Sanchez-
Cortes, J. Raman Spectrosc. 35 (2004) 921–927.[35] Z. Boruszczak, J. Kraska, Dyes Pigm. 36 (1998) 339–346.[36] P. Vandenabeele, L. Moens, H.G.M. Eduards, R. Dans, J. Raman
Spectrosc. 31 (2000) 509–519.[37] R. Decreau, M. Chanon, M. Julliard, Inorg. Chim. Acta 293 (1999)
80–87.
[38] M. Lazzari, O. Chiantore, Polym. Degrad. Stab. 65 (1999) 303–313.
[39] H.G.M. Edwards, D.W. Farwell, D. Webster, Spectrochim. Acta A53 (1997) 2383–2392.
[40] J.V. Gimeno-Adelantado, R. Mateo-Castro, M.T. Domenech-Carbo,F. Bosch-Reig, A. Domenech-Carbo, M.J. Casas-Catalan, L. Osete-Cortina, J. Chromatogr. A 922 (2001) 385–390.
Related Documents