Europ. J. Agronomy 30 (2009) 140–150 Contents lists available at ScienceDirect European Journal of Agronomy journal homepage: www.elsevier.com/locate/eja Multivariate analysis of water-related agroclimatic factors limiting spring wheat yields on the Canadian prairies Budong Qian ∗ , Reinder De Jong 1 , Samuel Gameda 2 Eastern Cereal and Oilseed Research Centre, Agriculture and Agri-Food Canada, 960 Carling Ave., Ottawa, ON, K1A 0C6 Canada article info Article history: Received 15 April 2008 Received in revised form 19 August 2008 Accepted 9 September 2008 Keywords: Spring wheat yield Agroclimatology Versatile Soil Moisture Budget Principal component analysis Canonical correlation analysis abstract Water use by spring wheat and soil water contents at meteorological stations on the Canadian prairies were simulated with the Versatile Soil Moisture Budget model for different crop growth stages. Six water-related agroclimatic indices at five growth stages (seeding–emergence, emergence–jointing, jointing–heading, heading–soft dough and soft dough–harvest) and previous non-growing season were correlated to spring wheat yields in the three prairies provinces and in the entire prairie region for the years 1976–2006. Principal component analysis was applied to explore major modes of joint variability in the regional water-related agroclimatic indices. Canonical correlation analysis was employed to further identify joint variability patterns of the water-related indices associated with regional spring wheat yields. Results showed some common features of the effects of the water-related factors at different growth stages: lower-than-normal moisture stress at the jointing–heading stage favoured spring wheat yields in all three provinces. Regional differences were also seen, for example, a slight moisture stress at the heading–soft dough stage could be beneficial to spring wheat yields in Manitoba because of its relatively wetter climate compared to the other two provinces. The results can be used for a better understanding of the effects of water-related agroclimatic conditions at different growth stages on final spring wheat yields on the Canadian prairies, leading to the improvement of crop management. The results can also be used in regional yield forecasting and in the projection of climate change impacts on crop production. This study provided an example of how to quantify crop–climate relationships by the use of statistical multivariate analysis tools. Crown Copyright © 2008 Published by Elsevier B.V. All rights reserved. 1. Introduction The Canadian prairies account for about 85% of the arable land in Canada, making it the most important agricultural region of the country (Campbell et al., 2002). This region is dominated by cereal grain production, especially hard red spring wheat (Triticum aes- tivum L.), although economic advantages of crop diversification have resulted in a steady increase in the production of oilseeds. While spring wheat yields have increased over the past 30 years, the interannual variability is large, mainly as a result of climatic variability (Qian et al., in press). Understanding the factors that limit crop yields is essential to regional yield forecasting and improving crop management techniques. Moreover, such factors must be known for the devel- ∗ Corresponding author. Tel.: +1 613 759 1641; fax: +1 613 759 1924. E-mail addresses: [email protected] (B. Qian), [email protected] (R. De Jong), [email protected] (S. Gameda). 1 Tel: +1 613 759 1520; fax: +1 613 759 1924. 2 Tel: +1 613 759 1532; fax: +1 613 759 1924. opment of adaptation strategies to climate change, for example, effective irrigations at key crop growth stages under a warmer and dryer climate scenario. Moisture stress is recognized as the dominant limiting factor to spring wheat yields on the Cana- dian prairies (Walker, 1989; Raddatz et al., 1994; Campbell et al., 1997). Campbell (1968) studied the influence of soil moisture stress applied at various stages of growth on the yield compo- nents of Chinook wheat at Swift Current, Saskatchewan. He found that the growth stage from shot-blade (the approximate growth stage equivalent to jointing of the biometeorological time scale in this paper) to anthesis/soft dough was most sensitive to soil moisture stress. Bauer (1972) reported that the heading to soft dough stage is the most sensitive one to water stress. Bootsma et al. (1992) indicated that lack of moisture during the period from jointing to soft dough is most likely to result in a yield reduction on the Canadian prairies. Desjardins and Ouellet (1980), deter- mining the importance of various phases of wheat growth on its final yield at selected locations in Canada, found that the most important phases were essentially the same for regions with sim- ilar climates, but were different for regions with widely different climates. 1161-0301/$ – see front matter. Crown Copyright © 2008 Published by Elsevier B.V. All rights reserved. doi:10.1016/j.eja.2008.09.003

Welcome message from author
This document is posted to help you gain knowledge. Please leave a comment to let me know what you think about it! Share it to your friends and learn new things together.
Transcript
Ml
BE
a
ARRA
KSAVPC
1
icgthWtv
tt
g
1d
Europ. J. Agronomy 30 (2009) 140–150
Contents lists available at ScienceDirect
European Journal of Agronomy
journa l homepage: www.e lsev ier .com/ locate /e ja
ultivariate analysis of water-related agroclimatic factorsimiting spring wheat yields on the Canadian prairies
udong Qian ∗, Reinder De Jong1, Samuel Gameda2
astern Cereal and Oilseed Research Centre, Agriculture and Agri-Food Canada, 960 Carling Ave., Ottawa, ON, K1A 0C6 Canada
r t i c l e i n f o
rticle history:eceived 15 April 2008eceived in revised form 19 August 2008ccepted 9 September 2008
eywords:pring wheat yieldgroclimatologyersatile Soil Moisture Budgetrincipal component analysisanonical correlation analysis
a b s t r a c t
Water use by spring wheat and soil water contents at meteorological stations on the Canadian prairies weresimulated with the Versatile Soil Moisture Budget model for different crop growth stages. Six water-relatedagroclimatic indices at five growth stages (seeding–emergence, emergence–jointing, jointing–heading,heading–soft dough and soft dough–harvest) and previous non-growing season were correlated to springwheat yields in the three prairies provinces and in the entire prairie region for the years 1976–2006.Principal component analysis was applied to explore major modes of joint variability in the regionalwater-related agroclimatic indices. Canonical correlation analysis was employed to further identify jointvariability patterns of the water-related indices associated with regional spring wheat yields. Resultsshowed some common features of the effects of the water-related factors at different growth stages:lower-than-normal moisture stress at the jointing–heading stage favoured spring wheat yields in all threeprovinces. Regional differences were also seen, for example, a slight moisture stress at the heading–softdough stage could be beneficial to spring wheat yields in Manitoba because of its relatively wetter climate
compared to the other two provinces. The results can be used for a better understanding of the effectsof water-related agroclimatic conditions at different growth stages on final spring wheat yields on theCanadian prairies, leading to the improvement of crop management. The results can also be used inregional yield forecasting and in the projection of climate change impacts on crop production. This studyprovided an example of how to quantify crop–climate relationships by the use of statistical multivariateoeaddasnts
analysis tools.
. Introduction
The Canadian prairies account for about 85% of the arable landn Canada, making it the most important agricultural region of theountry (Campbell et al., 2002). This region is dominated by cerealrain production, especially hard red spring wheat (Triticum aes-ivum L.), although economic advantages of crop diversificationave resulted in a steady increase in the production of oilseeds.hile spring wheat yields have increased over the past 30 years,
he interannual variability is large, mainly as a result of climatic
ariability (Qian et al., in press).Understanding the factors that limit crop yields is essentialo regional yield forecasting and improving crop managementechniques. Moreover, such factors must be known for the devel-
∗ Corresponding author. Tel.: +1 613 759 1641; fax: +1 613 759 1924.E-mail addresses: [email protected] (B. Qian), [email protected] (R. De Jong),
[email protected] (S. Gameda).1 Tel: +1 613 759 1520; fax: +1 613 759 1924.2 Tel: +1 613 759 1532; fax: +1 613 759 1924.
imdajomfiiic
161-0301/$ – see front matter. Crown Copyright © 2008 Published by Elsevier B.V. All rigoi:10.1016/j.eja.2008.09.003
Crown Copyright © 2008 Published by Elsevier B.V. All rights reserved.
pment of adaptation strategies to climate change, for example,ffective irrigations at key crop growth stages under a warmernd dryer climate scenario. Moisture stress is recognized as theominant limiting factor to spring wheat yields on the Cana-ian prairies (Walker, 1989; Raddatz et al., 1994; Campbell etl., 1997). Campbell (1968) studied the influence of soil moisturetress applied at various stages of growth on the yield compo-ents of Chinook wheat at Swift Current, Saskatchewan. He foundhat the growth stage from shot-blade (the approximate growthtage equivalent to jointing of the biometeorological time scalen this paper) to anthesis/soft dough was most sensitive to soil
oisture stress. Bauer (1972) reported that the heading to softough stage is the most sensitive one to water stress. Bootsma etl. (1992) indicated that lack of moisture during the period fromointing to soft dough is most likely to result in a yield reductionn the Canadian prairies. Desjardins and Ouellet (1980), deter-
ining the importance of various phases of wheat growth on itsnal yield at selected locations in Canada, found that the mostmportant phases were essentially the same for regions with sim-lar climates, but were different for regions with widely differentlimates.
hts reserved.
grono
sscphiaciasacpcs
yilwtptatr
2
2
p1SlA(fiebB
fPas
2
tpwCttsPLMpyv
2
oLWepSwwsf3dpr
2
B. Qian et al. / Europ. J. A
However, joint variability of the factors at different growthtages can be important as a limiting factor at different growthtages may have different effects on final yields. For example, pre-ipitation at most growth stages can be beneficial but excessiverecipitation may delay seeding as well as harvest. On the otherand, sufficient soil water may compensate the effects of precip-
tation shortage. In addition to the identification of key factorsnd stages, patterns of joint variability can demonstrate a moreomplete picture on how the factors contribute to the final yieldsn a consorted way. This is even more important as the factorsre always correlated to each other, as well as throughout growthtages in the uncontrolled field environment. Moreover, crop man-gement can exert an extra-influence to the final yields from theonsorted effect of the water-related factors. The objective of thisaper is to identify joint variability patterns of water-related agro-limatic indices at different crop growth stages associated withpring wheat yields on the Canadian prairies.
Multivariate analysis tools, such as principal component anal-sis (PCA) and canonical correlation analysis (CCA), are powerfuln dealing with intercorrelated data, such as agroclimatic factorsimiting crop yields. However, after an extensive literature search,
e found no applications of these statistical techniques to quan-ify crop–climate relationships. Therefore, this paper also aims torovide an example of how to quantify such relationships throughhe application of principal component- and canonical correlationnalysis. The results may be used for a better understanding ofhe effects of water-related factors on spring wheat yields at theegional scale, through the joint variability of such factors.
. Materials and methods
.1. Climate data
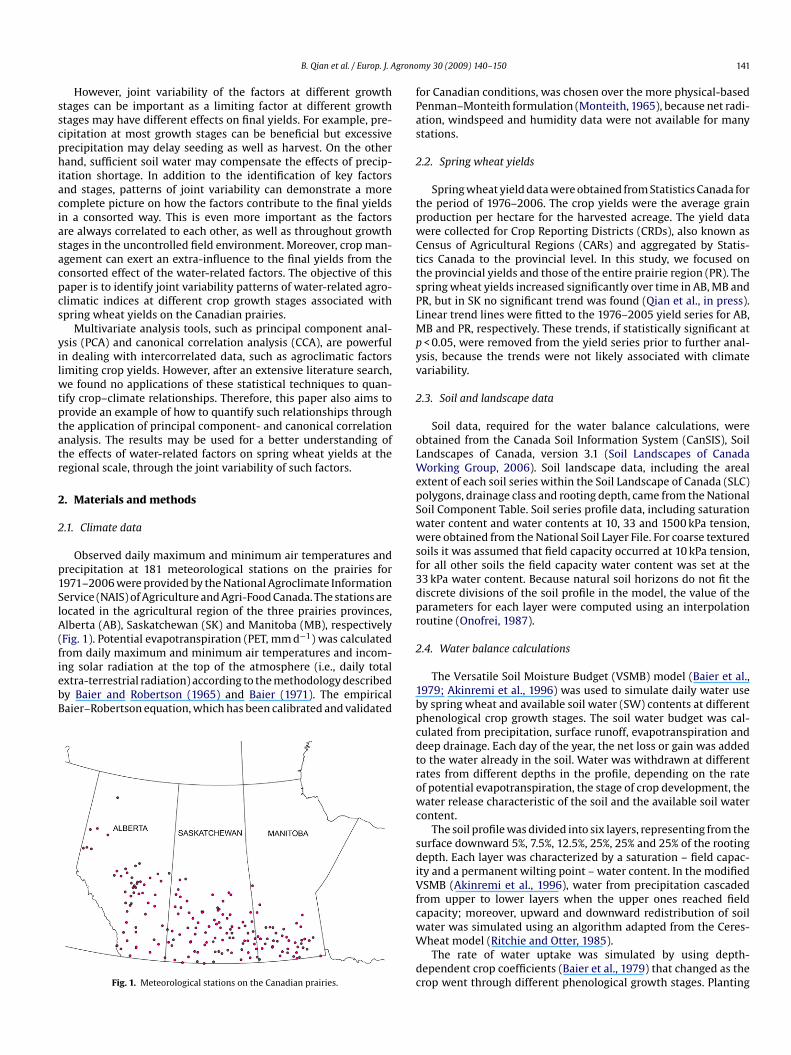
Observed daily maximum and minimum air temperatures andrecipitation at 181 meteorological stations on the prairies for971–2006 were provided by the National Agroclimate Informationervice (NAIS) of Agriculture and Agri-Food Canada. The stations areocated in the agricultural region of the three prairies provinces,lberta (AB), Saskatchewan (SK) and Manitoba (MB), respectively
Fig. 1). Potential evapotranspiration (PET, mm d−1) was calculatedrom daily maximum and minimum air temperatures and incom-
ng solar radiation at the top of the atmosphere (i.e., daily totalxtra-terrestrial radiation) according to the methodology describedy Baier and Robertson (1965) and Baier (1971). The empiricalaier–Robertson equation, which has been calibrated and validatedFig. 1. Meteorological stations on the Canadian prairies.
1bpcdtrowc
sdiVfcwW
dc
my 30 (2009) 140–150 141
or Canadian conditions, was chosen over the more physical-basedenman–Monteith formulation (Monteith, 1965), because net radi-tion, windspeed and humidity data were not available for manytations.
.2. Spring wheat yields
Spring wheat yield data were obtained from Statistics Canada forhe period of 1976–2006. The crop yields were the average grainroduction per hectare for the harvested acreage. The yield dataere collected for Crop Reporting Districts (CRDs), also known asensus of Agricultural Regions (CARs) and aggregated by Statis-ics Canada to the provincial level. In this study, we focused onhe provincial yields and those of the entire prairie region (PR). Thepring wheat yields increased significantly over time in AB, MB andR, but in SK no significant trend was found (Qian et al., in press).inear trend lines were fitted to the 1976–2005 yield series for AB,B and PR, respectively. These trends, if statistically significant at< 0.05, were removed from the yield series prior to further anal-sis, because the trends were not likely associated with climateariability.
.3. Soil and landscape data
Soil data, required for the water balance calculations, werebtained from the Canada Soil Information System (CanSIS), Soilandscapes of Canada, version 3.1 (Soil Landscapes of Canadaorking Group, 2006). Soil landscape data, including the areal
xtent of each soil series within the Soil Landscape of Canada (SLC)olygons, drainage class and rooting depth, came from the Nationaloil Component Table. Soil series profile data, including saturationater content and water contents at 10, 33 and 1500 kPa tension,ere obtained from the National Soil Layer File. For coarse textured
oils it was assumed that field capacity occurred at 10 kPa tension,or all other soils the field capacity water content was set at the3 kPa water content. Because natural soil horizons do not fit theiscrete divisions of the soil profile in the model, the value of thearameters for each layer were computed using an interpolationoutine (Onofrei, 1987).
.4. Water balance calculations
The Versatile Soil Moisture Budget (VSMB) model (Baier et al.,979; Akinremi et al., 1996) was used to simulate daily water usey spring wheat and available soil water (SW) contents at differenthenological crop growth stages. The soil water budget was cal-ulated from precipitation, surface runoff, evapotranspiration andeep drainage. Each day of the year, the net loss or gain was addedo the water already in the soil. Water was withdrawn at differentates from different depths in the profile, depending on the ratef potential evapotranspiration, the stage of crop development, theater release characteristic of the soil and the available soil water
ontent.The soil profile was divided into six layers, representing from the
urface downward 5%, 7.5%, 12.5%, 25%, 25% and 25% of the rootingepth. Each layer was characterized by a saturation – field capac-
ty and a permanent wilting point – water content. In the modifiedSMB (Akinremi et al., 1996), water from precipitation cascaded
rom upper to lower layers when the upper ones reached fieldapacity; moreover, upward and downward redistribution of soil
ater was simulated using an algorithm adapted from the Ceres-heat model (Ritchie and Otter, 1985).The rate of water uptake was simulated by using depth-ependent crop coefficients (Baier et al., 1979) that changed as therop went through different phenological growth stages. Planting
1 grono
dbsr(awa1
((cGeah
lbiifyofia
wlctu
Y
wbt
2
wao((iws(dstsamSpprsi
2
tn(dtdrABcmcivrasd
rCtntdjsmvntwpitdcs3oc
3
3
mmcm1avay
42 B. Qian et al. / Europ. J. A
ates of wheat were estimated according to procedures describedy Bootsma and De Jong (1988). The duration of each growthtage (i.e., planting, emergence, jointing, heading, soft dough andipening) was defined by a biometeorological time scale modelRobertson, 1968). Harvest dates were assumed to occur 1 weekfter ripening. The jointing, heading, soft dough and ripening stagesere approximately in correspondence with stages 6, 10.1, 10.5.4
nd 11.3, respectively, of the Feekes’ scale (Feekes, 1941; Large,954; Miller, 1999).
Soil water release characteristics, as defined by Dyer and Baier1979), were similar to those used by De Jong and Bootsma1988). For coarse-, medium- and fine-textured soils, curves 1 (con-ave), 2 (linear) and 4 (convex) were used, respectively. Followingallichand et al. (1991) and Van Keulen and Wolf (1986) the actualvapotranspiration rate fell below the potential one when the plantvailable water content was less than 45% of the soil available waterolding capacity.
Calculation of surface runoff from frozen and non-frozen soil fol-owed the procedures described by Akinremi et al. (1996). The snowudgeting procedure, described by Baier et al. (1979), was used dur-
ng the winter period to provide an estimate of soil water contentsn early spring. It allowed us to make continuous simulation runsor 37 years (1970–2006), without re-initializing the program everyear. The model started with an assumed soil water content of 75%f the maximum possible on 15 April 1970. The outputs from thisrst simulation year (1970) were not included in any subsequentnalyses.
The water balance calculations were made for all soil seriesithin the SLC polygons in which a meteorological station was
ocated. The output from the model (including, e.g., the variablesumulative potential and actual evapotranspiration, soil water con-ents, deep drainage, etc.) was scaled-up to the SLC polygon levelsing:
s =∑n
i=1(Yi × Ai)∑n
i=1Ai
(1)
here Ys is the soil area weighted mean of variable Y, n is the num-er of soil series within the polygon under consideration and Ai ishe area of soil series i.
.5. Water-related agroclimatic indices
Six water-related agroclimatic indices for six time periodsere used in the multivariate analysis. The indices included: (i)
ccumulated precipitation (P); (ii) accumulated potential evap-transpiration (PET); (iii) accumulated actual evapotranspirationAET); (iv) accumulated water stress (S), defined as 1 − (AET/PET);v) mean soil water content (SW); and (vi) soil water deficit (D),.e., accumulated soil water deficit to 50% of the soil availableater holding capacity. The indices were calculated for five growth
tages, including (i) seeding–emergence; (ii) emergence–jointing;iii) jointing–heading; (iv) heading–soft dough; and (v) softough–harvest, respectively. Because soil water conditions prior toeeding are also influential on wheat yields (Zentner et al., 1993),he time period from the previous harvest date to the current year’seeding date was also considered in the analysis. Therefore, sixgroclimatic indices for six time periods constituted 36 agrocli-atic variables in the multivariate analysis. The variables for each
LC polygon (i.e., meteorological station) were correlated to therovincial yields where the station is located and to the wholerairie region yields. Following Qian et al. (in press), provincial andegional indices were created from station indices weighted by thequared correlation (portion of variance in yields explained by thendex at the station), for AB, SK, MB and PR, respectively.
tyrovp
my 30 (2009) 140–150
.6. Multivariate analysis
Principal component analysis is a mathematical procedure thatransforms a number of possible correlated variables into a smallerumber of uncorrelated variables called principal componentsPCs). The first PC accounts for as much of the variability in theata as possible, and each succeeding PC accounts for as much ofhe remaining variability. PCA is mainly used as a tool in exploratoryata analysis and for making predictive models. Since PCs are uncor-elated, they are suitable predictors in multiple regression models.
more detailed description of PCA can be found in Jolliffe (1986).ecause many of the 36 variables in this study might be closelyorrelated to each other, only a few PCs will contain most infor-ation about the variability of these variables. In addition to data
ompression, PCA has the potential for yielding substantial insightsnto the variations exhibited by the variables: joint variability of theariables through modes of variation (eigenvectors) and the tempo-al variations through PCs. Since the variances of the 36 variablesre considerably different from each other, all the variables weretandardized by subtracting the mean and dividing by the standardeviation for the period of 1976–2006, prior the application of PCA.
The modes of variation identified by PCA are not necessarilyelated to interannual variations of regional spring wheat yields.CA was therefore performed to identify the mode of variation ofhe water-related variables that is closely associated with interan-ual variability of regional spring wheat yields. CCA is a statisticalechnique that identifies a sequence of patterns in two multivariateata sets, and it constructs sets of transformed variables by pro-
ecting the original data onto these patterns. The approach bearsome similarity to PCA, which searches for patterns within a singleultivariate data set that represents the maximum amount of the
ariation in the data. In CCA, the patterns are chosen such that theew variables defined by the projection of the two data sets ontohese patterns exhibit maximum correlation, but are uncorrelatedith the projections of the data onto any of the other identifiedatterns. In other words, CCA identifies new variables that max-
mize the interrelationships between two data sets, in contrasto the patterns describing the internal variability within a singleata set identified in PCA (Wilks, 1995). Details of the procedurean be found in Preisendorfer (1988). In this study, the regionalpring wheat yield is a single variable in one set of data and the6 water-related regional agroclimatic indices form the other setf data. Therefore, it is special case of CCA and only one canonicalorrelation pattern can be identified.
. Results and discussion
.1. Modes of variation of water-related agroclimatic factors
PCA was performed on the 36 standardized regional agrocli-atic indices for the years 1976–2006 in AB, SK, MB and PR. Theodes of variation (i.e., patterns) demonstrate the structure of
ovariance among the indices, i.e., joint variability, which explainedost variance in the indices for the 31-year time period. The first
0 PCs accounted 90.8%, 94.6%, 92.2% and 94.4% of the total vari-nce in the data for AB, SK, MB and PR, respectively. Percentages ofariance explained by the first five PCs of the 36 regional indicesnd correlations with their corresponding regional spring wheatields are listed in Table 1. The first PC explained 29.9–38.1% of theotal variance and was closely correlated to the detrended regional
ields at the 5% significance level, except for MB. Significant cor-elations were also found for other PCs (see Table 1). First modesf variation corresponding to PC1 for the four regions show jointariability of the indices that explains most variance (Fig. 2). Theseatterns have some implication for the effect of variability of an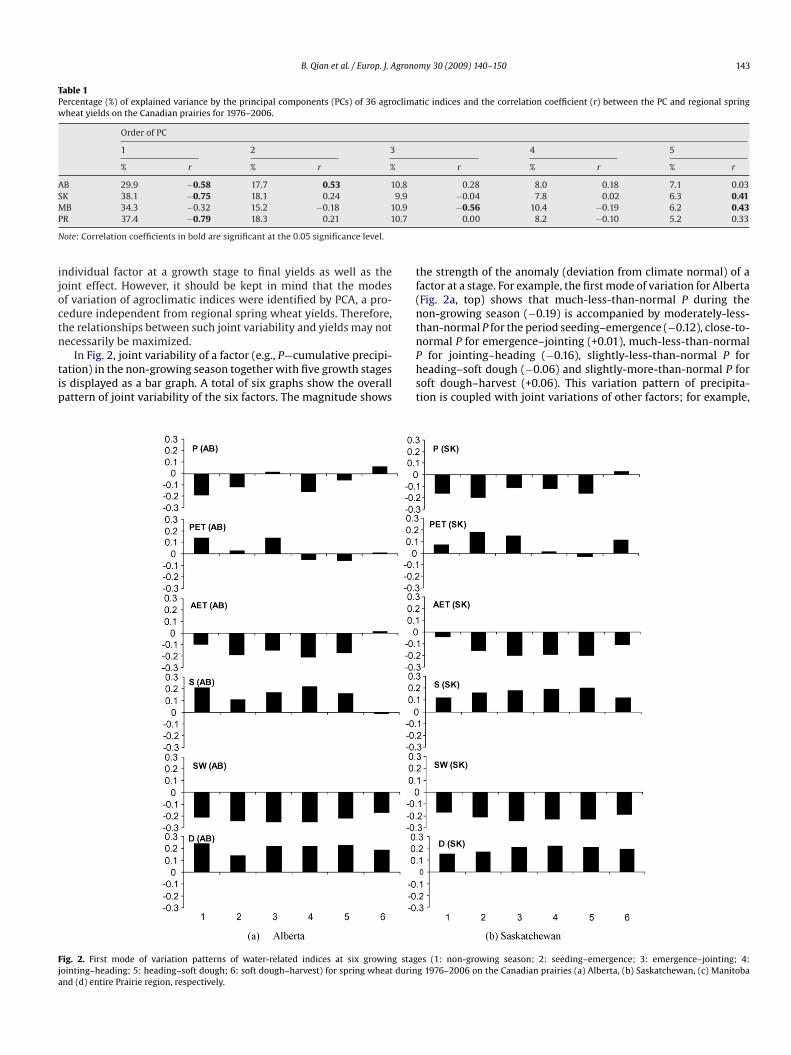
B. Qian et al. / Europ. J. Agronomy 30 (2009) 140–150 143
Table 1Percentage (%) of explained variance by the principal components (PCs) of 36 agroclimatic indices and the correlation coefficient (r) between the PC and regional springwheat yields on the Canadian prairies for 1976–2006.
Order of PC
1 2 3 4 5
% r % r % r % r % r
AB 29.9 −0.58 17.7 0.53 10.8 0.28 8.0 0.18 7.1 0.03SK 38.1 −0.75 18.1 0.24 9.9 −0.04 7.8 0.02 6.3 0.41M 0.9P 0.7
N
ijoctn
tip
tf(ntn
Fja
B 34.3 −0.32 15.2 −0.18 1R 37.4 −0.79 18.3 0.21 1
ote: Correlation coefficients in bold are significant at the 0.05 significance level.
ndividual factor at a growth stage to final yields as well as theoint effect. However, it should be kept in mind that the modesf variation of agroclimatic indices were identified by PCA, a pro-edure independent from regional spring wheat yields. Therefore,he relationships between such joint variability and yields may notecessarily be maximized.
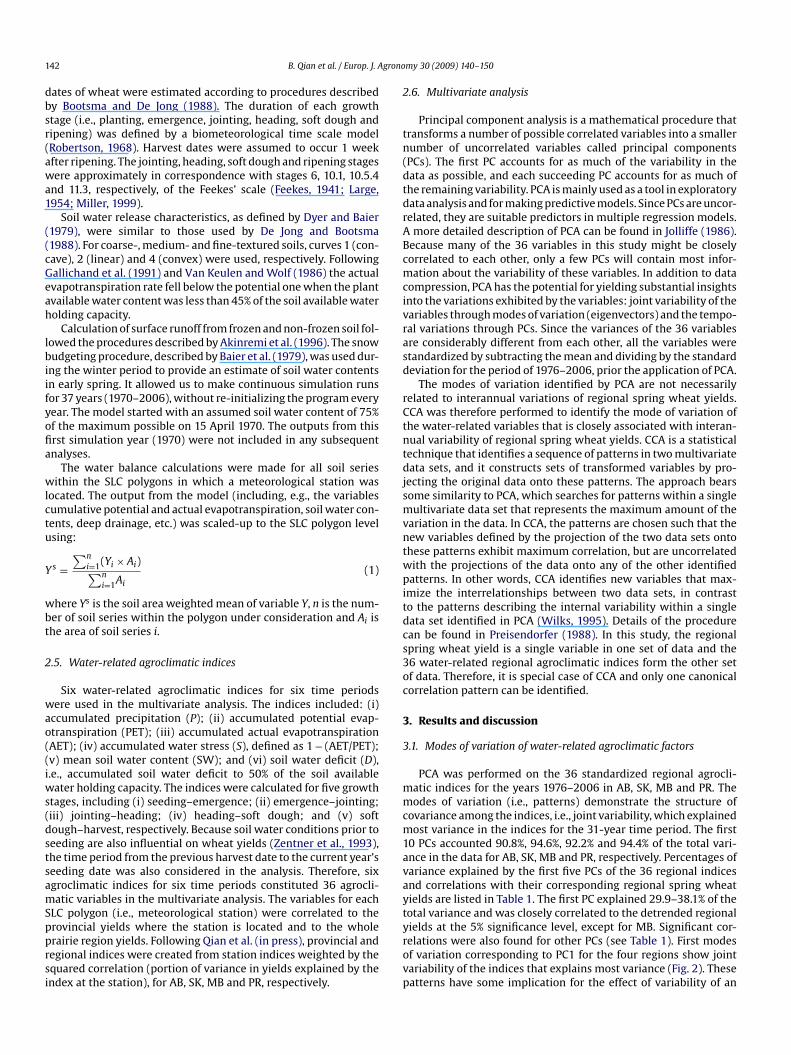
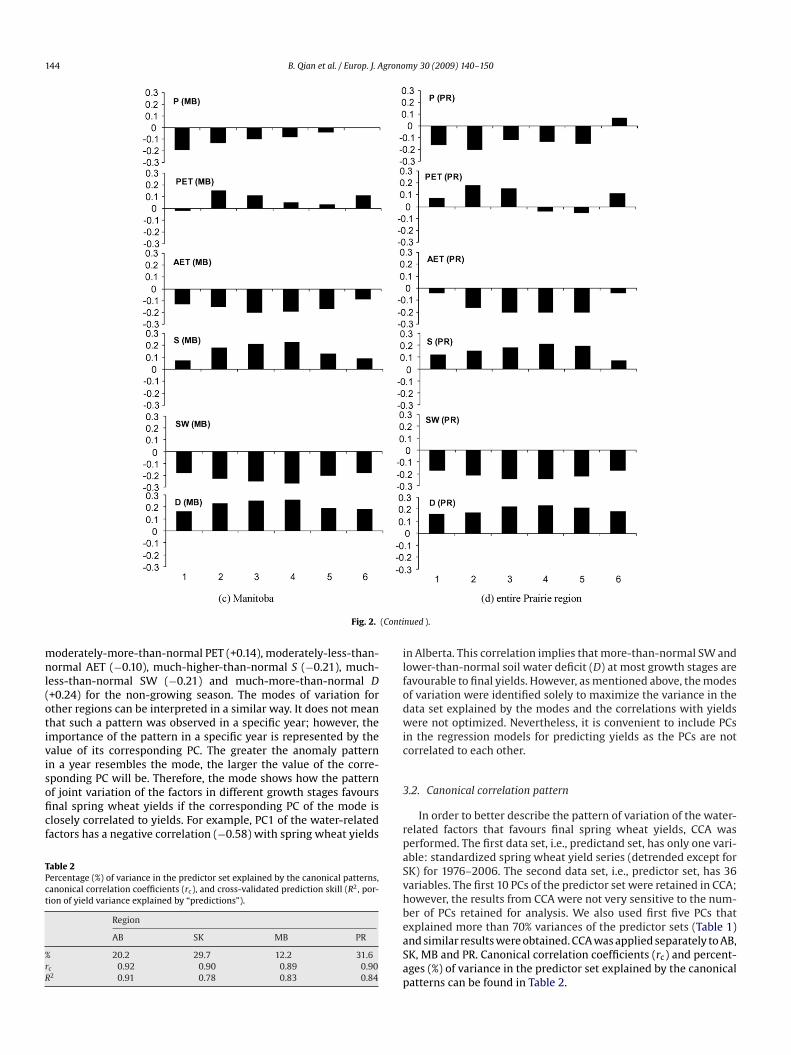
In Fig. 2, joint variability of a factor (e.g., P—cumulative precipi-ation) in the non-growing season together with five growth stagess displayed as a bar graph. A total of six graphs show the overallattern of joint variability of the six factors. The magnitude shows
Phst
ig. 2. First mode of variation patterns of water-related indices at six growing stagointing–heading; 5: heading–soft dough; 6: soft dough–harvest) for spring wheat durinnd (d) entire Prairie region, respectively.
−0.56 10.4 −0.19 6.2 0.430.00 8.2 −0.10 5.2 0.33
he strength of the anomaly (deviation from climate normal) of aactor at a stage. For example, the first mode of variation for AlbertaFig. 2a, top) shows that much-less-than-normal P during theon-growing season (−0.19) is accompanied by moderately-less-han-normal P for the period seeding–emergence (−0.12), close-to-ormal P for emergence–jointing (+0.01), much-less-than-normal
for jointing–heading (−0.16), slightly-less-than-normal P foreading–soft dough (−0.06) and slightly-more-than-normal P foroft dough–harvest (+0.06). This variation pattern of precipita-ion is coupled with joint variations of other factors; for example,
es (1: non-growing season; 2: seeding–emergence; 3: emergence–jointing; 4:g 1976–2006 on the Canadian prairies (a) Alberta, (b) Saskatchewan, (c) Manitoba
144 B. Qian et al. / Europ. J. Agronomy 30 (2009) 140–150
(Conti
mnl(otivisoficf
TPct
%rR
ilfodwic
Fig. 2.
oderately-more-than-normal PET (+0.14), moderately-less-than-ormal AET (−0.10), much-higher-than-normal S (−0.21), much-
ess-than-normal SW (−0.21) and much-more-than-normal D+0.24) for the non-growing season. The modes of variation forther regions can be interpreted in a similar way. It does not meanhat such a pattern was observed in a specific year; however, themportance of the pattern in a specific year is represented by thealue of its corresponding PC. The greater the anomaly patternn a year resembles the mode, the larger the value of the corre-
ponding PC will be. Therefore, the mode shows how the patternf joint variation of the factors in different growth stages favoursnal spring wheat yields if the corresponding PC of the mode islosely correlated to yields. For example, PC1 of the water-relatedactors has a negative correlation (−0.58) with spring wheat yieldsable 2ercentage (%) of variance in the predictor set explained by the canonical patterns,anonical correlation coefficients (rc), and cross-validated prediction skill (R2, por-ion of yield variance explained by “predictions”).
Region
AB SK MB PR
20.2 29.7 12.2 31.6c 0.92 0.90 0.89 0.902 0.91 0.78 0.83 0.84
3
rpaSvhbeaSap
nued ).
n Alberta. This correlation implies that more-than-normal SW andower-than-normal soil water deficit (D) at most growth stages areavourable to final yields. However, as mentioned above, the modesf variation were identified solely to maximize the variance in theata set explained by the modes and the correlations with yieldsere not optimized. Nevertheless, it is convenient to include PCs
n the regression models for predicting yields as the PCs are notorrelated to each other.
.2. Canonical correlation pattern
In order to better describe the pattern of variation of the water-elated factors that favours final spring wheat yields, CCA waserformed. The first data set, i.e., predictand set, has only one vari-ble: standardized spring wheat yield series (detrended except forK) for 1976–2006. The second data set, i.e., predictor set, has 36ariables. The first 10 PCs of the predictor set were retained in CCA;owever, the results from CCA were not very sensitive to the num-er of PCs retained for analysis. We also used first five PCs that
xplained more than 70% variances of the predictor sets (Table 1)nd similar results were obtained. CCA was applied separately to AB,K, MB and PR. Canonical correlation coefficients (rc) and percent-ges (%) of variance in the predictor set explained by the canonicalatterns can be found in Table 2.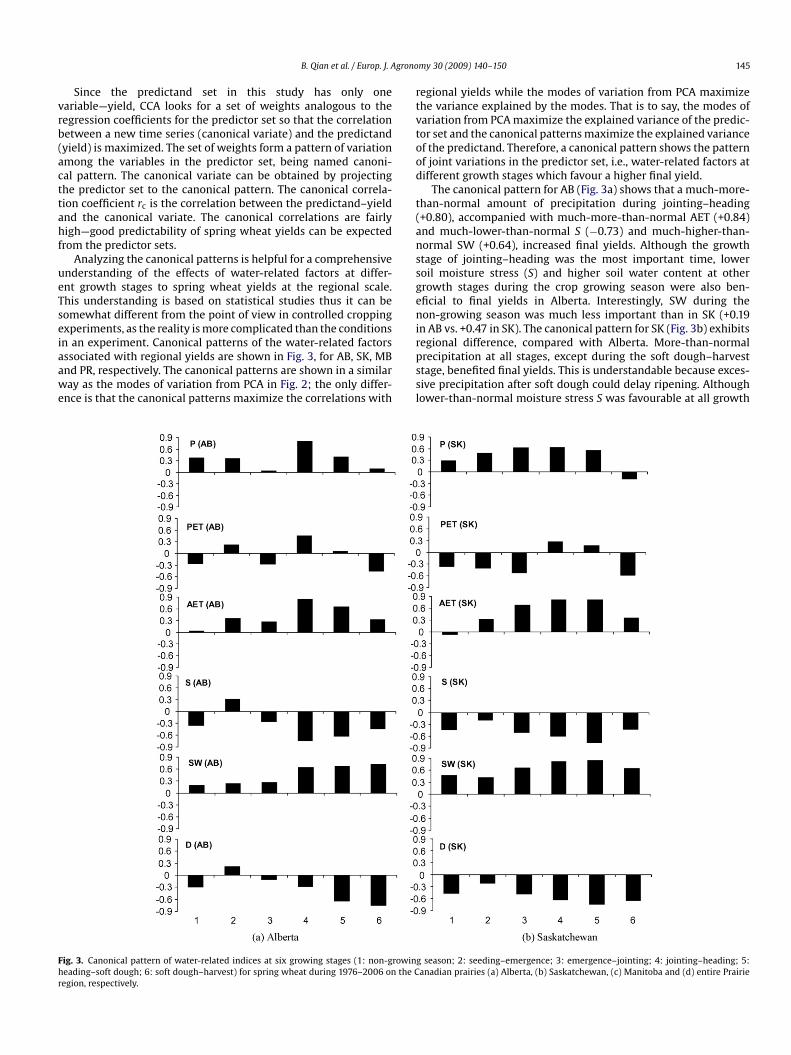
grono
vrb(acttahf
ueTseiaawe
rtvtood
t(anssgenir
Fhr
B. Qian et al. / Europ. J. A
Since the predictand set in this study has only oneariable—yield, CCA looks for a set of weights analogous to theegression coefficients for the predictor set so that the correlationetween a new time series (canonical variate) and the predictandyield) is maximized. The set of weights form a pattern of variationmong the variables in the predictor set, being named canoni-al pattern. The canonical variate can be obtained by projectinghe predictor set to the canonical pattern. The canonical correla-ion coefficient rc is the correlation between the predictand–yieldnd the canonical variate. The canonical correlations are fairlyigh—good predictability of spring wheat yields can be expected
rom the predictor sets.Analyzing the canonical patterns is helpful for a comprehensive
nderstanding of the effects of water-related factors at differ-nt growth stages to spring wheat yields at the regional scale.his understanding is based on statistical studies thus it can beomewhat different from the point of view in controlled croppingxperiments, as the reality is more complicated than the conditionsn an experiment. Canonical patterns of the water-related factors
ssociated with regional yields are shown in Fig. 3, for AB, SK, MBnd PR, respectively. The canonical patterns are shown in a similaray as the modes of variation from PCA in Fig. 2; the only differ-nce is that the canonical patterns maximize the correlations with
pssl
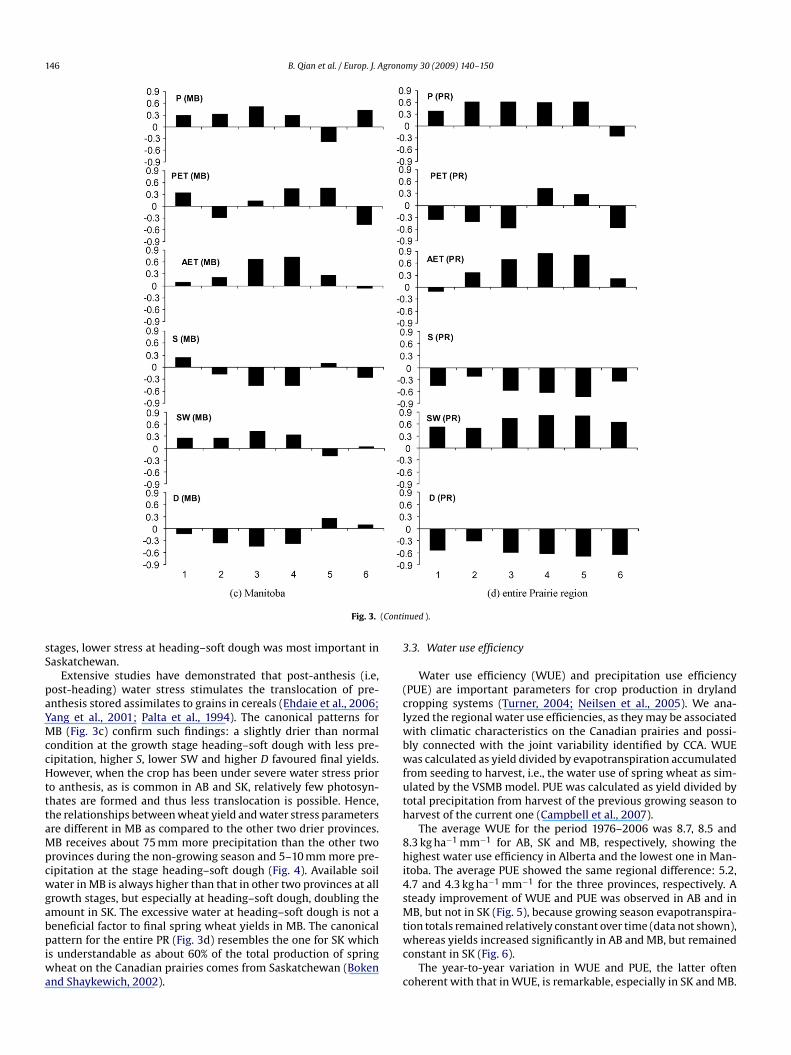
ig. 3. Canonical pattern of water-related indices at six growing stages (1: non-growineading–soft dough; 6: soft dough–harvest) for spring wheat during 1976–2006 on the Cegion, respectively.
my 30 (2009) 140–150 145
egional yields while the modes of variation from PCA maximizehe variance explained by the modes. That is to say, the modes ofariation from PCA maximize the explained variance of the predic-or set and the canonical patterns maximize the explained variancef the predictand. Therefore, a canonical pattern shows the patternf joint variations in the predictor set, i.e., water-related factors atifferent growth stages which favour a higher final yield.
The canonical pattern for AB (Fig. 3a) shows that a much-more-han-normal amount of precipitation during jointing–heading+0.80), accompanied with much-more-than-normal AET (+0.84)nd much-lower-than-normal S (−0.73) and much-higher-than-ormal SW (+0.64), increased final yields. Although the growthtage of jointing–heading was the most important time, loweroil moisture stress (S) and higher soil water content at otherrowth stages during the crop growing season were also ben-ficial to final yields in Alberta. Interestingly, SW during theon-growing season was much less important than in SK (+0.19
n AB vs. +0.47 in SK). The canonical pattern for SK (Fig. 3b) exhibitsegional difference, compared with Alberta. More-than-normal
recipitation at all stages, except during the soft dough–harvesttage, benefited final yields. This is understandable because exces-ive precipitation after soft dough could delay ripening. Althoughower-than-normal moisture stress S was favourable at all growthg season; 2: seeding–emergence; 3: emergence–jointing; 4: jointing–heading; 5:anadian prairies (a) Alberta, (b) Saskatchewan, (c) Manitoba and (d) entire Prairie
146 B. Qian et al. / Europ. J. Agronomy 30 (2009) 140–150
(Conti
sS
paYMccHtttaMpcwgabpiwa
3
(clwbwfuth
8hi4sM
Fig. 3.
tages, lower stress at heading–soft dough was most important inaskatchewan.
Extensive studies have demonstrated that post-anthesis (i.e,ost-heading) water stress stimulates the translocation of pre-nthesis stored assimilates to grains in cereals (Ehdaie et al., 2006;ang et al., 2001; Palta et al., 1994). The canonical patterns forB (Fig. 3c) confirm such findings: a slightly drier than normal
ondition at the growth stage heading–soft dough with less pre-ipitation, higher S, lower SW and higher D favoured final yields.owever, when the crop has been under severe water stress prior
o anthesis, as is common in AB and SK, relatively few photosyn-hates are formed and thus less translocation is possible. Hence,he relationships between wheat yield and water stress parametersre different in MB as compared to the other two drier provinces.B receives about 75 mm more precipitation than the other two
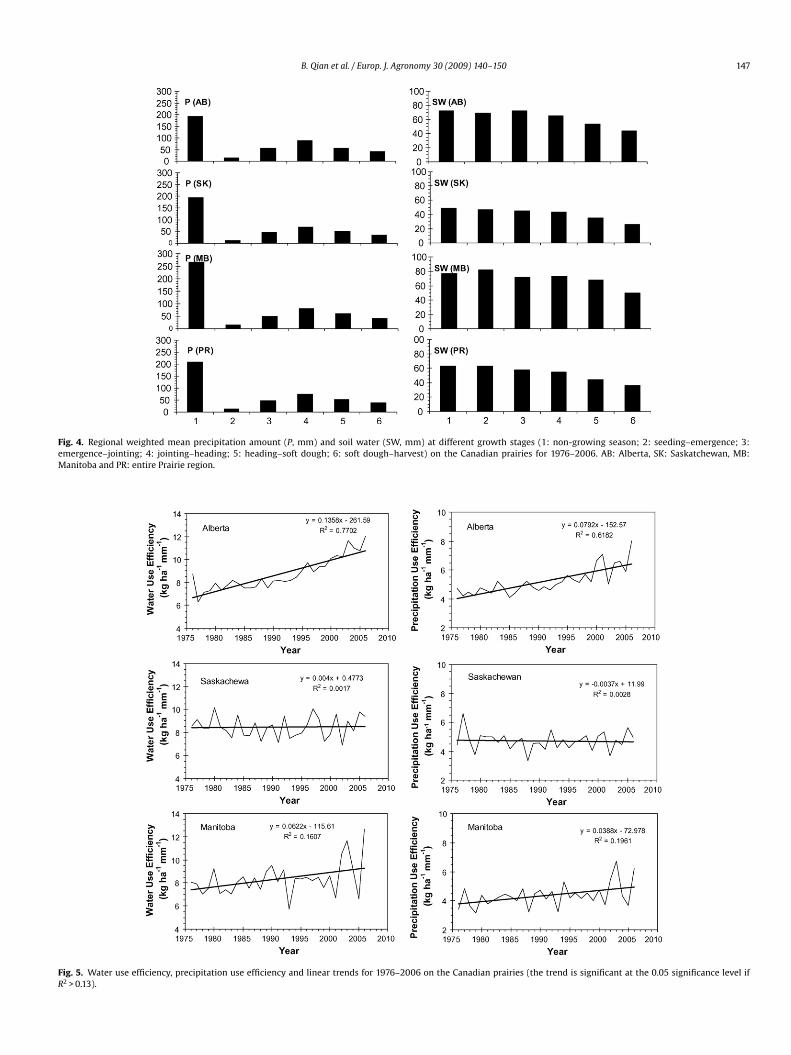
rovinces during the non-growing season and 5–10 mm more pre-ipitation at the stage heading–soft dough (Fig. 4). Available soilater in MB is always higher than that in other two provinces at all
rowth stages, but especially at heading–soft dough, doubling themount in SK. The excessive water at heading–soft dough is not a
eneficial factor to final spring wheat yields in MB. The canonicalattern for the entire PR (Fig. 3d) resembles the one for SK whichs understandable as about 60% of the total production of springheat on the Canadian prairies comes from Saskatchewan (Boken
nd Shaykewich, 2002).
twc
c
nued ).
.3. Water use efficiency
Water use efficiency (WUE) and precipitation use efficiencyPUE) are important parameters for crop production in drylandropping systems (Turner, 2004; Neilsen et al., 2005). We ana-yzed the regional water use efficiencies, as they may be associated
ith climatic characteristics on the Canadian prairies and possi-ly connected with the joint variability identified by CCA. WUEas calculated as yield divided by evapotranspiration accumulated
rom seeding to harvest, i.e., the water use of spring wheat as sim-lated by the VSMB model. PUE was calculated as yield divided byotal precipitation from harvest of the previous growing season toarvest of the current one (Campbell et al., 2007).
The average WUE for the period 1976–2006 was 8.7, 8.5 and.3 kg ha−1 mm−1 for AB, SK and MB, respectively, showing theighest water use efficiency in Alberta and the lowest one in Man-
toba. The average PUE showed the same regional difference: 5.2,.7 and 4.3 kg ha−1 mm−1 for the three provinces, respectively. Ateady improvement of WUE and PUE was observed in AB and inB, but not in SK (Fig. 5), because growing season evapotranspira-
ion totals remained relatively constant over time (data not shown),hereas yields increased significantly in AB and MB, but remained
onstant in SK (Fig. 6).The year-to-year variation in WUE and PUE, the latter often
oherent with that in WUE, is remarkable, especially in SK and MB.
B. Qian et al. / Europ. J. Agronomy 30 (2009) 140–150 147
Fig. 4. Regional weighted mean precipitation amount (P, mm) and soil water (SW, mm) at different growth stages (1: non-growing season; 2: seeding–emergence; 3:emergence–jointing; 4: jointing–heading; 5: heading–soft dough; 6: soft dough–harvest) on the Canadian prairies for 1976–2006. AB: Alberta, SK: Saskatchewan, MB:Manitoba and PR: entire Prairie region.
Fig. 5. Water use efficiency, precipitation use efficiency and linear trends for 1976–2006 on the Canadian prairies (the trend is significant at the 0.05 significance level ifR2 > 0.13).
148 B. Qian et al. / Europ. J. Agronomy 30 (2009) 140–150
F 76–20v s-valid
TaWTsls
tdmtststtlb
NiaeOfo2mwwtdgW
TSj
I
PPASSD
I
PPASSD
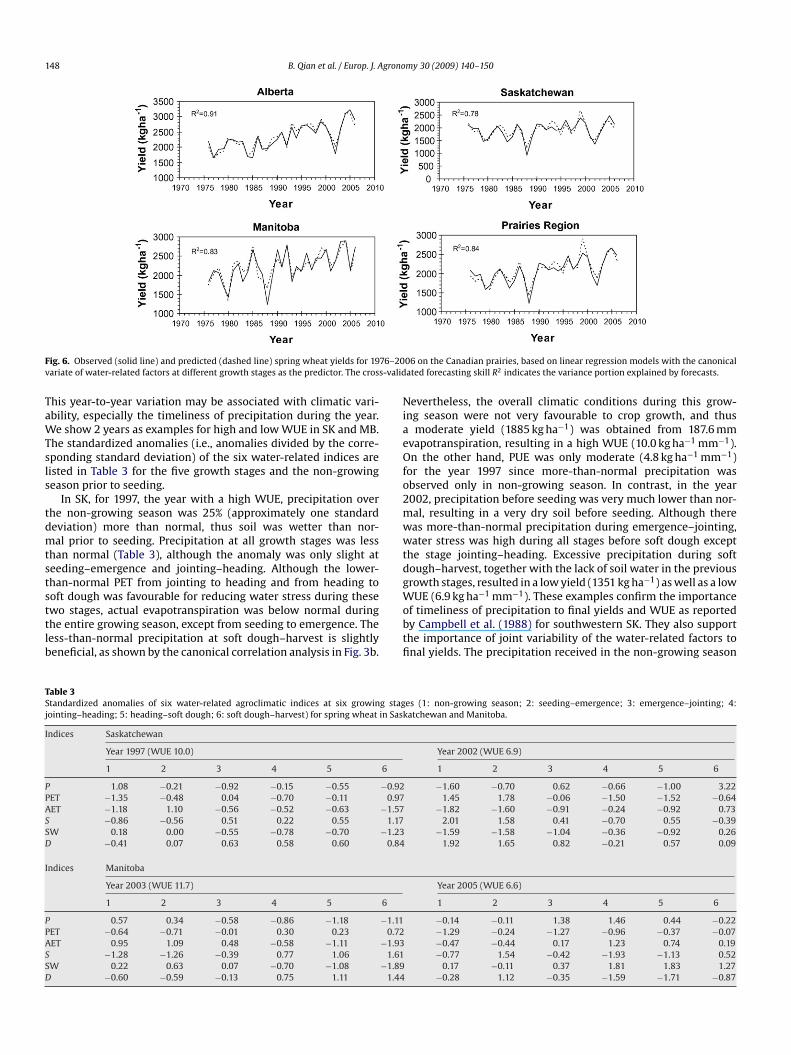
ig. 6. Observed (solid line) and predicted (dashed line) spring wheat yields for 19ariate of water-related factors at different growth stages as the predictor. The cros
his year-to-year variation may be associated with climatic vari-bility, especially the timeliness of precipitation during the year.e show 2 years as examples for high and low WUE in SK and MB.
he standardized anomalies (i.e., anomalies divided by the corre-ponding standard deviation) of the six water-related indices areisted in Table 3 for the five growth stages and the non-growingeason prior to seeding.
In SK, for 1997, the year with a high WUE, precipitation overhe non-growing season was 25% (approximately one standardeviation) more than normal, thus soil was wetter than nor-al prior to seeding. Precipitation at all growth stages was less
han normal (Table 3), although the anomaly was only slight ateeding–emergence and jointing–heading. Although the lower-han-normal PET from jointing to heading and from heading tooft dough was favourable for reducing water stress during these
wo stages, actual evapotranspiration was below normal duringhe entire growing season, except from seeding to emergence. Theess-than-normal precipitation at soft dough–harvest is slightlyeneficial, as shown by the canonical correlation analysis in Fig. 3b.obtfi
able 3tandardized anomalies of six water-related agroclimatic indices at six growing stagointing–heading; 5: heading–soft dough; 6: soft dough–harvest) for spring wheat in Sask
ndices Saskatchewan
Year 1997 (WUE 10.0)
1 2 3 4 5 6
1.08 −0.21 −0.92 −0.15 −0.55 −0.92ET −1.35 −0.48 0.04 −0.70 −0.11 0.97ET −1.18 1.10 −0.56 −0.52 −0.63 −1.57
−0.86 −0.56 0.51 0.22 0.55 1.17W 0.18 0.00 −0.55 −0.78 −0.70 −1.23
−0.41 0.07 0.63 0.58 0.60 0.84
ndices Manitoba
Year 2003 (WUE 11.7)
1 2 3 4 5 6
0.57 0.34 −0.58 −0.86 −1.18 −1.11ET −0.64 −0.71 −0.01 0.30 0.23 0.72ET 0.95 1.09 0.48 −0.58 −1.11 −1.93
−1.28 −1.26 −0.39 0.77 1.06 1.61W 0.22 0.63 0.07 −0.70 −1.08 −1.89
−0.60 −0.59 −0.13 0.75 1.11 1.44
06 on the Canadian prairies, based on linear regression models with the canonicalated forecasting skill R2 indicates the variance portion explained by forecasts.
evertheless, the overall climatic conditions during this grow-ng season were not very favourable to crop growth, and thus
moderate yield (1885 kg ha−1) was obtained from 187.6 mmvapotranspiration, resulting in a high WUE (10.0 kg ha−1 mm−1).n the other hand, PUE was only moderate (4.8 kg ha−1 mm−1)
or the year 1997 since more-than-normal precipitation wasbserved only in non-growing season. In contrast, in the year002, precipitation before seeding was very much lower than nor-al, resulting in a very dry soil before seeding. Although thereas more-than-normal precipitation during emergence–jointing,ater stress was high during all stages before soft dough except
he stage jointing–heading. Excessive precipitation during softough–harvest, together with the lack of soil water in the previousrowth stages, resulted in a low yield (1351 kg ha−1) as well as a lowUE (6.9 kg ha−1 mm−1). These examples confirm the importance
f timeliness of precipitation to final yields and WUE as reportedy Campbell et al. (1988) for southwestern SK. They also supporthe importance of joint variability of the water-related factors tonal yields. The precipitation received in the non-growing season
es (1: non-growing season; 2: seeding–emergence; 3: emergence–jointing; 4:atchewan and Manitoba.
Year 2002 (WUE 6.9)
1 2 3 4 5 6
−1.60 −0.70 0.62 −0.66 −1.00 3.221.45 1.78 −0.06 −1.50 −1.52 −0.64
−1.82 −1.60 −0.91 −0.24 −0.92 0.732.01 1.58 0.41 −0.70 0.55 −0.39
−1.59 −1.58 −1.04 −0.36 −0.92 0.261.92 1.65 0.82 −0.21 0.57 0.09
Year 2005 (WUE 6.6)
1 2 3 4 5 6
−0.14 −0.11 1.38 1.46 0.44 −0.22−1.29 −0.24 −1.27 −0.96 −0.37 −0.07−0.47 −0.44 0.17 1.23 0.74 0.19−0.77 1.54 −0.42 −1.93 −1.13 0.52
0.17 −0.11 0.37 1.81 1.83 1.27−0.28 1.12 −0.35 −1.59 −1.71 −0.87
gronomy 30 (2009) 140–150 149
aap
tgpnjcwAwhpalslcoiprdtwea
3
ustscipsaTtctwtf2tptbMswbm
rnctm
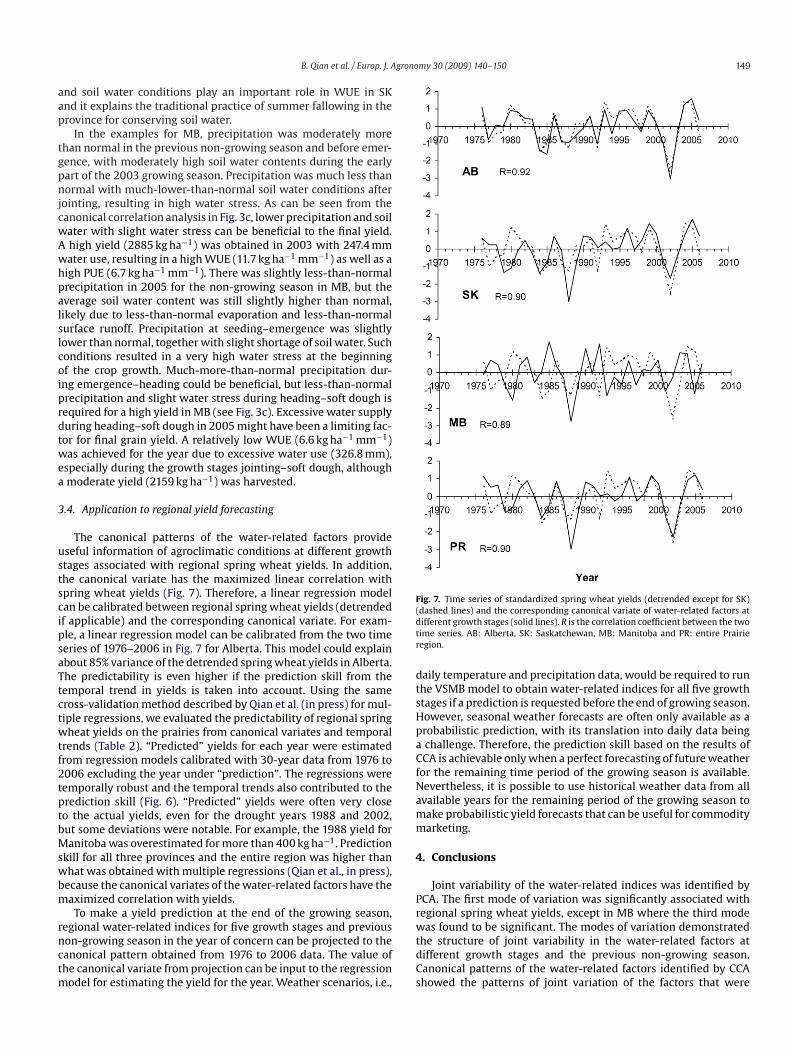
Fig. 7. Time series of standardized spring wheat yields (detrended except for SK)(dtr
dtsHpaCfNamm
4
Pr
B. Qian et al. / Europ. J. A
nd soil water conditions play an important role in WUE in SKnd it explains the traditional practice of summer fallowing in therovince for conserving soil water.
In the examples for MB, precipitation was moderately morehan normal in the previous non-growing season and before emer-ence, with moderately high soil water contents during the earlyart of the 2003 growing season. Precipitation was much less thanormal with much-lower-than-normal soil water conditions after
ointing, resulting in high water stress. As can be seen from theanonical correlation analysis in Fig. 3c, lower precipitation and soilater with slight water stress can be beneficial to the final yield.high yield (2885 kg ha−1) was obtained in 2003 with 247.4 mmater use, resulting in a high WUE (11.7 kg ha−1 mm−1) as well as aigh PUE (6.7 kg ha−1 mm−1). There was slightly less-than-normalrecipitation in 2005 for the non-growing season in MB, but theverage soil water content was still slightly higher than normal,ikely due to less-than-normal evaporation and less-than-normalurface runoff. Precipitation at seeding–emergence was slightlyower than normal, together with slight shortage of soil water. Suchonditions resulted in a very high water stress at the beginningf the crop growth. Much-more-than-normal precipitation dur-ng emergence–heading could be beneficial, but less-than-normalrecipitation and slight water stress during heading–soft dough isequired for a high yield in MB (see Fig. 3c). Excessive water supplyuring heading–soft dough in 2005 might have been a limiting fac-or for final grain yield. A relatively low WUE (6.6 kg ha−1 mm−1)as achieved for the year due to excessive water use (326.8 mm),
specially during the growth stages jointing–soft dough, althoughmoderate yield (2159 kg ha−1) was harvested.
.4. Application to regional yield forecasting
The canonical patterns of the water-related factors provideseful information of agroclimatic conditions at different growthtages associated with regional spring wheat yields. In addition,he canonical variate has the maximized linear correlation withpring wheat yields (Fig. 7). Therefore, a linear regression modelan be calibrated between regional spring wheat yields (detrendedf applicable) and the corresponding canonical variate. For exam-le, a linear regression model can be calibrated from the two timeeries of 1976–2006 in Fig. 7 for Alberta. This model could explainbout 85% variance of the detrended spring wheat yields in Alberta.he predictability is even higher if the prediction skill from theemporal trend in yields is taken into account. Using the sameross-validation method described by Qian et al. (in press) for mul-iple regressions, we evaluated the predictability of regional springheat yields on the prairies from canonical variates and temporal
rends (Table 2). “Predicted” yields for each year were estimatedrom regression models calibrated with 30-year data from 1976 to006 excluding the year under “prediction”. The regressions wereemporally robust and the temporal trends also contributed to therediction skill (Fig. 6). “Predicted” yields were often very closeo the actual yields, even for the drought years 1988 and 2002,ut some deviations were notable. For example, the 1988 yield foranitoba was overestimated for more than 400 kg ha−1. Prediction
kill for all three provinces and the entire region was higher thanhat was obtained with multiple regressions (Qian et al., in press),
ecause the canonical variates of the water-related factors have theaximized correlation with yields.To make a yield prediction at the end of the growing season,
egional water-related indices for five growth stages and previouson-growing season in the year of concern can be projected to theanonical pattern obtained from 1976 to 2006 data. The value ofhe canonical variate from projection can be input to the regression
odel for estimating the yield for the year. Weather scenarios, i.e.,
wtdCs
dashed lines) and the corresponding canonical variate of water-related factors atifferent growth stages (solid lines). R is the correlation coefficient between the twoime series. AB: Alberta, SK: Saskatchewan, MB: Manitoba and PR: entire Prairieegion.
aily temperature and precipitation data, would be required to runhe VSMB model to obtain water-related indices for all five growthtages if a prediction is requested before the end of growing season.owever, seasonal weather forecasts are often only available as arobabilistic prediction, with its translation into daily data beingchallenge. Therefore, the prediction skill based on the results ofCA is achievable only when a perfect forecasting of future weather
or the remaining time period of the growing season is available.evertheless, it is possible to use historical weather data from allvailable years for the remaining period of the growing season toake probabilistic yield forecasts that can be useful for commodityarketing.
. Conclusions
Joint variability of the water-related indices was identified byCA. The first mode of variation was significantly associated withegional spring wheat yields, except in MB where the third mode
as found to be significant. The modes of variation demonstratedhe structure of joint variability in the water-related factors atifferent growth stages and the previous non-growing season.anonical patterns of the water-related factors identified by CCAhowed the patterns of joint variation of the factors that were
1 grono
oStecscs
yomrpsodhptornts
A
wmt
R
A
B
B
B
B
B
B
B
C
C
C
C
C
D
D
D
E
F
G
JL
M
M
N
O
P
P
Q
R
R
R
S
T
V
W
WSan Diego, CA, 466 pp.
50 B. Qian et al. / Europ. J. A
ptimally associated with regional spring wheat yield variability.uch patterns exhibited regional differences in the effect of a fac-or at a growth stage on final yields, in addition to some commonffects. The regional differences may be associated with regionallimatic characteristics and water use efficiency. A better under-tanding of the regional differences can be useful for improvingrop management techniques, especially water-related measures,uch as summer fallow and irrigation practices.
The results of PCA and CCA can be applied to regional cropield forecasting. The potential prediction skill was higher than thatbtained from multiple regression analysis because CCA providesaximized correlation between the water-related factors and the
egional spring wheat yields. It should be kept in mind that theotential prediction skill can be achievable only when a perfecteasonal weather forecast is available. Considering the current skillf seasonal weather forecasts, the actual accuracy of crop yield pre-iction may be limited. However, it is possible to run the model withistorical weather data from all available years for the remainingeriod of the growing season, and therefore the crop yield predic-ion can be probabilistic. Other factors, e.g., temperature-relatednes, can be easily added into the analyses of PCA and CCA foregions with concerns of heat limitations. With future climate sce-arios as input to the VSMB model, the results can be used to projecthe impacts of future climate change on crop yields. Adaptationtrategies can be developed according to such projections.
cknowledgements
Authors are indebted to Drs. Weikai Yan and Jingyi Yang, asell as two anonymous reviewers, for their comments on theanuscript. We thank Ms. Valerie Kirkwood for her technical assis-
ance.
eferences
kinremi, O.O., McGinn, S.M., Barr, A.G., 1996. Simulation of soil moisture and othercomponents of the hydrological cycle using a water budget approach. Can. J. SoilSci. 76, 133–142.
aier, W., 1971. Evaluation of latent evaporation estimates and their conversion topotential evaporation. Can. J. Plant Sci. 51, 255–266.
aier, W., Dyer, J.A., Sharp, W.R., 1979. The versatile soil moisture budget. Tech. Bull.87 Research Branch, Agriculture Canada, Ottawa, ON, Canada.
aier, W., Robertson, G.W., 1965. Estimation of latent evaporation from simpleweather observations. Can. J. Plant Sci. 45, 276–284.
auer, A., 1972. Effect of water supply and seasonal distribution on spring wheatyields. Bull. 490. Agric. Exp. Stn., North Dakota State University, Fargo, 21 pp.
oken, V.K., Shaykewich, C.F., 2002. Improving an operational wheat yield modelusing phenological phase-based Normalized Difference Vegetation Index. Int. J.Remote Sens. 23, 4155–4168.
ootsma, A., De Jong, R., 1988. Estimates of seeding dates of spring wheat on theCanadian Prairies from climate data. Can. J. Plant Sci. 68, 513–517.
ootsma, A., De Jong, R., Dumanski, J. 1992. Stress indices for spring wheat on theCanadian prairies. CLBRR Contribution No. 92-65. Research Branch, Agriculture
Canada. ISBN 0-662-19719-4.ampbell, C.A., 1968. Influence of soil moisture stress applied at various stages ofgrowth on the yield components of Chinook wheat. Can. J. Plant Sci. 48, 313–320.
ampbell, C.A., Selles, F., Zentner, R.P., McConkey, B.G., Brandt, S.A., McKenzie, R.C.,1997. Regression model for predicting yield of hard red spring wheat grown onstubble in the semiarid prairie. Can. J. Plant Sci. 77, 43–52.
Y
Z
my 30 (2009) 140–150
ampbell, C.A., Zentner, R.P., Basnyat, P., Wang, H., Selles, F., McConkey, B.G., Gan, Y.T.,Cutforth, H.W., 2007. Water use efficiency and water and nitrate distribution insoil in the semiarid prairie: effect of crop type over 21 years. Can. J. Plant Sci. 87,815–827.
ampbell, C.A., Zentner, R.P., Gameda, S., Blomert, B., Wall, D.D., 2002. Production ofannual crops on the Canadian prairies: trends during 1976–1998. Can. J. Soil Sci.82, 45–57.
ampbell, C.A., Zentner, R.P., Johnson, P.J., 1988. Effect of crop rotation and fertiliza-tion on the quantitative relationship between spring wheat yield and moistureuse in southwestern Saskatchewan. Can. J. Soil Sci. 68, 1–16.
e Jong, R., Bootsma, A., 1988. Estimated long-term soil moisture variability on theCanadian Prairies. Can. J. Soil Sci. 68, 307–321.
esjardins, R.L., Ouellet, C.E., 1980. Determination of the importance of variousphases of wheat growth on final yield. Agric. Meteorol. 22, 129–136.
yer, J.A., Baier, W., 1979. An index for soil moisture drying patterns. Can. Agric. Eng.21, 117–118.
hdaie, B., Alloush, G.A., Madore, M.A., Waines, J.G., 2006. Genotypic variation forstem reserves and mobilization in wheat. I. Postanthesis changes in internodedry matter. Crop Sci. 46, 735–746.
eekes, W., 1941. De tarwe en haar milieu. Versl. Techn. Tarwe Comm. 17, 560–561.
allichand, J., Broughton, R.S., Boisvert, J., Rochette, P., 1991. Simulation of irrigationrequirements for major crops in South Western Quebec. Can. Agric. Eng. 33, 1–9.
olliffe, I.T., 1986. Principal Component Analysis. Springer, New York, 271 pp.arge, E.C., 1954. Growth stages in cereals, illustration of the Feekes’ scale. Plant
Pathol. 3, 128–129.iller, T.D., 1999. Growth Stage of Wheat: Identification and Understanding Improve
Crop Management. Texas Agricultural Extension Service, SCS-1999-16. Availableonline http://lubbock.tamu.edu/othercrops/pdf/wheat/wheatgrowthstages.pdf.
onteith, J.L., 1965. Evaporation and environment. In: Fogg, G.F. (Ed.), The State andMovement of Water in Living Organisms. Cambridge University Press, London,UK, pp. 205–234.
eilsen, D.C., Unger, P.W., Miller, P.R., 2005. Efficient water use in dryland croppingsystems in the Great Plains. Agron. J. 97, 364–372.
nofrei, C., 1987. A method of land evaluation using crop simulation techniques.Ph.D. Thesis, Univ. of Man., Winnipeg, MN, 314 pp.
alta, J.A., Kobata, T., Turner, N.C., Fillery, I.R., 1994. Remobilization of carbon andnitrogen in wheat as influenced by post-anthesis water deficits. Crop Sci. 34,118–124.
reisendorfer, R.W., 1988. In: Mobley, C.D. (Ed.), Principal Component Analysis inMeteorology and Oceanography, Elsevier, Amsterdam, 425 pp.
ian, B., De Jong, R., Warren, R., Chipanshi, A., Hill, H., in press. Statistical springwheat yield forecasting for the Canadian Prairies, Agric. Forest Meteorol.
addatz, R.L., Shaykewich, C.F., Bullock, P.R., 1994. Prairie crop yield estimatesfrom modelled phenological development and water use. Can. J. Plant Sci. 74,429–436.
itchie, J.T., Otter, S., 1985. Description and performance of Ceres-Wheat: a useroriented wheat yield model, vol. 38. USDA-ARS, ARS, pp. 159–170.
obertson, G.W., 1968. A biometeorological time scale for a cereal crop involv-ing day and night temperatures and photoperiod. Int. J. Biometeorol. 12, 191–223.
oil Landscapes of Canada Working Group. 2006. Soil Landscapes of Canada v3.1.Agriculture and Agri-Food Canada (digital map and database at 1:1 mil-lion scale). Available online: http://res.agr.ca/cansis/nsdb/slc/v3.1/intro.html(August 26, 2007).
urner, N.C., 2004. Agronomic options for improving rainfall-use efficiency of cropsin dryland farming systems. J. Exp. Bot. 55, 2413–2425.
an Keulen, H., Wolf, J., 1986. Modelling of Agricultural Production: Weather, Soilsand Crops. PUDOC, Wageningen, The Netherlands.
alker, G.K., 1989. Model for operational forecasting of western Canada wheat yield.Agric. Forest Meteorol. 44, 339–352.
ilks, D.S., 1995. Statistical Methods in the Atmospheric Sciences. Academic Press,
ang, J., Zhang, J., Wang, Z., Zhu, Q., Liu, L., 2001. Water deficit-induced senescenceand its relationship to the remobilization of re-stored carbon in wheat duringgrain filling. Agron. J. 93, 196–206.
entner, R.P., Dyck, F.B., Handford, K.R., Campbell, C.A., Selles, F., 1993. Economics offlex-cropping in southwest Saskatchewan. Can. J. Plant Sci. 73, 749–767.
Related Documents