Journal of Plant Breeding and Crop Science Vol. 2(7), pp. 192-204, July 2010 Available online http://www.academicjournals.org/jpbcs ISSN 2006-9758 © 2010 Academic Journals Full Length Research Paper Multivariate analysis of genetic divergence in twenty two genotypes of groundnut (Arachis hypogaea L.) Sunday Clement Olubunmi Makinde 1 * and Omolayo Johnson Ariyo 2 1 Department of Botany, Faculty of Science, Lagos State University, Ojo Campus, P.O Box 001, LASU Post Office Ojo, Lagos State, Nigeria. 2 Department of Plant Breeding and Seed Technology, College of Plant Science University of Agriculture Abeokuta, P. M. B. 2240 Abeokuta, Ogun State, Nigeria. Accepted 21 May, 2010 Twenty-two groundnut genotypes collected from different germplasm centers were cultivated in botanical nursery of the Lagos State University Ojo-Campus during the raining season of 2009. The data collected on 33 characters were subjected to multivariate analysis to study the variability within the genotypes and to determine the efficiency of the methods in classifying genotypes. The first three axes each of factor analysis and principal component analyses (PCA) captured 42 and 55% respectively of the total variance and jointly identified final plant height, leaflet length, stem pigmentation, nodes on the main stem and number of leaves per plant at flowering as characters contributing most to variation. The first three axes of the canonical and discriminant analyses accounted for 85 and 90% of the total variation respectively and identified in addition to the above characters, pod beak, hairiness of mature leaflet, pod constriction, lateral branch pattern and peg colour as important. Genotype clustering using single linkage clustering technique did not follow a particular pattern, as genotypes from different sources were grouped together, while some from same source were also separated into eight different groups. The effect of genetic divergence on the choice of parental stock in improvement breeding programme was discussed. Key words: Groundnut, factor analysis, principal component analysis, canonical discriminant analysis, single linkage cluster analysis. INTRODUCTION Groundnut (Arachis hypogaea L.), a member of the family Fabaceae is a major source of vegetable oil and plant protein in Africa. It is the World’s thirteenth most important food crop, the fourth most important source of edible oil and the third most important source of vegetable protein (Encyclopedia of Agricultural Science, 1994). Multivariate statistical methods and numerical taxonomy has been used extensively in summarizing and describing variation pattern in a population of crop genotypes (Ram and Panwar, 1970; Bartual et al., 1985; Rezai and Frey, 1990; Ariyo, 1990b; Ariyo and Odulaja, 1991; Ariyo, 1993; Flores et al., 1997; Cardi, 1998). The Mahalanobis D 2 statistic has been used to quantify the *Corresponding author. E-mail: [email protected], [email protected]. Tel: +234(0)8033277358, +234(0)8088494428. degree of divergence in different crops (Ram and Panwar, 1970; Das and DasGupa, 1984; Ariyo, 1987a; Nair et al., 1998; Pintu et al., 2007). The technique gave insight into the most genetically divergent parents that could be used for hybridization purpose. Das and DasGupa (1984) and Ariyo (1987a) noted earlier that, geographical diversity was not always related to genetic diversity and therefore not an adequate index of genetic diversity. Genotypes within clusters often showed great geographical diversity. Successful establishment of germplasm collections and plant introduction for crop improvement as well as for germplasm conservation require studies in genetic varia- bility within plant populations. Jain and Workman (1966) stated that such genetic variability and heterozygosity within populations existed in both natural and cultivated populations. Wright and Debzhonsky (1970) emphasized that the maintenance of this variability depended on complex interactions among a number of genetic and

Welcome message from author
This document is posted to help you gain knowledge. Please leave a comment to let me know what you think about it! Share it to your friends and learn new things together.
Transcript
Journal of Plant Breeding and Crop Science Vol. 2(7), pp. 192-204, July 2010 Available online http://www.academicjournals.org/jpbcs ISSN 2006-9758 © 2010 Academic Journals Full Length Research Paper
Multivariate analysis of genetic divergence in twenty two genotypes of groundnut (Arachis hypogaea L.)
Sunday Clement Olubunmi Makinde1* and Omolayo Johnson Ariyo2
1Department of Botany, Faculty of Science, Lagos State University, Ojo Campus,
P.O Box 001, LASU Post Office Ojo, Lagos State, Nigeria. 2Department of Plant Breeding and Seed Technology, College of Plant Science
University of Agriculture Abeokuta, P. M. B. 2240 Abeokuta, Ogun State, Nigeria.
Accepted 21 May, 2010
Twenty-two groundnut genotypes collected from different germplasm centers were cultivated in botanical nursery of the Lagos State University Ojo-Campus during the raining season of 2009. The data collected on 33 characters were subjected to multivariate analysis to study the variability within the genotypes and to determine the efficiency of the methods in classifying genotypes. The first three axes each of factor analysis and principal component analyses (PCA) captured 42 and 55% respectively of the total variance and jointly identified final plant height, leaflet length, stem pigmentation, nodes on the main stem and number of leaves per plant at flowering as characters contributing most to variation. The first three axes of the canonical and discriminant analyses accounted for 85 and 90% of the total variation respectively and identified in addition to the above characters, pod beak, hairiness of mature leaflet, pod constriction, lateral branch pattern and peg colour as important. Genotype clustering using single linkage clustering technique did not follow a particular pattern, as genotypes from different sources were grouped together, while some from same source were also separated into eight different groups. The effect of genetic divergence on the choice of parental stock in improvement breeding programme was discussed. Key words: Groundnut, factor analysis, principal component analysis, canonical discriminant analysis, single linkage cluster analysis.
INTRODUCTION Groundnut (Arachis hypogaea L.), a member of the family Fabaceae is a major source of vegetable oil and plant protein in Africa. It is the World’s thirteenth most important food crop, the fourth most important source of edible oil and the third most important source of vegetable protein (Encyclopedia of Agricultural Science, 1994). Multivariate statistical methods and numerical taxonomy has been used extensively in summarizing and describing variation pattern in a population of crop genotypes (Ram and Panwar, 1970; Bartual et al., 1985; Rezai and Frey, 1990; Ariyo, 1990b; Ariyo and Odulaja, 1991; Ariyo, 1993; Flores et al., 1997; Cardi, 1998). The Mahalanobis D2 statistic has been used to quantify the *Corresponding author. E-mail: [email protected], [email protected]. Tel: +234(0)8033277358, +234(0)8088494428.
degree of divergence in different crops (Ram and Panwar, 1970; Das and DasGupa, 1984; Ariyo, 1987a; Nair et al., 1998; Pintu et al., 2007). The technique gave insight into the most genetically divergent parents that could be used for hybridization purpose. Das and DasGupa (1984) and Ariyo (1987a) noted earlier that, geographical diversity was not always related to genetic diversity and therefore not an adequate index of genetic diversity. Genotypes within clusters often showed great geographical diversity.
Successful establishment of germplasm collections and plant introduction for crop improvement as well as for germplasm conservation require studies in genetic varia-bility within plant populations. Jain and Workman (1966) stated that such genetic variability and heterozygosity within populations existed in both natural and cultivated populations. Wright and Debzhonsky (1970) emphasized that the maintenance of this variability depended on complex interactions among a number of genetic and

Makinde and Ariyo 193
Table 1. Code names and source/ origin of groundnut genotypes.
Number Genotype Source/ Origin 1 ICG – 4998 ICRISAT India 2 ICG – 862 ICRISAT India 3 ICG – 6402 ICRISAT India 4 ICG – 8490 ICRISAT India 5 ICG – 4412 ICRISAT India 6 ICG – 156 ICRISAT India 7 ICG – 14466 ICRISAT India 8 ICG – 12370 ICRISAT India 9 ICG – 2106 ICRISAT India
10 ICG – 4343 ICRISAT India 11 ICG – 12189 ICRISAT India 12 ICG – 442 ICRISAT India 13 ICG – 4598 ICRISAT India 14 ICG – 7000 ICRISAT India 15 ICG – 1399 ICRISAT India 16 ICGY-6M- 5236 Zaria, Nigeria 17 ICG-IS- 11687 Zaria, Nigeria 18 ICGY-5M- 4746 Zaria, Nigeria 19 ICG-IS- 6646 UNILORIN, Nigeria 20 ICG- IS- 3584 UNILORIN, Nigeria 21 ICG49- 85A UNAAB, Nigeria 22 UGA-7- M UNAAB, Nigeria
and environmental factors. Ariyo (1987a and b) buttressed this fact further by stating that progress in breeding for economic characters often depends on the availability of a large germplasm representing a diverse genetic variation. He added that for a long term improvement programme, a large and diverse germplasm collection is an invaluable source of parental strains for hybridization and subsequent development of improved varieties. According to White and Gonzalez (1990), Nassir and Ariyo (2005), Aremu et al. (2007) accurate cultivar evaluations and ability to differentiate between cultivars in respect of genetic parameters associated with adaptedness in cultivated plants and their wild progenitors are critical to any plant breeding programme.
The objectives of this study therefore, are to evaluate and determine the variation pattern in collection of groundnut, identify the characters that sort the genotypes into different groups, suggest potential parents that could be used in improvement programme and appraise the suitability of the various multivariate techniques for classification of variation in groundnut. MATERIALS AND METHODS The twenty two genotypes of groundnut used in this study comprised of 15 accessions collected from International Crop Research Institute for the Semi-Arid Tropics (ICRISAT), Patancheru, India. The remaining 7 genotypes were collected from
different research centers within Nigeria, Table 1 presents the genotype coding with their collection centre. Planting was done during the raining season of 2009 (April) in the Department of Botany Nursery, Lagos State University-Ojo Campus, Lagos (6°
36’N, 3° 34’E) Lagos State, Nigeria. Following land preparation, they were grown in double-row plots, replicated 3 times in a randomized complete block design.
Each row was 4 m long with 1 m between rows and plants were spaced 40 cm apart within the row to give ten plants in a row. Each stand was thinned to one plant at two weeks after planting. Manual weeding was done at two weeks after planting and subsequently at three weeks intervals to ensure minimal crop-weeds competition. There was no application of inorganic fertilizers and chemicals (herbicides and pesticides).The rainfall, relative humidity and temperature data of the study sites are presented in Table 2. Data collection Agronomic and yield data were collected on each genotype. Five internal plants were sampled in each row (that is ten plants in each plot). At maturity, pods were harvested on plant basis to obtain some characteristics. Altogether, data were collected on 33 characters. Table 3 presented the 33 characters and their methods of scoring. Mean values of the characters were computed for the ten sampled plants in each plot. The means of the characters were subjected to analysis of variance and covariance (SAS 2000). The Principal Component Analysis (PCA) and Canonical Analysis were also done. The PCA analysis reduces the dimensions of a multivariate data to a few principal axes, generates an Eigen vector for each axis and produces component scores for the characters (Sneath and Sokal, 1973; Ariyo and Odulaja, 1991). Canonical analysis also measures the axis along which variation between
194 J. Plant Breed. Crop Sci.
Table 2. Mean monthly temperature, T (°C), relative humidity, RH (%) and rainfall R (mm) for the study months.
Months Environmental variable
T (°C) RH (%) R (mm) April 29.0 74 157.4 May 28.5 78 320.7 June 26.9 83 69.5 July 26.3 83 18.5 August 26.0 84 85.2
Table 3. Characters used in the analysis and their methods of measurement/ scoring. S/No Character Measurement/ Scoring (s) 1 Days to 50% flowering Estimated using calendar 2 Height at flowering Measured (cm) 3 Number of leaves/ plant at flowering Counted 4 Final height/ plant Measured (cm) 5 Days to maturity Estimated using calendar 6 Number of branches/ plant at maturity Counted 7 Nodes on the main stem/ plant at maturity Counted 8 Stem girth/ plant at maturity Measured (cm) 9 Leaflet length Measured (cm) 10 Leaflet width Measured (cm) 11 Leaflet length/ width ratio Estimated 12 Pod width Measured (cm) 13 Pod length Measured (cm) 14 Seed length Measured (mm) 15 Seed width Measured (mm) 16 Shelling %age Estimated (%) 17 Number of pods/ plant Counted 18 Sample seed weight (100 seeds) Measured(g) 19 Yield/ plant Measured(g) 20 Growth habit 1 (procumbent); 2 (procumbent 2); 3 (decumbent 1); 4 (decumbent 2); 5
(decumbent 3); 6 (erect); 7 (others) 21 Stem branching pattern 1 (alternate); 2 (sequential); 3 (irregular with flowers on the main stem); 4
(irregular without flowers on the main stem); 5 (others) 22 Stem pigmentation 1 (absent); 2 (present) 23 Stem hairiness 3 (scarce); 7(abundant) 24 Lateral branch habit 1 (non-distichous); 2(distichous) 25 Peg colour 1 (absent); 2 (present) 26 Leaflet shape 1 (cuneate); 2 (obcuneate); 3 (elliptic); 4 (lanceolate); 5 (others) 27 Hairiness of young leaflets 1 (almost glabrous); 2 (sparse and short); 3 (sparse and long); 4 (profuse and
short); 5 (profuse and long); 6 (others) 28 Hairiness of mature leaflets 1 (almost glabrous); 2 (sparse and short); 3 (sparse and long); 4 (profuse and
short); 5 (profuse and long); 6 (others) 29 Pod beak 1 (absent); 3 (slight); 5 (moderate); 7 (prominent); 9 (others) 30 Pod constriction 0 (none); 3 (slight); 5(moderate); 7 (deep); 9 (very deep) 31 Pod reticulation 0 (smooth); 3 (slight); 5 (moderate); 7 (prominent); 9 (others) 32 Seed colour 1 (one colour); 2 (variegated) 33 Number of seeds/ pod 1 (2-1); 2 (2-1-3); 3 (2-3-1); 4 (2-3-4-1); 5 (2-4-3-1) 6 (3-2-4-1); 7 (3-4-2-1); 8
(others)
Source: IBPGR/ ICRISAT groundnut Descriptors (1981).
Makinde and Ariyo 195
Table 4. Eigen values, % and cumulative variance, factor scores and communality of the ten most important characters from factor analysis
Eigen value Proportion of variation accounted for (%) Cumulative percentage 7.162 28.170 28.170 5.047 14.262 42.432 4.258 12.690 55.122 3.826 10.951 66.073 3.234 9.423 75.496
Table 5. Eigen values, percent and cumulative variance, factor scores and communality of the ten most important characters from factor analysis. Character Factor I Factor II Factor III Factor IV Communality
Yield per plant 0.281 0.196 -0.655 0.125 0.963 Seed colour 0.033 0.736 -0.325 0.075 0.935 Number of pods per plant -0.195 -0.210 -0.412 0.438 0.924 Matures leaflet length -0.701 0.531 -0.108 0.037 0.918 Sample seed (100 seeds) weight 0.352 0.370 0.299 -0.456 0.913 Pod width 0.697 0.538 -0.223 0.208 0.909 Height per plant at flowering 0.144 -0.315 -0.502 -0.499 0.905 Final height per plant -0.744 0.213 0.165 0.356 0.899 Pod length 0.341 0.803 0.195 -0.144 0.897 Pod beak 0.424 0.105 -0.364 0.375 0.887 Eigen values 6.062 4,047 3.859 3,318 Percent Variance 18.37 12.26 11.69 4.232 Cumulative variance 18.37 30.63 42.32 52.58
entries were maximum (Rezai and Frey, 1990; Ariyo, 1993). Factors and discriminant canonical analysis were also performed using the SPSS (Version 10.0) package. Factor analysis used the covariance matrix of characters (Harman, 1967; Ariyo, 1992) to generate factor loadings and communalities using the method of principal component extraction.
The discriminant canonical analysis summarizes the multivariate data in the same way as the canonical correlation. The analysis uses the Wilks’ lambda as the statistics for entering or removing new variables and thereby identifies the variables that provide the best discrimination among the entries. Single Linkage Clusters Analysis (SLCA) was performed to obtain dendrogram and sort genotypes into clusters using the FASTCLUS technique of SAS. RESULTS Factor analysis The results obtained from the factor analysis of the characters are presented in Table 4. The analysis identified 33 factors out of which only four were extracted which together explained 53% of the variance among the entries. The first factor with Eigen value of 6.062 accounted for only 18.37% of the variance and is primarily related to final plant height, pod width, leaflet length, stem pigmentation, number of nodes on the main
stem at maturity and number of leaves at flowering. The factor that accounted for 12.26 % of the total variance is mainly loaded by pod length. The third factor that accounted for 11.69 % of the total variance is mainly described by days to maturity and hairiness of young leaflet. The fourth factor is loaded by pod constriction, plant height at flowering, weight of 100 seeds, stem hairiness and it accounted for just 4.23 % of the total variance. The communality values ranged from 0.963 for yield/ plant to 0.680 for stem branching pattern. Principal component analysis (PCA) Results from the PCA presented in Table 5, revealed that only five of the thirty three principal components had Eigen values greater than 3.0 while, the first four axes with Eigen values of 7.162, 5.047, 4.258 and 3.826 respectively, jointly accounted for 66.07% of the total variation among the genotypes. The first five principal axes together explained above 70% of the total variation among the 33 characters that described the 22 geno-types. The major characters described by the first four principal axes are presented in Table 6. The first principal component axis was mainly loaded by vegetative characters.
196 J. Plant Breed. Crop Sci.
Table 6. Eigen vectors for major traits of the first four principal components used in the ordination.
Axis 1 Axis 2 Axis 3 Axis 4 Trait Score Trait Score Trait Score Trait Score Final plant height -0.302
Pod length 0.399 Days to maturity 0.413 Leaflet shape -0.318
Leaflet length -0.285 Seed colour 0.366 Hairiness of young leaflet 0.336 Pod constriction 0.274 Stem pigmentation -0.268
Pod width 0.268 Yield/ plant -0.333 Plant height at flowering -0.273
Number of nodes on the main stem at maturity
-0.259 Leaflet length 0.264 Days to 50% flowering 0.304 Stem hairiness 0.271
Number of leaves at flowering
0.251
Seed length
0.263
Plant height at flowering
-0.255
Weight of 100 seeds
-0.250
Leaflet width
-0.251
Leaflet length/ leaflet width ratio
0.253
Stem branching pattern
-0.219
Seed width
-0.244
Number of seeds/ pod 0.241
Seed width 0.234 Number of pods/ plant -0.209 Growth habit -0.243
Peg colour -0.231
Hairiness of mature leaflet -0.228 Pod beak -0.185 Number of pods/ plant 0.241
Seed length 0.219
Weight of 100 seeds 0.184 Seed colour -0.166 Number of seed/ pod 0.225
Pod beak 0.172
Pod reticulation 0.180 Leaflet shape -0.162 Hairiness of young leaflet 0.220
These were final plant height leaflet length, stem pigmentation, nodes on the main stem at maturity, number of leaves at flowering, leaflet width, seeds per pod, peg colour, seed length and pod beak in that order. Axes two and three were described largely by pod and seed characteristics like pod length, pod width, pod reticulation, pod beak, seed colour, seed length, weight of 100 seeds and number of pods per plant. The fourth axis is loaded by leaflet shape, pod reticulation, plant height at flowering, stem hairiness, weight of 100 seeds, seed width, number of pods per plant, seeds per pod and hairiness of young leaflet.
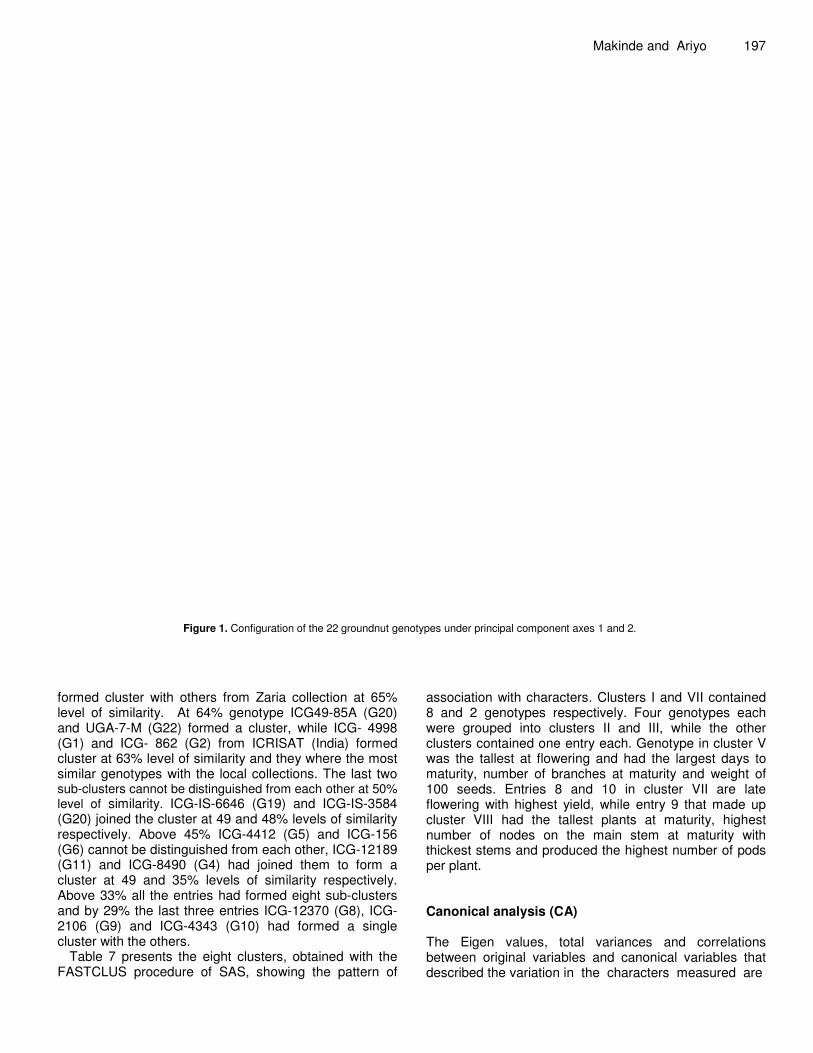
The configuration of the twenty two groundnut genotypes, along the first three principal component axes are shown in Figures 1, 2 and 3. The ordination of the genotypes on axes 1 and 2 (Figure 1) revealed that ICG 6402 (genotype 3), ICG 12370 (genotype 8), ICG 1399 (genotype 15) and ICG-IS-6646 (genotype 19) were the most distinct genotypes. ICGY-5M-4746 (genotype 18), ICG49-85A (genotype 21) and UGA-7-M (genotype 22) from local sources were most distinct from others in Figures 2 and 3. The remaining genotypes from ICRISAT-India and local sources (Nigeria) did not show any specific
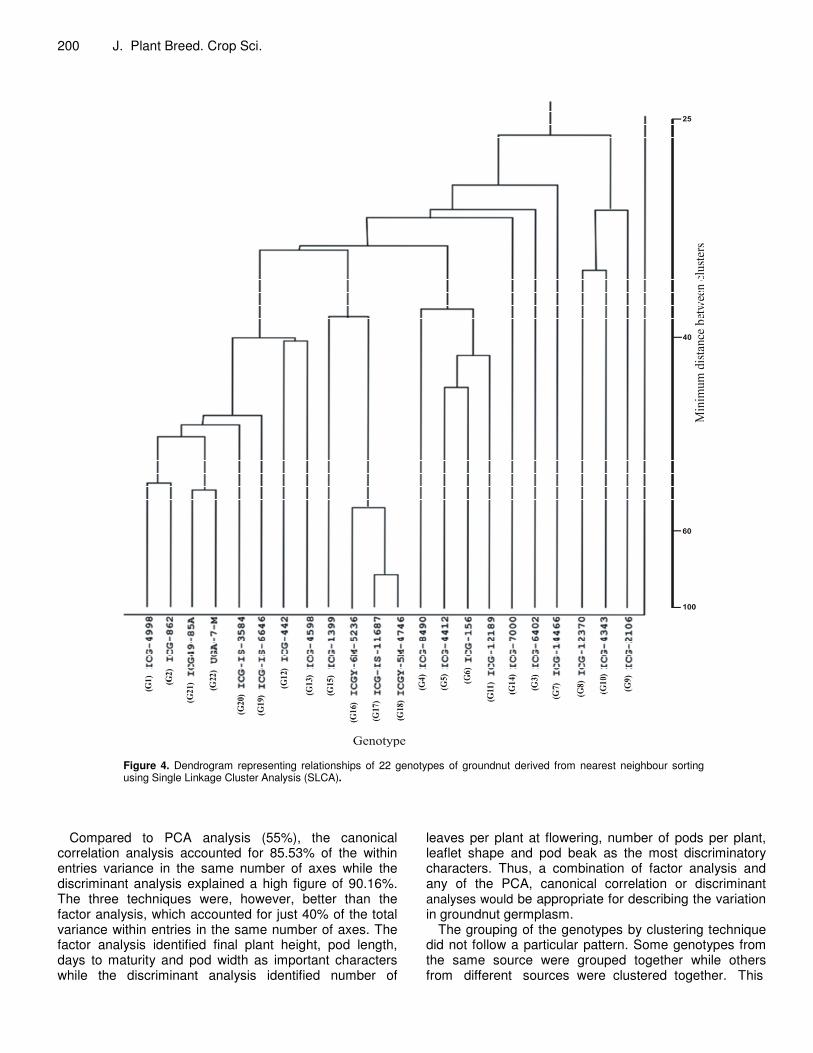
pattern in their distribution Single linkage cluster analysis (SLCA) The dendrogram from the Single Linkage Cluster Analysis is presented in Figure 4. All genotypes were distinct at 100% level of similarity while at 25% they could no longer be discriminated. ICGY-5M-4746 (G18) and ICG-IS-11687 (G17), both collected locally (from Zaria), were most similar to each other and different from others above 85% level of similarity. ICGY-6M-5236 (genotype 16)
Makinde and Ariyo 197
Figure 1. Configuration of the 22 groundnut genotypes under principal component axes 1 and 2.
formed cluster with others from Zaria collection at 65% level of similarity. At 64% genotype ICG49-85A (G20) and UGA-7-M (G22) formed a cluster, while ICG- 4998 (G1) and ICG- 862 (G2) from ICRISAT (India) formed cluster at 63% level of similarity and they where the most similar genotypes with the local collections. The last two sub-clusters cannot be distinguished from each other at 50% level of similarity. ICG-IS-6646 (G19) and ICG-IS-3584 (G20) joined the cluster at 49 and 48% levels of similarity respectively. Above 45% ICG-4412 (G5) and ICG-156 (G6) cannot be distinguished from each other, ICG-12189 (G11) and ICG-8490 (G4) had joined them to form a cluster at 49 and 35% levels of similarity respectively. Above 33% all the entries had formed eight sub-clusters and by 29% the last three entries ICG-12370 (G8), ICG-2106 (G9) and ICG-4343 (G10) had formed a single cluster with the others.
Table 7 presents the eight clusters, obtained with the FASTCLUS procedure of SAS, showing the pattern of
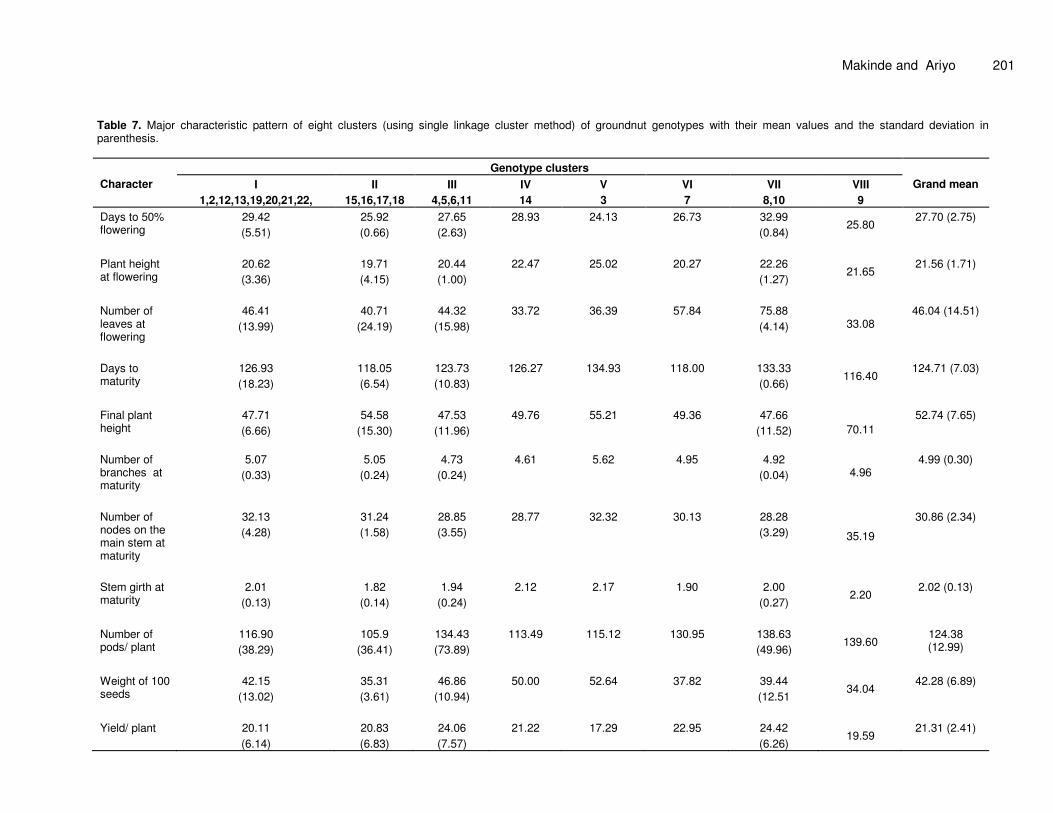
association with characters. Clusters I and VII contained 8 and 2 genotypes respectively. Four genotypes each were grouped into clusters II and III, while the other clusters contained one entry each. Genotype in cluster V was the tallest at flowering and had the largest days to maturity, number of branches at maturity and weight of 100 seeds. Entries 8 and 10 in cluster VII are late flowering with highest yield, while entry 9 that made up cluster VIII had the tallest plants at maturity, highest number of nodes on the main stem at maturity with thickest stems and produced the highest number of pods per plant. Canonical analysis (CA) The Eigen values, total variances and correlations between original variables and canonical variables that described the variation in the characters measured are

198 J. Plant Breed. Crop Sci.
Figure 2. Configuration of the 22 groundnut genotypes under principal component axes 1 and 3.
presented in Table 8. The first five canonical variables had Eigen values greater than 2.0 and accounted for 46.14, 27.72, 11.67, 7.54 and 6.92% of the total variance, respectively. The first four canonical variables however, recorded 93.07% of the variation. Number of leaves at flowering and lateral branch habit, were among the important characters in the first canonical variable while the second canonical variable comprised of number of pods per plant, yield per plant and stem pigmentation. The third canonical variable comprised of number of pods per plant, yield per plant, pod constriction and peg colour while number of leaves per plant, leaflet length and leaflet width were important for the fourth variable. Discriminant analysis Table 9 presents the Eigen values, variance and pooled within group correlation between discriminant variable and the canonical discriminant functions. The first four functions had Eigen values that are above 2 and jointly accounted for 99.34% of the total variance. The first two functions accounted for about 84% of the total variance
within the genotypes whereas the third and the fourth functions explained 14.77 and 1.08% of the total variance respectively. The first discriminant function, which accounted for 60.82% of the variance, was highly negatively correlated with number of leaves per plant at flowering (-0.799) but positively correlated with leaflet length (0.392). Number of pods per plant (-0.872) and yield per plant (-0.641) had high negative correlations with the second function while number of seeds per pod had the highest positive correlation (0.368) with the second function. Leaflet shape had the highest positive correlation (0.319) with the third function while hairiness of mature leaflet had the least correlation (0.111) with the third function. The fourth discriminant function correlated negatively with lateral branch habit (-0.495) while number of pods per plant had the least correlation (-0.230). The step-wise order of inclusion of the ten most important variables in the discriminant analysis is shown in Table 10. The order in which the variables were included in the discriminant analysis indicates their relative importance in classifying entries. Number of pods per plant was ranked first in the order of relative importance for discriminating the genotypes. It was followed by number of leaves per
Makinde and Ariyo 199
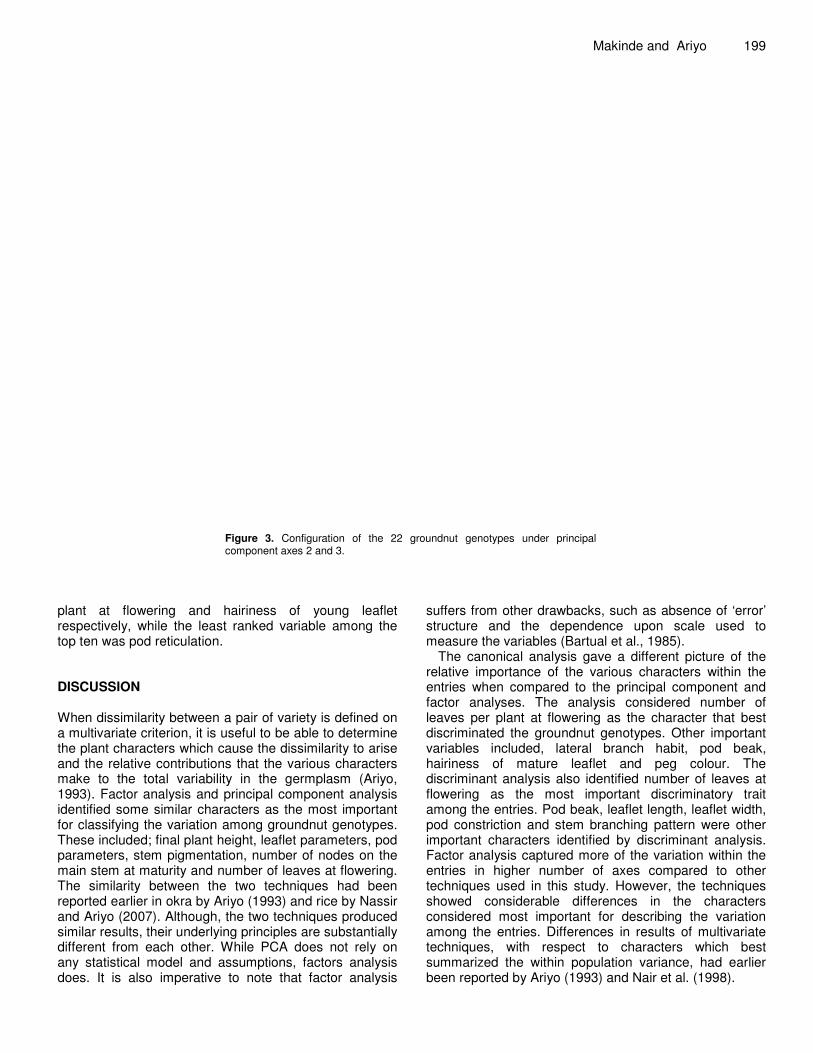
Figure 3. Configuration of the 22 groundnut genotypes under principal component axes 2 and 3.
plant at flowering and hairiness of young leaflet respectively, while the least ranked variable among the top ten was pod reticulation. DISCUSSION When dissimilarity between a pair of variety is defined on a multivariate criterion, it is useful to be able to determine the plant characters which cause the dissimilarity to arise and the relative contributions that the various characters make to the total variability in the germplasm (Ariyo, 1993). Factor analysis and principal component analysis identified some similar characters as the most important for classifying the variation among groundnut genotypes. These included; final plant height, leaflet parameters, pod parameters, stem pigmentation, number of nodes on the main stem at maturity and number of leaves at flowering. The similarity between the two techniques had been reported earlier in okra by Ariyo (1993) and rice by Nassir and Ariyo (2007). Although, the two techniques produced similar results, their underlying principles are substantially different from each other. While PCA does not rely on any statistical model and assumptions, factors analysis does. It is also imperative to note that factor analysis
suffers from other drawbacks, such as absence of ‘error’ structure and the dependence upon scale used to measure the variables (Bartual et al., 1985).
The canonical analysis gave a different picture of the relative importance of the various characters within the entries when compared to the principal component and factor analyses. The analysis considered number of leaves per plant at flowering as the character that best discriminated the groundnut genotypes. Other important variables included, lateral branch habit, pod beak, hairiness of mature leaflet and peg colour. The discriminant analysis also identified number of leaves at flowering as the most important discriminatory trait among the entries. Pod beak, leaflet length, leaflet width, pod constriction and stem branching pattern were other important characters identified by discriminant analysis. Factor analysis captured more of the variation within the entries in higher number of axes compared to other techniques used in this study. However, the techniques showed considerable differences in the characters considered most important for describing the variation among the entries. Differences in results of multivariate techniques, with respect to characters which best summarized the within population variance, had earlier been reported by Ariyo (1993) and Nair et al. (1998).
200 J. Plant Breed. Crop Sci.
Figure 4. Dendrogram representing relationships of 22 genotypes of groundnut derived from nearest neighbour sorting using Single Linkage Cluster Analysis (SLCA).
Compared to PCA analysis (55%), the canonical correlation analysis accounted for 85.53% of the within entries variance in the same number of axes while the discriminant analysis explained a high figure of 90.16%. The three techniques were, however, better than the factor analysis, which accounted for just 40% of the total variance within entries in the same number of axes. The factor analysis identified final plant height, pod length, days to maturity and pod width as important characters while the discriminant analysis identified number of
leaves per plant at flowering, number of pods per plant, leaflet shape and pod beak as the most discriminatory characters. Thus, a combination of factor analysis and any of the PCA, canonical correlation or discriminant analyses would be appropriate for describing the variation in groundnut germplasm.
The grouping of the genotypes by clustering technique did not follow a particular pattern. Some genotypes from the same source were grouped together while others from different sources were clustered together. This
Makinde and Ariyo 201
Table 7. Major characteristic pattern of eight clusters (using single linkage cluster method) of groundnut genotypes with their mean values and the standard deviation in parenthesis.
Character Genotype clusters
Grand mean I 1,2,12,13,19,20,21,22,
II 15,16,17,18
III 4,5,6,11
IV 14
V 3
VI 7
VII 8,10
VIII 9
Days to 50% flowering
29.42 (5.51)
25.92 (0.66)
27.65 (2.63)
28.93 24.13 26.73 32.99 (0.84)
25.80 27.70 (2.75)
Plant height at flowering
20.62 (3.36)
19.71 (4.15)
20.44 (1.00)
22.47
25.02
20.27
22.26 (1.27)
21.65
21.56 (1.71)
Number of leaves at flowering
46.41
(13.99)
40.71
(24.19)
44.32
(15.98)
33.72
36.39
57.84
75.88 (4.14)
33.08
46.04 (14.51)
Days to maturity
126.93 (18.23)
118.05 (6.54)
123.73 (10.83)
126.27
134.93
118.00
133.33 (0.66)
116.40
124.71 (7.03)
Final plant height
47.71 (6.66)
54.58
(15.30)
47.53
(11.96)
49.76
55.21
49.36
47.66
(11.52)
70.11
52.74 (7.65)
Number of branches at maturity
5.07 (0.33)
5.05 (0.24)
4.73 (0.24)
4.61 5.62 4.95 4.92 (0.04) 4.96
4.99 (0.30)
Number of nodes on the main stem at maturity
32.13 (4.28)
31.24 (1.58)
28.85 (3.55)
28.77
32.32
30.13
28.28 (3.29)
35.19
30.86 (2.34)
Stem girth at maturity
2.01
(0.13)
1.82
(0.14)
1.94
(0.24)
2.12
2.17
1.90
2.00
(0.27)
2.20
2.02 (0.13)
Number of pods/ plant
116.90 (38.29)
105.9
(36.41)
134.43 (73.89)
113.49
115.12
130.95
138.63 (49.96)
139.60
124.38 (12.99)
Weight of 100 seeds
42.15
(13.02)
35.31 (3.61)
46.86
(10.94)
50.00
52.64
37.82
39.44 (12.51
34.04
42.28 (6.89)
Yield/ plant
20.11 (6.14)
20.83 (6.83)
24.06 (7.57)
21.22
17.29
22.95
24.42 (6.26)
19.59
21.31 (2.41)

202 J. Plant Breed. Crop Sci.
Table 8. Eigen values, total variance, cumulative variance and correlation between original and canonical variables that describe the variation in 33 traits measured on 22 groundnut genotypes
Canonical variable
Eigen value
Proportion of variance accounted for (%)
Percentage cumulative Correlation of canonical variable with
1 14.925 46.14 46.14 Number of leaves/ plant at flowering (-0.318)
Lateral branch habit (0.311)
Pod beak (-0.215)
Hairiness of mature leaflet (0.202)
Pod constriction (-0.184)
Peg colour (-0.178)
2
8.969
27.72
73.86
Number of pods/ plant (-0.671)
Yield/ plant (-0.501)
Stem pigmentation (-0.475)
Lateral branch habit (0.398)
Number of leaves at flowering (0.372)
Number of seeds/ pod (0.309)
3
3.775
11.67
85.53
Number of pods/ plant (-0.588)
Yield/ plant (-0.429)
Pod constriction (-0.324)
Peg colour (0.279)
Leaflet shape (0.258)
Number of seeds/ pod (0.236)
4
2.440
7.54
93.07
Number of leaves at flowering (0.728)
Leaflet length (-0.487)
Leaflet width (-0.452)
Final plant height (-0.385)
Stem branching pattern (-0.362)
Hairiness of young leaflet (0.341)
5
2.240
6.92
100.00
Leaflet shape (0.319)
Stem hairiness (-0.235)
Peg colour (0.194)
Pod constriction (0.187)
Pod beak (0.113)
Hairiness of mature leaflet (0.105)
implies that geographical diversity is not a measure of genotypic diversity in groundnut as reported in okra by Ariyo (1987a). Mean values of characters were more or less continuous across clusters, hence, no sharp distinction between clusters was observed. This was an indication that the characters were under polygenic control. Therefore, improvement programme in groundnut through varietal selection will require painstaking and continuous hybridization and selection efforts for appreciable success (Nassir, 2002). However, clusters showed some character distinctions that
could be employed for hybridization purpose. Cluster III for instance, recorded highest yield per plant but fewer number of pods per plant when compared with cluster VIII, hence genotypes in cluster III may give even higher yield if the number of fruits and the number of nodes on the main stem are increased through a careful hybridization with any genotypes in cluster VIII. A high yielding progeny which will have a better combination of height, number of pods per plant and seed weight could be selected from a cross between suitable entries in clusters V and VII. The large amount of
genetic variability observed among the genotypes supported the earlier observation by Rao (1985), Siddiquey et al. (2006) and Pintu et al. (2007) that abundant genetic divergence existed in groundnut germplasm. In addition, the pattern of genetic variation would be of great importance to germplasm collectors and plant breeders. The categorization of the diversity among the genotypes into groups with similar characteristics can be used to design a collection strategy (Ariyo, 1993; El-Nasir et al., 2006). Furthermore, the high level of variability exhibited by this population

Makinde and Ariyo 203
Table 9. Eigen values, total variance, cumulative variance and pooled within group correlation between discriminant variables and the canonical discriminant functions.
Discriminant Canonical variable
Eigen value
Proportion of variance accounted
for (%)
Percentage cumulative Pooled within group correlation * with
1 13.698 60.815 60.815 Number of leaves/ plant at flowering
(-0.799)
Pod beak (-0.393)
Leaflet length (0.392)
Leaflet width (0.379)
Pod constriction
(-0.304)
Stem branching pattern (0.280)
2
3.566
15.829
76.644
Pods/ plant (-0.872)
Yield/ plant
(-0.641)
Stem
pigmentation (-0.499)
Number of seeds/ pod
(0.368)
Leaflet shape
(0.314)
Pod reticulation
(-0.256)
3
3.045
13.517
90.159
Leaflet shape (0.319)
Stem
hairiness (-0.217)
Pod constriction
(0.216)
Peg colour
(0.173)
Pod beak (0.145)
Hairiness of
mature leaflet (0.111)
4
2.217
9.841
100.000
Lateral
branch habit (-0.495)
Peg colour
(0.413)
Number of leaves at flowering (-0.347)
Pod
constriction (-0.302)
Hairiness of
mature leaflet (-0.288)
Pods/ plant
(-0.230)
* Largest absolute correlation between each variable and any discriminant function.
Table 10. Stepwise order of inclusion of the ten most important variables from discriminant analysis.
Variable Wilks’ Lambda F- value Number of pods per plant 0.247 95.779 Number of leaves at flowering 0.075 82.068 Hairiness of young leaflet 0.054 67.044 Seed length (cm) 0.041 58.879 Peg colour 0.033 53.040 Seed width (cm) 0.024 52.893 Stem girth at maturity (cm) 0.019 50.424 Stem hairiness 0.015 49.719 Pod length (cm) 0.012 49.181 Pod reticulation 0.009 48.206
*= All F- values are significant at P � 0.01.
204 J. Plant Breed. Crop Sci. indicates that heterosis could be utilized to produce superior hybrid which can be used to enhance crop production. Development of such genotype, however involves the understanding of the variance components in the population (Lukhele, 1981; Makinde, 1988). Conclusion Factor analysis captured more of the variation within the entries in higher number of axes compared to other techniques used in this study. However, the techniques showed considerable differences in the characters considered most important for describing the variation among the entries. Thus, a combination of factor analysis and any of the PCA, canonical correlation or discriminant analyses would be appropriate for describing the variation in groundnut germplasm. Genotypes ICG-2106, ICG49-85A and UGA-7-M could serve as a source of genes for earliness. ICG-4998, ICG-12370, ICG-4598, ICG-12189 and ICG-IS-6646 could be exploited for increase in pod yield. REFERENCES Abou ETHS, Ibrahim MM, Aboud KA (2006). Stability parameters in
yield of White Mustard (Brassica alba L.) in different environments. World J. Agric. Sci. 2(1): 47-55.
Aremu CO, Ariyo OJ, Adewole BD (2007). Assessment of selection techniques in genotype x environment interaction in cowpea (Vigna unguiculata (L.) Walp). African J. Agricul. Res. 2(8): 352-355.
Ariyo OJ (1987a). Multivariate analysis and the choice of parents for hybridization in okra (Abelmoschus esculentus (L.) Moench). Theor. Appl. Genet. 74: 361–363.
Ariyo OJ (1987b). Stability of performance of okra as influenced by planting date. Theor. Appl. Genet. 74:83-86.
Ariyo OJ (1990b). Measurement and classification of genetic diversity in okra (Abelmoschus esculentus). Ann. Appl. Biol. 116: 335-341.
Ariyo OJ (1992). Factor analysis of vegetative and yield traits in okra (Hibiscus esculentus). Indian J. Agric. Sci. 60 (12):793-795.
Ariyo OJ (1993). Genetic diversity in West African okra (Abelmoschus caillei L. (Chev.) Stevels- Multivariate analysis of morphological and agronomical characteristics. Genetic Res. Crop Evol. 40: 25-32.
Ariyo OJ, Odulaja A (1991). Numerical analysis of variation among accessions of okra (Abelmoschus esculentus (L.) Moench). Ann. Bot.
67:527- 531. Bartual R, Cabonell EA, Green DE (1985). Multivariate analysis of a
collection of soybean cultivars from south-eastern Spain. Euphytica. 34: 113-123.
Cardi T (1998). Multivariate analysis of variation among Solanum commersoni (+) Solanum tuberosum somatic hybrids with different ploidy levels. Euphytica 99: 35-41.
Das PK and Das Gupta T (1984). Multivariate analysis in black grain
(Vigna mango (L.) Hepper. Indian J. Genet. 44(2): 243-247. Encyclopedia of Agricultural Science (1994) Groundnut (Arachis
hypogaea L.). Acad. press. 3:112. Flores F, Gutrerrez JC, Lopez J, Moreno MT, Cubero JI (1997).
Multivariate analysis approach to evaluate a germplasm collection of Heydsarum coronarium L. Genet. Res. and Crop Evol. 44: 545-555.
Harman HH (1967). Modern factor analysis. 2nd ed. University of Chicago Press. Chicago. 124 pp.
International Board for Plant Genetic Resources (IBPGR) and International Crop Research Institute for the Semi - Arid Tropics (ICRISAT) (1981). Groundnut Descriptors. IBPGR Secretariat, Rome. 23pp.
Jain SK, Workman PL (1966). The genetic of inbreeding species. Advanced genetics. 14: 55–13.
Lukhele PE (1981). Estimation of genetic variability in sorghum (Sorghum bicolor L.) Moenel). Unpublished M. Sc. Thesis, Faculty of Agriculture, Ahmadu Bello University. Nigeria.
Makinde SC (1988). Genetic characterization of okra (Abelmoschus esculentus L.) Moench.) cultivars. Unpublished M. Sc. Thesis, Faculty of Science, University of Ilorin, Ilorin. Nigeria.
Nair NV, Ballakrishnan R, Screenivasan TV (1998). Variability for quantitative traits in exotic hybrid germplasm of sugar cane. Gen. Res. and Crop Evol. 45:459-464.
Nassir AL (2002). Studies on genotype x environment interaction, variability and plant character correlations in rice (Oriza sativa L.). Unpublished PhD Thesis, submitted to the post graduate School, University of Agriculture, Abeokuta. Ogun state Nigeria. 123pp.
Nassir AL, Ariyo OJ (2005). Genotype X Environment stability analysis of grain yield of rice (Oryza sativa L.). Trop. Agric. (Trinidad) 2005: 1-8.
Nassir AL, Ariyo OJ (2007). Multivariate analysis of variatiob of field-planted upland rice (Oryza sativa) in a tropical habitat. Malays. Appl. Biol. 36(1): 47-57.
Pintu B, Shamistha M, Sudhansu SM, Nirmalya B (2007). Influence of genotype on in vitro multiplication potential of Arachis hypogaea L. Acta. Bot. Croat. 66(1):15-23.
Ram J, Panwar DVS (1970). Intraspecific divergence in rice. Int. J. Genet. Plant Breed. 30 (1):1-10.
Rao VR (1985). Genetic resources and their use in enhancement of peanut at ICRISAT APRES Procedings. 17:27-30
Rezai A, Frey KJ (1990). Multivariate analysis of variation among wild oat accessions-seed traits. Euphytica. 49:111-119.
Statistcal Analysis System (SAS) (2000). SAS Online Doc. Version 8. Cary, NC: SAS Institute Inc.
Siddiquey MNH, Haque MM, Ara MJF, Ahmed MR, Roknuzzaman M (2006). Correlation and path analysis of groundnut (Arachis hypogaea L.). Int. J. Sustain. Agril. Tech. 2(7): 6-10.
Sneath PHA, Sokal R (1973). Numerical taxonomy. W. H. Freeman. San Francisco. 537pp.
White JW, Gonzalez A (1990). Characterization of negative association between seed yield and seed size among genotypes of common bean. Field crops Research. 23: 159-175.
Wright F, Debzhansky TH (1970). Genetics of evolution process. Columbia University press New York. 234pp.
Related Documents